UNITED STATES
SECURITIES AND EXCHANGE COMMISSION
Washington, D.C. 20549
FORM N-CSR
CERTIFIED SHAREHOLDER REPORT OF REGISTERED
MANAGEMENT INVESTMENT COMPANIES
Investment Company Act file number 811-2720
Fidelity Municipal Trust
(Exact name of registrant as specified in charter)
82 Devonshire St., Boston, Massachusetts 02109
(Address of principal executive offices) (Zip code)
Eric D. Roiter, Secretary
82 Devonshire St.
Boston, Massachusetts 02109
(Name and address of agent for service)
Registrant's telephone number, including area code: 617-563-7000
Date of fiscal year end: | December 31 |
| |
Date of reporting period: | June 30, 2005 |
Item 1. Reports to Stockholders
Spartan®
Michigan Municipal Income
Fund
and
Fidelity ®
Michigan Municipal Money
Market Fund
Semiannual Report
June 30, 2005
(2_fidelity_logos) (Registered_Trademark)
Contents
Chairman's Message | <Click Here> | Ned Johnson's message to shareholders |
Shareholder Expense Example | <Click Here> | An example of shareholder expenses. |
Spartan Michigan Municipal Income Fund |
Investment Changes | <Click Here> | A summary of major shifts in the fund's investments over the past six months. |
Investments | <Click Here> | A complete list of the fund's investments with their market values. |
Financial Statements | <Click Here> | Statements of assets and liabilities, operations, and changes in net assets,
as well as financial highlights. |
Fidelity Michigan Municipal Money Market Fund |
Investment Changes | <Click Here> | A summary of major shifts in the fund's investments over the past six months and one year. |
Investments | <Click Here> | A complete list of the fund's investments. |
Financial Statements | <Click Here> | Statements of assets and liabilities, operations, and changes in net assets,
as well as financial highlights. |
Notes | <Click Here> | Notes to the Financial Statements |
Board Approval of Investment Advisory Contracts and Management Fees | <Click Here> | |
To view a fund's proxy voting guidelines and proxy voting record for the 12-month period ended June 30, visit www.fidelity.com/proxyvotingresults or visit the Securities and Exchange Commission's (SEC) web site at www.sec.gov. You may also call 1-800-544-8544 to request a free copy of the proxy voting guidelines.
Standard & Poor's, S&P and S&P 500 are registered service marks of The McGraw-Hill Companies, Inc. and have been licensed for use by Fidelity Distributors Corporation.
Other third party marks appearing herein are the property of their respective owners.
All other marks appearing herein are registered or unregistered trademarks or service marks of FMR Corp. or an affiliated company.
This report and the financial statements contained herein are submitted for the general information of the shareholders of the funds. This report is not authorized for distribution to prospective investors in the funds unless preceded or accompanied by an effective prospectus.
A fund files its complete schedule of portfolio holdings with the SEC for the first and third quarters of each fiscal year on Form N-Q. Forms N-Q are available on the SEC's web site at http://www.sec.gov. A fund's Forms N-Q may be reviewed and copied at the SEC's Public Reference Room in Washington, DC. Information regarding the operation of the SEC's Public Reference Room may be obtained by calling 1-800-SEC-0330. For a complete list of a fund's portfolio holdings, view the most recent quarterly holdings report, semiannual report, or annual report on Fidelity's web site at http://www.fidelity.com/holdings.
NOT FDIC INSURED · MAY LOSE VALUE · NO BANK GUARANTEE
Neither the funds nor Fidelity Distributors Corporation is a bank.
Semiannual Report
Chairman's Message
(photo_of_Edward_C_Johnson_3d)
Dear Shareholder:
During the past year or so, much has been reported about the mutual fund industry, and much of it has been more critical than I believe is warranted. Allegations that some companies have been less than forthright with their shareholders have cast a shadow on the entire industry. I continue to find these reports disturbing, and assert that they do not create an accurate picture of the industry overall. Therefore, I would like to remind everyone where Fidelity stands on these issues. I will say two things specifically regarding allegations that some mutual fund companies were in violation of the Securities and Exchange Commission's forward pricing rules or were involved in so-called "market timing" activities.
First, Fidelity has no agreements that permit customers who buy fund shares after 4 p.m. to obtain the 4 p.m. price. This is not a new policy. This is not to say that someone could not deceive the company through fraudulent acts. However, we are extremely diligent in preventing fraud from occurring in this manner - and in every other. But I underscore again that Fidelity has no so-called "agreements" that sanction illegal practices.
Second, Fidelity continues to stand on record, as we have for years, in opposition to predatory short-term trading that adversely affects shareholders in a mutual fund. Back in the 1980s, we initiated a fee - which is returned to the fund and, therefore, to investors - to discourage this activity. Further, we took the lead several years ago in developing a Fair Value Pricing Policy to prevent market timing on foreign securities in our funds. I am confident we will find other ways to make it more difficult for predatory traders to operate. However, this will only be achieved through close cooperation among regulators, legislators and the industry.
Yes, there have been unfortunate instances of unethical and illegal activity within the mutual fund industry from time to time. That is true of any industry. When this occurs, confessed or convicted offenders should be dealt with appropriately. But we are still concerned about the risk of over-regulation and the quick application of simplistic solutions to intricate problems. Every system can be improved, and we support and applaud well thought out improvements by regulators, legislators and industry representatives that achieve the common goal of building and protecting the value of investors' holdings.
For nearly 60 years, Fidelity has worked very hard to improve its products and service to justify your trust. When our family founded this company in 1946, we had only a few hundred customers. Today, we serve more than 18 million customers including individual investors and participants in retirement plans across America.
Let me close by saying that we do not take your trust in us for granted, and we realize that we must always work to improve all aspects of our service to you. In turn, we urge you to continue your active participation with your financial matters, so that your interests can be well served.
Best regards,
/s/Edward C. Johnson 3d
Edward C. Johnson 3d
Semiannual Report
Shareholder Expense Example
As a shareholder of a Fund, you incur two types of costs: (1) transaction costs, including redemption fees, and (2) ongoing costs, including management fees and other Fund expenses. This Example is intended to help you understand your ongoing costs (in dollars) of investing in the Funds and to compare these costs with the ongoing costs of investing in other mutual funds.
The Example is based on an investment of $1,000 invested at the beginning of the period and held for the entire period (January 1, 2005 to June 30, 2005).
Actual Expenses
The first line of the table below for each fund provides information about actual account values and actual expenses. You may use the information in this line, together with the amount you invested, to estimate the expenses that you paid over the period. Simply divide your account value by $1,000.00 (for example, an $8,600 account value divided by $1,000.00 = 8.6), then multiply the result by the number in the first line for a fund under the heading entitled "Expenses Paid During Period" to estimate the expenses you paid on your account during this period. A small balance maintenance fee of $12.00 that is charged once a year may apply for certain accounts with a value of less than $2,000. This fee is not included in the table below. If it was, the estimate of expenses you paid during the period would be higher, and your ending account value lower, by this amount.
Hypothetical Example for Comparison Purposes
The second line of the table below for each fund provides information about hypothetical account values and hypothetical expenses based on a fund's actual expense ratio and an assumed rate of return of 5% per year before expenses, which is not the Fund's actual return. The hypothetical account values and expenses may not be used to estimate the actual ending account balance or expenses you paid for the period. You may use this information to compare the ongoing costs of investing in the Fund and other funds. To do so, compare this 5% hypothetical example with the 5% hypothetical examples that appear in the shareholder reports of the other funds. A small balance maintenance fee of $12.00 that is charged once a year may apply for certain accounts with a value of less than $2,000. This fee is not included in the table below. If it was, the estimate of expenses you paid during the period would be higher, and your ending account value lower, by this amount.
Please note that the expenses shown in the table are meant to highlight your ongoing costs only and do not reflect any transaction costs. Therefore, the second line of the table is useful in comparing ongoing costs only, and will not help you determine the relative total costs of owning different funds.
Semiannual Report
| Beginning
Account Value
January 1, 2005 | Ending
Account Value
June 30, 2005 | Expenses Paid
During Period*
January 1, 2005
to June 30, 2005 |
Spartan Michigan Municipal Income Fund | | | |
Actual | $ 1,000.00 | $ 1,023.40 | $ 2.51 |
HypotheticalA | $ 1,000.00 | $ 1,022.32 | $ 2.51 |
Fidelity Michigan Municipal Money Market Fund | | | |
Actual | $ 1,000.00 | $ 1,008.70 | $ 2.74 |
HypotheticalA | $ 1,000.00 | $ 1,022.07 | $ 2.76 |
A 5% return per year before expenses
* Expenses are equal to each Fund's annualized expense ratio (shown in the table below); multiplied by the average account value over the period, multiplied by 181/365 (to reflect the one-half year period
| Annualized
Expense Ratio |
Spartan Michigan Municipal Income Fund | .50% |
Fidelity Michigan Municipal Money Market Fund | .55% |
Semiannual Report
Spartan Michigan Municipal Income Fund
Investment Changes
Top Five Sectors as of June 30, 2005 |
| % of fund's
net assets | % of fund's net assets
6 months ago |
General Obligations | 45.6 | 50.7 |
Escrowed/Pre-Refunded | 18.9 | 10.4 |
Water & Sewer | 12.0 | 11.6 |
Health Care | 7.3 | 8.6 |
Electric Utilities | 5.0 | 5.1 |
Average Years to Maturity as of June 30, 2005 |
| | 6 months ago |
Years | 10.9 | 12.2 |
Average years to maturity is based on the average time remaining to the stated maturity date of each bond, weighted by the market value of each bond. |
Duration as of June 30, 2005 |
| | 6 months ago |
Years | 6.1 | 6.5 |
Duration shows how much a bond fund's price fluctuates with changes in comparable interest rates. If rates rise 1%, for example, a fund with a five-year duration is likely to lose about 5% of its value. Other factors also can influence a bond fund's performance and share price. Accordingly, a bond fund's actual performance may differ from this example. |
Quality Diversification (% of fund's net assets) |
As of June 30, 2005 | As of December 31, 2004 |
 | AAA 67.5% | | | AAA 65.9% | |
 | AA,A 29.5% | | | AA,A 31.0% | |
 | BBB 1.8% | | | BBB 0.9% | |
 | Not Rated 0.0% | | | Not Rated 0.2% | |
 | Short-Term
Investments and
Net Other Assets 1.2% | | | Short-Term
Investments and
Net Other Assets 2.0% | |

We have used ratings from Moody's® Investors Services, Inc. Where Moody's ratings are not available, we have used S&P® ratings. |
Semiannual Report
Spartan Michigan Municipal Income Fund
Investments June 30, 2005 (Unaudited)
Showing Percentage of Net Assets
Municipal Bonds - 97.9% |
| Principal
Amount | | Value
(Note 1) |
Michigan - 97.1% |
Anchor Bay School District 2000 School Bldg. & Site Series III, 5.25% 5/1/31 | | $ 9,300,000 | | $ 9,889,713 |
Ann Arbor Econ. Dev. Corp. Ltd. Oblig. Rev. (Glacier Hills, Inc. Proj.) 8.375% 1/15/19 (Escrowed to Maturity) (d) | | 3,016,000 | | 3,958,983 |
Bay City Gen. Oblig. 0% 6/1/15 (AMBAC Insured) | | 1,725,000 | | 1,161,960 |
Birmingham County School District Series II, 5.25% 11/1/19 | | 1,200,000 | | 1,310,796 |
Brighton Area School District Livingston County Series II, 0% 5/1/15 (AMBAC Insured) | | 10,000,000 | | 6,758,499 |
Byron Ctr. Pub. Schools 5.5% 5/1/16 | | 1,055,000 | | 1,166,714 |
Caladonia Cmnty. Schools Counties of Kent, Allegan and Barry: | | | | |
5.25% 5/1/17 | | 1,370,000 | | 1,518,851 |
5.25% 5/1/18 | | 1,100,000 | | 1,214,004 |
5.5% 5/1/26 (Pre-Refunded to 5/1/10 @ 100) (d) | | 3,000,000 | | 3,325,560 |
Carman-Ainsworth Cmnty. School District: | | | | |
5% 5/1/14 (FSA Insured) (a) | | 1,765,000 | | 1,961,497 |
5% 5/1/16 (FSA Insured) (a) | | 1,000,000 | | 1,108,780 |
5% 5/1/17 (FSA Insured) (a) | | 2,065,000 | | 2,277,076 |
5.5% 5/1/14 (Pre-Refunded to 5/1/12 @ 100) (d) | | 1,755,000 | | 1,998,155 |
5.5% 5/1/15 (Pre-Refunded to 5/1/12 @ 100) (d) | | 1,850,000 | | 2,106,318 |
5.5% 5/1/16 (Pre-Refunded to 5/1/12 @ 100) (d) | | 1,000,000 | | 1,138,550 |
5.5% 5/1/17 (Pre-Refunded to 5/1/12 @ 100) (d) | | 2,060,000 | | 2,345,413 |
5.5% 5/1/18 (Pre-Refunded to 5/1/12 @ 100) (d) | | 2,175,000 | | 2,476,346 |
5.5% 5/1/20 (Pre-Refunded to 5/1/12 @ 100) (d) | | 2,000,000 | | 2,277,100 |
Charles Stewart Mott Cmnty. College 5% 5/1/17 (MBIA Insured) | | 1,675,000 | | 1,847,023 |
Chippewa Valley Schools: | | | | |
Series I, 5.375% 5/1/17 (Pre-Refunded to 5/1/11 @ 100) (d) | | 1,000,000 | | 1,118,550 |
5.5% 5/1/17 (Pre-Refunded to 5/1/12 @ 100) (d) | | 1,125,000 | | 1,280,869 |
Clarkston Cmnty. Schools: | | | | |
5.375% 5/1/21 | | 1,950,000 | | 2,178,326 |
5.375% 5/1/22 | | 1,150,000 | | 1,282,998 |
Comstock Park Pub. Schools 5% 5/1/16 (FSA Insured) | | 1,000,000 | | 1,107,910 |
Constantine Pub. Schools: | | | | |
5% 5/1/25 (Pre-Refunded to 11/1/12 @ 100) (d) | | 2,250,000 | | 2,378,250 |
5.5% 5/1/18 (Pre-Refunded to 11/1/12 @ 100) (d) | | 1,220,000 | | 1,392,349 |
5.5% 5/1/19 (Pre-Refunded to 11/1/12 @ 100) (d) | | 1,245,000 | | 1,420,881 |
5.5% 5/1/20 (Pre-Refunded to 11/1/12 @ 100) (d) | | 1,245,000 | | 1,420,881 |
5.5% 5/1/21 (Pre-Refunded to 11/1/12 @ 100) (d) | | 1,250,000 | | 1,426,588 |
Municipal Bonds - continued |
| Principal
Amount | | Value
(Note 1) |
Michigan - continued |
Crawford AuSable School District (School Bldg. & Site Proj.) Series 2001, 5.625% 5/1/18 (Pre-Refunded to 5/1/11 @ 100) (d) | | $ 1,100,000 | | $ 1,241,801 |
Detroit City School District: | | | | |
Series A: | | | | |
5.5% 5/1/11 (FSA Insured) | | 2,000,000 | | 2,244,640 |
5.5% 5/1/16 (FSA Insured) | | 1,500,000 | | 1,682,460 |
5.5% 5/1/17 (FGIC Insured) | | 3,015,000 | | 3,393,473 |
5.5% 5/1/18 (FGIC Insured) | | 2,000,000 | | 2,240,960 |
5.5% 5/1/18 (FSA Insured) | | 1,000,000 | | 1,116,490 |
5.5% 5/1/20 (FSA Insured) | | 3,000,000 | | 3,336,030 |
Series B, 5.25% 5/1/15 (FGIC Insured) | | 3,085,000 | | 3,437,986 |
Detroit Convention Facilities Rev. (Cobo Hall Expansion Proj.): | | | | |
5% 9/30/11 (MBIA Insured) | | 3,000,000 | | 3,297,480 |
5% 9/30/12 (MBIA Insured) | | 3,000,000 | | 3,317,520 |
Detroit Gen. Oblig.: | | | | |
(Distributable State Aid Proj.) 5.25% 5/1/09 (AMBAC Insured) | | 4,525,000 | | 4,898,132 |
Series 2003 A, 5% 4/1/11 (XL Cap. Assurance, Inc. Insured) | | 1,430,000 | | 1,553,695 |
Series B1, 5% 4/1/13 (AMBAC Insured) | | 2,000,000 | | 2,205,960 |
5.5% 4/1/17 (MBIA Insured) | | 2,615,000 | | 2,878,801 |
5.5% 4/1/19 (MBIA Insured) | | 1,500,000 | | 1,677,735 |
5.5% 4/1/20 (MBIA Insured) | | 1,250,000 | | 1,393,963 |
Detroit Swr. Disp. Rev.: | | | | |
Series 2001 D1, 5.5%, tender 7/1/08 (MBIA Insured) (b) | | 10,000,000 | | 10,682,400 |
Series A: | | | | |
0% 7/1/14 (FGIC Insured) | | 6,730,000 | | 4,731,325 |
5.125% 7/1/31 (FGIC Insured) | | 8,020,000 | | 8,461,100 |
Detroit Wtr. Supply Sys. Rev.: | | | | |
Series 2001 A, 5.25% 7/1/33 (FGIC Insured) | | 6,390,000 | | 6,825,479 |
Series A: | | | | |
5.5% 7/1/15 (Pre-Refunded to 1/1/10 @ 101) (d) | | 3,675,000 | | 4,088,438 |
5.75% 7/1/11 (MBIA Insured) | | 3,050,000 | | 3,474,194 |
5.875% 7/1/29 (Pre-Refunded to 1/1/10 @ 101) (d) | | 3,085,000 | | 3,480,281 |
Series B: | | | | |
5.25% 7/1/17 (MBIA Insured) | | 2,760,000 | | 3,065,532 |
5.5% 7/1/33 (FGIC Insured) | | 10,000,000 | | 11,016,200 |
6.5% 7/1/15 (FGIC Insured) | | 6,025,000 | | 7,445,514 |
Municipal Bonds - continued |
| Principal
Amount | | Value
(Note 1) |
Michigan - continued |
Dexter Cmnty. Schools 5% 5/1/18 (Liquidity Facility Sumitomo Bank Lease Fin., Inc. (SBLF)) | | $ 1,955,000 | | $ 2,113,687 |
Dundee Cmnty. School District: | | | | |
Series 2000, 5.375% 5/1/27 (Pre-Refunded to 5/1/10 @ 100) (d) | | 1,195,000 | | 1,320,857 |
5.375% 5/1/19 (Pre-Refunded to 5/1/10 @ 100) (d) | | 1,000,000 | | 1,105,320 |
East China School District 5.5% 5/1/17 (Pre-Refunded to 11/1/11 @ 100) (d) | | 1,775,000 | | 2,006,815 |
East Grand Rapids Pub. School District: | | | | |
5% 5/1/16 (FSA Insured) | | 1,425,000 | | 1,559,876 |
5% 5/1/17 (FSA Insured) | | 1,985,000 | | 2,163,531 |
5.5% 5/1/17 | | 1,690,000 | | 1,858,071 |
Eastern Michigan Univ. Revs. Series 2000 B: | | | | |
5.5% 6/1/20 (FGIC Insured) | | 2,230,000 | | 2,430,299 |
5.625% 6/1/30 (FGIC Insured) | | 1,250,000 | | 1,378,738 |
Farmington Pub. School District 5% 5/1/18 (FSA Insured) | | 4,500,000 | | 4,927,275 |
Fenton Area Pub. Schools 5% 5/1/14 (FGIC Insured) | | 1,775,000 | | 1,958,446 |
Ferris State Univ. Rev.: | | | | |
5% 10/1/16 (MBIA Insured) (a) | | 1,255,000 | | 1,379,521 |
5% 10/1/17 (MBIA Insured) (a) | | 1,320,000 | | 1,443,420 |
Flushing Cmnty. Schools: | | | | |
5.25% 5/1/17 | | 1,000,000 | | 1,108,650 |
5.25% 5/1/18 | | 1,030,000 | | 1,136,749 |
Fraser Pub. School District: | | | | |
5% 5/1/16 (FSA Insured) | | 1,055,000 | | 1,166,092 |
5% 5/1/17 (FSA Insured) | | 1,615,000 | | 1,780,861 |
Genesee County Gen. Oblig. Series A: | | | | |
5% 5/1/17 (MBIA Insured) | | 1,355,000 | | 1,482,506 |
5% 5/1/18 (MBIA Insured) | | 1,505,000 | | 1,637,621 |
Gibraltar School District: | | | | |
5% 5/1/16 (FSA Insured) | | 1,230,000 | | 1,353,135 |
5% 5/1/17 (FSA Insured) | | 1,230,000 | | 1,345,743 |
5.5% 5/1/18 (Pre-Refunded to 11/1/12 @ 100) (d) | | 1,200,000 | | 1,369,524 |
5.5% 5/1/21 (Pre-Refunded to 11/1/12 @ 100) (d) | | 1,200,000 | | 1,369,524 |
Grand Blanc Cmnty. Schools 5.5% 5/1/13 (FGIC Insured) | | 1,000,000 | | 1,119,070 |
Grand Rapids Downtown Dev. Auth. Tax Increment Rev. 0% 6/1/11 (MBIA Insured) | | 3,160,000 | | 2,545,096 |
Grand Rapids Wtr. Supply Sys. 5.75% 1/1/11 (FGIC Insured) | | 2,000,000 | | 2,262,260 |
Municipal Bonds - continued |
| Principal
Amount | | Value
(Note 1) |
Michigan - continued |
Greater Detroit Resource Recovery Auth. Rev. Series A, 6.25% 12/13/07 (AMBAC Insured) | | $ 3,000,000 | | $ 3,245,700 |
Hamilton Cmnty. Schools District 5% 5/1/24 (FGIC Insured) | | 1,500,000 | | 1,548,015 |
Haslett Pub. Schools 5% 5/1/16 (MBIA Insured) | | 1,100,000 | | 1,210,121 |
Howell Pub. Schools 0% 5/1/10 (AMBAC Insured) | | 1,130,000 | | 955,087 |
Hudsonville Pub. Schools 5% 5/1/16 (FSA Insured) | | 1,000,000 | | 1,100,110 |
Huron School District 5.625% 5/1/16 (FSA Insured) | | 1,050,000 | | 1,170,593 |
Huron Valley School District: | | | | |
0% 5/1/10 (FGIC Insured) | | 2,500,000 | | 2,113,025 |
0% 5/1/11 (FGIC Insured) | | 5,830,000 | | 4,712,564 |
0% 5/1/12 (FGIC Insured) | | 1,420,000 | | 1,094,096 |
5.25% 5/1/16 | | 2,450,000 | | 2,728,541 |
5.5% 5/1/18 (Pre-Refunded to 11/1/11 @ 100) (d) | | 2,525,000 | | 2,854,765 |
Ingham, Eaton and Clinton Counties Lansing School District: | | | | |
5% 5/1/19 | | 4,450,000 | | 4,818,994 |
5% 5/1/20 | | 1,000,000 | | 1,078,270 |
Jonesville Cmnty. Schools 5.75% 5/1/17 (Pre-Refunded to 5/1/09 @ 100) (d) | | 1,150,000 | | 1,267,634 |
Kent Hosp. Fin. Auth. Hosp. Facilities Rev.: | | | | |
(Butterworth Hosp. Proj.) Series A, 7.25% 1/15/13 | | 3,685,000 | | 4,295,715 |
(Spectrum Health Proj.) Series A: | | | | |
5.375% 1/15/11 | | 2,420,000 | | 2,563,772 |
5.375% 1/15/12 | | 2,505,000 | | 2,661,237 |
L'Anse Creuse Pub. Schools: | | | | |
5.375% 5/1/18 | | 1,000,000 | | 1,119,410 |
5.375% 5/1/20 | | 1,000,000 | | 1,118,040 |
Lake Orion Cmnty. School District 5.25% 5/1/27 (Liquidity Facility Sumitomo Bank Lease Fin., Inc. (SBLF)) | | 1,150,000 | | 1,234,284 |
Lansing Bldg. Auth. Rev. 0% 6/1/12 (AMBAC Insured) | | 3,000,000 | | 2,304,120 |
Lawton Cmnty. Schools 5.5% 5/1/19 (Pre-Refunded to 11/1/11 @ 100) (d) | | 1,050,000 | | 1,187,130 |
Livonia Muni. Bldg. Auth. 5% 5/1/17 (FGIC Insured) | | 1,100,000 | | 1,160,544 |
Livonia Pub. School District Series II, 0% 5/1/21 (FGIC Insured) (Pre-Refunded to 5/1/07 @ 39.31) (d) | | 8,480,000 | | 3,142,434 |
Michigan Bldg. Auth. Rev. (Facilities Prog.) Series III, 5% 10/15/10 (MBIA Insured) | | 1,000,000 | | 1,089,730 |
Michigan Comprehensive Trans. Rev. Series B: | | | | |
5.25% 5/15/11 (FSA Insured) | | 1,475,000 | | 1,636,970 |
5.25% 5/15/16 (Pre-Refunded to 5/15/12 @ 100) (d) | | 3,850,000 | | 4,327,362 |
Municipal Bonds - continued |
| Principal
Amount | | Value
(Note 1) |
Michigan - continued |
Michigan Ctfs. of Prtn. 5.75% 6/1/17 (AMBAC Insured) | | $ 3,000,000 | | $ 3,340,140 |
Michigan Gen. Oblig. (Envir. Protection Prog.) 6.25% 11/1/12 | | 2,665,000 | | 3,064,137 |
Michigan Higher Ed. Student Ln. Auth. Rev. Series XII W, 4.875% 9/1/10 (AMBAC Insured) (c) | | 3,000,000 | | 3,150,930 |
Michigan Hosp. Fin. Auth. Hosp. Rev.: | | | | |
(Ascension Health Cr. Group Proj.) Series A: | | | | |
5%, tender 4/1/11 (b) | | 2,030,000 | | 2,180,342 |
6% 11/15/19 (Pre-Refunded to 11/15/09 @ 101) (d) | | 10,645,000 | | 11,996,363 |
6.125% 11/15/26 (Pre-Refunded to 11/15/09 @ 101) (d) | | 3,070,000 | | 3,475,271 |
(Crittenton Hosp. Proj.) Series A: | | | | |
5.5% 3/1/13 | | 455,000 | | 497,156 |
5.5% 3/1/14 | | 1,300,000 | | 1,414,088 |
5.5% 3/1/15 | | 1,985,000 | | 2,153,169 |
(Daughters of Charity Health Sys. Proj.) 5.5% 11/1/05 (Escrowed to Maturity) (d) | | 520,000 | | 524,987 |
(Genesys Reg'l. Med. Hosp. Proj.) Series A, 5.3% 10/1/11 (Escrowed to Maturity) (d) | | 1,000,000 | | 1,061,920 |
(Henry Ford Health Sys. Proj.): | | | | |
Series 2003 A, 5.5% 3/1/14 | | 2,000,000 | | 2,194,600 |
Series A, 6% 11/15/19 | | 1,945,000 | | 2,086,363 |
6% 9/1/12 (AMBAC Insured) | | 1,500,000 | | 1,741,575 |
(Mercy Health Svcs. Proj.): | | | | |
Series 1996 R, 5.375% 8/15/26 (Escrowed to Maturity) (d) | | 2,500,000 | | 2,569,250 |
Series Q: | | | | |
5.25% 8/15/10 (Escrowed to Maturity) (d) | | 2,195,000 | | 2,264,296 |
5.375% 8/15/26 (Escrowed to Maturity) (d) | | 2,450,000 | | 2,517,865 |
6% 8/15/08 (Escrowed to Maturity) (d) | | 1,130,000 | | 1,181,765 |
6% 8/15/10 (Escrowed to Maturity) (d) | | 1,265,000 | | 1,325,796 |
Series R, 5.375% 8/15/16 (Escrowed to Maturity) (d) | | 2,500,000 | | 2,572,000 |
(MidMichigan Health Obligated Group Prog.)
Series 2002 A, 5.5% 4/15/18 (AMBAC Insured) | | 2,000,000 | | 2,216,400 |
(Oakwood Obligated Group Proj.) 5.5% 11/1/11 | | 3,000,000 | | 3,280,440 |
(Saint John Hosp. & Med. Ctr. Proj.) Series A, 6% 5/15/09 (Escrowed to Maturity) (d) | | 1,710,000 | | 1,898,818 |
(Sisters of Mercy Health Corp. Proj.) Series P, 5.375% 8/15/14 (Escrowed to Maturity) (d) | | 570,000 | | 607,808 |
Municipal Bonds - continued |
| Principal
Amount | | Value
(Note 1) |
Michigan - continued |
Michigan Hosp. Fin. Auth. Hosp. Rev.: - continued | | | | |
(Sparrow Hosp. Obligated Group Proj.): | | | | |
5.5% 11/15/21 | | $ 1,435,000 | | $ 1,555,784 |
5.625% 11/15/31 | | 4,500,000 | | 4,798,035 |
(Trinity Health Sys. Proj.) Series 2000 A, 6% 12/1/27 | | 1,535,000 | | 1,706,229 |
Michigan Muni. Bond Auth. Rev.: | | | | |
(Detroit School District Proj.) Series B, 5% 6/1/12 (FSA Insured) | | 4,000,000 | | 4,393,280 |
(Local Govt. Ln. Prog.): | | | | |
Series A: | | | | |
0% 12/1/07 (FGIC Insured) | | 5,340,000 | | 4,960,700 |
4.75% 12/1/09 (FGIC Insured) | | 6,000,000 | | 6,020,100 |
Series CA: | | | | |
0% 6/15/07 (FSA Insured) | | 5,165,000 | | 4,876,690 |
0% 6/15/13 (FSA Insured) | | 3,850,000 | | 2,832,984 |
Series G, 0% 5/1/19 (AMBAC Insured) | | 1,865,000 | | 1,035,952 |
7.5% 11/1/09 (AMBAC Insured) | | 20,000 | | 20,109 |
Series C, 5% 5/1/11 | | 2,085,000 | | 2,283,909 |
5% 10/1/23 | | 5,000,000 | | 5,312,950 |
5.375% 10/1/19 | | 1,980,000 | | 2,214,056 |
Michigan Pub. Pwr. Agcy. Rev. (Belle River Proj.)
Series A, 5.25% 1/1/09 (MBIA Insured) | | 2,000,000 | | 2,151,320 |
Michigan Strategic Fund Exempt Facilities Rev. (Waste Mgmt., Inc. Proj.) 3.75%, tender 8/1/07 (b)(c) | | 3,000,000 | | 3,021,960 |
Michigan Strategic Fund Ltd. Oblig. Rev. (Detroit Edison Co. Proj.): | | | | |
Series A, 5.55% 9/1/29 (MBIA Insured) (c) | | 1,000,000 | | 1,071,290 |
Series AA, 6.4% 9/1/25 (MBIA Insured) | | 5,000,000 | | 5,127,300 |
Series BB: | | | | |
7% 7/15/08 (MBIA Insured) | | 2,200,000 | | 2,453,330 |
7% 5/1/21 (AMBAC Insured) | | 8,520,000 | | 11,398,311 |
Michigan Strategic Fund Solid Waste Disp. Rev. (Waste Mgmt., Inc. Proj.) 4.2%, tender 12/1/05 (b)(c) | | 2,155,000 | | 2,162,758 |
Michigan Trunk Line: | | | | |
Series A: | | | | |
0% 10/1/11 (AMBAC Insured) | | 3,630,000 | | 2,882,801 |
5.5% 11/1/16 | | 3,000,000 | | 3,510,690 |
5.25% 10/1/16 (FSA Insured) | | 3,000,000 | | 3,336,930 |
Mona Shores School District 6.75% 5/1/10 (FGIC Insured) | | 2,220,000 | | 2,570,338 |
Municipal Bonds - continued |
| Principal
Amount | | Value
(Note 1) |
Michigan - continued |
Montague Pub. School District: | | | | |
5.5% 5/1/16 | | $ 1,005,000 | | $ 1,111,419 |
5.5% 5/1/17 | | 1,005,000 | | 1,109,621 |
5.5% 5/1/19 | | 1,090,000 | | 1,200,243 |
Morenci Area Schools 5.25% 5/1/21 (MBIA Insured) | | 1,410,000 | | 1,537,929 |
Mount Clemens Cmnty. School District: | | | | |
0% 5/1/17 | | 5,000,000 | | 2,398,850 |
5.5% 5/1/16 (Pre-Refunded to 11/1/11 @ 100) (d) | | 1,000,000 | | 1,130,600 |
Muskegon Heights Wtr. Sys. Rev. Series 2000 A: | | | | |
5.625% 11/1/20 (MBIA Insured) | | 2,075,000 | | 2,298,893 |
5.625% 11/1/30 (MBIA Insured) | | 1,550,000 | | 1,710,100 |
New Haven Cmnty. Schools 5.25% 5/1/18 | | 1,175,000 | | 1,293,945 |
Northville Pub. Schools: | | | | |
Series II: | | | | |
5% 5/1/15 (FSA Insured) (a) | | 1,525,000 | | 1,686,909 |
5% 5/1/16 (FSA Insured) (a) | | 1,475,000 | | 1,622,662 |
5% 5/1/17 (FSA Insured) | | 3,675,000 | | 4,036,363 |
Northwestern Michigan Cmnty. College Impt.: | | | | |
5.5% 4/1/14 (FGIC Insured) | | 285,000 | | 309,698 |
5.5% 4/1/14 (Pre-Refunded to 10/1/09 @ 100) (d) | | 1,730,000 | | 1,902,204 |
5.5% 4/1/15 (FGIC Insured) | | 170,000 | | 184,521 |
5.5% 4/1/15 (Pre-Refunded to 10/1/09 @ 100) (d) | | 1,025,000 | | 1,127,029 |
Northwestern Michigan College Gen. Oblig. 5% 4/1/14 (AMBAC Insured) | | 2,000,000 | | 2,220,840 |
Oakland Univ. Rev. 5% 5/15/12 (AMBAC Insured) | | 1,020,000 | | 1,122,979 |
Okemos Pub. School District: | | | | |
0% 5/1/12 (MBIA Insured) | | 2,500,000 | | 1,926,225 |
0% 5/1/13 (MBIA Insured) | | 1,700,000 | | 1,256,844 |
Ovid-Elsie Area Schools Counties of Clinton, Shawassee, Saginaw and Gratiot 5% 5/1/18 | | 1,515,000 | | 1,633,155 |
Paw Paw Pub. School District 5.25% 5/1/25
(Pre-Refunded to 5/1/10 @ 100) (d) | | 4,100,000 | | 4,508,975 |
Petoskey Pub. School District: | | | | |
5% 5/1/14 (MBIA Insured) | | 1,430,000 | | 1,583,482 |
5% 5/1/16 (MBIA Insured) | | 1,945,000 | | 2,146,444 |
Plainwell Cmnty. School District: | | | | |
5% 5/1/15 (FSA Insured) | | 1,030,000 | | 1,142,940 |
5% 5/1/16 (FSA Insured) | | 1,025,000 | | 1,132,041 |
5.5% 5/1/14 | | 1,000,000 | | 1,132,940 |
5.5% 5/1/16 (Pre-Refunded to 11/1/12 @ 100) (d) | | 1,000,000 | | 1,141,270 |
Municipal Bonds - continued |
| Principal
Amount | | Value
(Note 1) |
Michigan - continued |
Port Huron Area School District County of Saint Clair: | | | | |
0% 5/1/08 (Liquidity Facility Michigan School Bond Ln. Fund) | | $ 1,975,000 | | $ 1,805,901 |
5.25% 5/1/16 | | 1,175,000 | | 1,309,115 |
5.25% 5/1/17 | | 2,125,000 | | 2,357,390 |
5.25% 5/1/18 | | 2,175,000 | | 2,395,175 |
Reese Pub. Schools School District (School Bldg. & Site Proj.) 5.5% 5/1/30 (Pre-Refunded to 5/1/10 @ 100) (d) | | 2,140,000 | | 2,377,283 |
Riverview Cmnty. School District: | | | | |
5% 5/1/14 | | 905,000 | | 1,004,306 |
5% 5/1/15 | | 955,000 | | 1,053,699 |
5% 5/1/17 | | 1,000,000 | | 1,093,860 |
5% 5/1/18 | | 1,000,000 | | 1,087,600 |
Rochester Cmnty. School District: | | | | |
Series II, 5.5% 5/1/16 | | 1,125,000 | | 1,249,493 |
5% 5/1/19 (MBIA Insured) | | 1,000,000 | | 1,124,590 |
Royal Oak Hosp. Fin. Auth. Hosp. Rev. (William Beaumont Hosp. Proj.): | | | | |
Series M, 5.25% 11/15/31 (MBIA Insured) | | 2,000,000 | | 2,114,860 |
5.5% 1/1/14 | | 4,000,000 | | 4,128,120 |
Saint Clair County Gen. Oblig.: | | | | |
5% 4/1/17 (AMBAC Insured) | | 1,380,000 | | 1,508,492 |
5% 4/1/19 (AMBAC Insured) | | 1,475,000 | | 1,606,600 |
Saint Joseph School District 5.5% 5/1/18 | | 1,065,000 | | 1,173,971 |
South Haven Pub. Schools: | | | | |
5% 5/1/21 (FSA Insured) | | 1,450,000 | | 1,556,532 |
5% 5/1/22 (FSA Insured) | | 1,350,000 | | 1,449,185 |
South Lyon Cmnty. Schools (School Bldg. and Site Prog.) 5.25% 5/1/15 (FGIC Insured) | | 1,000,000 | | 1,114,820 |
South Redford School District: | | | | |
5% 5/1/16 (MBIA Insured) | | 1,125,000 | | 1,242,484 |
5% 5/1/19 (MBIA Insured) | | 1,000,000 | | 1,089,820 |
Southfield Library Bldg. Auth. 5.5% 5/1/21
(Pre-Refunded to 5/1/10 @ 100) (d) | | 1,425,000 | | 1,583,004 |
Southfield Pub. Schools: | | | | |
Series A: | | | | |
5.25% 5/1/17 (Liquidity Facility Sumitomo Bank Lease Fin., Inc. (SBLF)) | | 1,025,000 | | 1,136,366 |
5.25% 5/1/18 (Liquidity Facility Sumitomo Bank Lease Fin., Inc. (SBLF)) | | 1,025,000 | | 1,131,231 |
Municipal Bonds - continued |
| Principal
Amount | | Value
(Note 1) |
Michigan - continued |
Southfield Pub. Schools: - continued | | | | |
Series A: | | | | |
5.25% 5/1/19 (Liquidity Facility Sumitomo Bank Lease Fin., Inc. (SBLF)) | | $ 1,025,000 | | $ 1,129,038 |
5.25% 5/1/20 (Liquidity Facility Sumitomo Bank Lease Fin., Inc. (SBLF)) | | 1,025,000 | | 1,126,854 |
Series B: | | | | |
5.125% 5/1/16 (FSA Insured) | | 2,780,000 | | 3,091,138 |
5.25% 5/1/25 (FSA Insured) | | 2,000,000 | | 2,184,140 |
Standish Sterling Cmnty. Schools 5.15% 5/1/28
(FGIC Insured) | | 4,900,000 | | 5,109,671 |
Stockbridge Cmnty. Schools 5.625% 5/1/26
(Pre-Refunded to 5/1/10 @ 100) (d) | | 1,415,000 | | 1,579,777 |
Taylor City Bldg. Auth. County of Wayne Bldg. Auth. Pub. Facilities: | | | | |
5% 10/1/21 (MBIA Insured) | | 1,735,000 | | 1,868,231 |
5% 10/1/23 (MBIA Insured) | | 1,920,000 | | 2,061,850 |
Tecumseh Pub. Schools 5.5% 5/1/30 (Pre-Refunded to 5/1/10 @ 100) (d) | | 1,250,000 | | 1,388,600 |
Troy School District 5% 5/1/15 | | 2,135,000 | | 2,355,652 |
Utica Cmnty. Schools: | | | | |
5% 5/1/17 | | 3,000,000 | | 3,272,430 |
5.25% 5/1/15 | | 725,000 | | 811,101 |
5.375% 5/1/16 | | 2,250,000 | | 2,541,218 |
5.5% 5/1/17 | | 1,000,000 | | 1,136,460 |
Warren Consolidated School District 5.375% 5/1/16 (FSA Insured) | | 2,350,000 | | 2,607,584 |
Waverly Cmnty. School District: | | | | |
5% 5/1/11 (FSA Insured) | | 1,000,000 | | 1,095,950 |
5% 5/1/17 (FSA Insured) | | 3,090,000 | | 3,407,343 |
5.75% 5/1/14 (Pre-Refunded to 5/1/10 @ 100) (d) | | 1,000,000 | | 1,122,020 |
5.75% 5/1/16 (Pre-Refunded to 5/1/10 @ 100) (d) | | 1,000,000 | | 1,122,020 |
Wayne Charter County Arpt. Rev. (Detroit Metropolitan Wayne County Arpt. Proj.) Series A, 5.25% 12/1/12 (MBIA Insured) (c) | | 2,500,000 | | 2,663,825 |
Wayne Charter County Gen. Oblig. Series 2001 A, 5.5% 12/1/17 (MBIA Insured) | | 1,000,000 | | 1,098,250 |
Wayne-Westland Cmnty. Schools 5% 5/1/10 (FSA Insured) | | 3,000,000 | | 3,254,610 |
West Ottawa Pub. School District 5.25% 5/1/10
(FGIC Insured) | | 850,000 | | 884,349 |
Whitehall District Schools 5.5% 5/1/15 | | 1,000,000 | | 1,108,270 |
Williamston Cmnty. Schools Gen. Oblig. 5% 5/1/18 (FGIC Insured) | | 1,000,000 | | 1,096,670 |
Municipal Bonds - continued |
| Principal
Amount | | Value
(Note 1) |
Michigan - continued |
Willow Run Cmnty. Schools County of Washtenaw: | | | | |
5% 5/1/17 (FSA Insured) | | $ 1,875,000 | | $ 2,059,481 |
5.5% 5/1/16 (Pre-Refunded to 5/1/11 @ 100) (d) | | 1,630,000 | | 1,833,995 |
Woodhaven-Brownstown School District County of Wayne: | | | | |
5.375% 5/1/16 | | 1,710,000 | | 1,911,729 |
5.375% 5/1/18 (FSA Insured) | | 1,875,000 | | 2,076,956 |
Wyandotte City School District 5.375% 5/1/20 | | 1,050,000 | | 1,166,445 |
Wyandotte Elec. Rev.: | | | | |
5.375% 10/1/14 (MBIA Insured) | | 3,485,000 | | 3,763,208 |
5.375% 10/1/15 (MBIA Insured) | | 1,670,000 | | 1,803,316 |
Zeeland Pub. Schools: | | | | |
5% 5/1/16 (FGIC Insured) | | 2,035,000 | | 2,254,597 |
5% 5/1/17 (FGIC Insured) | | 1,500,000 | | 1,654,050 |
5.25% 5/1/16 (MBIA Insured) | | 1,050,000 | | 1,177,344 |
| | 564,231,954 |
Puerto Rico - 0.8% |
Puerto Rico Commonwealth Hwy. & Trans. Auth. Hwy. Rev. Series 1996 Y, 5% 7/1/36 (MBIA Insured) | | 2,500,000 | | 2,708,925 |
Puerto Rico Commonwealth Infrastructure Fing. Auth. Series 2000 A, 5.5% 10/1/32 (Escrowed to Maturity) (d) | | 900,000 | | 993,582 |
Puerto Rico Elec. Pwr. Auth. Pwr. Rev. Series QQ, 5.5% 7/1/18 (XL Cap. Assurance, Inc. Insured) | | 1,000,000 | | 1,183,140 |
| | 4,885,647 |
TOTAL MUNICIPAL BONDS (Cost $539,807,847) | 569,117,601 |
Municipal Notes - 0.9% |
| | Principal
Amount | | Value
(Note 1) |
Michigan - 0.9% |
Michigan Strategic Fund Poll. Cont. Rev. (Gen. Motors Corp. Proj.) Series 1988 A, 4.4%, VRDN (b)
(Cost $5,000,000) | | $ 5,000,000 | | $ 5,000,000 |
TOTAL INVESTMENT PORTFOLIO - 98.8% (Cost $544,807,847) | | | 574,117,601 |
NET OTHER ASSETS - 1.2% | | | 7,077,778 |
NET ASSETS - 100% | | $ 581,195,379 |
Security Type Abbreviation |
VRDN - VARIABLE RATE DEMAND NOTE |
Legend |
(a) Security or a portion of the security purchased on a delayed delivery or when-issued basis. |
(b) The coupon rate shown on floating or adjustable rate securities represents the rate at period end. |
(c) Private activity obligations whose interest is subject to the federal alternative minimum tax for individuals. |
(d) Security collateralized by an amount sufficient to pay interest and principal. |
Other Information |
The distribution of municipal securities by revenue source, as a percentage of total net assets, is as follows: |
General Obligations | 45.6% |
Escrowed/Pre-Refunded | 18.9% |
Water & Sewer | 12.0% |
Health Care | 7.3% |
Electric Utilities | 5.0% |
Others* (individually less than 5%) | 11.2% |
| 100.0% |
*Includes net other assets |
See accompanying notes which are an integral part of the financial statements.
Semiannual Report
Spartan Michigan Municipal Income Fund
Financial Statements
Statement of Assets and Liabilities
| June 30, 2005 (Unaudited) |
| | |
Assets | | |
Investment in securities, at value (cost $544,807,847) - See accompanying schedule | | $ 574,117,601 |
Cash | | 9,476,674 |
Receivable for investments sold | | 3,196,812 |
Receivable for fund shares sold | | 1,100,014 |
Interest receivable | | 5,776,137 |
Prepaid expenses | | 1,173 |
Other receivables | | 12,919 |
Total assets | | 593,681,330 |
| | |
Liabilities | | |
Payable for investments purchased on a delayed delivery basis | $ 11,423,932 | |
Payable for fund shares redeemed | 199,523 | |
Distributions payable | 610,303 | |
Accrued management fee | 180,053 | |
Other affiliated payables | 51,243 | |
Other payables and accrued expenses | 20,897 | |
Total liabilities | | 12,485,951 |
| | |
Net Assets | | $ 581,195,379 |
Net Assets consist of: | | |
Paid in capital | | $ 549,465,491 |
Undistributed net investment income | | 139,057 |
Accumulated undistributed net realized gain (loss) on investments | | 2,281,077 |
Net unrealized appreciation (depreciation) on investments | | 29,309,754 |
Net Assets, for 47,961,112 shares outstanding | | $ 581,195,379 |
Net Asset Value, offering price and redemption price per share ($581,195,379 ÷ 47,961,112 shares) | | $ 12.12 |
See accompanying notes which are an integral part of the financial statements.
Semiannual Report
Statement of Operations
| Six months ended June 30, 2005 (Unaudited) |
| | |
Investment Income | | |
Interest | | $ 12,376,960 |
| | |
Expenses | | |
Management fee | $ 1,062,017 | |
Transfer agent fees | 225,136 | |
Accounting fees and expenses | 67,582 | |
Independent trustees' compensation | 1,304 | |
Custodian fees and expenses | 4,569 | |
Registration fees | 17,266 | |
Audit | 23,028 | |
Legal | 5,727 | |
Miscellaneous | 2,632 | |
Total expenses before reductions | 1,409,261 | |
Expense reductions | (126,879) | 1,282,382 |
Net investment income | | 11,094,578 |
Realized and Unrealized Gain (Loss) Net realized gain (loss) on: | | |
Investment securities | 2,609,547 | |
Futures contracts | 36,223 | |
Total net realized gain (loss) | | 2,645,770 |
Change in net unrealized appreciation (depreciation) on investment securities | | (436,551) |
Net gain (loss) | | 2,209,219 |
Net increase (decrease) in net assets resulting from operations | | $ 13,303,797 |
See accompanying notes which are an integral part of the financial statements.
Semiannual Report
Spartan Michigan Municipal Income Fund
Financial Statements - continued
Statement of Changes in Net Assets
| Six months ended
June 30, 2005
(Unaudited) | Year ended
December 31,
2004 |
Increase (Decrease) in Net Assets | | |
Operations | | |
Net investment income | $ 11,094,578 | $ 22,584,939 |
Net realized gain (loss) | 2,645,770 | 6,019,576 |
Change in net unrealized appreciation (depreciation) | (436,551) | (7,701,308) |
Net increase (decrease) in net assets resulting
from operations | 13,303,797 | 20,903,207 |
Distributions to shareholders from net investment income | (11,062,385) | (22,507,564) |
Distributions to shareholders from net realized gain | (1,629,226) | (3,899,782) |
Total distributions | (12,691,611) | (26,407,346) |
Share transactions
Proceeds from sales of shares | 50,870,017 | 72,884,467 |
Reinvestment of distributions | 8,591,515 | 18,252,560 |
Cost of shares redeemed | (38,763,574) | (87,145,890) |
Net increase (decrease) in net assets resulting from share transactions | 20,697,958 | 3,991,137 |
Redemption fees | 1,870 | 2,127 |
Total increase (decrease) in net assets | 21,312,014 | (1,510,875) |
| | |
Net Assets | | |
Beginning of period | 559,883,365 | 561,394,240 |
End of period (including undistributed net investment income of $139,057 and undistributed net investment income of $106,864, respectively) | $ 581,195,379 | $ 559,883,365 |
Other Information Shares | | |
Sold | 4,217,701 | 5,988,507 |
Issued in reinvestment of distributions | 711,636 | 1,506,099 |
Redeemed | (3,217,432) | (7,198,143) |
Net increase (decrease) | 1,711,905 | 296,463 |
See accompanying notes which are an integral part of the financial statements.
Semiannual Report
Financial Highlights
| Six months ended
June 30, 2005 | Years ended December 31, |
| (Unaudited) | 2004 | 2003 | 2002 | 2001 | 2000 |
Selected Per-Share Data | | | | | |
Net asset value, beginning of period | $ 12.11 | $ 12.22 | $ 12.04 | $ 11.47 | $ 11.48 | $ 10.87 |
Income from Investment Operations | | | | | | |
Net investment income D | .235 | .491 | .513 | .532 | .552 F | .570 |
Net realized and unrealized gain (loss) | .045 | (.026) | .180 | .568 | (.010) F | .610 |
Total from investment operations | .280 | .465 | .693 | 1.100 | .542 | 1.180 |
Distributions from net investment income | (.235) | (.490) | (.513) | (.530) | (.552) | (.570) |
Distributions from net realized gain | (.035) | (.085) | - | - | - | - |
Total distributions | (.270) | (.575) | (.513) | (.530) | (.552) | (.570) |
Redemption fees added to paid in capital | - D,G | - D,G | - D,G | - D,G | - D,G | - |
Net asset value,
end of period | $ 12.12 | $ 12.11 | $ 12.22 | $ 12.04 | $ 11.47 | $ 11.48 |
Total Return B, C | 2.34% | 3.90% | 5.87% | 9.78% | 4.77% | 11.19% |
Ratios to Average Net Assets E | | | | | |
Expenses before expense reductions | .50% A | .50% | .50% | .50% | .50% | .51% |
Expenses net of voluntary waivers, if any | .50% A | .50% | .50% | .50% | .50% | .51% |
Expenses net of all reductions | .46% A | .48% | .49% | .48% | .44% | .45% |
Net investment income | 3.94% A | 4.05% | 4.22% | 4.51% | 4.76% F | 5.17% |
Supplemental Data | | | | | |
Net assets,
end of period (000 omitted) | $ 581,195 | $ 559,883 | $ 561,394 | $ 572,242 | $ 505,534 | $ 458,910 |
Portfolio turnover rate | 24% A | 12% | 23% | 17% | 19% | 18% |
A Annualized
B Total returns for periods of less than one year are not annualized.
C Total returns would have been lower had certain expenses not been reduced during the periods shown.
D Calculated based on average shares outstanding during the period.
E Expense ratios reflect operating expenses of the fund. Expenses before reductions do not reflect amounts reimbursed by the investment adviser or reductions from brokerage service arrangements or other expense offset arrangements and do not represent the amount paid by the fund during periods when reimbursements or reductions occur. Expenses net of any voluntary waivers reflect expenses after reimbursement by the investment adviser but prior to reductions from brokerage service arrangements or other expense offset arrangements. Expenses net of all reductions represent the net expenses paid by the fund.
F Effective January 1, 2001, the fund adopted the provisions of the AICPA Audit and Accounting Guide for Investment Companies and began amortizing premium and discount on all debt securities. Per-share data and ratios for periods prior to adoption have not been restated to reflect this change.
G Amount represents less than $.001 per share.
See accompanying notes which are an integral part of the financial statements.
Semiannual Report
Fidelity Michigan Municipal Money Market Fund
Investment Changes
Maturity Diversification |
Days | % of fund's
investments
6/30/05 | % of fund's
investments
12/31/04 | % of fund's
investments
6/30/04 |
0 - 30 | 90.7 | 92.5 | 85.4 |
31 - 90 | 2.2 | 0.9 | 7.9 |
91 - 180 | 3.6 | 2.7 | 5.7 |
181 - 397 | 3.5 | 3.9 | 1.0 |
Weighted Average Maturity |
| 6/30/05 | 12/31/04 | 6/30/04 |
Fidelity Michigan Municipal Money
Market Fund | 21 Days | 21 Days | 20 Days |
All Tax-Free Money Market
Funds Average * | 24 Days | 33 Days | 33 Days |
Asset Allocation (% of fund's net assets) |
As of June 30, 2005 | As of December 31, 2004 |
| Variable Rate
Demand Notes
(VRDNs) 84.1% | | | Variable Rate
Demand Notes
(VRDNs) 85.7% | |
 | Commercial
Paper (including
CP Mode) 7.3% | | | Commercial
Paper (including
CP Mode) 3.1% | |
 | Tender Bonds 0.5% | | | Tender Bonds 0.9% | |
 | Municipal Notes 3.5% | | | Municipal Notes 2.8% | |
 | Fidelity Municipal
Cash Central Fund 0.0% | | | Fidelity Municipal
Cash Central Fund 3.8% | |
 | Other Investments 0.7% | | | Other Investments 1.4% | |
| Net Other Assets 3.9% | | | Net Other Assets 2.3% | |

*Source: iMoneyNet, Inc.
Semiannual Report
Fidelity Michigan Municipal Money Market Fund
Investments June 30, 2005 (Unaudited)
Showing Percentage of Net Assets
Municipal Securities - 96.1% |
| Principal
Amount | | Value
(Note 1) |
Michigan - 95.3% |
Allen Park Pub. School District Participating VRDN Series ROC II R4007, 2.32% (Liquidity Facility Citigroup Global Markets Hldgs., Inc.) (a)(d) | $ 5,130,000 | | $ 5,130,000 |
Birmingham County School District Participating VRDN
Series MT 81, 2.31% (Liquidity Facility Merrill Lynch & Co., Inc.) (a)(d) | 7,495,000 | | 7,495,000 |
Charlotte Hosp. Fin. Auth. Ltd. Oblig. Rev. (Hayes Green Beach Proj.) 2.36%, LOC Fifth Third Bank, Cincinnati, VRDN (a) | 13,675,000 | | 13,675,000 |
Clinton Econ. Dev. Corp. Rev. (Clinton Area Care Ctr. Proj.) 2.38%, LOC Northern Trust Co., Chicago, VRDN (a) | 4,935,000 | | 4,935,000 |
Comstock Park Pub. Schools Participating VRDN Series ROC II R 2178, 2.32% (Liquidity Facility Citigroup Global Markets Hldgs., Inc.) (a)(d) | 1,335,000 | | 1,335,000 |
Delta County Econ. Dev. Corp. Envir. Impt. Rev. Participating VRDN Series PT 2371, 2.35% (Liquidity Facility Merrill Lynch & Co., Inc.) (a)(d) | 3,100,000 | | 3,100,000 |
Detroit City School District Participating VRDN: | | | |
ROC II R1033, 2.32% (Liquidity Facility Citigroup Global Markets Hldgs., Inc.) (a)(d) | 3,665,000 | | 3,665,000 |
Series AAB 04 39, 2.32% (Liquidity Facility ABN-AMRO Bank NV) (a)(d) | 5,800,000 | | 5,800,000 |
Series PT 2158, 2.31% (Liquidity Facility Merrill Lynch & Co., Inc.) (a)(d) | 1,000,000 | | 1,000,000 |
Series ROC II R4004, 2.32% (Liquidity Facility Citigroup Global Markets Hldgs., Inc.) (a)(d) | 5,760,000 | | 5,760,000 |
Detroit Econ. Dev. Corp. Resource Recovery Rev.: | | | |
Bonds Series A, 4% 5/1/06 (AMBAC Insured) (b) | 2,500,000 | | 2,526,375 |
Participating VRDN Series Merlots 01 A90, 2.37% (Liquidity Facility Wachovia Bank NA) (a)(b)(d) | 2,500,000 | | 2,500,000 |
Detroit Gen. Oblig. RAN 4% 4/3/06 | 5,000,000 | | 5,050,766 |
Detroit Swr. Disp. Rev. Participating VRDN: | | | |
Series AAB 05 3, 2.33% (Liquidity Facility ABN-AMRO Bank NV) (a)(d) | 6,500,000 | | 6,500,000 |
Series MACN 02 G, 2.36% (Liquidity Facility Bank of America NA) (a)(d) | 8,520,000 | | 8,520,000 |
Series Merlots 00 I, 2.32% (Liquidity Facility Wachovia Bank NA) (a)(d) | 9,300,000 | | 9,300,000 |
Series Merlots 01 A103, 2.32% (Liquidity Facility Wachovia Bank NA) (a)(d) | 10,005,000 | | 10,005,000 |
Series Merlots 01 A112, 2.32% (Liquidity Facility Wachovia Bank NA) (a)(d) | 5,075,000 | | 5,075,000 |
Series Merlots 04 B2, 2.32% (Liquidity Facility Wachovia Bank NA) (a)(d) | 5,790,000 | | 5,790,000 |
Municipal Securities - continued |
| Principal
Amount | | Value
(Note 1) |
Michigan - continued |
Detroit Swr. Disp. Rev. Participating VRDN: - continued | | | |
Series Merlots B41, 2.32% (Liquidity Facility Wachovia Bank NA) (a)(d) | $ 2,255,000 | | $ 2,255,000 |
Series PA 1183, 2.31% (Liquidity Facility Merrill Lynch & Co., Inc.) (a)(d) | 6,000,000 | | 6,000,000 |
Series ROC II R4014, 2.32% (Liquidity Facility Citigroup Global Markets Hldgs., Inc.) (a)(d) | 2,075,000 | | 2,075,000 |
Series SGB 47, 2.32% (Liquidity Facility Societe Generale) (a)(d) | 5,800,000 | | 5,800,000 |
Detroit Wtr. Supply Sys. Rev. Participating VRDN: | | | |
Series Merlots 00 D, 2.32% (Liquidity Facility Wachovia Bank NA) (a)(d) | 4,500,000 | | 4,500,000 |
Series PT 2587, 2.31% (Liquidity Facility Dexia Cr. Local de France) (a)(d) | 3,275,000 | | 3,275,000 |
Series Putters 783, 2.32% (Liquidity Facility JPMorgan Chase Bank) (a)(d) | 3,570,000 | | 3,570,000 |
Series SG 64, 2.31% (Liquidity Facility Societe Generale) (a)(d) | 3,855,000 | | 3,855,000 |
Series SGB 6, 2.32% (Liquidity Facility Societe Generale) (a)(d) | 9,570,000 | | 9,570,000 |
Detroit Wtr. Sys. Rev. Participating VRDN Series EGL 99 2202, 2.32% (Liquidity Facility Citibank NA, New York) (a)(d) | 8,200,000 | | 8,200,000 |
East Lansing School District Participating VRDN Series SGA 114, 2.32% (Liquidity Facility Societe Generale) (a)(d) | 6,000,000 | | 6,000,000 |
Ecorse Pub. School District Participating VRDN Series ROC II R7520, 2.32% (Liquidity Facility Citibank NA) (a)(d) | 3,000,000 | | 3,000,000 |
Fitzgerald Pub. School District Participating VRDN Series Putters 561, 2.32% (Liquidity Facility JPMorgan Chase Bank) (a)(d) | 5,010,000 | | 5,010,000 |
Genesee County Econ. Dev. Corp. (Creative Foam Corp. Proj.) Series 1994, 2.47%, LOC JPMorgan Chase Bank, VRDN (a)(b) | 500,000 | | 500,000 |
Grand Rapids Econ. Dev. Corp. (Cornerstone Univ. Proj.) 2.33%, LOC Nat'l. City Bank, VRDN (a) | 1,800,000 | | 1,800,000 |
Grand Rapids San. Swr. Sys. Rev. Impt. Participating VRDN Series EGL 98 2201, 2.32% (Liquidity Facility Citibank NA) (a)(d) | 8,940,000 | | 8,940,000 |
Hartland Consolidated School District Participating VRDN Series MSTC 01 127 Class A, 2.32% (Liquidity Facility Bear Stearns Companies, Inc.) (a)(d) | 6,655,000 | | 6,655,000 |
Holland Charter Township Econ. Dev. Corp. Rev. (Chicago Mission Proj.) 2.39%, LOC Comerica Bank, Detroit, VRDN (a)(b) | 2,435,000 | | 2,435,000 |
Municipal Securities - continued |
| Principal
Amount | | Value
(Note 1) |
Michigan - continued |
Hudsonville Pub. Schools Participating VRDN Series PT 2797, 2.31% (Liquidity Facility Merrill Lynch & Co., Inc.) (a)(d) | $ 6,000,000 | | $ 6,000,000 |
Kent Hosp. Fin. Auth. Health Care Rev. Bonds (Butterworth health Sys. Obligated Group Proj.) Series 1996 A, 6.125% 1/15/21 (Pre-Refunded to 1/15/06 @ 102) (c) | 2,000,000 | | 2,075,168 |
Macomb County Hosp. Fin. Auth. Rev. (Mount Clemens Gen. Hosp. Proj.) Series 2003 A1, 2.4%, LOC Comerica Bank, Detroit, VRDN (a) | 5,900,000 | | 5,900,000 |
Michigan Bldg. Auth. Rev.: | | | |
Participating VRDN: | | | |
Series AAB 03 35, 2.32% (Liquidity Facility ABN-AMRO Bank NV) (a)(d) | 5,000,000 | | 5,000,000 |
Series EGL 01 2202, 2.32% (Liquidity Facility Citibank NA, New York) (a)(d) | 3,000,000 | | 3,000,000 |
Series Merlots 04 B10, 2.32% (Liquidity Facility Wachovia Bank NA) (a)(d) | 5,110,000 | | 5,110,000 |
Series MS 00 481X, 2.31% (Liquidity Facility Morgan Stanley) (a)(d) | 2,670,000 | | 2,670,000 |
Series ROC II R2064, 2.32% (Liquidity Facility Citigroup Global Markets Hldgs., Inc.) (a)(d) | 2,750,000 | | 2,750,000 |
Series ROC II R4057, 2.32% (Liquidity Facility Citigroup Global Markets Hldgs., Inc.) (a)(d) | 2,205,000 | | 2,205,000 |
Series ROC II R4551, 2.32% (Liquidity Facility Citigroup Global Markets Hldgs., Inc.) (a)(d) | 5,190,000 | | 5,190,000 |
Series 4, 2.68% 7/21/05, LOC Bank of New York, New York, LOC State Street Bank & Trust Co., Boston, CP | 6,100,000 | | 6,100,000 |
Michigan Gen. Oblig. Bonds: | | | |
(Multi-Modal Envir. Prog.) Series A, 1.95% tender 10/19/05 (Liquidity Facility DEPFA BANK PLC), CP mode | 10,000,000 | | 10,000,000 |
(Multi-Modal School Ln. Prog.): | | | |
Series 2005 A, 2.67% tender 10/4/05 (Liquidity Facility DEPFA BANK PLC), CP mode | 6,000,000 | | 6,000,000 |
Series B, 2.2% tender 10/5/05, CP mode | 3,250,000 | | 3,250,000 |
Michigan Higher Ed. Student Ln. Auth. Rev.: | | | |
Participating VRDN Series PA 1064, 2.36% (Liquidity Facility Merrill Lynch & Co., Inc.) (a)(b)(d) | 7,420,000 | | 7,420,000 |
2.34% (AMBAC Insured), VRDN (a)(b) | 4,000,000 | | 4,000,000 |
Michigan Hosp. Fin. Auth. Hosp. Rev.: | | | |
Bonds (Ascension Health Cr. Group Proj.) Series B, 5.2%, tender 11/15/05 (a) | 3,000,000 | | 3,024,968 |
(Health Care Equip. Ln. Prog.): | | | |
Series B, 2.33%, LOC Standard Fed. Bank, VRDN (a) | 2,600,000 | | 2,600,000 |
Series C, 2.33%, LOC Fifth Third Bank, Cincinnati, VRDN (a) | 7,500,000 | | 7,500,000 |
Municipal Securities - continued |
| Principal
Amount | | Value
(Note 1) |
Michigan - continued |
Michigan Hosp. Fin. Auth. Rev. Series B, 2.33%, LOC Standard Fed. Bank, VRDN (a) | $ 3,600,000 | | $ 3,600,000 |
Michigan Hsg. Dev. Auth. Multi-family Hsg. Rev. (Hunt Club Apts. Proj.) 2.32%, LOC Fannie Mae, VRDN (a)(b) | 5,600,000 | | 5,600,000 |
Michigan Hsg. Dev. Auth. Single Family Mtg. Rev.: | | | |
Participating VRDN Series PT 01 556, 2.36% (Liquidity Facility Landesbank Hessen-Thuringen) (a)(b)(d) | 3,410,000 | | 3,410,000 |
Series 1999 B2, 2.45% (MBIA Insured), VRDN (a)(b) | 5,225,000 | | 5,225,000 |
Series 2002 A, 2.45% (MBIA Insured), VRDN (a)(b) | 5,000,000 | | 5,000,000 |
Michigan Muni. Bond Auth. Rev.: | | | |
Participating VRDN: | | | |
Series EGL 00 2201, 2.32% (Liquidity Facility Citibank NA, New York) (a)(d) | 9,500,000 | | 9,500,000 |
Series MS 718, 2.31% (Liquidity Facility Morgan Stanley) (a)(d) | 19,221,500 | | 19,221,500 |
Series MSTC 02 204, 2.32% (Liquidity Facility Bear Stearns Companies, Inc.) (a)(d) | 10,395,000 | | 10,395,000 |
Series ROC II R 339, 2.32% (Liquidity Facility Citibank NA) (a)(d) | 8,135,000 | | 8,135,000 |
RAN: | | | |
(Detroit School District Proj.) 3.75% 3/21/06, LOC JPMorgan Chase Bank | 12,000,000 | | 12,101,096 |
Series B1, 3% 8/19/05 | 5,000,000 | | 5,009,243 |
Michigan Strategic Fund Indl. Dev. Rev. (Althaus Family Investors II Proj.) Series 1997, 2.58%, LOC Huntington Nat'l. Bank, Columbus, VRDN (a) | 1,895,000 | | 1,895,000 |
Michigan Strategic Fund Ltd. Oblig. Rev.: | | | |
Bonds (Dow Chemical Co. Proj.) Series 2003 A1, 2.97% tender 7/1/05, CP mode (b) | 5,900,000 | | 5,900,000 |
Participating VRDN: | | | |
Series MS 00 382, 2.31% (Liquidity Facility Morgan Stanley) (a)(d) | 2,000,000 | | 2,000,000 |
Series Putters 858Z, 2.32% (Liquidity Facility JPMorgan Chase Bank) (a)(b)(d) | 9,100,000 | | 9,100,000 |
(BC&C Proj.) 2.45%, LOC Comerica Bank, Detroit, VRDN (a)(b) | 1,560,000 | | 1,560,000 |
(Biewer of Lansing LLC Proj.) Series 1999, 2.44%, LOC Standard Fed. Bank, VRDN (a)(b) | 1,150,000 | | 1,150,000 |
(Bosal Ind. Proj.) Series 1998, 2.45%, LOC Bank of New York, New York, VRDN (a)(b) | 7,500,000 | | 7,500,000 |
Municipal Securities - continued |
| Principal
Amount | | Value
(Note 1) |
Michigan - continued |
Michigan Strategic Fund Ltd. Oblig. Rev.: - continued | | | |
(CJS Properties LLC Proj.) 2.47%, LOC JPMorgan Chase Bank, VRDN (a)(b) | $ 1,800,000 | | $ 1,800,000 |
(Conti Properties LLC Proj.) Series 1997, 2.45%, LOC Comerica Bank, Detroit, VRDN (a)(b) | 2,560,000 | | 2,560,000 |
(Creative Foam Corp. Proj.) 2.5%, LOC JPMorgan Chase Bank, VRDN (a)(b) | 800,000 | | 800,000 |
(Doss Ind. Dev. Co. Proj.) 2.47%, LOC JPMorgan Chase Bank, VRDN (a)(b) | 1,800,000 | | 1,800,000 |
(Fintex LLC Proj.) Series 2000, 2.45%, LOC Comerica Bank, Detroit, VRDN (a)(b) | 2,020,000 | | 2,020,000 |
(Future Fence Co. Proj.) 2.45%, LOC Comerica Bank, Detroit, VRDN (a)(b) | 2,450,000 | | 2,450,000 |
(Grandview Plaza Riverview Assoc. One LP Proj.) 2.42%, LOC Nat'l. City Bank, VRDN (a)(b) | 1,675,000 | | 1,675,000 |
(Holland Home Oblig. Group Proj.) 2.39%, LOC Huntington Nat'l. Bank, Columbus, VRDN (a) | 1,000,000 | | 1,000,000 |
(HP Pelzer Automotive Sys. Sterling Heights Proj.) 2.4%, LOC JPMorgan Chase Bank, VRDN (a)(b) | 3,150,000 | | 3,150,000 |
(John H. Dekker & Sons Proj.) Series 1998, 2.45%, LOC Standard Fed. Bank, VRDN (a)(b) | 1,015,000 | | 1,015,000 |
(K&M Engineering, Inc. Proj.) 2.45%, LOC Comerica Bank, Detroit, VRDN (a)(b) | 1,580,000 | | 1,580,000 |
(LPB LLC Proj.) 2.5%, LOC Comerica Bank, Detroit, VRDN (a)(b) | 2,600,000 | | 2,600,000 |
(Majestic Ind., Inc. Proj.) 2.45%, LOC Comerica Bank, Detroit, VRDN (a)(b) | 2,275,000 | | 2,275,000 |
(Mans Proj.) Series 1998, 2.45%, LOC Comerica Bank, Detroit, VRDN (a)(b) | 1,820,000 | | 1,820,000 |
(Mid-American Products, Inc. Proj.) Series 1998 2.41%, LOC Standard Fed. Bank, VRDN (a)(b) | 1,345,000 | | 1,345,000 |
(Orchestra Place Renewal Proj.) Series 2000, 2.64%, LOC ABN-AMRO Bank NV, VRDN (a) | 5,800,000 | | 5,800,000 |
(PBL Enterprises, Inc. Proj.) Series 1997, 2.45%, LOC Comerica Bank, Detroit, VRDN (a)(b) | 1,960,000 | | 1,960,000 |
(Pioneer Laboratories, Inc. Proj.) 2.37%, LOC JPMorgan Chase Bank, VRDN (a)(b) | 2,600,000 | | 2,600,000 |
(S&S LLC Proj.) Series 2000, 2.79%, LOC Standard Fed. Bank, VRDN (a)(b) | 2,700,000 | | 2,700,000 |
(SBC Ventures LLC Proj.) 2.45%, LOC Comerica Bank, Detroit, VRDN (a)(b) | 4,000,000 | | 4,000,000 |
(TEI Invts. LLC Proj.) Series 1997, 2.45%, LOC Comerica Bank, Detroit, VRDN (a)(b) | 600,000 | | 600,000 |
Municipal Securities - continued |
| Principal
Amount | | Value
(Note 1) |
Michigan - continued |
Michigan Strategic Fund Ltd. Oblig. Rev.: - continued | | | |
(Temperance Enterprise Proj.) Series 1996, 2.42%, LOC Nat'l. City Bank, VRDN (a)(b) | $ 2,000,000 | | $ 2,000,000 |
(The Monarch Press, Inc. Proj.) Series 2000, 2.45%, LOC Comerica Bank, Detroit, VRDN (a)(b) | 1,625,000 | | 1,625,000 |
(The Spiratex Co. Proj.) Series 1994, 2.47%, LOC JPMorgan Chase Bank, VRDN (a)(b) | 1,000,000 | | 1,000,000 |
(Trilan LLC Proj.) 2.5%, LOC JPMorgan Chase Bank, VRDN (a)(b) | 4,000,000 | | 4,000,000 |
(Unified-Boring Co., Inc. Proj.) Series 1992, 2.57%, LOC Comerica Bank, Detroit, VRDN (a)(b) | 400,000 | | 400,000 |
(Vent-Rite Valve Corp. Proj.) 2.39%, LOC Fleet Nat'l. Bank, VRDN (a)(b) | 705,000 | | 705,000 |
(W.H. Porter, Inc. Proj.) Series 2001, 2.45%, LOC Comerica Bank, Detroit, VRDN (a)(b) | 3,330,000 | | 3,330,000 |
(Windcrest Properties LLC Proj.) 2.71%, LOC Comerica Bank, Detroit, VRDN (a)(b) | 4,300,000 | | 4,300,000 |
(YMCA Metropolitan Detroit Proj.) Series 2001, 2.38%, LOC JPMorgan Chase Bank, VRDN (a) | 12,465,000 | | 12,465,000 |
Michigan Strategic Fund Rev. (Rest Haven Christian Services Proj.) Series A, 2.32%, LOC KBC Bank NV, VRDN (a) | 3,195,000 | | 3,195,000 |
Michigan Trunk Line Fund Participating VRDN: | | | |
Series Clipper 05 27, 2.4% (Liquidity Facility State Street Bank & Trust Co., Boston) (a)(d) | 6,500,000 | | 6,500,000 |
Series EGL 7050042 Class A, 2.32% (Liquidity Facility Citibank NA) (a)(d) | 3,000,000 | | 3,000,000 |
Series IXIS 05 13, 2.32% (Liquidity Facility CDC Fin.-CDC IXIS) (a)(d) | 6,025,000 | | 6,025,000 |
Oakland County Econ. Dev. Corp. Ltd. Oblig. Rev. (Osmic, Inc. Proj.) Series 2001 A, 2.45%, LOC JPMorgan Chase Bank, VRDN (a)(b) | 6,300,000 | | 6,300,000 |
Rockford Pub. Schools Participating VRDN Series MS 01 589, 2.31% (Liquidity Facility Morgan Stanley) (a)(d) | 2,135,000 | | 2,135,000 |
Saint Clair County Econ. Dev. Corp. Poll. Cont. Rev. Participating VRDN Series MS 00 282, 2.31% (Liquidity Facility Morgan Stanley) (a)(d) | 11,895,000 | | 11,895,000 |
Sanilac County Econ. Dev. Corp. (Marlette Cmnty. Hosp. Proj.) Series 2001, 2.38%, LOC JPMorgan Chase Bank, VRDN (a) | 12,245,000 | | 12,245,000 |
Sturgis Pub. School District Participating VRDN Series Putters 728, 2.32% (Liquidity Facility JPMorgan Chase & Co.) (a)(d) | 875,000 | | 875,000 |
Univ. of Michigan Univ. Revs. Series 2004 F: | | | |
2.45% 7/6/05, CP | 7,925,000 | | 7,925,000 |
2.5% 8/8/05, CP | 1,740,000 | | 1,740,000 |
2.75% 8/8/05, CP | 6,860,000 | | 6,860,000 |
Municipal Securities - continued |
| Principal
Amount | | Value
(Note 1) |
Michigan - continued |
Van Buren Township Local Dev. Fin. Auth. Participating VRDN Series ROC 4518, 2.32% (Liquidity Facility Citigroup Global Markets Hldgs., Inc.) (a)(d) | $ 7,685,000 | | $ 7,685,000 |
Wayne Charter County Arpt. Rev. Participating VRDN Series MT 123, 2.36% (Liquidity Facility Svenska Handelsbanken AB) (a)(b)(d) | 7,870,000 | | 7,870,000 |
Wayne County Arpt. Auth. Rev. Participating VRDN: | | | |
Series EGL 720050029, 2.36% (Liquidity Facility Citibank NA) (a)(b)(d) | 12,400,000 | | 12,400,000 |
Series MT 115, 2.36% (Liquidity Facility Svenska Handelsbanken AB) (a)(b)(d) | 6,100,000 | | 6,100,000 |
Series Putters 836, 2.35% (Liquidity Facility JPMorgan Chase & Co.) (a)(b)(d) | 6,100,000 | | 6,100,000 |
Wayne-Westland Cmnty. Schools Participating VRDN Series MS 98 56, 2.31% (Liquidity Facility Morgan Stanley) (a)(d) | 7,465,000 | | 7,465,000 |
West Branch Rose City Area School District Participating VRDN Series ROC II R7511, 2.32% (Liquidity Facility Citibank NA) (a)(d) | 6,120,000 | | 6,120,000 |
Western Townships Utils. Auth. County of Wayne Swr. Disp. Sys. Participating VRDN Series Merlots A96, 2.32% (Liquidity Facility Wachovia Bank NA) (a)(d) | 5,700,000 | | 5,700,000 |
Whitmore Lake Pub. School District Participating VRDN
Series ROC II R4515, 2.32% (Liquidity Facility Citigroup Global Markets Hldgs., Inc.) (a)(d) | 3,885,000 | | 3,885,000 |
Zeeland Hosp. Fin. Auth. Rev. (Zeeland Cmnty. Hosp. Proj.) 2.45%, LOC Huntington Nat'l. Bank, Columbus, VRDN (a) | 10,600,000 | | 10,600,000 |
| | 614,694,116 |
New York - 0.8% |
Bank of New York Muni. Ctfs. trust various states Participating VRDN Series BNY 02 3, 2.35% (Liquidity Facility Bank of New York, New York) (a)(b)(d) | 5,500,000 | | 5,500,000 |
TOTAL INVESTMENT PORTFOLIO - 96.1% (Cost $620,194,116) | | 620,194,116 |
NET OTHER ASSETS - 3.9% | | 24,845,016 |
NET ASSETS - 100% | $ 645,039,132 |
Security Type Abbreviations |
CP - COMMERCIAL PAPER |
RAN - REVENUE ANTICIPATION NOTE |
VRDN - VARIABLE RATE DEMAND NOTE |
Legend |
(a) The coupon rate shown on floating or adjustable rate securities represents the rate at period end. |
(b) Private activity obligations whose interest is subject to the federal alternative minimum tax for individuals. |
(c) Security collateralized by an amount sufficient to pay interest and principal. |
(d) Provides evidence of ownership in one or more underlying municipal bonds. |
See accompanying notes which are an integral part of the financial statements.
Semiannual Report
Fidelity Michigan Municipal Money Market Fund
Financial Statements
Statement of Assets and Liabilities
| June 30, 2005 (Unaudited) |
| | |
Assets | | |
Investment in securities, at value (cost $620,194,116) - See accompanying schedule | | $ 620,194,116 |
Cash | | 17,047,538 |
Receivable for investments sold | | 3,300,995 |
Receivable for fund shares sold | | 7,825,093 |
Interest receivable | | 3,634,745 |
Prepaid expenses | | 1,259 |
Receivable from investment adviser for expense reductions | | 12,022 |
Other receivables | | 41,872 |
Total assets | | 652,057,640 |
| | |
Liabilities | | |
Payable for investments purchased | $ 2,544,153 | |
Payable for fund shares redeemed | 4,144,217 | |
Distributions payable | 18,135 | |
Accrued management fee | 201,199 | |
Other affiliated payables | 90,858 | |
Other payables and accrued expenses | 19,946 | |
Total liabilities | | 7,018,508 |
| | |
Net Assets | | $ 645,039,132 |
Net Assets consist of: | | |
Paid in capital | | $ 644,736,678 |
Undistributed net investment income | | 28,052 |
Accumulated undistributed net realized gain (loss) on investments | | 274,402 |
Net Assets, for 644,449,287 shares outstanding | | $ 645,039,132 |
Net Asset Value, offering price and redemption price per share ($645,039,132 ÷ 644,449,287 shares) | | $ 1.00 |
See accompanying notes which are an integral part of the financial statements.
Semiannual Report
Fidelity Michigan Municipal Money Market Fund
Financial Statements - continued
Statement of Operations
| Six months ended June 30, 2005 (Unaudited) |
| | |
Investment Income | | |
Interest | | $ 6,835,138 |
| | |
Expenses | | |
Management fee | $ 1,156,198 | |
Transfer agent fees | 484,879 | |
Accounting fees and expenses | 41,930 | |
Independent trustees' compensation | 1,391 | |
Custodian fees and expenses | 5,493 | |
Registration fees | 28,771 | |
Audit | 21,812 | |
Legal | 6,066 | |
Miscellaneous | 2,549 | |
Total expenses before reductions | 1,749,089 | |
Expense reductions | (268,268) | 1,480,821 |
Net investment income | | 5,354,317 |
Net realized gain (loss) on investment securities | | 65,562 |
Net increase in net assets resulting from operations | | $ 5,419,879 |
See accompanying notes which are an integral part of the financial statements.
Semiannual Report
Statement of Changes in Net Assets
| Six months ended
June 30, 2005
(Unaudited) | Year ended
December 31,
2004 |
Increase (Decrease) in Net Assets | | |
Operations | | |
Net investment income | $ 5,354,317 | $ 4,246,350 |
Net realized gain (loss) | 65,562 | 149,538 |
Net increase in net assets resulting
from operations | 5,419,879 | 4,395,888 |
Distributions to shareholders from net investment income | (5,332,150) | (4,272,226) |
Share transactions at net asset value of $1.00 per share
Proceeds from sales of shares | 855,719,073 | 1,467,990,554 |
Reinvestment of distributions | 5,271,146 | 4,200,190 |
Cost of shares redeemed | (824,160,017) | (1,452,485,643) |
Net increase (decrease) in net assets and shares resulting from share transactions | 36,830,202 | 19,705,101 |
Total increase (decrease) in net assets | 36,917,931 | 19,828,763 |
| | |
Net Assets | | |
Beginning of period | 608,121,201 | 588,292,438 |
End of period (including undistributed net investment income of $28,052 and undistributed net investment income of $5,885, respectively) | $ 645,039,132 | $ 608,121,201 |
See accompanying notes which are an integral part of the financial statements.
Semiannual Report
Financial Highlights
| Six months ended
June 30, 2005 | Years ended December 31, |
| (Unaudited) | 2004 | 2003 | 2002 | 2001 | 2000 |
Selected Per-Share Data | | | | | |
Net asset value, beginning of period | $ 1.00 | $ 1.00 | $ 1.00 | $ 1.00 | $ 1.00 | $ 1.00 |
Income from Investment Operations | | | | | | |
Net investment income | .009 | .007 | .006 | .010 | .023 | .036 |
Net realized and unrealized gain (loss) E | - | - | - | - | - | - |
Total from investment operations | .009 | .007 | .006 | .010 | .023 | .036 |
Distributions from net investment income | (.009) | (.007) | (.006) | (.010) | (.023) | (.036) |
Distributions from net realized gain | - | - | - E | - | - | - |
Total distributions | (.009) | (.007) | (.006) | (.010) | (.023) | (.036) |
Net asset value,
end of period | $ 1.00 | $ 1.00 | $ 1.00 | $ 1.00 | $ 1.00 | $ 1.00 |
Total Return B, C | .87% | .73% | .63% | 1.03% | 2.35% | 3.69% |
Ratios to Average Net Assets D | | | | | |
Expenses before expense reductions | .57% A | .57% | .56% | .56% | .56% | .57% |
Expenses net of voluntary waivers, if any | .55% A | .57% | .56% | .56% | .56% | .57% |
Expenses net of all reductions | .48% A | .55% | .55% | .52% | .52% | .57% |
Net investment income | 1.75% A | .72% | .61% | 1.02% | 2.32% | 3.63% |
Supplemental Data | | | | | | |
Net assets,
end of period (000 omitted) | $ 645,039 | $ 608,121 | $ 588,292 | $ 568,762 | $ 542,017 | $ 507,223 |
A Annualized
B Total returns for periods of less than one year are not annualized.
C Total returns would have been lower had certain expenses not been reduced during the periods shown.
D Expense ratios reflect operating expenses of the fund. Expenses before reductions do not reflect amounts reimbursed by the investment adviser or reductions from brokerage service arrangements or other expense offset arrangements and do not represent the amount paid by the fund during periods when reimbursements or reductions occur. Expenses net of any voluntary waivers reflect expenses after reimbursement by the investment adviser but prior to reductions from brokerage service arrangements or other expense offset arrangements. Expenses net of all reductions represent the net expenses paid by the fund.
E Amount represents less than $.001 per share.
See accompanying notes which are an integral part of the financial statements.
Semiannual Report
Notes to Financial Statements
For the period ended June 30, 2005 (Unaudited)
1. Significant Accounting Policies.
Spartan Michigan Municipal Income Fund (the income fund) is a fund of Fidelity Municipal Trust. Fidelity Michigan Municipal Money Market Fund (the money market fund) is a fund of Fidelity Municipal Trust II. On July 21, 2005 the Board of Trustees approved a change in the name of Spartan Michigan Municipal Income Fund to Fidelity Michigan Municipal Income Fund effective August 15, 2005. Each trust is registered under the Investment Company Act of 1940, as amended (the 1940 Act), as an open-end management investment company. Fidelity Municipal Trust and Fidelity Municipal Trust II (the trusts) are organized as a Massachusetts business trust and a Delaware statutory trust, respectively. The income fund is a non-diversified fund. Each fund is authorized to issue an unlimited number of shares. Each fund may be affected by economic and political developments in the state of Michigan. The financial statements have been prepared in conformity with accounting principles generally accepted in the United States of America, which require management to make certain estimates and assumptions at the date of the financial statements. The following summarizes the significant accounting policies of the income fund and the money market fund:
Security Valuation. Net asset value per share (NAV calculation) is calculated as of the close of business of the New York Stock Exchange, normally 4:00 p.m. Eastern time. For the income fund, debt securities, including restricted securities, are valued on the basis of information provided by a pricing service. Pricing services use valuation matrices that incorporate both dealer-supplied valuations and valuation models. If prices are not readily available or do not accurately reflect fair value for a security, or if a security's value has been materially affected by events occurring after the close of the exchange or market on which the security is principally traded, that security may be valued by another method that the Board of Trustees believes accurately reflects fair value. A security's valuation may differ depending on the method used for determining value. Price movements in futures contracts and ADRs, market and trading trends, the bid/ask quotes of brokers and off-exchange institutional trading may be reviewed in the course of making a good faith determination of a security's fair value. Short-term securities with remaining maturities of sixty days or less for which quotations are not readily available are valued on the basis of amortized cost. Investments in open-end investment companies are valued at their net asset value each business day.
As permitted under Rule 2a-7 of the 1940 Act, and certain conditions therein, securities owned by the money market fund are valued initially at cost and thereafter assume a constant amortization to maturity of any discount or premium.
Investment Transactions and Income. Security transactions are accounted for as of trade date. Gains and losses on securities sold are determined on the basis of identified cost. Interest income is accrued as earned. Interest income includes coupon interest and amortization of premium and accretion of discount on debt securities.
Semiannual Report
Notes to Financial Statements (Unaudited) - continued
1. Significant Accounting Policies - continued
Expenses. Most expenses of each trust can be directly attributed to a fund. Expenses which cannot be directly attributed are apportioned among each fund in the trust.
Income Tax Information and Distributions to Shareholders. Each year, each fund intends to qualify as a regulated investment company by distributing all of its taxable income and realized gains under Subchapter M of the Internal Revenue Code. As a result, no provision for income taxes is required in the accompanying financial statements.
Dividends are declared daily and paid monthly from net investment income. Distributions from realized gains, if any, are recorded on the ex-dividend date. Income and capital gain distributions are determined in accordance with income tax regulations, which may differ from generally accepted accounting principles. In addition, certain funds claimed a portion of the payment made to redeeming shareholders as a distribution for income tax purposes.
Capital accounts within the financial statements are adjusted for permanent book-tax differences. These adjustments have no impact on net assets or the results of operations. Temporary book-tax differences will reverse in a subsequent period.
Book-tax differences are primarily due to market discount, deferred trustees compensation and losses deferred due to futures transactions.
The funds purchase municipal securities whose interest, in the opinion of the issuer, is free from federal income tax. There is no assurance that the Internal Revenue Service (IRS) will agree with this opinion. In the event the IRS determines that the issuer does not comply with relevant tax requirements, interest payments from a security could become federally taxable, possibly retroactively to the date the security was issued.
The federal tax cost of investments and unrealized appreciation (depreciation) as of period end were as follows for each fund:
| Cost for Federal
Income Tax
Purposes | Unrealized
Appreciation | Unrealized
Depreciation | Net Unrealized
Appreciation/
(Depreciation) |
Spartan Michigan Municipal Income Fund | $ 544,748,983 | $ 29,763,106 | $ (394,488) | $ 29,368,618 |
Fidelity Michigan Municipal Money Market Fund | 620,194,116 | - | - | - |
Short-Term Trading (Redemption) Fees. Shares held in the income fund less than 30 days are subject to a redemption fee equal to .50% of the proceeds of the redeemed shares. All redemption fees, including any estimated redemption fees paid by Fidelity Management & Research Company (FMR), are retained by the fund and accounted for as an addition to paid in capital.
Semiannual Report
2. Operating Policies.
Delayed Delivery Transactions and When-Issued Securities. Certain funds may purchase or sell securities on a delayed delivery or when-issued basis. Payment and delivery may take place after the customary settlement period for that security. The price of the underlying securities and the date when the securities will be delivered and paid for are fixed at the time the transaction is negotiated. During the time a delayed delivery sell is outstanding, the contract is marked-to-market daily and equivalent deliverable securities are held for the transaction. The value of the securities purchased on a delayed delivery or when-issued basis are identified as such in each applicable fund's Schedule of Investments. Certain funds may receive compensation for interest forgone in the purchase of a delayed delivery or when-issued security. With respect to purchase commitments, each applicable fund identifies securities as segregated in its records with a value at least equal to the amount of the commitment. Losses may arise due to changes in the value of the underlying securities or if the counterparty does not perform under the contract's terms, or if the issuer does not issue the securities due to political, economic, or other factors.
Futures Contracts. The income fund may use futures contracts to manage its exposure to the bond market and to fluctuations in interest rates. Buying futures tends to increase a fund's exposure to the underlying instrument, while selling futures tends to decrease a fund's exposure to the underlying instrument or hedge other fund investments. Losses may arise from changes in the value of the underlying instruments or if the counterparties do not perform under the contracts' terms. Gains (losses) are realized upon the expiration or closing of the futures contracts. Futures contracts are valued at the settlement price established each day by the board of trade or exchange on which they are traded.
3. Purchases and Sales of Investments.
Purchases and sales of securities, other than short-term securities and U.S. government securities, for the income fund aggregated $83,486,132 and $65,036,333, respectively.
4. Fees and Other Transactions with Affiliates.
Management Fee. FMR and its affiliates provide Spartan Michigan Municipal Income Fund and Fidelity Michigan Municipal Money Market Fund with investment management related services for which the funds pay a monthly management fee. The management fee is the sum of an individual fund fee rate and a group fee rate. The individual fund fee rate is applied to each fund's average net assets. The group fee rate is based upon the average net assets of all the mutual funds advised by FMR. The group fee rate
Semiannual Report
Notes to Financial Statements (Unaudited) - continued
4. Fees and Other Transactions with Affiliates - continued
Management Fee - continued
decreases as assets under management increase and increases as assets under management decrease. For the period, each fund's annualized management fee rate expressed as a percentage of each fund's average net assets was as follows:
| Individual
Rate | Group
Rate | Total |
Spartan Michigan Municipal Income Fund | .25% | .12% | .38% |
Fidelity Michigan Municipal Money Market Fund | .25% | .12% | .38% |
Transfer Agent and Accounting Fees. Citibank, N.A. (Citibank) is the custodian, transfer agent and shareholder servicing agent for the funds. Citibank has entered into a sub-arrangement with Fidelity Service Company, Inc. (FSC), an affiliate of FMR, under which FSC performs the activities associated with the funds' transfer and shareholder servicing agent and accounting functions. The funds pay account fees and asset-based fees that vary according to account size and type of account. FSC pays for typesetting, printing and mailing of shareholder reports, except proxy statements. The accounting fee is based on the level of average net assets for the month. For the period, the transfer agent fees were equivalent to the following annualized rates expressed as a percentage of average net assets:
Spartan Michigan Municipal Income Fund | .08% | | |
Fidelity Michigan Municipal Money Market Fund | .16% | |
Central Funds. Certain funds may invest in affiliated Central Funds managed by Fidelity Investments Money Management, Inc. (FIMM), an affiliate of FMR. The Central Funds are open-end investment companies available only to investment companies and other accounts managed by FMR and its affiliates. The Central Funds seek preservation of capital and current income and do not pay a management fee. Income distributions earned by the funds are recorded as income in the accompanying financial statements. Distributions from the Central Funds are noted in the table below:
| Income
Distributions |
Fidelity Michigan Municipal Money Market Fund | $ 81,135 |
5. Committed Line of Credit.
The income fund participates with other funds managed by FMR in a $4.2 billion credit facility (the "line of credit") to be utilized for temporary or emergency purposes to fund shareholder redemptions or for other short-term liquidity purposes. The participating funds have agreed to pay commitment fees on their pro rata portion of the line of credit. During the period, there were no borrowings on this line of credit.
Semiannual Report
6. Expense Reductions.
Effective February 1, 2005, FMR voluntarily agreed to reimburse funds to the extent annual operating expenses exceeded certain levels of average net assets as noted in the table below. Some expenses, for example interest expense, are excluded from this reimbursement.
| Expense
Limitations | Reimbursement
from adviser |
Fidelity Michigan Municipal Money Market Fund | .55% | $ 61,546 |
In addition, through arrangements with each applicable fund's custodian and transfer agent, credits realized as a result of uninvested cash balances were used to reduce each applicable fund's expenses. All of the applicable expense reductions are noted in the table below.
| Custody
expense
reduction | Transfer
Agent
expense
reduction |
Spartan Michigan Municipal Income Fund | $ 4,537 | $ 122,342 |
Fidelity Michigan Municipal Money Market Fund | 5,493 | 201,229 |
7. Other.
The funds' organizational documents provide former and current trustees and officers with a limited indemnification against liabilities arising in connection with the performance of their duties to the funds. In the normal course of business, the funds may also enter into contracts that provide general indemnifications. The funds' maximum exposure under these arrangements is unknown as this would be dependent on future claims that may be made against the funds. The risk of material loss from such claims is considered remote.
Semiannual Report
Board Approval of Investment Advisory Contracts and Management Fees
Spartan Michigan Municipal Income Fund / Fidelity Michigan Municipal Money Market Fund
Each year, typically in June, the Board of Trustees, including the independent Trustees (together, the Board), votes on the renewal of the management contract and sub-advisory agreements (together, the Advisory Contracts) for each fund. The Board, assisted by the advice of fund counsel and independent Trustees' counsel, requests and considers a broad range of information throughout the year.
The Board meets regularly each month except August and takes into account throughout the year matters bearing on Advisory Contracts. The Board, acting directly and through its separate committees, considers at each of its meetings factors that are relevant to the annual renewal of each fund's Advisory Contracts, including the services and support provided to each fund and its shareholders by Fidelity. At the time of the renewal, the Board had 11 standing committees, each composed of independent Trustees with varying backgrounds, to which the Board has assigned specific subject matter responsibilities in order to enhance effective decision-making by the Board. Each committee has adopted a written charter outlining the structure and purposes of the committee. One such committee, the Fixed-Income Contract Committee, meets periodically during the first six months of each year and as necessary to consider matters specifically related to the annual renewal of Advisory Contracts. The committee requests and receives information on, and makes recommendations to the independent Trustees concerning, the approval and annual review of the Advisory Contracts.
At its June 2005 meeting, the Board of Trustees, including the independent Trustees, unanimously determined to renew the Advisory Contracts for each fund. In reaching its determination, the Board considered all factors it believed relevant, including (1) the nature, extent, and quality of the services to be provided to each fund and its shareholders by Fidelity (including the investment performance of each fund); (2) the competitiveness of the management fee and total expenses of each fund; (3) the total costs of the services to be provided by and the profits to be realized by the investment adviser and its affiliates from the relationship with each fund; (4) the extent to which economies of scale would be realized as each fund grows; and (5) whether fee levels reflect these economies of scale, if any, for the benefit of fund shareholders.
In determining whether to renew the Advisory Contracts for each fund, the Board ultimately reached a determination, with the assistance of fund counsel and independent Trustees' counsel, that the renewal of the Advisory Contracts and the compensation to be received by Fidelity under the management contracts is consistent with Fidelity's fiduciary duty under applicable law. In addition to evaluating the specific factors noted above, the Board, in reaching its determination, is aware that shareholders in each fund have a broad range of investment choices available to them, including a wide choice among mutual funds offered by competitors to Fidelity, and that each fund's shareholders, with the opportunity to review and weigh the disclosure provided by the fund in its prospectus and other public disclosures, have chosen to invest in that fund, managed by Fidelity.
Semiannual Report
Nature, Extent, and Quality of Services Provided by Fidelity. The Board considered staffing within the investment adviser, FMR, and the sub-advisers (together, the Investment Advisers), including the backgrounds of the funds' portfolio managers and the funds' investment objectives and disciplines. The independent Trustees also had discussions with senior management of Fidelity's investment operations and investment groups. The Board considered the structure of the portfolio manager compensation program and whether this structure provides appropriate incentives.
Fidelity Resources Dedicated to Investment Management and Support Services. The Board reviewed the size, education, and experience of the Investment Advisers' investment staff, their use of technology, and the Investment Advisers' approach to recruiting, training, and retaining portfolio managers and other research, advisory, and management personnel. The Board considered Fidelity's extensive global research capabilities that enable the Investment Advisers to aggregate data from various sources in an effort to produce positive investment results. The Board noted that Fidelity's analysts have access to a variety of technological tools that enable them to perform both fundamental and quantitative analysis and to specialize in various disciplines. The Board also considered that Fidelity's portfolio managers and analysts have access to daily portfolio attribution that allows for monitoring of a fund's portfolio, as well as an electronic communication system that provides immediate real-time access to research concerning issuers and credit enhancers.
Shareholder and Administrative Services. The Board considered the nature, extent, quality, and cost of administrative, distribution, and shareholder services performed by the Investment Advisers and their affiliates under the Advisory Contracts and under separate agreements covering transfer agency and pricing and bookkeeping services for each fund. The Board also considered the nature and extent of the Investment Advisers' supervision of third party service providers, principally custodians and subcustodians. The Board reviewed the allocation of fund brokerage, including allocations to brokers affiliated with the Investment Advisers. The Board also considered the resources devoted to, and the record of compliance with, each fund's compliance policies and procedures.
The Board noted that the growth of fund assets across the complex allows Fidelity to reinvest in the development of services designed to enhance the value or convenience of the Fidelity funds as investment vehicles. These services include 24-hour access to account information and market information through phone representatives and over the Internet, and investor education materials and asset allocation tools.
Investment in a Large Fund Family. The Board considered the benefits to shareholders of investing in a Fidelity fund, including the benefits of investing in a fund that is part of a large family of funds offering a variety of investment disciplines and providing for a large variety of mutual fund investor services. For example, fund shareholders are offered the privilege of exchanging shares of a fund for shares of other Fidelity funds, as set forth in the fund's prospectus, without paying a sales charge. The Board noted that, since the last Advisory Contract renewals in June 2004, Fidelity has taken a number of actions that benefited particular funds, including (i) voluntarily deciding in 2004 to stop using "soft" commission dollars to pay for market data and, instead, to pay for that data out of its own resources, (ii) contractually agreeing to impose management fee reductions and expense limitations on its five Spartan stock index funds and its stock index fund available through variable insurance products, (iii) contractually agreeing to eliminate the management fees on the Fidelity Freedom Funds and the Fidelity Advisor Freedom Funds, (iv) contractually agreeing to reduce the management fees on most of its investment-grade taxable bond funds, and (v) contractually agreeing to impose expense limitations on its retail and Spartan investment-grade taxable bond funds.
Semiannual Report
Board Approval of Investment Advisory Contracts and
Management Fees - continued
Investment Performance. The Board considered whether each fund has operated within its investment objective, as well as its record of compliance with its investment restrictions. It also reviewed each fund's absolute investment performance, as well as each fund's relative investment performance measured against (i) a broad-based securities market index (bond fund only, as money market funds are typically not compared against a market index), and (ii) a peer group of mutual funds deemed appropriate by the Board over multiple periods. For each fund, the following charts considered by the Board show, over the one-, three-, and five-year periods ended December 31, 2004, the fund's returns, the returns of a broad-based securities market index ("benchmark") (bond fund only), and a range of returns of a peer group of mutual funds identified by Lipper Inc. as having an investment objective similar to that of the fund. The box within each chart shows the 25th percentile return (bottom of box) and the 75th percentile return (top of box) of the Lipper peer group. The percentage beaten number noted below each chart corresponds to the percentile box and represents the percentage of funds in the Lipper peer group whose performance was equal to or lower than that of the fund.
Semiannual Report
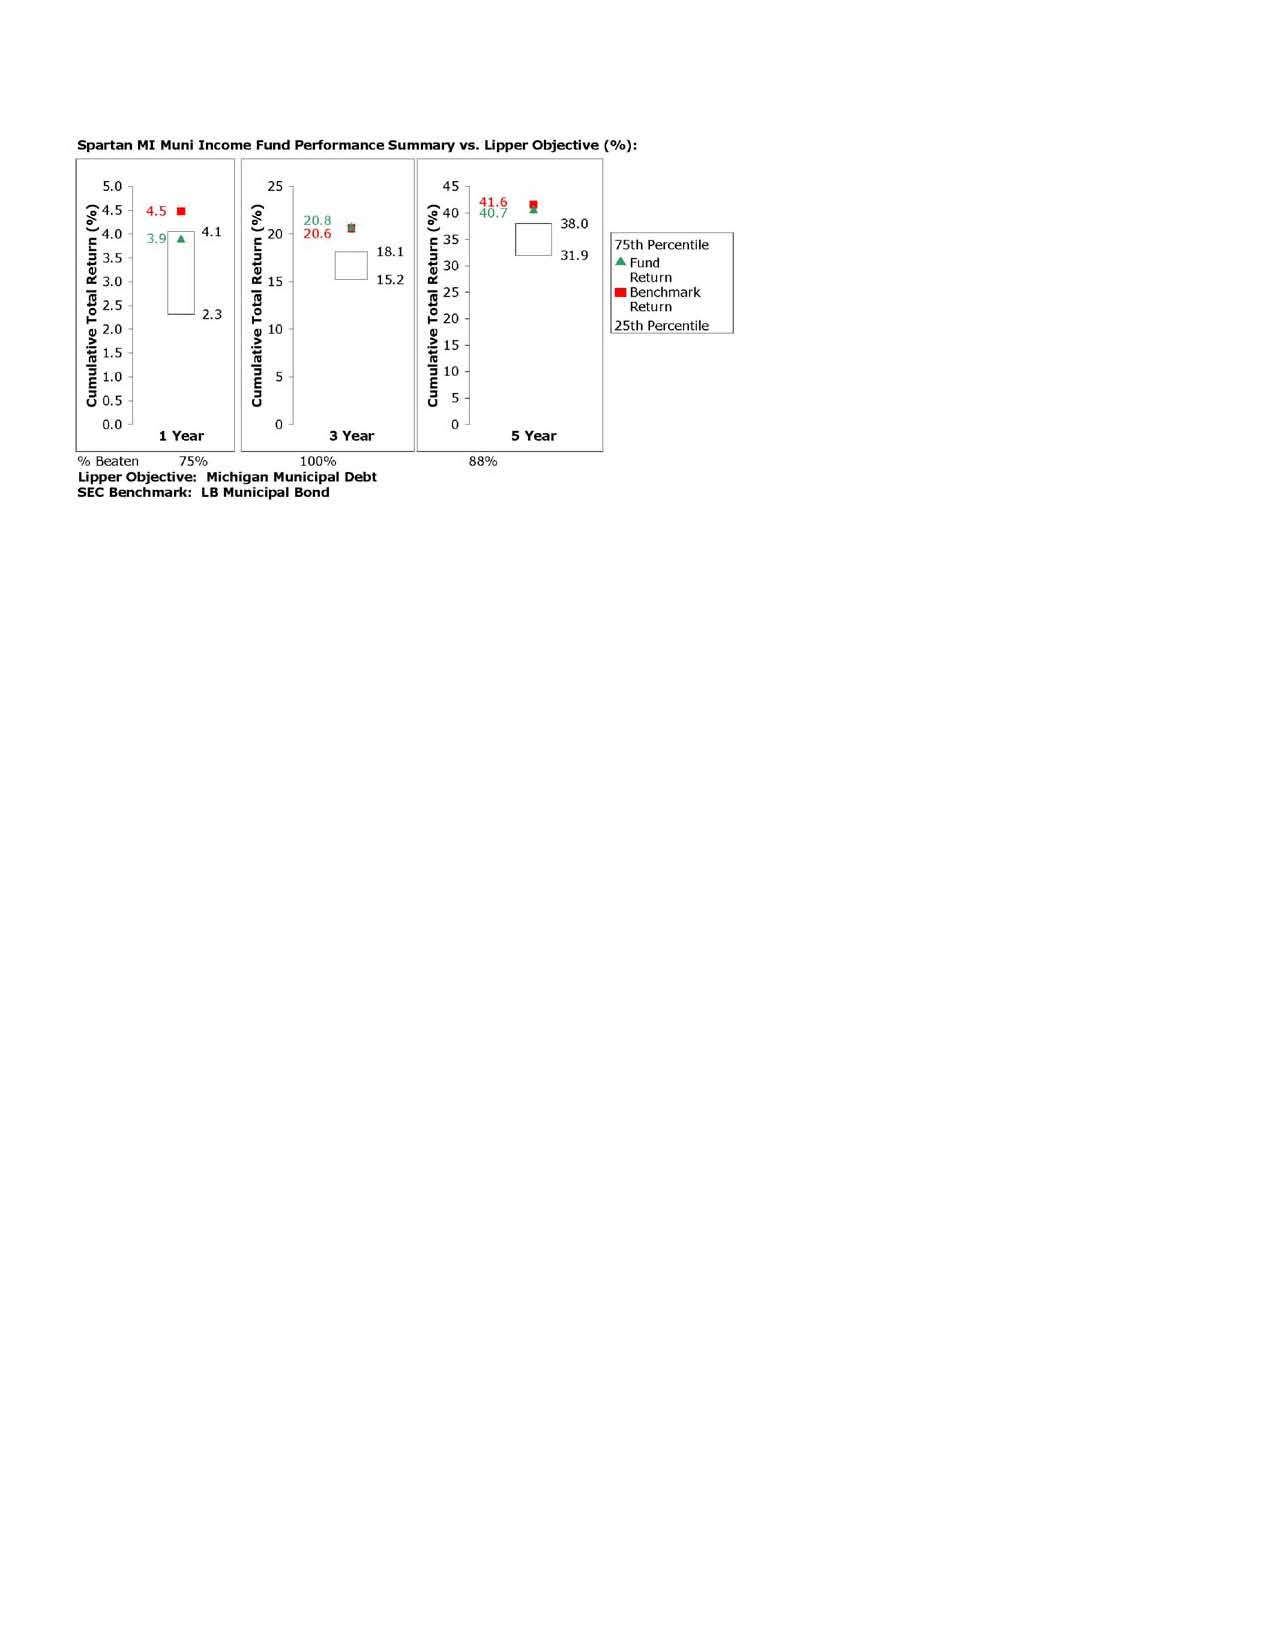
The Board noted that the relative investment performance of the fund has compared favorably to its Lipper peer group over time. The Board also noted that the relative investment performance of the fund was lower than its benchmark for certain periods, although the three-year cumulative total return of the fund compared favorably to its benchmark.
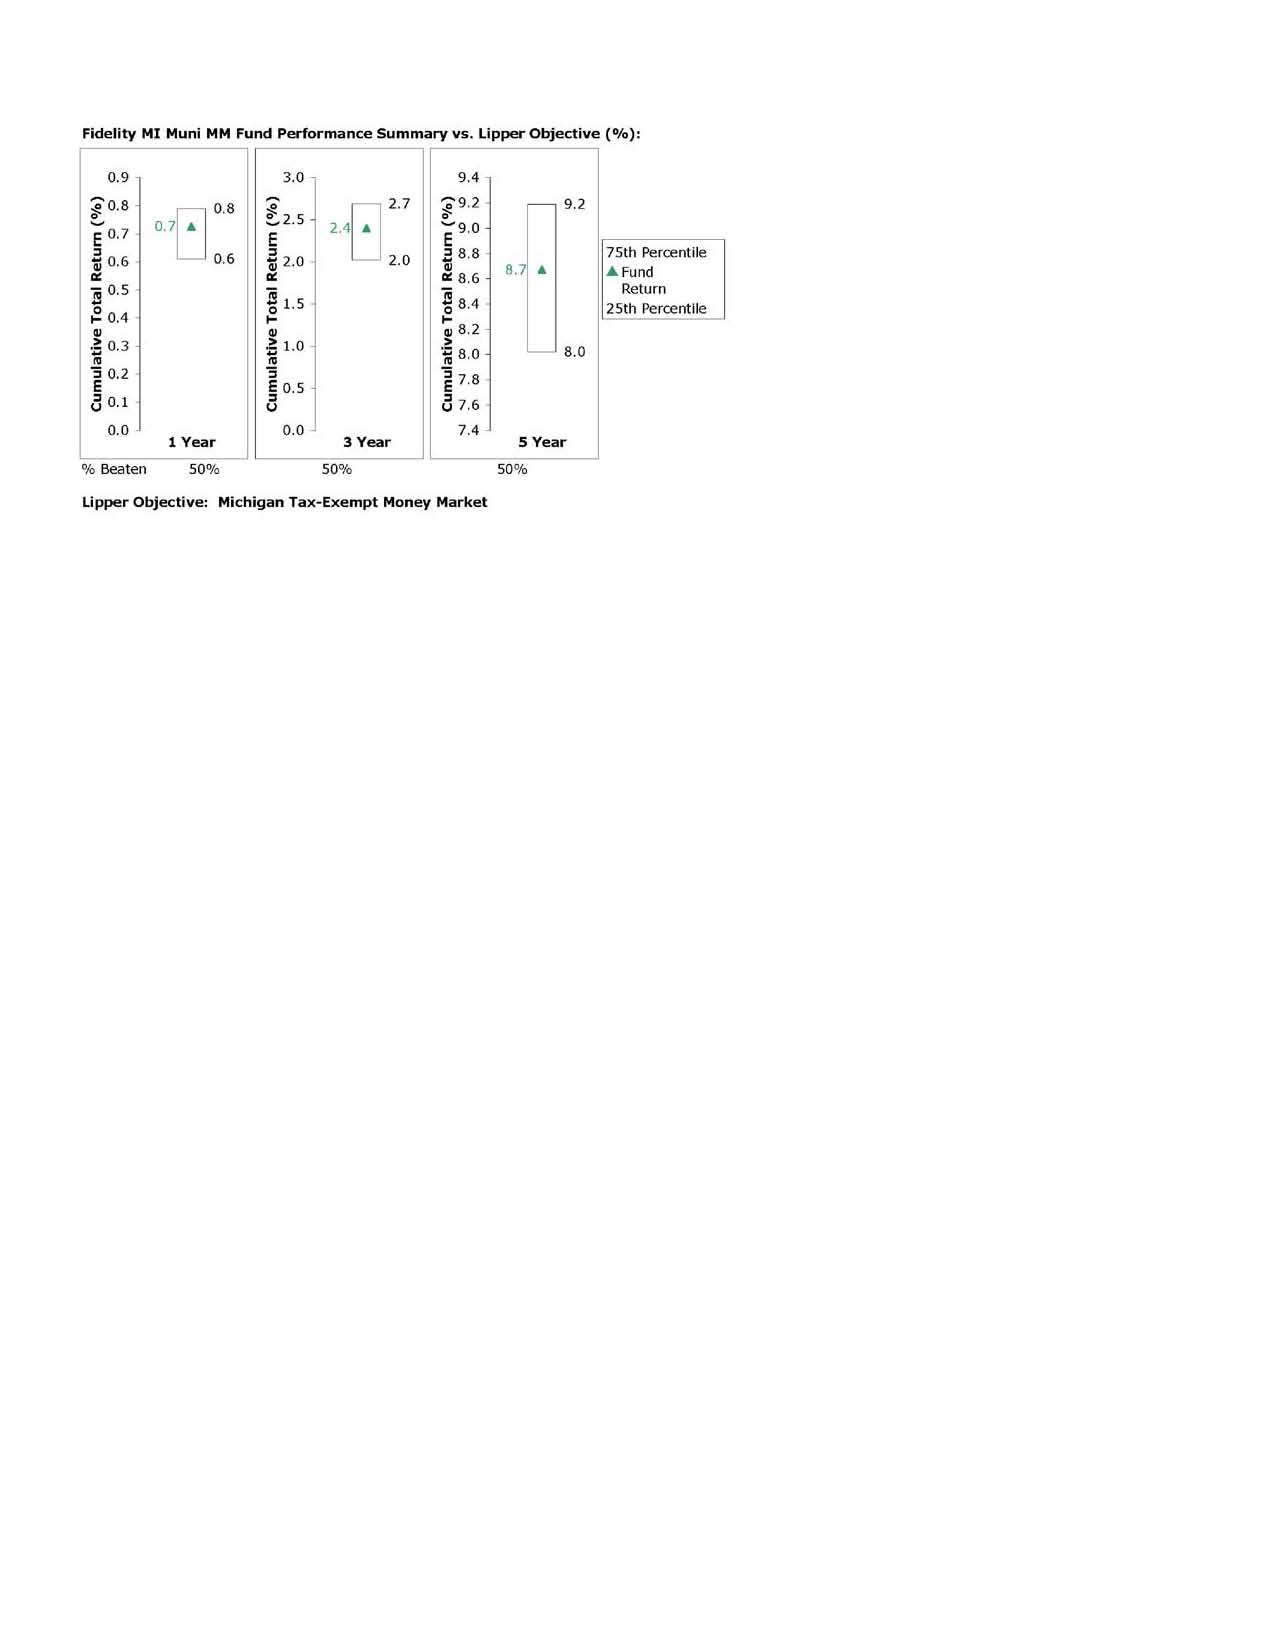
The Board noted that the relative investment performance of the fund has compared favorably to its Lipper peer group over time.
Semiannual Report
Board Approval of Investment Advisory Contracts and
Management Fees - continued
Based on its review, and giving particular weight to the nature and quality of the resources dedicated by the Investment Advisers to maintain and improve relative performance, the Board concluded that the nature, extent, and quality of the services provided by Fidelity will benefit each fund's shareholders, particularly in light of the Board's view that each fund's shareholders benefit from investing in a fund that is part of a large family of funds offering a variety of investment disciplines and services.
Competitiveness of Management Fee and Total Fund Expenses. The Board considered each fund's management fee and total expenses compared to "mapped groups" of competitive funds and classes. Fidelity creates "mapped groups" by combining similar Lipper investment objective categories that have comparable management fee characteristics. Combining Lipper investment objective categories aids the Board's management fee and total expense comparisons by broadening the competitive group used for comparison and by reducing the number of universes to which various Fidelity funds are compared.
The Board considered two proprietary management fee comparisons for the 12-month periods shown in the charts below. The group of Lipper funds used by the Board for management fee comparisons is referred to below as the "Total Mapped Group" and, for the reasons explained above, is broader than the Lipper peer group used by the Board for performance comparisons. The Total Mapped Group comparison focuses on a fund's standing relative to the total universe of comparable funds available to investors, in terms of gross management fees before expense reimbursements or caps. "TMG %" represents the percentage of funds in the Total Mapped Group that had management fees that were lower than a fund's. For example, a TMG % of 24% would mean that 76% of the funds in the Total Mapped Group had higher management fees than a fund. The "Asset-Size Peer Group" (ASPG) comparison focuses on a fund's standing relative to non-Fidelity funds similar in size to the fund within the Total Mapped Group. The ASPG represents at least 15% of the funds in the Total Mapped Group with comparable asset size and management fee characteristics, subject to a minimum of 50 funds (or all funds in the Total Mapped Group if fewer than 50). Additional information, such as the ASPG quartile ("quadrant") in which a fund's management fee ranked, is also included in the charts and considered by the Board.
Semiannual Report
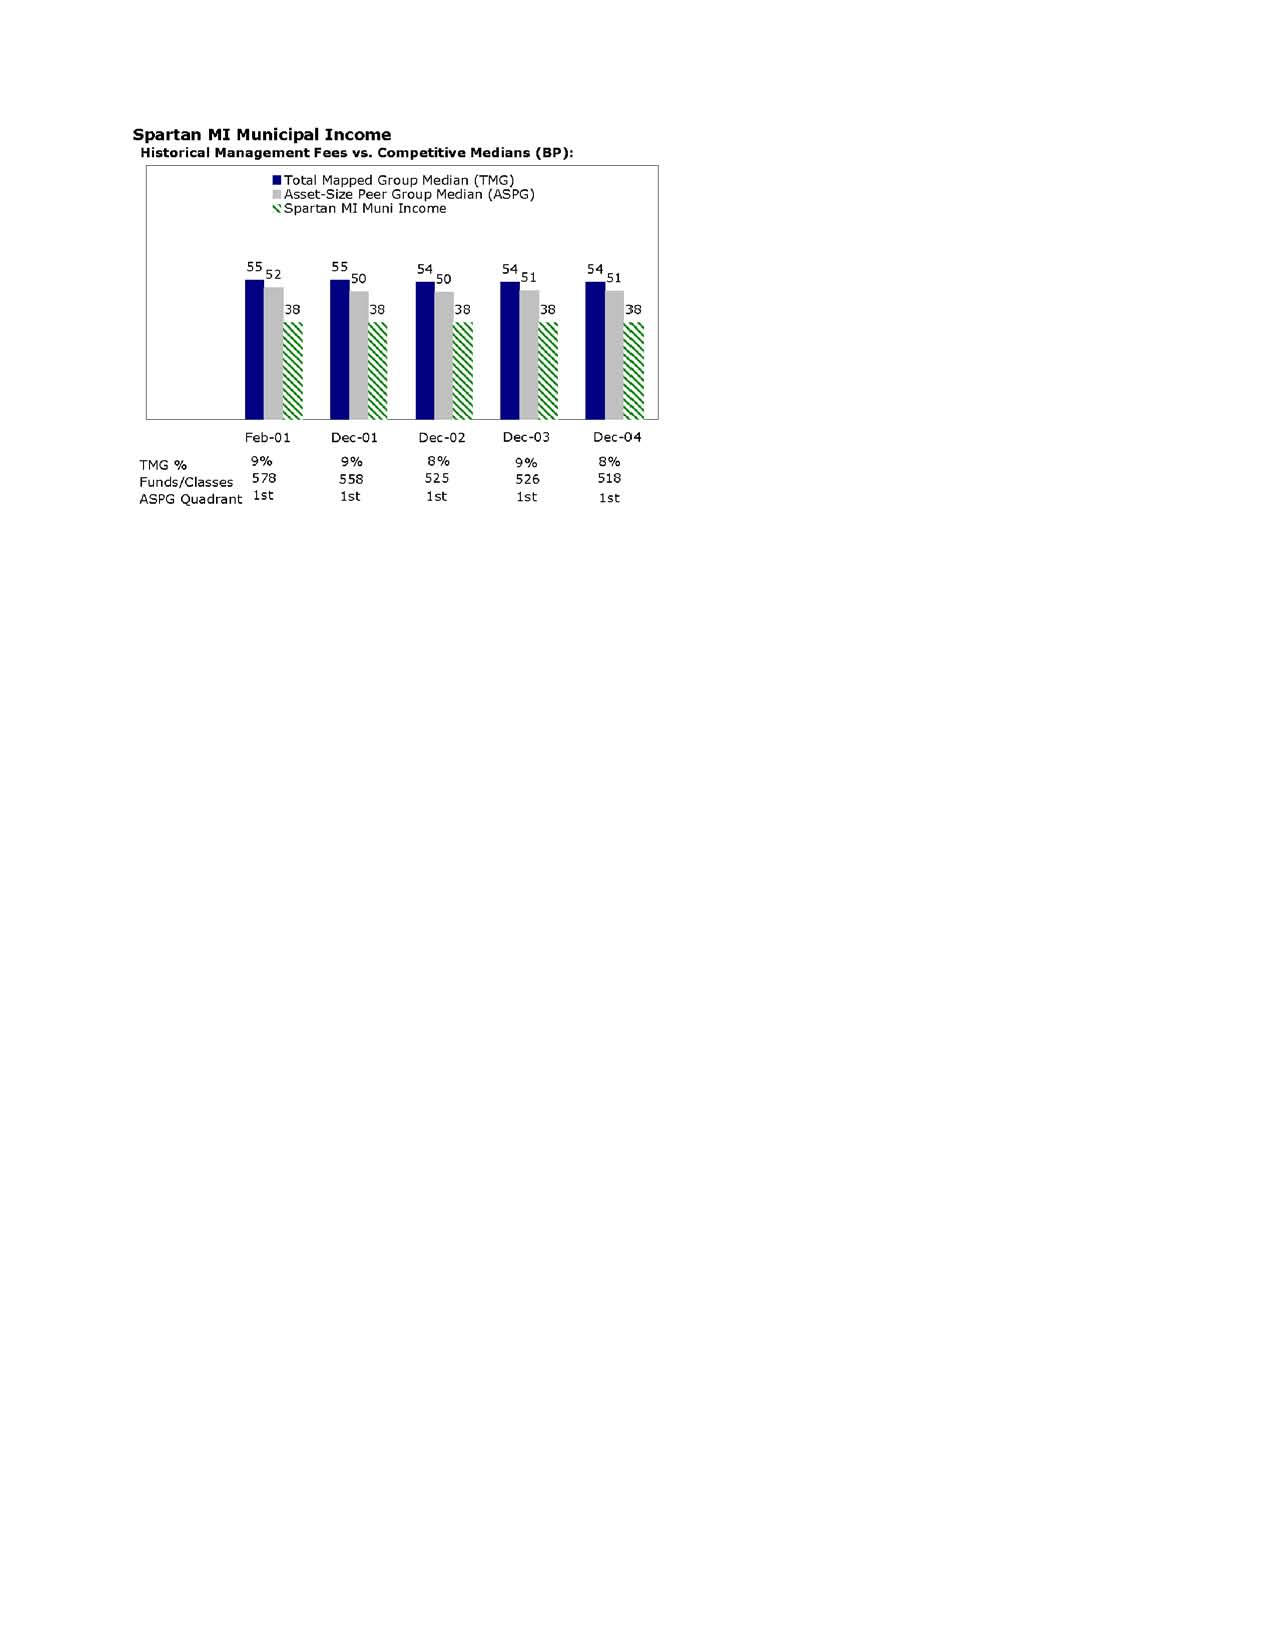

The Board noted that each fund's management fee ranked below the median of its Total Mapped Group and below the median of its ASPG for 2004. Based on its review, the Board concluded that each fund's management fee was fair and reasonable in light of the services that the fund receives and the other factors considered.
In its review of each fund's total expenses, the Board considered the fund's management fee as well as other fund expenses, such as transfer agent fees, pricing and bookkeeping fees, and custodial, legal, and audit fees. The Board also noted the effects of any waivers and reimbursements on fees and expenses. As part of its review, the Board also considered current and historical total expenses of each fund compared to competitive fund median expenses. Each fund is compared to those funds and classes in the Total Mapped Group (used by the Board for management fee comparisons) that have a similar sales load structure.
Semiannual Report
Board Approval of Investment Advisory Contracts and
Management Fees - continued
The Board noted that each fund's total expenses ranked below its competitive median for 2004.
In its review of total expenses, the Board also considered Fidelity fee structures and other information on clients that FMR and its affiliates service in other competitive markets, such as other mutual funds advised or subadvised by FMR or its affiliates, pension plan clients, and other institutional clients.
Based on its review, the Board concluded that each fund's total expenses were reasonable in light of the services that the fund and its shareholders receive and the other factors considered.
Costs of the Services and Profitability. The Board considered the revenues earned and the expenses incurred by Fidelity in conducting the business of developing, marketing, distributing, managing, administering and servicing each fund and its shareholders. The Board also considered the level of Fidelity's profits in respect of all the Fidelity funds.
On an annual basis, FMR presents to the Board Fidelity's profitability for each fund. Fidelity calculates the profitability for each fund, as well as aggregate profitability for groups of Fidelity funds and all Fidelity funds, using a series of detailed revenue and cost allocation methodologies which originate with the audited books and records of Fidelity. The Audit Committee of the Board reviews any significant changes from the prior year's methodologies.
PricewaterhouseCoopers LLP (PwC), independent registered accounting firm and auditor to Fidelity and certain Fidelity funds, has been engaged annually by the Board as part of the Board's assessment of the results of Fidelity's profitability analysis. PwC's engagement includes the review and assessment of Fidelity's methodologies used in determining the revenues and expenses attributable to Fidelity's mutual fund business, and completion of agreed-upon procedures surrounding the mathematical accuracy of fund profitability and its conformity to allocation methodologies. After considering PwC's reports issued under the engagement and information provided by Fidelity, the Board believes that while other allocation methods may also be reasonable, Fidelity's profitability methodologies are reasonable in all material respects.
The Board has also reviewed Fidelity's non-fund businesses and any fall-out benefits related to the mutual fund business as well as cases where Fidelity's affiliates may benefit from or be related to the funds' business. In addition, a special committee of the Board reviewed services provided to Fidelity by its affiliates and determined that the fees that Fidelity paid for such services were reasonable.
Semiannual Report
The Board considered the costs of the services provided by and the profits realized by Fidelity in connection with the operation of each fund and determined that the amount of profit is a fair entrepreneurial profit for the management of each fund.
Economies of Scale. The Board considered whether there have been economies of scale in respect of the management of the Fidelity funds, whether the Fidelity funds (including each fund) have appropriately benefited from any such economies of scale, and whether there is potential for realization of any further economies of scale. The Board considered the extent to which each fund will benefit from economies of scale through increased services to the fund, through waivers or reimbursements, or through fee or expense reductions, including reductions that occur through operation of the transfer agent agreement. The transfer agent fee varies in part based on the number of accounts in the fund. If the number of accounts decreases or the average account size increases, the overall transfer agent fee rate decreases.
The Board recognized that each fund's management contract incorporates a "group fee" structure, which provides for lower fee rates as total fund assets under FMR's management increase, and for higher fee rates as total fund assets under FMR's management decrease. The Board considered that the group fee is designed to deliver the benefits of economies of scale to fund shareholders when total fund assets increase, even if assets of any particular fund are unchanged or have declined, because some portion of Fidelity's costs are attributable to services provided to all Fidelity funds, and all funds benefit if those costs can be allocated among more assets. The Board concluded that, given the group fee structure, fund shareholders will achieve a certain level of economies of scale as assets under FMR's management increase at the fund complex level, regardless of whether Fidelity achieves any such economies of scale.
The Board further concluded that any potential economies of scale are being shared between fund shareholders and Fidelity in an appropriate manner.
Additional Information Requested by the Board. In order to develop fully the factual basis for consideration of the Advisory Contracts, the Board requested additional information regarding (i) Fidelity's fund profitability methodology, including additional detail on various cost allocations; (ii) fall-out benefits to Fidelity; and (iii) compensation of portfolio managers and research analysts.
Based on its evaluation of all of the conclusions noted above, and after considering all material factors, the Board ultimately concluded that the existing advisory fee structures are fair and reasonable, and that each fund's existing Advisory Contracts should be renewed.
Semiannual Report
Managing Your Investments
Fidelity offers several ways to conveniently manage your personal investments via your telephone or PC. You can access your account information, conduct trades and research your investments 24 hours a day.
By Phone
Fidelity Automated Service Telephone provides a single toll-free number to access account balances, positions, quotes and trading. It's easy to navigate the service, and on your first call, the system will help you create a personal identification number (PIN) for security.
(phone_graphic)
Fidelity Automated
Service Telephone (FAST®)
1-800-544-5555
Press
1 For mutual fund and brokerage trading.
2 For quotes.*
3 For account balances and holdings.
4 To review orders and mutual
fund activity.
5 To change your PIN.
*0 To speak to a Fidelity representative.
By PC
Fidelity's web site on the Internet provides a wide range of information, including daily financial news, fund performance, interactive planning tools and news about Fidelity products and services.
(computer_graphic)
Fidelity's Web Site
www.fidelity.com
* When you call the quotes line, please remember that a fund's yield and return will vary and, except for money market funds, share price will also vary. This means that you may have a gain or loss when you sell your shares. There is no assurance that money market funds will be able to maintain a stable $1 share price; an investment in a money market fund is not insured or guaranteed by the U.S. government. Total returns are historical and include changes in share price, reinvestment of dividends and capital gains, and the effects of any sales charges.
Semiannual Report
To Write Fidelity
We'll give your correspondence immediate attention and send you written confirmation upon completion of your request.
(letter_graphic)
Making Changes
To Your Account
(such as changing name, address, bank, etc.)
Fidelity Investments
P.O. Box 770001
Cincinnati, OH 45277-0002
(letter_graphic)
For Non-Retirement
Accounts
Buying shares
Fidelity Investments
P.O. Box 770001
Cincinnati, OH 45277-0003
Overnight Express
Fidelity Investments
Attn: Distribution Services
100 Crosby Parkway - KC1H
Covington, KY 41015
Selling shares
Fidelity Investments
P.O. Box 770001
Cincinnati, OH 45277-0035
Overnight Express
Fidelity Investments
Attn: Distribution Services
100 Crosby Parkway - KC1H
Covington, KY 41015
General Correspondence
Fidelity Investments
P.O. Box 500
Merrimack, NH 03054-0500
(letter_graphic)
For Retirement
Accounts
Buying shares
Fidelity Investments
P.O. Box 770001
Cincinnati, OH 45277-0003
Selling shares
Fidelity Investments
P.O. Box 770001
Cincinnati, OH 45277-0035
Overnight Express
Fidelity Investments
Attn: Distribution Services
100 Crosby Parkway - KC1H
Covington, KY 41015
General Correspondence
Fidelity Investments
P.O. Box 500
Merrimack, NH 03054-0500
Semiannual Report
To Visit Fidelity
For directions and hours,
please call 1-800-544-9797.
Arizona
7001 West Ray Road
Chandler, AZ
7373 N. Scottsdale Road
Scottsdale, AZ
California
815 East Birch Street
Brea, CA
1411 Chapin Avenue
Burlingame, CA
851 East Hamilton Avenue
Campbell, CA
19200 Von Karman Avenue
Irvine, CA
601 Larkspur Landing Circle
Larkspur, CA
10100 Santa Monica Blvd.
Los Angeles, CA
27101 Puerta Real
Mission Viejo, CA
73-575 El Paseo
Palm Desert, CA
251 University Avenue
Palo Alto, CA
123 South Lake Avenue
Pasadena, CA
16995 Bernardo Ctr. Drive
Rancho Bernardo, CA
1740 Arden Way
Sacramento, CA
7676 Hazard Center Drive
San Diego, CA
8 Montgomery Street
San Francisco, CA
3793 State Street
Santa Barbara, CA
21701 Hawthorne Boulevard
Torrance, CA
2001 North Main Street
Walnut Creek, CA
6300 Canoga Avenue
Woodland Hills, CA
Colorado
1625 Broadway
Denver, CO
9185 East Westview Road
Littleton, CO
Connecticut
48 West Putnam Avenue
Greenwich, CT
265 Church Street
New Haven, CT
300 Atlantic Street
Stamford, CT
29 South Main Street
West Hartford, CT
Delaware
222 Delaware Avenue
Wilmington, DE
Florida
4400 N. Federal Highway
Boca Raton, FL
121 Alhambra Plaza
Coral Gables, FL
2948 N. Federal Highway
Ft. Lauderdale, FL
1907 West State Road 434
Longwood, FL
8880 Tamiami Trail, North
Naples, FL
3550 Tamiami Trail, South
Sarasota, FL
1502 N. Westshore Blvd.
Tampa, FL
2465 State Road 7
Wellington, FL
3501 PGA Boulevard
West Palm Beach, FL
Georgia
3445 Peachtree Road, N.E.
Atlanta, GA
1000 Abernathy Road
Atlanta, GA
Illinois
One North LaSalle Street
Chicago, IL
875 North Michigan Ave.
Chicago, IL
1415 West 22nd Street
Oak Brook, IL
1700 East Golf Road
Schaumburg, IL
3232 Lake Avenue
Wilmette, IL
Indiana
4729 East 82nd Street
Indianapolis, IN
Kansas
5400 College Boulevard
Overland Park, KS
Maine
Three Canal Plaza
Portland, ME
Maryland
7315 Wisconsin Avenue
Bethesda, MD
One W. Pennsylvania Ave.
Towson, MD
Massachusetts
801 Boylston Street
Boston, MA
155 Congress Street
Boston, MA
300 Granite Street
Braintree, MA
44 Mall Road
Burlington, MA
405 Cochituate Road
Framingham, MA
416 Belmont Street
Worcester, MA
Michigan
500 E. Eisenhower Pkwy.
Ann Arbor, MI
280 Old N. Woodward Ave.
Birmingham, MI
43420 Grand River Avenue
Novi, MI
29155 Northwestern Hwy.
Southfield, MI
Minnesota
7600 France Avenue South
Edina, MN
Missouri
8885 Ladue Road
Ladue, MO
Semiannual Report
Nevada
2225 Village Walk Drive
Henderson, NV
New Jersey
150 Essex Street
Millburn, NJ
56 South Street
Morristown, NJ
396 Route 17, North
Paramus, NJ
3518 Route 1 North
Princeton, NJ
530 Highway 35
Shrewsbury, NJ
New York
1055 Franklin Avenue
Garden City, NY
37 West Jericho Turnpike
Huntington Station, NY
1271 Avenue of the Americas
New York, NY
61 Broadway
New York, NY
350 Park Avenue
New York, NY
200 Fifth Avenue
New York, NY
733 Third Avenue
New York, NY
11 Penn Plaza
New York, NY
2070 Broadway
New York, NY
1075 Northern Blvd.
Roslyn, NY
North Carolina
4611 Sharon Road
Charlotte, NC
Ohio
3805 Edwards Road
Cincinnati, OH
1324 Polaris Parkway
Columbus, OH
28699 Chagrin Boulevard
Woodmere Village, OH
Oregon
16850 SW 72nd Avenue
Tigard, OR
Pennsylvania
600 West DeKalb Pike
King of Prussia, PA
1735 Market Street
Philadelphia, PA
12001 Perry Highway
Wexford, PA
Rhode Island
47 Providence Place
Providence, RI
Tennessee
6150 Poplar Avenue
Memphis, TN
Texas
10000 Research Boulevard
Austin, TX
4001 Northwest Parkway
Dallas, TX
12532 Memorial Drive
Houston, TX
2701 Drexel Drive
Houston, TX
6500 N. MacArthur Blvd.
Irving, TX
6005 West Park Boulevard
Plano, TX
14100 San Pedro
San Antonio, TX
1576 East Southlake Blvd.
Southlake, TX
19740 IH 45 North
Spring, TX
Utah
215 South State Street
Salt Lake City, UT
Virginia
1861 International Drive
McLean, VA
Washington
411 108th Avenue, N.E.
Bellevue, WA
1518 6th Avenue
Seattle, WA
Washington, DC
1900 K Street, N.W.
Washington, DC
Wisconsin
595 North Barker Road
Brookfield, WI
Fidelity Brokerage Services, Inc., 100 Summer St., Boston, MA 02110 Member NYSE/SIPC
Semiannual Report
Investment Adviser
Fidelity Management & Research Company
Boston, MA
Investment Sub-Advisers
Fidelity Investments Money
Management, Inc.
Fidelity International Investment Advisors
Fidelity International Investment Advisors
(U.K.) Limited
General Distributor
Fidelity Distributors Corporation
Boston, MA
Transfer and Service Agents
Citibank, N.A.
New York, NY
and
Fidelity Service Company, Inc.
Boston, MA
Custodian
Citibank, N.A.
New York, NY
The Fidelity Telephone Connection
Mutual Fund 24-Hour Service
Exchanges/Redemptions
and Account Assistance 1-800-544-6666
Product Information 1-800-544-6666
Retirement Accounts 1-800-544-4774 (8 a.m. - 9 p.m.)
TDD Service 1-800-544-0118
for the deaf and hearing impaired
(9 a.m. - 9 p.m. Eastern time)
Fidelity Automated Service
Telephone (FAST®) (automated graphic) 1-800-544-5555
(automated graphic) Automated line for quickest service
MIR-USAN-0805
1.787785.102
(Fidelity Investment logo)(registered trademark)
Corporate Headquarters
82 Devonshire St., Boston, MA 02109
www.fidelity.com
Spartan®
Minnesota Municipal Income
Fund
Semiannual Report
June 30, 2005
(2_fidelity_logos) (Registered_Trademark)
Contents
Chairman's Message | <Click Here> | Ned Johnson's message to shareholders. |
Shareholder Expense Example | <Click Here> | An example of shareholder expenses. |
Investment Changes | <Click Here> | A summary of major shifts in the fund's investments over the past six months. |
Investments | <Click Here> | A complete list of the fund's investments with their market values. |
Financial Statements | <Click Here> | Statements of assets and liabilities, operations, and changes in net assets,
as well as financial highlights. |
Notes | <Click Here> | Notes to the financial statements. |
Board Approval of Investment Advisory
Contracts and Management Fees | <Click Here> | |
To view a fund's proxy voting guidelines and proxy voting record for the 12-month period ended June 30, visit www.fidelity.com/proxyvotingresults or visit the Securities and Exchange Commission's (SEC) web site at www.sec.gov. You may also call 1-800-544-8544 to request a free copy of the proxy voting guidelines.
Standard & Poor's, S&P and S&P 500 are registered service marks of The McGraw-Hill Companies, Inc. and have been licensed for use by Fidelity Distributors Corporation.
Other third party marks appearing herein are the property of their respective owners.
All other marks appearing herein are registered or unregistered trademarks or service marks of FMR Corp. or an affiliated company.
This report and the financial statements contained herein are submitted for the general information of the shareholders of the fund. This report is not authorized for distribution to prospective investors in the fund unless preceded or accompanied by an effective prospectus.
A fund files its complete schedule of portfolio holdings with the SEC for the first and third quarters of each fiscal year on Form N-Q. Forms N-Q are available on the SEC's web site at http://www.sec.gov. A fund's Forms N-Q may be reviewed and copied at the SEC's Public Reference Room in Washington, DC. Information regarding the operation of the SEC's Public Reference Room may be obtained by calling 1-800-SEC-0330. For a complete list of a fund's portfolio holdings, view the most recent quarterly holdings report, semiannual report, or annual report on Fidelity's web site at http://www.fidelity.com/holdings.
NOT FDIC INSURED · MAY LOSE VALUE · NO BANK GUARANTEE
Neither the fund nor Fidelity Distributors Corporation is a bank.
Semiannual Report
Chairman's Message
(photo_of_Edward_C_Johnson_3d)
Dear Shareholder:
During the past year or so, much has been reported about the mutual fund industry, and much of it has been more critical than I believe is warranted. Allegations that some companies have been less than forthright with their shareholders have cast a shadow on the entire industry. I continue to find these reports disturbing, and assert that they do not create an accurate picture of the industry overall. Therefore, I would like to remind everyone where Fidelity stands on these issues. I will say two things specifically regarding allegations that some mutual fund companies were in violation of the Securities and Exchange Commission's forward pricing rules or were involved in so-called "market timing" activities.
First, Fidelity has no agreements that permit customers who buy fund shares after 4 p.m. to obtain the 4 p.m. price. This is not a new policy. This is not to say that someone could not deceive the company through fraudulent acts. However, we are extremely diligent in preventing fraud from occurring in this manner - and in every other. But I underscore again that Fidelity has no so-called "agreements" that sanction illegal practices.
Second, Fidelity continues to stand on record, as we have for years, in opposition to predatory short-term trading that adversely affects shareholders in a mutual fund. Back in the 1980s, we initiated a fee - which is returned to the fund and, therefore, to investors - to discourage this activity. Further, we took the lead several years ago in developing a Fair Value Pricing Policy to prevent market timing on foreign securities in our funds. I am confident we will find other ways to make it more difficult for predatory traders to operate. However, this will only be achieved through close cooperation among regulators, legislators and the industry.
Yes, there have been unfortunate instances of unethical and illegal activity within the mutual fund industry from time to time. That is true of any industry. When this occurs, confessed or convicted offenders should be dealt with appropriately. But we are still concerned about the risk of over-regulation and the quick application of simplistic solutions to intricate problems. Every system can be improved, and we support and applaud well thought out improvements by regulators, legislators and industry representatives that achieve the common goal of building and protecting the value of investors' holdings.
For nearly 60 years, Fidelity has worked very hard to improve its products and service to justify your trust. When our family founded this company in 1946, we had only a few hundred customers. Today, we serve more than 18 million customers including individual investors and participants in retirement plans across America.
Let me close by saying that we do not take your trust in us for granted, and we realize that we must always work to improve all aspects of our service to you. In turn, we urge you to continue your active participation with your financial matters, so that your interests can be well served.
Best regards,
/s/Edward C. Johnson 3d
Edward C. Johnson 3d
Semiannual Report
Shareholder Expense Example
As a shareholder of the Fund, you incur two types of costs: (1) transaction costs, including redemption fees, and (2) ongoing costs, including management fees and other Fund expenses. This Example is intended to help you understand your ongoing costs (in dollars) of investing in the Fund and to compare these costs with the ongoing costs of investing in other mutual funds.
The Example is based on an investment of $1,000 invested at the beginning of the period and held for the entire period (January 1, 2005 to June 30, 2005).
Actual Expenses
The first line of the table below provides information about actual account values and actual expenses. You may use the information in this line, together with the amount you invested, to estimate the expenses that you paid over the period. Simply divide your account value by $1,000.00 (for example, an $8,600 account value divided by $1,000.00 = 8.6), then multiply the result by the number in the first line under the heading entitled "Expenses Paid During Period" to estimate the expenses you paid on your account during this period. A small balance maintenance fee of $12.00 that is charged once a year may apply for certain accounts with a value of less than $2,000. This fee is not included in the table below. If it was, the estimate of expenses you paid during the period would be higher, and your ending account value lower, by this amount.
Hypothetical Example for Comparison Purposes
The second line of the table below provides information about hypothetical account values and hypothetical expenses based on the Fund's actual expense ratio and an assumed rate of return of 5% per year before expenses, which is not the Fund's actual return. The hypothetical account values and expenses may not be used to estimate the actual ending account balance or expenses you paid for the period. You may use this information to compare the ongoing costs of investing in the Fund and other funds. To do so, compare this 5% hypothetical example with the 5% hypothetical examples that appear in the shareholder reports of the other funds. A small balance maintenance fee of $12.00 that is charged once a year may apply for certain accounts with a value of less than $2,000. This fee is not included in the table below. If it was, the estimate of expenses you paid during the period would be higher, and your ending account value lower, by this amount.
Please note that the expenses shown in the table are meant to highlight your ongoing costs only and do not reflect any transaction costs. Therefore, the second line of the table is useful in comparing ongoing costs only, and will not help you determine the relative total costs of owning different funds. In addition, if these transactional costs were included, your costs would have been higher.
Semiannual Report
| Beginning
Account Value
January 1, 2005 | Ending
Account Value
June 30, 2005 | Expenses Paid
During Period*
January 1, 2005
to June 30, 2005 |
Actual | $ 1,000.00 | $ 1,022.10 | $ 2.56 |
Hypothetical (5% return per year before expenses) | $ 1,000.00 | $ 1,022.27 | $ 2.56 |
* Expenses are equal to the Fund's annualized expense ratio of .51%; multiplied by the average account value over the period, multiplied by 181/365 (to reflect the one-half year period).
Semiannual Report
Investment Changes
Top Five Sectors as of June 30, 2005 |
| % of fund's
net assets | % of fund's net assets
6 months ago |
General Obligations | 44.8 | 48.5 |
Electric Utilities | 15.7 | 13.9 |
Health Care | 13.2 | 12.3 |
Escrowed/Pre-Refunded | 12.2 | 7.2 |
Transportation | 5.9 | 5.3 |
Average Years to Maturity as of June 30, 2005 |
| | 6 months ago |
Years | 12.7 | 12.8 |
Average years to maturity is based on the average time remaining to the stated maturity date of each bond, weighted by the market value of each bond. |
Duration as of June 30, 2005 |
| | 6 months ago |
Years | 6.0 | 6.2 |
Duration shows how much a bond fund's price fluctuates with changes in comparable interest rates. If rates rise 1%, for example, a fund with a five-year duration is likely to lose about 5% of its value. Other factors also can influence a bond fund's performance and share price. Accordingly, a bond fund's actual performance may differ from this example. |
Quality Diversification (% of fund's net assets) |
As of June 30, 2005 | As of December 31, 2004 |
 | AAA 60.0% | | | AAA 60.8% | |
 | AA,A 34.8% | | | AA,A 34.4% | |
 | BBB 3.7% | | | BBB 3.5% | |
 | BB and Below 0.6% | | | BB and Below 0.0% | |
 | Not Rated 0.0% | | | Not Rated 0.2% | |
 | Short-Term
Investments and
Net Other Assets 0.9% | | | Short-Term
Investments and
Net Other Assets 1.1% | |

We have used ratings from Moody's® Investors Services, Inc. Where Moody's ratings are not available, we have used S&P® ratings. |
Semiannual Report
Investments June 30, 2005 (Unaudited)
Showing Percentage of Net Assets
Municipal Bonds - 99.1% |
| Principal
Amount | | Value
(Note 1) |
Minnesota - 94.7% |
Anoka-Hennepin Independent School District #11: | | | |
Series 2004 B, 5% 2/1/20 | $ 1,880,000 | | $ 2,019,064 |
Series A, 5.75% 2/1/20 (Pre-Refunded to 2/1/10 @ 100) (c) | 3,950,000 | | 4,377,074 |
Brainerd Independent School District #181 Series A: | | | |
5.375% 2/1/17 (FGIC Insured) | 4,705,000 | | 5,253,133 |
5.375% 2/1/19 (FGIC Insured) | 2,700,000 | | 2,991,384 |
Brooklyn Ctr. Independent School District #286 5.1% 2/1/31 (FGIC Insured) | 6,000,000 | | 6,317,580 |
Cambridge Independant School District #911 Gen. Oblig. (Minnesota School District Prog.) Series C, 5% 4/1/14 (MBIA Insured) | 1,200,000 | | 1,336,332 |
Centennial Independent School District #12: | | | |
Series 1996 A, 5.625% 2/1/16 | 1,000,000 | | 1,063,660 |
Series A, 5% 2/1/19 (FSA Insured) | 580,000 | | 622,903 |
Chaska Elec. Rev. (Generating Facilities Proj.) Series A: | | | |
5.25% 10/1/20 | 2,000,000 | | 2,213,500 |
5.25% 10/1/25 | 1,215,000 | | 1,323,342 |
Duluth Econ. Dev. Auth. Health Care Facilities Rev.
(Benedictine Health Sys. St. Mary's) 5.25% 2/15/28 | 2,350,000 | | 2,448,982 |
Elk River Independent School District #728 Series A, 5% 2/1/17 (FGIC Insured) | 2,000,000 | | 2,206,820 |
Hastings Independent School District #200 Series A, 5% 2/1/22 (Pre-Refunded to 2/1/08 @ 100) (c) | 4,750,000 | | 4,989,163 |
Hopkins Independent School District #270: | | | |
5% 2/1/11 | 1,250,000 | | 1,363,925 |
5% 2/1/16 (FGIC Insured) | 1,350,000 | | 1,465,425 |
5.125% 2/1/17 (FGIC Insured) | 1,015,000 | | 1,107,913 |
Jackson County Central Independent School District #2895 5% 2/1/21 (FSA Insured) | 1,220,000 | | 1,302,179 |
Lake Superior Independent School District #381 Series A: | | | |
5% 4/1/15 (FSA Insured) | 1,970,000 | | 2,167,256 |
5% 4/1/16 (FSA Insured) | 2,065,000 | | 2,268,816 |
5% 4/1/17 (FSA Insured) | 2,165,000 | | 2,367,969 |
5% 4/1/18 (FSA Insured) | 1,260,000 | | 1,371,901 |
Lakeville Independent School District #194 Series A, 5% 2/1/22 (FGIC Insured) | 1,000,000 | | 1,074,190 |
Mankato Independent School District #77 Series A, 5% 2/1/12 (FSA Insured) | 1,605,000 | | 1,709,502 |
Maple Grove Gen. Oblig. Impt. Series A, 5.2% 2/1/17 | 1,120,000 | | 1,157,475 |
Municipal Bonds - continued |
| Principal
Amount | | Value
(Note 1) |
Minnesota - continued |
Metropolitan Council Minneapolis-Saint Paul Metropolitan Area Series 2004 A: | | | |
5% 9/1/07 | $ 1,350,000 | | $ 1,415,340 |
5% 9/1/12 | 875,000 | | 971,399 |
Minneapolis & Saint Paul Hsg. & Redev. Auth. Health Care Sys. Rev.: | | | |
(Health Partners Oblig. Group Proj.): | | | |
5.875% 12/1/29 | 800,000 | | 860,568 |
6% 12/1/19 | 2,415,000 | | 2,719,990 |
(Healthspan Corp. Proj.) Series A, 4.75% 11/15/18 (AMBAC Insured) | 4,500,000 | | 4,538,115 |
Minneapolis & Saint Paul Metropolitan Arpts. Commission Series 13, 5.25% 1/1/11 (b) | 2,840,000 | | 3,037,550 |
Minneapolis & Saint Paul Metropolitan Arpts. Commission Arpt. Rev.: | | | |
Series 1999 A, 5.125% 1/1/31 (FGIC Insured) | 3,375,000 | | 3,517,830 |
Series 2000 A, 5.75% 1/1/32 (Pre-Refunded to
1/1/10 @ 101) (c) | 1,000,000 | | 1,122,920 |
Series 2001 C: | | | |
5.25% 1/1/32 (FGIC Insured) | 1,020,000 | | 1,082,761 |
5.5% 1/1/16 (FGIC Insured) | 2,500,000 | | 2,780,550 |
Series A: | | | |
5% 1/1/19 (AMBAC Insured) | 4,000,000 | | 4,210,640 |
5% 1/1/35 (AMBAC Insured) | 3,000,000 | | 3,186,180 |
Series B: | | | |
5.25% 1/1/11 (AMBAC Insured) (b) | 3,475,000 | | 3,668,349 |
5.4% 1/1/09 (FGIC Insured) (b) | 1,375,000 | | 1,471,690 |
5.625% 1/1/13 (FGIC Insured) (b) | 1,000,000 | | 1,084,200 |
Minneapolis Art Ctr. Facilities Rev. (Walker Art Ctr. Proj.) 5.125% 7/1/21 | 1,250,000 | | 1,326,925 |
Minneapolis Cmnty. Dev. Agcy. Tax Increment Rev.: | | | |
0% 9/1/07 (MBIA Insured) | 2,860,000 | | 2,686,398 |
0% 9/1/08 (MBIA Insured) | 4,600,000 | | 4,165,760 |
Minneapolis Gen. Oblig.: | | | |
(Sports Arena Proj.) 5.125% 10/1/20 | 2,565,000 | | 2,698,072 |
Series B, 5.1% 9/1/08 | 2,000,000 | | 2,007,320 |
Minneapolis Health Care Sys. Rev.: | | | |
(Allina Health Sys. Proj.) Series 2002 A, 6% 11/15/18 | 2,655,000 | | 3,003,071 |
(Health Care Sys. Proj.) Series D, 5% 11/15/34
(AMBAC Insured) | 1,500,000 | | 1,592,100 |
Minneapolis Rev. (Univ. of Minnesota Gateway Proj.)
Series 1997 A, 5.25% 12/1/24 | 1,900,000 | | 1,975,924 |
Municipal Bonds - continued |
| Principal
Amount | | Value
(Note 1) |
Minnesota - continued |
Minneapolis Spl. School District #1: | | | |
Series A, 5% 2/1/17 (FSA Insured) | $ 2,000,000 | | $ 2,197,100 |
5% 2/1/15 (MBIA Insured) | 1,020,000 | | 1,110,321 |
5.3% 2/1/14 (Pre-Refunded to 2/1/08 @ 100) (c) | 3,275,000 | | 3,464,033 |
Minneapolis Spl. School District #1 Ctfs. of Prtn.: | | | |
Series B, 5% 2/1/13 (Pre-Refunded to 2/1/07 @ 100) (c) | 2,575,000 | | 2,668,189 |
5.5% 2/1/21 (MBIA Insured) (Pre-Refunded to
2/1/09 @ 100) (c) | 1,305,000 | | 1,412,323 |
Minnesota Agric. & Econ. Dev. Board Rev. (Health Care Sys. Proj.) Series A: | | | |
6.375% 11/15/29 | 90,000 | | 101,823 |
6.375% 11/15/29 (Pre-Refunded to 11/15/10 @ 101) (c) | 2,940,000 | | 3,435,214 |
Minnesota Gen. Oblig.: | | | |
(Duluth Arpt. Proj.) Series B, 6.25% 8/1/14 (b) | 1,000,000 | | 1,002,210 |
5% 8/1/16 | 3,500,000 | | 3,810,170 |
5% 8/1/18 | 10,775,000 | | 11,759,938 |
5.2% 5/1/07 | 3,750,000 | | 3,828,713 |
5.25% 8/1/13 | 755,000 | | 822,021 |
5.5% 6/1/17 | 2,150,000 | | 2,364,463 |
Minnesota Higher Ed. Facilities Auth. Rev.: | | | |
(Hamline Univ. Proj.): | | | |
Series 4I, 6% 10/1/12 | 2,000,000 | | 2,072,420 |
Series 5B, 5.95% 10/1/19 | 600,000 | | 646,344 |
(Saint Johns Univ. Proj.) Series 4L, 5.4% 10/1/22 | 3,500,000 | | 3,643,185 |
(Saint Thomas Univ. Proj.) Series 4M, 5.35% 4/1/17 | 1,500,000 | | 1,561,200 |
Minnesota Hsg. Fin. Agcy. (Single Family Mtg. Prog.) Series H, 6.5% 1/1/26 (b) | 1,410,000 | | 1,417,247 |
Minnesota Pub. Facilities Auth. Wtr. Poll. Cont. Rev. 5% 3/1/16 | 295,000 | | 304,192 |
Minnesota Retirement Sys. Bldg. Rev.: | | | |
5.55% 6/1/14 | 590,000 | | 651,024 |
5.6% 6/1/15 | 590,000 | | 652,912 |
5.65% 6/1/16 | 625,000 | | 692,456 |
5.7% 6/1/17 | 900,000 | | 999,594 |
5.75% 6/1/18 | 975,000 | | 1,085,087 |
5.75% 6/1/19 | 1,050,000 | | 1,168,052 |
5.8% 6/1/20 | 1,000,000 | | 1,114,680 |
5.875% 6/1/22 | 2,425,000 | | 2,710,107 |
Municipal Bonds - continued |
| Principal
Amount | | Value
(Note 1) |
Minnesota - continued |
Mounds View Independent School District #621 Series 2000 A, 5.375% 2/1/24 (Pre-Refunded to 2/1/11 @ 100) (c) | $ 3,000,000 | | $ 3,312,120 |
Northeast Metropolitan Intermediate School District #916 Ctfs. of Prtn. 5% 1/1/13 | 1,000,000 | | 1,076,870 |
Northern Muni. Pwr. Agcy. Elec. Sys. Rev.: | | | |
Series B, 4.75% 1/1/20 (AMBAC Insured) | 3,500,000 | | 3,625,720 |
5.25% 1/1/13 (FSA Insured) | 1,500,000 | | 1,632,210 |
5.375% 1/1/14 (FSA Insured) | 8,500,000 | | 9,275,115 |
Osseo Independent School District #279: | | | |
(School Bldg. Proj.): | | | |
Series 2000 A, 5.25% 2/1/21 | 2,625,000 | | 2,842,980 |
Series A: | | | |
5.75% 2/1/11 | 2,420,000 | | 2,713,812 |
5.75% 2/1/12 | 3,100,000 | | 3,468,683 |
Series A, 5.25% 2/1/14 (FSA Insured) | 2,705,000 | | 2,997,329 |
Series B, 5% 2/1/13 | 2,000,000 | | 2,141,320 |
Owatonna Pub. Utils. Commission Pub. Utils. Rev.: | | | |
5% 1/1/11 (AMBAC Insured) | 720,000 | | 785,491 |
5% 1/1/13 (AMBAC Insured) | 800,000 | | 886,200 |
5% 1/1/15 (AMBAC Insured) | 715,000 | | 783,611 |
Prior Lake Ind. School District #719 Series 2000, 5.5% 2/1/15 (FSA Insured) | 1,500,000 | | 1,644,870 |
Ramsey County Gen. Oblig. Series A, 5% 2/1/18 | 1,530,000 | | 1,672,902 |
Robbinsdale Independent School District #281: | | | |
5% 2/1/09 | 2,035,000 | | 2,176,026 |
5% 2/1/16 (FSA Insured) | 2,410,000 | | 2,616,055 |
5% 2/1/16 (FSA Insured) | 1,015,000 | | 1,101,783 |
5% 2/1/17 (FSA Insured) | 2,535,000 | | 2,740,918 |
5% 2/1/18 (FSA Insured) | 2,520,000 | | 2,714,015 |
Rochester Health Care Facilities Rev.: | | | |
(Mayo Foundation Proj.) Series A, 5.5% 11/15/27 | 4,750,000 | | 5,059,748 |
(Mayo Foundation/Mayo Med. Ctr. Proj.) Series I: | | | |
5.875% 11/15/08 | 1,000,000 | | 1,093,500 |
5.9% 11/15/09 | 1,000,000 | | 1,115,440 |
Roseville Independent School District #623
(School District Cr. Enhancement Prog.) Series A, 5% 2/1/15 (FSA Insured) | 1,015,000 | | 1,097,814 |
Saint Cloud Health Care Rev. (Saint Cloud Hosp. Group Oblig. Proj.) Series A: | | | |
5.75% 5/1/26 (FSA Insured) | 7,020,000 | | 7,800,343 |
5.875% 5/1/30 (FSA Insured) | 4,000,000 | | 4,468,560 |
6.25% 5/1/20 (FSA Insured) | 2,760,000 | | 3,138,175 |
Municipal Bonds - continued |
| Principal
Amount | | Value
(Note 1) |
Minnesota - continued |
Saint Cloud Hosp. Facilities Rev. (Saint Cloud Hosp. Proj.) Series B, 5% 7/1/20 (AMBAC Insured) | $ 1,000,000 | | $ 1,023,680 |
Saint Louis Park Health Care Facilities Rev.
(Park Nicollet Health Services Proj.) Series B,
5.5% 7/1/25 | 2,000,000 | | 2,163,380 |
Saint Louis Park Independent School District #283: | | | |
5.65% 2/1/16 (Pre-Refunded to 2/1/09 @ 100) (c) | 2,630,000 | | 2,859,546 |
5.75% 2/1/20 (Pre-Refunded to 2/1/09 @ 100) (c) | 3,765,000 | | 4,106,260 |
Saint Michael Independent School District #885 5% 2/1/27 (FSA Insured) | 7,000,000 | | 7,371,770 |
Saint Paul Hsg. & Redev. Auth. Health Care Facilities Rev. (Regions Hosp. Proj.) 5.3% 5/15/28 | 1,250,000 | | 1,279,650 |
Saint Paul Independent School District #625: | | | |
Series 2000 A, 5.5% 2/1/21 | 1,060,000 | | 1,167,590 |
Series A, 5% 2/1/17 (FSA Insured) | 220,000 | | 240,244 |
Series B: | | | |
5% 2/1/16 (FSA Insured) | 1,025,000 | | 1,142,024 |
5% 2/1/17 (FSA Insured) | 1,300,000 | | 1,440,647 |
5% 2/1/18 (FSA Insured) | 395,000 | | 429,436 |
Series C, 5% 2/1/21 | 1,000,000 | | 1,072,160 |
Saint Paul Port Auth. Energy Park Tax Increment Rev. 5% 2/1/08 (Escrowed to Maturity) (c) | 2,500,000 | | 2,627,125 |
Saint Paul Port Auth. Lease Rev.: | | | |
(HealthEast Midway Campus Proj.) Series 2003 A, 5.75% 5/1/25 | 2,000,000 | | 2,000,920 |
Series 2003 11, 5.25% 12/1/20 | 3,000,000 | | 3,305,760 |
Series 2003 12, 5.25% 12/1/18 | 3,685,000 | | 4,096,946 |
Shakopee Health Care Facilities Rev. (Saint Francis Reg'l. Med. Ctr. Proj.) 5.25% 9/1/34 | 2,500,000 | | 2,595,525 |
South Washington County Independent School District #833 Series A: | | | |
5.4% 2/1/15 | 3,925,000 | | 4,268,398 |
5.5% 2/1/19 (MBIA Insured) | 1,000,000 | | 1,089,920 |
Southern Minnesota Muni. Pwr. Agcy. Pwr. Supply Sys. Rev.: | | | |
Series 1994 A, 0% 1/1/21 (MBIA Insured) | 14,670,000 | | 7,476,712 |
Series 2002 A: | | | |
5% 1/1/10 (AMBAC Insured) | 1,620,000 | | 1,750,799 |
5% 1/1/12 (AMBAC Insured) | 2,660,000 | | 2,925,362 |
Municipal Bonds - continued |
| Principal
Amount | | Value
(Note 1) |
Minnesota - continued |
Southern Minnesota Muni. Pwr. Agcy. Pwr. Supply Sys. Rev.: - continued | | | |
Series A: | | | |
0% 1/1/19 (MBIA Insured) | $ 5,210,000 | | $ 2,943,077 |
5% 1/1/10 (MBIA Insured) | 2,720,000 | | 2,939,613 |
5.25% 1/1/15 (AMBAC Insured) | 1,000,000 | | 1,131,600 |
5.25% 1/1/16 (AMBAC Insured) | 3,360,000 | | 3,824,890 |
Spring Lake Park Ind. School District #16 Series B: | | | |
5% 2/1/15 (MBIA Insured) | 2,085,000 | | 2,289,893 |
5% 2/1/16 (MBIA Insured) | 2,230,000 | | 2,446,042 |
5% 2/1/17 (MBIA Insured) | 2,400,000 | | 2,620,848 |
Suburban Hennepin Reg'l. Park District 5% 2/1/12 | 1,000,000 | | 1,061,970 |
Virginia Hsg. & Redev. Auth. Health Care Facility Lease Rev. 5.25% 10/1/25 | 440,000 | | 455,470 |
Waconia Independent School District #110 Series A: | | | |
5% 2/1/09 (FSA Insured) | 850,000 | | 909,798 |
5% 2/1/10 (FSA Insured) | 900,000 | | 974,709 |
Washington County Gen. Oblig. 5.5% 2/1/21 (Pre-Refunded to 2/1/10 @ 100) (c) | 1,450,000 | | 1,591,462 |
Wayzata Ind. School District #284 Series B, 5% 2/1/16
(FSA Insured) | 1,005,000 | | 1,119,741 |
Western Minnesota Muni. Pwr. Agcy. Pwr. Supply Rev. Series A: | | | |
5% 1/1/30 (MBIA Insured) | 3,000,000 | | 3,162,630 |
5.4% 1/1/09 (AMBAC Insured) | 4,325,000 | | 4,465,303 |
5.5% 1/1/11 (AMBAC Insured) | 1,000,000 | | 1,032,870 |
5.5% 1/1/12 (AMBAC Insured) | 1,000,000 | | 1,032,870 |
6.375% 1/1/16 (Escrowed to Maturity) (c) | 1,415,000 | | 1,623,996 |
Western Minnesota Muni. Pwr. Agcy. Transmission Rev.
Series A, 5.5% 1/1/09 (AMBAC Insured) | 1,000,000 | | 1,082,850 |
Willmar Independent School District #347 Series A, 5% 2/1/11 (MBIA Insured) (a) | 2,000,000 | | 2,156,560 |
| | 335,619,814 |
Puerto Rico - 4.4% |
Puerto Rico Commonwealth Hwy. & Trans. Auth. Hwy. Rev. Series Y, 5.5% 7/1/36 (FSA Insured) | 2,680,000 | | 3,091,273 |
Puerto Rico Commonwealth Hwy. & Trans. Auth. Trans. Rev. Series D, 5.25% 7/1/38 | 2,500,000 | | 2,655,950 |
Puerto Rico Commonwealth Infrastructure Fing. Auth.
Series 2000 A: | | | |
5.5% 10/1/32 (Escrowed to Maturity) (c) | 3,700,000 | | 4,084,726 |
Municipal Bonds - continued |
| Principal
Amount | | Value
(Note 1) |
Puerto Rico - continued |
Puerto Rico Commonwealth Infrastructure Fing. Auth. Series 2000 A: - continued | | | |
5.5% 10/1/40 (Escrowed to Maturity) (c) | $ 1,500,000 | | $ 1,652,190 |
Puerto Rico Elec. Pwr. Auth. Pwr. Rev. Series HH, 5.25% 7/1/29 (FSA Insured) | 3,700,000 | | 4,012,613 |
| | 15,496,752 |
TOTAL INVESTMENT PORTFOLIO - 99.1% (Cost $333,062,603) | | 351,116,566 |
NET OTHER ASSETS - 0.9% | | 3,143,745 |
NET ASSETS - 100% | $ 354,260,311 |
Legend |
(a) Security or a portion of the security purchased on a delayed delivery or when-issued basis. |
(b) Private activity obligations whose interest is subject to the federal alternative minimum tax for individuals. |
(c) Security collateralized by an amount sufficient to pay interest and principal. |
Other Information |
The distribution of municipal securities by revenue source, as a percentage of total net assets, is as follows: |
General Obligations | 44.8% |
Electric Utilities | 15.7% |
Health Care | 13.2% |
Escrowed/Pre-Refunded | 12.2% |
Transportation | 5.9% |
Others* (individually less than 5%) | 8.2% |
| 100.0% |
*Includes net other assets |
See accompanying notes which are an integral part of the financial statements.
Semiannual Report
Financial Statements
Statement of Assets and Liabilities
| June 30, 2005 (Unaudited) |
| | |
Assets | | |
Investment in securities, at value (cost $333,062,603) - See accompanying schedule | | $ 351,116,566 |
Cash | | 87,188 |
Receivable for fund shares sold | | 81,031 |
Interest receivable | | 5,791,093 |
Prepaid expenses | | 735 |
Other receivables | | 3,615 |
Total assets | | 357,080,228 |
| | |
Liabilities | | |
Payable for investments purchased
Regular delivery | $ 34,841 | |
Delayed delivery | 2,125,316 | |
Payable for fund shares redeemed | 162,171 | |
Distributions payable | 334,654 | |
Accrued management fee | 110,402 | |
Other affiliated payables | 32,113 | |
Other payables and accrued expenses | 20,420 | |
Total liabilities | | 2,819,917 |
| | |
Net Assets | | $ 354,260,311 |
Net Assets consist of: | | |
Paid in capital | | $ 335,536,545 |
Undistributed net investment income | | 13,075 |
Accumulated undistributed net realized gain (loss) on investments | | 656,728 |
Net unrealized appreciation (depreciation) on investments | | 18,053,963 |
Net Assets, for 30,445,138 shares outstanding | | $ 354,260,311 |
Net Asset Value, offering price and redemption price per share ($354,260,311 ÷ 30,445,138 shares) | | $ 11.64 |
See accompanying notes which are an integral part of the financial statements.
Semiannual Report
Statement of Operations
| Six months ended June 30, 2005 (Unaudited) |
| | |
Investment Income | | |
Interest | | $ 7,896,655 |
| | |
Expenses | | |
Management fee | $ 666,052 | |
Transfer agent fees | 142,349 | |
Accounting fees and expenses | 44,509 | |
Independent trustees' compensation | 823 | |
Custodian fees and expenses | 2,964 | |
Registration fees | 18,577 | |
Audit | 22,400 | |
Legal | 6,789 | |
Miscellaneous | 2,074 | |
Total expenses before reductions | 906,537 | |
Expense reductions | (41,496) | 865,041 |
Net investment income | | 7,031,614 |
Realized and Unrealized Gain (Loss) Net realized gain (loss) on investment securities | | 996,999 |
Change in net unrealized appreciation (depreciation) on investment securities | | (284,627) |
Net gain (loss) | | 712,372 |
Net increase (decrease) in net assets resulting from operations | | $ 7,743,986 |
See accompanying notes which are an integral part of the financial statements.
Semiannual Report
Financial Statements - continued
Statement of Changes in Net Assets
| Six months ended
June 30, 2005
(Unaudited) | Year ended
December 31,
2004 |
Increase (Decrease) in Net Assets | | |
Operations | | |
Net investment income | $ 7,031,614 | $ 13,743,859 |
Net realized gain (loss) | 996,999 | 902,606 |
Change in net unrealized appreciation (depreciation) | (284,627) | (1,632,305) |
Net increase (decrease) in net assets resulting
from operations | 7,743,986 | 13,014,160 |
Distributions to shareholders from net investment income | (7,084,763) | (13,769,100) |
Distributions to shareholders from net realized gain | (92,958) | (1,709,461) |
Total distributions | (7,177,721) | (15,478,561) |
Share transactions
Proceeds from sales of shares | 26,775,201 | 59,618,414 |
Reinvestment of distributions | 5,077,239 | 11,248,140 |
Cost of shares redeemed | (33,620,813) | (56,824,374) |
Net increase (decrease) in net assets resulting from share transactions | (1,768,373) | 14,042,180 |
Redemption fees | 1,199 | 3,041 |
Total increase (decrease) in net assets | (1,200,909) | 11,580,820 |
| | |
Net Assets | | |
Beginning of period | 355,461,220 | 343,880,400 |
End of period (including undistributed net investment income of $13,075 and undistributed net investment income of $93,606, respectively) | $ 354,260,311 | $ 355,461,220 |
Other Information Shares | | |
Sold | 2,309,278 | 5,142,342 |
Issued in reinvestment of distributions | 437,921 | 970,372 |
Redeemed | (2,903,720) | (4,926,194) |
Net increase (decrease) | (156,521) | 1,186,520 |
See accompanying notes which are an integral part of the financial statements.
Semiannual Report
Financial Highlights
| Six months ended June 30, 2005 | Years ended December 31, |
| (Unaudited) | 2004 | 2003 | 2002 | 2001 | 2000 |
Selected Per-Share Data | | | | | |
Net asset value, beginning of period | $ 11.62 | $ 11.69 | $ 11.62 | $ 11.19 | $ 11.20 | $ 10.63 |
Income from Investment Operations | | | | | | |
Net investment income D | .229 | .458 | .467 | .509 | .529 F | .529 |
Net realized and unrealized gain (loss) | .025 | (.012) | .133 | .431 | (.016) F | .568 |
Total from investment operations | .254 | .446 | .600 | .940 | .513 | 1.097 |
Distributions from net investment income | (.231) | (.459) | (.464) | (.510) | (.523) | (.527) |
Distributions from net realized gain | (.003) | (.057) | (.066) | - | - | - |
Total distributions | (.234) | (.516) | (.530) | (.510) | (.523) | (.527) |
Redemption fees added to paid in capital | - D, G | - D, G | - D, G | - D, G | - D, G | - |
Net asset value,
end of period | $ 11.64 | $ 11.62 | $ 11.69 | $ 11.62 | $ 11.19 | $ 11.20 |
Total Return B, C | 2.21% | 3.92% | 5.27% | 8.57% | 4.64% | 10.62% |
Ratios to Average Net Assets E | | | | | |
Expenses before expense reductions | .51% A | .51% | .51% | .51% | .51% | .52% |
Expenses net of voluntary waivers, if any | .51% A | .51% | .51% | .51% | .51% | .52% |
Expenses net of all reductions | .49% A | .49% | .49% | .49% | .46% | .46% |
Net investment income | 3.98% A | 3.95% | 4.00% | 4.45% | 4.69% F | 4.90% |
Supplemental Data | | | | | |
Net assets,
end of period
(000 omitted) | $ 354,260 | $ 355,461 | $ 343,880 | $ 344,435 | $ 316,371 | $ 293,666 |
Portfolio turnover rate | 18% A | 12% | 15% | 25% | 7% | 18% |
A Annualized
B Total returns for periods of less than one year are not annualized.
C Total returns would have been lower had certain expenses not been reduced during the periods shown.
D Calculated based on average shares outstanding during the period.
E Expense ratios reflect operating expenses of the fund. Expenses before reductions do not reflect amounts reimbursed by the investment adviser or reductions from brokerage service arrangements or other expense offset arrangements and do not represent the amount paid by the fund during periods when reimbursements or reductions occur. Expenses net of any voluntary waivers reflect expenses after reimbursement by the investment adviser but prior to reductions from brokerage service arrangements or other expense offset arrangements. Expenses net of all reductions represent the net expenses paid by the fund.
F Effective January 1, 2001, the fund adopted the provisions of the AICPA Audit and Accounting Guide for Investment Companies and began amortizing premium and discount on all debt securities. Per-share data and ratios for periods prior to adoption have not been restated to reflect this change.
G Amount represents less than $.001 per share.
See accompanying notes which are an integral part of the financial statements.
Semiannual Report
Notes to Financial Statements
For the period ended June 30, 2005 (Unaudited)
1. Significant Accounting Policies.
Spartan Minnesota Municipal Income Fund (the fund) is a non-diversified fund of Fidelity Municipal Trust (the trust) and is authorized to issue an unlimited number of shares. On July 21, 2005, the Board of Trustees approved a change in the name of Spartan Minnesota Municipal Income Fund to Fidelity Minnesota Municipal Income Fund effective August 15, 2005. The trust is registered under the Investment Company Act of 1940, as amended (the 1940 Act), as an open-end management investment company organized as a Massachusetts business trust. The fund may be affected by economic and political developments in the state of Minnesota. The financial statements have been prepared in conformity with accounting principles generally accepted in the United States of America, which require management to make certain estimates and assumptions at the date of the financial statements. The following summarizes the significant accounting policies of the fund:
Security Valuation. Net asset value per share (NAV calculation) is calculated as of the close of business of the New York Stock Exchange, normally 4:00 p.m. Eastern time. Debt securities, including restricted securities, are valued on the basis of information provided by a pricing service. Pricing services use valuation matrices that incorporate both dealer-supplied valuations and valuation models. If prices are not readily available or do not accurately reflect fair value for a security, or if a security's value has been materially affected by events occurring after the close of the exchange or market on which the security is principally traded, that security may be valued by another method that the Board of Trustees believes accurately reflects fair value. A security's valuation may differ depending on the method used for determining value. Price movements in futures contracts and ADRs, market and trading trends, the bid/ask quotes of brokers and off-exchange institutional trading may be reviewed in the course of making a good faith determination of a security's fair value. Short-term securities with remaining maturities of sixty days or less for which quotations are not readily available are valued on the basis of amortized cost. Investments in open-end investment companies are valued at their net asset value each business day.
Investment Transactions and Income. Security transactions are accounted for as of trade date. Gains and losses on securities sold are determined on the basis of identified cost. Interest income is accrued as earned. Interest income includes coupon interest and amortization of premium and accretion of discount on debt securities.
Expenses. Most expenses of the trust can be directly attributed to a fund. Expenses which cannot be directly attributed are apportioned among each fund in the trust.
Income Tax Information and Distributions to Shareholders. Each year, the fund intends to qualify as a regulated investment company by distributing all of its taxable income and realized gains under Subchapter M of the Internal Revenue Code. As a result, no provision for income taxes is required in the accompanying financial statements.
Semiannual Report
1. Significant Accounting Policies - continued
Income Tax Information and Distributions to Shareholders - continued
Dividends are declared daily and paid monthly from net investment income. Distributions from realized gains, if any, are recorded on the ex-dividend date. Income and capital gain distributions are determined in accordance with income tax regulations, which may differ from generally accepted accounting principles. In addition, the fund claimed a portion of the payment made to redeeming shareholders as a distribution for income tax purposes. Capital accounts within the financial statements are adjusted for permanent book-tax differences. These adjustments have no impact on net assets or the results of operations. Temporary book-tax differences will reverse in a subsequent period.
Book-tax differences are primarily due to market discount and losses deferred due to futures transactions.
The fund purchases municipal securities whose interest, in the opinion of the issuer, is free from federal income tax. There is no assurance that the Internal Revenue Service (IRS) will agree with this opinion. In the event the IRS determines that the issuer does not comply with relevant tax requirements, interest payments from a security could become federally taxable, possibly retroactively to the date the security was issued.
The federal tax cost of investments and unrealized appreciation (depreciation) as of period end were as follows:
Unrealized appreciation | $ 18,308,604 | |
Unrealized depreciation | (97,407) | |
Net unrealized appreciation (depreciation) | $ 18,211,197 | |
Cost for federal income tax purposes | $ 332,905,369 | |
Short-Term Trading (Redemption) Fees. Shares held in the fund less than 30 days are subject to a redemption fee equal to .50% of the proceeds of the redeemed shares. All redemption fees, including any estimated redemption fees paid by Fidelity Management & Research Company (FMR), are retained by the fund and accounted for as an addition to paid in capital.
2. Operating Policies.
Delayed Delivery Transactions and When-Issued Securities. The fund may purchase or sell securities on a delayed delivery or when-issued basis. Payment and delivery may take place after the customary settlement period for that security. The price of the underlying securities and the date when the securities will be delivered and paid for are fixed at the time the transaction is negotiated. During the time a delayed delivery sell is outstanding, the contract is marked-to-market daily and equivalent deliverable securities are held for the transaction. The value of the securities purchased on a
Semiannual Report
Notes to Financial Statements (Unaudited) - continued
2. Operating Policies - continued
Delayed Delivery Transactions and When-Issued Securities - continued
delayed delivery or when-issued basis are identified as such in the fund's Schedule of Investments. The fund may receive compensation for interest forgone in the purchase of a delayed delivery or when-issued security. With respect to purchase commitments, the fund identifies securities as segregated in its records with a value at least equal to the amount of the commitment. Losses may arise due to changes in the value of the underlying securities or if the counterparty does not perform under the contract's terms, or if the issuer does not issue the securities due to political, economic, or other factors.
3. Purchases and Sales of Investments.
Purchases and sales of securities, other than short-term securities and U.S. government securities, aggregated $32,016,544 and $32,748,899, respectively.
4. Fees and Other Transactions with Affiliates.
Management Fee. FMR and its affiliates provide the fund with investment management related services for which the fund pays a monthly management fee. The management fee is the sum of an individual fund fee rate that is based on an annual rate of .25% of the fund's average net assets and a group fee rate that averaged .12% during the period. The group fee rate is based upon the average net assets of all the mutual funds advised by FMR. The group fee rate decreases as assets under management increase and increases as assets under management decrease. For the period, the total annualized management fee rate was .38% of the fund's average net assets.
Transfer Agent and Accounting Fees. Citibank, N.A. (Citibank) is the custodian, transfer agent and shareholder servicing agent for the fund. Citibank has entered into a sub-arrangement with Fidelity Service Company, Inc. (FSC), an affiliate of FMR, under which FSC performs the activities associated with the fund's transfer and shareholder servicing agent and accounting functions. The fund pays account fees and asset-based fees that vary according to account size and type of account. FSC pays for typesetting, printing and mailing of shareholder reports, except proxy statements. The accounting fee is based on the level of average net assets for the month. For the period, the transfer agent fees were equivalent to an annualized rate of .08% of average net assets.
Semiannual Report
5. Committed Line of Credit.
The fund participates with other funds managed by FMR in a $4.2 billion credit facility (the "line of credit") to be utilized for temporary or emergency purposes to fund shareholder redemptions or for other short-term liquidity purposes. The fund has agreed to pay commitment fees on its pro rata portion of the line of credit. During the period, there were no borrowings on this line of credit.
6. Expense Reductions.
Through arrangements with the fund's custodian and transfer agent, credits realized as a result of uninvested cash balances were used to reduce the fund's expenses. During the period, these credits reduced the fund's custody and transfer agent expenses by $2,922 and $38,574, respectively.
7. Other.
The fund's organizational documents provide former and current trustees and officers with a limited indemnification against liabilities arising in connection with the performance of their duties to the fund. In the normal course of business, the fund may also enter into contracts that provide general indemnifications. The fund's maximum exposure under these arrangements is unknown as this would be dependent on future claims that may be made against the fund. The risk of material loss from such claims is considered remote.
Semiannual Report
Board Approval of Investment Advisory Contracts and Management Fees
Spartan Minnesota Municipal Income Fund
Each year, typically in June, the Board of Trustees, including the independent Trustees (together, the Board), votes on the renewal of the management contract and sub-advisory agreements (together, the Advisory Contracts) for the fund. The Board, assisted by the advice of fund counsel and independent Trustees' counsel, requests and considers a broad range of information throughout the year.
The Board meets regularly each month except August and takes into account throughout the year matters bearing on Advisory Contracts. The Board, acting directly and through its separate committees, considers at each of its meetings factors that are relevant to the annual renewal of the fund's Advisory Contracts, including the services and support provided to the fund and its shareholders by Fidelity. At the time of the renewal, the Board had 11 standing committees, each composed of independent Trustees with varying backgrounds, to which the Board has assigned specific subject matter responsibilities in order to enhance effective decision-making by the Board. Each committee has adopted a written charter outlining the structure and purposes of the committee. One such committee, the Fixed-Income Contract Committee, meets periodically during the first six months of each year and as necessary to consider matters specifically related to the annual renewal of Advisory Contracts. The committee requests and receives information on, and makes recommendations to the independent Trustees concerning, the approval and annual review of the Advisory Contracts.
At its June 2005 meeting, the Board of Trustees, including the independent Trustees, unanimously determined to renew the Advisory Contracts for the fund. In reaching its determination, the Board considered all factors it believed relevant, including (1) the nature, extent, and quality of the services to be provided to the fund and its shareholders by Fidelity (including the investment performance of the fund); (2) the competitiveness of the management fee and total expenses of the fund; (3) the total costs of the services to be provided by and the profits to be realized by the investment adviser and its affiliates from the relationship with the fund; (4) the extent to which economies of scale would be realized as the fund grows; and (5) whether fee levels reflect these economies of scale, if any, for the benefit of fund shareholders.
In determining whether to renew the Advisory Contracts for the fund, the Board ultimately reached a determination, with the assistance of fund counsel and independent Trustees' counsel, that the renewal of the Advisory Contracts and the compensation to be received by Fidelity under the management contract is consistent with Fidelity's fiduciary duty under applicable law. In addition to evaluating the specific factors noted above, the Board, in reaching its determination, is aware that shareholders in the fund have a broad range of investment choices available to them, including a wide choice among mutual funds offered by competitors to Fidelity, and that the fund's shareholders,
Semiannual Report
with the opportunity to review and weigh the disclosure provided by the fund in its prospectus and other public disclosures, have chosen to invest in this fund, managed by Fidelity.
Nature, Extent, and Quality of Services Provided by Fidelity. The Board considered staffing within the investment adviser, FMR, and the sub-advisers (together, the Investment Advisers), including the background of the fund's portfolio manager and the fund's investment objective and discipline. The independent Trustees also had discussions with senior management of Fidelity's investment operations and investment groups. The Board considered the structure of the portfolio manager compensation program and whether this structure provides appropriate incentives.
Fidelity Resources Dedicated to Investment Management and Support Services. The Board reviewed the size, education, and experience of the Investment Advisers' investment staff, their use of technology, and the Investment Advisers' approach to recruiting, training, and retaining portfolio managers and other research, advisory, and management personnel. The Board considered Fidelity's extensive global research capabilities that enable the Investment Advisers to aggregate data from various sources in an effort to produce positive investment results. The Board noted that Fidelity's analysts have access to a variety of technological tools that enable them to perform both fundamental and quantitative analysis and to specialize in various disciplines. The Board also considered that Fidelity's portfolio managers and analysts have access to daily portfolio attribution that allows for monitoring of a fund's portfolio, as well as an electronic communication system that provides immediate real-time access to research concerning issuers and credit enhancers.
Shareholder and Administrative Services. The Board considered the nature, extent, quality, and cost of administrative, distribution, and shareholder services performed by the Investment Advisers and their affiliates under the Advisory Contracts and under separate agreements covering transfer agency and pricing and bookkeeping services for the fund. The Board also considered the nature and extent of the Investment Advisers' supervision of third party service providers, principally custodians and subcustodians. The Board reviewed the allocation of fund brokerage, including allocations to brokers affiliated with the Investment Advisers. The Board also considered the resources devoted to, and the record of compliance with, the fund's compliance policies and procedures.
The Board noted that the growth of fund assets across the complex allows Fidelity to reinvest in the development of services designed to enhance the value or convenience of the Fidelity funds as investment vehicles. These services include 24-hour access to account information and market information through phone representatives and over the Internet, and investor education materials and asset allocation tools.
Investment in a Large Fund Family. The Board considered the benefits to shareholders of investing in a Fidelity fund, including the benefits of investing in a fund that is part of a large family of funds offering a variety of investment disciplines and providing for a large variety of mutual fund investor services. For example, fund shareholders are offered the privilege of exchanging shares of the fund for shares of other Fidelity funds, as set forth in the fund's prospectus, without paying a sales charge. The Board noted that, since the last Advisory Contract renewals in June 2004, Fidelity has taken a number of actions that benefited particular funds, including (i) voluntarily deciding in 2004 to stop using "soft" commission dollars to pay for market data and, instead, to pay for that data out of its own resources, (ii) contractually agreeing to impose management fee reductions and expense limitations on its five Spartan stock index funds and its stock index fund available through variable insurance products, (iii) contractually agreeing to eliminate the management fees on the Fidelity Freedom Funds and the Fidelity Advisor Freedom Funds, (iv) contractually agreeing to reduce the management fees on most of its investment-grade taxable bond funds, and (v) contractually agreeing to impose expense limitations on its retail and Spartan investment-grade taxable bond funds.
Semiannual Report
Board Approval of Investment Advisory Contracts and
Management Fees - continued
Investment Performance. The Board considered whether the fund has operated within its investment objective, as well as its record of compliance with its investment restrictions. It also reviewed the fund's absolute investment performance, as well as the fund's relative investment performance measured against (i) a broad-based securities market index, and (ii) a peer group of mutual funds deemed appropriate by the Board over multiple periods. The following charts considered by the Board show, over the one-, three-, and five-year periods ended December 31, 2004, the fund's returns, the returns of a broad-based securities market index ("benchmark"), and a range of returns of a peer group of mutual funds identified by Lipper Inc. as having an investment objective similar to that of the fund. The box within each chart shows the 25th percentile return (bottom of box) and the 75th percentile return (top of box) of the Lipper peer group. The percentage beaten number noted below each chart corresponds to the percentile box and represents the percentage of funds in the Lipper peer group whose performance was equal to or lower than that of the fund.
Semiannual Report
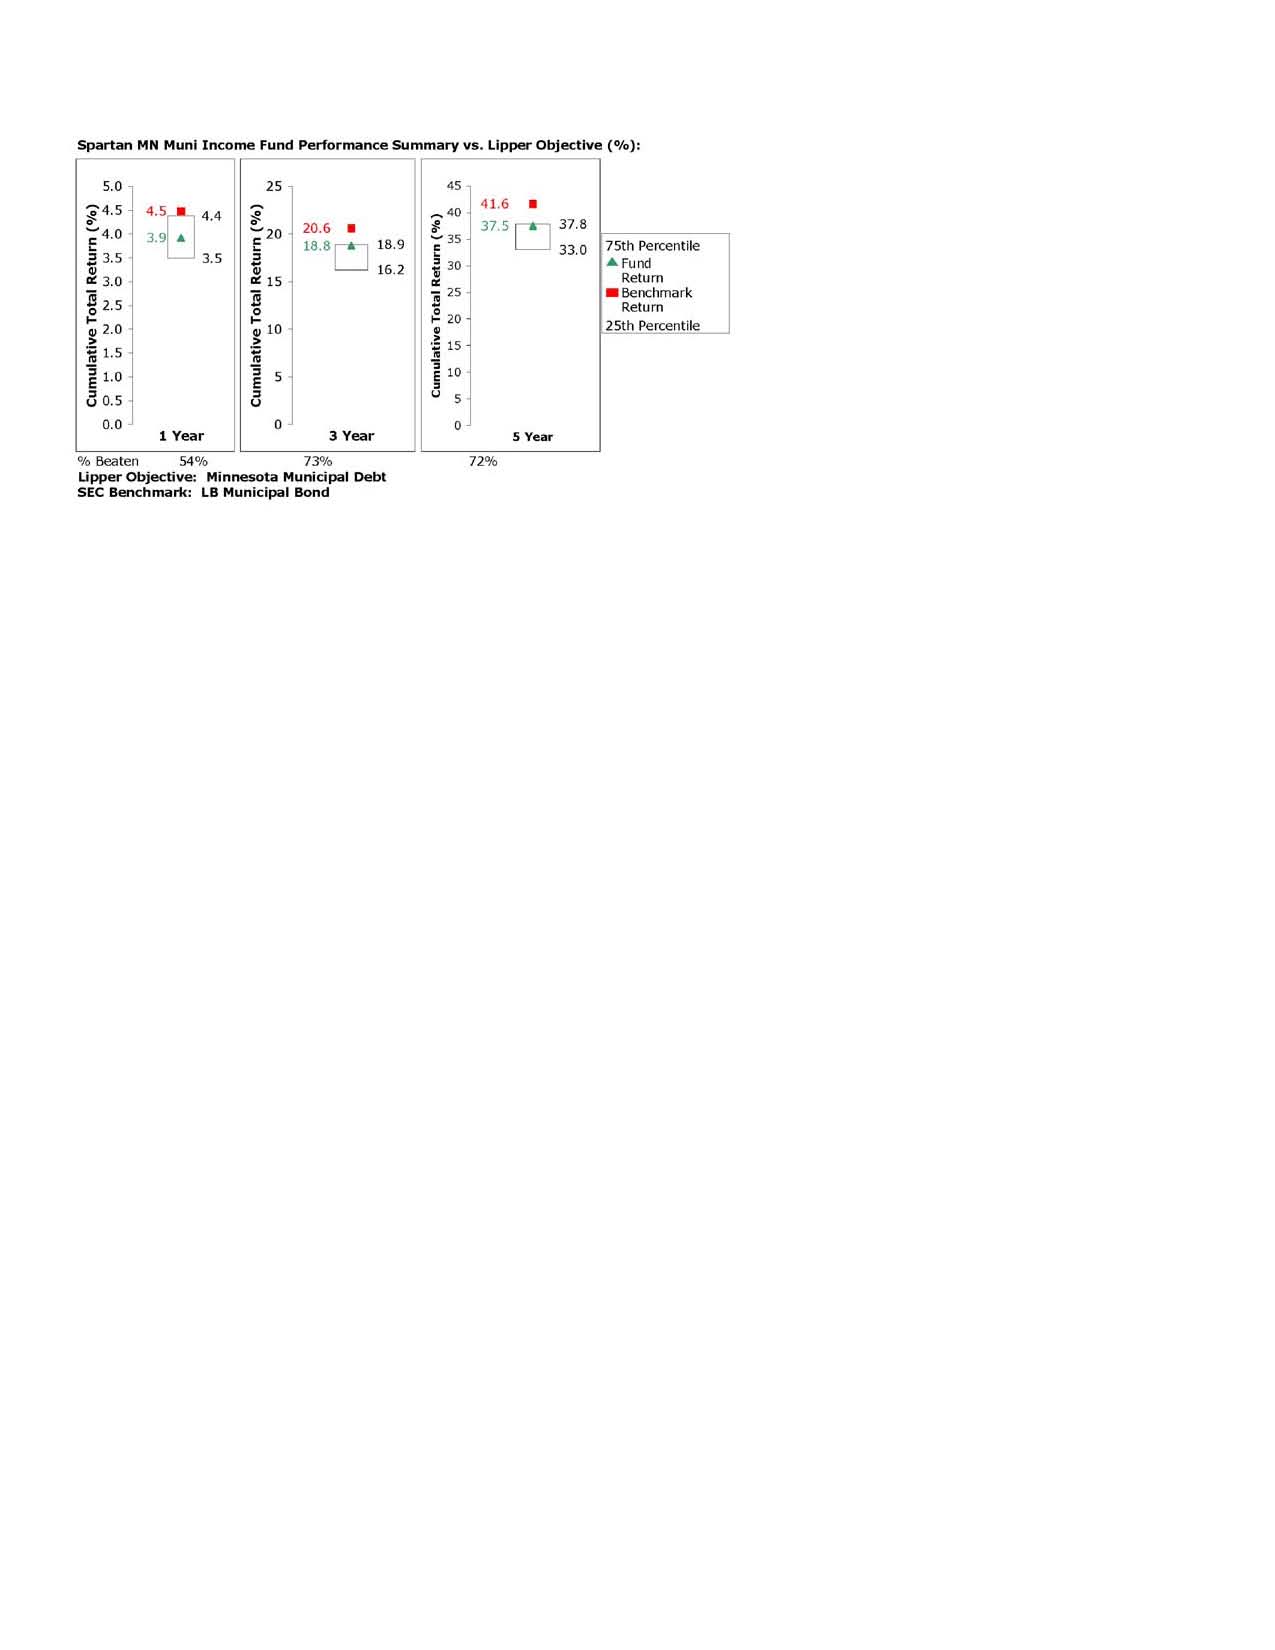
The Board noted that the relative investment performance of the fund has compared favorably to its Lipper peer group over time. The Board also noted that the relative investment performance of the fund was lower than its benchmark over time.
Based on its review, and giving particular weight to the nature and quality of the resources dedicated by the Investment Advisers to maintain and improve relative performance, the Board concluded that the nature, extent, and quality of the services provided by Fidelity will benefit the fund's shareholders, particularly in light of the Board's view that the fund's shareholders benefit from investing in a fund that is part of a large family of funds offering a variety of investment disciplines and services.
Competitiveness of Management Fee and Total Fund Expenses. The Board considered the fund's management fee and total expenses compared to "mapped groups" of competitive funds and classes. Fidelity creates "mapped groups" by combining similar Lipper investment objective categories that have comparable management fee characteristics. Combining Lipper investment objective categories aids the Board's management fee and total expense comparisons by broadening the competitive group used for comparison and by reducing the number of universes to which various Fidelity funds are compared.
The Board considered two proprietary management fee comparisons for the 12-month periods shown in the chart below. The group of Lipper funds used by the Board for management fee comparisons is referred to below as the "Total Mapped Group" and, for the reasons explained above, is broader than the Lipper peer group used by the Board for performance comparisons. The Total Mapped Group comparison focuses on a fund's standing relative to the total universe of comparable funds available to investors, in terms of gross management fees before expense reimbursements or caps. "TMG %" represents the percentage of funds in the Total Mapped Group that had management fees that were lower than the fund's. For example, a TMG % of 8% would mean that 92% of the funds in the Total Mapped Group had higher management fees than the fund. The "Asset-Size Peer Group" (ASPG) comparison focuses on a fund's standing relative to non-Fidelity funds similar in size to the fund within the Total Mapped Group. The ASPG represents at least 15% of the funds in the Total Mapped Group with comparable asset size and management fee characteristics, subject to a minimum of 50 funds (or all funds in the Total Mapped Group if fewer than 50). Additional information, such as the ASPG quartile ("quadrant") in which the fund's management fee ranked, is also included in the chart and considered by the Board.
Semiannual Report
Board Approval of Investment Advisory Contracts and
Management Fees - continued
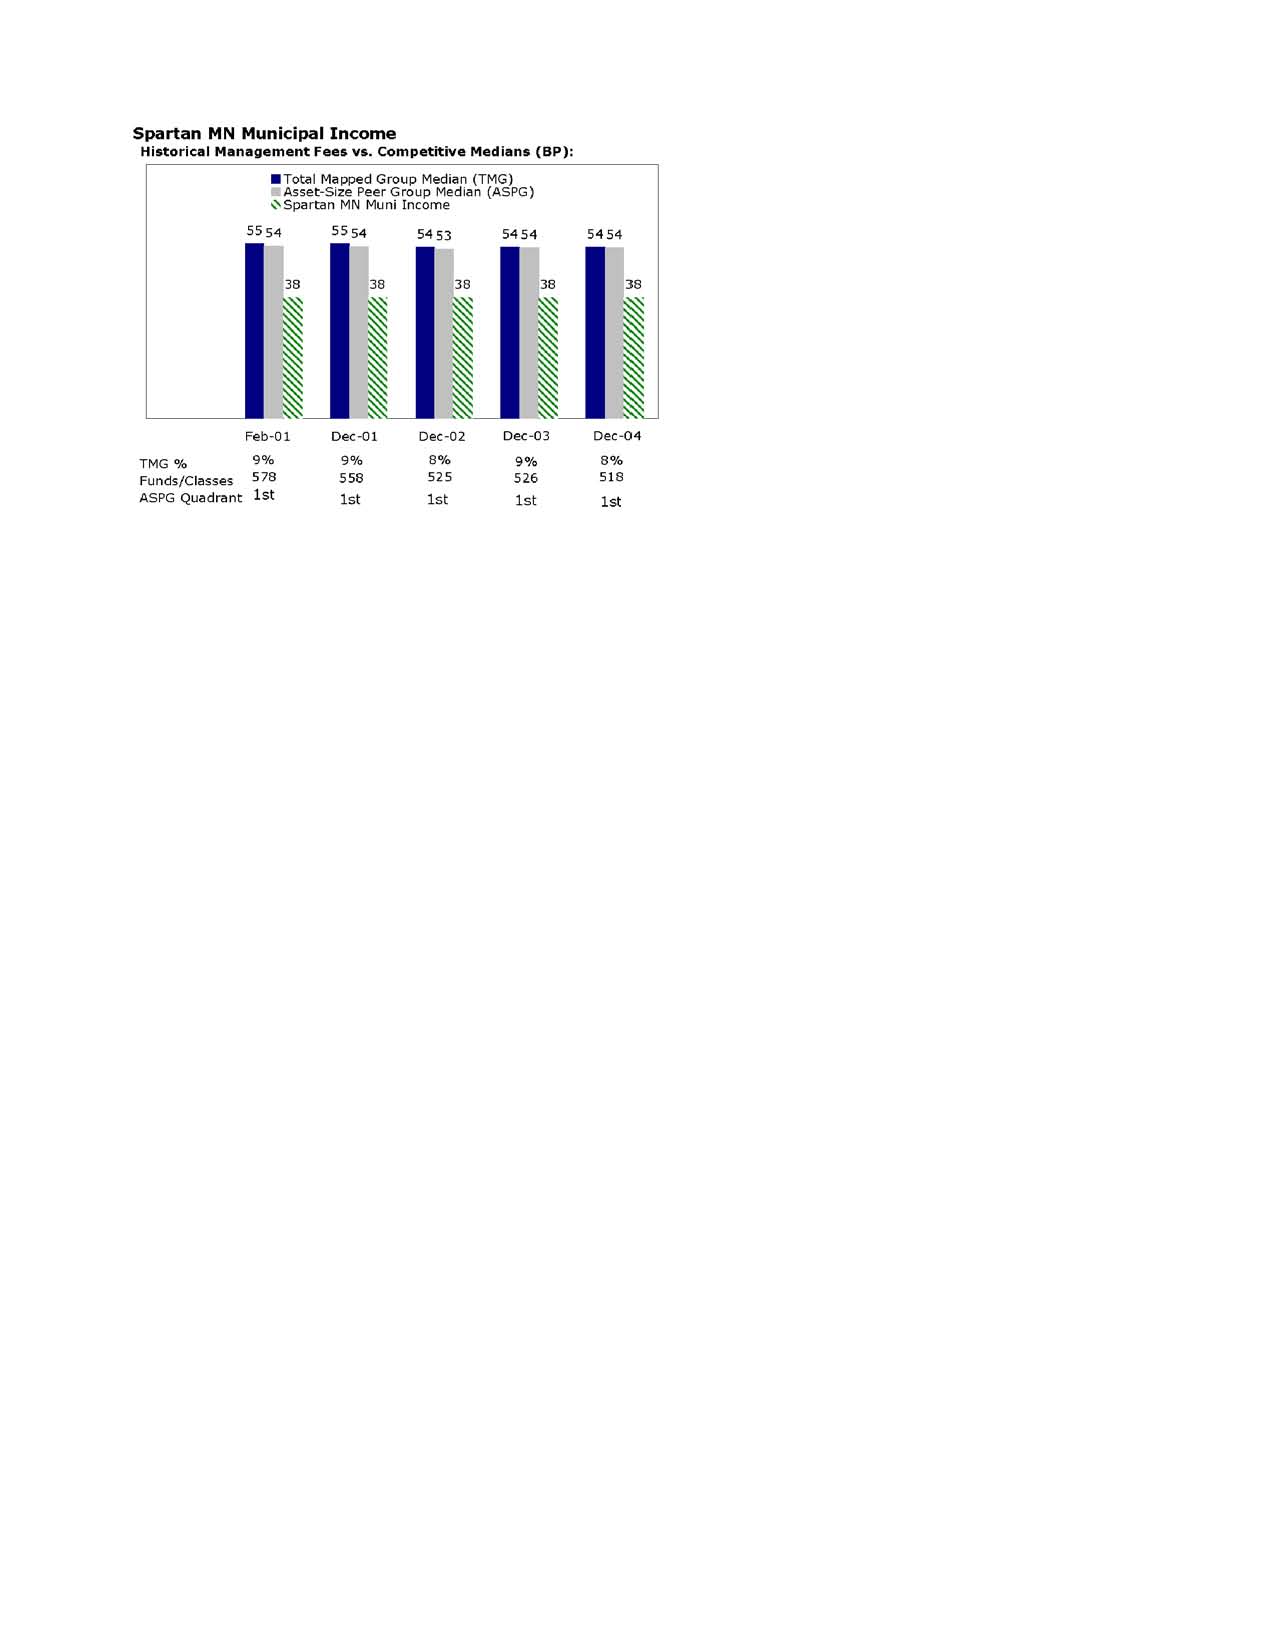
The Board noted that the fund's management fee ranked below the median of its Total Mapped Group and below the median of its ASPG for 2004. Based on its review, the Board concluded that the fund's management fee was fair and reasonable in light of the services that the fund receives and the other factors considered.
In its review of the fund's total expenses, the Board considered the fund's management fee as well as other fund expenses, such as transfer agent fees, pricing and bookkeeping fees, and custodial, legal, and audit fees. The Board also noted the effects of any waivers and reimbursements on fees and expenses. As part of its review, the Board also considered current and historical total expenses of the fund compared to competitive fund median expenses. The fund is compared to those funds and classes in the Total Mapped Group (used by the Board for management fee comparisons) that have a similar sales load structure.
Semiannual Report
The Board noted that the fund's total expenses ranked below its competitive median for 2004.
In its review of total expenses, the Board also considered Fidelity fee structures and other information on clients that FMR and its affiliates service in other competitive markets, such as other mutual funds advised or subadvised by FMR or its affiliates, pension plan clients, and other institutional clients.
Based on its review, the Board concluded that the fund's total expenses were reasonable in light of the services that the fund and its shareholders receive and the other factors considered.
Costs of the Services and Profitability. The Board considered the revenues earned and the expenses incurred by Fidelity in conducting the business of developing, marketing, distributing, managing, administering and servicing the fund and its shareholders. The Board also considered the level of Fidelity's profits in respect of all the Fidelity funds.
On an annual basis, FMR presents to the Board Fidelity's profitability for the fund. Fidelity calculates the profitability for each fund, as well as aggregate profitability for groups of Fidelity funds and all Fidelity funds, using a series of detailed revenue and cost allocation methodologies which originate with the audited books and records of Fidelity. The Audit Committee of the Board reviews any significant changes from the prior year's methodologies.
PricewaterhouseCoopers LLP (PwC), independent registered accounting firm and auditor to Fidelity and certain Fidelity funds, has been engaged annually by the Board as part of the Board's assessment of the results of Fidelity's profitability analysis. PwC's engagement includes the review and assessment of Fidelity's methodologies used in determining the revenues and expenses attributable to Fidelity's mutual fund business, and completion of agreed-upon procedures surrounding the mathematical accuracy of fund profitability and its conformity to allocation methodologies. After considering PwC's reports issued under the engagement and information provided by Fidelity, the Board believes that while other allocation methods may also be reasonable, Fidelity's profitability methodologies are reasonable in all material respects.
The Board has also reviewed Fidelity's non-fund businesses and any fall-out benefits related to the mutual fund business as well as cases where Fidelity's affiliates may benefit from or be related to the fund's business. In addition, a special committee of the Board reviewed services provided to Fidelity by its affiliates and determined that the fees that Fidelity paid for such services were reasonable.
The Board considered the costs of the services provided by and the profits realized by Fidelity in connection with the operation of the fund and determined that the amount of profit is a fair entrepreneurial profit for the management of the fund.
Semiannual Report
Board Approval of Investment Advisory Contracts and
Management Fees - continued
Economies of Scale. The Board considered whether there have been economies of scale in respect of the management of the Fidelity funds, whether the Fidelity funds (including the fund) have appropriately benefited from any such economies of scale, and whether there is potential for realization of any further economies of scale. The Board considered the extent to which the fund will benefit from economies of scale through increased services to the fund, through waivers or reimbursements, or through fee or expense reductions, including reductions that occur through operation of the transfer agent agreement. The transfer agent fee varies in part based on the number of accounts in the fund. If the number of accounts decreases or the average account size increases, the overall transfer agent fee rate decreases.
The Board recognized that the fund's management contract incorporates a "group fee" structure, which provides for lower fee rates as total fund assets under FMR's management increase, and for higher fee rates as total fund assets under FMR's management decrease. The Board considered that the group fee is designed to deliver the benefits of economies of scale to fund shareholders when total fund assets increase, even if assets of any particular fund are unchanged or have declined, because some portion of Fidelity's costs are attributable to services provided to all Fidelity funds, and all funds benefit if those costs can be allocated among more assets. The Board concluded that, given the group fee structure, fund shareholders will achieve a certain level of economies of scale as assets under FMR's management increase at the fund complex level, regardless of whether Fidelity achieves any such economies of scale.
The Board further concluded that any potential economies of scale are being shared between fund shareholders and Fidelity in an appropriate manner.
Additional Information Requested by the Board. In order to develop fully the factual basis for consideration of the Advisory Contracts, the Board requested additional information regarding (i) Fidelity's fund profitability methodology, including additional detail on various cost allocations; (ii) fall-out benefits to Fidelity; and (iii) compensation of portfolio managers and research analysts.
Based on its evaluation of all of the conclusions noted above, and after considering all material factors, the Board ultimately concluded that the existing advisory fee structures are fair and reasonable, and that the fund's existing Advisory Contracts should be renewed.
Semiannual Report
Managing Your Investments
Fidelity offers several ways to conveniently manage your personal investments via your telephone or PC. You can access your account information, conduct trades and research your investments 24 hours a day.
By Phone
Fidelity Automated Service Telephone provides a single toll-free number to access account balances, positions, quotes and trading. It's easy to navigate the service, and on your first call, the system will help you create a personal identification number (PIN) for security.
(phone_graphic)
Fidelity Automated
Service Telephone (FAST®)
1-800-544-5555
Press
1 For mutual fund and brokerage trading.
2 For quotes.*
3 For account balances and holdings.
4 To review orders and mutual
fund activity.
5 To change your PIN.
*0 To speak to a Fidelity representative.
By PC
Fidelity's web site on the Internet provides a wide range of information, including daily financial news, fund performance, interactive planning tools and news about Fidelity products and services.
(computer_graphic)
Fidelity's Web Site
www.fidelity.com
* When you call the quotes line, please remember that a fund's yield and return will vary and, except for money market funds, share price will also vary. This means that you may have a gain or loss when you sell your shares. There is no assurance that money market funds will be able to maintain a stable $1 share price; an investment in a money market fund is not insured or guaranteed by the U.S. government. Total returns are historical and include changes in share price, reinvestment of dividends and capital gains, and the effects of any sales charges.
Semiannual Report
To Visit Fidelity
For directions and hours,
please call 1-800-544-9797.
Arizona
7001 West Ray Road
Chandler, AZ
7373 N. Scottsdale Road
Scottsdale, AZ
California
815 East Birch Street
Brea, CA
1411 Chapin Avenue
Burlingame, CA
851 East Hamilton Avenue
Campbell, CA
19200 Von Karman Avenue
Irvine, CA
601 Larkspur Landing Circle
Larkspur, CA
10100 Santa Monica Blvd.
Los Angeles, CA
27101 Puerta Real
Mission Viejo, CA
73-575 El Paseo
Palm Desert, CA
251 University Avenue
Palo Alto, CA
123 South Lake Avenue
Pasadena, CA
16995 Bernardo Ctr. Drive
Rancho Bernardo, CA
1740 Arden Way
Sacramento, CA
7676 Hazard Center Drive
San Diego, CA
8 Montgomery Street
San Francisco, CA
3793 State Street
Santa Barbara, CA
21701 Hawthorne Boulevard
Torrance, CA
2001 North Main Street
Walnut Creek, CA
6300 Canoga Avenue
Woodland Hills, CA
Colorado
1625 Broadway
Denver, CO
9185 East Westview Road
Littleton, CO
Connecticut
48 West Putnam Avenue
Greenwich, CT
265 Church Street
New Haven, CT
300 Atlantic Street
Stamford, CT
29 South Main Street
West Hartford, CT
Delaware
222 Delaware Avenue
Wilmington, DE
Florida
4400 N. Federal Highway
Boca Raton, FL
121 Alhambra Plaza
Coral Gables, FL
2948 N. Federal Highway
Ft. Lauderdale, FL
1907 West State Road 434
Longwood, FL
8880 Tamiami Trail, North
Naples, FL
3550 Tamiami Trail, South
Sarasota, FL
1502 N. Westshore Blvd.
Tampa, FL
2465 State Road 7
Wellington, FL
3501 PGA Boulevard
West Palm Beach, FL
Georgia
3445 Peachtree Road, N.E.
Atlanta, GA
1000 Abernathy Road
Atlanta, GA
Illinois
One North LaSalle Street
Chicago, IL
875 North Michigan Ave.
Chicago, IL
1415 West 22nd Street
Oak Brook, IL
1700 East Golf Road
Schaumburg, IL
3232 Lake Avenue
Wilmette, IL
Indiana
4729 East 82nd Street
Indianapolis, IN
Kansas
5400 College Boulevard
Overland Park, KS
Maine
Three Canal Plaza
Portland, ME
Maryland
7315 Wisconsin Avenue
Bethesda, MD
One W. Pennsylvania Ave.
Towson, MD
Massachusetts
801 Boylston Street
Boston, MA
155 Congress Street
Boston, MA
300 Granite Street
Braintree, MA
44 Mall Road
Burlington, MA
405 Cochituate Road
Framingham, MA
416 Belmont Street
Worcester, MA
Michigan
500 E. Eisenhower Pkwy.
Ann Arbor, MI
280 Old N. Woodward Ave.
Birmingham, MI
43420 Grand River Avenue
Novi, MI
29155 Northwestern Hwy.
Southfield, MI
Minnesota
7600 France Avenue South
Edina, MN
Missouri
8885 Ladue Road
Ladue, MO
Semiannual Report
Nevada
2225 Village Walk Drive
Henderson, NV
New Jersey
150 Essex Street
Millburn, NJ
56 South Street
Morristown, NJ
396 Route 17, North
Paramus, NJ
3518 Route 1 North
Princeton, NJ
530 Highway 35
Shrewsbury, NJ
New York
1055 Franklin Avenue
Garden City, NY
37 West Jericho Turnpike
Huntington Station, NY
1271 Avenue of the Americas
New York, NY
61 Broadway
New York, NY
350 Park Avenue
New York, NY
200 Fifth Avenue
New York, NY
733 Third Avenue
New York, NY
11 Penn Plaza
New York, NY
2070 Broadway
New York, NY
1075 Northern Blvd.
Roslyn, NY
North Carolina
4611 Sharon Road
Charlotte, NC
Ohio
3805 Edwards Road
Cincinnati, OH
1324 Polaris Parkway
Columbus, OH
28699 Chagrin Boulevard
Woodmere Village, OH
Oregon
16850 SW 72nd Avenue
Tigard, OR
Pennsylvania
600 West DeKalb Pike
King of Prussia, PA
1735 Market Street
Philadelphia, PA
12001 Perry Highway
Wexford, PA
Rhode Island
47 Providence Place
Providence, RI
Tennessee
6150 Poplar Avenue
Memphis, TN
Texas
10000 Research Boulevard
Austin, TX
4001 Northwest Parkway
Dallas, TX
12532 Memorial Drive
Houston, TX
2701 Drexel Drive
Houston, TX
6500 N. MacArthur Blvd.
Irving, TX
6005 West Park Boulevard
Plano, TX
14100 San Pedro
San Antonio, TX
1576 East Southlake Blvd.
Southlake, TX
19740 IH 45 North
Spring, TX
Utah
215 South State Street
Salt Lake City, UT
Virginia
1861 International Drive
McLean, VA
Washington
411 108th Avenue, N.E.
Bellevue, WA
1518 6th Avenue
Seattle, WA
Washington, DC
1900 K Street, N.W.
Washington, DC
Wisconsin
595 North Barker Road
Brookfield, WI
Fidelity Brokerage Services, Inc., 100 Summer St., Boston, MA 02110 Member NYSE/SIPC
Semiannual Report
Investment Adviser
Fidelity Management & Research Company
Boston, MA
Investment Sub-Adviser
Fidelity Investments Money
Management Inc.
Fidelity International
Investment Advisors
Fidelity International
Investment Advisors (U.K.) Limited
General Distributor
Fidelity Distributors Corporation
Boston, MA
Transfer and Service Agents
Citibank, N.A.
New York, NY
Fidelity Service Company, Inc.
Boston, MA
Custodian
Citibank, N.A.
New York, NY
The Fidelity Telephone Connection
Mutual Fund 24-Hour Service
Exchanges/Redemptions
and Account Assistance 1-800-544-6666
Product Information 1-800-544-6666
Retirement Accounts 1-800-544-4774 (8 a.m. - 9 p.m.)
TDD Service 1-800-544-0118
for the deaf and hearing impaired
(9 a.m. - 9 p.m. Eastern time)
Fidelity Automated Service
Telephone (FAST®) (automated graphic) 1-800-544-5555
(automated graphic) Automated line for quickest service
MNF-USAN-0805
1.787786.102
(Fidelity Investment logo)(registered trademark)
Corporate Headquarters
82 Devonshire St., Boston, MA 02109
www.fidelity.com
Spartan®
Municipal Income
Fund
Semiannual Report
June 30, 2005
(2_fidelity_logos) (Registered_Trademark)
Contents
Chairman's Message | <Click Here> | Ned Johnson's message to shareholders. |
Shareholder Expense Example | <Click Here> | An example of shareholder expenses. |
Investment Changes | <Click Here> | A summary of major shifts in the fund's investments over the past six months. |
Investments | <Click Here> | A complete list of the fund's investments with their market values. |
Financial Statements | <Click Here> | Statements of assets and liabilities, operations, and changes in net assets,
as well as financial highlights. |
Notes | <Click Here> | Notes to the financial statements. |
Board Approval of Investment Advisory Contracts and Management Fees | <Click Here> | |
To view a fund's proxy voting guidelines and proxy voting record for the 12-month period ended June 30, visit www.fidelity.com/proxyvotingresults or visit the Securities and Exchange Commission's (SEC) web site at www.sec.gov. You may also call 1-800-544-8544 to request a free copy of the proxy voting guidelines.
Standard & Poor's, S&P and S&P 500 are registered service marks of The McGraw-Hill Companies, Inc. and have been licensed for use by Fidelity Distributors Corporation.
Other third party marks appearing herein are the property of their respective owners.
All other marks appearing herein are registered or unregistered trademarks or service marks of FMR Corp. or an affiliated company.
This report and the financial statements contained herein are submitted for the general information of the shareholders of the fund. This report is not authorized for distribution to prospective investors in the fund unless preceded or accompanied by an effective prospectus.
A fund files its complete schedule of portfolio holdings with the SEC for the first and third quarters of each fiscal year on Form N-Q. Forms N-Q are available on the SEC's web site at http://www.sec.gov. A fund's Forms N-Q may be reviewed and copied at the SEC's Public Reference Room in Washington, DC. Information regarding the operation of the SEC's Public Reference Room may be obtained by calling 1-800-SEC-0330. For a complete list of a fund's portfolio holdings, view the most recent quarterly holdings report, semiannual report, or annual report on Fidelity's web site at http://www.fidelity.com/holdings.
NOT FDIC INSURED · MAY LOSE VALUE · NO BANK GUARANTEE
Neither the fund nor Fidelity Distributors Corporation is a bank.
Semiannual Report
Chairman's Message
(photo_of_Edward_C_Johnson_3d)
Dear Shareholder:
During the past year or so, much has been reported about the mutual fund industry, and much of it has been more critical than I believe is warranted. Allegations that some companies have been less than forthright with their shareholders have cast a shadow on the entire industry. I continue to find these reports disturbing, and assert that they do not create an accurate picture of the industry overall. Therefore, I would like to remind everyone where Fidelity stands on these issues. I will say two things specifically regarding allegations that some mutual fund companies were in violation of the Securities and Exchange Commission's forward pricing rules or were involved in so-called "market timing" activities.
First, Fidelity has no agreements that permit customers who buy fund shares after 4 p.m. to obtain the 4 p.m. price. This is not a new policy. This is not to say that someone could not deceive the company through fraudulent acts. However, we are extremely diligent in preventing fraud from occurring in this manner - and in every other. But I underscore again that Fidelity has no so-called "agreements" that sanction illegal practices.
Second, Fidelity continues to stand on record, as we have for years, in opposition to predatory short-term trading that adversely affects shareholders in a mutual fund. Back in the 1980s, we initiated a fee - which is returned to the fund and, therefore, to investors - to discourage this activity. Further, we took the lead several years ago in developing a Fair Value Pricing Policy to prevent market timing on foreign securities in our funds. I am confident we will find other ways to make it more difficult for predatory traders to operate. However, this will only be achieved through close cooperation among regulators, legislators and the industry.
Yes, there have been unfortunate instances of unethical and illegal activity within the mutual fund industry from time to time. That is true of any industry. When this occurs, confessed or convicted offenders should be dealt with appropriately. But we are still concerned about the risk of over-regulation and the quick application of simplistic solutions to intricate problems. Every system can be improved, and we support and applaud well thought out improvements by regulators, legislators and industry representatives that achieve the common goal of building and protecting the value of investors' holdings.
For nearly 60 years, Fidelity has worked very hard to improve its products and service to justify your trust. When our family founded this company in 1946, we had only a few hundred customers. Today, we serve more than 18 million customers including individual investors and participants in retirement plans across America.
Let me close by saying that we do not take your trust in us for granted, and we realize that we must always work to improve all aspects of our service to you. In turn, we urge you to continue your active participation with your financial matters, so that your interests can be well served.
Best regards,
/s/Edward C. Johnson 3d
Edward C. Johnson 3d
Semiannual Report
Shareholder Expense Example
As a shareholder of the Fund, you incur two types of costs: (1) transaction costs, including redemption fees, and (2) ongoing costs, including management fees and other Fund expenses. This Example is intended to help you understand your ongoing costs (in dollars) of investing in the Fund and to compare these costs with the ongoing costs of investing in other mutual funds.
The Example is based on an investment of $1,000 invested at the beginning of the period and held for the entire period (January 1, 2005 to June 30, 2005).
Actual Expenses
The first line of the table below provides information about actual account values and actual expenses. You may use the information in this line, together with the amount you invested, to estimate the expenses that you paid over the period. Simply divide your account value by $1,000.00 (for example, an $8,600 account value divided by $1,000.00 = 8.6), then multiply the result by the number in the first line under the heading entitled "Expenses Paid During Period" to estimate the expenses you paid on your account during this period. A small balance maintenance fee of $12.00 that is charged once a year may apply for certain accounts with a value of less than $2,000. This fee is not included in the table below. If it was, the estimate of expenses you paid during the period would be higher, and your ending account value lower, by this amount.
Hypothetical Example for Comparison Purposes
The second line of the table below provides information about hypothetical account values and hypothetical expenses based on the Fund's actual expense ratio and an assumed rate of return of 5% per year before expenses, which is not the Fund's actual return. The hypothetical account values and expenses may not be used to estimate the actual ending account balance or expenses you paid for the period. You may use this information to compare the ongoing costs of investing in the Fund and other funds. To do so, compare this 5% hypothetical example with the 5% hypothetical examples that appear in the shareholder reports of the other funds. A small balance maintenance fee of $12.00 that is charged once a year may apply for certain accounts with a value of less than $2,000. This fee is not included in the table below. If it was, the estimate of expenses you paid during the period would be higher, and your ending account value lower, by this amount.
Please note that the expenses shown in the table are meant to highlight your ongoing costs only and do not reflect any transaction costs. Therefore, the second line of the table is useful in comparing ongoing costs only, and will not help you determine the relative total costs of owning different funds. In addition, if these transactional costs were included, your costs would have been higher.
Semiannual Report
| Beginning
Account Value
January 1, 2005 | Ending
Account Value
June 30, 2005 | Expenses Paid
During Period*
January 1, 2005
to June 30, 2005 |
Actual | $ 1,000.00 | $ 1,030.10 | $ 2.42 |
Hypothetical (5% return per year before expenses) | $ 1,000.00 | $ 1,022.41 | $ 2.41 |
* Expenses are equal to the Fund's annualized expense ratio of .48%; multiplied by the average account value over the period, multiplied by 181/365 (to reflect the one-half year period).
Semiannual Report
Investment Changes
Top Five States as of June 30, 2005 |
| % of fund's
net assets | % of fund's net assets
6 months ago |
Illinois | 14.3 | 15.4 |
Texas | 13.0 | 12.4 |
California | 10.1 | 9.0 |
New York | 9.9 | 10.2 |
Massachusetts | 6.5 | 6.7 |
Top Five Sectors as of June 30, 2005 |
| % of fund's
net assets | % of fund's net assets
6 months ago |
General Obligations | 33.3 | 32.9 |
Electric Utilities | 14.7 | 15.0 |
Water & Sewer | 10.5 | 9.8 |
Escrowed/Pre-Refunded | 10.2 | 6.7 |
Health Care | 10.1 | 11.2 |
Average Years to Maturity as of June 30, 2005 |
| | 6 months ago |
Years | 15.8 | 15.9 |
Average years to maturity is based on the average time remaining to the stated maturity date of each bond, weighted by the market value of each bond. |
Duration as of June 30, 2005 |
| | 6 months ago |
Years | 6.8 | 7.3 |
Duration shows how much a bond fund's price fluctuates with changes in comparable interest rates. If rates rise 1%, for example, a fund with a five-year duration is likely to lose about 5% of its value. Other factors also can influence a bond fund's performance and share price. Accordingly, a bond fund's actual performance may differ from this example. |
Quality Diversification (% of fund's net assets) |
As of June 30, 2005 | As of December 31, 2004 |
 | AAA 70.6% | | | AAA 70.2% | |
 | AA,A 22.8% | | | AA,A 22.7% | |
 | BBB 6.1% | | | BBB 6.3% | |
 | Not Rated 0.3% | | | Not Rated 0.7% | |
 | Short-Term
Investments and
Net Other Assets 0.2% | | | Short-Term
Investments and
Net Other Assets 0.1% | |

We have used ratings from Moody's® Investors Services, Inc. Where Moody's ratings are not available, we have used S&P® ratings. |
Semiannual Report
Investments June 30, 2005 (Unaudited)
Showing Percentage of Net Assets
Municipal Bonds - 99.8% |
| Principal
Amount (000s) | | Value (Note 1)
(000s) |
Alabama - 0.1% |
Alabama Pub. School & College Auth. Rev.
Series 1999 C, 5.75% 7/1/18 | | $ 2,000 | | $ 2,220 |
Jefferson County Ltd. Oblig. School Warrants Series A, 5.5% 1/1/22 | | 2,900 | | 3,199 |
Jefferson County Swr. Rev. Series 1997 D, 5.7% 2/1/18 (Pre-Refunded to 2/1/07 @ 101) (g) | | 100 | | 106 |
| | 5,525 |
Alaska - 0.1% |
North Slope Borough Gen. Oblig. Series 2000 B, 0% 6/30/09 (MBIA Insured) | | 5,000 | | 4,370 |
Arizona - 0.6% |
Arizona School Facilities Board Ctfs. of Prtn.: | | | | |
Series B, 5.25% 9/1/19 (Pre-Refunded to 9/1/14 @ 100) (g) | | 2,535 | | 2,888 |
Series C: | | | | |
5% 9/1/14 (FSA Insured) | | 2,000 | | 2,236 |
5% 9/1/15 (FSA Insured) | | 1,815 | | 2,004 |
Arizona School Facilities Board State School Impt. Rev. 5.25% 7/1/20 | | 1,000 | | 1,099 |
Arizona Student Ln. Acquisition Auth. Student Ln. Rev. Sr. Series A1, 5.9% 5/1/24 (f) | | 2,000 | | 2,144 |
Maricopa County Hosp. Rev. (Sun Health Corp. Proj.) 5.65% 4/1/06 | | 3,625 | | 3,684 |
Maricopa County Indl. Dev. Auth. Hosp. Facilities Rev. (Samaritan Health Svcs. Proj.) Series A, 7% 12/1/16 (Escrowed to Maturity) (g) | | 2,000 | | 2,541 |
Phoenix Civic Impt. Corp. Wtr. Sys. Rev.: | | | | |
5% 7/1/20 (MBIA Insured) | | 5,000 | | 5,456 |
5% 7/1/29 (MBIA Insured) | | 2,000 | | 2,146 |
Scottsdale Indl. Dev. Auth. Hosp. Rev. (Scottsdale Health Care Proj.) 5.8% 12/1/31 | | 3,250 | | 3,534 |
Tucson Gen. Oblig. Series 2002, 5% 7/1/10 | | 2,645 | | 2,870 |
| | 30,602 |
Arkansas - 0.2% |
Little Rock School District Series 2001 C, 5.25% 2/1/33 (FSA Insured) | | 6,500 | | 6,879 |
North Little Rock Elec. Rev. Series A, 6.5% 7/1/10 (MBIA Insured) | | 3,840 | | 4,225 |
| | 11,104 |
California - 10.1% |
ABC Unified School District 0% 8/1/28 (FGIC Insured) | | 3,925 | | 1,317 |
Municipal Bonds - continued |
| Principal
Amount (000s) | | Value (Note 1)
(000s) |
California - continued |
Cabrillo Unified School District Series A, 0% 8/1/20 (AMBAC Insured) | | $ 4,275 | | $ 2,215 |
California Dept. of Wtr. Resources Pwr. Supply Rev.: | | | | |
Series 2002 A: | | | | |
5.125% 5/1/18 (FGIC Insured) | | 7,500 | | 8,178 |
5.75% 5/1/17 | | 4,900 | | 5,542 |
Series A: | | | | |
5.5% 5/1/15 (AMBAC Insured) | | 8,800 | | 9,906 |
5.875% 5/1/16 | | 7,500 | | 8,572 |
6% 5/1/14 (MBIA Insured) | | 3,500 | | 4,054 |
6% 5/1/15 | | 9,300 | | 10,742 |
California Econ. Recovery: | | | | |
Series 2004 A, 5% 7/1/16 | | 10,700 | | 11,518 |
Series A: | | | | |
5.25% 7/1/13 (MBIA Insured) | | 5,300 | | 5,997 |
5.25% 7/1/14 (FGIC Insured) | | 2,800 | | 3,187 |
California Edl. Facilities Auth. Rev. (Loyola Marymount Univ. Proj.): | | | | |
0% 10/1/16 (MBIA Insured) | | 2,140 | | 1,350 |
0% 10/1/17 (MBIA Insured) | | 2,050 | | 1,230 |
0% 10/1/18 (MBIA Insured) | | 1,675 | | 955 |
0% 10/1/22 (MBIA Insured) | | 5,000 | | 2,310 |
California Gen. Oblig.: | | | | |
Series 1999, 5.75% 12/1/12 (FGIC Insured) | | 5,000 | | 5,662 |
Series 2005, 5.75% 12/1/24 | | 1,360 | | 1,518 |
5% 2/1/11 | | 8,000 | | 8,674 |
5.125% 9/1/12 | | 2,000 | | 2,162 |
5.25% 2/1/11 | | 1,000 | | 1,097 |
5.25% 3/1/12 | | 2,300 | | 2,544 |
5.25% 3/1/13 | | 3,530 | | 3,944 |
5.25% 2/1/14 | | 7,600 | | 8,466 |
5.25% 2/1/15 | | 18,300 | | 20,398 |
5.25% 2/1/16 | | 4,300 | | 4,787 |
5.25% 2/1/19 | | 5,620 | | 6,186 |
5.25% 2/1/20 | | 2,000 | | 2,194 |
5.25% 2/1/24 | | 4,000 | | 4,339 |
5.25% 2/1/28 | | 8,500 | | 9,184 |
5.25% 11/1/28 | | 4,485 | | 4,855 |
5.25% 2/1/33 | | 2,000 | | 2,147 |
5.5% 2/1/12 | | 8,000 | | 8,956 |
5.5% 3/1/12 | | 2,000 | | 2,220 |
5.5% 4/1/30 | | 3,800 | | 4,264 |
Municipal Bonds - continued |
| Principal
Amount (000s) | | Value (Note 1)
(000s) |
California - continued |
California Gen. Oblig.: - continued | | | | |
5.5% 11/1/33 | | $ 27,300 | | $ 30,562 |
5.625% 5/1/20 | | 4,200 | | 4,660 |
California Hsg. Fin. Agcy. Home Mtg. Rev.: | | | | |
Series 1983 A, 0% 2/1/15 (MBIA Insured) | | 187 | | 87 |
Series G: | | | | |
5.9% 2/1/09 (MBIA Insured) (f) | | 1,000 | | 1,021 |
5.9% 8/1/09 (MBIA Insured) (f) | | 2,000 | | 2,042 |
California Poll. Cont. Fing. Auth. Ctfs. of Prtn. (Pacific Gas & Elec. Co. Proj.) Series 2004 B, 3.5%, tender 6/1/07 (FGIC Insured) (d)(f) | | 8,800 | | 8,897 |
California Poll. Cont. Fing. Auth. Solid Waste Disp. Rev. (Waste Mgmt., Inc. Proj.) Series A1, 4.7%, tender 4/1/12 (d)(f) | | 1,000 | | 1,029 |
California Pub. Works Board Lease Rev.: | | | | |
(Various California State Univ. Projs.) Series A, 5.25% 12/1/13 | | 5,000 | | 5,058 |
Series 2005 A, 5.25% 6/1/30 | | 14,000 | | 15,133 |
Series B: | | | | |
5.25% 11/1/24 (XL Cap. Assurance, Inc. Insured) | | 1,575 | | 1,727 |
5.25% 11/1/26 (XL Cap. Assurance, Inc. Insured) | | 2,860 | | 3,139 |
California Statewide Cmntys. Dev. Auth. Rev.: | | | | |
(Kaiser Fund Hosp./Health Place, Inc. Proj.) Series 2002 C, 3.85%, tender 6/1/12 (d) | | 3,500 | | 3,521 |
(Kaiser Permanente Health Sys. Proj.) Series 2004 G, 2.3%, tender 5/1/07 (d) | | 4,000 | | 3,956 |
Compton Cmnty. Redev. Agcy. (Tax Allocation-Compton Redev. Proj.) Series A, 6.5% 8/1/13 (FSA Insured) | | 4,000 | | 4,090 |
Encinitas Union School District 0% 8/1/20 (MBIA Insured) | | 3,500 | | 1,814 |
Foothill/Eastern Trans. Corridor Agcy. Toll Road Rev.: | | | | |
Series A, 5% 1/1/35 (MBIA Insured) | | 5,070 | | 5,236 |
0% 1/15/27 (b) | | 2,500 | | 2,107 |
5% 1/15/16 (MBIA Insured) | | 2,800 | | 2,990 |
5.75% 1/15/40 | | 6,300 | | 6,459 |
Golden State Tobacco Securitization Corp.: | | | | |
Series 2003 A1: | | | | |
5% 6/1/21 | | 1,245 | | 1,259 |
6.75% 6/1/39 | | 8,800 | | 9,906 |
Series 2003 B: | | | | |
5% 6/1/08 | | 1,400 | | 1,461 |
5% 6/1/10 | | 2,000 | | 2,136 |
5% 6/1/12 | | 2,255 | | 2,426 |
Municipal Bonds - continued |
| Principal
Amount (000s) | | Value (Note 1)
(000s) |
California - continued |
Golden State Tobacco Securitization Corp.: - continued | | | | |
Series 2003 B: | | | | |
5.75% 6/1/21 | | $ 10,000 | | $ 10,710 |
5.75% 6/1/23 | | 3,400 | | 3,609 |
Laguna Salada Union School District Series C, 0% 8/1/30 (FGIC Insured) | | 2,095 | | 639 |
Los Angeles Dept. of Wtr. & Pwr. Wtrwks. Rev.: | | | | |
Series 2001 A, 5.125% 7/1/41 | | 5,000 | | 5,226 |
Series A, 5.125% 7/1/41 (MBIA Insured) | | 9,985 | | 10,486 |
Los Angeles Unified School District: | | | | |
Series A: | | | | |
5.375% 7/1/17 (MBIA Insured) | | 9,400 | | 10,626 |
5.375% 7/1/18 (MBIA Insured) | | 14,600 | | 16,396 |
5.5% 7/1/15 (MBIA Insured) | | 6,140 | | 7,063 |
Series F, 5% 7/1/18 (FSA Insured) | | 10,000 | | 10,863 |
Modesto Irrigation District Elec. Rev. Series A, 9.625% 1/1/11 (Escrowed to Maturity) (g) | | 3,090 | | 3,701 |
Monrovia Unified School District Series B, 0% 8/1/29 (FGIC Insured) | | 4,525 | | 1,438 |
Placer County Wtr. Agcy. Rev. (Middle Fork Proj.) Series A, 3.75% 7/1/12 | | 5,480 | | 5,541 |
Sacramento Cogeneration Auth. Cogeneration Proj. Rev. (Procter & Gamble Proj.) 6.375% 7/1/10 | | 700 | | 714 |
Sacramento Pwr. Auth. Cogeneration Proj. Rev. 6.5% 7/1/07 (Pre-Refunded to 7/1/06 @ 102) (g) | | 1,000 | | 1,057 |
San Diego Unified School District (Election of 1998 Proj.) Series E2: | | | | |
5.5% 7/1/25 (FSA Insured) | | 10,000 | | 11,943 |
5.5% 7/1/26 (FSA Insured) | | 6,700 | | 8,012 |
San Francisco City & County Arpts. Commission Int'l. Arpt. Rev.: | | | | |
Second Series 10A, 5.55% 5/1/14 (MBIA Insured) (f) | | 5,875 | | 6,102 |
Second Series 27A, 5.5% 5/1/09 (MBIA Insured) (f) | | 4,330 | | 4,659 |
San Joaquin Hills Trans. Corridor Agcy. Toll Road Rev. Series A: | | | | |
0% 1/15/12 (MBIA Insured) | | 9,900 | | 7,834 |
0% 1/15/34 (MBIA Insured) | | 10,000 | | 2,535 |
5.25% 1/15/30 (MBIA Insured) | | 3,600 | | 3,786 |
San Mateo County Cmnty. College District Series A, 0% 9/1/26 (FGIC Insured) | | 5,430 | | 2,028 |
Torrance Ctfs. of Prtn. (Refing. & Pub. Impt. Proj.)
Series B, 5.25% 6/1/34 (AMBAC Insured) | | 4,475 | | 4,876 |
Municipal Bonds - continued |
| Principal
Amount (000s) | | Value (Note 1)
(000s) |
California - continued |
Univ. of California Revs. (UCLA Med. Ctr. Proj.): | | | | |
Series A: | | | | |
5.5% 5/15/15 (AMBAC Insured) | | $ 2,990 | | $ 3,358 |
5.5% 5/15/16 (AMBAC Insured) | | 3,155 | | 3,537 |
5.5% 5/15/17 (AMBAC Insured) | | 3,325 | | 3,712 |
5.5% 5/15/19 (AMBAC Insured) | | 3,700 | | 4,119 |
5.5% 5/15/22 (AMBAC Insured) | | 1,000 | | 1,109 |
5.5% 5/15/23 (AMBAC Insured) | | 1,025 | | 1,131 |
Series B: | | | | |
5.5% 5/15/15 (AMBAC Insured) | | 5,105 | | 5,839 |
5.5% 5/15/16 (AMBAC Insured) | | 6,500 | | 7,419 |
5.5% 5/15/17 (AMBAC Insured) | | 6,860 | | 7,763 |
| | 479,217 |
Colorado - 1.7% |
Colorado Health Facilities Auth. Rev. Series 2001: | | | | |
6.5% 11/15/31 | | 5,040 | | 5,633 |
6.625% 11/15/26 | | 2,700 | | 3,036 |
Colorado Springs Arpt. Rev. Series C: | | | | |
0% 1/1/09 (MBIA Insured) | | 1,655 | | 1,471 |
0% 1/1/10 (MBIA Insured) | | 1,500 | | 1,276 |
Colorado Wtr. Resources and Pwr. Dev. Auth. Wtr. Resources Rev. (Parker Wtr. and Sanitation District Proj.) Series D, 5.25% 9/1/43 (MBIA Insured) | | 33,385 | | 35,998 |
Dawson Ridge Metropolitan District # 1 Series 1992 A, 0% 10/1/22 (Escrowed to Maturity) (g) | | 30,025 | | 13,766 |
Denver Health & Hosp. Auth. Health Care Rev. Series A, 6.25% 12/1/33 | | 2,000 | | 2,173 |
Douglas and Elbert Counties School District #RE1: | | | | |
5.75% 12/15/20 (FGIC Insured) | | 1,500 | | 1,748 |
5.75% 12/15/22 (FGIC Insured) | | 1,000 | | 1,159 |
E-470 Pub. Hwy. Auth. Rev. Series 2000 A, 5.75% 9/1/29 (MBIA Insured) | | 10,000 | | 11,275 |
Longmont Sales & Use Tax Rev. 5.7% 11/15/18
(FGIC Insured) | | 2,280 | | 2,549 |
Northwest Pkwy Pub. Hwy. Auth. Sr. Series A: | | | | |
5.5% 6/15/15 (AMBAC Insured) | | 1,000 | | 1,116 |
5.5% 6/15/19 (AMBAC Insured) | | 1,000 | | 1,110 |
| | 82,310 |
District Of Columbia - 1.2% |
District of Columbia Gen. Oblig.: | | | | |
Series 1998 A, 5.25% 6/1/27 (MBIA Insured) | | 17,330 | | 18,287 |
Municipal Bonds - continued |
| Principal
Amount (000s) | | Value (Note 1)
(000s) |
District Of Columbia - continued |
District of Columbia Gen. Oblig.: - continued | | | | |
Series B, 0% 6/1/12 (MBIA Insured) | | $ 8,800 | | $ 6,786 |
District of Columbia Rev.: | | | | |
(George Washington Univ. Proj.) Series A, 5.75% 9/15/20 (MBIA Insured) | | 12,600 | | 13,919 |
(Georgetown Univ. Proj.) Series A: | | | | |
5.95% 4/1/14 (MBIA Insured) | | 2,000 | | 2,187 |
6% 4/1/18 (MBIA Insured) | | 13,835 | | 15,145 |
| | 56,324 |
Florida - 1.5% |
Boynton Beach Util. Sys. Rev. 5.5% 11/1/19
(FGIC Insured) | | 3,300 | | 3,923 |
Dade County Aviation Rev. (Miami Int'l. Arpt. Proj.) Series B, 6% 10/1/24 (MBIA Insured) (f) | | 3,750 | | 3,851 |
Florida Board of Ed. Cap. Outlay Series B, 5.5% 6/1/15 (FGIC Insured) | | 3,655 | | 4,140 |
Highlands County Health Facilities Auth. Rev. (Adventist Health Sys./Sunbelt Obligated Group Proj.): | | | | |
5.25% 11/15/12 | | 3,935 | | 4,163 |
5.25% 11/15/13 | | 3,140 | | 3,311 |
Jacksonville Elec. Auth. Rev.: | | | | |
(Saint Johns River Proj.) Series 13 Issue 2, 5.375% 10/1/16 (MBIA Insured) | | 4,535 | | 4,660 |
(Third Installment Proj.) Series 73, 6.8% 7/1/12 (Escrowed to Maturity) (g) | | 2,465 | | 2,764 |
Jacksonville Port Auth. Rev.: | | | | |
5.5% 11/1/06 (MBIA Insured) (f) | | 2,840 | | 2,895 |
5.75% 11/1/09 (MBIA Insured) (f) | | 1,000 | | 1,054 |
Miami-Dade County Edl. Facilities Auth. Rev. 5.75% 4/1/29 (AMBAC Insured) | | 5,000 | | 5,559 |
Miami-Dade County School Board Ctfs. of Prtn. 5%, tender 5/1/11 (MBIA Insured) (d) | | 3,600 | | 3,874 |
Orange County Health Facilities Auth. Rev. (Adventist Health Sys./Sunbelt Obligated Group Proj.) 5.625% 11/15/32 | | 2,000 | | 2,158 |
Pasco County Solid Waste Disp. & Resource Recovery Sys. Rev.: | | | | |
6% 4/1/08 (AMBAC Insured) (f) | | 5,000 | | 5,361 |
6% 4/1/09 (AMBAC Insured) (f) | | 8,090 | | 8,839 |
Seminole County School Board Ctfs. of Prtn. Series A: | | | | |
5% 7/1/16 (MBIA Insured) | | 1,645 | | 1,832 |
5% 7/1/20 (MBIA Insured) | | 1,745 | | 1,883 |
Municipal Bonds - continued |
| Principal
Amount (000s) | | Value (Note 1)
(000s) |
Florida - continued |
South Broward Hosp. District Rev. 5.625% 5/1/32 (MBIA Insured) | | $ 2,630 | | $ 2,934 |
Tampa Wtr. & Swr. Rev. 6% 10/1/17 (FSA Insured) | | 1,000 | | 1,227 |
Univ. of Central Florida Athletics Assn, Inc. Certficates of Prtn. Series A, 5% 10/1/35 (FGIC Insured) | | 1,275 | | 1,345 |
Volusia County School Board Ctfs. of Prtn. (School Board of Volusia County Master Lease Prog.) 5% 8/1/08 (FSA Insured) | | 4,325 | | 4,587 |
| | 70,360 |
Georgia - 2.7% |
Atlanta & Fulton County Resource Auth. Rev. (Downtown Area Pub. Impt. Proj.) Series A, 5.375% 12/1/21 (MBIA Insured) | | 6,000 | | 6,367 |
Atlanta Wtr. & Wastewtr. Rev.: | | | | |
5% 11/1/37 (FSA Insured) | | 16,300 | | 17,270 |
5% 11/1/43 (FSA Insured) | | 64,000 | | 67,457 |
Augusta Wtr. & Swr. Rev. 5.25% 10/1/39 (FSA Insured) | | 12,100 | | 13,180 |
College Park Bus. & Indl. Dev. Auth. Civic Ctr. Proj. Rev. Series 2000, 5.75% 9/1/20 (AMBAC Insured) | | 5,800 | | 6,528 |
Fulton County Wtr. & Swr. Rev. 6.375% 1/1/14
(FGIC Insured) | | 140 | | 164 |
Gainesville & Hall County Hosp. Auth. Rev. Anticipation Ctfs. (Northeast Georgia Health Sys., Inc. Proj.) 5.5% 5/15/31 | | 4,500 | | 4,713 |
Private Colleges & Univs. Auth. Rev. (Emory Univ. Proj.): | | | | |
Series 1999 A, 5.5% 11/1/31 | | 3,800 | | 4,130 |
Series A, 5.5% 11/1/24 | | 5,000 | | 5,513 |
Richmond County Dev. Auth. Rev.: | | | | |
(Southern Care Corp. Facility Proj.) Series A, 0% 12/1/21 (Escrowed to Maturity) (g) | | 5,590 | | 2,674 |
Series C, 0% 12/1/21 (Escrowed to Maturity) (g) | | 2,200 | | 1,052 |
| | 129,048 |
Hawaii - 0.4% |
Hawaii Arpts. Sys. Rev.: | | | | |
Series 2000 A, 5.75% 7/1/21 (FGIC Insured) | | 2,640 | | 2,937 |
Series 2000 B, 8% 7/1/11 (FGIC Insured) (f) | | 9,250 | | 11,318 |
Hawaii Gen. Oblig. Series CU, 5.75% 10/1/12
(MBIA Insured) | | 2,130 | | 2,384 |
Honolulu City and County Wastewtr. Sys. Sr. Series 2001 5.5% 7/1/18 (AMBAC Insured) | | 1,090 | | 1,199 |
| | 17,838 |
Municipal Bonds - continued |
| Principal
Amount (000s) | | Value (Note 1)
(000s) |
Idaho - 0.2% |
Boise City Urban Renewal Agcy. Lease Rev. 5.9% 8/15/29 (Pre-Refunded to 8/15/09 @ 101) (g) | | $ 6,950 | | $ 7,805 |
Illinois - 14.3% |
Chicago Board of Ed. Series A: | | | | |
0% 12/1/16 (FGIC Insured) | | 3,200 | | 2,001 |
5.5% 12/1/27 (AMBAC Insured) | | 4,000 | | 4,789 |
5.5% 12/1/28 (Pre-Refunded to 12/1/11 @ 100) (g) | | 5,060 | | 5,729 |
Chicago Gen. Oblig.: | | | | |
(City Colleges Proj.): | | | | |
0% 1/1/14 (FGIC Insured) | | 17,000 | | 12,198 |
0% 1/1/15 (FGIC Insured) | | 20,000 | | 13,698 |
0% 1/1/26 (FGIC Insured) | | 16,000 | | 6,202 |
0% 1/1/28 (FGIC Insured) | | 23,555 | | 8,233 |
0% 1/1/30 (FGIC Insured) | | 18,670 | | 5,872 |
(Neighborhoods Alive 21 Prog.): | | | | |
Series A: | | | | |
5.75% 1/1/40 (FGIC Insured) | | 18,500 | | 20,644 |
6% 1/1/28 (FGIC Insured) | | 7,255 | | 8,200 |
5% 1/1/28 (AMBAC Insured) | | 2,000 | | 2,115 |
6% 1/1/28 (Pre-Refunded to 7/1/10 @ 101) (g) | | 1,145 | | 1,312 |
Series 2000 C, 5.5% 1/1/40 (FGIC Insured) | | 14,750 | | 16,057 |
Series 2000 D, 5.5% 1/1/35 (FGIC Insured) | | 15,000 | | 16,325 |
Series A: | | | | |
5% 1/1/41 (Pre-Refunded to 1/1/15 @ 100) (g) | | 1,300 | | 1,407 |
5% 1/1/42 (AMBAC Insured) | | 18,955 | | 19,725 |
5.25% 1/1/22 (MBIA Insured) | | 2,085 | | 2,262 |
5.25% 1/1/33 (MBIA Insured) | | 8,300 | | 8,806 |
5.5% 1/1/38 (MBIA Insured) | | 21,500 | | 23,536 |
Series C, 5.7% 1/1/30 (FGIC Insured) | | 15,415 | | 17,204 |
Chicago Midway Arpt. Rev.: | | | | |
Series A, 5.5% 1/1/29 (MBIA Insured) | | 24,825 | | 25,910 |
Series B: | | | | |
5.25% 1/1/13 (MBIA Insured) (f) | | 2,910 | | 3,008 |
5.25% 1/1/14 (MBIA Insured) (f) | | 3,060 | | 3,161 |
6% 1/1/08 (MBIA Insured) (f) | | 2,170 | | 2,283 |
6% 1/1/10 (MBIA Insured) (f) | | 2,435 | | 2,558 |
6.125% 1/1/11 (MBIA Insured) (f) | | 2,580 | | 2,713 |
Chicago Motor Fuel Tax Rev. Series A, 5.25% 1/1/19 (AMBAC Insured) | | 1,780 | | 1,956 |
Chicago O'Hare Int'l. Arpt. Rev.: | | | | |
Series 1999, 5.5% 1/1/11 (AMBAC Insured) (f) | | 10,000 | | 10,870 |
Municipal Bonds - continued |
| Principal
Amount (000s) | | Value (Note 1)
(000s) |
Illinois - continued |
Chicago O'Hare Int'l. Arpt. Rev.: - continued | | | | |
Series A: | | | | |
5.5% 1/1/16 (AMBAC Insured) (f) | | $ 10,770 | | $ 11,300 |
5.5% 1/1/16 (Pre-Refunded to 1/1/07 @ 102) (f)(g) | | 1,230 | | 1,301 |
5.6% 1/1/10 (AMBAC Insured) | | 4,500 | | 4,647 |
6.25% 1/1/09 (AMBAC Insured) (f) | | 6,040 | | 6,430 |
Series B, 5.75% 1/1/30 (AMBAC Insured) | | 13,420 | | 14,835 |
Chicago Park District: | | | | |
Series 2001 A: | | | | |
5.5% 1/1/19 (FGIC Insured) | | 3,100 | | 3,399 |
5.5% 1/1/20 (FGIC Insured) | | 3,200 | | 3,505 |
Series A: | | | | |
5.25% 1/1/18 (FGIC Insured) | | 4,690 | | 5,175 |
5.25% 1/1/19 (FGIC Insured) | | 3,000 | | 3,297 |
5.25% 1/1/20 (FGIC Insured) | | 2,195 | | 2,403 |
Chicago Spl. Trans. Rev. Series 2001: | | | | |
5.25% 1/1/31 (Pre-Refunded to 1/1/27 @ 100) (g) | | 11,670 | | 12,678 |
5.5% 1/1/17 (Escrowed to Maturity) (g) | | 1,135 | | 1,265 |
Chicago Transit Auth. Cap. Grant Receipts Rev.
(Douglas Branch Proj.) Series 2003 B, 5% 6/1/07 (AMBAC Insured) | | 4,830 | | 4,851 |
Chicago Wtr. Rev. 0% 11/1/16 (AMBAC Insured) | | 7,555 | | 4,714 |
Cicero Gen. Oblig. 5.25% 12/1/26 (MBIA Insured) | | 3,010 | | 3,273 |
Cook County Gen. Oblig. Series C: | | | | |
5% 11/15/25 (AMBAC Insured) | | 8,400 | | 8,865 |
5.5% 11/15/26 (AMBAC Insured) | | 5,120 | | 5,657 |
DuPage County Forest Preserve District Rev. 0% 11/1/17 | | 5,565 | | 3,315 |
Evanston Gen. Oblig. Series C: | | | | |
5.25% 1/1/16 | | 1,000 | | 1,107 |
5.25% 1/1/22 | | 2,000 | | 2,185 |
Franklin Park Village Cook County Gen. Oblig. Series B: | | | | |
5% 7/1/17 (AMBAC Insured) | | 1,380 | | 1,500 |
5% 7/1/18 (AMBAC Insured) | | 1,450 | | 1,571 |
Granite City Solid Waste Disp. Rev. (Waste Mgmt., Inc. Proj.) 3.85%, tender 5/1/08 (d)(f) | | 5,600 | | 5,592 |
Illinois Dev. Fin. Auth. Rev.: | | | | |
(DePaul Univ. Proj.) Series 2004 C, 5.625% 10/1/17 | | 2,800 | | 3,137 |
(Revolving Fund-Master Trust Prog.): | | | | |
5.5% 9/1/18 | | 5,365 | | 6,013 |
5.5% 9/1/19 | | 4,405 | | 4,934 |
Municipal Bonds - continued |
| Principal
Amount (000s) | | Value (Note 1)
(000s) |
Illinois - continued |
Illinois Edl. Facilities Auth. Revs.: | | | | |
(Northwestern Univ. Proj.) 5% 12/1/38 | | $ 23,250 | | $ 24,237 |
(Univ. of Chicago Proj.): | | | | |
Series 2004 B1, 3.45%, tender 7/1/08 (d) | | 3,350 | | 3,383 |
Series 2005 A: | | | | |
5.25% 7/1/41 | | 755 | | 805 |
5.25% 7/1/41 (Pre-Refunded to 7/1/11 @ 101) (g) | | 305 | | 343 |
Series A, 5.125% 7/1/38 | | 1,585 | | 1,638 |
Illinois Fin. Auth. Gas Supply Rev. (Peoples Gas Lt. and Coke Co. Proj.) Series A, 4.3%, tender 6/1/16 (AMBAC Insured) (d) | | 3,600 | | 3,685 |
Illinois Gen. Oblig.: | | | | |
First Series: | | | | |
5.25% 12/1/17 (FSA Insured) | | 2,260 | | 2,505 |
5.25% 12/1/20 (FSA Insured) | | 2,000 | | 2,200 |
5.375% 12/1/14 (FSA Insured) | | 5,000 | | 5,614 |
5.375% 7/1/15 (MBIA Insured) | | 3,700 | | 4,129 |
5.5% 4/1/16 (FSA Insured) | | 1,300 | | 1,457 |
5.5% 8/1/16 (MBIA Insured) | | 13,000 | | 14,633 |
5.5% 8/1/17 (MBIA Insured) | | 7,500 | | 8,422 |
5.5% 2/1/18 (FGIC Insured) | | 1,000 | | 1,115 |
5.5% 8/1/18 (MBIA Insured) | | 5,000 | | 5,608 |
5.75% 12/1/18 (MBIA Insured) | | 1,200 | | 1,340 |
5.5% 4/1/17 (MBIA Insured) | | 7,065 | | 7,715 |
5.6% 4/1/21 (MBIA Insured) | | 7,500 | | 8,199 |
5.7% 4/1/16 (MBIA Insured) | | 7,350 | | 8,131 |
Illinois Health Facilities Auth. Rev.: | | | | |
(Condell Med. Ctr. Proj.): | | | | |
6.5% 5/15/30 | | 9,000 | | 9,703 |
7% 5/15/22 | | 5,000 | | 5,603 |
(Lake Forest Hosp. Proj.): | | | | |
Series A, 6.25% 7/1/22 | | 4,200 | | 4,690 |
6% 7/1/33 | | 3,775 | | 4,083 |
(Lutheran Gen. Health Care Sys. Proj.) Series C: | | | | |
6% 4/1/18 | | 3,000 | | 3,470 |
7% 4/1/14 | | 1,500 | | 1,818 |
(Riverside Health Sys. Proj.) 6.85% 11/15/29 (Pre-Refunded to 11/15/10 @ 101) (g) | | 5,025 | | 5,988 |
(Swedish American Hosp. Proj.) 6.875% 11/15/30 (Pre-Refunded to 5/15/10 @ 101) (g) | | 6,975 | | 8,153 |
6.75% 2/15/15 | | 1,000 | | 1,128 |
Municipal Bonds - continued |
| Principal
Amount (000s) | | Value (Note 1)
(000s) |
Illinois - continued |
Illinois Reg'l. Trans. Auth. Series A, 8% 6/1/17
(AMBAC Insured) | | $ 4,500 | | $ 6,202 |
Illinois Sales Tax Rev. 6% 6/15/20 | | 4,600 | | 5,160 |
Kane County School District #129, Aurora West Side: | | | | |
Series A: | | | | |
5.75% 2/1/17 (FGIC Insured) | | 3,655 | | 4,125 |
5.75% 2/1/20 (FGIC Insured) | | 7,360 | | 8,237 |
6% 2/1/23 (FGIC Insured) | | 1,335 | | 1,529 |
Kane, McHenry, Cook & DeKalb Counties Cmnty. Unit School District #300, Carpentersville: | | | | |
5.5% 12/1/16 (MBIA Insured) | | 2,500 | | 2,775 |
5.5% 12/1/17 (MBIA Insured) | | 4,000 | | 4,433 |
Lake County Warren Township High School District #121, Gurnee Series C: | | | | |
5.5% 3/1/24 (AMBAC Insured) | | 2,945 | | 3,307 |
5.625% 3/1/21 (AMBAC Insured) | | 2,505 | | 2,863 |
5.75% 3/1/19 (AMBAC Insured) | | 2,240 | | 2,612 |
Metropolitan Pier & Exposition Auth. Dedicated State Tax Rev.: | | | | |
(McCormick Place Expansion Proj.): | | | | |
Series 2002 A: | | | | |
0% 12/15/32 (MBIA Insured) | | 15,000 | | 4,125 |
5.75% 6/15/41 (MBIA Insured) | | 26,420 | | 29,896 |
Series 2002 B, 0% 6/15/20 (MBIA Insured) (b) | | 2,000 | | 1,575 |
Series A: | | | | |
0% 6/15/08 (MBIA Insured) | | 3,820 | | 3,489 |
0% 6/15/11 (Escrowed to Maturity) (g) | | 6,000 | | 4,888 |
0% 6/15/15 (FGIC Insured) | | 15,000 | | 10,069 |
0% 6/15/19 (FGIC Insured) | | 2,225 | | 1,231 |
0% 6/15/20 (FGIC Insured) | | 3,450 | | 1,816 |
0% 6/15/34 (MBIA Insured) | | 2,625 | | 671 |
5.25% 12/15/10 (AMBAC Insured) | | 12,950 | | 13,484 |
6.65% 6/15/12 (FGIC Insured) | | 250 | | 251 |
Series 2002: | | | | |
0% 6/15/10 (Escrowed to Maturity) (g) | | 16,640 | | 14,148 |
0% 6/15/13 (Escrowed to Maturity) (g) | | 4,155 | | 3,113 |
0% 6/15/13 (FGIC Insured) | | 5,430 | | 3,996 |
Moline Gen. Oblig. Series A, 5.5% 2/1/17 (FGIC Insured) | | 1,000 | | 1,114 |
Univ. of Illinois Auxiliary Facilities Sys. Rev.: | | | | |
Series A, 0% 4/1/21 (MBIA Insured) | | 4,965 | | 2,465 |
Municipal Bonds - continued |
| Principal
Amount (000s) | | Value (Note 1)
(000s) |
Illinois - continued |
Univ. of Illinois Auxiliary Facilities Sys. Rev.: - continued | | | | |
0% 4/1/17 (MBIA Insured) | | $ 16,270 | | $ 9,932 |
0% 4/1/20 (MBIA Insured) | | 8,000 | | 4,188 |
| | 677,212 |
Indiana - 2.5% |
Anderson Ind. School Bldg. Corp.: | | | | |
5.5% 7/15/18 (FSA Insured) | | 1,780 | | 2,020 |
5.5% 7/15/19 (FSA Insured) | | 1,855 | | 2,097 |
5.5% 7/15/24 (FSA Insured) | | 1,460 | | 1,632 |
5.5% 1/15/28 (FSA Insured) | | 2,500 | | 2,784 |
Clark-Pleasant 2004 School Bldg. Corp.: | | | | |
5.25% 7/15/23 (FSA Insured) | | 1,545 | | 1,683 |
5.25% 7/15/25 (FSA Insured) | | 1,720 | | 1,862 |
Franklin Township Independent School Bldg. Corp., Marion County: | | | | |
5% 7/15/24 (MBIA Insured) (c) | | 1,365 | | 1,455 |
5.25% 7/15/17 (MBIA Insured) (c) | | 1,885 | | 2,099 |
GCS School Bldg. Corp. One 5% 7/15/22 (FSA Insured) | | 1,545 | | 1,665 |
Hamilton Southeastern Cumberland Campus School Bldg. Corp. 5.125% 1/15/23 (AMBAC Insured) | | 1,250 | | 1,334 |
Hammond School Bldg. Corp. 5% 7/15/16 (MBIA Insured) | | 1,845 | | 2,036 |
Indiana Bond Bank Series B: | | | | |
5% 2/1/19 (MBIA Insured) | | 1,940 | | 2,102 |
5% 2/1/20 (MBIA Insured) | | 1,635 | | 1,767 |
Indiana Dev. Fin. Auth. Rev. 5.95% 8/1/30 (f) | | 7,350 | | 7,728 |
Indiana Health Facilities Fing. Auth. Hosp. Rev.: | | | | |
(Columbus Reg'l. Hosp. Proj.) 7% 8/15/15 (FSA Insured) | | 2,500 | | 3,135 |
5.5% 2/15/30 (MBIA Insured) | | 5,295 | | 5,723 |
Indiana Trans. Fin. Auth. Hwy. Series 1993 A, 0% 6/1/18 (AMBAC Insured) | | 1,700 | | 984 |
Indianapolis Arpt. Auth. Rev. Series A, 5.6% 7/1/15 (FGIC Insured) | | 1,000 | | 1,046 |
Indianapolis Local Pub. Impt. Bond Bank (Wtrwks. Proj.) Series 2002 A: | | | | |
5.25% 7/1/33 (MBIA Insured) | | 35,240 | | 37,482 |
5.5% 1/1/18 (MBIA Insured) | | 1,250 | | 1,393 |
Muncie School Bldg. Corp.: | | | | |
5.25% 1/10/14 (MBIA Insured) | | 1,215 | | 1,357 |
5.25% 7/10/14 (MBIA Insured) | | 1,760 | | 1,969 |
Municipal Bonds - continued |
| Principal
Amount (000s) | | Value (Note 1)
(000s) |
Indiana - continued |
Petersburg Poll. Cont. Rev.: | | | | |
(Indianapolis Pwr. & Lt. Co. Proj.) 5.9% 12/1/24 (f) | | $ 10,000 | | $ 10,627 |
5.95% 12/1/29 (f) | | 2,000 | | 2,118 |
Portage Township Multi-School Bldg. Corp.: | | | | |
5.25% 7/15/17 (MBIA Insured) | | 1,375 | | 1,537 |
5.25% 7/15/22 (MBIA Insured) | | 1,785 | | 1,968 |
5.25% 7/15/24 (MBIA Insured) | | 1,975 | | 2,162 |
5.25% 7/15/25 (MBIA Insured) | | 2,085 | | 2,279 |
5.25% 1/15/29 (MBIA Insured) | | 1,265 | | 1,375 |
South Harrison School Bldg. Corp. Series A: | | | | |
5.25% 7/15/22 (FSA Insured) | | 2,820 | | 3,062 |
5.5% 7/15/21 (FSA Insured) | | 2,675 | | 2,970 |
Southmont School Bldg. Corp. 5% 7/15/15 (FGIC Insured) | | 2,000 | | 2,179 |
Westfield Washington Multi-School Bldg. Corp. Series A: | | | | |
5% 7/15/15 (FSA Insured) | | 1,360 | | 1,509 |
5% 7/15/18 (FSA Insured) | | 1,500 | | 1,633 |
| | 118,772 |
Iowa - 0.7% |
Iowa Fin. Auth. Hosp. Facilities Rev.: | | | | |
5.875% 2/15/30 (AMBAC Insured) | | 15,000 | | 16,564 |
6.625% 2/15/12 | | 2,000 | | 2,254 |
6.75% 2/15/13 | | 1,000 | | 1,123 |
6.75% 2/15/14 | | 1,280 | | 1,432 |
6.75% 2/15/15 | | 1,000 | | 1,116 |
6.75% 2/15/17 | | 1,000 | | 1,114 |
Tobacco Settlement Auth. Tobacco Settlement Rev. 5.3% 6/1/25 | | 10,000 | | 10,160 |
| | 33,763 |
Kansas - 0.3% |
Burlington Envir. Impt. Rev. (Kansas City Pwr. & Lt. Co. Proj.) Series A, 4.75%, tender 10/1/07 (d) | | 7,800 | | 8,047 |
Kansas Dev. Fin. Auth. Health Facilities Rev. (Sisters of Charity of Leavenworth Health Svcs. Corp. Proj.)
Series J, 6.25% 12/1/28 | | 4,500 | | 5,015 |
| | 13,062 |
Kentucky - 2.2% |
Jefferson County Cap. Projs. Corp. Rev. (Lease Prog.) Series A, 0% 8/15/11 | | 5,250 | | 4,169 |
Municipal Bonds - continued |
| Principal
Amount (000s) | | Value (Note 1)
(000s) |
Kentucky - continued |
Louisville & Jefferson County Metropolitan Swr. District Swr. & Drain Sys. Rev. Series A: | | | | |
5.25% 5/15/37 (FGIC Insured) | | $ 15,750 | | $ 17,181 |
5.75% 5/15/33 (FGIC Insured) | | 65,000 | | 71,992 |
Louisville & Jefferson County Reg'l. Arpt. Auth. Arpt. Sys. Rev. Series 2001 A: | | | | |
5.25% 7/1/09 (FSA Insured) (f) | | 1,545 | | 1,648 |
5.5% 7/1/10 (FSA Insured) (f) | | 3,800 | | 4,127 |
Owensboro Elec. Lt. & Pwr. Rev. Series B, 0% 1/1/10 (AMBAC Insured) | | 7,440 | | 6,359 |
| | 105,476 |
Louisiana - 0.6% |
Louisiana Gas & Fuel Tax Rev. Series A, 5.375% 6/1/20 (AMBAC Insured) | | 3,000 | | 3,284 |
Monroe-West Monroe Pub. Trust Fing. Auth. Mtg. Rev. Series C, 0% 8/20/14 | | 8,625 | | 5,701 |
New Orleans Gen. Oblig.: | | | | |
0% 9/1/09 (AMBAC Insured) | | 16,500 | | 14,438 |
0% 9/1/11 (AMBAC Insured) | | 3,205 | | 2,555 |
0% 9/1/14 (AMBAC Insured) | | 3,500 | | 2,421 |
| | 28,399 |
Maine - 0.1% |
Maine Tpk. Auth. Tpk. Rev. 5.25% 7/1/30 (FSA Insured) | | 3,000 | | 3,262 |
Maryland - 0.3% |
Maryland Health & Higher Edl. Facilities Auth. Rev.: | | | | |
(Good Samaritan Hosp. Proj.): | | | | |
5.75% 7/1/13 (Escrowed to Maturity) (g) | | 1,605 | | 1,819 |
5.75% 7/1/13 (Escrowed to Maturity) (g) | | 995 | | 1,128 |
(Univ. of Maryland Med. Sys. Proj.) 6.75% 7/1/30 | | 10,415 | | 11,895 |
| | 14,842 |
Massachusetts - 6.5% |
Massachusetts Bay Trans. Auth.: | | | | |
Series 2000 A, 5.25% 7/1/30 | | 1,465 | | 1,551 |
Series A, 5.75% 3/1/26 | | 17,795 | | 19,447 |
Series B, 6.2% 3/1/16 | | 3,800 | | 4,510 |
Massachusetts Ed. Ln. Auth. Ed. Ln. Rev.: | | | | |
Series A Issue E, 4.9% 7/1/13 (AMBAC Insured) (f) | | 3,460 | | 3,591 |
Series B Issue E: | | | | |
5.75% 7/1/05 (AMBAC Insured) (f) | | 710 | | 710 |
5.85% 7/1/06 (AMBAC Insured) (f) | | 845 | | 856 |
Municipal Bonds - continued |
| Principal
Amount (000s) | | Value (Note 1)
(000s) |
Massachusetts - continued |
Massachusetts Ed. Ln. Auth. Ed. Ln. Rev.: - continued | | | | |
Series B Issue E: | | | | |
5.95% 7/1/07 (AMBAC Insured) (f) | | $ 910 | | $ 924 |
6.05% 7/1/08 (AMBAC Insured) (f) | | 935 | | 949 |
6.15% 7/1/10 (AMBAC Insured) (f) | | 375 | | 381 |
6.25% 7/1/11 (AMBAC Insured) (f) | | 230 | | 234 |
6.3% 7/1/12 (AMBAC Insured) (f) | | 230 | | 234 |
Massachusetts Fed. Hwy. Series 2000 A: | | | | |
5.75% 6/15/11 | | 10,000 | | 11,132 |
5.75% 6/15/12 | | 5,000 | | 5,563 |
5.75% 6/15/13 | | 5,000 | | 5,587 |
Massachusetts Gen. Oblig.: | | | | |
Series 2005 A: | | | | |
5% 3/1/21 (FSA Insured) | | 20,000 | | 21,872 |
5% 3/1/22 | | 6,500 | | 7,043 |
Series D, 5.25% 10/1/21 (Pre-Refunded to 10/1/13 @ 100) (g) | | 9,000 | | 10,104 |
Massachusetts Health & Edl. Facilities Auth. Rev.: | | | | |
(Blood Research Institute Proj.) Series A, 6.5% 2/1/22 | | 3,975 | | 3,986 |
(Massachusetts Gen. Hosp. Proj.) Series F, 6.25% 7/1/12 (AMBAC Insured) | | 2,000 | | 2,222 |
(New England Med. Ctr. Hosp. Proj.) Series G, 5.375% 7/1/24 (MBIA Insured) | | 3,800 | | 3,889 |
(South Shore Hosp. Proj.) Series F, 5.75% 7/1/29 | | 11,930 | | 12,484 |
(Tufts Univ. Proj.) Series I, 5.5% 2/15/36 | | 10,000 | | 10,904 |
(Wellesley College Proj.) Series F, 5.125% 7/1/39 | | 5,705 | | 5,958 |
Massachusetts Indl. Fin. Agcy. Resource Recovery Rev. (Ogden Haverhill Proj.): | | | | |
Series 1992 A, 4.95% 12/1/06 | | 2,000 | | 2,038 |
Series A, 4.85% 12/1/05 | | 2,200 | | 2,214 |
Massachusetts Indl. Fin. Agcy. Rev. (Massachusetts Biomedical Research Corp. Proj.) Series A2: | | | | |
0% 8/1/06 | | 30,800 | | 29,847 |
0% 8/1/08 | | 5,000 | | 4,515 |
0% 8/1/09 | | 21,800 | | 18,891 |
0% 8/1/10 | | 2,000 | | 1,664 |
Massachusetts Muni. Wholesale Elec. Co. Pwr. Supply Sys. Rev. Series A, 5% 7/1/10 (Escrowed to Maturity) (g) | | 3,010 | | 3,121 |
Massachusetts Port Auth. Spl. Facilities Rev. (Delta Air Lines, Inc. Proj.) Series A: | | | | |
5.5% 1/1/12 (AMBAC Insured) (f) | | 2,000 | | 2,155 |
5.5% 1/1/14 (AMBAC Insured) (f) | | 2,540 | | 2,731 |
Municipal Bonds - continued |
| Principal
Amount (000s) | | Value (Note 1)
(000s) |
Massachusetts - continued |
Massachusetts Spl. Oblig. Dedicated Tax Rev. 5.75% 1/1/32 (Pre-Refunded to 1/1/14 @ 100) (g) | | $ 15,000 | | $ 17,364 |
Massachusetts Tpk. Auth. Metropolitan Hwy. Sys. Rev.: | | | | |
Series 1999 A, 5.25% 1/1/29 (AMBAC Insured) | | 14,400 | | 15,358 |
Sr. Series A, 5.125% 1/1/23 (MBIA Insured) | | 7,950 | | 8,242 |
Massachusetts Tpk. Auth. Western Tpk. Rev. Series A, 5.55% 1/1/17 (MBIA Insured) | | 16,215 | | 16,251 |
Massachusetts Wtr. Poll. Abatement Trust Wtr. Poll. Abatement Rev. (MWRA Ln. Prog.) Series A, 5.25% 8/1/13 | | 90 | | 96 |
Massachusetts Wtr. Resources Auth. Series A, 5.75% 8/1/39 (Pre-Refunded to 8/1/10 @ 101) (g) | | 30,300 | | 34,162 |
Route 3 North Trans. Impt. Assoc. Lease Rev. 5.75% 6/15/16 (MBIA Insured) | | 4,850 | | 5,418 |
Springfield Gen. Oblig. 5% 8/1/19 (MBIA Insured) (c) | | 7,015 | | 7,646 |
| | 305,844 |
Michigan - 1.5% |
Carman-Ainsworth Cmnty. School District 5% 5/1/18 (FSA Insured) (c) | | 2,175 | | 2,385 |
Clarkston Cmnty. Schools 5.375% 5/1/20 | | 1,775 | | 1,993 |
Detroit Wtr. Supply Sys. Rev. Series 2001 A, 5.25% 7/1/33 (FGIC Insured) | | 4,520 | | 4,828 |
Ferris State Univ. Rev. 5% 10/1/20 (MBIA Insured) (c) | | 3,165 | | 3,420 |
Fowlerville Cmnty. School District 5.25% 5/1/17 (FGIC Insured) | | 1,425 | | 1,591 |
Michigan Ctfs. of Prtn. 5.75% 6/1/17 (AMBAC Insured) | | 1,460 | | 1,626 |
Michigan Hosp. Fin. Auth. Hosp. Rev.: | | | | |
(Mercy Health Svcs. Proj.): | | | | |
Series Q, 5.375% 8/15/26 (Escrowed to Maturity) (g) | | 4,750 | | 4,882 |
Series W, 5.25% 8/15/27 (Escrowed to Maturity) (g) | | 4,000 | | 4,152 |
Series X, 6% 8/15/34 (MBIA Insured) | | 10,675 | | 11,854 |
(Sisters of Mercy Health Corp. Proj.) Series P, 5.375% 8/15/14 (Escrowed to Maturity) (g) | | 420 | | 448 |
(Trinity Health Sys. Proj.) Series 2000 A, 6% 12/1/27 | | 2,000 | | 2,223 |
Michigan Muni. Bond Auth. Rev. (State Revolving Fund Prog.) 5.125% 10/1/20 | | 18,300 | | 19,277 |
Royal Oak Hosp. Fin. Auth. Hosp. Rev. (William Beaumont Hosp. Proj.): | | | | |
Series M, 5.25% 11/15/31 (MBIA Insured) | | 7,000 | | 7,402 |
Municipal Bonds - continued |
| Principal
Amount (000s) | | Value (Note 1)
(000s) |
Michigan - continued |
Royal Oak Hosp. Fin. Auth. Hosp. Rev. (William Beaumont Hosp. Proj.): - continued | | | | |
5.5% 1/1/14 | | $ 3,695 | | $ 3,813 |
6.25% 1/1/09 | | 400 | | 438 |
| | 70,332 |
Minnesota - 1.0% |
Minneapolis & Saint Paul Hsg. & Redev. Auth. Health Care Sys. Rev.: | | | | |
(Health Partners Oblig. Group Proj.) 6% 12/1/18 | | 1,000 | | 1,128 |
(Healthspan Corp. Proj.) Series A, 4.75% 11/15/18 (AMBAC Insured) | | 9,700 | | 9,782 |
Minneapolis Health Care Sys. Rev. (Allina Health Sys. Proj.) Series 2002 A, 6% 11/15/23 | | 6,000 | | 6,713 |
Minnesota Agric. & Econ. Dev. Board Rev. (Health Care Sys. Proj.) Series A: | | | | |
6.375% 11/15/29 | | 375 | | 424 |
6.375% 11/15/29 (Pre-Refunded to 11/15/10 @ 101) (g) | | 11,625 | | 13,583 |
Saint Cloud Health Care Rev. (Saint Cloud Hosp.
Group Oblig. Proj.) Series A, 5.875% 5/1/30
(FSA Insured) | | 8,500 | | 9,496 |
Saint Cloud Hosp. Facilities Rev. (Saint Cloud Hosp. Proj.) Series C, 5.25% 10/1/13 (AMBAC Insured) | | 2,000 | | 2,013 |
Saint Paul Port Auth. Lease Rev. Series 2003 11: | | | | |
5.25% 12/1/18 | | 1,710 | | 1,901 |
5.25% 12/1/19 | | 2,850 | | 3,156 |
Waconia Independent School District #110 Series A, 5% 2/1/15 (FSA Insured) | | 1,155 | | 1,249 |
| | 49,445 |
Mississippi - 0.1% |
Hinds County Rev. (Mississippi Methodist Hosp. & Rehabilitation Proj.) 5.6% 5/1/12 (AMBAC Insured) | | 4,000 | | 4,291 |
Missouri - 0.2% |
Missouri Envir. Impt. & Energy Resources Auth. Wtr. Poll. Cont. & Drinking Wtr. Rev. (State Revolving Fund Prog.): | | | | |
Series 2002 B, 5.5% 7/1/17 | | 1,780 | | 2,020 |
Municipal Bonds - continued |
| Principal
Amount (000s) | | Value (Note 1)
(000s) |
Missouri - continued |
Missouri Envir. Impt. & Energy Resources Auth. Wtr. Poll. Cont. & Drinking Wtr. Rev. (State Revolving Fund Prog.): - continued | | | | |
Series 2003 A: | | | | |
5.125% 1/1/19 | | $ 5,000 | | $ 5,455 |
5.25% 1/1/18 | | 1,280 | | 1,411 |
Missouri Hsg. Dev. Commission Single Family Mtg. Rev. Series C, 5.5% 3/1/16 (f) | | 185 | | 185 |
| | 9,071 |
Montana - 0.4% |
Forsyth Poll. Cont. Rev. (Portland Gen. Elec. Co. Projs.) Series A, 5.2%, tender 5/1/09 (d) | | 7,700 | | 8,130 |
Montana Board of Invt. (Payroll Tax Workers Compensation Prog.): | | | | |
Series 1996: | | | | |
6.875% 6/1/20 (Escrowed to Maturity) (g) | | 1,255 | | 1,371 |
6.875% 6/1/20 (Escrowed to Maturity) (g) | | 3,870 | | 4,227 |
6.875% 6/1/20 (Escrowed to Maturity) (g) | | 2,005 | | 2,190 |
Montana Board of Regents Higher Ed. Rev. (Montana State Univ. Proj.) 5% 11/15/34 (AMBAC Insured) | | 2,000 | | 2,118 |
| | 18,036 |
Nevada - 1.0% |
Clark County Arpt. Rev. Series C: | | | | |
5.375% 7/1/17 (AMBAC Insured) (f) | | 4,310 | | 4,699 |
5.375% 7/1/19 (AMBAC Insured) (f) | | 1,100 | | 1,189 |
5.375% 7/1/21 (AMBAC Insured) (f) | | 1,600 | | 1,717 |
Clark County Gen. Oblig.: | | | | |
Series 2000, 5.5% 7/1/30 (MBIA Insured) | | 4,500 | | 4,878 |
5.5% 7/1/21 (MBIA Insured) | | 1,100 | | 1,199 |
Las Vegas Valley Wtr. District Series B, 5.25% 6/1/17 (MBIA Insured) | | 6,285 | | 6,936 |
Truckee Meadows Wtr. Auth. Wtr. Rev. 5.25% 7/1/34 (FSA Insured) | | 18,855 | | 19,975 |
Washoe County Gen. Oblig. (Reno Sparks Proj.)
Series B: | | | | |
0% 7/1/12 (FSA Insured) | | 4,605 | | 3,535 |
0% 7/1/13 (FSA Insured) | | 4,590 | | 3,369 |
0% 7/1/14 (FSA Insured) | | 3,000 | | 2,103 |
| | 49,600 |
Municipal Bonds - continued |
| Principal
Amount (000s) | | Value (Note 1)
(000s) |
New Hampshire - 0.2% |
Nashua Gen. Oblig. 5.25% 9/15/18 | | $ 1,000 | | $ 1,097 |
New Hampshire Bus. Fin. Auth. Poll. Cont. Rev. (United Illumination Co.) Series A, 3.65%, tender 2/1/10 (AMBAC Insured) (d)(f) | | 6,100 | | 6,102 |
| | 7,199 |
New Jersey - 1.6% |
Evesham Township Muni. Utils. Auth. Rev. Series 2003 A, 5.125% 7/1/14 (AMBAC Insured) | | 2,440 | | 2,690 |
New Jersey Econ. Dev. Auth. Rev. Series 2005 K, 5.5% 12/15/19 (AMBAC Insured) | | 9,500 | | 11,189 |
New Jersey Gen. Oblig. Series 2005 N, 5.25% 7/15/11 (AMBAC Insured) (c) | | 2,890 | | 3,166 |
New Jersey Health Care Facilities Fing. Auth. Rev. (Christ Hosp. Group Issue Proj.) 7% 7/1/06 (Escrowed to Maturity) (g) | | 1,635 | | 1,668 |
New Jersey Tpk. Auth. Tpk. Rev.: | | | | |
Series 2004 A, 3.15%, tender 1/1/10 (AMBAC Insured) (d) | | 10,900 | | 10,895 |
Series A: | | | | |
5.6% 1/1/22 (Pre-Refunded to 1/1/10 @ 100) (g) | | 1,600 | | 1,773 |
5.625% 1/1/15 (Pre-Refunded to 1/1/10 @ 100) (g) | | 1,475 | | 1,636 |
New Jersey Trans. Trust Fund Auth.: | | | | |
Series 2003 C, 5.5% 6/15/16 (Pre-Refunded to 6/15/13 @ 100) (g) | | 2,000 | | 2,302 |
Series B, 5.5% 12/15/21 (MBIA Insured) | | 5,000 | | 5,924 |
North Hudson Swr. Auth. Swr. Rev. Series A: | | | | |
5.25% 8/1/18 (FGIC Insured) | | 3,235 | | 3,591 |
5.25% 8/1/19 (FGIC Insured) | | 2,735 | | 3,011 |
Ocean County Utils. Auth. Wastewtr. Rev. 5.25% 1/1/07 | | 1,265 | | 1,292 |
Tobacco Settlement Fing. Corp.: | | | | |
4.375% 6/1/19 | | 3,270 | | 3,305 |
5.75% 6/1/32 | | 8,980 | | 9,315 |
6.125% 6/1/24 | | 8,500 | | 9,078 |
6.125% 6/1/42 | | 4,500 | | 4,720 |
Warren County Poll. Cont. Fing. Auth. Resource Recovery Rev. 6.55% 12/1/06 (MBIA Insured) | | 1,000 | | 1,015 |
| | 76,570 |
Municipal Bonds - continued |
| Principal
Amount (000s) | | Value (Note 1)
(000s) |
New Mexico - 0.6% |
Albuquerque Arpt. Rev.: | | | | |
6.5% 7/1/08 (AMBAC Insured) (f) | | $ 1,500 | | $ 1,630 |
6.7% 7/1/18 (AMBAC Insured) (f) | | 2,500 | | 2,713 |
6.75% 7/1/09 (AMBAC Insured) (f) | | 1,150 | | 1,289 |
6.75% 7/1/10 (AMBAC Insured) (f) | | 1,700 | | 1,931 |
6.75% 7/1/12 (AMBAC Insured) (f) | | 1,935 | | 2,273 |
Bernalillo County Gross Receipt Tax Rev. 5.25% 10/1/26 | | 5,790 | | 6,134 |
New Mexico Edl. Assistance Foundation Sr. Series A3, 4.95% 3/1/09 (f) | | 5,000 | | 5,259 |
Univ. of New Mexico Univ. Revs. Series A, 6% 6/1/21 | | 5,340 | | 6,478 |
| | 27,707 |
New York - 9.9% |
Erie County Indl. Dev. Agcy. School Facility Rev. (Buffalo City School District Proj.): | | | | |
5.75% 5/1/14 (FSA Insured) | | 3,500 | | 4,050 |
5.75% 5/1/15 (FSA Insured) | | 7,870 | | 9,078 |
5.75% 5/1/16 (FSA Insured) | | 7,120 | | 8,332 |
5.75% 5/1/18 (FSA Insured) | | 12,680 | | 14,669 |
5.75% 5/1/20 (FSA Insured) | | 8,000 | | 9,303 |
5.75% 5/1/21 (FSA Insured) | | 5,420 | | 6,253 |
5.75% 5/1/22 (FSA Insured) | | 1,000 | | 1,164 |
5.75% 5/1/23 (FSA Insured) | | 1,750 | | 1,977 |
5.75% 5/1/24 (FSA Insured) | | 3,000 | | 3,488 |
5.75% 5/1/25 (FSA Insured) | | 3,400 | | 3,934 |
5.75% 5/1/26 (FSA Insured) | | 5,200 | | 6,004 |
Metropolitan Trans. Auth. Dedicated Tax Fund Series A, 5.5% 11/15/26 (FSA Insured) | | 2,200 | | 2,453 |
Metropolitan Trans. Auth. Rev. Series F, 5.25% 11/15/27 (MBIA Insured) | | 3,400 | | 3,693 |
Metropolitan Trans. Auth. Svc. Contract Rev.: | | | | |
Series 2002 A, 5.75% 7/1/31 (AMBAC Insured) | | 3,800 | | 4,298 |
Series A, 5.5% 1/1/20 (MBIA Insured) | | 4,200 | | 4,722 |
Series B, 5.5% 7/1/19 (MBIA Insured) | | 2,000 | | 2,249 |
Series O, 5.75% 7/1/13 (Escrowed to Maturity) (g) | | 14,250 | | 16,072 |
Nassau County Gen. Oblig. Series Z, 5% 9/1/11 (FGIC Insured) | | 2,300 | | 2,484 |
Nassau County Interim Fin. Auth. Series 2000 A, 5.75% 11/15/11 (MBIA Insured) | | 1,000 | | 1,121 |
New York City Gen. Oblig.: | | | | |
Series 2000 A, 6.5% 5/15/11 | | 5,345 | | 6,134 |
Series 2003 A, 5.5% 8/1/20 (MBIA Insured) | | 8,000 | | 9,008 |
Municipal Bonds - continued |
| Principal
Amount (000s) | | Value (Note 1)
(000s) |
New York - continued |
New York City Gen. Oblig.: - continued | | | | |
Series 2003 I, 5.75% 3/1/16 | | $ 5,500 | | $ 6,218 |
Series 2005 J, 5% 3/1/20 | | 14,035 | | 15,056 |
Series A, 5.25% 11/1/14 (MBIA Insured) | | 1,850 | | 2,050 |
Series B, 5.75% 8/1/14 | | 2,000 | | 2,257 |
Series C: | | | | |
5.75% 3/15/27 (FSA Insured) | | 3,060 | | 3,454 |
5.75% 3/15/27 (Pre-Refunded to 3/15/12 @ 100) (g) | | 940 | | 1,085 |
Series E, 6% 8/1/11 | | 165 | | 173 |
Series G, 5.25% 8/1/14 (AMBAC Insured) | | 2,500 | | 2,751 |
New York City Indl. Dev. Agcy. Indl. Dev. Rev. (Japan Airlines Co. Ltd. Proj.) Series 1991, 6% 11/1/15
(FSA Insured) (f) | | 1,485 | | 1,563 |
New York City Indl. Dev. Agcy. Spl. Facilities Rev. (Term. One Group Assoc. Proj.) 6% 1/1/08 (f) | | 500 | | 506 |
New York City Muni. Wtr. Fin. Auth. Wtr. & Swr. Sys. Rev.: | | | | |
Series 2002 A, 5.125% 6/15/34 (FSA Insured) | | 3,300 | | 3,517 |
Series A: | | | | |
5.125% 6/15/34 (MBIA Insured) | | 13,800 | | 14,707 |
6% 6/15/28 (Pre-Refunded to 6/15/12 @ 100) (g) | | 12,500 | | 14,646 |
Series B, 5.125% 6/15/31 | | 10,545 | | 11,115 |
Series G, 5.125% 6/15/32 | | 2,000 | | 2,102 |
New York City Trust Cultural Resources Rev.: | | | | |
(American Museum of Natural History Proj.) Series A, 5.65% 4/1/27 (MBIA Insured) | | 6,500 | | 6,855 |
(Museum of Modern Art Proj.) Series 2001 D, 5.125% 7/1/31 (AMBAC Insured) | | 6,000 | | 6,385 |
New York Local Govt. Assistance Corp. Series C, 5.5% 4/1/17 | | 21,915 | | 25,325 |
New York State Dorm. Auth. Revs.: | | | | |
(City Univ. Sys. Consolidation Proj.): | | | | |
Series A: | | | | |
5.75% 7/1/09 | | 4,370 | | 4,767 |
5.75% 7/1/13 | | 8,750 | | 9,890 |
Series C, 7.5% 7/1/10 (FGIC Insured) | | 24,650 | | 27,310 |
(Long Island Jewish Med. Ctr. Proj.) 5.25% 7/1/11 (MBIA Insured) | | 3,770 | | 4,055 |
(State Univ. Edl. Facilities Proj.) Series A, 5.875% 5/15/17 (FGIC Insured) | | 6,865 | | 8,317 |
(Suffolk County Judicial Facilities Proj.) Series A, 9.5% 4/15/14 | | 690 | | 944 |
Municipal Bonds - continued |
| Principal
Amount (000s) | | Value (Note 1)
(000s) |
New York - continued |
New York State Dorm. Auth. Revs.: - continued | | | | |
Series 2002 A, 5.75% 10/1/17 (MBIA Insured) | | $ 3,000 | | $ 3,428 |
New York State Envir. Facilities Corp. Clean Wtr. & Drinking Wtr. Rev. Series F: | | | | |
4.875% 6/15/18 | | 4,205 | | 4,394 |
4.875% 6/15/20 | | 8,500 | | 8,852 |
5% 6/15/15 | | 3,015 | | 3,199 |
New York State Med. Care Facilities Fin. Agcy. Rev. (Homeowner Mtg. Prog.) Series E, 6.2% 2/15/15 | | 1,385 | | 1,418 |
New York State Thruway Auth. State Personal Income Tax Rev. Series A, 5.5% 3/15/17 | | 3,500 | | 3,905 |
New York State Thruway Auth. Svc. Contract Rev. 5.5% 4/1/16 | | 2,350 | | 2,619 |
New York State Urban Dev. Corp. Rev. Series 2004 A2, 5.5% 3/15/21 (MBIA Insured) | | 14,360 | | 17,037 |
New York Thruway Auth. Second Gen. Hwy. & Bridge Trust Fund Series A, 5.25% 4/1/22 (MBIA Insured) | | 2,190 | | 2,398 |
New York Transitional Fin. Auth. Rev.: | | | | |
Series 2003 D, 5% 2/1/31 | | 3,500 | | 3,682 |
Series A, 5.75% 2/15/16 | | 2,800 | | 3,118 |
Series B, 5.25% 8/1/19 | | 2,000 | | 2,212 |
Niagara Falls City Niagara County Pub. Impt. (Pub. Impt. Proj.) 7.5% 3/1/18 (MBIA Insured) | | 500 | | 693 |
Sales Tax Asset Receivables Corp. Series A, 5.25% 10/15/27 (AMBAC Insured) | | 10,500 | | 11,585 |
Tobacco Settlement Fing. Corp.: | | | | |
Series A1: | | | | |
5.25% 6/1/21 (AMBAC Insured) | | 5,645 | | 6,167 |
5.25% 6/1/22 (AMBAC Insured) | | 3,850 | | 4,198 |
5.5% 6/1/15 | | 33,500 | | 36,415 |
Series C1: | | | | |
5.5% 6/1/14 | | 7,300 | | 7,836 |
5.5% 6/1/20 | | 2,200 | | 2,440 |
Triborough Bridge & Tunnel Auth. (Convention Ctr. Proj.) Series E, 7.25% 1/1/10 (XL Cap. Assurance, Inc. Insured) | | 7,350 | | 8,078 |
Triborough Bridge & Tunnel Auth. Revs.: | | | | |
Series 2005 A, 5.125% 1/1/22 | | 4,000 | | 4,293 |
Series A: | | | | |
5% 1/1/32 (MBIA Insured) | | 3,000 | | 3,152 |
5.25% 1/1/28 (Pre-Refunded to 7/1/22 @ 100) (g) | | 13,315 | | 15,539 |
Municipal Bonds - continued |
| Principal
Amount (000s) | | Value (Note 1)
(000s) |
New York - continued |
Triborough Bridge & Tunnel Auth. Revs.: - continued | | | | |
Series B: | | | | |
5.2% 1/1/27 (Pre-Refunded to 1/1/22 @ 100) (g) | | $ 2,000 | | $ 2,322 |
5.5% 1/1/30 (Pre-Refunded to 1/1/22 @ 100) (g) | | 4,000 | | 4,733 |
Series SR, 5.5% 1/1/12 (Escrowed to Maturity) (g) | | 9,860 | | 10,827 |
| | 470,074 |
New York & New Jersey - 0.1% |
Port Auth. of New York & New Jersey 124th Series, 5% 8/1/13 (FGIC Insured) (f) | | 3,400 | | 3,569 |
North Carolina - 4.8% |
Catawba County Ctfs. of Prtn. (Pub. School and Cmnty. College Proj.) 5.25% 6/1/20 (MBIA Insured) | | 1,800 | | 1,991 |
Dare County Ctfs. of Prtn.: | | | | |
5.25% 6/1/17 (AMBAC Insured) | | 1,620 | | 1,804 |
5.25% 6/1/18 (AMBAC Insured) | | 1,620 | | 1,793 |
5.25% 6/1/19 (AMBAC Insured) | | 1,540 | | 1,704 |
5.25% 6/1/22 (AMBAC Insured) | | 1,620 | | 1,779 |
5.25% 6/1/23 (AMBAC Insured) | | 1,620 | | 1,768 |
North Carolina Cap. Facilities Fin. Agcy. Rev. (Duke Univ. Proj.) Series A: | | | | |
5.125% 10/1/41 | | 6,380 | | 6,697 |
5.125% 7/1/42 | | 34,200 | | 36,110 |
5.25% 7/1/42 | | 9,805 | | 10,460 |
North Carolina Ctfs. of Prtn. (Repair and Renovation Proj.) Series B, 5.25% 6/1/17 | | 3,600 | | 4,023 |
North Carolina Eastern Muni. Pwr. Agcy. Pwr. Sys. Rev.: | | | | |
Series A: | | | | |
5.5% 1/1/11 | | 8,675 | | 9,395 |
5.75% 1/1/26 | | 4,000 | | 4,256 |
Series B: | | | | |
5.875% 1/1/21 (MBIA Insured) | | 22,725 | | 24,126 |
7% 1/1/08 | | 9,650 | | 10,471 |
7.25% 1/1/07 | | 8,375 | | 8,851 |
Series C: | | | | |
5.25% 1/1/09 | | 2,500 | | 2,632 |
5.5% 1/1/07 | | 5,950 | | 6,138 |
7% 1/1/07 | | 15,715 | | 16,551 |
Series D: | | | | |
5.375% 1/1/10 | | 4,500 | | 4,811 |
6.7% 1/1/19 | | 5,000 | | 5,609 |
6.75% 1/1/26 | | 7,000 | | 7,845 |
Municipal Bonds - continued |
| Principal
Amount (000s) | | Value (Note 1)
(000s) |
North Carolina - continued |
North Carolina Infrastructure Fin. Corp. Ctfs. of Prtn. (North Carolina Correctional Facilities Proj.) Series A: | | | | |
5% 2/1/19 | | $ 2,945 | | $ 3,186 |
5% 2/1/20 | | 1,500 | | 1,616 |
North Carolina Muni. Pwr. Agcy. #1 Catawba Elec. Rev.: | | | | |
Series 1992, 7.25% 1/1/07 | | 5,200 | | 5,505 |
Series 1999 B, 6.375% 1/1/08 | | 7,000 | | 7,518 |
Series A: | | | | |
5.125% 1/1/15 (MBIA Insured) | | 6,860 | | 7,180 |
5.125% 1/1/17 (MBIA Insured) | | 31,350 | | 32,998 |
| | 226,817 |
North Dakota - 0.7% |
Mercer County Poll. Cont. Rev. (Antelope Valley Station/Basin Elec. Pwr. Coop. Proj.) 7.2% 6/30/13 (AMBAC Insured) | | 26,000 | | 31,270 |
Ohio - 1.1% |
Cincinnati Gen. Oblig. (Police & Firemen's Disability Proj.) 6% 12/1/35 | | 11,000 | | 12,424 |
Franklin County Hosp. Rev. 5.5% 5/1/28 (AMBAC Insured) | | 4,265 | | 4,656 |
Lakewood Hosp. Impt. Rev. (Lakewood Hosp. Assoc. Proj.) 5.5% 2/15/08 | | 1,225 | | 1,288 |
Montgomery County Rev. (Catholic Health Initiatives Proj.) Series A: | | | | |
6% 12/1/19 | | 4,905 | | 5,539 |
6% 12/1/19 (Escrowed to Maturity) (g) | | 5,095 | | 5,810 |
6% 12/1/26 (Escrowed to Maturity) (g) | | 10,000 | | 11,353 |
Ohio Solid Waste Rev. (Waste Mgmt., Inc. Proj.) 4.85%, tender 11/1/07 (d)(f) | | 5,000 | | 5,126 |
Richland County Hosp. Facilities (MedCentral Health Sys. Proj.) Series B, 6.375% 11/15/30 | | 3,000 | | 3,229 |
Univ. of Cincinnati Ctfs. of Prtn. 5.125% 6/1/28 (MBIA Insured) | | 3,750 | | 3,934 |
| | 53,359 |
Oklahoma - 1.1% |
Cherokee County Econ. Dev. Auth. Series A, 0% 11/1/11 (Escrowed to Maturity) (g) | | 2,080 | | 1,650 |
Oklahoma City Pub. Property Auth. Hotel Tax Rev.: | | | | |
5.5% 10/1/22 (FGIC Insured) | | 2,845 | | 3,200 |
5.5% 10/1/23 (FGIC Insured) | | 3,005 | | 3,370 |
5.5% 10/1/24 (FGIC Insured) | | 3,175 | | 3,552 |
Municipal Bonds - continued |
| Principal
Amount (000s) | | Value (Note 1)
(000s) |
Oklahoma - continued |
Oklahoma Dev. Fin. Auth. Rev. (Saint John Health Sys. Proj.) 6% 2/15/29 | | $ 15,000 | | $ 16,435 |
Oklahoma Industries Auth. Rev. (Health Sys. Oblig. Group Proj.) Series A: | | | | |
5.75% 8/15/29 (MBIA Insured) | | 11,420 | | 12,457 |
5.75% 8/15/29 (Pre-Refunded to 8/15/09 @ 101) (g) | | 8,330 | | 9,307 |
| | 49,971 |
Oregon - 0.7% |
Clackamas County School District #62C, Oregon City Series 2004: | | | | |
5% 6/15/18 (FSA Insured) | | 1,325 | | 1,447 |
5% 6/15/19 (FSA Insured) | | 3,395 | | 3,704 |
Port Morrow Poll. Cont. Rev. (Pacific Northwest Proj.) Series A: | | | | |
8% 7/15/06 | | 385 | | 399 |
8% 7/15/07 | | 430 | | 446 |
8% 7/15/08 | | 480 | | 498 |
8% 7/15/09 | | 540 | | 560 |
8% 7/15/10 | | 605 | | 628 |
8% 7/15/11 | | 385 | | 399 |
Portland Swr. Sys. Rev.: | | | | |
Series 2000 A, 5.75% 8/1/18 (Pre-Refunded to 8/1/10 @ 100) (g) | | 3,000 | | 3,379 |
5.75% 8/1/20 (Pre-Refunded to 8/1/10 @ 100) (g) | | 14,390 | | 16,209 |
Washington County School District #15: | | | | |
5.5% 6/15/20 (FSA Insured) | | 1,770 | | 2,080 |
5.5% 6/15/21 (FSA Insured) | | 1,060 | | 1,245 |
Yamhill County School District #029J Newberg 5.5% 6/15/20 (FGIC Insured) | | 1,000 | | 1,175 |
| | 32,169 |
Pennsylvania - 1.8% |
Allegheny County Arpt. Rev. (Pittsburgh Int'l. Arpt. Proj.) Series A1, 5.75% 1/1/07 (MBIA Insured) (f) | | 6,500 | | 6,727 |
Annville-Cleona School District: | | | | |
5.5% 3/1/24 (FSA Insured) | | 1,350 | | 1,526 |
5.5% 3/1/25 (FSA Insured) | | 1,400 | | 1,579 |
Canon McMillan School District Series 2001 B, 5.75% 12/1/33 (FGIC Insured) | | 3,000 | | 3,351 |
Municipal Bonds - continued |
| Principal
Amount (000s) | | Value (Note 1)
(000s) |
Pennsylvania - continued |
Chester County Health & Ed. Facilities Auth. Health Sys. Rev. (Jefferson Health Sys. Proj.) Series B, 5.25% 5/15/22 (AMBAC Insured) | | $ 4,400 | | $ 4,620 |
Montgomery County Higher Ed. & Health Auth. Hosp. Rev. (Abington Memorial Hosp. Proj.) Series A: | | | | |
6% 6/1/22 (AMBAC Insured) | | 2,000 | | 2,463 |
6.1% 6/1/12 (AMBAC Insured) | | 3,000 | | 3,487 |
6.125% 6/1/14 (AMBAC Insured) | | 5,230 | | 6,219 |
Northumberland County Auth. Commonwealth Lease Rev. (State Correctional Facilities Proj.) 0% 10/15/13 (Escrowed to Maturity) (g) | | 11,455 | | 8,444 |
Pennsylvania Convention Ctr. Auth. Rev. Series A: | | | | |
6.6% 9/1/09 (MBIA Insured) | | 3,000 | | 3,049 |
6.7% 9/1/14 (MBIA Insured) | | 1,500 | | 1,525 |
6.7% 9/1/16 (Escrowed to Maturity) (g) | | 2,000 | | 2,411 |
Pennsylvania Econ. Dev. Fing. Auth. Exempt Facilities Rev.: | | | | |
(Amtrak Proj.) Series 2001 A, 6.375% 11/1/41 (f) | | 8,700 | | 9,276 |
(Shippingport Proj.) Series A, 4.35%, tender 6/1/10 (d)(f) | | 3,100 | | 3,107 |
Pennsylvania Econ. Dev. Fing. Auth. Solid Waste Disp. Rev. (Waste Mgmt., Inc. Proj.) Series 2004 A, 3.95%, tender 11/1/09 (d)(f) | | 5,000 | | 4,976 |
Pennsylvania Higher Edl. Facilities Auth. Rev. (Univ. of Pennsylvania Health Systems Proj.) Series A, 5% 8/15/16 (AMBAC Insured) | | 3,600 | | 3,950 |
Pennsylvania Hsg. Fin. Agcy.: | | | | |
Series 54A, 5.375% 10/1/28 (f) | | 470 | | 474 |
Series C, 8.1% 7/1/13 | | 1,130 | | 1,135 |
Philadelphia Arpt. Rev. Series 1998, 5.375% 6/15/10 (FGIC Insured) (f) | | 4,425 | | 4,754 |
Philadelphia Gen. Oblig. Series 2003 A: | | | | |
5% 2/15/10 (XL Cap. Assurance, Inc. Insured) | | 2,000 | | 2,154 |
5% 2/15/12 (XL Cap. Assurance, Inc. Insured) | | 1,000 | | 1,098 |
Philadelphia Redev. Auth. Rev. (Philadelphia Neighborhood Transformation Initiative Proj.)
Series 2005 C, 5% 4/15/31 (FGIC Insured) | | 3,000 | | 3,176 |
Quaker Valley School District 5.5% 4/1/24
(Pre-Refunded to 4/1/14 @ 100) (g) | | 1,405 | | 1,623 |
West Allegheny School District Series B, 5.25% 2/1/14 (FGIC Insured) | | 2,010 | | 2,273 |
| | 83,397 |
Municipal Bonds - continued |
| Principal
Amount (000s) | | Value (Note 1)
(000s) |
Puerto Rico - 0.5% |
Puerto Rico Commonwealth Hwy. & Trans. Auth. Trans. Rev.: | | | | |
Series 1998, 5.75% 7/1/22 (CIFG North America Insured) | | $ 2,300 | | $ 2,622 |
5.75% 7/1/19 (FGIC Insured) | | 3,240 | | 3,717 |
Puerto Rico Commonwealth Infrastructure Fing. Auth.: | | | | |
Series 2000 A: | | | | |
5.5% 10/1/32 (Escrowed to Maturity) (g) | | 6,900 | | 7,617 |
5.5% 10/1/40 (Escrowed to Maturity) (g) | | 1,200 | | 1,322 |
Series C, 5.5% 7/1/21 (FGIC Insured) | | 3,000 | | 3,575 |
Puerto Rico Elec. Pwr. Auth. Pwr. Rev. Series 2002 KK, 5.5% 7/1/15 (MBIA Insured) | | 3,885 | | 4,553 |
| | 23,406 |
Rhode Island - 0.2% |
Rhode Island Health & Edl. Bldg. Corp. Rev. (Univ. of Rhode Island Univ. Revs. Proj.) Series A: | | | | |
5.25% 9/15/15 (AMBAC Insured) | | 1,725 | | 1,937 |
5.25% 9/15/16 (AMBAC Insured) | | 1,815 | | 2,043 |
5.25% 9/15/18 (AMBAC Insured) | | 1,005 | | 1,116 |
5.5% 9/15/24 (AMBAC Insured) | | 2,000 | | 2,242 |
| | 7,338 |
South Carolina - 1.0% |
Charleston County Gen. Oblig. 6% 6/1/13 (Pre-Refunded to 6/1/06 @ 100) (g) | | 2,500 | | 2,576 |
Lexington County Health Svcs. District, Inc. Hosp. Rev. 6% 11/1/18 | | 3,500 | | 3,975 |
Piedmont Muni. Pwr. Agcy. Elec. Rev. Series B, 5.25% 1/1/11 (MBIA Insured) | | 8,625 | | 9,033 |
Richland County Hosp. Facilities Rev. (Cmnty. Provider Pooled Ln. Prog.) Series A, 7.125% 7/1/17
(Escrowed to Maturity) (g) | | 1,500 | | 1,820 |
Rock Hill Util. Sys. Rev. Series 2003 A: | | | | |
5.375% 1/1/17 (FSA Insured) | | 2,100 | | 2,344 |
5.375% 1/1/23 (FSA Insured) | | 1,025 | | 1,129 |
South Carolina Jobs Econ. Dev. Auth. Hosp. Facilities Rev. (Palmetto Health Alliance Proj.) Series A, 7.375% 12/15/21 (Pre-Refunded to 12/15/10 @ 102) (g) | | 4,000 | | 4,882 |
South Carolina Ports Auth. Ports Rev. 5.5% 7/1/08
(FSA Insured) (f) | | 3,515 | | 3,760 |
Municipal Bonds - continued |
| Principal
Amount (000s) | | Value (Note 1)
(000s) |
South Carolina - continued |
South Carolina Pub. Svc. Auth. Rev.: | | | | |
(Santee Cooper Proj.) Series 2005 B, 5% 1/1/18 (MBIA Insured) (c) | | $ 2,200 | | $ 2,391 |
Series 2005 B, 5% 1/1/19 (MBIA Insured) (c) | | 2,500 | | 2,710 |
Series A: | | | | |
5.5% 1/1/15 (FGIC Insured) (c) | | 5,000 | | 5,716 |
5.75% 1/1/10 (Pre-Refunded to 1/1/06 @ 102) (g) | | 4,705 | | 4,869 |
York County Wtr. & Swr. Rev. 5.25% 12/1/30
(MBIA Insured) | | 1,120 | | 1,204 |
| | 46,409 |
South Dakota - 0.0% |
South Dakota Lease Rev. Series A, 6.625% 9/1/12
(FSA Insured) | | 1,000 | | 1,200 |
Tennessee - 1.2% |
Knox County Health Edl. & Hsg. Facilities Board Hosp. Facilities Rev. (Fort Sanders Alliance Proj.) Series C: | | | | |
5.25% 1/1/15 (MBIA Insured) | | 3,300 | | 3,703 |
5.75% 1/1/14 (MBIA Insured) | | 2,000 | | 2,317 |
7.25% 1/1/10 (MBIA Insured) | | 2,660 | | 3,102 |
Memphis-Shelby County Arpt. Auth. Arpt. Rev.: | | | | |
Series A: | | | | |
6.25% 2/15/09 (MBIA Insured) (f) | | 1,500 | | 1,639 |
6.25% 2/15/10 (MBIA Insured) (f) | | 1,000 | | 1,112 |
6.25% 2/15/11 (MBIA Insured) (f) | | 1,415 | | 1,593 |
Series B, 6.5% 2/15/09 (MBIA Insured) (f) | | 500 | | 550 |
Metropolitan Govt. Nashville & Davidson County Health & Edl. Facilities Board Rev. (Ascension Health Cr. Group Proj.) Series A: | | | | |
5.875% 11/15/28 (Pre-Refunded to 11/15/09 @ 101) (g) | | 3,100 | | 3,478 |
6% 11/15/30 (Pre-Refunded to 11/15/09 @ 101) (g) | | 4,400 | | 4,959 |
Metropolitan Govt. Nashville & Davidson County Wtr. & Swr. Sys. Rev. 7.7% 1/1/12 (FGIC Insured) | | 5,600 | | 6,721 |
Shelby County Health Edl. & Hsg. Facility Board Hosp. Rev. (Methodist Hosp. Proj.): | | | | |
6.5% 9/1/26 (Escrowed to Maturity) (g) | | 8,410 | | 9,896 |
6.5% 9/1/26 (Pre-Refunded to 9/1/12 @ 100) (g) | | 14,090 | | 16,921 |
| | 55,991 |
Municipal Bonds - continued |
| Principal
Amount (000s) | | Value (Note 1)
(000s) |
Texas - 13.0% |
Aledo Independent School District Series A, 5.125% 2/15/33 | | $ 2,775 | | $ 2,956 |
Argyle Independent School District 5.25% 8/15/40 (FSA Insured) | | 1,745 | | 1,880 |
Arlington Gen. Oblig. 5% 8/15/18 (FGIC Insured) | | 1,215 | | 1,319 |
Austin Independent School District: | | | | |
5.25% 8/1/10 (c) | | 5,245 | | 5,600 |
5.25% 8/1/11 (c) | | 2,000 | | 2,153 |
5.25% 8/1/15 (c) | | 2,000 | | 2,190 |
Austin Util. Sys. Rev. 0% 5/15/10 (MBIA Insured) | | 7,970 | | 6,750 |
Austin Wtr. & Wastewtr. Sys. Rev. 5.5% 5/15/16 (Pre-Refunded to 5/15/10 @ 100) (g) | | 2,200 | | 2,446 |
Bexar Metropolitan Wtr. District Wtrwks. Sys. Rev. 5.375% 5/1/20 (FSA Insured) | | 1,660 | | 1,826 |
Birdville Independent School District: | | | | |
0% 2/15/11 | | 8,665 | | 7,082 |
0% 2/15/13 | | 13,690 | | 10,227 |
Boerne Independent School District 5.25% 2/1/35 | | 7,900 | | 8,491 |
Brazos River Auth. Poll. Cont. Rev. (Texas Utils. Elec. Co. Proj.) Series 1995 B, 5.05%, tender 6/19/06 (d)(f) | | 4,815 | | 4,885 |
Canyon Independent School District Series A, 5.5% 2/15/21 | | 1,855 | | 2,067 |
Cedar Hill Independent School District 0% 8/15/09 | | 1,575 | | 1,343 |
Clint Independent School District: | | | | |
5.5% 8/15/19 | | 1,055 | | 1,178 |
5.5% 8/15/20 | | 1,110 | | 1,234 |
5.5% 8/15/21 | | 1,175 | | 1,305 |
Conroe Independent School District: | | | | |
Series B, 0% 2/15/10 | | 2,805 | | 2,394 |
0% 2/15/11 | | 1,500 | | 1,226 |
Corpus Christi Util. Sys. Rev.: | | | | |
5.25% 7/15/18 (FSA Insured) | | 3,305 | | 3,744 |
5.25% 7/15/19 (FSA Insured) | | 4,000 | | 4,506 |
Corsicana Independent School District 5.125% 2/15/34 (c) | | 2,750 | | 2,940 |
Cypress-Fairbanks Independent School District: | | | | |
Series A: | | | | |
0% 2/15/12 | | 20,900 | | 16,318 |
0% 2/15/13 | | 6,425 | | 4,800 |
0% 2/15/14 | | 11,465 | | 8,125 |
0% 2/15/16 | | 9,700 | | 6,241 |
5.75% 2/15/19 | | 4,400 | | 4,941 |
Municipal Bonds - continued |
| Principal
Amount (000s) | | Value (Note 1)
(000s) |
Texas - continued |
Cypress-Fairbanks Independent School District: - continued | | | | |
5.75% 2/15/21 | | $ 1,000 | | $ 1,117 |
Dallas Independent School District: | | | | |
Series 2005, 5.25% 8/15/10 (c) | | 2,810 | | 3,077 |
Series 5, 5.25% 8/15/13 (c) | | 1,000 | | 1,120 |
Denton County Lewisville Independent School District Series 2004, 5% 8/15/16 | | 3,465 | | 3,743 |
Duncanville Independent School District 5.65% 2/15/28 | | 5,550 | | 6,165 |
Edinburg Consolidated Independent School District 5.5% 2/15/30 | | 5,025 | | 5,425 |
Fort Worth Wtr. & Swr. Rev. 5% 2/15/16 (FSA Insured) | | 6,000 | | 6,580 |
Frisco Independent School District: | | | | |
Series C: | | | | |
5% 8/15/22 (c) | | 2,000 | | 2,153 |
5% 8/15/26 (c) | | 3,765 | | 4,017 |
5.375% 8/15/17 | | 2,715 | | 3,015 |
Garland Independent School District Series A, 4% 2/15/17 | | 5,000 | | 5,015 |
Garland Wtr. & Swr. Rev. 5.25% 3/1/23 (AMBAC Insured) | | 1,315 | | 1,427 |
Guadalupe-Blanco River Auth. Contract Rev. (Western Canyon Reg'l. Wtr. Supply Proj.): | | | | |
5.25% 4/15/15 (MBIA Insured) | | 1,570 | | 1,749 |
5.25% 4/15/16 (MBIA Insured) | | 1,680 | | 1,864 |
5.25% 4/15/17 (MBIA Insured) | | 2,295 | | 2,537 |
5.25% 4/15/18 (MBIA Insured) | | 1,915 | | 2,104 |
5.25% 4/15/19 (MBIA Insured) | | 1,000 | | 1,099 |
5.25% 4/15/20 (MBIA Insured) | | 1,565 | | 1,713 |
Harlandale Independent School District: | | | | |
5.5% 8/15/35 | | 3,625 | | 3,935 |
5.7% 8/15/30 | | 6,290 | | 6,969 |
6% 8/15/16 | | 35 | | 39 |
Harris County Gen. Oblig.: | | | | |
0% 10/1/13 (MBIA Insured) | | 5,550 | | 4,034 |
0% 10/1/14 (MBIA Insured) | | 11,000 | | 7,609 |
0% 8/15/25 (MBIA Insured) | | 3,000 | | 1,179 |
0% 8/15/28 (MBIA Insured) | | 5,000 | | 1,667 |
Harris County Health Facilities Dev. Corp. Rev. (Saint Luke's Episcopal Hosp. Proj.) Series 2001 A: | | | | |
5.375% 2/15/26 | | 3,000 | | 3,144 |
5.625% 2/15/13 | | 4,625 | | 5,094 |
Municipal Bonds - continued |
| Principal
Amount (000s) | | Value (Note 1)
(000s) |
Texas - continued |
Harris County Hosp. District Mtg. Rev.: | | | | |
7.4% 2/15/10 (AMBAC Insured) | | $ 1,340 | | $ 1,481 |
7.4% 2/15/10 (Escrowed to Maturity) (g) | | 695 | | 751 |
Houston Area Wtr. Corp. Contract Rev. (Northeast Wtr. Purification Proj.) 5.5% 3/1/15 (FGIC Insured) | | 1,985 | | 2,224 |
Houston Arpt. Sys. Rev.: | | | | |
Series A: | | | | |
5.625% 7/1/20 (FSA Insured) (f) | | 2,000 | | 2,184 |
5.625% 7/1/21 (FSA Insured) (f) | | 3,350 | | 3,651 |
6% 7/1/08 (FGIC Insured) (f) | | 1,000 | | 1,076 |
Series B, 5.5% 7/1/30 (FSA Insured) | | 10,645 | | 11,505 |
Houston Independent School District: | | | | |
Series A, 0% 8/15/11 | | 6,400 | | 5,122 |
0% 8/15/13 | | 9,835 | | 7,162 |
Humble Independent School District Series 2005 B, 5.25% 2/15/22 (FGIC Insured) | | 1,995 | | 2,189 |
Hurst Euless Bedford Independent School District: | | | | |
0% 8/15/11 | | 3,620 | | 2,897 |
0% 8/15/12 | | 5,105 | | 3,901 |
0% 8/15/13 | | 3,610 | | 2,639 |
Katy Independent School District: | | | | |
Series A, 5% 2/15/16 | | 2,500 | | 2,726 |
0% 8/15/11 | | 4,170 | | 3,337 |
Keller Independent School District: | | | | |
Series 1996 A, 0% 8/15/17 | | 2,000 | | 1,196 |
Series A, 5.125% 8/15/25 | | 3,000 | | 3,046 |
Kennedale Independent School District 5.5% 2/15/29 | | 3,335 | | 3,676 |
Killeen Independent School District: | | | | |
5.25% 2/15/17 | | 2,105 | | 2,308 |
5.25% 2/15/18 | | 1,325 | | 1,447 |
La Joya Independent School District: | | | | |
5.25% 2/15/23 | | 2,940 | | 3,212 |
5.5% 2/15/22 | | 8,140 | | 8,841 |
Little Elm Independent School District 5.5% 8/15/21 | | 2,540 | | 2,804 |
Lower Colorado River Auth. Rev.: | | | | |
5.25% 1/1/15 (Escrowed to Maturity) (g) | | 6,260 | | 7,127 |
5.25% 5/15/18 (AMBAC Insured) | | 2,020 | | 2,222 |
Lower Colorado River Auth. Transmission Contract Rev. (LCRA Transmission Services Corp. Proj.) Series C: | | | | |
5.25% 5/15/18 (AMBAC Insured) | | 1,000 | | 1,100 |
5.25% 5/15/19 (AMBAC Insured) | | 1,000 | | 1,100 |
5.25% 5/15/20 (AMBAC Insured) | | 2,000 | | 2,191 |
Municipal Bonds - continued |
| Principal
Amount (000s) | | Value (Note 1)
(000s) |
Texas - continued |
Mansfield Independent School District 5.5% 2/15/18 | | $ 3,855 | | $ 4,277 |
Mesquite Independent School District 5.375% 8/15/11 | | 1,385 | | 1,477 |
Midlothian Independent School District 0% 2/15/10 | | 1,525 | | 1,301 |
Midway Independent School District 0% 8/15/19 | | 3,600 | | 1,943 |
Montgomery County Gen. Oblig. Series A, 5.625% 3/1/20 (FSA Insured) | | 3,800 | | 4,240 |
Navasota Independent School District: | | | | |
5.25% 8/15/34 (FGIC Insured) | | 2,275 | | 2,456 |
5.5% 8/15/25 (FGIC Insured) | | 1,675 | | 1,865 |
North Central Health Facilities Dev. Corp. Rev. Series 1997 B, 5.75% 2/15/14 (MBIA Insured) | | 5,215 | | 6,030 |
Northside Independent School District 5.5% 2/15/12 | | 3,715 | | 4,136 |
Pflugerville Gen. Oblig. 5.5% 8/1/22 (AMBAC Insured) | | 1,000 | | 1,112 |
Prosper Independent School District 5.75% 8/15/29 | | 1,250 | | 1,411 |
Robstown Independent School District 5.25% 2/15/29 | | 3,165 | | 3,419 |
Rockwall Independent School District: | | | | |
5.375% 2/15/19 | | 1,450 | | 1,593 |
5.375% 2/15/20 | | 1,230 | | 1,350 |
5.375% 2/15/21 | | 1,560 | | 1,706 |
5.625% 2/15/12 | | 4,090 | | 4,580 |
5.625% 2/15/13 | | 1,190 | | 1,331 |
5.625% 2/15/14 | | 1,160 | | 1,295 |
Round Rock Independent School District: | | | | |
Series 2001 A, 5.5% 8/1/16 (Pre-Refunded to 8/1/11 @ 100) (g) | | 2,305 | | 2,601 |
0% 8/15/11 (MBIA Insured) | | 4,300 | | 3,452 |
Sabine River Auth. Poll. Cont. Rev. (Texas Utils. Elec. Co. Proj.) Series B, 5.75%, tender 11/1/11 (d)(f) | | 16,000 | | 17,212 |
San Antonio Elec. & Gas Systems Rev.: | | | | |
Series B: | | | | |
0% 2/1/10 (Escrowed to Maturity) (g) | | 19,000 | | 16,300 |
0% 2/1/12 (Escrowed to Maturity) (g) | | 7,000 | | 5,511 |
5.375% 2/1/18 (Pre-Refunded to 2/1/12 @ 100) (g) | | 5,000 | | 5,571 |
5.375% 2/1/19 (Pre-Refunded to 2/1/12 @ 100) (g) | | 6,000 | | 6,685 |
San Antonio Gen. Oblig.: | | | | |
5.5% 2/1/15 | | 1,975 | | 2,207 |
5.5% 2/1/15 (Pre-Refunded to 2/1/12 @ 100) (g) | | 25 | | 28 |
San Antonio Wtr. Sys. Rev.: | | | | |
5.875% 5/15/19 | | 3,000 | | 3,324 |
6.5% 5/15/10 (Escrowed to Maturity) (g) | | 440 | | 509 |
Snyder Independent School District: | | | | |
5.25% 2/15/21 (AMBAC Insured) | | 1,035 | | 1,150 |
Municipal Bonds - continued |
| Principal
Amount (000s) | | Value (Note 1)
(000s) |
Texas - continued |
Snyder Independent School District: - continued | | | | |
5.25% 2/15/22 (AMBAC Insured) | | $ 1,090 | | $ 1,205 |
5.25% 2/15/30 (AMBAC Insured) | | 1,750 | | 1,894 |
Socorro Independent School District 5.375% 8/15/18 | | 1,090 | | 1,197 |
South San Antonio Independent School District 5% 8/15/17 | | 1,025 | | 1,108 |
Southlake Gen. Oblig. Series 2000 D, 5.75% 2/15/21 (AMBAC Insured) | | 2,345 | | 2,572 |
Southwest Higher Ed. Auth. Rev. (Southern Methodist Univ. Proj.) 5.5% 10/1/17 (AMBAC Insured) | | 3,825 | | 4,302 |
Spring Branch Independent School District: | | | | |
Series 2001: | | | | |
5.375% 2/1/12 | | 2,000 | | 2,207 |
5.375% 2/1/13 | | 3,130 | | 3,460 |
5.375% 2/1/18 | | 3,600 | | 3,925 |
Tarrant County Health Facilities Dev. Corp. Hosp. Rev. 5.375% 11/15/20 | | 5,750 | | 5,998 |
Texas Gen. Oblig.: | | | | |
(College Student Ln. Prog.) 5% 8/1/12 (f) | | 6,655 | | 7,061 |
5.25% 10/1/11 | | 7,150 | | 7,600 |
5.75% 8/1/26 | | 5,000 | | 5,604 |
Texas Pub. Fin. Auth. Bldg. Rev.: | | | | |
Series 1990: | | | | |
0% 2/1/12 (MBIA Insured) | | 4,400 | | 3,440 |
0% 2/1/14 (MBIA Insured) | | 6,900 | | 4,898 |
0% 2/1/09 (MBIA Insured) | | 2,000 | | 1,778 |
Texas Tpk. Auth. Central Tpk. Sys. Rev.: | | | | |
5.5% 8/15/39 (AMBAC Insured) | | 37,550 | | 41,076 |
5.75% 8/15/38 (AMBAC Insured) | | 27,550 | | 31,051 |
Texas Tpk. Auth. Dallas North Tollway Rev.: | | | | |
0% 1/1/10 (Escrowed to Maturity) (g) | | 3,000 | | 2,589 |
5.25% 1/1/23 (FGIC Insured) | | 18,775 | | 19,356 |
Texas Wtr. Dev. Board Rev. Series B: | | | | |
5.375% 7/15/16 | | 5,000 | | 5,437 |
5.625% 7/15/21 | | 5,900 | | 6,451 |
Trinity River Auth. Rev. (Tarrant County Wtr. Proj.): | | | | |
5.5% 2/1/19 (MBIA Insured) | | 1,665 | | 1,859 |
5.5% 2/1/22 (MBIA Insured) | | 2,000 | | 2,211 |
Tyler Health Facilities Dev. Corp. Hosp. Rev. (Mother Frances Hosp. Reg'l. Health Care Ctr. Proj.): | | | | |
5.75% 7/1/27 | | 1,000 | | 1,050 |
6% 7/1/31 | | 6,225 | | 6,599 |
Municipal Bonds - continued |
| Principal
Amount (000s) | | Value (Note 1)
(000s) |
Texas - continued |
United Independent School District 5.25% 8/15/22
(Pre-Refunded to 8/15/12 @ 100) (g) | | $ 4,340 | | $ 4,881 |
Weatherford Independent School District: | | | | |
Series 2000, 0% 2/15/25 (Pre-Refunded to 2/15/10 @ 36.782) (g) | | 6,155 | | 1,946 |
0% 2/15/22 (Pre-Refunded to 2/15/10 @ 45.084) (g) | | 2,980 | | 1,155 |
0% 2/15/26 (Pre-Refunded to 2/15/10 @ 34.41) (g) | | 2,985 | | 883 |
0% 2/15/33 | | 6,985 | | 1,821 |
White Settlement Independent School District: | | | | |
5.75% 8/15/30 | | 2,890 | | 3,267 |
5.75% 8/15/34 | | 2,400 | | 2,705 |
Wichita Falls Wtr. & Swr. Rev. Series 2001, 5.375% 8/1/24 (AMBAC Insured) | | 3,000 | | 3,245 |
Williamson County Gen. Oblig.: | | | | |
5.5% 2/15/18 (FSA Insured) | | 60 | | 66 |
5.5% 2/15/18 (Pre-Refunded to 2/15/11 @ 100) (g) | | 3,945 | | 4,422 |
5.5% 2/15/20 (FSA Insured) | | 65 | | 72 |
5.5% 2/15/20 (Pre-Refunded to 2/15/11 @ 100) (g) | | 4,455 | | 4,994 |
| | 616,329 |
Utah - 2.5% |
Intermountain Pwr. Agcy. Pwr. Supply Rev.: | | | | |
Series A: | | | | |
6% 7/1/16 (AMBAC Insured) | | 5,640 | | 6,074 |
6% 7/1/16 (Escrowed to Maturity) (g) | | 9,205 | | 9,793 |
Series B: | | | | |
5.75% 7/1/16 (MBIA Insured) | | 30,260 | | 32,441 |
6% 7/1/16 (MBIA Insured) | | 29,500 | | 31,001 |
Series D, 5% 7/1/21 (MBIA Insured) | | 12,100 | | 12,489 |
Salt Lake City Hosp. Rev. (Intermountain Health Care Hosp., Inc. Proj.) Series A, 8.125% 5/15/15 (Escrowed to Maturity) (g) | | 2,975 | | 3,730 |
Salt Lake City School District Series B, 5% 3/1/14 | | 3,270 | | 3,649 |
Salt Lake County Hosp. Rev. (IHC Health Svcs., Inc. Proj.) 5.5% 5/15/11 (AMBAC Insured) | | 9,000 | | 10,031 |
Utah Associated Muni. Pwr. Sys. Rev. (Payson Pwr. Proj.) Series A: | | | | |
5.25% 4/1/16 (FSA Insured) | | 3,590 | | 3,979 |
5.25% 4/1/17 (FSA Insured) | | 4,335 | | 4,786 |
| | 117,973 |
Municipal Bonds - continued |
| Principal
Amount (000s) | | Value (Note 1)
(000s) |
Vermont - 0.3% |
Vermont Edl. & Health Bldgs. Fing. Agcy. Rev. (Fletcher Allen Health Care, Inc. Proj.): | | | | |
Series 2000 A, 6.125% 12/1/27 (AMBAC Insured) | | $ 8,600 | | $ 9,783 |
Series A, 5.75% 12/1/18 (AMBAC Insured) | | 3,100 | | 3,479 |
| | 13,262 |
Virginia - 0.2% |
Amelia County Indl. Dev. Auth. Solid Waste Disp. Rev. (Waste Mgmt., Inc. Proj.) 4.05%, tender 4/1/08 (d)(f) | | 2,200 | | 2,208 |
Peninsula Ports Auth. Hosp. Facilities Rev. (Whittaker Memorial Hosp. Proj.) 8.7% 8/1/23 | | 1,470 | | 1,741 |
Virginia Beach Dev. Auth. Hosp. Facilities Rev. (Virginia Beach Gen. Hosp. Proj.): | | | | |
6% 2/15/12 (AMBAC Insured) | | 2,150 | | 2,480 |
6% 2/15/13 (AMBAC Insured) | | 1,460 | | 1,705 |
Virginia Hsg. Dev. Auth. Multi-family Hsg. Rev. Series I, 5.95% 5/1/09 (f) | | 1,890 | | 1,946 |
| | 10,080 |
Washington - 6.2% |
Chelan County Pub. Util. District #1 Columbia River-Rock Island Hydro-Elec. Sys. Rev. Series A: | | | | |
0% 6/1/17 (MBIA Insured) | | 7,200 | | 4,274 |
0% 6/1/29 (MBIA Insured) | | 14,995 | | 4,649 |
Chelan County Pub. Util. District #1 Rev. Series 2005 A, 5.125%, tender 7/1/15 (FGIC Insured) (d)(f) | | 2,430 | | 2,641 |
Chelan County School District #246, Wenatchee 5.5% 12/1/19 (FSA Insured) | | 3,535 | | 3,935 |
Clark County School District #37, Vancouver Series C, 0% 12/1/19 (FGIC Insured) | | 2,000 | | 1,064 |
Douglas County Pub. Util. District #1 Wells Hydroelectric Rev. Series A, 8.75% 9/1/18 | | 2,790 | | 3,135 |
Energy Northwest Elec. Rev.: | | | | |
(#1 Proj.) Series 2001 A, 5.5% 7/1/12 (FSA Insured) | | 5,000 | | 5,591 |
(#3 Proj.) Series B, 6% 7/1/16 (AMBAC Insured) | | 28,000 | | 32,286 |
Grant County Pub. Util. District #2 Wanapum Hydro Elec. Rev. Series B: | | | | |
5.25% 1/1/18 (FGIC Insured) (f) | | 1,590 | | 1,731 |
5.25% 1/1/20 (FGIC Insured) (f) | | 1,760 | | 1,892 |
5.25% 1/1/23 (FGIC Insured) (f) | | 2,055 | | 2,186 |
King County Swr. Rev. Series B, 5.125% 1/1/33 (FSA Insured) | | 22,390 | | 23,555 |
Municipal Bonds - continued |
| Principal
Amount (000s) | | Value (Note 1)
(000s) |
Washington - continued |
Mead School District #354, Spokane County 5.375% 12/1/19 (FSA Insured) | | $ 2,575 | | $ 2,885 |
Pierce County School District #10 Tacoma Series A, 5% 12/1/18 (FSA Insured) | | 4,000 | | 4,388 |
Port of Seattle Rev.: | | | | |
Series B: | | | | |
5.5% 9/1/09 (FGIC Insured) (f) | | 3,800 | | 3,957 |
5.6% 9/1/10 (FGIC Insured) (f) | | 4,005 | | 4,176 |
5.6% 9/1/10 (Pre-Refunded to 9/1/06 @ 101) (f)(g) | | 225 | | 234 |
Series D: | | | | |
5.75% 11/1/13 (FGIC Insured) (f) | | 1,500 | | 1,688 |
5.75% 11/1/14 (FGIC Insured) (f) | | 3,055 | | 3,428 |
5.75% 11/1/16 (FGIC Insured) (f) | | 2,250 | | 2,513 |
Seattle Wtr. Sys. Rev. Series B, 5.75% 7/1/23
(FGIC Insured) | | 3,175 | | 3,500 |
Snohomish County Pub. Hosp. District #2 (Stevens Health Care Proj.) 4.5% 12/1/11 (FGIC Insured) | | 1,155 | | 1,229 |
Snohomish County School District #2, Everett 5.5% 12/1/16 (FSA Insured) | | 1,475 | | 1,657 |
Snohomish County School District #4, Lake Stevens 5.125% 12/1/19 (FGIC Insured) | | 1,875 | | 2,071 |
Spokane Pub. Facilities District Hotel/Motel Tax & Sales/Use Tax Rev. 5.75% 12/1/19 (MBIA Insured) | | 2,000 | | 2,330 |
Tacoma Elec. Sys. Rev.: | | | | |
Series 2001 A, 5.75% 1/1/20 (FSA Insured) | | 6,500 | | 7,261 |
Series A, 5.625% 1/1/21 (FSA Insured) | | 10,000 | | 11,056 |
Thurston & Pierce Counties Cmnty. Schools 5.25% 12/1/17 (FSA Insured) | | 2,000 | | 2,212 |
Washington Gen. Oblig.: | | | | |
Series 2000 A, 5.625% 7/1/24 | | 5,185 | | 5,630 |
Series 2001 C, 5.25% 1/1/16 | | 7,070 | | 7,745 |
Series C, 5.25% 1/1/26 (FSA Insured) | | 15,800 | | 16,949 |
Series R 97A: | | | | |
0% 7/1/17 | | 7,015 | | 4,183 |
0% 7/1/19 (MBIA Insured) | | 9,100 | | 4,931 |
Washington Health Care Facilities Auth. Rev.
(Providence Health Systems Proj.) Series A, 5.5% 10/1/12 (MBIA Insured) | | 5,455 | | 6,042 |
Washington Pub. Pwr. Supply Sys. Nuclear Proj. #1 Rev.: | | | | |
(Bonneville Pwr. Administration Proj.) Series B, 7% 7/1/08 | | 1,000 | | 1,113 |
Municipal Bonds - continued |
| Principal
Amount (000s) | | Value (Note 1)
(000s) |
Washington - continued |
Washington Pub. Pwr. Supply Sys. Nuclear Proj. #1 Rev.: - continued | | | | |
Series A: | | | | |
5.75% 7/1/10 (MBIA Insured) | | $ 5,000 | | $ 5,240 |
7% 7/1/08 | | 310 | | 345 |
Series B, 5.125% 7/1/13 | | 14,600 | | 15,449 |
Washington Pub. Pwr. Supply Sys. Nuclear Proj. #2 Rev.: | | | | |
Series A: | | | | |
0% 7/1/11 (Escrowed to Maturity) (g) | | 1,350 | | 1,080 |
5.125% 7/1/11 (FSA Insured) | | 10,420 | | 11,028 |
5.4% 7/1/12 | | 56,550 | | 63,307 |
Washington Pub. Pwr. Supply Sys. Nuclear Proj. #3 Rev.: | | | | |
Series A, 0% 7/1/12 (MBIA Insured) | | 4,000 | | 3,017 |
0% 7/1/08 (MBIA Insured) | | 3,000 | | 2,720 |
0% 7/1/10 (MBIA Insured) | | 2,800 | | 2,338 |
| | 292,641 |
West Virginia - 0.6% |
Marshall County Poll. Cont. Rev. (Ohio Pwr. Co./Kammer Plant Proj.) Series B, 5.45% 7/1/14 (MBIA Insured) | | 22,650 | | 22,925 |
West Virginia Wtr. Dev. Auth. Infrastructure Rev. Series A, 5.625% 10/1/26 (FSA Insured) | | 5,000 | | 5,503 |
| | 28,428 |
Wisconsin - 0.9% |
Badger Tobacco Asset Securitization Corp. 6.125% 6/1/27 | | 5,905 | | 6,263 |
Douglas County Gen. Oblig.: | | | | |
5.5% 2/1/19 (FGIC Insured) | | 1,035 | | 1,148 |
5.5% 2/1/19 (Pre-Refunded to 2/1/12 @ 100) (g) | | 2,120 | | 2,404 |
Evansville Cmnty. School District: | | | | |
5% 4/1/14 (FSA Insured) | | 1,980 | | 2,207 |
5% 4/1/15 (FSA Insured) | | 2,200 | | 2,459 |
Wisconsin Gen. Oblig. Series 1: | | | | |
5.25% 5/1/12 (MBIA Insured) (c) | | 4,000 | | 4,385 |
5.25% 5/1/13 (MBIA Insured) (c) | | 2,000 | | 2,208 |
Wisconsin Health & Edl. Facilities Auth. Rev. (Wheaton Franciscan Svcs., Inc. Proj.): | | | | |
Series A: | | | | |
5.5% 8/15/15 | | 1,480 | | 1,621 |
5.5% 8/15/16 | | 1,545 | | 1,687 |
5.75% 8/15/30 | | 14,250 | | 15,313 |
Municipal Bonds - continued |
| Principal
Amount (000s) | | Value (Note 1)
(000s) |
Wisconsin - continued |
Wisconsin Health & Edl. Facilities Auth. Rev. (Wheaton Franciscan Svcs., Inc. Proj.): - continued | | | | |
6.25% 8/15/22 | | $ 4,300 | | $ 4,784 |
Wisconsin Hsg. & Econ. Dev. Auth. Home Ownership Rev. Series F, 5.2% 9/1/26 (f) | | 30 | | 30 |
| | 44,509 |
Wyoming - 0.1% |
Gillette Spl. Purp. Wtr. & Swr. Utils. Sys. Rev. 7.7% 12/1/10 (Escrowed to Maturity) (g) | | 5,080 | | 6,049 |
TOTAL MUNICIPAL BONDS (Cost $4,431,786) | 4,721,627 |
Money Market Funds - 0.0% |
| | Shares | | |
Fidelity Municipal Cash Central Fund, 2.55% (a)(e)
(Cost $139) | | 138,900 | | 139 |
TOTAL INVESTMENT PORTFOLIO - 99.8% (Cost $4,431,925) | | | 4,721,766 |
NET OTHER ASSETS - 0.2% | | | 9,595 |
NET ASSETS - 100% | | $ 4,731,361 |
Legend |
(a) Affiliated fund that is available only to investment companies and other accounts managed by Fidelity Investments. The rate quoted is the annualized seven-day yield of the fund at period end. A complete listing of the fund's holdings as of its most recent quarter end is available upon request. |
(b) Debt obligation initially issued in zero coupon form which converts to coupon form at a specified rate and date. The rate shown is the rate at period end. |
(c) Security or a portion of the security purchased on a delayed delivery or when-issued basis. |
(d) The coupon rate shown on floating or adjustable rate securities represents the rate at period end. |
(e) Information in this report regarding holdings by state and security types does not reflect the holdings of the Fidelity Municipal Cash Central Fund. |
(f) Private activity obligations whose interest is subject to the federal alternative minimum tax for individuals. |
(g) Security collateralized by an amount sufficient to pay interest and principal. |
Other Information |
The distribution of municipal securities by revenue source, as a percentage of total net assets, is as follows: |
General Obligations | 33.3% |
Electric Utilities | 14.7% |
Water & Sewer | 10.5% |
Escrowed/Pre-Refunded | 10.2% |
Health Care | 10.1% |
Transportation | 9.0% |
Special Tax | 5.1% |
Others* (individually less than 5%) | 7.1% |
| 100.0% |
* Includes net other assets |
See accompanying notes which are an integral part of the financial statements.
Semiannual Report
Financial Statements
Statement of Assets and Liabilities
Amounts in thousands (except per-share amount) | June 30, 2005 (Unaudited) |
| | |
Assets | | |
Investment in securities, at value (cost $4,431,925) - See accompanying schedule | | $ 4,721,766 |
Cash | | 18,298 |
Receivable for investments sold
Regular delivery | | 294 |
Delayed delivery | | 1,122 |
Receivable for fund shares sold | | 2,904 |
Interest receivable | | 67,950 |
Prepaid expenses | | 10 |
Other receivables | | 31 |
Total assets | | 4,812,375 |
| | |
Liabilities | | |
Payable for investments purchased
Regular delivery | $ 8,876 | |
Delayed delivery | 60,306 | |
Payable for fund shares redeemed | 4,507 | |
Distributions payable | 5,445 | |
Accrued management fee | 1,470 | |
Other affiliated payables | 376 | |
Other payables and accrued expenses | 34 | |
Total liabilities | | 81,014 |
| | |
Net Assets | | $ 4,731,361 |
Net Assets consist of: | | |
Paid in capital | | $ 4,410,031 |
Undistributed net investment income | | 366 |
Accumulated undistributed net realized gain (loss) on investments | | 31,123 |
Net unrealized appreciation (depreciation) on investments | | 289,841 |
Net Assets, for 359,467 shares outstanding | | $ 4,731,361 |
Net Asset Value, offering price and redemption price per share ($4,731,361 ÷ 359,467 shares) | | $ 13.16 |
See accompanying notes which are an integral part of the financial statements.
Semiannual Report
Statement of Operations
Amounts in thousands | Six months ended June 30, 2005 (Unaudited) |
| | |
Investment Income | | |
Interest | | $ 109,290 |
| | |
Expenses | | |
Management fee | $ 8,726 | |
Transfer agent fees | 1,800 | |
Accounting fees and expenses | 311 | |
Independent trustees' compensation | 11 | |
Custodian fees and expenses | 36 | |
Registration fees | 52 | |
Audit | 43 | |
Legal | 4 | |
Miscellaneous | 18 | |
Total expenses before reductions | 11,001 | |
Expense reductions | (198) | 10,803 |
Net investment income | | 98,487 |
Realized and Unrealized Gain (Loss) Net realized gain (loss) on investment securities | | 34,765 |
Change in net unrealized appreciation (depreciation) on investment securities | | 7,145 |
Net gain (loss) | | 41,910 |
Net increase (decrease) in net assets resulting from operations | | $ 140,397 |
See accompanying notes which are an integral part of the financial statements.
Semiannual Report
Financial Statements - continued
Statement of Changes in Net Assets
Amounts in thousands | Six months ended
June 30, 2005
(Unaudited) | Year ended
December 31,
2004 |
Increase (Decrease) in Net Assets | | |
Operations | | |
Net investment income | $ 98,487 | $ 205,280 |
Net realized gain (loss) | 34,765 | 59,068 |
Change in net unrealized appreciation (depreciation) | 7,145 | (57,021) |
Net increase (decrease) in net assets resulting
from operations | 140,397 | 207,327 |
Distributions to shareholders from net investment income | (98,636) | (205,071) |
Distributions to shareholders from net realized gain | (14,938) | (44,159) |
Total distributions | (113,574) | (249,230) |
Share transactions
Proceeds from sales of shares | 306,494 | 596,717 |
Reinvestment of distributions | 75,954 | 167,758 |
Cost of shares redeemed | (307,989) | (876,891) |
Net increase (decrease) in net assets resulting from share transactions | 74,459 | (112,416) |
Redemption fees | 16 | 39 |
Total increase (decrease) in net assets | 101,298 | (154,280) |
| | |
Net Assets | | |
Beginning of period | 4,630,063 | 4,784,343 |
End of period (including undistributed net investment income of $366 and undistributed net investment income of $1,539, respectively) | $ 4,731,361 | $ 4,630,063 |
Other Information Shares | | |
Sold | 23,415 | 45,363 |
Issued in reinvestment of distributions | 5,797 | 12,826 |
Redeemed | (23,557) | (67,381) |
Net increase (decrease) | 5,655 | (9,192) |
See accompanying notes which are an integral part of the financial statements.
Semiannual Report
Financial Highlights
| Six months
ended
June 30, 2005 | Years ended December 31, |
| (Unaudited) | 2004 | 2003 | 2002 | 2001 | 2000 H | 2000 F |
Selected Per-Share Data | | | | | | |
Net asset value, beginning of period | $ 13.09 | $ 13.18 | $ 13.22 | $ 12.68 | $ 12.70 | $ 12.40 | $ 12.07 |
Income from Investment Operations | | | | | | | |
Net investment income D | .276 | .571 | .585 | .603 | .617 G | .053 | .626 |
Net realized and unrealized gain (loss) | .113 | .035 | .162 | .697 | .011 G | .303 | .337 |
Total from investment operations | .389 | .606 | .747 | 1.300 | .628 | .356 | .963 |
Distributions from net investment income | (.277) | (.571) | (.585) | (.600) | (.613) | (.053) | (.627) |
Distributions from net realized gain | (.042) | (.125) | (.202) | (.160) | (.035) | (.003) | (.006) |
Total distributions | (.319) | (.696) | (.787) | (.760) | (.648) | (.056) | (.633) |
Redemption fees added to paid
in capital | - D, I | - D, I | - D, I | - D, I | - D, I | - | - |
Net asset value,
end of period | $ 13.16 | $ 13.09 | $ 13.18 | $ 13.22 | $ 12.68 | $ 12.70 | $ 12.40 |
Total Return B, C | 3.01% | 4.73% | 5.80% | 10.48% | 5.00% | 2.87% | 8.24% |
Ratios to Average Net Assets E | | | | | | |
Expenses before expense reductions | .48% A | .47% | .48% | .48% | .47% | .47% A | .48% |
Expenses net of voluntary waivers, if any | .48% A | .47% | .48% | .48% | .47% | .47% A | .48% |
Expenses net of all reductions | .47% A | .47% | .47% | .46% | .43% | .42% A | .48% |
Net investment income | 4.26% A | 4.36% | 4.42% | 4.62% | 4.80% G | 4.98% A | 5.17% |
Supplemental Data | | | | | | |
Net assets,
end of period
(in millions) | $ 4,731 | $ 4,630 | $ 4,784 | $ 4,801 | $ 4,527 | $ 4,464 | $ 4,313 |
Portfolio turnover rate | 25% A | 20% | 23% | 23% | 27% | 4% A | 26% |
A Annualized B Total returns for periods of less than one year are not annualized. C Total returns would have been lower had certain expenses not been reduced during the periods shown. D Calculated based on average shares outstanding during the period. E Expense ratios reflect operating expenses of the fund. Expenses before reductions do not reflect amounts reimbursed by the investment adviser or reductions from brokerage service arrangements or other expense offset arrangements and do not represent the amount paid by the fund during periods when reimbursements or reductions occur. Expenses net of any voluntary waivers reflect expenses after reimbursement by the investment adviser but prior to reductions from brokerage service arrangements or other expense offset arrangements. Expenses net of all reductions represent the net expenses paid by the fund. F For the year ended November 30. G Effective January 1, 2001, the fund adopted the provisions of the AICPA Audit and Accounting Guide for Investment Companies and began amortizing premium and discount on all debt securities. Per-share data and ratios for periods prior to adoption have not been restated to reflect this change. H For the one month ended December 31, 2000. I Amount represents less than $.001 per share. |
See accompanying notes which are an integral part of the financial statements.
Semiannual Report
Notes to Financial Statements
For the period ended June 30, 2005 (Unaudited)
(Amounts in thousands except ratios)
1. Significant Accounting Policies.
Spartan Municipal Income Fund (the fund) is a fund of Fidelity Municipal Trust (the trust) and is authorized to issue an unlimited number of shares. On July 21, 2005 the Board of Trustees approved a change in the name of Spartan Municipal Income Fund to Fidelity Municipal Income Fund effective August 15, 2005. The trust is registered under the Investment Company Act of 1940, as amended (the 1940 Act), as an open-end management investment company organized as a Massachusetts business trust. The financial statements have been prepared in conformity with accounting principles generally accepted in the United States of America, which require management to make certain estimates and assumptions at the date of the financial statements. The following summarizes the significant accounting policies of the fund:
Security Valuation. Net asset value per share (NAV calculation) is calculated as of the close of business of the New York Stock Exchange, normally 4:00 p.m. Eastern time. Debt securities, including restricted securities, are valued on the basis of information provided by a pricing service. Pricing services use valuation matrices that incorporate both dealer-supplied valuations and valuation models. If prices are not readily available or do not accurately reflect fair value for a security, or if a security's value has been materially affected by events occurring after the close of the exchange or market on which the security is principally traded, that security may be valued by another method that the Board of Trustees believes accurately reflects fair value. A security's valuation may differ depending on the method used for determining value. Price movements in futures contracts and ADRs, market and trading trends, the bid/ask quotes of brokers and off-exchange institutional trading may be reviewed in the course of making a good faith determination of a security's fair value. Short-term securities with remaining maturities of sixty days or less for which quotations are not readily available are valued on the basis of amortized cost. Investments in open-end investment companies are valued at their net asset value each business day.
Investment Transactions and Income. Security transactions are accounted for as of trade date. Gains and losses on securities sold are determined on the basis of identified cost. Interest income is accrued as earned. Interest income includes coupon interest and amortization of premium and accretion of discount on debt securities.
Expenses. Most expenses of the each trust can be directly attributed to a fund. Expenses which cannot be directly attributed are apportioned among each fund in the trust.
Income Tax Information and Distributions to Shareholders. Each year, the fund intends to qualify as a regulated investment company by distributing all of its taxable income and realized gains under Subchapter M of the Internal Revenue Code. As a result, no provision for income taxes is required in the accompanying financial statements.
Semiannual Report
1. Significant Accounting Policies - continued
Income Tax Information and Distributions to Shareholders - continued
Dividends are declared daily and paid monthly from net investment income. Distributions from realized gains, if any, are recorded on the ex-dividend date. Income and capital gain distributions are determined in accordance with income tax regulations, which may differ from generally accepted accounting principles. In addition, the fund claimed a portion of the payment made to redeeming shareholders as a distribution for income tax purposes. Capital accounts within the financial statements are adjusted for permanent book-tax differences. These adjustments have no impact on net assets or the results of operations. Temporary book-tax differences will reverse in a subsequent period.
Book-tax differences are primarily due to futures transactions, market discount, and losses deferred due to wash sales and futures transactions
The fund purchases municipal securities whose interest, in the opinion of the issuer, is free from federal income tax. There is no assurance that the Internal Revenue Service (IRS) will agree with this opinion. In the event the IRS determines that the issuer does not comply with relevant tax requirements, interest payments from a security could become federally taxable, possibly retroactively to the date the security was issued.
The federal tax cost of investments and unrealized appreciation (depreciation) as of period end were as follows:
Unrealized appreciation | $ 294,383 | |
Unrealized depreciation | (637) | |
Net unrealized appreciation (depreciation) | $ 293,746 | |
Cost for federal income tax purposes | $ 4,428,020 | |
Short-Term Trading (Redemption) Fees. Shares held in the fund less than 30 days are subject to a redemption fee equal to .50% of the proceeds of the redeemed shares. All redemption fees, including any estimated redemption fees paid by Fidelity Management & Research Company (FMR), are retained by the fund and accounted for as an addition to paid in capital.
2. Operating Policies.
Delayed Delivery Transactions and When-Issued Securities. The fund may purchase or sell securities on a delayed delivery or when-issued basis. Payment and delivery may take place after the customary settlement period for that security. The price of the underlying securities and the date when the securities will be delivered and paid for are fixed at the time the transaction is negotiated. During the time a delayed delivery sell is outstanding, the contract is marked-to-market daily and equivalent deliverable securities are held for the transaction. The value of the securities purchased on a delayed delivery or when-issued basis are identified as such in the fund's Schedule of
Semiannual Report
Notes to Financial Statements (Unaudited) - continued
(Amounts in thousands except ratios)
2. Operating Policies - continued
Delayed Delivery Transactions and When-Issued Securities - continued
Investments. The fund may receive compensation for interest forgone in the purchase of a delayed delivery or when-issued security. With respect to purchase commitments, the fund identifies securities as segregated in its records with a value at least equal to the amount of the commitment. Losses may arise due to changes in the value of the underlying securities or if the counterparty does not perform under the contract's terms, or if the issuer does not issue the securities due to political, economic, or other factors.
3. Purchases and Sales of Investments.
Purchases and sales of securities, other than short-term securities and U.S. government securities, aggregated $630,070 and $578,110, respectively.
4. Fees and Other Transactions with Affiliates.
Management Fee. FMR and its affiliates provide the fund with investment management related services for which the fund pays a monthly management fee. The management fee is the sum of an individual fund fee rate that is based on an annual rate of .25% of the fund's average net assets and a group fee rate that averaged .12% during the period. The group fee rate is based upon the average net assets of all the mutual funds advised by FMR. The group fee rate decreases as assets under management increase and increases as assets under management decrease. For the period, the total annualized management fee rate was .38% of the fund's average net assets.
Transfer Agent and Accounting Fees. Citibank, N.A. (Citibank) is the custodian, transfer agent and shareholder servicing agent for the fund. Citibank has entered into a sub-arrangement with Fidelity Service Company, Inc. (FSC), an affiliate of FMR, under which FSC performs the activities associated with the fund's transfer and shareholder servicing agent and accounting functions. The fund pays account fees and asset-based fees that vary according to account size and type of account. FSC pays for typesetting, printing and mailing of shareholder reports, except proxy statements. The accounting fee is based on the level of average net assets for the month. For the period, the transfer agent fees were equivalent to an annualized rate of .08% of average net assets.
Central Funds. The fund may invest in affiliated Central Funds managed by Fidelity Investments Money Management, Inc. (FIMM), an affiliate of FMR. The Central Funds are open-end investment companies available only to investment companies and other accounts managed by FMR and its affiliates. The Money Market Central Funds seek preservation of capital and current income. The Central Funds do not pay a management fee. Income distributions earned by the fund are recorded as income in the accompanying financial statements and totaled $57 for the period.
Semiannual Report
5. Committed Line of Credit.
The fund participates with other funds managed by FMR in a $4.2 billion credit facility (the "line of credit") to be utilized for temporary or emergency purposes to fund shareholder redemptions or for other short-term liquidity purposes. The fund has agreed to pay commitment fees on its pro rata portion of the line of credit. During the period, there were no borrowings on this line of credit.
6. Expense Reductions.
Through arrangements with the fund's custodian and transfer agent, credits realized as a result of uninvested cash balances were used to reduce the fund's expenses. During the period, these credits reduced the fund's custody and transfer agent expenses by $33 and $165, respectively.
7. Other.
The fund's organizational documents provide former and current trustees and officers with a limited indemnification against liabilities arising in connection with the performance of their duties to the fund. In the normal course of business, the fund may also enter into contracts that provide general indemnifications. The fund's maximum exposure under these arrangements is unknown as this would be dependent on future claims that may be made against the fund. The risk of material loss from such claims is considered remote.
Semiannual Report
Board Approval of Investment Advisory Contracts and Management Fees
Spartan Municipal Income Fund
Each year, typically in June, the Board of Trustees, including the independent Trustees (together, the Board), votes on the renewal of the management contract and sub-advisory agreements (together, the Advisory Contracts) for the fund. The Board, assisted by the advice of fund counsel and independent Trustees' counsel, requests and considers a broad range of information throughout the year.
The Board meets regularly each month except August and takes into account throughout the year matters bearing on Advisory Contracts. The Board, acting directly and through its separate committees, considers at each of its meetings factors that are relevant to the annual renewal of the fund's Advisory Contracts, including the services and support provided to the fund and its shareholders by Fidelity. At the time of the renewal, the Board had 11 standing committees, each composed of independent Trustees with varying backgrounds, to which the Board has assigned specific subject matter responsibilities in order to enhance effective decision-making by the Board. Each committee has adopted a written charter outlining the structure and purposes of the committee. One such committee, the Fixed-Income Contract Committee, meets periodically during the first six months of each year and as necessary to consider matters specifically related to the annual renewal of Advisory Contracts. The committee requests and receives information on, and makes recommendations to the independent Trustees concerning, the approval and annual review of the Advisory Contracts.
At its June 2005 meeting, the Board of Trustees, including the independent Trustees, unanimously determined to renew the Advisory Contracts for the fund. In reaching its determination, the Board considered all factors it believed relevant, including (1) the nature, extent, and quality of the services to be provided to the fund and its shareholders by Fidelity (including the investment performance of the fund); (2) the competitiveness of the management fee and total expenses of the fund; (3) the total costs of the services to be provided by and the profits to be realized by the investment adviser and its affiliates from the relationship with the fund; (4) the extent to which economies of scale would be realized as the fund grows; and (5) whether fee levels reflect these economies of scale, if any, for the benefit of fund shareholders.
In determining whether to renew the Advisory Contracts for the fund, the Board ultimately reached a determination, with the assistance of fund counsel and independent Trustees' counsel, that the renewal of the Advisory Contracts and the compensation to be received by Fidelity under the management contract is consistent with Fidelity's fiduciary duty under applicable law. In addition to evaluating the specific factors noted above, the Board, in reaching its determination, is aware that shareholders in the fund have a broad range of investment choices available to them, including a wide choice among mutual funds offered by competitors to Fidelity, and that the fund's shareholders, with the opportunity to review and weigh the disclosure provided by the fund in its prospectus and other public disclosures, have chosen to invest in this fund, managed by Fidelity.
Semiannual Report
Nature, Extent, and Quality of Services Provided by Fidelity. The Board considered staffing within the investment adviser, FMR, and the sub-advisers (together, the Investment Advisers), including the background of the fund's portfolio manager and the fund's investment objective and discipline. The independent Trustees also had discussions with senior management of Fidelity's investment operations and investment groups. The Board considered the structure of the portfolio manager compensation program and whether this structure provides appropriate incentives.
Fidelity Resources Dedicated to Investment Management and Support Services. The Board reviewed the size, education, and experience of the Investment Advisers' investment staff, their use of technology, and the Investment Advisers' approach to recruiting, training, and retaining portfolio managers and other research, advisory, and management personnel. The Board considered Fidelity's extensive global research capabilities that enable the Investment Advisers to aggregate data from various sources in an effort to produce positive investment results. The Board noted that Fidelity's analysts have access to a variety of technological tools that enable them to perform both fundamental and quantitative analysis and to specialize in various disciplines. The Board also considered that Fidelity's portfolio managers and analysts have access to daily portfolio attribution that allows for monitoring of a fund's portfolio, as well as an electronic communication system that provides immediate real-time access to research concerning issuers and credit enhancers.
Shareholder and Administrative Services. The Board considered the nature, extent, quality, and cost of administrative, distribution, and shareholder services performed by the Investment Advisers and their affiliates under the Advisory Contracts and under separate agreements covering transfer agency and pricing and bookkeeping services for the fund. The Board also considered the nature and extent of the Investment Advisers' supervision of third party service providers, principally custodians and subcustodians. The Board reviewed the allocation of fund brokerage, including allocations to brokers affiliated with the Investment Advisers. The Board also considered the resources devoted to, and the record of compliance with, the fund's compliance policies and procedures.
The Board noted that the growth of fund assets across the complex allows Fidelity to reinvest in the development of services designed to enhance the value or convenience of the Fidelity funds as investment vehicles. These services include 24-hour access to account information and market information through phone representatives and over the Internet, and investor education materials and asset allocation tools.
Investment in a Large Fund Family. The Board considered the benefits to shareholders of investing in a Fidelity fund, including the benefits of investing in a fund that is part of a large family of funds offering a variety of investment disciplines and providing for a large variety of mutual fund investor services. For example, fund shareholders are offered the privilege of exchanging shares of the fund for shares of other Fidelity funds, as set forth in the fund's prospectus, without paying a sales charge. The Board noted that, since the last Advisory Contract renewals in June 2004, Fidelity has taken a number of actions that benefited particular funds, including (i) voluntarily deciding in 2004 to stop using "soft" commission dollars to pay for market data and, instead, to pay for that data out of its own resources, (ii) contractually agreeing to impose management fee reductions and expense limitations on its five Spartan stock index funds and its stock index fund available through variable insurance products, (iii) contractually agreeing to eliminate the management fees on the Fidelity Freedom Funds and the Fidelity Advisor Freedom Funds, (iv) contractually agreeing to reduce the management fees on most of its investment-grade taxable bond funds, and (v) contractually agreeing to impose expense limitations on its retail and Spartan investment-grade taxable bond funds.
Semiannual Report
Board Approval of Investment Advisory Contracts and
Management Fees - continued
Investment Performance. The Board considered whether the fund has operated within its investment objective, as well as its record of compliance with its investment restrictions. It also reviewed the fund's absolute investment performance, as well as the fund's relative investment performance measured against (i) a broad-based securities market index, and (ii) a peer group of mutual funds deemed appropriate by the Board over multiple periods. The following charts considered by the Board show, over the one-, three-, and five-year periods ended December 31, 2004, the fund's returns, the returns of a broad-based securities market index ("benchmark"), and a range of returns of a peer group of mutual funds identified by Lipper Inc. as having an investment objective similar to that of the fund. The box within each chart shows the 25th percentile return (bottom of box) and the 75th percentile return (top of box) of the Lipper peer group. The percentage beaten number noted below each chart corresponds to the percentile box and represents the percentage of funds in the Lipper peer group whose performance was equal to or lower than that of the fund.
Semiannual Report
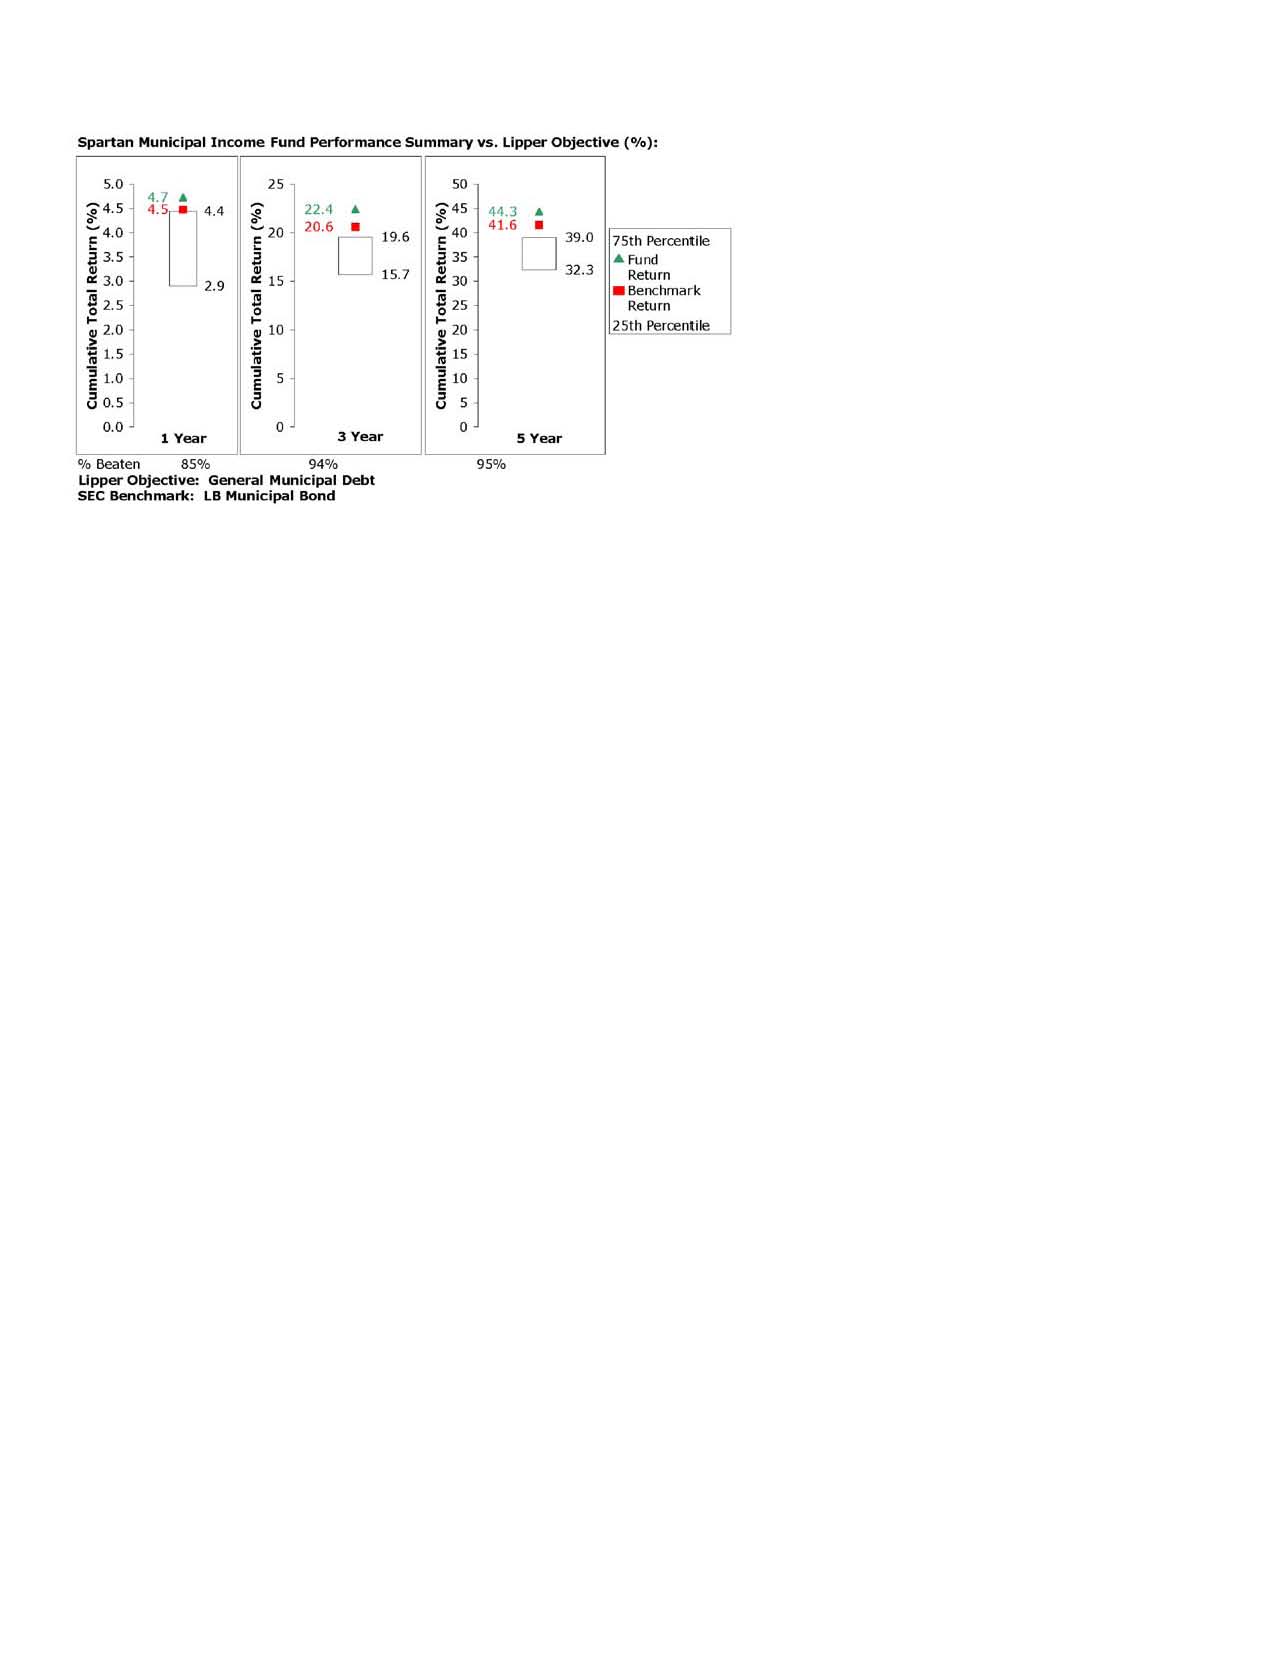
The Board noted that the relative investment performance of the fund has compared favorably to its Lipper peer group over time. The Board also noted that the relative investment performance of the fund has compared favorably to its benchmark over time.
Based on its review, and giving particular weight to the nature and quality of the resources dedicated by the Investment Advisers to maintain and improve relative performance, the Board concluded that the nature, extent, and quality of the services provided by Fidelity will benefit the fund's shareholders, particularly in light of the Board's view that the fund's shareholders benefit from investing in a fund that is part of a large family of funds offering a variety of investment disciplines and services.
Competitiveness of Management Fee and Total Fund Expenses. The Board considered the fund's management fee and total expenses compared to "mapped groups" of competitive funds and classes. Fidelity creates "mapped groups" by combining similar Lipper investment objective categories that have comparable management fee characteristics. Combining Lipper investment objective categories aids the Board's management fee and total expense comparisons by broadening the competitive group used for comparison and by reducing the number of universes to which various Fidelity funds are compared.
The Board considered two proprietary management fee comparisons for the 12-month periods shown in the chart below. The group of Lipper funds used by the Board for management fee comparisons is referred to below as the "Total Mapped Group" and, for the reasons explained above, is broader than the Lipper peer group used by the Board for performance comparisons. The Total Mapped Group comparison focuses on a fund's standing relative to the total universe of comparable funds available to investors, in terms of gross management fees before expense reimbursements or caps. "TMG %" represents the percentage of funds in the Total Mapped Group that had management fees that were lower than the fund's. For example, a TMG % of 8% would mean that 92% of the funds in the Total Mapped Group had higher management fees than the fund. The "Asset-Size Peer Group" (ASPG) comparison focuses on a fund's standing relative to non-Fidelity funds similar in size to the fund within the Total Mapped Group. The ASPG represents at least 15% of the funds in the Total Mapped Group with comparable asset size and management fee characteristics, subject to a minimum of 50 funds (or all funds in the Total Mapped Group if fewer than 50). Additional information, such as the ASPG quartile ("quadrant") in which the fund's management fee ranked, is also included in the chart and considered by the Board.
Semiannual Report
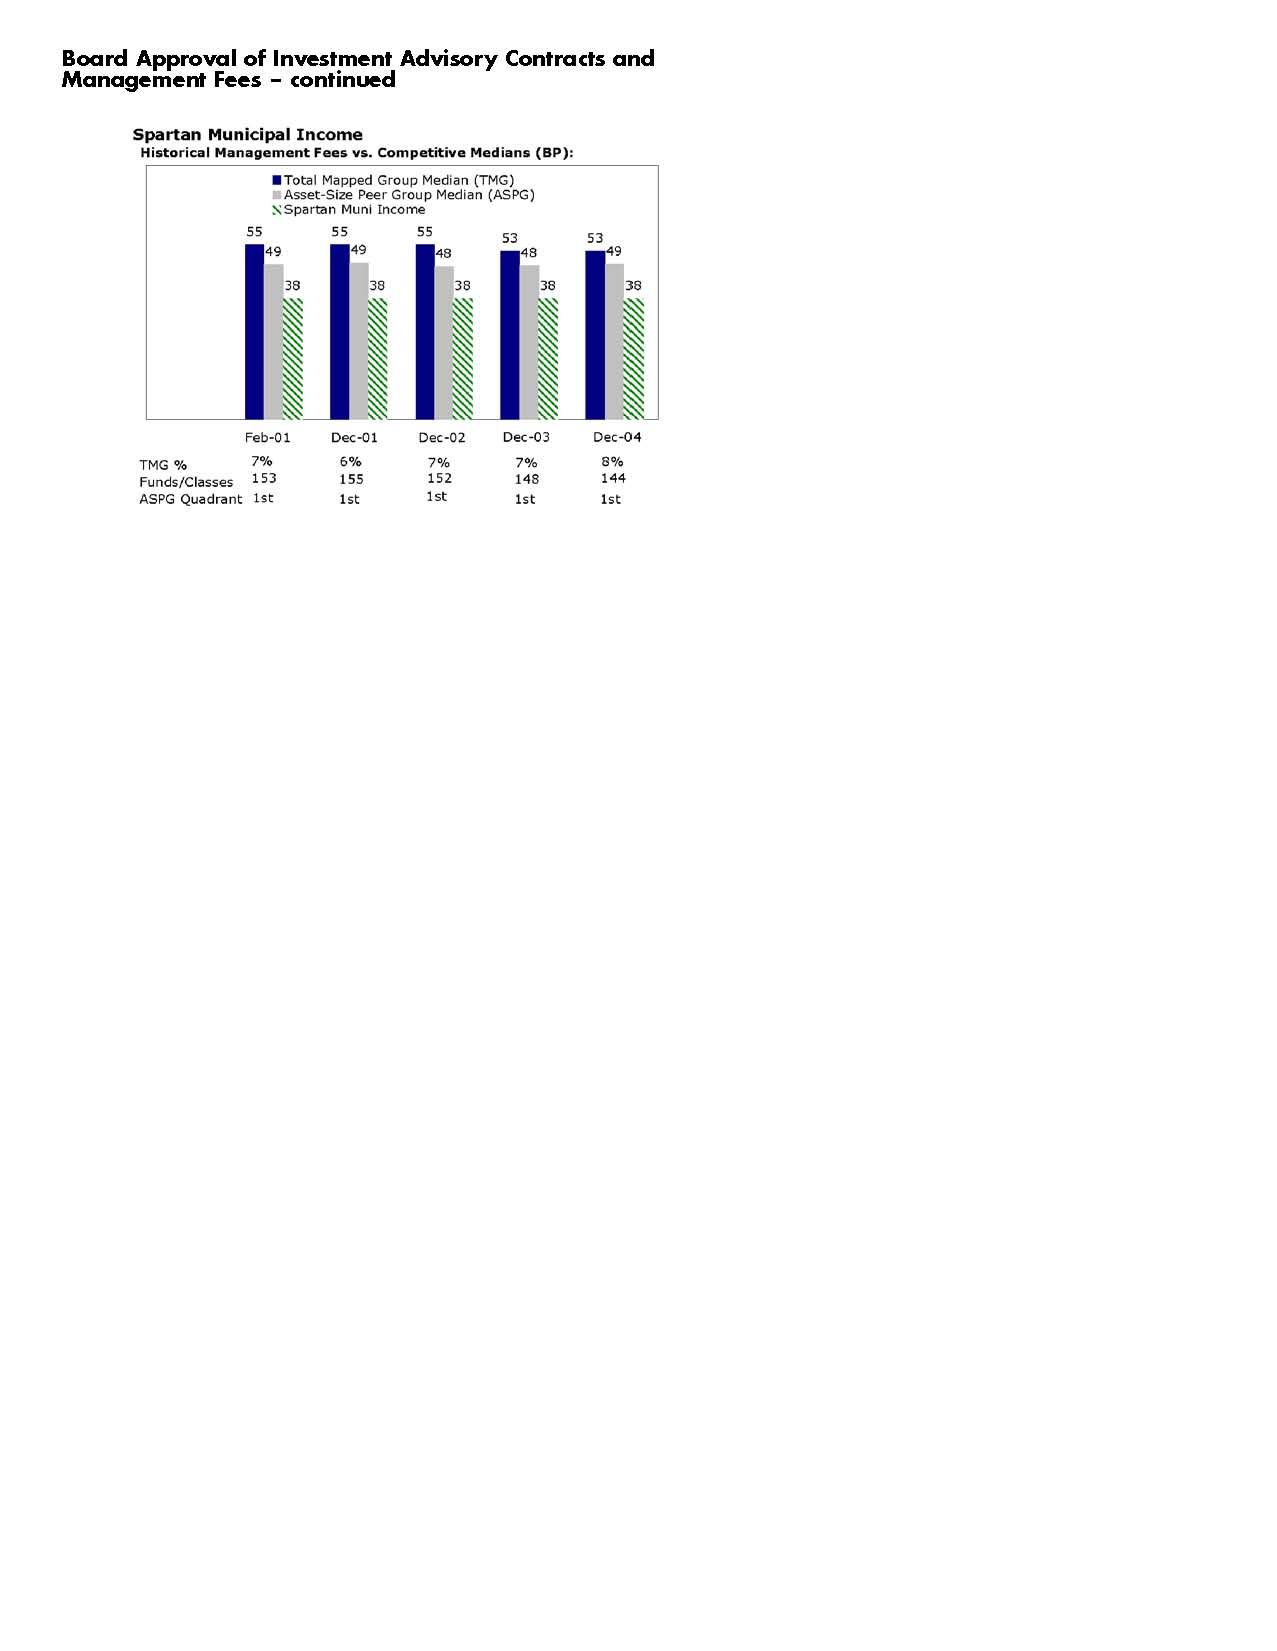
The Board noted that the fund's management fee ranked below the median of its Total Mapped Group and below the median of its ASPG for 2004. Based on its review, the Board concluded that the fund's management fee was fair and reasonable in light of the services that the fund receives and the other factors considered.
In its review of the fund's total expenses, the Board considered the fund's management fee as well as other fund expenses, such as transfer agent fees, pricing and bookkeeping fees, and custodial, legal, and audit fees. The Board also noted the effects of any waivers and reimbursements on fees and expenses. As part of its review, the Board also considered current and historical total expenses of the fund compared to competitive fund median expenses. The fund is compared to those funds and classes in the Total Mapped Group (used by the Board for management fee comparisons) that have a similar sales load structure.
Semiannual Report
The Board noted that the fund's total expenses ranked below its competitive median for 2004.
In its review of total expenses, the Board also considered Fidelity fee structures and other information on clients that FMR and its affiliates service in other competitive markets, such as other mutual funds advised or subadvised by FMR or its affiliates, pension plan clients, and other institutional clients.
Based on its review, the Board concluded that the fund's total expenses were reasonable in light of the services that the fund and its shareholders receive and the other factors considered.
Costs of the Services and Profitability. The Board considered the revenues earned and the expenses incurred by Fidelity in conducting the business of developing, marketing, distributing, managing, administering and servicing the fund and its shareholders. The Board also considered the level of Fidelity's profits in respect of all the Fidelity funds.
On an annual basis, FMR presents to the Board Fidelity's profitability for the fund. Fidelity calculates the profitability for each fund, as well as aggregate profitability for groups of Fidelity funds and all Fidelity funds, using a series of detailed revenue and cost allocation methodologies which originate with the audited books and records of Fidelity. The Audit Committee of the Board reviews any significant changes from the prior year's methodologies.
PricewaterhouseCoopers LLP (PwC), independent registered accounting firm and auditor to Fidelity and certain Fidelity funds, has been engaged annually by the Board as part of the Board's assessment of the results of Fidelity's profitability analysis. PwC's engagement includes the review and assessment of Fidelity's methodologies used in determining the revenues and expenses attributable to Fidelity's mutual fund business, and completion of agreed-upon procedures surrounding the mathematical accuracy of fund profitability and its conformity to allocation methodologies. After considering PwC's reports issued under the engagement and information provided by Fidelity, the Board believes that while other allocation methods may also be reasonable, Fidelity's profitability methodologies are reasonable in all material respects.
The Board has also reviewed Fidelity's non-fund businesses and any fall-out benefits related to the mutual fund business as well as cases where Fidelity's affiliates may benefit from or be related to the fund's business. In addition, a special committee of the Board reviewed services provided to Fidelity by its affiliates and determined that the fees that Fidelity paid for such services were reasonable.
The Board considered the costs of the services provided by and the profits realized by Fidelity in connection with the operation of the fund and determined that the amount of profit is a fair entrepreneurial profit for the management of the fund.
Semiannual Report
Board Approval of Investment Advisory Contracts and
Management Fees - continued
Economies of Scale. The Board considered whether there have been economies of scale in respect of the management of the Fidelity funds, whether the Fidelity funds (including the fund) have appropriately benefited from any such economies of scale, and whether there is potential for realization of any further economies of scale. The Board considered the extent to which the fund will benefit from economies of scale through increased services to the fund, through waivers or reimbursements, or through fee or expense reductions, including reductions that occur through operation of the transfer agent agreement. The transfer agent fee varies in part based on the number of accounts in the fund. If the number of accounts decreases or the average account size increases, the overall transfer agent fee rate decreases.
The Board recognized that the fund's management contract incorporates a "group fee" structure, which provides for lower fee rates as total fund assets under FMR's management increase, and for higher fee rates as total fund assets under FMR's management decrease. The Board considered that the group fee is designed to deliver the benefits of economies of scale to fund shareholders when total fund assets increase, even if assets of any particular fund are unchanged or have declined, because some portion of Fidelity's costs are attributable to services provided to all Fidelity funds, and all funds benefit if those costs can be allocated among more assets. The Board concluded that, given the group fee structure, fund shareholders will achieve a certain level of economies of scale as assets under FMR's management increase at the fund complex level, regardless of whether Fidelity achieves any such economies of scale.
The Board further concluded that any potential economies of scale are being shared between fund shareholders and Fidelity in an appropriate manner.
Additional Information Requested by the Board. In order to develop fully the factual basis for consideration of the Advisory Contracts, the Board requested additional information regarding (i) Fidelity's fund profitability methodology, including additional detail on various cost allocations; (ii) fall-out benefits to Fidelity; and (iii) compensation of portfolio managers and research analysts.
Based on its evaluation of all of the conclusions noted above, and after considering all material factors, the Board ultimately concluded that the existing advisory fee structures are fair and reasonable, and that the fund's existing Advisory Contracts should be renewed.
Semiannual Report
Managing Your Investments
Fidelity offers several ways to conveniently manage your personal investments via your telephone or PC. You can access your account information, conduct trades and research your investments 24 hours a day.
By Phone
Fidelity Automated Service Telephone provides a single toll-free number to access account balances, positions, quotes and trading. It's easy to navigate the service, and on your first call, the system will help you create a personal identification number (PIN) for security.
(phone_graphic)
Fidelity Automated
Service Telephone (FAST®)
1-800-544-5555
Press
1 For mutual fund and brokerage trading.
2 For quotes.*
3 For account balances and holdings.
4 To review orders and mutual
fund activity.
5 To change your PIN.
*0 To speak to a Fidelity representative.
By PC
Fidelity's web site on the Internet provides a wide range of information, including daily financial news, fund performance, interactive planning tools and news about Fidelity products and services.
(computer_graphic)
Fidelity's Web Site
www.fidelity.com
* When you call the quotes line, please remember that a fund's yield and return will vary and, except for money market funds, share price will also vary. This means that you may have a gain or loss when you sell your shares. There is no assurance that money market funds will be able to maintain a stable $1 share price; an investment in a money market fund is not insured or guaranteed by the U.S. government. Total returns are historical and include changes in share price, reinvestment of dividends and capital gains, and the effects of any sales charges.
Semiannual Report
To Visit Fidelity
For directions and hours,
please call 1-800-544-9797.
Arizona
7001 West Ray Road
Chandler, AZ
7373 N. Scottsdale Road
Scottsdale, AZ
California
815 East Birch Street
Brea, CA
1411 Chapin Avenue
Burlingame, CA
851 East Hamilton Avenue
Campbell, CA
19200 Von Karman Avenue
Irvine, CA
601 Larkspur Landing Circle
Larkspur, CA
10100 Santa Monica Blvd.
Los Angeles, CA
27101 Puerta Real
Mission Viejo, CA
73-575 El Paseo
Palm Desert, CA
251 University Avenue
Palo Alto, CA
123 South Lake Avenue
Pasadena, CA
16995 Bernardo Ctr. Drive
Rancho Bernardo, CA
1740 Arden Way
Sacramento, CA
7676 Hazard Center Drive
San Diego, CA
8 Montgomery Street
San Francisco, CA
3793 State Street
Santa Barbara, CA
21701 Hawthorne Boulevard
Torrance, CA
2001 North Main Street
Walnut Creek, CA
6300 Canoga Avenue
Woodland Hills, CA
Colorado
1625 Broadway
Denver, CO
9185 East Westview Road
Littleton, CO
Connecticut
48 West Putnam Avenue
Greenwich, CT
265 Church Street
New Haven, CT
300 Atlantic Street
Stamford, CT
29 South Main Street
West Hartford, CT
Delaware
222 Delaware Avenue
Wilmington, DE
Florida
4400 N. Federal Highway
Boca Raton, FL
121 Alhambra Plaza
Coral Gables, FL
2948 N. Federal Highway
Ft. Lauderdale, FL
1907 West State Road 434
Longwood, FL
8880 Tamiami Trail, North
Naples, FL
3550 Tamiami Trail, South
Sarasota, FL
1502 N. Westshore Blvd.
Tampa, FL
2465 State Road 7
Wellington, FL
3501 PGA Boulevard
West Palm Beach, FL
Georgia
3445 Peachtree Road, N.E.
Atlanta, GA
1000 Abernathy Road
Atlanta, GA
Illinois
One North LaSalle Street
Chicago, IL
875 North Michigan Ave.
Chicago, IL
1415 West 22nd Street
Oak Brook, IL
1700 East Golf Road
Schaumburg, IL
3232 Lake Avenue
Wilmette, IL
Indiana
4729 East 82nd Street
Indianapolis, IN
Kansas
5400 College Boulevard
Overland Park, KS
Maine
Three Canal Plaza
Portland, ME
Maryland
7315 Wisconsin Avenue
Bethesda, MD
One W. Pennsylvania Ave.
Towson, MD
Massachusetts
801 Boylston Street
Boston, MA
155 Congress Street
Boston, MA
300 Granite Street
Braintree, MA
44 Mall Road
Burlington, MA
405 Cochituate Road
Framingham, MA
416 Belmont Street
Worcester, MA
Michigan
500 E. Eisenhower Pkwy.
Ann Arbor, MI
280 Old N. Woodward Ave.
Birmingham, MI
43420 Grand River Avenue
Novi, MI
29155 Northwestern Hwy.
Southfield, MI
Minnesota
7600 France Avenue South
Edina, MN
Missouri
8885 Ladue Road
Ladue, MO
Semiannual Report
Nevada
2225 Village Walk Drive
Henderson, NV
New Jersey
150 Essex Street
Millburn, NJ
56 South Street
Morristown, NJ
396 Route 17, North
Paramus, NJ
3518 Route 1 North
Princeton, NJ
530 Highway 35
Shrewsbury, NJ
New York
1055 Franklin Avenue
Garden City, NY
37 West Jericho Turnpike
Huntington Station, NY
1271 Avenue of the Americas
New York, NY
61 Broadway
New York, NY
350 Park Avenue
New York, NY
200 Fifth Avenue
New York, NY
733 Third Avenue
New York, NY
11 Penn Plaza
New York, NY
2070 Broadway
New York, NY
1075 Northern Blvd.
Roslyn, NY
North Carolina
4611 Sharon Road
Charlotte, NC
Ohio
3805 Edwards Road
Cincinnati, OH
1324 Polaris Parkway
Columbus, OH
28699 Chagrin Boulevard
Woodmere Village, OH
Oregon
16850 SW 72nd Avenue
Tigard, OR
Pennsylvania
600 West DeKalb Pike
King of Prussia, PA
1735 Market Street
Philadelphia, PA
12001 Perry Highway
Wexford, PA
Rhode Island
47 Providence Place
Providence, RI
Tennessee
6150 Poplar Avenue
Memphis, TN
Texas
10000 Research Boulevard
Austin, TX
4001 Northwest Parkway
Dallas, TX
12532 Memorial Drive
Houston, TX
2701 Drexel Drive
Houston, TX
6500 N. MacArthur Blvd.
Irving, TX
6005 West Park Boulevard
Plano, TX
14100 San Pedro
San Antonio, TX
1576 East Southlake Blvd.
Southlake, TX
19740 IH 45 North
Spring, TX
Utah
215 South State Street
Salt Lake City, UT
Virginia
1861 International Drive
McLean, VA
Washington
411 108th Avenue, N.E.
Bellevue, WA
1518 6th Avenue
Seattle, WA
Washington, DC
1900 K Street, N.W.
Washington, DC
Wisconsin
595 North Barker Road
Brookfield, WI
Fidelity Brokerage Services, Inc., 100 Summer St., Boston, MA 02110 Member NYSE/SIPC
Semiannual Report
Investment Adviser
Fidelity Management & Research Company
Boston, MA
Investment Sub-Adviser
Fidelity Investments Money
Management, Inc.
Fidelity International Investment Advisors
Fidelity International Investment Advisors
(U.K.) Limited
General Distributor
Fidelity Distributors Corporation
Boston, MA
Transfer and Service Agents
Citibank N.A.
New York NY
Fidelity Service Company, Inc.
Boston, MA
Custodian
Citibank N.A.
New York NY
The Fidelity Telephone Connection
Mutual Fund 24-Hour Service
Exchanges/Redemptions
and Account Assistance 1-800-544-6666
Product Information 1-800-544-6666
Retirement Accounts 1-800-544-4774
(8 a.m. - 9 p.m.)
TDD Service 1-800-544-0118
for the deaf and hearing impaired
(9 a.m. - 9 p.m. Eastern time)
Fidelity Automated Service
Telephone(FAST®) (automated graphic) 1-800-544-5555
(automated graphic) Automated line for quickest service
HIY-USAN-0805
1.787789.102
(Fidelity Investment logo)(registered trademark)
Corporate Headquarters
82 Devonshire St., Boston, MA 02109
www.fidelity.com
Spartan®
Ohio Municipal Income
Fund
and
Fidelity ®
Ohio Municipal Money Market
Fund
Semiannual Report
June 30, 2005
(2_fidelity_logos) (Registered_Trademark)
Contents
Chairman's Message | <Click Here> | Ned Johnson's message to shareholders |
Shareholder Expense Example | <Click Here> | An example of shareholder expenses. |
Spartan Ohio Municipal Income Fund |
Investment Changes | <Click Here> | A summary of major shifts in the fund's investments over the past six months. |
Investments | <Click Here> | A complete list of the fund's investments with their market values. |
Financial Statements | <Click Here> | Statements of assets and liabilities, operations, and changes in net assets,
as well as financial highlights. |
Fidelity Ohio Municipal Money Market Fund |
Investment Changes | <Click Here> | A summary of major shifts in the fund's investments over the past six months. |
Investments | <Click Here> | A complete list of the fund's investments. |
Financial Statements | <Click Here> | Statements of assets and liabilities, operations, and changes in net assets,
as well as financial highlights. |
Notes | <Click Here> | Notes to the Financial Statements |
Board Approval of Investment Advisory Contracts and Management Fees | <Click Here> | |
To view a fund's proxy voting guidelines and proxy voting record for the 12-month period ended June 30, visit www.fidelity.com/proxyvotingresults or visit the Securities and Exchange Commission's (SEC) web site at www.sec.gov. You may also call 1-800-544-8544 to request a free copy of the proxy voting guidelines.
Standard & Poor's, S&P and S&P 500 are registered service marks of The McGraw-Hill Companies, Inc. and have been licensed for use by Fidelity Distributors Corporation.
Other third party marks appearing herein are the property of their respective owners.
All other marks appearing herein are registered or unregistered trademarks or service marks of FMR Corp. or an affiliated company.
This report and the financial statements contained herein are submitted for the general information of the shareholders of the funds. This report is not authorized for distribution to prospective investors in the funds unless preceded or accompanied by an effective prospectus.
A fund files its complete schedule of portfolio holdings with the SEC for the first and third quarters of each fiscal year on Form N-Q. Forms N-Q are available on the SEC's web site at http://www.sec.gov. A fund's Forms N-Q may be reviewed and copied at the SEC's Public Reference Room in Washington, DC. Information regarding the operation of the SEC's Public Reference Room may be obtained by calling 1-800-SEC-0330. For a complete list of a fund's portfolio holdings, view the most recent quarterly holdings report, semiannual report, or annual report on Fidelity's web site at http://www.fidelity.com/holdings.
NOT FDIC INSURED · MAY LOSE VALUE · NO BANK GUARANTEE
Neither the funds nor Fidelity Distributors Corporation is a bank.
Semiannual Report
Chairman's Message
(photo_of_Edward_C_Johnson_3d)
Dear Shareholder:
During the past year or so, much has been reported about the mutual fund industry, and much of it has been more critical than I believe is warranted. Allegations that some companies have been less than forthright with their shareholders have cast a shadow on the entire industry. I continue to find these reports disturbing, and assert that they do not create an accurate picture of the industry overall. Therefore, I would like to remind everyone where Fidelity stands on these issues. I will say two things specifically regarding allegations that some mutual fund companies were in violation of the Securities and Exchange Commission's forward pricing rules or were involved in so-called "market timing" activities.
First, Fidelity has no agreements that permit customers who buy fund shares after 4 p.m. to obtain the 4 p.m. price. This is not a new policy. This is not to say that someone could not deceive the company through fraudulent acts. However, we are extremely diligent in preventing fraud from occurring in this manner - and in every other. But I underscore again that Fidelity has no so-called "agreements" that sanction illegal practices.
Second, Fidelity continues to stand on record, as we have for years, in opposition to predatory short-term trading that adversely affects shareholders in a mutual fund. Back in the 1980s, we initiated a fee - which is returned to the fund and, therefore, to investors - to discourage this activity. Further, we took the lead several years ago in developing a Fair Value Pricing Policy to prevent market timing on foreign securities in our funds. I am confident we will find other ways to make it more difficult for predatory traders to operate. However, this will only be achieved through close cooperation among regulators, legislators and the industry.
Yes, there have been unfortunate instances of unethical and illegal activity within the mutual fund industry from time to time. That is true of any industry. When this occurs, confessed or convicted offenders should be dealt with appropriately. But we are still concerned about the risk of over-regulation and the quick application of simplistic solutions to intricate problems. Every system can be improved, and we support and applaud well thought out improvements by regulators, legislators and industry representatives that achieve the common goal of building and protecting the value of investors' holdings.
For nearly 60 years, Fidelity has worked very hard to improve its products and service to justify your trust. When our family founded this company in 1946, we had only a few hundred customers. Today, we serve more than 18 million customers including individual investors and participants in retirement plans across America.
Let me close by saying that we do not take your trust in us for granted, and we realize that we must always work to improve all aspects of our service to you. In turn, we urge you to continue your active participation with your financial matters, so that your interests can be well served.
Best regards,
/s/Edward C. Johnson 3d
Edward C. Johnson 3d
Semiannual Report
Shareholder Expense Example
As a shareholder of a Fund, you incur two types of costs: (1) transaction costs, including redemption fees, and (2) ongoing costs, including management fees and other Fund expenses. This Example is intended to help you understand your ongoing costs (in dollars) of investing in the Funds and to compare these costs with the ongoing costs of investing in other mutual funds.
The Example is based on an investment of $1,000 invested at the beginning of the period and held for the entire period (January 1, 2005 to June 30, 2005).
Actual Expenses
The first line of the table below for each fund provides information about actual account values and actual expenses. You may use the information in this line, together with the amount you invested, to estimate the expenses that you paid over the period. Simply divide your account value by $1,000.00 (for example, an $8,600 account value divided by $1,000.00 = 8.6), then multiply the result by the number in the first line for a fund under the heading entitled "Expenses Paid During Period" to estimate the expenses you paid on your account during this period. A small balance maintenance fee of $12.00 that is charged once a year may apply for certain accounts with a value of less than $2,000. This fee is not included in the table below. If it was, the estimate of expenses you paid during the period would be higher, and your ending account value lower, by this amount.
Hypothetical Example for Comparison Purposes
The second line of the table below for each fund provides information about hypothetical account values and hypothetical expenses based on a fund's actual expense ratio and an assumed rate of return of 5% per year before expenses, which is not the Fund's actual return. The hypothetical account values and expenses may not be used to estimate the actual ending account balance or expenses you paid for the period. You may use this information to compare the ongoing costs of investing in the Fund and other funds. To do so, compare this 5% hypothetical example with the 5% hypothetical examples that appear in the shareholder reports of the other funds. A small balance maintenance fee of $12.00 that is charged once a year may apply for certain accounts with a value of less than $2,000. This fee is not included in the table below. If it was, the estimate of expenses you paid during the period would be higher, and your ending account value lower, by this amount.
Please note that the expenses shown in the table are meant to highlight your ongoing costs only and do not reflect any transaction costs. Therefore, the second line of the table is useful in comparing ongoing costs only, and will not help you determine the relative total costs of owning different funds. In addition, if these transactional costs were included, your costs would have been higher.
Semiannual Report
| Beginning
Account Value
January 1, 2005 | Ending
Account Value
June 30, 2005 | Expenses Paid
During Period*
January 1, 2005
to June 30, 2005 |
Spartan Ohio Municipal Income Fund | | | |
Actual | $ 1,000.00 | $ 1,027.00 | $ 2.51 |
HypotheticalA | $ 1,000.00 | $ 1,022.32 | $ 2.51 |
Fidelity Ohio Municipal Money
Market Fund | | | |
Actual | $ 1,000.00 | $ 1,008.70 | $ 2.69 |
HypotheticalA | $ 1,000.00 | $ 1,022.12 | $ 2.71 |
A 5% return per year before expenses
* Expenses are equal to each Fund's annualized expense ratio (shown in the table below); multiplied by the average account value over the period, multiplied by 181/365 (to reflect the one-half year period).
| Annualized
Expense Ratio |
Spartan Ohio Municipal Income Fund | .50% |
Fidelity Ohio Municipal Money Market Fund | .54% |
Semiannual Report
Spartan Ohio Municipal Income Fund
Investment Changes
Top Five Sectors as of June 30, 2005 |
| % of fund's
net assets | % of fund's net assets
6 months ago |
General Obligations | 40.6 | 49.4 |
Education | 12.7 | 13.9 |
Water & Sewer | 10.8 | 9.1 |
Escrowed/Pre-Refunded | 10.6 | 4.2 |
Health Care | 7.2 | 7.6 |
Average Years to Maturity as of June 30, 2005 |
| | 6 months ago |
Years | 13.1 | 14.3 |
Average years to maturity is based on the average time remaining to the stated maturity date of each bond, weighted by the market value of each bond. |
Duration as of June 30, 2005 |
| | 6 months ago |
Years | 6.7 | 7.1 |
Duration shows how much a bond fund's price fluctuates with changes in comparable interest rates. If rates rise 1%, for example, a fund with a five-year duration is likely to lose about 5% of its value. Other factors also can influence a bond fund's performance and share price. Accordingly, a bond fund's actual performance may differ from this example. |
Quality Diversification (% of fund's net assets) |
As of June 30, 2005 | As of December 31, 2004 |
| AAA 57.7% | | | AAA 57.9% | |
| AA,A 38.4% | | | AA,A 37.9% | |
| BBB 4.0% | | | BBB 3.0% | |
| Not Rated 0.3% | | | Not Rated 0.7% | |
 | Short-Term
Investments and
Net Other Assets* (0.4)% | | | Short-Term
Investments and
Net Other Assets 0.5% | |

We have used ratings from Moody's® Investors Services, Inc. Where Moody's ratings are not available, we have used S&P ® ratings. |
* Short-Term Investments and Net Other Assets are not included in the pie chart. |
Semiannual Report
Spartan Ohio Municipal Income Fund
Investments June 30, 2005 (Unaudited)
Showing Percentage of Net Assets
Municipal Bonds - 100.4% |
| Principal
Amount | | Value
(Note 1) |
Ohio - 96.3% |
Adams County Valley Local School District
(Adams & Highland County Proj.) 5.25% 12/1/21 (MBIA Insured) | | $ 2,000,000 | | $ 2,058,540 |
Akron City Nontax Rev. Econ. Dev. Series 1997, 6% 12/1/12 (MBIA Insured) | | 1,250,000 | | 1,461,975 |
Akron Gen. Oblig. 5.5% 12/1/21 | | 2,000,000 | | 2,225,440 |
Akron Wtrwks. Rev. 5.25% 12/1/19 (MBIA Insured) | | 1,630,000 | | 1,801,134 |
Avon Lake City School District: | | | | |
5% 12/1/14 (MBIA Insured) | | 1,205,000 | | 1,341,575 |
5.5% 12/1/26 (FGIC Insured) | | 2,205,000 | | 2,471,342 |
Bowling Green Univ. Gen. Receipts: | | | | |
5.75% 6/1/11 (Pre-Refunded to 6/1/10 @ 101) (d) | | 1,455,000 | | 1,647,977 |
5.75% 6/1/14 (Pre-Refunded to 6/1/10 @ 101) (d) | | 1,190,000 | | 1,347,830 |
5.75% 6/1/16 (Pre-Refunded to 6/1/10 @ 101) (d) | | 1,250,000 | | 1,415,788 |
Brookville Local School District 5.25% 12/1/20
(FSA Insured) | | 1,875,000 | | 2,078,888 |
Buckeye Valley Local School District Delaware County Series A, 6.85% 12/1/15 (MBIA Insured) | | 2,500,000 | | 3,015,025 |
Butler County Gen. Oblig. 5.25% 12/1/16
(MBIA Insured) | | 1,820,000 | | 2,040,220 |
Butler County Sales Tax (Govt. Svcs. Ctr. Proj.) Series A, 5% 12/15/16 (AMBAC Insured) | | 2,455,000 | | 2,713,241 |
Butler County Trans. Impt. District Series 1997 A, 6% 4/1/10 (FSA Insured) | | 2,325,000 | | 2,556,779 |
Canal Winchester Local School District 5% 12/1/18 (MBIA Insured) | | 2,035,000 | | 2,228,488 |
Chagrin Falls Exempted Village School District 5.25% 12/1/19 (MBIA Insured) | | 1,915,000 | | 2,129,557 |
Cincinnati City School District: | | | | |
5.25% 6/1/16 (FSA Insured) | | 1,500,000 | | 1,662,615 |
5.25% 12/1/17 (FSA Insured) | | 2,000,000 | | 2,223,580 |
Cincinnati Gen. Oblig.: | | | | |
(Police & Firemen's Disability Proj.) 6% 12/1/35 | | 5,000,000 | | 5,647,050 |
5.375% 12/1/20 | | 2,000,000 | | 2,200,640 |
Cincinnati Student Ln. Fdg. Corp. Student Ln. Rev.
Series A, 7.25% 2/1/08 (c) | | 4,000,000 | | 4,013,400 |
Cincinnati Wtr. Sys. Rev. Series 2001, 5.5% 12/1/17 | | 2,000,000 | | 2,209,340 |
Cleveland Arpt. Sys. Rev. Series A, 5.5% 1/1/08
(FSA Insured) (c) | | 1,500,000 | | 1,581,450 |
Cleveland Gen. Oblig. 5.25% 12/1/17 (Pre-Refunded to 12/1/10 @ 101) (d) | | 1,355,000 | | 1,513,196 |
Municipal Bonds - continued |
| Principal
Amount | | Value
(Note 1) |
Ohio - continued |
Cleveland Muni. School District: | | | | |
5.25% 12/1/17 (FSA Insured) | | $ 2,215,000 | | $ 2,476,879 |
5.25% 12/1/19 (FSA Insured) | | 1,000,000 | | 1,115,820 |
Cleveland Pub. Pwr. Sys. Rev. (First Mtg. Prog.) Series A: | | | | |
0% 11/15/10 (MBIA Insured) | | 2,685,000 | | 2,217,756 |
0% 11/15/11 (MBIA Insured) | | 2,685,000 | | 2,120,076 |
Cleveland State Univ. Gen. Receipts Series 2003 A, 5% 6/1/18 (FGIC Insured) | | 2,490,000 | | 2,690,470 |
Cleveland Wtrwks. Rev.: | | | | |
(First Mtg. Prog.): | | | | |
Series G, 5.5% 1/1/13 (MBIA Insured) | | 2,450,000 | | 2,721,534 |
Series H, 5.75% 1/1/16 (MBIA Insured) | | 45,000 | | 46,544 |
Series I: | | | | |
5% 1/1/28 (FSA Insured) | | 25,000 | | 26,121 |
5% 1/1/28 (Pre-Refunded to 1/1/08 @ 101) (d) | | 25,000 | | 26,570 |
Columbus City School District 5.25% 12/1/25
(FSA Insured) | | 3,780,000 | | 4,147,114 |
Cuyahoga County Gen. Oblig.: | | | | |
Series A: | | | | |
0% 10/1/09 (MBIA Insured) | | 4,200,000 | | 3,650,136 |
0% 10/1/11 (MBIA Insured) | | 2,400,000 | | 1,916,520 |
0% 10/1/12 (MBIA Insured) | | 1,505,000 | | 1,148,586 |
5% 12/1/19 | | 3,000,000 | | 3,367,980 |
5.75% 12/1/12 (Pre-Refunded to 12/1/10 @ 100) (d) | | 1,950,000 | | 2,204,144 |
5.75% 12/1/13 (Pre-Refunded to 12/1/10 @ 100) (d) | | 2,210,000 | | 2,498,029 |
5.75% 12/1/14 (Pre-Refunded to 12/1/10 @ 100) (d) | | 1,460,000 | | 1,650,282 |
Erie County Gen. Oblig. 5.5% 12/1/18 (FSA Insured) | | 1,265,000 | | 1,435,294 |
Fairborn City School District (School Impt. Proj.) 5.75% 12/1/26 (FSA Insured) | | 2,200,000 | | 2,474,956 |
Fairfield City School District 7.45% 12/1/14 (FGIC Insured) | | 1,000,000 | | 1,258,720 |
Fairless Local School District 5% 12/1/32 (FSA Insured) | | 3,300,000 | | 3,511,134 |
Fairview Park Gen. Oblig. 5% 12/1/30
(MBIA Insured) (a) | | 3,750,000 | | 4,007,138 |
Franklin County Convention Facilities Auth. Tax & Lease Rev. 5.25% 12/1/19 (AMBAC Insured) | | 4,000,000 | | 4,392,720 |
Franklin County Gen. Oblig.: | | | | |
5.5% 12/1/15 | | 1,225,000 | | 1,281,411 |
5.5% 12/1/16 | | 1,290,000 | | 1,349,405 |
Municipal Bonds - continued |
| Principal
Amount | | Value
(Note 1) |
Ohio - continued |
Franklin County Hosp. Rev.: | | | | |
(Holy Cross Health Sys. Corp. Proj.) 5.875% 6/1/21 | | $ 1,000,000 | | $ 1,035,530 |
5.5% 5/1/13 (AMBAC Insured) | | 1,130,000 | | 1,257,860 |
Franklin County Rev. (OCLC Online Computer Library Ctr., Inc. Proj.) 5% 4/15/12 | | 2,505,000 | | 2,684,483 |
Gallia County Hosp. Facilities Rev. (Holzer Med. Ctr. Proj.) 5.125% 10/1/13 (AMBAC Insured) | | 3,000,000 | | 3,200,250 |
Greene County Swr. Sys. Rev. 0% 12/1/09
(AMBAC Insured) | | 775,000 | | 669,251 |
Hamilton County Convention Facilities Auth. Rev.: | | | | |
5% 12/1/17 (FGIC Insured) | | 1,985,000 | | 2,180,721 |
5% 12/1/18 (FGIC Insured) | | 1,075,000 | | 1,175,029 |
5% 12/1/19 (FGIC Insured) | | 2,190,000 | | 2,392,049 |
5% 12/1/19 (FGIC Insured) | | 1,130,000 | | 1,234,254 |
Hamilton County Hosp. Facilities Rev. (Childrens Hosp. Med. Ctr. Proj.) Series J: | | | | |
5.25% 5/15/15 (FGIC Insured) | | 1,835,000 | | 2,053,952 |
5.25% 5/15/17 (FGIC Insured) | | 2,585,000 | | 2,868,678 |
5.25% 5/15/18 (FGIC Insured) | | 2,720,000 | | 3,001,248 |
Hamilton County Sales Tax Series B, 5.25% 12/1/32 (AMBAC Insured) | | 4,750,000 | | 5,089,435 |
Hamilton Wtrwks. Rev. 5% 10/15/16 (MBIA Insured) | | 1,000,000 | | 1,095,220 |
Hilliard Gen. Oblig. 5% 12/1/18 (MBIA Insured) | | 1,000,000 | | 1,096,880 |
Hilliard School District 0% 12/1/11 (FGIC Insured) | | 3,720,000 | | 2,949,104 |
Kent City School District Series 2004, 5% 12/1/20 (FGIC Insured) | | 1,400,000 | | 1,523,648 |
Kings Local School District: | | | | |
5% 12/1/19 (MBIA Insured) | | 1,365,000 | | 1,499,698 |
6.1% 12/1/25 | | 6,800,000 | | 7,879,704 |
Lakewood City School District 5.25% 12/1/15
(FSA Insured) | | 1,000,000 | | 1,134,010 |
Lakewood Hosp. Impt. Rev. (Lakewood Hosp. Assoc. Proj.): | | | | |
5.5% 2/15/10 | | 1,000,000 | | 1,076,460 |
5.5% 2/15/11 | | 1,875,000 | | 2,033,569 |
5.5% 2/15/12 | | 1,000,000 | | 1,096,650 |
Licking Heights Local School District (Facilities Construction & Impt. Proj.) Series A, 5.5% 12/1/24 (Pre-Refunded to 12/1/10 @ 100) (d) | | 2,400,000 | | 2,689,512 |
Lorain County 5.5% 12/1/22 (FGIC Insured) | | 2,985,000 | | 3,323,917 |
Lucas County Hosp. Rev. (Promedia Health Care Oblig. Group Proj.): | | | | |
5.375% 11/15/23 (AMBAC Insured) | | 5,000,000 | | 5,420,800 |
Municipal Bonds - continued |
| Principal
Amount | | Value
(Note 1) |
Ohio - continued |
Lucas County Hosp. Rev. (Promedia Health Care Oblig. Group Proj.): - continued | | | | |
5.625% 11/15/12 (AMBAC Insured) | | $ 2,000,000 | | $ 2,217,480 |
5.625% 11/15/13 (AMBAC Insured) | | 1,200,000 | | 1,319,148 |
Marion County Hosp. Impt. Rev. (Cmnty. Hosp. Proj.) 6.1% 5/15/06 | | 1,000,000 | | 1,028,790 |
Medina City School District 5.25% 12/1/28
(Pre-Refunded to 12/1/09 @ 100) (d) | | 6,175,000 | | 6,749,213 |
Middletown City School District: | | | | |
5% 12/1/17 (FGIC Insured) | | 1,175,000 | | 1,277,331 |
5% 12/1/19 (FGIC Insured) | | 1,110,000 | | 1,207,514 |
Milford Exempt Villlage School District 5.125% 12/1/30 (FSA Insured) | | 5,335,000 | | 5,640,002 |
Montgomery County Gen. Oblig. 5.5% 12/1/25 | | 2,235,000 | | 2,469,429 |
Montgomery County Rev. (Catholic Health Initiatives Proj.) Series A: | | | | |
6% 12/1/19 | | 1,470,000 | | 1,660,071 |
6% 12/1/19 (Escrowed to Maturity) (d) | | 1,530,000 | | 1,744,567 |
6% 12/1/26 (Escrowed to Maturity) (d) | | 3,000,000 | | 3,406,020 |
Montgomery County Wtr. Sys. Rev. Series 2002, 5.375% 11/15/16 (AMBAC Insured) | | 2,200,000 | | 2,454,870 |
Ohio Air Quality Dev. Auth. Rev.: | | | | |
(Ohio Edison Co. Proj.) Series A, 3.25%, tender 2/1/08 (AMBAC Insured) (b) | | 2,000,000 | | 2,002,100 |
(Pennsylvania Pwr. Co. Proj.) 3.375%, tender 7/1/05 (b) | | 3,000,000 | | 3,000,000 |
Series 2002 A, 3.5%, tender 1/1/06 (b) | | 3,000,000 | | 2,999,970 |
Ohio Bldg. Auth.: | | | | |
(Administration Bldg. Fund Prog.) Series A: | | | | |
4.75% 10/1/17 | | 1,000,000 | | 1,041,820 |
5% 4/1/11 (FSA Insured) | | 1,425,000 | | 1,559,948 |
(Adult Correctional Bldg. Fund Prog.) Series 2001 A, 5.5% 10/1/12 (FSA Insured) | | 1,000,000 | | 1,120,040 |
(Juvenile Correctional Bldg. Fund Prog.): | | | | |
Series A, 5.5% 4/1/12 | | 2,960,000 | | 3,292,704 |
5% 4/1/17 (MBIA Insured) | | 2,485,000 | | 2,695,256 |
(Sports Facilities Bldg. Fund Prog.) Series 1999 A, 5.25% 10/1/12 | | 2,940,000 | | 3,195,045 |
Ohio Gen. Oblig.: | | | | |
(College Savings Prog.): | | | | |
0% 8/1/09 | | 2,290,000 | | 1,996,422 |
0% 8/1/10 | | 2,000,000 | | 1,677,420 |
0% 8/1/14 | | 1,375,000 | | 964,356 |
Municipal Bonds - continued |
| Principal
Amount | | Value
(Note 1) |
Ohio - continued |
Ohio Gen. Oblig.: - continued | | | | |
(Higher Ed. Cap. Facilities Proj.) Series A, 5.375% 8/1/16 | | $ 5,980,000 | | $ 6,651,375 |
(Mental Health Cap. Facilities Proj.): | | | | |
Series IIA, 5.25% 6/1/17 | | 2,670,000 | | 2,935,345 |
Series IIB, 5.5% 6/1/15 | | 2,265,000 | | 2,495,736 |
Series 2001 IIA, 5.5% 12/1/13 | | 2,020,000 | | 2,248,765 |
Series 2002 B, 5.25% 11/1/20 | | 2,520,000 | | 2,788,758 |
Series A, 5.5% 9/15/16 | | 11,060,000 | | 12,431,984 |
Ohio Higher Edl. Facility Commission Rev.: | | | | |
(Case Western Reserve Univ. 2002 Proj.): | | | | |
Series B: | | | | |
5.5% 10/1/21 | | 2,000,000 | | 2,244,120 |
6.5% 10/1/20 | | 2,335,000 | | 2,941,470 |
Series C, 5.125% 10/1/17 | | 2,985,000 | | 3,142,996 |
6.125% 10/1/15 | | 2,000,000 | | 2,411,900 |
6.25% 10/1/16 | | 2,500,000 | | 3,081,550 |
(Denison Univ. Proj.) 5.5% 11/1/14 | | 1,000,000 | | 1,116,870 |
(Univ. of Dayton Proj.): | | | | |
5% 12/1/17 (AMBAC Insured) | | 2,170,000 | | 2,394,053 |
5.5% 12/1/20 (AMBAC Insured) | | 1,300,000 | | 1,440,426 |
Ohio Hsg. Fin. Agcy. Mtg. Rev. (Residential Proj.): | | | | |
Series B2, 5.375% 9/1/19 (c) | | 410,000 | | 410,008 |
Series C, 4.9% 9/1/26 (c) | | 260,000 | | 260,338 |
Ohio Muni. Elec. Gen. Agcy. (Belleville Hydroelectric Proj.) 5% 2/15/17 (AMBAC Insured) | | 1,215,000 | | 1,331,433 |
Ohio Poll. Cont. Rev. (Standard Oil Co. Proj.) 6.75% 12/1/15 | | 3,100,000 | | 3,885,695 |
Ohio Pub. Facilities Commission Rev. (Mental Health Cap. Facilities Proj.) Series 2000 IIA, 5.375% 6/1/14 | | 2,200,000 | | 2,403,962 |
Ohio Solid Waste Rev. (Waste Mgmt., Inc. Proj.) 4.85%, tender 11/1/07 (b)(c) | | 3,000,000 | | 3,075,870 |
Ohio State Univ. Gen. Receipts: | | | | |
Series 2002 A, 5.125% 12/1/31 | | 5,000,000 | | 5,357,150 |
Series A, 5.8% 12/1/29 | | 3,300,000 | | 3,653,925 |
Series B, 5.25% 6/1/16 | | 5,000,000 | | 5,562,900 |
Ohio Tpk. Commission Tpk. Rev.: | | | | |
Series A, 5.5% 2/15/21 (FGIC Insured) | | 5,000,000 | | 5,922,050 |
5.5% 2/15/26 | | 3,700,000 | | 4,048,096 |
Ohio Univ. Gen. Receipts Athens 5% 12/1/18
(MBIA Insured) | | 1,980,000 | | 2,156,418 |
Municipal Bonds - continued |
| Principal
Amount | | Value
(Note 1) |
Ohio - continued |
Ohio Wtr. Dev. Auth. Poll. Cont. Facilities Rev. (Toledo Edison Co. Proj.) Series B, 4.5%, tender 9/1/05 (b) | | $ 2,000,000 | | $ 2,001,800 |
Ohio Wtr. Dev. Auth. Rev.: | | | | |
(Drinking Wtr. Fund Prog.): | | | | |
Series 2002, 5.5% 12/1/21 (Pre-Refunded to 12/1/12 @ 100) (d) | | 4,040,000 | | 4,616,548 |
Series 2005: | | | | |
5.25% 6/1/18 (a) | | 2,610,000 | | 2,981,586 |
5.25% 12/1/18 (a) | | 2,610,000 | | 2,977,906 |
(Fresh Wtr. Impt. Proj.): | | | | |
Series B, 5.5% 6/1/16 (FSA Insured) | | 1,560,000 | | 1,820,676 |
5% 12/1/34 | | 3,000,000 | | 3,185,790 |
5.25% 12/1/15 | | 2,200,000 | | 2,489,190 |
5.375% 12/1/19 (Pre-Refunded to 6/1/12 @ 100) (d) | | 3,000,000 | | 3,387,300 |
5.5% 6/1/17 | | 3,960,000 | | 4,653,634 |
(Pure Wtr. Proj.): | | | | |
Series I, 6% 12/1/16 (Escrowed to Maturity) (d) | | 1,685,000 | | 1,957,128 |
5.5% 12/1/18 (AMBAC Insured) | | 240,000 | | 240,893 |
5% 12/1/17 | | 3,765,000 | | 4,145,265 |
5.25% 6/1/13 (MBIA Insured) (a) | | 1,295,000 | | 1,457,859 |
5.25% 12/1/13 (MBIA Insured) (a) | | 1,305,000 | | 1,473,006 |
5.25% 6/1/14 (MBIA Insured) (a) | | 1,250,000 | | 1,414,000 |
5.25% 12/1/14 (MBIA Insured) (a) | | 1,260,000 | | 1,427,769 |
5.25% 12/1/15 (MBIA Insured) (a) | | 1,180,000 | | 1,341,070 |
5.25% 6/1/17 (MBIA Insured) (a) | | 1,160,000 | | 1,331,796 |
Ohio Wtr. Dev. Auth. Solid Waste Disp. Rev. (North Star BHP Steel/Cargill Proj.) 6.3% 9/1/20 (c) | | 6,350,000 | | 6,511,100 |
Ohio Wtr. Dev. Auth. Wtr. Poll. Cont. Rev.: | | | | |
(Ohio Edison Co. Proj.) Series A, 3.35%, tender 6/1/06 (b) | | 3,000,000 | | 3,002,580 |
5% 6/1/18 | | 2,000,000 | | 2,189,260 |
5.25% 12/1/19 | | 1,975,000 | | 2,266,629 |
Olentangy Local School District (School Facilities Construction & Impt. Proj.) Series A: | | | | |
5.25% 12/1/17 | | 1,335,000 | | 1,488,926 |
5.5% 12/1/15 (FGIC Insured) | | 1,055,000 | | 1,221,869 |
Otsego Local School District Wood, Henry & Lucas Counties 5.375% 12/1/32 (FSA Insured) | | 1,000,000 | | 1,113,470 |
Penta Career Ctr. Ctfs. of Prtn.: | | | | |
(Ohio School Facilities Proj.) 5.25% 4/1/17
(FGIC Insured) | | 1,755,000 | | 1,952,227 |
Municipal Bonds - continued |
| Principal
Amount | | Value
(Note 1) |
Ohio - continued |
Penta Career Ctr. Ctfs. of Prtn.: - continued | | | | |
(Wood, Lucas, Sandusky, Fulton, Ottawa, Henry and Hancock Counties, Ohio School Facilities Proj.) 5.25% 4/1/19 (FGIC Insured) | | $ 1,940,000 | | $ 2,151,906 |
Pickerington Local School District 5.25% 12/1/20
(FGIC Insured) | | 5,000,000 | | 5,473,850 |
Plain Local School District 6% 12/1/25 (FGIC Insured) | | 990,000 | | 1,128,848 |
Richland County Hosp. Facilities (MedCentral Health Sys. Proj.) Series B: | | | | |
6.375% 11/15/22 | | 1,500,000 | | 1,616,085 |
6.375% 11/15/30 | | 1,000,000 | | 1,076,410 |
Rocky River Gen. Oblig. 5% 12/1/19 (AMBAC Insured) | | 2,125,000 | | 2,321,435 |
Scioto County Marine Term. Facilities Rev. (Norfolk Southern Corp. Proj.) 5.3% 8/15/13 | | 3,000,000 | | 3,098,160 |
Sharonville Gen. Oblig. 5.25% 6/1/16 (FGIC Insured) | | 1,410,000 | | 1,570,782 |
Sugarcreek Local School District 5.25% 12/1/22
(MBIA Insured) | | 1,800,000 | | 1,975,320 |
Summit County Gen. Oblig.: | | | | |
5.25% 12/1/20 | | 1,645,000 | | 1,847,861 |
5.25% 12/1/21 | | 1,740,000 | | 1,950,540 |
Swanton Local School District 5.25% 12/1/21
(FGIC Insured) | | 3,415,000 | | 3,724,877 |
Toledo Wtrwks. Rev. 5% 11/15/16 (AMBAC Insured) | | 1,110,000 | | 1,219,579 |
Univ. of Akron Gen. Receipts Series B, 5% 1/1/27 (FGIC Insured) | | 1,405,000 | | 1,496,929 |
Univ. of Cincinnati Ctfs. of Prtn.: | | | | |
5.5% 6/1/11 (MBIA Insured) | | 1,045,000 | | 1,161,894 |
5.5% 6/1/12 (MBIA Insured) | | 1,315,000 | | 1,458,835 |
5.5% 6/1/15 (MBIA Insured) | | 1,000,000 | | 1,105,940 |
Univ. of Cincinnati Gen. Receipts Series 2004 A: | | | | |
5% 6/1/18 (AMBAC Insured) | | 1,445,000 | | 1,579,457 |
5% 6/1/19 (AMBAC Insured) | | 1,520,000 | | 1,660,235 |
Warren County Gen. Oblig.: | | | | |
Swr. Impt. (P&G Co./Lower Miami Proj.) 5.5% 12/1/16 (Pre-Refunded to 12/1/05 @ 101) (d) | | 1,455,000 | | 1,487,025 |
6.1% 12/1/12 | | 500,000 | | 558,265 |
6.65% 12/1/11 | | 380,000 | | 415,435 |
Wright State Univ. Gen. Receipts: | | | | |
5% 5/1/17 (MBIA Insured) | | 1,375,000 | | 1,509,475 |
5% 5/1/18 (MBIA Insured) | | 1,440,000 | | 1,572,898 |
5% 5/1/19 (MBIA Insured) | | 1,515,000 | | 1,653,638 |
| | 419,559,986 |
Municipal Bonds - continued |
| Principal
Amount | | Value
(Note 1) |
Puerto Rico - 4.0% |
Puerto Rico Commonwealth Hwy. & Trans. Auth. Hwy. Rev. Series Y, 5.5% 7/1/36 (FSA Insured) | | $ 1,000,000 | | $ 1,153,460 |
Puerto Rico Commonwealth Hwy. & Trans. Auth. Trans. Rev. Series E, 5.5% 7/1/22 (FSA Insured) | | 1,500,000 | | 1,814,895 |
Puerto Rico Commonwealth Infrastructure Fing. Auth.: | | | | |
Series 2000 A: | | | | |
5.5% 10/1/32 (Escrowed to Maturity) (d) | | 1,600,000 | | 1,766,368 |
5.5% 10/1/40 (Escrowed to Maturity) (d) | | 5,780,000 | | 6,366,439 |
Series C, 5.5% 7/1/17 (AMBAC Insured) | | 3,100,000 | | 3,639,555 |
Puerto Rico Elec. Pwr. Auth. Pwr. Rev.: | | | | |
Series HH, 5.25% 7/1/29 (FSA Insured) | | 800,000 | | 867,592 |
Series QQ, 5.5% 7/1/17 (XL Cap. Assurance, Inc. Insured) | | 1,300,000 | | 1,533,181 |
| | 17,141,490 |
Virgin Islands - 0.1% |
Virgin Islands Pub. Fin. Auth. Rev. Series A, 5% 10/1/09 | | 500,000 | | 531,290 |
TOTAL MUNICIPAL BONDS (Cost $411,923,388) | 437,232,766 |
Municipal Notes - 0.4% |
| | | |
Ohio - 0.4% |
Ohio Poll. Cont. Rev. (Gen. Motors Corp. Proj.) Series 1985, 4.85%, VRDN (b)
(Cost $2,000,000) | | 2,000,000 | | 2,000,000 |
TOTAL INVESTMENT PORTFOLIO - 100.8% (Cost $413,923,388) | | | 439,232,766 |
NET OTHER ASSETS - (0.8)% | | | (3,663,784) |
NET ASSETS - 100% | | $ 435,568,982 |
Security Type Abbreviation |
VRDN - VARIABLE RATE DEMAND NOTE |
Legend |
(a) Security or a portion of the security purchased on a delayed delivery or when-issued basis. |
(b) The coupon rate shown on floating or adjustable rate securities represents the rate at period end. |
(c) Private activity obligations whose interest is subject to the federal alternative minimum tax for individuals. |
(d) Security collateralized by an amount sufficient to pay interest and principal. |
Other Information |
The distribution of municipal securities by revenue source, as a percentage of total net assets, is as follows: |
General Obligations | 40.6% |
Education | 12.7% |
Water & Sewer | 10.8% |
Escrowed/Pre-Refunded | 10.6% |
Health Care | 7.2% |
Special Tax | 5.2% |
Others* (individually less than 5%) | 12.9% |
| 100.0% |
*Includes net other assets |
See accompanying notes which are an integral part of the financial statements.
Semiannual Report
Spartan Ohio Municipal Income Fund
Financial Statements
Statement of Assets and Liabilities
| June 30, 2005 (Unaudited) |
| | |
Assets | | |
Investment in securities, at value (cost $413,923,388) - See accompanying schedule | | $ 439,232,766 |
Cash | | 16,248,911 |
Receivable for fund shares sold | | 647,915 |
Interest receivable | | 3,069,928 |
Prepaid expenses | | 881 |
Other receivables | | 18,641 |
Total assets | | 459,219,042 |
| | |
Liabilities | | |
Payable for investments purchased
Regular delivery | $ 4,646,210 | |
Delayed delivery | 18,319,241 | |
Payable for fund shares redeemed | 92,437 | |
Distributions payable | 398,773 | |
Accrued management fee | 134,608 | |
Other affiliated payables | 38,234 | |
Other payables and accrued expenses | 20,557 | |
Total liabilities | | 23,650,060 |
| | |
Net Assets | | $ 435,568,982 |
Net Assets consist of: | | |
Paid in capital | | $ 406,776,151 |
Distributions in excess of net investment income | | (86,580) |
Accumulated undistributed net realized gain (loss) on investments | | 3,570,033 |
Net unrealized appreciation (depreciation) on investments | | 25,309,378 |
Net Assets, for 36,190,197 shares outstanding | | $ 435,568,982 |
Net Asset Value, offering price and redemption price per share ($435,568,982 ÷ 36,190,197 shares) | | $ 12.04 |
See accompanying notes which are an integral part of the financial statements.
Semiannual Report
Statement of Operations
| Six months ended June 30, 2005 (Unaudited) |
| | |
Investment Income | | |
Interest | | $ 9,551,149 |
| | |
Expenses | | |
Management fee | $ 798,251 | |
Transfer agent fees | 165,096 | |
Accounting fees and expenses | 53,344 | |
Independent trustees' compensation | 991 | |
Custodian fees and expenses | 3,547 | |
Registration fees | 16,443 | |
Audit | 22,609 | |
Legal | 1,540 | |
Miscellaneous | 2,297 | |
Total expenses before reductions | 1,064,118 | |
Expense reductions | (42,358) | 1,021,760 |
Net investment income | | 8,529,389 |
Realized and Unrealized Gain (Loss) Net realized gain (loss) on: | | |
Investment securities | 3,940,824 | |
Futures contracts | 575 | |
Total net realized gain (loss) | | 3,941,399 |
Change in net unrealized appreciation (depreciation) on investment securities | | (1,132,142) |
Net gain (loss) | | 2,809,257 |
Net increase (decrease) in net assets resulting from operations | | $ 11,338,646 |
See accompanying notes which are an integral part of the financial statements.
Semiannual Report
Spartan Ohio Municipal Income Fund
Financial Statements - continued
Statement of Changes in Net Assets
| Six months ended
June 30, 2005
(Unaudited) | Year ended
December 31,
2004 |
Increase (Decrease) in Net Assets | | |
Operations | | |
Net investment income | $ 8,529,389 | $ 17,450,563 |
Net realized gain (loss) | 3,941,399 | 5,347,550 |
Change in net unrealized appreciation (depreciation) | (1,132,142) | (4,790,968) |
Net increase (decrease) in net assets resulting
from operations | 11,338,646 | 18,007,145 |
Distributions to shareholders from net investment income | (8,550,627) | (17,502,945) |
Distributions to shareholders from net realized gain | (710,742) | (5,096,645) |
Total distributions | (9,261,369) | (22,599,590) |
Share transactions
Proceeds from sales of shares | 26,698,027 | 45,167,492 |
Reinvestment of distributions | 6,649,425 | 16,402,646 |
Cost of shares redeemed | (23,457,369) | (64,421,289) |
Net increase (decrease) in net assets resulting from share transactions | 9,890,083 | (2,851,151) |
Redemption fees | 4,249 | 2,423 |
Total increase (decrease) in net assets | 11,971,609 | (7,441,173) |
| | |
Net Assets | | |
Beginning of period | 423,597,373 | 431,038,546 |
End of period (including distributions in excess of net investment income of $86,580 and distributions in excess of net investment income of $48,762, respectively) | $ 435,568,982 | $ 423,597,373 |
Other Information Shares | | |
Sold | 2,229,213 | 3,749,160 |
Issued in reinvestment of distributions | 555,407 | 1,368,296 |
Redeemed | (1,961,090) | (5,378,568) |
Net increase (decrease) | 823,530 | (261,112) |
See accompanying notes which are an integral part of the financial statements.
Semiannual Report
Financial Highlights
| Six months ended June 30, 2005 | Years ended December 31, |
| (Unaudited) | 2004 | 2003 | 2002 | 2001 | 2000 |
Selected Per-Share Data | | | | | |
Net asset value, beginning of period | $ 11.98 | $ 12.10 | $ 12.03 | $ 11.54 | $ 11.54 | $ 10.86 |
Income from Investment Operations | | | | | | |
Net investment income D | .239 | .496 | .507 | .527 | .542 F | .552 |
Net realized and unrealized gain (loss) | .081 | .026 | .166 | .568 | (.002) F | .681 |
Total from investment operations | .320 | .522 | .673 | 1.095 | .540 | 1.233 |
Distributions from net investment income | (.240) | (.497) | (.508) | (.525) | (.540) | (.553) |
Distributions from net realized gain | (.020) | (.145) | (.095) | (.080) | - | - |
Total distributions | (.260) | (.642) | (.603) | (.605) | (.540) | (.553) |
Redemption fees added to paid in capital | - D, G | - D, G | - D, G | - D, G | - D, G | - |
Net asset value,
end of period | $ 12.04 | $ 11.98 | $ 12.10 | $ 12.03 | $ 11.54 | $ 11.54 |
Total Return B, C | 2.70% | 4.44% | 5.72% | 9.68% | 4.73% | 11.68% |
Ratios to Average Net Assets E | | | | | |
Expenses before expense reductions | .50% A | .50% | .51% | .51% | .51% | .52% |
Expenses net of voluntary waivers,
if any | .50% A | .50% | .51% | .51% | .51% | .52% |
Expenses net of all reductions | .48% A | .49% | .50% | .49% | .46% | .46% |
Net investment income | 4.03% A | 4.13% | 4.20% | 4.45% | 4.64% F | 4.99% |
Supplemental Data | | | | | |
Net assets,
end of period
(000 omitted) | $ 435,569 | $ 423,597 | $ 431,039 | $ 435,057 | $ 399,353 | $ 381,052 |
Portfolio turnover rate | 26% A | 26% | 22% | 19% | 17% | 28% |
A Annualized
B Total returns for periods of less than one year are not annualized.
C Total returns would have been lower had certain expenses not been reduced during the periods shown.
D Calculated based on average shares outstanding during the period.
E Expense ratios reflect operating expenses of the fund. Expenses before reductions do not reflect amounts reimbursed by the investment adviser or reductions from brokerage service arrangements or other expense offset arrangements and do not represent the amount paid by the fund during periods when reimbursements or reductions occur. Expenses net of any voluntary waivers reflect expenses after reimbursement by the investment adviser but prior to reductions from brokerage service arrangements or other expense offset arrangements. Expenses net of all reductions represent the net expenses paid by the fund.
F Effective January 1, 2001, the fund adopted the provisions of the AICPA Audit and Accounting Guide for Investment Companies and began amortizing premium and discount on all debt securities. Per-share data and ratios for periods prior to adoption have not been restated to reflect this change.
G Amount represents less than $.001 per share.
See accompanying notes which are an integral part of the financial statements.
Semiannual Report
Fidelity Ohio Municipal Money Market Fund
Investment Changes
Maturity Diversification |
Days | % of fund's
investments
6/30/05 | % of fund's
investments
12/31/04 | % of fund's
investments
6/30/04 |
0 - 30 | 77.7 | 85.4 | 84.8 |
31 - 90 | 7.7 | 5.0 | 6.7 |
91 - 180 | 5.6 | 2.5 | 5.4 |
181 - 397 | 9.0 | 7.1 | 3.1 |
Weighted Average Maturity |
| 6/30/05 | 12/31/04 | 6/30/04 |
Fidelity Ohio Municipal Money
Market Fund | 44 Days | 34 Days | 26 Days |
Ohio Tax-Free Money Market
Funds Average * | 34 Days | 42 Days | 41 Days |
Asset Allocation (% of fund's net assets) |
As of June 30, 2005 | As of December 31, 2004 |
| Variable Rate
Demand Notes
(VRDNs) 75.2% | | | Variable Rate
Demand Notes
(VRDNs) 84.4% | |
| Commercial Paper (including
CP Mode) 4.5% | | | Commercial Paper (including
CP Mode) 2.6% | |
| Tender Bonds 3.8% | | | Tender Bonds 4.0% | |
 | Municipal Notes 13.6% | | | Municipal Notes 8.0% | |
| Fidelity Municipal
Cash Central Fund 0.0% | | | Fidelity Municipal
Cash Central Fund 0.3% | |
| Net Other Assets 2.9% | | | Net Other Assets 0.7% | |

*Source: iMoneyNet, Inc.
Semiannual Report
Fidelity Ohio Municipal Money Market Fund
Investments June 30, 2005 (Unaudited)
Showing Percentage of Net Assets
Municipal Securities - 97.1% |
| Principal
Amount | | Value
(Note 1) |
Georgia - 0.7% |
Columbus Wtr. & Swr. Rev. Participating VRDN Series PT 2516, 2.31% (Liquidity Facility Merrill Lynch & Co., Inc.) (a)(c) | $ 5,175,000 | | $ 5,175,000 |
Ohio - 96.0% |
Akron Gen. Oblig. BAN 2.75% 11/3/05 | 9,133,000 | | 9,159,085 |
Akron Income Tax Rev. Participating VRDN: | | | |
Series ROC II R2137, 2.31% (Liquidity Facility Citigroup Global Markets Hldgs., Inc.) (a)(c) | 1,390,000 | | 1,390,000 |
Series ROC II R259, 2.31% (Liquidity Facility Citibank NA) (a)(c) | 2,210,000 | | 2,210,000 |
American Muni. Pwr. Bonds (Omega Joint Venture 6 Proj.) 2.24%, tender 8/14/05 (a) | 9,439,000 | | 9,439,000 |
Ashtabula County Indl. Dev. Rev. (Plasticolors, Inc. Proj.)
Series 1996 A, 2.44%, LOC Key Bank NA, VRDN (a)(b) | 1,770,000 | | 1,770,000 |
Blue Ash Gen. Oblig. BAN 2.35% 11/15/05 | 3,000,000 | | 3,000,000 |
Butler County Gen. Oblig. BAN 3.75% 6/8/06 | 4,025,000 | | 4,054,271 |
Butler County Wtrwks. Rev. Participating VRDN Series ROC II R2207, 2.31% (Liquidity Facility Citigroup Global Markets Hldgs., Inc.) (a)(c) | 2,560,000 | | 2,560,000 |
Cambridge Hosp. Facilities Rev. (Southeastern Reg'l. Med. Ctr. Proj.) 3.1%, LOC Nat'l. City Bank, VRDN (a) | 4,525,000 | | 4,525,000 |
Cincinnati City School District Participating VRDN Series EGL 04 34, 2.31% (Liquidity Facility Citibank NA) (a)(c) | 1,295,000 | | 1,295,000 |
Cincinnati Student Ln. Fdg. Corp. Student Ln. Rev.: | | | |
Series 1998 A1, 2.33% (Liquidity Facility Sallie Mae), VRDN (a)(b) | 7,700,000 | | 7,700,000 |
Series 1998 A2, 2.33% (Liquidity Facility Sallie Mae), VRDN (a)(b) | 19,800,000 | | 19,800,000 |
Cincinnati Wtr. Sys. Rev. Participating VRDN Series ROC II R7528, 2.31% (Liquidity Facility Citibank NA) (a)(c) | 2,645,000 | | 2,645,000 |
Clermont County Indl. Dev. Rev. (American Micro Products Proj.) 2.44%, LOC U.S. Bank NA, Minnesota, VRDN (a)(b) | 2,040,000 | | 2,040,000 |
Cleveland Arpt. Sys. Rev. Participating VRDN: | | | |
Series PT 799, 2.36% (Liquidity Facility Merrill Lynch & Co., Inc.) (a)(b)(c) | 1,500,000 | | 1,500,000 |
Series Stars 81, 2.36% (Liquidity Facility BNP Paribas SA) (a)(b)(c) | 5,610,000 | | 5,610,000 |
Cleveland Gen. Oblig. Participating VRDN Series PT 2032, 2.31% (Liquidity Facility Merrill Lynch & Co., Inc.) (a)(c) | 3,050,000 | | 3,050,000 |
Cleveland Wtrwks. Rev. Bonds Series Merlots 01 A24, 2.11%, tender 11/10/05 (Liquidity Facility Wachovia Bank NA) (a)(c)(d) | 4,020,000 | | 4,020,000 |
Municipal Securities - continued |
| Principal
Amount | | Value
(Note 1) |
Ohio - continued |
Columbus City School District Participating VRDN Series PT 2278, 2.31% (Liquidity Facility Merrill Lynch & Co., Inc.) (a)(c) | $ 2,750,000 | | $ 2,750,000 |
Columbus Gen. Oblig. Participating VRDN Series MS 01 585, 2.3% (Liquidity Facility Morgan Stanley) (a)(c) | 5,175,000 | | 5,175,000 |
Cuyahoga County Arpt. Facilities Rev. (Corporate Wings-Cleveland LLC Proj.) 2.42%, LOC Nat'l. City Bank, VRDN (a)(b) | 3,800,000 | | 3,800,000 |
Cuyahoga County Civic Facilities Rev. (Fairfax Dev. Corp. Proj.) 2.37%, LOC Key Bank NA, VRDN (a) | 4,455,000 | | 4,455,000 |
Cuyahoga County Health Care Facilities Rev. (Althenheim Proj.) 2.43%, LOC U.S. Bank NA, Minnesota, VRDN (a) | 6,475,000 | | 6,475,000 |
Cuyahoga County Indl. Dev. Rev.: | | | |
(Progressive Plastics, Inc. Proj.) 2.47%, LOC JPMorgan Chase Bank, VRDN (a)(b) | 1,290,000 | | 1,290,000 |
(Pubco Corp. Proj.) Series 2001, 2.42%, LOC Nat'l. City Bank, VRDN (a)(b) | 2,820,000 | | 2,820,000 |
(The Great Lakes Brewing Co. Proj.) Series 1997, 2.58%, LOC Huntington Nat'l. Bank, Columbus, VRDN (a)(b) | 3,790,000 | | 3,790,000 |
Cuyahoga County Rev. (Cleveland Clinic Health Sys. Obligated Group Prog.) Sub Series B3, 2.35%, VRDN (a) | 2,600,000 | | 2,600,000 |
Darke County Health Care Facilities Rev. (Brethren Retirement Cmnty. Proj.) 2.36%, LOC Fifth Third Bank, Cincinnati, VRDN (a) | 7,015,000 | | 7,015,000 |
Dayton Gen. Oblig. BAN 3% 7/7/05 (b) | 2,650,000 | | 2,650,427 |
Dayton School District Participating VRDN Series SG 173, 2.31% (Liquidity Facility Societe Generale) (a)(c) | 13,030,000 | | 13,030,000 |
Delaware County Health Care Facilities (Willow Brook Christian Cmnty. Proj.) Series 1999, 2.4%, LOC Huntington Nat'l. Bank, Columbus, VRDN (a) | 3,725,000 | | 3,725,000 |
Erie County Gen. Oblig. BAN 3.25% 4/12/06 | 13,000,000 | | 13,039,385 |
Erie County Multi-family Hsg. Rev. (Providence Residential Comnty. Corp. Proj.) Series 1999 A, 2.43%, LOC JPMorgan Chase Bank, VRDN (a) | 10,060,000 | | 10,060,000 |
Franklin County Multi-family Rev.: | | | |
(Golf Pointe Apts. Proj.) Series 2000 A, 2.35%, LOC Lasalle Bank NA, VRDN (a)(b) | 6,690,000 | | 6,690,000 |
(Hanover Ridge Apts. Proj. 2.45%, LOC Fannie Mae, VRDN (a)(b) | 4,350,000 | | 4,350,000 |
Geauga County Health Care Facilities Rev. (Montefiore Hsg. Corp. Proj.) Series 2001, 2.37%, LOC Key Bank NA, VRDN (a) | 5,645,000 | | 5,645,000 |
Grove City Gen. Oblig. BAN: | | | |
3% 8/25/05 | 8,044,000 | | 8,054,570 |
Municipal Securities - continued |
| Principal
Amount | | Value
(Note 1) |
Ohio - continued |
Grove City Gen. Oblig. BAN: - continued | | | |
3.75% 6/22/06 | $ 9,790,000 | | $ 9,883,863 |
Hamilton County Health Care Facilities Rev. 2.36%, LOC Fifth Third Bank, Cincinnati, VRDN (a) | 4,145,000 | | 4,145,000 |
Hamilton Gen. Oblig. BAN: | | | |
3.5% 3/28/06 | 9,800,000 | | 9,867,095 |
3.75% 6/1/06 | 3,400,000 | | 3,422,717 |
Jackson Local School District Stark & Summit Counties Participating VRDN Series PT 2334, 2.31% (Liquidity Facility Merrill Lynch & Co., Inc.) (a)(c) | 4,005,000 | | 4,005,000 |
Kettering Indl. Dev. Rev. (Millat Industries Corp. Proj.) 2.42%, LOC Nat'l. City Bank, VRDN (a)(b) | 3,120,000 | | 3,120,000 |
Lake County Indl. Dev. Rev.: | | | |
(American Bus. Co. Proj.) 2.58%, LOC Huntington Nat'l. Bank, Columbus, VRDN (a)(b) | 860,000 | | 860,000 |
(Norshar Co. Proj.) 2.47%, LOC JPMorgan Chase Bank, VRDN (a)(b) | 2,925,000 | | 2,925,000 |
Lima Hosp. Rev. (Lima Memorial Hosp. Proj.) 2.42%, LOC JPMorgan Chase Bank, VRDN (a) | 2,300,000 | | 2,300,000 |
Lucas County Multi-family Rev. (Lakewoods Proj.) 2.44%, LOC Key Bank NA, VRDN (a)(b) | 4,000,000 | | 4,000,000 |
Marysville Gen. Oblig. BAN 3.75% 8/25/05 | 2,119,000 | | 2,121,756 |
Medina County Indl. Dev. Rev.: | | | |
(Firedex, Inc. Proj.) Series 1997, 2.44%, LOC Key Bank NA, VRDN (a)(b) | 855,000 | | 855,000 |
(Rembond Proj.) Series 1996, 2.47%, LOC JPMorgan Chase Bank, VRDN (a)(b) | 1,845,000 | | 1,845,000 |
Montgomery County Gen. Oblig. Participating VRDN Series ROC II R7513, 2.31% (Liquidity Facility Citibank NA) (a)(c) | 7,850,000 | | 7,850,000 |
Montgomery County Health Care Facilities Rev.: | | | |
(Eastway Corp. & Property Resource Proj.) Series 1997, 2.58%, LOC Huntington Nat'l. Bank, Columbus, VRDN (a)(b) | 2,570,000 | | 2,570,000 |
(Kettering Affiliated Proj.) 2.42%, LOC JPMorgan Chase Bank, VRDN (a) | 2,400,000 | | 2,400,000 |
Montgomery County Multi-family Hsg. Dev. Rev. (Pedcor Invts.-Lyons Gate Proj.) 2.35%, LOC Fed. Home Ln. Bank, Cincinnati, VRDN (a)(b) | 4,306,000 | | 4,306,000 |
North Ridgeville Gen. Oblig. BAN 2.48% 12/15/05 | 8,965,000 | | 8,972,198 |
Ohio Air Quality Dev. Auth. Rev.: | | | |
Participating VRDN Series PA 769R, 2.31% (Liquidity Facility Merrill Lynch & Co., Inc.) (a)(c) | 3,880,000 | | 3,880,000 |
(AK Steel Corp. Proj.) Series A, 2.45%, LOC ABN-AMRO Bank NV, VRDN (a)(b) | 14,500,000 | | 14,500,000 |
Municipal Securities - continued |
| Principal
Amount | | Value
(Note 1) |
Ohio - continued |
Ohio Air Quality Dev. Auth. Rev.: - continued | | | |
(Cincinnati Gas & Elec. Co. Proj.) Series A, 2.34%, LOC Cr. Lyonnais SA, VRDN (a)(b) | $ 12,100,000 | | $ 12,100,000 |
Ohio Bldg. Auth. Participating VRDN: | | | |
Series Putters 790, 2.32% (Liquidity Facility JPMorgan Chase Bank) (a)(c) | 3,200,000 | | 3,200,000 |
Series Putters 793, 2.32% (Liquidity Facility JPMorgan Chase & Co.) (a)(c) | 2,080,000 | | 2,080,000 |
Ohio Gen. Oblig. Participating VRDN: | | | |
Series PT 2046, 2.31% (Liquidity Facility Merrill Lynch & Co., Inc.) (a)(c) | 4,280,000 | | 4,280,000 |
Series PT 2139, 2.31% (Liquidity Facility Merrill Lynch & Co., Inc.) (a)(c) | 4,295,000 | | 4,295,000 |
Series ROC II R341, 2.32% (Liquidity Facility Citibank NA) (a)(c) | 3,895,000 | | 3,895,000 |
Series ROC II R7508, 2.32% (Liquidity Facility Citibank NA) (a)(c) | 11,230,000 | | 11,230,000 |
Ohio Higher Edl. Facility Commission Rev.: | | | |
Participating VRDN Series MS 98 116, 2.3% (Liquidity Facility Morgan Stanley) (a)(c) | 10,120,000 | | 10,120,000 |
(Ashland Univ. Proj.) 2.33%, LOC Key Bank NA, VRDN (a) | 11,650,000 | | 11,650,000 |
(Cleveland Institute of Music Proj.) 2.33%, LOC Nat'l. City Bank, VRDN (a) | 7,000,000 | | 7,000,000 |
(Pooled Fing. Prog.): | | | |
Series 1996, 2.37%, LOC Fifth Third Bank, Cincinnati, VRDN (a) | 2,095,000 | | 2,095,000 |
Series 1997, 2.37%, LOC Fifth Third Bank, Cincinnati, VRDN (a) | 2,000,000 | | 2,000,000 |
Series 1998, 2.62%, LOC Fifth Third Bank, Cincinnati, VRDN (a) | 9,935,000 | | 9,935,000 |
Series 1999, 2.37%, LOC Fifth Third Bank, Cincinnati, VRDN (a) | 8,665,000 | | 8,665,000 |
Ohio Hsg. Fin. Agcy. Mtg. Rev.: | | | |
Bonds Series Merlots 00 A1, 2.17%, tender 11/10/05 (Liquidity Facility Wachovia Bank NA) (a)(b)(c)(d) | 5,510,000 | | 5,510,000 |
Participating VRDN: | | | |
Series BA 00 Q, 2.43% (Liquidity Facility Bank of America NA) (a)(b)(c) | 250,000 | | 250,000 |
Series BA 01 I, 2.4% (Liquidity Facility Bank of America NA) (a)(b)(c) | 3,775,000 | | 3,775,000 |
Series BA 98 B, 2.43% (Liquidity Facility Bank of America NA) (a)(b)(c) | 14,695,000 | | 14,695,000 |
Series BA 98 Q, 2.43% (Liquidity Facility Bank of America NA) (a)(b)(c) | 4,600,000 | | 4,600,000 |
Municipal Securities - continued |
| Principal
Amount | | Value
(Note 1) |
Ohio - continued |
Ohio Hsg. Fin. Agcy. Mtg. Rev.: - continued | | | |
Participating VRDN: | | | |
Series BA 99 Q, 2.43% (Liquidity Facility Bank of America NA) (a)(b)(c) | $ 620,000 | | $ 620,000 |
Series FRRI 25, 2.48% (Liquidity Facility Bank of New York, New York) (a)(b)(c) | 1,170,000 | | 1,170,000 |
Series LB 03 L46J, 2.48% (Liquidity Facility Lehman Brothers Hldgs., Inc.) (a)(b)(c) | 6,340,000 | | 6,340,000 |
Series Merlots 01 A78, 2.37% (Liquidity Facility Wachovia Bank NA) (a)(b)(c) | 1,890,000 | | 1,890,000 |
Series Merlots 02 A34, 2.37% (Liquidity Facility Wachovia Bank NA) (a)(b)(c) | 1,765,000 | | 1,765,000 |
Series PT 1334, 2.36% (Liquidity Facility Merrill Lynch & Co., Inc.) (a)(b)(c) | 5,060,000 | | 5,060,000 |
Series PT 228, 2.36% (Liquidity Facility Merrill Lynch & Co., Inc.) (a)(b)(c) | 4,160,000 | | 4,160,000 |
Series PT 241, 2.36% (Liquidity Facility Merrill Lynch & Co., Inc.) (a)(b)(c) | 2,920,000 | | 2,920,000 |
Series PT 567, 2.36% (Liquidity Facility Merrill Lynch & Co., Inc.) (a)(b)(c) | 3,160,000 | | 3,160,000 |
Series PT 582, 2.36% (Liquidity Facility Svenska Handelsbanken AB) (a)(b)(c) | 2,400,000 | | 2,400,000 |
Series B, 2.45% (Liquidity Facility Fed. Home Ln. Bank, Cincinnati), VRDN (a)(b) | 11,990,000 | | 11,990,000 |
Series F, 2.31% (Liquidity Facility Fed. Home Ln. Bank, Cincinnati), VRDN (a)(b) | 6,400,000 | | 6,400,000 |
Ohio Hsg. Fin. Agcy. Multi-family Hsg. Rev.: | | | |
(Club at Spring Valley Apts. Proj.) Series 1996 A, 2.37%, LOC Key Bank NA, VRDN (a)(b) | 5,700,000 | | 5,700,000 |
(Pedcor Invt. Willowlake Apts. Proj.): | | | |
Series A, 2.35%, LOC Fed. Home Ln. Bank, Indianapolis, VRDN (a)(b) | 2,835,000 | | 2,835,000 |
Series B, 2.45%, LOC Fed. Home Ln. Bank, Indianapolis, VRDN (a)(b) | 475,000 | | 475,000 |
Series C, 2.45%, LOC Fed. Home Ln. Bank, Indianapolis, VRDN (a)(b) | 555,000 | | 555,000 |
Series D, 2.45%, LOC Fed. Home Ln. Bank, Indianapolis, VRDN (a)(b) | 555,000 | | 555,000 |
(Pine Crossing Apts. Proj.) 2.35%, LOC Lasalle Bank NA, VRDN (a)(b) | 5,670,000 | | 5,670,000 |
(Shannon Glenn Apts. Proj.) 2.32%, LOC Fannie Mae, VRDN (a)(b) | 11,800,000 | | 11,800,000 |
Municipal Securities - continued |
| Principal
Amount | | Value
(Note 1) |
Ohio - continued |
Ohio Hsg. Fin. Agcy. Multi-family Hsg. Rev.: - continued | | | |
(Wingate at Belle Meadows Proj.) 2.32%, LOC Fed. Home Ln. Bank, Cincinnati, VRDN (a)(b) | $ 8,750,000 | | $ 8,750,000 |
Ohio Indl. Dev. Rev.: | | | |
(K&S Realty Proj.) Series 1989 I, 2.37%, LOC Nat'l. City Bank, VRDN (a)(b) | 85,000 | | 85,000 |
(K&S Realty/Starr Fabricating, Inc. Proj.) Series 1989 III, 2.37%, LOC Nat'l. City Bank, VRDN (a)(b) | 135,000 | | 135,000 |
Ohio Solid Waste Rev. (BP Exploration & Oil, Inc. Proj.): | | | |
Series 1999, 2.36% (BP PLC Guaranteed), VRDN (a)(b) | 8,100,000 | | 8,100,000 |
Series 2000, 2.36% (BP PLC Guaranteed), VRDN (a)(b) | 3,900,000 | | 3,900,000 |
Ohio State Univ. Gen. Receipts Participating VRDN Series MS 851, 2.3% (Liquidity Facility Morgan Stanley) (a)(c) | 8,245,000 | | 8,245,000 |
Ohio Tpk. Commission Tpk. Rev. Participating VRDN Series MS 98 71, 2.31% (Liquidity Facility Morgan Stanley) (a)(c) | 11,790,000 | | 11,790,000 |
Ohio Univ. Gen. Receipts Rev. Bonds (Ohio State Univ. Proj.) Series 2003 C: | | | |
2.25% tender 8/1/05, CP mode | 19,650,000 | | 19,650,000 |
2.7% tender 8/11/05, CP mode | 7,500,000 | | 7,500,000 |
2.85% tender 8/12/05, CP mode | 6,875,000 | | 6,875,000 |
Ohio Wtr. Dev. Auth. (Waste Mgmt., Inc. Proj.) Series B, 2.45%, LOC Fleet Bank NA, VRDN (a)(b) | 4,700,000 | | 4,700,000 |
Ohio Wtr. Dev. Auth. Poll. Cont. Facilities Rev.: | | | |
(Cleveland Elec. Illuminating Co. Proj.) Series A, 2.3%, LOC Barclays Bank PLC, VRDN (a)(b) | 6,000,000 | | 6,000,000 |
(Toledo Edison Co. Proj.) Series A, 2.28%, LOC Barclays Bank PLC, VRDN (a)(b) | 3,800,000 | | 3,800,000 |
Ohio Wtr. Dev. Auth. Rev. Bonds (Premcor Refining
Group Proj.) 2.38%, tender 12/1/05, LOC Fleet Nat'l. Bank (a)(b) | 10,000,000 | | 10,000,000 |
Ohio Wtr. Dev. Auth. Solid Waste Disp. Rev.
(Timken Co. Proj.) Series 1997, 2.4%, LOC Wachovia Bank NA, VRDN (a)(b) | 24,000,000 | | 24,000,000 |
Pepper Pike Gen. Oblig. BAN 3% 6/22/06 | 1,373,000 | | 1,375,605 |
Perrysburg Gen. Oblig. BAN: | | | |
2.2% 8/11/05 | 1,955,000 | | 1,955,861 |
3.75% 5/25/06 | 4,033,000 | | 4,064,690 |
Port of Greater Cincinnati Dev. Auth. Rev. (Nat'l. Underground Railroad Freedom Ctr., Inc. Proj.) Series 2003 A, 2.4%, LOC JPMorgan Chase Bank, LOC Fifth Third Bank, Cincinnati, VRDN (a) | 6,500,000 | | 6,500,000 |
Portage County Indl. Dev. Rev. (Mantaline Corp. Proj.) 2.42%, LOC Nat'l. City Bank, VRDN (a)(b) | 2,445,000 | | 2,445,000 |
Municipal Securities - continued |
| Principal
Amount | | Value
(Note 1) |
Ohio - continued |
Richland County Health Care Facilities Rev. (Mansfield Memorial Homes Proj.) Series 2002, 2.38%, LOC Key Bank NA, VRDN (a) | $ 4,870,000 | | $ 4,870,000 |
Richland County Indl. Dev. Rev. (Sabin Robbins Paper Co. Proj.) Series 1997, 2.4%, LOC Standard Fed. Bank, VRDN (a)(b) | 1,600,000 | | 1,600,000 |
Rickenbacker Port Auth. Indl. Dev. (Micro Industries Corp. Proj.) Series 2000, 2.47%, LOC JPMorgan Chase Bank, VRDN (a)(b) | 2,590,000 | | 2,590,000 |
Salem City Hosp. Facilities Rev. Series 2000, 2.35%, LOC PNC Bank NA, Pittsburgh, VRDN (a) | 5,600,000 | | 5,600,000 |
Stark County Indl. Dev. Rev. (H-P Products, Inc. Proj.) 2.44%, LOC Key Bank NA, VRDN (a)(b) | 2,290,000 | | 2,290,000 |
Stow Gen. Oblig. BAN 3.5% 5/11/06 | 7,500,000 | | 7,542,648 |
Summit County Indl. Dev. Rev.: | | | |
(Commercial Alloys Corp. Proj.): | | | |
2.47%, LOC Nat'l. City Bank, VRDN (a)(b) | 1,600,000 | | 1,600,000 |
2.52%, LOC Nat'l. City Bank, VRDN (a)(b) | 2,435,000 | | 2,435,000 |
(Kaiser Dev. Proj.) 2.47%, LOC Nat'l. City Bank, VRDN (a)(b) | 615,000 | | 615,000 |
(Keltec, Inc. Proj.) Series 1987, 2.5%, LOC Nat'l. City Bank, VRDN (a)(b) | 115,000 | | 115,000 |
(Mannix Co. Proj.) Series 1987, 2.5%, LOC JPMorgan Chase Bank, VRDN (a)(b) | 620,000 | | 620,000 |
(Sigma Properties Proj.) Series 2000 B, 2.47%, LOC Nat'l. City Bank, VRDN (a)(b) | 1,825,000 | | 1,825,000 |
(Summit Plastic Co. Proj.) 2.47%, LOC Nat'l. City Bank, VRDN (a)(b) | 920,000 | | 920,000 |
(Triumph Hldgs. Proj.) 2.52%, LOC Nat'l. City Bank, VRDN (a)(b) | 1,310,000 | | 1,310,000 |
Tallmadge Gen. Oblig. BAN 3.25% 3/13/06 | 1,950,000 | | 1,959,289 |
Toledo City School District Participating VRDN: | | | |
Series MS 889, 2.3% (Liquidity Facility Morgan Stanley) (a)(c) | 1,802,500 | | 1,802,500 |
Series Putters 655, 2.32% (Liquidity Facility JPMorgan Chase Bank) (a)(c) | 1,695,000 | | 1,695,000 |
Toledo-Lucas County Port Auth. Rev. (P&G Industries Proj.) 2.42%, LOC Nat'l. City Bank, VRDN (a)(b) | 1,895,000 | | 1,895,000 |
Tuscarawas County Hosp. Facilities Rev. Participating VRDN Series MT 103, 2.35% (Liquidity Facility Merrill Lynch & Co., Inc.) (a)(c) | 3,140,000 | | 3,140,000 |
Univ. of Cincinnati Gen. Receipts BAN Series 2005 C, 4% 3/28/06 | 9,460,000 | | 9,548,522 |
Municipal Securities - continued |
| Principal
Amount | | Value
(Note 1) |
Ohio - continued |
Upper Arlington City School District Participating VRDN Series PT 2513, 2.31% (Liquidity Facility Merrill Lynch & Co., Inc.) (a)(c) | $ 6,000,000 | | $ 6,000,000 |
Village of Indian Hill Econ. Dev. Rev. (Cincinnati Country Day School Proj.) Series 1999, 2.37%, LOC Nat'l. City Bank, VRDN (a) | 5,545,000 | | 5,545,000 |
Warren County Health Care Facilities Rev. (Otterbein Homes Proj.) Series 1998 B, 2.43%, LOC Fifth Third Bank, Cincinnati, VRDN (a) | 12,119,000 | | 12,119,000 |
Warren County Indl. Dev. Rev. (Pioneer Indl. Components Proj.) 2.53%, LOC Bank of Tokyo-Mitsubishi Ltd., VRDN (a) | 1,000,000 | | 1,000,000 |
Wood County Indl. Dev. Rev.: | | | |
(CMC Group Proj.) Series 2001, 2.42%, LOC Nat'l. City Bank, VRDN (a)(b) | 2,140,000 | | 2,140,000 |
(Dowa THT America, Inc. Proj.) Series 1999, 2.45%, LOC Comerica Bank, Detroit, VRDN (a)(b) | 3,800,000 | | 3,800,000 |
Zanesville-Muskingum Port Auth. Indl. Dev. Rev. (Almana II LLC Proj.) Series 2000, 2.45%, LOC JPMorgan Chase Bank, VRDN (a)(b) | 5,900,000 | | 5,900,000 |
| | 714,198,482 |
Puerto Rico - 0.4% |
Puerto Rico Commonwealth Infrastructure Fing. Auth. Participating VRDN Series TOC 05 Z6, 2.38% (Liquidity Facility Goldman Sachs Group, Inc.) (a)(c) | 2,900,000 | | 2,900,000 |
TOTAL INVESTMENT PORTFOLIO - 97.1% (Cost $722,273,482) | | 722,273,482 |
NET OTHER ASSETS - 2.9% | | 21,239,709 |
NET ASSETS - 100% | $ 743,513,191 |
Security Type Abbreviations |
BAN - BOND ANTICIPATION NOTE |
CP - COMMERCIAL PAPER |
VRDN - VARIABLE RATE DEMAND NOTE |
Legend |
(a) The coupon rate shown on floating or adjustable rate securities represents the rate at period end. |
(b) Private activity obligations whose interest is subject to the federal alternative minimum tax for individuals. |
(c) Provides evidence of ownership in one or more underlying municipal bonds. |
(d) Restricted securities - Investment in securities not registered under the Securities Act of 1933 (excluding 144A issues). At the end of the period, the value of restricted securities (excluding 144A issues) amounted to $9,530,000 or 1.3% of net assets. |
Additional information on each holding is as follows: |
Security | Acquisition
Date | Cost |
Cleveland Wtrwks. Rev. Bonds Series Merlots 01 A24, 2.11%, tender 11/10/05 (Liquidity Facility Wachovia Bank NA) | 3/16/01 | $ 4,020,000 |
Ohio Hsg. Fin. Agcy. Mtg. Rev. Bonds Series Merlots 00 A1, 2.17%, tender 11/10/05 (Liquidity Facility Wachovia Bank NA) | 9/25/00 - 11/12/03 | $ 5,510,000 |
Income Tax Information |
At December 31, 2004, the fund had a capital loss carryforward of approximately $25,362 all of which will expire on December 31, 2012. |
See accompanying notes which are an integral part of the financial statements.
Semiannual Report
Fidelity Ohio Municipal Money Market Fund
Financial Statements
Statement of Assets and Liabilities
| June 30, 2005 (Unaudited) |
| | |
Assets | | |
Investment in securities, at value (cost $722,273,482) - See accompanying schedule | | $ 722,273,482 |
Cash | | 4,614,710 |
Receivable for investments sold | | 12,528,002 |
Receivable for fund shares sold | | 7,939,614 |
Interest receivable | | 3,571,992 |
Prepaid expenses | | 1,518 |
Other receivables | | 54,928 |
Total assets | | 750,984,246 |
| | |
Liabilities | | |
Payable for investments purchased | $ 2,650,000 | |
Payable for fund shares redeemed | 4,455,744 | |
Distributions payable | 19,361 | |
Accrued management fee | 234,812 | |
Other affiliated payables | 94,233 | |
Other payables and accrued expenses | 16,905 | |
Total liabilities | | 7,471,055 |
| | |
Net Assets | | $ 743,513,191 |
Net Assets consist of: | | |
Paid in capital | | $ 743,449,319 |
Undistributed net investment income | | 67,538 |
Accumulated undistributed net realized gain (loss) on investments | | (3,666) |
Net Assets, for 743,468,170 shares outstanding | | $ 743,513,191 |
Net Asset Value, offering price and redemption price per share ($743,513,191 ÷ 743,468,170 shares) | | $ 1.00 |
See accompanying notes which are an integral part of the financial statements.
Semiannual Report
Statement of Operations
| Six months ended June 30, 2005 (Unaudited) |
| | |
Investment Income | | |
Interest | | $ 8,267,736 |
| | |
Expenses | | |
Management fee | $ 1,409,068 | |
Transfer agent fees | 516,696 | |
Accounting fees and expenses | 46,998 | |
Independent trustees' compensation | 1,718 | |
Custodian fees and expenses | 6,557 | |
Registration fees | 27,217 | |
Audit | 20,147 | |
Legal | 1,777 | |
Miscellaneous | 2,966 | |
Total expenses before reductions | 2,033,144 | |
Expense reductions | (281,890) | 1,751,254 |
Net investment income | | 6,516,482 |
Net realized gain (loss) on investment securities | | 21,694 |
Net increase in net assets resulting from operations | | $ 6,538,176 |
See accompanying notes which are an integral part of the financial statements.
Semiannual Report
Fidelity Ohio Municipal Money Market Fund
Financial Statements - continued
Statement of Changes in Net Assets
| Six months ended
June 30, 2005
(Unaudited) | Year ended
December 31,
2004 |
Increase (Decrease) in Net Assets | | |
Operations | | |
Net investment income | $ 6,516,482 | $ 5,364,905 |
Net realized gain (loss) | 21,694 | (25,360) |
Net increase in net assets resulting
from operations | 6,538,176 | 5,339,545 |
Distributions to shareholders from net investment income | (6,519,764) | (5,369,246) |
Share transactions at net asset value of $1.00 per share
Proceeds from sales of shares | 921,038,885 | 1,700,320,832 |
Reinvestment of distributions | 6,438,292 | 5,288,351 |
Cost of shares redeemed | (954,040,624) | (1,623,280,855) |
Net increase (decrease) in net assets and shares resulting from share transactions | (26,563,447) | 82,328,328 |
Total increase (decrease) in net assets | (26,545,035) | 82,298,627 |
| | |
Net Assets | | |
Beginning of period | 770,058,226 | 687,759,599 |
End of period (including undistributed net investment income of $67,538 and undistributed net investment income of $70,820, respectively) | $ 743,513,191 | $ 770,058,226 |
See accompanying notes which are an integral part of the financial statements.
Semiannual Report
Financial Highlights
| Six months ended June 30, 2005 | Years ended December 31, |
| (Unaudited) | 2004 | 2003 | 2002 | 2001 | 2000 |
Selected Per-Share Data | | | | | |
Net asset value, beginning of period | $ 1.00 | $ 1.00 | $ 1.00 | $ 1.00 | $ 1.00 | $ 1.00 |
Income from Investment Operations | | | | | | |
Net investment income | .009 | .008 | .006 | .011 | .025 | .036 |
Distributions from net investment income | (.009) | (.008) | (.006) | (.011) | (.025) | (.036) |
Net asset value,
end of period | $ 1.00 | $ 1.00 | $ 1.00 | $ 1.00 | $ 1.00 | $ 1.00 |
Total Return B, C | .87% | .76% | .64% | 1.13% | 2.52% | 3.71% |
Ratios to Average Net Assets D | | | | | |
Expenses before expense reductions | .54% A | .54% | .54% | .54% | .55% | .56% |
Expenses net of voluntary waivers, if any | .54% A | .54% | .54% | .54% | .55% | .56% |
Expenses net of all reductions | .47% A | .53% | .53% | .51% | .51% | .55% |
Net investment income | 1.74% A | .77% | .64% | 1.12% | 2.47% | 3.64% |
Supplemental Data | | | | | |
Net assets,
end of period
(000 omitted) | $ 743,513 | $ 770,058 | $ 687,760 | $ 652,072 | $ 622,602 | $ 516,018 |
A Annualized
B Total returns for periods of less than one year are not annualized.
C Total returns would have been lower had certain expenses not been reduced during the periods shown.
D Expense ratios reflect operating expenses of the fund. Expenses before reductions do not reflect amounts reimbursed by the investment adviser or reductions from brokerage service arrangements or other expense offset arrangements and do not represent the amount paid by the fund during periods when reimbursements or reductions occur. Expenses net of any voluntary waivers reflect expenses after reimbursement by the investment adviser but prior to reductions from brokerage service arrangements or other expense offset arrangements. Expenses net of all reductions represent the net expenses paid by the fund.
See accompanying notes which are an integral part of the financial statements.
Semiannual Report
Notes to Financial Statements
For the period ended June 30, 2005 (Unaudited)
1. Significant Accounting Policies.
Spartan Ohio Municipal Income Fund (the income fund) is a fund of Fidelity Municipal Trust. Fidelity Ohio Municipal Money Market Fund (the money market fund) is a fund of Fidelity Municipal Trust II. On July 21, 2005 the Board of Trustees approved a change in the name of Spartan Ohio Municipal Income Fund to Fidelity Ohio Municipal Income Fund effective August 15, 2005. Each trust is registered under the Investment Company Act of 1940, as amended (the 1940 Act), as an open-end management investment company. Fidelity Municipal Trust and Fidelity Municipal Trust II (the trusts) are organized as a Massachusetts business trust and a Delaware statutory trust, respectively. The income fund is a non-diversified fund. Each fund is authorized to issue an unlimited number of shares. Each fund may be affected by economic and political developments in the state of Ohio. The financial statements have been prepared in conformity with accounting principles generally accepted in the United States of America, which require management to make certain estimates and assumptions at the date of the financial statements. The following summarizes the significant accounting policies of the income fund and the money market fund:
Security Valuation. Net asset value per share (NAV calculation) is calculated as of the close of business of the New York Stock Exchange, normally 4:00 p.m. Eastern time. For the income fund, debt securities, including restricted securities, are valued on the basis of information provided by a pricing service. Pricing services use valuation matrices that incorporate both dealer-supplied valuations and valuation models. If prices are not readily available or do not accurately reflect fair value for a security, or if a security's value has been materially affected by events occurring after the close of the exchange or market on which the security is principally traded, that security may be valued by another method that the Board of Trustees believes accurately reflects fair value. A security's valuation may differ depending on the method used for determining value. Price movements in futures contracts and ADRs, market and trading trends, the bid/ask quotes of brokers and off-exchange institutional trading may be reviewed in the course of making a good faith determination of a security's fair value. Short-term securities with remaining maturities of sixty days or less for which quotations are not readily available are valued on the basis of amortized cost. Investments in open-end investment companies are valued at their net asset value each business day.
As permitted under Rule 2a-7 of the 1940 Act, and certain conditions therein, securities owned by the money market fund are valued initially at cost and thereafter assume a constant amortization to maturity of any discount or premium.
Investment Transactions and Income. Security transactions are accounted for as of trade date. Gains and losses on securities sold are determined on the basis of identified cost. Interest income is accrued as earned. Interest income includes coupon interest and amortization of premium and accretion of discount on debt securities.
Expenses. Most expenses of each trust can be directly attributed to a fund. Expenses which cannot be directly attributed are apportioned among each fund in the trust.
Semiannual Report
1. Significant Accounting Policies - continued
Income Tax Information and Distributions to Shareholders. Each year, each fund intends to qualify as a regulated investment company by distributing all of its taxable income and realized gains under Subchapter M of the Internal Revenue Code. As a result, no provision for income taxes is required in the accompanying financial statements.
Dividends are declared daily and paid monthly from net investment income. Distributions from realized gains, if any, are recorded on the ex-dividend date. Income and capital gain distributions are determined in accordance with income tax regulations, which may differ from generally accepted accounting principles. In addition, the income fund claimed a portion of the payment made to redeeming shareholders as a distribution for income tax purposes. Capital accounts within the financial statements are adjusted for permanent book-tax differences. These adjustments have no impact on net assets or the results of operations. Temporary book-tax differences will reverse in a subsequent period.
Book-tax differences are primarily due to futures transactions, market discount, deferred trustees compensation and losses deferred due to futures transactions.
The funds purchase municipal securities whose interest, in the opinion of the issuer, is free from federal income tax. There is no assurance that the Internal Revenue Service (IRS) will agree with this opinion. In the event the IRS determines that the issuer does not comply with relevant tax requirements, interest payments from a security could become federally taxable, possibly retroactively to the date the security was issued.
The federal tax cost of investments and unrealized appreciation (depreciation) as of period end were as follows for each fund:
| Cost for Federal
Income Tax
Purposes | Unrealized
Appreciation | Unrealized
Depreciation | Net Unrealized
Appreciation/
(Depreciation) |
Spartan Ohio Municipal Income Fund | $ 413,841,686 | $ 25,452,121 | $ (61,041) | $ 25,391,080 |
Fidelity Ohio Municipal Money Market Fund | 722,273,482 | - | - | - |
Short-Term Trading (Redemption) Fees. Shares held in the income fund less than 30 days are subject to a redemption fee equal to .50% of the proceeds of the redeemed shares. All redemption fees, including any estimated redemption fees paid by Fidelity Management & Research Company (FMR), are retained by the fund and accounted for as an addition to paid in capital.
Semiannual Report
Notes to Financial Statements (Unaudited) - continued
2. Operating Policies.
Delayed Delivery Transactions and When-Issued Securities. Certain funds may purchase or sell securities on a delayed delivery or when-issued basis. Payment and delivery may take place after the customary settlement period for that security. The price of the underlying securities and the date when the securities will be delivered and paid for are fixed at the time the transaction is negotiated. During the time a delayed delivery sell is outstanding, the contract is marked-to-market daily and equivalent deliverable securities are held for the transaction. The value of the securities purchased on a delayed delivery or when-issued basis are identified as such in each applicable fund's Schedule of Investments. Certain funds may receive compensation for interest forgone in the purchase of a delayed delivery or when-issued security. With respect to purchase commitments, each applicable fund identifies securities as segregated in its records with a value at least equal to the amount of the commitment. Losses may arise due to changes in the value of the underlying securities or if the counterparty does not perform under the contract's terms, or if the issuer does not issue the securities due to political, economic, or other factors.
Futures Contracts. The income fund may use futures contracts to manage its exposure to the bond market and to fluctuations in interest rates. Buying futures tends to increase a fund's exposure to the underlying instrument, while selling futures tends to decrease a fund's exposure to the underlying instrument or hedge other fund investments. Losses may arise from changes in the value of the underlying instruments or if the counterparties do not perform under the contracts' terms. Gains (losses) are realized upon the expiration or closing of the futures contracts. Futures contracts are valued at the settlement price established each day by the board of trade or exchange on which they are traded.
Restricted Securities. Certain funds may invest in securities that are subject to legal or contractual restrictions on resale. These securities generally may be resold in transactions exempt from registration or to the public if the securities are registered. Disposal of these securities may involve time-consuming negotiations and expense, and prompt sale at an acceptable price may be difficult. Information regarding restricted securities is included at the end of each applicable fund's Schedule of Investments.
3. Purchases and Sales of Investments.
Purchases and sales of securities, other than short-term securities and U.S. government securities, for the income fund aggregated $66,921,038 and $53,570,106, respectively.
Semiannual Report
4. Fees and Other Transactions with Affiliates.
Management Fee. FMR and its affiliates provide the funds with investment management related services for which the funds pay a monthly management fee. The management fee is the sum of an individual fund fee rate and a group fee rate. The individual fund fee rate is applied to each fund's average net assets. The group fee rate is based upon the average net assets of all the mutual funds advised by FMR. The group fee rate decreases as assets under management increase and increases as assets under management decrease. For the period, each fund's annualized management fee rate expressed as a percentage of each fund's average net assets was as follows:
| Individual
Rate | Group
Rate | Total |
Spartan Ohio Municipal Income Fund | .25% | .12% | .38% |
Fidelity Ohio Municipal Money Market Fund | .25% | .12% | .38% |
Transfer Agent and Accounting Fees. Citibank, N.A. (Citibank) is the custodian, transfer agent and shareholder servicing agent for the funds. Citibank has entered into a sub-arrangement with Fidelity Service Company, Inc. (FSC), an affiliate of FMR, under which FSC performs the activities associated with the funds' transfer and shareholder servicing agent and accounting functions. The funds pay account fees and asset-based fees that vary according to account size and type of account. FSC pays for typesetting, printing and mailing of shareholder reports, except proxy statements. The accounting fee is based on the level of average net assets for the month. For the period, the transfer agent fees were equivalent to the following annualized rates expressed as a percentage of average net assets:
Spartan Ohio Municipal Income Fund | .08% | | |
Fidelity Ohio Municipal Money Market Fund | .14% | | |
Central Funds. Certain funds may invest in affiliated Central Funds managed by Fidelity Investments Money Management, Inc. (FIMM), an affiliate of FMR. The Central Funds are open-end investment companies available only to investment companies and other accounts managed by FMR and its affiliates. The Money Market Central Funds seek preservation of capital and current income. The Central Funds do not pay a management fee. Income distributions earned by the funds are recorded as income in the accompanying financial statements. Distributions from the Central Funds are noted in the table below:
| Income
Distributions |
Fidelity Ohio Municipal Money Market Fund | $ 22,145 |
Semiannual Report
Notes to Financial Statements (Unaudited) - continued
5. Committed Line of Credit.
The income fund participates with other funds managed by FMR in a $4.2 billion credit facility (the "line of credit") to be utilized for temporary or emergency purposes to fund shareholder redemptions or for other short-term liquidity purposes. The participating funds have agreed to pay commitment fees on their pro rata portion of the line of credit. During the period, there were no borrowings on this line of credit.
6. Expense Reductions.
Through arrangements with each applicable fund's custodian and transfer agent, credits realized as a result of uninvested cash balances were used to reduce each applicable fund's expenses. All of the applicable expense reductions are noted in the table below.
| Custody
expense
reduction | Transfer
Agent
expense
reduction |
Spartan Ohio Municipal Income Fund | $ 3,498 | $ 38,860 |
Fidelity Ohio Municipal Money Market Fund | 6,426 | 275,464 |
7. Other.
The funds' organizational documents provide former and current trustees and officers with a limited indemnification against liabilities arising in connection with the performance of their duties to the funds. In the normal course of business, the funds may also enter into contracts that provide general indemnifications. The funds' maximum exposure under these arrangements is unknown as this would be dependent on future claims that may be made against the funds. The risk of material loss from such claims is considered remote.
Semiannual Report
Board Approval of Investment Advisory Contracts and Management Fees
Spartan Ohio Municipal Income Fund / Fidelity Ohio Municipal Money Market Fund
Each year, typically in June, the Board of Trustees, including the independent Trustees (together, the Board), votes on the renewal of the management contract and sub-advisory agreements (together, the Advisory Contracts) for each fund. The Board, assisted by the advice of fund counsel and independent Trustees' counsel, requests and considers a broad range of information throughout the year.
The Board meets regularly each month except August and takes into account throughout the year matters bearing on Advisory Contracts. The Board, acting directly and through its separate committees, considers at each of its meetings factors that are relevant to the annual renewal of each fund's Advisory Contracts, including the services and support provided to each fund and its shareholders by Fidelity. At the time of the renewal, the Board had 11 standing committees, each composed of independent Trustees with varying backgrounds, to which the Board has assigned specific subject matter responsibilities in order to enhance effective decision-making by the Board. Each committee has adopted a written charter outlining the structure and purposes of the committee. One such committee, the Fixed-Income Contract Committee, meets periodically during the first six months of each year and as necessary to consider matters specifically related to the annual renewal of Advisory Contracts. The committee requests and receives information on, and makes recommendations to the independent Trustees concerning, the approval and annual review of the Advisory Contracts.
At its June 2005 meeting, the Board of Trustees, including the independent Trustees, unanimously determined to renew the Advisory Contracts for each fund. In reaching its determination, the Board considered all factors it believed relevant, including (1) the nature, extent, and quality of the services to be provided to each fund and its shareholders by Fidelity (including the investment performance of each fund); (2) the competitiveness of the management fee and total expenses of each fund; (3) the total costs of the services to be provided by and the profits to be realized by the investment adviser and its affiliates from the relationship with each fund; (4) the extent to which economies of scale would be realized as each fund grows; and (5) whether fee levels reflect these economies of scale, if any, for the benefit of fund shareholders.
In determining whether to renew the Advisory Contracts for each fund, the Board ultimately reached a determination, with the assistance of fund counsel and independent Trustees' counsel, that the renewal of the Advisory Contracts and the compensation to be received by Fidelity under the management contracts is consistent with Fidelity's fiduciary duty under applicable law. In addition to evaluating the specific factors noted above, the Board, in reaching its determination, is aware that shareholders in each fund have a broad range of investment choices available to them, including a wide choice among mutual funds offered by competitors to Fidelity, and that each fund's shareholders, with the opportunity to review and weigh the disclosure provided by the fund in its prospectus and other public disclosures, have chosen to invest in that fund, managed by Fidelity.
Semiannual Report
Board Approval of Investment Advisory Contracts and
Management Fees - continued
Nature, Extent, and Quality of Services Provided by Fidelity. The Board considered staffing within the investment adviser, FMR, and the sub-advisers (together, the Investment Advisers), including the backgrounds of the funds' portfolio managers and the funds' investment objectives and disciplines. The independent Trustees also had discussions with senior management of Fidelity's investment operations and investment groups. The Board considered the structure of the portfolio manager compensation program and whether this structure provides appropriate incentives.
Fidelity Resources Dedicated to Investment Management and Support Services. The Board reviewed the size, education, and experience of the Investment Advisers' investment staff, their use of technology, and the Investment Advisers' approach to recruiting, training, and retaining portfolio managers and other research, advisory, and management personnel. The Board considered Fidelity's extensive global research capabilities that enable the Investment Advisers to aggregate data from various sources in an effort to produce positive investment results. The Board noted that Fidelity's analysts have access to a variety of technological tools that enable them to perform both fundamental and quantitative analysis and to specialize in various disciplines. The Board also considered that Fidelity's portfolio managers and analysts have access to daily portfolio attribution that allows for monitoring of a fund's portfolio, as well as an electronic communication system that provides immediate real-time access to research concerning issuers and credit enhancers.
Shareholder and Administrative Services. The Board considered the nature, extent, quality, and cost of administrative, distribution, and shareholder services performed by the Investment Advisers and their affiliates under the Advisory Contracts and under separate agreements covering transfer agency and pricing and bookkeeping services for each fund. The Board also considered the nature and extent of the Investment Advisers' supervision of third party service providers, principally custodians and subcustodians. The Board reviewed the allocation of fund brokerage, including allocations to brokers affiliated with the Investment Advisers. The Board also considered the resources devoted to, and the record of compliance with, each fund's compliance policies and procedures.
The Board noted that the growth of fund assets across the complex allows Fidelity to reinvest in the development of services designed to enhance the value or convenience of the Fidelity funds as investment vehicles. These services include 24-hour access to account information and market information through phone representatives and over the Internet, and investor education materials and asset allocation tools.
Investment in a Large Fund Family. The Board considered the benefits to shareholders of investing in a Fidelity fund, including the benefits of investing in a fund that is part of a large family of funds offering a variety of investment disciplines and providing for a large variety of mutual fund investor services. For example, fund shareholders are offered the privilege of exchanging shares of a fund for shares of other Fidelity funds, as set forth in the fund's prospectus, without paying a sales charge. The Board noted that, since the last Advisory Contract renewals in June 2004, Fidelity has taken a number of actions that benefited particular funds, including (i) voluntarily deciding in 2004 to stop using "soft" commission dollars to pay for market data and, instead, to pay for that data out of its own resources, (ii) contractually agreeing to impose management fee reductions and expense limitations on its five Spartan stock index funds and its stock index fund available through variable insurance products, (iii) contractually agreeing to eliminate the management fees on the Fidelity Freedom Funds and the Fidelity Advisor Freedom Funds, (iv) contractually agreeing to reduce the management fees on most of its investment-grade taxable bond funds, and (v) contractually agreeing to impose expense limitations on its retail and Spartan investment-grade taxable bond funds.
Semiannual Report
Investment Performance. The Board considered whether each fund has operated within its investment objective, as well as its record of compliance with its investment restrictions. It also reviewed each fund's absolute investment performance, as well as each fund's relative investment performance measured against (i) a broad-based securities market index (bond fund only, as money market funds are typically not compared against a market index), and (ii) a peer group of mutual funds deemed appropriate by the Board over multiple periods. For each fund, the following charts considered by the Board show, over the one-, three-, and five-year periods ended December 31, 2004, the fund's returns, the returns of a broad-based securities market index ("benchmark") (bond fund only), and a range of returns of a peer group of mutual funds identified by Lipper Inc. as having an investment objective similar to that of the fund. The box within each chart shows the 25th percentile return (bottom of box) and the 75th percentile return (top of box) of the Lipper peer group. The percentage beaten number noted below each chart corresponds to the percentile box and represents the percentage of funds in the Lipper peer group whose performance was equal to or lower than that of the fund.
Semiannual Report
Board Approval of Investment Advisory Contracts and
Management Fees - continued
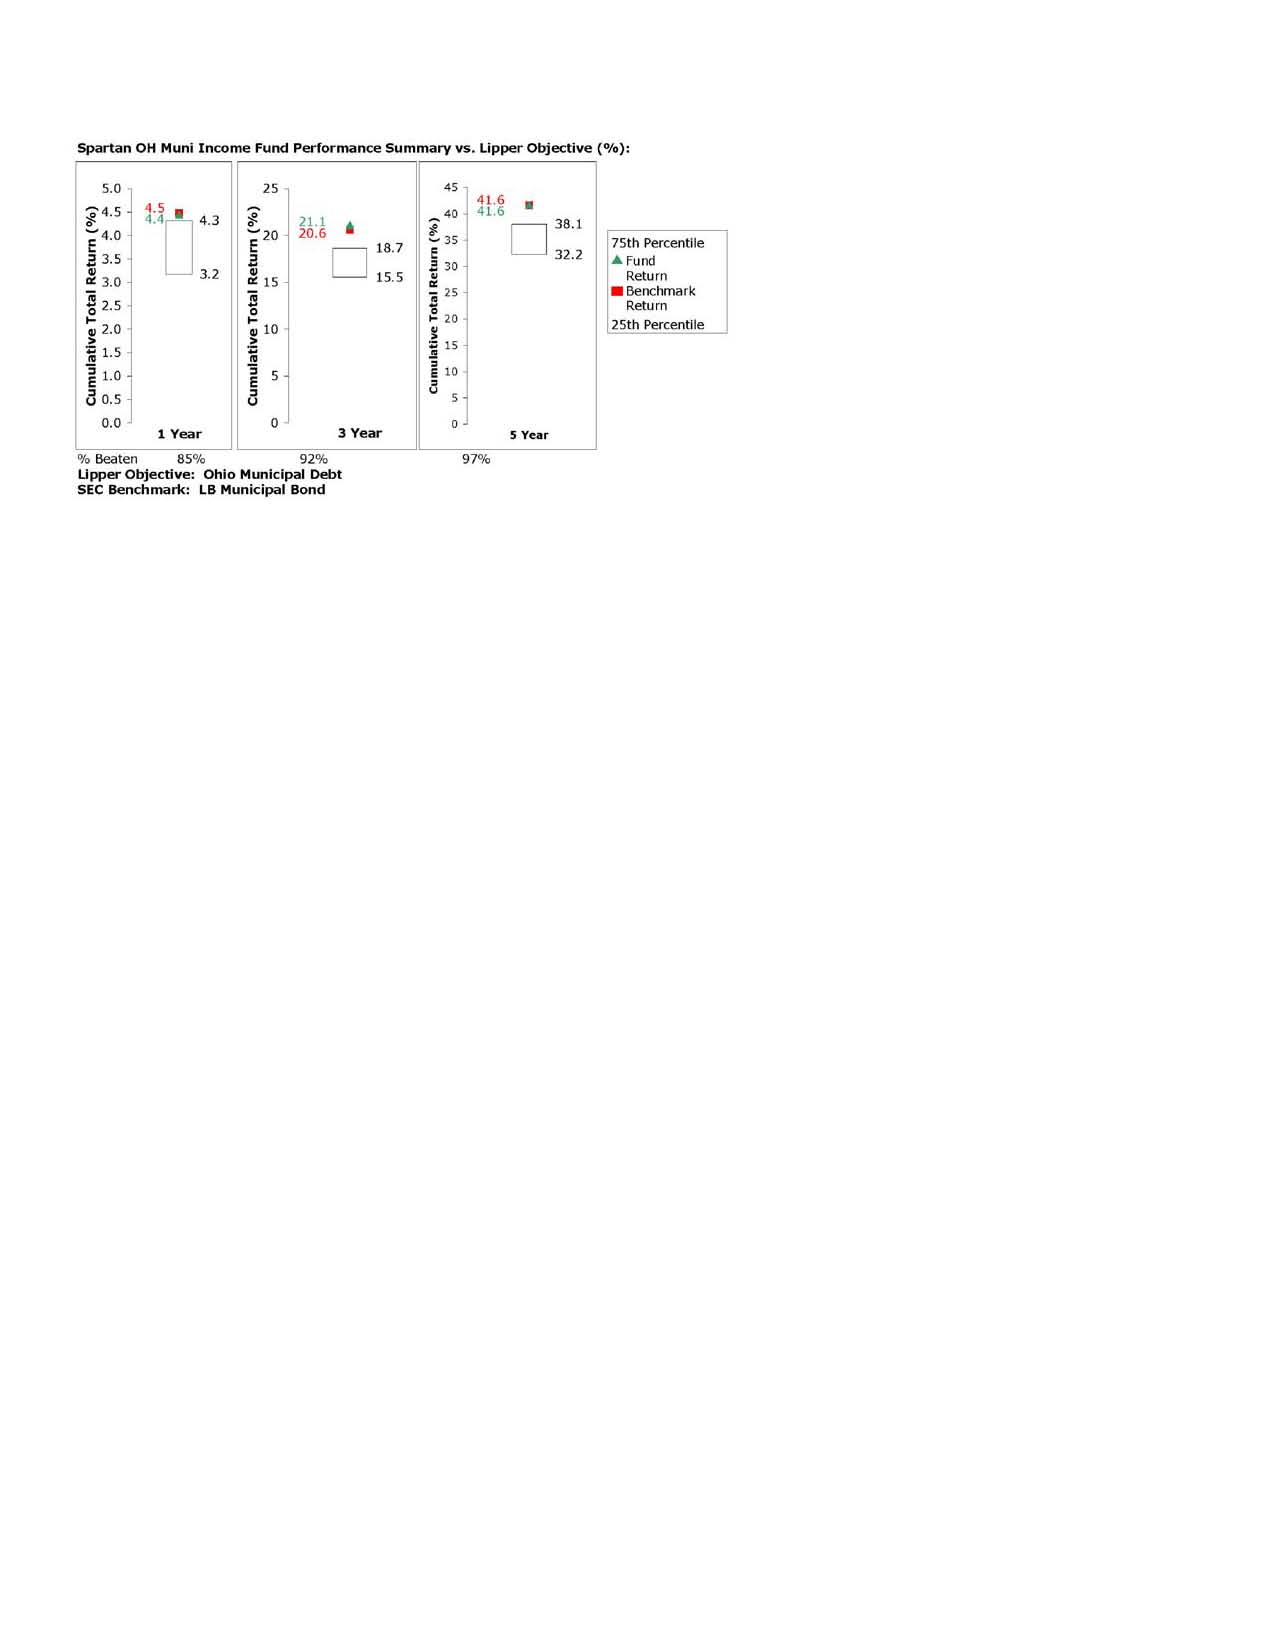
The Board noted that the relative investment performance of the fund has compared favorably to its Lipper peer group over time. The Board also noted that the relative investment performance of the fund has compared favorably to its benchmark over time, although the fund's one-year cumulative total return was lower than its benchmark.
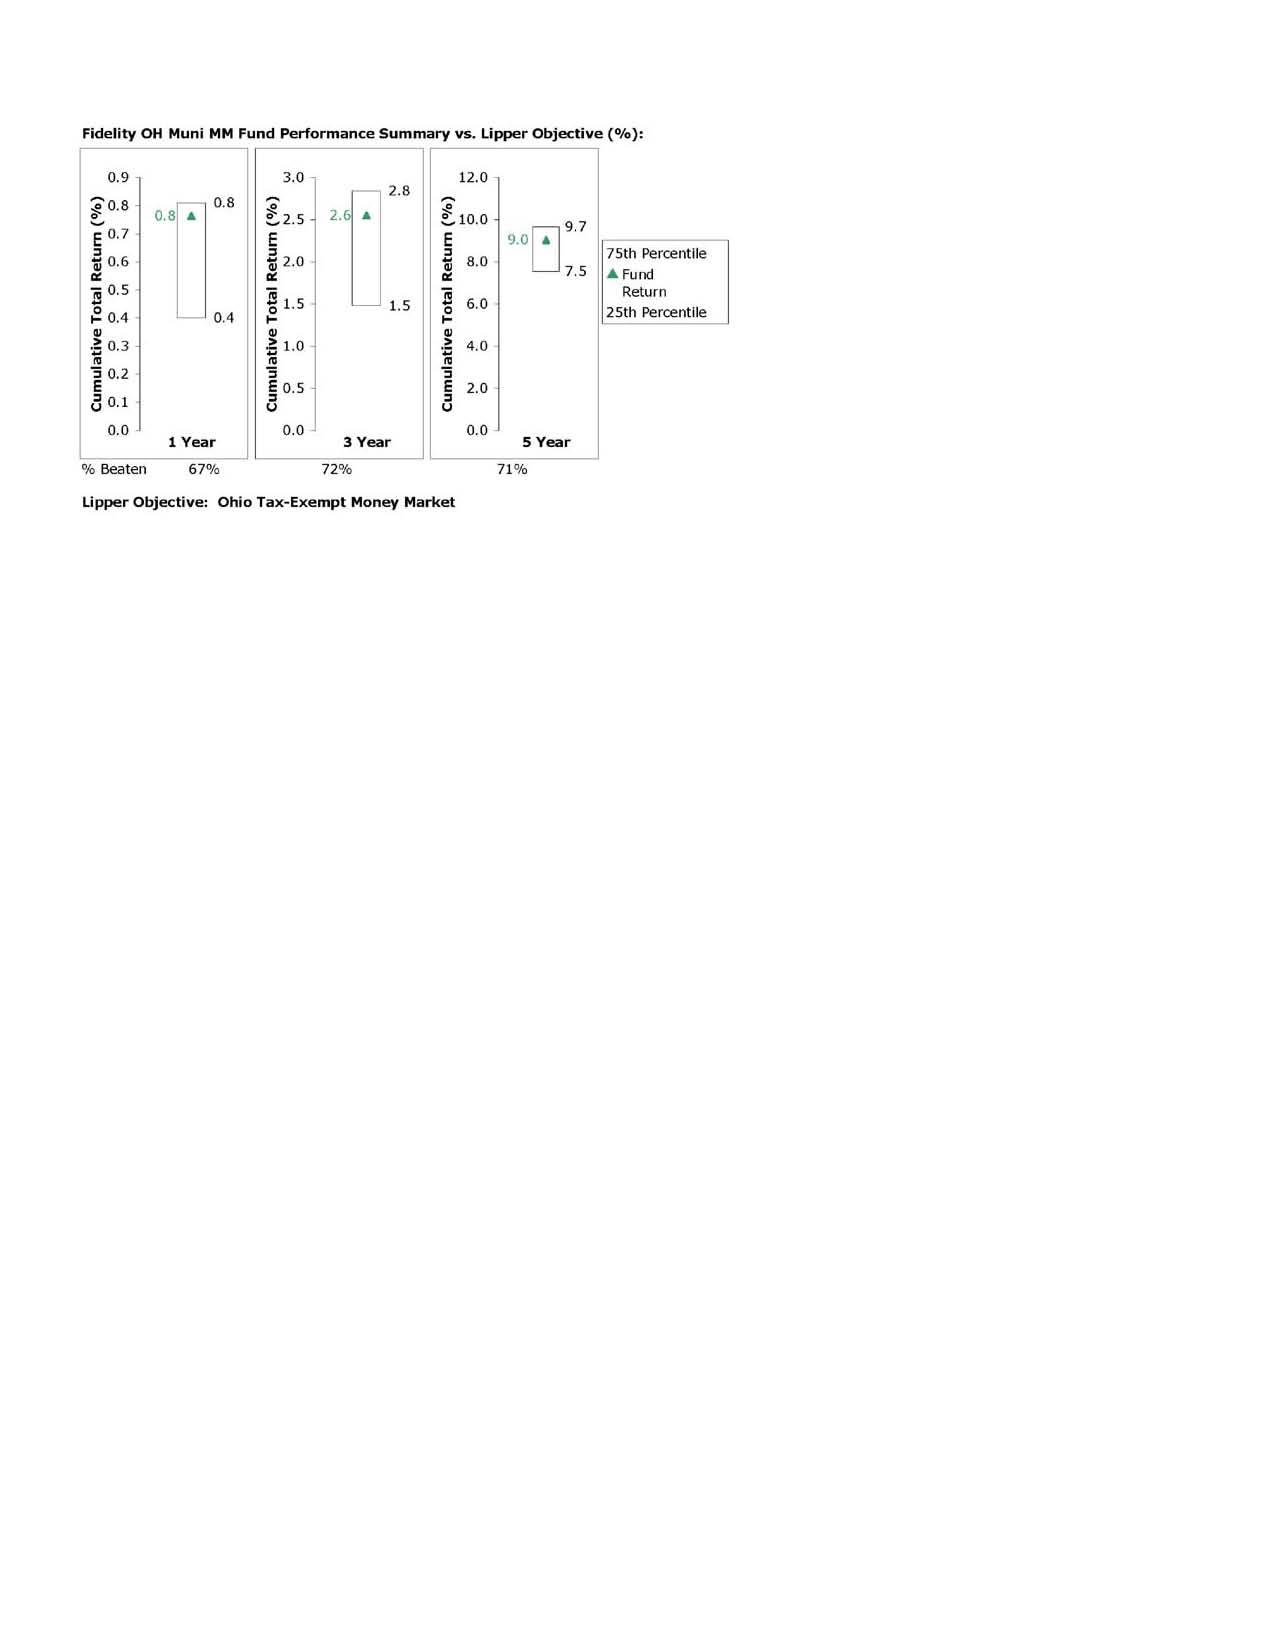
The Board noted that the relative investment performance of the fund has compared favorably to its Lipper peer group over time.
Semiannual Report
Based on its review, and giving particular weight to the nature and quality of the resources dedicated by the Investment Advisers to maintain and improve relative performance, the Board concluded that the nature, extent, and quality of the services provided by Fidelity will benefit each fund's shareholders, particularly in light of the Board's view that each fund's shareholders benefit from investing in a fund that is part of a large family of funds offering a variety of investment disciplines and services.
Competitiveness of Management Fee and Total Fund Expenses. The Board considered each fund's management fee and total expenses compared to "mapped groups" of competitive funds and classes. Fidelity creates "mapped groups" by combining similar Lipper investment objective categories that have comparable management fee characteristics. Combining Lipper investment objective categories aids the Board's management fee and total expense comparisons by broadening the competitive group used for comparison and by reducing the number of universes to which various Fidelity funds are compared.
The Board considered two proprietary management fee comparisons for the 12-month periods shown in the charts below. The group of Lipper funds used by the Board for management fee comparisons is referred to below as the "Total Mapped Group" and, for the reasons explained above, is broader than the Lipper peer group used by the Board for performance comparisons. The Total Mapped Group comparison focuses on a fund's standing relative to the total universe of comparable funds available to investors, in terms of gross management fees before expense reimbursements or caps. "TMG %" represents the percentage of funds in the Total Mapped Group that had management fees that were lower than a fund's. For example, a TMG % of 24% would mean that 76% of the funds in the Total Mapped Group had higher management fees than a fund. The "Asset-Size Peer Group" (ASPG) comparison focuses on a fund's standing relative to non-Fidelity funds similar in size to the fund within the Total Mapped Group. The ASPG represents at least 15% of the funds in the Total Mapped Group with comparable asset size and management fee characteristics, subject to a minimum of 50 funds (or all funds in the Total Mapped Group if fewer than 50). Additional information, such as the ASPG quartile ("quadrant") in which a fund's management fee ranked, is also included in the charts and considered by the Board.
Semiannual Report
Board Approval of Investment Advisory Contracts and
Management Fees - continued


The Board noted that each fund's management fee ranked below the median of its Total Mapped Group and below the median of its ASPG for 2004. Based on its review, the Board concluded that each fund's management fee was fair and reasonable in light of the services that the fund receives and the other factors considered.
In its review of each fund's total expenses, the Board considered the fund's management fee as well as other fund expenses, such as transfer agent fees, pricing and bookkeeping fees, and custodial, legal, and audit fees. The Board also noted the effects of any waivers and reimbursements on fees and expenses. As part of its review, the Board also considered current and historical total expenses of each fund compared to competitive fund median expenses. Each fund is compared to those funds and classes in the Total Mapped Group (used by the Board for management fee comparisons) that have a similar sales load structure.
Semiannual Report
The Board noted that each fund's total expenses ranked below its competitive median for 2004.
In its review of total expenses, the Board also considered Fidelity fee structures and other information on clients that FMR and its affiliates service in other competitive markets, such as other mutual funds advised or subadvised by FMR or its affiliates, pension plan clients, and other institutional clients.
Based on its review, the Board concluded that each fund's total expenses were reasonable in light of the services that the fund and its shareholders receive and the other factors considered.
Costs of the Services and Profitability. The Board considered the revenues earned and the expenses incurred by Fidelity in conducting the business of developing, marketing, distributing, managing, administering and servicing each fund and its shareholders. The Board also considered the level of Fidelity's profits in respect of all the Fidelity funds.
On an annual basis, FMR presents to the Board Fidelity's profitability for each fund. Fidelity calculates the profitability for each fund, as well as aggregate profitability for groups of Fidelity funds and all Fidelity funds, using a series of detailed revenue and cost allocation methodologies which originate with the audited books and records of Fidelity. The Audit Committee of the Board reviews any significant changes from the prior year's methodologies.
PricewaterhouseCoopers LLP (PwC), independent registered accounting firm and auditor to Fidelity and certain Fidelity funds, has been engaged annually by the Board as part of the Board's assessment of the results of Fidelity's profitability analysis. PwC's engagement includes the review and assessment of Fidelity's methodologies used in determining the revenues and expenses attributable to Fidelity's mutual fund business, and completion of agreed-upon procedures surrounding the mathematical accuracy of fund profitability and its conformity to allocation methodologies. After considering PwC's reports issued under the engagement and information provided by Fidelity, the Board believes that while other allocation methods may also be reasonable, Fidelity's profitability methodologies are reasonable in all material respects.
The Board has also reviewed Fidelity's non-fund businesses and any fall-out benefits related to the mutual fund business as well as cases where Fidelity's affiliates may benefit from or be related to the funds' business. In addition, a special committee of the Board reviewed services provided to Fidelity by its affiliates and determined that the fees that Fidelity paid for such services were reasonable.
Semiannual Report
Board Approval of Investment Advisory Contracts and
Management Fees - continued
The Board considered the costs of the services provided by and the profits realized by Fidelity in connection with the operation of each fund and determined that the amount of profit is a fair entrepreneurial profit for the management of each fund.
Economies of Scale. The Board considered whether there have been economies of scale in respect of the management of the Fidelity funds, whether the Fidelity funds (including each fund) have appropriately benefited from any such economies of scale, and whether there is potential for realization of any further economies of scale. The Board considered the extent to which each fund will benefit from economies of scale through increased services to the fund, through waivers or reimbursements, or through fee or expense reductions, including reductions that occur through operation of the transfer agent agreement. The transfer agent fee varies in part based on the number of accounts in the fund. If the number of accounts decreases or the average account size increases, the overall transfer agent fee rate decreases.
The Board recognized that each fund's management contract incorporates a "group fee" structure, which provides for lower fee rates as total fund assets under FMR's management increase, and for higher fee rates as total fund assets under FMR's management decrease. The Board considered that the group fee is designed to deliver the benefits of economies of scale to fund shareholders when total fund assets increase, even if assets of any particular fund are unchanged or have declined, because some portion of Fidelity's costs are attributable to services provided to all Fidelity funds, and all funds benefit if those costs can be allocated among more assets. The Board concluded that, given the group fee structure, fund shareholders will achieve a certain level of economies of scale as assets under FMR's management increase at the fund complex level, regardless of whether Fidelity achieves any such economies of scale.
The Board further concluded that any potential economies of scale are being shared between fund shareholders and Fidelity in an appropriate manner.
Additional Information Requested by the Board. In order to develop fully the factual basis for consideration of the Advisory Contracts, the Board requested additional information regarding (i) Fidelity's fund profitability methodology, including additional detail on various cost allocations; (ii) fall-out benefits to Fidelity; and (iii) compensation of portfolio managers and research analysts.
Based on its evaluation of all of the conclusions noted above, and after considering all material factors, the Board ultimately concluded that the existing advisory fee structures are fair and reasonable, and that each fund's existing Advisory Contracts should be renewed.
Semiannual Report
Managing Your Investments
Fidelity offers several ways to conveniently manage your personal investments via your telephone or PC. You can access your account information, conduct trades and research your investments 24 hours a day.
By Phone
Fidelity Automated Service Telephone provides a single toll-free number to access account balances, positions, quotes and trading. It's easy to navigate the service, and on your first call, the system will help you create a personal identification number (PIN) for security.
(phone_graphic)
Fidelity Automated
Service Telephone (FAST®)
1-800-544-5555
Press
1 For mutual fund and brokerage trading.
2 For quotes.*
3 For account balances and holdings.
4 To review orders and mutual
fund activity.
5 To change your PIN.
*0 To speak to a Fidelity representative.
By PC
Fidelity's web site on the Internet provides a wide range of information, including daily financial news, fund performance, interactive planning tools and news about Fidelity products and services.
(computer_graphic)
Fidelity's Web Site
www.fidelity.com
* When you call the quotes line, please remember that a fund's yield and return will vary and, except for money market funds, share price will also vary. This means that you may have a gain or loss when you sell your shares. There is no assurance that money market funds will be able to maintain a stable $1 share price; an investment in a money market fund is not insured or guaranteed by the U.S. government. Total returns are historical and include changes in share price, reinvestment of dividends and capital gains, and the effects of any sales charges.
Semiannual Report
To Visit Fidelity
For directions and hours,
please call 1-800-544-9797.
Arizona
7001 West Ray Road
Chandler, AZ
7373 N. Scottsdale Road
Scottsdale, AZ
California
815 East Birch Street
Brea, CA
1411 Chapin Avenue
Burlingame, CA
851 East Hamilton Avenue
Campbell, CA
19200 Von Karman Avenue
Irvine, CA
601 Larkspur Landing Circle
Larkspur, CA
10100 Santa Monica Blvd.
Los Angeles, CA
27101 Puerta Real
Mission Viejo, CA
73-575 El Paseo
Palm Desert, CA
251 University Avenue
Palo Alto, CA
123 South Lake Avenue
Pasadena, CA
16995 Bernardo Ctr. Drive
Rancho Bernardo, CA
1740 Arden Way
Sacramento, CA
7676 Hazard Center Drive
San Diego, CA
8 Montgomery Street
San Francisco, CA
3793 State Street
Santa Barbara, CA
21701 Hawthorne Boulevard
Torrance, CA
2001 North Main Street
Walnut Creek, CA
6300 Canoga Avenue
Woodland Hills, CA
Colorado
1625 Broadway
Denver, CO
9185 East Westview Road
Littleton, CO
Connecticut
48 West Putnam Avenue
Greenwich, CT
265 Church Street
New Haven, CT
300 Atlantic Street
Stamford, CT
29 South Main Street
West Hartford, CT
Delaware
222 Delaware Avenue
Wilmington, DE
Florida
4400 N. Federal Highway
Boca Raton, FL
121 Alhambra Plaza
Coral Gables, FL
2948 N. Federal Highway
Ft. Lauderdale, FL
1907 West State Road 434
Longwood, FL
8880 Tamiami Trail, North
Naples, FL
3550 Tamiami Trail, South
Sarasota, FL
1502 N. Westshore Blvd.
Tampa, FL
2465 State Road 7
Wellington, FL
3501 PGA Boulevard
West Palm Beach, FL
Georgia
3445 Peachtree Road, N.E.
Atlanta, GA
1000 Abernathy Road
Atlanta, GA
Illinois
One North LaSalle Street
Chicago, IL
875 North Michigan Ave.
Chicago, IL
1415 West 22nd Street
Oak Brook, IL
1700 East Golf Road
Schaumburg, IL
3232 Lake Avenue
Wilmette, IL
Indiana
4729 East 82nd Street
Indianapolis, IN
Kansas
5400 College Boulevard
Overland Park, KS
Maine
Three Canal Plaza
Portland, ME
Maryland
7315 Wisconsin Avenue
Bethesda, MD
One W. Pennsylvania Ave.
Towson, MD
Massachusetts
801 Boylston Street
Boston, MA
155 Congress Street
Boston, MA
300 Granite Street
Braintree, MA
44 Mall Road
Burlington, MA
405 Cochituate Road
Framingham, MA
416 Belmont Street
Worcester, MA
Michigan
500 E. Eisenhower Pkwy.
Ann Arbor, MI
280 Old N. Woodward Ave.
Birmingham, MI
43420 Grand River Avenue
Novi, MI
29155 Northwestern Hwy.
Southfield, MI
Minnesota
7600 France Avenue South
Edina, MN
Missouri
8885 Ladue Road
Ladue, MO
Semiannual Report
Nevada
2225 Village Walk Drive
Henderson, NV
New Jersey
150 Essex Street
Millburn, NJ
56 South Street
Morristown, NJ
396 Route 17, North
Paramus, NJ
3518 Route 1 North
Princeton, NJ
530 Highway 35
Shrewsbury, NJ
New York
1055 Franklin Avenue
Garden City, NY
37 West Jericho Turnpike
Huntington Station, NY
1271 Avenue of the Americas
New York, NY
61 Broadway
New York, NY
350 Park Avenue
New York, NY
200 Fifth Avenue
New York, NY
733 Third Avenue
New York, NY
11 Penn Plaza
New York, NY
2070 Broadway
New York, NY
1075 Northern Blvd.
Roslyn, NY
North Carolina
4611 Sharon Road
Charlotte, NC
Ohio
3805 Edwards Road
Cincinnati, OH
1324 Polaris Parkway
Columbus, OH
28699 Chagrin Boulevard
Woodmere Village, OH
Oregon
16850 SW 72nd Avenue
Tigard, OR
Pennsylvania
600 West DeKalb Pike
King of Prussia, PA
1735 Market Street
Philadelphia, PA
12001 Perry Highway
Wexford, PA
Rhode Island
47 Providence Place
Providence, RI
Tennessee
6150 Poplar Avenue
Memphis, TN
Texas
10000 Research Boulevard
Austin, TX
4001 Northwest Parkway
Dallas, TX
12532 Memorial Drive
Houston, TX
2701 Drexel Drive
Houston, TX
6500 N. MacArthur Blvd.
Irving, TX
6005 West Park Boulevard
Plano, TX
14100 San Pedro
San Antonio, TX
1576 East Southlake Blvd.
Southlake, TX
19740 IH 45 North
Spring, TX
Utah
215 South State Street
Salt Lake City, UT
Virginia
1861 International Drive
McLean, VA
Washington
411 108th Avenue, N.E.
Bellevue, WA
1518 6th Avenue
Seattle, WA
Washington, DC
1900 K Street, N.W.
Washington, DC
Wisconsin
595 North Barker Road
Brookfield, WI
Fidelity Brokerage Services, Inc., 100 Summer St., Boston, MA 02110 Member NYSE/SIPC
Semiannual Report
To Write Fidelity
We'll give your correspondence immediate attention and send you written confirmation upon completion of your request.
(letter_graphic)
Making Changes
To Your Account
(such as changing name, address, bank, etc.)
Fidelity Investments
P.O. Box 770001
Cincinnati, OH 45277-0002
(letter_graphic)
For Non-Retirement
Accounts
Buying shares
Fidelity Investments
P.O. Box 770001
Cincinnati, OH 45277-0003
Overnight Express
Fidelity Investments
Attn: Distribution Services
100 Crosby Parkway - KC1H
Covington, KY 41015
Selling shares
Fidelity Investments
P.O. Box 770001
Cincinnati, OH 45277-0035
Overnight Express
Fidelity Investments
Attn: Distribution Services
100 Crosby Parkway - KC1H
Covington, KY 41015
General Correspondence
Fidelity Investments
P.O. Box 500
Merrimack, NH 03054-0500
(letter_graphic)
For Retirement
Accounts
Buying shares
Fidelity Investments
P.O. Box 770001
Cincinnati, OH 45277-0003
Selling shares
Fidelity Investments
P.O. Box 770001
Cincinnati, OH 45277-0035
Overnight Express
Fidelity Investments
Attn: Distribution Services
100 Crosby Parkway - KC1H
Covington, KY 41015
General Correspondence
Fidelity Investments
P.O. Box 500
Merrimack, NH 03054-0500
Semiannual Report
Semiannual Report
Investment Adviser
Fidelity Management & Research Company
Boston, MA
Investment Sub-Advisers
Fidelity Investments Money
Management, Inc.
Fidelity International Investment Advisors
Fidelity International Investment Advisors
(U.K.) Limited
General Distributor
Fidelity Distributors Corporation
Boston, MA
Transfer and Service Agents
Citibank, N.A.
New York, NY
Fidelity Service Company, Inc.
Boston, MA
Custodian
Citibank, N.A.
New York, NY
The Fidelity Telephone Connection
Mutual Fund 24-Hour Service
Exchanges/Redemptions
and Account Assistance 1-800-544-6666
Product Information 1-800-544-6666
Retirement Accounts 1-800-544-4774 (8 a.m. - 9 p.m.)
TDD Service 1-800-544-0118
for the deaf and hearing impaired
(9 a.m. - 9 p.m. Eastern time)
Fidelity Automated Service
Telephone (FAST®) (automated graphic) 1-800-544-5555
(automated graphic) Automated lines for quickest service
OFF-USAN-0805
1.787787.102
(Fidelity Investment logo)(registered trademark)
Corporate Headquarters
82 Devonshire St., Boston, MA 02109
www.fidelity.com
Spartan®
Pennsylvania Municipal
Income Fund
and
Fidelity®
Pennsylvania Municipal
Money Market Fund
Semiannual Report
June 30, 2005
(2_fidelity_logos) (Registered_Trademark)
Contents
Chairman's Message | <Click Here> | Ned Johnson's message to shareholders |
Shareholder Expense Example | <Click Here> | An example of shareholder expenses. |
Spartan Pennsylvania Municipal Income Fund |
Investment Changes | <Click Here> | A summary of major shifts in the fund's investments over the past six months. |
Investments | <Click Here> | A complete list of the fund's investments with their market values. |
Financial Statements | <Click Here> | Statements of assets and liabilities, operations, and changes in net assets,
as well as financial highlights. |
Fidelity Pennsylvania Municipal Money Market Fund |
Investment Changes | <Click Here> | A summary of major shifts in the fund's investments over the past six months. |
Investments | <Click Here> | A complete list of the fund's investments. |
Financial Statements | <Click Here> | Statements of assets and liabilities, operations, and changes in net assets,
as well as financial highlights. |
Notes | <Click Here> | Notes to the Financial Statements |
Board Approval of Investment Advisory Contracts and Management Fees | <Click Here> | |
To view a fund's proxy voting guidelines and proxy voting record for the 12-month period ended June 30, visit www.fidelity.com/proxyvotingresults or visit the Securities and Exchange Commission's (SEC) web site at www.sec.gov. You may also call 1-800-544-8544 to request a free copy of the proxy voting guidelines.
Standard & Poor's, S&P and S&P 500 are registered service marks of The McGraw-Hill Companies, Inc. and have been licensed for use by Fidelity Distributors Corporation.
Other third party marks appearing herein are the property of their respective owners.
All other marks appearing herein are registered or unregistered trademarks or service marks of FMR Corp. or an affiliated company.
This report and the financial statements contained herein are submitted for the general information of the shareholders of the funds. This report is not authorized for distribution to prospective investors in the funds unless preceded or accompanied by an effective prospectus.
A fund files its complete schedule of portfolio holdings with the SEC for the first and third quarters of each fiscal year on Form N-Q. Forms N-Q are available on the SEC's web site at http://www.sec.gov. A fund's Forms N-Q may be reviewed and copied at the SEC's Public Reference Room in Washington, DC. Information regarding the operation of the SEC's Public Reference Room may be obtained by calling 1-800-SEC-0330. For a complete list of a fund's portfolio holdings, view the most recent quarterly holdings report, semiannual report, or annual report on Fidelity's web site at http://www.fidelity.com/holdings.
NOT FDIC INSURED · MAY LOSE VALUE · NO BANK GUARANTEE
Neither the funds nor Fidelity Distributors Corporation is a bank.
Semiannual Report
Chairman's Message
(photo_of_Edward_C_Johnson_3d)
Dear Shareholder:
During the past year or so, much has been reported about the mutual fund industry, and much of it has been more critical than I believe is warranted. Allegations that some companies have been less than forthright with their shareholders have cast a shadow on the entire industry. I continue to find these reports disturbing, and assert that they do not create an accurate picture of the industry overall. Therefore, I would like to remind everyone where Fidelity stands on these issues. I will say two things specifically regarding allegations that some mutual fund companies were in violation of the Securities and Exchange Commission's forward pricing rules or were involved in so-called "market timing" activities.
First, Fidelity has no agreements that permit customers who buy fund shares after 4 p.m. to obtain the 4 p.m. price. This is not a new policy. This is not to say that someone could not deceive the company through fraudulent acts. However, we are extremely diligent in preventing fraud from occurring in this manner - and in every other. But I underscore again that Fidelity has no so-called "agreements" that sanction illegal practices.
Second, Fidelity continues to stand on record, as we have for years, in opposition to predatory short-term trading that adversely affects shareholders in a mutual fund. Back in the 1980s, we initiated a fee - which is returned to the fund and, therefore, to investors - to discourage this activity. Further, we took the lead several years ago in developing a Fair Value Pricing Policy to prevent market timing on foreign securities in our funds. I am confident we will find other ways to make it more difficult for predatory traders to operate. However, this will only be achieved through close cooperation among regulators, legislators and the industry.
Yes, there have been unfortunate instances of unethical and illegal activity within the mutual fund industry from time to time. That is true of any industry. When this occurs, confessed or convicted offenders should be dealt with appropriately. But we are still concerned about the risk of over-regulation and the quick application of simplistic solutions to intricate problems. Every system can be improved, and we support and applaud well thought out improvements by regulators, legislators and industry representatives that achieve the common goal of building and protecting the value of investors' holdings.
For nearly 60 years, Fidelity has worked very hard to improve its products and service to justify your trust. When our family founded this company in 1946, we had only a few hundred customers. Today, we serve more than 18 million customers including individual investors and participants in retirement plans across America.
Let me close by saying that we do not take your trust in us for granted, and we realize that we must always work to improve all aspects of our service to you. In turn, we urge you to continue your active participation with your financial matters, so that your interests can be well served.
Best regards,
/s/Edward C. Johnson 3d
Edward C. Johnson 3d
Semiannual Report
Shareholder Expense Example
As a shareholder of a Fund, you incur two types of costs: (1) transaction costs, including redemption fees, and (2) ongoing costs, including management fees and other Fund expenses. This Example is intended to help you understand your ongoing costs (in dollars) of investing in the Funds and to compare these costs with the ongoing costs of investing in other mutual funds.
The Example is based on an investment of $1,000 invested at the beginning of the period and held for the entire period (January 1, 2005 to June 30, 2005).
Actual Expenses
The first line of the table below for each fund provides information about actual account values and actual expenses. You may use the information in this line, together with the amount you invested, to estimate the expenses that you paid over the period. Simply divide your account value by $1,000.00 (for example, an $8,600 account value divided by $1,000.00 = 8.6), then multiply the result by the number in the first line for a fund under the heading entitled "Expenses Paid During Period" to estimate the expenses you paid on your account during this period. A small balance maintenance fee of $12.00 that is charged once a year may apply for certain accounts with a value of less than $2,000. This fee is not included in the table below. If it was, the estimate of expenses you paid during the period would be higher, and your ending account value lower, by this amount.
Hypothetical Example for Comparison Purposes
The second line of the table below for each fund provides information about hypothetical account values and hypothetical expenses based on a fund's actual expense ratio and an assumed rate of return of 5% per year before expenses, which is not the Fund's actual return. The hypothetical account values and expenses may not be used to estimate the actual ending account balance or expenses you paid for the period. You may use this information to compare the ongoing costs of investing in the Fund and other funds. To do so, compare this 5% hypothetical example with the 5% hypothetical examples that appear in the shareholder reports of the other funds. A small balance maintenance fee of $12.00 that is charged once a year may apply for certain accounts with a value of less than $2,000. This fee is not included in the table below. If it was, the estimate of expenses you paid during the period would be higher, and your ending account value lower, by this amount.
Please note that the expenses shown in the table are meant to highlight your ongoing costs only and do not reflect any transaction costs. Therefore, the second line of the table is useful in comparing ongoing costs only, and will not help you determine the relative total costs of owning different funds. In addition, if these transactional costs were included, your costs would have been higher.
| Beginning
Account Value
January 1, 2005 | Ending
Account Value
June 30, 2005 | Expenses Paid
During Period*
January 1, 2005
to June 30, 2005 |
Spartan Pennsylvania Municipal Income Fund | | | |
Actual | $ 1,000.00 | $ 1,022.10 | $ 2.56 |
HypotheticalA | $ 1,000.00 | $ 1,022.27 | $ 2.56 |
| Beginning
Account Value
January 1, 2005 | Ending
Account Value
June 30, 2005 | Expenses Paid
During Period*
January 1, 2005
to June 30, 2005 |
Fidelity Pennsylvania Municipal Money Market Fund | | | |
Actual | $ 1,000.00 | $ 1,008.80 | $ 2.49 |
HypotheticalA | $ 1,000.00 | $ 1,022.32 | $ 2.51 |
A 5% return per year before expenses
*Expenses are equal to each Fund's annualized expense ratio (shown in the table below); multiplied by the average account value over the period, multiplied by 181/365 (to reflect the one-half year period).
| Annualized
Expense Ratio |
Spartan Pennsylvania Municipal Income Fund | .51% |
Fidelity Pennsylvania Municipal Money Market Fund | .50% |
Semiannual Report
Spartan Pennsylvania Municipal Income Fund
Investment Changes
Top Five Sectors as of June 30, 2005 |
| % of fund's
net assets | % of fund's net assets
6 months ago |
General Obligations | 30.0 | 29.3 |
Escrowed/Pre-Refunded | 16.9 | 18.7 |
Transportation | 13.3 | 11.6 |
Education | 12.9 | 12.0 |
Water & Sewer | 9.6 | 9.5 |
Average Years to Maturity as of June 30, 2005 |
| | 6 months ago |
Years | 12.9 | 12.6 |
Average years to maturity is based on the average time remaining to the stated maturity date of each bond, weighted by the market value of each bond. |
Duration as of June 30, 2005 |
| | 6 months ago |
Years | 6.0 | 6.1 |
Duration shows how much a bond fund's price fluctuates with changes in comparable interest rates. If rates rise 1%, for example, a fund with a five-year duration is likely to lose about 5% of its value. Other factors also can influence a bond fund's performance and share price. Accordingly, a bond fund's actual performance may differ from this example. |
Quality Diversification (% of fund's net assets) |
As of June 30, 2005 | As of December 31, 2004 |
| AAA 80.4% | | | AAA 79.9% | |
| AA,A 16.2% | | | AA,A 14.6% | |
| BBB 1.4% | | | BBB 2.2% | |
 | Not Rated 0.9% | | | Not Rated 1.1% | |
| Short-Term
Investments and
Net Other Assets 1.1% | | | Short-Term
Investments and
Net Other Assets 2.2% | |

We have used ratings from Moody's® Investors Services, Inc. Where Moody's ratings are not available, we have used S&P® ratings. |
Semiannual Report
Spartan Pennsylvania Municipal Income Fund
Investments June 30, 2005 (Unaudited)
Showing Percentage of Net Assets
Municipal Bonds - 98.9% |
| Principal Amount | | Value (Note 1) |
New Jersey/Pennsylvania - 1.4% |
Delaware River Joint Toll Bridge Commission Bridge Rev. 5.25% 7/1/19 (Pre-Refunded to 7/1/13 @ 100) (c) | | $ 1,000,000 | | $ 1,130,670 |
Delaware River Port Auth. Pennsylvania & New Jersey Rev.: | | | | |
(Port District Proj.) Series A, 5.5% 1/1/18 (FSA Insured) | | 2,000,000 | | 2,235,220 |
Series 1999, 6% 1/1/18 (FSA Insured) | | 700,000 | | 783,475 |
| | 4,149,365 |
Pennsylvania - 94.5% |
Allegheny County Arpt. Rev. (Pittsburgh Int'l. Arpt. Proj.): | | | | |
Series A1: | | | | |
5.75% 1/1/07 (MBIA Insured) (b) | | 1,500,000 | | 1,552,425 |
5.75% 1/1/08 (MBIA Insured) (b) | | 1,000,000 | | 1,054,100 |
5.75% 1/1/11 (MBIA Insured) (b) | | 2,000,000 | | 2,182,180 |
5.75% 1/1/12 (MBIA Insured) (b) | | 3,000,000 | | 3,293,730 |
5.75% 1/1/14 (MBIA Insured) (b) | | 3,000,000 | | 3,324,540 |
5.75% 1/1/09 (MBIA Insured) (b) | | 3,000,000 | | 3,204,450 |
Allegheny County Higher Ed. Bldg. Auth. Univ. Rev.: | | | | |
(Carnegie Mellon Univ. Proj.): | | | | |
5.125% 3/1/32 | | 750,000 | | 793,875 |
5.25% 3/1/32 | | 2,000,000 | | 2,143,460 |
(Duquesne Univ. Proj.) 6.5% 3/1/10 (AMBAC Insured) | | 400,000 | | 456,808 |
Allegheny County Hosp. Dev. Auth. Rev. (Health Ctr.-UPMC Health Sys. Proj.) Series A: | | | | |
4.625% 8/1/12 (MBIA Insured) | | 1,000,000 | | 1,044,410 |
4.625% 8/1/14 (MBIA Insured) | | 3,560,000 | | 3,699,089 |
5.55% 4/1/12 (MBIA Insured) | | 2,845,000 | | 3,015,216 |
Allegheny County Indl. Dev. Auth. Rev. (Watson Institute Ed. Ctr. Proj.) 3.375%, tender 5/1/08, LOC PNC Bank NA, Pittsburgh (a) | | 3,000,000 | | 3,001,110 |
Allegheny County San. Auth. Swr. Rev.: | | | | |
0% 12/1/12 (Escrowed to Maturity) (c) | | 2,260,000 | | 1,719,995 |
5.5% 12/1/30 (MBIA Insured) | | 2,000,000 | | 2,244,780 |
Annville-Cleona School District: | | | | |
6% 3/1/28 (FSA Insured) | | 1,500,000 | | 1,767,150 |
6% 3/1/31 (FSA Insured) | | 1,975,000 | | 2,324,990 |
Bristol Borough School District 5.25% 3/1/25 (FSA Insured) | | 1,200,000 | | 1,324,092 |
Bucks County Indl. Dev. Auth. Wtr. Facilities Rev. (Pennsylvania Suburban Wtr. Co. Proj.) Series 2002, 5.55% 9/1/32 (FGIC Insured) (b) | | 1,870,000 | | 2,015,093 |
Municipal Bonds - continued |
| Principal Amount | | Value (Note 1) |
Pennsylvania - continued |
Butler Area School District: | | | | |
Series A: | | | | |
0% 10/1/27 (FGIC Insured) | | $ 1,500,000 | | $ 525,840 |
0% 9/15/28 (FGIC Insured) | | 1,000,000 | | 332,850 |
0% 9/15/29 (FGIC Insured) | | 2,705,000 | | 852,589 |
0% 11/15/19 (Pre-Refunded to 11/15/07 @ 50.177) (c) | | 5,650,000 | | 2,648,946 |
Canon McMillan School District: | | | | |
Series 2001 B, 5.75% 12/1/33 (FGIC Insured) | | 8,995,000 | | 10,048,764 |
Series 2002 B, 5.75% 12/1/35 (FGIC Insured) | | 2,500,000 | | 2,836,050 |
Central York School District 5.5% 6/1/16 (FGIC Insured) | | 2,000,000 | | 2,247,240 |
Chester County Health & Ed. Facilities Auth. Health Sys. Rev. (Jefferson Health Sys. Proj.) Series B: | | | | |
5% 5/15/08 (AMBAC Insured) | | 600,000 | | 633,624 |
5.25% 5/15/22 (AMBAC Insured) | | 1,450,000 | | 1,522,616 |
Cumberland County Muni. Auth. College Rev. (Dickerson College Proj.) Series A, 5.5% 11/1/30 (AMBAC Insured) | | 4,200,000 | | 4,582,956 |
Delaware County Auth. College Rev. (Haverford College Proj.): | | | | |
5.75% 11/15/29 | | 5,000,000 | | 5,571,050 |
6% 11/15/30 | | 3,620,000 | | 4,107,542 |
Delaware County Indl. Dev. Auth. Rev. (Philadelphia Suburban Wtr. Co. Proj.) 6% 6/1/29 (FGIC Insured) (b) | | 2,500,000 | | 2,761,375 |
Delaware County Reg'l. Wtr. Quality Cont. Auth. Swr. Rev. Series 2001, 5.25% 5/1/12 (FGIC Insured) | | 2,165,000 | | 2,410,468 |
Erie School District 0% 9/1/30 (AMBAC Insured) | | 4,000,000 | | 1,195,400 |
Harrisburg Auth. Dauphin County School Rev. (Harrisburg School District Rfdg. Proj.) 5.5% 4/1/14 (FGIC Insured) | | 1,655,000 | | 1,859,393 |
Harrisburg Auth. Rev. (Pooled Bond Prog.) Series I, 5.625% 4/1/15 (Pre-Refunded to 4/1/06 @ 102) (c) | | 445,000 | | 463,530 |
Harrisburg Auth. Wtr. Rev. 5.75% 7/15/12 (FGIC Insured) | | 1,115,000 | | 1,259,248 |
Kennett Consolidated School District Series A, 5.25% 2/15/15 (FGIC Insured) | | 1,310,000 | | 1,460,991 |
Luzerne County Indl. Dev. Auth. Wtr. Facilities Rev. (Pennsylvania-American Wtr. Co. Proj.) 3.6%, tender 12/1/09 (AMBAC Insured) (a)(b) | | 2,000,000 | | 2,012,100 |
Montgomery County Higher Ed. & Health Auth. Hosp. Rev. (Abington Memorial Hosp. Proj.) Series A: | | | | |
6% 6/1/09 (AMBAC Insured) | | 2,365,000 | | 2,615,217 |
Municipal Bonds - continued |
| Principal Amount | | Value (Note 1) |
Pennsylvania - continued |
Montgomery County Higher Ed. & Health Auth. Hosp. Rev. (Abington Memorial Hosp. Proj.) Series A: - continued | | | | |
6% 6/1/16 (AMBAC Insured) | | $ 1,000,000 | | $ 1,196,820 |
Montgomery County Higher Ed. & Health Auth. Rev. (Health Care-Holy Redeemer Health Proj.) Series A, 5.5% 10/1/08 (AMBAC Insured) | | 1,000,000 | | 1,064,110 |
Muhlenberg School District Series AA, 5.375% 9/1/15 (FGIC Insured) | | 1,055,000 | | 1,185,556 |
Northumberland County Auth. Commonwealth Lease Rev. (State Correctional Facilities Proj.) 0% 10/15/10 (Escrowed to Maturity) (c) | | 1,000,000 | | 839,680 |
Owen J. Roberts School District 5.5% 8/15/19 (FSA Insured) | | 1,525,000 | | 1,708,290 |
Pennsbury School District 5.5% 1/15/17 (FGIC Insured) | | 2,160,000 | | 2,422,678 |
Pennsylvania Convention Ctr. Auth. Rev. Series A: | | | | |
6.6% 9/1/09 (MBIA Insured) | | 9,150,000 | | 9,299,603 |
6.7% 9/1/14 (MBIA Insured) | | 3,965,000 | | 4,030,423 |
Pennsylvania Econ. Dev. Fing. Auth. Exempt Facilities Rev.: | | | | |
(Amtrak Proj.) Series 2001 A: | | | | |
6.25% 11/1/31 (b) | | 3,300,000 | | 3,515,061 |
6.375% 11/1/41 (b) | | 1,300,000 | | 1,386,060 |
(Shippingport Proj.) Series A, 4.35%, tender 6/1/10 (a)(b) | | 1,500,000 | | 1,503,225 |
Pennsylvania Gen. Oblig.: | | | | |
First Series: | | | | |
5% 6/1/13 (Pre-Refunded to 6/1/09 @ 101) (c) | | 750,000 | | 814,403 |
5% 6/1/19 (Pre-Refunded to 6/1/09 @ 101) (c) | | 7,275,000 | | 7,899,704 |
5.25% 2/1/14 | | 125,000 | | 138,431 |
5.25% 2/1/18 (Pre-Refunded to 2/1/12 @ 100) (c) | | 1,250,000 | | 1,395,225 |
Second Series: | | | | |
0% 7/1/07 (AMBAC Insured) | | 1,770,000 | | 1,668,030 |
5.5% 5/1/17 (Pre-Refunded to 5/1/12 @ 100) (c) | | 6,000,000 | | 6,831,300 |
5.75% 10/1/16 (Pre-Refunded to 10/1/09 @ 101) (c) | | 475,000 | | 531,164 |
Pennsylvania Higher Edl. Facilities Auth. College & Univ. Revs.: | | | | |
(Trustees of the Univ. of Pennsylvania Proj.) 5.5% 7/15/38 | | 4,380,000 | | 4,666,934 |
(Univ. of Pennsylvania Proj.) Series A, 5.9% 9/1/15 | | 1,200,000 | | 1,206,300 |
Municipal Bonds - continued |
| Principal Amount | | Value (Note 1) |
Pennsylvania - continued |
Pennsylvania Higher Edl. Facilities Auth. Rev.: | | | | |
(Drexel Univ. Proj.): | | | | |
Series A: | | | | |
5% 5/1/16 (MBIA Insured) | | $ 1,135,000 | | $ 1,263,414 |
5% 5/1/18 (MBIA Insured) | | 1,220,000 | | 1,343,196 |
6% 5/1/24 (Pre-Refunded to 5/1/09 @ 100) (c) | | 4,075,000 | | 4,520,642 |
6% 5/1/29 (Pre-Refunded to 5/1/09 @ 100) (c) | | 3,470,000 | | 3,849,479 |
(Lafayette College Proj.) 6% 5/1/30 | | 2,500,000 | | 2,793,625 |
(Temple Univ. Proj.) 5.375% 7/15/19 (MBIA Insured) | | 1,000,000 | | 1,102,290 |
(Univ. of Pennsylvania Health Systems Proj.) Series A, 5% 8/15/17 (AMBAC Insured) | | 3,000,000 | | 3,276,000 |
(UPMC Health Sys. Proj.): | | | | |
Series 1999 A: | | | | |
5.25% 8/1/10 (FSA Insured) | | 1,000,000 | | 1,081,220 |
5.25% 8/1/11 (FSA Insured) | | 1,000,000 | | 1,090,360 |
Series 2001 A: | | | | |
6% 1/15/22 | | 400,000 | | 445,884 |
6% 1/15/31 | | 1,000,000 | | 1,108,380 |
Series 2000 S, 5.5% 6/15/15 (AMBAC Insured) | | 500,000 | | 548,665 |
Pennsylvania Hsg. Fin. Agcy. Series 54A, 5.375% 10/1/28 (b) | | 475,000 | | 478,658 |
Pennsylvania Indl. Dev. Auth. Rev.: | | | | |
5.5% 7/1/16 (AMBAC Insured) | | 1,080,000 | | 1,223,467 |
7% 1/1/07 (AMBAC Insured) | | 1,000,000 | | 1,061,920 |
Pennsylvania Pub. School Bldg. Auth. School Rev.: | | | | |
(Northwestern School District Proj.) Series E, 5.75% 1/15/19 (FGIC Insured) | | 500,000 | | 544,095 |
(Philadelphia School District Proj.) 5% 6/1/33 (FSA Insured) | | 3,085,000 | | 3,247,271 |
Pennsylvania State Univ.: | | | | |
5% 9/1/29 | | 1,550,000 | | 1,663,491 |
5% 9/1/35 | | 4,485,000 | | 4,790,339 |
Pennsylvania Tpk. Commission Registration Fee Rev.: | | | | |
Series 2001, 5.5% 7/15/33 (AMBAC Insured) | | 1,000,000 | | 1,102,720 |
5% 7/15/41 (AMBAC Insured) | | 4,500,000 | | 4,710,150 |
5.25% 7/15/41 (AMBAC Insured) | | 1,800,000 | | 1,909,728 |
Pennsylvania Tpk. Commission Tpk. Rev. Series S, 5.625% 6/1/12 (FGIC Insured) | | 2,000,000 | | 2,269,720 |
Philadelphia Arpt. Rev.: | | | | |
Series 1998, 5.375% 6/15/10 (FGIC Insured) (b) | | 2,000,000 | | 2,148,800 |
5.375% 6/15/11 (FGIC Insured) (b) | | 3,770,000 | | 4,051,581 |
6% 6/15/08 (FGIC Insured) (b) | | 3,000,000 | | 3,220,020 |
Municipal Bonds - continued |
| Principal Amount | | Value (Note 1) |
Pennsylvania - continued |
Philadelphia Gas Works Rev.: | | | | |
(1975 Gen. Ordinance Proj.) 17th Series, 5% 7/1/07 (FSA Insured) | | $ 4,000,000 | | $ 4,160,200 |
Third Series, 5% 8/1/06 (FSA Insured) | | 1,000,000 | | 1,023,530 |
Philadelphia Gen. Oblig. 5.25% 9/15/12 (FSA Insured) | | 2,455,000 | | 2,694,755 |
Philadelphia Hosp. & Higher Ed. Facilities Auth. Health Sys. Rev. (Jefferson Health Sys. Proj.) Series A: | | | | |
5% 5/15/09 | | 1,000,000 | | 1,055,070 |
5.5% 5/15/08 | | 1,000,000 | | 1,062,590 |
Philadelphia Hosps. & Higher Ed. Facilities Auth. Hosp. Rev.: | | | | |
(Jeanes Hosp. Proj.) 5.875% 7/1/17 (Pre-Refunded to 7/1/07 @ 102) (c) | | 340,000 | | 366,700 |
(Pennsylvania Hosp. Proj.) 6.25% 7/1/06 (Escrowed to Maturity) (c) | | 2,600,000 | | 2,689,726 |
Philadelphia Muni. Auth. Rev.: | | | | |
(Muni. Svcs. Bldg. Lease Prog.) 0% 3/15/11 (FSA Insured) | | 1,000,000 | | 810,760 |
Series B, 5.25% 11/15/11 (FSA Insured) | | 2,000,000 | | 2,218,320 |
Philadelphia Redev. Auth. Rev. (Philadelphia Neighborhood Transformation Initiative Proj.) Series 2005 C, 5% 4/15/31 (FGIC Insured) | | 1,000,000 | | 1,058,600 |
Philadelphia School District: | | | | |
Series 2002 A, 5.5% 2/1/26 (Pre-Refunded to 2/1/12 @ 100) (c) | | 3,565,000 | | 4,031,480 |
Series 2004 D, 5.25% 6/1/34 (FGIC Insured) | | 2,785,000 | | 3,019,608 |
Series A, 5.75% 2/1/16 (Pre-Refunded to 2/1/11 @ 100) (c) | | 500,000 | | 566,465 |
Series B, 5.625% 8/1/15 (Pre-Refunded to 8/1/12 @ 100) (c) | | 1,500,000 | | 1,721,325 |
Series D, 5.125% 6/1/34 (FGIC Insured) | | 1,800,000 | | 1,932,228 |
Philadelphia Wtr. & Wastewtr. Rev.: | | | | |
Series 14, 0% 10/1/08 (MBIA Insured) | | 5,300,000 | | 4,779,487 |
Series A: | | | | |
5% 11/1/31 (FGIC Insured) | | 1,075,000 | | 1,127,955 |
5.375% 11/1/19 (FGIC Insured) | | 3,000,000 | | 3,335,730 |
Pittsburgh Gen. Oblig.: | | | | |
Series 2003 A: | | | | |
5.5% 9/1/16 (AMBAC Insured) | | 5,000,000 | | 5,520,000 |
5.75% 9/1/22 (Pre-Refunded to 9/1/09 @ 100) (c) | | 800,000 | | 880,992 |
Series 2003 D, 5% 9/1/06 (FGIC Insured) | | 250,000 | | 256,533 |
Municipal Bonds - continued |
| Principal Amount | | Value (Note 1) |
Pennsylvania - continued |
Pittsburgh Gen. Oblig.: - continued | | | | |
Series A: | | | | |
5% 9/1/11 (MBIA Insured) | | $ 5,000,000 | | $ 5,460,850 |
6% 3/1/07 (MBIA Insured) | | 2,735,000 | | 2,873,911 |
Pittsburgh School District Series C: | | | | |
0% 8/1/07 (AMBAC Insured) | | 2,610,000 | | 2,453,531 |
0% 8/1/08 (AMBAC Insured) | | 2,000,000 | | 1,813,760 |
Pittsburgh Wtr. & Swr. Auth. Wtr. & Swr. Sys. Rev. Series A, 6.5% 9/1/13 (FGIC Insured) | | 10,000,000 | | 11,838,395 |
Quaker Valley School District 5.5% 4/1/25 (Pre-Refunded to 4/1/14 @ 100) (c) | | 1,020,000 | | 1,178,161 |
Scranton-Lackawanna Health & Welfare Auth. Rev. (Cmnty. Med. Ctr. Proj.) 5.5% 7/1/12 (MBIA Insured) | | 3,375,000 | | 3,624,075 |
Spring-Ford Area School District: | | | | |
5.375% 4/1/16 (FSA Insured) | | 790,000 | | 879,665 |
5.375% 4/1/17 (FSA Insured) | | 830,000 | | 918,428 |
5.375% 4/1/18 (FSA Insured) | | 875,000 | | 966,569 |
Upper Saint Clair Township School District 5.375% 7/15/16 (FSA Insured) | | 1,855,000 | | 2,073,612 |
West Allegheny School District Series B, 5.25% 2/1/12 (FGIC Insured) | | 1,850,000 | | 2,062,621 |
Westmoreland County Gen. Oblig.: | | | | |
0% 8/1/15 (Escrowed to Maturity) (c) | | 4,290,000 | | 2,910,551 |
0% 8/1/16 (Escrowed to Maturity) (c) | | 2,955,000 | | 1,904,084 |
Westmoreland County Indl. Dev. Auth. Rev. (Nat'l. Waste & Energy Corp./Valley Landfill Expansion Proj.) 5.1%, tender 5/1/09 (a)(b) | | 2,700,000 | | 2,800,197 |
Westmoreland County Muni. Auth. Muni. Svc. Rev.: | | | | |
Series A: | | | | |
0% 8/15/19 (FGIC Insured) | | 5,000,000 | | 2,732,100 |
0% 8/15/20 (FGIC Insured) | | 2,500,000 | | 1,291,450 |
Series C, 0% 8/15/17 (Escrowed to Maturity) (c) | | 2,500,000 | | 1,525,775 |
York City Swr. Auth. Swr. Rev. 0% 12/1/12 (MBIA Insured) | | 3,235,000 | | 2,439,352 |
| | 296,316,535 |
Puerto Rico - 3.0% |
Puerto Rico Commonwealth Hwy. & Trans. Auth. Hwy. Rev. Series Y, 5.5% 7/1/36 (FSA Insured) | | 400,000 | | 461,384 |
Puerto Rico Commonwealth Infrastructure Fing. Auth.: | | | | |
Series 2000 A, 5.5% 10/1/32 (Escrowed to Maturity) (c) | | 2,600,000 | | 2,870,348 |
Municipal Bonds - continued |
| Principal Amount | | Value (Note 1) |
Puerto Rico - continued |
Puerto Rico Commonwealth Infrastructure Fing. Auth.: - continued | | | | |
Series C: | | | | |
5.5% 7/1/17 (AMBAC Insured) | | $ 1,200,000 | | $ 1,408,860 |
5.5% 7/1/25 (AMBAC Insured) | | 2,500,000 | | 3,024,300 |
Puerto Rico Elec. Pwr. Auth. Pwr. Rev.: | | | | |
Series II, 5.375% 7/1/16 (MBIA Insured) | | 1,000,000 | | 1,125,140 |
Series QQ, 5.25% 7/1/13 (XL Cap. Assurance, Inc. Insured) | | 500,000 | | 566,455 |
| | 9,456,487 |
TOTAL INVESTMENT PORTFOLIO - 98.9% (Cost $293,235,068) | | | 309,922,387 |
NET OTHER ASSETS - 1.1% | | | 3,568,738 |
NET ASSETS - 100% | | $ 313,491,125 |
Legend |
(a) The coupon rate shown on floating or adjustable rate securities represents the rate at period end. |
(b) Private activity obligations whose interest is subject to the federal alternative minimum tax for individuals. |
(c) Security collateralized by an amount sufficient to pay interest and principal. |
Other Information |
The distribution of municipal securities by revenue source, as a percentage of total net assets, is as follows: |
General Obligations | 30.0% |
Escrowed/Pre-Refunded | 16.9% |
Transportation | 13.3% |
Education | 12.9% |
Water & Sewer | 9.6% |
Health Care | 8.6% |
Others* (individually less than 5%) | 8.7% |
| 100.0% |
*Includes net other assets |
See accompanying notes which are an integral part of the financial statements.
Semiannual Report
Spartan Pennsylvania Municipal Income Fund
Financial Statements
Statement of Assets and Liabilities
| June 30, 2005 (Unaudited) |
| | |
Assets | | |
Investment in securities, at value (cost $293,235,068) - See accompanying schedule | | $ 309,922,387 |
Receivable for investments sold | | 432,270 |
Receivable for fund shares sold | | 225,582 |
Interest receivable | | 3,662,363 |
Prepaid expenses | | 605 |
Other receivables | | 5,983 |
Total assets | | 314,249,190 |
| | |
Liabilities | | |
Payable to custodian bank | $ 151,947 | |
Payable for fund shares redeemed | 160,062 | |
Distributions payable | 301,827 | |
Accrued management fee | 96,957 | |
Other affiliated payables | 26,917 | |
Other payables and accrued expenses | 20,355 | |
Total liabilities | | 758,065 |
| | |
Net Assets | | $ 313,491,125 |
Net Assets consist of: | | |
Paid in capital | | $ 296,332,213 |
Undistributed net investment income | | 7,412 |
Accumulated undistributed net realized gain (loss) on investments | | 464,181 |
Net unrealized appreciation (depreciation) on investments | | 16,687,319 |
Net Assets, for 28,393,812 shares outstanding | | $ 313,491,125 |
Net Asset Value, offering price and redemption price per share ($313,491,125 ÷ 28,393,812 shares) | | $ 11.04 |
See accompanying notes which are an integral part of the financial statements.
Semiannual Report
Statement of Operations
| Six months ended June 30, 2005 (Unaudited) |
| | |
Investment Income | | |
Interest | | $ 6,810,960 |
| | |
Expenses | | |
Management fee | $ 567,853 | |
Transfer agent fees | 114,945 | |
Accounting fees and expenses | 37,947 | |
Independent trustees' compensation | 701 | |
Custodian fees and expenses | 2,550 | |
Registration fees | 17,743 | |
Audit | 22,234 | |
Legal | 1,387 | |
Miscellaneous | 1,271 | |
Total expenses before reductions | 766,631 | |
Expense reductions | (43,240) | 723,391 |
Net investment income | | 6,087,569 |
Realized and Unrealized Gain (Loss) Net realized gain (loss) on: | | |
Investment securities | 1,026,185 | |
Futures contracts | 76,456 | |
Swap agreements | 61,411 | |
Total net realized gain (loss) | | 1,164,052 |
Change in net unrealized appreciation (depreciation) on: Investment securities | (550,095) | |
Swap agreements | (5,042) | |
Total change in net unrealized appreciation (depreciation) | | (555,137) |
Net gain (loss) | | 608,915 |
Net increase (decrease) in net assets resulting from operations | | $ 6,696,484 |
See accompanying notes which are an integral part of the financial statements.
Semiannual Report
Spartan Pennsylvania Municipal Income Fund
Financial Statements - continued
Statement of Changes in Net Assets
| Six months ended
June 30, 2005
(Unaudited) | Year ended
December 31,
2004 |
Increase (Decrease) in Net Assets | | |
Operations | | |
Net investment income | $ 6,087,569 | $ 11,953,364 |
Net realized gain (loss) | 1,164,052 | 1,131,185 |
Change in net unrealized appreciation (depreciation) | (555,137) | (1,386,233) |
Net increase (decrease) in net assets resulting
from operations | 6,696,484 | 11,698,316 |
Distributions to shareholders from net investment income | (6,077,991) | (11,909,386) |
Distributions to shareholders from net realized gain | - | (1,280,619) |
Total distributions | (6,077,991) | (13,190,005) |
Share transactions
Proceeds from sales of shares | 31,374,043 | 41,546,733 |
Reinvestment of distributions | 4,307,180 | 9,672,228 |
Cost of shares redeemed | (20,430,888) | (44,125,799) |
Net increase (decrease) in net assets resulting from share transactions | 15,250,335 | 7,093,162 |
Redemption fees | 904 | 1,146 |
Total increase (decrease) in net assets | 15,869,732 | 5,602,619 |
| | |
Net Assets | | |
Beginning of period | 297,621,393 | 292,018,774 |
End of period (including undistributed net investment income of $7,412 and distributions in excess of net investment income of $2,166, respectively) | $ 313,491,125 | $ 297,621,393 |
Other Information Shares | | |
Sold | 2,852,421 | 3,770,208 |
Issued in reinvestment of distributions | 391,567 | 881,647 |
Redeemed | (1,857,449) | (4,041,514) |
Net increase (decrease) | 1,386,539 | 610,341 |
See accompanying notes which are an integral part of the financial statements.
Semiannual Report
Financial Highlights
| Six months ended
June 30, 2005 | Years ended December 31, |
| (Unaudited) | 2004 | 2003 | 2002 | 2001 | 2000 |
Selected Per-Share Data | | | | | |
Net asset value, beginning of period | $ 11.02 | $ 11.06 | $ 11.07 | $ 10.64 | $ 10.64 | $ 10.06 |
Income from Investment Operations | | | | | | |
Net investment
incomeD | .220 | .454 | .463 | .482 | .494G | .494 |
Net realized
and unrealized gain (loss) | .020 | .006E | .091 | .471 | .030G | .581 |
Total from investment operations | .240 | .460 | .554 | .953 | .524 | 1.075 |
Distributions from net investment income | (.220) | (.452) | (.462) | (.482) | (.493) | (.495) |
Distributions from net realized gain | - | (.048) | (.102) | (.041) | (.031) | - |
Total distributions | (.220) | (.500) | (.564) | (.523) | (.524) | (.495) |
Redemption fees added to paid in capitalD,H | - | - | - | - | - | - |
Net asset value,
end of period | $ 11.04 | $ 11.02 | $ 11.06 | $ 11.07 | $ 10.64 | $ 10.64 |
Total ReturnB,C | 2.21% | 4.28% | 5.11% | 9.14% | 4.97% | 10.99% |
Ratios to Average Net AssetsF | | | | | |
Expenses before expense reductions | .51%A | .50% | .51% | .51% | .51% | .52% |
Expenses net of
voluntary waivers, if any | .51%A | .50% | .51% | .51% | .51% | .52% |
Expenses net of all reductions | .48%A | .49% | .50% | .49% | .45% | .44% |
Net investment
income | 4.04%A | 4.14% | 4.18% | 4.42% | 4.59%G | 4.84% |
Supplemental Data | | | | | | |
Net assets,
end of period (000 omitted) | $ 313,491 | $ 297,621 | $ 292,019 | $ 300,026 | $ 269,262 | $ 243,369 |
Portfolio
turnover rate | 20%A | 14% | 18% | 9% | 22% | 26% |
A Annualized
B Total returns for periods of less than one year are not annualized.
C Total returns would have been lower had certain expenses not been reduced during the periods shown.
D Calculated based on average shares outstanding during the period.
E The amount shown for a share outstanding does not correspond with the aggregate net gain (loss) on investments for the period due to the timing of sales and repurchases of shares in relation to fluctuating market values of the investments of the fund.
F Expense ratios reflect operating expenses of the fund. Expenses before reductions do not reflect amounts reimbursed by the investment adviser or reductions from brokerage service arrangements or other expense offset arrangements and do not represent the amount paid by the fund during periods when reimbursements or reductions occur. Expenses net of any voluntary waivers reflect expenses after reimbursement by the investment adviser but prior to reductions from brokerage service arrangements or other expense offset arrangements. Expenses net of all reductions represent the net expenses paid by the fund.
G Effective January 1, 2001, the fund adopted the provisions of the AICPA Audit and Accounting Guide for Investment Companies and began amortizing premium and discount on all debt securities. Per-share data and ratios for periods prior to adoption have not been restated to reflect this change.
H Amount represents less than $.001 per share.
See accompanying notes which are an integral part of the financial statements.
Semiannual Report
Fidelity Pennsylvania Municipal Money Market Fund
Investment Changes
Maturity Diversification |
Days | % of fund's investments 6/30/05 | % of fund's investments 12/31/04 | % of fund's investments 6/30/04 |
0 - 30 | 87.5 | 87.7 | 79.2 |
31 - 90 | 1.8 | 3.2 | 13.2 |
91 - 180 | 3.1 | 1.4 | 3.0 |
181 - 397 | 7.6 | 7.7 | 4.6 |
Weighted Average Maturity |
| 6/30/05 | 12/31/04 | 6/30/04 |
Fidelity Pennsylvania Municipal Money Market Fund | 33 Days | 27 Days | 30 Days |
Pennsylvania Tax-Free Money Market Funds Average* | 22 Days | 32 Days | 32 Days |
Asset Allocation (% of fund's net assets) |
As of June 30, 2005 | As of December 31, 2004 |
| Variable Rate
Demand Notes
(VRDNs) 81.5% | | | Variable Rate
Demand Notes
(VRDNs) 79.5% | |
| Commercial Paper (including CP Mode) 1.7% | | | Commercial Paper (including CP Mode) 6.0% | |
| Tender Bonds 6.4% | | | Tender Bonds 4.0% | |
| Municipal Notes 1.4% | | | Municipal Notes 3.3% | |
| Other Investments 3.1% | | | Other Investments 4.7% | |
| Net Other Assets 5.9% | | | Net Other Assets 2.5% | |

*Source: iMoneyNet, Inc.
Semiannual Report
Fidelity Pennsylvania Municipal Money Market Fund
Investments June 30, 2005 (Unaudited)
Showing Percentage of Net Assets
Municipal Securities - 94.1% |
| Principal Amount | | Value (Note 1) |
New Jersey/Pennsylvania - 2.0% |
Delaware River Port Auth. Pennsylvania & New Jersey Rev. Participating VRDN Series SGA 89, 2.28% (Liquidity Facility Societe Generale) (a)(c) | $ 7,500,000 | | $ 7,500,000 |
Pennsylvania - 92.1% |
Allegheny County Arpt. Rev. Participating VRDN Series PA 567, 2.36% (Liquidity Facility Merrill Lynch & Co., Inc.) (a)(b)(c) | 2,000,000 | | 2,000,000 |
Allegheny County Gen. Oblig. Bonds Series C56, 4% 10/1/05 (FSA Insured) | 6,595,000 | | 6,626,791 |
Allegheny County Hosp. Dev. Auth. Rev. Bonds: | | | |
(South Hills Health Sys. Proj.): | | | |
Series 2000 A, 2.95%, tender 6/1/06, LOC PNC Bank NA, Pittsburgh (a) | 4,400,000 | | 4,400,000 |
Series A, 2.93%, tender 5/1/06, LOC PNC Bank NA, Pittsburgh (a) | 6,315,000 | | 6,315,000 |
Series PT 762, 2.85%, tender 6/15/06 (Liquidity Facility Landesbank Hessen-Thuringen) (a)(c)(d) | 5,720,000 | | 5,720,000 |
Allegheny County Indl. Dev. Auth. Econ. Dev. Rev. (Glassport Realty Ltd. Proj.) 2.55%, LOC Huntington Nat'l. Bank, Columbus, VRDN (a)(b) | 1,730,000 | | 1,730,000 |
Allegheny County Indl. Dev. Auth. Rev.: | | | |
Bonds (Children's Museum of Pittsburgh Proj.) 1.85%, tender 10/1/05, LOC PNC Bank NA, Pittsburgh (a) | 4,230,000 | | 4,230,000 |
Participating VRDN Series Merlots A48, 2.32% (Liquidity Facility Wachovia Bank NA) (a)(c) | 3,000,000 | | 3,000,000 |
(Doren, Inc. Proj.) Series 1997 C, 2.42%, LOC Nat'l. City Bank, PA, VRDN (a)(b) | 1,500,000 | | 1,500,000 |
(R.I. Lampus Co. Proj.) Series 1997 A, 2.42%, LOC Nat'l. City Bank, PA, VRDN (a)(b) | 2,560,000 | | 2,560,000 |
(Union Elec. Steel Co. Proj.) Series 1996 A, 2.38%, LOC PNC Bank NA, Pittsburgh, VRDN (a)(b) | 3,120,000 | | 3,120,000 |
(UPMC Children's Hosp. Proj.) Series 2004 A, 2.42%, VRDN (a) | 3,200,000 | | 3,200,000 |
(UPMC Health Sys. Proj.) Series 2002 C, 2.3%, LOC Comerica Bank, Detroit, VRDN (a) | 2,885,000 | | 2,885,000 |
Beaver County Indl. Dev. Auth. Poll. Cont. Rev. Participating VRDN Series EGL 95 3503, 2.31% (Liquidity Facility Citibank NA, New York) (a)(c) | 2,700,000 | | 2,700,000 |
Berks County Indl. Dev. Auth. Rev.: | | | |
(Fleetwood Industries Bus. Trust Proj.) 2.38%, LOC First Tennessee Bank NA, Memphis, VRDN (a)(b) | 2,440,000 | | 2,440,000 |
(Grafika Commercial Printing, Inc. Proj.) Series 1995, 2.39%, LOC Wachovia Bank NA, VRDN (a)(b) | 695,000 | | 695,000 |
Municipal Securities - continued |
| Principal Amount | | Value (Note 1) |
Pennsylvania - continued |
Blair County Indl. Dev. Auth. Rev. (Homewood at Martinsburg Proj.) 2.59%, LOC Manufacturers & Traders Trust Co., VRDN (a) | $ 3,200,000 | | $ 3,200,000 |
Bucks County Indl. Dev. Auth. Rev.: | | | |
(Double H Plastics, Inc. Proj.) Series 1993, 2.39%, LOC Wachovia Bank NA, VRDN (a)(b) | 1,020,000 | | 1,020,000 |
(Snowball Real Estate LP Proj.) 2.44%, LOC Wachovia Bank NA, VRDN (a)(b) | 2,375,000 | | 2,375,000 |
Butler County Indl. Dev. Auth. Rev. (Armco, Inc. Proj.) Series 1996 A, 2.38%, LOC Fifth Third Bank, Cincinnati, VRDN (a)(b) | 1,500,000 | | 1,500,000 |
Cambria County Ind. Dev. Auth. (Cambria Cogen Co. Proj.): | | | |
Series 1998 A1, 2.42%, LOC Bayerische Hypo-und Vereinsbank AG, VRDN (a)(b) | 5,825,000 | | 5,825,000 |
Series 1998 A2, 2.48%, LOC Bayerische Hypo-und Vereinsbank AG, VRDN (a)(b) | 3,300,000 | | 3,300,000 |
Central Bucks School District Series 2000 A, 2.33% (FGIC Insured), VRDN (a) | 4,125,000 | | 4,125,000 |
Chester County Inter Unit 2.38%, LOC PNC Bank NA, Pittsburgh, VRDN (a) | 1,660,000 | | 1,660,000 |
Delaware County Indl. Dev. Auth. Poll. Cont. Rev. Bonds (Exelon Generation Co. LLC Proj.) Series 2001 A, 2.5% tender 8/5/05, LOC Wachovia Bank NA, CP mode | 3,600,000 | | 3,600,000 |
Delaware County Indl. Dev. Auth. Rev. Participating VRDN Series PA 1295, 2.33% (Liquidity Facility Merrill Lynch & Co., Inc.) (a)(b)(c) | 2,250,000 | | 2,250,000 |
Harrisburg Auth. Wtr. Rev. Series A, 2.33% (FGIC Insured), VRDN (a) | 2,800,000 | | 2,800,000 |
Hatfield Township Indl. Dev. Auth. Exempt Facilities Rev. (Hatfield Quality Meats Proj.) 2.35%, LOC Bank of America NA, VRDN (a)(b) | 1,500,000 | | 1,500,000 |
Lackawanna County Gen. Oblig. Series 2004 B, 2.31% (FSA Insured), VRDN (a) | 3,300,000 | | 3,300,000 |
Lancaster Higher Ed. Auth. College Rev. (Franklin & Marshall College Proj.) Series 1997, 2.38%, VRDN (a) | 2,860,000 | | 2,860,000 |
Lawrence County Indl. Dev. Auth. Indl. Dev. Rev. (Atlantic States Materials Proj.) Series 1999, 2.39%, LOC Wachovia Bank NA, VRDN (a)(b) | 1,400,000 | | 1,400,000 |
Lycoming County Indl. Dev. Auth. (FXD-Brodart Co. Proj.): | | | |
Series A, 2.43%, LOC Manufacturers & Traders Trust Co., VRDN (a)(b) | 1,905,000 | | 1,905,000 |
Series C, 2.43%, LOC Manufacturers & Traders Trust Co., VRDN (a)(b) | 1,000,000 | | 1,000,000 |
Municipal Securities - continued |
| Principal Amount | | Value (Note 1) |
Pennsylvania - continued |
Northampton County Indl. Dev. Auth. Rev.: | | | |
Bonds (American Wtr. Cap. Corp. Proj.) Series 1991, 2.9% tender 8/5/05, CP mode (b) | $ 2,500,000 | | $ 2,500,000 |
(Binney & Smith, Inc. Proj.) Series 1997 A, 2.34%, LOC JPMorgan Chase Bank, VRDN (a)(b) | 2,350,000 | | 2,350,000 |
Northampton Indl. Dev. Auth. Rev. (Ultra-Poly Corp./Portland Ind. Park Proj.) 2.45%, LOC PNC Bank NA, Pittsburgh, VRDN (a)(b) | 2,600,000 | | 2,600,000 |
Pennsylvania Econ. Dev. Fing. Auth. Exempt Facilities Rev.: | | | |
(Amtrak Proj.) Series B, 2.45%, LOC JPMorgan Chase Bank, VRDN (a)(b) | 18,700,000 | | 18,700,000 |
(Merck & Co. Proj.) Series 2000, 2.35%, VRDN (a)(b) | 7,200,000 | | 7,200,000 |
(York Wtr. Co. Proj.) Series B, 2.38% (XL Cap. Assurance, Inc. Insured), VRDN (a)(b) | 3,500,000 | | 3,500,000 |
Pennsylvania Econ. Dev. Fing. Auth. Indl. Dev. Rev.: | | | |
Series 1996 A2, 2.38%, LOC PNC Bank NA, Pittsburgh, VRDN (a)(b) | 400,000 | | 400,000 |
Series 1999 C4, 2.38%, LOC PNC Bank NA, Pittsburgh, VRDN (a)(b) | 900,000 | | 900,000 |
Series 2002 B6, 2.38%, LOC PNC Bank NA, Pittsburgh, VRDN (a)(b) | 900,000 | | 900,000 |
Series 2004 D2, 2.38%, LOC PNC Bank NA, Pittsburgh, VRDN (a)(b) | 2,900,000 | | 2,900,000 |
Series 2004 D6, 2.38%, LOC PNC Bank NA, Pittsburgh, VRDN (a)(b) | 2,800,000 | | 2,800,000 |
Series B3, 2.38%, LOC PNC Bank NA, Pittsburgh, VRDN (a)(b) | 1,700,000 | | 1,700,000 |
Series B5, 2.38%, LOC PNC Bank NA, Pittsburgh, VRDN (a)(b) | 1,100,000 | | 1,100,000 |
Pennsylvania Econ. Dev. Fing. Auth. Rev.: | | | |
(Westrum Hanover, LP Proj.) 2.33%, LOC Fed. Home Ln. Bank Pittsburg, VRDN (a)(b) | 2,900,000 | | 2,900,000 |
(Westrum Harleysville II LP Proj.) 2.33%, LOC Fed. Home Ln. Bank Pittsburg, VRDN (a)(b) | 4,335,000 | | 4,335,000 |
Pennsylvania Econ. Dev. Fing. Auth. Solid Waste Disp. Rev. Participating VRDN Series MT 47, 2.35% (Liquidity Facility Lloyds TSB Bank PLC) (a)(b)(c) | 4,500,000 | | 4,500,000 |
Pennsylvania Econ. Dev. Fing. Auth. Wastewtr. Treatment Rev. (Sunoco, Inc. (R&M) Proj.): | | | |
Series A, 2.765% (Sunoco, Inc. Guaranteed), VRDN (a)(b) | 1,600,000 | | 1,600,000 |
Series B, 2.5% (Sunoco, Inc. Guaranteed), VRDN (a)(b) | 1,600,000 | | 1,600,000 |
Pennsylvania Gen. Oblig. Participating VRDN: | | | |
Series EGL 04 43 Class A, 2.31% (Liquidity Facility Citibank NA) (a)(c) | 3,000,000 | | 3,000,000 |
Municipal Securities - continued |
| Principal Amount | | Value (Note 1) |
Pennsylvania - continued |
Pennsylvania Gen. Oblig. Participating VRDN: - continued | | | |
Series Merlots 04 B15, 2.32% (Liquidity Facility Wachovia Bank NA) (a)(c) | $ 3,095,000 | | $ 3,095,000 |
Series MS 01 465, 2.31% (Liquidity Facility Morgan Stanley) (a)(c) | 6,995,000 | | 6,995,000 |
Series ROC II R343, 2.31% (Liquidity Facility Citibank NA) (a)(c) | 4,410,000 | | 4,410,000 |
Pennsylvania Higher Ed. Assistance Agcy. Student Ln. Rev.: | | | |
Series 1988 E, 2.33%, LOC Sallie Mae, VRDN (a)(b) | 10,500,000 | | 10,500,000 |
Series 1997 A, 2.45% (AMBAC Insured), VRDN (a)(b) | 2,900,000 | | 2,900,000 |
Series 2000 A, 2.45% (AMBAC Insured), VRDN (a)(b) | 4,000,000 | | 4,000,000 |
Series 2001 B, 2.33% (FSA Insured), VRDN (a)(b) | 800,000 | | 800,000 |
Series 2002 B, 2.4% (FSA Insured), VRDN (a)(b) | 2,800,000 | | 2,800,000 |
Series A: | | | |
2.4% (FSA Insured), VRDN (a)(b) | 16,300,000 | | 16,300,000 |
2.45% (AMBAC Insured), VRDN (a)(b) | 2,500,000 | | 2,500,000 |
Series A1, 2.45% (AMBAC Insured), VRDN (a)(b) | 5,600,000 | | 5,600,000 |
Pennsylvania Higher Edl. Facilities Auth. (Washington & Jefferson Dev. Corp. Proj.) Series A, 2.32%, LOC Unicredito Italiano Spa, VRDN (a) | 3,500,000 | | 3,500,000 |
Pennsylvania Higher Edl. Facilities Auth. Hosp. Rev. Participating VRDN Series MT 42, 2.34% (Liquidity Facility Lloyds TSB Bank PLC) (a)(c) | 3,290,000 | | 3,290,000 |
Pennsylvania Higher Edl. Facilities Auth. Rev. (Mount Aloysius College Proj.) Series L3, 2.33%, LOC Allied Irish Banks PLC, VRDN (a) | 2,600,000 | | 2,600,000 |
Pennsylvania Hsg. Fin. Agcy. Participating VRDN: | | | |
Series LB 04 L80, 2.48% (Liquidity Facility Lehman Brothers Hldgs., Inc.) (a)(b)(c) | 3,400,000 | | 3,400,000 |
Series PA 1235, 2.35% (Liquidity Facility Merrill Lynch & Co., Inc.) (a)(b)(c) | 1,675,000 | | 1,675,000 |
Series PA 930, 2.33% (Liquidity Facility Merrill Lynch & Co., Inc.) (a)(b)(c) | 4,995,000 | | 4,995,000 |
Series PT 2068, 2.35% (Liquidity Facility Merrill Lynch & Co., Inc.) (a)(b)(c) | 3,900,000 | | 3,900,000 |
Series PT 2190, 2.35% (Liquidity Facility Merrill Lynch & Co., Inc.) (a)(b)(c) | 3,980,000 | | 3,980,000 |
Series PT 890, 2.35% (Liquidity Facility Merrill Lynch & Co., Inc.) (a)(b)(c) | 1,315,000 | | 1,315,000 |
Pennsylvania Pub. School Bldg. Auth. School Rev.: | | | |
Bonds Series Merlots 03 A42, 1.8%, tender 7/28/05 (Liquidity Facility Wachovia Bank NA) (a)(c)(d) | 2,895,000 | | 2,895,000 |
Municipal Securities - continued |
| Principal Amount | | Value (Note 1) |
Pennsylvania - continued |
Pennsylvania Pub. School Bldg. Auth. School Rev.: - continued | | | |
Participating VRDN: | | | |
Series MS 958, 2.31% (Liquidity Facility Morgan Stanley) (a)(c) | $ 5,000,000 | | $ 5,000,000 |
Series Stars 124, 2.31% (Liquidity Facility BNP Paribas SA) (a)(c) | 3,905,000 | | 3,905,000 |
Pennsylvania Tpk. Commission Oil Franchise Tax Rev. Participating VRDN Series ROC II R1005, 2.31% (Liquidity Facility Citigroup Global Markets Hldgs., Inc.) (a)(c) | 1,000,000 | | 1,000,000 |
Pennsylvania Tpk. Commission Tpk. Rev. Bonds Series AAB 04 9, 2.32%, tender 7/7/05 (Liquidity Facility ABN-AMRO Bank NV) (a)(c) | 3,100,000 | | 3,100,000 |
Philadelphia Arpt. Rev. Participating VRDN Series SG 118, 2.36% (Liquidity Facility Societe Generale) (a)(b)(c) | 2,600,000 | | 2,600,000 |
Philadelphia Auth. for Indl. Dev. Arpt. Rev. Participating VRDN: | | | |
Series LB 04 L17, 2.48% (Liquidity Facility Lehman Brothers Hldgs., Inc.) (a)(b)(c) | 3,385,000 | | 3,385,000 |
Series PA 882, 2.36% (Liquidity Facility Merrill Lynch & Co., Inc.) (a)(b)(c) | 2,200,000 | | 2,200,000 |
Series Putters 217, 2.33% (Liquidity Facility JPMorgan Chase Bank) (a)(b)(c) | 7,715,000 | | 7,715,000 |
Philadelphia Gas Works Rev. Participating VRDN: | | | |
Series 1998 104, 2.31% (Liquidity Facility Morgan Stanley) (a)(c) | 2,195,000 | | 2,195,000 |
Series MS 906, 2.31% (Liquidity Facility Morgan Stanley) (a)(c) | 3,000,000 | | 3,000,000 |
Series Putters 384, 2.32% (Liquidity Facility JPMorgan Chase Bank) (a)(c) | 5,000,000 | | 5,000,000 |
Philadelphia Hosp. & Higher Ed. Facilities Auth. Health Sys. Rev. Bonds (Jefferson Health Sys. Proj.) Series A, 5.5% 5/15/06 | 2,045,000 | | 2,090,297 |
Philadelphia Redev. Auth. Rev. Participating VRDN Series DB 134, 2.33% (Liquidity Facility Deutsche Bank AG) (a)(b)(c) | 3,500,000 | | 3,500,000 |
Philadelphia School District Participating VRDN: | | | |
Series EGL 7050036, 2.31% (Liquidity Facility Citibank NA) (a)(c) | 3,800,000 | | 3,800,000 |
Series EGL 7050039, 2.31% (Liquidity Facility Citibank NA) (a)(c) | 3,000,000 | | 3,000,000 |
Series Putters 870, 2.32% (Liquidity Facility JPMorgan Chase & Co.) (a)(c) | 2,585,000 | | 2,585,000 |
Philadelphia Wtr. & Wastewtr. Rev. Participating VRDN Series MS 773, 2.31% (Liquidity Facility Morgan Stanley) (a)(c) | 2,000,000 | | 2,000,000 |
Municipal Securities - continued |
| Principal Amount | | Value (Note 1) |
Pennsylvania - continued |
Pittsburgh Gen. Oblig. Bonds Series 1996 A, 6% 3/1/06 (MBIA Insured) | $ 2,540,000 | | $ 2,590,985 |
Pittsburgh Urban Redev. Auth. Single Family Mortgage Rev. Participating VRDN Series PT 996, 2.35% (Liquidity Facility Merrill Lynch & Co., Inc.) (a)(b)(c) | 3,100,000 | | 3,100,000 |
Schuylkill County Indl. Dev. Auth. Resource Recovery Rev. (Northeastern Pwr. Co. Proj.) Series 1997 B, 2.32%, LOC Dexia Cr. Local de France, VRDN (a)(b) | 5,705,000 | | 5,705,000 |
Scranton-Lackawanna Health & Welfare Auth. Rev. Participating VRDN Series Merlots 02 A18, 2.32% (Liquidity Facility Wachovia Bank NA) (a)(c) | 2,575,000 | | 2,575,000 |
Southcentral Pennsylvania Gen. Auth. Rev. (Hanover Lutheran Village Proj.) 2.59%, LOC Manufacturers & Traders Trust Co., VRDN (a) | 3,700,000 | | 3,700,000 |
Southeastern Pennsylvania Transit Auth. Spl. Rev. Participating VRDN Series BS 01 9016 Class A, 2.3% (Liquidity Facility Bear Stearns Companies, Inc.) (a)(c) | 5,500,000 | | 5,500,000 |
Temple Univ. of the Commonwealth Sys. of Higher Ed. BAN 4% 4/28/06 | 5,000,000 | | 5,049,326 |
| | 337,972,399 |
TOTAL INVESTMENT PORTFOLIO - 94.1% (Cost $345,472,399) | | 345,472,399 |
NET OTHER ASSETS - 5.9% | | 21,688,877 |
NET ASSETS - 100% | $ 367,161,276 |
Security Type Abbreviations |
BAN - BOND ANTICIPATION NOTE |
CP - COMMERCIAL PAPER |
VRDN - VARIABLE RATE DEMAND NOTE |
Legend |
(a) The coupon rate shown on floating or adjustable rate securities represents the rate at period end. |
(b) Private activity obligations whose interest is subject to the federal alternative minimum tax for individuals. |
(c) Provides evidence of ownership in one or more underlying municipal bonds. |
(d) Restricted securities - Investment in securities not registered under the Securities Act of 1933 (excluding 144A issues). At the end of the period, the value of restricted securities (excluding 144A issues) amounted to $8,615,000 or 2.3% of net assets. |
Additional information on each holding is as follows: |
Security | Acquisition Date | Cost |
Allegheny County Hosp. Dev. Auth. Rev. Bonds Series PT 762, 2.85%, tender 6/15/06 (Liquidity Facility Landesbank Hessen-Thuringen) | 9/4/03 - 3/9/05 | $ 5,720,000 |
Pennsylvania Pub. School Bldg. Auth. School Rev. Bonds Series Merlots 03 A42, 1.8%, tender 7/28/05 (Liquidity Facility Wachovia Bank NA) | 9/18/03 | $ 2,895,000 |
Income Tax Information |
At December 31, 2004, the fund had a capital loss carryforward of approximately $23,236 all of which will expire on December 31, 2012. |
See accompanying notes which are an integral part of the financial statements.
Semiannual Report
Fidelity Pennsylvania Municipal Money Market Fund
Financial Statements
Statement of Assets and Liabilities
| June 30, 2005 (Unaudited) |
| | |
Assets | | |
Investment in securities, at value (cost $345,472,399) - See accompanying schedule | | $ 345,472,399 |
Cash | | 16,431,983 |
Receivable for investments sold | | 6,000,392 |
Receivable for fund shares sold | | 3,267,693 |
Interest receivable | | 1,738,419 |
Other receivables | | 21,930 |
Total assets | | 372,932,816 |
| | |
Liabilities | | |
Payable for fund shares redeemed | 5,605,880 | |
Distributions payable | 11,406 | |
Accrued management fee | 153,341 | |
Other affiliated payables | 913 | |
Total liabilities | | 5,771,540 |
| | |
Net Assets | | $ 367,161,276 |
Net Assets consist of: | | |
Paid in capital | | $ 367,115,910 |
Undistributed net investment income | | 75,883 |
Accumulated undistributed net realized gain (loss) on investments | | (30,517) |
Net Assets, for 367,158,728 shares outstanding | | $ 367,161,276 |
Net Asset Value, offering price and redemption price per share ($367,161,276 ÷ 367,158,728 shares) | | $ 1.00 |
See accompanying notes which are an integral part of the financial statements.
Semiannual Report
Statement of Operations
| Six months ended June 30, 2005 (Unaudited) |
| | |
Investment Income | | |
Interest | | $ 3,904,683 |
| | |
Expenses | | |
Management fee | $ 883,208 | |
Independent trustees' compensation | 796 | |
Total expenses before reductions | 884,004 | |
Expense reductions | (108,160) | 775,844 |
Net investment income | | 3,128,839 |
Net realized gain (loss) on investment securities | | (7,280) |
Net increase in net assets resulting from operations | | $ 3,121,559 |
See accompanying notes which are an integral part of the financial statements.
Semiannual Report
Fidelity Pennsylvania Municipal Money Market Fund
Financial Statements - continued
Statement of Changes in Net Assets
| Six months ended
June 30, 2005
(Unaudited) | Year ended
December 31,
2004 |
Increase (Decrease) in Net Assets | | |
Operations | | |
Net investment income | $ 3,128,839 | $ 2,477,211 |
Net realized gain (loss) | (7,280) | (23,237) |
Net increase in net assets resulting
from operations | 3,121,559 | 2,453,974 |
Distributions to shareholders from net investment income | (3,093,245) | (2,515,303) |
Share transactions at net asset value of $1.00 per share
Proceeds from sales of shares | 437,447,526 | 592,486,036 |
Reinvestment of distributions | 3,082,754 | 2,473,422 |
Cost of shares redeemed | (405,232,938) | (557,374,245) |
Net increase (decrease) in net assets and shares resulting from share transactions | 35,297,342 | 37,585,213 |
Total increase (decrease) in net assets | 35,325,656 | 37,523,884 |
| | |
Net Assets | | |
Beginning of period | 331,835,620 | 294,311,736 |
End of period (including undistributed net investment income of $75,883 and undistributed net investment income of $40,289, respectively) | $ 367,161,276 | $ 331,835,620 |
See accompanying notes which are an integral part of the financial statements.
Semiannual Report
Financial Highlights
| Six months ended
June 30, 2005 | Years ended December 31, |
| (Unaudited) | 2004 | 2003 | 2002 | 2001 | 2000 |
Selected Per-Share Data | | | | | |
Net asset value, beginning of period | $ 1.00 | $ 1.00 | $ 1.00 | $ 1.00 | $ 1.00 | $ 1.00 |
Income from Investment Operations | | | | | | |
Net investment
income | .009 | .008 | .006 | .011 | .025 | .037 |
Distributions from net investment income | (.009) | (.008) | (.006) | (.011) | (.025) | (.037) |
Net asset value,
end of period | $ 1.00 | $ 1.00 | $ 1.00 | $ 1.00 | $ 1.00 | $ 1.00 |
Total ReturnB,C,D | .88% | .81% | .65% | 1.09% | 2.50% | 3.80% |
Ratios to Average Net AssetsE | | | | | |
Expenses before expense reductions | .50%A | .50% | .50% | .50% | .50% | .50% |
Expenses net of
voluntary waivers, if any | .50%A | .50% | .50% | .50% | .50% | .50% |
Expenses net of all reductions | .44%A | .48% | .49% | .46% | .47% | .50% |
Net investment
income | 1.78%A | .80% | .66% | 1.09% | 2.45% | 3.74% |
Supplemental Data | | | | | | |
Net assets,
end of period (000 omitted) | $ 367,161 | $ 331,836 | $ 294,312 | $ 278,322 | $ 240,705 | $ 213,847 |
A Annualized
B Total returns for periods of less than one year are not annualized.
C Total returns would have been lower had certain expenses not been reduced during the periods shown.
D Total returns do not include the effect of the former account closeout fee.
E Expense ratios reflect operating expenses of the fund. Expenses before reductions do not reflect amounts reimbursed by the investment adviser or reductions from brokerage service arrangements or other expense offset arrangements and do not represent the amount paid by the fund during periods when reimbursements or reductions occur. Expenses net of any voluntary waivers reflect expenses after reimbursement by the investment adviser but prior to reductions from brokerage service arrangements or other expense offset arrangements. Expenses net of all reductions represent the net expenses paid by the fund.
See accompanying notes which are an integral part of the financial statements.
Semiannual Report
Notes to Financial Statements
For the period ended June 30, 2005 (Unaudited)
1. Significant Accounting Policies.
Spartan Pennsylvania Municipal Income Fund (the income fund) is a fund of Fidelity Municipal Trust. Fidelity Pennsylvania Municipal Money Market Fund (the money market fund) is a fund of Fidelity Municipal Trust II. On July 21, 2005 the Board of Trustees approved a change in the name of Spartan Pennsylvania Municipal Income Fund to Fidelity Pennsylvania Municipal Income Fund effective August 15, 2005. Each trust is registered under the Investment Company Act of 1940, as amended (the 1940 Act), as an open-end management investment company. Fidelity Municipal Trust and Fidelity Municipal Trust II (the trusts) are organized as a Massachusetts business trust and a Delaware statutory trust, respectively. The income fund is a non-diversified fund. Each fund is authorized to issue an unlimited number of shares. Each fund may be affected by economic and political developments in the state of Pennsylvania. The financial statements have been prepared in conformity with accounting principles generally accepted in the United States of America, which require management to make certain estimates and assumptions at the date of the financial statements. The following summarizes the significant accounting policies of the income fund and the money market fund:
Security Valuation. Net asset value per share (NAV calculation) is calculated as of the close of business of the New York Stock Exchange, normally 4:00 p.m. Eastern time. For the income fund, debt securities, including restricted securities, are valued on the basis of information provided by a pricing service. Pricing services use valuation matrices that incorporate both dealer-supplied valuations and valuation models. If prices are not readily available or do not accurately reflect fair value for a security, or if a security's value has been materially affected by events occurring after the close of the exchange or market on which the security is principally traded, that security may be valued by another method that the Board of Trustees believes accurately reflects fair value. A security's valuation may differ depending on the method used for determining value. Price movements in futures contracts and ADRs, market and trading trends, the bid/ask quotes of brokers and off-exchange institutional trading may be reviewed in the course of making a good faith determination of a security's fair value. Short-term securities with remaining maturities of sixty days or less for which quotations are not readily available are valued on the basis of amortized cost. Investments in open-end investment companies are valued at their net asset value each business day.
As permitted under Rule 2a-7 of the 1940 Act, and certain conditions therein, securities owned by the money market fund are valued initially at cost and thereafter assume a constant amortization to maturity of any discount or premium.
Investment Transactions and Income. Security transactions are accounted for as of trade date. Gains and losses on securities sold are determined on the basis of identified cost. Interest income is accrued as earned. Interest income includes coupon interest and amortization of premium and accretion of discount on debt securities.
Semiannual Report
1. Significant Accounting Policies - continued
Expenses. Most expenses of each trust can be directly attributed to a fund. Expenses which cannot be directly attributed are apportioned among each fund in the trust.
Income Tax Information and Distributions to Shareholders. Each year, each fund intends to qualify as a regulated investment company by distributing all of its taxable income and realized gains under Subchapter M of the Internal Revenue Code. As a result, no provision for income taxes is required in the accompanying financial statements.
Dividends are declared daily and paid monthly from net investment income. Distributions from realized gains, if any, are recorded on the ex-dividend date. Income and capital gain distributions are determined in accordance with income tax regulations, which may differ from generally accepted accounting principles. In addition, the income fund claimed a portion of the payment made to redeeming shareholders as a distribution for income tax purposes. Capital accounts within the financial statements are adjusted for permanent book-tax differences. These adjustments have no impact on net assets or the results of operations. Temporary book-tax differences will reverse in a subsequent period.
Book-tax differences are primarily due to market discount and losses deferred due to wash sales.
The funds purchase municipal securities whose interest, in the opinion of the issuer, is free from federal income tax. There is no assurance that the Internal Revenue Service (IRS) will agree with this opinion. In the event the IRS determines that the issuer does not comply with relevant tax requirements, interest payments from a security could become federally taxable, possibly retroactively to the date the security was issued.
The federal tax cost of investments and unrealized appreciation (depreciation) as of period end were as follows for each fund:
| Cost for Federal
Income Tax
Purposes | Unrealized
Appreciation | Unrealized
Depreciation | Net Unrealized
Appreciation/
(Depreciation) |
Spartan Pennsylvania Municipal Income Fund | $ 293,175,897 | $ 16,845,243 | $ (98,753) | $ 16,746,490 |
Fidelity Pennsylvania Municipal Money
Market Fund | 345,472,399 | - | - | - |
Short-Term Trading (Redemption) Fees. Shares held in the income fund less than 30 days are subject to a redemption fee equal to .50% of the proceeds of the redeemed shares. All redemption fees, including any estimated redemption fees paid by Fidelity Management & Research Company (FMR), are retained by the fund and accounted for as an addition to paid in capital.
Semiannual Report
Notes to Financial Statements (Unaudited) - continued
2. Operating Policies.
Futures Contracts. The income fund may use futures contracts to manage its exposure to the bond market and to fluctuations in interest rates. Buying futures tends to increase a fund's exposure to the underlying instrument, while selling futures tends to decrease a fund's exposure to the underlying instrument or hedge other fund investments. Losses may arise from changes in the value of the underlying instruments or if the counterparties do not perform under the contracts' terms. Gains (losses) are realized upon the expiration or closing of the futures contracts. Futures contracts are valued at the settlement price established each day by the board of trade or exchange on which they are traded.
Restricted Securities. Certain funds may invest in securities that are subject to legal or contractual restrictions on resale. These securities generally may be resold in transactions exempt from registration or to the public if the securities are registered. Disposal of these securities may involve time-consuming negotiations and expense, and prompt sale at an acceptable price may be difficult. Information regarding restricted securities is included at the end of each applicable fund's Schedule of Investments.
Swap Agreements. The income fund may invest in swaps for the purpose of managing its exposure to interest rate, credit or market risk.
Interest rate swaps are agreements to exchange cash flows periodically based on a notional principal amount, for example, the exchange of fixed rate interest payments for floating rate interest payments. The primary risk associated with interest rate swaps is that unfavorable changes in the fluctuation of interest rates could adversely impact the fund.
Swaps are marked-to-market daily based on dealer-supplied valuations and changes in value are recorded as unrealized appreciation (depreciation). Gains or losses are realized upon early termination of the swap agreement. Collateral, in the form of cash or securities, may be required to be held in segregated accounts with the fund's custodian in compliance with swap contracts.
3. Purchases and Sales of Investments.
Purchases and sales of securities, other than short-term securities and U.S. government securities, for the income fund aggregated $48,282,444 and $29,951,222, respectively.
Semiannual Report
4. Fees and Other Transactions with Affiliates.
Management Fee. FMR and its affiliates provide the income fund with investment management related services for which the fund pays a monthly management fee. The management fee is the sum of an individual fund fee rate that is based on an annual rate of .25% of the fund's average net assets and a group fee rate that averaged ..12% during the period. The group fee rate is based upon the average net assets of all the mutual funds advised by FMR. The group fee rate decreases as assets under management increase and increases as assets under management decrease. For the period, the total annualized management fee rate was .38% of the fund's average net assets.
FMR and its affiliates provide the money market fund with investment management related services for which the fund pays a monthly management fee that is based on an annual rate of .50% of the fund's average net assets. FMR pays all other expenses, except the compensation of the independent Trustees and certain exceptions such as interest expense. The management fee paid to FMR by the fund is reduced by an amount equal to the fees and expenses paid by the fund to the independent Trustees.
Transfer Agent and Accounting Fees. Citibank, N.A. (Citibank) is the custodian, transfer agent and shareholder servicing agent for the funds. Citibank has entered into a sub-arrangement with Fidelity Service Company, Inc. (FSC), an affiliate of FMR, under which FSC performs the activities associated with the funds' transfer and shareholder servicing agent and accounting functions. The funds pay account fees and asset-based fees that vary according to account size and type of account. FSC pays for typesetting, printing and mailing of shareholder reports, except proxy statements. The accounting fee is based on the level of average net assets for the month. For the period, the transfer agent fees were equivalent to the following annualized rates expressed as a percentage of average net assets:
Spartan Pennsylvania Municipal Income Fund | .08% | | |
Central Funds. Certain funds may invest in affiliated Central Funds managed by Fidelity Investments Money Management, Inc. (FIMM), an affiliate of FMR. The Central Funds are open-end investment companies available only to investment companies and other accounts managed by FMR and its affiliates. The Money Market Central Funds seek preservation of capital and current income. The Central Funds do not pay a management fee. Income distributions earned by the funds are recorded as income in the accompanying financial statements. Distributions from the Central Funds are noted in the table below:
| Income Distributions |
Fidelity Pennsylvania Municipal Money Market Fund | 13,679 |
Semiannual Report
Notes to Financial Statements (Unaudited) - continued
5. Committed Line of Credit.
The income fund participates with other funds managed by FMR in a $4.2 billion credit facility (the "line of credit") to be utilized for temporary or emergency purposes to fund shareholder redemptions or for other short-term liquidity purposes. The participating funds have agreed to pay commitment fees on their pro rata portion of the line of credit. During the period, there were no borrowings on this line of credit.
6. Expense Reductions.
Through arrangements with the income fund's custodian and transfer agent, credits realized as a result of uninvested cash balances were used to reduce fund expenses. These expense reductions are noted in the table below.
| Custody
expense
reduction | Transfer
Agent
expense
reduction |
| | |
Spartan Pennsylvania Municipal Income Fund | $ 2,533 | $ 40,707 |
In addition, through an arrangement with the money market fund's custodian and transfer agent, $108,160 of credits realized as a result of uninvested cash balances were used to reduce the fund's management fee.
7. Other.
The funds' organizational documents provide former and current trustees and officers with a limited indemnification against liabilities arising in connection with the performance of their duties to the funds. In the normal course of business, the funds may also enter into contracts that provide general indemnifications. The funds' maximum exposure under these arrangements is unknown as this would be dependent on future claims that may be made against the funds. The risk of material loss from such claims is considered remote.
Semiannual Report
Board Approval of Investment Advisory Contracts and Management Fees
Spartan Pennsylvania Municipal Income Fund / Fidelity Pennsylvania Municipal Money Market Fund
Each year, typically in June, the Board of Trustees, including the independent Trustees (together, the Board), votes on the renewal of the management contract and sub-advisory agreements (together, the Advisory Contracts) for each fund. The Board, assisted by the advice of fund counsel and independent Trustees' counsel, requests and considers a broad range of information throughout the year.
The Board meets regularly each month except August and takes into account throughout the year matters bearing on Advisory Contracts. The Board, acting directly and through its separate committees, considers at each of its meetings factors that are relevant to the annual renewal of each fund's Advisory Contracts, including the services and support provided to each fund and its shareholders by Fidelity. At the time of the renewal, the Board had 11 standing committees, each composed of independent Trustees with varying backgrounds, to which the Board has assigned specific subject matter responsibilities in order to enhance effective decision-making by the Board. Each committee has adopted a written charter outlining the structure and purposes of the committee. One such committee, the Fixed-Income Contract Committee, meets periodically during the first six months of each year and as necessary to consider matters specifically related to the annual renewal of Advisory Contracts. The committee requests and receives information on, and makes recommendations to the independent Trustees concerning, the approval and annual review of the Advisory Contracts.
At its June 2005 meeting, the Board of Trustees, including the independent Trustees, unanimously determined to renew the Advisory Contracts for each fund. In reaching its determination, the Board considered all factors it believed relevant, including (1) the nature, extent, and quality of the services to be provided to each fund and its shareholders by Fidelity (including the investment performance of each fund); (2) the competitiveness of the management fee and total expenses of each fund; (3) the total costs of the services to be provided by and the profits to be realized by the investment adviser and its affiliates from the relationship with each fund; (4) the extent to which economies of scale would be realized as each fund grows; and (5) whether fee levels reflect these economies of scale, if any, for the benefit of fund shareholders.
In determining whether to renew the Advisory Contracts for each fund, the Board ultimately reached a determination, with the assistance of fund counsel and independent Trustees' counsel, that the renewal of the Advisory Contracts and the compensation to be received by Fidelity under the management contracts is consistent with Fidelity's fiduciary duty under applicable law. In addition to evaluating the specific factors noted above, the Board, in reaching its determination, is aware that shareholders in each fund have a broad range of investment choices available to them, including a wide choice
Semiannual Report
Board Approval of Investment Advisory Contracts and
Management Fees - continued
among mutual funds offered by competitors to Fidelity, and that each fund's shareholders, with the opportunity to review and weigh the disclosure provided by the fund in its prospectus and other public disclosures, have chosen to invest in that fund, managed by Fidelity.
Nature, Extent, and Quality of Services Provided by Fidelity. The Board considered staffing within the investment adviser, FMR, and the sub-advisers (together, the Investment Advisers), including the backgrounds of the funds' portfolio managers and the funds' investment objectives and disciplines. The independent Trustees also had discussions with senior management of Fidelity's investment operations and investment groups. The Board considered the structure of the portfolio manager compensation program and whether this structure provides appropriate incentives.
Fidelity Resources Dedicated to Investment Management and Support Services. The Board reviewed the size, education, and experience of the Investment Advisers' investment staff, their use of technology, and the Investment Advisers' approach to recruiting, training, and retaining portfolio managers and other research, advisory, and management personnel. The Board considered Fidelity's extensive global research capabilities that enable the Investment Advisers to aggregate data from various sources in an effort to produce positive investment results. The Board noted that Fidelity's analysts have access to a variety of technological tools that enable them to perform both fundamental and quantitative analysis and to specialize in various disciplines. The Board also considered that Fidelity's portfolio managers and analysts have access to daily portfolio attribution that allows for monitoring of a fund's portfolio, as well as an electronic communication system that provides immediate real-time access to research concerning issuers and credit enhancers.
Shareholder and Administrative Services. The Board considered the nature, extent, quality, and cost of administrative, distribution, and shareholder services performed by the Investment Advisers and their affiliates under the Advisory Contracts and under separate agreements covering transfer agency and pricing and bookkeeping services for each fund. The Board also considered the nature and extent of the Investment Advisers' supervision of third party service providers, principally custodians and subcustodians. The Board reviewed the allocation of fund brokerage, including allocations to brokers affiliated with the Investment Advisers. The Board also considered the resources devoted to, and the record of compliance with, each fund's compliance policies and procedures.
The Board noted that the growth of fund assets across the complex allows Fidelity to reinvest in the development of services designed to enhance the value or convenience of the Fidelity funds as investment vehicles. These services include 24-hour access to account information and market information through phone representatives and over the Internet, and investor education materials and asset allocation tools.
Semiannual Report
Investment in a Large Fund Family. The Board considered the benefits to shareholders of investing in a Fidelity fund, including the benefits of investing in a fund that is part of a large family of funds offering a variety of investment disciplines and providing for a large variety of mutual fund investor services. For example, fund shareholders are offered the privilege of exchanging shares of a fund for shares of other Fidelity funds, as set forth in the fund's prospectus, without paying a sales charge. The Board noted that, since the last Advisory Contract renewals in June 2004, Fidelity has taken a number of actions that benefited particular funds, including (i) voluntarily deciding in 2004 to stop using "soft" commission dollars to pay for market data and, instead, to pay for that data out of its own resources, (ii) contractually agreeing to impose management fee reductions and expense limitations on its five Spartan stock index funds and its stock index fund available through variable insurance products, (iii) contractually agreeing to eliminate the management fees on the Fidelity Freedom Funds and the Fidelity Advisor Freedom Funds, (iv) contractually agreeing to reduce the management fees on most of its investment-grade taxable bond funds, and (v) contractually agreeing to impose expense limitations on its retail and Spartan investment-grade taxable bond funds.
Investment Performance. The Board considered whether each fund has operated within its investment objective, as well as its record of compliance with its investment restrictions. It also reviewed each fund's absolute investment performance, as well as each fund's relative investment performance measured against (i) a broad-based securities market index (bond fund only , as money market funds are typically not compared against a market index), and (ii) a peer group of mutual funds deemed appropriate by the Board over multiple periods. For each fund, the following charts considered by the Board show, over the one-, three-, and five-year periods ended December 31, 2004, the fund's returns, the returns of a broad-based securities market index ("benchmark") (bond fund only), and a range of returns of a peer group of mutual funds identified by Lipper Inc. as having an investment objective similar to that of the fund. The box within each chart shows the 25th percentile return (bottom of box) and the 75th percentile return (top of box) of the Lipper peer group. The percentage beaten number noted below each chart corresponds to the percentile box and represents the percentage of funds in the Lipper peer group whose performance was equal to or lower than that of the fund.
Semiannual Report
Board Approval of Investment Advisory Contracts and
Management Fees - continued
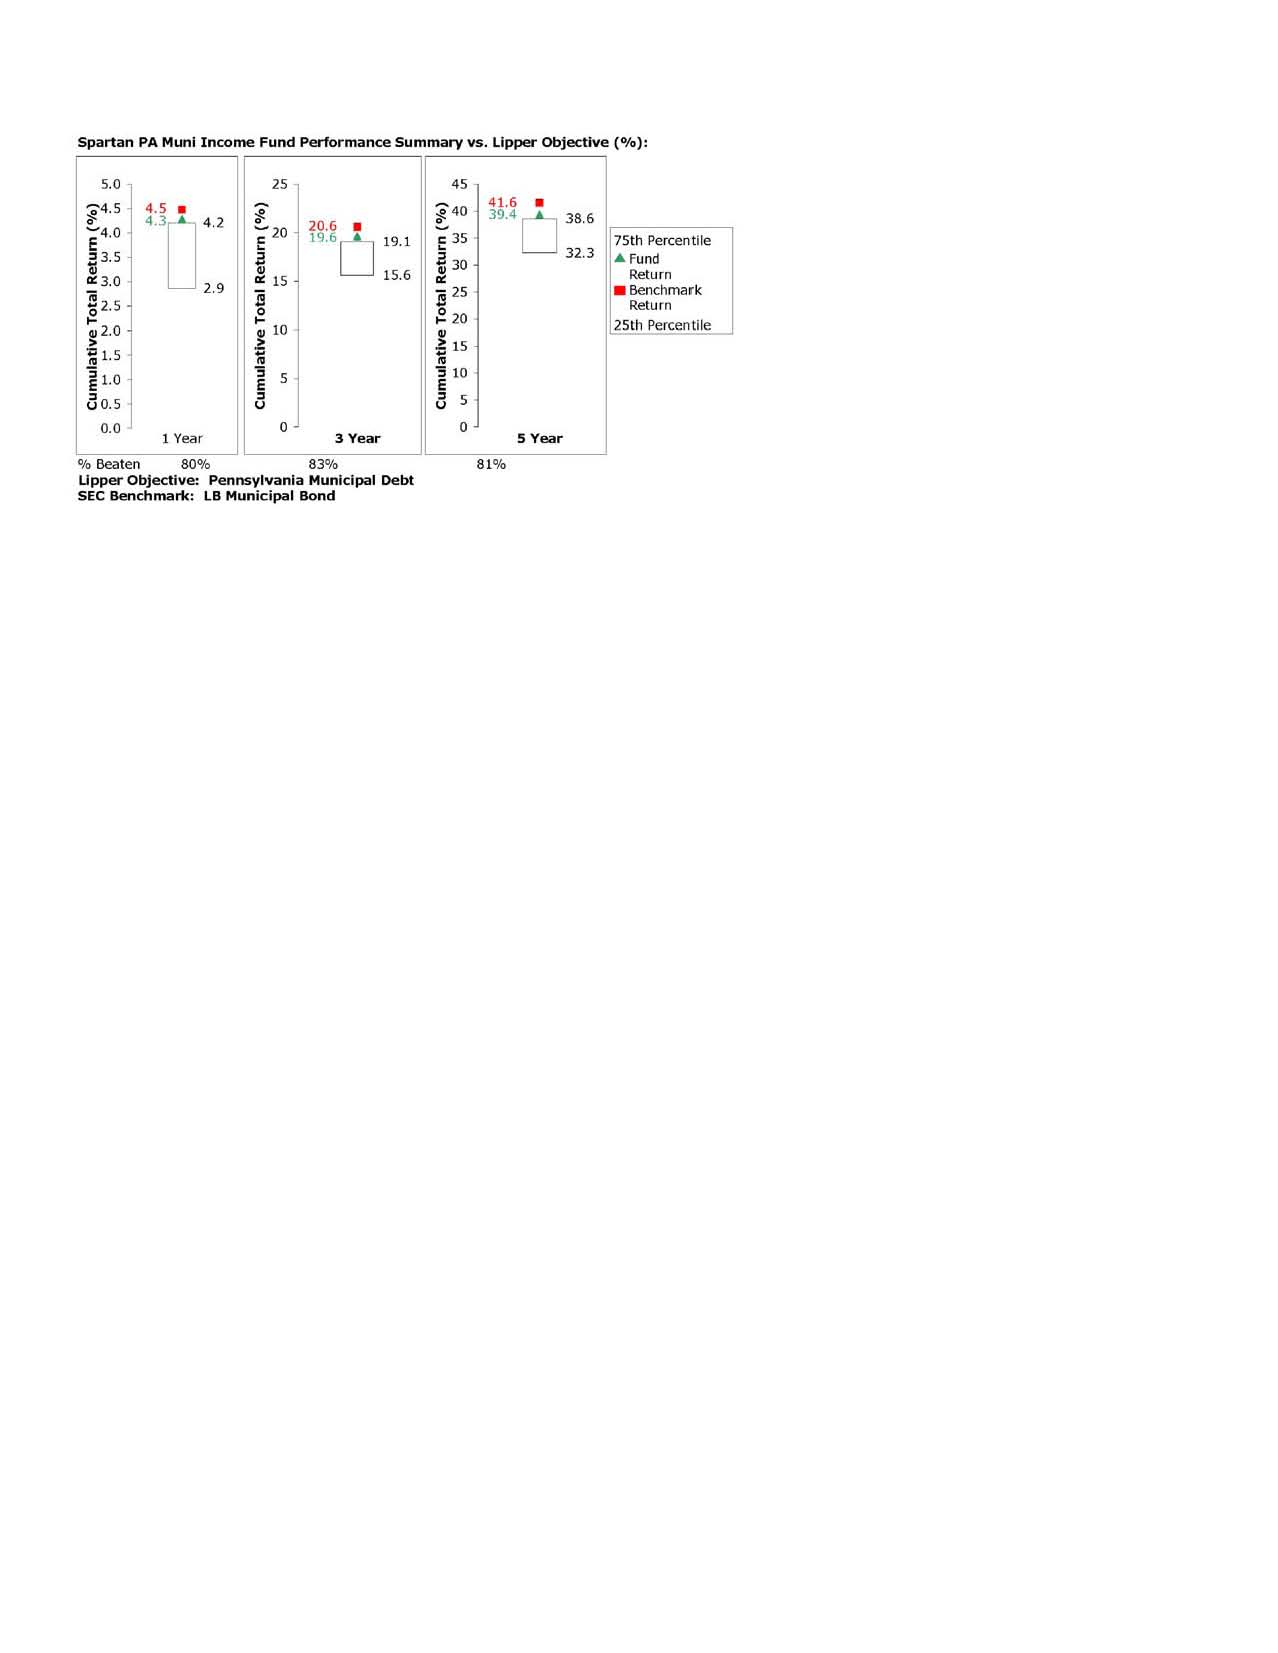
The Board noted that the relative investment performance of the fund has compared favorably to its Lipper peer group over time. The Board also noted that the relative investment performance of the fund was lower than its benchmark over time.
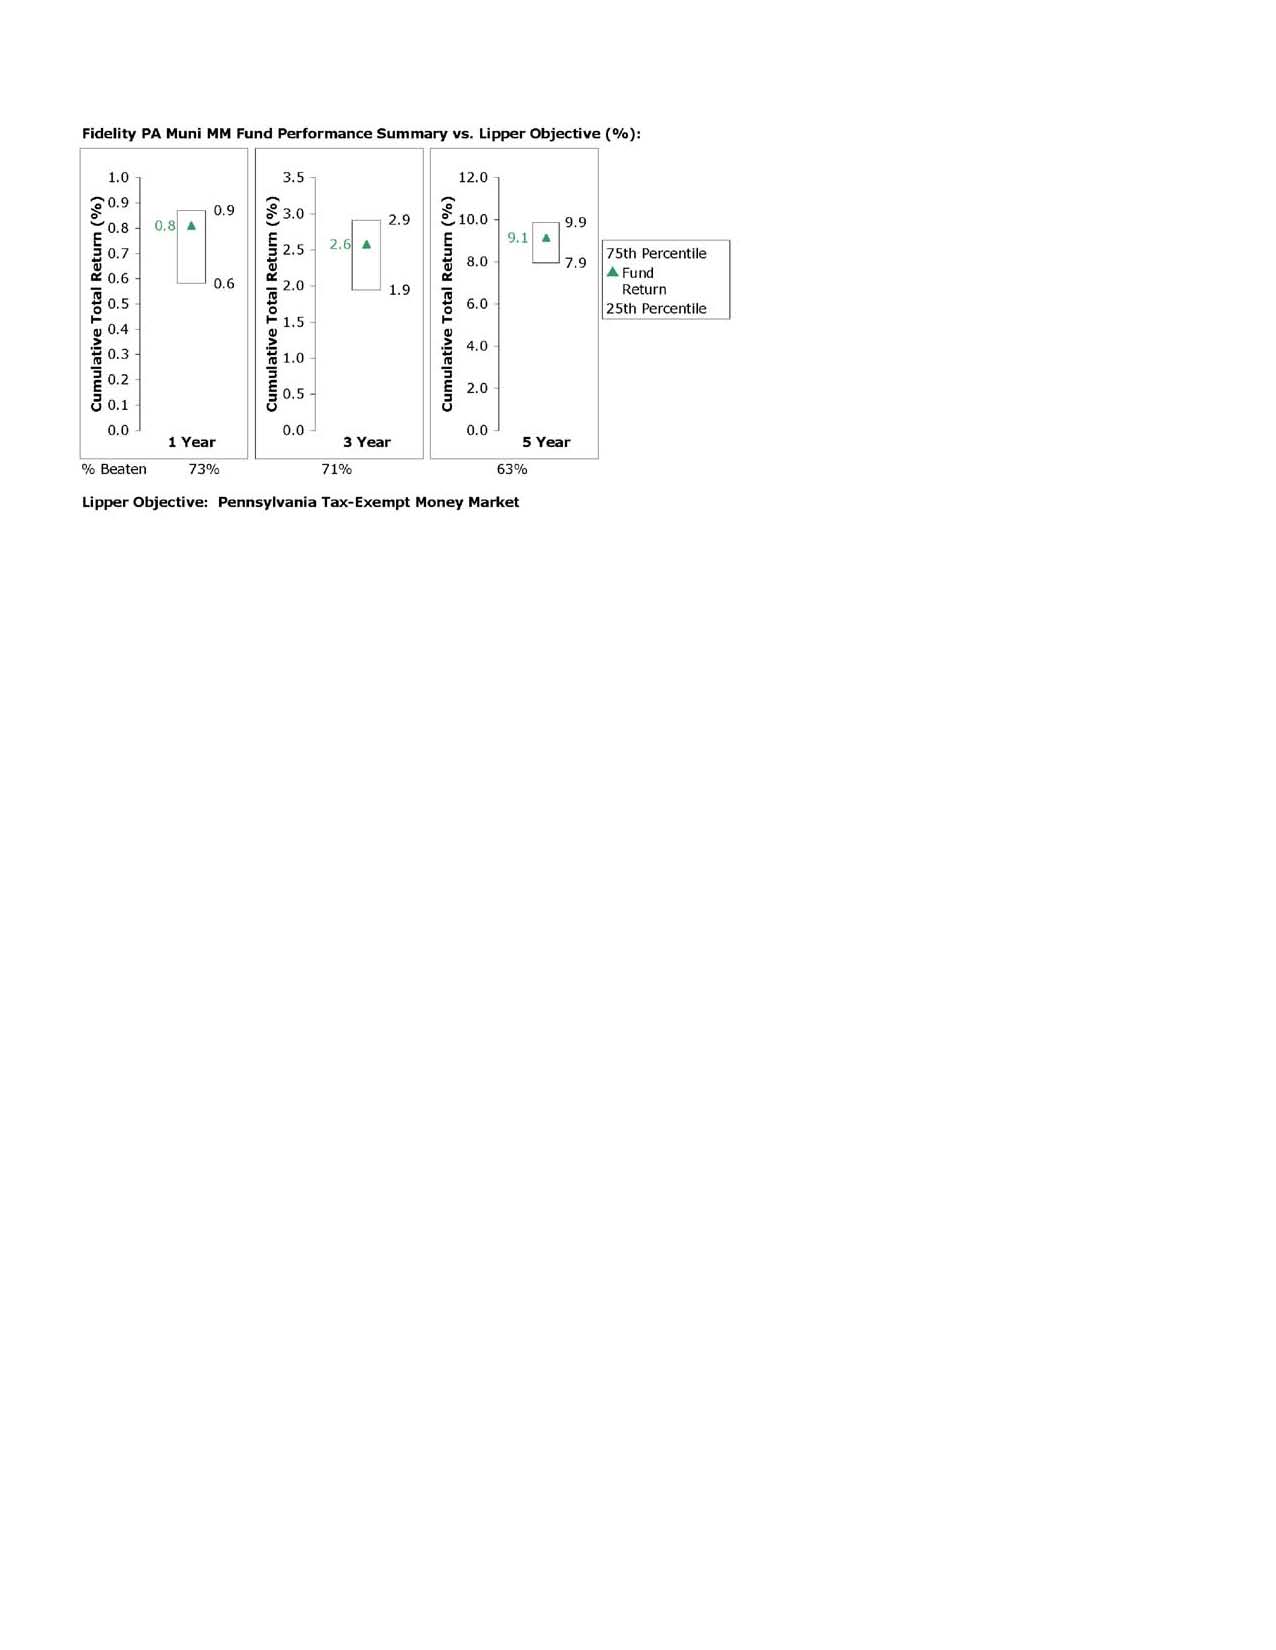
The Board noted that the relative investment performance of the fund has compared favorably to its Lipper peer group over time.
Based on its review, and giving particular weight to the nature and quality of the resources dedicated by the Investment Advisers to maintain and improve relative performance, the Board concluded that the nature, extent, and quality of the services provided by Fidelity will benefit each fund's shareholders, particularly in light of the Board's view that each fund's shareholders benefit from investing in a fund that is part of a large family of funds offering a variety of investment disciplines and services.
Semiannual Report
Competitiveness of Management Fee and Total Fund Expenses. The Board considered each fund's management fee and total expenses compared to "mapped groups" of competitive funds and classes. Fidelity creates "mapped groups" by combining similar Lipper investment objective categories that have comparable management fee characteristics. Combining Lipper investment objective categories aids the Board's management fee and total expense comparisons by broadening the competitive group used for comparison and by reducing the number of universes to which various Fidelity funds are compared.
The Board considered two proprietary management fee comparisons for the 12-month periods shown in the charts below. The group of Lipper funds used by the Board for management fee comparisons is referred to below as the "Total Mapped Group" and, for the reasons explained above, is broader than the Lipper peer group used by the Board for performance comparisons. The Total Mapped Group comparison focuses on a fund's standing relative to the total universe of comparable funds available to investors, in terms of gross management fees before expense reimbursements or caps. "TMG %" represents the percentage of funds in the Total Mapped Group that had management fees that were lower than a fund's. For example, a TMG % of 19% would mean that 81% of the funds in the Total Mapped Group had higher management fees than a fund. The "Asset-Size Peer Group" (ASPG) comparison focuses on a fund's standing relative to non-Fidelity funds similar in size to the fund within the Total Mapped Group. The ASPG represents at least 15% of the funds in the Total Mapped Group with comparable asset size and management fee characteristics, subject to a minimum of 50 funds (or all funds in the Total Mapped Group if fewer than 50). Additional information, such as the ASPG quartile ("quadrant") in which a fund's management fee ranked, is also included in the charts and considered by the Board. For a more meaningful comparison of management fees, Fidelity Pennsylvania Municipal Money Market Fund is compared on the basis of a hypothetical "net management fee," which is derived by subtracting payments made by FMR for non-management expenses (including transfer agent fees, pricing and bookkeeping fees, and custody fees) from the fund's all-inclusive fee. In this regard, the Board realizes that net management fees can vary from year to year because of differences in non-management expenses.
Semiannual Report
Board Approval of Investment Advisory Contracts and
Management Fees - continued
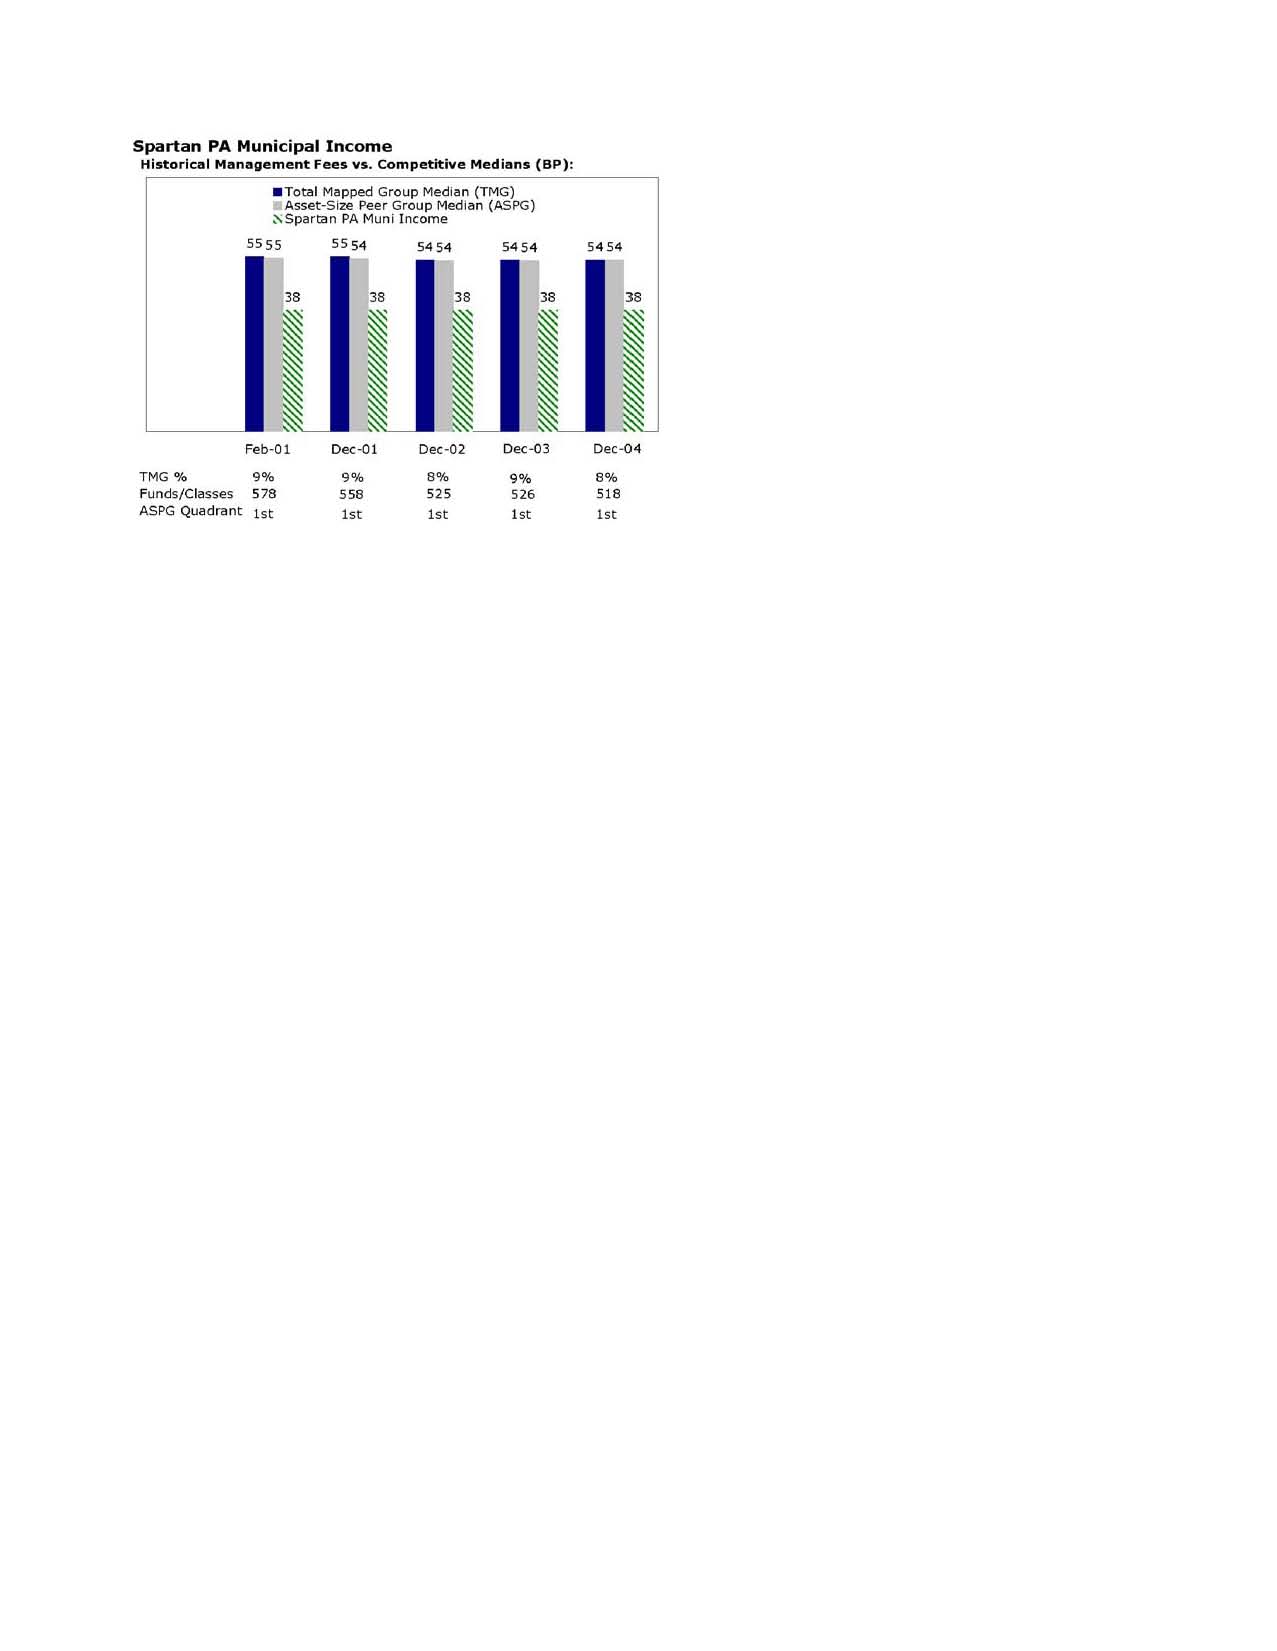

The Board noted that each fund's management fee ranked below the median of its Total Mapped Group and below the median of its ASPG for 2004. Based on its review, the Board concluded that each fund's management fee was fair and reasonable in light of the services that the fund receives and the other factors considered.
In its review of Spartan Pennsylvania Municipal Income Fund's total expenses, the Board considered the fund's management fee as well as other fund expenses, such as transfer agent fees, pricing and bookkeeping fees, and custodial, legal, and audit fees. The Board also noted the effects of any waivers and reimbursements on fees and expenses.
Semiannual Report
In its review of Fidelity Pennsylvania Municipal Money Market Fund's total expenses, the Board considered the fund's hypothetical net management fee as well as the fund's all-inclusive fee. The Board also considered other expenses, such as transfer agent fees, pricing and bookkeeping fees, and custodial, legal, and audit fees, paid by FMR under the all-inclusive arrangement. The Board also noted the effects of any waivers and reimbursements on fees and expenses.
As part of its review, the Board also considered current and historical total expenses of each fund compared to competitive fund median expenses. Each fund is compared to those funds and classes in the Total Mapped Group (used by the Board for management fee comparisons) that have a similar sales load structure.
The Board noted that each fund's total expenses ranked below its competitive median for 2004.
In its review of total expenses, the Board also considered Fidelity fee structures and other information on clients that FMR and its affiliates service in other competitive markets, such as other mutual funds advised or subadvised by FMR or its affiliates, pension plan clients, and other institutional clients.
Based on its review, the Board concluded that each fund's total expenses were reasonable in light of the services that the fund and its shareholders receive and the other factors considered.
Costs of the Services and Profitability. The Board considered the revenues earned and the expenses incurred by Fidelity in conducting the business of developing, marketing, distributing, managing, administering and servicing each fund and its shareholders. The Board also considered the level of Fidelity's profits in respect of all the Fidelity funds.
On an annual basis, FMR presents to the Board Fidelity's profitability for each fund. Fidelity calculates the profitability for each fund, as well as aggregate profitability for groups of Fidelity funds and all Fidelity funds, using a series of detailed revenue and cost allocation methodologies which originate with the audited books and records of Fidelity. The Audit Committee of the Board reviews any significant changes from the prior year's methodologies.
PricewaterhouseCoopers LLP (PwC), independent registered accounting firm and auditor to Fidelity and certain Fidelity funds, has been engaged annually by the Board as part of the Board's assessment of the results of Fidelity's profitability analysis. PwC's engagement includes the review and assessment of Fidelity's methodologies used in determining the revenues and expenses attributable to Fidelity's mutual fund business, and completion of agreed-upon procedures surrounding the mathematical accuracy of fund profitability and its conformity to allocation methodologies. After considering PwC's reports issued under the engagement and information provided by Fidelity, the Board believes that while other allocation methods may also be reasonable, Fidelity's profitability methodologies are reasonable in all material respects.
Semiannual Report
Board Approval of Investment Advisory Contracts and
Management Fees - continued
The Board has also reviewed Fidelity's non-fund businesses and any fall-out benefits related to the mutual fund business as well as cases where Fidelity's affiliates may benefit from or be related to the funds' business. In addition, a special committee of the Board reviewed services provided to Fidelity by its affiliates and determined that the fees that Fidelity paid for such services were reasonable.
The Board considered the costs of the services provided by and the profits realized by Fidelity in connection with the operation of each fund and determined that the amount of profit is a fair entrepreneurial profit for the management of each fund.
Economies of Scale. The Board considered whether there have been economies of scale in respect of the management of the Fidelity funds, whether the Fidelity funds (including each fund) have appropriately benefited from any such economies of scale, and whether there is potential for realization of any further economies of scale. The Board considered the extent to which each fund will benefit from economies of scale through increased services to the fund, through waivers or reimbursements, or through fee or expense reductions, including (Spartan Pennsylvania Municipal Income Fund only) reductions that occur through operation of the transfer agent agreement. The transfer agent fee varies in part based on the number of accounts in the fund. If the number of accounts decreases or the average account size increases, the overall transfer agent fee rate decreases.
The Board recognized that Spartan Pennsylvania Municipal Income Fund's management contract incorporates a "group fee" structure, which provides for lower fee rates as total fund assets under FMR's management increase, and for higher fee rates as total fund assets under FMR's management decrease. The Board considered that the group fee is designed to deliver the benefits of economies of scale to fund shareholders when total fund assets increase, even if assets of any particular fund are unchanged or have declined, because some portion of Fidelity's costs are attributable to services provided to all Fidelity funds, and all funds benefit if those costs can be allocated among more assets. The Board concluded that, given the group fee structure, fund shareholders will achieve a certain level of economies of scale as assets under FMR's management increase at the fund complex level, regardless of whether Fidelity achieves any such economies of scale.
The Board further concluded that any potential economies of scale are being shared between fund shareholders and Fidelity in an appropriate manner.
Additional Information Requested by the Board. In order to develop fully the factual basis for consideration of the Advisory Contracts, the Board requested additional information regarding (i) Fidelity's fund profitability methodology, including additional detail on various cost allocations; (ii) fall-out benefits to Fidelity; and (iii) compensation of portfolio managers and research analysts.
Semiannual Report
Based on its evaluation of all of the conclusions noted above, and after considering all material factors, the Board ultimately concluded that the existing advisory fee structures are fair and reasonable, and that each fund's existing Advisory Contracts should be renewed.
Semiannual Report
Investment Adviser
Fidelity Management & Research Company
Boston, MA
Sub-Adviser
Fidelity Investments Money
Management, Inc.
Fidelity International Investment
Advisors
Fidelity International Investment
Advisors (U.K.) Limited
General Distributor
Fidelity Distributors Corporation
Boston, MA
Transfer and Shareholder
Servicing Agents
Citibank, N.A.
New York, NY
Fidelity Service Company, Inc.
Boston, MA
Custodian
Citibank, N.A.
New York, NY
The Fidelity Telephone Connection
Mutual Fund 24-Hour Service
Exchanges/Redemptions
and Account Assistance 1-800-544-6666
Product Information 1-800-544-6666
Retirement Accounts 1-800-544-4774 (8 a.m. - 9 p.m.)
TDD Service 1-800-544-0118
for the deaf and hearing impaired
(9 a.m. - 9 p.m. Eastern time)
Fidelity Automated Service
Telephone (FAST®) (automated graphic) 1-800-544-5555
(automated graphic) Automated line for quickest service
PFR-USAN-0805
1.787788.102
(Fidelity Investment logo)(registered trademark)
Corporate Headquarters
82 Devonshire St., Boston, MA 02109
www.fidelity.com
Spartan®
Short-Intermediate
Municipal Income
Fund
Semiannual Report
June 30, 2005
(2_fidelity_logos) (Registered_Trademark)
Contents
Chairman's Message | <Click Here> | Ned Johnson's message to shareholders. |
Shareholder Expense Example | <Click Here> | An example of shareholder expenses. |
Investment Changes | <Click Here> | A summary of major shifts in the fund's investments over the past six months. |
Investments | <Click Here> | A complete list of the fund's investments with their market values. |
Financial Statements | <Click Here> | Statements of assets and liabilities, operations, and changes in net assets,
as well as financial highlights. |
Notes | <Click Here> | Notes to the financial statements. |
Board Approval of Investment Advisory Contracts and Management Fees | <Click Here> | |
To view a fund's proxy voting guidelines and proxy voting record for the 12-month period ended June 30, visit www.fidelity.com/proxyvotingresults or visit the Securities and Exchange Commission's (SEC) web site at www.sec.gov. You may also call 1-800-544-8544 to request a free copy of the proxy voting guidelines.
Standard & Poor's, S&P and S&P 500 are registered service marks of The McGraw-Hill Companies, Inc. and have been licensed for use by Fidelity Distributors Corporation.
Other third party marks appearing herein are the property of their respective owners.
All other marks appearing herein are registered or unregistered trademarks or service marks of FMR Corp. or an affiliated company.
This report and the financial statements contained herein are submitted for the general information of the shareholders of the funds. This report is not authorized for distribution to prospective investors in the funds unless preceded or accompanied by an effective prospectus.
A fund files its complete schedule of portfolio holdings with the SEC for the first and third quarters of each fiscal year on Form N-Q. Forms N-Q are available on the SEC's web site at http://www.sec.gov. A fund's Forms N-Q may be reviewed and copied at the SEC's Public Reference Room in Washington, DC. Information regarding the operation of the SEC's Public Reference Room may be obtained by calling 1-800-SEC-0330. For a complete list of a fund's portfolio holdings, view the most recent quarterly holdings report, semiannual report, or annual report on Fidelity's web site at http://www.fidelity.com/holdings.
NOT FDIC INSURED · MAY LOSE VALUE · NO BANK GUARANTEE
Neither the funds nor Fidelity Distributors Corporation is a bank.
Semiannual Report
Chairman's Message
(photo_of_Edward_C_Johnson_3d)
Dear Shareholder:
During the past year or so, much has been reported about the mutual fund industry, and much of it has been more critical than I believe is warranted. Allegations that some companies have been less than forthright with their shareholders have cast a shadow on the entire industry. I continue to find these reports disturbing, and assert that they do not create an accurate picture of the industry overall. Therefore, I would like to remind everyone where Fidelity stands on these issues. I will say two things specifically regarding allegations that some mutual fund companies were in violation of the Securities and Exchange Commission's forward pricing rules or were involved in so-called "market timing" activities.
First, Fidelity has no agreements that permit customers who buy fund shares after 4 p.m. to obtain the 4 p.m. price. This is not a new policy. This is not to say that someone could not deceive the company through fraudulent acts. However, we are extremely diligent in preventing fraud from occurring in this manner - and in every other. But I underscore again that Fidelity has no so-called "agreements" that sanction illegal practices.
Second, Fidelity continues to stand on record, as we have for years, in opposition to predatory short-term trading that adversely affects shareholders in a mutual fund. Back in the 1980s, we initiated a fee - which is returned to the fund and, therefore, to investors - to discourage this activity. Further, we took the lead several years ago in developing a Fair Value Pricing Policy to prevent market timing on foreign securities in our funds. I am confident we will find other ways to make it more difficult for predatory traders to operate. However, this will only be achieved through close cooperation among regulators, legislators and the industry.
Yes, there have been unfortunate instances of unethical and illegal activity within the mutual fund industry from time to time. That is true of any industry. When this occurs, confessed or convicted offenders should be dealt with appropriately. But we are still concerned about the risk of over-regulation and the quick application of simplistic solutions to intricate problems. Every system can be improved, and we support and applaud well thought out improvements by regulators, legislators and industry representatives that achieve the common goal of building and protecting the value of investors' holdings.
For nearly 60 years, Fidelity has worked very hard to improve its products and service to justify your trust. When our family founded this company in 1946, we had only a few hundred customers. Today, we serve more than 18 million customers including individual investors and participants in retirement plans across America.
Let me close by saying that we do not take your trust in us for granted, and we realize that we must always work to improve all aspects of our service to you. In turn, we urge you to continue your active participation with your financial matters, so that your interests can be well served.
Best regards,
/s/Edward C. Johnson 3d
Edward C. Johnson 3d
Semiannual Report
Shareholder Expense Example
As a shareholder of the Fund, you incur two types of costs: (1) transaction costs, including sales charges (loads) on purchase payments or redemption proceeds, redemption fees, and (2) ongoing costs, including management fees, distribution and/or service (12b-1) fees and other Fund expenses. This Example is intended to help you understand your ongoing costs (in dollars) of investing in the Fund and to compare these costs with the ongoing costs of investing in other mutual funds.
The Example is based on an investment of $1,000 invested at the beginning of the period and held for the entire period (January 1, 2005 to June 30, 2005).
Actual Expenses
The first line of the table below for each class of the Fund provides information about actual account values and actual expenses. You may use the information in this line, together with the amount you invested, to estimate the expenses that you paid over the period. Simply divide your account value by $1,000.00 (for example, an $8,600 account value divided by $1,000.00 = 8.6), then multiply the result by the number in the first line for a class of the Fund under the heading entitled "Expenses Paid During Period" to estimate the expenses you paid on your account during this period.
Hypothetical Example for Comparison Purposes
The second line of the table below for each class of the Fund provides information about hypothetical account values and hypothetical expenses based on a Class' actual expense ratio and an assumed rate of return of 5% per year before expenses, which is not the Class' actual return. The hypothetical account values and expenses may not be used to estimate the actual ending account balance or expenses you paid for the period. You may use this information to compare the ongoing costs of investing in the Fund and other funds. To do so, compare this 5% hypothetical example with the 5% hypothetical examples that appear in the shareholder reports of the other funds.
Please note that the expenses shown in the table are meant to highlight your ongoing costs only and do not reflect any transaction costs. Therefore, the second line of the table is useful in comparing ongoing costs only, and will not help you determine the relative total costs of owning different funds. In addition, if these transactional costs were included, your costs would have been higher.
| Beginning
Account Value
January 1, 2005 | Ending
Account Value
June 30, 2005 | Expenses Paid
During Period*
January 1, 2005
to June 30, 2005 |
Class A | | | |
Actual | $ 1,000.00 | $ 1,005.30 | $ 3.28 |
HypotheticalA | $ 1,000.00 | $ 1,021.52 | $ 3.31 |
Class T | | | |
Actual | $ 1,000.00 | $ 1,005.70 | $ 3.83 |
HypotheticalA | $ 1,000.00 | $ 1,020.98 | $ 3.86 |
Class B | | | |
Actual | $ 1,000.00 | $ 1,001.50 | $ 7.05 |
HypotheticalA | $ 1,000.00 | $ 1,017.75 | $ 7.10 |
| Beginning
Account Value
January 1, 2005 | Ending
Account Value
June 30, 2005 | Expenses Paid
During Period*
January 1, 2005
to June 30, 2005 |
Class C | | | |
Actual | $ 1,000.00 | $ 1,001.00 | $ 7.59 |
HypotheticalA | $ 1,000.00 | $ 1,017.21 | $ 7.65 |
Spartan Short-Intermediate Municipal Income | | | |
Actual | $ 1,000.00 | $ 1,006.10 | $ 2.44 |
HypotheticalA | $ 1,000.00 | $ 1,022.36 | $ 2.46 |
Institutional Class | | | |
Actual | $ 1,000.00 | $ 1,006.10 | $ 2.44 |
HypotheticalA | $ 1,000.00 | $ 1,022.36 | $ 2.46 |
A 5% return per year before expenses
* Expenses are equal to each Class' annualized expense ratio (shown in the table below); multiplied by the average account value over the period, multiplied by 181/365 (to reflect the one-half year period).
| Annualized
Expense Ratio |
Class A | .66% |
Class T | .77% |
Class B | 1.42% |
Class C | 1.53% |
Spartan Short-Intermediate Municipal Income | .49% |
Institutional Class | .49% |
Semiannual Report
Investment Changes
Top Five States as of June 30, 2005 |
| % of fund's
net assets | % of fund's net assets
6 months ago |
Texas | 14.4 | 13.6 |
Illinois | 9.3 | 9.7 |
New York | 8.5 | 6.9 |
California | 8.1 | 8.2 |
Washington | 5.2 | 6.3 |
Top Five Sectors as of June 30, 2005 |
| % of fund's
net assets | % of fund's net assets
6 months ago |
General Obligations | 45.1 | 47.3 |
Electric Utilities | 14.0 | 14.3 |
Escrowed/Pre-Refunded | 8.1 | 9.5 |
Transportation | 6.6 | 7.1 |
Health Care | 5.9 | 5.9 |
Average Years to Maturity as of June 30, 2005 |
| | 6 months ago |
Years | 3.4 | 3.3 |
Average years to maturity is based on the average time remaining to the stated maturity date of each bond, weighted by the market value of each bond. |
Duration as of June 30, 2005 |
| | 6 months ago |
Years | 2.9 | 3.0 |
Duration shows how much a bond fund's price fluctuates with changes in comparable interest rates. If rates rise 1%, for example, a fund with a five-year duration is likely to lose about 5% of its value. Other factors also can influence a bond fund's performance and share price. Accordingly, a bond fund's actual performance may differ from this example. |
Quality Diversification (% of fund's net assets) |
As of June 30, 2005 | As of December 31, 2004 |
 | AAA 60.2% | | | AAA 61.3% | |
 | AA,A 28.4% | | | AA,A 32.9% | |
 | BBB 5.9% | | | BBB 5.8% | |
 | Not Rated 1.5% | | | Not Rated 1.9% | |
 | Short-Term
Investments and
Net Other Assets 4.0% | |  | Short-Term
Investments and
Net Other Assets* (1.9)% | |

We have used ratings from Moody's® Investors Services, Inc. Where Moody's ratings are not available, we have used S&P® ratings. |
* Short-Term Investments and Net Other Assets are not included in the pie chart. |
Semiannual Report
Investments June 30, 2005 (Unaudited)
Showing Percentage of Net Assets
Municipal Bonds - 96.0% |
| Principal
Amount (000s) | | Value (Note 1)
(000s) |
Alabama - 2.3% |
Alabama Agric. & Mechanical Univ. Revs. 6.5% 11/1/25 (Pre-Refunded to 11/1/05 @ 102) (d) | | $ 2,000 | | $ 2,065 |
Huntsville Solid Waste Disp. Auth. & Resource Recovery Rev.: | | | | |
5.25% 10/1/07 (MBIA Insured) (c) | | 1,750 | | 1,813 |
5.25% 10/1/08 (MBIA Insured) (c) | | 2,900 | | 3,047 |
5.75% 10/1/09 (MBIA Insured) (c) | | 4,000 | | 4,320 |
Jefferson County Ltd. Oblig. School Warrants Series A, 5% 1/1/07 | | 2,210 | | 2,277 |
Jefferson County Swr. Rev.: | | | | |
Series 1999 A, 5.75% 2/1/38 (Pre-Refunded to 2/1/09 @ 101) (d) | | 5,000 | | 5,525 |
Series A: | | | | |
5% 2/1/33 (Pre-Refunded to 2/1/09 @ 101) (d) | | 13,460 | | 14,462 |
5.5% 2/1/40 (Pre-Refunded to 2/1/11 @ 101) (d) | | 3,900 | | 4,402 |
5% 2/1/41 (Pre-Refunded to 8/1/12 @ 100) (d) | | 2,035 | | 2,235 |
Mobile County Gen. Oblig.: | | | | |
5% 2/1/07 (MBIA Insured) | | 1,000 | | 1,034 |
5% 2/1/08 (MBIA Insured) | | 1,475 | | 1,550 |
| | 42,730 |
Alaska - 1.6% |
Alaska Student Ln. Corp. Student Ln. Rev. Series A: | | | | |
5.15% 7/1/05 (AMBAC Insured) (c) | | 1,950 | | 1,950 |
5.85% 7/1/13 (AMBAC Insured) (c) | | 3,285 | | 3,623 |
Anchorage Gen. Oblig. Series B, 5.75% 12/1/11
(Pre-Refunded to 12/1/10 @ 100) (d) | | 2,500 | | 2,832 |
North Slope Borough Gen. Oblig.: | | | | |
Series 1996 B, 0% 6/30/07 (MBIA Insured) | | 3,100 | | 2,921 |
Series A, 0% 6/30/07 (MBIA Insured) | | 5,000 | | 4,711 |
Series B: | | | | |
0% 6/30/06 (MBIA Insured) | | 3,500 | | 3,404 |
0% 6/30/07 (MBIA Insured) | | 7,050 | | 6,642 |
0% 6/30/08 (MBIA Insured) | | 4,240 | | 3,857 |
| | 29,940 |
Arizona - 1.0% |
Arizona School Facilities Board Ctfs. of Prtn. Series C, 5% 9/1/09 (FSA Insured) | | 1,115 | | 1,196 |
Maricopa County Unified School District #48 Scottsdale 7.4% 7/1/10 | | 3,750 | | 4,476 |
Pima County Unified School District #1 Tucson 7.5% 7/1/08 (FGIC Insured) | | 7,060 | | 7,952 |
Municipal Bonds - continued |
| Principal
Amount (000s) | | Value (Note 1)
(000s) |
Arizona - continued |
Tucson Wtr. Rev.: | | | | |
Series 2002, 5.5% 7/1/06 (FGIC Insured) | | $ 980 | | $ 1,007 |
Series A, 5% 7/1/11 (FGIC Insured) | | 1,500 | | 1,637 |
Univ. of Arizona Ctfs. of Prtn. (Univ. of Arizona Parking & Student Hsg. Proj.) Series A, 5% 6/1/09 (AMBAC Insured) | | 2,000 | | 2,138 |
| | 18,406 |
Arkansas - 0.3% |
Arkansas Dev. Fin. Auth. Wastewtr. Sys. Rev.
Series 2004 A, 4% 6/1/06 (MBIA Insured) | | 1,060 | | 1,073 |
Little Rock Gen. Oblig. 4% 4/1/07 (FSA Insured) | | 1,000 | | 1,021 |
Rogers Sales & Use Tax Rev. Series A: | | | | |
4.25% 9/1/06 (FGIC Insured) | | 1,000 | | 1,017 |
4.25% 9/1/07 (FGIC Insured) | | 2,175 | | 2,238 |
| | 5,349 |
California - 8.1% |
California Dept. of Wtr. Resources Pwr. Supply Rev. Series A: | | | | |
5.25% 5/1/07 (MBIA Insured) | | 27,455 | | 28,719 |
5.25% 5/1/10 (MBIA Insured) | | 1,200 | | 1,316 |
5.25% 5/1/12 (MBIA Insured) | | 6,000 | | 6,690 |
California Econ. Recovery Series A, 5.25% 7/1/13 (MBIA Insured) | | 5,000 | | 5,657 |
California Gen. Oblig.: | | | | |
5% 2/1/09 | | 1,640 | | 1,745 |
5% 2/1/10 | | 2,000 | | 2,151 |
5% 12/1/11 (MBIA Insured) | | 8,000 | | 8,823 |
5.125% 9/1/12 | | 1,000 | | 1,081 |
5.25% 2/1/10 (FSA Insured) | | 7,265 | | 7,948 |
5.25% 2/1/11 | | 5,775 | | 6,334 |
5.5% 3/1/11 (FGIC Insured) | | 3,210 | | 3,596 |
5.5% 3/1/11 (XL Cap. Assurance, Inc. Insured) | | 3,525 | | 3,939 |
5.75% 10/1/08 | | 1,085 | | 1,178 |
6.4% 9/1/08 | | 3,075 | | 3,388 |
6.5% 9/1/10 | | 1,740 | | 2,001 |
8% 11/1/07 (FGIC Insured) | | 7,000 | | 7,451 |
California Poll. Cont. Fing. Auth. Ctfs. of Prtn. (Pacific Gas & Elec. Co. Proj.) Series 2004 B, 3.5%, tender 6/1/07 (FGIC Insured) (b)(c) | | 15,000 | | 15,165 |
Municipal Bonds - continued |
| Principal
Amount (000s) | | Value (Note 1)
(000s) |
California - continued |
California Poll. Cont. Fing. Auth. Solid Waste Disp. Rev. (Waste Mgmt., Inc. Proj.) Series A, 3.125%, tender 5/1/06 (b)(c) | | $ 5,000 | | $ 4,997 |
California Pub. Works Board Lease Rev.: | | | | |
(California State Univ. Proj.) Series 1997 A, 5.5% 10/1/07 | | 1,075 | | 1,135 |
(Coalinga State Hosp. Proj.) Series 2004 A: | | | | |
5% 6/1/07 | | 4,000 | | 4,159 |
5% 6/1/08 | | 6,000 | | 6,326 |
California Statewide Cmntys. Dev. Auth. Rev.: | | | | |
(Kaiser Fund Hosp./Health Place, Inc. Proj.) Series 2002 C, 3.85%, tender 6/1/12 (b) | | 1,400 | | 1,408 |
(Kaiser Permanente Health Sys. Proj.) Series 2004 G, 2.3%, tender 5/1/07 (b) | | 8,000 | | 7,913 |
Commerce Refuse To Energy Auth. Rev.: | | | | |
5% 7/1/07 (MBIA Insured) | | 1,770 | | 1,846 |
5.25% 7/1/08 (MBIA Insured) | | 855 | | 912 |
Golden State Tobacco Securitization Corp. Series 2003 B, 5% 6/1/08 | | 1,300 | | 1,356 |
Long Beach Hbr. Rev. Series 2000 A, 5.5% 5/15/06 (c) | | 3,000 | | 3,060 |
Los Angeles Hbr. Dept. Rev. Series A, 5.5% 8/1/06 (AMBAC Insured) (c) | | 1,495 | | 1,539 |
San Joaquin Hills Trans. Corridor Agcy. Toll Road Rev. Series A, 0% 1/15/12 (MBIA Insured) | | 3,600 | | 2,849 |
Univ. of California Revs. (UCLA Med. Ctr. Proj.) 4.55% 12/1/09 (e) | | 8,955 | | 9,217 |
| | 153,899 |
Colorado - 0.5% |
Arapahoe County Cap. Impt. Trust Fund Hwy. Rev.
Series C, 0% 8/31/08 (Pre-Refunded to 8/31/05 @ 82.9449) (d) | | 4,500 | | 3,718 |
E-470 Pub. Hwy. Auth. Rev. Series 2000 B: | | | | |
0% 9/1/06 (Escrowed to Maturity) (d) | | 2,200 | | 2,128 |
0% 9/1/07 (Escrowed to Maturity) (d) | | 3,200 | | 2,998 |
| | 8,844 |
Connecticut - 0.6% |
Connecticut Gen. Oblig.: | | | | |
Series 2001 D, 5.125% 11/15/18 (Pre-Refunded to 11/15/11 @ 100) (d) | | 5,000 | | 5,504 |
Series 2002 C, 5% 12/15/08 | | 1,930 | | 2,062 |
Municipal Bonds - continued |
| Principal
Amount (000s) | | Value (Note 1)
(000s) |
Connecticut - continued |
Connecticut Health & Edl. Facilities Auth. Rev. (Connecticut Children's Med. Ctr. Proj.) Series B: | | | | |
4% 7/1/07 (MBIA Insured) | | $ 1,275 | | $ 1,305 |
4.5% 7/1/08 (MBIA Insured) | | 1,045 | | 1,093 |
5% 7/1/09 (MBIA Insured) | | 1,000 | | 1,075 |
| | 11,039 |
District Of Columbia - 2.0% |
District of Columbia Ctfs. of Prtn.: | | | | |
(District's Pub. Safety and Emergency Preparedness Communications Ctr. and Related Technology Proj.) Series 2003, 3% 1/1/06 (AMBAC Insured) | | 1,305 | | 1,307 |
5% 1/1/06 (AMBAC Insured) | | 1,000 | | 1,011 |
5% 1/1/07 (AMBAC Insured) | | 1,000 | | 1,032 |
5.25% 1/1/08 (AMBAC Insured) | | 935 | | 984 |
District of Columbia Gen. Oblig.: | | | | |
Series 1993 B2, 5.5% 6/1/07 (FSA Insured) | | 1,830 | | 1,922 |
Series 2001 B, 5.5% 6/1/07 (FSA Insured) | | 1,345 | | 1,412 |
Series A: | | | | |
5% 6/1/06 | | 3,480 | | 3,547 |
5% 6/1/07 | | 2,810 | | 2,917 |
5.25% 6/1/09 (FSA Insured) | | 1,000 | | 1,082 |
Series B, 0% 6/1/12 (MBIA Insured) | | 3,600 | | 2,776 |
District of Columbia Rev. (Medstar Univ. Hosp. Proj.) Series D, 6.875%, tender 2/16/07 (b) | | 9,000 | | 9,593 |
Metropolitan Washington Arpts. Auth. Gen. Arpt. Rev. Series B, 5.5% 10/1/08 (FGIC Insured) (c) | | 6,460 | | 6,848 |
Metropolitan Washington Arpts. Auth. Sys. Rev. Series D: | | | | |
4% 10/1/06 (FSA Insured) (c) | | 1,750 | | 1,774 |
4% 10/1/07 (FSA Insured) (c) | | 1,000 | | 1,020 |
| | 37,225 |
Florida - 4.0% |
Brevard County Util. Rev. 5% 3/1/06 (FGIC Insured) | | 530 | | 538 |
Coral Gables Health Facilities Hosp. (Baptist Health South Florida Obligated Group Proj.) 5% 8/15/06 | | 1,000 | | 1,025 |
Highlands County Health Facilities Auth. Rev. (Adventist Health Sys./Sunbelt Obligated Group Proj.) 3.35%, tender 9/1/05 (b) | | 20,300 | | 20,319 |
Hillsborough County Indl. Dev. Auth. Poll. Cont. Rev. (Tampa Elec. Co. Proj.): | | | | |
4%, tender 8/1/07 (b) | | 11,000 | | 11,131 |
Municipal Bonds - continued |
| Principal
Amount (000s) | | Value (Note 1)
(000s) |
Florida - continued |
Hillsborough County Indl. Dev. Auth. Poll. Cont. Rev. (Tampa Elec. Co. Proj.): - continued | | | | |
4.25%, tender 8/1/07 (b)(c) | | $ 6,000 | | $ 6,071 |
Indian River County School District 4% 4/1/06
(FSA Insured) | | 1,470 | | 1,485 |
Miami-Dade County Cap. Asset Acquisition Fixed
Rate Spl. Oblig. Series 2002 A, 5% 4/1/08
(AMBAC Insured) | | 2,825 | | 2,986 |
Miami-Dade County School Board Ctfs. of Prtn. 5%, tender 5/1/11 (MBIA Insured) (b) | | 1,500 | | 1,614 |
Miami-Dade County School District Series 1994 A, 5.65% 6/1/06 (MBIA Insured) | | 1,545 | | 1,586 |
Orlando Utils. Commission Util. Sys. Rev. 5.25% 7/1/09 | | 6,000 | | 6,506 |
Palm Beach County Rev. (Cmnty. Foundation Palm Beach Proj.) 2%, tender 9/1/05, LOC Northern Trust Co., Chicago (b) | | 4,010 | | 4,006 |
Pasco County Solid Waste Disp. & Resource Recovery Sys. Rev. 5.75% 4/1/06 (AMBAC Insured) (c) | | 1,500 | | 1,530 |
Polk County Cap. Impt. Rev. Series 2004, 5.5%, tender 12/1/10 (FSA Insured) (b) | | 9,000 | | 9,939 |
Seminole County School Board Ctfs. of Prtn. Series A: | | | | |
4.5% 7/1/06 (MBIA Insured) | | 1,150 | | 1,170 |
4.5% 7/1/08 (MBIA Insured) | | 1,250 | | 1,309 |
Univ. Athletic Assoc., Inc. Athletic Prog. Rev. Series 2001, 2.8%, tender 10/1/08, LOC Suntrust Banks of Florida, Inc. (b) | | 2,000 | | 1,974 |
Volusia County School Board Ctfs. of Prtn. (School Board of Volusia County Master Lease Prog.) 4.5% 8/1/07 (FSA Insured) | | 2,135 | | 2,205 |
| | 75,394 |
Georgia - 1.1% |
Atlanta Arpt. Facilities Rev. 6.5% 1/1/06 (Escrowed to Maturity) (d) | | 6,000 | | 6,111 |
Cobb County Dev. Auth. Solid Waste Disp. Rev. (Georgia Waste Mgmt. Proj.) Series A, 3.65%, tender 4/1/06 (b)(c) | | 1,000 | | 1,002 |
Columbia County Gen. Oblig. 5% 1/1/09 (FSA Insured) | | 1,505 | | 1,605 |
Fulton DeKalb Hosp. Auth. Hosp. Rev. 5% 1/1/08
(FSA Insured) | | 2,250 | | 2,356 |
Georgia Gen. Oblig. Series B, 6.25% 4/1/06 | | 1,750 | | 1,797 |
Georgia Muni. Elec. Auth. Pwr. Rev. Series 1992 B, 8.25% 1/1/11 (MBIA Insured) | | 4,105 | | 5,101 |
Municipal Bonds - continued |
| Principal
Amount (000s) | | Value (Note 1)
(000s) |
Georgia - continued |
Gwinnett County Gen. Oblig. 4% 1/1/06 | | $ 1,035 | | $ 1,042 |
Henry County Wtr. & Swr. Auth. Rev. 5% 2/1/08
(MBIA Insured) | | 1,095 | | 1,152 |
| | 20,166 |
Hawaii - 2.1% |
Hawaii Arpts. Sys. Rev. Series 2000 B, 8% 7/1/10 (FGIC Insured) (c) | | 3,850 | | 4,597 |
Hawaii Gen. Oblig. Series CU, 5.75% 10/1/11
(MBIA Insured) | | 3,210 | | 3,604 |
Honolulu City & County Gen. Oblig. Series B, 8% 10/1/09 | | 26,940 | | 32,081 |
| | 40,282 |
Illinois - 9.3% |
Chicago Gen. Oblig.: | | | | |
(Neighborhoods Alive 21 Prog.): | | | | |
5% 1/1/07 (MBIA Insured) | | 1,360 | | 1,405 |
5% 1/1/08 (MBIA Insured) | | 1,190 | | 1,248 |
Series A, 5.25% 1/1/12 (FSA Insured) | | 1,000 | | 1,108 |
5% 1/1/07 (FGIC Insured) | | 1,000 | | 1,033 |
Chicago Midway Arpt. Rev.: | | | | |
Series 2001 B, 5% 1/1/07 (FSA Insured) | | 1,000 | | 1,032 |
Series B: | | | | |
5% 1/1/10 (AMBAC Insured) | | 1,225 | | 1,314 |
5% 1/1/11 (AMBAC Insured) | | 3,625 | | 3,915 |
Chicago O'Hare Int'l. Arpt. Rev.: | | | | |
Series 2001 C, 5% 1/1/07 (AMBAC Insured) (c) | | 2,670 | | 2,748 |
Series A: | | | | |
5% 1/1/12 (MBIA Insured) | | 1,135 | | 1,235 |
5.5% 1/1/08 (AMBAC Insured) | | 5,000 | | 5,163 |
5.5% 1/1/10 (AMBAC Insured) (c) | | 5,000 | | 5,401 |
Chicago Park District: | | | | |
Series B, 5% 1/1/11 (AMBAC Insured) | | 5,750 | | 6,243 |
Series C, 5% 1/1/11 (AMBAC Insured) | | 2,515 | | 2,731 |
Chicago School Fin. Auth. Series B, 5% 6/1/09
(FSA Insured) | | 12,825 | | 13,733 |
Chicago Tax Increment Rev.: | | | | |
Series 2000 A, 0% 12/1/08 (AMBAC Insured) | | 10,000 | | 8,964 |
Series A, 0% 12/1/05 (AMBAC Insured) | | 3,000 | | 2,968 |
Municipal Bonds - continued |
| Principal
Amount (000s) | | Value (Note 1)
(000s) |
Illinois - continued |
Chicago Transit Auth. Cap. Grant Receipts Rev.: | | | | |
(Fed. Transit Administration Section 5307
Formula Funds Proj.) Series A, 5.25% 6/1/10 (AMBAC Insured) | | $ 4,785 | | $ 5,238 |
Series A, 4.25% 6/1/08 (AMBAC Insured) | | 3,600 | | 3,645 |
Chicago Wastewtr. Transmission Rev. 5.5% 1/1/09 (FGIC Insured) | | 2,975 | | 3,213 |
Cook County Cmnty. College District #508 Ctfs. of Prtn. 8.75% 1/1/07 (FGIC Insured) | | 8,000 | | 8,692 |
Du Page Wtr. Commission Wtr. Rev. 5% 5/1/08 (AMBAC Insured) | | 4,525 | | 4,780 |
Granite City Solid Waste Disp. Rev. (Waste Mgmt., Inc. Proj.) 3.85%, tender 5/1/08 (b)(c) | | 2,200 | | 2,197 |
Illinois Dev. Fin. Auth. Gas Supply Rev. (The Peoples Gas Lt. & Coke Co. Proj.) Series 2003 B, 3.05%, tender 2/1/08 (AMBAC Insured) (b) | | 6,100 | | 6,101 |
Illinois Dev. Fin. Auth. Rev. (DePaul Univ. Proj.)
Series 2004 C, 5.5% 10/1/10 | | 1,900 | | 2,076 |
Illinois Edl. Facilities Auth. Revs.: | | | | |
(Art Institute of Chicago Proj.) Series 2003, 3.85%, tender 3/1/11 (b) | | 12,800 | | 12,851 |
(Univ. of Chicago Proj.): | | | | |
Series 2004 B1, 3.45%, tender 7/1/08 (b) | | 6,100 | | 6,160 |
Series A, 5.25% 7/1/41 (Pre-Refunded to 7/1/11 @ 101) (d) | | 2,640 | | 2,958 |
Series B, 3.1%, tender 7/1/07 (b) | | 3,900 | | 3,907 |
Illinois Fin. Auth. Rev. (DePaul Univ. Proj.): | | | | |
5% 10/1/06 | | 1,115 | | 1,140 |
5% 10/1/07 | | 1,225 | | 1,272 |
5% 10/1/08 | | 1,000 | | 1,050 |
Illinois Gen. Oblig.: | | | | |
First Series: | | | | |
5% 8/1/06 | | 8,160 | | 8,358 |
5.25% 4/1/08 (MBIA Insured) | | 1,035 | | 1,100 |
5.25% 4/1/10 (MBIA Insured) | | 2,600 | | 2,846 |
5.5% 8/1/10 | | 1,415 | | 1,568 |
6% 1/1/11 (Pre-Refunded to 1/1/10 @ 100) (d) | | 7,075 | | 7,956 |
Series A, 5% 10/1/09 | | 2,600 | | 2,799 |
5.75% 4/1/12 (Pre-Refunded to 4/1/10 @ 100) (d) | | 1,000 | | 1,120 |
Municipal Bonds - continued |
| Principal
Amount (000s) | | Value (Note 1)
(000s) |
Illinois - continued |
Illinois Health Facilities Auth. Rev. (Condell Med. Ctr. Proj.): | | | | |
5% 5/15/07 | | $ 500 | | $ 511 |
5% 5/15/08 | | 700 | | 717 |
Kane & DeKalb Counties Cmnty. Unit School District #301 0% 12/1/10 (AMBAC Insured) | | 2,000 | | 1,655 |
Kane & DuPage Counties Cmnty. Unit School District #303, Saint Charles Series A, 5.5% 1/1/12
(FSA Insured) | | 2,270 | | 2,548 |
Kane County School District #129, Aurora West Side Series A, 5.75% 2/1/14 (FGIC Insured) | | 1,600 | | 1,817 |
Kane, McHenry, Cook & DeKalb Counties Cmnty. Unit School District #300, Carpentersville 5.5% 12/1/13 (MBIA Insured) | | 5,000 | | 5,590 |
Kendall, Kane & Will Counties Cmnty. Unit School District #308: | | | | |
5.25% 10/1/05 (FGIC Insured) | | 560 | | 564 |
5.25% 10/1/06 (FGIC Insured) | | 695 | | 716 |
Lake County Cmnty. High School District #128, Libertyville Series 2004, 5% 1/1/11 | | 2,365 | | 2,573 |
Rosemont Gen. Oblig. Series 3: | | | | |
0% 12/1/07 (Escrowed to Maturity) (d) | | 2,375 | | 2,216 |
0% 12/1/07 (FGIC Insured) | | 625 | | 581 |
Univ. of Illinois Auxiliary Facilities Sys. Rev.
Series 2001 A, 5% 4/1/08 (AMBAC Insured) | | 2,035 | | 2,143 |
Univ. of Illinois Ctfs. of Prtn. (Util. Infrastructure Projs.) 5% 8/15/11 (AMBAC Insured) | | 1,360 | | 1,481 |
Will County School District #122 Series B, 0% 11/1/08 (FSA Insured) | | 1,500 | | 1,349 |
| | 175,729 |
Indiana - 2.9% |
Carmel High School Bldg. Corp. 5% 1/10/11
(FSA Insured) | | 1,000 | | 1,082 |
Hamilton Southeastern Consolidated School Bldg. Corp.: | | | | |
Series A: | | | | |
5% 1/10/10 (FSA Insured) | | 1,750 | | 1,882 |
5.25% 7/10/11 (FSA Insured) | | 2,295 | | 2,536 |
5.25% 1/10/12 (FSA Insured) | | 1,355 | | 1,499 |
5% 1/15/10 (FSA Insured) | | 1,835 | | 1,978 |
5% 1/15/11 (FSA Insured) | | 1,910 | | 2,077 |
5% 1/15/12 (FSA Insured) | | 1,990 | | 2,180 |
Municipal Bonds - continued |
| Principal
Amount (000s) | | Value (Note 1)
(000s) |
Indiana - continued |
Indiana Health Facility Fing. Auth. Rev.: | | | | |
(Ascension Health Cr. Group Prog.) Series 2002 F: | | | | |
5.5% 11/15/05 | | $ 1,000 | | $ 1,010 |
5.5% 11/15/06 | | 1,000 | | 1,036 |
(Ascension Health Cr. Group, Inc. Proj.) Series A, 5%, tender 5/1/07 (b) | | 7,100 | | 7,366 |
Indianapolis Local Pub. Impt. Bond Bank (Indianapolis Arpt. Auth. Proj.) Series I: | | | | |
4% 1/1/06 (MBIA Insured) (c) | | 1,325 | | 1,331 |
5% 1/1/08 (MBIA Insured) (c) | | 1,550 | | 1,616 |
Indianapolis Resource Recovery Rev. (Ogden Martin Sys., Inc. Proj.) 6.75% 12/1/07 (AMBAC Insured) | | 3,000 | | 3,213 |
Ivy Tech State College Series I, 5% 7/1/09
(AMBAC Insured) | | 1,405 | | 1,508 |
Logansport High School Bldg. Corp.: | | | | |
5.25% 1/15/11 (MBIA Insured) | | 1,000 | | 1,095 |
5.25% 7/15/11 (MBIA Insured) | | 1,020 | | 1,124 |
5.25% 1/15/12 (MBIA Insured) | | 1,045 | | 1,153 |
5.25% 7/15/12 (MBIA Insured) | | 1,075 | | 1,194 |
Muncie School Bldg. Corp. 5.25% 7/10/12
(MBIA Insured) | | 1,585 | | 1,760 |
New Albany Floyd County Independent School Bldg. Corp. 5% 1/15/11 (FSA Insured) | | 1,000 | | 1,082 |
Rockport Poll. Cont. Rev. 4.9%, tender 6/1/07 (b) | | 4,000 | | 4,104 |
Saint Joseph County Ind. Edl. Facilities Rev. (Univ. of Notre Dame Du Lac Proj.) 2.5%, tender 12/3/07 (b) | | 10,000 | | 9,869 |
West Clark 2000 School Bldg. Corp.: | | | | |
5.25% 1/15/11 (MBIA Insured) | | 1,065 | | 1,166 |
5.25% 7/15/11 (MBIA Insured) | | 1,125 | | 1,240 |
5.25% 1/15/12 (MBIA Insured) | | 1,150 | | 1,269 |
| | 55,370 |
Kansas - 0.9% |
Burlington Envir. Impt. Rev. (Kansas City Pwr. & Lt. Co. Proj.): | | | | |
Series A, 4.75%, tender 10/1/07 (b) | | 2,400 | | 2,476 |
Series C, 2.38%, tender 9/1/05 (b) | | 12,300 | | 12,282 |
La Cygne Envir. Impt. Rev. (Kansas City Pwr. & Lt. Co. Proj.) Series 1994, 2.25%, tender 9/1/05 (b) | | 2,500 | | 2,496 |
| | 17,254 |
Municipal Bonds - continued |
| Principal
Amount (000s) | | Value (Note 1)
(000s) |
Kentucky - 0.7% |
Kenton County Arpt. Board Arpt. Rev. Series B, 5% 3/1/09 (MBIA Insured) (c) | | $ 1,185 | | $ 1,250 |
Owensboro Elec. Lt. & Pwr. Rev. Series B: | | | | |
0% 1/1/07 (AMBAC Insured) | | 10,000 | | 9,560 |
0% 1/1/09 (AMBAC Insured) | | 2,000 | | 1,785 |
| | 12,595 |
Louisiana - 0.2% |
New Orleans Gen. Oblig. 5% 3/1/07 (MBIA Insured) | | 3,100 | | 3,206 |
Maryland - 0.3% |
Prince Georges County Ctfs. of Prtn. (Equip. Acquisition Prog.) 5.25% 5/15/10 (MBIA Insured) | | 1,535 | | 1,678 |
Prince Georges County Gen. Oblig. Series 2004 C, 5% 12/1/10 | | 3,770 | | 4,120 |
| | 5,798 |
Massachusetts - 3.1% |
Massachusetts Bay Trans. Auth. Series A, 7% 3/1/09 | | 6,880 | | 7,810 |
Massachusetts Dev. Fin. Agcy. Rev. (Massachusetts Biomedical Research Corp. Proj.) Series C: | | | | |
5.75% 8/1/06 | | 1,200 | | 1,229 |
5.875% 8/1/08 | | 1,630 | | 1,737 |
Massachusetts Fed. Hwy.: | | | | |
Series 2000 A, 5.75% 6/15/13 | | 3,000 | | 3,352 |
Series B, 5.125% 12/15/14 (Pre-Refunded to 12/15/08 @ 101) (d) | | 2,775 | | 2,981 |
Massachusetts Gen. Oblig.: | | | | |
Series 1999 C, 5.625% 9/1/12 (Pre-Refunded to 9/1/09 @ 101) (d) | | 2,570 | | 2,846 |
Series 2001 A, 5.5% 1/1/11 | | 5,000 | | 5,566 |
Series 2003 A, 5.375% 8/1/08 | | 5,165 | | 5,531 |
Series 2003 C: | | | | |
5% 12/1/06 (XL Cap. Assurance, Inc. Insured) | | 1,900 | | 1,959 |
5.5% 10/1/10 (MBIA Insured) | | 1,130 | | 1,258 |
Series A, 4.5% 1/1/09 (Pre-Refunded to 1/1/08
@ 101) (d) | | 2,055 | | 2,152 |
Series C, 5.25% 11/1/30 (Pre-Refunded to 11/1/12 @ 100) (d) | | 2,495 | | 2,773 |
Massachusetts Health & Edl. Facilities Auth. Rev.: | | | | |
(Caritas Christi Oblig. Group Proj.) 5.5% 7/1/05 | | 1,000 | | 1,000 |
(Dana Farber Cancer Proj.) Series G1, 6.25% 12/1/14 (Pre-Refunded to 12/1/05 @ 102) (d) | | 3,000 | | 3,104 |
Municipal Bonds - continued |
| Principal
Amount (000s) | | Value (Note 1)
(000s) |
Massachusetts - continued |
Massachusetts Port Auth. Spl. Facilities Rev.
(Delta Air Lines, Inc. Proj.) Series A, 5.5% 1/1/12 (AMBAC Insured) (c) | | $ 1,000 | | $ 1,078 |
New England Ed. Ln. Marketing Corp. Series A, 5.7% 7/1/05 (c) | | 2,800 | | 2,800 |
Springfield Gen. Oblig.: | | | | |
5% 1/15/06 (MBIA Insured) | | 1,000 | | 1,012 |
5% 8/1/11 (MBIA Insured) (a) | | 3,500 | | 3,821 |
5.25% 8/1/12 (MBIA Insured) (a) | | 6,000 | | 6,680 |
| | 58,689 |
Michigan - 3.2% |
Battle Creek Downtown Dev. Auth. 6% 5/1/06 (Escrowed to Maturity) (d) | | 2,000 | | 2,054 |
Chippewa Valley Schools: | | | | |
4% 5/1/06 | | 1,000 | | 1,011 |
5% 5/1/08 | | 1,260 | | 1,332 |
Detroit Gen. Oblig.: | | | | |
Series 2004 A, 5% 4/1/08 (FSA Insured) | | 7,275 | | 7,686 |
Series A, 5% 4/1/07 (FSA Insured) | | 6,910 | | 7,175 |
5% 4/1/08 (MBIA Insured) | | 14,545 | | 15,366 |
5% 4/1/09 (MBIA Insured) | | 10,620 | | 11,384 |
Detroit Swr. Disp. Rev. Series A, 5.75% 7/1/26
(Pre-Refunded to 1/1/10 @ 101) (d) | | 2,000 | | 2,246 |
Ferndale Gen. Oblig. 3.5% 4/1/06 (FGIC Insured) | | 1,960 | | 1,972 |
Greater Detroit Resource Recovery Auth. Rev. Series A, 6.25% 12/13/07 (AMBAC Insured) | | 4,000 | | 4,328 |
Hazel Park School District 5% 5/1/08 | | 1,275 | | 1,348 |
Livonia Pub. School District Series II, 0% 5/1/21
(FGIC Insured) (Pre-Refunded to 5/1/07 @ 39.31) (d) | | 8,000 | | 2,965 |
Wayne-Westland Cmnty. Schools 5% 5/1/10
(FSA Insured) | | 1,225 | | 1,329 |
| | 60,196 |
Minnesota - 0.5% |
Hopkins Independent School District #270 Series B, 4% 2/1/06 | | 2,575 | | 2,596 |
Mankato Independent School District #77 Series A, 4% 2/1/06 (FSA Insured) | | 1,420 | | 1,432 |
Metropolitan Council Minneapolis-Saint Paul Metropolitan Area Series 2005 A, 5% 9/1/06 | | 2,340 | | 2,404 |
Municipal Bonds - continued |
| Principal
Amount (000s) | | Value (Note 1)
(000s) |
Minnesota - continued |
Minneapolis & Saint Paul Hsg. & Redev. Auth. Health Care Sys. Rev. (Health Partners Oblig. Group Proj.): | | | | |
5.25% 12/1/08 | | $ 1,200 | | $ 1,270 |
5.25% 12/1/10 | | 500 | | 541 |
Saint Paul Port Auth. Lease Rev. (HealthEast Midway Campus Proj.) Series 2003 A, 5% 5/1/10 | | 700 | | 702 |
Waconia Independent School District #110 Series A, 5% 2/1/11 (FSA Insured) | | 940 | | 1,028 |
| | 9,973 |
Mississippi - 0.1% |
Mississippi Higher Ed. Student Ln. Series 2000 B3, 5.3% 9/1/08 (c) | | 1,190 | | 1,248 |
Missouri - 0.6% |
Kansas City School District Bldg. Corp. Rev.: | | | | |
(School District Elementary School Proj.): | | | | |
Series 2003 B, 5% 2/1/12 (FGIC Insured) | | 3,100 | | 3,411 |
Series B, 5% 2/1/11 (FGIC Insured) | | 1,850 | | 2,021 |
Series A: | | | | |
5% 2/1/07 (FGIC Insured) | | 1,020 | | 1,056 |
5% 2/1/08 (FGIC Insured) | | 2,000 | | 2,106 |
Saint Louis Muni. Fin. Corp. Leasehold Rev.: | | | | |
(Callahan Courthouse Proj.) Series A, 5.75% 2/15/14 (FGIC Insured) | | 1,050 | | 1,190 |
(Civil Courts Bldg. Proj.) Series 2003 A, 5% 8/1/06 (FSA Insured) | | 1,635 | | 1,676 |
| | 11,460 |
Montana - 0.2% |
Forsyth Poll. Cont. Rev. (Portland Gen. Elec. Co. Projs.) Series A, 5.2%, tender 5/1/09 (b) | | 2,900 | | 3,062 |
Nebraska - 1.7% |
Lancaster County School District #1 (Lincoln Pub. Schools Proj.) 4% 1/15/06 | | 1,000 | | 1,007 |
Nebraska Pub. Pwr. District Rev. Series A: | | | | |
0% 1/1/06 (MBIA Insured) | | 24,465 | | 24,111 |
0% 1/1/07 (MBIA Insured) | | 4,000 | | 3,825 |
Omaha Pub. Pwr. District Elec. Rev. Series B, 4.5% 2/1/09 | | 3,500 | | 3,674 |
| | 32,617 |
Municipal Bonds - continued |
| Principal
Amount (000s) | | Value (Note 1)
(000s) |
Nevada - 1.6% |
Clark County Arpt. Rev. Series C: | | | | |
5% 7/1/05 (AMBAC Insured) (c) | | $ 800 | | $ 800 |
5% 7/1/06 (AMBAC Insured) (c) | | 800 | | 817 |
5% 7/1/08 (AMBAC Insured) (c) | | 2,215 | | 2,321 |
5% 7/1/09 (AMBAC Insured) (c) | | 2,700 | | 2,855 |
5% 7/1/10 (AMBAC Insured) (c) | | 1,225 | | 1,303 |
5% 7/1/11 (AMBAC Insured) (c) | | 1,790 | | 1,915 |
Clark County School District: | | | | |
Series 2000 A, 5.75% 6/15/17 (Pre-Refunded to 6/15/10 @ 100) (d) | | 1,600 | | 1,800 |
Series C, 5% 6/15/10 (MBIA Insured) | | 1,000 | | 1,082 |
Series D, 5% 6/15/09 (MBIA Insured) | | 13,890 | | 14,915 |
Washoe County School District Gen. Oblig. Series D, 5% 6/1/10 (MBIA Insured) | | 2,410 | | 2,612 |
| | 30,420 |
New Hampshire - 0.1% |
New Hampshire Bus. Fin. Auth. Poll. Cont. Rev. (United Illumination Co.) Series A, 3.65%, tender 2/1/10 (AMBAC Insured) (b)(c) | | 2,500 | | 2,501 |
New Jersey - 4.5% |
Casino Reinvestment Dev. Auth. Hotel Room Fee Rev.: | | | | |
5% 1/1/08 (AMBAC Insured) | | 920 | | 965 |
5% 1/1/09 (AMBAC Insured) | | 1,000 | | 1,065 |
Elizabeth Gen. Oblig. 5.25% 8/15/09 (MBIA Insured) | | 1,225 | | 1,329 |
Garden State Preservation Trust Open Space & Farmland Preservation Series B, 6.25% 11/1/09 (MBIA Insured) (a) | | 4,000 | | 4,436 |
New Jersey Econ. Dev. Auth. Rev. 5% 6/15/07 | | 7,500 | | 7,759 |
New Jersey Gen. Oblig. Series 2005 N, 5% 7/15/08 (FGIC Insured) (a) | | 6,175 | | 6,482 |
New Jersey Tpk. Auth. Tpk. Rev. Series 2004 A, 3.15%, tender 1/1/10 (AMBAC Insured) (b) | | 16,250 | | 16,243 |
New Jersey Trans. Trust Fund Auth.: | | | | |
Series 2001 A: | | | | |
5% 6/15/06 | | 355 | | 362 |
5% 6/15/06 (Escrowed to Maturity) (d) | | 5,945 | | 6,078 |
Series A, 5.25% 12/15/08 (MBIA Insured) | | 15,000 | | 16,101 |
Series B: | | | | |
5.25% 12/15/10 (FGIC Insured) | | 4,550 | | 5,020 |
5.25% 12/15/11 (FGIC Insured) | | 10,015 | | 11,109 |
Municipal Bonds - continued |
| Principal
Amount (000s) | | Value (Note 1)
(000s) |
New Jersey - continued |
New Jersey Transit Corp. Series 2000 B, 5.5% 2/1/08 (AMBAC Insured) | | $ 1,000 | | $ 1,064 |
New Jersey Transit Corp. Ctfs. of Prtn. Series A, 6% 9/15/13 (Pre-Refunded to 9/15/09 @ 100) (d) | | 7,000 | | 7,798 |
| | 85,811 |
New Jersey/Pennsylvania - 0.3% |
Delaware River Joint Toll Bridge Commission Bridge Rev. 5% 7/1/09 | | 5,170 | | 5,496 |
New Mexico - 1.8% |
Farmington Poll. Cont. Rev. (Pub. Svc. Co. of
New Mexico San Juan and Four Corners Projs.)
Series 2003 B, 2.1%, tender 4/1/06 (b) | | 7,000 | | 6,935 |
San Juan County Gross Receipts Tax Rev. Series B, 2.5% 8/15/05 | | 13,600 | | 13,596 |
Sandoval County Incentive Payment Rev. 4.25% 12/1/06 | | 13,750 | | 13,960 |
| | 34,491 |
New York - 8.5% |
Grand Central District Mgmt. Assoc., Inc.: | | | | |
5% 1/1/10 | | 1,200 | | 1,289 |
5% 1/1/12 | | 1,175 | | 1,280 |
Metropolitan Trans. Auth. Commuter Facilities Rev.
Series A: | | | | |
5% 7/1/06 (Escrowed to Maturity) (d) | | 270 | | 276 |
5.375% 7/1/09 (Escrowed to Maturity) (d) | | 3,635 | | 3,979 |
Metropolitan Trans. Auth. Svc. Contract Rev. Series B, 5% 1/1/06 | | 10,110 | | 10,225 |
Nassau County Gen. Oblig. Series Z, 5% 9/1/11
(FGIC Insured) | | 800 | | 864 |
New York City Gen. Oblig.: | | | | |
Series 2000 A, 6.5% 5/15/11 | | 2,075 | | 2,381 |
Series 2002 G, 5.5% 8/1/10 | | 2,720 | | 2,993 |
Series 2004 G, 5% 8/1/09 | | 8,000 | | 8,545 |
Series 2005 K: | | | | |
5% 8/1/11 | | 7,120 | | 7,715 |
5% 8/1/12 | | 4,360 | | 4,744 |
Series 2005 O, 5% 6/1/12 | | 7,500 | | 8,146 |
Series A, 5.25% 11/1/14 (MBIA Insured) | | 600 | | 665 |
Series B, 5.75% 8/1/14 | | 1,000 | | 1,128 |
Series E, 6% 8/1/11 | | 60 | | 63 |
Series G, 5.25% 8/1/14 (AMBAC Insured) | | 1,000 | | 1,100 |
Municipal Bonds - continued |
| Principal
Amount (000s) | | Value (Note 1)
(000s) |
New York - continued |
New York City Gen. Oblig.: - continued | | | | |
Series H, 5.75% 3/15/11 (FGIC Insured) | | $ 1,700 | | $ 1,915 |
New York State Dorm. Auth. Revs.: | | | | |
(City Univ. Sys. Consolidation Proj.): | | | | |
Series 2000 A, 6.125% 7/1/12 (AMBAC Insured) | | 5,540 | | 6,345 |
Series A, 5.75% 7/1/13 | | 3,500 | | 3,956 |
Series C, 7.5% 7/1/10 | | 3,600 | | 3,969 |
Series 2003 A: | | | | |
5% 1/1/06 | | 1,250 | | 1,264 |
5% 1/1/07 | | 10,855 | | 11,181 |
5% 3/15/08 | | 2,000 | | 2,105 |
Series B, 5.25%, tender 5/15/12 (b) | | 13,000 | | 14,293 |
New York State Urban Dev. Corp. Rev. 5% 1/1/12 | | 5,000 | | 5,477 |
New York Transitional Fin. Auth. Rev. Series 2003 E: | | | | |
4.5% 2/1/07 | | 1,750 | | 1,798 |
4.5% 2/1/08 | | 1,500 | | 1,560 |
5% 2/1/09 | | 2,035 | | 2,173 |
Tobacco Settlement Fing. Corp.: | | | | |
Series 2004 B1, 5% 6/1/09 | | 3,800 | | 4,049 |
Series A1: | | | | |
5.25% 6/1/12 | | 5,000 | | 5,106 |
5.25% 6/1/13 | | 17,500 | | 18,491 |
Series B1, 5% 6/1/06 | | 17,815 | | 18,115 |
Triborough Bridge & Tunnel Auth. Revs. Series A, 5.5% 1/1/14 (Pre-Refunded to 1/1/12 @ 100) (d) | | 3,745 | | 4,253 |
| | 161,443 |
New York & New Jersey - 0.3% |
Port Auth. of New York & New Jersey: | | | | |
124th Series, 5% 8/1/13 (FGIC Insured) (c) | | 1,200 | | 1,259 |
127th Series, 5% 12/15/08 (AMBAC Insured) (c) | | 3,510 | | 3,725 |
| | 4,984 |
North Carolina - 1.2% |
Charlotte Ctfs. of Prtn. (FY 2004 Equip. Acquisition Proj.) Series 2004 C, 4% 3/1/08 | | 4,940 | | 5,078 |
North Carolina Ctfs. of Prtn. (Repair and Renovation Proj.) Series 2004 B, 4% 6/1/06 | | 1,300 | | 1,316 |
North Carolina Eastern Muni. Pwr. Agcy. Pwr. Sys. Rev.: | | | | |
Series 1993 B, 7% 1/1/08 (MBIA Insured) | | 1,500 | | 1,647 |
Series A, 5.5% 1/1/10 | | 3,000 | | 3,223 |
Series B, 6% 1/1/06 | | 6,170 | | 6,253 |
Municipal Bonds - continued |
| Principal
Amount (000s) | | Value (Note 1)
(000s) |
North Carolina - continued |
North Carolina Eastern Muni. Pwr. Agcy. Pwr. Sys. Rev.: - continued | | | | |
Series C, 5% 1/1/08 | | $ 1,190 | | $ 1,236 |
Series D, 5.375% 1/1/10 | | 3,715 | | 3,972 |
| | 22,725 |
Ohio - 1.3% |
Cleveland Pub. Pwr. Sys. Rev. (First Mtg. Prog.)
Series 1994 A, 0% 11/15/09 (MBIA Insured) | | 2,250 | | 1,943 |
Franklin County Rev. (OCLC Online Computer Library Ctr., Inc. Proj.) 5% 4/15/07 | | 1,960 | | 2,015 |
Lakewood Hosp. Impt. Rev. (Lakewood Hosp. Assoc. Proj.) 5.5% 2/15/07 | | 1,420 | | 1,472 |
Ohio Air Quality Dev. Auth. Rev.: | | | | |
(Pennsylvania Pwr. Co. Proj.) 3.375%, tender 7/1/05 (b) | | 2,300 | | 2,300 |
Series 2002 A, 3.5%, tender 1/1/06 (b) | | 1,000 | | 1,000 |
Ohio Gen. Oblig. Series 2000 E, 5.5% 5/1/09 | | 1,905 | | 2,079 |
Ohio Univ. Gen. Receipts Athens: | | | | |
5% 12/1/06 (FSA Insured) | | 3,600 | | 3,713 |
5% 12/1/07 (FSA Insured) | | 1,285 | | 1,353 |
Ohio Wtr. Dev. Auth. Poll. Cont. Facilities Rev. (Toledo Edison Co. Proj.) Series B, 4.5%, tender 9/1/05 (b) | | 7,000 | | 7,006 |
Ohio Wtr. Dev. Auth. Wtr. Poll. Cont. Rev. (Ohio Edison Co. Proj.) Series A, 3.35%, tender 6/1/06 (b) | | 1,800 | | 1,802 |
| | 24,683 |
Oklahoma - 0.2% |
Cherokee County Econ. Dev. Auth. Series A, 0% 11/1/11 (Escrowed to Maturity) (d) | | 1,000 | | 793 |
Oklahoma Dev. Fin. Auth. Rev. (Samuel Roberts Noble, Inc. Proj.) 5% 5/1/06 | | 3,200 | | 3,259 |
| | 4,052 |
Oregon - 0.4% |
Beaverton Wtr. Rev. Series B, 5% 6/1/10 (FSA Insured) | | 1,210 | | 1,314 |
Eugene Elec. Util. Rev. Series A, 5.25% 8/1/06 (FSA Insured) | | 1,280 | | 1,314 |
Oregon Dept. Administrative Svcs. Ctfs. of Prtn. Series B: | | | | |
5% 5/1/09 (FSA Insured) | | 1,000 | | 1,070 |
5% 5/1/11 (FSA Insured) | | 1,000 | | 1,088 |
Municipal Bonds - continued |
| Principal
Amount (000s) | | Value (Note 1)
(000s) |
Oregon - continued |
Oregon Gen. Oblig. 8.25% 1/1/07 | | $ 1,000 | | $ 1,078 |
Salem Gen. Oblig. 5% 5/1/10 (FSA Insured) | | 2,550 | | 2,766 |
| | 8,630 |
Pennsylvania - 3.9% |
Allegheny County Arpt. Rev. (Pittsburgh Int'l. Arpt. Proj.) Series A1, 5.75% 1/1/12 (MBIA Insured) (c) | | 1,300 | | 1,427 |
Allegheny County Hosp. Dev. Auth. Rev. (Univ. of Pittsburgh Med. Ctr. Proj.) Series B: | | | | |
5.5% 6/15/06 | | 3,065 | | 3,139 |
5.5% 6/15/07 | | 2,000 | | 2,096 |
Allegheny County Indl. Dev. Auth. Rev. (Watson Institute Ed. Ctr. Proj.) 3.375%, tender 5/1/08, LOC PNC Bank NA, Pittsburgh (b) | | 4,500 | | 4,502 |
Allegheny County San. Auth. Swr. Rev. 6% 12/1/11 (MBIA Insured) | | 1,495 | | 1,715 |
Hazleton Area School District 6.5% 3/1/06
(FSA Insured) | | 1,155 | | 1,184 |
Luzerne County Indl. Dev. Auth. Wtr. Facilities Rev. (Pennsylvania-American Wtr. Co. Proj.) 3.6%, tender 12/1/09 (AMBAC Insured) (b)(c) | | 10,000 | | 10,061 |
Montgomery County Higher Ed. & Health Auth. Hosp. Rev. (Abington Memorial Hosp. Proj.) Series A, 5% 6/1/06 (AMBAC Insured) | | 3,750 | | 3,818 |
Pennsylvania Econ. Dev. Fing. Auth. Exempt Facilities Rev. (Shippingport Proj.) Series A, 4.35%, tender 6/1/10 (b)(c) | | 1,200 | | 1,203 |
Pennsylvania Higher Edl. Facilities Auth. Rev.: | | | | |
(Univ. of Pennsylvania Health Systems Proj.) Series A: | | | | |
4% 8/15/06 | | 1,405 | | 1,420 |
5% 8/15/07 | | 1,735 | | 1,797 |
5% 8/15/08 | | 2,000 | | 2,100 |
(UPMC Health Sys. Proj.) Series 2001 A, 5.75% 1/15/09 | | 1,750 | | 1,882 |
Series B: | | | | |
5% 9/1/06 | | 4,510 | | 4,626 |
5.25% 9/1/08 | | 5,860 | | 6,275 |
Pennsylvania Indl. Dev. Auth. Rev. 5.25% 7/1/10 (AMBAC Insured) | | 2,750 | | 3,023 |
Philadelphia Muni. Auth. Rev.: | | | | |
Series A: | | | | |
5% 5/15/07 (FSA Insured) | | 5,500 | | 5,721 |
5% 5/15/08 (FSA Insured) | | 5,000 | | 5,280 |
Series B, 5.25% 11/15/11 (FSA Insured) | | 3,400 | | 3,771 |
Municipal Bonds - continued |
| Principal
Amount (000s) | | Value (Note 1)
(000s) |
Pennsylvania - continued |
Philadelphia School District Series B, 5% 4/1/11 (AMBAC Insured) | | $ 2,160 | | $ 2,365 |
Pittsburgh Gen. Oblig. Series A, 6% 3/1/07
(MBIA Insured) | | 2,000 | | 2,102 |
Westmoreland County Muni. Auth. Muni. Svc. Rev. Series K, 0% 7/1/12 (Escrowed to Maturity) (d) | | 2,355 | | 1,839 |
Wyoming Valley San. Auth. Swr. Rev. 5% 11/15/06 (MBIA Insured) | | 1,865 | | 1,922 |
| | 73,268 |
Puerto Rico - 0.0% |
Puerto Rico Pub. Bldgs Auth. Rev. Series K, 4%, tender 7/1/07 (MBIA Insured) (b) | | 1,000 | | 1,027 |
Rhode Island - 0.2% |
Rhode Island Health & Edl. Bldg. Corp. Rev. (Johnson & Wales Univ. Proj.): | | | | |
5% 4/1/06 (XL Cap. Assurance, Inc. Insured) | | 2,225 | | 2,264 |
5% 4/1/08 (XL Cap. Assurance, Inc. Insured) | | 1,700 | | 1,794 |
| | 4,058 |
South Carolina - 1.8% |
Berkeley County School District 7% 4/1/07 | | 2,615 | | 2,805 |
Charleston County Hosp. Facilities (Care Alliance Health Services Proj.) Series A: | | | | |
5% 8/15/06 | | 1,000 | | 1,020 |
5% 8/15/07 | | 1,700 | | 1,766 |
5% 8/15/08 | | 1,690 | | 1,771 |
Greenville County Pub. Facilities Corp. Certificate of Prtn. (Courthouse and Detention Proj.) 5% 4/1/10 (AMBAC Insured) | | 1,450 | | 1,574 |
Piedmont Muni. Pwr. Agcy. Elec. Rev. 5.6% 1/1/09 (MBIA Insured) | | 2,345 | | 2,558 |
Rock Hill Util. Sys. Rev. Series 2003 A: | | | | |
5% 1/1/08 (FSA Insured) | | 1,850 | | 1,950 |
5% 1/1/09 (FSA Insured) | | 1,945 | | 2,083 |
South Carolina Pub. Svc. Auth. Rev.: | | | | |
Series 2002 A: | | | | |
5% 1/1/06 (FSA Insured) | | 1,705 | | 1,725 |
5% 1/1/07 (FSA Insured) | | 4,105 | | 4,240 |
Series 2005 B, 5% 1/1/10 (MBIA Insured) (a) | | 3,000 | | 3,214 |
Series A: | | | | |
5.5% 1/1/11 (MBIA Insured) | | 3,000 | | 3,311 |
5.5% 1/1/14 (FGIC Insured) (a) | | 1,335 | | 1,517 |
Municipal Bonds - continued |
| Principal
Amount (000s) | | Value (Note 1)
(000s) |
South Carolina - continued |
South Carolina Pub. Svc. Auth. Rev.: - continued | | | | |
Series D, 5% 1/1/06 | | $ 2,750 | | $ 2,782 |
Spartanburg County School District #5 Pub. Facilities Corp. Ctfs. of Prtn. 5% 7/1/09 (FSA Insured) | | 1,000 | | 1,075 |
| | 33,391 |
Tennessee - 0.7% |
Elizabethton Health & Edl. Facilities Board Rev. (First Mtg. Prog.) 6% 7/1/11 (MBIA Insured) | | 2,005 | | 2,288 |
Maury County Gen. Oblig. Series 2004 B, 5% 4/1/10 (MBIA Insured) | | 2,000 | | 2,162 |
Memphis-Shelby County Arpt. Auth. Arpt. Rev. Series A: | | | | |
4% 9/1/06 (MBIA Insured) | | 1,500 | | 1,521 |
4.5% 9/1/08 (MBIA Insured) | | 1,620 | | 1,692 |
4.5% 9/1/09 (MBIA Insured) | | 1,685 | | 1,773 |
Metropolitan Nashville Arpt. Auth. Rev. Series C, 5% 7/1/06 (FGIC Insured) (c) | | 1,675 | | 1,711 |
Shelby County Health Edl. & Hsg. Facility Board Hosp. Rev. (Methodist Health Care Proj.) 5.5% 4/1/09 (MBIA Insured) | | 1,200 | | 1,294 |
| | 12,441 |
Texas - 14.4% |
Alief Independent School District Series 2004 B, 5% 2/15/10 | | 1,500 | | 1,619 |
Arlington Independent School District 5% 2/15/13 | | 2,500 | | 2,756 |
Austin Arpt. Sys. Rev. Series A: | | | | |
6.5% 11/15/05 (Escrowed to Maturity) (c)(d) | | 940 | | 953 |
6.5% 11/15/05 (MBIA Insured) (c) | | 6,870 | | 6,963 |
Austin Independent School District 5% 8/1/07 (a) | | 3,605 | | 3,682 |
Austin Util. Sys. Rev.: | | | | |
Series 1992 A, 0% 11/15/09 (MBIA Insured) | | 5,130 | | 4,438 |
Series A, 0% 11/15/10 (MBIA Insured) | | 5,300 | | 4,401 |
Bexar County Series A: | | | | |
5% 6/15/09 (FSA Insured) | | 2,615 | | 2,803 |
5% 6/15/10 (FSA Insured) | | 1,000 | | 1,083 |
Birdville Independent School District 5% 2/15/10 | | 1,300 | | 1,403 |
Brazos River Auth. Poll. Cont. Rev. (Texas Utils. Elec. Co. Proj.) Series 1995 B, 5.05%, tender 6/19/06 (b)(c) | | 6,255 | | 6,346 |
Bryan Wtrwks. & Swr. Sys. Rev. 5.5% 7/1/11 (FSA Insured) | | 1,500 | | 1,684 |
College Station Independent School District 5% 2/15/10 | | 1,000 | | 1,079 |
Conroe Independent School District Lot B, 0% 2/15/08 | | 3,000 | | 2,761 |
Municipal Bonds - continued |
| Principal
Amount (000s) | | Value (Note 1)
(000s) |
Texas - continued |
Corpus Christi Gen. Oblig.: | | | | |
4% 3/1/06 (FSA Insured) | | $ 1,285 | | $ 1,296 |
5% 3/1/06 (AMBAC Insured) | | 3,365 | | 3,417 |
5% 3/1/07 (FSA Insured) | | 2,735 | | 2,835 |
Corpus Christi Util. Sys. Rev.: | | | | |
5% 7/15/12 (FSA Insured) | | 1,000 | | 1,103 |
5% 7/15/13 (FSA Insured) | | 1,665 | | 1,848 |
Cypress-Fairbanks Independent School District: | | | | |
Series B, 0% 8/1/07 (AMBAC Insured) | | 10,000 | | 9,404 |
4.5% 2/15/06 | | 2,245 | | 2,270 |
5% 2/15/08 | | 2,000 | | 2,105 |
Dallas Independent School District Series 2005, 5.25% 8/15/08 (a) | | 2,000 | | 2,134 |
Del Valle Independent School District 5.5% 2/1/09 | | 1,205 | | 1,305 |
Denton County Gen. Oblig.: | | | | |
5% 7/15/11 (FSA Insured) (a) | | 3,065 | | 3,349 |
5% 7/15/13 (FSA Insured) (a) | | 1,200 | | 1,326 |
El Paso Wtr. & Swr. Rev.: | | | | |
5% 3/1/06 (AMBAC Insured) | | 1,000 | | 1,015 |
5% 3/1/08 (AMBAC Insured) | | 2,770 | | 2,918 |
Fort Bend Independent School District 5%, tender 8/15/09 (b) | | 5,000 | | 5,344 |
Fort Worth Gen. Oblig. Series A, 5% 3/1/06 | | 1,000 | | 1,015 |
Fort Worth Independent School District 5% 2/15/12 | | 1,500 | | 1,644 |
Frisco Gen. Oblig.: | | | | |
Series 2003 A: | | | | |
4% 2/15/07 (FSA Insured) | | 1,320 | | 1,347 |
4% 2/15/08 (FSA Insured) | | 1,145 | | 1,176 |
5% 2/15/10 (FSA Insured) | | 1,710 | | 1,845 |
4% 2/15/06 (FSA Insured) | | 2,975 | | 3,000 |
4% 2/15/07 (FSA Insured) | | 3,115 | | 3,178 |
Garland Independent School District 0% 2/15/07 | | 1,610 | | 1,533 |
Harris County Gen. Oblig. Series A, 0% 8/15/07
(FGIC Insured) | | 4,400 | | 4,133 |
Harris County Health Facilities Dev. Corp. Rev. (Saint Luke's Episcopal Hosp. Proj.) Series 2001 A, 5.5% 2/15/09 | | 3,710 | | 3,993 |
Houston Cmnty. College Sys. Rev.: | | | | |
5.25% 4/15/11 (FSA Insured) | | 3,030 | | 3,342 |
5.25% 4/15/12 (FSA Insured) | | 2,000 | | 2,223 |
Houston Gen. Oblig.: | | | | |
5.5% 3/1/06 | | 2,580 | | 2,627 |
Municipal Bonds - continued |
| Principal
Amount (000s) | | Value (Note 1)
(000s) |
Texas - continued |
Houston Gen. Oblig.: - continued | | | | |
5.5% 3/1/06 (Escrowed to Maturity) (d) | | $ 120 | | $ 122 |
Houston Util. Sys. Rev. Series A, 5.25% 5/15/10
(MBIA Insured) | | 1,250 | | 1,368 |
Irving Independent School District 5.25% 2/15/13 | | 2,145 | | 2,400 |
Katy Independent School District Series A: | | | | |
4% 2/15/06 | | 1,335 | | 1,346 |
5.25% 2/15/12 | | 2,000 | | 2,221 |
Killeen Independent School District 4% 2/15/08 | | 1,200 | | 1,233 |
La Porte Independent School District 4% 2/15/08 | | 2,000 | | 2,055 |
Lewisville Gen. Oblig. 4% 2/15/06 (FSA Insured) | | 1,300 | | 1,311 |
Lower Colorado River Auth. Rev.: | | | | |
0% 1/1/09 (Escrowed to Maturity) (d) | | 3,000 | | 2,690 |
5.25% 1/1/15 (Pre-Refunded to 1/1/11 @ 100) (d) | | 5,000 | | 5,517 |
Lubbock Gen. Oblig.: | | | | |
(Wtrwks. Sys. Surplus Proj.) 5% 2/15/11
(FSA Insured) (a) | | 2,465 | | 2,674 |
5% 2/15/09 (MBIA Insured) | | 1,615 | | 1,723 |
5% 2/15/10 (MBIA Insured) | | 1,845 | | 1,991 |
Mesquite Independent School District Series A, 0% 8/15/06 | | 1,115 | | 1,080 |
New Braunfels Independent School District 0% 2/1/07 | | 2,000 | | 1,907 |
North East Texas Independent School District 7% 2/1/11 (Pre-Refunded to 2/1/10 @ 100) (d) | | 3,600 | | 4,200 |
North Texas Tollway Auth. Dallas North Tollway Sys. Rev. Series C: | | | | |
5% 1/1/09 (FSA Insured) | | 2,000 | | 2,135 |
5%, tender 7/1/08 (FSA Insured) (b) | | 2,650 | | 2,797 |
Northside Independent School District Series B, 2.45%, tender 8/1/06 (Liquidity Facility Dexia Cr. Local de France) (b) | | 7,300 | | 7,284 |
Port Houston Auth. Harris County 6% 10/1/06
(FGIC Insured) (c) | | 2,000 | | 2,079 |
Red River Ed. Fin. Corp. Ed. Rev. (Texas Christian Univ. Proj.) 5% 3/15/12 (MBIA Insured) | | 2,625 | | 2,876 |
Rockwall Independent School District: | | | | |
4% 2/15/06 | | 2,370 | | 2,389 |
5% 2/15/08 | | 3,825 | | 4,025 |
5% 2/15/09 | | 4,690 | | 5,005 |
San Angelo Wtrks & Swr. Sys. Impt. and Rfdg. Rev. 5% 4/1/10 (FSA Insured) | | 1,630 | | 1,762 |
Municipal Bonds - continued |
| Principal
Amount (000s) | | Value (Note 1)
(000s) |
Texas - continued |
San Antonio Elec. & Gas Systems Rev.: | | | | |
Series 2000 A, 5.75% 2/1/15 (Pre-Refunded to 2/1/10 @ 100) (d) | | $ 5,000 | | $ 5,558 |
5.25% 2/1/07 | | 2,500 | | 2,597 |
5.25% 2/1/08 | | 1,000 | | 1,059 |
San Antonio Independent School District 7% 8/15/08 | | 5,000 | | 5,592 |
San Antonio Muni. Drain Util. Sys. Rev. 5.25% 2/1/12 (MBIA Insured) | | 1,545 | | 1,718 |
San Antonio Wtr. Sys. Rev. 5% 5/15/10 (FGIC Insured) | | 1,020 | | 1,105 |
Socorro Independent School District 5% 8/15/09 | | 2,070 | | 2,225 |
Spring Branch Independent School District Series 2001, 5.375% 2/1/14 | | 2,790 | | 3,067 |
Spring Independent School District 5% 2/15/08 | | 1,875 | | 1,973 |
Texas Gen. Oblig.: | | | | |
(College Student Ln. Prog.) 5% 8/1/11 (c) | | 3,000 | | 3,167 |
Series 1992 A, 8% 10/1/07 | | 10,000 | | 11,103 |
Series A, 6% 10/1/08 (MBIA Insured) | | 10,750 | | 11,789 |
Series C, 0% 4/1/08 (Escrowed to Maturity) (d) | | 3,100 | | 2,861 |
Texas Pub. Fin. Auth. Bldg. Rev. (Dept. of Criminal Justice Prog.) Series A, 5% 2/1/07 (FSA Insured) | | 2,000 | | 2,069 |
Texas Pub. Fin. Auth. Rev. (Bldg. and Procurement Commission Projs.) Series A, 5% 2/1/10
(AMBAC Insured) | | 1,055 | | 1,138 |
Texas State Univ. Sys. Fing. Rev. 5% 3/15/13
(FSA Insured) | | 2,000 | | 2,212 |
Texas Tech Univ. Revs. Ninth Series: | | | | |
4% 2/15/09 (AMBAC Insured) | | 1,460 | | 1,510 |
5% 2/15/11 (AMBAC Insured) | | 1,250 | | 1,363 |
Travis County Gen. Oblig. 5.25% 3/1/12 | | 4,125 | | 4,586 |
Trinity River Auth. Red Oak Creek Sys. Rev. 3.5% 2/1/06 (FSA Insured) | | 1,270 | | 1,276 |
Tyler Health Facilities Dev. Corp. Hosp. Rev. (Mother Frances Hosp. Reg'l. Health Care Ctr. Proj.): | | | | |
4% 7/1/05 | | 1,800 | | 1,800 |
4.5% 7/1/06 | | 1,220 | | 1,229 |
5% 7/1/07 | | 1,000 | | 1,030 |
Univ. of Texas Univ. Revs.: | | | | |
(Fing. Sys. Proj.) Series A, 5.5% 8/15/09 | | 1,115 | | 1,221 |
Series B, 5% 8/15/09 | | 13,555 | | 14,584 |
Webb County Gen. Oblig.: | | | | |
5% 2/15/06 (FGIC Insured) | | 1,055 | | 1,070 |
5% 2/15/07 (FGIC Insured) | | 1,110 | | 1,150 |
Municipal Bonds - continued |
| Principal
Amount (000s) | | Value (Note 1)
(000s) |
Texas - continued |
Webb County Gen. Oblig.: - continued | | | | |
5% 2/15/08 (FGIC Insured) | | $ 1,170 | | $ 1,231 |
Wichita Falls Independent School District 0% 2/1/10 | | 2,325 | | 1,987 |
| | 272,156 |
Utah - 0.5% |
Salt Lake County Wtr. Conservancy District Rev. Series A: | | | | |
0% 10/1/11 (AMBAC Insured) | | 3,800 | | 3,010 |
0% 10/1/12 (AMBAC Insured) | | 3,800 | | 2,884 |
0% 10/1/13 (AMBAC Insured) | | 3,760 | | 2,735 |
Utah Bldg. Ownership Auth. Lease Rev. (State Facilities Master Lease Prog.) Series A, 5% 5/15/11 | | 1,700 | | 1,861 |
| | 10,490 |
Virginia - 0.2% |
Amelia County Indl. Dev. Auth. Solid Waste Disp. Rev. (Waste Mgmt., Inc. Proj.) 4.05%, tender 4/1/08 (b)(c) | | 1,000 | | 1,004 |
Virginia Commonwealth Trans. Board Trans. Rev. (U.S. Route 58 Corridor Dev. Prog.) Series B, 5.375% 5/15/12 (Pre-Refunded to 5/15/09 @ 101) (d) | | 1,800 | | 1,978 |
| | 2,982 |
Washington - 5.2% |
Chelan County Pub. Util. District #1 Rev. Series B, 5% 7/1/11 (FGIC Insured) | | 1,190 | | 1,274 |
Clark County Pub. Util. District #1 Elec. Rev.: | | | | |
Series B: | | | | |
5% 1/1/06 (FSA Insured) | | 1,375 | | 1,390 |
5% 1/1/07 (FSA Insured) | | 1,395 | | 1,440 |
5.25% 1/1/08 (FSA Insured) | | 1,515 | | 1,602 |
5.25% 1/1/09 (FSA Insured) | | 1,595 | | 1,716 |
5% 1/1/11 (MBIA Insured) | | 1,680 | | 1,833 |
King & Snohomish Counties School District #417 Northshore: | | | | |
5.5% 12/1/14 (Pre-Refunded to 6/1/12 @ 100) (d) | | 6,300 | | 7,183 |
5.75% 12/1/15 (Pre-Refunded to 6/1/12 @ 100) (d) | | 2,500 | | 2,889 |
King County Rural Library District 5% 12/1/06 (FSA Insured) | | 1,045 | | 1,078 |
King County School District #409, Tahoma 5% 6/1/11 (FSA Insured) | | 1,740 | | 1,904 |
King County Swr. Rev. Series B: | | | | |
5% 1/1/06 (FSA Insured) | | 3,000 | | 3,035 |
5% 1/1/07 (FSA Insured) | | 5,000 | | 5,164 |
Municipal Bonds - continued |
| Principal
Amount (000s) | | Value (Note 1)
(000s) |
Washington - continued |
King County Swr. Rev. Series B: - continued | | | | |
5.25% 1/1/08 (FSA Insured) | | $ 3,500 | | $ 3,701 |
Pierce County School District #10 Tacoma Series A, 5% 12/1/12 (FSA Insured) | | 4,175 | | 4,597 |
Port of Seattle Rev. Series D, 5.75% 11/1/15
(FGIC Insured) (c) | | 3,640 | | 4,077 |
Seattle Muni. Lt. & Pwr. Rev. 5.25% 3/1/07
(FSA Insured) | | 1,690 | | 1,757 |
Snohomish County Pub. Hosp. District #2 (Stevens Health Care Proj.): | | | | |
4% 12/1/05 (FGIC Insured) | | 1,570 | | 1,578 |
4.5% 12/1/09 (FGIC Insured) | | 1,000 | | 1,055 |
Snohomish County School District #2, Everett: | | | | |
5% 6/1/09 (FSA Insured) | | 1,045 | | 1,121 |
5% 6/1/10 (FSA Insured) | | 1,000 | | 1,084 |
Vancouver Wtr. & Swr. Rev. 5.25% 6/1/11
(FSA Insured) | | 1,000 | | 1,108 |
Washington Gen. Oblig. Series A: | | | | |
4% 1/1/08 (MBIA Insured) | | 33,175 | | 34,098 |
5% 7/1/11 (FGIC Insured) | | 1,000 | | 1,093 |
5.5% 7/1/11 | | 3,500 | | 3,853 |
Washington Pub. Pwr. Supply Sys. Nuclear Proj. #2 Rev. Series A, 5.75% 7/1/08 | | 3,000 | | 3,236 |
Washington Pub. Pwr. Supply Sys. Nuclear Proj. #3 Rev. Series C, 5% 7/1/06 (FSA Insured) | | 5,000 | | 5,109 |
| | 97,975 |
West Virginia - 0.1% |
West Virginia School Bldg. Auth. 4% 1/1/06 (MBIA Insured) | | 2,500 | | 2,517 |
Wisconsin - 1.5% |
Milwaukee County Gen. Oblig. Series A, 0% 12/1/10 (FGIC Insured) | | 3,370 | | 2,782 |
Wisconsin Gen. Oblig. Series 1, 5% 5/1/10
(MBIA Insured) (a) | | 2,500 | | 2,666 |
Wisconsin Health & Edl. Facilities Auth. Rev.: | | | | |
(Hosp. Sisters Svcs., Inc. Proj.) Series 2003 B, 4%, tender 12/1/06 (FSA Insured) (b) | | 15,000 | | 15,192 |
(Wheaton Franciscan Svcs., Inc. Proj.) Series A: | | | | |
5% 8/15/09 | | 1,000 | | 1,058 |
5% 8/15/10 | | 1,870 | | 1,981 |
Municipal Bonds - continued |
| Principal
Amount (000s) | | Value (Note 1)
(000s) |
Wisconsin - continued |
Wisconsin Trans. Rev.: | | | | |
Series A, 5.7% 7/1/14 (Pre-Refunded to 7/1/06 @ 100) (d) | | $ 2,230 | | $ 2,297 |
5% 7/1/07 | | 1,500 | | 1,564 |
| | 27,540 |
TOTAL MUNICIPAL BONDS (Cost $1,806,102) | 1,813,552 |
Municipal Notes - 0.6% |
| | | |
Michigan - 0.5% |
Michigan Strategic Fund Poll. Cont. Rev. (Gen. Motors Corp. Proj.) Series 1988 A, 4.4%, VRDN (b) | | 8,830 | | 8,830 |
Ohio - 0.1% |
Ohio Poll. Cont. Rev. (Gen. Motors Corp. Proj.) Series 1985, 4.85%, VRDN (b) | | 2,350 | | 2,350 |
TOTAL MUNICIPAL NOTES (Cost $11,180) | | 11,180 |
TOTAL INVESTMENT PORTFOLIO - 96.6% (Cost $1,817,282) | | | 1,824,732 |
NET OTHER ASSETS - 3.4% | | | 63,257 |
NET ASSETS - 100% | | $ 1,887,989 |
Security Type Abbreviation |
VRDN - VARIABLE RATE DEMAND NOTE |
Legend |
(a) Security or a portion of the security purchased on a delayed delivery or when-issued basis. |
(b) The coupon rate shown on floating or adjustable rate securities represents the rate at period end. |
(c) Private activity obligations whose interest is subject to the federal alternative minimum tax for individuals. |
(d) Security collateralized by an amount sufficient to pay interest and principal. |
(e) Restricted securities - Investment in securities not registered under the Securities Act of 1933 (excluding 144A issues). At the end of the period, the value of restricted securities (excluding 144A issues) amounted to $9,217,000 or 0.5% of net assets. |
Additional information on each holding is as follows: |
Security | Acquisition
Date | Acquisition
Cost (000s) |
Univ. of California Revs. (UCLA Med. Ctr. Proj.) 4.55% 12/1/09 | 3/6/02 | $ 8,955 |
Other Information |
The distribution of municipal securities by revenue source, as a percentage of total net assets, is as follows: |
General Obligations | 45.1% |
Electric Utilities | 14.0% |
Escrowed/Pre-Refunded | 8.1% |
Transportation | 6.6% |
Health Care | 5.9% |
Education | 5.2% |
Others* (individually less than 5%) | 15.1% |
| 100.0% |
* Includes net other assets |
See accompanying notes which are an integral part of the financial statements.
Semiannual Report
Financial Statements
Statement of Assets and Liabilities
Amounts in thousands (except per-share amounts) | June 30, 2005 (Unaudited) |
| | |
Assets | | |
Investment in securities, at value (cost $1,817,282) - See accompanying schedule | | $ 1,824,732 |
Cash | | 112,770 |
Receivable for investments sold | | 441 |
Receivable for fund shares sold | | 3,073 |
Interest receivable | | 22,410 |
Prepaid expenses | | 4 |
Other receivables | | 163 |
Total assets | | 1,963,593 |
| | |
Liabilities | | |
Payable for investments purchased
Regular delivery | $ 27,781 | |
Delayed delivery | 41,935 | |
Payable for fund shares redeemed | 3,837 | |
Distributions payable | 1,255 | |
Accrued management fee | 587 | |
Distribution fees payable | 18 | |
Other affiliated payables | 160 | |
Other payables and accrued expenses | 31 | |
Total liabilities | | 75,604 |
| | |
Net Assets | | $ 1,887,989 |
Net Assets consist of: | | |
Paid in capital | | $ 1,881,014 |
Undistributed net investment income | | 156 |
Accumulated undistributed net realized gain (loss) on investments | | (631) |
Net unrealized appreciation (depreciation) on investments | | 7,450 |
Net Assets | | $ 1,887,989 |
See accompanying notes which are an integral part of the financial statements.
Semiannual Report
Financial Statements - continued
Statement of Assets and Liabilities - continued
Amounts in thousands (except per-share amounts) | June 30, 2005 (Unaudited) |
| | |
Calculation of Maximum Offering Price
Class A:
Net Asset Value and redemption price per share
($11,447 ÷ 1,110 shares) | | $ 10.31 |
| | |
Maximum offering price per share (100/96.25 of $10.31) | | $ 10.71 |
Class T:
Net Asset Value and redemption price per share ($20,193 ÷ 1,961 shares) | | $ 10.30 |
| | |
Maximum offering price per share (100/97.25 of $10.30) | | $ 10.59 |
Class B:
Net Asset Value and offering price per share
($3,721 ÷ 361 shares)A | | $ 10.31 |
| | |
Class C:
Net Asset Value and offering price per share
($11,227 ÷ 1,090 shares)A | | $ 10.30 |
| | |
Spartan Short-Intermediate Municipal Income:
Net Asset Value, offering price and redemption price per share ($1,839,829 ÷ 178,659 shares) | | $ 10.30 |
| | |
Institutional Class:
Net Asset Value, offering price and redemption price per share ($1,572 ÷ 152.6 shares) | | $ 10.30 |
A Redemption price per share is equal to net asset value less any applicable contingent deferred sales charge.
See accompanying notes which are an integral part of the financial statements.
Semiannual Report
Statement of Operations
Amounts in thousands | Six months ended June 30, 2005 (Unaudited) |
| | |
Investment Income | | |
Interest | | $ 29,768 |
| | |
Expenses | | |
Management fee | $ 3,535 | |
Transfer agent fees | 751 | |
Distribution fees | 110 | |
Accounting fees and expenses | 183 | |
Independent trustees' compensation | 4 | |
Custodian fees and expenses | 15 | |
Registration fees | 76 | |
Audit | 27 | |
Legal | 7 | |
Miscellaneous | 7 | |
Total expenses before reductions | 4,715 | |
Expense reductions | (436) | 4,279 |
Net investment income | | 25,489 |
Realized and Unrealized Gain (Loss) Net realized gain (loss) on investment securities | | (336) |
Change in net unrealized appreciation (depreciation) on investment securities | | (13,546) |
Net gain (loss) | | (13,882) |
Net increase (decrease) in net assets resulting from operations | | $ 11,607 |
See accompanying notes which are an integral part of the financial statements.
Semiannual Report
Financial Statements - continued
Statement of Changes in Net Assets
Amounts in thousands | Six months ended
June 30, 2005
(Unaudited) | Year ended
December 31,
2004 |
Increase (Decrease) in Net Assets | | |
Operations | | |
Net investment income | $ 25,489 | $ 47,437 |
Net realized gain (loss) | (336) | 4,712 |
Change in net unrealized appreciation (depreciation) | (13,546) | (22,609) |
Net increase (decrease) in net assets resulting
from operations | 11,607 | 29,540 |
Distributions to shareholders from net investment income | (25,523) | (47,598) |
Distributions to shareholders from net realized gain | (549) | (3,486) |
Total distributions | (26,072) | (51,084) |
Share transactions - net increase (decrease) | 12,401 | 37,160 |
Redemption fees | 20 | 65 |
Total increase (decrease) in net assets | (2,044) | 15,681 |
| | |
Net Assets | | |
Beginning of period | 1,890,033 | 1,874,352 |
End of period (including undistributed net investment income of $156 and undistributed net investment income of $190, respectively) | $ 1,887,989 | $ 1,890,033 |
See accompanying notes which are an integral part of the financial statements.
Semiannual Report
Financial Highlights - Class A
| Six months ended
June 30, 2005 | Years ended December 31, |
| (Unaudited) | 2004 | 2003 F |
Selected Per-Share Data | | | |
Net asset value, beginning of period | $ 10.39 | $ 10.50 | $ 10.49 |
Income from Investment Operations | | | |
Net investment income E | .132 | .250 | .115 |
Net realized and unrealized gain (loss) | (.078) | (.090) | .071 |
Total from investment operations | .054 | .160 | .186 |
Distributions from net investment income | (.131) | (.251) | (.111) |
Distributions from net realized gain | (.003) | (.019) | (.065) |
Total distributions | (.134) | (.270) | (.176) |
Redemption fees added to paid in capital E | - H | - H | - H |
Net asset value, end of period | $ 10.31 | $ 10.39 | $ 10.50 |
Total Return B, C, D | .53% | 1.55% | 1.78% |
Ratios to Average Net Assets G | | | |
Expenses before expense reductions | .66% A | .65% | .65% A |
Expenses net of voluntary waivers, if any | .66% A | .65% | .65% A |
Expenses net of all reductions | .61% A | .64% | .64% A |
Net investment income | 2.57% A | 2.41% | 2.52% A |
Supplemental Data | | | |
Net assets, end of period (in millions) | $ 11 | $ 12 | $ 9 |
Portfolio turnover rate | 27% A | 45% | 34% |
A Annualized
B Total returns for periods of less than one year are not annualized.
C Total returns would have been lower had certain expenses not been reduced during the periods shown.
D Total returns do not include the effect of the sales charges.
E Calculated based on average shares outstanding during the period.
F For the period July 23, 2003 (commencement of sale of shares) to December 31, 2003.
G Expense ratios reflect operating expenses of the class. Expenses before reductions do not reflect amounts reimbursed by the investment adviser or reductions from brokerage service arrangements or other expense offset arrangements and do not represent the amount paid by the class during periods when reimbursements or reductions occur. Expense ratios before reductions for start-up periods may not be representative of longer-term operating periods. Expenses net of any voluntary waivers reflect expenses after reimbursement by the investment adviser but prior to reductions from brokerage service arrangements or other expense offset arrangements. Expenses net of all reductions represent the net expenses paid by the class.
H Amount represents less than $.001 per share.
See accompanying notes which are an integral part of the financial statements.
Semiannual Report
Financial Highlights - Class T
| Six months ended
June 30, 2005 | Years ended December 31, |
| (Unaudited) | 2004 | 2003 F |
Selected Per-Share Data | | | |
Net asset value, beginning of period | $ 10.37 | $ 10.48 | $ 10.49 |
Income from Investment Operations | | | |
Net investment income E | .125 | .238 | .110 |
Net realized and unrealized gain (loss) | (.066) | (.089) | .050 |
Total from investment operations | .059 | .149 | .160 |
Distributions from net investment income | (.126) | (.240) | (.105) |
Distributions from net realized gain | (.003) | (.019) | (.065) |
Total distributions | (.129) | (.259) | (.170) |
Redemption fees added to paid in capital E | - H | - H | - H |
Net asset value, end of period | $ 10.30 | $ 10.37 | $ 10.48 |
Total Return B, C, D | .57% | 1.44% | 1.54% |
Ratios to Average Net Assets G | | | |
Expenses before expense reductions | .77% A | .76% | .77% A |
Expenses net of voluntary waivers, if any | .77% A | .76% | .77% A |
Expenses net of all reductions | .72% A | .75% | .76% A |
Net investment income | 2.46% A | 2.30% | 2.41% A |
Supplemental Data | | | |
Net assets, end of period (in millions) | $ 20 | $ 20 | $ 12 |
Portfolio turnover rate | 27% A | 45% | 34% |
A Annualized
B Total returns for periods of less than one year are not annualized.
C Total returns would have been lower had certain expenses not been reduced during the periods shown.
D Total returns do not include the effect of the sales charges.
E Calculated based on average shares outstanding during the period.
F For the period July 23, 2003 (commencement of sale of shares) to December 31, 2003.
G Expense ratios reflect operating expenses of the class. Expenses before reductions do not reflect amounts reimbursed by the investment adviser or reductions from brokerage service arrangements or other expense offset arrangements and do not represent the amount paid by the class during periods when reimbursements or reductions occur. Expense ratios before reductions for start-up periods may not be representative of longer-term operating periods. Expenses net of any voluntary waivers reflect expenses after reimbursement by the investment adviser but prior to reductions from brokerage service arrangements or other expense offset arrangements. Expenses net of all reductions represent the net expenses paid by the class.
H Amount represents less than $.001 per share.
See accompanying notes which are an integral part of the financial statements.
Semiannual Report
Financial Highlights - Class B
| Six months ended
June 30, 2005 | Years ended December 31, |
| (Unaudited) | 2004 | 2003 F |
Selected Per-Share Data | | | |
Net asset value, beginning of period | $ 10.39 | $ 10.49 | $ 10.49 |
Income from Investment Operations | | | |
Net investment income E | .092 | .172 | .081 |
Net realized and unrealized gain (loss) | (.077) | (.080) | .059 |
Total from investment operations | .015 | .092 | .140 |
Distributions from net investment income | (.092) | (.173) | (.075) |
Distributions from net realized gain | (.003) | (.019) | (.065) |
Total distributions | (.095) | (.192) | (.140) |
Redemption fees added to paid in capital E | - H | - H | - H |
Net asset value, end of period | $ 10.31 | $ 10.39 | $ 10.49 |
Total Return B, C, D | .15% | .89% | 1.34% |
Ratios to Average Net Assets G | | | |
Expenses before expense reductions | 1.42% A | 1.40% | 1.40% A |
Expenses net of voluntary waivers, if any | 1.42% A | 1.40% | 1.40% A |
Expenses net of all reductions | 1.37% A | 1.39% | 1.39% A |
Net investment income | 1.80% A | 1.65% | 1.78% A |
Supplemental Data | | | |
Net assets, end of period (in millions) | $ 4 | $ 4 | $ 2 |
Portfolio turnover rate | 27% A | 45% | 34% |
A Annualized
B Total returns for periods of less than one year are not annualized.
C Total returns would have been lower had certain expenses not been reduced during the periods shown.
D Total returns do not include the effect of the contingent deferred sales charge.
E Calculated based on average shares outstanding during the period.
F For the period July 23, 2003 (commencement of sale of shares) to December 31, 2003.
G Expense ratios reflect operating expenses of the class. Expenses before reductions do not reflect amounts reimbursed by the investment adviser or reductions from brokerage service arrangements or other expense offset arrangements and do not represent the amount paid by the class during periods when reimbursements or reductions occur. Expense ratios before reductions for start-up periods may not be representative of longer-term operating periods. Expenses net of any voluntary waivers reflect expenses after reimbursement by the investment adviser but prior to reductions from brokerage service arrangements or other expense offset arrangements. Expenses net of all reductions represent the net expenses paid by the class.
H Amount represents less than $.001 per share.
See accompanying notes which are an integral part of the financial statements.
Semiannual Report
Financial Highlights - Class C
| Six months ended
June 30, 2005 | Years ended December 31, |
| (Unaudited) | 2004 | 2003 F |
Selected Per-Share Data | | | |
Net asset value, beginning of period | $ 10.38 | $ 10.48 | $ 10.49 |
Income from Investment Operations | | | |
Net investment income E | .086 | .159 | .077 |
Net realized and unrealized gain (loss) | (.076) | (.080) | .048 |
Total from investment operations | .010 | .079 | .125 |
Distributions from net investment income | (.087) | (.160) | (.070) |
Distributions from net realized gain | (.003) | (.019) | (.065) |
Total distributions | (.090) | (.179) | (.135) |
Redemption fees added to paid in capital E | - H | - H | - H |
Net asset value, end of period | $ 10.30 | $ 10.38 | $ 10.48 |
Total Return B, C, D | .10% | .77% | 1.20% |
Ratios to Average Net Assets G | | | |
Expenses before expense reductions | 1.53% A | 1.52% | 1.50% A |
Expenses net of voluntary waivers, if any | 1.53% A | 1.52% | 1.50% A |
Expenses net of all reductions | 1.48% A | 1.51% | 1.49% A |
Net investment income | 1.69% A | 1.53% | 1.67% A |
Supplemental Data | | | |
Net assets, end of period (in millions) | $ 11 | $ 11 | $ 8 |
Portfolio turnover rate | 27% A | 45% | 34% |
A Annualized
B Total returns for periods of less than one year are not annualized.
C Total returns would have been lower had certain expenses not been reduced during the periods shown.
D Total returns do not include the effect of the contingent deferred sales charge.
E Calculated based on average shares outstanding during the period.
F For the period July 23, 2003 (commencement of sale of shares) to December 31, 2003.
G Expense ratios reflect operating expenses of the class. Expenses before reductions do not reflect amounts reimbursed by the investment adviser or reductions from brokerage service arrangements or other expense offset arrangements and do not represent the amount paid by the class during periods when reimbursements or reductions occur. Expense ratios before reductions for start-up periods may not be representative of longer-term operating periods. Expenses net of any voluntary waivers reflect expenses after reimbursement by the investment adviser but prior to reductions from brokerage service arrangements or other expense offset arrangements. Expenses net of all reductions represent the net expenses paid by the class.
H Amount represents less than $.001 per share.
See accompanying notes which are an integral part of the financial statements.
Semiannual Report
Financial Highlights - Spartan Short-Intermediate Municipal Income
| Six months ended
June 30, 2005 | Years ended December 31, |
| (Unaudited) | 2004 | 2003 | 2002 | 2001 | 2000 G | 2000 H |
Selected Per-Share Data | | | | | | |
Net asset value, beginning of period | $ 10.38 | $ 10.48 | $ 10.52 | $ 10.27 | $ 10.12 | $ 10.03 | $ 10.00 |
Income from Investment Operations | | | | | | | |
Net investment income D | .140 | .268 | .283 | .336 | .396 F | .139 | .399 |
Net realized and unrealized gain (loss) | (.077) | (.080) | .030 | .317 | .173 F | .092 | .034 |
Total from investment operations | .063 | .188 | .313 | .653 | .569 | .231 | .433 |
Distributions from net investment income | (.140) | (.269) | (.283) | (.339) | (.396) | (.140) | (.400) |
Distributions from net realized gain | (.003) | (.019) | (.070) | (.064) | (.023) | (.001) | - |
Distributions in excess of net realized gain | - | - | - | - | - | - | (.003) |
Total distributions | (.143) | (.288) | (.353) | (.403) | (.419) | (.141) | (.403) |
Redemption fees added to paid in capital | - D, I | - D, I | - D, I | - D, I | - D, I | - | - |
Net asset value,
end of period | $ 10.30 | $ 10.38 | $ 10.48 | $ 10.52 | $ 10.27 | $ 10.12 | $ 10.03 |
Total Return B, C | .61% | 1.82% | 3.01% | 6.47% | 5.70% | 2.32% | 4.45% |
Ratios to Average Net Assets E | | | | | | |
Expenses before expense reductions | .49% A | .49% | .49% | .49% | .49% | .49% A | .55% |
Expenses net of voluntary waivers, if any | .49% A | .48% | .49% | .49% | .49% | .49% A | .54% |
Expenses net of all reductions | .44% A | .47% | .47% | .45% | .41% | .45% A | .54% |
Net investment income | 2.73% A | 2.57% | 2.69% | 3.23% | 3.85% F | 4.17% A | 4.02% |
Supplemental Data | | | | | | |
Net assets,
end of period
(in millions) | $ 1,840 | $ 1,841 | $ 1,843 | $ 1,683 | $ 1,183 | $ 965 | $ 904 |
Portfolio turnover rate | 27% A | 45% | 34% | 38% | 43% | 106% A | 53% |
A Annualized B Total returns for periods of less than one year are not annualized. C Total returns would have been lower had certain expenses not been reduced during the periods shown. D Calculated based on average shares outstanding during the period. E Expense ratios reflect operating expenses of the class. Expenses before reductions do not reflect amounts reimbursed by the investment adviser or reductions from brokerage service arrangements or other expense offset arrangements and do not represent the amount paid by the class during periods when reimbursements or reductions occur. Expenses net of any voluntary waivers reflect expenses after reimbursement by the investment adviser but prior to reductions from brokerage service arrangements or other expense offset arrangements. Expenses net of all reductions represent the net expenses paid by the class. F Effective January 1, 2001, the fund adopted the provisions of the AICPA Audit and Accounting Guide for Investment Companies and began amortizing premium and discount on all debt securities. Per-share data and ratios for periods prior to adoption have not been restated to reflect this change. G For the four months ended December 31. H For the year ended August 31. I Amount represents less than $.001 per share. |
See accompanying notes which are an integral part of the financial statements.
Semiannual Report
Financial Highlights - Institutional Class
| Six months ended
June 30, 2005 | Years ended December 31, |
| (Unaudited) | 2004 | 2003 E |
Selected Per-Share Data | | | |
Net asset value, beginning of period | $ 10.38 | $ 10.49 | $ 10.49 |
Income from Investment Operations | | | |
Net investment income D | .139 | .265 | .125 |
Net realized and unrealized gain (loss) | (.076) | (.088) | .059 |
Total from investment operations | .063 | .177 | .184 |
Distributions from net investment income | (.140) | (.268) | (.119) |
Distributions from net realized gain | (.003) | (.019) | (.065) |
Total distributions | (.143) | (.287) | (.184) |
Redemption fees added to paid in capital D | - G | - G | - G |
Net asset value, end of period | $ 10.30 | $ 10.38 | $ 10.49 |
Total Return B, C | .61% | 1.71% | 1.77% |
Ratios to Average Net Assets F | | | |
Expenses before expense reductions | .49% A | .49% | .48% A |
Expenses net of voluntary waivers, if any | .49% A | .49% | .48% A |
Expenses net of all reductions | .45% A | .48% | .47% A |
Net investment income | 2.73% A | 2.57% | 2.69% A |
Supplemental Data | | | |
Net assets, end of period (000 omitted) | $ 1,572 | $ 1,253 | $ 414 |
Portfolio turnover rate | 27% A | 45% | 34% |
A Annualized
B Total returns for periods of less than one year are not annualized.
C Total returns would have been lower had certain expenses not been reduced during the periods shown.
D Calculated based on average shares outstanding during the period.
E For the period July 23, 2003 (commencement of sale of shares) to December 31, 2003.
F Expense ratios reflect operating expenses of the class. Expenses before reductions do not reflect amounts reimbursed by the investment adviser or reductions from brokerage service arrangements or other expense offset arrangements and do not represent the amount paid by the class during periods when reimbursements or reductions occur. Expense ratios before reductions for start-up periods may not be representative of longer-term operating periods. Expenses net of any voluntary waivers reflect expenses after reimbursement by the investment adviser but prior to reductions from brokerage service arrangements or other expense offset arrangements. Expenses net of all reductions represent the net expenses paid by the class.
G Amount represents less than $.001 per share.
See accompanying notes which are an integral part of the financial statements.
Semiannual Report
Notes to Financial Statements
For the period ended June 30, 2005 (Unaudited)
(Amounts in thousands except ratios)
1. Significant Accounting Policies.
Spartan Short-Intermediate Municipal Income Fund (the fund) is a fund of Fidelity Municipal Trust (the trust) and is authorized to issue an unlimited number of shares. On July 21, 2005 the Board of Trustees approved a change in the name of Spartan Short-Intermediate Municipal Income Fund to Fidelity Short-Intermediate Municipal Income Fund effective August 15, 2005. The trust is registered under the Investment Company Act of 1940, as amended (the 1940 Act), as an open-end management investment company organized as a Massachusetts business trust.
The fund offers Class A, Class T, Class B, Class C, Spartan Short-Intermediate Municipal Income and Institutional Class shares, each of which has equal rights as to assets and voting privileges. Each class has exclusive voting rights with respect to matters that affect that class. Class B shares will automatically convert to Class A shares after a holding period of four years from the initial date of purchase. Investment income, realized and unrealized capital gains and losses, the common expenses of the fund, and certain fund-level expense reductions, if any, are allocated on a pro rata basis to each class based on the relative net assets of each class to the total net assets of the fund. Each class differs with respect to transfer agent and distribution and service plan fees incurred. Certain expense reductions also differ by class.
The financial statements have been prepared in conformity with accounting principles generally accepted in the United States of America, which require management to make certain estimates and assumptions at the date of the financial statements. The following summarizes the significant accounting policies of the fund:
Security Valuation. Net asset value per share (NAV calculation) is calculated as of the close of business of the New York Stock Exchange, normally 4:00 p.m. Eastern time. Debt securities, including restricted securities, are valued on the basis of information provided by a pricing service. Pricing services use valuation matrices that incorporate both dealer-supplied valuations and valuation models. If prices are not readily available or do not accurately reflect fair value for a security, or if a security's value has been materially affected by events occurring after the close of the exchange or market on which the security is principally traded, that security may be valued by another method that the Board of Trustees believes accurately reflects fair value. A security's valuation may differ depending on the method used for determining value. Price movements in futures contracts and ADRs, market and trading trends, the bid/ask quotes of brokers and off-exchange institutional trading may be reviewed in the course of making a good faith determination of a security's fair value. Short-term securities with remaining maturities of sixty days or less for which quotations are not readily available are valued on the basis of amortized cost. Investments in open-end investment companies are valued at their net asset value each business day.
Semiannual Report
Notes to Financial Statements (Unaudited) - continued
(Amounts in thousands except ratios)
1. Significant Accounting Policies - continued
Investment Transactions and Income. Security transactions are accounted for as of trade date. Gains and losses on securities sold are determined on the basis of identified cost. Interest income is accrued as earned. Interest income includes coupon interest and amortization of premium and accretion of discount on debt securities.
Expenses. Most expenses of the trust can be directly attributed to a fund. Expenses which cannot be directly attributed are apportioned among each fund in the trust.
Income Tax Information and Distributions to Shareholders. Each year, the fund intends to qualify as a regulated investment company by distributing all of its taxable income and realized gains under Subchapter M of the Internal Revenue Code. As a result, no provision for income taxes is required in the accompanying financial statements.
Dividends are declared daily and paid monthly from net investment income. Distributions from realized gains, if any, are recorded on the ex-dividend date. Income dividends and capital gain distributions are declared separately for each class. Income and capital gain distributions are determined in accordance with income tax regulations, which may differ from generally accepted accounting principles. In addition, the fund claimed a portion of the payment made to redeeming shareholders as a distribution for income tax purposes. Capital accounts within the financial statements are adjusted for permanent book-tax differences. These adjustments have no impact on net assets or the results of operations. Temporary book-tax differences will reverse in a subsequent period.
Book-tax differences are primarily due to market discount and deferred trustees compensation.
The fund purchases municipal securities whose interest, in the opinion of the issuer, is free from federal income tax. There is no assurance that the Internal Revenue Service (IRS) will agree with this opinion. In the event the IRS determines that the issuer does not comply with relevant tax requirements, interest payments from a security could become federally taxable, possibly retroactively to the date the security was issued.
The federal tax cost of investments and unrealized appreciation (depreciation) as of period end were as follows:
Unrealized appreciation | $ 14,114 | |
Unrealized depreciation | (6,664) | |
Net unrealized appreciation (depreciation) | $ 7,450 | |
Cost for federal income tax purposes | $ 1,817,282 | |
Semiannual Report
1. Significant Accounting Policies - continued
Short-Term Trading (Redemption) Fees. Shares held in the fund less than 30 days are subject to a redemption fee equal to .50% of the proceeds of the redeemed shares. All redemption fees, including any estimated redemption fees paid by Fidelity Management & Research Company (FMR), are retained by the fund and accounted for as an addition to paid in capital.
2. Operating Policies.
Delayed Delivery Transactions and When-Issued Securities. The fund may purchase or sell securities on a delayed delivery or when-issued basis. Payment and delivery may take place after the customary settlement period for that security. The price of the underlying securities and the date when the securities will be delivered and paid for are fixed at the time the transaction is negotiated. During the time a delayed delivery sell is outstanding, the contract is marked-to-market daily and equivalent deliverable securities are held for the transaction. The value of the securities purchased on a delayed delivery or when-issued basis are identified as such in the fund's Schedule of Investments. The fund may receive compensation for interest forgone in the purchase of a delayed delivery or when-issued security. With respect to purchase commitments, the fund identifies securities as segregated in its records with a value at least equal to the amount of the commitment. Losses may arise due to changes in the value of the underlying securities or if the counterparty does not perform under the contract's terms, or if the issuer does not issue the securities due to political, economic, or other factors.
Restricted Securities. The fund may invest in securities that are subject to legal or contractual restrictions on resale. These securities generally may be resold in transactions exempt from registration or to the public if the securities are registered. Disposal of these securities may involve time-consuming negotiations and expense, and prompt sale at an acceptable price may be difficult. Information regarding restricted securities is included at the end of the fund's Schedule of Investments.
3. Purchases and Sales of Investments.
Purchases and sales of securities, other than short-term securities and U.S. government securities, aggregated $251,008 and $337,309, respectively.
4. Fees and Other Transactions with Affiliates.
Management Fee. FMR and its affiliates provide the fund with investment management related services for which the fund pays a monthly management fee. The management fee is the sum of an individual fund fee rate that is based on an annual rate of .25% of the fund's average net assets and a group fee rate that averaged .12% during the period. The group fee rate is based upon the average net assets of all the mutual funds
Semiannual Report
Notes to Financial Statements (Unaudited) - continued
(Amounts in thousands except ratios)
4. Fees and Other Transactions with Affiliates - continued
Management Fee - continued
advised by FMR. The group fee rate decreases as assets under management increase and increases as assets under management decrease. For the period, the total annualized management fee rate was .38% of the fund's average net assets.
Distribution and Service Plan. In accordance with Rule 12b-1 of the 1940 Act, the fund has adopted separate Distribution and Service Plans for each class of shares. Certain classes pay Fidelity Distributors Corporation (FDC), an affiliate of FMR, separate Distribution and Service Fees, each of which is based on an annual percentage of each class' average net assets. In addition, FDC may pay financial intermediaries for selling shares of the fund and providing shareholder support services. For the period, the Distribution and Service Fee rates and the total amounts paid to and retained by FDC were as follows:
| Distribution
Fee | Service
Fee | Paid to
FDC | Retained
by FDC |
Class A | 0% | .15% | $ 9 | $ - |
Class T | 0% | .25% | 26 | - |
Class B | .65% | .25% | 17 | 13 |
Class C | .75% | .25% | 58 | 23 |
| | | $ 110 | $ 36 |
Sales Load. FDC receives a front-end sales charge of up to 3.75% for selling Class A shares, and 2.75% for selling Class T shares, some of which is paid to financial intermediaries for selling shares of the fund. FDC receives the proceeds of contingent deferred sales charges levied on Class A, Class T, Class B, and Class C redemptions. These charges depend on the holding period. The deferred sales charges range from 3% to 1% for Class B, 1% for Class C, and .25% for certain purchases of Class A and Class T shares.
For the period, sales charge amounts retained by FDC were as follows:
| Retained
by FDC |
Class A | $ 3 |
Class T | 3 |
Class B* | 3 |
Class C* | 4 |
| $ 13 |
* When Class B and Class C shares are initially sold, FDC pays commissions from its own resources to financial intermediaries through which the sales are made.
Semiannual Report
4. Fees and Other Transactions with Affiliates - continued
Transfer Agent and Accounting Fees. Citibank, N.A. (Citibank) is the custodian, transfer agent, and shareholder servicing agent for the fund's Class A, Class T, Class B, Class C, Spartan Short-Intermediate Municipal Income and Institutional Class shares. Citibank has entered into a sub-arrangement with Fidelity Investments Institutional Operations Company, Inc. (FIIOC), an affiliate of FMR, with respect to all classes of the fund, except for Spartan Short-Intermediate Municipal Income, to perform the transfer, dividend disbursing, and shareholder servicing agent functions. Citibank has also entered into a sub-arrangement with Fidelity Service Company, Inc. (FSC), an affiliate of FMR, with respect to Spartan Short-Intermediate Municipal Income, to perform the transfer, dividend disbursing, and shareholder servicing agent functions. FIIOC and FSC receive account fees and asset-based fees that vary according to the account size and type of account of the shareholders of the respective classes of the fund. All fees are paid to FIIOC by Citibank, which is reimbursed by each class for such payments. FIIOC and FSC pay for typesetting, printing and mailing of shareholder reports, except proxy statements. For the period, each class paid the following transfer agent fees:
| Amount | % of
Average
Net Assets |
Class A | $ 5 | .09* |
Class T | 11 | .10* |
Class B | 2 | .10* |
Class C | 7 | .11* |
Spartan Short-Intermediate Municipal Income | 725 | .08* |
Institutional Class | 1 | .08* |
| $ 751 | |
* Annualized
Citibank also has a sub-arrangement with FSC to maintain the fund's accounting records. The fee is based on the level of average net assets for the month.
Central Funds. The fund may invest in affiliated Central Funds managed by Fidelity Investments Money Management, Inc. (FIMM), an affiliate of FMR. The Central Funds are open-end investment companies available only to investment companies and other accounts managed by FMR and its affiliates. The Money Market Central Funds seek preservation of capital and current income. The Central Funds do not pay a management fee. Income distributions earned by the fund are recorded as income in the accompanying financial statements and totaled $238 for the period.
Semiannual Report
Notes to Financial Statements (Unaudited) - continued
(Amounts in thousands except ratios)
5. Committed Line of Credit.
The fund participates with other funds managed by FMR in a $4.2 billion credit facility (the "line of credit") to be utilized for temporary or emergency purposes to fund shareholder redemptions or for other short-term liquidity purposes. The fund has agreed to pay commitment fees on its pro rata portion of the line of credit. During the period, there were no borrowings on this line of credit.
6. Expense Reductions.
FMR voluntarily agreed to reimburse each class to the extent annual operating expenses exceeded certain levels of average net assets as noted in the table below. Some expenses, for example interest expense, are excluded from this reimbursement.
| Expense
Limitations | Reimbursement
from adviser |
Class C | 1.53% | - |
In addition, through arrangements with the fund's custodian and each class' transfer agent, credits realized as a result of uninvested cash balances were used to reduce the fund's expenses. During the period, these credits reduced the fund's custody and accounting expenses by $15 and $157, respectively. During the period, credits reduced each class' transfer agent expense as noted in the table below.
| Transfer Agent
expense reduction | |
Class A | $ 2 | |
Class T | 3 | |
Class B | 1 | |
Class C | 1 | |
Spartan Short-Intermediate Municipal Income | 257 | |
Institutional Class | - | |
| $ 264 | |
7. Other.
The fund's organizational documents provide former and current trustees and officers with a limited indemnification against liabilities arising in connection with the performance of their duties to the fund. In the normal course of business, the fund may also enter into contracts that provide general indemnifications. The fund's maximum exposure under these arrangements is unknown as this would be dependent on future claims that may be made against the fund. The risk of material loss from such claims is considered remote.
Semiannual Report
8. Distributions to Shareholders.
Distributions to shareholders of each class were as follows:
| Six months ended
June 30, 2005 | Year ended
December 31, 2004 |
From net investment income | | |
Class A | $ 151 | $ 303 |
Class T | 249 | 403 |
Class B | 35 | 58 |
Class C | 99 | 160 |
Spartan Short-Intermediate Municipal Income | 24,972 | 46,653 |
Institutional Class | 17 | 21 |
Total | $ 25,523 | $ 47,598 |
From net realized gain | | |
Class A | $ 4 | $ 23 |
Class T | 6 | 36 |
Class B | 1 | 7 |
Class C | 3 | 20 |
Spartan Short-Intermediate Municipal Income | 534 | 3,398 |
Institutional Class | 1 | 2 |
Total | $ 549 | $ 3,486 |
9. Share Transactions.
Transactions for each class of shares were as follows:
| Shares | Dollars |
| Six months ended
June 30, 2005 | Year ended
December 31, 2004 | Six months ended
June 30, 2005 | Year ended
December 31, 2004 |
Class A | | | | |
Shares sold | 164 | 1,095 | $ 1,695 | $ 11,465 |
Reinvestment of distributions | 12 | 24 | 122 | 253 |
Shares redeemed | (267) | (785) | (2,748) | (8,128) |
Net increase (decrease) | (91) | 334 | $ (931) | $ 3,590 |
Class T | | | | |
Shares sold | 318 | 1,569 | $ 3,273 | $ 16,393 |
Reinvestment of distributions | 17 | 30 | 179 | 309 |
Shares redeemed | (310) | (818) | (3,187) | (8,551) |
Net increase (decrease) | 25 | 781 | $ 265 | $ 8,151 |
Class B | | | | |
Shares sold | 41 | 214 | $ 415 | $ 2,231 |
Reinvestment of distributions | 2 | 4 | 22 | 42 |
Shares redeemed | (50) | (84) | (513) | (870) |
Net increase (decrease) | (7) | 134 | $ (76) | $ 1,403 |
Semiannual Report
Notes to Financial Statements (Unaudited) - continued
(Amounts in thousands except ratios)
9. Share Transactions - continued
| Shares | Dollars |
| Six months ended
June 30, 2005 | Year ended
December 31, 2004 | Six months ended
June 30, 2005 | Year ended
December 31, 2004 |
Class C | | | | |
Shares sold | 289 | 658 | $ 2,982 | $ 6,848 |
Reinvestment of distributions | 6 | 10 | 59 | 103 |
Shares redeemed | (301) | (295) | (3,100) | (3,054) |
Net increase (decrease) | (6) | 373 | $ (59) | $ 3,897 |
Spartan Short-Intermediate Municipal Income | | | | |
Shares sold | 27,858 | 75,115 | $ 287,044 | $ 784,282 |
Reinvestment of distributions | 1,749 | 3,669 | 17,998 | 38,189 |
Shares redeemed | (28,363) | (77,123) | (292,167) | (803,196) |
Net increase (decrease) | 1,244 | 1,661 | $ 12,875 | $ 19,275 |
Institutional Class | | | | |
Shares sold | 66 | 110 | $ 679 | $ 1,153 |
Reinvestment of distributions | 1 | 1 | 6 | 8 |
Shares redeemed | (35) | (30) | (358) | (317) |
Net increase (decrease) | 32 | 81 | $ 327 | $ 844 |
Semiannual Report
Board Approval of Investment Advisory Contracts and Management Fees
Spartan Short-Intermediate Municipal Income Fund
Each year, typically in June, the Board of Trustees, including the independent Trustees (together, the Board), votes on the renewal of the management contract and sub-advisory agreements (together, the Advisory Contracts) for the fund. The Board, assisted by the advice of fund counsel and independent Trustees' counsel, requests and considers a broad range of information throughout the year.
The Board meets regularly each month except August and takes into account throughout the year matters bearing on Advisory Contracts. The Board, acting directly and through its separate committees, considers at each of its meetings factors that are relevant to the annual renewal of the fund's Advisory Contracts, including the services and support provided to the fund and its shareholders by Fidelity. At the time of the renewal, the Board had 11 standing committees, each composed of independent Trustees with varying backgrounds, to which the Board has assigned specific subject matter responsibilities in order to enhance effective decision-making by the Board. Each committee has adopted a written charter outlining the structure and purposes of the committee. One such committee, the Fixed-Income Contract Committee, meets periodically during the first six months of each year and as necessary to consider matters specifically related to the annual renewal of Advisory Contracts. The committee requests and receives information on, and makes recommendations to the independent Trustees concerning, the approval and annual review of the Advisory Contracts.
At its June 2005 meeting, the Board of Trustees, including the independent Trustees, unanimously determined to renew the Advisory Contracts for the fund. In reaching its determination, the Board considered all factors it believed relevant, including (1) the nature, extent, and quality of the services to be provided to the fund and its shareholders by Fidelity (including the investment performance of the fund); (2) the competitiveness of the management fee and total expenses of the fund; (3) the total costs of the services to be provided by and the profits to be realized by the investment adviser and its affiliates from the relationship with the fund; (4) the extent to which economies of scale would be realized as the fund grows; and (5) whether fee levels reflect these economies of scale, if any, for the benefit of fund shareholders.
In determining whether to renew the Advisory Contracts for the fund, the Board ultimately reached a determination, with the assistance of fund counsel and independent Trustees' counsel, that the renewal of the Advisory Contracts and the compensation to be received by Fidelity under the management contract is consistent with Fidelity's fiduciary duty under applicable law. In addition to evaluating the specific factors noted above, the Board, in reaching its determination, is aware that shareholders in the fund have a broad range of investment choices available to them, including a wide choice among mutual funds offered by competitors to Fidelity, and that the fund's shareholders, with the opportunity to review and weigh the disclosure provided by the fund in its prospectus and other public disclosures, have chosen to invest in this fund, managed by Fidelity.
Semiannual Report
Board Approval of Investment Advisory Contracts and
Management Fees - continued
Nature, Extent, and Quality of Services Provided by Fidelity. The Board considered staffing within the investment adviser, FMR, and the sub-advisers (together, the Investment Advisers), including the background of the fund's portfolio manager and the fund's investment objective and discipline. The independent Trustees also had discussions with senior management of Fidelity's investment operations and investment groups. The Board considered the structure of the portfolio manager compensation program and whether this structure provides appropriate incentives.
Fidelity Resources Dedicated to Investment Management and Support Services. The Board reviewed the size, education, and experience of the Investment Advisers' investment staff, their use of technology, and the Investment Advisers' approach to recruiting, training, and retaining portfolio managers and other research, advisory, and management personnel. The Board considered Fidelity's extensive global research capabilities that enable the Investment Advisers to aggregate data from various sources in an effort to produce positive investment results. The Board noted that Fidelity's analysts have access to a variety of technological tools that enable them to perform both fundamental and quantitative analysis and to specialize in various disciplines. The Board also considered that Fidelity's portfolio managers and analysts have access to daily portfolio attribution that allows for monitoring of a fund's portfolio, as well as an electronic communication system that provides immediate real-time access to research concerning issuers and credit enhancers.
Shareholder and Administrative Services. The Board considered the nature, extent, quality, and cost of administrative, distribution, and shareholder services performed by the Investment Advisers and their affiliates under the Advisory Contracts and under separate agreements covering transfer agency and pricing and bookkeeping services for the fund. The Board also considered the nature and extent of the Investment Advisers' supervision of third party service providers, principally custodians and subcustodians. The Board reviewed the allocation of fund brokerage, including allocations to brokers affiliated with the Investment Advisers. The Board also considered the resources devoted to, and the record of compliance with, the fund's compliance policies and procedures.
The Board noted that the growth of fund assets across the complex allows Fidelity to reinvest in the development of services designed to enhance the value or convenience of the Fidelity funds as investment vehicles. These services include 24-hour access to account information and market information through phone representatives and over the Internet, and investor education materials and asset allocation tools.
Investment in a Large Fund Family. The Board considered the benefits to shareholders of investing in a Fidelity fund, including the benefits of investing in a fund that is part of a large family of funds offering a variety of investment disciplines and providing for a large variety of mutual fund investor services. For example, fund shareholders are offered the privilege of exchanging shares of the fund for shares of other Fidelity funds, as set forth in the fund's prospectus, without paying an additional sales charge. The Board noted that, since the last Advisory Contract renewals in June 2004, Fidelity has taken a number of actions that benefited particular funds, including (i) voluntarily deciding in 2004 to stop using "soft" commission dollars to pay for market data and, instead, to pay for that data out of its own resources, (ii) contractually agreeing to impose management fee reductions and expense limitations on its five Spartan stock index funds and its stock index fund available through variable insurance products, (iii) contractually agreeing to eliminate the management fees on the Fidelity Freedom Funds and the Fidelity Advisor Freedom Funds, (iv) contractually agreeing to reduce the management fees on most of its investment-grade taxable bond funds, and (v) contractually agreeing to impose expense limitations on its retail and Spartan investment-grade taxable bond funds.
Semiannual Report
Investment Performance. The Board considered whether the fund has operated within its investment objective, as well as its record of compliance with its investment restrictions. It also reviewed the fund's absolute investment performance for each class, as well as the fund's relative investment performance for each class measured against (i) a broad-based securities market index, and (ii) a peer group of mutual funds deemed appropriate by the Board over multiple periods. The following charts considered by the Board show, over the one-, three-, and five-year periods ended December 31, 2004, as applicable, the returns of Class C and the retail class of the fund, the returns of a broad-based securities market index ("benchmark"), and a range of returns of a peer group of mutual funds identified by Lipper Inc. as having an investment objective similar to that of the fund. The returns of Class C and the retail class represent the performance of classes with the highest and lowest 12b-1 fees, respectively (not necessarily with the highest and lowest total expenses). The box within each chart shows the 25th percentile return (bottom of box) and the 75th percentile return (top of box) of the Lipper peer group. The percentage beaten numbers noted below each chart correspond to the percentile box and represent the percentage of funds in the Lipper peer group whose performance was equal to or lower than that of the class indicated.
Semiannual Report
Board Approval of Investment Advisory Contracts and
Management Fees - continued
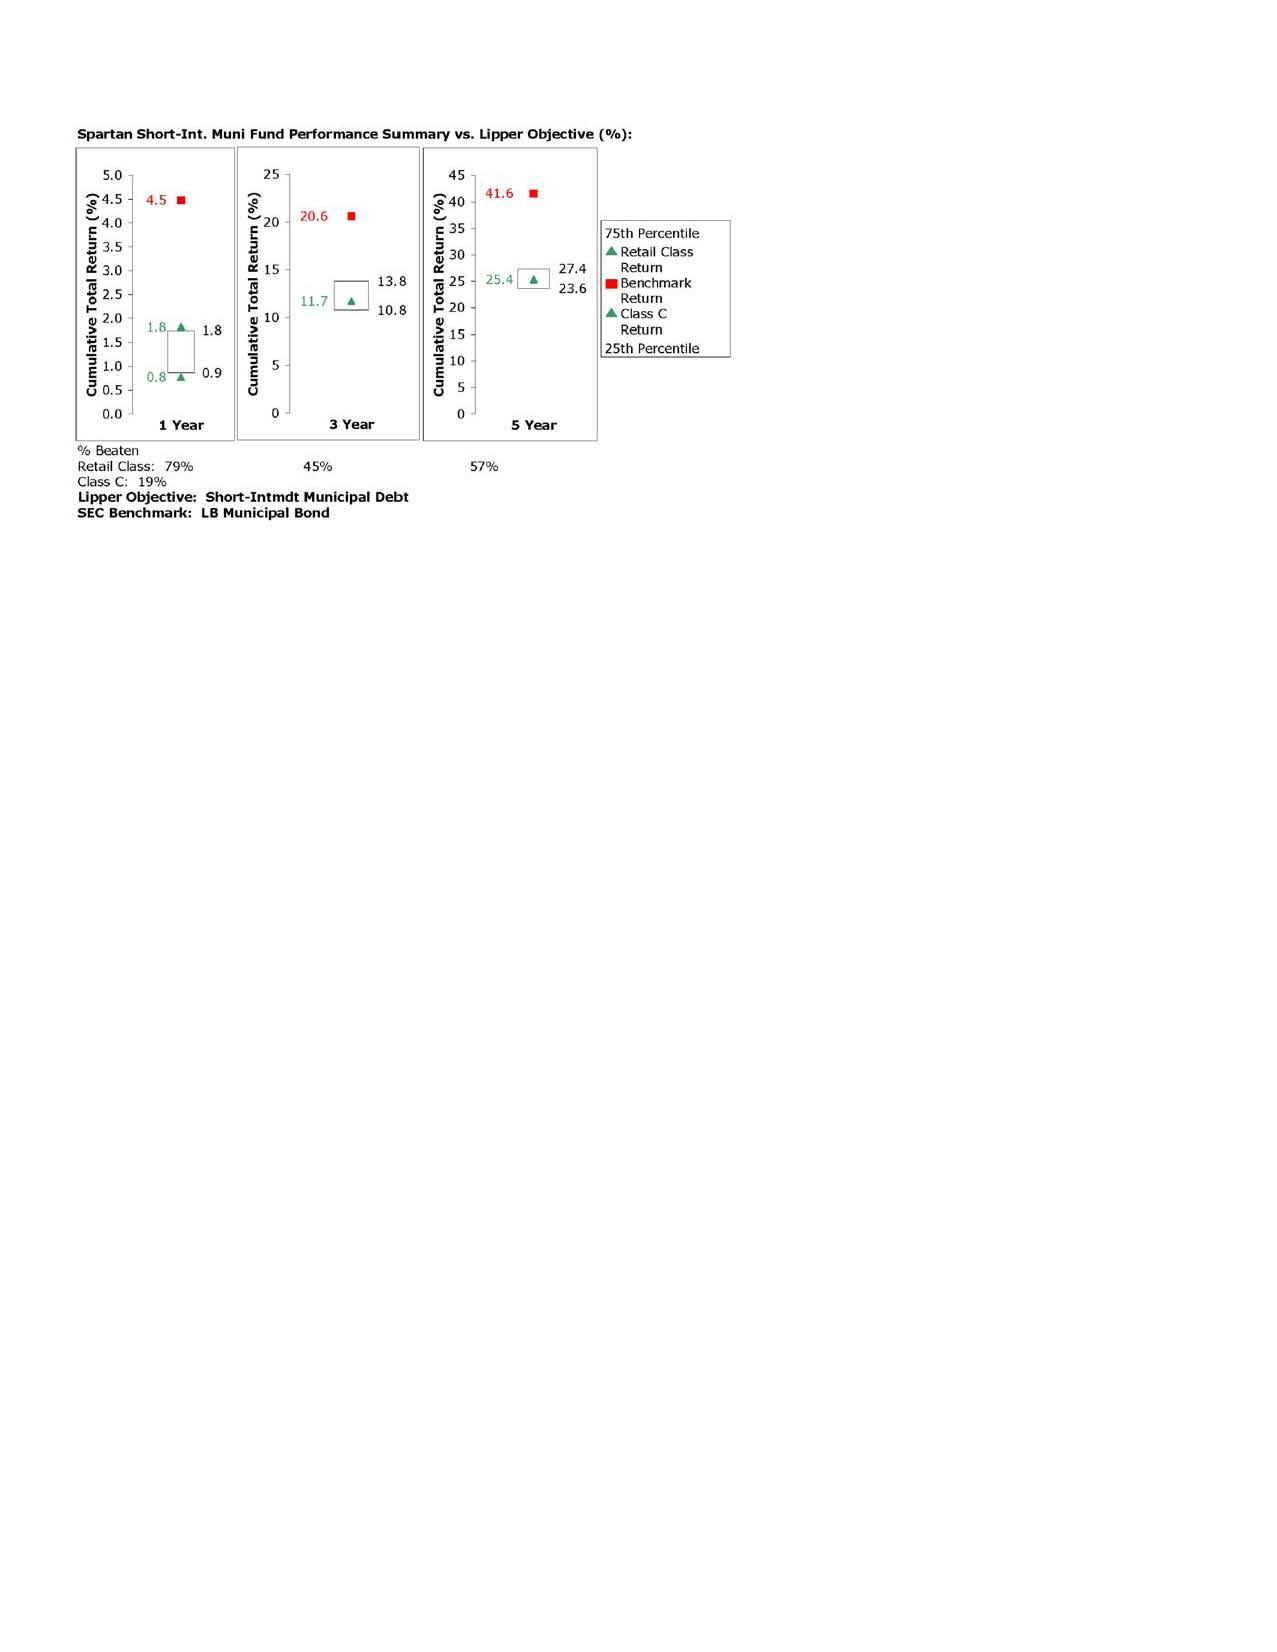
The Board noted that the relative investment performance of the retail class of the fund has compared favorably to its Lipper peer group over time. The Board also noted that the investment performance of the retail class of the fund was lower than its benchmark over time. The Board considered that the variations in performance among the fund's classes reflect the variations in class expenses, which result in lower performance for higher expense classes.
Based on its review, and giving particular weight to the nature and quality of the resources dedicated by the Investment Advisers to maintain and improve relative performance, the Board concluded that the nature, extent, and quality of the services provided by Fidelity will benefit the fund's shareholders, particularly in light of the Board's view that the fund's shareholders benefit from investing in a fund that is part of a large family of funds offering a variety of investment disciplines and services.
Competitiveness of Management Fee and Total Fund Expenses. The Board considered the fund's management fee and total expenses compared to "mapped groups" of competitive funds and classes. Fidelity creates "mapped groups" by combining similar Lipper investment objective categories that have comparable management fee characteristics. Combining Lipper investment objective categories aids the Board's management fee and total expense comparisons by broadening the competitive group used for comparison and by reducing the number of universes to which various Fidelity funds are compared.
The Board considered two proprietary management fee comparisons for the 12-month periods shown in the chart below. The group of Lipper funds used by the Board for management fee comparisons is referred to below as the "Total Mapped Group" and, for the reasons explained above, is broader than the Lipper peer group used by the Board for performance comparisons. The Total Mapped Group comparison focuses on a fund's standing relative to the total universe of comparable funds available to investors, in terms of gross management fees before expense reimbursements or caps. "TMG %" represents the percentage of funds in the Total Mapped Group that had management fees that were lower than the fund's. For example, a TMG % of 12% would mean that 88% of the funds in the Total Mapped Group had higher management fees than the fund. The "Asset-Size Peer Group" (ASPG) comparison focuses on a fund's standing relative to non-Fidelity funds similar in size to the fund within the Total Mapped Group. The ASPG represents at least 15% of the funds in the Total Mapped Group with comparable asset size and management fee characteristics, subject to a minimum of 50 funds (or all funds in the Total Mapped Group if fewer than 50). Additional information, such as the ASPG quartile ("quadrant") in which the fund's management fee ranked, is also included in the chart and considered by the Board.
Semiannual Report
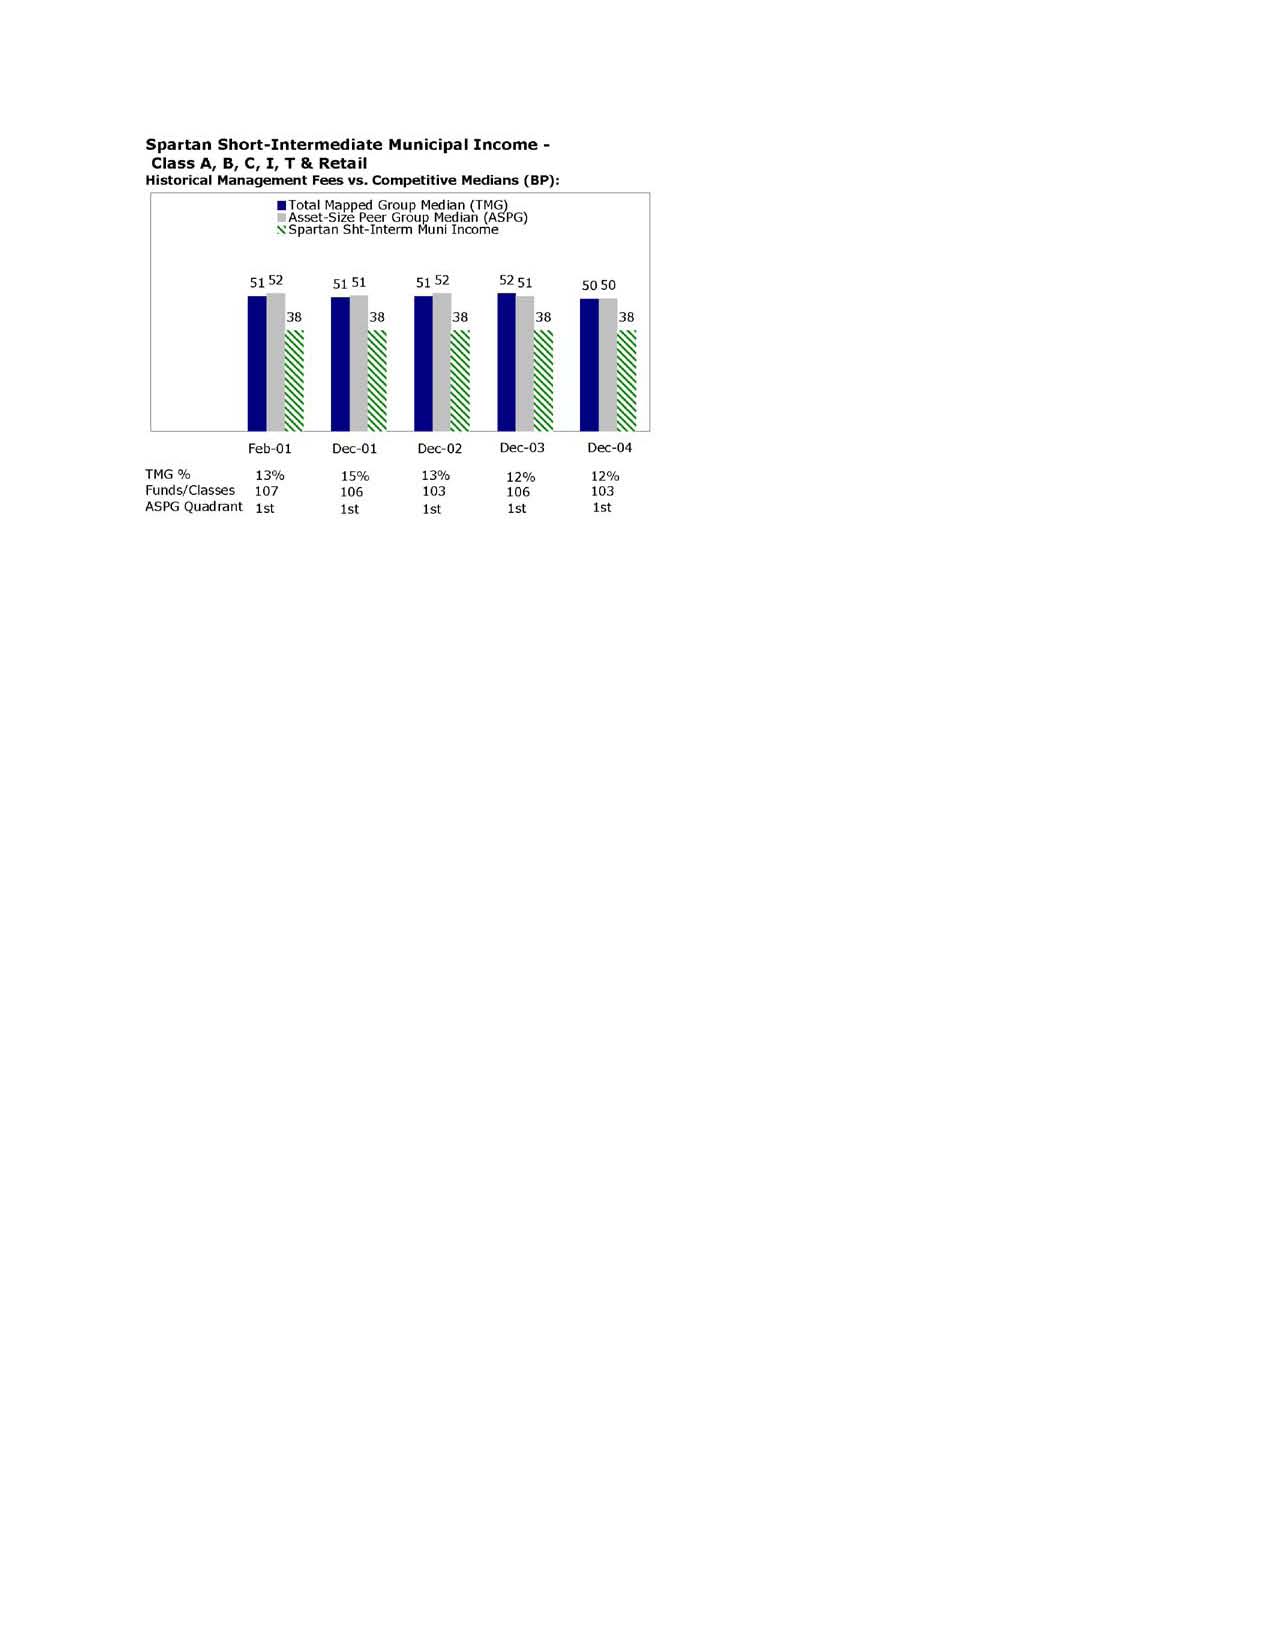
The Board noted that the fund's management fee ranked below the median of its Total Mapped Group and below the median of its ASPG for 2004. Based on its review, the Board concluded that the fund's management fee was fair and reasonable in light of the services that the fund receives and the other factors considered.
In its review of each class's total expenses, the Board considered the fund's management fee as well as other fund or class expenses, as applicable, such as transfer agent fees, pricing and bookkeeping fees, fund-paid 12b-1 fees, and custodial, legal, and audit fees. The Board also noted the effects of any waivers and reimbursements on fees and expenses. As part of its review, the Board also considered current and historical total expenses of each class of the fund compared to competitive fund median expenses. Each class of the fund is compared to those funds and classes in the Total Mapped Group (used by the Board for management fee comparisons) that have a similar sales load structure.
Semiannual Report
Board Approval of Investment Advisory Contracts and
Management Fees - continued
The Board noted that the total expenses of each of Class A, Class T, Class B, Spartan Short-Intermediate Municipal Income Fund (retail class), and Institutional Class ranked below its competitive median for 2004, and the total expenses of Class C ranked above its competitive median for 2004. The Board noted that the fund offers multiple classes, each of which has a different sales load and 12b-1 fee structure, and that the multiple structures are intended to offer a range of pricing options for the intermediary market. The Board also noted that the total expenses of the classes vary primarily by the level of their 12b-1 fees, although differences in transfer agent fees may also cause expenses to vary from class to class.
In its review of total expenses, the Board also considered Fidelity fee structures and other information on clients that FMR and its affiliates service in other competitive markets, such as other mutual funds advised or subadvised by FMR or its affiliates, pension plan clients, and other institutional clients.
Based on its review, the Board concluded that the total expenses for each class of the fund were reasonable, although in one case above the median of the universe presented for comparison, in light of the services that the fund and its shareholders receive and the other factors considered.
Costs of the Services and Profitability. The Board considered the revenues earned and the expenses incurred by Fidelity in conducting the business of developing, marketing, distributing, managing, administering and servicing the fund and its shareholders. The Board also considered the level of Fidelity's profits in respect of all the Fidelity funds.
On an annual basis, FMR presents to the Board Fidelity's profitability for the fund. Fidelity calculates the profitability for each fund, as well as aggregate profitability for groups of Fidelity funds and all Fidelity funds, using a series of detailed revenue and cost allocation methodologies which originate with the audited books and records of Fidelity. The Audit Committee of the Board reviews any significant changes from the prior year's methodologies.
PricewaterhouseCoopers LLP (PwC), independent registered accounting firm and auditor to Fidelity and certain Fidelity funds, has been engaged annually by the Board as part of the Board's assessment of the results of Fidelity's profitability analysis. PwC's engagement includes the review and assessment of Fidelity's methodologies used in determining the revenues and expenses attributable to Fidelity's mutual fund business, and completion of agreed-upon procedures surrounding the mathematical accuracy of fund profitability and its conformity to allocation methodologies. After considering PwC's reports issued under the engagement and information provided by Fidelity, the Board believes that while other allocation methods may also be reasonable, Fidelity's profitability methodologies are reasonable in all material respects.
Semiannual Report
The Board has also reviewed Fidelity's non-fund businesses and any fall-out benefits related to the mutual fund business as well as cases where Fidelity's affiliates may benefit from or be related to the fund's business. In addition, a special committee of the Board reviewed services provided to Fidelity by its affiliates and determined that the fees that Fidelity paid for such services were reasonable.
The Board considered the costs of the services provided by and the profits realized by Fidelity in connection with the operation of the fund and determined that the amount of profit is a fair entrepreneurial profit for the management of the fund.
Economies of Scale. The Board considered whether there have been economies of scale in respect of the management of the Fidelity funds, whether the Fidelity funds (including the fund) have appropriately benefited from any such economies of scale, and whether there is potential for realization of any further economies of scale. The Board considered the extent to which the fund will benefit from economies of scale through increased services to the fund, through waivers or reimbursements, or through fee or expense reductions, including reductions that occur through operation of the transfer agent agreement. The transfer agent fee varies in part based on the number of accounts in the fund. If the number of accounts decreases or the average account size increases, the overall transfer agent fee rate decreases.
The Board recognized that the fund's management contract incorporates a "group fee" structure, which provides for lower fee rates as total fund assets under FMR's management increase, and for higher fee rates as total fund assets under FMR's management decrease. The Board considered that the group fee is designed to deliver the benefits of economies of scale to fund shareholders when total fund assets increase, even if assets of any particular fund are unchanged or have declined, because some portion of Fidelity's costs are attributable to services provided to all Fidelity funds, and all funds benefit if those costs can be allocated among more assets. The Board concluded that, given the group fee structure, fund shareholders will achieve a certain level of economies of scale as assets under FMR's management increase at the fund complex level, regardless of whether Fidelity achieves any such economies of scale.
The Board further concluded that any potential economies of scale are being shared between fund shareholders and Fidelity in an appropriate manner.
Additional Information Requested by the Board. In order to develop fully the factual basis for consideration of the Advisory Contracts, the Board requested additional information regarding (i) Fidelity's fund profitability methodology, including additional detail on various cost allocations; (ii) fall-out benefits to Fidelity; and (iii) compensation of portfolio managers and research analysts.
Semiannual Report
Board Approval of Investment Advisory Contracts and
Management Fees - continued
Based on its evaluation of all of the conclusions noted above, and after considering all material factors, the Board ultimately concluded that the existing advisory fee structures are fair and reasonable, and that the fund's existing Advisory Contracts should be renewed.
Semiannual Report
Managing Your Investments
Fidelity offers several ways to conveniently manage your personal investments via your telephone or PC. You can access your account information, conduct trades and research your investments 24 hours a day.
By Phone
Fidelity Automated Service Telephone provides a single toll-free number to access account balances, positions, quotes and trading. It's easy to navigate the service, and on your first call, the system will help you create a personal identification number (PIN) for security.
(phone_graphic)
Fidelity Automated
Service Telephone (FAST®)
1-800-544-5555
Press
1 For mutual fund and brokerage trading.
2 For quotes.*
3 For account balances and holdings.
4 To review orders and mutual
fund activity.
5 To change your PIN.
*0 To speak to a Fidelity representative.
By PC
Fidelity's web site on the Internet provides a wide range of information, including daily financial news, fund performance, interactive planning tools and news about Fidelity products and services.
(computer_graphic)
Fidelity's Web Site
www.fidelity.com
* When you call the quotes line, please remember that a fund's yield and return will vary and, except for money market funds, share price will also vary. This means that you may have a gain or loss when you sell your shares. There is no assurance that money market funds will be able to maintain a stable $1 share price; an investment in a money market fund is not insured or guaranteed by the U.S. government. Total returns are historical and include changes in share price, reinvestment of dividends and capital gains, and the effects of any sales charges.
Semiannual Report
To Visit Fidelity
For directions and hours,
please call 1-800-544-9797.
Arizona
7001 West Ray Road
Chandler, AZ
7373 N. Scottsdale Road
Scottsdale, AZ
California
815 East Birch Street
Brea, CA
1411 Chapin Avenue
Burlingame, CA
851 East Hamilton Avenue
Campbell, CA
19200 Von Karman Avenue
Irvine, CA
601 Larkspur Landing Circle
Larkspur, CA
10100 Santa Monica Blvd.
Los Angeles, CA
27101 Puerta Real
Mission Viejo, CA
73-575 El Paseo
Palm Desert, CA
251 University Avenue
Palo Alto, CA
123 South Lake Avenue
Pasadena, CA
16995 Bernardo Ctr. Drive
Rancho Bernardo, CA
1740 Arden Way
Sacramento, CA
7676 Hazard Center Drive
San Diego, CA
8 Montgomery Street
San Francisco, CA
3793 State Street
Santa Barbara, CA
21701 Hawthorne Boulevard
Torrance, CA
2001 North Main Street
Walnut Creek, CA
6300 Canoga Avenue
Woodland Hills, CA
Colorado
1625 Broadway
Denver, CO
9185 East Westview Road
Littleton, CO
Connecticut
48 West Putnam Avenue
Greenwich, CT
265 Church Street
New Haven, CT
300 Atlantic Street
Stamford, CT
29 South Main Street
West Hartford, CT
Delaware
222 Delaware Avenue
Wilmington, DE
Florida
4400 N. Federal Highway
Boca Raton, FL
121 Alhambra Plaza
Coral Gables, FL
2948 N. Federal Highway
Ft. Lauderdale, FL
1907 West State Road 434
Longwood, FL
8880 Tamiami Trail, North
Naples, FL
3550 Tamiami Trail, South
Sarasota, FL
1502 N. Westshore Blvd.
Tampa, FL
2465 State Road 7
Wellington, FL
3501 PGA Boulevard
West Palm Beach, FL
Georgia
3445 Peachtree Road, N.E.
Atlanta, GA
1000 Abernathy Road
Atlanta, GA
Illinois
One North LaSalle Street
Chicago, IL
875 North Michigan Ave.
Chicago, IL
1415 West 22nd Street
Oak Brook, IL
1700 East Golf Road
Schaumburg, IL
3232 Lake Avenue
Wilmette, IL
Indiana
4729 East 82nd Street
Indianapolis, IN
Kansas
5400 College Boulevard
Overland Park, KS
Maine
Three Canal Plaza
Portland, ME
Maryland
7315 Wisconsin Avenue
Bethesda, MD
One W. Pennsylvania Ave.
Towson, MD
Massachusetts
801 Boylston Street
Boston, MA
155 Congress Street
Boston, MA
300 Granite Street
Braintree, MA
44 Mall Road
Burlington, MA
405 Cochituate Road
Framingham, MA
416 Belmont Street
Worcester, MA
Michigan
500 E. Eisenhower Pkwy.
Ann Arbor, MI
280 Old N. Woodward Ave.
Birmingham, MI
43420 Grand River Avenue
Novi, MI
29155 Northwestern Hwy.
Southfield, MI
Minnesota
7600 France Avenue South
Edina, MN
Missouri
8885 Ladue Road
Ladue, MO
Fidelity Brokerage Services, Inc., 100 Summer St., Boston, MA 02110 Member NYSE/SIPC
Semiannual Report
Nevada
2225 Village Walk Drive
Henderson, NV
New Jersey
150 Essex Street
Millburn, NJ
56 South Street
Morristown, NJ
396 Route 17, North
Paramus, NJ
3518 Route 1 North
Princeton, NJ
530 Highway 35
Shrewsbury, NJ
New York
1055 Franklin Avenue
Garden City, NY
37 West Jericho Turnpike
Huntington Station, NY
1271 Avenue of the Americas
New York, NY
61 Broadway
New York, NY
350 Park Avenue
New York, NY
200 Fifth Avenue
New York, NY
733 Third Avenue
New York, NY
11 Penn Plaza
New York, NY
2070 Broadway
New York, NY
1075 Northern Blvd.
Roslyn, NY
North Carolina
4611 Sharon Road
Charlotte, NC
Ohio
3805 Edwards Road
Cincinnati, OH
1324 Polaris Parkway
Columbus, OH
28699 Chagrin Boulevard
Woodmere Village, OH
Oregon
16850 SW 72nd Avenue
Tigard, OR
Pennsylvania
600 West DeKalb Pike
King of Prussia, PA
1735 Market Street
Philadelphia, PA
12001 Perry Highway
Wexford, PA
Rhode Island
47 Providence Place
Providence, RI
Tennessee
6150 Poplar Avenue
Memphis, TN
Texas
10000 Research Boulevard
Austin, TX
4001 Northwest Parkway
Dallas, TX
12532 Memorial Drive
Houston, TX
2701 Drexel Drive
Houston, TX
6500 N. MacArthur Blvd.
Irving, TX
6005 West Park Boulevard
Plano, TX
14100 San Pedro
San Antonio, TX
1576 East Southlake Blvd.
Southlake, TX
19740 IH 45 North
Spring, TX
Utah
215 South State Street
Salt Lake City, UT
Virginia
1861 International Drive
McLean, VA
Washington
411 108th Avenue, N.E.
Bellevue, WA
1518 6th Avenue
Seattle, WA
Washington, DC
1900 K Street, N.W.
Washington, DC
Wisconsin
595 North Barker Road
Brookfield, WI
Semiannual Report
To Write Fidelity
We'll give your correspondence immediate attention and send you written confirmation upon completion of your request.
(letter_graphic)
Making Changes
To Your Account
(such as changing name, address, bank, etc.)
Fidelity Investments
P.O. Box 770001
Cincinnati, OH 45277-0002
(letter_graphic)
For Non-Retirement
Accounts
Buying shares
Fidelity Investments
P.O. Box 770001
Cincinnati, OH 45277-0003
Overnight Express
Fidelity Investments
Attn: Distribution Services
100 Crosby Parkway - KC1H
Covington, KY 41015
Selling shares
Fidelity Investments
P.O. Box 770001
Cincinnati, OH 45277-0035
Overnight Express
Fidelity Investments
Attn: Distribution Services
100 Crosby Parkway - KC1H
Covington, KY 41015
General Correspondence
Fidelity Investments
P.O. Box 500
Merrimack, NH 03054-0500
(letter_graphic)
For Retirement
Accounts
Buying shares
Fidelity Investments
P.O. Box 770001
Cincinnati, OH 45277-0003
Selling shares
Fidelity Investments
P.O. Box 770001
Cincinnati, OH 45277-0035
Overnight Express
Fidelity Investments
Attn: Distribution Services
100 Crosby Parkway - KC1H
Covington, KY 41015
General Correspondence
Fidelity Investments
P.O. Box 500
Merrimack, NH 03054-0500
Semiannual Report
Semiannual Report
Investment Adviser
Fidelity Management & Research Company
Boston, MA
Investment Sub-Adviser
Fidelity Investments Money
Management, Inc.
Fidelity International Investment Advisors
Fidelity International Investment Advisors
(U.K.) Limited
General Distributor
Fidelity Distributors Corporation
Boston, MA
Transfer and Service Agents
Citibank, N.A.
New York, NY
Fidelity Service Company, Inc.
Boston, MA
Custodian
Citibank, N.A.
New York, NY
The Fidelity Telephone Connection
Mutual Fund 24-Hour Service
Exchanges/Redemptions
and Account Assistance 1-800-544-6666
Product Information 1-800-544-6666
Retirement Accounts 1-800-544-4774
(8 a.m. - 9 p.m.)
TDD Service 1-800-544-0118
for the deaf and hearing impaired
(9 a.m. - 9 p.m. Eastern time)
Fidelity Automated Service
Telephone (FAST®) (automated graphic) 1-800-544-5555
(automated graphic) Automated line for quickest service
STM-USAN-0805
1.787790.102
(Fidelity Investment logo)(registered trademark)
Corporate Headquarters
82 Devonshire St., Boston, MA 02109
www.fidelity.com
(Fidelity Investment logo)(registered trademark)
Fidelity Advisor
Short-Intermediate
Municipal Income
Fund - Class A, Class T, Class B
and Class C
Semiannual Report
June 30, 2005
Class A, Class T, Class B, and Class C are classes of Spartan® Short-Intermediate Municipal Income Fund
(2_fidelity_logos) (Registered_Trademark)
Contents
Chairman's Message | <Click Here> | Ned Johnson's message to shareholders. |
Shareholder Expense Example | <Click Here> | An example of shareholder expenses. |
Investment Changes | <Click Here> | A summary of major shifts in the fund's investments over the past six months. |
Investments | <Click Here> | A complete list of the fund's investments with their market values. |
Financial Statements | <Click Here> | Statements of assets and liabilities, operations, and changes in net assets,
as well as financial highlights. |
Notes | <Click Here> | Notes to the financial statements. |
Board Approval of Investment Advisory Contracts and Management Fees | <Click Here> | |
To view a fund's proxy voting guidelines and proxy voting record for the 12-month period ended June 30, visit www.fidelity.com/proxyvotingresults or visit the Securities and Exchange Commission's (SEC) web site at www.sec.gov. You may also call 1-877-208-0098 to request a free copy of the proxy voting guidelines.
Standard & Poor's, S&P and S&P 500 are registered service marks of The McGraw-Hill Companies, Inc. and have been licensed for use by Fidelity Distributors Corporation.
Other third party marks appearing herein are the property of their respective owners.
All other marks appearing herein are registered or unregistered trademarks or service marks of FMR Corp. or an affiliated company.
This report and the financial statements contained herein are submitted for the general information of the shareholders of the fund. This report is not authorized for distribution to prospective investors in the fund unless preceded or accompanied by an effective prospectus.
A fund files its complete schedule of portfolio holdings with the SEC for the first and third quarters of each fiscal year on Form N-Q. Forms N-Q are available on the SEC's web site at http://www.sec.gov. A fund's Forms N-Q may be reviewed and copied at the SEC's Public Reference Room in Washington, DC. Information regarding the operation of the SEC's Public Reference Room may be obtained by calling 1-800-SEC-0330. For a complete list of a fund's portfolio holdings, view the most recent quarterly holdings report, semiannual report, or annual report on Fidelity's web site at http://www.advisor.fidelity.com.
NOT FDIC INSURED · MAY LOSE VALUE · NO BANK GUARANTEE
Neither the fund nor Fidelity Distributors Corporation is a bank.
Semiannual Report
Chairman's Message
(photo_of_Edward_C_Johnson_3d)
Dear Shareholder:
During the past year or so, much has been reported about the mutual fund industry, and much of it has been more critical than I believe is warranted. Allegations that some companies have been less than forthright with their shareholders have cast a shadow on the entire industry. I continue to find these reports disturbing, and assert that they do not create an accurate picture of the industry overall. Therefore, I would like to remind everyone where Fidelity stands on these issues. I will say two things specifically regarding allegations that some mutual fund companies were in violation of the Securities and Exchange Commission's forward pricing rules or were involved in so-called "market timing" activities.
First, Fidelity has no agreements that permit customers who buy fund shares after 4 p.m. to obtain the 4 p.m. price. This is not a new policy. This is not to say that someone could not deceive the company through fraudulent acts. However, we are extremely diligent in preventing fraud from occurring in this manner - and in every other. But I underscore again that Fidelity has no so-called "agreements" that sanction illegal practices.
Second, Fidelity continues to stand on record, as we have for years, in opposition to predatory short-term trading that adversely affects shareholders in a mutual fund. Back in the 1980s, we initiated a fee - which is returned to the fund and, therefore, to investors - to discourage this activity. Further, we took the lead several years ago in developing a Fair Value Pricing Policy to prevent market timing on foreign securities in our funds. I am confident we will find other ways to make it more difficult for predatory traders to operate. However, this will only be achieved through close cooperation among regulators, legislators and the industry.
Yes, there have been unfortunate instances of unethical and illegal activity within the mutual fund industry from time to time. That is true of any industry. When this occurs, confessed or convicted offenders should be dealt with appropriately. But we are still concerned about the risk of over-regulation and the quick application of simplistic solutions to intricate problems. Every system can be improved, and we support and applaud well thought out improvements by regulators, legislators and industry representatives that achieve the common goal of building and protecting the value of investors' holdings.
For nearly 60 years, Fidelity has worked very hard to improve its products and service to justify your trust. When our family founded this company in 1946, we had only a few hundred customers. Today, we serve more than 18 million customers including individual investors and participants in retirement plans across America.
Let me close by saying that we do not take your trust in us for granted, and we realize that we must always work to improve all aspects of our service to you. In turn, we urge you to continue your active participation with your financial matters, so that your interests can be well served.
Best regards,
/s/Edward C. Johnson 3d
Edward C. Johnson 3d
Semiannual Report
Shareholder Expense Example
As a shareholder of the Fund, you incur two types of costs: (1) transaction costs, including sales charges (loads) on purchase payments or redemption proceeds, redemption fees, and (2) ongoing costs, including management fees, distribution and/or service (12b-1) fees and other Fund expenses. This Example is intended to help you understand your ongoing costs (in dollars) of investing in the Fund and to compare these costs with the ongoing costs of investing in other mutual funds.
The Example is based on an investment of $1,000 invested at the beginning of the period and held for the entire period (January 1, 2005 to June 30, 2005).
Actual Expenses
The first line of the table below for each class of the Fund provides information about actual account values and actual expenses. You may use the information in this line, together with the amount you invested, to estimate the expenses that you paid over the period. Simply divide your account value by $1,000.00 (for example, an $8,600 account value divided by $1,000.00 = 8.6), then multiply the result by the number in the first line for a class of the Fund under the heading entitled "Expenses Paid During Period" to estimate the expenses you paid on your account during this period.
Hypothetical Example for Comparison Purposes
The second line of the table below for each class of the Fund provides information about hypothetical account values and hypothetical expenses based on a Class' actual expense ratio and an assumed rate of return of 5% per year before expenses, which is not the Class' actual return. The hypothetical account values and expenses may not be used to estimate the actual ending account balance or expenses you paid for the period. You may use this information to compare the ongoing costs of investing in the Fund and other funds. To do so, compare this 5% hypothetical example with the 5% hypothetical examples that appear in the shareholder reports of the other funds.
Please note that the expenses shown in the table are meant to highlight your ongoing costs only and do not reflect any transaction costs. Therefore, the second line of the table is useful in comparing ongoing costs only, and will not help you determine the relative total costs of owning different funds. In addition, if these transactional costs were included, your costs would have been higher.
| Beginning
Account Value
January 1, 2005 | Ending
Account Value
June 30, 2005 | Expenses Paid
During Period*
January 1, 2005
to June 30, 2005 |
Class A | | | |
Actual | $ 1,000.00 | $ 1,005.30 | $ 3.28 |
HypotheticalA | $ 1,000.00 | $ 1,021.52 | $ 3.31 |
Class T | | | |
Actual | $ 1,000.00 | $ 1,005.70 | $ 3.83 |
HypotheticalA | $ 1,000.00 | $ 1,020.98 | $ 3.86 |
Class B | | | |
Actual | $ 1,000.00 | $ 1,001.50 | $ 7.05 |
HypotheticalA | $ 1,000.00 | $ 1,017.75 | $ 7.10 |
| Beginning
Account Value
January 1, 2005 | Ending
Account Value
June 30, 2005 | Expenses Paid
During Period*
January 1, 2005
to June 30, 2005 |
Class C | | | |
Actual | $ 1,000.00 | $ 1,001.00 | $ 7.59 |
HypotheticalA | $ 1,000.00 | $ 1,017.21 | $ 7.65 |
Spartan Short-Intermediate Municipal Income | | | |
Actual | $ 1,000.00 | $ 1,006.10 | $ 2.44 |
HypotheticalA | $ 1,000.00 | $ 1,022.36 | $ 2.46 |
Institutional Class | | | |
Actual | $ 1,000.00 | $ 1,006.10 | $ 2.44 |
HypotheticalA | $ 1,000.00 | $ 1,022.36 | $ 2.46 |
A 5% return per year before expenses
* Expenses are equal to each Class' annualized expense ratio (shown in the table below); multiplied by the average account value over the period, multiplied by 181/365 (to reflect the one-half year period).
| Annualized
Expense Ratio |
Class A | .66% |
Class T | .77% |
Class B | 1.42% |
Class C | 1.53% |
Spartan Short-Intermediate Municipal Income | .49% |
Institutional Class | .49% |
Semiannual Report
Investment Changes
Top Five States as of June 30, 2005 |
| % of fund's
net assets | % of fund's net assets
6 months ago |
Texas | 14.4 | 13.6 |
Illinois | 9.3 | 9.7 |
New York | 8.5 | 6.9 |
California | 8.1 | 8.2 |
Washington | 5.2 | 6.3 |
Top Five Sectors as of June 30, 2005 |
| % of fund's
net assets | % of fund's net assets
6 months ago |
General Obligations | 45.1 | 47.3 |
Electric Utilities | 14.0 | 14.3 |
Escrowed/Pre-Refunded | 8.1 | 9.5 |
Transportation | 6.6 | 7.1 |
Health Care | 5.9 | 5.9 |
Average Years to Maturity as of June 30, 2005 |
| | 6 months ago |
Years | 3.4 | 3.3 |
Average years to maturity is based on the average time remaining to the stated maturity date of each bond, weighted by the market value of each bond. |
Duration as of June 30, 2005 |
| | 6 months ago |
Years | 2.9 | 3.0 |
Duration shows how much a bond fund's price fluctuates with changes in comparable interest rates. If rates rise 1%, for example, a fund with a five-year duration is likely to lose about 5% of its value. Other factors also can influence a bond fund's performance and share price. Accordingly, a bond fund's actual performance may differ from this example. |
Quality Diversification (% of fund's net assets) |
As of June 30, 2005 | As of December 31, 2004 |
 | AAA 60.2% | | | AAA 61.3% | |
 | AA,A 28.4% | | | AA,A 32.9% | |
 | BBB 5.9% | | | BBB 5.8% | |
 | Not Rated 1.5% | | | Not Rated 1.9% | |
 | Short-Term
Investments and
Net Other Assets 4.0% | |  | Short-Term
Investments and
Net Other Assets* (1.9)% | |

We have used ratings from Moody's® Investors Services, Inc. Where Moody's ratings are not available, we have used S&P® ratings. |
* Short-Term Investments and Net Other Assets are not included in the pie chart. |
Semiannual Report
Investments June 30, 2005 (Unaudited)
Showing Percentage of Net Assets
Municipal Bonds - 96.0% |
| Principal
Amount (000s) | | Value (Note 1)
(000s) |
Alabama - 2.3% |
Alabama Agric. & Mechanical Univ. Revs. 6.5% 11/1/25 (Pre-Refunded to 11/1/05 @ 102) (d) | | $ 2,000 | | $ 2,065 |
Huntsville Solid Waste Disp. Auth. & Resource Recovery Rev.: | | | | |
5.25% 10/1/07 (MBIA Insured) (c) | | 1,750 | | 1,813 |
5.25% 10/1/08 (MBIA Insured) (c) | | 2,900 | | 3,047 |
5.75% 10/1/09 (MBIA Insured) (c) | | 4,000 | | 4,320 |
Jefferson County Ltd. Oblig. School Warrants Series A, 5% 1/1/07 | | 2,210 | | 2,277 |
Jefferson County Swr. Rev.: | | | | |
Series 1999 A, 5.75% 2/1/38 (Pre-Refunded to 2/1/09 @ 101) (d) | | 5,000 | | 5,525 |
Series A: | | | | |
5% 2/1/33 (Pre-Refunded to 2/1/09 @ 101) (d) | | 13,460 | | 14,462 |
5.5% 2/1/40 (Pre-Refunded to 2/1/11 @ 101) (d) | | 3,900 | | 4,402 |
5% 2/1/41 (Pre-Refunded to 8/1/12 @ 100) (d) | | 2,035 | | 2,235 |
Mobile County Gen. Oblig.: | | | | |
5% 2/1/07 (MBIA Insured) | | 1,000 | | 1,034 |
5% 2/1/08 (MBIA Insured) | | 1,475 | | 1,550 |
| | 42,730 |
Alaska - 1.6% |
Alaska Student Ln. Corp. Student Ln. Rev. Series A: | | | | |
5.15% 7/1/05 (AMBAC Insured) (c) | | 1,950 | | 1,950 |
5.85% 7/1/13 (AMBAC Insured) (c) | | 3,285 | | 3,623 |
Anchorage Gen. Oblig. Series B, 5.75% 12/1/11
(Pre-Refunded to 12/1/10 @ 100) (d) | | 2,500 | | 2,832 |
North Slope Borough Gen. Oblig.: | | | | |
Series 1996 B, 0% 6/30/07 (MBIA Insured) | | 3,100 | | 2,921 |
Series A, 0% 6/30/07 (MBIA Insured) | | 5,000 | | 4,711 |
Series B: | | | | |
0% 6/30/06 (MBIA Insured) | | 3,500 | | 3,404 |
0% 6/30/07 (MBIA Insured) | | 7,050 | | 6,642 |
0% 6/30/08 (MBIA Insured) | | 4,240 | | 3,857 |
| | 29,940 |
Arizona - 1.0% |
Arizona School Facilities Board Ctfs. of Prtn. Series C, 5% 9/1/09 (FSA Insured) | | 1,115 | | 1,196 |
Maricopa County Unified School District #48 Scottsdale 7.4% 7/1/10 | | 3,750 | | 4,476 |
Pima County Unified School District #1 Tucson 7.5% 7/1/08 (FGIC Insured) | | 7,060 | | 7,952 |
Municipal Bonds - continued |
| Principal
Amount (000s) | | Value (Note 1)
(000s) |
Arizona - continued |
Tucson Wtr. Rev.: | | | | |
Series 2002, 5.5% 7/1/06 (FGIC Insured) | | $ 980 | | $ 1,007 |
Series A, 5% 7/1/11 (FGIC Insured) | | 1,500 | | 1,637 |
Univ. of Arizona Ctfs. of Prtn. (Univ. of Arizona Parking & Student Hsg. Proj.) Series A, 5% 6/1/09 (AMBAC Insured) | | 2,000 | | 2,138 |
| | 18,406 |
Arkansas - 0.3% |
Arkansas Dev. Fin. Auth. Wastewtr. Sys. Rev.
Series 2004 A, 4% 6/1/06 (MBIA Insured) | | 1,060 | | 1,073 |
Little Rock Gen. Oblig. 4% 4/1/07 (FSA Insured) | | 1,000 | | 1,021 |
Rogers Sales & Use Tax Rev. Series A: | | | | |
4.25% 9/1/06 (FGIC Insured) | | 1,000 | | 1,017 |
4.25% 9/1/07 (FGIC Insured) | | 2,175 | | 2,238 |
| | 5,349 |
California - 8.1% |
California Dept. of Wtr. Resources Pwr. Supply Rev. Series A: | | | | |
5.25% 5/1/07 (MBIA Insured) | | 27,455 | | 28,719 |
5.25% 5/1/10 (MBIA Insured) | | 1,200 | | 1,316 |
5.25% 5/1/12 (MBIA Insured) | | 6,000 | | 6,690 |
California Econ. Recovery Series A, 5.25% 7/1/13 (MBIA Insured) | | 5,000 | | 5,657 |
California Gen. Oblig.: | | | | |
5% 2/1/09 | | 1,640 | | 1,745 |
5% 2/1/10 | | 2,000 | | 2,151 |
5% 12/1/11 (MBIA Insured) | | 8,000 | | 8,823 |
5.125% 9/1/12 | | 1,000 | | 1,081 |
5.25% 2/1/10 (FSA Insured) | | 7,265 | | 7,948 |
5.25% 2/1/11 | | 5,775 | | 6,334 |
5.5% 3/1/11 (FGIC Insured) | | 3,210 | | 3,596 |
5.5% 3/1/11 (XL Cap. Assurance, Inc. Insured) | | 3,525 | | 3,939 |
5.75% 10/1/08 | | 1,085 | | 1,178 |
6.4% 9/1/08 | | 3,075 | | 3,388 |
6.5% 9/1/10 | | 1,740 | | 2,001 |
8% 11/1/07 (FGIC Insured) | | 7,000 | | 7,451 |
California Poll. Cont. Fing. Auth. Ctfs. of Prtn. (Pacific Gas & Elec. Co. Proj.) Series 2004 B, 3.5%, tender 6/1/07 (FGIC Insured) (b)(c) | | 15,000 | | 15,165 |
Municipal Bonds - continued |
| Principal
Amount (000s) | | Value (Note 1)
(000s) |
California - continued |
California Poll. Cont. Fing. Auth. Solid Waste Disp. Rev. (Waste Mgmt., Inc. Proj.) Series A, 3.125%, tender 5/1/06 (b)(c) | | $ 5,000 | | $ 4,997 |
California Pub. Works Board Lease Rev.: | | | | |
(California State Univ. Proj.) Series 1997 A, 5.5% 10/1/07 | | 1,075 | | 1,135 |
(Coalinga State Hosp. Proj.) Series 2004 A: | | | | |
5% 6/1/07 | | 4,000 | | 4,159 |
5% 6/1/08 | | 6,000 | | 6,326 |
California Statewide Cmntys. Dev. Auth. Rev.: | | | | |
(Kaiser Fund Hosp./Health Place, Inc. Proj.) Series 2002 C, 3.85%, tender 6/1/12 (b) | | 1,400 | | 1,408 |
(Kaiser Permanente Health Sys. Proj.) Series 2004 G, 2.3%, tender 5/1/07 (b) | | 8,000 | | 7,913 |
Commerce Refuse To Energy Auth. Rev.: | | | | |
5% 7/1/07 (MBIA Insured) | | 1,770 | | 1,846 |
5.25% 7/1/08 (MBIA Insured) | | 855 | | 912 |
Golden State Tobacco Securitization Corp. Series 2003 B, 5% 6/1/08 | | 1,300 | | 1,356 |
Long Beach Hbr. Rev. Series 2000 A, 5.5% 5/15/06 (c) | | 3,000 | | 3,060 |
Los Angeles Hbr. Dept. Rev. Series A, 5.5% 8/1/06 (AMBAC Insured) (c) | | 1,495 | | 1,539 |
San Joaquin Hills Trans. Corridor Agcy. Toll Road Rev. Series A, 0% 1/15/12 (MBIA Insured) | | 3,600 | | 2,849 |
Univ. of California Revs. (UCLA Med. Ctr. Proj.) 4.55% 12/1/09 (e) | | 8,955 | | 9,217 |
| | 153,899 |
Colorado - 0.5% |
Arapahoe County Cap. Impt. Trust Fund Hwy. Rev.
Series C, 0% 8/31/08 (Pre-Refunded to 8/31/05 @ 82.9449) (d) | | 4,500 | | 3,718 |
E-470 Pub. Hwy. Auth. Rev. Series 2000 B: | | | | |
0% 9/1/06 (Escrowed to Maturity) (d) | | 2,200 | | 2,128 |
0% 9/1/07 (Escrowed to Maturity) (d) | | 3,200 | | 2,998 |
| | 8,844 |
Connecticut - 0.6% |
Connecticut Gen. Oblig.: | | | | |
Series 2001 D, 5.125% 11/15/18 (Pre-Refunded to 11/15/11 @ 100) (d) | | 5,000 | | 5,504 |
Series 2002 C, 5% 12/15/08 | | 1,930 | | 2,062 |
Municipal Bonds - continued |
| Principal
Amount (000s) | | Value (Note 1)
(000s) |
Connecticut - continued |
Connecticut Health & Edl. Facilities Auth. Rev. (Connecticut Children's Med. Ctr. Proj.) Series B: | | | | |
4% 7/1/07 (MBIA Insured) | | $ 1,275 | | $ 1,305 |
4.5% 7/1/08 (MBIA Insured) | | 1,045 | | 1,093 |
5% 7/1/09 (MBIA Insured) | | 1,000 | | 1,075 |
| | 11,039 |
District Of Columbia - 2.0% |
District of Columbia Ctfs. of Prtn.: | | | | |
(District's Pub. Safety and Emergency Preparedness Communications Ctr. and Related Technology Proj.) Series 2003, 3% 1/1/06 (AMBAC Insured) | | 1,305 | | 1,307 |
5% 1/1/06 (AMBAC Insured) | | 1,000 | | 1,011 |
5% 1/1/07 (AMBAC Insured) | | 1,000 | | 1,032 |
5.25% 1/1/08 (AMBAC Insured) | | 935 | | 984 |
District of Columbia Gen. Oblig.: | | | | |
Series 1993 B2, 5.5% 6/1/07 (FSA Insured) | | 1,830 | | 1,922 |
Series 2001 B, 5.5% 6/1/07 (FSA Insured) | | 1,345 | | 1,412 |
Series A: | | | | |
5% 6/1/06 | | 3,480 | | 3,547 |
5% 6/1/07 | | 2,810 | | 2,917 |
5.25% 6/1/09 (FSA Insured) | | 1,000 | | 1,082 |
Series B, 0% 6/1/12 (MBIA Insured) | | 3,600 | | 2,776 |
District of Columbia Rev. (Medstar Univ. Hosp. Proj.) Series D, 6.875%, tender 2/16/07 (b) | | 9,000 | | 9,593 |
Metropolitan Washington Arpts. Auth. Gen. Arpt. Rev. Series B, 5.5% 10/1/08 (FGIC Insured) (c) | | 6,460 | | 6,848 |
Metropolitan Washington Arpts. Auth. Sys. Rev. Series D: | | | | |
4% 10/1/06 (FSA Insured) (c) | | 1,750 | | 1,774 |
4% 10/1/07 (FSA Insured) (c) | | 1,000 | | 1,020 |
| | 37,225 |
Florida - 4.0% |
Brevard County Util. Rev. 5% 3/1/06 (FGIC Insured) | | 530 | | 538 |
Coral Gables Health Facilities Hosp. (Baptist Health South Florida Obligated Group Proj.) 5% 8/15/06 | | 1,000 | | 1,025 |
Highlands County Health Facilities Auth. Rev. (Adventist Health Sys./Sunbelt Obligated Group Proj.) 3.35%, tender 9/1/05 (b) | | 20,300 | | 20,319 |
Hillsborough County Indl. Dev. Auth. Poll. Cont. Rev. (Tampa Elec. Co. Proj.): | | | | |
4%, tender 8/1/07 (b) | | 11,000 | | 11,131 |
Municipal Bonds - continued |
| Principal
Amount (000s) | | Value (Note 1)
(000s) |
Florida - continued |
Hillsborough County Indl. Dev. Auth. Poll. Cont. Rev. (Tampa Elec. Co. Proj.): - continued | | | | |
4.25%, tender 8/1/07 (b)(c) | | $ 6,000 | | $ 6,071 |
Indian River County School District 4% 4/1/06
(FSA Insured) | | 1,470 | | 1,485 |
Miami-Dade County Cap. Asset Acquisition Fixed
Rate Spl. Oblig. Series 2002 A, 5% 4/1/08
(AMBAC Insured) | | 2,825 | | 2,986 |
Miami-Dade County School Board Ctfs. of Prtn. 5%, tender 5/1/11 (MBIA Insured) (b) | | 1,500 | | 1,614 |
Miami-Dade County School District Series 1994 A, 5.65% 6/1/06 (MBIA Insured) | | 1,545 | | 1,586 |
Orlando Utils. Commission Util. Sys. Rev. 5.25% 7/1/09 | | 6,000 | | 6,506 |
Palm Beach County Rev. (Cmnty. Foundation Palm Beach Proj.) 2%, tender 9/1/05, LOC Northern Trust Co., Chicago (b) | | 4,010 | | 4,006 |
Pasco County Solid Waste Disp. & Resource Recovery Sys. Rev. 5.75% 4/1/06 (AMBAC Insured) (c) | | 1,500 | | 1,530 |
Polk County Cap. Impt. Rev. Series 2004, 5.5%, tender 12/1/10 (FSA Insured) (b) | | 9,000 | | 9,939 |
Seminole County School Board Ctfs. of Prtn. Series A: | | | | |
4.5% 7/1/06 (MBIA Insured) | | 1,150 | | 1,170 |
4.5% 7/1/08 (MBIA Insured) | | 1,250 | | 1,309 |
Univ. Athletic Assoc., Inc. Athletic Prog. Rev. Series 2001, 2.8%, tender 10/1/08, LOC Suntrust Banks of Florida, Inc. (b) | | 2,000 | | 1,974 |
Volusia County School Board Ctfs. of Prtn. (School Board of Volusia County Master Lease Prog.) 4.5% 8/1/07 (FSA Insured) | | 2,135 | | 2,205 |
| | 75,394 |
Georgia - 1.1% |
Atlanta Arpt. Facilities Rev. 6.5% 1/1/06 (Escrowed to Maturity) (d) | | 6,000 | | 6,111 |
Cobb County Dev. Auth. Solid Waste Disp. Rev. (Georgia Waste Mgmt. Proj.) Series A, 3.65%, tender 4/1/06 (b)(c) | | 1,000 | | 1,002 |
Columbia County Gen. Oblig. 5% 1/1/09 (FSA Insured) | | 1,505 | | 1,605 |
Fulton DeKalb Hosp. Auth. Hosp. Rev. 5% 1/1/08
(FSA Insured) | | 2,250 | | 2,356 |
Georgia Gen. Oblig. Series B, 6.25% 4/1/06 | | 1,750 | | 1,797 |
Georgia Muni. Elec. Auth. Pwr. Rev. Series 1992 B, 8.25% 1/1/11 (MBIA Insured) | | 4,105 | | 5,101 |
Municipal Bonds - continued |
| Principal
Amount (000s) | | Value (Note 1)
(000s) |
Georgia - continued |
Gwinnett County Gen. Oblig. 4% 1/1/06 | | $ 1,035 | | $ 1,042 |
Henry County Wtr. & Swr. Auth. Rev. 5% 2/1/08
(MBIA Insured) | | 1,095 | | 1,152 |
| | 20,166 |
Hawaii - 2.1% |
Hawaii Arpts. Sys. Rev. Series 2000 B, 8% 7/1/10 (FGIC Insured) (c) | | 3,850 | | 4,597 |
Hawaii Gen. Oblig. Series CU, 5.75% 10/1/11
(MBIA Insured) | | 3,210 | | 3,604 |
Honolulu City & County Gen. Oblig. Series B, 8% 10/1/09 | | 26,940 | | 32,081 |
| | 40,282 |
Illinois - 9.3% |
Chicago Gen. Oblig.: | | | | |
(Neighborhoods Alive 21 Prog.): | | | | |
5% 1/1/07 (MBIA Insured) | | 1,360 | | 1,405 |
5% 1/1/08 (MBIA Insured) | | 1,190 | | 1,248 |
Series A, 5.25% 1/1/12 (FSA Insured) | | 1,000 | | 1,108 |
5% 1/1/07 (FGIC Insured) | | 1,000 | | 1,033 |
Chicago Midway Arpt. Rev.: | | | | |
Series 2001 B, 5% 1/1/07 (FSA Insured) | | 1,000 | | 1,032 |
Series B: | | | | |
5% 1/1/10 (AMBAC Insured) | | 1,225 | | 1,314 |
5% 1/1/11 (AMBAC Insured) | | 3,625 | | 3,915 |
Chicago O'Hare Int'l. Arpt. Rev.: | | | | |
Series 2001 C, 5% 1/1/07 (AMBAC Insured) (c) | | 2,670 | | 2,748 |
Series A: | | | | |
5% 1/1/12 (MBIA Insured) | | 1,135 | | 1,235 |
5.5% 1/1/08 (AMBAC Insured) | | 5,000 | | 5,163 |
5.5% 1/1/10 (AMBAC Insured) (c) | | 5,000 | | 5,401 |
Chicago Park District: | | | | |
Series B, 5% 1/1/11 (AMBAC Insured) | | 5,750 | | 6,243 |
Series C, 5% 1/1/11 (AMBAC Insured) | | 2,515 | | 2,731 |
Chicago School Fin. Auth. Series B, 5% 6/1/09
(FSA Insured) | | 12,825 | | 13,733 |
Chicago Tax Increment Rev.: | | | | |
Series 2000 A, 0% 12/1/08 (AMBAC Insured) | | 10,000 | | 8,964 |
Series A, 0% 12/1/05 (AMBAC Insured) | | 3,000 | | 2,968 |
Municipal Bonds - continued |
| Principal
Amount (000s) | | Value (Note 1)
(000s) |
Illinois - continued |
Chicago Transit Auth. Cap. Grant Receipts Rev.: | | | | |
(Fed. Transit Administration Section 5307
Formula Funds Proj.) Series A, 5.25% 6/1/10 (AMBAC Insured) | | $ 4,785 | | $ 5,238 |
Series A, 4.25% 6/1/08 (AMBAC Insured) | | 3,600 | | 3,645 |
Chicago Wastewtr. Transmission Rev. 5.5% 1/1/09 (FGIC Insured) | | 2,975 | | 3,213 |
Cook County Cmnty. College District #508 Ctfs. of Prtn. 8.75% 1/1/07 (FGIC Insured) | | 8,000 | | 8,692 |
Du Page Wtr. Commission Wtr. Rev. 5% 5/1/08 (AMBAC Insured) | | 4,525 | | 4,780 |
Granite City Solid Waste Disp. Rev. (Waste Mgmt., Inc. Proj.) 3.85%, tender 5/1/08 (b)(c) | | 2,200 | | 2,197 |
Illinois Dev. Fin. Auth. Gas Supply Rev. (The Peoples Gas Lt. & Coke Co. Proj.) Series 2003 B, 3.05%, tender 2/1/08 (AMBAC Insured) (b) | | 6,100 | | 6,101 |
Illinois Dev. Fin. Auth. Rev. (DePaul Univ. Proj.)
Series 2004 C, 5.5% 10/1/10 | | 1,900 | | 2,076 |
Illinois Edl. Facilities Auth. Revs.: | | | | |
(Art Institute of Chicago Proj.) Series 2003, 3.85%, tender 3/1/11 (b) | | 12,800 | | 12,851 |
(Univ. of Chicago Proj.): | | | | |
Series 2004 B1, 3.45%, tender 7/1/08 (b) | | 6,100 | | 6,160 |
Series A, 5.25% 7/1/41 (Pre-Refunded to 7/1/11 @ 101) (d) | | 2,640 | | 2,958 |
Series B, 3.1%, tender 7/1/07 (b) | | 3,900 | | 3,907 |
Illinois Fin. Auth. Rev. (DePaul Univ. Proj.): | | | | |
5% 10/1/06 | | 1,115 | | 1,140 |
5% 10/1/07 | | 1,225 | | 1,272 |
5% 10/1/08 | | 1,000 | | 1,050 |
Illinois Gen. Oblig.: | | | | |
First Series: | | | | |
5% 8/1/06 | | 8,160 | | 8,358 |
5.25% 4/1/08 (MBIA Insured) | | 1,035 | | 1,100 |
5.25% 4/1/10 (MBIA Insured) | | 2,600 | | 2,846 |
5.5% 8/1/10 | | 1,415 | | 1,568 |
6% 1/1/11 (Pre-Refunded to 1/1/10 @ 100) (d) | | 7,075 | | 7,956 |
Series A, 5% 10/1/09 | | 2,600 | | 2,799 |
5.75% 4/1/12 (Pre-Refunded to 4/1/10 @ 100) (d) | | 1,000 | | 1,120 |
Municipal Bonds - continued |
| Principal
Amount (000s) | | Value (Note 1)
(000s) |
Illinois - continued |
Illinois Health Facilities Auth. Rev. (Condell Med. Ctr. Proj.): | | | | |
5% 5/15/07 | | $ 500 | | $ 511 |
5% 5/15/08 | | 700 | | 717 |
Kane & DeKalb Counties Cmnty. Unit School District #301 0% 12/1/10 (AMBAC Insured) | | 2,000 | | 1,655 |
Kane & DuPage Counties Cmnty. Unit School District #303, Saint Charles Series A, 5.5% 1/1/12
(FSA Insured) | | 2,270 | | 2,548 |
Kane County School District #129, Aurora West Side Series A, 5.75% 2/1/14 (FGIC Insured) | | 1,600 | | 1,817 |
Kane, McHenry, Cook & DeKalb Counties Cmnty. Unit School District #300, Carpentersville 5.5% 12/1/13 (MBIA Insured) | | 5,000 | | 5,590 |
Kendall, Kane & Will Counties Cmnty. Unit School District #308: | | | | |
5.25% 10/1/05 (FGIC Insured) | | 560 | | 564 |
5.25% 10/1/06 (FGIC Insured) | | 695 | | 716 |
Lake County Cmnty. High School District #128, Libertyville Series 2004, 5% 1/1/11 | | 2,365 | | 2,573 |
Rosemont Gen. Oblig. Series 3: | | | | |
0% 12/1/07 (Escrowed to Maturity) (d) | | 2,375 | | 2,216 |
0% 12/1/07 (FGIC Insured) | | 625 | | 581 |
Univ. of Illinois Auxiliary Facilities Sys. Rev.
Series 2001 A, 5% 4/1/08 (AMBAC Insured) | | 2,035 | | 2,143 |
Univ. of Illinois Ctfs. of Prtn. (Util. Infrastructure Projs.) 5% 8/15/11 (AMBAC Insured) | | 1,360 | | 1,481 |
Will County School District #122 Series B, 0% 11/1/08 (FSA Insured) | | 1,500 | | 1,349 |
| | 175,729 |
Indiana - 2.9% |
Carmel High School Bldg. Corp. 5% 1/10/11
(FSA Insured) | | 1,000 | | 1,082 |
Hamilton Southeastern Consolidated School Bldg. Corp.: | | | | |
Series A: | | | | |
5% 1/10/10 (FSA Insured) | | 1,750 | | 1,882 |
5.25% 7/10/11 (FSA Insured) | | 2,295 | | 2,536 |
5.25% 1/10/12 (FSA Insured) | | 1,355 | | 1,499 |
5% 1/15/10 (FSA Insured) | | 1,835 | | 1,978 |
5% 1/15/11 (FSA Insured) | | 1,910 | | 2,077 |
5% 1/15/12 (FSA Insured) | | 1,990 | | 2,180 |
Municipal Bonds - continued |
| Principal
Amount (000s) | | Value (Note 1)
(000s) |
Indiana - continued |
Indiana Health Facility Fing. Auth. Rev.: | | | | |
(Ascension Health Cr. Group Prog.) Series 2002 F: | | | | |
5.5% 11/15/05 | | $ 1,000 | | $ 1,010 |
5.5% 11/15/06 | | 1,000 | | 1,036 |
(Ascension Health Cr. Group, Inc. Proj.) Series A, 5%, tender 5/1/07 (b) | | 7,100 | | 7,366 |
Indianapolis Local Pub. Impt. Bond Bank (Indianapolis Arpt. Auth. Proj.) Series I: | | | | |
4% 1/1/06 (MBIA Insured) (c) | | 1,325 | | 1,331 |
5% 1/1/08 (MBIA Insured) (c) | | 1,550 | | 1,616 |
Indianapolis Resource Recovery Rev. (Ogden Martin Sys., Inc. Proj.) 6.75% 12/1/07 (AMBAC Insured) | | 3,000 | | 3,213 |
Ivy Tech State College Series I, 5% 7/1/09
(AMBAC Insured) | | 1,405 | | 1,508 |
Logansport High School Bldg. Corp.: | | | | |
5.25% 1/15/11 (MBIA Insured) | | 1,000 | | 1,095 |
5.25% 7/15/11 (MBIA Insured) | | 1,020 | | 1,124 |
5.25% 1/15/12 (MBIA Insured) | | 1,045 | | 1,153 |
5.25% 7/15/12 (MBIA Insured) | | 1,075 | | 1,194 |
Muncie School Bldg. Corp. 5.25% 7/10/12
(MBIA Insured) | | 1,585 | | 1,760 |
New Albany Floyd County Independent School Bldg. Corp. 5% 1/15/11 (FSA Insured) | | 1,000 | | 1,082 |
Rockport Poll. Cont. Rev. 4.9%, tender 6/1/07 (b) | | 4,000 | | 4,104 |
Saint Joseph County Ind. Edl. Facilities Rev. (Univ. of Notre Dame Du Lac Proj.) 2.5%, tender 12/3/07 (b) | | 10,000 | | 9,869 |
West Clark 2000 School Bldg. Corp.: | | | | |
5.25% 1/15/11 (MBIA Insured) | | 1,065 | | 1,166 |
5.25% 7/15/11 (MBIA Insured) | | 1,125 | | 1,240 |
5.25% 1/15/12 (MBIA Insured) | | 1,150 | | 1,269 |
| | 55,370 |
Kansas - 0.9% |
Burlington Envir. Impt. Rev. (Kansas City Pwr. & Lt. Co. Proj.): | | | | |
Series A, 4.75%, tender 10/1/07 (b) | | 2,400 | | 2,476 |
Series C, 2.38%, tender 9/1/05 (b) | | 12,300 | | 12,282 |
La Cygne Envir. Impt. Rev. (Kansas City Pwr. & Lt. Co. Proj.) Series 1994, 2.25%, tender 9/1/05 (b) | | 2,500 | | 2,496 |
| | 17,254 |
Municipal Bonds - continued |
| Principal
Amount (000s) | | Value (Note 1)
(000s) |
Kentucky - 0.7% |
Kenton County Arpt. Board Arpt. Rev. Series B, 5% 3/1/09 (MBIA Insured) (c) | | $ 1,185 | | $ 1,250 |
Owensboro Elec. Lt. & Pwr. Rev. Series B: | | | | |
0% 1/1/07 (AMBAC Insured) | | 10,000 | | 9,560 |
0% 1/1/09 (AMBAC Insured) | | 2,000 | | 1,785 |
| | 12,595 |
Louisiana - 0.2% |
New Orleans Gen. Oblig. 5% 3/1/07 (MBIA Insured) | | 3,100 | | 3,206 |
Maryland - 0.3% |
Prince Georges County Ctfs. of Prtn. (Equip. Acquisition Prog.) 5.25% 5/15/10 (MBIA Insured) | | 1,535 | | 1,678 |
Prince Georges County Gen. Oblig. Series 2004 C, 5% 12/1/10 | | 3,770 | | 4,120 |
| | 5,798 |
Massachusetts - 3.1% |
Massachusetts Bay Trans. Auth. Series A, 7% 3/1/09 | | 6,880 | | 7,810 |
Massachusetts Dev. Fin. Agcy. Rev. (Massachusetts Biomedical Research Corp. Proj.) Series C: | | | | |
5.75% 8/1/06 | | 1,200 | | 1,229 |
5.875% 8/1/08 | | 1,630 | | 1,737 |
Massachusetts Fed. Hwy.: | | | | |
Series 2000 A, 5.75% 6/15/13 | | 3,000 | | 3,352 |
Series B, 5.125% 12/15/14 (Pre-Refunded to 12/15/08 @ 101) (d) | | 2,775 | | 2,981 |
Massachusetts Gen. Oblig.: | | | | |
Series 1999 C, 5.625% 9/1/12 (Pre-Refunded to 9/1/09 @ 101) (d) | | 2,570 | | 2,846 |
Series 2001 A, 5.5% 1/1/11 | | 5,000 | | 5,566 |
Series 2003 A, 5.375% 8/1/08 | | 5,165 | | 5,531 |
Series 2003 C: | | | | |
5% 12/1/06 (XL Cap. Assurance, Inc. Insured) | | 1,900 | | 1,959 |
5.5% 10/1/10 (MBIA Insured) | | 1,130 | | 1,258 |
Series A, 4.5% 1/1/09 (Pre-Refunded to 1/1/08
@ 101) (d) | | 2,055 | | 2,152 |
Series C, 5.25% 11/1/30 (Pre-Refunded to 11/1/12 @ 100) (d) | | 2,495 | | 2,773 |
Massachusetts Health & Edl. Facilities Auth. Rev.: | | | | |
(Caritas Christi Oblig. Group Proj.) 5.5% 7/1/05 | | 1,000 | | 1,000 |
(Dana Farber Cancer Proj.) Series G1, 6.25% 12/1/14 (Pre-Refunded to 12/1/05 @ 102) (d) | | 3,000 | | 3,104 |
Municipal Bonds - continued |
| Principal
Amount (000s) | | Value (Note 1)
(000s) |
Massachusetts - continued |
Massachusetts Port Auth. Spl. Facilities Rev.
(Delta Air Lines, Inc. Proj.) Series A, 5.5% 1/1/12 (AMBAC Insured) (c) | | $ 1,000 | | $ 1,078 |
New England Ed. Ln. Marketing Corp. Series A, 5.7% 7/1/05 (c) | | 2,800 | | 2,800 |
Springfield Gen. Oblig.: | | | | |
5% 1/15/06 (MBIA Insured) | | 1,000 | | 1,012 |
5% 8/1/11 (MBIA Insured) (a) | | 3,500 | | 3,821 |
5.25% 8/1/12 (MBIA Insured) (a) | | 6,000 | | 6,680 |
| | 58,689 |
Michigan - 3.2% |
Battle Creek Downtown Dev. Auth. 6% 5/1/06 (Escrowed to Maturity) (d) | | 2,000 | | 2,054 |
Chippewa Valley Schools: | | | | |
4% 5/1/06 | | 1,000 | | 1,011 |
5% 5/1/08 | | 1,260 | | 1,332 |
Detroit Gen. Oblig.: | | | | |
Series 2004 A, 5% 4/1/08 (FSA Insured) | | 7,275 | | 7,686 |
Series A, 5% 4/1/07 (FSA Insured) | | 6,910 | | 7,175 |
5% 4/1/08 (MBIA Insured) | | 14,545 | | 15,366 |
5% 4/1/09 (MBIA Insured) | | 10,620 | | 11,384 |
Detroit Swr. Disp. Rev. Series A, 5.75% 7/1/26
(Pre-Refunded to 1/1/10 @ 101) (d) | | 2,000 | | 2,246 |
Ferndale Gen. Oblig. 3.5% 4/1/06 (FGIC Insured) | | 1,960 | | 1,972 |
Greater Detroit Resource Recovery Auth. Rev. Series A, 6.25% 12/13/07 (AMBAC Insured) | | 4,000 | | 4,328 |
Hazel Park School District 5% 5/1/08 | | 1,275 | | 1,348 |
Livonia Pub. School District Series II, 0% 5/1/21
(FGIC Insured) (Pre-Refunded to 5/1/07 @ 39.31) (d) | | 8,000 | | 2,965 |
Wayne-Westland Cmnty. Schools 5% 5/1/10
(FSA Insured) | | 1,225 | | 1,329 |
| | 60,196 |
Minnesota - 0.5% |
Hopkins Independent School District #270 Series B, 4% 2/1/06 | | 2,575 | | 2,596 |
Mankato Independent School District #77 Series A, 4% 2/1/06 (FSA Insured) | | 1,420 | | 1,432 |
Metropolitan Council Minneapolis-Saint Paul Metropolitan Area Series 2005 A, 5% 9/1/06 | | 2,340 | | 2,404 |
Municipal Bonds - continued |
| Principal
Amount (000s) | | Value (Note 1)
(000s) |
Minnesota - continued |
Minneapolis & Saint Paul Hsg. & Redev. Auth. Health Care Sys. Rev. (Health Partners Oblig. Group Proj.): | | | | |
5.25% 12/1/08 | | $ 1,200 | | $ 1,270 |
5.25% 12/1/10 | | 500 | | 541 |
Saint Paul Port Auth. Lease Rev. (HealthEast Midway Campus Proj.) Series 2003 A, 5% 5/1/10 | | 700 | | 702 |
Waconia Independent School District #110 Series A, 5% 2/1/11 (FSA Insured) | | 940 | | 1,028 |
| | 9,973 |
Mississippi - 0.1% |
Mississippi Higher Ed. Student Ln. Series 2000 B3, 5.3% 9/1/08 (c) | | 1,190 | | 1,248 |
Missouri - 0.6% |
Kansas City School District Bldg. Corp. Rev.: | | | | |
(School District Elementary School Proj.): | | | | |
Series 2003 B, 5% 2/1/12 (FGIC Insured) | | 3,100 | | 3,411 |
Series B, 5% 2/1/11 (FGIC Insured) | | 1,850 | | 2,021 |
Series A: | | | | |
5% 2/1/07 (FGIC Insured) | | 1,020 | | 1,056 |
5% 2/1/08 (FGIC Insured) | | 2,000 | | 2,106 |
Saint Louis Muni. Fin. Corp. Leasehold Rev.: | | | | |
(Callahan Courthouse Proj.) Series A, 5.75% 2/15/14 (FGIC Insured) | | 1,050 | | 1,190 |
(Civil Courts Bldg. Proj.) Series 2003 A, 5% 8/1/06 (FSA Insured) | | 1,635 | | 1,676 |
| | 11,460 |
Montana - 0.2% |
Forsyth Poll. Cont. Rev. (Portland Gen. Elec. Co. Projs.) Series A, 5.2%, tender 5/1/09 (b) | | 2,900 | | 3,062 |
Nebraska - 1.7% |
Lancaster County School District #1 (Lincoln Pub. Schools Proj.) 4% 1/15/06 | | 1,000 | | 1,007 |
Nebraska Pub. Pwr. District Rev. Series A: | | | | |
0% 1/1/06 (MBIA Insured) | | 24,465 | | 24,111 |
0% 1/1/07 (MBIA Insured) | | 4,000 | | 3,825 |
Omaha Pub. Pwr. District Elec. Rev. Series B, 4.5% 2/1/09 | | 3,500 | | 3,674 |
| | 32,617 |
Municipal Bonds - continued |
| Principal
Amount (000s) | | Value (Note 1)
(000s) |
Nevada - 1.6% |
Clark County Arpt. Rev. Series C: | | | | |
5% 7/1/05 (AMBAC Insured) (c) | | $ 800 | | $ 800 |
5% 7/1/06 (AMBAC Insured) (c) | | 800 | | 817 |
5% 7/1/08 (AMBAC Insured) (c) | | 2,215 | | 2,321 |
5% 7/1/09 (AMBAC Insured) (c) | | 2,700 | | 2,855 |
5% 7/1/10 (AMBAC Insured) (c) | | 1,225 | | 1,303 |
5% 7/1/11 (AMBAC Insured) (c) | | 1,790 | | 1,915 |
Clark County School District: | | | | |
Series 2000 A, 5.75% 6/15/17 (Pre-Refunded to 6/15/10 @ 100) (d) | | 1,600 | | 1,800 |
Series C, 5% 6/15/10 (MBIA Insured) | | 1,000 | | 1,082 |
Series D, 5% 6/15/09 (MBIA Insured) | | 13,890 | | 14,915 |
Washoe County School District Gen. Oblig. Series D, 5% 6/1/10 (MBIA Insured) | | 2,410 | | 2,612 |
| | 30,420 |
New Hampshire - 0.1% |
New Hampshire Bus. Fin. Auth. Poll. Cont. Rev. (United Illumination Co.) Series A, 3.65%, tender 2/1/10 (AMBAC Insured) (b)(c) | | 2,500 | | 2,501 |
New Jersey - 4.5% |
Casino Reinvestment Dev. Auth. Hotel Room Fee Rev.: | | | | |
5% 1/1/08 (AMBAC Insured) | | 920 | | 965 |
5% 1/1/09 (AMBAC Insured) | | 1,000 | | 1,065 |
Elizabeth Gen. Oblig. 5.25% 8/15/09 (MBIA Insured) | | 1,225 | | 1,329 |
Garden State Preservation Trust Open Space & Farmland Preservation Series B, 6.25% 11/1/09 (MBIA Insured) (a) | | 4,000 | | 4,436 |
New Jersey Econ. Dev. Auth. Rev. 5% 6/15/07 | | 7,500 | | 7,759 |
New Jersey Gen. Oblig. Series 2005 N, 5% 7/15/08 (FGIC Insured) (a) | | 6,175 | | 6,482 |
New Jersey Tpk. Auth. Tpk. Rev. Series 2004 A, 3.15%, tender 1/1/10 (AMBAC Insured) (b) | | 16,250 | | 16,243 |
New Jersey Trans. Trust Fund Auth.: | | | | |
Series 2001 A: | | | | |
5% 6/15/06 | | 355 | | 362 |
5% 6/15/06 (Escrowed to Maturity) (d) | | 5,945 | | 6,078 |
Series A, 5.25% 12/15/08 (MBIA Insured) | | 15,000 | | 16,101 |
Series B: | | | | |
5.25% 12/15/10 (FGIC Insured) | | 4,550 | | 5,020 |
5.25% 12/15/11 (FGIC Insured) | | 10,015 | | 11,109 |
Municipal Bonds - continued |
| Principal
Amount (000s) | | Value (Note 1)
(000s) |
New Jersey - continued |
New Jersey Transit Corp. Series 2000 B, 5.5% 2/1/08 (AMBAC Insured) | | $ 1,000 | | $ 1,064 |
New Jersey Transit Corp. Ctfs. of Prtn. Series A, 6% 9/15/13 (Pre-Refunded to 9/15/09 @ 100) (d) | | 7,000 | | 7,798 |
| | 85,811 |
New Jersey/Pennsylvania - 0.3% |
Delaware River Joint Toll Bridge Commission Bridge Rev. 5% 7/1/09 | | 5,170 | | 5,496 |
New Mexico - 1.8% |
Farmington Poll. Cont. Rev. (Pub. Svc. Co. of
New Mexico San Juan and Four Corners Projs.)
Series 2003 B, 2.1%, tender 4/1/06 (b) | | 7,000 | | 6,935 |
San Juan County Gross Receipts Tax Rev. Series B, 2.5% 8/15/05 | | 13,600 | | 13,596 |
Sandoval County Incentive Payment Rev. 4.25% 12/1/06 | | 13,750 | | 13,960 |
| | 34,491 |
New York - 8.5% |
Grand Central District Mgmt. Assoc., Inc.: | | | | |
5% 1/1/10 | | 1,200 | | 1,289 |
5% 1/1/12 | | 1,175 | | 1,280 |
Metropolitan Trans. Auth. Commuter Facilities Rev.
Series A: | | | | |
5% 7/1/06 (Escrowed to Maturity) (d) | | 270 | | 276 |
5.375% 7/1/09 (Escrowed to Maturity) (d) | | 3,635 | | 3,979 |
Metropolitan Trans. Auth. Svc. Contract Rev. Series B, 5% 1/1/06 | | 10,110 | | 10,225 |
Nassau County Gen. Oblig. Series Z, 5% 9/1/11
(FGIC Insured) | | 800 | | 864 |
New York City Gen. Oblig.: | | | | |
Series 2000 A, 6.5% 5/15/11 | | 2,075 | | 2,381 |
Series 2002 G, 5.5% 8/1/10 | | 2,720 | | 2,993 |
Series 2004 G, 5% 8/1/09 | | 8,000 | | 8,545 |
Series 2005 K: | | | | |
5% 8/1/11 | | 7,120 | | 7,715 |
5% 8/1/12 | | 4,360 | | 4,744 |
Series 2005 O, 5% 6/1/12 | | 7,500 | | 8,146 |
Series A, 5.25% 11/1/14 (MBIA Insured) | | 600 | | 665 |
Series B, 5.75% 8/1/14 | | 1,000 | | 1,128 |
Series E, 6% 8/1/11 | | 60 | | 63 |
Series G, 5.25% 8/1/14 (AMBAC Insured) | | 1,000 | | 1,100 |
Municipal Bonds - continued |
| Principal
Amount (000s) | | Value (Note 1)
(000s) |
New York - continued |
New York City Gen. Oblig.: - continued | | | | |
Series H, 5.75% 3/15/11 (FGIC Insured) | | $ 1,700 | | $ 1,915 |
New York State Dorm. Auth. Revs.: | | | | |
(City Univ. Sys. Consolidation Proj.): | | | | |
Series 2000 A, 6.125% 7/1/12 (AMBAC Insured) | | 5,540 | | 6,345 |
Series A, 5.75% 7/1/13 | | 3,500 | | 3,956 |
Series C, 7.5% 7/1/10 | | 3,600 | | 3,969 |
Series 2003 A: | | | | |
5% 1/1/06 | | 1,250 | | 1,264 |
5% 1/1/07 | | 10,855 | | 11,181 |
5% 3/15/08 | | 2,000 | | 2,105 |
Series B, 5.25%, tender 5/15/12 (b) | | 13,000 | | 14,293 |
New York State Urban Dev. Corp. Rev. 5% 1/1/12 | | 5,000 | | 5,477 |
New York Transitional Fin. Auth. Rev. Series 2003 E: | | | | |
4.5% 2/1/07 | | 1,750 | | 1,798 |
4.5% 2/1/08 | | 1,500 | | 1,560 |
5% 2/1/09 | | 2,035 | | 2,173 |
Tobacco Settlement Fing. Corp.: | | | | |
Series 2004 B1, 5% 6/1/09 | | 3,800 | | 4,049 |
Series A1: | | | | |
5.25% 6/1/12 | | 5,000 | | 5,106 |
5.25% 6/1/13 | | 17,500 | | 18,491 |
Series B1, 5% 6/1/06 | | 17,815 | | 18,115 |
Triborough Bridge & Tunnel Auth. Revs. Series A, 5.5% 1/1/14 (Pre-Refunded to 1/1/12 @ 100) (d) | | 3,745 | | 4,253 |
| | 161,443 |
New York & New Jersey - 0.3% |
Port Auth. of New York & New Jersey: | | | | |
124th Series, 5% 8/1/13 (FGIC Insured) (c) | | 1,200 | | 1,259 |
127th Series, 5% 12/15/08 (AMBAC Insured) (c) | | 3,510 | | 3,725 |
| | 4,984 |
North Carolina - 1.2% |
Charlotte Ctfs. of Prtn. (FY 2004 Equip. Acquisition Proj.) Series 2004 C, 4% 3/1/08 | | 4,940 | | 5,078 |
North Carolina Ctfs. of Prtn. (Repair and Renovation Proj.) Series 2004 B, 4% 6/1/06 | | 1,300 | | 1,316 |
North Carolina Eastern Muni. Pwr. Agcy. Pwr. Sys. Rev.: | | | | |
Series 1993 B, 7% 1/1/08 (MBIA Insured) | | 1,500 | | 1,647 |
Series A, 5.5% 1/1/10 | | 3,000 | | 3,223 |
Series B, 6% 1/1/06 | | 6,170 | | 6,253 |
Municipal Bonds - continued |
| Principal
Amount (000s) | | Value (Note 1)
(000s) |
North Carolina - continued |
North Carolina Eastern Muni. Pwr. Agcy. Pwr. Sys. Rev.: - continued | | | | |
Series C, 5% 1/1/08 | | $ 1,190 | | $ 1,236 |
Series D, 5.375% 1/1/10 | | 3,715 | | 3,972 |
| | 22,725 |
Ohio - 1.3% |
Cleveland Pub. Pwr. Sys. Rev. (First Mtg. Prog.)
Series 1994 A, 0% 11/15/09 (MBIA Insured) | | 2,250 | | 1,943 |
Franklin County Rev. (OCLC Online Computer Library Ctr., Inc. Proj.) 5% 4/15/07 | | 1,960 | | 2,015 |
Lakewood Hosp. Impt. Rev. (Lakewood Hosp. Assoc. Proj.) 5.5% 2/15/07 | | 1,420 | | 1,472 |
Ohio Air Quality Dev. Auth. Rev.: | | | | |
(Pennsylvania Pwr. Co. Proj.) 3.375%, tender 7/1/05 (b) | | 2,300 | | 2,300 |
Series 2002 A, 3.5%, tender 1/1/06 (b) | | 1,000 | | 1,000 |
Ohio Gen. Oblig. Series 2000 E, 5.5% 5/1/09 | | 1,905 | | 2,079 |
Ohio Univ. Gen. Receipts Athens: | | | | |
5% 12/1/06 (FSA Insured) | | 3,600 | | 3,713 |
5% 12/1/07 (FSA Insured) | | 1,285 | | 1,353 |
Ohio Wtr. Dev. Auth. Poll. Cont. Facilities Rev. (Toledo Edison Co. Proj.) Series B, 4.5%, tender 9/1/05 (b) | | 7,000 | | 7,006 |
Ohio Wtr. Dev. Auth. Wtr. Poll. Cont. Rev. (Ohio Edison Co. Proj.) Series A, 3.35%, tender 6/1/06 (b) | | 1,800 | | 1,802 |
| | 24,683 |
Oklahoma - 0.2% |
Cherokee County Econ. Dev. Auth. Series A, 0% 11/1/11 (Escrowed to Maturity) (d) | | 1,000 | | 793 |
Oklahoma Dev. Fin. Auth. Rev. (Samuel Roberts Noble, Inc. Proj.) 5% 5/1/06 | | 3,200 | | 3,259 |
| | 4,052 |
Oregon - 0.4% |
Beaverton Wtr. Rev. Series B, 5% 6/1/10 (FSA Insured) | | 1,210 | | 1,314 |
Eugene Elec. Util. Rev. Series A, 5.25% 8/1/06 (FSA Insured) | | 1,280 | | 1,314 |
Oregon Dept. Administrative Svcs. Ctfs. of Prtn. Series B: | | | | |
5% 5/1/09 (FSA Insured) | | 1,000 | | 1,070 |
5% 5/1/11 (FSA Insured) | | 1,000 | | 1,088 |
Municipal Bonds - continued |
| Principal
Amount (000s) | | Value (Note 1)
(000s) |
Oregon - continued |
Oregon Gen. Oblig. 8.25% 1/1/07 | | $ 1,000 | | $ 1,078 |
Salem Gen. Oblig. 5% 5/1/10 (FSA Insured) | | 2,550 | | 2,766 |
| | 8,630 |
Pennsylvania - 3.9% |
Allegheny County Arpt. Rev. (Pittsburgh Int'l. Arpt. Proj.) Series A1, 5.75% 1/1/12 (MBIA Insured) (c) | | 1,300 | | 1,427 |
Allegheny County Hosp. Dev. Auth. Rev. (Univ. of Pittsburgh Med. Ctr. Proj.) Series B: | | | | |
5.5% 6/15/06 | | 3,065 | | 3,139 |
5.5% 6/15/07 | | 2,000 | | 2,096 |
Allegheny County Indl. Dev. Auth. Rev. (Watson Institute Ed. Ctr. Proj.) 3.375%, tender 5/1/08, LOC PNC Bank NA, Pittsburgh (b) | | 4,500 | | 4,502 |
Allegheny County San. Auth. Swr. Rev. 6% 12/1/11 (MBIA Insured) | | 1,495 | | 1,715 |
Hazleton Area School District 6.5% 3/1/06
(FSA Insured) | | 1,155 | | 1,184 |
Luzerne County Indl. Dev. Auth. Wtr. Facilities Rev. (Pennsylvania-American Wtr. Co. Proj.) 3.6%, tender 12/1/09 (AMBAC Insured) (b)(c) | | 10,000 | | 10,061 |
Montgomery County Higher Ed. & Health Auth. Hosp. Rev. (Abington Memorial Hosp. Proj.) Series A, 5% 6/1/06 (AMBAC Insured) | | 3,750 | | 3,818 |
Pennsylvania Econ. Dev. Fing. Auth. Exempt Facilities Rev. (Shippingport Proj.) Series A, 4.35%, tender 6/1/10 (b)(c) | | 1,200 | | 1,203 |
Pennsylvania Higher Edl. Facilities Auth. Rev.: | | | | |
(Univ. of Pennsylvania Health Systems Proj.) Series A: | | | | |
4% 8/15/06 | | 1,405 | | 1,420 |
5% 8/15/07 | | 1,735 | | 1,797 |
5% 8/15/08 | | 2,000 | | 2,100 |
(UPMC Health Sys. Proj.) Series 2001 A, 5.75% 1/15/09 | | 1,750 | | 1,882 |
Series B: | | | | |
5% 9/1/06 | | 4,510 | | 4,626 |
5.25% 9/1/08 | | 5,860 | | 6,275 |
Pennsylvania Indl. Dev. Auth. Rev. 5.25% 7/1/10 (AMBAC Insured) | | 2,750 | | 3,023 |
Philadelphia Muni. Auth. Rev.: | | | | |
Series A: | | | | |
5% 5/15/07 (FSA Insured) | | 5,500 | | 5,721 |
5% 5/15/08 (FSA Insured) | | 5,000 | | 5,280 |
Series B, 5.25% 11/15/11 (FSA Insured) | | 3,400 | | 3,771 |
Municipal Bonds - continued |
| Principal
Amount (000s) | | Value (Note 1)
(000s) |
Pennsylvania - continued |
Philadelphia School District Series B, 5% 4/1/11 (AMBAC Insured) | | $ 2,160 | | $ 2,365 |
Pittsburgh Gen. Oblig. Series A, 6% 3/1/07
(MBIA Insured) | | 2,000 | | 2,102 |
Westmoreland County Muni. Auth. Muni. Svc. Rev. Series K, 0% 7/1/12 (Escrowed to Maturity) (d) | | 2,355 | | 1,839 |
Wyoming Valley San. Auth. Swr. Rev. 5% 11/15/06 (MBIA Insured) | | 1,865 | | 1,922 |
| | 73,268 |
Puerto Rico - 0.0% |
Puerto Rico Pub. Bldgs Auth. Rev. Series K, 4%, tender 7/1/07 (MBIA Insured) (b) | | 1,000 | | 1,027 |
Rhode Island - 0.2% |
Rhode Island Health & Edl. Bldg. Corp. Rev. (Johnson & Wales Univ. Proj.): | | | | |
5% 4/1/06 (XL Cap. Assurance, Inc. Insured) | | 2,225 | | 2,264 |
5% 4/1/08 (XL Cap. Assurance, Inc. Insured) | | 1,700 | | 1,794 |
| | 4,058 |
South Carolina - 1.8% |
Berkeley County School District 7% 4/1/07 | | 2,615 | | 2,805 |
Charleston County Hosp. Facilities (Care Alliance Health Services Proj.) Series A: | | | | |
5% 8/15/06 | | 1,000 | | 1,020 |
5% 8/15/07 | | 1,700 | | 1,766 |
5% 8/15/08 | | 1,690 | | 1,771 |
Greenville County Pub. Facilities Corp. Certificate of Prtn. (Courthouse and Detention Proj.) 5% 4/1/10 (AMBAC Insured) | | 1,450 | | 1,574 |
Piedmont Muni. Pwr. Agcy. Elec. Rev. 5.6% 1/1/09 (MBIA Insured) | | 2,345 | | 2,558 |
Rock Hill Util. Sys. Rev. Series 2003 A: | | | | |
5% 1/1/08 (FSA Insured) | | 1,850 | | 1,950 |
5% 1/1/09 (FSA Insured) | | 1,945 | | 2,083 |
South Carolina Pub. Svc. Auth. Rev.: | | | | |
Series 2002 A: | | | | |
5% 1/1/06 (FSA Insured) | | 1,705 | | 1,725 |
5% 1/1/07 (FSA Insured) | | 4,105 | | 4,240 |
Series 2005 B, 5% 1/1/10 (MBIA Insured) (a) | | 3,000 | | 3,214 |
Series A: | | | | |
5.5% 1/1/11 (MBIA Insured) | | 3,000 | | 3,311 |
5.5% 1/1/14 (FGIC Insured) (a) | | 1,335 | | 1,517 |
Municipal Bonds - continued |
| Principal
Amount (000s) | | Value (Note 1)
(000s) |
South Carolina - continued |
South Carolina Pub. Svc. Auth. Rev.: - continued | | | | |
Series D, 5% 1/1/06 | | $ 2,750 | | $ 2,782 |
Spartanburg County School District #5 Pub. Facilities Corp. Ctfs. of Prtn. 5% 7/1/09 (FSA Insured) | | 1,000 | | 1,075 |
| | 33,391 |
Tennessee - 0.7% |
Elizabethton Health & Edl. Facilities Board Rev. (First Mtg. Prog.) 6% 7/1/11 (MBIA Insured) | | 2,005 | | 2,288 |
Maury County Gen. Oblig. Series 2004 B, 5% 4/1/10 (MBIA Insured) | | 2,000 | | 2,162 |
Memphis-Shelby County Arpt. Auth. Arpt. Rev. Series A: | | | | |
4% 9/1/06 (MBIA Insured) | | 1,500 | | 1,521 |
4.5% 9/1/08 (MBIA Insured) | | 1,620 | | 1,692 |
4.5% 9/1/09 (MBIA Insured) | | 1,685 | | 1,773 |
Metropolitan Nashville Arpt. Auth. Rev. Series C, 5% 7/1/06 (FGIC Insured) (c) | | 1,675 | | 1,711 |
Shelby County Health Edl. & Hsg. Facility Board Hosp. Rev. (Methodist Health Care Proj.) 5.5% 4/1/09 (MBIA Insured) | | 1,200 | | 1,294 |
| | 12,441 |
Texas - 14.4% |
Alief Independent School District Series 2004 B, 5% 2/15/10 | | 1,500 | | 1,619 |
Arlington Independent School District 5% 2/15/13 | | 2,500 | | 2,756 |
Austin Arpt. Sys. Rev. Series A: | | | | |
6.5% 11/15/05 (Escrowed to Maturity) (c)(d) | | 940 | | 953 |
6.5% 11/15/05 (MBIA Insured) (c) | | 6,870 | | 6,963 |
Austin Independent School District 5% 8/1/07 (a) | | 3,605 | | 3,682 |
Austin Util. Sys. Rev.: | | | | |
Series 1992 A, 0% 11/15/09 (MBIA Insured) | | 5,130 | | 4,438 |
Series A, 0% 11/15/10 (MBIA Insured) | | 5,300 | | 4,401 |
Bexar County Series A: | | | | |
5% 6/15/09 (FSA Insured) | | 2,615 | | 2,803 |
5% 6/15/10 (FSA Insured) | | 1,000 | | 1,083 |
Birdville Independent School District 5% 2/15/10 | | 1,300 | | 1,403 |
Brazos River Auth. Poll. Cont. Rev. (Texas Utils. Elec. Co. Proj.) Series 1995 B, 5.05%, tender 6/19/06 (b)(c) | | 6,255 | | 6,346 |
Bryan Wtrwks. & Swr. Sys. Rev. 5.5% 7/1/11 (FSA Insured) | | 1,500 | | 1,684 |
College Station Independent School District 5% 2/15/10 | | 1,000 | | 1,079 |
Conroe Independent School District Lot B, 0% 2/15/08 | | 3,000 | | 2,761 |
Municipal Bonds - continued |
| Principal
Amount (000s) | | Value (Note 1)
(000s) |
Texas - continued |
Corpus Christi Gen. Oblig.: | | | | |
4% 3/1/06 (FSA Insured) | | $ 1,285 | | $ 1,296 |
5% 3/1/06 (AMBAC Insured) | | 3,365 | | 3,417 |
5% 3/1/07 (FSA Insured) | | 2,735 | | 2,835 |
Corpus Christi Util. Sys. Rev.: | | | | |
5% 7/15/12 (FSA Insured) | | 1,000 | | 1,103 |
5% 7/15/13 (FSA Insured) | | 1,665 | | 1,848 |
Cypress-Fairbanks Independent School District: | | | | |
Series B, 0% 8/1/07 (AMBAC Insured) | | 10,000 | | 9,404 |
4.5% 2/15/06 | | 2,245 | | 2,270 |
5% 2/15/08 | | 2,000 | | 2,105 |
Dallas Independent School District Series 2005, 5.25% 8/15/08 (a) | | 2,000 | | 2,134 |
Del Valle Independent School District 5.5% 2/1/09 | | 1,205 | | 1,305 |
Denton County Gen. Oblig.: | | | | |
5% 7/15/11 (FSA Insured) (a) | | 3,065 | | 3,349 |
5% 7/15/13 (FSA Insured) (a) | | 1,200 | | 1,326 |
El Paso Wtr. & Swr. Rev.: | | | | |
5% 3/1/06 (AMBAC Insured) | | 1,000 | | 1,015 |
5% 3/1/08 (AMBAC Insured) | | 2,770 | | 2,918 |
Fort Bend Independent School District 5%, tender 8/15/09 (b) | | 5,000 | | 5,344 |
Fort Worth Gen. Oblig. Series A, 5% 3/1/06 | | 1,000 | | 1,015 |
Fort Worth Independent School District 5% 2/15/12 | | 1,500 | | 1,644 |
Frisco Gen. Oblig.: | | | | |
Series 2003 A: | | | | |
4% 2/15/07 (FSA Insured) | | 1,320 | | 1,347 |
4% 2/15/08 (FSA Insured) | | 1,145 | | 1,176 |
5% 2/15/10 (FSA Insured) | | 1,710 | | 1,845 |
4% 2/15/06 (FSA Insured) | | 2,975 | | 3,000 |
4% 2/15/07 (FSA Insured) | | 3,115 | | 3,178 |
Garland Independent School District 0% 2/15/07 | | 1,610 | | 1,533 |
Harris County Gen. Oblig. Series A, 0% 8/15/07
(FGIC Insured) | | 4,400 | | 4,133 |
Harris County Health Facilities Dev. Corp. Rev. (Saint Luke's Episcopal Hosp. Proj.) Series 2001 A, 5.5% 2/15/09 | | 3,710 | | 3,993 |
Houston Cmnty. College Sys. Rev.: | | | | |
5.25% 4/15/11 (FSA Insured) | | 3,030 | | 3,342 |
5.25% 4/15/12 (FSA Insured) | | 2,000 | | 2,223 |
Houston Gen. Oblig.: | | | | |
5.5% 3/1/06 | | 2,580 | | 2,627 |
Municipal Bonds - continued |
| Principal
Amount (000s) | | Value (Note 1)
(000s) |
Texas - continued |
Houston Gen. Oblig.: - continued | | | | |
5.5% 3/1/06 (Escrowed to Maturity) (d) | | $ 120 | | $ 122 |
Houston Util. Sys. Rev. Series A, 5.25% 5/15/10
(MBIA Insured) | | 1,250 | | 1,368 |
Irving Independent School District 5.25% 2/15/13 | | 2,145 | | 2,400 |
Katy Independent School District Series A: | | | | |
4% 2/15/06 | | 1,335 | | 1,346 |
5.25% 2/15/12 | | 2,000 | | 2,221 |
Killeen Independent School District 4% 2/15/08 | | 1,200 | | 1,233 |
La Porte Independent School District 4% 2/15/08 | | 2,000 | | 2,055 |
Lewisville Gen. Oblig. 4% 2/15/06 (FSA Insured) | | 1,300 | | 1,311 |
Lower Colorado River Auth. Rev.: | | | | |
0% 1/1/09 (Escrowed to Maturity) (d) | | 3,000 | | 2,690 |
5.25% 1/1/15 (Pre-Refunded to 1/1/11 @ 100) (d) | | 5,000 | | 5,517 |
Lubbock Gen. Oblig.: | | | | |
(Wtrwks. Sys. Surplus Proj.) 5% 2/15/11
(FSA Insured) (a) | | 2,465 | | 2,674 |
5% 2/15/09 (MBIA Insured) | | 1,615 | | 1,723 |
5% 2/15/10 (MBIA Insured) | | 1,845 | | 1,991 |
Mesquite Independent School District Series A, 0% 8/15/06 | | 1,115 | | 1,080 |
New Braunfels Independent School District 0% 2/1/07 | | 2,000 | | 1,907 |
North East Texas Independent School District 7% 2/1/11 (Pre-Refunded to 2/1/10 @ 100) (d) | | 3,600 | | 4,200 |
North Texas Tollway Auth. Dallas North Tollway Sys. Rev. Series C: | | | | |
5% 1/1/09 (FSA Insured) | | 2,000 | | 2,135 |
5%, tender 7/1/08 (FSA Insured) (b) | | 2,650 | | 2,797 |
Northside Independent School District Series B, 2.45%, tender 8/1/06 (Liquidity Facility Dexia Cr. Local de France) (b) | | 7,300 | | 7,284 |
Port Houston Auth. Harris County 6% 10/1/06
(FGIC Insured) (c) | | 2,000 | | 2,079 |
Red River Ed. Fin. Corp. Ed. Rev. (Texas Christian Univ. Proj.) 5% 3/15/12 (MBIA Insured) | | 2,625 | | 2,876 |
Rockwall Independent School District: | | | | |
4% 2/15/06 | | 2,370 | | 2,389 |
5% 2/15/08 | | 3,825 | | 4,025 |
5% 2/15/09 | | 4,690 | | 5,005 |
San Angelo Wtrks & Swr. Sys. Impt. and Rfdg. Rev. 5% 4/1/10 (FSA Insured) | | 1,630 | | 1,762 |
Municipal Bonds - continued |
| Principal
Amount (000s) | | Value (Note 1)
(000s) |
Texas - continued |
San Antonio Elec. & Gas Systems Rev.: | | | | |
Series 2000 A, 5.75% 2/1/15 (Pre-Refunded to 2/1/10 @ 100) (d) | | $ 5,000 | | $ 5,558 |
5.25% 2/1/07 | | 2,500 | | 2,597 |
5.25% 2/1/08 | | 1,000 | | 1,059 |
San Antonio Independent School District 7% 8/15/08 | | 5,000 | | 5,592 |
San Antonio Muni. Drain Util. Sys. Rev. 5.25% 2/1/12 (MBIA Insured) | | 1,545 | | 1,718 |
San Antonio Wtr. Sys. Rev. 5% 5/15/10 (FGIC Insured) | | 1,020 | | 1,105 |
Socorro Independent School District 5% 8/15/09 | | 2,070 | | 2,225 |
Spring Branch Independent School District Series 2001, 5.375% 2/1/14 | | 2,790 | | 3,067 |
Spring Independent School District 5% 2/15/08 | | 1,875 | | 1,973 |
Texas Gen. Oblig.: | | | | |
(College Student Ln. Prog.) 5% 8/1/11 (c) | | 3,000 | | 3,167 |
Series 1992 A, 8% 10/1/07 | | 10,000 | | 11,103 |
Series A, 6% 10/1/08 (MBIA Insured) | | 10,750 | | 11,789 |
Series C, 0% 4/1/08 (Escrowed to Maturity) (d) | | 3,100 | | 2,861 |
Texas Pub. Fin. Auth. Bldg. Rev. (Dept. of Criminal Justice Prog.) Series A, 5% 2/1/07 (FSA Insured) | | 2,000 | | 2,069 |
Texas Pub. Fin. Auth. Rev. (Bldg. and Procurement Commission Projs.) Series A, 5% 2/1/10
(AMBAC Insured) | | 1,055 | | 1,138 |
Texas State Univ. Sys. Fing. Rev. 5% 3/15/13
(FSA Insured) | | 2,000 | | 2,212 |
Texas Tech Univ. Revs. Ninth Series: | | | | |
4% 2/15/09 (AMBAC Insured) | | 1,460 | | 1,510 |
5% 2/15/11 (AMBAC Insured) | | 1,250 | | 1,363 |
Travis County Gen. Oblig. 5.25% 3/1/12 | | 4,125 | | 4,586 |
Trinity River Auth. Red Oak Creek Sys. Rev. 3.5% 2/1/06 (FSA Insured) | | 1,270 | | 1,276 |
Tyler Health Facilities Dev. Corp. Hosp. Rev. (Mother Frances Hosp. Reg'l. Health Care Ctr. Proj.): | | | | |
4% 7/1/05 | | 1,800 | | 1,800 |
4.5% 7/1/06 | | 1,220 | | 1,229 |
5% 7/1/07 | | 1,000 | | 1,030 |
Univ. of Texas Univ. Revs.: | | | | |
(Fing. Sys. Proj.) Series A, 5.5% 8/15/09 | | 1,115 | | 1,221 |
Series B, 5% 8/15/09 | | 13,555 | | 14,584 |
Webb County Gen. Oblig.: | | | | |
5% 2/15/06 (FGIC Insured) | | 1,055 | | 1,070 |
5% 2/15/07 (FGIC Insured) | | 1,110 | | 1,150 |
Municipal Bonds - continued |
| Principal
Amount (000s) | | Value (Note 1)
(000s) |
Texas - continued |
Webb County Gen. Oblig.: - continued | | | | |
5% 2/15/08 (FGIC Insured) | | $ 1,170 | | $ 1,231 |
Wichita Falls Independent School District 0% 2/1/10 | | 2,325 | | 1,987 |
| | 272,156 |
Utah - 0.5% |
Salt Lake County Wtr. Conservancy District Rev. Series A: | | | | |
0% 10/1/11 (AMBAC Insured) | | 3,800 | | 3,010 |
0% 10/1/12 (AMBAC Insured) | | 3,800 | | 2,884 |
0% 10/1/13 (AMBAC Insured) | | 3,760 | | 2,735 |
Utah Bldg. Ownership Auth. Lease Rev. (State Facilities Master Lease Prog.) Series A, 5% 5/15/11 | | 1,700 | | 1,861 |
| | 10,490 |
Virginia - 0.2% |
Amelia County Indl. Dev. Auth. Solid Waste Disp. Rev. (Waste Mgmt., Inc. Proj.) 4.05%, tender 4/1/08 (b)(c) | | 1,000 | | 1,004 |
Virginia Commonwealth Trans. Board Trans. Rev. (U.S. Route 58 Corridor Dev. Prog.) Series B, 5.375% 5/15/12 (Pre-Refunded to 5/15/09 @ 101) (d) | | 1,800 | | 1,978 |
| | 2,982 |
Washington - 5.2% |
Chelan County Pub. Util. District #1 Rev. Series B, 5% 7/1/11 (FGIC Insured) | | 1,190 | | 1,274 |
Clark County Pub. Util. District #1 Elec. Rev.: | | | | |
Series B: | | | | |
5% 1/1/06 (FSA Insured) | | 1,375 | | 1,390 |
5% 1/1/07 (FSA Insured) | | 1,395 | | 1,440 |
5.25% 1/1/08 (FSA Insured) | | 1,515 | | 1,602 |
5.25% 1/1/09 (FSA Insured) | | 1,595 | | 1,716 |
5% 1/1/11 (MBIA Insured) | | 1,680 | | 1,833 |
King & Snohomish Counties School District #417 Northshore: | | | | |
5.5% 12/1/14 (Pre-Refunded to 6/1/12 @ 100) (d) | | 6,300 | | 7,183 |
5.75% 12/1/15 (Pre-Refunded to 6/1/12 @ 100) (d) | | 2,500 | | 2,889 |
King County Rural Library District 5% 12/1/06 (FSA Insured) | | 1,045 | | 1,078 |
King County School District #409, Tahoma 5% 6/1/11 (FSA Insured) | | 1,740 | | 1,904 |
King County Swr. Rev. Series B: | | | | |
5% 1/1/06 (FSA Insured) | | 3,000 | | 3,035 |
5% 1/1/07 (FSA Insured) | | 5,000 | | 5,164 |
Municipal Bonds - continued |
| Principal
Amount (000s) | | Value (Note 1)
(000s) |
Washington - continued |
King County Swr. Rev. Series B: - continued | | | | |
5.25% 1/1/08 (FSA Insured) | | $ 3,500 | | $ 3,701 |
Pierce County School District #10 Tacoma Series A, 5% 12/1/12 (FSA Insured) | | 4,175 | | 4,597 |
Port of Seattle Rev. Series D, 5.75% 11/1/15
(FGIC Insured) (c) | | 3,640 | | 4,077 |
Seattle Muni. Lt. & Pwr. Rev. 5.25% 3/1/07
(FSA Insured) | | 1,690 | | 1,757 |
Snohomish County Pub. Hosp. District #2 (Stevens Health Care Proj.): | | | | |
4% 12/1/05 (FGIC Insured) | | 1,570 | | 1,578 |
4.5% 12/1/09 (FGIC Insured) | | 1,000 | | 1,055 |
Snohomish County School District #2, Everett: | | | | |
5% 6/1/09 (FSA Insured) | | 1,045 | | 1,121 |
5% 6/1/10 (FSA Insured) | | 1,000 | | 1,084 |
Vancouver Wtr. & Swr. Rev. 5.25% 6/1/11
(FSA Insured) | | 1,000 | | 1,108 |
Washington Gen. Oblig. Series A: | | | | |
4% 1/1/08 (MBIA Insured) | | 33,175 | | 34,098 |
5% 7/1/11 (FGIC Insured) | | 1,000 | | 1,093 |
5.5% 7/1/11 | | 3,500 | | 3,853 |
Washington Pub. Pwr. Supply Sys. Nuclear Proj. #2 Rev. Series A, 5.75% 7/1/08 | | 3,000 | | 3,236 |
Washington Pub. Pwr. Supply Sys. Nuclear Proj. #3 Rev. Series C, 5% 7/1/06 (FSA Insured) | | 5,000 | | 5,109 |
| | 97,975 |
West Virginia - 0.1% |
West Virginia School Bldg. Auth. 4% 1/1/06 (MBIA Insured) | | 2,500 | | 2,517 |
Wisconsin - 1.5% |
Milwaukee County Gen. Oblig. Series A, 0% 12/1/10 (FGIC Insured) | | 3,370 | | 2,782 |
Wisconsin Gen. Oblig. Series 1, 5% 5/1/10
(MBIA Insured) (a) | | 2,500 | | 2,666 |
Wisconsin Health & Edl. Facilities Auth. Rev.: | | | | |
(Hosp. Sisters Svcs., Inc. Proj.) Series 2003 B, 4%, tender 12/1/06 (FSA Insured) (b) | | 15,000 | | 15,192 |
(Wheaton Franciscan Svcs., Inc. Proj.) Series A: | | | | |
5% 8/15/09 | | 1,000 | | 1,058 |
5% 8/15/10 | | 1,870 | | 1,981 |
Municipal Bonds - continued |
| Principal
Amount (000s) | | Value (Note 1)
(000s) |
Wisconsin - continued |
Wisconsin Trans. Rev.: | | | | |
Series A, 5.7% 7/1/14 (Pre-Refunded to 7/1/06 @ 100) (d) | | $ 2,230 | | $ 2,297 |
5% 7/1/07 | | 1,500 | | 1,564 |
| | 27,540 |
TOTAL MUNICIPAL BONDS (Cost $1,806,102) | 1,813,552 |
Municipal Notes - 0.6% |
| | | |
Michigan - 0.5% |
Michigan Strategic Fund Poll. Cont. Rev. (Gen. Motors Corp. Proj.) Series 1988 A, 4.4%, VRDN (b) | | 8,830 | | 8,830 |
Ohio - 0.1% |
Ohio Poll. Cont. Rev. (Gen. Motors Corp. Proj.) Series 1985, 4.85%, VRDN (b) | | 2,350 | | 2,350 |
TOTAL MUNICIPAL NOTES (Cost $11,180) | | 11,180 |
TOTAL INVESTMENT PORTFOLIO - 96.6% (Cost $1,817,282) | | | 1,824,732 |
NET OTHER ASSETS - 3.4% | | | 63,257 |
NET ASSETS - 100% | | $ 1,887,989 |
Security Type Abbreviation |
VRDN - VARIABLE RATE DEMAND NOTE |
Legend |
(a) Security or a portion of the security purchased on a delayed delivery or when-issued basis. |
(b) The coupon rate shown on floating or adjustable rate securities represents the rate at period end. |
(c) Private activity obligations whose interest is subject to the federal alternative minimum tax for individuals. |
(d) Security collateralized by an amount sufficient to pay interest and principal. |
(e) Restricted securities - Investment in securities not registered under the Securities Act of 1933 (excluding 144A issues). At the end of the period, the value of restricted securities (excluding 144A issues) amounted to $9,217,000 or 0.5% of net assets. |
Additional information on each holding is as follows: |
Security | Acquisition
Date | Acquisition
Cost (000s) |
Univ. of California Revs. (UCLA Med. Ctr. Proj.) 4.55% 12/1/09 | 3/6/02 | $ 8,955 |
Other Information |
The distribution of municipal securities by revenue source, as a percentage of total net assets, is as follows: |
General Obligations | 45.1% |
Electric Utilities | 14.0% |
Escrowed/Pre-Refunded | 8.1% |
Transportation | 6.6% |
Health Care | 5.9% |
Education | 5.2% |
Others* (individually less than 5%) | 15.1% |
| 100.0% |
* Includes net other assets |
See accompanying notes which are an integral part of the financial statements.
Semiannual Report
Financial Statements
Statement of Assets and Liabilities
Amounts in thousands (except per-share amounts) | June 30, 2005 (Unaudited) |
| | |
Assets | | |
Investment in securities, at value (cost $1,817,282) - See accompanying schedule | | $ 1,824,732 |
Cash | | 112,770 |
Receivable for investments sold | | 441 |
Receivable for fund shares sold | | 3,073 |
Interest receivable | | 22,410 |
Prepaid expenses | | 4 |
Other receivables | | 163 |
Total assets | | 1,963,593 |
| | |
Liabilities | | |
Payable for investments purchased
Regular delivery | $ 27,781 | |
Delayed delivery | 41,935 | |
Payable for fund shares redeemed | 3,837 | |
Distributions payable | 1,255 | |
Accrued management fee | 587 | |
Distribution fees payable | 18 | |
Other affiliated payables | 160 | |
Other payables and accrued expenses | 31 | |
Total liabilities | | 75,604 |
| | |
Net Assets | | $ 1,887,989 |
Net Assets consist of: | | |
Paid in capital | | $ 1,881,014 |
Undistributed net investment income | | 156 |
Accumulated undistributed net realized gain (loss) on investments | | (631) |
Net unrealized appreciation (depreciation) on investments | | 7,450 |
Net Assets | | $ 1,887,989 |
See accompanying notes which are an integral part of the financial statements.
Semiannual Report
Financial Statements - continued
Statement of Assets and Liabilities - continued
Amounts in thousands (except per-share amounts) | June 30, 2005 (Unaudited) |
| | |
Calculation of Maximum Offering Price
Class A:
Net Asset Value and redemption price per share
($11,447 ÷ 1,110 shares) | | $ 10.31 |
| | |
Maximum offering price per share (100/96.25 of $10.31) | | $ 10.71 |
Class T:
Net Asset Value and redemption price per share ($20,193 ÷ 1,961 shares) | | $ 10.30 |
| | |
Maximum offering price per share (100/97.25 of $10.30) | | $ 10.59 |
Class B:
Net Asset Value and offering price per share
($3,721 ÷ 361 shares)A | | $ 10.31 |
| | |
Class C:
Net Asset Value and offering price per share
($11,227 ÷ 1,090 shares)A | | $ 10.30 |
| | |
Spartan Short-Intermediate Municipal Income:
Net Asset Value, offering price and redemption price per share ($1,839,829 ÷ 178,659 shares) | | $ 10.30 |
| | |
Institutional Class:
Net Asset Value, offering price and redemption price per share ($1,572 ÷ 152.6 shares) | | $ 10.30 |
A Redemption price per share is equal to net asset value less any applicable contingent deferred sales charge.
See accompanying notes which are an integral part of the financial statements.
Semiannual Report
Statement of Operations
Amounts in thousands | Six months ended June 30, 2005 (Unaudited) |
| | |
Investment Income | | |
Interest | | $ 29,768 |
| | |
Expenses | | |
Management fee | $ 3,535 | |
Transfer agent fees | 751 | |
Distribution fees | 110 | |
Accounting fees and expenses | 183 | |
Independent trustees' compensation | 4 | |
Custodian fees and expenses | 15 | |
Registration fees | 76 | |
Audit | 27 | |
Legal | 7 | |
Miscellaneous | 7 | |
Total expenses before reductions | 4,715 | |
Expense reductions | (436) | 4,279 |
Net investment income | | 25,489 |
Realized and Unrealized Gain (Loss) Net realized gain (loss) on investment securities | | (336) |
Change in net unrealized appreciation (depreciation) on investment securities | | (13,546) |
Net gain (loss) | | (13,882) |
Net increase (decrease) in net assets resulting from operations | | $ 11,607 |
See accompanying notes which are an integral part of the financial statements.
Semiannual Report
Financial Statements - continued
Statement of Changes in Net Assets
Amounts in thousands | Six months ended
June 30, 2005
(Unaudited) | Year ended
December 31,
2004 |
Increase (Decrease) in Net Assets | | |
Operations | | |
Net investment income | $ 25,489 | $ 47,437 |
Net realized gain (loss) | (336) | 4,712 |
Change in net unrealized appreciation (depreciation) | (13,546) | (22,609) |
Net increase (decrease) in net assets resulting
from operations | 11,607 | 29,540 |
Distributions to shareholders from net investment income | (25,523) | (47,598) |
Distributions to shareholders from net realized gain | (549) | (3,486) |
Total distributions | (26,072) | (51,084) |
Share transactions - net increase (decrease) | 12,401 | 37,160 |
Redemption fees | 20 | 65 |
Total increase (decrease) in net assets | (2,044) | 15,681 |
| | |
Net Assets | | |
Beginning of period | 1,890,033 | 1,874,352 |
End of period (including undistributed net investment income of $156 and undistributed net investment income of $190, respectively) | $ 1,887,989 | $ 1,890,033 |
See accompanying notes which are an integral part of the financial statements.
Semiannual Report
Financial Highlights - Class A
| Six months ended
June 30, 2005 | Years ended December 31, |
| (Unaudited) | 2004 | 2003 F |
Selected Per-Share Data | | | |
Net asset value, beginning of period | $ 10.39 | $ 10.50 | $ 10.49 |
Income from Investment Operations | | | |
Net investment income E | .132 | .250 | .115 |
Net realized and unrealized gain (loss) | (.078) | (.090) | .071 |
Total from investment operations | .054 | .160 | .186 |
Distributions from net investment income | (.131) | (.251) | (.111) |
Distributions from net realized gain | (.003) | (.019) | (.065) |
Total distributions | (.134) | (.270) | (.176) |
Redemption fees added to paid in capital E | - H | - H | - H |
Net asset value, end of period | $ 10.31 | $ 10.39 | $ 10.50 |
Total Return B, C, D | .53% | 1.55% | 1.78% |
Ratios to Average Net Assets G | | | |
Expenses before expense reductions | .66% A | .65% | .65% A |
Expenses net of voluntary waivers, if any | .66% A | .65% | .65% A |
Expenses net of all reductions | .61% A | .64% | .64% A |
Net investment income | 2.57% A | 2.41% | 2.52% A |
Supplemental Data | | | |
Net assets, end of period (in millions) | $ 11 | $ 12 | $ 9 |
Portfolio turnover rate | 27% A | 45% | 34% |
A Annualized
B Total returns for periods of less than one year are not annualized.
C Total returns would have been lower had certain expenses not been reduced during the periods shown.
D Total returns do not include the effect of the sales charges.
E Calculated based on average shares outstanding during the period.
F For the period July 23, 2003 (commencement of sale of shares) to December 31, 2003.
G Expense ratios reflect operating expenses of the class. Expenses before reductions do not reflect amounts reimbursed by the investment adviser or reductions from brokerage service arrangements or other expense offset arrangements and do not represent the amount paid by the class during periods when reimbursements or reductions occur. Expense ratios before reductions for start-up periods may not be representative of longer-term operating periods. Expenses net of any voluntary waivers reflect expenses after reimbursement by the investment adviser but prior to reductions from brokerage service arrangements or other expense offset arrangements. Expenses net of all reductions represent the net expenses paid by the class.
H Amount represents less than $.001 per share.
See accompanying notes which are an integral part of the financial statements.
Semiannual Report
Financial Highlights - Class T
| Six months ended
June 30, 2005 | Years ended December 31, |
| (Unaudited) | 2004 | 2003 F |
Selected Per-Share Data | | | |
Net asset value, beginning of period | $ 10.37 | $ 10.48 | $ 10.49 |
Income from Investment Operations | | | |
Net investment income E | .125 | .238 | .110 |
Net realized and unrealized gain (loss) | (.066) | (.089) | .050 |
Total from investment operations | .059 | .149 | .160 |
Distributions from net investment income | (.126) | (.240) | (.105) |
Distributions from net realized gain | (.003) | (.019) | (.065) |
Total distributions | (.129) | (.259) | (.170) |
Redemption fees added to paid in capital E | - H | - H | - H |
Net asset value, end of period | $ 10.30 | $ 10.37 | $ 10.48 |
Total Return B, C, D | .57% | 1.44% | 1.54% |
Ratios to Average Net Assets G | | | |
Expenses before expense reductions | .77% A | .76% | .77% A |
Expenses net of voluntary waivers, if any | .77% A | .76% | .77% A |
Expenses net of all reductions | .72% A | .75% | .76% A |
Net investment income | 2.46% A | 2.30% | 2.41% A |
Supplemental Data | | | |
Net assets, end of period (in millions) | $ 20 | $ 20 | $ 12 |
Portfolio turnover rate | 27% A | 45% | 34% |
A Annualized
B Total returns for periods of less than one year are not annualized.
C Total returns would have been lower had certain expenses not been reduced during the periods shown.
D Total returns do not include the effect of the sales charges.
E Calculated based on average shares outstanding during the period.
F For the period July 23, 2003 (commencement of sale of shares) to December 31, 2003.
G Expense ratios reflect operating expenses of the class. Expenses before reductions do not reflect amounts reimbursed by the investment adviser or reductions from brokerage service arrangements or other expense offset arrangements and do not represent the amount paid by the class during periods when reimbursements or reductions occur. Expense ratios before reductions for start-up periods may not be representative of longer-term operating periods. Expenses net of any voluntary waivers reflect expenses after reimbursement by the investment adviser but prior to reductions from brokerage service arrangements or other expense offset arrangements. Expenses net of all reductions represent the net expenses paid by the class.
H Amount represents less than $.001 per share.
See accompanying notes which are an integral part of the financial statements.
Semiannual Report
Financial Highlights - Class B
| Six months ended
June 30, 2005 | Years ended December 31, |
| (Unaudited) | 2004 | 2003 F |
Selected Per-Share Data | | | |
Net asset value, beginning of period | $ 10.39 | $ 10.49 | $ 10.49 |
Income from Investment Operations | | | |
Net investment income E | .092 | .172 | .081 |
Net realized and unrealized gain (loss) | (.077) | (.080) | .059 |
Total from investment operations | .015 | .092 | .140 |
Distributions from net investment income | (.092) | (.173) | (.075) |
Distributions from net realized gain | (.003) | (.019) | (.065) |
Total distributions | (.095) | (.192) | (.140) |
Redemption fees added to paid in capital E | - H | - H | - H |
Net asset value, end of period | $ 10.31 | $ 10.39 | $ 10.49 |
Total Return B, C, D | .15% | .89% | 1.34% |
Ratios to Average Net Assets G | | | |
Expenses before expense reductions | 1.42% A | 1.40% | 1.40% A |
Expenses net of voluntary waivers, if any | 1.42% A | 1.40% | 1.40% A |
Expenses net of all reductions | 1.37% A | 1.39% | 1.39% A |
Net investment income | 1.80% A | 1.65% | 1.78% A |
Supplemental Data | | | |
Net assets, end of period (in millions) | $ 4 | $ 4 | $ 2 |
Portfolio turnover rate | 27% A | 45% | 34% |
A Annualized
B Total returns for periods of less than one year are not annualized.
C Total returns would have been lower had certain expenses not been reduced during the periods shown.
D Total returns do not include the effect of the contingent deferred sales charge.
E Calculated based on average shares outstanding during the period.
F For the period July 23, 2003 (commencement of sale of shares) to December 31, 2003.
G Expense ratios reflect operating expenses of the class. Expenses before reductions do not reflect amounts reimbursed by the investment adviser or reductions from brokerage service arrangements or other expense offset arrangements and do not represent the amount paid by the class during periods when reimbursements or reductions occur. Expense ratios before reductions for start-up periods may not be representative of longer-term operating periods. Expenses net of any voluntary waivers reflect expenses after reimbursement by the investment adviser but prior to reductions from brokerage service arrangements or other expense offset arrangements. Expenses net of all reductions represent the net expenses paid by the class.
H Amount represents less than $.001 per share.
See accompanying notes which are an integral part of the financial statements.
Semiannual Report
Financial Highlights - Class C
| Six months ended
June 30, 2005 | Years ended December 31, |
| (Unaudited) | 2004 | 2003 F |
Selected Per-Share Data | | | |
Net asset value, beginning of period | $ 10.38 | $ 10.48 | $ 10.49 |
Income from Investment Operations | | | |
Net investment income E | .086 | .159 | .077 |
Net realized and unrealized gain (loss) | (.076) | (.080) | .048 |
Total from investment operations | .010 | .079 | .125 |
Distributions from net investment income | (.087) | (.160) | (.070) |
Distributions from net realized gain | (.003) | (.019) | (.065) |
Total distributions | (.090) | (.179) | (.135) |
Redemption fees added to paid in capital E | - H | - H | - H |
Net asset value, end of period | $ 10.30 | $ 10.38 | $ 10.48 |
Total Return B, C, D | .10% | .77% | 1.20% |
Ratios to Average Net Assets G | | | |
Expenses before expense reductions | 1.53% A | 1.52% | 1.50% A |
Expenses net of voluntary waivers, if any | 1.53% A | 1.52% | 1.50% A |
Expenses net of all reductions | 1.48% A | 1.51% | 1.49% A |
Net investment income | 1.69% A | 1.53% | 1.67% A |
Supplemental Data | | | |
Net assets, end of period (in millions) | $ 11 | $ 11 | $ 8 |
Portfolio turnover rate | 27% A | 45% | 34% |
A Annualized
B Total returns for periods of less than one year are not annualized.
C Total returns would have been lower had certain expenses not been reduced during the periods shown.
D Total returns do not include the effect of the contingent deferred sales charge.
E Calculated based on average shares outstanding during the period.
F For the period July 23, 2003 (commencement of sale of shares) to December 31, 2003.
G Expense ratios reflect operating expenses of the class. Expenses before reductions do not reflect amounts reimbursed by the investment adviser or reductions from brokerage service arrangements or other expense offset arrangements and do not represent the amount paid by the class during periods when reimbursements or reductions occur. Expense ratios before reductions for start-up periods may not be representative of longer-term operating periods. Expenses net of any voluntary waivers reflect expenses after reimbursement by the investment adviser but prior to reductions from brokerage service arrangements or other expense offset arrangements. Expenses net of all reductions represent the net expenses paid by the class.
H Amount represents less than $.001 per share.
See accompanying notes which are an integral part of the financial statements.
Semiannual Report
Financial Highlights - Spartan Short-Intermediate Municipal Income
| Six months ended
June 30, 2005 | Years ended December 31, |
| (Unaudited) | 2004 | 2003 | 2002 | 2001 | 2000 G | 2000 H |
Selected Per-Share Data | | | | | | |
Net asset value, beginning of period | $ 10.38 | $ 10.48 | $ 10.52 | $ 10.27 | $ 10.12 | $ 10.03 | $ 10.00 |
Income from Investment Operations | | | | | | | |
Net investment income D | .140 | .268 | .283 | .336 | .396 F | .139 | .399 |
Net realized and unrealized gain (loss) | (.077) | (.080) | .030 | .317 | .173 F | .092 | .034 |
Total from investment operations | .063 | .188 | .313 | .653 | .569 | .231 | .433 |
Distributions from net investment income | (.140) | (.269) | (.283) | (.339) | (.396) | (.140) | (.400) |
Distributions from net realized gain | (.003) | (.019) | (.070) | (.064) | (.023) | (.001) | - |
Distributions in excess of net realized gain | - | - | - | - | - | - | (.003) |
Total distributions | (.143) | (.288) | (.353) | (.403) | (.419) | (.141) | (.403) |
Redemption fees added to paid in capital | - D, I | - D, I | - D, I | - D, I | - D, I | - | - |
Net asset value,
end of period | $ 10.30 | $ 10.38 | $ 10.48 | $ 10.52 | $ 10.27 | $ 10.12 | $ 10.03 |
Total Return B, C | .61% | 1.82% | 3.01% | 6.47% | 5.70% | 2.32% | 4.45% |
Ratios to Average Net Assets E | | | | | | |
Expenses before expense reductions | .49% A | .49% | .49% | .49% | .49% | .49% A | .55% |
Expenses net of voluntary waivers, if any | .49% A | .48% | .49% | .49% | .49% | .49% A | .54% |
Expenses net of all reductions | .44% A | .47% | .47% | .45% | .41% | .45% A | .54% |
Net investment income | 2.73% A | 2.57% | 2.69% | 3.23% | 3.85% F | 4.17% A | 4.02% |
Supplemental Data | | | | | | |
Net assets,
end of period
(in millions) | $ 1,840 | $ 1,841 | $ 1,843 | $ 1,683 | $ 1,183 | $ 965 | $ 904 |
Portfolio turnover rate | 27% A | 45% | 34% | 38% | 43% | 106% A | 53% |
A Annualized B Total returns for periods of less than one year are not annualized. C Total returns would have been lower had certain expenses not been reduced during the periods shown. D Calculated based on average shares outstanding during the period. E Expense ratios reflect operating expenses of the class. Expenses before reductions do not reflect amounts reimbursed by the investment adviser or reductions from brokerage service arrangements or other expense offset arrangements and do not represent the amount paid by the class during periods when reimbursements or reductions occur. Expenses net of any voluntary waivers reflect expenses after reimbursement by the investment adviser but prior to reductions from brokerage service arrangements or other expense offset arrangements. Expenses net of all reductions represent the net expenses paid by the class. F Effective January 1, 2001, the fund adopted the provisions of the AICPA Audit and Accounting Guide for Investment Companies and began amortizing premium and discount on all debt securities. Per-share data and ratios for periods prior to adoption have not been restated to reflect this change. G For the four months ended December 31. H For the year ended August 31. I Amount represents less than $.001 per share. |
See accompanying notes which are an integral part of the financial statements.
Semiannual Report
Financial Highlights - Institutional Class
| Six months ended
June 30, 2005 | Years ended December 31, |
| (Unaudited) | 2004 | 2003 E |
Selected Per-Share Data | | | |
Net asset value, beginning of period | $ 10.38 | $ 10.49 | $ 10.49 |
Income from Investment Operations | | | |
Net investment income D | .139 | .265 | .125 |
Net realized and unrealized gain (loss) | (.076) | (.088) | .059 |
Total from investment operations | .063 | .177 | .184 |
Distributions from net investment income | (.140) | (.268) | (.119) |
Distributions from net realized gain | (.003) | (.019) | (.065) |
Total distributions | (.143) | (.287) | (.184) |
Redemption fees added to paid in capital D | - G | - G | - G |
Net asset value, end of period | $ 10.30 | $ 10.38 | $ 10.49 |
Total Return B, C | .61% | 1.71% | 1.77% |
Ratios to Average Net Assets F | | | |
Expenses before expense reductions | .49% A | .49% | .48% A |
Expenses net of voluntary waivers, if any | .49% A | .49% | .48% A |
Expenses net of all reductions | .45% A | .48% | .47% A |
Net investment income | 2.73% A | 2.57% | 2.69% A |
Supplemental Data | | | |
Net assets, end of period (000 omitted) | $ 1,572 | $ 1,253 | $ 414 |
Portfolio turnover rate | 27% A | 45% | 34% |
A Annualized
B Total returns for periods of less than one year are not annualized.
C Total returns would have been lower had certain expenses not been reduced during the periods shown.
D Calculated based on average shares outstanding during the period.
E For the period July 23, 2003 (commencement of sale of shares) to December 31, 2003.
F Expense ratios reflect operating expenses of the class. Expenses before reductions do not reflect amounts reimbursed by the investment adviser or reductions from brokerage service arrangements or other expense offset arrangements and do not represent the amount paid by the class during periods when reimbursements or reductions occur. Expense ratios before reductions for start-up periods may not be representative of longer-term operating periods. Expenses net of any voluntary waivers reflect expenses after reimbursement by the investment adviser but prior to reductions from brokerage service arrangements or other expense offset arrangements. Expenses net of all reductions represent the net expenses paid by the class.
G Amount represents less than $.001 per share.
See accompanying notes which are an integral part of the financial statements.
Semiannual Report
Notes to Financial Statements
For the period ended June 30, 2005 (Unaudited)
(Amounts in thousands except ratios)
1. Significant Accounting Policies.
Spartan Short-Intermediate Municipal Income Fund (the fund) is a fund of Fidelity Municipal Trust (the trust) and is authorized to issue an unlimited number of shares. On July 21, 2005 the Board of Trustees approved a change in the name of Spartan Short-Intermediate Municipal Income Fund to Fidelity Short-Intermediate Municipal Income Fund effective August 15, 2005. The trust is registered under the Investment Company Act of 1940, as amended (the 1940 Act), as an open-end management investment company organized as a Massachusetts business trust.
The fund offers Class A, Class T, Class B, Class C, Spartan Short-Intermediate Municipal Income and Institutional Class shares, each of which has equal rights as to assets and voting privileges. Each class has exclusive voting rights with respect to matters that affect that class. Class B shares will automatically convert to Class A shares after a holding period of four years from the initial date of purchase. Investment income, realized and unrealized capital gains and losses, the common expenses of the fund, and certain fund-level expense reductions, if any, are allocated on a pro rata basis to each class based on the relative net assets of each class to the total net assets of the fund. Each class differs with respect to transfer agent and distribution and service plan fees incurred. Certain expense reductions also differ by class.
The financial statements have been prepared in conformity with accounting principles generally accepted in the United States of America, which require management to make certain estimates and assumptions at the date of the financial statements. The following summarizes the significant accounting policies of the fund:
Security Valuation. Net asset value per share (NAV calculation) is calculated as of the close of business of the New York Stock Exchange, normally 4:00 p.m. Eastern time. Debt securities, including restricted securities, are valued on the basis of information provided by a pricing service. Pricing services use valuation matrices that incorporate both dealer-supplied valuations and valuation models. If prices are not readily available or do not accurately reflect fair value for a security, or if a security's value has been materially affected by events occurring after the close of the exchange or market on which the security is principally traded, that security may be valued by another method that the Board of Trustees believes accurately reflects fair value. A security's valuation may differ depending on the method used for determining value. Price movements in futures contracts and ADRs, market and trading trends, the bid/ask quotes of brokers and off-exchange institutional trading may be reviewed in the course of making a good faith determination of a security's fair value. Short-term securities with remaining maturities of sixty days or less for which quotations are not readily available are valued on the basis of amortized cost. Investments in open-end investment companies are valued at their net asset value each business day.
Semiannual Report
Notes to Financial Statements (Unaudited) - continued
(Amounts in thousands except ratios)
1. Significant Accounting Policies - continued
Investment Transactions and Income. Security transactions are accounted for as of trade date. Gains and losses on securities sold are determined on the basis of identified cost. Interest income is accrued as earned. Interest income includes coupon interest and amortization of premium and accretion of discount on debt securities.
Expenses. Most expenses of the trust can be directly attributed to a fund. Expenses which cannot be directly attributed are apportioned among each fund in the trust.
Income Tax Information and Distributions to Shareholders. Each year, the fund intends to qualify as a regulated investment company by distributing all of its taxable income and realized gains under Subchapter M of the Internal Revenue Code. As a result, no provision for income taxes is required in the accompanying financial statements.
Dividends are declared daily and paid monthly from net investment income. Distributions from realized gains, if any, are recorded on the ex-dividend date. Income dividends and capital gain distributions are declared separately for each class. Income and capital gain distributions are determined in accordance with income tax regulations, which may differ from generally accepted accounting principles. In addition, the fund claimed a portion of the payment made to redeeming shareholders as a distribution for income tax purposes. Capital accounts within the financial statements are adjusted for permanent book-tax differences. These adjustments have no impact on net assets or the results of operations. Temporary book-tax differences will reverse in a subsequent period.
Book-tax differences are primarily due to market discount and deferred trustees compensation.
The fund purchases municipal securities whose interest, in the opinion of the issuer, is free from federal income tax. There is no assurance that the Internal Revenue Service (IRS) will agree with this opinion. In the event the IRS determines that the issuer does not comply with relevant tax requirements, interest payments from a security could become federally taxable, possibly retroactively to the date the security was issued.
The federal tax cost of investments and unrealized appreciation (depreciation) as of period end were as follows:
Unrealized appreciation | $ 14,114 | |
Unrealized depreciation | (6,664) | |
Net unrealized appreciation (depreciation) | $ 7,450 | |
Cost for federal income tax purposes | $ 1,817,282 | |
Semiannual Report
1. Significant Accounting Policies - continued
Short-Term Trading (Redemption) Fees. Shares held in the fund less than 30 days are subject to a redemption fee equal to .50% of the proceeds of the redeemed shares. All redemption fees, including any estimated redemption fees paid by Fidelity Management & Research Company (FMR), are retained by the fund and accounted for as an addition to paid in capital.
2. Operating Policies.
Delayed Delivery Transactions and When-Issued Securities. The fund may purchase or sell securities on a delayed delivery or when-issued basis. Payment and delivery may take place after the customary settlement period for that security. The price of the underlying securities and the date when the securities will be delivered and paid for are fixed at the time the transaction is negotiated. During the time a delayed delivery sell is outstanding, the contract is marked-to-market daily and equivalent deliverable securities are held for the transaction. The value of the securities purchased on a delayed delivery or when-issued basis are identified as such in the fund's Schedule of Investments. The fund may receive compensation for interest forgone in the purchase of a delayed delivery or when-issued security. With respect to purchase commitments, the fund identifies securities as segregated in its records with a value at least equal to the amount of the commitment. Losses may arise due to changes in the value of the underlying securities or if the counterparty does not perform under the contract's terms, or if the issuer does not issue the securities due to political, economic, or other factors.
Restricted Securities. The fund may invest in securities that are subject to legal or contractual restrictions on resale. These securities generally may be resold in transactions exempt from registration or to the public if the securities are registered. Disposal of these securities may involve time-consuming negotiations and expense, and prompt sale at an acceptable price may be difficult. Information regarding restricted securities is included at the end of the fund's Schedule of Investments.
3. Purchases and Sales of Investments.
Purchases and sales of securities, other than short-term securities and U.S. government securities, aggregated $251,008 and $337,309, respectively.
4. Fees and Other Transactions with Affiliates.
Management Fee. FMR and its affiliates provide the fund with investment management related services for which the fund pays a monthly management fee. The management fee is the sum of an individual fund fee rate that is based on an annual rate of .25% of the fund's average net assets and a group fee rate that averaged .12% during the period. The group fee rate is based upon the average net assets of all the mutual funds
Semiannual Report
Notes to Financial Statements (Unaudited) - continued
(Amounts in thousands except ratios)
4. Fees and Other Transactions with Affiliates - continued
Management Fee - continued
advised by FMR. The group fee rate decreases as assets under management increase and increases as assets under management decrease. For the period, the total annualized management fee rate was .38% of the fund's average net assets.
Distribution and Service Plan. In accordance with Rule 12b-1 of the 1940 Act, the fund has adopted separate Distribution and Service Plans for each class of shares. Certain classes pay Fidelity Distributors Corporation (FDC), an affiliate of FMR, separate Distribution and Service Fees, each of which is based on an annual percentage of each class' average net assets. In addition, FDC may pay financial intermediaries for selling shares of the fund and providing shareholder support services. For the period, the Distribution and Service Fee rates and the total amounts paid to and retained by FDC were as follows:
| Distribution
Fee | Service
Fee | Paid to
FDC | Retained
by FDC |
Class A | 0% | .15% | $ 9 | $ - |
Class T | 0% | .25% | 26 | - |
Class B | .65% | .25% | 17 | 13 |
Class C | .75% | .25% | 58 | 23 |
| | | $ 110 | $ 36 |
Sales Load. FDC receives a front-end sales charge of up to 3.75% for selling Class A shares, and 2.75% for selling Class T shares, some of which is paid to financial intermediaries for selling shares of the fund. FDC receives the proceeds of contingent deferred sales charges levied on Class A, Class T, Class B, and Class C redemptions. These charges depend on the holding period. The deferred sales charges range from 3% to 1% for Class B, 1% for Class C, and .25% for certain purchases of Class A and Class T shares.
For the period, sales charge amounts retained by FDC were as follows:
| Retained
by FDC |
Class A | $ 3 |
Class T | 3 |
Class B* | 3 |
Class C* | 4 |
| $ 13 |
* When Class B and Class C shares are initially sold, FDC pays commissions from its own resources to financial intermediaries through which the sales are made.
Semiannual Report
4. Fees and Other Transactions with Affiliates - continued
Transfer Agent and Accounting Fees. Citibank, N.A. (Citibank) is the custodian, transfer agent, and shareholder servicing agent for the fund's Class A, Class T, Class B, Class C, Spartan Short-Intermediate Municipal Income and Institutional Class shares. Citibank has entered into a sub-arrangement with Fidelity Investments Institutional Operations Company, Inc. (FIIOC), an affiliate of FMR, with respect to all classes of the fund, except for Spartan Short-Intermediate Municipal Income, to perform the transfer, dividend disbursing, and shareholder servicing agent functions. Citibank has also entered into a sub-arrangement with Fidelity Service Company, Inc. (FSC), an affiliate of FMR, with respect to Spartan Short-Intermediate Municipal Income, to perform the transfer, dividend disbursing, and shareholder servicing agent functions. FIIOC and FSC receive account fees and asset-based fees that vary according to the account size and type of account of the shareholders of the respective classes of the fund. All fees are paid to FIIOC by Citibank, which is reimbursed by each class for such payments. FIIOC and FSC pay for typesetting, printing and mailing of shareholder reports, except proxy statements. For the period, each class paid the following transfer agent fees:
| Amount | % of
Average
Net Assets |
Class A | $ 5 | .09* |
Class T | 11 | .10* |
Class B | 2 | .10* |
Class C | 7 | .11* |
Spartan Short-Intermediate Municipal Income | 725 | .08* |
Institutional Class | 1 | .08* |
| $ 751 | |
* Annualized
Citibank also has a sub-arrangement with FSC to maintain the fund's accounting records. The fee is based on the level of average net assets for the month.
Central Funds. The fund may invest in affiliated Central Funds managed by Fidelity Investments Money Management, Inc. (FIMM), an affiliate of FMR. The Central Funds are open-end investment companies available only to investment companies and other accounts managed by FMR and its affiliates. The Money Market Central Funds seek preservation of capital and current income. The Central Funds do not pay a management fee. Income distributions earned by the fund are recorded as income in the accompanying financial statements and totaled $238 for the period.
Semiannual Report
Notes to Financial Statements (Unaudited) - continued
(Amounts in thousands except ratios)
5. Committed Line of Credit.
The fund participates with other funds managed by FMR in a $4.2 billion credit facility (the "line of credit") to be utilized for temporary or emergency purposes to fund shareholder redemptions or for other short-term liquidity purposes. The fund has agreed to pay commitment fees on its pro rata portion of the line of credit. During the period, there were no borrowings on this line of credit.
6. Expense Reductions.
FMR voluntarily agreed to reimburse each class to the extent annual operating expenses exceeded certain levels of average net assets as noted in the table below. Some expenses, for example interest expense, are excluded from this reimbursement.
| Expense
Limitations | Reimbursement
from adviser |
Class C | 1.53% | - |
In addition, through arrangements with the fund's custodian and each class' transfer agent, credits realized as a result of uninvested cash balances were used to reduce the fund's expenses. During the period, these credits reduced the fund's custody and accounting expenses by $15 and $157, respectively. During the period, credits reduced each class' transfer agent expense as noted in the table below.
| Transfer Agent
expense reduction | |
Class A | $ 2 | |
Class T | 3 | |
Class B | 1 | |
Class C | 1 | |
Spartan Short-Intermediate Municipal Income | 257 | |
Institutional Class | - | |
| $ 264 | |
7. Other.
The fund's organizational documents provide former and current trustees and officers with a limited indemnification against liabilities arising in connection with the performance of their duties to the fund. In the normal course of business, the fund may also enter into contracts that provide general indemnifications. The fund's maximum exposure under these arrangements is unknown as this would be dependent on future claims that may be made against the fund. The risk of material loss from such claims is considered remote.
Semiannual Report
8. Distributions to Shareholders.
Distributions to shareholders of each class were as follows:
| Six months ended
June 30, 2005 | Year ended
December 31, 2004 |
From net investment income | | |
Class A | $ 151 | $ 303 |
Class T | 249 | 403 |
Class B | 35 | 58 |
Class C | 99 | 160 |
Spartan Short-Intermediate Municipal Income | 24,972 | 46,653 |
Institutional Class | 17 | 21 |
Total | $ 25,523 | $ 47,598 |
From net realized gain | | |
Class A | $ 4 | $ 23 |
Class T | 6 | 36 |
Class B | 1 | 7 |
Class C | 3 | 20 |
Spartan Short-Intermediate Municipal Income | 534 | 3,398 |
Institutional Class | 1 | 2 |
Total | $ 549 | $ 3,486 |
9. Share Transactions.
Transactions for each class of shares were as follows:
| Shares | Dollars |
| Six months ended
June 30, 2005 | Year ended
December 31, 2004 | Six months ended
June 30, 2005 | Year ended
December 31, 2004 |
Class A | | | | |
Shares sold | 164 | 1,095 | $ 1,695 | $ 11,465 |
Reinvestment of distributions | 12 | 24 | 122 | 253 |
Shares redeemed | (267) | (785) | (2,748) | (8,128) |
Net increase (decrease) | (91) | 334 | $ (931) | $ 3,590 |
Class T | | | | |
Shares sold | 318 | 1,569 | $ 3,273 | $ 16,393 |
Reinvestment of distributions | 17 | 30 | 179 | 309 |
Shares redeemed | (310) | (818) | (3,187) | (8,551) |
Net increase (decrease) | 25 | 781 | $ 265 | $ 8,151 |
Class B | | | | |
Shares sold | 41 | 214 | $ 415 | $ 2,231 |
Reinvestment of distributions | 2 | 4 | 22 | 42 |
Shares redeemed | (50) | (84) | (513) | (870) |
Net increase (decrease) | (7) | 134 | $ (76) | $ 1,403 |
Semiannual Report
Notes to Financial Statements (Unaudited) - continued
(Amounts in thousands except ratios)
9. Share Transactions - continued
| Shares | Dollars |
| Six months ended
June 30, 2005 | Year ended
December 31, 2004 | Six months ended
June 30, 2005 | Year ended
December 31, 2004 |
Class C | | | | |
Shares sold | 289 | 658 | $ 2,982 | $ 6,848 |
Reinvestment of distributions | 6 | 10 | 59 | 103 |
Shares redeemed | (301) | (295) | (3,100) | (3,054) |
Net increase (decrease) | (6) | 373 | $ (59) | $ 3,897 |
Spartan Short-Intermediate Municipal Income | | | | |
Shares sold | 27,858 | 75,115 | $ 287,044 | $ 784,282 |
Reinvestment of distributions | 1,749 | 3,669 | 17,998 | 38,189 |
Shares redeemed | (28,363) | (77,123) | (292,167) | (803,196) |
Net increase (decrease) | 1,244 | 1,661 | $ 12,875 | $ 19,275 |
Institutional Class | | | | |
Shares sold | 66 | 110 | $ 679 | $ 1,153 |
Reinvestment of distributions | 1 | 1 | 6 | 8 |
Shares redeemed | (35) | (30) | (358) | (317) |
Net increase (decrease) | 32 | 81 | $ 327 | $ 844 |
Semiannual Report
Board Approval of Investment Advisory Contracts and Management Fees
Spartan Short-Intermediate Municipal Income Fund
Each year, typically in June, the Board of Trustees, including the independent Trustees (together, the Board), votes on the renewal of the management contract and sub-advisory agreements (together, the Advisory Contracts) for the fund. The Board, assisted by the advice of fund counsel and independent Trustees' counsel, requests and considers a broad range of information throughout the year.
The Board meets regularly each month except August and takes into account throughout the year matters bearing on Advisory Contracts. The Board, acting directly and through its separate committees, considers at each of its meetings factors that are relevant to the annual renewal of the fund's Advisory Contracts, including the services and support provided to the fund and its shareholders by Fidelity. At the time of the renewal, the Board had 11 standing committees, each composed of independent Trustees with varying backgrounds, to which the Board has assigned specific subject matter responsibilities in order to enhance effective decision-making by the Board. Each committee has adopted a written charter outlining the structure and purposes of the committee. One such committee, the Fixed-Income Contract Committee, meets periodically during the first six months of each year and as necessary to consider matters specifically related to the annual renewal of Advisory Contracts. The committee requests and receives information on, and makes recommendations to the independent Trustees concerning, the approval and annual review of the Advisory Contracts.
At its June 2005 meeting, the Board of Trustees, including the independent Trustees, unanimously determined to renew the Advisory Contracts for the fund. In reaching its determination, the Board considered all factors it believed relevant, including (1) the nature, extent, and quality of the services to be provided to the fund and its shareholders by Fidelity (including the investment performance of the fund); (2) the competitiveness of the management fee and total expenses of the fund; (3) the total costs of the services to be provided by and the profits to be realized by the investment adviser and its affiliates from the relationship with the fund; (4) the extent to which economies of scale would be realized as the fund grows; and (5) whether fee levels reflect these economies of scale, if any, for the benefit of fund shareholders.
In determining whether to renew the Advisory Contracts for the fund, the Board ultimately reached a determination, with the assistance of fund counsel and independent Trustees' counsel, that the renewal of the Advisory Contracts and the compensation to be received by Fidelity under the management contract is consistent with Fidelity's fiduciary duty under applicable law. In addition to evaluating the specific factors noted above, the Board, in reaching its determination, is aware that shareholders in the fund have a broad range of investment choices available to them, including a wide choice among mutual funds offered by competitors to Fidelity, and that the fund's shareholders, with the opportunity to review and weigh the disclosure provided by the fund in its prospectus and other public disclosures, have chosen to invest in this fund, managed by Fidelity.
Semiannual Report
Board Approval of Investment Advisory Contracts and
Management Fees - continued
Nature, Extent, and Quality of Services Provided by Fidelity. The Board considered staffing within the investment adviser, FMR, and the sub-advisers (together, the Investment Advisers), including the background of the fund's portfolio manager and the fund's investment objective and discipline. The independent Trustees also had discussions with senior management of Fidelity's investment operations and investment groups. The Board considered the structure of the portfolio manager compensation program and whether this structure provides appropriate incentives.
Fidelity Resources Dedicated to Investment Management and Support Services. The Board reviewed the size, education, and experience of the Investment Advisers' investment staff, their use of technology, and the Investment Advisers' approach to recruiting, training, and retaining portfolio managers and other research, advisory, and management personnel. The Board considered Fidelity's extensive global research capabilities that enable the Investment Advisers to aggregate data from various sources in an effort to produce positive investment results. The Board noted that Fidelity's analysts have access to a variety of technological tools that enable them to perform both fundamental and quantitative analysis and to specialize in various disciplines. The Board also considered that Fidelity's portfolio managers and analysts have access to daily portfolio attribution that allows for monitoring of a fund's portfolio, as well as an electronic communication system that provides immediate real-time access to research concerning issuers and credit enhancers.
Shareholder and Administrative Services. The Board considered the nature, extent, quality, and cost of administrative, distribution, and shareholder services performed by the Investment Advisers and their affiliates under the Advisory Contracts and under separate agreements covering transfer agency and pricing and bookkeeping services for the fund. The Board also considered the nature and extent of the Investment Advisers' supervision of third party service providers, principally custodians and subcustodians. The Board reviewed the allocation of fund brokerage, including allocations to brokers affiliated with the Investment Advisers. The Board also considered the resources devoted to, and the record of compliance with, the fund's compliance policies and procedures.
The Board noted that the growth of fund assets across the complex allows Fidelity to reinvest in the development of services designed to enhance the value or convenience of the Fidelity funds as investment vehicles. These services include 24-hour access to account information and market information through phone representatives and over the Internet, and investor education materials and asset allocation tools.
Investment in a Large Fund Family. The Board considered the benefits to shareholders of investing in a Fidelity fund, including the benefits of investing in a fund that is part of a large family of funds offering a variety of investment disciplines and providing for a large variety of mutual fund investor services. For example, fund shareholders are offered the privilege of exchanging shares of the fund for shares of other Fidelity funds, as set forth in the fund's prospectus, without paying an additional sales charge. The Board noted that, since the last Advisory Contract renewals in June 2004, Fidelity has taken a number of actions that benefited particular funds, including (i) voluntarily deciding in 2004 to stop using "soft" commission dollars to pay for market data and, instead, to pay for that data out of its own resources, (ii) contractually agreeing to impose management fee reductions and expense limitations on its five Spartan stock index funds and its stock index fund available through variable insurance products, (iii) contractually agreeing to eliminate the management fees on the Fidelity Freedom Funds and the Fidelity Advisor Freedom Funds, (iv) contractually agreeing to reduce the management fees on most of its investment-grade taxable bond funds, and (v) contractually agreeing to impose expense limitations on its retail and Spartan investment-grade taxable bond funds.
Semiannual Report
Investment Performance. The Board considered whether the fund has operated within its investment objective, as well as its record of compliance with its investment restrictions. It also reviewed the fund's absolute investment performance for each class, as well as the fund's relative investment performance for each class measured against (i) a broad-based securities market index, and (ii) a peer group of mutual funds deemed appropriate by the Board over multiple periods. The following charts considered by the Board show, over the one-, three-, and five-year periods ended December 31, 2004, as applicable, the returns of Class C and the retail class of the fund, the returns of a broad-based securities market index ("benchmark"), and a range of returns of a peer group of mutual funds identified by Lipper Inc. as having an investment objective similar to that of the fund. The returns of Class C and the retail class represent the performance of classes with the highest and lowest 12b-1 fees, respectively (not necessarily with the highest and lowest total expenses). The box within each chart shows the 25th percentile return (bottom of box) and the 75th percentile return (top of box) of the Lipper peer group. The percentage beaten numbers noted below each chart correspond to the percentile box and represent the percentage of funds in the Lipper peer group whose performance was equal to or lower than that of the class indicated.
Semiannual Report
Board Approval of Investment Advisory Contracts and
Management Fees - continued
The Board noted that the relative investment performance of the retail class of the fund has compared favorably to its Lipper peer group over time. The Board also noted that the investment performance of the retail class of the fund was lower than its benchmark over time. The Board considered that the variations in performance among the fund's classes reflect the variations in class expenses, which result in lower performance for higher expense classes.
Based on its review, and giving particular weight to the nature and quality of the resources dedicated by the Investment Advisers to maintain and improve relative performance, the Board concluded that the nature, extent, and quality of the services provided by Fidelity will benefit the fund's shareholders, particularly in light of the Board's view that the fund's shareholders benefit from investing in a fund that is part of a large family of funds offering a variety of investment disciplines and services.
Competitiveness of Management Fee and Total Fund Expenses. The Board considered the fund's management fee and total expenses compared to "mapped groups" of competitive funds and classes. Fidelity creates "mapped groups" by combining similar Lipper investment objective categories that have comparable management fee characteristics. Combining Lipper investment objective categories aids the Board's management fee and total expense comparisons by broadening the competitive group used for comparison and by reducing the number of universes to which various Fidelity funds are compared.
The Board considered two proprietary management fee comparisons for the 12-month periods shown in the chart below. The group of Lipper funds used by the Board for management fee comparisons is referred to below as the "Total Mapped Group" and, for the reasons explained above, is broader than the Lipper peer group used by the Board for performance comparisons. The Total Mapped Group comparison focuses on a fund's standing relative to the total universe of comparable funds available to investors, in terms of gross management fees before expense reimbursements or caps. "TMG %" represents the percentage of funds in the Total Mapped Group that had management fees that were lower than the fund's. For example, a TMG % of 12% would mean that 88% of the funds in the Total Mapped Group had higher management fees than the fund. The "Asset-Size Peer Group" (ASPG) comparison focuses on a fund's standing relative to non-Fidelity funds similar in size to the fund within the Total Mapped Group. The ASPG represents at least 15% of the funds in the Total Mapped Group with comparable asset size and management fee characteristics, subject to a minimum of 50 funds (or all funds in the Total Mapped Group if fewer than 50). Additional information, such as the ASPG quartile ("quadrant") in which the fund's management fee ranked, is also included in the chart and considered by the Board.
Semiannual Report
The Board noted that the fund's management fee ranked below the median of its Total Mapped Group and below the median of its ASPG for 2004. Based on its review, the Board concluded that the fund's management fee was fair and reasonable in light of the services that the fund receives and the other factors considered.
In its review of each class's total expenses, the Board considered the fund's management fee as well as other fund or class expenses, as applicable, such as transfer agent fees, pricing and bookkeeping fees, fund-paid 12b-1 fees, and custodial, legal, and audit fees. The Board also noted the effects of any waivers and reimbursements on fees and expenses. As part of its review, the Board also considered current and historical total expenses of each class of the fund compared to competitive fund median expenses. Each class of the fund is compared to those funds and classes in the Total Mapped Group (used by the Board for management fee comparisons) that have a similar sales load structure.
Semiannual Report
Board Approval of Investment Advisory Contracts and
Management Fees - continued
The Board noted that the total expenses of each of Class A, Class T, Class B, Spartan Short-Intermediate Municipal Income Fund (retail class), and Institutional Class ranked below its competitive median for 2004, and the total expenses of Class C ranked above its competitive median for 2004. The Board noted that the fund offers multiple classes, each of which has a different sales load and 12b-1 fee structure, and that the multiple structures are intended to offer a range of pricing options for the intermediary market. The Board also noted that the total expenses of the classes vary primarily by the level of their 12b-1 fees, although differences in transfer agent fees may also cause expenses to vary from class to class.
In its review of total expenses, the Board also considered Fidelity fee structures and other information on clients that FMR and its affiliates service in other competitive markets, such as other mutual funds advised or subadvised by FMR or its affiliates, pension plan clients, and other institutional clients.
Based on its review, the Board concluded that the total expenses for each class of the fund were reasonable, although in one case above the median of the universe presented for comparison, in light of the services that the fund and its shareholders receive and the other factors considered.
Costs of the Services and Profitability. The Board considered the revenues earned and the expenses incurred by Fidelity in conducting the business of developing, marketing, distributing, managing, administering and servicing the fund and its shareholders. The Board also considered the level of Fidelity's profits in respect of all the Fidelity funds.
On an annual basis, FMR presents to the Board Fidelity's profitability for the fund. Fidelity calculates the profitability for each fund, as well as aggregate profitability for groups of Fidelity funds and all Fidelity funds, using a series of detailed revenue and cost allocation methodologies which originate with the audited books and records of Fidelity. The Audit Committee of the Board reviews any significant changes from the prior year's methodologies.
PricewaterhouseCoopers LLP (PwC), independent registered accounting firm and auditor to Fidelity and certain Fidelity funds, has been engaged annually by the Board as part of the Board's assessment of the results of Fidelity's profitability analysis. PwC's engagement includes the review and assessment of Fidelity's methodologies used in determining the revenues and expenses attributable to Fidelity's mutual fund business, and completion of agreed-upon procedures surrounding the mathematical accuracy of fund profitability and its conformity to allocation methodologies. After considering PwC's reports issued under the engagement and information provided by Fidelity, the Board believes that while other allocation methods may also be reasonable, Fidelity's profitability methodologies are reasonable in all material respects.
Semiannual Report
The Board has also reviewed Fidelity's non-fund businesses and any fall-out benefits related to the mutual fund business as well as cases where Fidelity's affiliates may benefit from or be related to the fund's business. In addition, a special committee of the Board reviewed services provided to Fidelity by its affiliates and determined that the fees that Fidelity paid for such services were reasonable.
The Board considered the costs of the services provided by and the profits realized by Fidelity in connection with the operation of the fund and determined that the amount of profit is a fair entrepreneurial profit for the management of the fund.
Economies of Scale. The Board considered whether there have been economies of scale in respect of the management of the Fidelity funds, whether the Fidelity funds (including the fund) have appropriately benefited from any such economies of scale, and whether there is potential for realization of any further economies of scale. The Board considered the extent to which the fund will benefit from economies of scale through increased services to the fund, through waivers or reimbursements, or through fee or expense reductions, including reductions that occur through operation of the transfer agent agreement. The transfer agent fee varies in part based on the number of accounts in the fund. If the number of accounts decreases or the average account size increases, the overall transfer agent fee rate decreases.
The Board recognized that the fund's management contract incorporates a "group fee" structure, which provides for lower fee rates as total fund assets under FMR's management increase, and for higher fee rates as total fund assets under FMR's management decrease. The Board considered that the group fee is designed to deliver the benefits of economies of scale to fund shareholders when total fund assets increase, even if assets of any particular fund are unchanged or have declined, because some portion of Fidelity's costs are attributable to services provided to all Fidelity funds, and all funds benefit if those costs can be allocated among more assets. The Board concluded that, given the group fee structure, fund shareholders will achieve a certain level of economies of scale as assets under FMR's management increase at the fund complex level, regardless of whether Fidelity achieves any such economies of scale.
The Board further concluded that any potential economies of scale are being shared between fund shareholders and Fidelity in an appropriate manner.
Additional Information Requested by the Board. In order to develop fully the factual basis for consideration of the Advisory Contracts, the Board requested additional information regarding (i) Fidelity's fund profitability methodology, including additional detail on various cost allocations; (ii) fall-out benefits to Fidelity; and (iii) compensation of portfolio managers and research analysts.
Semiannual Report
Board Approval of Investment Advisory Contracts and
Management Fees - continued
Based on its evaluation of all of the conclusions noted above, and after considering all material factors, the Board ultimately concluded that the existing advisory fee structures are fair and reasonable, and that the fund's existing Advisory Contracts should be renewed.
Semiannual Report
Semiannual Report
Investment Adviser
Fidelity Management & Research Company
Boston, MA
Investment Sub-Advisers
Fidelity Investments Money
Management, Inc.
Fidelity International Investment Advisors
Fidelity International Investment Advisors
(U.K.) Limited
General Distributor
Fidelity Distributors Corporation
Boston, MA
Transfer and Service Agents
Citibank, N.A.
New York, NY
Fidelity Investments Institutional
Operations Company, Inc.
Boston, MA
Custodian
Citibank, N.A.
New York, NY
ASTM-USAN-0805
1.803547.101
(Fidelity Investment logo)(registered trademark)
Corporate Headquarters
82 Devonshire St., Boston, MA 02109
www.fidelity.com
(Fidelity Investment logo)(registered trademark)
Fidelity Advisor
Short-Intermediate
Municipal Income
Fund - Institutional Class
Semiannual Report
June 30, 2005
Institutional Class is a class of Spartan® Short-Intermediate
Municipal Income Fund
(2_fidelity_logos) (Registered_Trademark)
Contents
Chairman's Message | <Click Here> | Ned Johnson's message to shareholders. |
Shareholder Expense Example | <Click Here> | An example of shareholder expenses. |
Investment Changes | <Click Here> | A summary of major shifts in the fund's investments over the past six months. |
Investments | <Click Here> | A complete list of the fund's investments with their market values. |
Financial Statements | <Click Here> | Statements of assets and liabilities, operations, and changes in net assets,
as well as financial highlights. |
Notes | <Click Here> | Notes to the financial statements. |
Board Approval of Investment Advisory Contracts and Management Fees | <Click Here> | |
To view a fund's proxy voting guidelines and proxy voting record for the 12-month period ended June 30, visit www.fidelity.com/proxyvotingresults or visit the Securities and Exchange Commission's (SEC) web site at www.sec.gov. You may also call 1-877-208-0098 to request a free copy of the proxy voting guidelines.
Standard & Poor's, S&P and S&P 500 are registered service marks of The McGraw-Hill Companies, Inc. and have been licensed for use by Fidelity Distributors Corporation.
Other third party marks appearing herein are the property of their respective owners.
All other marks appearing herein are registered or unregistered trademarks or service marks of FMR Corp. or an affiliated company.
This report and the financial statements contained herein are submitted for the general information of the shareholders of the fund. This report is not authorized for distribution to prospective investors in the fund unless preceded or accompanied by an effective prospectus.
A fund files its complete schedule of portfolio holdings with the SEC for the first and third quarters of each fiscal year on Form N-Q. Forms N-Q are available on the SEC's web site at http://www.sec.gov. A fund's Forms N-Q may be reviewed and copied at the SEC's Public Reference Room in Washington, DC. Information regarding the operation of the SEC's Public Reference Room may be obtained by calling 1-800-SEC-0330. For a complete list of a fund's portfolio holdings, view the most recent quarterly holdings report, semiannual report, or annual report on Fidelity's web site at http://www.advisor.fidelity.com.
NOT FDIC INSURED · MAY LOSE VALUE · NO BANK GUARANTEE
Neither the fund nor Fidelity Distributors Corporation is a bank.
Semiannual Report
Chairman's Message
(photo_of_Edward_C_Johnson_3d)
Dear Shareholder:
During the past year or so, much has been reported about the mutual fund industry, and much of it has been more critical than I believe is warranted. Allegations that some companies have been less than forthright with their shareholders have cast a shadow on the entire industry. I continue to find these reports disturbing, and assert that they do not create an accurate picture of the industry overall. Therefore, I would like to remind everyone where Fidelity stands on these issues. I will say two things specifically regarding allegations that some mutual fund companies were in violation of the Securities and Exchange Commission's forward pricing rules or were involved in so-called "market timing" activities.
First, Fidelity has no agreements that permit customers who buy fund shares after 4 p.m. to obtain the 4 p.m. price. This is not a new policy. This is not to say that someone could not deceive the company through fraudulent acts. However, we are extremely diligent in preventing fraud from occurring in this manner - and in every other. But I underscore again that Fidelity has no so-called "agreements" that sanction illegal practices.
Second, Fidelity continues to stand on record, as we have for years, in opposition to predatory short-term trading that adversely affects shareholders in a mutual fund. Back in the 1980s, we initiated a fee - which is returned to the fund and, therefore, to investors - to discourage this activity. Further, we took the lead several years ago in developing a Fair Value Pricing Policy to prevent market timing on foreign securities in our funds. I am confident we will find other ways to make it more difficult for predatory traders to operate. However, this will only be achieved through close cooperation among regulators, legislators and the industry.
Yes, there have been unfortunate instances of unethical and illegal activity within the mutual fund industry from time to time. That is true of any industry. When this occurs, confessed or convicted offenders should be dealt with appropriately. But we are still concerned about the risk of over-regulation and the quick application of simplistic solutions to intricate problems. Every system can be improved, and we support and applaud well thought out improvements by regulators, legislators and industry representatives that achieve the common goal of building and protecting the value of investors' holdings.
For nearly 60 years, Fidelity has worked very hard to improve its products and service to justify your trust. When our family founded this company in 1946, we had only a few hundred customers. Today, we serve more than 18 million customers including individual investors and participants in retirement plans across America.
Let me close by saying that we do not take your trust in us for granted, and we realize that we must always work to improve all aspects of our service to you. In turn, we urge you to continue your active participation with your financial matters, so that your interests can be well served.
Best regards,
/s/Edward C. Johnson 3d
Edward C. Johnson 3d
Semiannual Report
Shareholder Expense Example
As a shareholder of the Fund, you incur two types of costs: (1) transaction costs, including sales charges (loads) on purchase payments or redemption proceeds, redemption fees, and (2) ongoing costs, including management fees, distribution and/or service (12b-1) fees and other Fund expenses. This Example is intended to help you understand your ongoing costs (in dollars) of investing in the Fund and to compare these costs with the ongoing costs of investing in other mutual funds.
The Example is based on an investment of $1,000 invested at the beginning of the period and held for the entire period (January 1, 2005 to June 30, 2005).
Actual Expenses
The first line of the table below for each class of the Fund provides information about actual account values and actual expenses. You may use the information in this line, together with the amount you invested, to estimate the expenses that you paid over the period. Simply divide your account value by $1,000.00 (for example, an $8,600 account value divided by $1,000.00 = 8.6), then multiply the result by the number in the first line for a class of the Fund under the heading entitled "Expenses Paid During Period" to estimate the expenses you paid on your account during this period.
Hypothetical Example for Comparison Purposes
The second line of the table below for each class of the Fund provides information about hypothetical account values and hypothetical expenses based on a Class' actual expense ratio and an assumed rate of return of 5% per year before expenses, which is not the Class' actual return. The hypothetical account values and expenses may not be used to estimate the actual ending account balance or expenses you paid for the period. You may use this information to compare the ongoing costs of investing in the Fund and other funds. To do so, compare this 5% hypothetical example with the 5% hypothetical examples that appear in the shareholder reports of the other funds.
Please note that the expenses shown in the table are meant to highlight your ongoing costs only and do not reflect any transaction costs. Therefore, the second line of the table is useful in comparing ongoing costs only, and will not help you determine the relative total costs of owning different funds. In addition, if these transactional costs were included, your costs would have been higher.
| Beginning
Account Value
January 1, 2005 | Ending
Account Value
June 30, 2005 | Expenses Paid
During Period*
January 1, 2005
to June 30, 2005 |
Class A | | | |
Actual | $ 1,000.00 | $ 1,005.30 | $ 3.28 |
HypotheticalA | $ 1,000.00 | $ 1,021.52 | $ 3.31 |
Class T | | | |
Actual | $ 1,000.00 | $ 1,005.70 | $ 3.83 |
HypotheticalA | $ 1,000.00 | $ 1,020.98 | $ 3.86 |
Class B | | | |
Actual | $ 1,000.00 | $ 1,001.50 | $ 7.05 |
HypotheticalA | $ 1,000.00 | $ 1,017.75 | $ 7.10 |
| Beginning
Account Value
January 1, 2005 | Ending
Account Value
June 30, 2005 | Expenses Paid
During Period*
January 1, 2005
to June 30, 2005 |
Class C | | | |
Actual | $ 1,000.00 | $ 1,001.00 | $ 7.59 |
HypotheticalA | $ 1,000.00 | $ 1,017.21 | $ 7.65 |
Spartan Short-Intermediate Municipal Income | | | |
Actual | $ 1,000.00 | $ 1,006.10 | $ 2.44 |
HypotheticalA | $ 1,000.00 | $ 1,022.36 | $ 2.46 |
Institutional Class | | | |
Actual | $ 1,000.00 | $ 1,006.10 | $ 2.44 |
HypotheticalA | $ 1,000.00 | $ 1,022.36 | $ 2.46 |
A 5% return per year before expenses
* Expenses are equal to each Class' annualized expense ratio (shown in the table below); multiplied by the average account value over the period, multiplied by 181/365 (to reflect the one-half year period).
| Annualized
Expense Ratio |
Class A | .66% |
Class T | .77% |
Class B | 1.42% |
Class C | 1.53% |
Spartan Short-Intermediate Municipal Income | .49% |
Institutional Class | .49% |
Semiannual Report
Investment Changes
Top Five States as of June 30, 2005 |
| % of fund's
net assets | % of fund's net assets
6 months ago |
Texas | 14.4 | 13.6 |
Illinois | 9.3 | 9.7 |
New York | 8.5 | 6.9 |
California | 8.1 | 8.2 |
Washington | 5.2 | 6.3 |
Top Five Sectors as of June 30, 2005 |
| % of fund's
net assets | % of fund's net assets
6 months ago |
General Obligations | 45.1 | 47.3 |
Electric Utilities | 14.0 | 14.3 |
Escrowed/Pre-Refunded | 8.1 | 9.5 |
Transportation | 6.6 | 7.1 |
Health Care | 5.9 | 5.9 |
Average Years to Maturity as of June 30, 2005 |
| | 6 months ago |
Years | 3.4 | 3.3 |
Average years to maturity is based on the average time remaining to the stated maturity date of each bond, weighted by the market value of each bond. |
Duration as of June 30, 2005 |
| | 6 months ago |
Years | 2.9 | 3.0 |
Duration shows how much a bond fund's price fluctuates with changes in comparable interest rates. If rates rise 1%, for example, a fund with a five-year duration is likely to lose about 5% of its value. Other factors also can influence a bond fund's performance and share price. Accordingly, a bond fund's actual performance may differ from this example. |
Quality Diversification (% of fund's net assets) |
As of June 30, 2005 | As of December 31, 2004 |
| AAA 60.2% | | | AAA 61.3% | |
| AA,A 28.4% | | | AA,A 32.9% | |
| BBB 5.9% | | | BBB 5.8% | |
| Not Rated 1.5% | | | Not Rated 1.9% | |
| Short-Term
Investments and
Net Other Assets 4.0% | | | Short-Term
Investments and
Net Other Assets* (1.9)% | |

We have used ratings from Moody's® Investors Services, Inc. Where Moody's ratings are not available, we have used S&P® ratings. |
* Short-Term Investments and Net Other Assets are not included in the pie chart. |
Semiannual Report
Investments June 30, 2005 (Unaudited)
Showing Percentage of Net Assets
Municipal Bonds - 96.0% |
| Principal
Amount (000s) | | Value (Note 1)
(000s) |
Alabama - 2.3% |
Alabama Agric. & Mechanical Univ. Revs. 6.5% 11/1/25 (Pre-Refunded to 11/1/05 @ 102) (d) | | $ 2,000 | | $ 2,065 |
Huntsville Solid Waste Disp. Auth. & Resource Recovery Rev.: | | | | |
5.25% 10/1/07 (MBIA Insured) (c) | | 1,750 | | 1,813 |
5.25% 10/1/08 (MBIA Insured) (c) | | 2,900 | | 3,047 |
5.75% 10/1/09 (MBIA Insured) (c) | | 4,000 | | 4,320 |
Jefferson County Ltd. Oblig. School Warrants Series A, 5% 1/1/07 | | 2,210 | | 2,277 |
Jefferson County Swr. Rev.: | | | | |
Series 1999 A, 5.75% 2/1/38 (Pre-Refunded to 2/1/09 @ 101) (d) | | 5,000 | | 5,525 |
Series A: | | | | |
5% 2/1/33 (Pre-Refunded to 2/1/09 @ 101) (d) | | 13,460 | | 14,462 |
5.5% 2/1/40 (Pre-Refunded to 2/1/11 @ 101) (d) | | 3,900 | | 4,402 |
5% 2/1/41 (Pre-Refunded to 8/1/12 @ 100) (d) | | 2,035 | | 2,235 |
Mobile County Gen. Oblig.: | | | | |
5% 2/1/07 (MBIA Insured) | | 1,000 | | 1,034 |
5% 2/1/08 (MBIA Insured) | | 1,475 | | 1,550 |
| | 42,730 |
Alaska - 1.6% |
Alaska Student Ln. Corp. Student Ln. Rev. Series A: | | | | |
5.15% 7/1/05 (AMBAC Insured) (c) | | 1,950 | | 1,950 |
5.85% 7/1/13 (AMBAC Insured) (c) | | 3,285 | | 3,623 |
Anchorage Gen. Oblig. Series B, 5.75% 12/1/11
(Pre-Refunded to 12/1/10 @ 100) (d) | | 2,500 | | 2,832 |
North Slope Borough Gen. Oblig.: | | | | |
Series 1996 B, 0% 6/30/07 (MBIA Insured) | | 3,100 | | 2,921 |
Series A, 0% 6/30/07 (MBIA Insured) | | 5,000 | | 4,711 |
Series B: | | | | |
0% 6/30/06 (MBIA Insured) | | 3,500 | | 3,404 |
0% 6/30/07 (MBIA Insured) | | 7,050 | | 6,642 |
0% 6/30/08 (MBIA Insured) | | 4,240 | | 3,857 |
| | 29,940 |
Arizona - 1.0% |
Arizona School Facilities Board Ctfs. of Prtn. Series C, 5% 9/1/09 (FSA Insured) | | 1,115 | | 1,196 |
Maricopa County Unified School District #48 Scottsdale 7.4% 7/1/10 | | 3,750 | | 4,476 |
Pima County Unified School District #1 Tucson 7.5% 7/1/08 (FGIC Insured) | | 7,060 | | 7,952 |
Municipal Bonds - continued |
| Principal
Amount (000s) | | Value (Note 1)
(000s) |
Arizona - continued |
Tucson Wtr. Rev.: | | | | |
Series 2002, 5.5% 7/1/06 (FGIC Insured) | | $ 980 | | $ 1,007 |
Series A, 5% 7/1/11 (FGIC Insured) | | 1,500 | | 1,637 |
Univ. of Arizona Ctfs. of Prtn. (Univ. of Arizona Parking & Student Hsg. Proj.) Series A, 5% 6/1/09 (AMBAC Insured) | | 2,000 | | 2,138 |
| | 18,406 |
Arkansas - 0.3% |
Arkansas Dev. Fin. Auth. Wastewtr. Sys. Rev.
Series 2004 A, 4% 6/1/06 (MBIA Insured) | | 1,060 | | 1,073 |
Little Rock Gen. Oblig. 4% 4/1/07 (FSA Insured) | | 1,000 | | 1,021 |
Rogers Sales & Use Tax Rev. Series A: | | | | |
4.25% 9/1/06 (FGIC Insured) | | 1,000 | | 1,017 |
4.25% 9/1/07 (FGIC Insured) | | 2,175 | | 2,238 |
| | 5,349 |
California - 8.1% |
California Dept. of Wtr. Resources Pwr. Supply Rev. Series A: | | | | |
5.25% 5/1/07 (MBIA Insured) | | 27,455 | | 28,719 |
5.25% 5/1/10 (MBIA Insured) | | 1,200 | | 1,316 |
5.25% 5/1/12 (MBIA Insured) | | 6,000 | | 6,690 |
California Econ. Recovery Series A, 5.25% 7/1/13 (MBIA Insured) | | 5,000 | | 5,657 |
California Gen. Oblig.: | | | | |
5% 2/1/09 | | 1,640 | | 1,745 |
5% 2/1/10 | | 2,000 | | 2,151 |
5% 12/1/11 (MBIA Insured) | | 8,000 | | 8,823 |
5.125% 9/1/12 | | 1,000 | | 1,081 |
5.25% 2/1/10 (FSA Insured) | | 7,265 | | 7,948 |
5.25% 2/1/11 | | 5,775 | | 6,334 |
5.5% 3/1/11 (FGIC Insured) | | 3,210 | | 3,596 |
5.5% 3/1/11 (XL Cap. Assurance, Inc. Insured) | | 3,525 | | 3,939 |
5.75% 10/1/08 | | 1,085 | | 1,178 |
6.4% 9/1/08 | | 3,075 | | 3,388 |
6.5% 9/1/10 | | 1,740 | | 2,001 |
8% 11/1/07 (FGIC Insured) | | 7,000 | | 7,451 |
California Poll. Cont. Fing. Auth. Ctfs. of Prtn. (Pacific Gas & Elec. Co. Proj.) Series 2004 B, 3.5%, tender 6/1/07 (FGIC Insured) (b)(c) | | 15,000 | | 15,165 |
Municipal Bonds - continued |
| Principal
Amount (000s) | | Value (Note 1)
(000s) |
California - continued |
California Poll. Cont. Fing. Auth. Solid Waste Disp. Rev. (Waste Mgmt., Inc. Proj.) Series A, 3.125%, tender 5/1/06 (b)(c) | | $ 5,000 | | $ 4,997 |
California Pub. Works Board Lease Rev.: | | | | |
(California State Univ. Proj.) Series 1997 A, 5.5% 10/1/07 | | 1,075 | | 1,135 |
(Coalinga State Hosp. Proj.) Series 2004 A: | | | | |
5% 6/1/07 | | 4,000 | | 4,159 |
5% 6/1/08 | | 6,000 | | 6,326 |
California Statewide Cmntys. Dev. Auth. Rev.: | | | | |
(Kaiser Fund Hosp./Health Place, Inc. Proj.) Series 2002 C, 3.85%, tender 6/1/12 (b) | | 1,400 | | 1,408 |
(Kaiser Permanente Health Sys. Proj.) Series 2004 G, 2.3%, tender 5/1/07 (b) | | 8,000 | | 7,913 |
Commerce Refuse To Energy Auth. Rev.: | | | | |
5% 7/1/07 (MBIA Insured) | | 1,770 | | 1,846 |
5.25% 7/1/08 (MBIA Insured) | | 855 | | 912 |
Golden State Tobacco Securitization Corp. Series 2003 B, 5% 6/1/08 | | 1,300 | | 1,356 |
Long Beach Hbr. Rev. Series 2000 A, 5.5% 5/15/06 (c) | | 3,000 | | 3,060 |
Los Angeles Hbr. Dept. Rev. Series A, 5.5% 8/1/06 (AMBAC Insured) (c) | | 1,495 | | 1,539 |
San Joaquin Hills Trans. Corridor Agcy. Toll Road Rev. Series A, 0% 1/15/12 (MBIA Insured) | | 3,600 | | 2,849 |
Univ. of California Revs. (UCLA Med. Ctr. Proj.) 4.55% 12/1/09 (e) | | 8,955 | | 9,217 |
| | 153,899 |
Colorado - 0.5% |
Arapahoe County Cap. Impt. Trust Fund Hwy. Rev.
Series C, 0% 8/31/08 (Pre-Refunded to 8/31/05 @ 82.9449) (d) | | 4,500 | | 3,718 |
E-470 Pub. Hwy. Auth. Rev. Series 2000 B: | | | | |
0% 9/1/06 (Escrowed to Maturity) (d) | | 2,200 | | 2,128 |
0% 9/1/07 (Escrowed to Maturity) (d) | | 3,200 | | 2,998 |
| | 8,844 |
Connecticut - 0.6% |
Connecticut Gen. Oblig.: | | | | |
Series 2001 D, 5.125% 11/15/18 (Pre-Refunded to 11/15/11 @ 100) (d) | | 5,000 | | 5,504 |
Series 2002 C, 5% 12/15/08 | | 1,930 | | 2,062 |
Municipal Bonds - continued |
| Principal
Amount (000s) | | Value (Note 1)
(000s) |
Connecticut - continued |
Connecticut Health & Edl. Facilities Auth. Rev. (Connecticut Children's Med. Ctr. Proj.) Series B: | | | | |
4% 7/1/07 (MBIA Insured) | | $ 1,275 | | $ 1,305 |
4.5% 7/1/08 (MBIA Insured) | | 1,045 | | 1,093 |
5% 7/1/09 (MBIA Insured) | | 1,000 | | 1,075 |
| | 11,039 |
District Of Columbia - 2.0% |
District of Columbia Ctfs. of Prtn.: | | | | |
(District's Pub. Safety and Emergency Preparedness Communications Ctr. and Related Technology Proj.) Series 2003, 3% 1/1/06 (AMBAC Insured) | | 1,305 | | 1,307 |
5% 1/1/06 (AMBAC Insured) | | 1,000 | | 1,011 |
5% 1/1/07 (AMBAC Insured) | | 1,000 | | 1,032 |
5.25% 1/1/08 (AMBAC Insured) | | 935 | | 984 |
District of Columbia Gen. Oblig.: | | | | |
Series 1993 B2, 5.5% 6/1/07 (FSA Insured) | | 1,830 | | 1,922 |
Series 2001 B, 5.5% 6/1/07 (FSA Insured) | | 1,345 | | 1,412 |
Series A: | | | | |
5% 6/1/06 | | 3,480 | | 3,547 |
5% 6/1/07 | | 2,810 | | 2,917 |
5.25% 6/1/09 (FSA Insured) | | 1,000 | | 1,082 |
Series B, 0% 6/1/12 (MBIA Insured) | | 3,600 | | 2,776 |
District of Columbia Rev. (Medstar Univ. Hosp. Proj.) Series D, 6.875%, tender 2/16/07 (b) | | 9,000 | | 9,593 |
Metropolitan Washington Arpts. Auth. Gen. Arpt. Rev. Series B, 5.5% 10/1/08 (FGIC Insured) (c) | | 6,460 | | 6,848 |
Metropolitan Washington Arpts. Auth. Sys. Rev. Series D: | | | | |
4% 10/1/06 (FSA Insured) (c) | | 1,750 | | 1,774 |
4% 10/1/07 (FSA Insured) (c) | | 1,000 | | 1,020 |
| | 37,225 |
Florida - 4.0% |
Brevard County Util. Rev. 5% 3/1/06 (FGIC Insured) | | 530 | | 538 |
Coral Gables Health Facilities Hosp. (Baptist Health South Florida Obligated Group Proj.) 5% 8/15/06 | | 1,000 | | 1,025 |
Highlands County Health Facilities Auth. Rev. (Adventist Health Sys./Sunbelt Obligated Group Proj.) 3.35%, tender 9/1/05 (b) | | 20,300 | | 20,319 |
Hillsborough County Indl. Dev. Auth. Poll. Cont. Rev. (Tampa Elec. Co. Proj.): | | | | |
4%, tender 8/1/07 (b) | | 11,000 | | 11,131 |
Municipal Bonds - continued |
| Principal
Amount (000s) | | Value (Note 1)
(000s) |
Florida - continued |
Hillsborough County Indl. Dev. Auth. Poll. Cont. Rev. (Tampa Elec. Co. Proj.): - continued | | | | |
4.25%, tender 8/1/07 (b)(c) | | $ 6,000 | | $ 6,071 |
Indian River County School District 4% 4/1/06
(FSA Insured) | | 1,470 | | 1,485 |
Miami-Dade County Cap. Asset Acquisition Fixed
Rate Spl. Oblig. Series 2002 A, 5% 4/1/08
(AMBAC Insured) | | 2,825 | | 2,986 |
Miami-Dade County School Board Ctfs. of Prtn. 5%, tender 5/1/11 (MBIA Insured) (b) | | 1,500 | | 1,614 |
Miami-Dade County School District Series 1994 A, 5.65% 6/1/06 (MBIA Insured) | | 1,545 | | 1,586 |
Orlando Utils. Commission Util. Sys. Rev. 5.25% 7/1/09 | | 6,000 | | 6,506 |
Palm Beach County Rev. (Cmnty. Foundation Palm Beach Proj.) 2%, tender 9/1/05, LOC Northern Trust Co., Chicago (b) | | 4,010 | | 4,006 |
Pasco County Solid Waste Disp. & Resource Recovery Sys. Rev. 5.75% 4/1/06 (AMBAC Insured) (c) | | 1,500 | | 1,530 |
Polk County Cap. Impt. Rev. Series 2004, 5.5%, tender 12/1/10 (FSA Insured) (b) | | 9,000 | | 9,939 |
Seminole County School Board Ctfs. of Prtn. Series A: | | | | |
4.5% 7/1/06 (MBIA Insured) | | 1,150 | | 1,170 |
4.5% 7/1/08 (MBIA Insured) | | 1,250 | | 1,309 |
Univ. Athletic Assoc., Inc. Athletic Prog. Rev. Series 2001, 2.8%, tender 10/1/08, LOC Suntrust Banks of Florida, Inc. (b) | | 2,000 | | 1,974 |
Volusia County School Board Ctfs. of Prtn. (School Board of Volusia County Master Lease Prog.) 4.5% 8/1/07 (FSA Insured) | | 2,135 | | 2,205 |
| | 75,394 |
Georgia - 1.1% |
Atlanta Arpt. Facilities Rev. 6.5% 1/1/06 (Escrowed to Maturity) (d) | | 6,000 | | 6,111 |
Cobb County Dev. Auth. Solid Waste Disp. Rev. (Georgia Waste Mgmt. Proj.) Series A, 3.65%, tender 4/1/06 (b)(c) | | 1,000 | | 1,002 |
Columbia County Gen. Oblig. 5% 1/1/09 (FSA Insured) | | 1,505 | | 1,605 |
Fulton DeKalb Hosp. Auth. Hosp. Rev. 5% 1/1/08
(FSA Insured) | | 2,250 | | 2,356 |
Georgia Gen. Oblig. Series B, 6.25% 4/1/06 | | 1,750 | | 1,797 |
Georgia Muni. Elec. Auth. Pwr. Rev. Series 1992 B, 8.25% 1/1/11 (MBIA Insured) | | 4,105 | | 5,101 |
Municipal Bonds - continued |
| Principal
Amount (000s) | | Value (Note 1)
(000s) |
Georgia - continued |
Gwinnett County Gen. Oblig. 4% 1/1/06 | | $ 1,035 | | $ 1,042 |
Henry County Wtr. & Swr. Auth. Rev. 5% 2/1/08
(MBIA Insured) | | 1,095 | | 1,152 |
| | 20,166 |
Hawaii - 2.1% |
Hawaii Arpts. Sys. Rev. Series 2000 B, 8% 7/1/10 (FGIC Insured) (c) | | 3,850 | | 4,597 |
Hawaii Gen. Oblig. Series CU, 5.75% 10/1/11
(MBIA Insured) | | 3,210 | | 3,604 |
Honolulu City & County Gen. Oblig. Series B, 8% 10/1/09 | | 26,940 | | 32,081 |
| | 40,282 |
Illinois - 9.3% |
Chicago Gen. Oblig.: | | | | |
(Neighborhoods Alive 21 Prog.): | | | | |
5% 1/1/07 (MBIA Insured) | | 1,360 | | 1,405 |
5% 1/1/08 (MBIA Insured) | | 1,190 | | 1,248 |
Series A, 5.25% 1/1/12 (FSA Insured) | | 1,000 | | 1,108 |
5% 1/1/07 (FGIC Insured) | | 1,000 | | 1,033 |
Chicago Midway Arpt. Rev.: | | | | |
Series 2001 B, 5% 1/1/07 (FSA Insured) | | 1,000 | | 1,032 |
Series B: | | | | |
5% 1/1/10 (AMBAC Insured) | | 1,225 | | 1,314 |
5% 1/1/11 (AMBAC Insured) | | 3,625 | | 3,915 |
Chicago O'Hare Int'l. Arpt. Rev.: | | | | |
Series 2001 C, 5% 1/1/07 (AMBAC Insured) (c) | | 2,670 | | 2,748 |
Series A: | | | | |
5% 1/1/12 (MBIA Insured) | | 1,135 | | 1,235 |
5.5% 1/1/08 (AMBAC Insured) | | 5,000 | | 5,163 |
5.5% 1/1/10 (AMBAC Insured) (c) | | 5,000 | | 5,401 |
Chicago Park District: | | | | |
Series B, 5% 1/1/11 (AMBAC Insured) | | 5,750 | | 6,243 |
Series C, 5% 1/1/11 (AMBAC Insured) | | 2,515 | | 2,731 |
Chicago School Fin. Auth. Series B, 5% 6/1/09
(FSA Insured) | | 12,825 | | 13,733 |
Chicago Tax Increment Rev.: | | | | |
Series 2000 A, 0% 12/1/08 (AMBAC Insured) | | 10,000 | | 8,964 |
Series A, 0% 12/1/05 (AMBAC Insured) | | 3,000 | | 2,968 |
Municipal Bonds - continued |
| Principal
Amount (000s) | | Value (Note 1)
(000s) |
Illinois - continued |
Chicago Transit Auth. Cap. Grant Receipts Rev.: | | | | |
(Fed. Transit Administration Section 5307
Formula Funds Proj.) Series A, 5.25% 6/1/10 (AMBAC Insured) | | $ 4,785 | | $ 5,238 |
Series A, 4.25% 6/1/08 (AMBAC Insured) | | 3,600 | | 3,645 |
Chicago Wastewtr. Transmission Rev. 5.5% 1/1/09 (FGIC Insured) | | 2,975 | | 3,213 |
Cook County Cmnty. College District #508 Ctfs. of Prtn. 8.75% 1/1/07 (FGIC Insured) | | 8,000 | | 8,692 |
Du Page Wtr. Commission Wtr. Rev. 5% 5/1/08 (AMBAC Insured) | | 4,525 | | 4,780 |
Granite City Solid Waste Disp. Rev. (Waste Mgmt., Inc. Proj.) 3.85%, tender 5/1/08 (b)(c) | | 2,200 | | 2,197 |
Illinois Dev. Fin. Auth. Gas Supply Rev. (The Peoples Gas Lt. & Coke Co. Proj.) Series 2003 B, 3.05%, tender 2/1/08 (AMBAC Insured) (b) | | 6,100 | | 6,101 |
Illinois Dev. Fin. Auth. Rev. (DePaul Univ. Proj.)
Series 2004 C, 5.5% 10/1/10 | | 1,900 | | 2,076 |
Illinois Edl. Facilities Auth. Revs.: | | | | |
(Art Institute of Chicago Proj.) Series 2003, 3.85%, tender 3/1/11 (b) | | 12,800 | | 12,851 |
(Univ. of Chicago Proj.): | | | | |
Series 2004 B1, 3.45%, tender 7/1/08 (b) | | 6,100 | | 6,160 |
Series A, 5.25% 7/1/41 (Pre-Refunded to 7/1/11 @ 101) (d) | | 2,640 | | 2,958 |
Series B, 3.1%, tender 7/1/07 (b) | | 3,900 | | 3,907 |
Illinois Fin. Auth. Rev. (DePaul Univ. Proj.): | | | | |
5% 10/1/06 | | 1,115 | | 1,140 |
5% 10/1/07 | | 1,225 | | 1,272 |
5% 10/1/08 | | 1,000 | | 1,050 |
Illinois Gen. Oblig.: | | | | |
First Series: | | | | |
5% 8/1/06 | | 8,160 | | 8,358 |
5.25% 4/1/08 (MBIA Insured) | | 1,035 | | 1,100 |
5.25% 4/1/10 (MBIA Insured) | | 2,600 | | 2,846 |
5.5% 8/1/10 | | 1,415 | | 1,568 |
6% 1/1/11 (Pre-Refunded to 1/1/10 @ 100) (d) | | 7,075 | | 7,956 |
Series A, 5% 10/1/09 | | 2,600 | | 2,799 |
5.75% 4/1/12 (Pre-Refunded to 4/1/10 @ 100) (d) | | 1,000 | | 1,120 |
Municipal Bonds - continued |
| Principal
Amount (000s) | | Value (Note 1)
(000s) |
Illinois - continued |
Illinois Health Facilities Auth. Rev. (Condell Med. Ctr. Proj.): | | | | |
5% 5/15/07 | | $ 500 | | $ 511 |
5% 5/15/08 | | 700 | | 717 |
Kane & DeKalb Counties Cmnty. Unit School District #301 0% 12/1/10 (AMBAC Insured) | | 2,000 | | 1,655 |
Kane & DuPage Counties Cmnty. Unit School District #303, Saint Charles Series A, 5.5% 1/1/12
(FSA Insured) | | 2,270 | | 2,548 |
Kane County School District #129, Aurora West Side Series A, 5.75% 2/1/14 (FGIC Insured) | | 1,600 | | 1,817 |
Kane, McHenry, Cook & DeKalb Counties Cmnty. Unit School District #300, Carpentersville 5.5% 12/1/13 (MBIA Insured) | | 5,000 | | 5,590 |
Kendall, Kane & Will Counties Cmnty. Unit School District #308: | | | | |
5.25% 10/1/05 (FGIC Insured) | | 560 | | 564 |
5.25% 10/1/06 (FGIC Insured) | | 695 | | 716 |
Lake County Cmnty. High School District #128, Libertyville Series 2004, 5% 1/1/11 | | 2,365 | | 2,573 |
Rosemont Gen. Oblig. Series 3: | | | | |
0% 12/1/07 (Escrowed to Maturity) (d) | | 2,375 | | 2,216 |
0% 12/1/07 (FGIC Insured) | | 625 | | 581 |
Univ. of Illinois Auxiliary Facilities Sys. Rev.
Series 2001 A, 5% 4/1/08 (AMBAC Insured) | | 2,035 | | 2,143 |
Univ. of Illinois Ctfs. of Prtn. (Util. Infrastructure Projs.) 5% 8/15/11 (AMBAC Insured) | | 1,360 | | 1,481 |
Will County School District #122 Series B, 0% 11/1/08 (FSA Insured) | | 1,500 | | 1,349 |
| | 175,729 |
Indiana - 2.9% |
Carmel High School Bldg. Corp. 5% 1/10/11
(FSA Insured) | | 1,000 | | 1,082 |
Hamilton Southeastern Consolidated School Bldg. Corp.: | | | | |
Series A: | | | | |
5% 1/10/10 (FSA Insured) | | 1,750 | | 1,882 |
5.25% 7/10/11 (FSA Insured) | | 2,295 | | 2,536 |
5.25% 1/10/12 (FSA Insured) | | 1,355 | | 1,499 |
5% 1/15/10 (FSA Insured) | | 1,835 | | 1,978 |
5% 1/15/11 (FSA Insured) | | 1,910 | | 2,077 |
5% 1/15/12 (FSA Insured) | | 1,990 | | 2,180 |
Municipal Bonds - continued |
| Principal
Amount (000s) | | Value (Note 1)
(000s) |
Indiana - continued |
Indiana Health Facility Fing. Auth. Rev.: | | | | |
(Ascension Health Cr. Group Prog.) Series 2002 F: | | | | |
5.5% 11/15/05 | | $ 1,000 | | $ 1,010 |
5.5% 11/15/06 | | 1,000 | | 1,036 |
(Ascension Health Cr. Group, Inc. Proj.) Series A, 5%, tender 5/1/07 (b) | | 7,100 | | 7,366 |
Indianapolis Local Pub. Impt. Bond Bank (Indianapolis Arpt. Auth. Proj.) Series I: | | | | |
4% 1/1/06 (MBIA Insured) (c) | | 1,325 | | 1,331 |
5% 1/1/08 (MBIA Insured) (c) | | 1,550 | | 1,616 |
Indianapolis Resource Recovery Rev. (Ogden Martin Sys., Inc. Proj.) 6.75% 12/1/07 (AMBAC Insured) | | 3,000 | | 3,213 |
Ivy Tech State College Series I, 5% 7/1/09
(AMBAC Insured) | | 1,405 | | 1,508 |
Logansport High School Bldg. Corp.: | | | | |
5.25% 1/15/11 (MBIA Insured) | | 1,000 | | 1,095 |
5.25% 7/15/11 (MBIA Insured) | | 1,020 | | 1,124 |
5.25% 1/15/12 (MBIA Insured) | | 1,045 | | 1,153 |
5.25% 7/15/12 (MBIA Insured) | | 1,075 | | 1,194 |
Muncie School Bldg. Corp. 5.25% 7/10/12
(MBIA Insured) | | 1,585 | | 1,760 |
New Albany Floyd County Independent School Bldg. Corp. 5% 1/15/11 (FSA Insured) | | 1,000 | | 1,082 |
Rockport Poll. Cont. Rev. 4.9%, tender 6/1/07 (b) | | 4,000 | | 4,104 |
Saint Joseph County Ind. Edl. Facilities Rev. (Univ. of Notre Dame Du Lac Proj.) 2.5%, tender 12/3/07 (b) | | 10,000 | | 9,869 |
West Clark 2000 School Bldg. Corp.: | | | | |
5.25% 1/15/11 (MBIA Insured) | | 1,065 | | 1,166 |
5.25% 7/15/11 (MBIA Insured) | | 1,125 | | 1,240 |
5.25% 1/15/12 (MBIA Insured) | | 1,150 | | 1,269 |
| | 55,370 |
Kansas - 0.9% |
Burlington Envir. Impt. Rev. (Kansas City Pwr. & Lt. Co. Proj.): | | | | |
Series A, 4.75%, tender 10/1/07 (b) | | 2,400 | | 2,476 |
Series C, 2.38%, tender 9/1/05 (b) | | 12,300 | | 12,282 |
La Cygne Envir. Impt. Rev. (Kansas City Pwr. & Lt. Co. Proj.) Series 1994, 2.25%, tender 9/1/05 (b) | | 2,500 | | 2,496 |
| | 17,254 |
Municipal Bonds - continued |
| Principal
Amount (000s) | | Value (Note 1)
(000s) |
Kentucky - 0.7% |
Kenton County Arpt. Board Arpt. Rev. Series B, 5% 3/1/09 (MBIA Insured) (c) | | $ 1,185 | | $ 1,250 |
Owensboro Elec. Lt. & Pwr. Rev. Series B: | | | | |
0% 1/1/07 (AMBAC Insured) | | 10,000 | | 9,560 |
0% 1/1/09 (AMBAC Insured) | | 2,000 | | 1,785 |
| | 12,595 |
Louisiana - 0.2% |
New Orleans Gen. Oblig. 5% 3/1/07 (MBIA Insured) | | 3,100 | | 3,206 |
Maryland - 0.3% |
Prince Georges County Ctfs. of Prtn. (Equip. Acquisition Prog.) 5.25% 5/15/10 (MBIA Insured) | | 1,535 | | 1,678 |
Prince Georges County Gen. Oblig. Series 2004 C, 5% 12/1/10 | | 3,770 | | 4,120 |
| | 5,798 |
Massachusetts - 3.1% |
Massachusetts Bay Trans. Auth. Series A, 7% 3/1/09 | | 6,880 | | 7,810 |
Massachusetts Dev. Fin. Agcy. Rev. (Massachusetts Biomedical Research Corp. Proj.) Series C: | | | | |
5.75% 8/1/06 | | 1,200 | | 1,229 |
5.875% 8/1/08 | | 1,630 | | 1,737 |
Massachusetts Fed. Hwy.: | | | | |
Series 2000 A, 5.75% 6/15/13 | | 3,000 | | 3,352 |
Series B, 5.125% 12/15/14 (Pre-Refunded to 12/15/08 @ 101) (d) | | 2,775 | | 2,981 |
Massachusetts Gen. Oblig.: | | | | |
Series 1999 C, 5.625% 9/1/12 (Pre-Refunded to 9/1/09 @ 101) (d) | | 2,570 | | 2,846 |
Series 2001 A, 5.5% 1/1/11 | | 5,000 | | 5,566 |
Series 2003 A, 5.375% 8/1/08 | | 5,165 | | 5,531 |
Series 2003 C: | | | | |
5% 12/1/06 (XL Cap. Assurance, Inc. Insured) | | 1,900 | | 1,959 |
5.5% 10/1/10 (MBIA Insured) | | 1,130 | | 1,258 |
Series A, 4.5% 1/1/09 (Pre-Refunded to 1/1/08
@ 101) (d) | | 2,055 | | 2,152 |
Series C, 5.25% 11/1/30 (Pre-Refunded to 11/1/12 @ 100) (d) | | 2,495 | | 2,773 |
Massachusetts Health & Edl. Facilities Auth. Rev.: | | | | |
(Caritas Christi Oblig. Group Proj.) 5.5% 7/1/05 | | 1,000 | | 1,000 |
(Dana Farber Cancer Proj.) Series G1, 6.25% 12/1/14 (Pre-Refunded to 12/1/05 @ 102) (d) | | 3,000 | | 3,104 |
Municipal Bonds - continued |
| Principal
Amount (000s) | | Value (Note 1)
(000s) |
Massachusetts - continued |
Massachusetts Port Auth. Spl. Facilities Rev.
(Delta Air Lines, Inc. Proj.) Series A, 5.5% 1/1/12 (AMBAC Insured) (c) | | $ 1,000 | | $ 1,078 |
New England Ed. Ln. Marketing Corp. Series A, 5.7% 7/1/05 (c) | | 2,800 | | 2,800 |
Springfield Gen. Oblig.: | | | | |
5% 1/15/06 (MBIA Insured) | | 1,000 | | 1,012 |
5% 8/1/11 (MBIA Insured) (a) | | 3,500 | | 3,821 |
5.25% 8/1/12 (MBIA Insured) (a) | | 6,000 | | 6,680 |
| | 58,689 |
Michigan - 3.2% |
Battle Creek Downtown Dev. Auth. 6% 5/1/06 (Escrowed to Maturity) (d) | | 2,000 | | 2,054 |
Chippewa Valley Schools: | | | | |
4% 5/1/06 | | 1,000 | | 1,011 |
5% 5/1/08 | | 1,260 | | 1,332 |
Detroit Gen. Oblig.: | | | | |
Series 2004 A, 5% 4/1/08 (FSA Insured) | | 7,275 | | 7,686 |
Series A, 5% 4/1/07 (FSA Insured) | | 6,910 | | 7,175 |
5% 4/1/08 (MBIA Insured) | | 14,545 | | 15,366 |
5% 4/1/09 (MBIA Insured) | | 10,620 | | 11,384 |
Detroit Swr. Disp. Rev. Series A, 5.75% 7/1/26
(Pre-Refunded to 1/1/10 @ 101) (d) | | 2,000 | | 2,246 |
Ferndale Gen. Oblig. 3.5% 4/1/06 (FGIC Insured) | | 1,960 | | 1,972 |
Greater Detroit Resource Recovery Auth. Rev. Series A, 6.25% 12/13/07 (AMBAC Insured) | | 4,000 | | 4,328 |
Hazel Park School District 5% 5/1/08 | | 1,275 | | 1,348 |
Livonia Pub. School District Series II, 0% 5/1/21
(FGIC Insured) (Pre-Refunded to 5/1/07 @ 39.31) (d) | | 8,000 | | 2,965 |
Wayne-Westland Cmnty. Schools 5% 5/1/10
(FSA Insured) | | 1,225 | | 1,329 |
| | 60,196 |
Minnesota - 0.5% |
Hopkins Independent School District #270 Series B, 4% 2/1/06 | | 2,575 | | 2,596 |
Mankato Independent School District #77 Series A, 4% 2/1/06 (FSA Insured) | | 1,420 | | 1,432 |
Metropolitan Council Minneapolis-Saint Paul Metropolitan Area Series 2005 A, 5% 9/1/06 | | 2,340 | | 2,404 |
Municipal Bonds - continued |
| Principal
Amount (000s) | | Value (Note 1)
(000s) |
Minnesota - continued |
Minneapolis & Saint Paul Hsg. & Redev. Auth. Health Care Sys. Rev. (Health Partners Oblig. Group Proj.): | | | | |
5.25% 12/1/08 | | $ 1,200 | | $ 1,270 |
5.25% 12/1/10 | | 500 | | 541 |
Saint Paul Port Auth. Lease Rev. (HealthEast Midway Campus Proj.) Series 2003 A, 5% 5/1/10 | | 700 | | 702 |
Waconia Independent School District #110 Series A, 5% 2/1/11 (FSA Insured) | | 940 | | 1,028 |
| | 9,973 |
Mississippi - 0.1% |
Mississippi Higher Ed. Student Ln. Series 2000 B3, 5.3% 9/1/08 (c) | | 1,190 | | 1,248 |
Missouri - 0.6% |
Kansas City School District Bldg. Corp. Rev.: | | | | |
(School District Elementary School Proj.): | | | | |
Series 2003 B, 5% 2/1/12 (FGIC Insured) | | 3,100 | | 3,411 |
Series B, 5% 2/1/11 (FGIC Insured) | | 1,850 | | 2,021 |
Series A: | | | | |
5% 2/1/07 (FGIC Insured) | | 1,020 | | 1,056 |
5% 2/1/08 (FGIC Insured) | | 2,000 | | 2,106 |
Saint Louis Muni. Fin. Corp. Leasehold Rev.: | | | | |
(Callahan Courthouse Proj.) Series A, 5.75% 2/15/14 (FGIC Insured) | | 1,050 | | 1,190 |
(Civil Courts Bldg. Proj.) Series 2003 A, 5% 8/1/06 (FSA Insured) | | 1,635 | | 1,676 |
| | 11,460 |
Montana - 0.2% |
Forsyth Poll. Cont. Rev. (Portland Gen. Elec. Co. Projs.) Series A, 5.2%, tender 5/1/09 (b) | | 2,900 | | 3,062 |
Nebraska - 1.7% |
Lancaster County School District #1 (Lincoln Pub. Schools Proj.) 4% 1/15/06 | | 1,000 | | 1,007 |
Nebraska Pub. Pwr. District Rev. Series A: | | | | |
0% 1/1/06 (MBIA Insured) | | 24,465 | | 24,111 |
0% 1/1/07 (MBIA Insured) | | 4,000 | | 3,825 |
Omaha Pub. Pwr. District Elec. Rev. Series B, 4.5% 2/1/09 | | 3,500 | | 3,674 |
| | 32,617 |
Municipal Bonds - continued |
| Principal
Amount (000s) | | Value (Note 1)
(000s) |
Nevada - 1.6% |
Clark County Arpt. Rev. Series C: | | | | |
5% 7/1/05 (AMBAC Insured) (c) | | $ 800 | | $ 800 |
5% 7/1/06 (AMBAC Insured) (c) | | 800 | | 817 |
5% 7/1/08 (AMBAC Insured) (c) | | 2,215 | | 2,321 |
5% 7/1/09 (AMBAC Insured) (c) | | 2,700 | | 2,855 |
5% 7/1/10 (AMBAC Insured) (c) | | 1,225 | | 1,303 |
5% 7/1/11 (AMBAC Insured) (c) | | 1,790 | | 1,915 |
Clark County School District: | | | | |
Series 2000 A, 5.75% 6/15/17 (Pre-Refunded to 6/15/10 @ 100) (d) | | 1,600 | | 1,800 |
Series C, 5% 6/15/10 (MBIA Insured) | | 1,000 | | 1,082 |
Series D, 5% 6/15/09 (MBIA Insured) | | 13,890 | | 14,915 |
Washoe County School District Gen. Oblig. Series D, 5% 6/1/10 (MBIA Insured) | | 2,410 | | 2,612 |
| | 30,420 |
New Hampshire - 0.1% |
New Hampshire Bus. Fin. Auth. Poll. Cont. Rev. (United Illumination Co.) Series A, 3.65%, tender 2/1/10 (AMBAC Insured) (b)(c) | | 2,500 | | 2,501 |
New Jersey - 4.5% |
Casino Reinvestment Dev. Auth. Hotel Room Fee Rev.: | | | | |
5% 1/1/08 (AMBAC Insured) | | 920 | | 965 |
5% 1/1/09 (AMBAC Insured) | | 1,000 | | 1,065 |
Elizabeth Gen. Oblig. 5.25% 8/15/09 (MBIA Insured) | | 1,225 | | 1,329 |
Garden State Preservation Trust Open Space & Farmland Preservation Series B, 6.25% 11/1/09 (MBIA Insured) (a) | | 4,000 | | 4,436 |
New Jersey Econ. Dev. Auth. Rev. 5% 6/15/07 | | 7,500 | | 7,759 |
New Jersey Gen. Oblig. Series 2005 N, 5% 7/15/08 (FGIC Insured) (a) | | 6,175 | | 6,482 |
New Jersey Tpk. Auth. Tpk. Rev. Series 2004 A, 3.15%, tender 1/1/10 (AMBAC Insured) (b) | | 16,250 | | 16,243 |
New Jersey Trans. Trust Fund Auth.: | | | | |
Series 2001 A: | | | | |
5% 6/15/06 | | 355 | | 362 |
5% 6/15/06 (Escrowed to Maturity) (d) | | 5,945 | | 6,078 |
Series A, 5.25% 12/15/08 (MBIA Insured) | | 15,000 | | 16,101 |
Series B: | | | | |
5.25% 12/15/10 (FGIC Insured) | | 4,550 | | 5,020 |
5.25% 12/15/11 (FGIC Insured) | | 10,015 | | 11,109 |
Municipal Bonds - continued |
| Principal
Amount (000s) | | Value (Note 1)
(000s) |
New Jersey - continued |
New Jersey Transit Corp. Series 2000 B, 5.5% 2/1/08 (AMBAC Insured) | | $ 1,000 | | $ 1,064 |
New Jersey Transit Corp. Ctfs. of Prtn. Series A, 6% 9/15/13 (Pre-Refunded to 9/15/09 @ 100) (d) | | 7,000 | | 7,798 |
| | 85,811 |
New Jersey/Pennsylvania - 0.3% |
Delaware River Joint Toll Bridge Commission Bridge Rev. 5% 7/1/09 | | 5,170 | | 5,496 |
New Mexico - 1.8% |
Farmington Poll. Cont. Rev. (Pub. Svc. Co. of
New Mexico San Juan and Four Corners Projs.)
Series 2003 B, 2.1%, tender 4/1/06 (b) | | 7,000 | | 6,935 |
San Juan County Gross Receipts Tax Rev. Series B, 2.5% 8/15/05 | | 13,600 | | 13,596 |
Sandoval County Incentive Payment Rev. 4.25% 12/1/06 | | 13,750 | | 13,960 |
| | 34,491 |
New York - 8.5% |
Grand Central District Mgmt. Assoc., Inc.: | | | | |
5% 1/1/10 | | 1,200 | | 1,289 |
5% 1/1/12 | | 1,175 | | 1,280 |
Metropolitan Trans. Auth. Commuter Facilities Rev.
Series A: | | | | |
5% 7/1/06 (Escrowed to Maturity) (d) | | 270 | | 276 |
5.375% 7/1/09 (Escrowed to Maturity) (d) | | 3,635 | | 3,979 |
Metropolitan Trans. Auth. Svc. Contract Rev. Series B, 5% 1/1/06 | | 10,110 | | 10,225 |
Nassau County Gen. Oblig. Series Z, 5% 9/1/11
(FGIC Insured) | | 800 | | 864 |
New York City Gen. Oblig.: | | | | |
Series 2000 A, 6.5% 5/15/11 | | 2,075 | | 2,381 |
Series 2002 G, 5.5% 8/1/10 | | 2,720 | | 2,993 |
Series 2004 G, 5% 8/1/09 | | 8,000 | | 8,545 |
Series 2005 K: | | | | |
5% 8/1/11 | | 7,120 | | 7,715 |
5% 8/1/12 | | 4,360 | | 4,744 |
Series 2005 O, 5% 6/1/12 | | 7,500 | | 8,146 |
Series A, 5.25% 11/1/14 (MBIA Insured) | | 600 | | 665 |
Series B, 5.75% 8/1/14 | | 1,000 | | 1,128 |
Series E, 6% 8/1/11 | | 60 | | 63 |
Series G, 5.25% 8/1/14 (AMBAC Insured) | | 1,000 | | 1,100 |
Municipal Bonds - continued |
| Principal
Amount (000s) | | Value (Note 1)
(000s) |
New York - continued |
New York City Gen. Oblig.: - continued | | | | |
Series H, 5.75% 3/15/11 (FGIC Insured) | | $ 1,700 | | $ 1,915 |
New York State Dorm. Auth. Revs.: | | | | |
(City Univ. Sys. Consolidation Proj.): | | | | |
Series 2000 A, 6.125% 7/1/12 (AMBAC Insured) | | 5,540 | | 6,345 |
Series A, 5.75% 7/1/13 | | 3,500 | | 3,956 |
Series C, 7.5% 7/1/10 | | 3,600 | | 3,969 |
Series 2003 A: | | | | |
5% 1/1/06 | | 1,250 | | 1,264 |
5% 1/1/07 | | 10,855 | | 11,181 |
5% 3/15/08 | | 2,000 | | 2,105 |
Series B, 5.25%, tender 5/15/12 (b) | | 13,000 | | 14,293 |
New York State Urban Dev. Corp. Rev. 5% 1/1/12 | | 5,000 | | 5,477 |
New York Transitional Fin. Auth. Rev. Series 2003 E: | | | | |
4.5% 2/1/07 | | 1,750 | | 1,798 |
4.5% 2/1/08 | | 1,500 | | 1,560 |
5% 2/1/09 | | 2,035 | | 2,173 |
Tobacco Settlement Fing. Corp.: | | | | |
Series 2004 B1, 5% 6/1/09 | | 3,800 | | 4,049 |
Series A1: | | | | |
5.25% 6/1/12 | | 5,000 | | 5,106 |
5.25% 6/1/13 | | 17,500 | | 18,491 |
Series B1, 5% 6/1/06 | | 17,815 | | 18,115 |
Triborough Bridge & Tunnel Auth. Revs. Series A, 5.5% 1/1/14 (Pre-Refunded to 1/1/12 @ 100) (d) | | 3,745 | | 4,253 |
| | 161,443 |
New York & New Jersey - 0.3% |
Port Auth. of New York & New Jersey: | | | | |
124th Series, 5% 8/1/13 (FGIC Insured) (c) | | 1,200 | | 1,259 |
127th Series, 5% 12/15/08 (AMBAC Insured) (c) | | 3,510 | | 3,725 |
| | 4,984 |
North Carolina - 1.2% |
Charlotte Ctfs. of Prtn. (FY 2004 Equip. Acquisition Proj.) Series 2004 C, 4% 3/1/08 | | 4,940 | | 5,078 |
North Carolina Ctfs. of Prtn. (Repair and Renovation Proj.) Series 2004 B, 4% 6/1/06 | | 1,300 | | 1,316 |
North Carolina Eastern Muni. Pwr. Agcy. Pwr. Sys. Rev.: | | | | |
Series 1993 B, 7% 1/1/08 (MBIA Insured) | | 1,500 | | 1,647 |
Series A, 5.5% 1/1/10 | | 3,000 | | 3,223 |
Series B, 6% 1/1/06 | | 6,170 | | 6,253 |
Municipal Bonds - continued |
| Principal
Amount (000s) | | Value (Note 1)
(000s) |
North Carolina - continued |
North Carolina Eastern Muni. Pwr. Agcy. Pwr. Sys. Rev.: - continued | | | | |
Series C, 5% 1/1/08 | | $ 1,190 | | $ 1,236 |
Series D, 5.375% 1/1/10 | | 3,715 | | 3,972 |
| | 22,725 |
Ohio - 1.3% |
Cleveland Pub. Pwr. Sys. Rev. (First Mtg. Prog.)
Series 1994 A, 0% 11/15/09 (MBIA Insured) | | 2,250 | | 1,943 |
Franklin County Rev. (OCLC Online Computer Library Ctr., Inc. Proj.) 5% 4/15/07 | | 1,960 | | 2,015 |
Lakewood Hosp. Impt. Rev. (Lakewood Hosp. Assoc. Proj.) 5.5% 2/15/07 | | 1,420 | | 1,472 |
Ohio Air Quality Dev. Auth. Rev.: | | | | |
(Pennsylvania Pwr. Co. Proj.) 3.375%, tender 7/1/05 (b) | | 2,300 | | 2,300 |
Series 2002 A, 3.5%, tender 1/1/06 (b) | | 1,000 | | 1,000 |
Ohio Gen. Oblig. Series 2000 E, 5.5% 5/1/09 | | 1,905 | | 2,079 |
Ohio Univ. Gen. Receipts Athens: | | | | |
5% 12/1/06 (FSA Insured) | | 3,600 | | 3,713 |
5% 12/1/07 (FSA Insured) | | 1,285 | | 1,353 |
Ohio Wtr. Dev. Auth. Poll. Cont. Facilities Rev. (Toledo Edison Co. Proj.) Series B, 4.5%, tender 9/1/05 (b) | | 7,000 | | 7,006 |
Ohio Wtr. Dev. Auth. Wtr. Poll. Cont. Rev. (Ohio Edison Co. Proj.) Series A, 3.35%, tender 6/1/06 (b) | | 1,800 | | 1,802 |
| | 24,683 |
Oklahoma - 0.2% |
Cherokee County Econ. Dev. Auth. Series A, 0% 11/1/11 (Escrowed to Maturity) (d) | | 1,000 | | 793 |
Oklahoma Dev. Fin. Auth. Rev. (Samuel Roberts Noble, Inc. Proj.) 5% 5/1/06 | | 3,200 | | 3,259 |
| | 4,052 |
Oregon - 0.4% |
Beaverton Wtr. Rev. Series B, 5% 6/1/10 (FSA Insured) | | 1,210 | | 1,314 |
Eugene Elec. Util. Rev. Series A, 5.25% 8/1/06 (FSA Insured) | | 1,280 | | 1,314 |
Oregon Dept. Administrative Svcs. Ctfs. of Prtn. Series B: | | | | |
5% 5/1/09 (FSA Insured) | | 1,000 | | 1,070 |
5% 5/1/11 (FSA Insured) | | 1,000 | | 1,088 |
Municipal Bonds - continued |
| Principal
Amount (000s) | | Value (Note 1)
(000s) |
Oregon - continued |
Oregon Gen. Oblig. 8.25% 1/1/07 | | $ 1,000 | | $ 1,078 |
Salem Gen. Oblig. 5% 5/1/10 (FSA Insured) | | 2,550 | | 2,766 |
| | 8,630 |
Pennsylvania - 3.9% |
Allegheny County Arpt. Rev. (Pittsburgh Int'l. Arpt. Proj.) Series A1, 5.75% 1/1/12 (MBIA Insured) (c) | | 1,300 | | 1,427 |
Allegheny County Hosp. Dev. Auth. Rev. (Univ. of Pittsburgh Med. Ctr. Proj.) Series B: | | | | |
5.5% 6/15/06 | | 3,065 | | 3,139 |
5.5% 6/15/07 | | 2,000 | | 2,096 |
Allegheny County Indl. Dev. Auth. Rev. (Watson Institute Ed. Ctr. Proj.) 3.375%, tender 5/1/08, LOC PNC Bank NA, Pittsburgh (b) | | 4,500 | | 4,502 |
Allegheny County San. Auth. Swr. Rev. 6% 12/1/11 (MBIA Insured) | | 1,495 | | 1,715 |
Hazleton Area School District 6.5% 3/1/06
(FSA Insured) | | 1,155 | | 1,184 |
Luzerne County Indl. Dev. Auth. Wtr. Facilities Rev. (Pennsylvania-American Wtr. Co. Proj.) 3.6%, tender 12/1/09 (AMBAC Insured) (b)(c) | | 10,000 | | 10,061 |
Montgomery County Higher Ed. & Health Auth. Hosp. Rev. (Abington Memorial Hosp. Proj.) Series A, 5% 6/1/06 (AMBAC Insured) | | 3,750 | | 3,818 |
Pennsylvania Econ. Dev. Fing. Auth. Exempt Facilities Rev. (Shippingport Proj.) Series A, 4.35%, tender 6/1/10 (b)(c) | | 1,200 | | 1,203 |
Pennsylvania Higher Edl. Facilities Auth. Rev.: | | | | |
(Univ. of Pennsylvania Health Systems Proj.) Series A: | | | | |
4% 8/15/06 | | 1,405 | | 1,420 |
5% 8/15/07 | | 1,735 | | 1,797 |
5% 8/15/08 | | 2,000 | | 2,100 |
(UPMC Health Sys. Proj.) Series 2001 A, 5.75% 1/15/09 | | 1,750 | | 1,882 |
Series B: | | | | |
5% 9/1/06 | | 4,510 | | 4,626 |
5.25% 9/1/08 | | 5,860 | | 6,275 |
Pennsylvania Indl. Dev. Auth. Rev. 5.25% 7/1/10 (AMBAC Insured) | | 2,750 | | 3,023 |
Philadelphia Muni. Auth. Rev.: | | | | |
Series A: | | | | |
5% 5/15/07 (FSA Insured) | | 5,500 | | 5,721 |
5% 5/15/08 (FSA Insured) | | 5,000 | | 5,280 |
Series B, 5.25% 11/15/11 (FSA Insured) | | 3,400 | | 3,771 |
Municipal Bonds - continued |
| Principal
Amount (000s) | | Value (Note 1)
(000s) |
Pennsylvania - continued |
Philadelphia School District Series B, 5% 4/1/11 (AMBAC Insured) | | $ 2,160 | | $ 2,365 |
Pittsburgh Gen. Oblig. Series A, 6% 3/1/07
(MBIA Insured) | | 2,000 | | 2,102 |
Westmoreland County Muni. Auth. Muni. Svc. Rev. Series K, 0% 7/1/12 (Escrowed to Maturity) (d) | | 2,355 | | 1,839 |
Wyoming Valley San. Auth. Swr. Rev. 5% 11/15/06 (MBIA Insured) | | 1,865 | | 1,922 |
| | 73,268 |
Puerto Rico - 0.0% |
Puerto Rico Pub. Bldgs Auth. Rev. Series K, 4%, tender 7/1/07 (MBIA Insured) (b) | | 1,000 | | 1,027 |
Rhode Island - 0.2% |
Rhode Island Health & Edl. Bldg. Corp. Rev. (Johnson & Wales Univ. Proj.): | | | | |
5% 4/1/06 (XL Cap. Assurance, Inc. Insured) | | 2,225 | | 2,264 |
5% 4/1/08 (XL Cap. Assurance, Inc. Insured) | | 1,700 | | 1,794 |
| | 4,058 |
South Carolina - 1.8% |
Berkeley County School District 7% 4/1/07 | | 2,615 | | 2,805 |
Charleston County Hosp. Facilities (Care Alliance Health Services Proj.) Series A: | | | | |
5% 8/15/06 | | 1,000 | | 1,020 |
5% 8/15/07 | | 1,700 | | 1,766 |
5% 8/15/08 | | 1,690 | | 1,771 |
Greenville County Pub. Facilities Corp. Certificate of Prtn. (Courthouse and Detention Proj.) 5% 4/1/10 (AMBAC Insured) | | 1,450 | | 1,574 |
Piedmont Muni. Pwr. Agcy. Elec. Rev. 5.6% 1/1/09 (MBIA Insured) | | 2,345 | | 2,558 |
Rock Hill Util. Sys. Rev. Series 2003 A: | | | | |
5% 1/1/08 (FSA Insured) | | 1,850 | | 1,950 |
5% 1/1/09 (FSA Insured) | | 1,945 | | 2,083 |
South Carolina Pub. Svc. Auth. Rev.: | | | | |
Series 2002 A: | | | | |
5% 1/1/06 (FSA Insured) | | 1,705 | | 1,725 |
5% 1/1/07 (FSA Insured) | | 4,105 | | 4,240 |
Series 2005 B, 5% 1/1/10 (MBIA Insured) (a) | | 3,000 | | 3,214 |
Series A: | | | | |
5.5% 1/1/11 (MBIA Insured) | | 3,000 | | 3,311 |
5.5% 1/1/14 (FGIC Insured) (a) | | 1,335 | | 1,517 |
Municipal Bonds - continued |
| Principal
Amount (000s) | | Value (Note 1)
(000s) |
South Carolina - continued |
South Carolina Pub. Svc. Auth. Rev.: - continued | | | | |
Series D, 5% 1/1/06 | | $ 2,750 | | $ 2,782 |
Spartanburg County School District #5 Pub. Facilities Corp. Ctfs. of Prtn. 5% 7/1/09 (FSA Insured) | | 1,000 | | 1,075 |
| | 33,391 |
Tennessee - 0.7% |
Elizabethton Health & Edl. Facilities Board Rev. (First Mtg. Prog.) 6% 7/1/11 (MBIA Insured) | | 2,005 | | 2,288 |
Maury County Gen. Oblig. Series 2004 B, 5% 4/1/10 (MBIA Insured) | | 2,000 | | 2,162 |
Memphis-Shelby County Arpt. Auth. Arpt. Rev. Series A: | | | | |
4% 9/1/06 (MBIA Insured) | | 1,500 | | 1,521 |
4.5% 9/1/08 (MBIA Insured) | | 1,620 | | 1,692 |
4.5% 9/1/09 (MBIA Insured) | | 1,685 | | 1,773 |
Metropolitan Nashville Arpt. Auth. Rev. Series C, 5% 7/1/06 (FGIC Insured) (c) | | 1,675 | | 1,711 |
Shelby County Health Edl. & Hsg. Facility Board Hosp. Rev. (Methodist Health Care Proj.) 5.5% 4/1/09 (MBIA Insured) | | 1,200 | | 1,294 |
| | 12,441 |
Texas - 14.4% |
Alief Independent School District Series 2004 B, 5% 2/15/10 | | 1,500 | | 1,619 |
Arlington Independent School District 5% 2/15/13 | | 2,500 | | 2,756 |
Austin Arpt. Sys. Rev. Series A: | | | | |
6.5% 11/15/05 (Escrowed to Maturity) (c)(d) | | 940 | | 953 |
6.5% 11/15/05 (MBIA Insured) (c) | | 6,870 | | 6,963 |
Austin Independent School District 5% 8/1/07 (a) | | 3,605 | | 3,682 |
Austin Util. Sys. Rev.: | | | | |
Series 1992 A, 0% 11/15/09 (MBIA Insured) | | 5,130 | | 4,438 |
Series A, 0% 11/15/10 (MBIA Insured) | | 5,300 | | 4,401 |
Bexar County Series A: | | | | |
5% 6/15/09 (FSA Insured) | | 2,615 | | 2,803 |
5% 6/15/10 (FSA Insured) | | 1,000 | | 1,083 |
Birdville Independent School District 5% 2/15/10 | | 1,300 | | 1,403 |
Brazos River Auth. Poll. Cont. Rev. (Texas Utils. Elec. Co. Proj.) Series 1995 B, 5.05%, tender 6/19/06 (b)(c) | | 6,255 | | 6,346 |
Bryan Wtrwks. & Swr. Sys. Rev. 5.5% 7/1/11 (FSA Insured) | | 1,500 | | 1,684 |
College Station Independent School District 5% 2/15/10 | | 1,000 | | 1,079 |
Conroe Independent School District Lot B, 0% 2/15/08 | | 3,000 | | 2,761 |
Municipal Bonds - continued |
| Principal
Amount (000s) | | Value (Note 1)
(000s) |
Texas - continued |
Corpus Christi Gen. Oblig.: | | | | |
4% 3/1/06 (FSA Insured) | | $ 1,285 | | $ 1,296 |
5% 3/1/06 (AMBAC Insured) | | 3,365 | | 3,417 |
5% 3/1/07 (FSA Insured) | | 2,735 | | 2,835 |
Corpus Christi Util. Sys. Rev.: | | | | |
5% 7/15/12 (FSA Insured) | | 1,000 | | 1,103 |
5% 7/15/13 (FSA Insured) | | 1,665 | | 1,848 |
Cypress-Fairbanks Independent School District: | | | | |
Series B, 0% 8/1/07 (AMBAC Insured) | | 10,000 | | 9,404 |
4.5% 2/15/06 | | 2,245 | | 2,270 |
5% 2/15/08 | | 2,000 | | 2,105 |
Dallas Independent School District Series 2005, 5.25% 8/15/08 (a) | | 2,000 | | 2,134 |
Del Valle Independent School District 5.5% 2/1/09 | | 1,205 | | 1,305 |
Denton County Gen. Oblig.: | | | | |
5% 7/15/11 (FSA Insured) (a) | | 3,065 | | 3,349 |
5% 7/15/13 (FSA Insured) (a) | | 1,200 | | 1,326 |
El Paso Wtr. & Swr. Rev.: | | | | |
5% 3/1/06 (AMBAC Insured) | | 1,000 | | 1,015 |
5% 3/1/08 (AMBAC Insured) | | 2,770 | | 2,918 |
Fort Bend Independent School District 5%, tender 8/15/09 (b) | | 5,000 | | 5,344 |
Fort Worth Gen. Oblig. Series A, 5% 3/1/06 | | 1,000 | | 1,015 |
Fort Worth Independent School District 5% 2/15/12 | | 1,500 | | 1,644 |
Frisco Gen. Oblig.: | | | | |
Series 2003 A: | | | | |
4% 2/15/07 (FSA Insured) | | 1,320 | | 1,347 |
4% 2/15/08 (FSA Insured) | | 1,145 | | 1,176 |
5% 2/15/10 (FSA Insured) | | 1,710 | | 1,845 |
4% 2/15/06 (FSA Insured) | | 2,975 | | 3,000 |
4% 2/15/07 (FSA Insured) | | 3,115 | | 3,178 |
Garland Independent School District 0% 2/15/07 | | 1,610 | | 1,533 |
Harris County Gen. Oblig. Series A, 0% 8/15/07
(FGIC Insured) | | 4,400 | | 4,133 |
Harris County Health Facilities Dev. Corp. Rev. (Saint Luke's Episcopal Hosp. Proj.) Series 2001 A, 5.5% 2/15/09 | | 3,710 | | 3,993 |
Houston Cmnty. College Sys. Rev.: | | | | |
5.25% 4/15/11 (FSA Insured) | | 3,030 | | 3,342 |
5.25% 4/15/12 (FSA Insured) | | 2,000 | | 2,223 |
Houston Gen. Oblig.: | | | | |
5.5% 3/1/06 | | 2,580 | | 2,627 |
Municipal Bonds - continued |
| Principal
Amount (000s) | | Value (Note 1)
(000s) |
Texas - continued |
Houston Gen. Oblig.: - continued | | | | |
5.5% 3/1/06 (Escrowed to Maturity) (d) | | $ 120 | | $ 122 |
Houston Util. Sys. Rev. Series A, 5.25% 5/15/10
(MBIA Insured) | | 1,250 | | 1,368 |
Irving Independent School District 5.25% 2/15/13 | | 2,145 | | 2,400 |
Katy Independent School District Series A: | | | | |
4% 2/15/06 | | 1,335 | | 1,346 |
5.25% 2/15/12 | | 2,000 | | 2,221 |
Killeen Independent School District 4% 2/15/08 | | 1,200 | | 1,233 |
La Porte Independent School District 4% 2/15/08 | | 2,000 | | 2,055 |
Lewisville Gen. Oblig. 4% 2/15/06 (FSA Insured) | | 1,300 | | 1,311 |
Lower Colorado River Auth. Rev.: | | | | |
0% 1/1/09 (Escrowed to Maturity) (d) | | 3,000 | | 2,690 |
5.25% 1/1/15 (Pre-Refunded to 1/1/11 @ 100) (d) | | 5,000 | | 5,517 |
Lubbock Gen. Oblig.: | | | | |
(Wtrwks. Sys. Surplus Proj.) 5% 2/15/11
(FSA Insured) (a) | | 2,465 | | 2,674 |
5% 2/15/09 (MBIA Insured) | | 1,615 | | 1,723 |
5% 2/15/10 (MBIA Insured) | | 1,845 | | 1,991 |
Mesquite Independent School District Series A, 0% 8/15/06 | | 1,115 | | 1,080 |
New Braunfels Independent School District 0% 2/1/07 | | 2,000 | | 1,907 |
North East Texas Independent School District 7% 2/1/11 (Pre-Refunded to 2/1/10 @ 100) (d) | | 3,600 | | 4,200 |
North Texas Tollway Auth. Dallas North Tollway Sys. Rev. Series C: | | | | |
5% 1/1/09 (FSA Insured) | | 2,000 | | 2,135 |
5%, tender 7/1/08 (FSA Insured) (b) | | 2,650 | | 2,797 |
Northside Independent School District Series B, 2.45%, tender 8/1/06 (Liquidity Facility Dexia Cr. Local de France) (b) | | 7,300 | | 7,284 |
Port Houston Auth. Harris County 6% 10/1/06
(FGIC Insured) (c) | | 2,000 | | 2,079 |
Red River Ed. Fin. Corp. Ed. Rev. (Texas Christian Univ. Proj.) 5% 3/15/12 (MBIA Insured) | | 2,625 | | 2,876 |
Rockwall Independent School District: | | | | |
4% 2/15/06 | | 2,370 | | 2,389 |
5% 2/15/08 | | 3,825 | | 4,025 |
5% 2/15/09 | | 4,690 | | 5,005 |
San Angelo Wtrks & Swr. Sys. Impt. and Rfdg. Rev. 5% 4/1/10 (FSA Insured) | | 1,630 | | 1,762 |
Municipal Bonds - continued |
| Principal
Amount (000s) | | Value (Note 1)
(000s) |
Texas - continued |
San Antonio Elec. & Gas Systems Rev.: | | | | |
Series 2000 A, 5.75% 2/1/15 (Pre-Refunded to 2/1/10 @ 100) (d) | | $ 5,000 | | $ 5,558 |
5.25% 2/1/07 | | 2,500 | | 2,597 |
5.25% 2/1/08 | | 1,000 | | 1,059 |
San Antonio Independent School District 7% 8/15/08 | | 5,000 | | 5,592 |
San Antonio Muni. Drain Util. Sys. Rev. 5.25% 2/1/12 (MBIA Insured) | | 1,545 | | 1,718 |
San Antonio Wtr. Sys. Rev. 5% 5/15/10 (FGIC Insured) | | 1,020 | | 1,105 |
Socorro Independent School District 5% 8/15/09 | | 2,070 | | 2,225 |
Spring Branch Independent School District Series 2001, 5.375% 2/1/14 | | 2,790 | | 3,067 |
Spring Independent School District 5% 2/15/08 | | 1,875 | | 1,973 |
Texas Gen. Oblig.: | | | | |
(College Student Ln. Prog.) 5% 8/1/11 (c) | | 3,000 | | 3,167 |
Series 1992 A, 8% 10/1/07 | | 10,000 | | 11,103 |
Series A, 6% 10/1/08 (MBIA Insured) | | 10,750 | | 11,789 |
Series C, 0% 4/1/08 (Escrowed to Maturity) (d) | | 3,100 | | 2,861 |
Texas Pub. Fin. Auth. Bldg. Rev. (Dept. of Criminal Justice Prog.) Series A, 5% 2/1/07 (FSA Insured) | | 2,000 | | 2,069 |
Texas Pub. Fin. Auth. Rev. (Bldg. and Procurement Commission Projs.) Series A, 5% 2/1/10
(AMBAC Insured) | | 1,055 | | 1,138 |
Texas State Univ. Sys. Fing. Rev. 5% 3/15/13
(FSA Insured) | | 2,000 | | 2,212 |
Texas Tech Univ. Revs. Ninth Series: | | | | |
4% 2/15/09 (AMBAC Insured) | | 1,460 | | 1,510 |
5% 2/15/11 (AMBAC Insured) | | 1,250 | | 1,363 |
Travis County Gen. Oblig. 5.25% 3/1/12 | | 4,125 | | 4,586 |
Trinity River Auth. Red Oak Creek Sys. Rev. 3.5% 2/1/06 (FSA Insured) | | 1,270 | | 1,276 |
Tyler Health Facilities Dev. Corp. Hosp. Rev. (Mother Frances Hosp. Reg'l. Health Care Ctr. Proj.): | | | | |
4% 7/1/05 | | 1,800 | | 1,800 |
4.5% 7/1/06 | | 1,220 | | 1,229 |
5% 7/1/07 | | 1,000 | | 1,030 |
Univ. of Texas Univ. Revs.: | | | | |
(Fing. Sys. Proj.) Series A, 5.5% 8/15/09 | | 1,115 | | 1,221 |
Series B, 5% 8/15/09 | | 13,555 | | 14,584 |
Webb County Gen. Oblig.: | | | | |
5% 2/15/06 (FGIC Insured) | | 1,055 | | 1,070 |
5% 2/15/07 (FGIC Insured) | | 1,110 | | 1,150 |
Municipal Bonds - continued |
| Principal
Amount (000s) | | Value (Note 1)
(000s) |
Texas - continued |
Webb County Gen. Oblig.: - continued | | | | |
5% 2/15/08 (FGIC Insured) | | $ 1,170 | | $ 1,231 |
Wichita Falls Independent School District 0% 2/1/10 | | 2,325 | | 1,987 |
| | 272,156 |
Utah - 0.5% |
Salt Lake County Wtr. Conservancy District Rev. Series A: | | | | |
0% 10/1/11 (AMBAC Insured) | | 3,800 | | 3,010 |
0% 10/1/12 (AMBAC Insured) | | 3,800 | | 2,884 |
0% 10/1/13 (AMBAC Insured) | | 3,760 | | 2,735 |
Utah Bldg. Ownership Auth. Lease Rev. (State Facilities Master Lease Prog.) Series A, 5% 5/15/11 | | 1,700 | | 1,861 |
| | 10,490 |
Virginia - 0.2% |
Amelia County Indl. Dev. Auth. Solid Waste Disp. Rev. (Waste Mgmt., Inc. Proj.) 4.05%, tender 4/1/08 (b)(c) | | 1,000 | | 1,004 |
Virginia Commonwealth Trans. Board Trans. Rev. (U.S. Route 58 Corridor Dev. Prog.) Series B, 5.375% 5/15/12 (Pre-Refunded to 5/15/09 @ 101) (d) | | 1,800 | | 1,978 |
| | 2,982 |
Washington - 5.2% |
Chelan County Pub. Util. District #1 Rev. Series B, 5% 7/1/11 (FGIC Insured) | | 1,190 | | 1,274 |
Clark County Pub. Util. District #1 Elec. Rev.: | | | | |
Series B: | | | | |
5% 1/1/06 (FSA Insured) | | 1,375 | | 1,390 |
5% 1/1/07 (FSA Insured) | | 1,395 | | 1,440 |
5.25% 1/1/08 (FSA Insured) | | 1,515 | | 1,602 |
5.25% 1/1/09 (FSA Insured) | | 1,595 | | 1,716 |
5% 1/1/11 (MBIA Insured) | | 1,680 | | 1,833 |
King & Snohomish Counties School District #417 Northshore: | | | | |
5.5% 12/1/14 (Pre-Refunded to 6/1/12 @ 100) (d) | | 6,300 | | 7,183 |
5.75% 12/1/15 (Pre-Refunded to 6/1/12 @ 100) (d) | | 2,500 | | 2,889 |
King County Rural Library District 5% 12/1/06 (FSA Insured) | | 1,045 | | 1,078 |
King County School District #409, Tahoma 5% 6/1/11 (FSA Insured) | | 1,740 | | 1,904 |
King County Swr. Rev. Series B: | | | | |
5% 1/1/06 (FSA Insured) | | 3,000 | | 3,035 |
5% 1/1/07 (FSA Insured) | | 5,000 | | 5,164 |
Municipal Bonds - continued |
| Principal
Amount (000s) | | Value (Note 1)
(000s) |
Washington - continued |
King County Swr. Rev. Series B: - continued | | | | |
5.25% 1/1/08 (FSA Insured) | | $ 3,500 | | $ 3,701 |
Pierce County School District #10 Tacoma Series A, 5% 12/1/12 (FSA Insured) | | 4,175 | | 4,597 |
Port of Seattle Rev. Series D, 5.75% 11/1/15
(FGIC Insured) (c) | | 3,640 | | 4,077 |
Seattle Muni. Lt. & Pwr. Rev. 5.25% 3/1/07
(FSA Insured) | | 1,690 | | 1,757 |
Snohomish County Pub. Hosp. District #2 (Stevens Health Care Proj.): | | | | |
4% 12/1/05 (FGIC Insured) | | 1,570 | | 1,578 |
4.5% 12/1/09 (FGIC Insured) | | 1,000 | | 1,055 |
Snohomish County School District #2, Everett: | | | | |
5% 6/1/09 (FSA Insured) | | 1,045 | | 1,121 |
5% 6/1/10 (FSA Insured) | | 1,000 | | 1,084 |
Vancouver Wtr. & Swr. Rev. 5.25% 6/1/11
(FSA Insured) | | 1,000 | | 1,108 |
Washington Gen. Oblig. Series A: | | | | |
4% 1/1/08 (MBIA Insured) | | 33,175 | | 34,098 |
5% 7/1/11 (FGIC Insured) | | 1,000 | | 1,093 |
5.5% 7/1/11 | | 3,500 | | 3,853 |
Washington Pub. Pwr. Supply Sys. Nuclear Proj. #2 Rev. Series A, 5.75% 7/1/08 | | 3,000 | | 3,236 |
Washington Pub. Pwr. Supply Sys. Nuclear Proj. #3 Rev. Series C, 5% 7/1/06 (FSA Insured) | | 5,000 | | 5,109 |
| | 97,975 |
West Virginia - 0.1% |
West Virginia School Bldg. Auth. 4% 1/1/06 (MBIA Insured) | | 2,500 | | 2,517 |
Wisconsin - 1.5% |
Milwaukee County Gen. Oblig. Series A, 0% 12/1/10 (FGIC Insured) | | 3,370 | | 2,782 |
Wisconsin Gen. Oblig. Series 1, 5% 5/1/10
(MBIA Insured) (a) | | 2,500 | | 2,666 |
Wisconsin Health & Edl. Facilities Auth. Rev.: | | | | |
(Hosp. Sisters Svcs., Inc. Proj.) Series 2003 B, 4%, tender 12/1/06 (FSA Insured) (b) | | 15,000 | | 15,192 |
(Wheaton Franciscan Svcs., Inc. Proj.) Series A: | | | | |
5% 8/15/09 | | 1,000 | | 1,058 |
5% 8/15/10 | | 1,870 | | 1,981 |
Municipal Bonds - continued |
| Principal
Amount (000s) | | Value (Note 1)
(000s) |
Wisconsin - continued |
Wisconsin Trans. Rev.: | | | | |
Series A, 5.7% 7/1/14 (Pre-Refunded to 7/1/06 @ 100) (d) | | $ 2,230 | | $ 2,297 |
5% 7/1/07 | | 1,500 | | 1,564 |
| | 27,540 |
TOTAL MUNICIPAL BONDS (Cost $1,806,102) | 1,813,552 |
Municipal Notes - 0.6% |
| | | |
Michigan - 0.5% |
Michigan Strategic Fund Poll. Cont. Rev. (Gen. Motors Corp. Proj.) Series 1988 A, 4.4%, VRDN (b) | | 8,830 | | 8,830 |
Ohio - 0.1% |
Ohio Poll. Cont. Rev. (Gen. Motors Corp. Proj.) Series 1985, 4.85%, VRDN (b) | | 2,350 | | 2,350 |
TOTAL MUNICIPAL NOTES (Cost $11,180) | | 11,180 |
TOTAL INVESTMENT PORTFOLIO - 96.6% (Cost $1,817,282) | | | 1,824,732 |
NET OTHER ASSETS - 3.4% | | | 63,257 |
NET ASSETS - 100% | | $ 1,887,989 |
Security Type Abbreviation |
VRDN - VARIABLE RATE DEMAND NOTE |
Legend |
(a) Security or a portion of the security purchased on a delayed delivery or when-issued basis. |
(b) The coupon rate shown on floating or adjustable rate securities represents the rate at period end. |
(c) Private activity obligations whose interest is subject to the federal alternative minimum tax for individuals. |
(d) Security collateralized by an amount sufficient to pay interest and principal. |
(e) Restricted securities - Investment in securities not registered under the Securities Act of 1933 (excluding 144A issues). At the end of the period, the value of restricted securities (excluding 144A issues) amounted to $9,217,000 or 0.5% of net assets. |
Additional information on each holding is as follows: |
Security | Acquisition
Date | Acquisition
Cost (000s) |
Univ. of California Revs. (UCLA Med. Ctr. Proj.) 4.55% 12/1/09 | 3/6/02 | $ 8,955 |
Other Information |
The distribution of municipal securities by revenue source, as a percentage of total net assets, is as follows: |
General Obligations | 45.1% |
Electric Utilities | 14.0% |
Escrowed/Pre-Refunded | 8.1% |
Transportation | 6.6% |
Health Care | 5.9% |
Education | 5.2% |
Others* (individually less than 5%) | 15.1% |
| 100.0% |
* Includes net other assets |
See accompanying notes which are an integral part of the financial statements.
Semiannual Report
Financial Statements
Statement of Assets and Liabilities
Amounts in thousands (except per-share amounts) | June 30, 2005 (Unaudited) |
| | |
Assets | | |
Investment in securities, at value (cost $1,817,282) - See accompanying schedule | | $ 1,824,732 |
Cash | | 112,770 |
Receivable for investments sold | | 441 |
Receivable for fund shares sold | | 3,073 |
Interest receivable | | 22,410 |
Prepaid expenses | | 4 |
Other receivables | | 163 |
Total assets | | 1,963,593 |
| | |
Liabilities | | |
Payable for investments purchased
Regular delivery | $ 27,781 | |
Delayed delivery | 41,935 | |
Payable for fund shares redeemed | 3,837 | |
Distributions payable | 1,255 | |
Accrued management fee | 587 | |
Distribution fees payable | 18 | |
Other affiliated payables | 160 | |
Other payables and accrued expenses | 31 | |
Total liabilities | | 75,604 |
| | |
Net Assets | | $ 1,887,989 |
Net Assets consist of: | | |
Paid in capital | | $ 1,881,014 |
Undistributed net investment income | | 156 |
Accumulated undistributed net realized gain (loss) on investments | | (631) |
Net unrealized appreciation (depreciation) on investments | | 7,450 |
Net Assets | | $ 1,887,989 |
See accompanying notes which are an integral part of the financial statements.
Semiannual Report
Financial Statements - continued
Statement of Assets and Liabilities - continued
Amounts in thousands (except per-share amounts) | June 30, 2005 (Unaudited) |
| | |
Calculation of Maximum Offering Price
Class A:
Net Asset Value and redemption price per share
($11,447 ÷ 1,110 shares) | | $ 10.31 |
| | |
Maximum offering price per share (100/96.25 of $10.31) | | $ 10.71 |
Class T:
Net Asset Value and redemption price per share ($20,193 ÷ 1,961 shares) | | $ 10.30 |
| | |
Maximum offering price per share (100/97.25 of $10.30) | | $ 10.59 |
Class B:
Net Asset Value and offering price per share
($3,721 ÷ 361 shares)A | | $ 10.31 |
| | |
Class C:
Net Asset Value and offering price per share
($11,227 ÷ 1,090 shares)A | | $ 10.30 |
| | |
Spartan Short-Intermediate Municipal Income:
Net Asset Value, offering price and redemption price per share ($1,839,829 ÷ 178,659 shares) | | $ 10.30 |
| | |
Institutional Class:
Net Asset Value, offering price and redemption price per share ($1,572 ÷ 152.6 shares) | | $ 10.30 |
A Redemption price per share is equal to net asset value less any applicable contingent deferred sales charge.
See accompanying notes which are an integral part of the financial statements.
Semiannual Report
Statement of Operations
Amounts in thousands | Six months ended June 30, 2005 (Unaudited) |
| | |
Investment Income | | |
Interest | | $ 29,768 |
| | |
Expenses | | |
Management fee | $ 3,535 | |
Transfer agent fees | 751 | |
Distribution fees | 110 | |
Accounting fees and expenses | 183 | |
Independent trustees' compensation | 4 | |
Custodian fees and expenses | 15 | |
Registration fees | 76 | |
Audit | 27 | |
Legal | 7 | |
Miscellaneous | 7 | |
Total expenses before reductions | 4,715 | |
Expense reductions | (436) | 4,279 |
Net investment income | | 25,489 |
Realized and Unrealized Gain (Loss) Net realized gain (loss) on investment securities | | (336) |
Change in net unrealized appreciation (depreciation) on investment securities | | (13,546) |
Net gain (loss) | | (13,882) |
Net increase (decrease) in net assets resulting from operations | | $ 11,607 |
See accompanying notes which are an integral part of the financial statements.
Semiannual Report
Financial Statements - continued
Statement of Changes in Net Assets
Amounts in thousands | Six months ended
June 30, 2005
(Unaudited) | Year ended
December 31,
2004 |
Increase (Decrease) in Net Assets | | |
Operations | | |
Net investment income | $ 25,489 | $ 47,437 |
Net realized gain (loss) | (336) | 4,712 |
Change in net unrealized appreciation (depreciation) | (13,546) | (22,609) |
Net increase (decrease) in net assets resulting
from operations | 11,607 | 29,540 |
Distributions to shareholders from net investment income | (25,523) | (47,598) |
Distributions to shareholders from net realized gain | (549) | (3,486) |
Total distributions | (26,072) | (51,084) |
Share transactions - net increase (decrease) | 12,401 | 37,160 |
Redemption fees | 20 | 65 |
Total increase (decrease) in net assets | (2,044) | 15,681 |
| | |
Net Assets | | |
Beginning of period | 1,890,033 | 1,874,352 |
End of period (including undistributed net investment income of $156 and undistributed net investment income of $190, respectively) | $ 1,887,989 | $ 1,890,033 |
See accompanying notes which are an integral part of the financial statements.
Semiannual Report
Financial Highlights - Class A
| Six months ended
June 30, 2005 | Years ended December 31, |
| (Unaudited) | 2004 | 2003 F |
Selected Per-Share Data | | | |
Net asset value, beginning of period | $ 10.39 | $ 10.50 | $ 10.49 |
Income from Investment Operations | | | |
Net investment income E | .132 | .250 | .115 |
Net realized and unrealized gain (loss) | (.078) | (.090) | .071 |
Total from investment operations | .054 | .160 | .186 |
Distributions from net investment income | (.131) | (.251) | (.111) |
Distributions from net realized gain | (.003) | (.019) | (.065) |
Total distributions | (.134) | (.270) | (.176) |
Redemption fees added to paid in capital E | - H | - H | - H |
Net asset value, end of period | $ 10.31 | $ 10.39 | $ 10.50 |
Total Return B, C, D | .53% | 1.55% | 1.78% |
Ratios to Average Net Assets G | | | |
Expenses before expense reductions | .66% A | .65% | .65% A |
Expenses net of voluntary waivers, if any | .66% A | .65% | .65% A |
Expenses net of all reductions | .61% A | .64% | .64% A |
Net investment income | 2.57% A | 2.41% | 2.52% A |
Supplemental Data | | | |
Net assets, end of period (in millions) | $ 11 | $ 12 | $ 9 |
Portfolio turnover rate | 27% A | 45% | 34% |
A Annualized
B Total returns for periods of less than one year are not annualized.
C Total returns would have been lower had certain expenses not been reduced during the periods shown.
D Total returns do not include the effect of the sales charges.
E Calculated based on average shares outstanding during the period.
F For the period July 23, 2003 (commencement of sale of shares) to December 31, 2003.
G Expense ratios reflect operating expenses of the class. Expenses before reductions do not reflect amounts reimbursed by the investment adviser or reductions from brokerage service arrangements or other expense offset arrangements and do not represent the amount paid by the class during periods when reimbursements or reductions occur. Expense ratios before reductions for start-up periods may not be representative of longer-term operating periods. Expenses net of any voluntary waivers reflect expenses after reimbursement by the investment adviser but prior to reductions from brokerage service arrangements or other expense offset arrangements. Expenses net of all reductions represent the net expenses paid by the class.
H Amount represents less than $.001 per share.
See accompanying notes which are an integral part of the financial statements.
Semiannual Report
Financial Highlights - Class T
| Six months ended
June 30, 2005 | Years ended December 31, |
| (Unaudited) | 2004 | 2003 F |
Selected Per-Share Data | | | |
Net asset value, beginning of period | $ 10.37 | $ 10.48 | $ 10.49 |
Income from Investment Operations | | | |
Net investment income E | .125 | .238 | .110 |
Net realized and unrealized gain (loss) | (.066) | (.089) | .050 |
Total from investment operations | .059 | .149 | .160 |
Distributions from net investment income | (.126) | (.240) | (.105) |
Distributions from net realized gain | (.003) | (.019) | (.065) |
Total distributions | (.129) | (.259) | (.170) |
Redemption fees added to paid in capital E | - H | - H | - H |
Net asset value, end of period | $ 10.30 | $ 10.37 | $ 10.48 |
Total Return B, C, D | .57% | 1.44% | 1.54% |
Ratios to Average Net Assets G | | | |
Expenses before expense reductions | .77% A | .76% | .77% A |
Expenses net of voluntary waivers, if any | .77% A | .76% | .77% A |
Expenses net of all reductions | .72% A | .75% | .76% A |
Net investment income | 2.46% A | 2.30% | 2.41% A |
Supplemental Data | | | |
Net assets, end of period (in millions) | $ 20 | $ 20 | $ 12 |
Portfolio turnover rate | 27% A | 45% | 34% |
A Annualized
B Total returns for periods of less than one year are not annualized.
C Total returns would have been lower had certain expenses not been reduced during the periods shown.
D Total returns do not include the effect of the sales charges.
E Calculated based on average shares outstanding during the period.
F For the period July 23, 2003 (commencement of sale of shares) to December 31, 2003.
G Expense ratios reflect operating expenses of the class. Expenses before reductions do not reflect amounts reimbursed by the investment adviser or reductions from brokerage service arrangements or other expense offset arrangements and do not represent the amount paid by the class during periods when reimbursements or reductions occur. Expense ratios before reductions for start-up periods may not be representative of longer-term operating periods. Expenses net of any voluntary waivers reflect expenses after reimbursement by the investment adviser but prior to reductions from brokerage service arrangements or other expense offset arrangements. Expenses net of all reductions represent the net expenses paid by the class.
H Amount represents less than $.001 per share.
See accompanying notes which are an integral part of the financial statements.
Semiannual Report
Financial Highlights - Class B
| Six months ended
June 30, 2005 | Years ended December 31, |
| (Unaudited) | 2004 | 2003 F |
Selected Per-Share Data | | | |
Net asset value, beginning of period | $ 10.39 | $ 10.49 | $ 10.49 |
Income from Investment Operations | | | |
Net investment income E | .092 | .172 | .081 |
Net realized and unrealized gain (loss) | (.077) | (.080) | .059 |
Total from investment operations | .015 | .092 | .140 |
Distributions from net investment income | (.092) | (.173) | (.075) |
Distributions from net realized gain | (.003) | (.019) | (.065) |
Total distributions | (.095) | (.192) | (.140) |
Redemption fees added to paid in capital E | - H | - H | - H |
Net asset value, end of period | $ 10.31 | $ 10.39 | $ 10.49 |
Total Return B, C, D | .15% | .89% | 1.34% |
Ratios to Average Net Assets G | | | |
Expenses before expense reductions | 1.42% A | 1.40% | 1.40% A |
Expenses net of voluntary waivers, if any | 1.42% A | 1.40% | 1.40% A |
Expenses net of all reductions | 1.37% A | 1.39% | 1.39% A |
Net investment income | 1.80% A | 1.65% | 1.78% A |
Supplemental Data | | | |
Net assets, end of period (in millions) | $ 4 | $ 4 | $ 2 |
Portfolio turnover rate | 27% A | 45% | 34% |
A Annualized
B Total returns for periods of less than one year are not annualized.
C Total returns would have been lower had certain expenses not been reduced during the periods shown.
D Total returns do not include the effect of the contingent deferred sales charge.
E Calculated based on average shares outstanding during the period.
F For the period July 23, 2003 (commencement of sale of shares) to December 31, 2003.
G Expense ratios reflect operating expenses of the class. Expenses before reductions do not reflect amounts reimbursed by the investment adviser or reductions from brokerage service arrangements or other expense offset arrangements and do not represent the amount paid by the class during periods when reimbursements or reductions occur. Expense ratios before reductions for start-up periods may not be representative of longer-term operating periods. Expenses net of any voluntary waivers reflect expenses after reimbursement by the investment adviser but prior to reductions from brokerage service arrangements or other expense offset arrangements. Expenses net of all reductions represent the net expenses paid by the class.
H Amount represents less than $.001 per share.
See accompanying notes which are an integral part of the financial statements.
Semiannual Report
Financial Highlights - Class C
| Six months ended
June 30, 2005 | Years ended December 31, |
| (Unaudited) | 2004 | 2003 F |
Selected Per-Share Data | | | |
Net asset value, beginning of period | $ 10.38 | $ 10.48 | $ 10.49 |
Income from Investment Operations | | | |
Net investment income E | .086 | .159 | .077 |
Net realized and unrealized gain (loss) | (.076) | (.080) | .048 |
Total from investment operations | .010 | .079 | .125 |
Distributions from net investment income | (.087) | (.160) | (.070) |
Distributions from net realized gain | (.003) | (.019) | (.065) |
Total distributions | (.090) | (.179) | (.135) |
Redemption fees added to paid in capital E | - H | - H | - H |
Net asset value, end of period | $ 10.30 | $ 10.38 | $ 10.48 |
Total Return B, C, D | .10% | .77% | 1.20% |
Ratios to Average Net Assets G | | | |
Expenses before expense reductions | 1.53% A | 1.52% | 1.50% A |
Expenses net of voluntary waivers, if any | 1.53% A | 1.52% | 1.50% A |
Expenses net of all reductions | 1.48% A | 1.51% | 1.49% A |
Net investment income | 1.69% A | 1.53% | 1.67% A |
Supplemental Data | | | |
Net assets, end of period (in millions) | $ 11 | $ 11 | $ 8 |
Portfolio turnover rate | 27% A | 45% | 34% |
A Annualized
B Total returns for periods of less than one year are not annualized.
C Total returns would have been lower had certain expenses not been reduced during the periods shown.
D Total returns do not include the effect of the contingent deferred sales charge.
E Calculated based on average shares outstanding during the period.
F For the period July 23, 2003 (commencement of sale of shares) to December 31, 2003.
G Expense ratios reflect operating expenses of the class. Expenses before reductions do not reflect amounts reimbursed by the investment adviser or reductions from brokerage service arrangements or other expense offset arrangements and do not represent the amount paid by the class during periods when reimbursements or reductions occur. Expense ratios before reductions for start-up periods may not be representative of longer-term operating periods. Expenses net of any voluntary waivers reflect expenses after reimbursement by the investment adviser but prior to reductions from brokerage service arrangements or other expense offset arrangements. Expenses net of all reductions represent the net expenses paid by the class.
H Amount represents less than $.001 per share.
See accompanying notes which are an integral part of the financial statements.
Semiannual Report
Financial Highlights - Spartan Short-Intermediate Municipal Income
| Six months ended
June 30, 2005 | Years ended December 31, |
| (Unaudited) | 2004 | 2003 | 2002 | 2001 | 2000 G | 2000 H |
Selected Per-Share Data | | | | | | |
Net asset value, beginning of period | $ 10.38 | $ 10.48 | $ 10.52 | $ 10.27 | $ 10.12 | $ 10.03 | $ 10.00 |
Income from Investment Operations | | | | | | | |
Net investment income D | .140 | .268 | .283 | .336 | .396 F | .139 | .399 |
Net realized and unrealized gain (loss) | (.077) | (.080) | .030 | .317 | .173 F | .092 | .034 |
Total from investment operations | .063 | .188 | .313 | .653 | .569 | .231 | .433 |
Distributions from net investment income | (.140) | (.269) | (.283) | (.339) | (.396) | (.140) | (.400) |
Distributions from net realized gain | (.003) | (.019) | (.070) | (.064) | (.023) | (.001) | - |
Distributions in excess of net realized gain | - | - | - | - | - | - | (.003) |
Total distributions | (.143) | (.288) | (.353) | (.403) | (.419) | (.141) | (.403) |
Redemption fees added to paid in capital | - D, I | - D, I | - D, I | - D, I | - D, I | - | - |
Net asset value,
end of period | $ 10.30 | $ 10.38 | $ 10.48 | $ 10.52 | $ 10.27 | $ 10.12 | $ 10.03 |
Total Return B, C | .61% | 1.82% | 3.01% | 6.47% | 5.70% | 2.32% | 4.45% |
Ratios to Average Net Assets E | | | | | | |
Expenses before expense reductions | .49% A | .49% | .49% | .49% | .49% | .49% A | .55% |
Expenses net of voluntary waivers, if any | .49% A | .48% | .49% | .49% | .49% | .49% A | .54% |
Expenses net of all reductions | .44% A | .47% | .47% | .45% | .41% | .45% A | .54% |
Net investment income | 2.73% A | 2.57% | 2.69% | 3.23% | 3.85% F | 4.17% A | 4.02% |
Supplemental Data | | | | | | |
Net assets,
end of period
(in millions) | $ 1,840 | $ 1,841 | $ 1,843 | $ 1,683 | $ 1,183 | $ 965 | $ 904 |
Portfolio turnover rate | 27% A | 45% | 34% | 38% | 43% | 106% A | 53% |
A Annualized B Total returns for periods of less than one year are not annualized. C Total returns would have been lower had certain expenses not been reduced during the periods shown. D Calculated based on average shares outstanding during the period. E Expense ratios reflect operating expenses of the class. Expenses before reductions do not reflect amounts reimbursed by the investment adviser or reductions from brokerage service arrangements or other expense offset arrangements and do not represent the amount paid by the class during periods when reimbursements or reductions occur. Expenses net of any voluntary waivers reflect expenses after reimbursement by the investment adviser but prior to reductions from brokerage service arrangements or other expense offset arrangements. Expenses net of all reductions represent the net expenses paid by the class. F Effective January 1, 2001, the fund adopted the provisions of the AICPA Audit and Accounting Guide for Investment Companies and began amortizing premium and discount on all debt securities. Per-share data and ratios for periods prior to adoption have not been restated to reflect this change. G For the four months ended December 31. H For the year ended August 31. I Amount represents less than $.001 per share. |
See accompanying notes which are an integral part of the financial statements.
Semiannual Report
Financial Highlights - Institutional Class
| Six months ended
June 30, 2005 | Years ended December 31, |
| (Unaudited) | 2004 | 2003 E |
Selected Per-Share Data | | | |
Net asset value, beginning of period | $ 10.38 | $ 10.49 | $ 10.49 |
Income from Investment Operations | | | |
Net investment income D | .139 | .265 | .125 |
Net realized and unrealized gain (loss) | (.076) | (.088) | .059 |
Total from investment operations | .063 | .177 | .184 |
Distributions from net investment income | (.140) | (.268) | (.119) |
Distributions from net realized gain | (.003) | (.019) | (.065) |
Total distributions | (.143) | (.287) | (.184) |
Redemption fees added to paid in capital D | - G | - G | - G |
Net asset value, end of period | $ 10.30 | $ 10.38 | $ 10.49 |
Total Return B, C | .61% | 1.71% | 1.77% |
Ratios to Average Net Assets F | | | |
Expenses before expense reductions | .49% A | .49% | .48% A |
Expenses net of voluntary waivers, if any | .49% A | .49% | .48% A |
Expenses net of all reductions | .45% A | .48% | .47% A |
Net investment income | 2.73% A | 2.57% | 2.69% A |
Supplemental Data | | | |
Net assets, end of period (000 omitted) | $ 1,572 | $ 1,253 | $ 414 |
Portfolio turnover rate | 27% A | 45% | 34% |
A Annualized
B Total returns for periods of less than one year are not annualized.
C Total returns would have been lower had certain expenses not been reduced during the periods shown.
D Calculated based on average shares outstanding during the period.
E For the period July 23, 2003 (commencement of sale of shares) to December 31, 2003.
F Expense ratios reflect operating expenses of the class. Expenses before reductions do not reflect amounts reimbursed by the investment adviser or reductions from brokerage service arrangements or other expense offset arrangements and do not represent the amount paid by the class during periods when reimbursements or reductions occur. Expense ratios before reductions for start-up periods may not be representative of longer-term operating periods. Expenses net of any voluntary waivers reflect expenses after reimbursement by the investment adviser but prior to reductions from brokerage service arrangements or other expense offset arrangements. Expenses net of all reductions represent the net expenses paid by the class.
G Amount represents less than $.001 per share.
See accompanying notes which are an integral part of the financial statements.
Semiannual Report
Notes to Financial Statements
For the period ended June 30, 2005 (Unaudited)
(Amounts in thousands except ratios)
1. Significant Accounting Policies.
Spartan Short-Intermediate Municipal Income Fund (the fund) is a fund of Fidelity Municipal Trust (the trust) and is authorized to issue an unlimited number of shares. On July 21, 2005 the Board of Trustees approved a change in the name of Spartan Short-Intermediate Municipal Income Fund to Fidelity Short-Intermediate Municipal Income Fund effective August 15, 2005. The trust is registered under the Investment Company Act of 1940, as amended (the 1940 Act), as an open-end management investment company organized as a Massachusetts business trust.
The fund offers Class A, Class T, Class B, Class C, Spartan Short-Intermediate Municipal Income and Institutional Class shares, each of which has equal rights as to assets and voting privileges. Each class has exclusive voting rights with respect to matters that affect that class. Class B shares will automatically convert to Class A shares after a holding period of four years from the initial date of purchase. Investment income, realized and unrealized capital gains and losses, the common expenses of the fund, and certain fund-level expense reductions, if any, are allocated on a pro rata basis to each class based on the relative net assets of each class to the total net assets of the fund. Each class differs with respect to transfer agent and distribution and service plan fees incurred. Certain expense reductions also differ by class.
The financial statements have been prepared in conformity with accounting principles generally accepted in the United States of America, which require management to make certain estimates and assumptions at the date of the financial statements. The following summarizes the significant accounting policies of the fund:
Security Valuation. Net asset value per share (NAV calculation) is calculated as of the close of business of the New York Stock Exchange, normally 4:00 p.m. Eastern time. Debt securities, including restricted securities, are valued on the basis of information provided by a pricing service. Pricing services use valuation matrices that incorporate both dealer-supplied valuations and valuation models. If prices are not readily available or do not accurately reflect fair value for a security, or if a security's value has been materially affected by events occurring after the close of the exchange or market on which the security is principally traded, that security may be valued by another method that the Board of Trustees believes accurately reflects fair value. A security's valuation may differ depending on the method used for determining value. Price movements in futures contracts and ADRs, market and trading trends, the bid/ask quotes of brokers and off-exchange institutional trading may be reviewed in the course of making a good faith determination of a security's fair value. Short-term securities with remaining maturities of sixty days or less for which quotations are not readily available are valued on the basis of amortized cost. Investments in open-end investment companies are valued at their net asset value each business day.
Semiannual Report
Notes to Financial Statements (Unaudited) - continued
(Amounts in thousands except ratios)
1. Significant Accounting Policies - continued
Investment Transactions and Income. Security transactions are accounted for as of trade date. Gains and losses on securities sold are determined on the basis of identified cost. Interest income is accrued as earned. Interest income includes coupon interest and amortization of premium and accretion of discount on debt securities.
Expenses. Most expenses of the trust can be directly attributed to a fund. Expenses which cannot be directly attributed are apportioned among each fund in the trust.
Income Tax Information and Distributions to Shareholders. Each year, the fund intends to qualify as a regulated investment company by distributing all of its taxable income and realized gains under Subchapter M of the Internal Revenue Code. As a result, no provision for income taxes is required in the accompanying financial statements.
Dividends are declared daily and paid monthly from net investment income. Distributions from realized gains, if any, are recorded on the ex-dividend date. Income dividends and capital gain distributions are declared separately for each class. Income and capital gain distributions are determined in accordance with income tax regulations, which may differ from generally accepted accounting principles. In addition, the fund claimed a portion of the payment made to redeeming shareholders as a distribution for income tax purposes. Capital accounts within the financial statements are adjusted for permanent book-tax differences. These adjustments have no impact on net assets or the results of operations. Temporary book-tax differences will reverse in a subsequent period.
Book-tax differences are primarily due to market discount and deferred trustees compensation.
The fund purchases municipal securities whose interest, in the opinion of the issuer, is free from federal income tax. There is no assurance that the Internal Revenue Service (IRS) will agree with this opinion. In the event the IRS determines that the issuer does not comply with relevant tax requirements, interest payments from a security could become federally taxable, possibly retroactively to the date the security was issued.
The federal tax cost of investments and unrealized appreciation (depreciation) as of period end were as follows:
Unrealized appreciation | $ 14,114 | |
Unrealized depreciation | (6,664) | |
Net unrealized appreciation (depreciation) | $ 7,450 | |
Cost for federal income tax purposes | $ 1,817,282 | |
Semiannual Report
1. Significant Accounting Policies - continued
Short-Term Trading (Redemption) Fees. Shares held in the fund less than 30 days are subject to a redemption fee equal to .50% of the proceeds of the redeemed shares. All redemption fees, including any estimated redemption fees paid by Fidelity Management & Research Company (FMR), are retained by the fund and accounted for as an addition to paid in capital.
2. Operating Policies.
Delayed Delivery Transactions and When-Issued Securities. The fund may purchase or sell securities on a delayed delivery or when-issued basis. Payment and delivery may take place after the customary settlement period for that security. The price of the underlying securities and the date when the securities will be delivered and paid for are fixed at the time the transaction is negotiated. During the time a delayed delivery sell is outstanding, the contract is marked-to-market daily and equivalent deliverable securities are held for the transaction. The value of the securities purchased on a delayed delivery or when-issued basis are identified as such in the fund's Schedule of Investments. The fund may receive compensation for interest forgone in the purchase of a delayed delivery or when-issued security. With respect to purchase commitments, the fund identifies securities as segregated in its records with a value at least equal to the amount of the commitment. Losses may arise due to changes in the value of the underlying securities or if the counterparty does not perform under the contract's terms, or if the issuer does not issue the securities due to political, economic, or other factors.
Restricted Securities. The fund may invest in securities that are subject to legal or contractual restrictions on resale. These securities generally may be resold in transactions exempt from registration or to the public if the securities are registered. Disposal of these securities may involve time-consuming negotiations and expense, and prompt sale at an acceptable price may be difficult. Information regarding restricted securities is included at the end of the fund's Schedule of Investments.
3. Purchases and Sales of Investments.
Purchases and sales of securities, other than short-term securities and U.S. government securities, aggregated $251,008 and $337,309, respectively.
4. Fees and Other Transactions with Affiliates.
Management Fee. FMR and its affiliates provide the fund with investment management related services for which the fund pays a monthly management fee. The management fee is the sum of an individual fund fee rate that is based on an annual rate of .25% of the fund's average net assets and a group fee rate that averaged .12% during the period. The group fee rate is based upon the average net assets of all the mutual funds
Semiannual Report
Notes to Financial Statements (Unaudited) - continued
(Amounts in thousands except ratios)
4. Fees and Other Transactions with Affiliates - continued
Management Fee - continued
advised by FMR. The group fee rate decreases as assets under management increase and increases as assets under management decrease. For the period, the total annualized management fee rate was .38% of the fund's average net assets.
Distribution and Service Plan. In accordance with Rule 12b-1 of the 1940 Act, the fund has adopted separate Distribution and Service Plans for each class of shares. Certain classes pay Fidelity Distributors Corporation (FDC), an affiliate of FMR, separate Distribution and Service Fees, each of which is based on an annual percentage of each class' average net assets. In addition, FDC may pay financial intermediaries for selling shares of the fund and providing shareholder support services. For the period, the Distribution and Service Fee rates and the total amounts paid to and retained by FDC were as follows:
| Distribution
Fee | Service
Fee | Paid to
FDC | Retained
by FDC |
Class A | 0% | .15% | $ 9 | $ - |
Class T | 0% | .25% | 26 | - |
Class B | .65% | .25% | 17 | 13 |
Class C | .75% | .25% | 58 | 23 |
| | | $ 110 | $ 36 |
Sales Load. FDC receives a front-end sales charge of up to 3.75% for selling Class A shares, and 2.75% for selling Class T shares, some of which is paid to financial intermediaries for selling shares of the fund. FDC receives the proceeds of contingent deferred sales charges levied on Class A, Class T, Class B, and Class C redemptions. These charges depend on the holding period. The deferred sales charges range from 3% to 1% for Class B, 1% for Class C, and .25% for certain purchases of Class A and Class T shares.
For the period, sales charge amounts retained by FDC were as follows:
| Retained
by FDC |
Class A | $ 3 |
Class T | 3 |
Class B* | 3 |
Class C* | 4 |
| $ 13 |
* When Class B and Class C shares are initially sold, FDC pays commissions from its own resources to financial intermediaries through which the sales are made.
Semiannual Report
4. Fees and Other Transactions with Affiliates - continued
Transfer Agent and Accounting Fees. Citibank, N.A. (Citibank) is the custodian, transfer agent, and shareholder servicing agent for the fund's Class A, Class T, Class B, Class C, Spartan Short-Intermediate Municipal Income and Institutional Class shares. Citibank has entered into a sub-arrangement with Fidelity Investments Institutional Operations Company, Inc. (FIIOC), an affiliate of FMR, with respect to all classes of the fund, except for Spartan Short-Intermediate Municipal Income, to perform the transfer, dividend disbursing, and shareholder servicing agent functions. Citibank has also entered into a sub-arrangement with Fidelity Service Company, Inc. (FSC), an affiliate of FMR, with respect to Spartan Short-Intermediate Municipal Income, to perform the transfer, dividend disbursing, and shareholder servicing agent functions. FIIOC and FSC receive account fees and asset-based fees that vary according to the account size and type of account of the shareholders of the respective classes of the fund. All fees are paid to FIIOC by Citibank, which is reimbursed by each class for such payments. FIIOC and FSC pay for typesetting, printing and mailing of shareholder reports, except proxy statements. For the period, each class paid the following transfer agent fees:
| Amount | % of
Average
Net Assets |
Class A | $ 5 | .09* |
Class T | 11 | .10* |
Class B | 2 | .10* |
Class C | 7 | .11* |
Spartan Short-Intermediate Municipal Income | 725 | .08* |
Institutional Class | 1 | .08* |
| $ 751 | |
* Annualized
Citibank also has a sub-arrangement with FSC to maintain the fund's accounting records. The fee is based on the level of average net assets for the month.
Central Funds. The fund may invest in affiliated Central Funds managed by Fidelity Investments Money Management, Inc. (FIMM), an affiliate of FMR. The Central Funds are open-end investment companies available only to investment companies and other accounts managed by FMR and its affiliates. The Money Market Central Funds seek preservation of capital and current income. The Central Funds do not pay a management fee. Income distributions earned by the fund are recorded as income in the accompanying financial statements and totaled $238 for the period.
Semiannual Report
Notes to Financial Statements (Unaudited) - continued
(Amounts in thousands except ratios)
5. Committed Line of Credit.
The fund participates with other funds managed by FMR in a $4.2 billion credit facility (the "line of credit") to be utilized for temporary or emergency purposes to fund shareholder redemptions or for other short-term liquidity purposes. The fund has agreed to pay commitment fees on its pro rata portion of the line of credit. During the period, there were no borrowings on this line of credit.
6. Expense Reductions.
FMR voluntarily agreed to reimburse each class to the extent annual operating expenses exceeded certain levels of average net assets as noted in the table below. Some expenses, for example interest expense, are excluded from this reimbursement.
| Expense
Limitations | Reimbursement
from adviser |
Class C | 1.53% | - |
In addition, through arrangements with the fund's custodian and each class' transfer agent, credits realized as a result of uninvested cash balances were used to reduce the fund's expenses. During the period, these credits reduced the fund's custody and accounting expenses by $15 and $157, respectively. During the period, credits reduced each class' transfer agent expense as noted in the table below.
| Transfer Agent
expense reduction | |
Class A | $ 2 | |
Class T | 3 | |
Class B | 1 | |
Class C | 1 | |
Spartan Short-Intermediate Municipal Income | 257 | |
Institutional Class | - | |
| $ 264 | |
7. Other.
The fund's organizational documents provide former and current trustees and officers with a limited indemnification against liabilities arising in connection with the performance of their duties to the fund. In the normal course of business, the fund may also enter into contracts that provide general indemnifications. The fund's maximum exposure under these arrangements is unknown as this would be dependent on future claims that may be made against the fund. The risk of material loss from such claims is considered remote.
Semiannual Report
8. Distributions to Shareholders.
Distributions to shareholders of each class were as follows:
| Six months ended
June 30, 2005 | Year ended
December 31, 2004 |
From net investment income | | |
Class A | $ 151 | $ 303 |
Class T | 249 | 403 |
Class B | 35 | 58 |
Class C | 99 | 160 |
Spartan Short-Intermediate Municipal Income | 24,972 | 46,653 |
Institutional Class | 17 | 21 |
Total | $ 25,523 | $ 47,598 |
From net realized gain | | |
Class A | $ 4 | $ 23 |
Class T | 6 | 36 |
Class B | 1 | 7 |
Class C | 3 | 20 |
Spartan Short-Intermediate Municipal Income | 534 | 3,398 |
Institutional Class | 1 | 2 |
Total | $ 549 | $ 3,486 |
9. Share Transactions.
Transactions for each class of shares were as follows:
| Shares | Dollars |
| Six months ended
June 30, 2005 | Year ended
December 31, 2004 | Six months ended
June 30, 2005 | Year ended
December 31, 2004 |
Class A | | | | |
Shares sold | 164 | 1,095 | $ 1,695 | $ 11,465 |
Reinvestment of distributions | 12 | 24 | 122 | 253 |
Shares redeemed | (267) | (785) | (2,748) | (8,128) |
Net increase (decrease) | (91) | 334 | $ (931) | $ 3,590 |
Class T | | | | |
Shares sold | 318 | 1,569 | $ 3,273 | $ 16,393 |
Reinvestment of distributions | 17 | 30 | 179 | 309 |
Shares redeemed | (310) | (818) | (3,187) | (8,551) |
Net increase (decrease) | 25 | 781 | $ 265 | $ 8,151 |
Class B | | | | |
Shares sold | 41 | 214 | $ 415 | $ 2,231 |
Reinvestment of distributions | 2 | 4 | 22 | 42 |
Shares redeemed | (50) | (84) | (513) | (870) |
Net increase (decrease) | (7) | 134 | $ (76) | $ 1,403 |
Semiannual Report
Notes to Financial Statements (Unaudited) - continued
(Amounts in thousands except ratios)
9. Share Transactions - continued
| Shares | Dollars |
| Six months ended
June 30, 2005 | Year ended
December 31, 2004 | Six months ended
June 30, 2005 | Year ended
December 31, 2004 |
Class C | | | | |
Shares sold | 289 | 658 | $ 2,982 | $ 6,848 |
Reinvestment of distributions | 6 | 10 | 59 | 103 |
Shares redeemed | (301) | (295) | (3,100) | (3,054) |
Net increase (decrease) | (6) | 373 | $ (59) | $ 3,897 |
Spartan Short-Intermediate Municipal Income | | | | |
Shares sold | 27,858 | 75,115 | $ 287,044 | $ 784,282 |
Reinvestment of distributions | 1,749 | 3,669 | 17,998 | 38,189 |
Shares redeemed | (28,363) | (77,123) | (292,167) | (803,196) |
Net increase (decrease) | 1,244 | 1,661 | $ 12,875 | $ 19,275 |
Institutional Class | | | | |
Shares sold | 66 | 110 | $ 679 | $ 1,153 |
Reinvestment of distributions | 1 | 1 | 6 | 8 |
Shares redeemed | (35) | (30) | (358) | (317) |
Net increase (decrease) | 32 | 81 | $ 327 | $ 844 |
Semiannual Report
Board Approval of Investment Advisory Contracts and Management Fees
Spartan Short-Intermediate Municipal Income Fund
Each year, typically in June, the Board of Trustees, including the independent Trustees (together, the Board), votes on the renewal of the management contract and sub-advisory agreements (together, the Advisory Contracts) for the fund. The Board, assisted by the advice of fund counsel and independent Trustees' counsel, requests and considers a broad range of information throughout the year.
The Board meets regularly each month except August and takes into account throughout the year matters bearing on Advisory Contracts. The Board, acting directly and through its separate committees, considers at each of its meetings factors that are relevant to the annual renewal of the fund's Advisory Contracts, including the services and support provided to the fund and its shareholders by Fidelity. At the time of the renewal, the Board had 11 standing committees, each composed of independent Trustees with varying backgrounds, to which the Board has assigned specific subject matter responsibilities in order to enhance effective decision-making by the Board. Each committee has adopted a written charter outlining the structure and purposes of the committee. One such committee, the Fixed-Income Contract Committee, meets periodically during the first six months of each year and as necessary to consider matters specifically related to the annual renewal of Advisory Contracts. The committee requests and receives information on, and makes recommendations to the independent Trustees concerning, the approval and annual review of the Advisory Contracts.
At its June 2005 meeting, the Board of Trustees, including the independent Trustees, unanimously determined to renew the Advisory Contracts for the fund. In reaching its determination, the Board considered all factors it believed relevant, including (1) the nature, extent, and quality of the services to be provided to the fund and its shareholders by Fidelity (including the investment performance of the fund); (2) the competitiveness of the management fee and total expenses of the fund; (3) the total costs of the services to be provided by and the profits to be realized by the investment adviser and its affiliates from the relationship with the fund; (4) the extent to which economies of scale would be realized as the fund grows; and (5) whether fee levels reflect these economies of scale, if any, for the benefit of fund shareholders.
In determining whether to renew the Advisory Contracts for the fund, the Board ultimately reached a determination, with the assistance of fund counsel and independent Trustees' counsel, that the renewal of the Advisory Contracts and the compensation to be received by Fidelity under the management contract is consistent with Fidelity's fiduciary duty under applicable law. In addition to evaluating the specific factors noted above, the Board, in reaching its determination, is aware that shareholders in the fund have a broad range of investment choices available to them, including a wide choice among mutual funds offered by competitors to Fidelity, and that the fund's shareholders, with the opportunity to review and weigh the disclosure provided by the fund in its prospectus and other public disclosures, have chosen to invest in this fund, managed by Fidelity.
Semiannual Report
Board Approval of Investment Advisory Contracts and
Management Fees - continued
Nature, Extent, and Quality of Services Provided by Fidelity. The Board considered staffing within the investment adviser, FMR, and the sub-advisers (together, the Investment Advisers), including the background of the fund's portfolio manager and the fund's investment objective and discipline. The independent Trustees also had discussions with senior management of Fidelity's investment operations and investment groups. The Board considered the structure of the portfolio manager compensation program and whether this structure provides appropriate incentives.
Fidelity Resources Dedicated to Investment Management and Support Services. The Board reviewed the size, education, and experience of the Investment Advisers' investment staff, their use of technology, and the Investment Advisers' approach to recruiting, training, and retaining portfolio managers and other research, advisory, and management personnel. The Board considered Fidelity's extensive global research capabilities that enable the Investment Advisers to aggregate data from various sources in an effort to produce positive investment results. The Board noted that Fidelity's analysts have access to a variety of technological tools that enable them to perform both fundamental and quantitative analysis and to specialize in various disciplines. The Board also considered that Fidelity's portfolio managers and analysts have access to daily portfolio attribution that allows for monitoring of a fund's portfolio, as well as an electronic communication system that provides immediate real-time access to research concerning issuers and credit enhancers.
Shareholder and Administrative Services. The Board considered the nature, extent, quality, and cost of administrative, distribution, and shareholder services performed by the Investment Advisers and their affiliates under the Advisory Contracts and under separate agreements covering transfer agency and pricing and bookkeeping services for the fund. The Board also considered the nature and extent of the Investment Advisers' supervision of third party service providers, principally custodians and subcustodians. The Board reviewed the allocation of fund brokerage, including allocations to brokers affiliated with the Investment Advisers. The Board also considered the resources devoted to, and the record of compliance with, the fund's compliance policies and procedures.
The Board noted that the growth of fund assets across the complex allows Fidelity to reinvest in the development of services designed to enhance the value or convenience of the Fidelity funds as investment vehicles. These services include 24-hour access to account information and market information through phone representatives and over the Internet, and investor education materials and asset allocation tools.
Investment in a Large Fund Family. The Board considered the benefits to shareholders of investing in a Fidelity fund, including the benefits of investing in a fund that is part of a large family of funds offering a variety of investment disciplines and providing for a large variety of mutual fund investor services. For example, fund shareholders are offered the privilege of exchanging shares of the fund for shares of other Fidelity funds, as set forth in the fund's prospectus, without paying an additional sales charge. The Board noted that, since the last Advisory Contract renewals in June 2004, Fidelity has taken a number of actions that benefited particular funds, including (i) voluntarily deciding in 2004 to stop using "soft" commission dollars to pay for market data and, instead, to pay for that data out of its own resources, (ii) contractually agreeing to impose management fee reductions and expense limitations on its five Spartan stock index funds and its stock index fund available through variable insurance products, (iii) contractually agreeing to eliminate the management fees on the Fidelity Freedom Funds and the Fidelity Advisor Freedom Funds, (iv) contractually agreeing to reduce the management fees on most of its investment-grade taxable bond funds, and (v) contractually agreeing to impose expense limitations on its retail and Spartan investment-grade taxable bond funds.
Semiannual Report
Investment Performance. The Board considered whether the fund has operated within its investment objective, as well as its record of compliance with its investment restrictions. It also reviewed the fund's absolute investment performance for each class, as well as the fund's relative investment performance for each class measured against (i) a broad-based securities market index, and (ii) a peer group of mutual funds deemed appropriate by the Board over multiple periods. The following charts considered by the Board show, over the one-, three-, and five-year periods ended December 31, 2004, as applicable, the returns of Class C and the retail class of the fund, the returns of a broad-based securities market index ("benchmark"), and a range of returns of a peer group of mutual funds identified by Lipper Inc. as having an investment objective similar to that of the fund. The returns of Class C and the retail class represent the performance of classes with the highest and lowest 12b-1 fees, respectively (not necessarily with the highest and lowest total expenses). The box within each chart shows the 25th percentile return (bottom of box) and the 75th percentile return (top of box) of the Lipper peer group. The percentage beaten numbers noted below each chart correspond to the percentile box and represent the percentage of funds in the Lipper peer group whose performance was equal to or lower than that of the class indicated.
Semiannual Report
Board Approval of Investment Advisory Contracts and
Management Fees - continued
The Board noted that the relative investment performance of the retail class of the fund has compared favorably to its Lipper peer group over time. The Board also noted that the investment performance of the retail class of the fund was lower than its benchmark over time. The Board considered that the variations in performance among the fund's classes reflect the variations in class expenses, which result in lower performance for higher expense classes.
Based on its review, and giving particular weight to the nature and quality of the resources dedicated by the Investment Advisers to maintain and improve relative performance, the Board concluded that the nature, extent, and quality of the services provided by Fidelity will benefit the fund's shareholders, particularly in light of the Board's view that the fund's shareholders benefit from investing in a fund that is part of a large family of funds offering a variety of investment disciplines and services.
Competitiveness of Management Fee and Total Fund Expenses. The Board considered the fund's management fee and total expenses compared to "mapped groups" of competitive funds and classes. Fidelity creates "mapped groups" by combining similar Lipper investment objective categories that have comparable management fee characteristics. Combining Lipper investment objective categories aids the Board's management fee and total expense comparisons by broadening the competitive group used for comparison and by reducing the number of universes to which various Fidelity funds are compared.
The Board considered two proprietary management fee comparisons for the 12-month periods shown in the chart below. The group of Lipper funds used by the Board for management fee comparisons is referred to below as the "Total Mapped Group" and, for the reasons explained above, is broader than the Lipper peer group used by the Board for performance comparisons. The Total Mapped Group comparison focuses on a fund's standing relative to the total universe of comparable funds available to investors, in terms of gross management fees before expense reimbursements or caps. "TMG %" represents the percentage of funds in the Total Mapped Group that had management fees that were lower than the fund's. For example, a TMG % of 12% would mean that 88% of the funds in the Total Mapped Group had higher management fees than the fund. The "Asset-Size Peer Group" (ASPG) comparison focuses on a fund's standing relative to non-Fidelity funds similar in size to the fund within the Total Mapped Group. The ASPG represents at least 15% of the funds in the Total Mapped Group with comparable asset size and management fee characteristics, subject to a minimum of 50 funds (or all funds in the Total Mapped Group if fewer than 50). Additional information, such as the ASPG quartile ("quadrant") in which the fund's management fee ranked, is also included in the chart and considered by the Board.
Semiannual Report
The Board noted that the fund's management fee ranked below the median of its Total Mapped Group and below the median of its ASPG for 2004. Based on its review, the Board concluded that the fund's management fee was fair and reasonable in light of the services that the fund receives and the other factors considered.
In its review of each class's total expenses, the Board considered the fund's management fee as well as other fund or class expenses, as applicable, such as transfer agent fees, pricing and bookkeeping fees, fund-paid 12b-1 fees, and custodial, legal, and audit fees. The Board also noted the effects of any waivers and reimbursements on fees and expenses. As part of its review, the Board also considered current and historical total expenses of each class of the fund compared to competitive fund median expenses. Each class of the fund is compared to those funds and classes in the Total Mapped Group (used by the Board for management fee comparisons) that have a similar sales load structure.
Semiannual Report
Board Approval of Investment Advisory Contracts and
Management Fees - continued
The Board noted that the total expenses of each of Class A, Class T, Class B, Spartan Short-Intermediate Municipal Income Fund (retail class), and Institutional Class ranked below its competitive median for 2004, and the total expenses of Class C ranked above its competitive median for 2004. The Board noted that the fund offers multiple classes, each of which has a different sales load and 12b-1 fee structure, and that the multiple structures are intended to offer a range of pricing options for the intermediary market. The Board also noted that the total expenses of the classes vary primarily by the level of their 12b-1 fees, although differences in transfer agent fees may also cause expenses to vary from class to class.
In its review of total expenses, the Board also considered Fidelity fee structures and other information on clients that FMR and its affiliates service in other competitive markets, such as other mutual funds advised or subadvised by FMR or its affiliates, pension plan clients, and other institutional clients.
Based on its review, the Board concluded that the total expenses for each class of the fund were reasonable, although in one case above the median of the universe presented for comparison, in light of the services that the fund and its shareholders receive and the other factors considered.
Costs of the Services and Profitability. The Board considered the revenues earned and the expenses incurred by Fidelity in conducting the business of developing, marketing, distributing, managing, administering and servicing the fund and its shareholders. The Board also considered the level of Fidelity's profits in respect of all the Fidelity funds.
On an annual basis, FMR presents to the Board Fidelity's profitability for the fund. Fidelity calculates the profitability for each fund, as well as aggregate profitability for groups of Fidelity funds and all Fidelity funds, using a series of detailed revenue and cost allocation methodologies which originate with the audited books and records of Fidelity. The Audit Committee of the Board reviews any significant changes from the prior year's methodologies.
PricewaterhouseCoopers LLP (PwC), independent registered accounting firm and auditor to Fidelity and certain Fidelity funds, has been engaged annually by the Board as part of the Board's assessment of the results of Fidelity's profitability analysis. PwC's engagement includes the review and assessment of Fidelity's methodologies used in determining the revenues and expenses attributable to Fidelity's mutual fund business, and completion of agreed-upon procedures surrounding the mathematical accuracy of fund profitability and its conformity to allocation methodologies. After considering PwC's reports issued under the engagement and information provided by Fidelity, the Board believes that while other allocation methods may also be reasonable, Fidelity's profitability methodologies are reasonable in all material respects.
Semiannual Report
The Board has also reviewed Fidelity's non-fund businesses and any fall-out benefits related to the mutual fund business as well as cases where Fidelity's affiliates may benefit from or be related to the fund's business. In addition, a special committee of the Board reviewed services provided to Fidelity by its affiliates and determined that the fees that Fidelity paid for such services were reasonable.
The Board considered the costs of the services provided by and the profits realized by Fidelity in connection with the operation of the fund and determined that the amount of profit is a fair entrepreneurial profit for the management of the fund.
Economies of Scale. The Board considered whether there have been economies of scale in respect of the management of the Fidelity funds, whether the Fidelity funds (including the fund) have appropriately benefited from any such economies of scale, and whether there is potential for realization of any further economies of scale. The Board considered the extent to which the fund will benefit from economies of scale through increased services to the fund, through waivers or reimbursements, or through fee or expense reductions, including reductions that occur through operation of the transfer agent agreement. The transfer agent fee varies in part based on the number of accounts in the fund. If the number of accounts decreases or the average account size increases, the overall transfer agent fee rate decreases.
The Board recognized that the fund's management contract incorporates a "group fee" structure, which provides for lower fee rates as total fund assets under FMR's management increase, and for higher fee rates as total fund assets under FMR's management decrease. The Board considered that the group fee is designed to deliver the benefits of economies of scale to fund shareholders when total fund assets increase, even if assets of any particular fund are unchanged or have declined, because some portion of Fidelity's costs are attributable to services provided to all Fidelity funds, and all funds benefit if those costs can be allocated among more assets. The Board concluded that, given the group fee structure, fund shareholders will achieve a certain level of economies of scale as assets under FMR's management increase at the fund complex level, regardless of whether Fidelity achieves any such economies of scale.
The Board further concluded that any potential economies of scale are being shared between fund shareholders and Fidelity in an appropriate manner.
Additional Information Requested by the Board. In order to develop fully the factual basis for consideration of the Advisory Contracts, the Board requested additional information regarding (i) Fidelity's fund profitability methodology, including additional detail on various cost allocations; (ii) fall-out benefits to Fidelity; and (iii) compensation of portfolio managers and research analysts.
Semiannual Report
Board Approval of Investment Advisory Contracts and
Management Fees - continued
Based on its evaluation of all of the conclusions noted above, and after considering all material factors, the Board ultimately concluded that the existing advisory fee structures are fair and reasonable, and that the fund's existing Advisory Contracts should be renewed.
Semiannual Report
Semiannual Report
Semiannual Report
Semiannual Report
Investment Adviser
Fidelity Management & Research Company
Boston, MA
Investment Sub-Advisers
Fidelity Investments Money
Management, Inc.
Fidelity International Investment Advisors
Fidelity International Investment Advisors
(U.K.) Limited
General Distributor
Fidelity Distributors Corporation
Boston, MA
Transfer and Service Agents
Citibank, N.A.
New York, NY
Fidelity Investments Institutional
Operations Company, Inc.
Boston, MA
Custodian
Citibank, N.A.
New York, NY
ASTMI-USAN-0805
1.803550.101
(Fidelity Investment logo)(registered trademark)
Corporate Headquarters
82 Devonshire St., Boston, MA 02109
www.fidelity.com
Item 2. Code of Ethics
Not applicable.
Item 3. Audit Committee Financial Expert
Not applicable.
Item 4. Principal Accountant Fees and Services
Not applicable.
Item 5. Audit Committee of Listed Registrants
Not applicable.
Item 6. Schedule of Investments
Not applicable.
Item 7. Disclosure of Proxy Voting Policies and Procedures for Closed-End Management Investment Companies
Not applicable.
Item 8. Portfolio Managers of Closed-End Management Investment Companies
Not applicable.
Item 9. Purchase of Equity Securities by Closed-End Management Investment Company and Affiliated Purchasers
Not applicable.
Item 10. Submission of Matters to a Vote of Security Holders
There were no material changes to the procedures by which shareholders may recommend nominees to the Fidelity Municipal Trust's Board of Trustees.
Item 11. Controls and Procedures
(a)(i) The President and Treasurer and the Chief Financial Officer have concluded that the Fidelity Municipal Trust's (the "Trust") disclosure controls and procedures (as defined in Rule 30a-3(c) under the Investment Company Act) provide reasonable assurances that material information relating to the Trust is made known to them by the appropriate persons, based on their evaluation of these controls and procedures as of a date within 90 days of the filing date of this report.
(a)(ii) There was no change in the Trust's internal control over financial reporting (as defined in Rule 30a-3(d) under the Investment Company Act) that occurred during the second fiscal quarter of the period covered by this report that has materially affected, or is reasonably likely to materially affect, the Trust's internal control over financial reporting.
Item 12. Exhibits
(a) | (1) | Not applicable. |
(a) | (2) | Certification pursuant to Rule 30a-2(a) under the Investment Company Act of 1940 (17 CFR 270.30a-2(a)) is filed and attached hereto as Exhibit 99.CERT. |
(a) | (3) | Not applicable. |
(b) | | Certification pursuant to Rule 30a-2(b) under the Investment Company Act of 1940 (17 CFR 270.30a-2(b)) is furnished and attached hereto as Exhibit 99.906CERT. |
SIGNATURES
Pursuant to the requirements of the Securities Exchange Act of 1934 and the Investment Company Act of 1940, the registrant has duly caused this report to be signed on its behalf by the undersigned, thereunto duly authorized.
Fidelity Municipal Trust
By: | /s/Christine Reynolds |
| Christine Reynolds |
| President and Treasurer |
| |
Date: | August 19, 2005 |
Pursuant to the requirements of the Securities Exchange Act of 1934 and the Investment Company Act of 1940, this report has been signed below by the following persons on behalf of the registrant and in the capacities and on the dates indicated.
By: | /s/Christine Reynolds |
| Christine Reynolds |
| President and Treasurer |
| |
Date: | August 19, 2005 |
By: | /s/Timothy F. Hayes |
| Timothy F. Hayes |
| Chief Financial Officer |
| |
Date: | August 19, 2005 |