UNITED STATES
SECURITIES AND EXCHANGE COMMISSION
Washington, D.C. 20549
FORM N-CSR
CERTIFIED SHAREHOLDER REPORT OF REGISTERED
MANAGEMENT INVESTMENT COMPANIES
Investment Company Act file number 811-02628
Fidelity Municipal Trust
(Exact name of registrant as specified in charter)
245 Summer St., Boston, Massachusetts 02210
(Address of principal executive offices) (Zip code)
Margaret Carey, Secretary
245 Summer St.
Boston, Massachusetts 02210
(Name and address of agent for service)
Registrant's telephone number, including area code:
617-563-7000
Date of fiscal year end: | December 31 |
Date of reporting period: | December 31, 2023 |
Item 1.
Reports to Stockholders


Contents
| Average Annual Total Returns | |||
Periods ended December 31, 2023 | Past 1 year | Past 5 years | Past 10 years |
Class A (incl. 4.00% sales charge) | 2.51% | 1.17% | 2.65% |
Class M (incl. 4.00% sales charge) | 2.53% | 1.19% | 2.67% |
Class C (incl. contingent deferred sales charge) | 5.01% | 1.25% | 2.63% |
| Fidelity® Municipal Income Fund | 7.12% | 2.35% | 3.27% |
| Class I | 7.04% | 2.25% | 3.22% |
| Class Z | 7.17% | 2.37% | 3.28% |
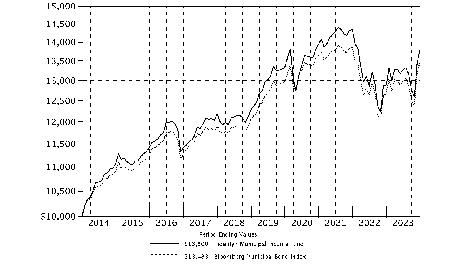
| $10,000 Over 10 Years |
Let's say hypothetically that $10,000 was invested in Fidelity® Municipal Income Fund, a class of the fund, on December 31, 2013. The chart shows how the value of your investment would have changed, and also shows how the Bloomberg Municipal Bond Index performed over the same period. |
 |
| Top Five States (% of Fund's net assets) | |
| Illinois | 16.3 |
| Pennsylvania | 8.2 |
| New York | 7.5 |
| Florida | 6.2 |
| New Jersey | 5.3 |
| Revenue Sources (% of Fund's net assets) | ||
| Transportation | 22.9 | |
| Health Care | 22.4 | |
| General Obligations | 21.8 | |
| Education | 9.0 | |
| Special Tax | 8.1 | |
| State G.O. | 5.1 | |
| Others* (Individually Less Than 5%) | 10.7 | |
| 100.0 | ||
| *Includes net other assets | ||
Quality Diversification (% of Fund's net assets) |
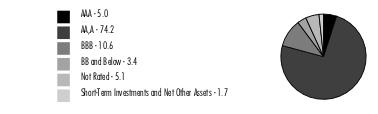 |
| We have used ratings from Moody's Investors Service, Inc. Where Moody's® ratings are not available, we have used S&P® ratings. All ratings are as of the date indicated and do not reflect subsequent changes. |
| Municipal Bonds - 98.6% | |||
Principal Amount (a) (000s) | Value ($) (000s) | ||
| Alabama - 1.4% | |||
| Auburn Univ. Gen. Fee Rev. Series 2018 A, 5% 6/1/43 | 2,565 | 2,727 | |
| Black Belt Energy Gas District Bonds Series 2022 E, 5%, tender 6/1/28 (b) | 8,020 | 8,399 | |
| Jefferson County Gen. Oblig. Series 2018 A, 5% 4/1/26 | 2,400 | 2,513 | |
| Montgomery Med. Clinic Facilities Series 2015, 5% 3/1/33 | 4,140 | 3,601 | |
| Southeast Energy Auth. Coop. Dis Bonds (Proj. No. 6) Series 2023 B, 5%, tender 6/1/30 (b) | 17,760 | 18,956 | |
| Southeast Energy Auth. Rev.: | |||
| (Proj. No. 2) Series 2021 B1: | |||
4% 6/1/29 | 1,475 | 1,498 | |
4% 6/1/30 | 1,115 | 1,131 | |
4% 6/1/31 | 975 | 977 | |
| Bonds (Proj. No. 2) Series 2021 B1, 4%, tender 12/1/31 (b) | 23,655 | 23,614 | |
TOTAL ALABAMA | 63,416 | ||
| Arizona - 2.0% | |||
| Arizona Health Facilities Auth. Rev. (Banner Health Sys. Proj.) Series 2007 B, S&P Muni. Bond 7 Day High Grade Rate Index + 0.810% 4.97%, tender 1/1/37 (b)(c) | 2,485 | 2,286 | |
| Arizona Indl. Dev. Auth. Hosp. Rev. Series 2021 A: | |||
| 5% 2/1/30 | 1,300 | 1,469 | |
| 5% 2/1/31 | 1,250 | 1,436 | |
| 5% 2/1/32 | 1,250 | 1,458 | |
| Arizona Indl. Dev. Auth. Rev.: | |||
| (Provident Group-Eastern Michigan Univ. Parking Proj.) Series 2018: | |||
5% 5/1/48 | 910 | 501 | |
5% 5/1/51 | 910 | 501 | |
| Series 2019 2, 3.625% 5/20/33 | 2,734 | 2,589 | |
| Chandler Indl. Dev. Auth. Indl. Dev. Rev. (Intel Corp. Proj.) Series 2022 2, 5%, tender 9/1/27 (b)(d) | 4,580 | 4,763 | |
| Glendale Gen. Oblig. Series 2017: | |||
| 5% 7/1/30 | 2,080 | 2,253 | |
| 5% 7/1/31 | 3,105 | 3,354 | |
| Glendale Indl. Dev. Auth. (Terraces of Phoenix Proj.) Series 2018 A: | |||
| 5% 7/1/38 | 235 | 226 | |
| 5% 7/1/48 | 295 | 259 | |
| Maricopa County Indl. Dev. Auth. (Creighton Univ. Proj.) Series 2020, 5% 7/1/47 | 2,400 | 2,540 | |
| Maricopa County Indl. Dev. Auth. Sr. Living Facilities Series 2016: | |||
| 5.75% 1/1/36 (e) | 2,140 | 1,728 | |
| 6% 1/1/48 (e) | 5,260 | 3,738 | |
| Maricopa County Rev.: | |||
| Series 2016 A: | |||
5% 1/1/32 | 8,280 | 8,760 | |
5% 1/1/33 | 4,965 | 5,246 | |
| Series 2017 D, 3% 1/1/48 | 5,970 | 4,672 | |
| Series 2019 E, 3% 1/1/49 | 3,535 | 2,733 | |
| Phoenix Ariz Indl. Dev. Auth. Rev.: | |||
| (Guam Facilities Foundation, Inc. Projs.) Series 2014, 5.375% 2/1/41 | 3,825 | 3,635 | |
| (Guam Facilities Foundation, Inc. Proj.) Series 2014, 5.125% 2/1/34 | 2,655 | 2,610 | |
| Phoenix Civic Impt. Board Arpt. Rev.: | |||
| Series 2017 A: | |||
5% 7/1/33 (d) | 910 | 964 | |
5% 7/1/36 (d) | 1,450 | 1,527 | |
5% 7/1/37 (d) | 1,075 | 1,127 | |
| Series 2017 B: | |||
5% 7/1/29 | 2,070 | 2,246 | |
5% 7/1/33 | 2,900 | 3,136 | |
5% 7/1/36 | 3,310 | 3,559 | |
5% 7/1/37 | 2,070 | 2,216 | |
| Phoenix Civic Impt. Corp. Series 2019 A, 5% 7/1/45 | 6,100 | 6,415 | |
| Phoenix IDA Student Hsg. Rev. (Downtown Phoenix Student Hsg. II LLC Arizona State Univ. Proj.) Series 2019 A: | |||
| 5% 7/1/44 | 1,000 | 1,012 | |
| 5% 7/1/49 | 1,125 | 1,127 | |
| 5% 7/1/54 | 1,330 | 1,327 | |
| 5% 7/1/59 | 2,000 | 1,979 | |
| Salt Verde Finl. Corp. Sr. Gas Rev. Series 2007, 5.5% 12/1/29 | 7,370 | 8,051 | |
TOTAL ARIZONA | 91,443 | ||
| California - 4.8% | |||
| ABC Unified School District Series 1997 C, 0% 8/1/28 (Nat'l. Pub. Fin. Guarantee Corp. Insured) | 3,250 | 2,851 | |
| California Gen. Oblig.: | |||
| Series 2004: | |||
5.25% 12/1/33 | 150 | 150 | |
5.5% 4/1/28 | 10 | 10 | |
5.5% 4/1/30 | 5 | 5 | |
| Series 2021, 5% 10/1/37 | 7,740 | 9,021 | |
| California Hsg. Fin. Agcy.: | |||
| Series 2021 1, 3.5% 11/20/35 | 3,044 | 2,964 | |
| Series 2023 A1, 4.375% 9/20/36 | 8,936 | 8,968 | |
| California Muni. Fin. Auth. Student Hsg. (CHF-Davis I, LLC - West Village Student Hsg. Proj.) Series 2018, 5% 5/15/38 | 7,200 | 7,502 | |
| California Pub. Works Board Lease Rev. (Various Cap. Projs.) Series 2022 C: | |||
| 5% 8/1/31 | 1,365 | 1,623 | |
| 5% 8/1/34 | 2,535 | 3,006 | |
| California Statewide Cmntys. Dev. Auth. Rev.: | |||
| Series 2015, 5% 2/1/45 | 2,695 | 1,428 | |
| Series 2018 A, 5% 3/1/42 | 195 | 202 | |
| Eastern Muni. Wtr. District Fing. Auth. Series 2020 A: | |||
| 4% 7/1/38 | 1,400 | 1,473 | |
| 5% 7/1/36 | 1,600 | 1,856 | |
| 5% 7/1/37 | 1,000 | 1,153 | |
| Folsom Cordova Union School District No. 4 Series A, 0% 10/1/31 (Nat'l. Pub. Fin. Guarantee Corp. Insured) | 1,520 | 1,203 | |
| Fresno Arpt. Rev. Series 2023 A: | |||
| 5% 7/1/30 (Build America Mutual Assurance Insured) (d) | 2,000 | 2,221 | |
| 5% 7/1/31 (Build America Mutual Assurance Insured) (d) | 1,000 | 1,122 | |
| Golden State Tobacco Securitization Corp. Tobacco Settlement Rev. Series 2021 B2, 0% 6/1/66 | 69,825 | 8,215 | |
| Kern Cmnty. College District Gen. Oblig. Series 2006: | |||
| 0% 11/1/28 (Assured Guaranty Muni. Corp. Insured) | 4,100 | 3,562 | |
| 0% 11/1/30 (Assured Guaranty Muni. Corp. Insured) | 4,140 | 3,380 | |
| Long Beach Unified School District Series 2009, 5.5% 8/1/29 | 155 | 155 | |
| Los Angeles Dept. Arpt. Rev.: | |||
| Series 2020 C, 5% 5/15/45 (d) | 2,900 | 3,060 | |
| Series 2021 D: | |||
5% 5/15/35 (d) | 1,610 | 1,818 | |
5% 5/15/35 (Pre-Refunded to 11/15/31 @ 100) (d) | 90 | 103 | |
| Los Angeles Hbr. Dept. Rev. Series 2019 A: | |||
| 5% 8/1/25 (d) | 3,515 | 3,623 | |
| 5% 8/1/26 (d) | 1,350 | 1,421 | |
| Los Angeles Unified School District Ctfs. of Prtn. Series 2023 A: | |||
| 5% 10/1/30 | 3,805 | 4,435 | |
| 5% 10/1/31 | 8,845 | 10,498 | |
| Monrovia Unified School District Series B, 0% 8/1/29 (Nat'l. Pub. Fin. Guarantee Corp. Insured) | 3,745 | 3,165 | |
| Mount Diablo Unified School District Series 2022 B: | |||
| 4% 8/1/29 | 1,595 | 1,747 | |
| 4% 8/1/30 | 465 | 512 | |
| Poway Unified School District: | |||
| (District #2007-1 School Facilities Proj.) Series 2008 A, 0% 8/1/32 | 4,885 | 3,779 | |
| Series 2011, 0% 8/1/46 | 950 | 356 | |
| Series B: | |||
0% 8/1/37 | 6,455 | 4,061 | |
0% 8/1/38 | 6,890 | 4,101 | |
0% 8/1/39 | 19,705 | 11,118 | |
| Poway Unified School District Pub. Fing. Series 2015 A: | |||
| 5% 9/1/24 | 825 | 832 | |
| 5% 9/1/26 | 1,050 | 1,078 | |
| 5% 9/1/29 | 2,185 | 2,246 | |
| 5% 9/1/31 | 985 | 1,012 | |
| Sacramento City Fing. Auth. Rev. Series A, 0% 12/1/26 (Nat'l. Pub. Fin. Guarantee Corp. Insured) | 4,140 | 3,768 | |
| San Diego County Reg'l. Arpt. Auth. Arpt. Rev. Series 2021 B: | |||
| 5% 7/1/46 (d) | 10,000 | 10,541 | |
| 5% 7/1/56 (d) | 7,000 | 7,295 | |
| San Diego Unified School District: | |||
| Series 2008 C, 0% 7/1/34 | 2,980 | 2,143 | |
| Series 2008 E, 0% 7/1/47 (f) | 7,205 | 5,643 | |
| San Francisco City & County Arpts. Commission Int'l. Arpt. Rev.: | |||
| Series 2019 A, 5% 5/1/49 (d) | 1,000 | 1,035 | |
| Series 2019 B, 5% 5/1/49 | 3,765 | 4,023 | |
| Series 2022 A: | |||
5% 5/1/26 (d) | 6,315 | 6,556 | |
5% 5/1/27 (d) | 6,395 | 6,757 | |
5% 5/1/28 (d) | 8,530 | 9,173 | |
5% 5/1/29 (d) | 5,710 | 6,242 | |
| Series 2022 B, 5% 5/1/52 | 17,310 | 19,019 | |
| San Marcos Unified School District Series 2010 B, 0% 8/1/47 | 17,635 | 6,690 | |
| San Mateo County Cmnty. College District Series A, 0% 9/1/26 (Nat'l. Pub. Fin. Guarantee Corp. Insured) | 4,495 | 4,184 | |
| Univ. of California Revs. Series 2021 Q, 3% 5/15/51 | 6,765 | 5,569 | |
| Washington Township Health Care District Gen. Oblig. Series 2013 A, 5.5% 8/1/38 | 3,725 | 3,758 | |
TOTAL CALIFORNIA | 223,431 | ||
| Colorado - 2.1% | |||
| Arkansas River Pwr. Auth. Rev. Series 2018 A: | |||
| 5% 10/1/38 | 2,080 | 2,156 | |
| 5% 10/1/43 | 2,600 | 2,674 | |
| Colorado Health Facilities Auth. Rev. Bonds: | |||
| (Parkview Med. Ctr., Inc. Proj.) Series 2016: | |||
4% 9/1/35 | 1,365 | 1,388 | |
4% 9/1/36 | 1,075 | 1,090 | |
5% 9/1/46 | 6,045 | 6,165 | |
| Series 2019 A1, 4% 8/1/44 | 4,395 | 4,334 | |
| Series 2019 A2: | |||
3.25% 8/1/49 | 4,110 | 3,071 | |
4% 8/1/49 | 17,455 | 16,742 | |
5% 8/1/37 | 1,000 | 1,070 | |
5% 8/1/44 | 6,145 | 6,399 | |
| Series 2020 A, 4% 9/1/50 | 1,525 | 1,461 | |
| Colorado Hsg. & Fin. Auth. Series 2019 H, 4.25% 11/1/49 | 855 | 859 | |
| Denver City & County Arpt. Rev.: | |||
| Series 2017 A: | |||
5% 11/15/26 (d) | 2,855 | 3,001 | |
5% 11/15/27 (d) | 2,440 | 2,614 | |
| Series 2018 A: | |||
5% 12/1/34 (d) | 4,245 | 4,891 | |
5% 12/1/36 (d) | 4,140 | 4,385 | |
5% 12/1/37 (d) | 8,280 | 8,718 | |
| Series 2022 A: | |||
5% 11/15/33 (d) | 1,185 | 1,362 | |
5% 11/15/36 (d) | 10,000 | 11,308 | |
5.5% 11/15/38 (d) | 12,500 | 14,473 | |
TOTAL COLORADO | 98,161 | ||
| Connecticut - 1.7% | |||
| Connecticut Gen. Oblig.: | |||
| Series 2015 B, 5% 6/15/32 | 1,895 | 1,950 | |
| Series 2020 A: | |||
4% 1/15/34 | 8,385 | 8,947 | |
4% 1/15/38 | 1,000 | 1,037 | |
| Series 2021 A: | |||
3% 1/15/35 | 1,000 | 983 | |
3% 1/15/39 | 1,475 | 1,336 | |
3% 1/15/40 | 1,770 | 1,579 | |
| Series 2021 B: | |||
3% 6/1/38 | 1,850 | 1,701 | |
3% 6/1/40 | 1,740 | 1,550 | |
4% 1/15/39 | 3,305 | 3,442 | |
| Series 2022 B, 3% 1/15/40 | 3,710 | 3,310 | |
| Connecticut Health & Edl. Facilities Auth. Rev.: | |||
| (Sacred Heart Univ., CT. Proj.) Series 2017 I-1: | |||
5% 7/1/26 | 415 | 435 | |
5% 7/1/27 | 290 | 310 | |
5% 7/1/28 | 525 | 560 | |
5% 7/1/29 | 330 | 353 | |
| Series 2016 K, 4% 7/1/46 | 7,315 | 6,779 | |
| Series 2018 K-3, 5% 7/1/36 | 895 | 918 | |
| Series 2019 A: | |||
5% 7/1/39 (e) | 3,930 | 3,658 | |
5% 7/1/49 (e) | 285 | 248 | |
| Series 2020 A: | |||
4% 7/1/37 | 2,500 | 2,540 | |
4% 7/1/38 | 1,120 | 1,135 | |
5% 7/1/32 | 2,000 | 2,201 | |
5% 7/1/34 | 3,500 | 3,844 | |
| Series 2020 K, 5% 7/1/44 (e) | 1,525 | 1,462 | |
| Series 2021 S, 4% 6/1/51 | 1,675 | 1,671 | |
| Series 2022 M: | |||
4% 7/1/36 | 4,000 | 4,060 | |
4% 7/1/52 | 2,515 | 2,392 | |
| Series G, 5% 7/1/50 (e) | 1,800 | 1,657 | |
| Series K1: | |||
5% 7/1/27 | 415 | 429 | |
5% 7/1/29 | 1,060 | 1,105 | |
5% 7/1/30 | 830 | 864 | |
5% 7/1/31 | 1,400 | 1,455 | |
5% 7/1/32 | 1,000 | 1,037 | |
5% 7/1/33 | 2,500 | 2,589 | |
5% 7/1/34 | 620 | 641 | |
| Connecticut Hsg. Fin. Auth. Series 2021 B1, 3% 11/15/49 | 1,565 | 1,517 | |
| Hbr. Point Infrastructure Impt. District Series 2017: | |||
| 5% 4/1/30 (e) | 3,485 | 3,564 | |
| 5% 4/1/39 (e) | 4,865 | 4,918 | |
| New Britain Gen. Oblig. Series 2017 C, 5% 3/1/29 (Assured Guaranty Muni. Corp. Insured) | 885 | 948 | |
| Steelpointe Hbr. Infrastructure Impt. District (Steelpointe Hbr. Proj.) Series 2021, 4% 4/1/36 (e) | 1,390 | 1,255 | |
TOTAL CONNECTICUT | 80,380 | ||
| District Of Columbia - 1.3% | |||
| Metropolitan Washington Arpts. Auth. Dulles Toll Road Rev.: | |||
| (Dulles Metrorail and Cap. Impt. Projs.): | |||
Series 2019 A: | |||
5% 10/1/35 | 2,115 | 2,291 | |
5% 10/1/37 | 2,125 | 2,279 | |
5% 10/1/39 | 2,000 | 2,125 | |
5% 10/1/44 | 7,000 | 7,380 | |
Series 2019 B, 3% 10/1/50 (Assured Guaranty Muni. Corp. Insured) | 6,355 | 4,993 | |
| (Dulles Metrorail And Cap. Impt. Projs.) Series 2019 B, 4% 10/1/49 | 7,815 | 7,374 | |
| (Dulles Metrorail and Cap. Impt. Projs.) Series 2019 B, 5% 10/1/47 | 7,150 | 7,432 | |
| (Dulles Metrorail and Cap. Impts. Projs.) Series 2022 A, 3% 10/1/53 (Assured Guaranty Muni. Corp. Insured) | 3,600 | 2,750 | |
| Metropolitan Washington DC Arpts. Auth. Sys. Rev.: | |||
| Series 2017 A: | |||
5% 10/1/31 (d) | 1,200 | 1,277 | |
5% 10/1/32 (d) | 1,855 | 1,973 | |
5% 10/1/33 (d) | 910 | 966 | |
5% 10/1/35 (d) | 2,070 | 2,187 | |
5% 10/1/42 (d) | 4,140 | 4,289 | |
| Series 2020 A: | |||
5% 10/1/26 (d) | 9,015 | 9,452 | |
5% 10/1/27 (d) | 3,125 | 3,340 | |
5% 10/1/28 (d) | 1,560 | 1,695 | |
TOTAL DISTRICT OF COLUMBIA | 61,803 | ||
| Florida - 6.2% | |||
| Brevard County School Board Ctfs. of Prtn. Series 2015 C, 5% 7/1/28 | 1,445 | 1,487 | |
| Broward County Arpt. Sys. Rev.: | |||
| Series 2017: | |||
5% 10/1/25 (d) | 205 | 210 | |
5% 10/1/26 (d) | 930 | 973 | |
5% 10/1/27 (d) | 830 | 884 | |
5% 10/1/29 (d) | 2,200 | 2,343 | |
5% 10/1/30 (d) | 610 | 646 | |
5% 10/1/32 (d) | 2,900 | 3,073 | |
5% 10/1/33 (d) | 1,080 | 1,140 | |
5% 10/1/34 (d) | 1,055 | 1,111 | |
5% 10/1/35 (d) | 1,240 | 1,301 | |
5% 10/1/36 (d) | 1,655 | 1,731 | |
5% 10/1/37 (d) | 1,865 | 1,941 | |
5% 10/1/42 (d) | 3,520 | 3,627 | |
5% 10/1/47 (d) | 4,965 | 5,077 | |
| Series A: | |||
5% 10/1/28 (d) | 2,485 | 2,541 | |
5% 10/1/30 (d) | 2,900 | 2,965 | |
5% 10/1/31 (d) | 2,485 | 2,540 | |
5% 10/1/32 (d) | 2,320 | 2,371 | |
| Broward County School Board Ctfs. of Prtn.: | |||
| (Broward County School District Proj.) Series 2016 A, 5% 7/1/28 | 555 | 585 | |
| Series 2015 A, 5% 7/1/27 | 830 | 856 | |
| Series 2016, 5% 7/1/32 | 1,820 | 1,895 | |
| Cap. Projs. Fin. Auth. Student Hsg. Rev. (Cap. Projs. Ln. Prog. - Florida Univs.) Series 2020 A, 5% 10/1/28 | 2,000 | 2,092 | |
| Duval County School Board Ctfs. of Prtn.: | |||
| Series 2015 B: | |||
5% 7/1/28 | 1,705 | 1,756 | |
5% 7/1/32 | 10,120 | 10,403 | |
| Series 2016 A, 5% 7/1/33 | 1,110 | 1,158 | |
| Escambia County Health Facilities Auth. Health Facilities Rev. Series 2020 A: | |||
| 4% 8/15/45 | 2,820 | 2,590 | |
| 4% 8/15/50 | 1,525 | 1,341 | |
| Florida Dept. of Trans. Tpk. Rev.: | |||
| Series 2020 A, 3% 7/1/35 | 3,540 | 3,460 | |
| Series 2022 B: | |||
4% 7/1/36 | 4,155 | 4,428 | |
4% 7/1/37 | 4,525 | 4,784 | |
4% 7/1/38 | 4,710 | 4,945 | |
| Florida Higher Edl. Facilities Fing. Auth. (Rollins College Proj.) Series 2020 A, 3% 12/1/48 | 5,015 | 3,908 | |
| Florida Hsg. Fin. Corp. Multi-family Mtg. Rev. Bonds Series 2023 C, 5%, tender 12/1/25 (b) | 2,050 | 2,106 | |
| Florida Mid-Bay Bridge Auth. Rev.: | |||
| Series 2015 A, 5% 10/1/35 | 5,300 | 5,400 | |
| Series 2015 C: | |||
5% 10/1/30 | 2,705 | 2,765 | |
5% 10/1/40 | 1,655 | 1,673 | |
| Florida Muni. Pwr. Agcy. Rev.: | |||
| (Requirements Pwr. Supply Proj.) Series 2016 A: | |||
5% 10/1/30 | 1,810 | 1,898 | |
5% 10/1/31 | 1,975 | 2,069 | |
| Series 2015 B: | |||
5% 10/1/28 | 830 | 856 | |
5% 10/1/30 | 1,490 | 1,534 | |
| Greater Orlando Aviation Auth. Arpt. Facilities Rev.: | |||
| Series 2016 A, 5% 10/1/46 (d) | 830 | 841 | |
| Series 2016: | |||
5% 10/1/26 (d) | 1,405 | 1,469 | |
5% 10/1/27 (d) | 830 | 884 | |
| Series 2017 A: | |||
5% 10/1/25 (d) | 275 | 282 | |
5% 10/1/25 (Escrowed to Maturity) (d) | 555 | 570 | |
5% 10/1/27 (d) | 385 | 409 | |
5% 10/1/27 (Escrowed to Maturity) (d) | 1,270 | 1,354 | |
5% 10/1/29 (Pre-Refunded to 10/1/27 @ 100) (d) | 2,485 | 2,658 | |
5% 10/1/30 (Pre-Refunded to 10/1/27 @ 100) (d) | 2,665 | 2,850 | |
5% 10/1/34 (d) | 4,965 | 5,228 | |
5% 10/1/37 (d) | 5,175 | 5,387 | |
| Halifax Hosp. Med. Ctr. Rev. Series 2015, 5% 6/1/24 | 230 | 231 | |
| JEA Wtr. & Swr. Sys. Rev. Series 2021 A: | |||
| 4% 10/1/37 | 4,560 | 4,796 | |
| 4% 10/1/38 | 1,090 | 1,139 | |
| Miami-Dade County Aviation Rev.: | |||
| Series 2014 A, 5% 10/1/28 (d) | 4,140 | 4,162 | |
| Series 2015 A: | |||
5% 10/1/29 (d) | 1,310 | 1,329 | |
5% 10/1/31 (d) | 1,100 | 1,112 | |
5% 10/1/35 (d) | 4,555 | 4,572 | |
| Series 2016 A: | |||
5% 10/1/29 | 1,200 | 1,256 | |
5% 10/1/31 | 1,450 | 1,515 | |
| Series 2017 B, 5% 10/1/40 (d) | 10,760 | 11,093 | |
| Series 2019 A, 5% 10/1/49 (d) | 11,860 | 12,237 | |
| Miami-Dade County Expressway Auth.: | |||
| Series 2014 B, 5% 7/1/28 | 830 | 837 | |
| Series 2016 A: | |||
5% 7/1/32 | 3,560 | 3,704 | |
5% 7/1/33 | 3,020 | 3,142 | |
| Miami-Dade County School Board Ctfs. of Prtn.: | |||
| Series 2015 A, 5% 5/1/29 | 3,375 | 3,452 | |
| Series 2016 A, 5% 5/1/30 | 6,225 | 6,522 | |
| Miami-Dade County Wtr. & Swr. Rev.: | |||
| Series 2017 B, 4% 10/1/35 | 3,900 | 4,005 | |
| Series 2021: | |||
5% 10/1/31 | 1,250 | 1,465 | |
5% 10/1/32 | 645 | 755 | |
| Orange County Health Facilities Auth. Series 2016 A: | |||
| 5% 10/1/39 | 2,200 | 2,266 | |
| 5% 10/1/44 | 1,605 | 1,641 | |
| Palm Beach County Arpt. Sys. Rev. Series 2016: | |||
| 5% 10/1/24 (d) | 1,140 | 1,152 | |
| 5% 10/1/27 (d) | 830 | 865 | |
| 5% 10/1/29 (d) | 860 | 892 | |
| 5% 10/1/30 (d) | 1,530 | 1,587 | |
| 5% 10/1/31 (d) | 1,075 | 1,115 | |
| 5% 10/1/32 (d) | 1,655 | 1,715 | |
| 5% 10/1/33 (d) | 3,555 | 3,684 | |
| 5% 10/1/34 (d) | 3,730 | 3,862 | |
| 5% 10/1/35 (d) | 3,930 | 4,062 | |
| Palm Beach County Health Facilities Auth. Hosp. Rev. Series 2019, 4% 8/15/49 | 9,880 | 9,444 | |
| Palm Beach County Health Facilities Auth. Rev. Series 2019 B, 5% 5/15/53 | 5,695 | 4,200 | |
| Palm Beach County School Board Ctfs. of Prtn. Series 2015 D, 5% 8/1/28 | 3,905 | 4,017 | |
| Pinellas County Idr (Drs. Kiran & Pallavi Patel 2017 Foundation for Global Understanding, Inc. Proj.) Series 2019: | |||
| 5% 7/1/29 | 400 | 410 | |
| 5% 7/1/39 | 810 | 813 | |
| South Florida Wtr. Mgmt. District Ctfs. of Prtn. Series 2015: | |||
| 5% 10/1/29 | 4,140 | 4,347 | |
| 5% 10/1/32 | 5,190 | 5,434 | |
| South Miami Health Facilities Auth. Hosp. Rev. (Baptist Med. Ctr., FL. Proj.) Series 2017: | |||
| 4% 8/15/33 | 2,070 | 2,128 | |
| 5% 8/15/26 | 2,815 | 2,958 | |
| 5% 8/15/27 | 1,865 | 2,002 | |
| 5% 8/15/28 | 1,240 | 1,335 | |
| 5% 8/15/30 | 2,685 | 2,861 | |
| 5% 8/15/31 | 2,590 | 2,753 | |
| 5% 8/15/32 | 1,930 | 2,049 | |
| 5% 8/15/34 | 5,360 | 5,680 | |
| 5% 8/15/35 | 3,555 | 3,757 | |
| 5% 8/15/42 | 5,465 | 5,647 | |
| 5% 8/15/47 | 8,115 | 8,329 | |
| Tallahassee Health Facilities Rev.: | |||
| (Tallahassee Memorial Healthcare, Inc. Proj.) Series 2016 A, 5% 12/1/41 | 910 | 919 | |
| Series 2015 A, 5% 12/1/40 | 1,820 | 1,834 | |
| Volusia County Edl. Facilities Auth. Rev. (Embry-Riddle Aeronautical Univ., Inc. Proj.) Series 2020 A: | |||
| 5% 10/15/44 | 905 | 960 | |
| 5% 10/15/49 | 1,705 | 1,789 | |
| Volusia County School Board Ctfs. of Prtn. (Florida Master Lease Prog.) Series 2016 A: | |||
| 5% 8/1/29 (Build America Mutual Assurance Insured) | 830 | 863 | |
| 5% 8/1/32 (Build America Mutual Assurance Insured) | 4,140 | 4,298 | |
TOTAL FLORIDA | 289,387 | ||
| Georgia - 4.3% | |||
| Atlanta Arpt. Passenger Facilities Charge Rev. Series 2023 E, 5% 7/1/39 (d) | 3,230 | 3,586 | |
| Atlanta Arpt. Rev. Series 2019 B, 5% 7/1/25 (d) | 1,870 | 1,915 | |
| Burke County Indl. Dev. Auth. Poll. Cont. Rev. (Georgia Transmission Corp. Proj.) Series 2012, 2.75% 1/1/52 (b) | 4,320 | 3,068 | |
| Columbus Med. Ctr. Hosp. Auth. Bonds (Piedmont Healthcare, Inc. Proj.) Series 2019 B, 5%, tender 7/1/29 (b) | 6,900 | 7,523 | |
| Fulton County Dev. Auth. Rev. Series 2019, 4% 6/15/49 | 1,515 | 1,475 | |
| Gainesville & Hall County Hosp. Auth. Rev. Series 2020 A, 3% 2/15/47 | 13,420 | 10,710 | |
| Georgia Gen. Oblig. Series 2022 A: | |||
| 5% 7/1/33 | 6,885 | 8,320 | |
| 5% 7/1/35 | 24,240 | 29,138 | |
| Georgia Hsg. & Fin. Auth. Series 2021 A, 2.25% 12/1/36 | 2,750 | 2,290 | |
| Glynn-Brunswick Memorial Hosp. Auth. Rev. (Southeast Georgia Health Sys. Proj.) Series 2017: | |||
| 4% 8/1/43 | 1,860 | 1,742 | |
| 5% 8/1/39 | 1,705 | 1,721 | |
| 5% 8/1/43 | 2,275 | 2,306 | |
| Hosp. Auth. of Savannah Auth. Rev. Series 2019 A: | |||
| 4% 7/1/35 | 1,400 | 1,428 | |
| 4% 7/1/36 | 4,500 | 4,585 | |
| 4% 7/1/43 | 6,160 | 6,113 | |
| Main Street Natural Gas, Inc. Bonds: | |||
| Series 2021 A, 4%, tender 9/1/27 (b) | 25,000 | 25,147 | |
| Series 2021 C, 4%, tender 12/1/28 (b) | 23,425 | 23,585 | |
| Series 2023 C, 5%, tender 9/1/30 (b) | 23,910 | 25,579 | |
| Series 2023 D, 5%, tender 12/1/30 (b) | 35,455 | 37,708 | |
| Private Colleges & Univs. Auth. Rev.: | |||
| (Agnes Scott College) Series 2019 A, 5% 6/1/28 | 1,000 | 1,078 | |
| Series 2019 A, 5% 6/1/29 | 800 | 877 | |
TOTAL GEORGIA | 199,894 | ||
| Hawaii - 0.4% | |||
| Hawaii Arpts. Sys. Rev.: | |||
| Series 2018 A: | |||
5% 7/1/29 (d) | 1,055 | 1,138 | |
5% 7/1/30 (d) | 1,240 | 1,331 | |
5% 7/1/31 (d) | 1,215 | 1,302 | |
5% 7/1/32 (d) | 1,240 | 1,328 | |
5% 7/1/33 (d) | 1,265 | 1,354 | |
| Series 2022 A, 5% 7/1/42 (d) | 9,480 | 10,225 | |
| Hawaii Gen. Oblig. Series 2020 A, 4% 7/1/34 (d) | 750 | 780 | |
TOTAL HAWAII | 17,458 | ||
| Idaho - 0.0% | |||
| Idaho Hsg. & Fin. Assoc. Single Family Mtg. Series 2019 A, 4% 1/1/50 | 440 | 440 | |
| Illinois - 16.3% | |||
| Chicago Board of Ed.: | |||
| Series 2012 A, 5% 12/1/42 | 7,630 | 7,533 | |
| Series 2015 C, 5.25% 12/1/39 | 1,405 | 1,404 | |
| Series 2016 B, 6.5% 12/1/46 | 660 | 691 | |
| Series 2017 A, 7% 12/1/46 (e) | 2,320 | 2,499 | |
| Series 2017 C: | |||
5% 12/1/24 | 4,770 | 4,801 | |
5% 12/1/25 | 2,725 | 2,775 | |
5% 12/1/26 | 800 | 826 | |
5% 12/1/30 | 2,105 | 2,156 | |
5% 12/1/34 | 1,245 | 1,269 | |
| Series 2017 D: | |||
5% 12/1/24 | 1,030 | 1,037 | |
5% 12/1/31 | 3,565 | 3,649 | |
| Series 2017 H, 5% 12/1/36 | 95 | 96 | |
| Series 2018 A: | |||
5% 12/1/25 | 830 | 845 | |
5% 12/1/26 | 830 | 856 | |
5% 12/1/28 | 3,915 | 4,104 | |
5% 12/1/30 | 1,655 | 1,709 | |
5% 12/1/32 | 950 | 976 | |
5% 12/1/34 | 1,140 | 1,167 | |
5% 12/1/35 | 830 | 847 | |
| Series 2018 C, 5% 12/1/46 | 3,250 | 3,232 | |
| Series 2019 A: | |||
4% 12/1/27 | 5,000 | 5,019 | |
5% 12/1/27 | 1,625 | 1,695 | |
5% 12/1/28 | 2,910 | 3,050 | |
5% 12/1/28 | 2,000 | 2,096 | |
5% 12/1/33 | 1,300 | 1,350 | |
| Chicago Gen. Oblig.: | |||
| Series 2017 A, 6% 1/1/38 | 1,000 | 1,050 | |
| Series 2020 A: | |||
5% 1/1/27 | 430 | 450 | |
5% 1/1/29 | 3,175 | 3,409 | |
5% 1/1/30 | 3,555 | 3,861 | |
5% 1/1/31 | 3,760 | 4,068 | |
| Series 2021 A, 5% 1/1/32 | 5,335 | 5,835 | |
| Series 2023 A: | |||
5.25% 1/1/38 | 11,380 | 12,370 | |
5.5% 1/1/39 | 12,000 | 13,173 | |
5.5% 1/1/40 | 6,750 | 7,375 | |
| Chicago Midway Arpt. Rev.: | |||
| Series 2014 A: | |||
5% 1/1/28 (d) | 9,150 | 9,192 | |
5% 1/1/33 (d) | 4,450 | 4,470 | |
5% 1/1/34 (d) | 2,150 | 2,160 | |
| Series 2016 A, 5% 1/1/28 (d) | 1,655 | 1,696 | |
| Series 2016 B: | |||
4% 1/1/35 | 1,305 | 1,322 | |
5% 1/1/36 | 1,655 | 1,702 | |
5% 1/1/37 | 2,235 | 2,293 | |
| Chicago O'Hare Int'l. Arpt. Rev.: | |||
| Series 2015 A, 5% 1/1/31 (d) | 5,000 | 5,044 | |
| Series 2015 C, 5% 1/1/46 (d) | 1,985 | 1,991 | |
| Series 2016 B, 5% 1/1/34 | 5,050 | 5,239 | |
| Series 2016 C: | |||
5% 1/1/33 | 2,255 | 2,340 | |
5% 1/1/34 | 2,610 | 2,708 | |
| Series 2016 G: | |||
5% 1/1/37 (d) | 1,655 | 1,715 | |
5% 1/1/42 (d) | 1,655 | 1,697 | |
5.25% 1/1/29 (d) | 290 | 306 | |
5.25% 1/1/31 (d) | 330 | 348 | |
| Series 2017 A, 5% 1/1/31 | 2,925 | 3,112 | |
| Series 2017 B: | |||
5% 1/1/35 | 1,740 | 1,847 | |
5% 1/1/37 | 7,080 | 7,474 | |
| Series 2017 C: | |||
5% 1/1/30 | 495 | 527 | |
5% 1/1/31 | 495 | 527 | |
5% 1/1/32 | 540 | 574 | |
| Series 2017 D: | |||
5% 1/1/28 (d) | 2,475 | 2,602 | |
5% 1/1/29 (d) | 2,070 | 2,179 | |
5% 1/1/32 (d) | 2,235 | 2,344 | |
5% 1/1/34 (d) | 3,360 | 3,507 | |
5% 1/1/35 (d) | 2,485 | 2,590 | |
5% 1/1/36 (d) | 3,090 | 3,212 | |
5% 1/1/37 (d) | 1,655 | 1,715 | |
| Series 2018 A: | |||
5% 1/1/48 (d) | 2,215 | 2,282 | |
5% 1/1/53 (d) | 3,790 | 3,887 | |
| Chicago O'Hare Int'l. Arpt. Spl. Facilities Rev. Series 2018: | |||
| 5% 7/1/38 (d) | 2,185 | 2,248 | |
| 5% 7/1/48 (d) | 9,030 | 9,100 | |
| Chicago Transit Auth. Series 2017, 5% 12/1/46 | 3,395 | 3,481 | |
| Chicago Transit Auth. Cap. Grant Receipts Rev. Series 2017: | |||
| 5% 6/1/25 | 255 | 261 | |
| 5% 6/1/26 | 205 | 213 | |
| Cook County Gen. Oblig. Series 2016 A: | |||
| 5% 11/15/26 | 4,420 | 4,705 | |
| 5% 11/15/27 | 2,320 | 2,457 | |
| 5% 11/15/28 | 3,020 | 3,198 | |
| 5% 11/15/29 | 3,760 | 3,981 | |
| 5% 11/15/30 | 4,140 | 4,384 | |
| DuPage & Cook Counties Cmnty. Unit School District #205 Series 2021 A, 2% 1/1/39 | 4,200 | 3,191 | |
| Illinois Fin. Auth.: | |||
| Series 2020 A: | |||
3% 5/15/50 | 10,870 | 7,877 | |
3% 5/15/50 (Build America Mutual Assurance Insured) | 5,040 | 3,976 | |
3.25% 8/15/49 | 8,905 | 7,040 | |
| Series 2020, 5% 7/1/36 | 5,850 | 6,685 | |
| Series 2022 A, 5% 8/15/47 | 3,500 | 3,743 | |
| Illinois Fin. Auth. Rev.: | |||
| (Bradley Univ. Proj.) Series 2017 C: | |||
5% 8/1/29 | 1,090 | 1,150 | |
5% 8/1/30 | 760 | 801 | |
5% 8/1/32 | 1,015 | 1,067 | |
| (Depaul Univ. Proj.) Series 2016 A: | |||
4% 10/1/34 | 830 | 844 | |
5% 10/1/29 | 830 | 875 | |
5% 10/1/30 | 830 | 874 | |
| (OSF Healthcare Sys.) Series 2018 A: | |||
4.125% 5/15/47 | 25,725 | 25,323 | |
5% 5/15/43 | 34,525 | 36,050 | |
| (Presence Health Proj.) Series 2016 C: | |||
3.625% 2/15/32 | 950 | 951 | |
4% 2/15/33 | 225 | 231 | |
5% 2/15/29 | 5,110 | 5,415 | |
5% 2/15/36 | 1,535 | 1,602 | |
| (Rosalind Franklin Univ. Research Bldg. Proj.) Series 2017 C, 5% 8/1/46 | 830 | 839 | |
| (Rush Univ. Med. Ctr. Proj.) Series 2015 A, 5% 11/15/34 | 415 | 421 | |
| Series 2013: | |||
5% 11/15/28 | 2,380 | 2,382 | |
5% 11/15/29 | 1,160 | 1,161 | |
| Series 2015 A, 5% 11/15/35 | 1,985 | 2,020 | |
| Series 2015 C: | |||
4.125% 8/15/37 | 735 | 726 | |
5% 8/15/44 | 24,675 | 25,013 | |
| Series 2016 A: | |||
5% 2/15/29 | 4,255 | 4,436 | |
5% 2/15/30 | 4,490 | 4,680 | |
5% 7/1/30 (Pre-Refunded to 7/1/26 @ 100) | 590 | 624 | |
5% 2/15/31 | 3,620 | 3,773 | |
5% 2/15/32 | 3,520 | 3,669 | |
5% 8/15/35 (Pre-Refunded to 8/15/26 @ 100) | 420 | 443 | |
5% 8/15/36 (Pre-Refunded to 8/15/26 @ 100) | 1,685 | 1,776 | |
5.25% 8/15/31 (Pre-Refunded to 8/15/26 @ 100) | 495 | 525 | |
| Series 2016 B: | |||
5% 8/15/31 | 6,095 | 6,472 | |
5% 8/15/32 | 5,000 | 5,291 | |
5% 8/15/34 | 6,220 | 6,562 | |
5% 8/15/36 | 8,680 | 9,096 | |
| Series 2016 C: | |||
3.75% 2/15/34 | 1,215 | 1,220 | |
4% 2/15/36 | 5,160 | 5,255 | |
4% 2/15/41 | 20,725 | 20,507 | |
5% 2/15/31 | 12,595 | 13,316 | |
5% 2/15/32 | 3,660 | 3,864 | |
5% 2/15/34 | 2,920 | 3,072 | |
| Series 2016: | |||
4% 2/15/41 (Pre-Refunded to 2/15/27 @ 100) | 30 | 31 | |
5% 5/15/29 | 1,040 | 1,082 | |
5% 12/1/29 | 1,420 | 1,478 | |
5% 5/15/30 | 2,200 | 2,284 | |
5% 12/1/33 | 835 | 865 | |
5% 12/1/46 | 11,065 | 11,263 | |
| Series 2017 A, 5% 8/1/42 | 730 | 743 | |
| Series 2017: | |||
5% 1/1/29 | 2,775 | 2,972 | |
5% 7/1/34 | 4,640 | 4,962 | |
5% 7/1/35 | 3,900 | 4,162 | |
| Series 2019: | |||
4% 9/1/37 | 600 | 507 | |
4% 9/1/41 | 1,000 | 794 | |
5% 9/1/36 | 1,000 | 963 | |
| Illinois Gen. Oblig.: | |||
| Series 2014: | |||
5% 2/1/25 | 3,005 | 3,008 | |
5% 2/1/26 | 2,270 | 2,272 | |
5% 4/1/28 | 1,895 | 1,902 | |
5% 5/1/28 | 1,780 | 1,789 | |
5.25% 2/1/31 | 360 | 360 | |
| Series 2016: | |||
5% 6/1/26 | 995 | 1,040 | |
5% 2/1/27 | 5,585 | 5,912 | |
| Series 2018 A, 5% 10/1/28 | 230 | 251 | |
| Series 2020, 5.75% 5/1/45 | 3,865 | 4,254 | |
| Series 2021 A: | |||
5% 3/1/32 | 2,750 | 3,087 | |
5% 3/1/33 | 1,500 | 1,678 | |
5% 3/1/34 | 2,220 | 2,474 | |
5% 3/1/35 | 5,450 | 6,046 | |
5% 3/1/36 | 4,500 | 4,968 | |
5% 3/1/37 | 5,500 | 6,042 | |
5% 3/1/46 | 7,635 | 8,086 | |
| Series 2022 A: | |||
5% 3/1/29 | 4,600 | 5,046 | |
5% 3/1/32 | 4,490 | 5,108 | |
5% 3/1/33 | 6,690 | 7,581 | |
5% 3/1/34 | 5,110 | 5,765 | |
| Series 2022 B, 5% 10/1/34 | 16,015 | 18,141 | |
| Series 2023 B: | |||
5% 5/1/29 | 11,295 | 12,423 | |
5% 5/1/35 | 8,085 | 9,094 | |
5% 5/1/36 | 3,550 | 3,967 | |
5% 5/1/37 | 1,770 | 1,964 | |
5.25% 5/1/41 | 4,360 | 4,827 | |
5.25% 5/1/43 | 320 | 351 | |
| Illinois Hsg. Dev. Auth. Multi-family Hsg. Rev. Series 2019, 2.9% 7/1/35 | 5,931 | 5,390 | |
| Illinois Hsg. Dev. Auth. Rev. Series 2019 D, 2.7% 10/1/34 | 760 | 703 | |
| Illinois Muni. Elec. Agcy. Pwr. Supply Series 2015 A, 5% 2/1/31 | 3,370 | 3,456 | |
| Illinois Sales Tax Rev. Series 2021 A, 3% 6/15/33 (Build America Mutual Assurance Insured) | 4,230 | 3,947 | |
| Illinois Toll Hwy. Auth. Toll Hwy. Rev.: | |||
| Series 2016 A, 5% 12/1/31 | 5,825 | 6,070 | |
| Series 2019 A, 5% 1/1/44 | 1,260 | 1,364 | |
| Series A: | |||
5% 1/1/36 | 1,000 | 1,155 | |
5% 1/1/38 | 350 | 395 | |
5% 1/1/40 | 2,390 | 2,656 | |
| Kendall, Kane & Will Counties Cmnty. Unit School District #308 Series 2016: | |||
| 5% 2/1/34 | 5,795 | 5,960 | |
| 5% 2/1/35 | 4,140 | 4,250 | |
| 5% 2/1/36 | 7,120 | 7,294 | |
| Lake County Cmnty. Consolidated School District #73 Gen. Oblig. Series 2021, 2.25% 1/1/40 | 1,000 | 785 | |
| Metropolitan Pier & Exposition: | |||
| (McCormick Place Expansion Proj.): | |||
Series 2002 A, 0% 6/15/36 (Nat'l. Pub. Fin. Guarantee Corp. Insured) | 2,645 | 1,701 | |
Series 2010 B1: | |||
0% 6/15/43 (Assured Guaranty Muni. Corp. Insured) | 41,985 | 18,780 | |
0% 6/15/44 (Assured Guaranty Muni. Corp. Insured) | 8,205 | 3,471 | |
0% 6/15/45 (Assured Guaranty Muni. Corp. Insured) | 25,250 | 10,098 | |
0% 6/15/46 (Assured Guaranty Muni. Corp. Insured) | 2,890 | 1,087 | |
0% 6/15/47 (Assured Guaranty Muni. Corp. Insured) | 3,000 | 1,064 | |
Series 2012 B, 0% 12/15/51 | 10,845 | 2,892 | |
| Series 1996 A, 0% 6/15/24 | 2,535 | 2,493 | |
| Series 2002 A, 0% 6/15/35 (Nat'l. Pub. Fin. Guarantee Corp. Insured) | 1,690 | 1,143 | |
| Series 2002, 0% 12/15/36 (Nat'l. Pub. Fin. Guarantee Corp. Insured) | 13,280 | 8,328 | |
| Series 2017 B: | |||
5% 12/15/25 | 830 | 858 | |
5% 12/15/26 | 2,755 | 2,903 | |
5% 12/15/27 | 295 | 317 | |
5% 12/15/31 | 560 | 596 | |
5% 12/15/34 | 330 | 351 | |
| Series 2022 A: | |||
4% 12/15/42 | 7,330 | 7,326 | |
4% 12/15/47 | 560 | 540 | |
4% 6/15/52 | 2,000 | 1,882 | |
| Northern Illinois Univ. Revs. Series 2020 B: | |||
| 5% 4/1/26 (Build America Mutual Assurance Insured) | 1,400 | 1,450 | |
| 5% 4/1/28 (Build America Mutual Assurance Insured) | 1,300 | 1,390 | |
| 5% 4/1/30 (Build America Mutual Assurance Insured) | 1,000 | 1,089 | |
| 5% 4/1/32 (Build America Mutual Assurance Insured) | 1,295 | 1,399 | |
| Railsplitter Tobacco Settlement Auth. Rev. Series 2017: | |||
| 5% 6/1/27 (Pre-Refunded to 6/1/26 @ 100) | 4,345 | 4,579 | |
| 5% 6/1/28 (Pre-Refunded to 6/1/26 @ 100) | 2,275 | 2,397 | |
| Sales Tax Securitization Corp. Series 2023 C, 5% 1/1/32 | 7,305 | 8,387 | |
| Schaumburg Village Gen. Oblig. Series 2023: | |||
| 4% 12/1/30 | 2,235 | 2,376 | |
| 4% 12/1/31 | 2,350 | 2,513 | |
| Univ. of Illinois Rev. Series 2018 A, 5% 4/1/30 | 3,425 | 3,736 | |
| Will County Cmnty. Unit School District #365-U Series 2007 B, 0% 11/1/26 (Pre-Refunded to 11/1/26 @ 100) | 5,095 | 4,687 | |
TOTAL ILLINOIS | 761,541 | ||
| Indiana - 1.2% | |||
| Indiana Fin. Auth. Health Sys. Rev. Series 2016 A, 4% 11/1/51 | 20,960 | 18,897 | |
| Indiana Fin. Auth. Rev. Series 2016: | |||
| 5% 9/1/26 | 1,075 | 1,132 | |
| 5% 9/1/28 | 2,535 | 2,685 | |
| 5% 9/1/29 | 1,240 | 1,313 | |
| 5% 9/1/30 | 1,160 | 1,227 | |
| Indiana Hsg. & Cmnty. Dev. Auth. (Glasswater Creek of Whitestown Proj.) Series 2020, 5.375% 10/1/40 (e) | 2,045 | 1,685 | |
| Indianapolis Local Pub. Impt.: | |||
| (Indianapolis Arpt. Auth. Proj.) Series 2019 I, 5% 1/1/44 | 5,100 | 5,496 | |
| Series 2016: | |||
4% 1/1/32 (d) | 830 | 841 | |
4% 1/1/33 (d) | 830 | 839 | |
4% 1/1/34 (d) | 1,010 | 1,016 | |
4% 1/1/35 (d) | 2,300 | 2,303 | |
5% 1/1/26 (d) | 875 | 902 | |
| Purdue Univ. Rev. Series 2018 DD: | |||
| 5% 7/1/34 | 995 | 1,094 | |
| 5% 7/1/35 | 1,960 | 2,152 | |
| 5% 7/1/36 | 2,130 | 2,328 | |
| 5% 7/1/37 | 1,970 | 2,142 | |
| 5% 7/1/38 | 2,345 | 2,538 | |
| Saint Joseph County Econ. Dev. Auth. Rev. (St. Mary's College Proj.): | |||
| Series 2019: | |||
4% 4/1/38 | 260 | 261 | |
4% 4/1/46 | 6,035 | 5,634 | |
5% 4/1/43 | 460 | 482 | |
| Series 2020: | |||
4% 4/1/38 | 1,510 | 1,514 | |
5% 4/1/32 | 1,805 | 1,976 | |
TOTAL INDIANA | 58,457 | ||
| Iowa - 0.2% | |||
| Iowa Fin. Auth. Rev.: | |||
| Series 2019 A1, 4% 5/15/55 | 2,000 | 1,204 | |
| Series A: | |||
5% 5/15/43 | 1,145 | 922 | |
5% 5/15/48 | 1,885 | 1,438 | |
| Iowa Student Ln. Liquidity Corp. Student Ln. Rev. Series 2019 B: | |||
| 5% 12/1/26 (d) | 1,850 | 1,924 | |
| 5% 12/1/27 (d) | 1,965 | 2,076 | |
| Tobacco Settlement Auth. Tobacco Settlement Rev. Series 2021 B1, 4% 6/1/49 | 3,285 | 3,303 | |
TOTAL IOWA | 10,867 | ||
| Kentucky - 1.3% | |||
| Ashland Med. Ctr. Rev. Series 2019, 3% 2/1/40 (Assured Guaranty Muni. Corp. Insured) | 2,545 | 2,135 | |
| Kenton County Arpt. Board Arpt. Rev. Series 2016: | |||
| 5% 1/1/28 | 1,310 | 1,364 | |
| 5% 1/1/31 | 1,240 | 1,287 | |
| 5% 1/1/32 | 1,240 | 1,287 | |
| Kentucky Econ. Dev. Fin. Auth.: | |||
| Series 2019 A1: | |||
5% 8/1/35 | 1,000 | 1,086 | |
5% 8/1/44 | 1,000 | 1,041 | |
| Series 2019 A2, 5% 8/1/44 | 2,995 | 3,119 | |
| Kentucky State Property & Buildings Commission Rev. (Proj. No. 119) Series 2018: | |||
| 5% 5/1/26 | 830 | 873 | |
| 5% 5/1/29 | 4,510 | 4,932 | |
| 5% 5/1/32 | 1,185 | 1,296 | |
| 5% 5/1/33 | 915 | 1,000 | |
| 5% 5/1/34 | 1,045 | 1,138 | |
| 5% 5/1/35 | 615 | 665 | |
| 5% 5/1/36 | 520 | 561 | |
| Kentucky, Inc. Pub. Energy Bonds: | |||
| Series 2024 A1, 5.25%, tender 2/1/32 (b) | 13,375 | 14,577 | |
| Series A, 4%, tender 6/1/26 (b) | 10,000 | 9,946 | |
| Louisville & Jefferson County: | |||
| Bonds: | |||
Series 2020 C, 5%, tender 10/1/26 (b) | 1,695 | 1,771 | |
Series 2020 D, 5%, tender 10/1/29 (b) | 2,030 | 2,209 | |
| Series 2020 A: | |||
3% 10/1/43 | 8,660 | 6,788 | |
5% 10/1/37 | 2,405 | 2,559 | |
5% 10/1/38 | 2,300 | 2,434 | |
TOTAL KENTUCKY | 62,068 | ||
| Louisiana - 0.8% | |||
| Jefferson Parish Consolidated Wtrwks. District No. 2 Series 2022, 5% 2/1/42 (Build America Mutual Assurance Insured) | 10,390 | 11,428 | |
| Louisiana Hsg. Corp. Single Fami (Home Ownership Prog.) Series 2023 C, 5.75% 12/1/53 | 1,550 | 1,705 | |
| Louisiana Pub. Facilities Auth. Hosp. Rev. (Franciscan Missionaries of Our Lady Health Sys. Proj.) Series 2017 A, 5% 7/1/47 | 1,950 | 1,988 | |
| Louisiana Pub. Facilities Auth. Rev.: | |||
| (Tulane Univ. of Louisiana Proj.) Series 2016 A: | |||
5% 12/15/28 | 1,655 | 1,756 | |
5% 12/15/29 | 1,175 | 1,245 | |
5% 12/15/30 | 2,320 | 2,457 | |
| Series 2018 E: | |||
5% 7/1/37 | 1,615 | 1,729 | |
5% 7/1/38 | 1,260 | 1,343 | |
| New Orleans Aviation Board Rev.: | |||
| (North Term. Proj.): | |||
Series 2015 B: | |||
5% 1/1/29 (d) | 4,295 | 4,329 | |
5% 1/1/31 (d) | 2,070 | 2,084 | |
Series 2017 B: | |||
5% 1/1/27 (d) | 330 | 346 | |
5% 1/1/28 (d) | 205 | 214 | |
5% 1/1/32 (d) | 330 | 345 | |
5% 1/1/33 (d) | 580 | 606 | |
5% 1/1/34 (d) | 180 | 188 | |
5% 1/1/35 (d) | 330 | 344 | |
| Series 2017 D2: | |||
5% 1/1/27 (d) | 415 | 434 | |
5% 1/1/28 (d) | 595 | 622 | |
5% 1/1/31 (d) | 530 | 554 | |
5% 1/1/33 (d) | 850 | 887 | |
5% 1/1/34 (d) | 1,020 | 1,065 | |
5% 1/1/36 (d) | 775 | 806 | |
5% 1/1/37 (d) | 1,275 | 1,321 | |
TOTAL LOUISIANA | 37,796 | ||
| Maine - 0.9% | |||
| Brunswick Series 2020, 2.5% 11/1/39 | 720 | 597 | |
| Maine Health & Higher Edl. Facilities Auth. Rev.: | |||
| Series 2016 A: | |||
4% 7/1/41 | 1,935 | 1,782 | |
4% 7/1/46 | 3,180 | 2,753 | |
5% 7/1/41 | 8,620 | 8,636 | |
5% 7/1/46 | 22,975 | 21,551 | |
| Series 2017 B: | |||
4% 7/1/25 | 375 | 379 | |
4% 7/1/31 | 580 | 594 | |
4% 7/1/32 | 415 | 425 | |
4% 7/1/34 | 835 | 853 | |
5% 7/1/26 | 270 | 283 | |
5% 7/1/28 | 420 | 448 | |
5% 7/1/29 | 330 | 351 | |
5% 7/1/33 | 830 | 882 | |
5% 7/1/35 | 630 | 667 | |
| Maine Tpk. Auth. Tpk. Rev. Series 2015: | |||
| 5% 7/1/32 | 870 | 895 | |
| 5% 7/1/36 | 2,150 | 2,202 | |
| 5% 7/1/38 | 555 | 566 | |
TOTAL MAINE | 43,864 | ||
| Maryland - 1.5% | |||
| Anne Arundel County Gen. Oblig.: | |||
| Series 2012, 3% 10/1/36 | 3,625 | 3,564 | |
| Series 2021, 3% 10/1/37 | 1,970 | 1,906 | |
| Baltimore County Gen. Oblig. Series 2021, 3% 3/1/37 | 1,285 | 1,256 | |
| Baltimore Gen. Oblig. Series 2022 A: | |||
| 5% 10/15/36 | 1,015 | 1,204 | |
| 5% 10/15/38 | 2,935 | 3,417 | |
| 5% 10/15/39 | 3,085 | 3,569 | |
| 5% 10/15/42 | 3,315 | 3,781 | |
| City of Westminster Series 2016: | |||
| 5% 11/1/27 | 2,150 | 2,246 | |
| 5% 11/1/28 | 2,275 | 2,379 | |
| 5% 11/1/29 | 2,410 | 2,521 | |
| 5% 11/1/30 | 2,555 | 2,669 | |
| Maryland Cmnty. Dev. Admin Dept. Hsg. & Cmnty. Dev. Series 2019 B, 4% 9/1/49 | 1,960 | 1,957 | |
| Maryland Dept. of Trans. Series 2022 A, 5% 12/1/25 | 1,000 | 1,045 | |
| Maryland Econ. Dev. Auth. Rev. (Ports America Chesapeake LLC. Proj.) Series 2017 A: | |||
| 5% 6/1/30 | 1,035 | 1,102 | |
| 5% 6/1/35 | 1,655 | 1,751 | |
| Maryland Gen. Oblig. Series 2022 A, 5% 6/1/35 | 10,210 | 12,226 | |
| Maryland Health & Higher Edl. Series 2021 A, 3% 7/1/51 | 6,445 | 4,703 | |
| Maryland Health & Higher Edl. Facilities Auth. Rev. Series 2016 A: | |||
| 4% 7/1/42 | 1,430 | 1,361 | |
| 5% 7/1/35 | 575 | 594 | |
| Maryland Stadium Auth. Built to Learn Rev. Series 2021: | |||
| 4% 6/1/46 | 1,280 | 1,287 | |
| 4% 6/1/51 | 3,000 | 2,972 | |
| Washington Metropolitan Area Transit Auth.: | |||
| Series 2020 A, 5% 7/15/38 | 9,900 | 11,111 | |
| Series 2021 A, 5% 7/15/46 | 2,000 | 2,190 | |
TOTAL MARYLAND | 70,811 | ||
| Massachusetts - 3.8% | |||
| Massachusetts Bay Trans. Auth. Sales Tax Rev. Series 2021 A1: | |||
| 5% 7/1/32 | 2,235 | 2,647 | |
| 5% 7/1/33 | 2,500 | 2,959 | |
| 5% 7/1/34 | 1,260 | 1,482 | |
| 5% 7/1/35 | 3,180 | 3,713 | |
| Massachusetts Commonwealth Trans. Fund Rev. Series 2021 A, 5% 6/1/51 | 5,900 | 6,336 | |
| Massachusetts Dev. Fin. Agcy. Rev.: | |||
| (Lesley Univ. Proj.) Series 2016, 5% 7/1/39 | 1,360 | 1,379 | |
| (Partners Healthcare Sys., Inc. Proj.): | |||
Series 2017 S: | |||
5% 7/1/30 | 3,210 | 3,488 | |
5% 7/1/34 | 3,500 | 3,793 | |
Series 2017, 4% 7/1/41 | 8,280 | 8,328 | |
| (Univ. of Massachusetts Health Cr., Inc. Proj.) Series 2017 L, 4% 7/1/44 | 830 | 778 | |
| (Wentworth Institute of Technology Proj.) Series 2017: | |||
5% 10/1/27 | 830 | 858 | |
5% 10/1/28 | 875 | 906 | |
5% 10/1/29 | 920 | 952 | |
5% 10/1/31 | 1,015 | 1,048 | |
5% 10/1/32 | 1,065 | 1,098 | |
| Series 2016 I, 5% 7/1/41 | 1,925 | 1,949 | |
| Series 2016: | |||
5% 10/1/29 | 830 | 872 | |
5% 10/1/30 | 1,240 | 1,302 | |
5% 7/1/31 | 1,385 | 1,440 | |
5% 10/1/31 | 1,340 | 1,405 | |
5% 10/1/43 | 8,995 | 9,072 | |
| Series 2017: | |||
5% 7/1/34 | 1,325 | 1,369 | |
5% 7/1/35 | 1,000 | 1,031 | |
| Series 2019, 5% 9/1/59 | 6,925 | 7,314 | |
| Series 2020 A, 4% 7/1/45 | 12,200 | 10,774 | |
| Series 2022, 5% 10/1/37 | 1,720 | 2,003 | |
| Series M: | |||
4% 10/1/50 | 12,425 | 10,527 | |
5% 10/1/45 | 9,360 | 9,445 | |
| Massachusetts Edl. Fing. Auth. Rev. Series 2019 B: | |||
| 5% 7/1/27 (d) | 1,000 | 1,044 | |
| 5% 7/1/28 (d) | 1,915 | 2,033 | |
| Massachusetts Gen. Oblig.: | |||
| Series 2019 C, 5% 5/1/49 | 4,175 | 4,450 | |
| Series 2020 D, 5% 7/1/48 | 5,670 | 6,135 | |
| Series 2022 C, 5.25% 10/1/47 | 30,000 | 33,949 | |
| Massachusetts Port Auth. Rev.: | |||
| Series 2016 A: | |||
5% 7/1/33 | 1,740 | 1,834 | |
5% 7/1/34 | 895 | 943 | |
5% 7/1/38 | 1,300 | 1,355 | |
| Series 2016 B, 5% 7/1/43 (d) | 7,110 | 7,245 | |
| Series 2021 E: | |||
5% 7/1/38 (d) | 2,875 | 3,143 | |
5% 7/1/39 (d) | 4,480 | 4,871 | |
5% 7/1/40 (d) | 2,835 | 3,069 | |
5% 7/1/51 (d) | 10,000 | 10,480 | |
TOTAL MASSACHUSETTS | 178,819 | ||
| Michigan - 2.0% | |||
| Detroit Downtown Dev. Auth. Tax Series 2018 A, 5% 7/1/32 (Assured Guaranty Muni. Corp. Insured) | 1,000 | 1,007 | |
| Detroit Gen. Oblig. Series 2021 A, 5% 4/1/50 | 2,600 | 2,645 | |
| Flint Hosp. Bldg. Auth. Rev. Series 2020, 5% 7/1/38 | 1,515 | 1,562 | |
| Grand Traverse County Hosp. Fin. Auth. Series 2021, 3% 7/1/51 | 2,780 | 1,964 | |
| Great Lakes Wtr. Auth. Sew Disp. Sys. Series 2018 A: | |||
| 5% 7/1/43 | 2,030 | 2,142 | |
| 5% 7/1/48 | 8,725 | 9,096 | |
| Kalamazoo Hosp. Fin. Auth. Hosp. Facilities Rev. Series 2016: | |||
| 5% 5/15/28 | 1,945 | 2,027 | |
| 5% 5/15/28 (Pre-Refunded to 5/15/26 @ 100) | 10 | 11 | |
| Michigan Bldg. Auth. Rev. Series 2015 I: | |||
| 5% 4/15/30 | 3,960 | 4,120 | |
| 5% 4/15/30 (Pre-Refunded to 10/15/25 @ 100) | 180 | 187 | |
| Michigan Fin. Auth. Rev.: | |||
| (Charter County of Wayne Criminal Justice Ctr. Proj.) Series 2018, 5% 11/1/43 | 2,570 | 2,744 | |
| Series 2019 A: | |||
3% 12/1/49 | 3,935 | 3,096 | |
5% 11/15/48 | 2,105 | 2,187 | |
| Series 2020 A, 4% 6/1/49 | 2,545 | 2,350 | |
| Michigan Hosp. Fin. Auth. Rev. Series 2008 C: | |||
| 5% 12/1/32 | 1,110 | 1,197 | |
| 5% 12/1/32 (Pre-Refunded to 12/1/27 @ 100) | 130 | 142 | |
| Michigan Hsg. Dev. Auth. Single Family Mtg. Rev. Series A, 3.5% 12/1/50 | 1,510 | 1,490 | |
| Michigan State Hsg. Dev. Auth. Series 2021 A, 2.45% 10/1/46 | 4,870 | 3,433 | |
| Oakland Univ. Rev. Series 2019: | |||
| 5% 3/1/44 | 8,540 | 8,963 | |
| 5% 3/1/50 | 13,450 | 13,982 | |
| Portage Pub. Schools Series 2016: | |||
| 5% 11/1/30 | 2,365 | 2,477 | |
| 5% 11/1/31 | 2,090 | 2,184 | |
| 5% 11/1/36 | 205 | 213 | |
| Univ. of Michigan Rev. Series 2020 A, 5% 4/1/50 | 1,165 | 1,261 | |
| Wayne County Arpt. Auth. Rev.: | |||
| Series 2015 G, 5% 12/1/28 (d) | 4,555 | 4,650 | |
| Series 2017 A: | |||
4% 12/1/33 (Assured Guaranty Muni. Corp. Insured) | 1,230 | 1,273 | |
4% 12/1/34 (Assured Guaranty Muni. Corp. Insured) | 1,020 | 1,054 | |
4% 12/1/35 (Assured Guaranty Muni. Corp. Insured) | 995 | 1,025 | |
4% 12/1/36 (Assured Guaranty Muni. Corp. Insured) | 1,035 | 1,063 | |
5% 12/1/31 | 310 | 334 | |
5% 12/1/32 | 315 | 339 | |
5% 12/1/34 | 580 | 624 | |
5% 12/1/35 | 540 | 579 | |
5% 12/1/37 | 355 | 376 | |
| Series 2017 B: | |||
5% 12/1/29 (d) | 495 | 523 | |
5% 12/1/30 (d) | 580 | 610 | |
5% 12/1/31 (d) | 660 | 693 | |
5% 12/1/32 (d) | 420 | 446 | |
5% 12/1/32 (d) | 540 | 567 | |
5% 12/1/34 (d) | 495 | 522 | |
5% 12/1/35 (d) | 540 | 568 | |
5% 12/1/37 (d) | 705 | 734 | |
5% 12/1/42 (d) | 830 | 857 | |
| Series 2018 D, 5% 12/1/29 (d) | 3,645 | 3,932 | |
TOTAL MICHIGAN | 91,249 | ||
| Minnesota - 1.0% | |||
| Duluth Econ. Dev. Auth. Health Care Facilities Rev. Series 2018 A, 5% 2/15/48 | 6,000 | 6,108 | |
| Maple Grove Health Care Sys. Rev.: | |||
| Series 2015, 5% 9/1/29 | 2,345 | 2,403 | |
| Series 2017, 5% 5/1/25 | 660 | 672 | |
| Minnesota Higher Ed. Facilities Auth. Rev. Series 2018 A: | |||
| 5% 10/1/30 | 615 | 662 | |
| 5% 10/1/45 | 1,370 | 1,397 | |
| Minnesota Hsg. Fin. Agcy. Series 2023 F, 5.75% 7/1/53 | 1,045 | 1,128 | |
| Minnesota Muni. Gas Agcy. Rev. Bonds Series 2022 A, 4%, tender 12/1/27 (b) | 18,275 | 18,389 | |
| Minnesota Office of Higher Ed. Series 2023: | |||
| 5% 11/1/30 (d) | 3,800 | 4,152 | |
| 5% 11/1/31 (d) | 4,200 | 4,620 | |
| 5% 11/1/32 (d) | 4,400 | 4,877 | |
| Moorhead Edl. Facilities Rev. (The Concordia College Corp. Proj.) Series 2016, 5% 12/1/25 | 520 | 524 | |
| Shakopee Sr. Hsg. Rev. Bonds Series 2018, 5.85%, tender 11/1/25 (b)(e) | 3,665 | 3,556 | |
TOTAL MINNESOTA | 48,488 | ||
| Mississippi - 0.2% | |||
| Mississippi Bus. finance Corp. Exempt Facilities Rev. Bonds (Enviva, Inc. Proj.) Series 2022, 7.75%, tender 7/15/32 (b)(d) | 15,100 | 9,460 | |
| Missouri - 0.8% | |||
| Cape Girardeau County Indl. Dev. Auth. (Southeast Hosp. Proj.) Series 2017 A: | |||
| 5% 3/1/30 | 580 | 613 | |
| 5% 3/1/31 | 870 | 919 | |
| 5% 3/1/36 | 1,725 | 1,810 | |
| Kansas City Wtr. Rev. Series 2020 A, 4% 12/1/42 | 1,200 | 1,224 | |
| Missouri Health & Edl. Facilities Rev.: | |||
| Series 2015 B: | |||
3.125% 2/1/27 | 830 | 832 | |
3.25% 2/1/28 | 830 | 834 | |
5% 2/1/29 | 1,025 | 1,052 | |
5% 2/1/31 | 2,150 | 2,205 | |
5% 2/1/33 | 2,375 | 2,432 | |
5% 2/1/36 | 2,235 | 2,287 | |
| Series 2019 A: | |||
4% 10/1/48 | 2,850 | 2,807 | |
5% 10/1/46 | 5,575 | 5,937 | |
| Missouri Hsg. Dev. Commission Single Family Mtg. Rev.: | |||
| (First Place Homeownership Ln. Prog.) Series 2021 C, 3.25% 11/1/52 | 2,915 | 2,846 | |
| Series 2019, 4% 5/1/50 | 505 | 505 | |
| Saint Louis Arpt. Rev. Series 2019 C: | |||
| 5% 7/1/33 | 2,390 | 2,663 | |
| 5% 7/1/34 | 1,750 | 1,944 | |
| Saint Louis County Indl. Dev. Auth. Sr. Living Facilities Rev.: | |||
| Series 2017, 5% 9/1/48 | 1,000 | 872 | |
| Series 2018 A: | |||
5.125% 9/1/48 | 3,325 | 2,953 | |
5.125% 9/1/49 | 2,665 | 2,352 | |
TOTAL MISSOURI | 37,087 | ||
| Montana - 0.1% | |||
| Montana Board Hsg. Single Family: | |||
| Series 2017 B, 4% 12/1/48 (d) | 215 | 215 | |
| Series 2019 B, 4% 6/1/50 | 310 | 311 | |
| Montana Facility Fin. Auth. Series 2021 A, 3% 6/1/50 | 4,010 | 2,905 | |
TOTAL MONTANA | 3,431 | ||
| Nebraska - 0.7% | |||
| Central Plains Energy Proj. Rev. Bonds (Proj. No. 4) Series 2023 A1, 5%, tender 11/1/29 (b) | 15,135 | 16,044 | |
| Douglas County Neb Edl. Facilities Rev.: | |||
| (Creighton Univ. Proj.) Series 2017: | |||
4% 7/1/34 | 830 | 856 | |
5% 7/1/36 | 570 | 601 | |
| (Creighton Univ. Projs.) Series 2021 A, 3% 7/1/51 | 1,795 | 1,294 | |
| Nebraska Invt. Fin. Auth. Single Family Hsg. Rev.: | |||
| Series 2019 B, 4% 9/1/49 (d) | 1,405 | 1,397 | |
| Series 2019 E, 3.75% 9/1/49 (d) | 1,450 | 1,436 | |
| Series 2020 A, 3.5% 9/1/50 | 1,330 | 1,315 | |
| Nebraska Pub. Pwr. District Rev. Series 2016 B: | |||
| 5% 1/1/37 | 2,050 | 2,109 | |
| 5% 1/1/40 | 935 | 958 | |
| Omaha Arpt. Auth. Arpt. Rev. Series 2017 A: | |||
| 5% 12/15/25 (d) | 185 | 191 | |
| 5% 12/15/25 (Escrowed to Maturity) (d) | 145 | 151 | |
| 5% 12/15/26 (d) | 660 | 695 | |
| 5% 12/15/26 (Escrowed to Maturity) (d) | 530 | 564 | |
| 5% 12/15/27 (d) | 455 | 477 | |
| 5% 12/15/27 (Pre-Refunded to 12/15/26 @ 100) (d) | 375 | 399 | |
| 5% 12/15/30 (d) | 685 | 711 | |
| 5% 12/15/30 (Pre-Refunded to 12/15/26 @ 100) (d) | 555 | 590 | |
| 5% 12/15/31 (d) | 360 | 374 | |
| 5% 12/15/31 (Pre-Refunded to 12/15/26 @ 100) (d) | 290 | 308 | |
| 5% 12/15/33 (d) | 365 | 378 | |
| 5% 12/15/33 (Pre-Refunded to 12/15/26 @ 100) (d) | 295 | 314 | |
| 5% 12/15/35 (d) | 910 | 940 | |
| 5% 12/15/35 (Pre-Refunded to 12/15/26 @ 100) (d) | 745 | 792 | |
| 5% 12/15/36 (d) | 230 | 237 | |
| 5% 12/15/36 (Pre-Refunded to 12/15/26 @ 100) (d) | 190 | 202 | |
TOTAL NEBRASKA | 33,333 | ||
| Nevada - 0.2% | |||
| Clark County School District Series 2020 B, 3% 6/15/39 | 3,710 | 3,280 | |
| Nevada Hsg. Division Single Family Mtg. Rev. Series 2019 B, 4% 10/1/49 | 800 | 801 | |
| Tahoe-Douglas Visitors Auth. Series 2020: | |||
| 5% 7/1/40 | 1,000 | 1,027 | |
| 5% 7/1/45 | 2,605 | 2,637 | |
TOTAL NEVADA | 7,745 | ||
| New Hampshire - 2.0% | |||
| Nat'l. Fin. Auth. Hosp. Rev. (St. Luke's Univ. Health Network Proj.) Series 2021 B, 3% 8/15/51 (Assured Guaranty Muni. Corp. Insured) | 3,445 | 2,615 | |
| Nat'l. Fin. Auth. Rev. (Presbyterian Sr. Living Proj.) Series 2023 A, 5.25% 7/1/48 | 1,480 | 1,515 | |
| Nat'l. Finnance Auth.: | |||
| Series 2020 1, 4.125% 1/20/34 | 5,780 | 5,714 | |
| Series 2023 2A, 3.875% 1/20/38 | 10,547 | 10,211 | |
| New Hampshire Health & Ed. Facilities Auth.: | |||
| (Dartmouth-Hitchcock Oblgtd Grp Proj.) Series 2018 A: | |||
5% 8/1/28 | 895 | 959 | |
5% 8/1/29 | 855 | 916 | |
5% 8/1/30 | 850 | 908 | |
| (Partners Healthcare Sys., Inc. Proj.): | |||
Series 2017 5% 7/1/29 | 3,275 | 3,563 | |
Series 2017: | |||
5% 7/1/30 | 2,125 | 2,309 | |
5% 7/1/31 | 4,750 | 5,158 | |
5% 7/1/32 | 3,185 | 3,454 | |
5% 7/1/33 | 2,900 | 3,143 | |
5% 7/1/34 | 4,415 | 4,785 | |
5% 7/1/35 | 4,635 | 5,015 | |
5% 7/1/36 | 4,870 | 5,248 | |
5% 7/1/37 | 4,290 | 4,600 | |
| Series 2017, 5% 7/1/44 | 1,590 | 1,554 | |
| Series 2023 B, 5% 11/1/43 (d) | 3,615 | 3,945 | |
| New Hampshire Health & Ed. Facilities Auth. Rev.: | |||
| Series 2012: | |||
4% 7/1/32 | 2,295 | 2,295 | |
5% 7/1/24 | 830 | 831 | |
5% 7/1/25 | 980 | 981 | |
5% 7/1/27 | 415 | 415 | |
| Series 2016: | |||
4% 10/1/38 | 2,010 | 1,971 | |
5% 10/1/24 | 1,755 | 1,774 | |
5% 10/1/25 | 1,740 | 1,793 | |
5% 10/1/29 | 5,525 | 5,728 | |
5% 10/1/31 | 4,315 | 4,447 | |
5% 10/1/33 | 3,355 | 3,447 | |
5% 10/1/38 | 6,185 | 6,340 | |
TOTAL NEW HAMPSHIRE | 95,634 | ||
| New Jersey - 5.3% | |||
| Atlantic County Impt. Auth. (Atlantic City Campus Proj.) Series 2016 A: | |||
| 5% 7/1/28 (Assured Guaranty Muni. Corp. Insured) | 860 | 908 | |
| 5% 7/1/30 (Assured Guaranty Muni. Corp. Insured) | 2,105 | 2,215 | |
| 5% 7/1/32 (Assured Guaranty Muni. Corp. Insured) | 1,035 | 1,083 | |
| 5% 7/1/33 (Assured Guaranty Muni. Corp. Insured) | 1,075 | 1,126 | |
| Lyndhurst Township N J School District Series 2020, 2% 9/1/34 | 1,000 | 854 | |
| New Jersey Econ. Dev. Auth.: | |||
| (White Horse HMT Urban Renewal LLC Proj.) Series 2020, 5% 1/1/40 (e) | 1,000 | 700 | |
| Series 2015, 5.25% 6/15/27 | 6,525 | 6,725 | |
| Series A, 5% 11/1/40 | 8,915 | 9,600 | |
| Series QQQ, 4% 6/15/46 | 8,255 | 8,170 | |
| New Jersey Econ. Dev. Auth. Rev.: | |||
| (Black Horse EHT Urban Renewal LLC Proj.) Series 2019 A, 5% 10/1/39 (e) | 910 | 600 | |
| Series LLL, 5% 6/15/44 | 2,680 | 2,848 | |
| New Jersey Edl. Facility Series 2016 A: | |||
| 5% 7/1/31 | 1,740 | 1,807 | |
| 5% 7/1/32 | 1,985 | 2,060 | |
| New Jersey Gen. Oblig.: | |||
| Series 2020 A, 5% 6/1/29 | 3,685 | 4,158 | |
| Series 2021: | |||
2% 6/1/30 | 3,745 | 3,453 | |
2% 6/1/32 | 3,155 | 2,793 | |
2% 6/1/36 | 1,775 | 1,458 | |
| New Jersey Health Care Facilities Fing. Auth. Rev.: | |||
| Series 2016 A: | |||
5% 7/1/27 | 620 | 655 | |
5% 7/1/28 | 300 | 317 | |
5% 7/1/29 (Pre-Refunded to 7/1/26 @ 100) | 580 | 612 | |
5% 7/1/30 | 830 | 876 | |
| Series 2016: | |||
4% 7/1/48 | 2,400 | 2,205 | |
5% 7/1/41 | 2,865 | 2,899 | |
| New Jersey Higher Ed. Student Assistance Auth. Student Ln. Rev.: | |||
| Series 2017 1A, 5% 12/1/26 (d) | 830 | 864 | |
| Series 2018 B: | |||
5% 12/1/25 (d) | 3,495 | 3,593 | |
5% 12/1/26 (d) | 1,035 | 1,077 | |
| Series 2023 A: | |||
5% 12/1/31 (d) | 2,475 | 2,726 | |
5% 12/1/32 (d) | 2,475 | 2,747 | |
5% 12/1/33 (d) | 2,400 | 2,688 | |
| Series 2023 B: | |||
5% 12/1/30 (d) | 3,420 | 3,729 | |
5% 12/1/31 (d) | 4,610 | 5,078 | |
5% 12/1/32 (d) | 11,000 | 12,210 | |
| New Jersey Tobacco Settlement Fing. Corp. Series 2018 B, 5% 6/1/46 | 1,590 | 1,614 | |
| New Jersey Tpk. Auth. Tpk. Rev. Series 2022 B: | |||
| 4.25% 1/1/43 | 1,680 | 1,737 | |
| 4.5% 1/1/48 | 20,000 | 20,704 | |
| New Jersey Trans. Trust Fund Auth.: | |||
| (Trans. Prog.) Series 2019 AA, 5.25% 6/15/43 | 21,525 | 22,977 | |
| Series 2006 C: | |||
0% 12/15/30 (FGIC Insured) | 1,200 | 964 | |
0% 12/15/33 (Assured Guaranty Muni. Corp. Insured) | 7,625 | 5,586 | |
0% 12/15/34 | 1,220 | 863 | |
| Series 2008 A, 0% 12/15/38 | 1,500 | 852 | |
| Series 2010 A, 0% 12/15/27 | 9,485 | 8,373 | |
| Series 2014 BB2: | |||
5% 6/15/32 | 5,810 | 6,728 | |
5% 6/15/33 | 1,635 | 1,887 | |
5% 6/15/34 | 1,060 | 1,217 | |
| Series 2016 A: | |||
5% 6/15/27 | 2,250 | 2,363 | |
5% 6/15/29 | 1,865 | 1,961 | |
| Series 2019 BB, 4% 6/15/50 | 2,625 | 2,545 | |
| Series 2021 A, 5% 6/15/33 | 2,980 | 3,439 | |
| Series 2022 A: | |||
4% 6/15/39 | 5,030 | 5,152 | |
4% 6/15/40 | 5,410 | 5,508 | |
4% 6/15/42 | 7,290 | 7,363 | |
| Series 2022 AA: | |||
5% 6/15/32 | 8,500 | 10,004 | |
5% 6/15/34 | 7,460 | 8,698 | |
5% 6/15/36 | 2,215 | 2,549 | |
5% 6/15/37 | 4,235 | 4,844 | |
| Series A, 5% 12/15/33 | 680 | 762 | |
| Series AA: | |||
4% 6/15/35 | 1,500 | 1,572 | |
4% 6/15/40 | 1,680 | 1,707 | |
4% 6/15/45 | 7,950 | 7,930 | |
4% 6/15/50 | 4,865 | 4,717 | |
5% 6/15/35 | 490 | 555 | |
5% 6/15/39 | 3,000 | 3,322 | |
| Series BB, 5% 6/15/50 | 1,885 | 1,964 | |
| South Jersey Trans. Auth. Trans. Sys. Rev. Series 2022 A, 4.625% 11/1/47 | 3,500 | 3,619 | |
TOTAL NEW JERSEY | 246,910 | ||
| New Mexico - 0.0% | |||
| New Mexico Mtg. Fin. Auth. Series 2019 D, 3.75% 1/1/50 | 1,270 | 1,263 | |
| Santa Fe Retirement Fac. Series 2019 A: | |||
| 5% 5/15/34 | 275 | 264 | |
| 5% 5/15/39 | 205 | 186 | |
| 5% 5/15/44 | 215 | 188 | |
| 5% 5/15/49 | 425 | 354 | |
TOTAL NEW MEXICO | 2,255 | ||
| New York - 7.5% | |||
| Dorm. Auth. New York Univ. Rev.: | |||
| (Fordham Univ. Proj.) Series 2017: | |||
4% 7/1/33 | 1,035 | 1,070 | |
4% 7/1/34 | 1,035 | 1,069 | |
| Series 2017: | |||
5% 12/1/24 (e) | 1,100 | 1,104 | |
5% 12/1/25 (e) | 1,200 | 1,204 | |
| Hempstead Local Dev. Corp. Rev. (Hofstra Univ. Proj.) Series 2021 A, 3% 7/1/51 | 3,310 | 2,386 | |
| MTA Hudson Rail Yards Trust Oblig. Series 2016 A, 5% 11/15/56 | 26,320 | 26,319 | |
| New York City Edl. Construction Fund Series 2021 B, 5% 4/1/46 | 5,215 | 5,614 | |
| New York City Gen. Oblig. Series 2016 E, 5% 8/1/28 | 3,645 | 3,861 | |
| New York City Hsg. Dev. Corp. Multifamily Hsg.: | |||
| Series 2019 J, 3.05% 11/1/49 | 1,930 | 1,558 | |
| Series 2021 F1, 2.4% 11/1/46 | 2,680 | 1,886 | |
| New York City Muni. Wtr. Fin. Auth. Wtr. & Swr. Sys. Rev.: | |||
| Series 2022 EE, 5% 6/15/45 | 11,240 | 12,561 | |
| Series GG 1, 5% 6/15/48 | 3,500 | 3,770 | |
| New York City Transitional Fin. Auth. Series 2024: | |||
| 5% 11/1/31 (g) | 8,000 | 9,509 | |
| 5% 11/1/33 (g) | 8,000 | 9,834 | |
| New York City Transitional Fin. Auth. Bldg. Aid Rev. Series 2015 S2, 5% 7/15/35 | 1,465 | 1,500 | |
| New York City Transitional Fin. Auth. Rev. Series 2024 A1, 5% 5/1/42 | 4,870 | 5,574 | |
| New York Dorm. Auth. Rev. Series 2022 A: | |||
| 5% 7/15/37 | 785 | 839 | |
| 5% 7/15/42 | 2,210 | 2,290 | |
| 5% 7/15/50 | 5,710 | 5,787 | |
| New York Dorm. Auth. Sales Tax Rev. Series 2023 A1, 5% 3/15/41 | 26,245 | 30,169 | |
| New York Metropolitan Trans. Auth. Rev.: | |||
| Series 2014 B, 5% 11/15/44 | 8,280 | 8,291 | |
| Series 2015 A1, 5% 11/15/45 | 6,170 | 6,219 | |
| Series 2020 A1: | |||
4% 11/15/51 | 3,550 | 3,370 | |
4% 11/15/52 | 3,855 | 3,646 | |
| Series 2020 D: | |||
4% 11/15/46 | 39,325 | 38,066 | |
4% 11/15/47 | 2,710 | 2,611 | |
| New York State Dorm. Auth.: | |||
| Series 2019 D, 3% 2/15/49 | 7,555 | 6,063 | |
| Series 2021 E: | |||
3% 3/15/50 | 3,275 | 2,611 | |
4% 3/15/45 | 13,955 | 14,001 | |
| New York State Mtg. Agcy. Homeowner Mtg. Series 221, 3.5% 10/1/32 (d) | 610 | 600 | |
| New York State Urban Dev. Corp.: | |||
| Series 2020 A, 5% 3/15/42 | 2,000 | 2,215 | |
| Series 2020 E: | |||
3% 3/15/50 | 4,230 | 3,346 | |
4% 3/15/44 | 28,000 | 28,348 | |
4% 3/15/45 | 22,500 | 22,728 | |
| New York Trans. Dev. Corp.: | |||
| (Laguardia Arpt. Term. Redev. Proj.) Series 2016 A, 5% 7/1/41 (d) | 3,560 | 3,564 | |
| (Term. 4 John F. Kennedy Int'l. Arpt. Proj.) Series 2022: | |||
5% 12/1/32 (d) | 2,755 | 3,083 | |
5% 12/1/33 (d) | 4,270 | 4,773 | |
5% 12/1/34 (d) | 4,665 | 5,202 | |
5% 12/1/35 (d) | 2,330 | 2,583 | |
5% 12/1/36 (d) | 1,590 | 1,748 | |
5% 12/1/37 (d) | 4,240 | 4,616 | |
5% 12/1/38 (d) | 10,300 | 11,129 | |
5% 12/1/39 (d) | 7,875 | 8,455 | |
5% 12/1/40 (d) | 6,665 | 7,120 | |
5% 12/1/41 (d) | 6,060 | 6,423 | |
5% 12/1/42 (d) | 3,030 | 3,196 | |
| New York Urban Dev. Corp. Rev.: | |||
| (New York State Gen. Oblig. Proj.) Series 2017 A, 5% 3/15/34 | 5,215 | 5,573 | |
| Gen. Oblig. (New York State Gen. Oblig. Proj.) Series 2017 A, 5% 3/15/32 | 4,470 | 4,790 | |
| Oneida County Local Dev. Corp. Rev. (Mohawk Valley Health Sys. Proj.) Series 2019 A: | |||
| 4% 12/1/33 (Assured Guaranty Muni. Corp. Insured) | 1,200 | 1,231 | |
| 5% 12/1/31 (Assured Guaranty Muni. Corp. Insured) | 1,500 | 1,663 | |
| Onondaga Civic Dev. Corp. (Le Moyne College Proj.) Series 2018, 5% 1/1/43 | 830 | 848 | |
| Suffolk County Econ. Dev. Corp. Rev. Series 2021: | |||
| 4.625% 11/1/31 (e) | 750 | 676 | |
| 5.375% 11/1/54 (e) | 1,150 | 887 | |
| Triborough Bridge & Tunnel Auth. Revs. Series 2015 A, 5.25% 11/15/45 | 4,140 | 4,224 | |
TOTAL NEW YORK | 351,803 | ||
| New York And New Jersey - 0.2% | |||
| Port Auth. of New York & New Jersey: | |||
| Series 194, 5.25% 10/15/55 | 3,750 | 3,824 | |
| Series 2023 238: | |||
5% 7/15/38 (d) | 2,085 | 2,320 | |
5% 7/15/39 (d) | 1,275 | 1,410 | |
5% 7/15/40 (d) | 1,120 | 1,232 | |
TOTAL NEW YORK AND NEW JERSEY | 8,786 | ||
| North Carolina - 0.6% | |||
| Charlotte Ctfs. of Prtn. (Convention Facility Projs.) Series 2019 A: | |||
| 5% 6/1/44 | 4,000 | 4,303 | |
| 5% 6/1/46 | 2,120 | 2,270 | |
| Charlotte Int'l. Arpt. Rev.: | |||
| Series 2017 A: | |||
5% 7/1/30 | 1,265 | 1,372 | |
5% 7/1/33 | 1,040 | 1,125 | |
5% 7/1/37 | 2,910 | 3,116 | |
| Series 2017 B: | |||
5% 7/1/25 (d) | 85 | 87 | |
5% 7/1/26 (d) | 85 | 89 | |
5% 7/1/27 (d) | 160 | 170 | |
5% 7/1/28 (d) | 135 | 143 | |
5% 7/1/29 (d) | 195 | 207 | |
5% 7/1/30 (d) | 210 | 223 | |
5% 7/1/31 (d) | 395 | 419 | |
5% 7/1/32 (d) | 420 | 445 | |
5% 7/1/33 (d) | 440 | 465 | |
5% 7/1/34 (d) | 460 | 486 | |
5% 7/1/35 (d) | 315 | 332 | |
5% 7/1/36 (d) | 255 | 268 | |
5% 7/1/37 (d) | 300 | 314 | |
5% 7/1/42 (d) | 975 | 1,008 | |
| Series 2017 C, 4% 7/1/32 | 1,190 | 1,231 | |
| New Hanover County Hosp. Rev. Series 2017, 5% 10/1/27 (Escrowed to Maturity) | 275 | 298 | |
| North Carolina Grant Anticipation Rev. Series 2021, 2% 3/1/36 | 5,490 | 4,498 | |
| North Carolina Med. Care Commission Health Care Facilities Rev.: | |||
| Series 2020 A, 3% 7/1/45 | 2,590 | 2,097 | |
| Series 2021 A: | |||
4% 3/1/41 | 1,050 | 843 | |
4% 3/1/51 | 2,075 | 1,472 | |
| North Carolina State Ed. Assistance Auth. Student Ln. Rev. Series 2023 A, 5% 6/1/43 (d) | 1,095 | 1,134 | |
TOTAL NORTH CAROLINA | 28,415 | ||
| North Dakota - 0.1% | |||
| Univ. of North Dakota Series 2021 A, 3% 6/1/61 (Assured Guaranty Muni. Corp. Insured) | 5,480 | 3,891 | |
| Ohio - 2.1% | |||
| Akron Bath Copley Hosp. District Rev. Series 2016, 5.25% 11/15/46 | 7,285 | 7,394 | |
| Allen County Hosp. Facilities Rev. (Mercy Health) Series 2017 A: | |||
| 5% 8/1/25 | 2,475 | 2,549 | |
| 5% 8/1/26 | 1,645 | 1,730 | |
| 5% 8/1/27 | 2,060 | 2,212 | |
| 5% 8/1/28 | 2,060 | 2,238 | |
| 5% 8/1/29 | 4,130 | 4,482 | |
| 5% 8/1/30 | 3,520 | 3,818 | |
| Buckeye Tobacco Settlement Fing. Auth.: | |||
| Series 2020 A2: | |||
3% 6/1/48 | 3,870 | 2,982 | |
4% 6/1/48 | 1,265 | 1,168 | |
5% 6/1/30 | 2,000 | 2,196 | |
5% 6/1/32 | 1,665 | 1,824 | |
5% 6/1/33 | 2,000 | 2,189 | |
5% 6/1/34 | 420 | 459 | |
| Series 2020 B2, 5% 6/1/55 | 9,315 | 8,754 | |
| Columbus City School District Series 2016 A, 5% 12/1/29 | 1,740 | 1,838 | |
| Fairfield County Hosp. Facilities Rev. (Fairfield Med. Ctr. Proj.) Series 2013, 5.25% 6/15/43 | 3,470 | 3,253 | |
| Franklin County Convention Facilities Auth. (Greater Columbus Convention Ctr. Hotel Expansion Proj.) Series 2019: | |||
| 5% 12/1/44 | 470 | 448 | |
| 5% 12/1/46 | 4,700 | 4,986 | |
| 5% 12/1/51 | 6,900 | 7,269 | |
| Lancaster Port Auth. Gas Rev. Bonds Series 2019, 5%, tender 2/1/25 (b) | 1,850 | 1,874 | |
| Muskingum County Hosp. Facilities (Genesis Healthcare Sys. Obligated Group Proj.) Series 2013, 5% 2/15/33 | 3,685 | 3,685 | |
| Ohio Hosp. Rev. Series 2020 A, 4% 1/15/50 | 975 | 921 | |
| Ohio Hsg. Fin. Agcy. Residential Mtg. Rev.: | |||
| (Mtg. Backed Securities Prog.) Series 2019 B, 4.5% 3/1/50 | 395 | 399 | |
| (Mtg.-Backed Securities Prog.) Series 2023 B, 6% 3/1/55 | 2,525 | 2,809 | |
| Ohio Tpk. Commission Tpk. Rev.: | |||
| (Infrastructure Proj.) Series 2005 A, 0% 2/15/42 | 2,150 | 1,023 | |
| (Infrastructure Projs.) Series 2022 A: | |||
5% 2/15/32 | 4,930 | 5,838 | |
5% 2/15/38 | 1,155 | 1,340 | |
5% 2/15/39 | 240 | 276 | |
| Scioto County Hosp. Facilities Rev.: | |||
| Series 2016: | |||
5% 2/15/29 | 1,815 | 1,872 | |
5% 2/15/34 | 370 | 378 | |
| Series 2019, 5% 2/15/29 | 3,125 | 3,266 | |
| Univ. of Akron Gen. Receipts Series 2016 A, 5% 1/1/35 | 3,725 | 3,864 | |
| Washington County Hosp. Rev. Series 2022: | |||
| 6% 12/1/28 | 1,550 | 1,595 | |
| 6% 12/1/29 | 1,645 | 1,702 | |
| 6% 12/1/30 | 1,750 | 1,818 | |
| 6% 12/1/31 | 1,850 | 1,927 | |
TOTAL OHIO | 96,376 | ||
| Oklahoma - 0.2% | |||
| Oklahoma City Pub. Property Auth. Hotel Tax Rev. Series 2015: | |||
| 5% 10/1/28 | 1,050 | 1,089 | |
| 5% 10/1/29 | 1,160 | 1,203 | |
| 5% 10/1/36 | 830 | 852 | |
| 5% 10/1/39 | 1,655 | 1,683 | |
| Oklahoma Dev. Fin. Auth. Rev. (Oklahoma City Univ. Proj.) Series 2019, 5% 8/1/44 | 1,915 | 1,920 | |
| Oklahoma Hsg. Fin. Agcy. Single Family Mtg. Rev. (Homeownership Ln. Prog.) Series 2023 C, 6% 3/1/54 | 465 | 517 | |
TOTAL OKLAHOMA | 7,264 | ||
| Oregon - 1.1% | |||
| Lake Oswego Ore Series 2019 A: | |||
| 2.7% 6/1/37 | 1,850 | 1,661 | |
| 2.75% 6/1/38 | 1,960 | 1,720 | |
| Multnomah County School District #1J Portland Series 2020 B, 3% 6/15/36 | 1,525 | 1,488 | |
| Oregon Health and Science Univ. Spl. Rev. Series 2021 A, 3% 7/1/51 | 8,100 | 6,320 | |
| Oregon State Hsg. & Cmnty. Svcs. Dept.: | |||
| (Single Family Mtg. Prog.) Series A, 3.5% 1/1/51 | 1,800 | 1,779 | |
| (Single-Family Mtg. Prog.) Series 2019 A, 2.65% 7/1/39 | 1,065 | 901 | |
| Series 2019 A, 4% 7/1/50 | 4,590 | 4,580 | |
| Port of Portland Arpt. Rev.: | |||
| Series 2020 27A, 5% 7/1/45 (d) | 2,980 | 3,140 | |
| Series 2022 28: | |||
5% 7/1/41 (d) | 12,420 | 13,458 | |
5% 7/1/52 (d) | 10,500 | 11,045 | |
| Salem Hosp. Facility Auth. Rev.: | |||
| (Salem Health Projs.) Series 2019 A, 3% 5/15/49 | 5,975 | 4,510 | |
| Series 2016 A, 4% 5/15/41 | 1,680 | 1,682 | |
TOTAL OREGON | 52,284 | ||
| Pennsylvania - 8.2% | |||
| Allegheny County Arpt. Auth. Rev. Series 2021 A: | |||
| 4% 1/1/38 (d) | 2,545 | 2,557 | |
| 4% 1/1/39 (d) | 3,075 | 3,065 | |
| 4% 1/1/40 (d) | 10,000 | 9,956 | |
| 4% 1/1/41 (d) | 10,000 | 9,967 | |
| 5% 1/1/29 (d) | 4,185 | 4,528 | |
| 5% 1/1/30 (d) | 4,000 | 4,387 | |
| 5% 1/1/31 (d) | 3,000 | 3,331 | |
| 5% 1/1/32 (d) | 4,000 | 4,427 | |
| 5% 1/1/51 (d) | 20,480 | 21,306 | |
| 5% 1/1/56 (d) | 12,420 | 12,891 | |
| Allegheny County Indl. Dev. Auth. Rev. Series 2021: | |||
| 3.5% 12/1/31 | 1,200 | 981 | |
| 4% 12/1/41 | 2,450 | 1,704 | |
| 4.25% 12/1/50 | 2,730 | 1,764 | |
| Bucks County Indl. Dev. Auth. Hosp. Rev. Series 2021: | |||
| 5% 7/1/32 | 495 | 473 | |
| 5% 7/1/33 | 1,150 | 1,092 | |
| 5% 7/1/40 | 3,100 | 2,755 | |
| Cap. Region Wtr. Wtr. Rev. Series 2018: | |||
| 5% 7/15/27 | 830 | 897 | |
| 5% 7/15/29 | 1,290 | 1,419 | |
| 5% 7/15/32 | 830 | 908 | |
| Dauphin County Gen. Auth. (Pinnacle Health Sys. Proj.) Series 2016 A: | |||
| 5% 6/1/28 | 885 | 923 | |
| 5% 6/1/29 | 970 | 1,010 | |
| Delaware County Auth. Rev. (Cabrini College) Series 2017, 5% 7/1/47 | 3,310 | 3,344 | |
| Doylestown Hosp. Auth. Hosp. Rev. Series 2016 A: | |||
| 5% 7/1/46 | 980 | 850 | |
| 5% 7/1/46 (Pre-Refunded to 7/1/26 @ 100) | 225 | 237 | |
| Dubois Hosp. Auth. Hosp. Rev.: | |||
| (Penn Highlands Healthcare Proj.) Series 2018: | |||
4% 7/15/33 | 2,070 | 2,101 | |
4% 7/15/35 | 2,135 | 2,169 | |
4% 7/15/37 | 4,140 | 4,168 | |
5% 7/15/25 | 330 | 337 | |
5% 7/15/26 | 1,035 | 1,076 | |
5% 7/15/27 | 1,745 | 1,841 | |
5% 7/15/28 | 1,285 | 1,369 | |
5% 7/15/29 | 1,385 | 1,472 | |
5% 7/15/30 | 1,815 | 1,927 | |
5% 7/15/31 | 1,240 | 1,314 | |
5% 7/15/32 | 1,305 | 1,382 | |
5% 7/15/34 | 1,405 | 1,488 | |
5% 7/15/36 | 4,150 | 4,363 | |
5% 7/15/38 | 4,990 | 5,177 | |
5% 7/15/43 | 5,795 | 5,957 | |
| Series 2020, 4% 7/15/45 | 2,900 | 2,721 | |
| Lancaster County Hosp. Auth. Health Ctr. Rev. Series 2021, 5% 11/1/51 | 3,595 | 3,761 | |
| Lehigh County Gen. Purp. Auth. Rev. (Muhlenberg College Proj.) Series 2017, 5% 2/1/39 | 2,140 | 2,218 | |
| Monroe County Hosp. Auth. Rev. Series 2016: | |||
| 5% 7/1/26 | 830 | 866 | |
| 5% 7/1/27 | 830 | 868 | |
| 5% 7/1/28 | 830 | 867 | |
| 5% 7/1/34 | 3,045 | 3,140 | |
| 5% 7/1/36 | 1,655 | 1,701 | |
| Montgomery County Higher Ed. & Health Auth. Rev.: | |||
| Series 2014 A: | |||
5% 10/1/24 | 965 | 963 | |
5% 10/1/25 | 865 | 863 | |
5% 10/1/27 | 415 | 415 | |
| Series 2016 A: | |||
5% 10/1/28 | 1,255 | 1,255 | |
5% 10/1/29 | 2,150 | 2,151 | |
5% 10/1/31 | 3,790 | 3,788 | |
5% 10/1/36 | 6,790 | 6,757 | |
5% 10/1/40 | 4,700 | 4,551 | |
| Northampton County Gen. Purp. Auth. Hosp. Rev.: | |||
| (St. Luke's Univ. Health Network Proj.): | |||
Series 2016 A, 5% 8/15/36 | 615 | 636 | |
Series 2018 A, 4% 8/15/48 | 10,545 | 9,806 | |
| Series 2016 A, 5% 8/15/46 | 24,835 | 25,283 | |
| Pennsylvania Econ. Dev. Fing. Auth. Indl. Dev. Rev. (Presbyterian Sr. Living Proj.) Series 2023 B2, 5% 7/1/38 | 1,625 | 1,686 | |
| Pennsylvania Gen. Oblig. Series 2023, 5% 9/1/32 | 10,000 | 11,930 | |
| Pennsylvania Higher Edl. Facilities Auth. Rev.: | |||
| (Drexel Univ. Proj.): | |||
Series 2016, 5% 5/1/35 | 2,880 | 2,962 | |
Series 2017: | |||
5% 5/1/35 | 1,025 | 1,070 | |
5% 5/1/37 | 1,295 | 1,342 | |
5% 5/1/41 | 5,860 | 5,987 | |
| Series 2016: | |||
5% 5/1/28 | 415 | 429 | |
5% 5/1/32 | 1,040 | 1,072 | |
5% 5/1/33 | 1,405 | 1,445 | |
| Pennsylvania State Univ. Series 2020 A, 4% 9/1/50 | 2,950 | 2,912 | |
| Pennsylvania Tpk. Commission Tpk. Rev. Series 2021 B, 5% 12/1/38 | 6,680 | 7,574 | |
| Philadelphia Arpt. Rev.: | |||
| Series 2017 A: | |||
5% 7/1/25 | 830 | 856 | |
5% 7/1/26 | 830 | 878 | |
5% 7/1/27 | 660 | 714 | |
| Series 2017 B: | |||
5% 7/1/26 (d) | 2,485 | 2,586 | |
5% 7/1/27 (d) | 2,070 | 2,195 | |
5% 7/1/28 (d) | 2,485 | 2,622 | |
5% 7/1/29 (d) | 1,860 | 1,964 | |
5% 7/1/32 (d) | 2,485 | 2,621 | |
5% 7/1/33 (d) | 1,865 | 1,963 | |
5% 7/1/34 (d) | 3,310 | 3,475 | |
5% 7/1/37 (d) | 3,725 | 3,872 | |
| Philadelphia Auth. for Indl. Dev. Series 2017, 5% 11/1/47 | 5,425 | 5,518 | |
| Philadelphia Gas Works Rev. Series 16 A, 4% 8/1/45 (Assured Guaranty Muni. Corp. Insured) | 2,685 | 2,698 | |
| Philadelphia School District: | |||
| Series 2016 D: | |||
5% 9/1/26 | 7,600 | 8,016 | |
5% 9/1/27 | 8,020 | 8,412 | |
5% 9/1/28 | 6,705 | 7,020 | |
| Series 2016 F: | |||
5% 9/1/28 | 11,600 | 12,145 | |
5% 9/1/29 | 7,540 | 7,879 | |
| Series 2018 A: | |||
5% 9/1/36 | 1,575 | 1,677 | |
5% 9/1/37 | 910 | 964 | |
5% 9/1/38 | 1,450 | 1,529 | |
| Series 2018 B, 5% 9/1/43 | 2,115 | 2,221 | |
| Series 2019 A: | |||
4% 9/1/35 | 5,215 | 5,399 | |
5% 9/1/33 (Assured Guaranty Muni. Corp. Insured) | 2,480 | 2,770 | |
5% 9/1/34 | 7,225 | 7,942 | |
| Series 2019 C, 5% 9/1/33 | 2,540 | 2,823 | |
| Series F: | |||
5% 9/1/30 | 5,625 | 5,863 | |
5% 9/1/30 (Pre-Refunded to 9/1/26 @ 100) | 20 | 21 | |
| Philadelphia Wtr. & Wastewtr. Rev.: | |||
| Series 2018 A: | |||
5% 10/1/35 | 4,190 | 4,588 | |
5% 10/1/36 | 6,210 | 6,736 | |
5% 10/1/48 | 6,000 | 6,316 | |
| Series 2023 B, 5.5% 9/1/53 (Assured Guaranty Muni. Corp. Insured) | 4,210 | 4,821 | |
| Pittsburgh Wtr. & Swr. Auth. Wtr. & Swr. Sys. Rev.: | |||
| Series 2019 A, 5% 9/1/39 (Assured Guaranty Muni. Corp. Insured) | 2,315 | 2,539 | |
| Series 2019 A, 5% 9/1/44 (Assured Guaranty Muni. Corp. Insured) | 775 | 833 | |
| State Pub. School Bldg. Auth. Lease Rev. (The School District of Philadelphia Proj.) Series 2015 A, 5% 6/1/26 | 1,055 | 1,081 | |
| Union County Hosp. Auth. Rev. Series 2018 B: | |||
| 5% 8/1/43 | 4,605 | 4,772 | |
| 5% 8/1/48 | 5,335 | 5,488 | |
TOTAL PENNSYLVANIA | 385,749 | ||
| Puerto Rico - 1.6% | |||
| Puerto Rico Commonwealth Aqueduct & Swr. Auth.: | |||
| Series 2020 A, 5% 7/1/35 (e) | 3,435 | 3,467 | |
| Series 2021 B: | |||
4% 7/1/42 (e) | 1,085 | 957 | |
5% 7/1/33 (e) | 1,580 | 1,603 | |
5% 7/1/37 (e) | 6,625 | 6,654 | |
| Series 2022 A, 4% 7/1/42 (e) | 5,545 | 4,893 | |
| Puerto Rico Commonwealth Pub. Impt. Gen. Oblig. Series 2021 A1: | |||
| 0% 7/1/33 | 16,679 | 10,398 | |
| 4% 7/1/33 | 11,631 | 11,388 | |
| 4% 7/1/35 | 4,213 | 4,073 | |
| 5.625% 7/1/27 | 1,360 | 1,438 | |
| 5.625% 7/1/29 | 3,903 | 4,233 | |
| Puerto Rico Sales Tax Fing. Corp. Sales Tax Rev.: | |||
| Series 2018 A1: | |||
0% 7/1/31 | 9,290 | 6,799 | |
4.55% 7/1/40 | 2,000 | 2,010 | |
| Series 2019 A2, 4.329% 7/1/40 | 15,855 | 15,739 | |
TOTAL PUERTO RICO | 73,652 | ||
| Rhode Island - 0.5% | |||
| Rhode Island Health & Edl. Bldg. Corp. Higher Ed. Facilities Rev.: | |||
| Series 2016 B: | |||
5% 9/1/31 | 655 | 655 | |
5% 9/1/36 | 5,810 | 5,702 | |
| Series 2016, 5% 5/15/39 | 5,215 | 5,272 | |
| Rhode Island Hsg. & Mtg. Fin. Corp. Series 2019 70, 4% 10/1/49 | 800 | 800 | |
| Rhode Island Student Ln. Auth. Student Ln. Rev.: | |||
| Series 2021 A, 5% 12/1/28 (d) | 1,480 | 1,596 | |
| Series 2023 A, 5% 12/1/31 (d) | 4,830 | 5,366 | |
| Series A: | |||
3.5% 12/1/34 (d) | 1,200 | 1,138 | |
5% 12/1/25 (d) | 1,000 | 1,030 | |
TOTAL RHODE ISLAND | 21,559 | ||
| South Carolina - 1.5% | |||
| Charleston County Arpt. District Series 2019, 5% 7/1/43 | 2,085 | 2,229 | |
| Scago Edl. Facilities Corp. for Colleton School District (School District of Colleton County Proj.) Series 2015: | |||
| 5% 12/1/25 | 2,275 | 2,334 | |
| 5% 12/1/28 | 4,690 | 4,812 | |
| South Carolina Hsg. Fin. & Dev. Auth. Mtg. Rev.: | |||
| Series 2019 A, 4% 1/1/50 | 1,545 | 1,547 | |
| Series 2023 B, 6% 1/1/54 | 1,550 | 1,725 | |
| South Carolina Jobs-Econ. Dev. Auth. Series 2019 C: | |||
| 5% 7/1/32 | 1,010 | 1,101 | |
| 5% 7/1/33 | 4,200 | 4,566 | |
| South Carolina Ports Auth. Ports Rev. Series 2015, 5.25% 7/1/55 (Pre-Refunded to 7/1/25 @ 100) (d) | 910 | 936 | |
| South Carolina Pub. Svc. Auth. Rev.: | |||
| Series 2016 A: | |||
5% 12/1/29 | 2,485 | 2,588 | |
5% 12/1/38 | 250 | 255 | |
| Series 2016 B: | |||
5% 12/1/31 | 910 | 952 | |
5% 12/1/41 | 12,515 | 12,773 | |
| Spartanburg County Reg'l. Health Series 2017 A: | |||
| 4% 4/15/43 | 15,510 | 15,227 | |
| 4% 4/15/48 | 10,815 | 10,250 | |
| 5% 4/15/48 | 10,595 | 10,970 | |
TOTAL SOUTH CAROLINA | 72,265 | ||
| South Dakota - 0.1% | |||
| South Dakota Health & Edl. Facilities Auth. Rev.: | |||
| (Avera Health Proj.) Series 2017, 5% 7/1/31 | 540 | 582 | |
| Series 2017: | |||
5% 7/1/26 | 250 | 262 | |
5% 7/1/28 | 250 | 270 | |
5% 7/1/29 | 470 | 508 | |
| Series 2020 A, 3% 9/1/45 | 3,355 | 2,612 | |
TOTAL SOUTH DAKOTA | 4,234 | ||
| Tennessee - 0.5% | |||
| Chattanooga Health Ed. & Hsg. Facility Board Rev.: | |||
| Series 2019 A1: | |||
4% 8/1/44 | 2,200 | 2,169 | |
5% 8/1/31 | 1,000 | 1,094 | |
5% 8/1/33 | 1,250 | 1,367 | |
| Series 2019 A2, 5% 8/1/35 | 765 | 831 | |
| Metropolitan Nashville Arpt. Auth. Rev.: | |||
| Series 2015 B, 4% 7/1/25 (d) | 1,755 | 1,766 | |
| Series 2019 B, 5% 7/1/54 (d) | 9,580 | 9,883 | |
| Tennessee Hsg. Dev. Agcy.: | |||
| Series 2015 A, 3.5% 7/1/45 | 1,235 | 1,225 | |
| Series 2022 2, 5% 1/1/53 | 4,750 | 4,983 | |
| Tennessee Hsg. Dev. Agcy. Residential: | |||
| Series 2019 3: | |||
2.6% 7/1/39 | 415 | 343 | |
2.8% 7/1/44 | 505 | 402 | |
| Series 2019 4, 2.9% 7/1/39 | 300 | 261 | |
TOTAL TENNESSEE | 24,324 | ||
| Texas - 4.7% | |||
| Austin Arpt. Sys. Rev.: | |||
| Series 2014: | |||
5% 11/15/26 (d) | 830 | 836 | |
5% 11/15/27 (d) | 1,035 | 1,042 | |
5% 11/15/28 (d) | 1,240 | 1,248 | |
5% 11/15/39 (d) | 2,725 | 2,732 | |
| Series 2017 B: | |||
5% 11/15/28 (d) | 830 | 863 | |
5% 11/15/30 (d) | 1,275 | 1,321 | |
5% 11/15/32 (d) | 1,005 | 1,040 | |
5% 11/15/35 (d) | 1,035 | 1,068 | |
5% 11/15/36 (d) | 1,385 | 1,425 | |
5% 11/15/37 (d) | 1,165 | 1,194 | |
5% 11/15/41 (d) | 4,725 | 4,802 | |
| Brazos County Gen. Oblig. Series 2020: | |||
| 1.75% 9/1/34 | 1,380 | 1,137 | |
| 1.875% 9/1/35 | 700 | 573 | |
| Bryan Tex For Previous Issuess Series 2020, 2.125% 8/15/34 | 1,150 | 999 | |
| Central Reg'l. Mobility Auth. Series 2015 A: | |||
| 5% 1/1/28 | 1,075 | 1,110 | |
| 5% 1/1/31 (Pre-Refunded to 7/1/25 @ 100) | 395 | 407 | |
| Collin County Series 2022, 4% 2/15/39 | 1,800 | 1,873 | |
| Coppell Tex Series 2020, 1.375% 2/1/34 | 1,395 | 1,097 | |
| Dallas Wtrwks. & Swr. Sys. Rev. Series 2020 C: | |||
| 4% 10/1/35 | 1,000 | 1,072 | |
| 4% 10/1/39 | 5,000 | 5,186 | |
| 4% 10/1/40 | 2,000 | 2,061 | |
| Grand Parkway Trans. Corp.: | |||
| Series 2018 A, 5% 10/1/38 | 2,655 | 2,844 | |
| Series 2020 C, 4% 10/1/49 | 3,100 | 3,056 | |
| Harris County Cultural Ed. Facilities Fin. Corp. Rev. (Texas Childrens Hosp., Proj.) Series 2015-1 5% 10/1/29 | 1,115 | 1,155 | |
| Harris County Gen. Oblig. Series 2002: | |||
| 0% 8/15/25 (Nat'l. Pub. Fin. Guarantee Corp. Insured) | 2,485 | 2,366 | |
| 0% 8/15/28 (Nat'l. Pub. Fin. Guarantee Corp. Insured) | 4,140 | 3,628 | |
| Houston Arpt. Sys. Rev.: | |||
| Series 2018 A, 5% 7/1/41 (d) | 1,000 | 1,040 | |
| Series 2018 C: | |||
5% 7/1/29 (d) | 1,655 | 1,786 | |
5% 7/1/30 (d) | 1,765 | 1,889 | |
5% 7/1/31 (d) | 1,240 | 1,329 | |
5% 7/1/32 (d) | 1,450 | 1,553 | |
| Houston Gen. Oblig. Series 2017 A: | |||
| 5% 3/1/31 | 3,835 | 4,120 | |
| 5% 3/1/32 | 1,635 | 1,755 | |
| Houston Util. Sys. Rev. Series 2020 C: | |||
| 5% 11/15/33 | 2,000 | 2,308 | |
| 5% 11/15/34 | 2,500 | 2,878 | |
| Irving Hosp. Auth. Hosp. Rev. Series 2017 A: | |||
| 5% 10/15/28 | 390 | 406 | |
| 5% 10/15/30 | 1,570 | 1,630 | |
| 5% 10/15/32 | 830 | 859 | |
| 5% 10/15/36 | 545 | 560 | |
| 5% 10/15/37 | 930 | 953 | |
| 5% 10/15/38 | 1,325 | 1,354 | |
| 5% 10/15/44 | 1,310 | 1,327 | |
| Love Field Arpt. Modernization Rev.: | |||
| Series 2015: | |||
5% 11/1/26 (d) | 830 | 846 | |
5% 11/1/27 (d) | 1,780 | 1,817 | |
5% 11/1/28 (d) | 2,755 | 2,810 | |
5% 11/1/29 (d) | 1,655 | 1,685 | |
5% 11/1/32 (d) | 3,055 | 3,103 | |
| Series 2017: | |||
5% 11/1/24 (d) | 830 | 839 | |
5% 11/1/25 (d) | 830 | 853 | |
5% 11/1/26 (d) | 830 | 869 | |
5% 11/1/27 (d) | 830 | 866 | |
5% 11/1/28 (d) | 1,450 | 1,507 | |
5% 11/1/29 (d) | 1,035 | 1,075 | |
5% 11/1/30 (d) | 830 | 860 | |
5% 11/1/31 (d) | 1,840 | 1,900 | |
5% 11/1/32 (d) | 2,135 | 2,204 | |
5% 11/1/33 (d) | 830 | 856 | |
5% 11/1/34 (d) | 830 | 856 | |
5% 11/1/36 (d) | 830 | 851 | |
| Lower Colorado River Auth. Rev. Series 2015 D: | |||
| 5% 5/15/28 | 1,820 | 1,861 | |
| 5% 5/15/30 | 4,140 | 4,231 | |
| Mansfield Tex Series 2020, 2.25% 2/15/35 | 1,385 | 1,187 | |
| New Hope Cultural Ed. Facilities Fin. Corp. (Childrens Med. Ctr. of Dallas) Series 2017 A: | |||
| 5% 8/15/27 | 625 | 674 | |
| 5% 8/15/29 | 1,655 | 1,788 | |
| 5% 8/15/47 | 1,890 | 1,953 | |
| Newark Higher Ed. Fin. Corp. (Abilene Christian Univ. Proj.) Series 2016 A: | |||
| 5% 4/1/27 | 595 | 619 | |
| 5% 4/1/30 | 2,825 | 2,946 | |
| North Texas Tollway Auth. Rev.: | |||
| (Sr. Lien Proj.) Series 2017 A: | |||
5% 1/1/31 | 830 | 867 | |
5% 1/1/33 | 975 | 1,036 | |
5% 1/1/34 | 1,240 | 1,317 | |
5% 1/1/34 | 2,485 | 2,992 | |
5% 1/1/35 | 1,820 | 1,930 | |
5% 1/1/36 | 4,965 | 5,251 | |
5% 1/1/37 | 6,625 | 6,976 | |
| (Sub Lien Proj.) Series 2017 B: | |||
5% 1/1/30 | 350 | 363 | |
5% 1/1/31 | 495 | 513 | |
| Series 2015 A, 5% 1/1/32 | 2,775 | 2,821 | |
| Series 2016 A, 5% 1/1/36 | 1,035 | 1,074 | |
| Series 2021 B, 3% 1/1/51 | 16,575 | 12,617 | |
| Prosper Independent School District Series 2021 A, 3% 2/15/39 | 3,000 | 2,758 | |
| Southwest Higher Ed. Auth. Rev. (Southern Methodist Univ., TX. Proj.) Series 2017: | |||
| 5% 10/1/29 | 375 | 406 | |
| 5% 10/1/30 | 580 | 625 | |
| 5% 10/1/31 | 520 | 560 | |
| 5% 10/1/39 | 1,030 | 1,086 | |
| 5% 10/1/40 | 830 | 872 | |
| Tarrant County Cultural Ed. Facilities Fin. Corp. Rev.: | |||
| Series 2016 A, 4% 2/15/35 | 4,140 | 4,216 | |
| Series 2018 B, 5% 7/1/43 | 1,500 | 1,577 | |
| Texas Dept. of Hsg. & Cmnty. Affairs Multi-family Hsg. Rev. Series 2019, 2.95% 7/1/36 | 4,327 | 3,892 | |
| Texas Dept. of Hsg. & Cmnty. Affairs Residential Mtg. Rev. Series 2023 B, 6% 1/1/54 | 6,460 | 7,191 | |
| Texas Dept. of Hsg. & Cmnty. Affairs Single Family Mtg. Rev.: | |||
| Series 2019 A, 4% 3/1/50 | 3,150 | 3,153 | |
| Series A, 3.5% 3/1/51 | 2,945 | 2,899 | |
| Texas Gen. Oblig. Series 2022, 5% 8/1/34 (d) | 3,185 | 3,637 | |
| Texas Muni. Gas Acquisition & Su Bonds Series 2023 B, 5.5%, tender 1/1/34 (b) | 1,980 | 2,200 | |
| Texas State Univ. Sys. Fing. Rev. Series 2017 A: | |||
| 5% 3/15/29 | 3,530 | 3,801 | |
| 5% 3/15/31 | 2,690 | 2,883 | |
| Texas Wtr. Dev. Board Rev.: | |||
| Series 2020, 3% 8/1/39 | 1,165 | 1,065 | |
| Series 2021, 2.5% 10/15/39 | 3,000 | 2,525 | |
| Univ. of Houston Univ. Revs. Series 2017 A: | |||
| 5% 2/15/33 | 3,310 | 3,452 | |
| 5% 2/15/34 | 4,140 | 4,314 | |
| 5% 2/15/36 | 2,485 | 2,582 | |
| Univ. of North Texas Univ. Rev. Series 2017 A, 5% 4/15/32 | 1,740 | 1,862 | |
| Univ. of Texas Board of Regents Sys. Rev. Series 2019 A, 5% 8/15/29 | 1,850 | 2,108 | |
| Univ. of Texas Permanent Univ. Fund Rev. Series 2016 B, 5% 7/1/29 | 1,685 | 1,773 | |
| Waco Gen. Oblig. Series 2020: | |||
| 2% 2/1/34 | 3,395 | 2,929 | |
| 2.375% 2/1/38 | 1,035 | 877 | |
| Waller Independent School District Series 2020, 3% 2/15/39 | 1,850 | 1,693 | |
| Weatherford Independent School District Series 2002, 0% 2/15/33 | 5,785 | 4,323 | |
TOTAL TEXAS | 219,954 | ||
| Utah - 1.4% | |||
| Salt Lake City Arpt. Rev.: | |||
| Series 2017 A: | |||
5% 7/1/25 (d) | 1,655 | 1,692 | |
5% 7/1/27 (d) | 3,500 | 3,712 | |
5% 7/1/29 (d) | 3,090 | 3,268 | |
5% 7/1/30 (d) | 2,275 | 2,406 | |
5% 7/1/31 (d) | 4,345 | 4,592 | |
5% 7/1/33 (d) | 3,310 | 3,489 | |
5% 7/1/35 (d) | 3,310 | 3,474 | |
5% 7/1/36 (d) | 4,470 | 4,676 | |
5% 7/1/37 (d) | 3,520 | 3,668 | |
| Series 2018 A: | |||
5% 7/1/31 (d) | 2,000 | 2,144 | |
5% 7/1/32 (d) | 4,310 | 4,618 | |
5% 7/1/33 (d) | 1,420 | 1,521 | |
5.25% 7/1/48 (d) | 5,655 | 5,878 | |
| Series 2023 A, 5.25% 7/1/41 (d) | 2,000 | 2,215 | |
| Utah County Hosp. Rev. Series 2020 A: | |||
| 5% 5/15/43 | 5,500 | 5,963 | |
| 5% 5/15/50 | 9,000 | 9,535 | |
| Weber School District Utah (Utah School District Bond Guaranty Prog.) Series 2019, 2.25% 6/15/34 | 1,230 | 1,105 | |
TOTAL UTAH | 63,956 | ||
| Vermont - 0.6% | |||
| Vermont Edl. & Health Bldg. Fin. Agcy. Rev.: | |||
| (Champlain College Proj.) Series 2016 A: | |||
5% 10/15/41 | 3,810 | 3,651 | |
5% 10/15/46 | 4,720 | 4,339 | |
| (Middlebury College Proj.) Series 2020, 5% 11/1/49 | 18,500 | 19,668 | |
| Vermont Student Assistant Corp. Ed. Ln. Rev. Series 2019 A, 5% 6/15/28 (d) | 1,430 | 1,514 | |
TOTAL VERMONT | 29,172 | ||
| Virginia - 0.5% | |||
| Fredericksburg Econ. Dev. Auth. Rev. Series 2014: | |||
| 5% 6/15/25 | 3,860 | 3,881 | |
| 5% 6/15/30 | 1,035 | 1,042 | |
| Lynchburg Econ. Dev. Series 2021, 3% 1/1/51 | 3,000 | 2,234 | |
| Stafford County Econ. Dev. Auth. Hosp. Facilities Rev.: | |||
| (Mary Washington Hosp. Proj.) Series 2016, 3% 6/15/29 | 525 | 522 | |
| Series 2016: | |||
4% 6/15/37 �� | 595 | 597 | |
5% 6/15/27 | 1,240 | 1,293 | |
5% 6/15/30 | 540 | 560 | |
5% 6/15/33 | 350 | 361 | |
5% 6/15/34 | 665 | 685 | |
5% 6/15/35 | 1,820 | 1,871 | |
| Virginia Commonwealth Trans. Board Rev. (Virginia Gen. Oblig. Proj.) Series 2017 A, 5% 5/15/32 | 725 | 788 | |
| Virginia Pub. Bldg. Auth. Pub. Facilities Rev. Series 2019 A, 4% 8/1/36 | 4,505 | 4,731 | |
| Winchester Econ. Dev. Auth. Series 2015: | |||
| 5% 1/1/31 | 2,070 | 2,143 | |
| 5% 1/1/34 | 1,240 | 1,281 | |
| 5% 1/1/35 | 1,240 | 1,281 | |
| 5% 1/1/44 | 830 | 846 | |
TOTAL VIRGINIA | 24,116 | ||
| Washington - 2.9% | |||
| Port of Seattle Rev.: | |||
| Series 2016 B: | |||
5% 10/1/28 (d) | 2,900 | 3,005 | |
5% 10/1/30 (d) | 1,655 | 1,706 | |
| Series 2019 A, 4% 4/1/44 (d) | 2,525 | 2,451 | |
| Washington Convention Ctr. Pub. Facilities: | |||
| Series 2021 B: | |||
3% 7/1/43 | 865 | 705 | |
3% 7/1/58 (Assured Guaranty Muni. Corp. Insured) | 12,930 | 9,451 | |
| Series 2021, 4% 7/1/31 | 17,595 | 17,513 | |
| Washington Gen. Oblig.: | |||
| Series 2020 A, 5% 8/1/33 | 1,260 | 1,423 | |
| Series 2021 C, 5% 2/1/44 | 270 | 299 | |
| Series 2022 A, 5% 8/1/37 | 33,745 | 39,414 | |
| Series 2022 C, 4% 7/1/35 | 4,200 | 4,570 | |
| Series 2022 D: | |||
4% 7/1/35 | 1,800 | 1,959 | |
4% 7/1/36 | 5,735 | 6,168 | |
4% 7/1/37 | 4,000 | 4,259 | |
| Series R-2017 A, 5% 8/1/30 | 1,685 | 1,780 | |
| Washington Health Care Facilities Auth. Rev.: | |||
| (Overlake Hosp. Med. Ctr., WA. Proj.) Series 2017 B: | |||
5% 7/1/25 | 675 | 684 | |
5% 7/1/27 | 1,285 | 1,330 | |
5% 7/1/28 | 1,570 | 1,636 | |
5% 7/1/29 | 615 | 641 | |
5% 7/1/30 | 735 | 766 | |
5% 7/1/31 | 1,120 | 1,167 | |
5% 7/1/32 | 1,655 | 1,723 | |
5% 7/1/33 | 2,345 | 2,438 | |
5% 7/1/34 | 540 | 560 | |
5% 7/1/42 | 4,685 | 4,772 | |
| Series 2019 A1, 5% 8/1/38 | 1,000 | 1,062 | |
| Series 2019 A2, 5% 8/1/33 | 2,000 | 2,188 | |
| Washington Higher Ed. Facilities Auth. Rev.: | |||
| (Gonzaga Univ. Proj.) Series 2019 A, 3% 4/1/49 | 5,005 | 3,670 | |
| (Whitworth Univ. Proj.): | |||
Series 2016 A: | |||
5% 10/1/27 | 1,770 | 1,845 | |
5% 10/1/28 | 1,825 | 1,905 | |
5% 10/1/35 | 1,880 | 1,944 | |
5% 10/1/36 | 2,845 | 2,933 | |
5% 10/1/40 | 2,795 | 2,847 | |
Series 2019, 4% 10/1/49 | 3,515 | 3,103 | |
| Washington Hsg. Fin. Commission Nonprofit Hsg. Rev. (Judson Park Proj.) Series 2018: | |||
| 4% 7/1/28 (e) | 100 | 96 | |
| 5% 7/1/33 (e) | 125 | 124 | |
| 5% 7/1/38 (e) | 100 | 95 | |
| 5% 7/1/48 (e) | 400 | 346 | |
| Washington Hsg. Fin. Commission Nonprofit Rev. (Seattle Academy of Arts and Sciences Proj.) Series 2023, 6.375% 7/1/63 (e) | 4,125 | 4,501 | |
TOTAL WASHINGTON | 137,079 | ||
| West Virginia - 0.1% | |||
| West Virginia Hosp. Fin. Auth. Hosp. Rev. Series 2018 A: | |||
| 5% 1/1/31 | 1,355 | 1,394 | |
| 5% 1/1/32 | 1,120 | 1,151 | |
| West Virginia Hsg. Dev. Fund Series 2018 A, 3.45% 11/1/33 | 1,250 | 1,251 | |
TOTAL WEST VIRGINIA | 3,796 | ||
| Wisconsin - 1.7% | |||
| Blue Ridge Healthcare Pub. Fin. Auth. Series 2020 A: | |||
| 5% 1/1/35 | 1,210 | 1,299 | |
| 5% 1/1/40 | 540 | 563 | |
| Howard Suamico Scd Series 2021, 2% 3/1/38 | 1,780 | 1,380 | |
| Kohler Wis School District Series 2021, 2% 3/1/39 | 1,230 | 930 | |
| Pub. Fin. Auth. Hosp. Rev.: | |||
| (Renown Reg'l. Med. Ctr. Proj.) Series 2020 A, 5% 6/1/29 | 820 | 884 | |
| Series 2019 A, 5% 10/1/44 | 7,550 | 7,886 | |
| Series 2020 A, 3% 6/1/45 | 9,350 | 7,276 | |
| Pub. Fin. Auth. Sr. Living Rev. (Mary's Woods At Marylhurst, Inc. Proj.) Series 2017 A: | |||
| 5% 5/15/25 (e) | 700 | 695 | |
| 5% 5/15/28 (e) | 1,095 | 1,078 | |
| 5.25% 5/15/37 (e) | 415 | 398 | |
| 5.25% 5/15/42 (e) | 415 | 385 | |
| 5.25% 5/15/47 (e) | 410 | 370 | |
| 5.25% 5/15/52 (e) | 775 | 684 | |
| Pub. Fin. Auth. Wisconsin Retirement Facility Rev. Series 2018: | |||
| 5% 10/1/43 (e) | 945 | 824 | |
| 5% 10/1/48 (e) | 1,055 | 886 | |
| 5% 10/1/53 (e) | 2,330 | 1,912 | |
| Roseman Univ. of Health: | |||
| Series 2020: | |||
5% 4/1/40 (e) | 720 | 696 | |
5% 4/1/40 (Pre-Refunded to 4/1/30 @ 100) (e) | 30 | 34 | |
5% 4/1/50 (e) | 520 | 471 | |
| Series 2021 A: | |||
3% 7/1/50 | 2,640 | 2,005 | |
4.5% 6/1/56 (e) | 14,095 | 10,885 | |
| Series 2021 B, 6.5% 6/1/56 (e) | 4,700 | 3,923 | |
| Westosha Cent High School District Series 2021: | |||
| 1.625% 3/1/32 | 1,010 | 841 | |
| 2% 3/1/35 | 1,000 | 852 | |
| 2% 3/1/36 | 1,005 | 836 | |
| Wisconsin Health & Edl. Facilities: | |||
| Series 2013 B2, 4% 11/15/43 | 3,890 | 3,804 | |
| Series 2014, 4% 5/1/33 | 2,920 | 2,925 | |
| Series 2016 A: | |||
5% 2/15/28 | 1,965 | 2,025 | |
5% 2/15/29 | 2,550 | 2,627 | |
5% 2/15/30 | 2,805 | 2,887 | |
| Series 2016, 4% 12/1/46 | 4,350 | 4,267 | |
| Series 2017 A: | |||
4% 4/1/39 | 2,140 | 2,131 | |
5% 9/1/31 (Pre-Refunded to 9/1/27 @ 100) | 830 | 897 | |
5% 9/1/33 (Pre-Refunded to 9/1/27 @ 100) | 1,425 | 1,540 | |
5% 9/1/35 (Pre-Refunded to 9/1/27 @ 100) | 1,575 | 1,702 | |
| Series 2019 A, 5% 11/1/46 | 540 | 435 | |
| Series 2019 B1, 2.825% 11/1/28 | 1,245 | 1,117 | |
| Wisconsin Rapids School District Series 2021: | |||
| 1.7% 4/1/32 | 1,600 | 1,365 | |
| 2% 4/1/38 | 2,100 | 1,567 | |
TOTAL WISCONSIN | 77,282 | ||
| TOTAL MUNICIPAL BONDS (Cost $4,657,601) | 4,611,585 | ||
| Money Market Funds - 0.6% | |||
| Shares | Value ($) (000s) | ||
Fidelity Municipal Cash Central Fund 4.24% (h)(i) (Cost $30,158) | 30,153,291 | 30,159 | |
| TOTAL INVESTMENT IN SECURITIES - 99.2% (Cost $4,687,759) | 4,641,744 |
NET OTHER ASSETS (LIABILITIES) - 0.8% | 36,185 |
| NET ASSETS - 100.0% | 4,677,929 |
| (a) | Amount is stated in United States dollars unless otherwise noted. |
| (b) | Coupon rates for floating and adjustable rate securities reflect the rates in effect at period end. |
| (c) | Coupon is indexed to a floating interest rate which may be multiplied by a specified factor and/or subject to caps or floors. |
| (d) | Private activity obligations whose interest is subject to the federal alternative minimum tax for individuals. |
| (e) | Security exempt from registration under Rule 144A of the Securities Act of 1933. These securities may be resold in transactions exempt from registration, normally to qualified institutional buyers. At the end of the period, the value of these securities amounted to $81,116,000 or 1.7% of net assets. |
| (f) | Security initially issued in zero coupon form which converts to coupon form at a specified rate and date. The rate shown is the rate at period end. |
| (g) | Security or a portion of the security purchased on a delayed delivery or when-issued basis. |
| (h) | Information in this report regarding holdings by state and security types does not reflect the holdings of the Fidelity Municipal Cash Central Fund. |
| (i) | Affiliated fund that is generally available only to investment companies and other accounts managed by Fidelity Investments. The rate quoted is the annualized seven-day yield of the fund at period end. A complete unaudited listing of the fund's holdings as of its most recent quarter end is available upon request. In addition, each Fidelity Central Fund's financial statements, which are not covered by the Fund's Report of Independent Registered Public Accounting Firm, are available on the SEC's website or upon request. |
| Affiliate (Amounts in thousands) | Value, beginning of period ($) | Purchases ($) | Sales Proceeds ($) | Dividend Income ($) | Realized Gain (loss) ($) | Change in Unrealized appreciation (depreciation) ($) | Value, end of period ($) | % ownership, end of period |
| Fidelity Municipal Cash Central Fund 4.24% | 111,110 | 483,007 | 563,966 | 4,396 | - | 8 | 30,159 | 1.2% |
| Total | 111,110 | 483,007 | 563,966 | 4,396 | - | 8 | 30,159 | |
| Valuation Inputs at Reporting Date: | ||||
Description (Amounts in thousands) | Total ($) | Level 1 ($) | Level 2 ($) | Level 3 ($) |
Investments in Securities: | ||||
| Municipal Securities | 4,611,585 | - | 4,611,585 | - |
| Money Market Funds | 30,159 | 30,159 | - | - |
| Total Investments in Securities: | 4,641,744 | 30,159 | 4,611,585 | - |
| Statement of Assets and Liabilities | ||||
| Amounts in thousands (except per-share amounts) | December 31, 2023 | |||
| Assets | ||||
| Investment in securities, at value - See accompanying schedule: | ||||
Unaffiliated issuers (cost $4,657,601) | $ | 4,611,585 | ||
Fidelity Central Funds (cost $30,158) | 30,159 | |||
| Total Investment in Securities (cost $4,687,759) | $ | 4,641,744 | ||
| Cash | 100 | |||
| Receivable for fund shares sold | 7,940 | |||
| Interest receivable | 60,568 | |||
| Distributions receivable from Fidelity Central Funds | 134 | |||
| Prepaid expenses | 4 | |||
Total assets | 4,710,490 | |||
| Liabilities | ||||
| Payable for investments purchased on a delayed delivery basis | $ | 18,817 | ||
| Payable for fund shares redeemed | 8,019 | |||
| Distributions payable | 3,693 | |||
| Accrued management fee | 1,331 | |||
| Distribution and service plan fees payable | 92 | |||
| Other affiliated payables | 498 | |||
| Other payables and accrued expenses | 111 | |||
| Total Liabilities | 32,561 | |||
| Net Assets | $ | 4,677,929 | ||
| Net Assets consist of: | ||||
| Paid in capital | $ | 4,759,224 | ||
| Total accumulated earnings (loss) | (81,295) | |||
| Net Assets | $ | 4,677,929 | ||
| Net Asset Value and Maximum Offering Price | ||||
| Class A : | ||||
Net Asset Value and redemption price per share ($285,414 ÷ 23,134 shares)(a) | $ | 12.34 | ||
| Maximum offering price per share (100/96.00 of $12.34) | $ | 12.85 | ||
| Class M : | ||||
Net Asset Value and redemption price per share ($76,093 ÷ 6,162 shares)(a) | $ | 12.35 | ||
| Maximum offering price per share (100/96.00 of $12.35) | $ | 12.86 | ||
| Class C : | ||||
Net Asset Value and offering price per share ($22,521 ÷ 1,825 shares)(a) | $ | 12.34 | ||
| Fidelity Municipal Income Fund : | ||||
Net Asset Value, offering price and redemption price per share ($2,783,280 ÷ 225,439 shares) | $ | 12.35 | ||
| Class I : | ||||
Net Asset Value, offering price and redemption price per share ($1,155,918 ÷ 93,688 shares) | $ | 12.34 | ||
| Class Z : | ||||
Net Asset Value, offering price and redemption price per share ($354,703 ÷ 28,740 shares) | $ | 12.34 | ||
(a)Redemption price per share is equal to net asset value less any applicable contingent deferred sales charge. | ||||
| Statement of Operations | ||||
| Amounts in thousands | Year ended December 31, 2023 | |||
| Investment Income | ||||
| Interest | $ | 148,439 | ||
| Income from Fidelity Central Funds | 4,396 | |||
| Total Income | 152,835 | |||
| Expenses | ||||
| Management fee | $ | 15,460 | ||
| Transfer agent fees | 5,131 | |||
| Distribution and service plan fees | 1,118 | |||
| Accounting fees and expenses | 638 | |||
| Custodian fees and expenses | 40 | |||
| Independent trustees' fees and expenses | 16 | |||
| Registration fees | 150 | |||
| Audit | 68 | |||
| Legal | 5 | |||
| Miscellaneous | 55 | |||
| Total expenses before reductions | 22,681 | |||
| Expense reductions | (144) | |||
| Total expenses after reductions | 22,537 | |||
| Net Investment income (loss) | 130,298 | |||
| Realized and Unrealized Gain (Loss) | ||||
| Net realized gain (loss) on: | ||||
| Investment Securities: | ||||
| Unaffiliated issuers | (6,995) | |||
| Total net realized gain (loss) | (6,995) | |||
| Change in net unrealized appreciation (depreciation) on: | ||||
| Investment Securities: | ||||
| Unaffiliated issuers | 182,313 | |||
| Fidelity Central Funds | 8 | |||
| Total change in net unrealized appreciation (depreciation) | 182,321 | |||
| Net gain (loss) | 175,326 | |||
| Net increase (decrease) in net assets resulting from operations | $ | 305,624 | ||
| Statement of Changes in Net Assets | ||||
| Amount in thousands | Year ended December 31, 2023 | Year ended December 31, 2022 | ||
| Increase (Decrease) in Net Assets | ||||
| Operations | ||||
| Net investment income (loss) | $ | 130,298 | $ | 114,716 |
| Net realized gain (loss) | (6,995) | (30,793) | ||
| Change in net unrealized appreciation (depreciation) | 182,321 | (596,229) | ||
| Net increase (decrease) in net assets resulting from operations | 305,624 | (512,306) | ||
| Distributions to shareholders | (128,164) | (114,383) | ||
| Share transactions - net increase (decrease) | 277,844 | (275,639) | ||
| Total increase (decrease) in net assets | 455,304 | (902,328) | ||
| Net Assets | ||||
| Beginning of period | 4,222,625 | 5,124,953 | ||
| End of period | $ | 4,677,929 | $ | 4,222,625 |
| Fidelity Advisor® Municipal Income Fund Class A |
| Years ended December 31, | 2023 | 2022 | 2021 | 2020 | 2019 | |||||
Selected Per-Share Data | ||||||||||
| Net asset value, beginning of period | $ | 11.86 | $ | 13.56 | $ | 13.59 | $ | 13.39 | $ | 12.75 |
| Income from Investment Operations | ||||||||||
Net investment income (loss) A,B | .316 | .282 | .281 | .305 | .330 | |||||
| Net realized and unrealized gain (loss) | .474 | (1.700) | .057 | .257 | .689 | |||||
| Total from investment operations | .790 | (1.418) | .338 | .562 | 1.019 | |||||
| Distributions from net investment income | (.310) | (.282) | (.281) | (.304) | (.328) | |||||
| Distributions from net realized gain | - | - | (.087) | (.058) | (.051) | |||||
| Total distributions | (.310) | (.282) | (.368) | (.362) | (.379) | |||||
| Net asset value, end of period | $ | 12.34 | $ | 11.86 | $ | 13.56 | $ | 13.59 | $ | 13.39 |
Total Return C,D | 6.78% | (10.48)% | 2.51% | 4.28% | 8.06% | |||||
Ratios to Average Net Assets B,E,F | ||||||||||
| Expenses before reductions | .79% | .78% | .78% | .78% | .79% | |||||
| Expenses net of fee waivers, if any | .79% | .78% | .78% | .78% | .79% | |||||
| Expenses net of all reductions | .79% | .78% | .78% | .78% | .79% | |||||
| Net investment income (loss) | 2.64% | 2.31% | 2.06% | 2.29% | 2.49% | |||||
| Supplemental Data | ||||||||||
| Net assets, end of period (in millions) | $ | 285 | $ | 268 | $ | 249 | $ | 233 | $ | 241 |
Portfolio turnover rate G | 4% | 23% | 13% | 16% | 16% |
| Fidelity Advisor® Municipal Income Fund Class M |
| Years ended December 31, | 2023 | 2022 | 2021 | 2020 | 2019 | |||||
Selected Per-Share Data | ||||||||||
| Net asset value, beginning of period | $ | 11.87 | $ | 13.57 | $ | 13.60 | $ | 13.40 | $ | 12.76 |
| Income from Investment Operations | ||||||||||
Net investment income (loss) A,B | .319 | .286 | .285 | .308 | .333 | |||||
| Net realized and unrealized gain (loss) | .474 | (1.701) | .056 | .258 | .689 | |||||
| Total from investment operations | .793 | (1.415) | .341 | .566 | 1.022 | |||||
| Distributions from net investment income | (.313) | (.285) | (.284) | (.308) | (.331) | |||||
| Distributions from net realized gain | - | - | (.087) | (.058) | (.051) | |||||
| Total distributions | (.313) | (.285) | (.371) | (.366) | (.382) | |||||
| Net asset value, end of period | $ | 12.35 | $ | 11.87 | $ | 13.57 | $ | 13.60 | $ | 13.40 |
Total Return C,D | 6.80% | (10.45)% | 2.53% | 4.30% | 8.08% | |||||
Ratios to Average Net Assets B,E,F | ||||||||||
| Expenses before reductions | .76% | .77% | .76% | .76% | .77% | |||||
| Expenses net of fee waivers, if any | .76% | .76% | .76% | .76% | .77% | |||||
| Expenses net of all reductions | .76% | .76% | .76% | .76% | .77% | |||||
| Net investment income (loss) | 2.66% | 2.33% | 2.08% | 2.31% | 2.51% | |||||
| Supplemental Data | ||||||||||
| Net assets, end of period (in millions) | $ | 76 | $ | 80 | $ | 106 | $ | 109 | $ | 120 |
Portfolio turnover rate G | 4% | 23% | 13% | 16% | 16% |
| Fidelity Advisor® Municipal Income Fund Class C |
| Years ended December 31, | 2023 | 2022 | 2021 | 2020 | 2019 | |||||
Selected Per-Share Data | ||||||||||
| Net asset value, beginning of period | $ | 11.86 | $ | 13.56 | $ | 13.59 | $ | 13.39 | $ | 12.75 |
| Income from Investment Operations | ||||||||||
Net investment income (loss) A,B | .230 | .194 | .181 | .206 | .231 | |||||
| Net realized and unrealized gain (loss) | .473 | (1.701) | .056 | .257 | .689 | |||||
| Total from investment operations | .703 | (1.507) | .237 | .463 | .920 | |||||
| Distributions from net investment income | (.223) | (.193) | (.180) | (.205) | (.229) | |||||
| Distributions from net realized gain | - | - | (.087) | (.058) | (.051) | |||||
| Total distributions | (.223) | (.193) | (.267) | (.263) | (.280) | |||||
| Net asset value, end of period | $ | 12.34 | $ | 11.86 | $ | 13.56 | $ | 13.59 | $ | 13.39 |
Total Return C,D | 6.01% | (11.13)% | 1.75% | 3.51% | 7.26% | |||||
Ratios to Average Net Assets B,E,F | ||||||||||
| Expenses before reductions | 1.51% | 1.51% | 1.52% | 1.53% | 1.53% | |||||
| Expenses net of fee waivers, if any | 1.51% | 1.51% | 1.52% | 1.53% | 1.53% | |||||
| Expenses net of all reductions | 1.51% | 1.51% | 1.52% | 1.53% | 1.53% | |||||
| Net investment income (loss) | 1.91% | 1.58% | 1.32% | 1.54% | 1.75% | |||||
| Supplemental Data | ||||||||||
| Net assets, end of period (in millions) | $ | 23 | $ | 25 | $ | 35 | $ | 52 | $ | 58 |
Portfolio turnover rate G | 4% | 23% | 13% | 16% | 16% |
| Fidelity® Municipal Income Fund |
| Years ended December 31, | 2023 | 2022 | 2021 | 2020 | 2019 | |||||
Selected Per-Share Data | ||||||||||
| Net asset value, beginning of period | $ | 11.87 | $ | 13.57 | $ | 13.60 | $ | 13.40 | $ | 12.75 |
| Income from Investment Operations | ||||||||||
Net investment income (loss) A,B | .355 | .324 | .327 | .350 | .374 | |||||
| Net realized and unrealized gain (loss) | .475 | (1.702) | .057 | .257 | .699 | |||||
| Total from investment operations | .830 | (1.378) | .384 | .607 | 1.073 | |||||
| Distributions from net investment income | (.350) | (.322) | (.327) | (.349) | (.372) | |||||
| Distributions from net realized gain | - | - | (.087) | (.058) | (.051) | |||||
| Total distributions | (.350) | (.322) | (.414) | (.407) | (.423) | |||||
| Net asset value, end of period | $ | 12.35 | $ | 11.87 | $ | 13.57 | $ | 13.60 | $ | 13.40 |
Total Return C | 7.12% | (10.18)% | 2.85% | 4.63% | 8.50% | |||||
Ratios to Average Net Assets B,D,E | ||||||||||
| Expenses before reductions | .46% | .46% | .45% | .45% | .45% | |||||
| Expenses net of fee waivers, if any | .46% | .46% | .45% | .45% | .45% | |||||
| Expenses net of all reductions | .46% | .46% | .45% | .45% | .45% | |||||
| Net investment income (loss) | 2.97% | 2.64% | 2.39% | 2.62% | 2.83% | |||||
| Supplemental Data | ||||||||||
| Net assets, end of period (in millions) | $ | 2,783 | $ | 2,780 | $ | 3,787 | $ | 3,805 | $ | 3,955 |
Portfolio turnover rate F | 4% | 23% | 13% | 16% | 16% |
| Fidelity Advisor® Municipal Income Fund Class I |
| Years ended December 31, | 2023 | 2022 | 2021 | 2020 | 2019 | |||||
Selected Per-Share Data | ||||||||||
| Net asset value, beginning of period | $ | 11.86 | $ | 13.56 | $ | 13.59 | $ | 13.39 | $ | 12.75 |
| Income from Investment Operations | ||||||||||
Net investment income (loss) A,B | .344 | .311 | .315 | .339 | .363 | |||||
| Net realized and unrealized gain (loss) | .475 | (1.699) | .057 | .257 | .689 | |||||
| Total from investment operations | .819 | (1.388) | .372 | .596 | 1.052 | |||||
| Distributions from net investment income | (.339) | (.312) | (.315) | (.338) | (.361) | |||||
| Distributions from net realized gain | - | - | (.087) | (.058) | (.051) | |||||
| Total distributions | (.339) | (.312) | (.402) | (.396) | (.412) | |||||
| Net asset value, end of period | $ | 12.34 | $ | 11.86 | $ | 13.56 | $ | 13.59 | $ | 13.39 |
Total Return C | 7.04% | (10.26)% | 2.76% | 4.54% | 8.33% | |||||
Ratios to Average Net Assets B,D,E | ||||||||||
| Expenses before reductions | .54% | .54% | .53% | .53% | .53% | |||||
| Expenses net of fee waivers, if any | .54% | .54% | .53% | .53% | .53% | |||||
| Expenses net of all reductions | .54% | .54% | .53% | .53% | .53% | |||||
| Net investment income (loss) | 2.88% | 2.55% | 2.31% | 2.54% | 2.75% | |||||
| Supplemental Data | ||||||||||
| Net assets, end of period (in millions) | $ | 1,156 | $ | 834 | $ | 714 | $ | 619 | $ | 647 |
Portfolio turnover rate F | 4% | 23% | 13% | 16% | 16% |
| Fidelity Advisor® Municipal Income Fund Class Z |
| Years ended December 31, | 2023 | 2022 | 2021 | 2020 | 2019 | |||||
Selected Per-Share Data | ||||||||||
| Net asset value, beginning of period | $ | 11.86 | $ | 13.57 | $ | 13.60 | $ | 13.39 | $ | 12.75 |
| Income from Investment Operations | ||||||||||
Net investment income (loss) A,B | .359 | .327 | .331 | .352 | .378 | |||||
| Net realized and unrealized gain (loss) | .476 | (1.710) | .057 | .269 | .689 | |||||
| Total from investment operations | .835 | (1.383) | .388 | .621 | 1.067 | |||||
| Distributions from net investment income | (.355) | (.327) | (.331) | (.353) | (.376) | |||||
| Distributions from net realized gain | - | - | (.087) | (.058) | (.051) | |||||
| Total distributions | (.355) | (.327) | (.418) | (.411) | (.427) | |||||
| Net asset value, end of period | $ | 12.34 | $ | 11.86 | $ | 13.57 | $ | 13.60 | $ | 13.39 |
Total Return C | 7.17% | (10.22)% | 2.88% | 4.74% | 8.45% | |||||
Ratios to Average Net Assets B,D,E | ||||||||||
| Expenses before reductions | .42% | .42% | .42% | .42% | .42% | |||||
| Expenses net of fee waivers, if any | .42% | .42% | .42% | .42% | .42% | |||||
| Expenses net of all reductions | .42% | .42% | .42% | .42% | .42% | |||||
| Net investment income (loss) | 3.01% | 2.67% | 2.42% | 2.65% | 2.86% | |||||
| Supplemental Data | ||||||||||
| Net assets, end of period (in millions) | $ | 355 | $ | 235 | $ | 235 | $ | 196 | $ | 97 |
Portfolio turnover rate F | 4% | 23% | 13% | 16% | 16% |
| Fidelity Central Fund | Investment Manager | Investment Objective | Investment Practices | Expense RatioA |
| Fidelity Money Market Central Funds | Fidelity Management & Research Company LLC (FMR) | Each fund seeks to obtain a high level of current income consistent with the preservation of capital and liquidity. | Short-term Investments | Less than .005% |
| Gross unrealized appreciation | $105,014 |
| Gross unrealized depreciation | (148,348) |
| Net unrealized appreciation (depreciation) | $(43,334) |
| Tax Cost | $4,685,078 |
| Capital loss carryforward | $(37,793) |
| Net unrealized appreciation (depreciation) on securities and other investments | $(43,334) |
Short-term | $(15,066) |
Long-term | (22,727) |
| Total capital loss carryforward | $(37,793) |
| December 31, 2023 | December 31, 2022 | |
| Tax-exempt Income | $128,164 | $114,383 |
| Purchases ($) | Sales ($) | |
| Fidelity Municipal Income Fund | 579,119 | 191,494 |
| Distribution Fee | Service Fee | Total Fees | Retained by FDC | |
| Class A | - % | .25% | $687 | $25 |
| Class M | - % | .25% | 194 | -A |
| Class C | .75% | .25% | 237 | 37 |
| $1,118 | $62 |
| Retained by FDC | |
| Class A | $15 |
| Class M | 3 |
Class C A | -B |
| $18 |
| % of Class-Level Average Net Assets | |
| Class A | 0.1688% |
| Class M | 0.1454% |
| Class C | 0.1461% |
| Fidelity Municipal Income Fund | 0.0926% |
| Class I | 0.1749% |
| Amount | % of Class-Level Average Net Assets | |
| Class A | $468 | .17 |
| Class M | 114 | .15 |
| Class C | 35 | .15 |
| Fidelity Municipal Income Fund | 2,570 | .09 |
| Class I | 1,797 | .18 |
| Class Z | 147 | .05 |
| $5,131 |
| % of Average Net Assets | |
| Fidelity Municipal Income Fund | 0.0141% |
| % of Average Net Assets | |
| Fidelity Municipal Income Fund | .01 |
| Maximum Management Fee Rate % | |
| Class A | 0.51 |
| Class M | 0.49 |
| Class C | 0.49 |
| Fidelity Municipal Income Fund | 0.43 |
| Class I | 0.52 |
| Class Z | 0.39 |
| Purchases ($) | Sales ($) | Realized Gain (Loss) ($) | |
| Fidelity Municipal Income Fund | - | 12,700 | - |
| Amount | |
| Fidelity Municipal Income Fund | $8 |
Year ended December 31, 2023 | Year ended December 31, 2022 | |
| Fidelity Municipal Income Fund | ||
| Distributions to shareholders | ||
| Class A | $7,118 | $5,541 |
| Class M | 2,028 | 2,073 |
| Class C | 442 | 435 |
| Fidelity Municipal Income Fund | 80,821 | 81,658 |
| Class I | 29,017 | 18,130 |
| Class Z | 8,738 | 6,546 |
Total | $128,164 | $114,383 |
| Shares | Shares | Dollars | Dollars | |
Year ended December 31, 2023 | Year ended December 31, 2022 | Year ended December 31, 2023 | Year ended December 31, 2022 | |
| Fidelity Municipal Income Fund | ||||
| Class A | ||||
| Shares sold | 3,568 | 9,594 | $42,727 | $115,427 |
| Reinvestment of distributions | 535 | 411 | 6,403 | 4,981 |
| Shares redeemed | (3,599) | (5,727) | (42,868) | (69,759) |
| Net increase (decrease) | 504 | 4,278 | $6,262 | $50,649 |
| Class M | ||||
| Shares sold | 162 | 276 | $1,943 | $3,355 |
| Reinvestment of distributions | 150 | 150 | 1,790 | 1,825 |
| Shares redeemed | (891) | (1,491) | (10,686) | (18,102) |
| Net increase (decrease) | (579) | (1,065) | $(6,953) | $(12,922) |
| Class C | ||||
| Shares sold | 420 | 511 | $5,060 | $6,199 |
| Reinvestment of distributions | 34 | 34 | 411 | 410 |
| Shares redeemed | (767) | (967) | (9,192) | (11,857) |
| Net increase (decrease) | (313) | (422) | $(3,721) | $(5,248) |
| Fidelity Municipal Income Fund | ||||
| Shares sold | 25,181 | 40,481 | $299,407 | $491,259 |
| Reinvestment of distributions | 4,986 | 4,697 | 59,681 | 57,042 |
| Shares redeemed | (38,976) | (89,945) | (465,366) | (1,101,537) |
| Net increase (decrease) | (8,809) | (44,767) | $(106,278) | $(553,236) |
| Class I | ||||
| Shares sold | 54,308 | 56,827 | $648,131 | $682,902 |
| Reinvestment of distributions | 944 | 657 | 11,282 | 7,979 |
| Shares redeemed | (31,890) | (39,781) | (378,696) | (480,093) |
| Net increase (decrease) | 23,362 | 17,703 | $280,717 | $210,788 |
| Class Z | ||||
| Shares sold | 16,561 | 26,980 | $198,051 | $329,960 |
| Reinvestment of distributions | 582 | 414 | 6,953 | 5,017 |
| Shares redeemed | (8,184) | (24,933) | (97,187) | (300,647) |
| Net increase (decrease) | 8,959 | 2,461 | $107,817 | $34,330 |
| The Example is based on an investment of $1,000 invested at the beginning of the period and held for the entire period (July 1, 2023 to December 31, 2023). |
Annualized Expense Ratio- A | Beginning Account Value July 1, 2023 | Ending Account Value December 31, 2023 | Expenses Paid During Period- C July 1, 2023 to December 31, 2023 | |||||||
| Fidelity® Municipal Income Fund | ||||||||||
| Class A | .78% | |||||||||
| Actual | $ 1,000 | $ 1,037.90 | $ 4.01 | |||||||
Hypothetical-B | $ 1,000 | $ 1,021.27 | $ 3.97 | |||||||
| Class M | .75% | |||||||||
| Actual | $ 1,000 | $ 1,037.10 | $ 3.85 | |||||||
Hypothetical-B | $ 1,000 | $ 1,021.42 | $ 3.82 | |||||||
| Class C | 1.49% | |||||||||
| Actual | $ 1,000 | $ 1,033.20 | $ 7.64 | |||||||
Hypothetical-B | $ 1,000 | $ 1,017.69 | $ 7.58 | |||||||
| Fidelity® Municipal Income Fund | .45% | |||||||||
| Actual | $ 1,000 | $ 1,039.50 | $ 2.31 | |||||||
Hypothetical-B | $ 1,000 | $ 1,022.94 | $ 2.29 | |||||||
| Class I | .53% | |||||||||
| Actual | $ 1,000 | $ 1,039.10 | $ 2.72 | |||||||
Hypothetical-B | $ 1,000 | $ 1,022.53 | $ 2.70 | |||||||
| Class Z | .41% | |||||||||
| Actual | $ 1,000 | $ 1,038.90 | $ 2.11 | |||||||
Hypothetical-B | $ 1,000 | $ 1,023.14 | $ 2.09 | |||||||
| A special meeting of shareholders was held on October 18, 2023. The results of votes taken among shareholders on the proposal before them are reported below. Each vote reported represents one dollar of net asset value held on the record date for the meeting. | ||
| Proposal 1 | ||
| To elect a Board of Trustees. | ||
# of Votes | % of Votes | |
| Abigail P. Johnson | ||
| Affirmative | 11,160,118,778.550 | 97.240 |
| Withheld | 316,510,692.230 | 2.760 |
| TOTAL | 11,476,629,470.780 | 100.000 |
| Jennifer Toolin McAuliffe | ||
| Affirmative | 11,160,843,041.160 | 97.250 |
| Withheld | 315,786,429.620 | 2.750 |
| TOTAL | 11,476,629,470.780 | 100.000 |
| Christine J. Thompson | ||
| Affirmative | 11,156,602,115.000 | 97.210 |
| Withheld | 320,027,355.780 | 2.790 |
| TOTAL | 11,476,629,470.780 | 100.000 |
| Elizabeth S. Acton | ||
| Affirmative | 11,110,214,430.850 | 96.810 |
| Withheld | 366,415,039.930 | 3.190 |
| TOTAL | 11,476,629,470.780 | 100.000 |
| Laura M. Bishop | ||
| Affirmative | 11,132,012,161.210 | 97.000 |
| Withheld | 344,617,309.570 | 3.000 |
| TOTAL | 11,476,629,470.780 | 100.000 |
| Ann E. Dunwoody | ||
| Affirmative | 11,125,767,777.290 | 96.940 |
| Withheld | 350,861,693.490 | 3.060 |
| TOTAL | 11,476,629,470.780 | 100.000 |
| John Engler | ||
| Affirmative | 11,009,456,697.420 | 95.930 |
| Withheld | 467,172,773.360 | 4.070 |
| TOTAL | 11,476,629,470.780 | 100.000 |
| Robert F. Gartland | ||
| Affirmative | 11,139,433,974.390 | 97.060 |
| Withheld | 337,195,496.390 | 2.940 |
| TOTAL | 11,476,629,470.780 | 100.000 |
| Robert W. Helm | ||
| Affirmative | 11,140,155,147.040 | 97.070 |
| Withheld | 336,474,323.740 | 2.930 |
| TOTAL | 11,476,629,470.780 | 100.000 |
| Arthur E. Johnson | ||
| Affirmative | 11,087,922,630.810 | 96.610 |
| Withheld | 388,706,839.970 | 3.390 |
| TOTAL | 11,476,629,470.780 | 100.000 |
| Michael E. Kenneally | ||
| Affirmative | 11,003,372,175.210 | 95.880 |
| Withheld | 473,257,295.570 | 4.120 |
| TOTAL | 11,476,629,470.780 | 100.000 |
| Mark A. Murray | ||
| Affirmative | 11,139,176,322.830 | 97.060 |
| Withheld | 337,453,147.950 | 2.940 |
| TOTAL | 11,476,629,470.780 | 100.000 |
| Carol J. Zierhoffer | ||
| Affirmative | 11,137,882,609.000 | 97.050 |
| Withheld | 338,746,861.780 | 2.950 |
| TOTAL | 11,476,629,470.780 | 100.000 |
| Proposal 1 reflects trust wide proposal and voting results. | ||
 |


Contents
| Average Annual Total Returns | |||
Periods ended December 31, 2023 | Past 1 year | Past 5 years | Past 10 years |
Class A (incl. 1.50% sales charge) | 1.98% | 1.03% | 0.90% |
| Fidelity® Conservative Income Municipal Bond Fund | 3.66% | 1.36% | 1.07% |
| Class I | 3.64% | 1.36% | 1.06% |
| Class Z | 3.67% | 1.37% | 1.07% |
| $10,000 Over 10 Years |
Let's say hypothetically that $10,000 was invested in Fidelity® Conservative Income Municipal Bond Fund, a class of the fund, on December 31, 2013. The chart shows how the value of your investment would have changed, and also shows how the Bloomberg Municipal Bond 1 Year (1-2 Y) Index performed over the same period. |
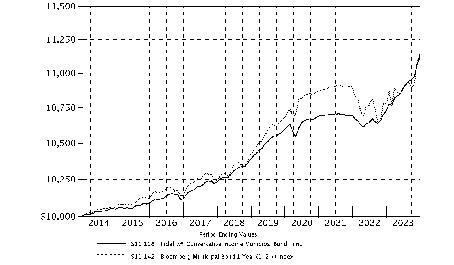 |
| Top Five States (% of Fund's net assets) | |
| California | 14.1 |
| Texas | 11.4 |
| Pennsylvania | 7.0 |
| Illinois | 5.5 |
| New York | 5.4 |
| Revenue Sources (% of Fund's net assets) | ||
| Synthetics | 23.2 | |
| General Obligations | 12.6 | |
| Industrial Development | 12.2 | |
| Transportation | 10.7 | |
| Resource Recovery | 10.1 | |
| Health Care | 6.8 | |
| Electric Utilities | 5.6 | |
| Others* (Individually Less Than 5%) | 18.8 | |
| 100.0 | ||
| *Includes net other assets | ||
Quality Diversification (% of Fund's net assets) |
 |
| We have used ratings from Moody's Investors Service, Inc. Where Moody's® ratings are not available, we have used S&P® ratings. All ratings are as of the date indicated and do not reflect subsequent changes. |
| Maturity Diversification (% of Fund's Investments) | ||
| Days | ||
| 1 - 7 | 35.2 | |
| 8 - 30 | 1.1 | |
| 31 - 60 | 12.8 | |
| 61 - 90 | 0.9 | |
| 91 - 180 | 6.3 | |
| > 180 | 43.7 | |
| The date shown for securities represents the date when principal payments must be paid, taking into account any call options exercised by the issuer and any permissible maturity shortening features other than interest rate resets. | ||
| Municipal Bonds - 57.6% | |||
Principal Amount (a) | Value ($) | ||
| Alabama - 1.5% | |||
| Black Belt Energy Gas District: | |||
| Bonds Series 2022 D1, 4%, tender 6/1/27 (b) | 5,640,000 | 5,671,041 | |
| Series 2022 C, 5.25% 6/1/24 | 145,000 | 145,884 | |
| Series 2022 C1: | |||
5.25% 12/1/24 | 405,000 | 410,768 | |
5.25% 12/1/25 | 530,000 | 546,500 | |
5.25% 6/1/26 | 1,225,000 | 1,272,392 | |
| Series 2022 E: | |||
5% 6/1/24 | 1,520,000 | 1,528,537 | |
5% 6/1/25 | 1,585,000 | 1,614,863 | |
5% 6/1/26 | 2,185,000 | 2,257,021 | |
| Series 2023 C: | |||
5.5% 6/1/26 | 900,000 | 928,823 | |
5.5% 6/1/27 | 385,000 | 402,289 | |
| Mobile Indl. Dev. Board Poll. Cont. Rev. Bonds (Alabama Pwr. Co. Barry Plant Proj.): | |||
| Series 2007 C, 3.78%, tender 6/16/26 (b) | 1,380,000 | 1,392,802 | |
| Series 2008, 3.65%, tender 1/10/25 (b) | 10,600,000 | 10,617,651 | |
| Southeast Alabama Gas Supply District Bonds: | |||
| (Proj. No. 2) Series 2018 A, 4%, tender 6/1/24 (b) | 9,915,000 | 9,919,790 | |
| Series 2018 A, 4%, tender 4/1/24 (b) | 1,185,000 | 1,185,472 | |
| Southeast Energy Auth. Rev. (Proj. No. 2) Series 2021 B1: | |||
| 4% 6/1/24 | 510,000 | 510,307 | |
| 4% 6/1/25 | 615,000 | 617,363 | |
TOTAL ALABAMA | 39,021,503 | ||
| Alaska - 0.1% | |||
| Alaska Int'l. Arpts. Revs. Series 2021 C, 5% 10/1/25 (c) | 1,695,000 | 1,740,433 | |
| Arizona - 3.4% | |||
| Arizona Health Facilities Auth. Rev. (Scottsdale Lincoln Hospitals Proj.) Series 2014 A, 5% 12/1/24 | 1,000,000 | 1,016,345 | |
| Chandler Indl. Dev. Auth. Indl. Dev. Rev.: | |||
| (Intel Corp. Proj.) Series 2022 2, 5%, tender 9/1/27 (b)(c) | 19,750,000 | 20,541,092 | |
| Bonds (Intel Corp. Proj.) Series 2019, 5%, tender 6/3/24 (b)(c) | 47,785,000 | 47,877,846 | |
| Coconino County Poll. Cont. Corp. Rev. Bonds (Navada Pwr. Co. Projs.) Series 2017 A, 4.125%, tender 3/31/26 (b)(c) | 2,300,000 | 2,320,432 | |
| Maricopa County Rev. Bonds: | |||
| Series 2023 A1, 5%, tender 5/15/26 (b) | 3,760,000 | 3,920,611 | |
| Series C, 5%, tender 10/18/24 (b) | 945,000 | 958,123 | |
| Phoenix Civic Impt. Board Arpt. Rev.: | |||
| Series 2018, 5% 7/1/24 (c) | 785,000 | 790,977 | |
| Series 2023: | |||
5% 7/1/24 (c) | 900,000 | 906,853 | |
5% 7/1/26 (c) | 1,815,000 | 1,893,378 | |
| Phoenix Indl. Solid Waste Disp. Rev. Bonds (Republic Svc., Inc. Proj.) Series 2013, 4.9%, tender 2/1/24 (b)(c) | 8,035,000 | 8,036,152 | |
| Yuma Pledged Rev. Series 2021, 4% 7/1/24 | 300,000 | 301,412 | |
TOTAL ARIZONA | 88,563,221 | ||
| California - 5.2% | |||
| Anaheim Pub. Fing. Auth. Lease Rev. Series 1997, 0% 9/1/25 (Assured Guaranty Muni. Corp. Insured) | 10,000,000 | 9,486,778 | |
| California Health Facilities Fing. Auth. Rev. Bonds Series 2016 B2, 4%, tender 10/1/24 (b) | 13,085,000 | 13,115,628 | |
| California Muni. Fin. Auth. Envir. Bonds (Aymium Williams Proj.) Series 2023, 4%, tender 6/21/24 (b)(c)(d) | 7,000,000 | 7,000,064 | |
| California Muni. Fin. Auth. Solid Waste Disp. Rev. Bonds: | |||
| (Republic Svcs., Inc. Proj.): | |||
Series 2021 A, 4.7%, tender 4/1/24 (b)(c) | 13,300,000 | 13,305,373 | |
Series 2021 B, 4.2%, tender 1/16/24 (b)(c) | 10,300,000 | 10,297,930 | |
| (Waste Mgmt., Inc. Proj.): | |||
Series 2009 A, 1.3%, tender 2/3/25 (b)(d) | 750,000 | 728,732 | |
Series 2017 A, 4.25%, tender 12/2/24 (b)(c) | 12,600,000 | 12,622,006 | |
Series 2020, 4.5%, tender 3/1/24 (b)(c) | 13,100,000 | 13,102,586 | |
| California Poll. Cont. Fing. Auth. Solid Waste Disp. Rev. Bonds (Republic Svcs. INC. Proj.) Series 2023, 4.25%, tender 2/15/24 (b)(c)(d) | 19,100,000 | 19,088,704 | |
| California Pub. Works Board Lease Rev. (Various Cap. Projs.) Series 2022 C, 5% 8/1/24 | 1,925,000 | 1,949,417 | |
| Los Angeles Dept. Arpt. Rev.: | |||
| Series 2019 A, 5% 5/15/24 (c) | 705,000 | 709,277 | |
| Series 2020 C, 5% 5/15/24 (c) | 500,000 | 503,033 | |
| Series 2022 C: | |||
5% 5/15/25 (c) | 1,475,000 | 1,509,686 | |
5% 5/15/26 (c) | 3,595,000 | 3,740,609 | |
| Series 2022 G, 5% 5/15/25 (c) | 995,000 | 1,018,398 | |
| Series 2023 A: | |||
5% 5/15/24 (c) | 700,000 | 704,247 | |
5% 5/15/25 (c) | 465,000 | 475,935 | |
5% 5/15/26 (c) | 805,000 | 837,605 | |
| Series B, 5% 5/15/24 (c) | 1,065,000 | 1,071,461 | |
| Port of Oakland Rev. Series H, 5% 5/1/26 (c) | 2,750,000 | 2,870,482 | |
| San Diego County Reg'l. Arpt. Auth. Arpt. Rev. Series 2019 B, 5% 7/1/24 (c) | 500,000 | 503,562 | |
| San Francisco City & County Arpts. Commission Int'l. Arpt. Rev.: | |||
| Series 2017 D, 5% 5/1/24 (c) | 1,000,000 | 1,005,688 | |
| Series 2019 H: | |||
5% 5/1/24 (Escrowed to Maturity) (c) | 550,000 | 553,327 | |
5% 5/1/27 (c) | 6,000,000 | 6,343,560 | |
| Series 2023 A: | |||
5% 5/1/24 (c) | 2,500,000 | 2,514,220 | |
5% 5/1/25 (c) | 1,510,000 | 1,548,122 | |
5% 5/1/26 (c) | 5,920,000 | 6,145,544 | |
| San Jose Int. Arpt. Rev. Series 2021 B, 5% 3/1/25 | 375,000 | 385,152 | |
TOTAL CALIFORNIA | 133,137,126 | ||
| Colorado - 0.9% | |||
| Colorado Health Facilities Auth. Rev. Bonds Series 2022 A: | |||
| 5% 11/1/24 | 430,000 | 434,926 | |
| 5% 11/1/25 | 400,000 | 411,051 | |
| Colorado Univ. Co. Hosp. Auth. Rev. Bonds Series 2019 C, 5%, tender 11/15/24 (b) | 700,000 | 703,964 | |
| Denver City & County Arpt. Rev.: | |||
| Series 2017 A, 5% 11/15/24 (c) | 825,000 | 834,735 | |
| Series 2018 A, 5% 12/1/27 (c) | 4,450,000 | 4,754,698 | |
| Series 2022 A: | |||
5% 11/15/24 (c) | 1,000,000 | 1,011,800 | |
5% 11/15/25 (c) | 2,450,000 | 2,519,908 | |
| Series 2022 D: | |||
5% 11/15/25 (c) | 4,000,000 | 4,127,324 | |
5.25% 11/15/26 (c) | 4,985,000 | 5,273,870 | |
| Maiker Hsg. Partners Colo Multi Bonds Series 2023, 4.5%, tender 5/1/26 (b) | 3,175,000 | 3,177,729 | |
TOTAL COLORADO | 23,250,005 | ||
| Connecticut - 1.6% | |||
| Connecticut Gen. Oblig.: | |||
| Series 2013 A, 4.86% 3/1/25 (b) | 1,075,000 | 1,080,469 | |
| Series 2016 B, 5% 5/15/25 | 505,000 | 519,954 | |
| Series 2021 D, 5% 7/15/24 | 1,760,000 | 1,779,161 | |
| Series A: | |||
3% 1/15/24 | 500,000 | 499,978 | |
3% 4/15/24 | 500,000 | 499,915 | |
4% 1/15/24 | 465,000 | 465,148 | |
| Connecticut Health & Edl. Facilities Auth. Rev.: | |||
| Bonds: | |||
Series 1999 U2, 1.1%, tender 2/11/25 (b) | 3,600,000 | 3,498,940 | |
Series 2010 A3, 0.25%, tender 2/9/24 (b) | 11,800,000 | 11,758,753 | |
Series 2010 A4, 1.1%, tender 2/11/25 (b) | 9,050,000 | 8,795,947 | |
Series 2014 B, 1.8%, tender 7/1/24 (b) | 980,000 | 969,249 | |
Series 2017 B2, 3.2%, tender 7/1/26 (b) | 2,910,000 | 2,940,285 | |
| Series 2022 L, 5% 7/1/25 | 450,000 | 462,725 | |
| Connecticut Spl. Tax Oblig. Trans. Infrastructure Rev.: | |||
| Series 2015 A, 5% 8/1/26 | 1,000,000 | 1,035,261 | |
| Series 2021 A, 5% 5/1/26 | 1,270,000 | 1,340,007 | |
| Series 2021 C, 5% 1/1/24 | 1,340,000 | 1,340,000 | |
| Hartford Gen. Oblig. Series 2015 C, 5% 7/15/25 (Assured Guaranty Muni. Corp. Insured) | 1,910,000 | 1,974,307 | |
| New Haven Gen. Oblig. Series 2023: | |||
| 5% 8/1/24 | 600,000 | 605,712 | |
| 5% 8/1/25 | 500,000 | 514,244 | |
| 5% 8/1/26 (Build America Mutual Assurance Insured) | 700,000 | 736,943 | |
| 5% 8/1/27 (Build America Mutual Assurance Insured) | 650,000 | 698,069 | |
TOTAL CONNECTICUT | 41,515,067 | ||
| Delaware - 0.1% | |||
| Delaware Econ. Dev. Auth. Rev. Bonds (Delmarva Pwr. & Lt. Co. Proj.) Series A, 1.05%, tender 7/1/25 (b) | 580,000 | 557,203 | |
| Delaware Trans. Auth. Grant Series 2020, 5% 9/1/24 | 850,000 | 861,875 | |
TOTAL DELAWARE | 1,419,078 | ||
| District Of Columbia - 0.9% | |||
| District of Columbia Gen. Oblig. Series 2021 D, 4% 2/1/24 | 325,000 | 325,271 | |
| Metropolitan Washington DC Arpts. Auth. Sys. Rev.: | |||
| Series 2014 A, 5% 10/1/26 (c) | 950,000 | 956,692 | |
| Series 2018 A, 5% 10/1/24 (c) | 5,675,000 | 5,734,950 | |
| Series 2019 A: | |||
5% 10/1/24 (c) | 3,000,000 | 3,031,691 | |
5% 10/1/26 (c) | 1,300,000 | 1,362,992 | |
| Series 2020 A, 5% 10/1/24 (c) | 7,200,000 | 7,276,059 | |
| Series 2022 A, 5% 10/1/24 (c) | 1,300,000 | 1,313,733 | |
| Series 2023 A, 5% 10/1/26 (c) | 1,965,000 | 2,060,214 | |
| Washington Metropolitan Area Transit Auth. Series 2023 A, 5% 7/15/25 | 1,000,000 | 1,034,127 | |
TOTAL DISTRICT OF COLUMBIA | 23,095,729 | ||
| Florida - 2.6% | |||
| Broward County Arpt. Sys. Rev. Series 2017, 5% 10/1/24 (c) | 500,000 | 504,951 | |
| Broward County Fin. Auth. Multi-family Hsg. Rev. Bonds Series 2023, 4.05%, tender 3/1/26 (b) | 1,875,000 | 1,899,194 | |
| Broward County Port Facilities Rev. Series 2022, 5% 9/1/27 (c) | 1,995,000 | 2,110,582 | |
| Broward County School Board Ctfs. of Prtn. Series 2022 A, 5% 7/1/25 | 1,590,000 | 1,640,850 | |
| Citizens Property Ins. Corp. Series 2015 A1, 5% 6/1/25 (Pre-Refunded to 12/1/24 @ 100) | 4,705,000 | 4,777,655 | |
| Duval County School Board Ctfs. of Prtn. Series 2022 A: | |||
| 5% 7/1/25 (Assured Guaranty Muni. Corp. Insured) | 2,795,000 | 2,874,862 | |
| 5% 7/1/26 (Assured Guaranty Muni. Corp. Insured) | 4,900,000 | 5,173,098 | |
| Florida Hsg. Fin. Corp. Multi-family Mtg. Rev. Bonds: | |||
| Series 2023 B, 5%, tender 2/1/26 (b) | 1,550,000 | 1,598,730 | |
| Series 2023 C, 5%, tender 12/1/25 (b) | 1,110,000 | 1,140,509 | |
| Greater Orlando Aviation Auth. Arpt. Facilities Rev. Series 2016 A, 5% 10/1/25 (Escrowed to Maturity) (c) | 575,000 | 591,397 | |
| Hillsborough Co. Sldwst and Resource Receivables Series 2016 A, 5% 9/1/26 (c) | 2,260,000 | 2,390,968 | |
| Hillsborough County Aviation Auth. Rev. Series 2022 A: | |||
| 5% 10/1/24 (c) | 4,570,000 | 4,621,307 | |
| 5% 10/1/25 (c) | 1,860,000 | 1,914,317 | |
| Jacksonville Spl. Rev. Series 2022 A: | |||
| 5% 10/1/24 | 580,000 | 589,302 | |
| 5% 10/1/25 | 455,000 | 473,399 | |
| Lee County Arpt. Rev. Series 2021 A, 5% 10/1/24 (c) | 1,530,000 | 1,546,050 | |
| Lee County Hsg. Fin. Auth. Multi-family Hsg. Rev. Bonds Series 2023 A, 3.55%, tender 8/1/27 (b) | 2,500,000 | 2,498,331 | |
| Miami Dade County Hsg. Multifamily Hsg. Rev. Bonds: | |||
| Series 2023 B, 4.05%, tender 9/1/25 (b) | 1,090,000 | 1,099,771 | |
| Series 2023: | |||
3.55%, tender 1/1/26 (b) | 4,670,000 | 4,672,415 | |
5%, tender 9/1/25 (b) | 3,805,000 | 3,885,802 | |
5%, tender 9/1/25 (b) | 2,090,000 | 2,141,514 | |
5%, tender 10/1/25 (b) | 6,385,000 | 6,579,135 | |
| Miami-Dade County Aviation Rev. Series 2012 A, 5% 10/1/24 | 895,000 | 896,188 | |
| Miami-Dade County Indl. Dev. Auth. Solid Waste Disp. Rev. Bonds Series 2011, 5%, tender 11/1/24 (b)(c) | 3,750,000 | 3,768,870 | |
| Okeechobee County Solid Waste Rev. Bonds (Waste Mgmt., Inc.-Okeechobee Landfill Proj.) Series 2004 A, 0.55%, tender 7/1/24 (b) | 1,500,000 | 1,474,193 | |
| Orange County Health Facilities Auth. Bonds Series 2021 C, 5%, tender 11/15/26 (b) | 2,860,000 | 3,022,382 | |
| Orlando Utils. Commission Util. Sys. Rev. Series 2013 A, 5% 10/1/24 | 500,000 | 507,759 | |
| Pasco County Tax Alloc Series 2023 A, 5.25% 9/1/25 (Assured Guaranty Muni. Corp. Insured) | 250,000 | 258,760 | |
| Pasco County School Board Ctfs. of Prtn. Series 2022 A, 5% 8/1/26 | 1,045,000 | 1,103,352 | |
| Polk County Hsg. Fin. Auth. Multi-family Hsg. Rev. Bonds Series 2023, 4.15%, tender 6/1/26 (b) | 2,040,000 | 2,079,353 | |
TOTAL FLORIDA | 67,834,996 | ||
| Georgia - 0.8% | |||
| Atlanta Arpt. Rev.: | |||
| Series 2014 C, 5% 1/1/24 (c) | 2,400,000 | 2,400,000 | |
| Series 2020 B, 5% 7/1/25 (c) | 1,115,000 | 1,141,601 | |
| Burke County Indl. Dev. Auth. Poll. Cont. Rev. Bonds (Georgia Pwr. Co. Plant Vogtle Proj.): | |||
| Series 1994 4, 3.8%, tender 5/21/26 (b) | 2,970,000 | 2,992,514 | |
| Series 2012, 2.875%, tender 8/19/25 (b) | 3,575,000 | 3,511,370 | |
| Fayette County Hosp. Auth. Rev. Bonds (Piedmont Healthcare, Inc. Proj.) Series 2019 A, 5%, tender 7/1/24 (b) | 1,140,000 | 1,141,248 | |
| Georgia Muni. Elec. Auth. Pwr. Rev.: | |||
| Series 2021 A: | |||
5% 1/1/24 | 335,000 | 335,000 | |
5% 1/1/25 (Assured Guaranty Muni. Corp. Insured) | 200,000 | 203,699 | |
| Series 2022 A: | |||
5% 7/1/24 (Assured Guaranty Muni. Corp. Insured) | 335,000 | 337,616 | |
5% 7/1/25 (Assured Guaranty Muni. Corp. Insured) | 350,000 | 359,071 | |
5% 7/1/26 (Assured Guaranty Muni. Corp. Insured) | 365,000 | 384,801 | |
| Main Street Natural Gas, Inc.: | |||
| Bonds Series 2019 B, 4%, tender 12/2/24 (b) | 2,030,000 | 2,034,506 | |
| Series 2022 A, 4% 12/1/25 | 1,260,000 | 1,261,138 | |
| Series 2023 B: | |||
5% 9/1/25 | 350,000 | 357,716 | |
5% 9/1/26 | 675,000 | 701,596 | |
| Series 2023 D: | |||
5% 12/1/24 | 300,000 | 302,506 | |
5% 12/1/25 | 550,000 | 561,030 | |
5% 12/1/26 | 305,000 | 314,881 | |
| Monroe County Dev. Auth. Poll. Cont. Rev. Bonds (Georgia Pwr. Co. Plant Scherer Proj.) Series 2012, 3.875%, tender 3/6/26 (b) | 2,715,000 | 2,737,695 | |
TOTAL GEORGIA | 21,077,988 | ||
| Guam - 0.1% | |||
| Guam Pwr. Auth. Rev. Series 2022 A: | |||
| 5% 10/1/24 | 1,235,000 | 1,245,776 | |
| 5% 10/1/25 | 1,545,000 | 1,580,348 | |
TOTAL GUAM | 2,826,124 | ||
| Hawaii - 0.2% | |||
| Honolulu City & County Multi-family housing Rev. Bonds Series 2023, 5%, tender 6/1/26 (b) | 5,480,000 | 5,699,239 | |
| Illinois - 5.2% | |||
| Chicago Midway Arpt. Rev. Series 2023, 5% 1/1/27 (Build America Mutual Assurance Insured) (c) | 1,000,000 | 1,050,182 | |
| Chicago O'Hare Int'l. Arpt. Rev.: | |||
| Series 2022 A, 5% 1/1/25 (c) | 1,095,000 | 1,110,625 | |
| Series 2022 C: | |||
5% 1/1/25 (c) | 2,250,000 | 2,282,105 | |
5% 1/1/26 (c) | 1,200,000 | 1,237,122 | |
| Chicago Park District Gen. Oblig.: | |||
| Series 2014 B, 5% 1/1/24 | 615,000 | 615,000 | |
| Series 2021 D, 4% 1/1/24 | 100,000 | 100,000 | |
| Series 2021 E, 4% 1/1/24 | 1,340,000 | 1,340,000 | |
| Chicago Transit Auth. Cap. Grant Receipts Rev. Series 2021, 5% 6/1/24 | 625,000 | 628,510 | |
| Chicago Wtr. Rev.: | |||
| Series 2017 2, 5% 11/1/24 | 1,000,000 | 1,013,503 | |
| Series 2023 B: | |||
5% 11/1/24 | 1,250,000 | 1,266,879 | |
5% 11/1/25 | 1,000,000 | 1,032,835 | |
| Cook County Gen. Oblig.: | |||
| Series 2021 A, 5% 11/15/24 | 450,000 | 457,550 | |
| Series 2022 A: | |||
5% 11/15/24 | 5,940,000 | 6,039,659 | |
5% 11/15/25 | 4,370,000 | 4,541,336 | |
| Cook County Sales Tax Rev. Series 2022 A, 5% 11/15/25 | 675,000 | 701,465 | |
| Illinois Dev. Fin. Auth. Solid Waste Disp. Rev. Bonds (Waste Mgmt., Inc. Proj.) Series 2019, 5%, tender 11/1/24 (b)(c) | 12,500,000 | 12,562,900 | |
| Illinois Fin. Auth. Series 2022 A, 5% 10/1/24 | 160,000 | 160,647 | |
| Illinois Gen. Oblig.: | |||
| Series 2016, 5% 11/1/24 | 800,000 | 811,504 | |
| Series 2017 D: | |||
5% 11/1/24 | 26,200,000 | 26,578,582 | |
5% 11/1/26 | 1,460,000 | 1,539,542 | |
| Series 2019 B, 5% 9/1/25 | 595,000 | 612,866 | |
| Series 2022 A, 5% 3/1/25 | 2,070,000 | 2,112,841 | |
| Series 2022 B: | |||
5% 3/1/24 | 4,105,000 | 4,114,944 | |
5% 3/1/25 | 16,255,000 | 16,591,413 | |
5% 3/1/26 | 6,060,000 | 6,300,560 | |
| Series 2023 C, 5% 5/1/26 | 4,000,000 | 4,175,927 | |
| Series 2023 D, 5% 7/1/25 | 12,565,000 | 12,907,805 | |
| Illinois Hsg. Dev. Auth. Multi-family Hsg. Rev. Bonds Series 2023: | |||
| 4%, tender 6/1/25 (b) | 2,940,000 | 2,957,332 | |
| 5%, tender 2/1/26 (b) | 1,405,000 | 1,446,039 | |
| 5%, tender 2/1/26 (b) | 1,520,000 | 1,564,398 | |
| Illinois Sales Tax Rev.: | |||
| Series 2021 A, 4% 6/15/24 | 3,195,000 | 3,205,108 | |
| Series 2021 C, 5% 6/15/25 | 270,000 | 276,134 | |
| Metropolitan Pier & Exposition: | |||
| Series 2010 B1, 0% 6/15/26 (Assured Guaranty Muni. Corp. Insured) | 1,130,000 | 1,043,109 | |
| Series 2022 A, 3% 6/15/24 | 1,870,000 | 1,861,902 | |
| Railsplitter Tobacco Settlement Auth. Rev. Series 2017: | |||
| 5% 6/1/24 (Escrowed to Maturity) | 1,535,000 | 1,547,084 | |
| 5% 6/1/26 (Escrowed to Maturity) | 1,000,000 | 1,053,799 | |
| Sales Tax Securitization Corp.: | |||
| Series 2023 C, 5% 1/1/24 | 4,630,000 | 4,630,000 | |
| Series 2023 D, 5% 1/1/24 | 2,315,000 | 2,315,000 | |
| Univ. of Illinois Rev. Series 2023, 5% 10/1/27 | 400,000 | 429,601 | |
TOTAL ILLINOIS | 134,215,808 | ||
| Indiana - 1.2% | |||
| Indianapolis Local Pub. Impt.: | |||
| (Indianapolis Arpt. Auth. Proj.): | |||
Series 2015 I, 4% 1/1/24 (c) | 7,740,000 | 7,740,000 | |
Series 2019 D, 5% 1/1/25 (c) | 5,765,000 | 5,846,697 | |
| Indianapolis Arpt. Auth. Proj. Series 2019 D, 5% 1/1/26 (c) | 4,775,000 | 4,922,715 | |
| Series 2016, 5% 1/1/26 (c) | 2,000,000 | 2,061,870 | |
| Series 2022 G2: | |||
5% 1/1/25 (c) | 85,000 | 86,205 | |
5% 1/1/26 (c) | 405,000 | 417,529 | |
| Indianapolis Local Pub. Impt. Bond Bank (Indianapolis Arpt. Auth. Proj.) Series 2023 I2: | |||
| 5% 1/1/25 (c) | 1,715,000 | 1,739,304 | |
| 5% 1/1/26 (c) | 1,050,000 | 1,082,482 | |
| 5% 1/1/27 (c) | 2,100,000 | 2,199,265 | |
| Whiting Envir. Facilities Rev. Bonds (BP Products North America, Inc. Proj.) Series 2017, 5%, tender 11/1/24 (b)(c) | 5,865,000 | 5,895,313 | |
TOTAL INDIANA | 31,991,380 | ||
| Iowa - 0.0% | |||
| Iowa Student Ln. Liquidity Corp. Student Ln. Rev.: | |||
| Series 2015 A, 5% 12/1/24 (c) | 500,000 | 505,697 | |
| Series 2023 B, 5% 12/1/26 (c) | 600,000 | 624,140 | |
TOTAL IOWA | 1,129,837 | ||
| Kansas - 0.0% | |||
| Olathe Gen. Oblig. Series 2017 230, 2.5% 10/1/27 | 1,130,000 | 1,095,084 | |
| Kentucky - 0.9% | |||
| Kentucky Asset/Liability Commission Gen. Fund Rev. Series 2021 A, 5% 11/1/24 | 1,000,000 | 1,015,557 | |
| Kentucky, Inc. Pub. Energy Bonds: | |||
| Series 2018 A, 4%, tender 3/15/24 (b) | 3,845,000 | 3,854,679 | |
| Series C1, 4%, tender 6/1/25 (b) | 5,070,000 | 5,079,042 | |
| Trimble County Envirl Facilities Re Bonds Series 2023, 4.7%, tender 6/1/27 (b)(c) | 12,995,000 | 13,194,963 | |
TOTAL KENTUCKY | 23,144,241 | ||
| Louisiana - 0.1% | |||
| St. John Baptist Parish Rev. Bonds (Marathon Oil Corp.) Series 2017, 4.05%, tender 7/1/26 (b) | 2,855,000 | 2,823,011 | |
| Maine - 0.2% | |||
| Maine Hsg. Auth. Mtg. Bonds Series 2023 B, 3.125%, tender 5/1/24 (b) | 5,390,000 | 5,390,000 | |
| Maryland - 0.5% | |||
| Maryland Cmnty. Dev. Admin Dept. Hsg. & Cmnty. Dev. Series 2023 D, 3.5% 1/1/26 | 7,570,000 | 7,591,309 | |
| Maryland Dept. of Trans. Series 2022 A, 5% 12/1/24 | 550,000 | 560,883 | |
| Maryland Health & Higher Edl. Bonds Series 2020, 5%, tender 7/1/25 (b) | 2,755,000 | 2,802,152 | |
| Maryland Stadium Auth. Built to Learn Rev. Series 2022 A: | |||
| 5% 6/1/24 | 730,000 | 735,717 | |
| 5% 6/1/25 | 905,000 | 931,372 | |
| Maryland Trans. Auth. Passenger Facility Charge Rev. Series 2019, 5% 6/1/24 (c) | 1,000,000 | 1,004,717 | |
TOTAL MARYLAND | 13,626,150 | ||
| Massachusetts - 1.6% | |||
| Massachusetts Dev. Fin. Agcy. Rev.: | |||
| Series 2016 I, 5% 7/1/25 | 1,150,000 | 1,180,822 | |
| Series 2021 I, 5% 10/1/24 | 900,000 | 910,834 | |
| Massachusetts Edl. Fing. Auth. Rev.: | |||
| Series 2014 I, 5% 1/1/25 (c) | 3,400,000 | 3,449,514 | |
| Series 2015 A, 5% 1/1/24 (c) | 18,160,000 | 18,160,000 | |
| Series 2017 A, 5% 7/1/25 (c) | 1,430,000 | 1,462,646 | |
| Series 2018 B, 5% 7/1/25 (c) | 5,380,000 | 5,502,822 | |
| Series 2019 B, 5% 7/1/25 (c) | 1,000,000 | 1,022,829 | |
| Series 2020 C, 5% 7/1/24 (c) | 600,000 | 604,245 | |
| Series 2022 B: | |||
5% 7/1/24 (c) | 525,000 | 528,714 | |
5% 7/1/25 (c) | 2,800,000 | 2,863,922 | |
| Massachusetts School Bldg. Auth. Dedicated Sales Tax Rev. Series 2015 C, 5% 8/15/27 | 4,605,000 | 4,779,557 | |
TOTAL MASSACHUSETTS | 40,465,905 | ||
| Michigan - 0.8% | |||
| Michigan Fin. Auth. Rev.: | |||
| (Detroit Reg'l. Convention Facility Auth. Local Proj.) Series 2014 H1, 5% 10/1/24 | 850,000 | 851,128 | |
| Series 2015 D1, 0.55% 10/15/24 | 1,700,000 | 1,662,789 | |
| Series 2022: | |||
5% 4/15/25 | 2,840,000 | 2,909,040 | |
5% 4/15/26 | 4,735,000 | 4,945,288 | |
| Michigan Gen. Oblig. Series 2016, 5% 3/15/24 | 500,000 | 502,062 | |
| Michigan Hsg. Dev. Auth. Single Family Mtg. Rev. Series 2022 A, 2.5% 6/1/25 | 1,215,000 | 1,188,596 | |
| Oakland Univ. Rev.: | |||
| Series 2022 A: | |||
5% 3/1/24 | 175,000 | 175,510 | |
5% 3/1/25 | 200,000 | 204,605 | |
| Series 2022 B: | |||
5% 3/1/24 | 350,000 | 351,021 | |
5% 3/1/25 | 1,185,000 | 1,212,283 | |
| Southfield Pub. Schools Series 2023: | |||
| 5% 5/1/25 | 2,000,000 | 2,056,822 | |
| 5% 5/1/26 | 2,325,000 | 2,448,305 | |
| Wayne County Arpt. Auth. Rev.: | |||
| Series 2015 F, 5% 12/1/26 (c) | 890,000 | 907,957 | |
| Series 2017 E, 4% 12/1/25 (c)(d) | 1,725,000 | 1,738,576 | |
TOTAL MICHIGAN | 21,153,982 | ||
| Minnesota - 0.4% | |||
| Minneapolis & Saint Paul Metropolitan Arpts. Commission Arpt. Rev. Series 2022 B: | |||
| 5% 1/1/24 (c) | 565,000 | 565,000 | |
| 5% 1/1/25 (c) | 1,370,000 | 1,390,623 | |
| 5% 1/1/26 (c) | 905,000 | 932,996 | |
| Minnesota Hsg. Fin. Agcy.: | |||
| Series 2022 A, 5% 8/1/24 | 910,000 | 920,232 | |
| Series 2022 B: | |||
5% 8/1/24 | 1,155,000 | 1,167,987 | |
5% 8/1/25 | 1,710,000 | 1,765,390 | |
5% 8/1/26 | 1,700,000 | 1,795,796 | |
| Series H, 0.7% 7/1/24 (c) | 200,000 | 196,178 | |
| Northern Muni. Pwr. Agcy. Elec. Sys. Rev. Series 2023: | |||
| 5% 1/1/25 | 325,000 | 330,818 | |
| 5% 1/1/26 | 375,000 | 389,393 | |
| 5% 1/1/27 | 575,000 | 609,931 | |
TOTAL MINNESOTA | 10,064,344 | ||
| Missouri - 0.1% | |||
| Kansas City Planned Indl. Expansion Bonds Series 2023, 5%, tender 7/1/27 (b) | 2,405,000 | 2,520,753 | |
| Nebraska - 0.2% | |||
| Central Plains Energy Proj. Rev. Bonds Series 2019, 2.5%, tender 8/1/25 (b) | 3,510,000 | 3,428,280 | |
| Nebraska Pub. Pwr. District Rev. Series 2017 B, 5% 1/1/25 | 650,000 | 663,304 | |
TOTAL NEBRASKA | 4,091,584 | ||
| Nevada - 0.9% | |||
| Clark County Arpt. Rev. Series 2021 B, 5% 7/1/24 (c) | 3,720,000 | 3,747,230 | |
| Clark County Poll. Cont. Rev. Bonds (Nevada Pwr. Co. Proj.) Series 2017, 3.75%, tender 3/31/26 (b) | 1,435,000 | 1,451,171 | |
| Clark County School District: | |||
| Series 2015 C, 5% 6/15/27 | 1,800,000 | 1,877,754 | |
| Series 2016 F, 4% 6/15/24 | 500,000 | 500,298 | |
| Series 2020 A, 3% 6/15/25 (Assured Guaranty Muni. Corp. Insured) | 500,000 | 500,292 | |
| Series 2021 C, 5% 6/15/25 | 4,875,000 | 5,016,606 | |
| Nevada Dept. of Bus. & Industry Bonds: | |||
| (Republic Svcs., Inc. Proj.) Series 2001, 4.5%, tender 6/3/24 (b)(c)(d) | 4,000,000 | 4,003,060 | |
| Series 2023 A, 3.7%, tender 1/31/24 (b)(c)(d) | 4,900,000 | 4,894,812 | |
TOTAL NEVADA | 21,991,223 | ||
| New Hampshire - 0.4% | |||
| Nat'l. Fin. Auth. Solid Bonds (Waste Mgmt., Inc. Proj.) Series 2019 A2, 2.15%, tender 7/1/24 (b)(c) | 4,000,000 | 3,962,190 | |
| New Hampshire Health & Ed. Facilities Auth. Series 2023 B, 5.5% 11/1/26 (c) | 300,000 | 317,607 | |
| New Hampshire St Hsg. Fin.: | |||
| Series 2023 3: | |||
3.8% 7/1/26 | 1,070,000 | 1,080,214 | |
3.85% 1/1/27 | 1,700,000 | 1,723,501 | |
| Series 2023 4: | |||
3.625% 4/1/26 | 575,000 | 576,843 | |
3.7% 1/1/27 | 1,845,000 | 1,853,374 | |
TOTAL NEW HAMPSHIRE | 9,513,729 | ||
| New Jersey - 3.5% | |||
| Harrison Township Series 2023, 5% 11/27/24 | 4,268,400 | 4,329,736 | |
| Millburn Township Board of Ed. Series 2023, 0.05% 8/15/25 | 1,150,000 | 1,089,447 | |
| New Jersey Econ. Dev. Auth.: | |||
| Series 2022 A: | |||
5% 11/1/24 | 825,000 | 838,645 | |
5% 11/1/25 | 1,000,000 | 1,039,711 | |
| Series 2023 RRR: | |||
5% 3/1/25 | 7,050,000 | 7,217,825 | |
5% 3/1/26 | 5,425,000 | 5,676,466 | |
| Series 2024 SSS, 5% 6/15/26 (e) | 3,615,000 | 3,773,311 | |
| New Jersey Econ. Dev. Auth. Rev.: | |||
| Series 2015 XX: | |||
4% 6/15/24 | 1,345,000 | 1,351,011 | |
5% 6/15/24 | 3,490,000 | 3,521,069 | |
| Series 2019: | |||
5.25% 9/1/24 (d) | 12,690,000 | 12,878,537 | |
5.25% 9/1/26 (d) | 2,900,000 | 3,085,582 | |
| New Jersey Edl. Facility: | |||
| Series 2016 A, 5% 7/1/24 | 4,740,000 | 4,781,904 | |
| Series 2016 C, 5% 7/1/24 (Assured Guaranty Muni. Corp. Insured) | 1,000,000 | 1,009,578 | |
| New Jersey Gen. Oblig.: | |||
| Series 2020 A: | |||
5% 6/1/24 | 1,080,000 | 1,089,302 | |
5% 6/1/25 | 4,700,000 | 4,849,498 | |
| Series 2021, 2% 6/1/25 | 1,585,000 | 1,553,823 | |
| New Jersey Higher Ed. Student Assistance Auth. Student Ln. Rev.: | |||
| Series 2016 1A, 5% 12/1/24 (c) | 4,400,000 | 4,452,900 | |
| Series 2017 1A: | |||
5% 12/1/24 (c) | 1,500,000 | 1,518,034 | |
5% 12/1/25 (c) | 2,860,000 | 2,940,211 | |
| Series 2018 B, 5% 12/1/26 (c) | 1,000,000 | 1,040,795 | |
| Series 2019 A, 5% 12/1/24 | 555,000 | 564,573 | |
| Series 2020, 5% 12/1/24 (c) | 1,100,000 | 1,113,225 | |
| Series 2021 A, 5% 12/1/24 (c) | 330,000 | 333,968 | |
| Series 2022 A: | |||
5% 12/1/24 (c) | 430,000 | 435,170 | |
5% 12/1/25 (c) | 550,000 | 565,425 | |
| Series 2022 B: | |||
5% 12/1/24 (c) | 1,770,000 | 1,790,169 | |
5% 12/1/25 (c) | 2,625,000 | 2,698,620 | |
| New Jersey Tobacco Settlement Fing. Corp. Series 2018 A: | |||
| 5% 6/1/24 | 5,050,000 | 5,080,382 | |
| 5% 6/1/25 | 1,565,000 | 1,598,071 | |
| New Jersey Trans. Trust Fund Auth.: | |||
| Series 2006 C, 0% 12/15/24 | 160,000 | 154,675 | |
| Series 2008 A, 0% 12/15/25 | 2,445,000 | 2,287,624 | |
| Series 2010 A, 0% 12/15/25 | 1,050,000 | 982,415 | |
| Series 2016 A1, 5% 6/15/24 | 975,000 | 983,099 | |
| Series 2018 A, 5% 6/15/24 | 1,205,000 | 1,214,631 | |
| Series 2022 AA: | |||
5% 6/15/24 | 1,090,000 | 1,099,704 | |
5% 6/15/25 | 420,000 | 432,763 | |
TOTAL NEW JERSEY | 89,371,899 | ||
| New York - 2.7% | |||
| East Hampton Union Free School District Series 2017, 2.1% 6/1/27 | 2,020,000 | 1,949,074 | |
| Long Island Pwr. Auth. Elec. Sys. Rev.: | |||
| Bonds Series 2019 B, 1.65%, tender 9/1/24 (b) | 2,675,000 | 2,641,249 | |
| Series 2021, 1% 9/1/25 | 2,195,000 | 2,087,538 | |
| Monroe County Indl. Dev. Agcy. Bonds (Andrews Terrace Cmnty. Partners, L.P. Proj.) Series 2023 B1, 5%, tender 7/1/27 (b) | 1,490,000 | 1,567,486 | |
| New York City Gen. Oblig. Bonds Series 2015 F4, 5%, tender 12/1/25 (f) | 910,000 | 935,083 | |
| New York City Hsg. Dev. Corp. Multifamily Hsg. Bonds Series 2021 K2, 0.9%, tender 1/1/26 (b) | 1,250,000 | 1,164,647 | |
| New York City Indl. Dev. Agcy. Rev.: | |||
| (Queens Baseball Stadium Proj.) Series 2021 A, 5% 1/1/24 (Assured Guaranty Corp. Insured) | 675,000 | 675,000 | |
| Series 2021 A, 5% 1/1/26 (Assured Guaranty Muni. Corp. Insured) | 600,000 | 622,085 | |
| New York City Transitional Fin. Auth. Rev. Series 2015 C, 5% 11/1/27 | 3,000,000 | 3,082,856 | |
| New York Metropolitan Trans. Auth. Rev.: | |||
| Bonds: | |||
Series 2019 A1, 5%, tender 11/15/24 (b) | 23,185,000 | 23,345,853 | |
Series 2020 A2, 5%, tender 5/15/24 (b) | 1,600,000 | 1,607,568 | |
| Series 2015 C1, 5% 11/15/26 | 2,495,000 | 2,570,625 | |
| Series 2017 C1, 5% 11/15/25 | 1,045,000 | 1,085,302 | |
| New York State Hsg. Fin. Agcy. Rev. Bonds Series 2023 E2, 3.8%, tender 5/1/27 (b) | 1,845,000 | 1,852,280 | |
| New York Trans. Dev. Corp.: | |||
| (Term. 4 JFK Int'l. Arpt. Proj.): | |||
Series 2020 A, 5% 12/1/25 (c) | 2,955,000 | 3,032,363 | |
Series 2020 C, 5% 12/1/24 | 1,000,000 | 1,014,991 | |
| (Term. 4 John F. Kennedy Int'l. Arpt. Proj.) Series 2022, 5% 12/1/26 (c) | 5,000,000 | 5,213,832 | |
| Port Auth. of New York & New Jersey Series 2020 221, 5% 7/15/25 (c) | 1,995,000 | 2,049,440 | |
| St. Lawrence County Indl. Dev. (St. Lawrence Univ. Proj.) Series 2022: | |||
| 5% 7/1/25 | 415,000 | 427,042 | |
| 5% 7/1/26 | 400,000 | 420,415 | |
| Syracuse Reg'l. Arpt. Auth. Series 2021, 5% 7/1/24 (c) | 770,000 | 774,544 | |
| Tobacco Settlement Asset Securitization Corp. Series 2017 A, 5% 6/1/25 | 3,115,000 | 3,166,944 | |
| Triborough Bridge & Tunnel Auth. Bonds Series 2021 A2, 2%, tender 5/15/26 (b) | 1,000,000 | 961,854 | |
| Westchester County Indl. Dev. Bonds (Armory Plaza Hsg., L.P. Proj.) Series 2023, 3.625%, tender 6/1/24 (b) | 6,800,000 | 6,798,702 | |
TOTAL NEW YORK | 69,046,773 | ||
| New York And New Jersey - 1.4% | |||
| Port Auth. of New York & New Jersey: | |||
| Series 188, 5% 5/1/24 (c) | 1,990,000 | 2,000,729 | |
| Series 2013, 5% 7/15/25 (c) | 1,015,000 | 1,016,295 | |
| Series 2014 186, 5% 10/15/26 (c) | 5,220,000 | 5,262,844 | |
| Series 2016 195, 5% 10/1/25 (c) | 1,930,000 | 1,991,005 | |
| Series 2018, 5% 9/15/25 (c) | 7,050,000 | 7,266,361 | |
| Series 2023 242: | |||
5% 12/1/24 (c) | 1,270,000 | 1,289,382 | |
5% 12/1/25 (c) | 4,215,000 | 4,345,833 | |
5% 12/1/26 (c) | 8,650,000 | 9,090,987 | |
| Series 223: | |||
5% 7/15/24 (c) | 3,250,000 | 3,278,489 | |
5% 7/15/25 (c) | 515,000 | 529,053 | |
TOTAL NEW YORK AND NEW JERSEY | 36,070,978 | ||
| North Carolina - 0.7% | |||
| Charlotte-Mecklenburg Hosp. Auth. Health Care Sys. Rev. Bonds: | |||
| Series 2018 C, 3.45%, tender 10/31/25 (b) | 5,390,000 | 5,420,715 | |
| Series 2021 B, 5%, tender 12/2/24 (b) | 2,525,000 | 2,562,763 | |
| Series 2023 D, 3.625%, tender 6/15/27 (b) | 4,485,000 | 4,531,811 | |
| North Carolina Med. Care Commission Hosp. Rev. Bonds Series 2021 B, 5%, tender 2/1/26 (b) | 3,975,000 | 4,128,332 | |
TOTAL NORTH CAROLINA | 16,643,621 | ||
| Ohio - 0.9% | |||
| American Muni. Pwr., Inc. Rev. Series 2023 A: | |||
| 5% 2/15/25 | 875,000 | 894,805 | |
| 5% 2/15/26 | 4,925,000 | 5,132,558 | |
| 5% 2/15/27 | 7,735,000 | 8,246,857 | |
| Columbus-Franklin County Fin. Auth. Bonds (Dering Family Homes Proj.) Series 2023, 5%, tender 2/1/27 (b) | 2,098,000 | 2,184,487 | |
| Lancaster Port Auth. Gas Rev. Bonds Series 2019, 5%, tender 2/1/25 (b) | 2,025,000 | 2,050,858 | |
| Montgomery County Hosp. Rev. (Kettering Health Network Obligated Group Proj.) Series 2021, 5% 8/1/24 | 200,000 | 201,847 | |
| Northeast Ohio Med. Univ. Series 2022: | |||
| 5% 12/1/24 (Build America Mutual Assurance Insured) | 250,000 | 254,199 | |
| 5% 12/1/25 (Build America Mutual Assurance Insured) | 265,000 | 273,574 | |
| Ohio Higher Edl. Facility Commission Rev.: | |||
| (Xavier Univ. 2020 Proj.) Series 2020, 5% 5/1/26 | 1,100,000 | 1,154,775 | |
| Bonds (Case Western Reserve Univ. Proj.) Series 2019 C, 1.625%, tender 12/1/26 (b) | 1,155,000 | 1,101,326 | |
| Ohio Tpk. Commission Tpk. Rev. (Infrastructure Projs.) Series 2022 A, 5% 2/15/25 | 1,840,000 | 1,884,918 | |
TOTAL OHIO | 23,380,204 | ||
| Oklahoma - 0.4% | |||
| Oklahoma County Independent School District #89 Oklahoma City Series 2023 A, 3% 7/1/26 | 11,235,000 | 11,298,124 | |
| Oregon - 0.7% | |||
| Gilliam County Solid Waste Disp. Rev. Bonds (Waste Mgmt., Inc. Proj.): | |||
| Series 2000 A, 3.95%, tender 5/1/24 (b)(c) | 5,250,000 | 5,236,578 | |
| Series 2003 A, 3.95%, tender 5/1/24 (b)(c) | 5,000,000 | 4,991,942 | |
| Port of Portland Arpt. Rev.: | |||
| Series 2020 26B, 5% 7/1/26 | 1,600,000 | 1,657,844 | |
| Series 2022: | |||
5% 7/1/24 (c) | 2,000,000 | 2,014,248 | |
5% 7/1/25 (c) | 2,810,000 | 2,877,038 | |
| Series 24B, 5% 7/1/25 (c) | 1,000,000 | 1,023,857 | |
TOTAL OREGON | 17,801,507 | ||
| Pennsylvania - 6.2% | |||
| Allegheny County Arpt. Auth. Rev.: | |||
| Series 2021 A, 5% 1/1/27 (c) | 1,030,000 | 1,078,388 | |
| Series 2023 A, 5% 1/1/27 (Assured Guaranty Muni. Corp. Insured) (c) | 850,000 | 893,399 | |
| Geisinger Auth. Health Sys. Rev. Bonds Series 2020 B, 5%, tender 2/15/27 (b) | 6,255,000 | 6,529,859 | |
| Pennsylvania Econ. Dev. Fing. Auth.: | |||
| Series 2021 A, 4% 10/15/24 | 850,000 | 855,944 | |
| Series 2022 A: | |||
5% 2/15/25 | 160,000 | 163,444 | |
5% 2/15/26 | 200,000 | 208,387 | |
| Pennsylvania Econ. Dev. Fing. Auth. Indl. Dev. Rev. Series 2016, 5% 3/15/24 | 1,250,000 | 1,254,421 | |
| Pennsylvania Econ. Dev. Fing. Auth. Solid Waste Disp. Rev. Bonds: | |||
| (Republic Svcs., Inc. Proj.): | |||
Series 2019 A, 4.6%, tender 1/16/24 (b)(c) | 8,350,000 | 8,349,633 | |
Series 2019 B1, 4.6%, tender 1/16/24 (b)(c) | 9,600,000 | 9,599,578 | |
| (Republic Svcs., Inc. Proj.) Series 2014, 4.6%, tender 1/3/24 (b)(c) | 45,000,000 | 45,000,000 | |
| (Waste Mgmt., Inc. Proj.) Series 2013, 4.875%, tender 2/1/24 (b)(c) | 21,300,000 | 21,306,688 | |
| (Waste Mgmt., Inc. Proj.): | |||
Series 2017 A, 0.58%, tender 8/1/24 (b)(c) | 2,200,000 | 2,154,996 | |
Series 2021 A, SIFMA Municipal Swap Index + 0.400% 4.27%, tender 1/4/24 (b)(c)(g) | 2,845,000 | 2,832,337 | |
Series 2021 A2, 4.6%, tender 10/1/26 (b)(c) | 25,000,000 | 25,264,555 | |
| Series 2011, 2.15%, tender 7/1/24 (b)(c) | 850,000 | 841,558 | |
| Pennsylvania Gen. Oblig. Series 2023: | |||
| 5% 9/1/26 | 12,580,000 | 13,382,356 | |
| 5% 9/1/27 | 12,580,000 | 13,703,051 | |
| Pennsylvania Hsg. Fin. Agcy.: | |||
| Series 2021 135 B: | |||
5% 4/1/24 (c) | 230,000 | 230,631 | |
5% 4/1/25 (c) | 380,000 | 385,940 | |
| Series 2022 138: | |||
5% 4/1/24 | 1,060,000 | 1,064,737 | |
5% 10/1/24 | 1,970,000 | 1,994,443 | |
5% 10/1/25 | 1,100,000 | 1,135,149 | |
| Philadelphia Arpt. Rev. Series 2021: | |||
| 5% 7/1/24 (c) | 945,000 | 951,270 | |
| 5% 7/1/26 (c) | 1,000,000 | 1,038,069 | |
TOTAL PENNSYLVANIA | 160,218,833 | ||
| Rhode Island - 0.0% | |||
| Rhode Island Student Ln. Auth. Student Ln. Rev. Series 2018 A, 5% 12/1/25 (c) | 875,000 | 899,540 | |
| South Carolina - 1.9% | |||
| Patriots Energy Group Fing. Agcy. Bonds Series 2018 A, 4%, tender 2/1/24 (b) | 39,575,000 | 39,595,152 | |
| South Carolina Ports Auth. Ports Rev.: | |||
| Series 2015 (AMT), 5% 7/1/45 (Pre-Refunded to 7/1/25 @ 100) (c) | 2,600,000 | 2,663,939 | |
| Series 2015: | |||
5.25% 7/1/50 (Pre-Refunded to 7/1/25 @ 100) (c) | 4,525,000 | 4,652,643 | |
5.25% 7/1/55 (Pre-Refunded to 7/1/25 @ 100) (c) | 2,170,000 | 2,231,212 | |
TOTAL SOUTH CAROLINA | 49,142,946 | ||
| South Dakota - 0.3% | |||
| South Dakota Health & Edl. Facilities Auth. Rev. Bonds Series 2019 A, 5%, tender 7/1/24 (b) | 1,000,000 | 1,003,384 | |
| South Dakota Hsg. Dev. Auth. Bonds Series 2023 J, 3.875%, tender 12/12/24 (b) | 7,200,000 | 7,232,018 | |
TOTAL SOUTH DAKOTA | 8,235,402 | ||
| Tennessee - 1.0% | |||
| Memphis-Shelby County Arpt. Auth. Arpt. Rev. Series 2021 C, 1.875% 7/1/25 (c) | 1,245,000 | 1,197,492 | |
| Metropolitan Gov Nashvle&David Ind. Bonds (Waste Mgmt., Inc. Proj.) Series 2001, 0.58%, tender 8/1/24 (b)(c) | 900,000 | 882,088 | |
| Metropolitan Nashville Arpt. Auth. Rev. Series 2022 B: | |||
| 5% 7/1/26 (c) | 675,000 | 702,338 | |
| 5% 7/1/27 (c) | 1,025,000 | 1,084,541 | |
| Tennergy Corp. Gas Rev. Bonds Series 2019 A, 5%, tender 10/1/24 (b) | 21,250,000 | 21,434,767 | |
TOTAL TENNESSEE | 25,301,226 | ||
| Texas - 4.7% | |||
| Austin Arpt. Sys. Rev.: | |||
| Series 2019, 5% 11/15/24 (c) | 1,375,000 | 1,389,463 | |
| Series 2022, 5% 11/15/25 (c) | 1,910,000 | 1,959,272 | |
| Bexar County Gen. Oblig. Series 2014, 5% 6/15/25 | 1,835,000 | 1,854,057 | |
| Clear Creek Independent School District Bonds Series 2013 B, 3.6%, tender 8/15/25 (b) | 1,460,000 | 1,473,325 | |
| Crandall Independent School District Series 2021 A, 0% 8/15/24 | 765,000 | 749,977 | |
| Cuero Independent School District Series 2017, 5% 8/15/26 | 1,955,000 | 2,071,181 | |
| Dallas Gen. Oblig.: | |||
| Series 2023 A, 5% 2/15/25 | 3,720,000 | 3,808,330 | |
| Series 2023, 5% 2/15/25 | 5,520,000 | 5,651,071 | |
| Dallas Hsg. Fin. Corp. Multi-family Hsg. Rev. Bonds Series 2023: | |||
| 5%, tender 12/1/25 (b) | 2,350,000 | 2,418,103 | |
| 5%, tender 3/1/26 (b) | 2,930,000 | 3,007,968 | |
| 5%, tender 7/1/27 (b) | 3,120,000 | 3,271,074 | |
| Hays Consolidated Independent School District Series 2022: | |||
| 5% 2/15/25 | 500,000 | 511,372 | |
| 5% 2/15/26 | 700,000 | 734,356 | |
| Houston Convention and Entertainment Facilities Dept. Hotel Occupancy Tax and Spl. Rev. Series 2014, 5% 9/1/26 | 1,500,000 | 1,512,761 | |
| Houston Hsg. Fin. Corp. Multi-family Hsg. Rev. Bonds Series 2023, 5%, tender 8/1/26 (b) | 1,700,000 | 1,751,575 | |
| Houston Independent School District Bonds: | |||
| Series 2014 A2, 3.5%, tender 6/1/25 (b) | 8,940,000 | 8,994,240 | |
| Series 2023 C, 4%, tender 6/1/25 (b) | 8,040,000 | 8,143,867 | |
| Lower Colorado River Auth. Rev.: | |||
| (LCRA Transmission Svcs. Corp. Proj.): | |||
Series 2015, 5% 5/15/24 | 1,080,000 | 1,087,742 | |
Series 2018, 5% 5/15/24 | 2,095,000 | 2,110,018 | |
Series 2020, 5% 5/15/25 | 570,000 | 586,492 | |
| Series 2020, 5% 5/15/24 | 760,000 | 765,448 | |
| Series 2022, 5% 5/15/24 (Assured Guaranty Muni. Corp. Insured) | 1,630,000 | 1,641,685 | |
| Mission Econ. Dev. Corp. Solid Waste Disp. Rev. Bonds: | |||
| (Republic Svcs., Inc. Proj.) Series 2020 A, 4.9%, tender 2/1/24 (b)(c) | 22,500,000 | 22,503,227 | |
| (Waste Mgmt., Inc. Proj.) Series 2018, 0.000% x SIFMA Municipal Swap Index 4.245%, tender 1/4/24 (b)(c)(g) | 6,835,000 | 6,799,291 | |
| North East Texas Independent School District Series 2015, 3% 8/1/27 | 1,720,000 | 1,721,265 | |
| North Texas Tollway Auth. Rev.: | |||
| Series 2014: | |||
5% 1/1/24 | 630,000 | 630,000 | |
5% 1/1/24 (Escrowed to Maturity) | 310,000 | 310,000 | |
| Series 2017 A, 5% 1/1/24 | 210,000 | 210,000 | |
| Series 2021 B, 5% 1/1/26 | 1,150,000 | 1,202,326 | |
| Northside Independent School District Bonds Series 2023 B, 3%, tender 8/1/26 (b) | 9,490,000 | 9,440,756 | |
| Port Arthur Independent School District Series 2015 A, 5% 2/15/25 | 615,000 | 630,013 | |
| Prosper Independent School District Bonds Series 2019 B, 4%, tender 8/15/26 (b) | 1,655,000 | 1,689,452 | |
| San Antonio Elec. & Gas Sys. Rev.: | |||
| Bonds Series 2018, SIFMA Municipal Swap Index + 0.870% 4.74%, tender 12/1/25 (b)(g) | 8,480,000 | 8,465,115 | |
| Series 2022, 5% 2/1/26 | 905,000 | 947,921 | |
| Tarrant County Cultural Ed. Facilities Fin. Corp. Hosp. Rev. Bonds (Baylor Scott & White Health Proj.) Series 2022 E, 5%, tender 5/15/26 (b) | 4,240,000 | 4,404,531 | |
| Texas Affordable Hsg. Corp. Multi-family Hsg. Rev. Bonds Series 2023, 3.625%, tender 1/1/27 (b) | 2,150,000 | 2,161,326 | |
| Texas Muni. Gas Acquisition & Su: | |||
| Series 2023 A: | |||
5.25% 1/1/25 | 875,000 | 885,754 | |
5.25% 1/1/26 | 1,000,000 | 1,026,961 | |
5.25% 1/1/27 | 1,000,000 | 1,041,873 | |
| Series 2023 B: | |||
5.25% 1/1/25 | 605,000 | 612,436 | |
5.25% 1/1/26 | 1,200,000 | 1,232,353 | |
| Travis County Hsg. Fin. Corp. Bonds Series 2023, 3.75%, tender 8/1/25 (b) | 490,000 | 491,827 | |
TOTAL TEXAS | 121,899,804 | ||
| Utah - 0.3% | |||
| Salt Lake City Arpt. Rev.: | |||
| Series 2021 A: | |||
5% 7/1/24 (c) | 1,000,000 | 1,006,586 | |
5% 7/1/25 (c) | 1,325,000 | 1,354,472 | |
| Series 2023 A: | |||
5% 7/1/25 (c) | 710,000 | 725,792 | |
5% 7/1/26 (c) | 1,000,000 | 1,040,744 | |
5% 7/1/27 (c) | 940,000 | 996,838 | |
| Utah County Hosp. Rev. Bonds: | |||
| Series 2018 B2, 5%, tender 8/1/24 (b) | 970,000 | 971,321 | |
| Series 2020 B2, 5%, tender 8/1/26 (b) | 2,465,000 | 2,580,070 | |
TOTAL UTAH | 8,675,823 | ||
| Vermont - 0.1% | |||
| Vermont Student Assistant Corp. Ed. Ln. Rev. Series 2016 A, 5% 6/15/26 (c) | 1,700,000 | 1,763,287 | |
| Virginia - 0.6% | |||
| Gloucester County Indl. Dev. Auth. Bonds Series 2003 A, 3.95%, tender 5/1/24 (b)(c) | 1,725,000 | 1,724,007 | |
| Southampton County Indl. Bonds (PRTA-Virginia One, LLC Proj.) Series 2023, 4.875%, tender 12/12/24 (b)(c) | 12,500,000 | 12,530,939 | |
| Wise County Indl. Dev. Auth. Waste & Sewage Rev. Bonds (Virginia Elec. and Pwr. Co. Proj.) Series 2010 A, 1.2%, tender 5/31/24 (b) | 1,795,000 | 1,767,002 | |
TOTAL VIRGINIA | 16,021,948 | ||
| Washington - 1.2% | |||
| King County Swr. Rev. Bonds Series 2020 B, 0.875%, tender 1/1/26 (b) | 5,395,000 | 4,993,798 | |
| Port of Seattle Rev.: | |||
| Series 2015 C, 5% 4/1/24 (c) | 1,200,000 | 1,204,239 | |
| Series 2016 B, 5% 10/1/27 (c) | 1,000,000 | 1,037,444 | |
| Series 2018 A, 5% 5/1/27 (c) | 4,110,000 | 4,341,343 | |
| Series 2018 B, 5% 5/1/24 (c) | 875,000 | 879,200 | |
| Series 2019: | |||
5% 4/1/24 (c) | 760,000 | 762,684 | |
5% 4/1/25 (c) | 525,000 | 535,585 | |
| Series 2021 C, 5% 8/1/24 (c) | 4,675,000 | 4,716,025 | |
| Series 2021, 5% 9/1/24 (c) | 2,220,000 | 2,241,385 | |
| Series 2022 B: | |||
5% 8/1/24 (c) | 2,670,000 | 2,693,431 | |
5% 8/1/25 (c) | 2,515,000 | 2,581,561 | |
5% 8/1/26 (c) | 1,570,000 | 1,637,345 | |
| Seattle Hsg. Auth. Rev. (Juniper Apts. Proj.) Series 2023, 5% 6/1/27 | 1,205,000 | 1,258,487 | |
| Washington Hsg. Fin. Commission Multi-family Hsg. Rev. Bonds (Ardea At Totem Lake Apts. Proj.) Series 2023, 5%, tender 2/1/27 (b) | 2,215,000 | 2,299,868 | |
TOTAL WASHINGTON | 31,182,395 | ||
| West Virginia - 0.4% | |||
| West Virginia Econ. Dev. Auth. Solid Waste Disp. Facilities Rev. Bonds (Allegheny Metallurgical Proj.) Series 2023, 4.75%, tender 8/1/24 (b)(c) | 10,735,000 | 10,770,569 | |
| Wisconsin - 0.7% | |||
| Milwaukee County Arpt. Rev.: | |||
| Series 2023 A: | |||
5% 12/1/24 (c) | 235,000 | 238,121 | |
5% 12/1/26 (c) | 800,000 | 839,193 | |
| Series 2023 B, 5% 12/1/24 (c) | 1,640,000 | 1,661,780 | |
| Milwaukee Gen. Oblig. Series 2016, 2% 3/1/27 | 3,090,000 | 2,941,368 | |
| Pub. Fin. Auth. Health Care Sys. Rev. Series 2023 A, 5% 10/1/24 | 4,445,000 | 4,510,678 | |
| Wisconsin Health & Edl. Facilities Auth. Rev. Series 2022: | |||
| 5% 10/1/24 | 4,465,000 | 4,523,700 | |
| 5% 10/1/25 | 920,000 | 950,983 | |
| Wisconsin Hsg. & Econ. Dev. Auth. Hsg. Rev. Bonds: | |||
| Series 2021 C, 0.61%, tender 5/1/24 (b) | 260,000 | 256,399 | |
| Series 2023 E, 3.875%, tender 5/1/27 (b) | 1,895,000 | 1,904,092 | |
TOTAL WISCONSIN | 17,826,314 | ||
| TOTAL MUNICIPAL BONDS (Cost $1,486,811,891) | 1,487,948,733 | ||
| Municipal Notes - 41.0% | |||
Principal Amount (a) | Value ($) | ||
| Alabama - 2.6% | |||
| Black Belt Energy Gas District Participating VRDN: | |||
| Series XF 30 73, 4.22% 1/5/24 (Liquidity Facility Morgan Stanley Bank, West Valley City Utah) (b)(h)(i) | 19,700,000 | 19,700,000 | |
| Series ZL 03 96, 4.17% 1/5/24 (Liquidity Facility Morgan Stanley Bank, West Valley City Utah) (b)(h)(i) | 4,400,000 | 4,400,000 | |
| Series ZL 03 97, 4.17% 1/5/24 (Liquidity Facility Morgan Stanley Bank, West Valley City Utah) (b)(h)(i) | 4,490,000 | 4,490,000 | |
| Decatur Indl. Dev. Board Exempt Facilities Rev. (Nucor Steel Decatur LLC Proj.) Series 2003 A, 4.39% 1/5/24, VRDN (b)(c) | 3,860,000 | 3,860,000 | |
| Health Care Auth. for Baptist Health Series 2013 B, 5.21% 1/5/24, VRDN (b) | 4,451,000 | 4,451,000 | |
| Southeast Energy Auth. Rev. Participating VRDN: | |||
| Series XG 04 10, 4.17% 1/5/24 (Liquidity Facility Morgan Stanley Bank, West Valley City Utah) (b)(h)(i) | 21,400,000 | 21,400,000 | |
| Series XM 10 62, 4.22% 1/5/24 (Liquidity Facility Morgan Stanley Bank, West Valley City Utah) (b)(h)(i) | 9,700,000 | 9,700,000 | |
TOTAL ALABAMA | 68,001,000 | ||
| Arizona - 1.1% | |||
| Arizona St Indl. Dev. Auth. Multi Participating VRDN Series XF 31 74, 4.24% 1/5/24 (Liquidity Facility Mizuho Cap. Markets LLC) (b)(h)(i) | 1,900,000 | 1,900,000 | |
| Maricopa County Poll. Cont. Rev. Series 2009 D, 4.15% 1/5/24, VRDN (b) | 24,200,000 | 24,200,000 | |
| Mizuho Floater / Residual Trust V Participating VRDN Series Floater 91 57, 4.27% 2/2/24 (Liquidity Facility Mizuho Cap. Markets LLC) (b)(h)(i) | 3,000,000 | 3,000,000 | |
TOTAL ARIZONA | 29,100,000 | ||
| Arkansas - 0.1% | |||
| Blytheville Indl. Dev. Rev. (Nucor Corp. Proj.) Series 1998, 4.39% 1/5/24, VRDN (b)(c) | 2,600,000 | 2,600,000 | |
| California - 8.9% | |||
| California Cmnty. Choice Fing. Auth. Clean Energy Proj. Rev. Participating VRDN Series XF 30 07, 4.17% 1/5/24 (Liquidity Facility Morgan Stanley Bank, West Valley City Utah) (b)(h)(i) | 16,315,000 | 16,315,000 | |
| California Health Facilities Fing. Auth. Rev. Participating VRDN Series MS 3389, 4.27% 1/5/24 (Liquidity Facility Toronto-Dominion Bank) (b)(h)(i) | 5,100,000 | 5,100,000 | |
| California Hsg. Fin. Agcy. Ltd. Obl Participating VRDN Series XF 31 27, 4.24% 1/5/24 (Liquidity Facility Mizuho Cap. Markets LLC) (b)(h)(i) | 2,765,000 | 2,765,000 | |
| California Statewide Cmntys. Dev. Auth. Multi-family Hsg. Rev. Participating VRDN: | |||
| Series MIZ 91 21, 4.8% 1/2/24 (Liquidity Facility Mizuho Cap. Markets LLC) (b)(c)(h)(i) | 9,900,000 | 9,900,000 | |
| Series MIZ 91 22, 4.8% 1/2/24 (Liquidity Facility Mizuho Cap. Markets LLC) (b)(c)(h)(i) | 20,730,000 | 20,730,000 | |
| Los Angeles Cmnty. Redev. Agcy. Multi-family Hsg. Rev. Participating VRDN: | |||
| Series 2022 MIZ 90 89, 4.8% 1/2/24 (Liquidity Facility Mizuho Cap. Markets LLC) (b)(c)(h)(i) | 57,270,000 | 57,270,000 | |
| Series 2022 MIZ 90 90, 4.8% 1/2/24 (Liquidity Facility Mizuho Cap. Markets LLC) (b)(c)(h)(i) | 38,650,000 | 38,650,000 | |
| Mizuho Floater / Residual Trust V Participating VRDN Series Floater MIZ 90 97, 4.27% 1/5/24, LOC Mizuho Cap. Markets LLC (b)(h)(i) | 2,905,000 | 2,905,000 | |
| San Diego County Reg'l. Arpt. Auth. Arpt. Rev. Participating VRDN Series XM 10 54, 4.17% 1/5/24 (Liquidity Facility Morgan Stanley Bank, West Valley City Utah) (b)(c)(h)(i) | 8,175,000 | 8,175,000 | |
| San Francisco City & County Arpts. Commission Int'l. Arpt. Rev. Participating VRDN Series 2022 XF 30 51, 4.17% 1/5/24 (Liquidity Facility Morgan Stanley Bank, West Valley City Utah) (b)(c)(h)(i) | 2,300,000 | 2,300,000 | |
| San Francisco City & County Multi-family Hsg. Rev. Participating VRDN: | |||
| Series MIZ 90 95, 4.27% 2/2/24 (Liquidity Facility Mizuho Cap. Markets LLC) (b)(h)(i)(j) | 27,100,000 | 27,100,000 | |
| Series MIZ 91 15, 4.27% 2/2/24 (Liquidity Facility Mizuho Cap. Markets LLC) (b)(h)(i)(j) | 40,000,000 | 40,000,000 | |
TOTAL CALIFORNIA | 231,210,000 | ||
| Colorado - 1.2% | |||
| Colorado Edl. & Cultural Facilities Auth. Rev. (Mesivta of Greater Los Angeles Proj.) Series 2005, 4.22% 1/5/24, LOC Deutsche Bank AG, VRDN (b) | 1,460,000 | 1,460,000 | |
| Colorado Health Facilities Auth. Rev. Bonds Participating VRDN: | |||
| Series XM 10 59, 4.17% 1/5/24 (Liquidity Facility JPMorgan Chase Bank) (b)(h)(i) | 2,520,000 | 2,520,000 | |
| Series XM 10 61, 4.17% 1/5/24 (Liquidity Facility JPMorgan Chase Bank) (b)(h)(i) | 4,180,000 | 4,180,000 | |
| Denver City & County Arpt. Rev. Participating VRDN: | |||
| Series Floaters XM 07 15, 4.17% 1/5/24 (Liquidity Facility Morgan Stanley Bank, West Valley City Utah) (b)(c)(h)(i) | 19,885,000 | 19,885,000 | |
| Series XM 10 20, 4.17% 1/5/24 (Liquidity Facility Morgan Stanley Bank, West Valley City Utah) (b)(c)(h)(i) | 4,165,000 | 4,165,000 | |
TOTAL COLORADO | 32,210,000 | ||
| Florida - 2.2% | |||
| Florida Ins. Assistance Interlo Series 2023 A2, 4.36% 1/5/24 (Liquidity Facility Florida Gen. Oblig.), VRDN (b) | 23,200,000 | 23,200,000 | |
| Greater Orlando Aviation Auth. Arpt. Facilities Rev. Participating VRDN Series XM 10 93, 4.75% 1/2/24 (Liquidity Facility JPMorgan Chase Bank) (b)(c)(h)(i) | 11,620,000 | 11,620,000 | |
| Lee Memorial Health Sys. Hosp. Rev. Series 2019 B, 4.38% 1/5/24, VRDN (b) | 19,270,000 | 19,270,000 | |
| Miami Dade County Hsg. Multifamily Hsg. Rev. Participating VRDN Series Floater MIZ 90 87, 4.27% 2/2/24 (Liquidity Facility Mizuho Cap. Markets LLC) (b)(h)(i)(j) | 1,600,000 | 1,600,000 | |
TOTAL FLORIDA | 55,690,000 | ||
| Georgia - 0.1% | |||
| Buford Hsg. Auth. Multifamily Participating VRDN Series XF 31 18, 4.24% 1/5/24 (Liquidity Facility Mizuho Cap. Markets LLC) (b)(h)(i) | 2,920,000 | 2,920,000 | |
| Hawaii - 0.5% | |||
| Hawaii Arpts. Sys. Rev. Participating VRDN: | |||
| Series XG 03 86, 4.17% 1/5/24 (Liquidity Facility Morgan Stanley Bank, West Valley City Utah) (b)(c)(h)(i) | 9,600,000 | 9,600,000 | |
| Series XM 10 55, 4.17% 1/5/24 (Liquidity Facility Morgan Stanley Bank, West Valley City Utah) (b)(c)(h)(i) | 3,200,000 | 3,200,000 | |
TOTAL HAWAII | 12,800,000 | ||
| Illinois - 0.3% | |||
| Chicago O'Hare Int'l. Arpt. Rev. Participating VRDN Series XM 10 43, 4.17% 1/5/24 (Liquidity Facility JPMorgan Chase Bank) (b)(c)(h)(i) | 8,000,000 | 8,000,000 | |
| Iowa - 0.8% | |||
| Louisa County Poll. Cont. Rev. Series 1994, 4.2% 1/3/24, VRDN (b) | 21,900,000 | 21,900,000 | |
| Kentucky - 2.1% | |||
| Meade County Indl. Bldg. Rev. (Nucor Steel Brandenburg Proj.): | |||
| Series 2020 A1, 5.1% 1/2/24, VRDN (b)(c) | 20,640,000 | 20,640,000 | |
| Series 2020 B1, 5.1% 1/2/24, VRDN (b)(c) | 34,920,000 | 34,920,000 | |
TOTAL KENTUCKY | 55,560,000 | ||
| Louisiana - 1.5% | |||
| Saint James Parish Gen. Oblig. (Nucor Steel Louisiana LLC Proj.) Series 2010 A1, 4.29% 1/5/24, VRDN (b)(e) | 38,630,000 | 38,630,000 | |
| Maryland - 0.4% | |||
| Baltimore County Gen. Oblig. Participating VRDN Series 2022 032, 4.22% 2/9/24 (Liquidity Facility Barclays Bank PLC) (b)(h)(i) | 3,220,000 | 3,220,000 | |
| Integrace Obligated Group Participating VRDN Series 2022 024, 4.22% 2/9/24 (Liquidity Facility Barclays Bank PLC) (b)(h)(i) | 6,900,000 | 6,900,000 | |
TOTAL MARYLAND | 10,120,000 | ||
| Missouri - 0.6% | |||
| Kansas City Indl. Dev. Auth. Participating VRDN: | |||
| Series XL 03 3, 4.17% 1/5/24 (Liquidity Facility JPMorgan Chase Bank) (b)(c)(h)(i) | 9,600,000 | 9,600,000 | |
| Series XM 11 08, 4.7% 1/2/24 (Liquidity Facility JPMorgan Chase Bank) (b)(c)(h)(i) | 3,600,000 | 3,600,000 | |
| Mizuho Floater / Residual Trust V Participating VRDN Series Floater MIZ 91 53, 4.27% 2/2/24 (Liquidity Facility Mizuho Cap. Markets LLC) (b)(h)(i) | 3,100,000 | 3,100,000 | |
TOTAL MISSOURI | 16,300,000 | ||
| Nebraska - 0.2% | |||
| Stanton County Indl. Dev. Rev.: | |||
| (Nucor Corp. Proj.) Series 1996, 4.39% 1/5/24, VRDN (b)(c) | 5,600,000 | 5,600,000 | |
| Series 1998, 4.39% 1/5/24, VRDN (b)(c) | 125,000 | 125,000 | |
TOTAL NEBRASKA | 5,725,000 | ||
| New Jersey - 1.8% | |||
| Clifton Gen. Oblig. BAN Series 2023, 5% 11/26/24 | 100,000 | 101,407 | |
| Elmwood Park BAN Series 2023, 5% 10/9/24 | 5,000,000 | 5,052,893 | |
| Hazlet Township NJ BAN Series 2023, 5% 11/8/24 | 7,442,000 | 7,537,787 | |
| Manasquan N J BAN Series 2023, 5% 10/3/24 | 4,402,450 | 4,451,591 | |
| New Jersey Trans. Trust Fund Auth. Participating VRDN: | |||
| Series XL 04 50, 4.17% 1/5/24 (Liquidity Facility JPMorgan Chase Bank) (b)(h)(i) | 2,300,000 | 2,300,000 | |
| Series XM 09 29, 4.17% 1/5/24 (Liquidity Facility JPMorgan Chase Bank) (b)(h)(i) | 5,200,000 | 5,200,000 | |
| Series XM 10 47, 4.17% 1/5/24 (Liquidity Facility JPMorgan Chase Bank) (b)(h)(i) | 10,025,000 | 10,025,000 | |
| Ridgewood Gen. Oblig. BAN Series 2023 B, 5% 10/11/24 | 11,300,000 | 11,421,221 | |
TOTAL NEW JERSEY | 46,089,899 | ||
| New Mexico - 0.2% | |||
| New Mexico St Hosp. Equip. Ln. Co. Participating VRDN Series 2022 034, 4.22% 2/9/24 (Liquidity Facility Barclays Bank PLC) (b)(h)(i) | 4,200,000 | 4,200,000 | |
| New York - 2.7% | |||
| Albany City School District BAN Series 2023 B, 4.75% 6/27/24 | 6,200,000 | 6,238,980 | |
| Liberty Dev. Corp. Rev. Participating VRDN Series MS 1207, 4.22% 1/5/24 (Liquidity Facility Morgan Stanley Bank, West Valley City Utah) (b)(h)(i) | 2,170,000 | 2,170,000 | |
| New York Metropolitan Trans. Auth. Rev. Participating VRDN: | |||
| Series XF 13 21, 4.19% 1/5/24 (Liquidity Facility JPMorgan Chase Bank) (b)(h)(i) | 3,975,000 | 3,975,000 | |
| Series XF 13 55, 4.19% 1/5/24 (Liquidity Facility JPMorgan Chase Bank) (b)(h)(i) | 7,000,000 | 7,000,000 | |
| Series XF 16 49, 4.19% 1/5/24 (Liquidity Facility JPMorgan Chase Bank) (b)(h)(i) | 7,050,000 | 7,050,000 | |
| RIB Floater Trust Various States Participating VRDN Series Floater 2022 007, 4.32% 2/9/24 (Liquidity Facility Barclays Bank PLC) (b)(c)(h)(i) | 43,900,000 | 43,900,000 | |
TOTAL NEW YORK | 70,333,980 | ||
| Ohio - 1.5% | |||
| Allen County Hosp. Facilities Rev. Series 2012 B, 4.1% 1/5/24 (Liquidity Facility Ohio Gen. Oblig.), VRDN (b) | 5,800,000 | 5,800,000 | |
| Middletown Hosp. Facilities Rev. Participating VRDN Series Floaters 003, 4.17% 2/9/24 (Liquidity Facility Barclays Bank PLC) (b)(h)(i) | 14,785,000 | 14,785,000 | |
| Ohio Hosp. Rev.: | |||
| Series 2013 B, 4.32% 1/5/24, VRDN (b) | 10,000,000 | 10,000,000 | |
| Series 2015 B, 4.32% 1/4/27, VRDN (b) | 7,875,000 | 7,875,000 | |
TOTAL OHIO | 38,460,000 | ||
| Oklahoma - 0.7% | |||
| Oklahoma Dev. Fin. Auth. Health Sys. Rev. Series 2020 B, 4.43% 1/4/27, VRDN (b) | 14,600,000 | 14,600,000 | |
| Steele Duncan Plaza, LLC Participating VRDN Series MIZ 91 03, 4.27% 2/2/24 (Liquidity Facility Mizuho Cap. Markets LLC) (b)(h)(i)(j) | 2,600,000 | 2,600,000 | |
TOTAL OKLAHOMA | 17,200,000 | ||
| Pennsylvania - 0.8% | |||
| Montgomery County Higher Ed. & Health Auth. Rev. Series 2018 D, 4.42% 1/4/27, VRDN (b) | 12,400,000 | 12,400,000 | |
| Philadelphia Auth. for Indl. Dev.: | |||
| Participating VRDN Series MIZ 90 51, 4.27% 2/2/24 (Liquidity Facility Mizuho Cap. Markets LLC) (b)(h)(i)(j) | 932,702 | 932,702 | |
| Series 2017 B, 4.43% 1/4/27, VRDN (b) | 6,555,000 | 6,555,000 | |
TOTAL PENNSYLVANIA | 19,887,702 | ||
| South Carolina - 1.1% | |||
| Berkeley County Indl. Dev. Rev. (Nucor Corp. Proj.) Series 1995, 4.39% 1/5/24, VRDN (b)(c) | 1,200,000 | 1,200,000 | |
| South Carolina Pub. Svc. Auth. Rev. Participating VRDN: | |||
| Series 2021 XF 12 43, 4.17% 1/5/24 (Liquidity Facility JPMorgan Chase Bank) (b)(h)(i) | 6,125,000 | 6,125,000 | |
| Series Floaters XM 03 84, 4.17% 1/5/24 (Liquidity Facility JPMorgan Chase Bank) (b)(h)(i) | 20,000,000 | 20,000,000 | |
TOTAL SOUTH CAROLINA | 27,325,000 | ||
| Tennessee - 0.2% | |||
| Chattanooga Health Ed. & Hsg. Facility Board Rev. (Catholic Health Initiatives Proj.) Series C, 4.25% 1/5/24, VRDN (b) | 4,700,000 | 4,700,000 | |
| Texas - 6.7% | |||
| Brazos County Tex Hsg. Fin. Corp. M Participating VRDN Series XF 31 29, 4.24% 1/5/24 (Liquidity Facility Mizuho Cap. Markets LLC) (b)(h)(i) | 2,500,000 | 2,500,000 | |
| Ep Machuca Lp Participating VRDN Series MIZ 91 04, 3.97% 2/2/24 (Liquidity Facility Mizuho Cap. Markets LLC) (b)(h)(i)(j) | 3,660,000 | 3,660,000 | |
| Mizuho Floater / Residual Trust V Participating VRDN: | |||
| Series Floater MIZ 91 50, 4.27% 2/2/24 (Liquidity Facility Mizuho Cap. Markets LLC) (b)(h)(i)(j) | 14,800,000 | 14,800,000 | |
| Series MIZ 91 24, 4.27% 2/2/24 (Liquidity Facility Mizuho Cap. Markets LLC) (b)(h)(i)(j) | 20,850,000 | 20,850,000 | |
| Port Arthur Navigation District Envir. Facilities Rev. (Motiva Enterprises LLC Proj.): | |||
| Series 2001 A, 4.6% 1/2/24, VRDN (b) | 17,450,000 | 17,450,000 | |
| Series 2004, 4.93% 1/5/24, VRDN (b)(c) | 75,685,000 | 75,684,992 | |
| Series 2010 B, 4.6% 1/2/24, VRDN (b) | 600,000 | 600,000 | |
| Series 2010 C, 4.6% 1/2/24, VRDN (b) | 2,200,000 | 2,200,000 | |
| Series 2010 D: | |||
4.85% 1/5/24, VRDN (b) | 33,480,000 | 33,480,000 | |
4.88% 1/5/24, VRDN (b) | 2,475,000 | 2,475,000 | |
TOTAL TEXAS | 173,699,992 | ||
| Utah - 0.8% | |||
| Salt Lake City Arpt. Rev. Participating VRDN: | |||
| Series XM 11 07, 4.7% 1/2/24 (Liquidity Facility JPMorgan Chase Bank) (b)(c)(h)(i) | 9,895,000 | 9,895,000 | |
| Series XM 11 47, 3.9% 1/5/24 (Liquidity Facility JPMorgan Chase Bank) (b)(c)(h)(i) | 10,500,000 | 10,500,000 | |
TOTAL UTAH | 20,395,000 | ||
| Virginia - 0.2% | |||
| Nat'l. Sr. Campuses Participating VRDN Series 2022 028, 4.2% 2/9/24 (Liquidity Facility Barclays Bank PLC) (b)(h)(i) | 4,815,000 | 4,815,000 | |
| Washington - 0.4% | |||
| Washington Econ. Dev. Fin. Auth. Rev. Participating VRDN Series Floaters 005, 4.22% 2/9/24 (Liquidity Facility Barclays Bank PLC) (b)(c)(h)(i) | 9,180,000 | 9,180,000 | |
| West Virginia - 0.3% | |||
| West Virginia Hosp. Fin. Auth. Hosp. Rev. Series 2018 E, 4.38% 1/4/27, VRDN (b) | 8,240,000 | 8,240,000 | |
| Wyoming - 1.0% | |||
| Lincoln County Envir. (PacifiCorp Proj.) Series 1995, 5.6% 1/5/24, VRDN (b)(c) | 13,900,000 | 13,900,000 | |
| Lincoln County Poll. Cont. Rev. (PacifiCorp Proj.) Series 1994, 5.55% 1/3/24, VRDN (b) | 1,200,000 | 1,200,000 | |
| Sweetwater County Env Imp Rev. (Pacificorp Proj.) Series 1995, 4.55% 1/2/24, VRDN (b)(c) | 4,500,000 | 4,500,000 | |
| Sweetwater County Poll. Cont. Rev. (PacifiCorp Proj.) Series 1994, 5.55% 1/3/24, VRDN (b) | 6,200,000 | 6,200,000 | |
TOTAL WYOMING | 25,800,000 | ||
| TOTAL MUNICIPAL NOTES (Cost $1,060,937,307) | 1,061,092,573 | ||
| Money Market Funds - 1.8% | |||
| Shares | Value ($) | ||
Fidelity Municipal Cash Central Fund 4.24% (k)(l) (Cost $46,002,000) | 45,992,801 | 46,002,000 | |
| TOTAL INVESTMENT IN SECURITIES - 100.4% (Cost $2,593,751,198) | 2,595,043,306 |
NET OTHER ASSETS (LIABILITIES) - (0.4)% | (9,443,530) |
| NET ASSETS - 100.0% | 2,585,599,776 |
| BAN | - | BOND ANTICIPATION NOTE |
| VRDN | - | VARIABLE RATE DEMAND NOTE (A debt instrument that is payable upon demand, either daily, weekly or monthly) |
| (a) | Amount is stated in United States dollars unless otherwise noted. |
| (b) | Coupon rates for floating and adjustable rate securities reflect the rates in effect at period end. |
| (c) | Private activity obligations whose interest is subject to the federal alternative minimum tax for individuals. |
| (d) | Security exempt from registration under Rule 144A of the Securities Act of 1933. These securities may be resold in transactions exempt from registration, normally to qualified institutional buyers. At the end of the period, the value of these securities amounted to $53,418,067 or 2.1% of net assets. |
| (e) | Security or a portion of the security purchased on a delayed delivery or when-issued basis. |
| (f) | Security initially issued at one coupon which converts to a higher coupon at a specified date. The rate shown is the rate at period end. |
| (g) | Coupon is indexed to a floating interest rate which may be multiplied by a specified factor and/or subject to caps or floors. |
| (h) | Provides evidence of ownership in one or more underlying municipal bonds. |
| (i) | Coupon rates are determined by re-marketing agents based on current market conditions. |
| (j) | Restricted securities (including private placements) - Investment in securities not registered under the Securities Act of 1933 (excluding 144A issues). At the end of the period, the value of restricted securities (excluding 144A issues) amounted to $111,542,702 or 4.3% of net assets. |
| (k) | Information in this report regarding holdings by state and security types does not reflect the holdings of the Fidelity Municipal Cash Central Fund. |
| (l) | Affiliated fund that is generally available only to investment companies and other accounts managed by Fidelity Investments. The rate quoted is the annualized seven-day yield of the fund at period end. A complete unaudited listing of the fund's holdings as of its most recent quarter end is available upon request. In addition, each Fidelity Central Fund's financial statements, which are not covered by the Fund's Report of Independent Registered Public Accounting Firm, are available on the SEC's website or upon request. |
| Additional information on each restricted holding is as follows: | ||
| Security | Acquisition Date | Acquisition Cost ($) |
| Ep Machuca Lp Participating VRDN Series MIZ 91 04, 3.97% 2/2/24 (Liquidity Facility Mizuho Cap. Markets LLC) | 8/05/22 | 3,660,000 |
| Miami Dade County Hsg. Multifamily Hsg. Rev. Participating VRDN Series Floater MIZ 90 87, 4.27% 2/2/24 (Liquidity Facility Mizuho Cap. Markets LLC) | 1/27/22 | 1,600,000 |
| Mizuho Floater / Residual Trust V Participating VRDN Series Floater MIZ 91 50, 4.27% 2/2/24 (Liquidity Facility Mizuho Cap. Markets LLC) | 8/01/23 | 14,800,000 |
| Mizuho Floater / Residual Trust V Participating VRDN Series MIZ 91 24, 4.27% 2/2/24 (Liquidity Facility Mizuho Cap. Markets LLC) | 1/27/23 | 20,850,000 |
| Philadelphia Auth. for Indl. Dev. Participating VRDN Series MIZ 90 51, 4.27% 2/2/24 (Liquidity Facility Mizuho Cap. Markets LLC) | 11/12/20 | 932,702 |
| San Francisco City & County Multi-family Hsg. Rev. Participating VRDN Series MIZ 90 95, 4.27% 2/2/24 (Liquidity Facility Mizuho Cap. Markets LLC) | 4/01/22 | 27,100,000 |
| San Francisco City & County Multi-family Hsg. Rev. Participating VRDN Series MIZ 91 15, 4.27% 2/2/24 (Liquidity Facility Mizuho Cap. Markets LLC) | 12/19/22 - 1/30/23 | 40,000,000 |
| Steele Duncan Plaza, LLC Participating VRDN Series MIZ 91 03, 4.27% 2/2/24 (Liquidity Facility Mizuho Cap. Markets LLC) | 8/11/22 | 2,600,000 |
| Affiliate | Value, beginning of period ($) | Purchases ($) | Sales Proceeds ($) | Dividend Income ($) | Realized Gain (loss) ($) | Change in Unrealized appreciation (depreciation) ($) | Value, end of period ($) | % ownership, end of period |
| Fidelity Municipal Cash Central Fund 4.24% | 60,404,000 | 564,682,000 | 579,084,000 | 1,523,013 | - | - | 46,002,000 | 1.9% |
| Total | 60,404,000 | 564,682,000 | 579,084,000 | 1,523,013 | - | - | 46,002,000 | |
| Valuation Inputs at Reporting Date: | ||||
| Description | Total ($) | Level 1 ($) | Level 2 ($) | Level 3 ($) |
Investments in Securities: | ||||
| Municipal Securities | 2,549,041,306 | - | 2,549,041,306 | - |
| Money Market Funds | 46,002,000 | 46,002,000 | - | - |
| Total Investments in Securities: | 2,595,043,306 | 46,002,000 | 2,549,041,306 | - |
| Statement of Assets and Liabilities | ||||
| December 31, 2023 | ||||
| Assets | ||||
| Investment in securities, at value - See accompanying schedule: | ||||
Unaffiliated issuers (cost $2,547,749,198) | $ | 2,549,041,306 | ||
Fidelity Central Funds (cost $46,002,000) | 46,002,000 | |||
| Total Investment in Securities (cost $2,593,751,198) | $ | 2,595,043,306 | ||
| Cash | 1,318 | |||
| Receivable for fund shares sold | 1,753,876 | |||
| Interest receivable | 22,031,610 | |||
| Distributions receivable from Fidelity Central Funds | 107,983 | |||
| Receivable from investment adviser for expense reductions | 97,847 | |||
| Other receivables | 449 | |||
Total assets | 2,619,036,389 | |||
| Liabilities | ||||
| Payable for investments purchased | ||||
Regular delivery | $ | 22,600,000 | ||
Delayed delivery | 4,096,098 | |||
| Payable for fund shares redeemed | 724,138 | |||
| Distributions payable | 5,372,199 | |||
| Accrued management fee | 430,613 | |||
| Distribution and service plan fees payable | 46 | |||
| Other affiliated payables | 213,519 | |||
| Total Liabilities | 33,436,613 | |||
| Net Assets | $ | 2,585,599,776 | ||
| Net Assets consist of: | ||||
| Paid in capital | $ | 2,584,555,264 | ||
| Total accumulated earnings (loss) | 1,044,512 | |||
| Net Assets | $ | 2,585,599,776 | ||
| Net Asset Value and Maximum Offering Price | ||||
| Class A : | ||||
Net Asset Value and redemption price per share ($419,636 ÷ 41,779 shares)(a) | $ | 10.04 | ||
| Maximum offering price per share (100/98.50 of $10.04) | $ | 10.19 | ||
| Fidelity Conservative Income Municipal Bond Fund : | ||||
Net Asset Value, offering price and redemption price per share ($2,541,355,690 ÷ 253,022,862 shares) | $ | 10.04 | ||
| Class I : | ||||
Net Asset Value, offering price and redemption price per share ($1,373,430 ÷ 136,745 shares) | $ | 10.04 | ||
| Class Z : | ||||
Net Asset Value, offering price and redemption price per share ($42,451,020 ÷ 4,226,492 shares) | $ | 10.04 | ||
(a)Redemption price per share is equal to net asset value less any applicable contingent deferred sales charge. | ||||
| Statement of Operations | ||||
Year ended December 31, 2023 | ||||
| Investment Income | ||||
| Interest | $ | 77,068,703 | ||
| Income from Fidelity Central Funds | 1,523,013 | |||
| Total Income | 78,591,716 | |||
| Expenses | ||||
| Management fee | $ | 5,549,707 | ||
| Transfer agent fees | 2,173,630 | |||
| Distribution and service plan fees | 187 | |||
| Independent trustees' fees and expenses | 8,937 | |||
| Total expenses before reductions | 7,732,461 | |||
| Expense reductions | (1,525,035) | |||
| Total expenses after reductions | 6,207,426 | |||
| Net Investment income (loss) | 72,384,290 | |||
| Realized and Unrealized Gain (Loss) | ||||
| Net realized gain (loss) on: | ||||
| Investment Securities: | ||||
| Unaffiliated issuers | 154,029 | |||
| Total net realized gain (loss) | 154,029 | |||
| Change in net unrealized appreciation (depreciation) on investment securities | 18,047,491 | |||
| Net gain (loss) | 18,201,520 | |||
| Net increase (decrease) in net assets resulting from operations | $ | 90,585,810 | ||
| Statement of Changes in Net Assets | ||||
Year ended December 31, 2023 | Year ended December 31, 2022 | |||
| Increase (Decrease) in Net Assets | ||||
| Operations | ||||
| Net investment income (loss) | $ | 72,384,290 | $ | 24,794,612 |
| Net realized gain (loss) | 154,029 | (180,583) | ||
| Change in net unrealized appreciation (depreciation) | 18,047,491 | (18,547,287) | ||
| Net increase (decrease) in net assets resulting from operations | 90,585,810 | 6,066,742 | ||
| Distributions to shareholders | (71,521,315) | (24,762,794) | ||
| Share transactions - net increase (decrease) | 81,513,168 | (257,663,646) | ||
| Total increase (decrease) in net assets | 100,577,663 | (276,359,698) | ||
| Net Assets | ||||
| Beginning of period | 2,485,022,113 | 2,761,381,811 | ||
| End of period | $ | 2,585,599,776 | $ | 2,485,022,113 |
| Fidelity Advisor® Conservative Income Municipal Bond Fund Class A |
| Years ended December 31, | 2023 A | |
Selected Per-Share Data | ||
| Net asset value, beginning of period | $ | 9.97 |
| Income from Investment Operations | ||
Net investment income (loss) B,C | .187 | |
| Net realized and unrealized gain (loss) | .060 | |
| Total from investment operations | .247 | |
| Distributions from net investment income | (.177) | |
| Total distributions | (.177) | |
| Net asset value, end of period | $ | 10.04 |
Total Return D,E,F | 2.50% | |
Ratios to Average Net Assets C,G,H | ||
| Expenses before reductions | .42% I | |
| Expenses net of fee waivers, if any | .42% I | |
| Expenses net of all reductions | .42% I | |
| Net investment income (loss) | 3.11% I | |
| Supplemental Data | ||
| Net assets, end of period (000 omitted) | $ | 420 |
Portfolio turnover rate J | 76% |
| Fidelity® Conservative Income Municipal Bond Fund |
| Years ended December 31, | 2023 | 2022 | 2021 | 2020 | 2019 | |||||
Selected Per-Share Data | ||||||||||
| Net asset value, beginning of period | $ | 9.97 | $ | 10.04 | $ | 10.06 | $ | 10.06 | $ | 10.02 |
| Income from Investment Operations | ||||||||||
Net investment income (loss) A,B | .293 | .096 | .025 | .081 | .157 | |||||
| Net realized and unrealized gain (loss) | .066 | (.069) | (.020) | .007 | .042 | |||||
| Total from investment operations | .359 | .027 | .005 | .088 | .199 | |||||
| Distributions from net investment income | (.289) | (.097) | (.025) | (.087) | (.158) | |||||
| Distributions from net realized gain | - | - | - | (.001) | (.001) | |||||
| Total distributions | (.289) | (.097) | (.025) | (.088) | (.159) | |||||
| Net asset value, end of period | $ | 10.04 | $ | 9.97 | $ | 10.04 | $ | 10.06 | $ | 10.06 |
Total Return C | 3.66% | .27% | .05% | .88% | 2.00% | |||||
Ratios to Average Net Assets B,D,E | ||||||||||
| Expenses before reductions | .31% | .35% | .35% | .35% | .35% | |||||
| Expenses net of fee waivers, if any | .25% | .25% | .25% | .25% | .25% | |||||
| Expenses net of all reductions | .25% | .25% | .25% | .25% | .25% | |||||
| Net investment income (loss) | 2.93% | .96% | .25% | .81% | 1.56% | |||||
| Supplemental Data | ||||||||||
| Net assets, end of period (000 omitted) | $ | 2,541,356 | $ | 2,339,827 | $ | 2,580,577 | $ | 3,175,503 | $ | 2,108,640 |
Portfolio turnover rate F | 76% | 56% | 56% | 41% | 63% |
| Fidelity Advisor® Conservative Income Municipal Bond Fund Class I |
| Years ended December 31, | 2023 A | |
Selected Per-Share Data | ||
| Net asset value, beginning of period | $ | 9.97 |
| Income from Investment Operations | ||
Net investment income (loss) B,C | .196 | |
| Net realized and unrealized gain (loss) | .062 | |
| Total from investment operations | .258 | |
| Distributions from net investment income | (.188) | |
| Total distributions | (.188) | |
| Net asset value, end of period | $ | 10.04 |
Total Return D,E | 2.61% | |
Ratios to Average Net Assets C,F,G | ||
| Expenses before reductions | .29% H | |
| Expenses net of fee waivers, if any | .25% H | |
| Expenses net of all reductions | .25% H | |
| Net investment income (loss) | 3.31% H | |
| Supplemental Data | ||
| Net assets, end of period (000 omitted) | $ | 1,373 |
Portfolio turnover rate I | 76% |
| Fidelity Advisor® Conservative Income Municipal Bond Fund Class Z |
| Years ended December 31, | 2023 A | |
Selected Per-Share Data | ||
| Net asset value, beginning of period | $ | 9.97 |
| Income from Investment Operations | ||
Net investment income (loss) B,C | .202 | |
| Net realized and unrealized gain (loss) | .059 | |
| Total from investment operations | .261 | |
| Distributions from net investment income | (.191) | |
| Total distributions | (.191) | |
| Net asset value, end of period | $ | 10.04 |
Total Return D,E | 2.64% | |
Ratios to Average Net Assets C,F,G | ||
| Expenses before reductions | .25% H | |
| Expenses net of fee waivers, if any | .20% H | |
| Expenses net of all reductions | .20% H | |
| Net investment income (loss) | 3.39% H | |
| Supplemental Data | ||
| Net assets, end of period (000 omitted) | $ | 42,451 |
Portfolio turnover rate I | 76% |
| Fidelity Central Fund | Investment Manager | Investment Objective | Investment Practices | Expense RatioA |
| Fidelity Money Market Central Funds | Fidelity Management & Research Company LLC (FMR) | Each fund seeks to obtain a high level of current income consistent with the preservation of capital and liquidity. | Short-term Investments | Less than .005% |
| Gross unrealized appreciation | $6,411,478 |
| Gross unrealized depreciation | (4,911,828) |
| Net unrealized appreciation (depreciation) | $1,499,650 |
| Tax Cost | $2,593,543,656 |
| Undistributed tax-exempt income | $675,727 |
| Capital loss carryforward | $(1,130,866) |
| Net unrealized appreciation (depreciation) on securities and other investments | $1,499,650 |
| Short-term | $(882,546) |
| Long-term | (248,320) |
| Total Capital loss carryforward | $(1,130,866) |
| December 31, 2023 | December 31, 2022 | |
| Tax-exempt Income | 71,521,315 | 24,762,794 |
| Purchases ($) | Sales ($) | |
| Fidelity Conservative Income Municipal Bond Fund | 1,252,754,710 | 934,855,238 |
| Distribution Fee | Service Fee | Total Fees | Retained by FDC | |
| Class A | -% | .15% | 187 | 110 |
| Retained by FDC | |
| Class A | $252 |
| Amount | % of Class-Level Average Net AssetsA | |
| Conservative Income Municipal Bond | $37,385 | .10 |
| Class A | 96 | .08 |
| Fidelity Conservative Income Municipal Bond Fund | 2,129,013 | .09A |
| Class I | 392 | .09 |
| Class Z | 6,744 | .05 |
| $2,173,630 |
| Purchases ($) | Sales ($) | Realized Gain (Loss) ($) | |
| Fidelity Conservative Income Municipal Bond Fund | 61,151,992 | 17,163,773 | (1,227) |
| Expense Limitations | Reimbursement | |
| Conservative Income Municipal Bond | .35% | $20,475 |
| Class A | .45%A | - |
| Fidelity Conservative Income Municipal Bond Fund | .25% | 1,495,623 |
| Class I | .25%A | 164 |
| Class Z | .20%A | 6,611 |
| $1,522,873 |
Year ended December 31, 2023A | Year ended December 31, 2022 | |
| Fidelity Conservative Income Municipal Bond Fund | ||
| Distributions to shareholders | ||
| Conservative Income Municipal Bond | $862,973 | $1,260,065 |
| Class A | 3,791 | - |
| Fidelity Conservative Income Municipal Bond Fund | 70,195,185 | 23,502,729 |
| Class I | 14,244 | - |
| Class Z | 445,122 | - |
Total | $71,521,315 | $24,762,794 |
| Shares | Shares | Dollars | Dollars | |
Year ended December 31, 2023A | Year ended December 31, 2022 | Year ended December 31, 2023A | Year ended December 31, 2022 | |
| Fidelity Conservative Income Municipal Bond Fund | ||||
| Conservative Income Municipal Bond | ||||
| Shares sold | 2,563,002 | 6,431,861 | $25,637,442 | $64,090,475 |
| Reinvestment of distributions | 69,620 | 104,367 | 695,551 | 1,039,599 |
| Shares redeemed | (17,197,882) | (9,979,407) | (172,014,003) | (99,539,380) |
| Net increase (decrease) | (14,565,260) | (3,443,179) | $(145,681,010) | $(34,409,306) |
| Class A | ||||
| Shares sold | 42,367 | - | $423,305 | $ - |
| Reinvestment of distributions | 379 | - | 3,791 | - |
| Shares redeemed | (967) | - | (9,698) | - |
| Net increase (decrease) | 41,779 | - | $417,398 | $ - |
| Fidelity Conservative Income Municipal Bond Fund | ||||
| Shares sold | 155,544,691 | 232,738,873 | $1,554,173,088 | $2,320,419,781 |
| Reinvestment of distributions | 1,851,005 | 692,458 | 18,497,325 | 6,899,221 |
| Shares redeemed | (139,088,392) | (255,738,433) | (1,389,471,874) | (2,550,573,342) |
| Net increase (decrease) | 18,307,304 | (22,307,102) | $183,198,539 | $(223,254,340) |
| Class I | ||||
| Shares sold | 148,199 | - | $1,481,429 | $ - |
| Reinvestment of distributions | 1,419 | - | 14,191 | - |
| Shares redeemed | (12,873) | - | (128,629) | - |
| Net increase (decrease) | 136,745 | - | $1,366,991 | $ - |
| Class Z | ||||
| Shares sold | 4,521,790 | - | $45,165,531 | $ - |
| Reinvestment of distributions | 38,853 | - | 388,665 | - |
| Shares redeemed | (334,151) | - | (3,342,946) | - |
| Net increase (decrease) | 4,226,492 | - | $42,211,250 | $ - |
| Shares | Total net realized gain or loss ($) | Total Proceeds ($) | Participating classes | |
| Fidelity Conservative Income Municipal Bond Fund | 96,728,319 | (761,921) | 969,217,761 | Fidelity Conservative Income Municipal Bond |
| The Example is based on an investment of $1,000 invested at the beginning of the period and held for the entire period (July 1, 2023 to December 31, 2023). |
Annualized Expense Ratio- A | Beginning Account Value July 1, 2023 | Ending Account Value December 31, 2023 | Expenses Paid During Period- C July 1, 2023 to December 31, 2023 | |||||||
| Fidelity® Conservative Income Municipal Bond Fund | ||||||||||
| Class A | .42% | |||||||||
| Actual | $ 1,000 | $ 1,025.00 | $ 2.14 | |||||||
Hypothetical-B | $ 1,000 | $ 1,023.09 | $ 2.14 | |||||||
| Fidelity® Conservative Income Municipal Bond Fund | .25% | |||||||||
| Actual | $ 1,000 | $ 1,021.10 | $ 1.27 | |||||||
Hypothetical-B | $ 1,000 | $ 1,023.95 | $ 1.28 | |||||||
| Class I | .25% | |||||||||
| Actual | $ 1,000 | $ 1,026.10 | $ 1.28 | |||||||
Hypothetical-B | $ 1,000 | $ 1,023.95 | $ 1.28 | |||||||
| Class Z | .20% | |||||||||
| Actual | $ 1,000 | $ 1,026.40 | $ 1.02 | |||||||
Hypothetical-B | $ 1,000 | $ 1,024.20 | $ 1.02 | |||||||
| A special meeting of shareholders was held on October 18, 2023. The results of votes taken among shareholders on the proposal before them are reported below. Each vote reported represents one dollar of net asset value held on the record date for the meeting. | ||
| Proposal 1 | ||
| To elect a Board of Trustees. | ||
# of Votes | % of Votes | |
| Abigail P. Johnson | ||
| Affirmative | 11,160,118,778.550 | 97.240 |
| Withheld | 316,510,692.230 | 2.760 |
| TOTAL | 11,476,629,470.780 | 100.000 |
| Jennifer Toolin McAuliffe | ||
| Affirmative | 11,160,843,041.160 | 97.250 |
| Withheld | 315,786,429.620 | 2.750 |
| TOTAL | 11,476,629,470.780 | 100.000 |
| Christine J. Thompson | ||
| Affirmative | 11,156,602,115.000 | 97.210 |
| Withheld | 320,027,355.780 | 2.790 |
| TOTAL | 11,476,629,470.780 | 100.000 |
| Elizabeth S. Acton | ||
| Affirmative | 11,110,214,430.850 | 96.810 |
| Withheld | 366,415,039.930 | 3.190 |
| TOTAL | 11,476,629,470.780 | 100.000 |
| Laura M. Bishop | ||
| Affirmative | 11,132,012,161.210 | 97.000 |
| Withheld | 344,617,309.570 | 3.000 |
| TOTAL | 11,476,629,470.780 | 100.000 |
| Ann E. Dunwoody | ||
| Affirmative | 11,125,767,777.290 | 96.940 |
| Withheld | 350,861,693.490 | 3.060 |
| TOTAL | 11,476,629,470.780 | 100.000 |
| John Engler | ||
| Affirmative | 11,009,456,697.420 | 95.930 |
| Withheld | 467,172,773.360 | 4.070 |
| TOTAL | 11,476,629,470.780 | 100.000 |
| Robert F. Gartland | ||
| Affirmative | 11,139,433,974.390 | 97.060 |
| Withheld | 337,195,496.390 | 2.940 |
| TOTAL | 11,476,629,470.780 | 100.000 |
| Robert W. Helm | ||
| Affirmative | 11,140,155,147.040 | 97.070 |
| Withheld | 336,474,323.740 | 2.930 |
| TOTAL | 11,476,629,470.780 | 100.000 |
| Arthur E. Johnson | ||
| Affirmative | 11,087,922,630.810 | 96.610 |
| Withheld | 388,706,839.970 | 3.390 |
| TOTAL | 11,476,629,470.780 | 100.000 |
| Michael E. Kenneally | ||
| Affirmative | 11,003,372,175.210 | 95.880 |
| Withheld | 473,257,295.570 | 4.120 |
| TOTAL | 11,476,629,470.780 | 100.000 |
| Mark A. Murray | ||
| Affirmative | 11,139,176,322.830 | 97.060 |
| Withheld | 337,453,147.950 | 2.940 |
| TOTAL | 11,476,629,470.780 | 100.000 |
| Carol J. Zierhoffer | ||
| Affirmative | 11,137,882,609.000 | 97.050 |
| Withheld | 338,746,861.780 | 2.950 |
| TOTAL | 11,476,629,470.780 | 100.000 |
| Proposal 1 reflects trust wide proposal and voting results. | ||
 |


Contents
| Average Annual Total Returns | |||
Periods ended December 31, 2023 | Past 1 year | Past 5 years | Past 10 years |
Class A (incl. 2.75% sales charge) | 0.81% | 0.54% | 0.76% |
Class M (incl. 2.75% sales charge) | 0.82% | 0.56% | 0.78% |
Class C (incl. contingent deferred sales charge) | 1.91% | 0.37% | 0.44% |
| Fidelity® Limited Term Municipal Income Fund | 3.84% | 1.40% | 1.35% |
| Class I | 3.93% | 1.39% | 1.31% |
| Class Z | 3.99% | 1.45% | 1.34% |
| $10,000 Over 10 Years |
Let's say hypothetically that $10,000 was invested in Fidelity® Limited Term Municipal Income Fund, a class of the fund, on December 31, 2013. The chart shows how the value of your investment would have changed, and also shows how the Bloomberg Municipal Bond Index performed over the same period. |
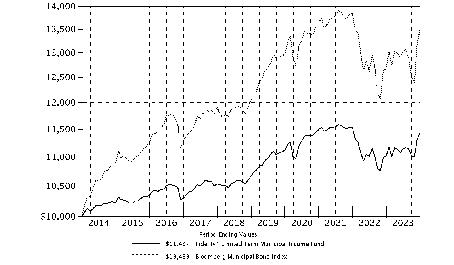 |
| Top Five States (% of Fund's net assets) | |
| Texas | 13.3 |
| New York | 9.5 |
| Illinois | 9.2 |
| Florida | 4.8 |
| Georgia | 4.3 |
| Revenue Sources (% of Fund's net assets) | ||
| Transportation | 24.1 | |
| General Obligations | 23.6 | |
| Health Care | 14.6 | |
| State G.O. | 7.7 | |
| Housing | 7.2 | |
| Electric Utilities | 6.0 | |
| Education | 5.2 | |
| Others* (Individually Less Than 5%) | 11.6 | |
| 100.0 | ||
| *Includes net other assets | ||
Quality Diversification (% of Fund's net assets) |
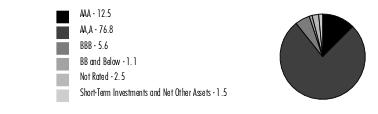 |
| We have used ratings from Moody's Investors Service, Inc. Where Moody's® ratings are not available, we have used S&P® ratings. All ratings are as of the date indicated and do not reflect subsequent changes. |
| Municipal Bonds - 98.6% | |||
Principal Amount (a) (000s) | Value ($) (000s) | ||
| Alabama - 2.5% | |||
| Birmingham Arpt. Auth. Series 2020: | |||
| 5% 7/1/26 (Build America Mutual Assurance Insured) | 555 | 587 | |
| 5% 7/1/27 (Build America Mutual Assurance Insured) | 500 | 542 | |
| Black Belt Energy Gas District: | |||
| Bonds: | |||
(Proj. No. 5) Series A, 4%, tender 10/1/26 (b) | 4,000 | 4,014 | |
Series 2022 E, 5%, tender 6/1/28 (b) | 4,945 | 5,179 | |
Series 2023 D1, 5.5%, tender 2/1/29 (b) | 4,460 | 4,773 | |
| Series 2022 C1: | |||
5.25% 12/1/26 | 1,845 | 1,935 | |
5.25% 6/1/27 | 1,290 | 1,361 | |
5.25% 12/1/27 | 1,170 | 1,245 | |
5.25% 6/1/28 | 1,540 | 1,645 | |
5.25% 12/1/28 | 1,275 | 1,370 | |
5.25% 6/1/29 | 1,000 | 1,068 | |
| Huntsville Health Care Auth. Bonds Series 2023 A, 5%, tender 6/1/30 (b) | 7,850 | 8,729 | |
| Mobile County Board of School Commissioners Series 2016 A, 5% 3/1/25 | 1,225 | 1,253 | |
| Mobile Indl. Dev. Board Poll. Cont. Rev. Bonds Series 2009 E, 1%, tender 6/26/25 (b) | 5,030 | 4,855 | |
| Southeast Alabama Gas Supply District Bonds (Proj. No. 2) Series 2018 A, 4%, tender 6/1/24 (b) | 2,460 | 2,461 | |
| Southeast Energy Auth. Coop. Dis Bonds (Proj. No. 6) Series 2023 B, 5%, tender 6/1/30 (b) | 10,000 | 10,673 | |
| Southeast Energy Auth. Rev.: | |||
| (Proj. No. 2) Series 2021 B1: | |||
4% 6/1/24 | 600 | 600 | |
4% 6/1/25 | 725 | 728 | |
4% 6/1/26 | 1,500 | 1,509 | |
4% 6/1/27 | 2,440 | 2,462 | |
4% 6/1/28 | 3,780 | 3,826 | |
| Bonds Series 2022 B1, 5%, tender 8/1/28 (b) | 6,035 | 6,307 | |
TOTAL ALABAMA | 67,122 | ||
| Alaska - 0.2% | |||
| Alaska Hsg. Fin. Corp. Mtg. Rev. Series 2022 A, 3% 6/1/51 | 1,075 | 1,039 | |
| Alaska Int'l. Arpts. Revs. Series 2021 C, 5% 10/1/26 (c) | 1,510 | 1,579 | |
| Alaska Muni. Bond Bank Series 2015 B, 5% 3/1/28 (c) | 1,390 | 1,415 | |
TOTAL ALASKA | 4,033 | ||
| Arizona - 1.7% | |||
| Arizona Board of Regents Arizona State Univ. Rev.: | |||
| Series 2016 A, 5% 7/1/26 | 275 | 284 | |
| Series 2021: | |||
5% 8/1/26 | 1,100 | 1,168 | |
5% 8/1/27 | 1,500 | 1,632 | |
| Arizona Health Facilities Auth. Rev. (Scottsdale Lincoln Hospitals Proj.) Series 2014 A, 5% 12/1/24 | 1,465 | 1,489 | |
| Arizona Indl. Dev. Auth. Hosp. Rev. Series 2021 A: | |||
| 5% 2/1/25 | 1,100 | 1,123 | |
| 5% 2/1/26 | 1,200 | 1,250 | |
| 5% 2/1/27 | 1,200 | 1,278 | |
| Chandler Indl. Dev. Auth. Indl. Dev. Rev. (Intel Corp. Proj.) Series 2022 2, 5%, tender 9/1/27 (b)(c) | 8,765 | 9,116 | |
| Glendale Union School District 205 Series A: | |||
| 5% 7/1/26 (Assured Guaranty Muni. Corp. Insured) | 200 | 211 | |
| 5% 7/1/27 (Assured Guaranty Muni. Corp. Insured) | 250 | 269 | |
| Maricopa County Indl. Dev. Auth. Sr. Living Facilities (Christian Care Surprise, Inc. Proj.) Series 2016, 5% 1/1/26 (d) | 755 | 715 | |
| Maricopa County Rev. Bonds: | |||
| Series 2019 D, 5%, tender 5/15/26 (b) | 6,765 | 7,072 | |
| Series 2023 A2, 5%, tender 5/15/28 (b) | 4,480 | 4,846 | |
| Maricopa County Spl. Health Care District Gen. Oblig. Series 2021 D, 5% 7/1/26 | 3,000 | 3,167 | |
| Maricopa County Unified School District #48 Scottsdale Series D: | |||
| 4% 7/1/25 | 800 | 815 | |
| 4% 7/1/26 | 900 | 931 | |
| 4% 7/1/27 | 225 | 237 | |
| Phoenix Civic Impt. Board Arpt. Rev. Series 2019 B: | |||
| 5% 7/1/24 (c) | 1,550 | 1,562 | |
| 5% 7/1/25 (c) | 1,500 | 1,538 | |
| Phoenix Civic Impt. Corp. Series 2019 B, 5% 7/1/28 | 1,910 | 2,084 | |
| Tucson Ctfs. of Prtn. Series 2016, 5% 7/1/27 (Assured Guaranty Muni. Corp. Insured) | 1,245 | 1,313 | |
| Univ. of Arizona Univ. Revs. Series 2019 A, 5% 6/1/26 | 1,250 | 1,321 | |
| Western Maricopa Ed. Ctr. District Series 2019 B, 5% 7/1/26 | 2,000 | 2,117 | |
TOTAL ARIZONA | 45,538 | ||
| California - 3.8% | |||
| Bay Area Toll Auth. San Francisco Bay Toll Bridge Rev. Bonds: | |||
| Series 2021 A, 2%, tender 4/1/28 (b) | 7,365 | 6,870 | |
| Series A, 2.95%, tender 4/1/26 (b) | 4,895 | 4,820 | |
| Series B, 2.85%, tender 4/1/25 (b) | 4,000 | 3,970 | |
| California Gen. Oblig.: | |||
| Series 2017, 5% 8/1/26 | 1,200 | 1,275 | |
| Series 2020, 4% 11/1/26 | 700 | 728 | |
| Series 2023, 5% 10/1/28 | 4,000 | 4,482 | |
| California Pub. Works Board Lease Rev.: | |||
| (Various Cap. Projs.): | |||
Series 2022 C, 5% 8/1/24 | 965 | 977 | |
Series 2023 B, 5% 12/1/28 | 5,950 | 6,706 | |
| Series 2023 A, 5% 12/1/29 | 2,000 | 2,302 | |
| Castaic Lake Wtr. Agcy. Ctfs. of Prtn. Series 1999, 0% 8/1/28 (AMBAC Insured) | 1,435 | 1,263 | |
| Fresno Arpt. Rev. Series 2023 A: | |||
| 5% 7/1/26 (Build America Mutual Assurance Insured) (c) | 1,000 | 1,041 | |
| 5% 7/1/27 (Build America Mutual Assurance Insured) (c) | 1,340 | 1,420 | |
| 5% 7/1/28 (Build America Mutual Assurance Insured) (c) | 2,885 | 3,110 | |
| 5% 7/1/29 (Build America Mutual Assurance Insured) (c) | 3,025 | 3,313 | |
| Los Angeles Dept. Arpt. Rev.: | |||
| Series 2016 A: | |||
5% 5/15/24 (c) | 890 | 895 | |
5% 5/15/24 (Escrowed to Maturity) (c) | 120 | 121 | |
5% 5/15/25 (c) | 880 | 901 | |
5% 5/15/25 (Escrowed to Maturity) (c) | 120 | 123 | |
| Series 2017 B, 5% 5/15/25 (c) | 2,265 | 2,318 | |
| Series 2018 B: | |||
5% 5/15/25 (c) | 1,305 | 1,336 | |
5% 5/15/26 (c) | 1,545 | 1,614 | |
| Series 2018 C, 5% 5/15/27 (c) | 1,615 | 1,714 | |
| Series 2020 C, 5% 5/15/26 (c) | 2,645 | 2,764 | |
| Los Angeles Unified School District Ctfs. of Prtn. Series 2023 A, 5% 10/1/28 | 3,450 | 3,861 | |
| Palomar Health Rev. Series 2016: | |||
| 5% 11/1/24 | 1,955 | 1,971 | |
| 5% 11/1/25 | 1,000 | 1,021 | |
| Port of Oakland Rev.: | |||
| Series 2021 H, 5% 5/1/28 (c) | 1,000 | 1,080 | |
| Series H: | |||
5% 5/1/26 (c) | 1,830 | 1,910 | |
5% 5/1/27 (c) | 3,400 | 3,615 | |
| San Diego County Reg'l. Arpt. Auth. Arpt. Rev. Series 2020 C, 5% 7/1/26 (c) | 1,000 | 1,040 | |
| San Francisco City & County Arpts. Commission Int'l. Arpt. Rev.: | |||
| Series 2019 A, 5% 1/1/27 (c) | 2,405 | 2,524 | |
| Series 2022 A: | |||
5% 5/1/26 (c) | 4,535 | 4,708 | |
5% 5/1/27 (c) | 4,590 | 4,850 | |
5% 5/1/28 (c) | 6,130 | 6,592 | |
5% 5/1/29 (c) | 4,100 | 4,482 | |
| Series 2023 A, 5% 5/1/25 (c) | 1,770 | 1,815 | |
| Southern California Pub. Pwr. Auth. Rev. Bonds Series 2020 C, 0.65%, tender 7/1/25 (b) | 8,000 | 7,699 | |
TOTAL CALIFORNIA | 101,231 | ||
| Colorado - 2.3% | |||
| Colorado Health Facilities Auth. Rev. Bonds Bonds: | |||
| Series 2019 B: | |||
5%, tender 8/1/25 (b) | 2,950 | 2,999 | |
5%, tender 8/1/26 (b) | 2,035 | 2,104 | |
5%, tender 11/19/26 (b) | 615 | 656 | |
5%, tender 11/19/26 (b) | 6,065 | 6,411 | |
| Series 2023 A1, 5%, tender 11/15/28 (b) | 12,265 | 13,370 | |
| Colorado Hsg. & Fin. Auth.: | |||
| Series 2019 F, 4.25% 11/1/49 | 960 | 965 | |
| Series 2019 H, 4.25% 11/1/49 | 490 | 493 | |
| Colorado Reg'l. Trans. District Ctfs. of Prtn. Series 2020, 5% 6/1/26 | 1,000 | 1,055 | |
| Colorado Univ. Co. Hosp. Auth. Rev. Bonds Series 2019 C, 5%, tender 11/15/24 (b) | 14,940 | 15,025 | |
| Denver City & County Arpt. Rev.: | |||
| Series 2018 A, 5% 12/1/29 (c) | 1,205 | 1,308 | |
| Series 2020 B1, 5% 11/15/24 (c) | 1,500 | 1,518 | |
| E-470 Pub. Hwy. Auth. Rev. Series 2020 A, 5% 9/1/26 | 1,750 | 1,856 | |
| Univ. of Colorado Enterprise Sys. Rev. Bonds: | |||
| Series 2019 C, 2%, tender 10/15/24 (b) | 9,030 | 8,957 | |
| Series 2021 C3A, 2%, tender 10/15/25 (b) | 1,625 | 1,584 | |
| Series 2021 C3B, 2%, tender 10/15/26 (b) | 1,345 | 1,293 | |
TOTAL COLORADO | 59,594 | ||
| Connecticut - 2.6% | |||
| Connecticut Gen. Oblig.: | |||
| Series 2016 A, 5% 3/15/26 | 1,925 | 2,025 | |
| Series 2019 A: | |||
5% 4/15/26 | 2,355 | 2,482 | |
5% 4/15/30 | 965 | 1,088 | |
| Series 2020 C, 2% 6/1/25 | 1,000 | 983 | |
| Series 2022 A, 4% 1/15/26 | 1,025 | 1,052 | |
| Series 2022 E, 5% 11/15/26 | 6,000 | 6,421 | |
| Series 2022 G, 5% 11/15/26 | 6,000 | 6,421 | |
| Series C, 4% 6/1/26 | 1,100 | 1,135 | |
| Connecticut Health & Edl. Facilities Auth. Rev.: | |||
| Bonds: | |||
Series 2010 A3, 0.25%, tender 2/9/24 (b) | 4,155 | 4,140 | |
Series 2014 B, 1.8%, tender 7/1/24 (b) | 3,150 | 3,115 | |
Series 2017 B2, 3.2%, tender 7/1/26 (b) | 3,370 | 3,405 | |
Series 2017 C2, 2.8%, tender 2/3/26 (b) | 19,250 | 19,263 | |
| Series 2016 A, 2%, tender 7/1/26 (b) | 1,725 | 1,679 | |
| Series 2018 S, 5% 7/1/24 | 1,000 | 1,009 | |
| Series 2019 A: | |||
4% 7/1/24 (d) | 1,090 | 1,081 | |
5% 7/1/25 (d) | 705 | 700 | |
5% 7/1/28 (d) | 1,315 | 1,305 | |
5% 7/1/29 (d) | 940 | 932 | |
| Series 2022 M: | |||
5% 7/1/24 | 175 | 176 | |
5% 7/1/27 | 250 | 264 | |
5% 7/1/28 | 300 | 321 | |
| Connecticut Spl. Tax Oblig. Trans. Infrastructure Rev. Series A, 5% 9/1/26 | 1,025 | 1,091 | |
| Hartford County Metropolitan District Gen. Oblig. Series 2021 A: | |||
| 5% 9/1/27 | 800 | 873 | |
| 5% 9/1/28 | 775 | 867 | |
| New Britain Gen. Oblig. Series 2009, 5% 4/1/24 (Escrowed to Maturity) | 373 | 374 | |
| New Haven Gen. Oblig. Series 2016 A, 5% 8/15/25 (Assured Guaranty Muni. Corp. Insured) | 980 | 1,011 | |
| Stratford Gen. Oblig. Series 2019, 5% 1/1/26 | 3,735 | 3,887 | |
| Univ. of Connecticut Gen. Oblig. Series 2019 A, 5% 11/1/26 | 1,000 | 1,066 | |
TOTAL CONNECTICUT | 68,166 | ||
| Delaware - 0.1% | |||
| Delaware Econ. Dev. Auth. Rev. Bonds (Delmarva Pwr. & Lt. Co. Proj.) Series A, 1.05%, tender 7/1/25 (b) | 1,475 | 1,417 | |
| District Of Columbia - 2.5% | |||
| District of Columbia Income Tax Rev.: | |||
| Series 2020 A, 5% 3/1/24 | 715 | 717 | |
| Series 2022 C, 5% 12/1/27 | 5,900 | 6,489 | |
| District of Columbia Wtr. & Swr. Auth. Pub. Util. Rev. Bonds Series 2019 C, 1.75%, tender 10/1/24 (b) | 7,540 | 7,408 | |
| Metropolitan Washington DC Arpts. Auth. Sys. Rev.: | |||
| Series 2014 A, 5% 10/1/26 (c) | 1,140 | 1,148 | |
| Series 2017 A, 5% 10/1/26 (c) | 12,905 | 13,530 | |
| Series 2019 A, 5% 10/1/25 (c) | 1,410 | 1,449 | |
| Series 2020 A: | |||
5% 10/1/24 (c) | 4,470 | 4,517 | |
5% 10/1/25 (c) | 4,470 | 4,594 | |
| Series 2021 A: | |||
5% 10/1/25 (c) | 3,000 | 3,083 | |
5% 10/1/28 (c) | 20,500 | 22,280 | |
TOTAL DISTRICT OF COLUMBIA | 65,215 | ||
| Florida - 4.8% | |||
| Brevard County Health Facilities Auth. Rev. Series 2023 A: | |||
| 5% 4/1/26 | 1,920 | 1,995 | |
| 5% 4/1/28 | 2,115 | 2,281 | |
| Broward County Arpt. Sys. Rev.: | |||
| Series 2012 P-1, 5% 10/1/25 (c) | 6,645 | 6,653 | |
| Series 2015 C, 5% 10/1/24 (c) | 1,015 | 1,025 | |
| Series 2019 A: | |||
5% 10/1/24 (c) | 1,300 | 1,313 | |
5% 10/1/25 (c) | 1,500 | 1,539 | |
| Series 2019 B: | |||
5% 10/1/24 (c) | 750 | 757 | |
5% 10/1/25 (c) | 755 | 775 | |
| Cap. Projs. Fin. Auth. Student Hsg. Rev. (Cap. Projs. Ln. Prog. - Florida Univs.) Series 2020 A: | |||
| 5% 10/1/24 | 540 | 543 | |
| 5% 10/1/26 | 1,940 | 1,989 | |
| Central Florida Expressway Auth. Sr. Lien Rev. Series 2021: | |||
| 5% 7/1/26 (Assured Guaranty Muni. Corp. Insured) | 1,485 | 1,570 | |
| 5% 7/1/27 (Assured Guaranty Muni. Corp. Insured) | 8,200 | 8,888 | |
| Florida Hsg. Fin. Corp. Multi-family Mtg. Rev. Bonds Series 2023 C, 5%, tender 12/1/25 (b) | 1,270 | 1,305 | |
| Florida Hsg. Fin. Corp. Rev. Series 2021 1, 3% 1/1/52 | 5,220 | 5,087 | |
| Florida Mid-Bay Bridge Auth. Rev. Series 2015 A: | |||
| 5% 10/1/24 | 1,955 | 1,976 | |
| 5% 10/1/25 | 1,710 | 1,757 | |
| 5% 10/1/26 | 1,955 | 1,995 | |
| Florida Muni. Pwr. Agcy. Rev. Series 2016 A, 4% 10/1/26 | 530 | 547 | |
| Greater Orlando Aviation Auth. Arpt. Facilities Rev.: | |||
| Series 2015 A, 5% 10/1/29 (Pre-Refunded to 10/1/25 @ 100) (c) | 1,070 | 1,101 | |
| Series 2016 A, 5% 10/1/25 (Escrowed to Maturity) (c) | 620 | 638 | |
| Series 2016, 5% 10/1/26 (c) | 1,300 | 1,360 | |
| Series 2017 A: | |||
5% 10/1/25 (c) | 320 | 329 | |
5% 10/1/25 (Escrowed to Maturity) (c) | 1,675 | 1,720 | |
5% 10/1/26 (c) | 545 | 570 | |
5% 10/1/26 (Escrowed to Maturity) (c) | 2,025 | 2,119 | |
5% 10/1/27 (Escrowed to Maturity) (c) | 580 | 618 | |
| Series 2019 A: | |||
5% 10/1/24 (c) | 12,700 | 12,829 | |
5% 10/1/25 (c) | 6,700 | 6,880 | |
5% 10/1/27 (c) | 1,940 | 2,074 | |
| Hillsborough County School Board Ctfs. of Prtn. (School Board of Hillsbrough County, Florida Master Lease Prog.) Series 2017 B, 5% 7/1/28 | 2,375 | 2,553 | |
| Jacksonville Spl. Rev. Series 2022 A: | |||
| 5% 10/1/24 | 785 | 798 | |
| 5% 10/1/25 | 610 | 635 | |
| 5% 10/1/26 | 435 | 464 | |
| 5% 10/1/27 | 345 | 377 | |
| 5% 10/1/28 | 685 | 765 | |
| 5% 10/1/29 | 595 | 678 | |
| 5% 10/1/30 | 560 | 650 | |
| 5% 10/1/32 | 510 | 613 | |
| Lee County Arpt. Rev. Series 2021 A: | |||
| 5% 10/1/24 (c) | 1,795 | 1,814 | |
| 5% 10/1/25 (c) | 3,325 | 3,416 | |
| Lee Memorial Health Sys. Hosp. Rev. Bonds Series 2019 A2, 5%, tender 4/1/26 (b) | 4,810 | 4,931 | |
| Miami-Dade County Aviation Rev.: | |||
| Series 2012 A, 5% 10/1/24 (c) | 1,800 | 1,802 | |
| Series 2014 A, 5% 10/1/31 (c) | 1,750 | 1,758 | |
| Series 2016 A, 5% 10/1/27 | 1,275 | 1,343 | |
| Miami-Dade County Indl. Dev. Auth. Solid Waste Disp. Rev. Bonds (Waste Mgmt., Inc. of Florida Proj.) Series 2007, 4.625%, tender 11/1/24 (b) | 10,000 | 10,078 | |
| Miami-Dade County School Board Ctfs. of Prtn. Series 2015 A, 5% 5/1/27 (Assured Guaranty Muni. Corp. Insured) | 1,880 | 1,928 | |
| Orange County Hsg. Fin. Auth. Multi-family Rev. Bonds Series 2021 B, 0.55%, tender 7/1/24 (b) | 9,950 | 9,742 | |
| Palm Beach County Health Facilities Auth. Hosp. Rev.: | |||
| (Jupiter Med. Ctr. Proj.) Series 2022, 5% 11/1/28 | 150 | 159 | |
| Series 2014, 5% 12/1/24 (Escrowed to Maturity) | 380 | 386 | |
| Palm Beach County Health Facilities Auth. Rev.: | |||
| Series 2015 C: | |||
5% 5/15/24 | 1,000 | 995 | |
5% 5/15/30 | 2,490 | 2,355 | |
| Series 2021 C, 4% 5/15/29 | 1,440 | 1,308 | |
| Pinellas County Hsg. Fin. Auth. Bonds Series 2021 B, 0.65%, tender 7/1/24 (b) | 2,170 | 2,125 | |
| Seminole County School Board Ctfs. of Prtn. Series 2016 C: | |||
| 5% 7/1/25 | 980 | 1,011 | |
| 5% 7/1/26 | 1,115 | 1,179 | |
| Village Cmnty. Dev. District No. 13 Series 2019, 2.625% 5/1/24 | 120 | 119 | |
TOTAL FLORIDA | 126,215 | ||
| Georgia - 4.3% | |||
| Atlanta Arpt. Rev.: | |||
| Series 2014 C, 5% 1/1/29 (c) | 900 | 900 | |
| Series 2020 A, 5% 7/1/26 (c) | 3,000 | 3,130 | |
| Series 2020 B: | |||
5% 7/1/27 (c) | 4,000 | 4,255 | |
5% 7/1/29 (c) | 1,920 | 2,112 | |
| Series 2021 C, 5% 7/1/30 (c) | 1,315 | 1,468 | |
| Series 2023 G: | |||
5% 7/1/28 (c) | 2,015 | 2,180 | |
5% 7/1/29 (c) | 5,635 | 6,199 | |
| Burke County Indl. Dev. Auth. Poll. Cont. Rev. Bonds: | |||
| (Georgia Pwr. Co. Plant Vogtle Proj.): | |||
Series 1995 4, 3.8%, tender 5/21/26 (b) | 3,500 | 3,527 | |
Series 2012, 1.7%, tender 8/22/24 (b) | 3,400 | 3,333 | |
Series 2013 1st, 2.925%, tender 3/12/24 (b) | 9,930 | 9,897 | |
| (Oglethorpe Pwr. Corp. Vogtle Proj.) Series 2017 E, 3.25%, tender 2/3/25 (b) | 900 | 891 | |
| Columbus Med. Ctr. Hosp. Auth. Bonds (Piedmont Healthcare, Inc. Proj.) Series 2019 A, 5%, tender 7/1/26 (b) | 4,840 | 5,005 | |
| Georgia Gen. Oblig. Series 2016 A, 5% 2/1/27 | 4,980 | 5,239 | |
| Georgia Muni. Elec. Auth. Pwr. Rev. Series 2020 A: | |||
| 4% 11/1/24 | 1,420 | 1,428 | |
| 5% 1/1/25 | 1,000 | 1,016 | |
| 5% 1/1/26 | 1,125 | 1,172 | |
| 5% 1/1/26 | 1,000 | 1,041 | |
| 5% 1/1/27 | 760 | 806 | |
| Georgia Road & Thruway Auth. Rev. Series 2020, 5% 6/1/26 | 2,500 | 2,644 | |
| Main Street Natural Gas, Inc.: | |||
| Bonds: | |||
Series 2021 A, 4%, tender 9/1/27 (b) | 15,000 | 15,088 | |
Series 2021 C, 4%, tender 12/1/28 (b) | 16,990 | 17,106 | |
Series 2023 D, 5%, tender 12/1/30 (b) | 11,820 | 12,571 | |
| Series 2022 A: | |||
4% 12/1/24 | 1,100 | 1,099 | |
4% 12/1/25 | 170 | 170 | |
4% 12/1/26 | 1,955 | 1,957 | |
| Series 2023 B, 5% 3/1/24 | 260 | 260 | |
| Series 2023 D, 5% 12/1/29 | 2,750 | 2,917 | |
| Monroe County Dev. Auth. Poll. Cont. Rev. (Georgia Pwr. Co. Plant Scherer Proj.) Series 1995, 2.25% 7/1/25 | 6,505 | 6,270 | |
| Private Colleges & Univs. Auth. Rev. (The Savannah College of Art & Design Projs.) Series 2021, 5% 4/1/26 | 1,200 | 1,254 | |
TOTAL GEORGIA | 114,935 | ||
| Hawaii - 0.6% | |||
| Hawaii Arpts. Sys. Rev. Series 2018 A, 5% 7/1/31 (c) | 1,000 | 1,072 | |
| Hawaii Gen. Oblig. Series 2015 EZ, 5% 10/1/26 | 10,000 | 10,380 | |
| Honolulu City & County Gen. Oblig.: | |||
| Series 2016 C, 5% 10/1/28 | 1,000 | 1,119 | |
| Series 2020 F, 5% 7/1/26 | 800 | 847 | |
| Series 2022 A, 5% 11/1/26 | 1,985 | 2,120 | |
TOTAL HAWAII | 15,538 | ||
| Idaho - 0.0% | |||
| Idaho Hsg. & Fin. Assoc. Single Family Mtg. Series 2019 A, 4% 1/1/50 | 250 | 250 | |
| Illinois - 9.2% | |||
| Champaign County Cmnty. Unit Series 2019, 4% 6/1/24 | 420 | 421 | |
| Chicago Board of Ed.: | |||
| Series 2017 C: | |||
5% 12/1/26 | 485 | 500 | |
5% 12/1/27 | 1,830 | 1,909 | |
| Series 2018 C, 5% 12/1/24 | 13,000 | 13,093 | |
| Series 2019 A, 0% 12/1/26 | 3,500 | 3,126 | |
| Series 2023 A, 5% 12/1/30 | 5,000 | 5,315 | |
| Chicago Gen. Oblig. Series 2020 A, 5% 1/1/30 | 2,005 | 2,177 | |
| Chicago Metropolitan Wtr. Reclamation District of Greater Chicago Series 2007, 5.25% 12/1/32 | 2,920 | 3,540 | |
| Chicago Midway Arpt. Rev.: | |||
| Series 2013 B, 5% 1/1/25 | 1,700 | 1,702 | |
| Series 2014 A, 5% 1/1/26 (c) | 3,475 | 3,491 | |
| Series 2016 A: | |||
5% 1/1/27 (c) | 2,810 | 2,881 | |
5% 1/1/28 (c) | 500 | 512 | |
| Chicago O'Hare Int'l. Arpt. Rev.: | |||
| Series 2012 B, 4% 1/1/27 (c) | 1,220 | 1,220 | |
| Series 2015 A: | |||
5% 1/1/26 (c) | 1,600 | 1,613 | |
5% 1/1/27 (c) | 1,000 | 1,008 | |
| Series 2015 C, 5% 1/1/26 (c) | 1,540 | 1,553 | |
| Series 2016 A, 5% 1/1/27 (c) | 840 | 865 | |
| Series 2017 D: | |||
5% 1/1/26 (c) | 445 | 459 | |
5% 1/1/27 (c) | 1,595 | 1,673 | |
5% 1/1/29 (c) | 215 | 226 | |
| Series 2020 B, 5% 1/1/26 | 1,310 | 1,369 | |
| Series 2022 A, 5% 1/1/26 (c) | 830 | 856 | |
| Series 2022 C, 5% 1/1/26 (c) | 2,300 | 2,371 | |
| Chicago Transit Auth. Cap. Grant Receipts Rev. Series 2017, 5% 6/1/25 | 1,225 | 1,251 | |
| Cook County Gen. Oblig.: | |||
| Series 2021 A: | |||
5% 11/15/24 | 425 | 432 | |
5% 11/15/25 | 425 | 442 | |
5% 11/15/26 | 850 | 905 | |
5% 11/15/27 | 1,075 | 1,171 | |
| Series 2021 B: | |||
4% 11/15/25 | 1,100 | 1,123 | |
4% 11/15/26 | 555 | 576 | |
4% 11/15/27 | 565 | 595 | |
4% 11/15/28 | 285 | 299 | |
| Series 2022 A: | |||
5% 11/15/25 | 5,585 | 5,804 | |
5% 11/15/26 | 300 | 319 | |
5% 11/15/27 | 325 | 354 | |
5% 11/15/28 | 350 | 390 | |
5% 11/15/29 | 1,315 | 1,485 | |
| Cook County Sales Tax Rev.: | |||
| Series 2022 A: | |||
5% 11/15/26 | 635 | 674 | |
5% 11/15/27 | 350 | 379 | |
5% 11/15/28 | 190 | 210 | |
5% 11/15/29 | 140 | 157 | |
5% 11/15/30 | 315 | 357 | |
| Series 2022 B: | |||
5% 11/15/25 | 815 | 847 | |
5% 11/15/26 | 360 | 382 | |
5% 11/15/27 | 470 | 509 | |
5% 11/15/28 | 290 | 320 | |
5% 11/15/29 | 265 | 298 | |
5% 11/15/30 | 275 | 312 | |
| Illinois Fin. Auth.: | |||
| Bonds Series 2020 B: | |||
5%, tender 11/15/24 (b) | 2,125 | 2,132 | |
5%, tender 11/15/26 (b) | 2,830 | 2,945 | |
| Series 2015, 5% 5/1/45 (Pre-Refunded to 5/1/25 @ 100) | 1,190 | 1,219 | |
| Series 2020 A, 5% 8/15/24 | 1,080 | 1,093 | |
| Series 2022 A: | |||
5% 10/1/26 | 265 | 272 | |
5% 10/1/28 | 330 | 347 | |
| Illinois Fin. Auth. Rev.: | |||
| (Bradley Univ. Proj.) Series 2017 C, 5% 8/1/26 | 1,650 | 1,714 | |
| (Edward-Elmhurst Healthcare) Series 2017 A, 5% 1/1/25 (Escrowed to Maturity) | 740 | 754 | |
| (OSF Healthcare Sys.) Series 2018 A: | |||
5% 5/15/26 | 4,300 | 4,451 | |
5% 5/15/27 | 9,260 | 9,752 | |
| Series 2008 A3, 5% 11/1/30 | 1,280 | 1,352 | |
| Series 2015 A: | |||
5% 11/15/24 | 1,490 | 1,511 | |
5% 11/15/25 | 1,905 | 1,958 | |
5% 11/15/26 | 1,955 | 2,016 | |
| Series 2015 B, 5% 11/15/24 | 1,910 | 1,938 | |
| Series 2016 A: | |||
5.25% 8/15/28 (Pre-Refunded to 8/15/26 @ 100) | 1,000 | 1,060 | |
5.25% 8/15/29 (Pre-Refunded to 8/15/26 @ 100) | 5,850 | 6,201 | |
| Series 2016 C, 5% 2/15/27 | 1,875 | 2,001 | |
| Series 2016: | |||
5% 5/15/25 | 490 | 501 | |
5% 5/15/26 | 980 | 1,015 | |
5% 5/15/27 | 1,225 | 1,279 | |
| Series 2019: | |||
5% 9/1/24 | 415 | 415 | |
5% 9/1/25 | 900 | 898 | |
5% 4/1/26 | 1,625 | 1,687 | |
5% 9/1/26 | 300 | 300 | |
5% 4/1/27 | 2,135 | 2,262 | |
5% 9/1/27 | 500 | 502 | |
5% 4/1/28 | 1,425 | 1,533 | |
5% 4/1/29 | 2,000 | 2,183 | |
| Illinois Gen. Oblig.: | |||
| Series 2014, 5% 2/1/25 | 2,275 | 2,277 | |
| Series 2016: | |||
4% 2/1/30 (Assured Guaranty Muni. Corp. Insured) | 3,760 | 3,849 | |
5% 1/1/26 | 2,970 | 3,078 | |
| Series 2017 C, 5% 11/1/29 | 14,620 | 15,653 | |
| Series 2017 D: | |||
5% 11/1/25 | 6,635 | 6,861 | |
5% 11/1/26 | 5,890 | 6,211 | |
| Series 2018 A, 5% 10/1/26 | 4,615 | 4,853 | |
| Series 2020 B: | |||
5% 10/1/25 | 5,105 | 5,266 | |
5% 10/1/28 | 6,500 | 7,084 | |
| Series 2022 B: | |||
5% 3/1/26 | 6,880 | 7,153 | |
5% 3/1/27 | 6,500 | 6,891 | |
| Series 2023 B, 5% 5/1/28 | 3,000 | 3,248 | |
| Series 2023 D, 5% 7/1/28 | 4,230 | 4,597 | |
| Illinois Hsg. Dev. Auth. Rev. Series D, 3.75% 4/1/50 | 505 | 502 | |
| Illinois Sales Tax Rev.: | |||
| Series 2013, 5% 6/15/24 | 2,985 | 2,988 | |
| Series 2021 C: | |||
5% 6/15/24 | 615 | 620 | |
5% 6/15/25 | 355 | 363 | |
| Illinois Toll Hwy. Auth. Toll Hwy. Rev. Series 2024 A, 5% 1/1/31 (e) | 790 | 916 | |
| Lake, Cook, Kane & McHenry Countries Cmnty. Unit School District #220 Series 2021, 3% 12/1/32 | 1,250 | 1,190 | |
| McHenry County Cmnty. School District #200 Series 2006 B: | |||
| 0% 1/15/25 | 4,915 | 4,744 | |
| 0% 1/15/26 | 3,695 | 3,455 | |
| Metropolitan Pier & Exposition: | |||
| Series 1994, 0% 6/15/29 (FGIC Insured) | 4,430 | 3,714 | |
| Series 2002: | |||
0% 12/15/29 (Assured Guaranty Muni. Corp. Insured) (Nat'l. Pub. Fin. Guarantee Corp. Insured) | 2,440 | 2,020 | |
0% 12/15/29 (Nat'l. Pub. Fin. Guarantee Corp. Insured) | 3,690 | 3,040 | |
| Series 2022 A, 3% 6/15/25 | 2,330 | 2,308 | |
| Series 2023 A, 5% 12/15/28 | 2,880 | 3,087 | |
| Northern Illinois Univ. Revs. Series 2020 B, 5% 4/1/24 (Build America Mutual Assurance Insured) | 1,100 | 1,104 | |
| Sales Tax Securitization Corp.: | |||
| Series 2023 C, 5% 1/1/29 | 5,225 | 5,742 | |
| Series 2023 D, 5% 1/1/28 | 1,735 | 1,871 | |
| Schaumburg Village Gen. Oblig. Series 2023, 4% 12/1/31 | 2,820 | 3,015 | |
TOTAL ILLINOIS | 244,462 | ||
| Indiana - 2.1% | |||
| Indiana Fin. Auth. Envir. Facilities Rev. Bonds (Indianapolis Pwr. & Lt. Co. Proj.): | |||
| Series 2020 A, 0.75%, tender 4/1/26 (b) | 600 | 550 | |
| Series 2020 B, 0.95%, tender 4/1/26 (b)(c) | 1,025 | 947 | |
| Indiana Fin. Auth. Health Sys. Rev. Bonds: | |||
| Series 2019 B, 2.25%, tender 7/1/25 (b) | 6,405 | 6,302 | |
| Series 2023 B1, 5%, tender 7/1/28 (b) | 5,865 | 6,357 | |
| Indiana Fin. Auth. Hosp. Rev. Bonds: | |||
| Series 2011 L, 0.7%, tender 1/1/26 (b) | 1,105 | 1,031 | |
| Series 2011 M, 0.7%, tender 1/1/26 (b) | 7,795 | 7,275 | |
| Indiana Fin. Auth. Wastewtr. Util. Rev. (CWA Auth. Proj.) Series 2015 A, 5% 10/1/25 | 1,590 | 1,614 | |
| Indiana Hsg. & Cmnty. Dev. Auth.: | |||
| Series 2019 B, 3.5% 1/1/49 | 1,130 | 1,117 | |
| Series 2021 B, 3% 7/1/50 | 825 | 803 | |
| Series 2021 C1, 3% 1/1/52 | 3,575 | 3,448 | |
| Indianapolis Local Pub. Impt.: | |||
| (Indianapolis Arpt. Auth. Proj.): | |||
Series 2014 D: | |||
5% 1/1/28 (c) | 470 | 472 | |
5% 1/1/30 (c) | 550 | 552 | |
Series 2016 A1, 5% 1/1/25 (c) | 2,845 | 2,885 | |
Series 2019 D, 5% 1/1/25 (c) | 1,710 | 1,734 | |
| Indianapolis Arpt. Auth. Proj. Series 2019 D, 5% 1/1/26 (c) | 3,680 | 3,794 | |
| Whiting Envir. Facilities Rev. Bonds (BP Products North America, Inc. Proj.): | |||
| Series 2017, 5%, tender 11/1/24 (b)(c) | 1,250 | 1,256 | |
| Series 2019 A, 5%, tender 6/5/26 (b)(c) | 15,985 | 16,258 | |
TOTAL INDIANA | 56,395 | ||
| Iowa - 0.1% | |||
| Iowa Student Ln. Liquidity Corp. Student Ln. Rev.: | |||
| Series 2019 B, 5% 12/1/24 (c) | 800 | 809 | |
| Series 2023 B, 5% 12/1/30 (c) | 1,770 | 1,924 | |
TOTAL IOWA | 2,733 | ||
| Kansas - 0.0% | |||
| Wyandotte County/Kansas City Unified Govt. Util. Sys. Rev. Series 2016 A, 5% 9/1/25 | 785 | 811 | |
| Kentucky - 3.7% | |||
| Ashland Med. Ctr. Rev. (Ashland Hosp. Corp. D/B/A King's Daughters Med. Ctr. Proj.) Series 2016 A: | |||
| 5% 2/1/24 | 1,330 | 1,331 | |
| 5% 2/1/25 | 980 | 993 | |
| Carroll County Envir. Facilities Rev. Bonds (Kentucky Utils. Co. Proj.) Series 2004 A, 1.75%, tender 9/1/26 (b)(c) | 9,750 | 9,117 | |
| Carroll County Poll. Ctlr Rev. Bonds (Kentucky Utils. Co. Proj.) Series 2016 A, 1.55%, tender 9/1/26 (b) | 5,750 | 5,343 | |
| Kentucky Asset/Liability Commission Gen. Fund Rev. Series 2021 A: | |||
| 5% 11/1/24 | 1,065 | 1,082 | |
| 5% 11/1/25 | 3,000 | 3,112 | |
| 5% 11/1/26 | 1,000 | 1,061 | |
| 5% 11/1/27 | 1,000 | 1,085 | |
| Kentucky Econ. Dev. Fin. Auth. Hosp. Rev. Series 2015 A, 5% 6/1/24 | 1,655 | 1,658 | |
| Kentucky Hsg. Corp. Single Family Mtg. Rev. Series 2023 A, 6% 7/1/54 | 12,775 | 14,226 | |
| Kentucky State Property & Buildings Commission Rev. Series A, 5% 11/1/24 | 1,250 | 1,270 | |
| Kentucky, Inc. Pub. Energy: | |||
| Bonds: | |||
Series 2018 A, 4%, tender 3/15/24 (b) | 4,110 | 4,120 | |
Series 2019 A1, 4%, tender 6/1/25 (b) | 10,455 | 10,474 | |
Series A, 4%, tender 6/1/26 (b) | 11,570 | 11,508 | |
Series C1, 4%, tender 6/1/25 (b) | 15,000 | 15,027 | |
| Series A: | |||
4% 12/1/25 | 825 | 828 | |
4% 6/1/26 | 1,085 | 1,087 | |
| Louisville & Jefferson County: | |||
| Bonds Series 2020 C, 5%, tender 10/1/26 (b) | 5,985 | 6,253 | |
| Series 2023 A: | |||
5% 10/1/28 | 2,500 | 2,736 | |
5% 10/1/29 | 1,310 | 1,449 | |
5% 10/1/30 | 1,485 | 1,667 | |
| Louisville Reg'l. Arpt. Auth. Sys. Rev. Series 2014 A, 5% 7/1/24 (c) | 1,280 | 1,289 | |
TOTAL KENTUCKY | 96,716 | ||
| Louisiana - 0.4% | |||
| Louisiana Hsg. Corp. Single Fami (Home Ownership Prog.) Series 2023 C, 5.75% 12/1/53 | 950 | 1,045 | |
| New Orleans Aviation Board Rev.: | |||
| (North Term. Proj.) Series 2017 B: | |||
5% 1/1/24 (c) | 195 | 195 | |
5% 1/1/25 (c) | 195 | 198 | |
5% 1/1/26 (c) | 490 | 504 | |
| Series 2017 D2: | |||
5% 1/1/24 (c) | 735 | 735 | |
5% 1/1/25 (c) | 1,390 | 1,410 | |
| St. John Baptist Parish Rev.: | |||
| (Marathon Oil Corp.) Series 2017, 2.2% 6/1/37 (b) | 3,765 | 3,560 | |
| Bonds (Marathon Oil Corp.) Series 2017, 4.05%, tender 7/1/26 (b) | 3,320 | 3,283 | |
TOTAL LOUISIANA | 10,930 | ||
| Maine - 0.1% | |||
| Brunswick Series 2020, 2% 11/1/31 | 1,015 | 920 | |
| City of Portland Arpt. Series 2016, 5% 1/1/29 | 690 | 714 | |
| Maine Health & Higher Edl. Facilities Auth. Rev. Series 2021 A: | |||
| 5% 7/1/28 | 555 | 603 | |
| 5% 7/1/29 | 600 | 664 | |
| 5% 7/1/30 | 500 | 561 | |
TOTAL MAINE | 3,462 | ||
| Maryland - 1.7% | |||
| Hsg. Opportunities Commission of Montgomery County Series 2021 C, 0.8% 7/1/25 | 700 | 662 | |
| Maryland Cmnty. Dev. Admin Dept. Hsg. & Cmnty. Dev.: | |||
| Series 2019 B, 4% 9/1/49 | 1,125 | 1,123 | |
| Series 2019 C, 3.5% 3/1/50 | 1,190 | 1,175 | |
| Series 2021 C: | |||
0.5% 1/1/24 | 1,000 | 1,000 | |
0.6% 7/1/24 | 2,840 | 2,800 | |
| Series 2023 E, 6.25% 3/1/54 | 600 | 663 | |
| Maryland Dept. of Trans.: | |||
| Series 2021 B, 5% 8/1/27 (c) | 1,805 | 1,913 | |
| Series 2022 B, 5% 12/1/27 | 1,295 | 1,425 | |
| Series 2022, 5% 12/1/26 | 1,395 | 1,497 | |
| Maryland Gen. Oblig. Series 2022 2D, 3% 8/1/27 | 1,575 | 1,600 | |
| Maryland Health & Higher Edl. Bonds: | |||
| Series 2020 B2, 5%, tender 7/1/27 (b) | 2,480 | 2,624 | |
| Series 2020, 5%, tender 7/1/25 (b) | 8,525 | 8,671 | |
| Maryland Health & Higher Edl. Facilities Auth. Rev. Series 2015: | |||
| 5% 7/1/24 | 1,955 | 1,969 | |
| 5% 7/1/25 | 1,730 | 1,771 | |
| Maryland Trans. Auth. Passenger Facility Charge Rev. Series 2012 B: | |||
| 2.5% 6/1/26 (c) | 4,915 | 4,758 | |
| 2.625% 6/1/27 (c) | 4,030 | 3,890 | |
| Montgomery County Gen. Oblig. Series 2022 A: | |||
| 5% 8/1/24 | 895 | 906 | |
| 5% 8/1/26 | 7,075 | 7,525 | |
TOTAL MARYLAND | 45,972 | ||
| Massachusetts - 1.4% | |||
| Massachusetts Bay Trans. Auth. Sales Tax Rev. Series 2016 A, 0% 7/1/29 | 1,000 | 824 | |
| Massachusetts Dev. Fin. Agcy. Rev.: | |||
| Bonds Series 2011 N, 0.45%, tender 7/1/25 (b) | 5,000 | 4,726 | |
| Series 2016 I: | |||
5% 7/1/24 | 1,075 | 1,081 | |
5% 7/1/25 | 1,475 | 1,515 | |
5% 7/1/25 | 1,480 | 1,508 | |
5% 7/1/26 | 980 | 1,018 | |
| Series 2019 A: | |||
5% 7/1/24 | 1,150 | 1,159 | |
5% 7/1/25 | 825 | 839 | |
5% 7/1/26 | 2,015 | 2,059 | |
| Series 2021: | |||
4% 7/1/24 | 225 | 224 | |
4% 7/1/25 | 235 | 233 | |
| 5% 7/1/25 | 740 | 760 | |
| 5% 7/1/25 (Escrowed to Maturity) | 1,915 | 1,975 | |
| Massachusetts Edl. Fing. Auth. Rev.: | |||
| Series 2016, 5% 7/1/24 (c) | 2,850 | 2,870 | |
| Series 2020 C: | |||
5% 7/1/25 (c) | 850 | 869 | |
5% 7/1/26 (c) | 1,900 | 1,965 | |
| Series 2021 B, 5% 7/1/26 (c) | 1,390 | 1,437 | |
| Series 2023 B: | |||
5% 7/1/28 (c) | 3,675 | 3,902 | |
5% 7/1/29 (c) | 2,650 | 2,848 | |
| Massachusetts Health & Edl. Facilities Auth. Rev. Bonds Series I, 0.7%, tender 7/1/25 (b) | 2,133 | 2,024 | |
| Massachusetts Port Auth. Rev.: | |||
| Series 2017 A, 5% 7/1/25 (c) | 1,115 | 1,143 | |
| Series 2021 E, 5% 7/1/27 (c) | 500 | 531 | |
| Univ. of Massachusetts Bldg. Auth. Rev. Series 2021 1, 5% 11/1/26 | 2,445 | 2,620 | |
TOTAL MASSACHUSETTS | 38,130 | ||
| Michigan - 1.2% | |||
| Detroit Downtown Dev. Auth. Tax Series A, 5% 7/1/24 (Assured Guaranty Muni. Corp. Insured) | 1,000 | 1,009 | |
| Flint Hosp. Bldg. Auth. Rev. Series 2020, 5% 7/1/24 | 925 | 927 | |
| Grand Traverse County Hosp. Fin. Auth. Series 2021: | |||
| 5% 7/1/26 | 550 | 577 | |
| 5% 7/1/27 | 900 | 962 | |
| 5% 7/1/28 | 725 | 787 | |
| Kalamazoo Hosp. Fin. Auth. Hosp. Facilities Rev. Series 2016: | |||
| 5% 5/15/24 | 635 | 639 | |
| 5% 5/15/24 (Escrowed to Maturity) | 5 | 5 | |
| 5% 5/15/25 | 1,275 | 1,304 | |
| 5% 5/15/25 (Escrowed to Maturity) | 10 | 10 | |
| 5% 5/15/26 | 1,230 | 1,282 | |
| 5% 5/15/26 (Escrowed to Maturity) | 5 | 5 | |
| Lansing Board of Wtr. & Lt. Util. Rev. Bonds Series 2021 B, 2%, tender 7/1/26 (b) | 2,000 | 1,898 | |
| Michigan Fin. Auth. Rev.: | |||
| Bonds: | |||
Series 2015 D2, 1.2%, tender 4/13/28 (b) | 635 | 570 | |
Series 2019 MI2, 5%, tender 2/1/25 (b) | 4,830 | 4,919 | |
| Series 2015 A, 5% 8/1/26 (Pre-Refunded to 8/1/24 @ 100) | 300 | 303 | |
| Series 2015 D1, 0.75% 10/15/25 | 1,000 | 959 | |
| Series 2020 A, 5% 6/1/25 | 2,000 | 2,042 | |
| Michigan Hsg. Dev. Auth. Single Family Mtg. Rev.: | |||
| Series 2021 A, 3% 6/1/52 | 1,935 | 1,879 | |
| Series A, 3.5% 12/1/50 | 925 | 913 | |
| Michigan Strategic Fund Ltd. Oblig. Rev. Bonds (Consumer Energy Co. Proj.) Series 2019, 1.8%, tender 10/1/24 (b)(c) | 3,140 | 3,091 | |
| Novi Cmnty. School District Series I: | |||
| 4% 5/1/24 | 795 | 797 | |
| 4% 5/1/25 | 600 | 608 | |
| Portage Pub. Schools Series 2016: | |||
| 5% 5/1/25 | 1,100 | 1,132 | |
| 5% 11/1/25 | 1,195 | 1,244 | |
| 5% 11/1/28 | 985 | 1,034 | |
| Saginaw Hosp. Fin. Auth. Hosp. Rev. Series 2020 J: | |||
| 5% 7/1/24 | 765 | 771 | |
| 5% 7/1/25 | 500 | 511 | |
| 5% 7/1/26 | 750 | 779 | |
TOTAL MICHIGAN | 30,957 | ||
| Minnesota - 1.5% | |||
| Duluth Econ. Dev. Auth. Series 2021 A: | |||
| 3% 7/1/24 | 200 | 198 | |
| 3% 7/1/25 | 615 | 596 | |
| Minneapolis & Saint Paul Metropolitan Arpts. Commission Arpt. Rev. Series 2022 B: | |||
| 5% 1/1/24 (c) | 705 | 705 | |
| 5% 1/1/25 (c) | 460 | 467 | |
| 5% 1/1/26 (c) | 1,125 | 1,160 | |
| 5% 1/1/27 (c) | 3,800 | 3,986 | |
| Minneapolis Health Care Sys. Rev. Bonds Series 2023 A, 5%, tender 11/15/28 (b) | 11,835 | 12,845 | |
| Minnesota Gen. Oblig. Series 2023 A, 5% 8/1/29 | 7,810 | 8,920 | |
| Minnesota Hsg. Fin. Agcy.: | |||
| Series 2023 E, 6.25% 7/1/54 | 540 | 598 | |
| Series 2023 F, 5.75% 7/1/53 | 650 | 702 | |
| Series 2023, 6% 7/1/53 | 2,925 | 3,198 | |
| Moorhead Edl. Facilities Rev. (The Concordia College Corp. Proj.) Series 2016, 5% 12/1/25 | 1,555 | 1,566 | |
| Shakopee Sr. Hsg. Rev. Bonds Series 2018, 5.85%, tender 11/1/25 (b)(d) | 2,430 | 2,358 | |
| Southern Minnesota Muni. Pwr. Agcy. Pwr. Supply Sys. Rev. Series 2015 A, 5% 1/1/26 | 2,065 | 2,158 | |
| Western Minnesota Muni. Pwr. Agcy. Pwr. Supply Rev. Series 2014 A, 5% 1/1/24 | 980 | 980 | |
TOTAL MINNESOTA | 40,437 | ||
| Mississippi - 0.2% | |||
| Mississippi Dev. Bank Spl. Oblig. (Magnolia Reg'l. Health Ctr. Proj.) Series 2021: | |||
| 5% 10/1/25 (d) | 1,320 | 1,336 | |
| 5% 10/1/27 (d) | 900 | 931 | |
| Mississippi Hosp. Equip. & Facilities Auth.: | |||
| (Forrest County Gen. Hosp. Rfdg. Proj.) Series 2019 B, 5% 1/1/24 | 400 | 400 | |
| Bonds Series II, 5%, tender 3/1/27 (b) | 1,130 | 1,188 | |
| Series I: | |||
5% 10/1/25 | 600 | 618 | |
5% 10/1/27 | 800 | 854 | |
TOTAL MISSISSIPPI | 5,327 | ||
| Missouri - 0.8% | |||
| Cape Girardeau County Indl. Dev. Auth. (Southeast Hosp. Proj.) Series 2017 A: | |||
| 5% 3/1/24 | 685 | 686 | |
| 5% 3/1/25 | 710 | 718 | |
| 5% 3/1/26 | 980 | 1,023 | |
| Kansas City Indl. Dev. Auth. (Kansas City Int'l. Arpt. Term. Modernization Proj.): | |||
| Series 2020 A: | |||
5% 3/1/26 (c) | 1,185 | 1,223 | |
5% 3/1/27 (c) | 4,065 | 4,261 | |
| Series 2020 B: | |||
5% 3/1/26 | 2,190 | 2,284 | |
5% 3/1/27 | 1,535 | 1,638 | |
| Kansas City Planned Indl. Expansion Bonds Series 2023, 5%, tender 7/1/27 (b) | 2,485 | 2,605 | |
| Missouri Hsg. Dev. Commission Single Family Mtg. Rev. Series 2019, 4% 5/1/50 | 285 | 285 | |
| Saint Louis Arpt. Rev. Series A, 5.25% 7/1/26 (Assured Guaranty Muni. Corp. Insured) | 5,370 | 5,715 | |
TOTAL MISSOURI | 20,438 | ||
| Montana - 0.2% | |||
| Montana Board Hsg. Single Family: | |||
| Series 2019 B, 4% 6/1/50 | 170 | 170 | |
| Series 2021 B, 3% 12/1/51 | 2,185 | 2,127 | |
| Series 2022 A, 3% 6/1/52 | 1,625 | 1,574 | |
| Series A1, 3.5% 6/1/50 | 2,505 | 2,476 | |
TOTAL MONTANA | 6,347 | ||
| Nebraska - 1.5% | |||
| Central Plains Energy Proj. Rev. Bonds: | |||
| (Proj. No. 4) Series 2023 A1, 5%, tender 11/1/29 (b) | 9,280 | 9,837 | |
| Series 2019, 4%, tender 8/1/25 (b) | 11,940 | 12,006 | |
| Douglas County Hosp. Auth. #2 Health Facilities Rev. Bonds Series 2020, 5%, tender 11/15/25 (b) | 2,200 | 2,255 | |
| Lincoln Arpt. Auth. Series 2021: | |||
| 5% 7/1/24 (c) | 700 | 706 | |
| 5% 7/1/26 (c) | 750 | 781 | |
| 5% 7/1/27 (c) | 1,275 | 1,352 | |
| 5% 7/1/28 (c) | 1,830 | 1,975 | |
| 5% 7/1/29 (c) | 1,000 | 1,097 | |
| Nebraska Invt. Fin. Auth. Single Family Hsg. Rev.: | |||
| Series 2019 B, 4% 9/1/49 (c) | 810 | 805 | |
| Series 2019 E, 3.75% 9/1/49 (c) | 845 | 837 | |
| Nebraska Pub. Pwr. District Rev. Series 2017 B, 5% 1/1/26 | 1,260 | 1,315 | |
| Washington County Wstwtr Sol Bonds (Cargill, Inc. Projs.) Series 2012, 0.9%, tender 9/1/25 (b)(c) | 7,400 | 7,122 | |
TOTAL NEBRASKA | 40,088 | ||
| Nevada - 1.0% | |||
| Clark County Arpt. Rev.: | |||
| Series 2014 A2: | |||
5% 7/1/28 | 525 | 530 | |
5% 7/1/30 | 750 | 756 | |
| Series 2021 B: | |||
5% 7/1/24 (c) | 985 | 992 | |
5% 7/1/25 (c) | 1,795 | 1,839 | |
5% 7/1/27 (c) | 6,000 | 6,349 | |
| Clark County McCarran Int'l. Arpt. Passenger Facility Charge Rev.: | |||
| Series 2019 E: | |||
5% 7/1/25 | 1,275 | 1,316 | |
5% 7/1/27 | 2,245 | 2,433 | |
| Series B, 5% 7/1/24 (c) | 2,080 | 2,095 | |
| Clark County School District: | |||
| Series 2017 A, 5% 6/15/26 | 1,285 | 1,354 | |
| Series 2020 B, 5% 6/15/26 | 5,805 | 6,130 | |
| Nevada Gen. Oblig. Series 2015 A, 3% 8/1/29 | 2,175 | 2,176 | |
TOTAL NEVADA | 25,970 | ||
| New Hampshire - 0.4% | |||
| Nat'l. Fin. Auth. Hosp. Rev. (St. Luke's Univ. Health Network Proj.) Series 2021 B: | |||
| 5% 8/15/24 | 600 | 606 | |
| 5% 8/15/28 | 1,125 | 1,215 | |
| Nat'l. Fin. Auth. Solid Bonds (Waste Mgmt., Inc. Proj.): | |||
| Series 2019 A3, 2.15%, tender 7/1/24 (b)(c) | 4,455 | 4,413 | |
| Series 2019 A4, 2.15%, tender 7/1/24 (b)(c) | 2,250 | 2,229 | |
| New Hampshire Bus. Fin. Auth. Wtr. Facility (Pennichuck Wtr. Works, Inc. Proj.) Series 2014 A, 5% 1/1/25 (Escrowed to Maturity) (c) | 1,000 | 1,016 | |
TOTAL NEW HAMPSHIRE | 9,479 | ||
| New Jersey - 4.2% | |||
| New Jersey Econ. Dev. Auth. Series 2024 SSS: | |||
| 5% 6/15/24 (e) | 1,750 | 1,753 | |
| 5% 6/15/26 (e) | 2,575 | 2,688 | |
| 5% 6/15/27 (e) | 1,070 | 1,140 | |
| New Jersey Econ. Dev. Auth. Rev.: | |||
| (Provident Montclair Proj.) Series 2017, 5% 6/1/24 (Assured Guaranty Muni. Corp. Insured) | 980 | 988 | |
| Series 2014 RR, 5% 6/15/32 (Pre-Refunded to 6/15/24 @ 100) | 375 | 378 | |
| Series 2014 UU, 5% 6/15/30 (Pre-Refunded to 6/15/24 @ 100) | 465 | 469 | |
| Series 2015 XX: | |||
4% 6/15/24 | 550 | 552 | |
5% 6/15/26 (Pre-Refunded to 6/15/25 @ 100) | 975 | 1,006 | |
| Series 2019: | |||
5.25% 9/1/24 (d) | 300 | 304 | |
5.25% 9/1/26 (d) | 3,410 | 3,628 | |
| New Jersey Edl. Facility Series 2016 B, 4% 9/1/26 | 320 | 329 | |
| New Jersey Gen. Oblig. Series 2021, 2% 6/1/29 | 1,965 | 1,840 | |
| New Jersey Health Care Facilities Fing. Auth. Rev.: | |||
| Bonds: | |||
Series 2019 B2, 5%, tender 7/1/25 (b) | 3,890 | 4,000 | |
Series 2019 B3, 5%, tender 7/1/26 (b) | 2,750 | 2,870 | |
| Series 2016 A: | |||
5% 7/1/24 (Escrowed to Maturity) | 985 | 994 | |
5% 7/1/24 (Escrowed to Maturity) | 475 | 479 | |
| Series 2016, 5% 7/1/25 | 275 | 283 | |
| New Jersey Higher Ed. Student Assistance Auth. Student Ln. Rev.: | |||
| Series 2015 1A, 5% 12/1/24 (c) | 6,015 | 6,087 | |
| Series 2020: | |||
5% 12/1/24 (c) | 1,360 | 1,376 | |
5% 12/1/25 (c) | 2,440 | 2,508 | |
5% 12/1/26 (c) | 3,165 | 3,294 | |
| Series 2021 A, 5% 12/1/25 (c) | 130 | 134 | |
| Series 2021 B: | |||
5% 12/1/25 (c) | 315 | 324 | |
5% 12/1/26 (c) | 1,425 | 1,483 | |
| New Jersey Hsg. & Mtg. Fin. Agcy. Rev. Series 2019 D, 4% 4/1/25 (c) | 1,405 | 1,408 | |
| New Jersey Tpk. Auth. Tpk. Rev. Series D, 5% 1/1/28 | 1,710 | 1,804 | |
| New Jersey Trans. Trust Fund Auth.: | |||
| Series 2006 C: | |||
0% 12/15/25 | 6,400 | 5,988 | |
0% 12/15/26 (Assured Guaranty Corp. Insured) | 1,585 | 1,445 | |
0% 12/15/27 (Nat'l. Pub. Fin. Guarantee Corp. Insured) | 1,820 | 1,607 | |
0% 12/15/29 (Assured Guaranty Muni. Corp. Insured) | 1,225 | 1,024 | |
0% 12/15/31 (FGIC Insured) | 5,400 | 4,189 | |
| Series 2010 A: | |||
0% 12/15/25 | 1,140 | 1,067 | |
0% 12/15/27 | 6,420 | 5,667 | |
| Series 2016 A, 5% 6/15/27 | 3,960 | 4,158 | |
| Series 2022 AA: | |||
5% 6/15/26 | 9,745 | 10,276 | |
5% 6/15/27 | 8,000 | 8,630 | |
5% 6/15/28 | 10,000 | 11,019 | |
| Series A: | |||
0% 12/15/26 | 11,265 | 10,238 | |
5% 12/15/25 | 1,680 | 1,752 | |
5% 12/15/26 | 2,600 | 2,772 | |
TOTAL NEW JERSEY | 111,951 | ||
| New Mexico - 2.1% | |||
| New Mexico Edl. Assistance Foundation Series 2021 1A: | |||
| 5% 9/1/25 (c) | 6,250 | 6,417 | |
| 5% 9/1/28 (c) | 2,000 | 2,149 | |
| New Mexico Hosp. Equip. Ln. Council Rev. Bonds Series 2019 B, 5%, tender 8/1/25 (b) | 3,135 | 3,220 | |
| New Mexico Mtg. Fin. Auth.: | |||
| Series 2019 C, 4% 1/1/50 | 2,825 | 2,823 | |
| Series 2021 C, 3% 1/1/52 | 2,985 | 2,892 | |
| Series 2021 D, 3% 7/1/52 | 14,205 | 13,753 | |
| Series 2023 C, I 5.75% 3/1/54 | 1,980 | 2,157 | |
| New Mexico Muni. Energy Acquisition Auth. Gas Supply Rev.: | |||
| Bonds Series 2019 A, 5%, tender 5/1/25 (b) | 15,495 | 15,751 | |
| Series 2019 A: | |||
4% 5/1/24 | 950 | 952 | |
4% 11/1/24 | 1,450 | 1,455 | |
4% 5/1/25 | 2,790 | 2,804 | |
TOTAL NEW MEXICO | 54,373 | ||
| New York - 9.5% | |||
| Dorm. Auth. New York Univ. Rev. Series 2016 A, 5% 7/1/24 | 1,810 | 1,824 | |
| East Hampton Union Free School District Series 2017, 2.25% 6/1/28 | 505 | 480 | |
| Long Island Pwr. Auth. Elec. Sys. Rev.: | |||
| Bonds: | |||
Series 2019 B, 1.65%, tender 9/1/24 (b) | 7,255 | 7,163 | |
Series 2020 B, 0.85%, tender 9/1/25 (b) | 19,810 | 18,971 | |
Series 2021 B, 1.5%, tender 9/1/26 (b) | 3,360 | 3,175 | |
| Series 2021, 1% 9/1/25 | 2,805 | 2,668 | |
| Monroe County Indl. Dev. Agcy. Bonds (Andrews Terrace Cmnty. Partners, L.P. Proj.) Series 2023 B1, 5%, tender 7/1/27 (b) | 1,540 | 1,620 | |
| Monroe County Indl. Dev. Corp. (Univ. of Rochester Proj.): | |||
| Series 2017 A, 5% 7/1/25 | 900 | 930 | |
| Series 2020 A: | |||
5% 7/1/25 | 750 | 775 | |
5% 7/1/26 | 500 | 529 | |
| New York Bridge Auth. Gen. Rev. Series 2021 B, 5% 1/1/27 | 1,500 | 1,610 | |
| New York City Gen. Oblig.: | |||
| Series 2020 A1, 5% 8/1/27 | 13,205 | 14,369 | |
| Series 2020 C1, 5% 8/1/30 | 1,000 | 1,161 | |
| Series 2022 B1, 5% 8/1/28 | 11,490 | 12,809 | |
| Series A, 5% 8/1/26 | 1,000 | 1,061 | |
| Series A6, 5% 8/1/25 | 250 | 250 | |
| Series F1, 5% 6/1/25 | 470 | 485 | |
| Series I1, 5% 3/1/27 | 615 | 617 | |
| New York City Health & Hosp. Corp. Rev. Series A: | |||
| 3% 2/15/24 | 535 | 535 | |
| 5% 2/15/24 | 750 | 752 | |
| New York City Hsg. Dev. Corp. Bonds Series 2023 E2, 3.8%, tender 1/3/28 (b) | 690 | 694 | |
| New York City Hsg. Dev. Corp. Multifamily Hsg. Bonds: | |||
| Series 2021 C2, 0.7%, tender 7/1/25 (b) | 2,210 | 2,096 | |
| Series 2021 K2, 0.9%, tender 1/1/26 (b) | 12,290 | 11,451 | |
| Series 2021, 0.6%, tender 7/1/25 (b) | 2,855 | 2,704 | |
| Series 2023 A2, 3.73%, tender 12/29/28 (b) | 4,675 | 4,696 | |
| Series 2023 D, 4.3%, tender 11/1/28 (b) | 2,355 | 2,416 | |
| New York City Indl. Dev. Agcy. Rev. Series 2021 A: | |||
| 5% 1/1/25 (Assured Guaranty Muni. Corp. Insured) | 1,000 | 1,019 | |
| 5% 1/1/26 (Assured Guaranty Muni. Corp. Insured) | 1,000 | 1,037 | |
| 5% 1/1/27 (Assured Guaranty Muni. Corp. Insured) | 1,000 | 1,058 | |
| New York City Transitional Fin. Auth. Rev.: | |||
| Series 2017 E1, 5% 2/1/30 | 2,830 | 3,016 | |
| Series E1, 5% 2/1/26 | 475 | 486 | |
| New York Dorm. Auth. Rev.: | |||
| Series 2015 A: | |||
5% 7/1/28 | 370 | 378 | |
5% 7/1/28 (Pre-Refunded to 7/1/25 @ 100) | 30 | 31 | |
| Series 2022: | |||
5% 7/1/26 | 675 | 696 | |
5% 7/1/27 | 710 | 743 | |
5% 7/1/28 | 750 | 794 | |
5% 7/1/29 | 1,065 | 1,139 | |
| New York Dorm. Auth. Sales Tax Rev.: | |||
| Series 2017 A, 5% 3/15/31 | 2,745 | 2,953 | |
| Series 2023 A1, 5% 3/15/29 | 25,000 | 28,258 | |
| New York Metropolitan Trans. Auth. Dedicated Tax Fund Rev.: | |||
| Series 2016 A, 5% 11/15/24 | 525 | 535 | |
| Series 2016 B1, 5% 11/15/24 | 670 | 683 | |
| Series 2017 B1, 4% 11/15/25 | 250 | 256 | |
| New York Metropolitan Trans. Auth. Rev.: | |||
| Series 2015 A, 5% 11/15/24 | 1,000 | 1,018 | |
| Series 2015 A1, 5% 11/15/29 | 765 | 780 | |
| Series 2016 D, 5% 11/15/27 | 1,500 | 1,567 | |
| Series 2017 A2: | |||
5% 11/15/25 | 2,620 | 2,721 | |
5% 11/15/26 | 5,815 | 6,155 | |
| Series 2017 B, 5% 11/15/24 | 665 | 677 | |
| Series 2017 C1, 5% 11/15/28 | 4,340 | 4,719 | |
| New York State Dorm. Auth.: | |||
| Series 2018 A, 5% 3/15/27 (Escrowed to Maturity) | 970 | 1,044 | |
| Series 2021 A, 5% 3/15/29 | 1,500 | 1,697 | |
| Series 2023 A: | |||
5% 3/15/29 | 5,000 | 5,655 | |
5% 3/15/30 | 7,295 | 8,415 | |
| New York State Hsg. Fin. Agcy. Rev.: | |||
| Bonds: | |||
Series 2021 D2, 0.65%, tender 11/1/25 (b) | 2,770 | 2,597 | |
Series 2021 J2: | |||
1%, tender 11/1/26 (b) | 1,770 | 1,630 | |
1.1%, tender 5/1/27 (b) | 6,610 | 6,033 | |
| Series J, 0.75% 5/1/25 | 2,705 | 2,570 | |
| New York State Mtg. Agcy. Homeowner Mtg.: | |||
| Series 2021 232: | |||
5% 4/1/25 (c) | 1,130 | 1,149 | |
5% 10/1/26 (c) | 1,580 | 1,647 | |
| Series 221, 3.5% 10/1/32 (c) | 335 | 330 | |
| New York Thruway Auth. Gen. Rev. Series 2014 K, 5% 1/1/32 | 795 | 808 | |
| New York Trans. Dev. Corp.: | |||
| (Term. 4 JFK Int'l. Arpt. Proj.): | |||
Series 2020 A: | |||
5% 12/1/24 (c) | 1,500 | 1,513 | |
5% 12/1/25 (c) | 2,295 | 2,355 | |
5% 12/1/26 (c) | 1,180 | 1,230 | |
Series 2020 C: | |||
5% 12/1/24 | 1,000 | 1,015 | |
5% 12/1/25 | 800 | 827 | |
5% 12/1/26 | 1,250 | 1,318 | |
5% 12/1/27 | 1,250 | 1,342 | |
5% 12/1/28 | 1,300 | 1,421 | |
| (Term. 4 John F. Kennedy Int'l. Arpt. Proj.) Series 2022: | |||
5% 12/1/26 (c) | 13,300 | 13,869 | |
5% 12/1/27 (c) | 12,605 | 13,358 | |
5% 12/1/28 (c) | 600 | 646 | |
| New York Urban Dev. Corp. Rev. Series 2015 A, 5% 3/15/26 | 250 | 259 | |
| Niagara Frontier Trans. Auth. Arpt. Rev. Series 2019 A: | |||
| 5% 4/1/25 (c) | 625 | 634 | |
| 5% 4/1/27 (c) | 1,350 | 1,415 | |
| Suffolk County Gen. Oblig.: | |||
| Series 2022 A: | |||
5% 6/15/24 | 655 | 661 | |
5% 6/15/25 | 695 | 716 | |
5% 6/15/29 | 965 | 1,088 | |
| Series 2022 B: | |||
5% 10/1/25 | 800 | 830 | |
5% 10/1/26 | 410 | 436 | |
5% 10/1/28 | 670 | 746 | |
| Syracuse Reg'l. Arpt. Auth. Series 2021: | |||
| 5% 7/1/25 (c) | 750 | 765 | |
| 5% 7/1/26 (c) | 1,145 | 1,184 | |
| 5% 7/1/27 (c) | 1,515 | 1,589 | |
| Triborough Bridge & Tunnel Auth. Bonds: | |||
| Series 2021 A2: | |||
2%, tender 5/15/26 (b) | 7,870 | 7,570 | |
2%, tender 5/15/28 (b) | 2,575 | 2,410 | |
| Series 2021 B, 5%, tender 5/15/26 (b) | 2,470 | 2,576 | |
TOTAL NEW YORK | 251,908 | ||
| New York And New Jersey - 1.5% | |||
| Port Auth. of New York & New Jersey: | |||
| Series 188, 5% 5/1/25 (c) | 1,980 | 2,026 | |
| Series 193: | |||
5% 10/15/25 (c) | 4,015 | 4,145 | |
5% 10/15/29 (c) | 1,350 | 1,384 | |
| Series 2015 193, 5% 10/15/27 (c) | 7,425 | 7,625 | |
| Series 2023 242: | |||
5% 12/1/27 (c) | 2,700 | 2,886 | |
5% 12/1/28 (c) | 11,915 | 12,954 | |
| Series 223: | |||
5% 7/15/25 (c) | 1,500 | 1,541 | |
5% 7/15/26 (c) | 2,250 | 2,347 | |
5% 7/15/27 (c) | 3,055 | 3,243 | |
5% 7/15/28 (c) | 2,500 | 2,700 | |
TOTAL NEW YORK AND NEW JERSEY | 40,851 | ||
| North Carolina - 1.7% | |||
| Asheville Spl. Obligations Series 2021, 5% 4/1/25 | 1,530 | 1,571 | |
| Charlotte Int'l. Arpt. Rev.: | |||
| Series 2019 B, 5% 7/1/27 (c) | 735 | 782 | |
| Series 2021 B: | |||
5% 7/1/26 (c) | 5,535 | 5,774 | |
5% 7/1/27 (c) | 4,500 | 4,787 | |
5% 7/1/28 (c) | 1,675 | 1,812 | |
5% 7/1/29 (c) | 865 | 952 | |
| Charlotte-Mecklenburg Hosp. Auth. Health Care Sys. Rev. Bonds: | |||
| Series 2021 B, 5%, tender 12/2/24 (b) | 4,200 | 4,263 | |
| Series 2021 C, 5%, tender 12/1/28 (b) | 1,570 | 1,732 | |
| New Hanover County Hosp. Rev. Series 2017: | |||
| 5% 10/1/25 (Escrowed to Maturity) | 1,115 | 1,154 | |
| 5% 10/1/26 (Escrowed to Maturity) | 1,360 | 1,441 | |
| North Carolina Cap. Facilities Fin. Agcy. Edl. Facilities Rev. Series 2021, 5% 5/1/25 | 260 | 266 | |
| North Carolina Grant Anticipation Rev. Series 2021: | |||
| 5% 3/1/27 | 2,305 | 2,479 | |
| 5% 3/1/28 | 2,375 | 2,615 | |
| North Carolina Hsg. Fin. Agcy. Home Ownership Rev.: | |||
| Series 2023 52A, 6.25% 1/1/55 | 1,200 | 1,328 | |
| Series 43, 4% 7/1/50 | 4,770 | 4,767 | |
| North Carolina Med. Care Commission Health Care Facilities Rev. Bonds Series 2019 C, 2.55%, tender 6/1/26 (b) | 7,335 | 7,237 | |
| North Carolina Med. Care Commission Hosp. Rev. Bonds Series 2021 B, 5%, tender 2/1/26 (b) | 1,110 | 1,153 | |
| Raleigh Durham Arpt. Auth. Arpt. Rev. Series 2020 A, 5% 5/1/27 (c) | 355 | 376 | |
| Union County Enterprise Systems Rev. Series 2021: | |||
| 5% 6/1/26 | 750 | 793 | |
| 5% 6/1/27 | 775 | 841 | |
TOTAL NORTH CAROLINA | 46,123 | ||
| North Dakota - 0.2% | |||
| North Dakota Hsg. Fin. Agcy.: | |||
| Series 2021 A, 3% 1/1/52 | 1,465 | 1,426 | |
| Series 2021 B, 3% 7/1/52 | 3,975 | 3,842 | |
| Series 2023 F, 6.25% 1/1/54 | 430 | 476 | |
TOTAL NORTH DAKOTA | 5,744 | ||
| Ohio - 1.9% | |||
| Akron Bath Copley Hosp. District Rev.: | |||
| Series 2016, 5% 11/15/24 | 1,955 | 1,979 | |
| Series 2020: | |||
5% 11/15/26 | 375 | 392 | |
5% 11/15/27 | 185 | 196 | |
| American Muni. Pwr., Inc. Rev.: | |||
| Bonds Series 2021 A2, 1%, tender 8/15/24 (b) | 2,150 | 2,114 | |
| Series 2021 A: | |||
5% 2/15/26 | 300 | 313 | |
5% 2/15/27 | 400 | 426 | |
| Series 2023 A: | |||
5% 2/15/28 | 3,615 | 3,938 | |
5% 2/15/29 | 4,555 | 5,064 | |
| Cleveland Arpt. Sys. Rev. Series 2016 A: | |||
| 5% 1/1/25 (Assured Guaranty Muni. Corp. Insured) | 1,225 | 1,249 | |
| 5% 1/1/26 (Assured Guaranty Muni. Corp. Insured) | 490 | 500 | |
| Miami County Hosp. Facilities Rev. (Kettering Health Network Obligated Group Proj.) Series 2019: | |||
| 5% 8/1/27 | 1,000 | 1,072 | |
| 5% 8/1/28 | 1,000 | 1,091 | |
| Miami Univ. Series 2022 A, 5% 9/1/24 | 125 | 127 | |
| Montgomery County Hosp. Rev. (Kettering Health Network Obligated Group Proj.)) Series 2021: | |||
| 5% 8/1/27 | 575 | 616 | |
| 5% 8/1/28 | 500 | 546 | |
| Ohio Cap. Facilities Lease (Adult Correctional Bldg. Fund Projs.) Series 2021 A, 5% 10/1/26 | 1,750 | 1,862 | |
| Ohio Higher Edl. Facility Commission Rev. Bonds (Case Western Reserve Univ. Proj.) Series 2019 C, 1.625%, tender 12/1/26 (b) | 1,345 | 1,282 | |
| Ohio Hosp. Rev. Bonds Series 2019 C, 2.75%, tender 5/1/28 (b) | 3,920 | 3,902 | |
| Ohio Hsg. Fin. Agcy. Residential Mtg. Rev.: | |||
| (Mtg. Backed Securities Prog.) Series 2019 B, 4.5% 3/1/50 | 230 | 232 | |
| (Mtg.-Backed Securities Prog.) Series 2023 B, 6% 3/1/55 | 1,545 | 1,719 | |
| Series 2021 C, 3.25% 3/1/51 | 16,335 | 15,961 | |
| Scioto County Hosp. Facilities Rev.: | |||
| Series 2016: | |||
5% 2/15/25 | 2,065 | 2,100 | |
5% 2/15/26 | 1,285 | 1,327 | |
| Series 2019, 5% 2/15/29 | 1,820 | 1,902 | |
| Univ. of Akron Gen. Receipts Series 2019 A, 5% 1/1/25 | 1,100 | 1,123 | |
TOTAL OHIO | 51,033 | ||
| Oklahoma - 0.6% | |||
| Oklahoma County Independent School District #89 Oklahoma City Series 2023 A, 3% 7/1/26 | 14,520 | 14,602 | |
| Oklahoma Hsg. Fin. Agcy. Single Family Mtg. Rev.: | |||
| (Homeownership Ln. Prog.) Series 2023 C, 6% 3/1/54 | 285 | 317 | |
| (Homeownership Load Prog.) Series 2023 D, 6.5% 9/1/54 | 310 | 354 | |
| Oklahoma Tpk. Auth. Tpk. Rev. Series 2017 D, 5% 1/1/25 | 775 | 792 | |
TOTAL OKLAHOMA | 16,065 | ||
| Oregon - 0.2% | |||
| Oregon Facilities Auth. Rev. (Samaritan Health Svcs. Proj.): | |||
| Series 2020 A: | |||
5% 10/1/24 | 200 | 202 | |
5% 10/1/25 | 225 | 230 | |
5% 10/1/26 | 150 | 156 | |
| Series A, 5% 10/1/27 | 150 | 158 | |
| Oregon State Hsg. & Cmnty. Svcs. Dept. (Single Family Mtg. Prog.) Series A, 3.5% 1/1/51 | 2,415 | 2,387 | |
| Port of Portland Arpt. Rev.: | |||
| Series 2020 27 A, 5% 7/1/29 (c) | 430 | 469 | |
| Series 27 A, 5% 7/1/26 (c) | 1,515 | 1,576 | |
TOTAL OREGON | 5,178 | ||
| Pennsylvania - 2.9% | |||
| Allegheny County Arpt. Auth. Rev. Series 2021 A: | |||
| 5% 1/1/26 (c) | 1,750 | 1,801 | |
| 5% 1/1/27 (c) | 2,000 | 2,094 | |
| 5% 1/1/28 (c) | 2,250 | 2,396 | |
| Allegheny County Indl. Dev. Auth. Rev. Series 2021, 3.5% 12/1/31 | 970 | 793 | |
| Allegheny County Sanitation Auth. Swr. Rev. Series 2020 A: | |||
| 4% 6/1/25 | 200 | 203 | |
| 5% 6/1/26 | 1,000 | 1,057 | |
| Commonwealth Fing. Auth. Rev. Series 2020 A, 5% 6/1/25 | 1,150 | 1,184 | |
| Geisinger Auth. Health Sys. Rev. Bonds: | |||
| Series 2020 B, 5%, tender 2/15/27 (b) | 3,420 | 3,570 | |
| Series 2020 C, 5%, tender 4/1/30 (b) | 3,625 | 3,970 | |
| Lancaster Muni. Auth. Rev. Series 2023 B, 5% 6/1/29 | 2,650 | 2,970 | |
| Montgomery County Higher Ed. & Health Auth. Rev. Series 2019, 5% 9/1/29 | 1,000 | 1,095 | |
| Pennsylvania Econ. Dev. Fing. Auth. Solid Waste Disp. Rev. Bonds: | |||
| (Waste Mgmt., Inc. Proj.) Series 2017 A, 0.58%, tender 8/1/24 (b)(c) | 1,100 | 1,077 | |
| Series 2011, 2.15%, tender 7/1/24 (b)(c) | 1,000 | 990 | |
| Pennsylvania Gen. Oblig.: | |||
| Series 2018: | |||
3.2% 3/1/29 | 4,065 | 4,117 | |
3.35% 3/1/30 | 6,055 | 6,142 | |
| Series 2019: | |||
5% 7/15/28 | 1,760 | 1,952 | |
5% 7/15/29 | 1,395 | 1,579 | |
| Pennsylvania Higher Edl. Facilities Auth. Rev. Series 2016 C, 5% 8/15/25 | 2,855 | 2,955 | |
| Pennsylvania Hsg. Fin. Agcy.: | |||
| Series 2020 13 2A, 3.5% 4/1/51 | 625 | 619 | |
| Series 2021 137, 3% 10/1/51 | 5,505 | 5,307 | |
| Pennsylvania Tpk. Commission Tpk. Rev. Series 2021 B: | |||
| 5% 12/1/25 | 860 | 894 | |
| 5% 12/1/26 | 1,000 | 1,064 | |
| 5% 12/1/27 | 750 | 815 | |
| Philadelphia Arpt. Rev.: | |||
| Series 2015 A, 5% 6/15/24 (c) | 600 | 604 | |
| Series 2017 A, 5% 7/1/24 | 490 | 495 | |
| Series 2017 B: | |||
5% 7/1/24 (c) | 4,790 | 4,822 | |
5% 7/1/25 (c) | 1,700 | 1,738 | |
| Series 2021: | |||
5% 7/1/28 (c) | 3,100 | 3,327 | |
5% 7/1/29 (c) | 1,830 | 1,994 | |
| Philadelphia School District: | |||
| Series 2018 A: | |||
5% 9/1/24 | 1,000 | 1,011 | |
5% 9/1/25 | 700 | 721 | |
5% 9/1/26 | 750 | 787 | |
| Series 2019 A: | |||
5% 9/1/24 | 1,050 | 1,061 | |
5% 9/1/25 | 1,200 | 1,235 | |
| Series 2019 B, 5% 9/1/24 | 1,000 | 1,011 | |
| Reading School District Series 2017: | |||
| 5% 3/1/25 (Assured Guaranty Muni. Corp. Insured) | 320 | 326 | |
| 5% 3/1/26 (Assured Guaranty Muni. Corp. Insured) | 260 | 271 | |
| 5% 3/1/27 (Assured Guaranty Muni. Corp. Insured) | 250 | 266 | |
| 5% 3/1/28 (Assured Guaranty Muni. Corp. Insured) | 245 | 261 | |
| Southcentral Pennsylvania Gen. Auth. Rev. Series 2023 A, 5% 6/1/29 | 8,475 | 9,500 | |
TOTAL PENNSYLVANIA | 78,074 | ||
| Puerto Rico - 0.7% | |||
| Puerto Rico Commonwealth Aqueduct & Swr. Auth. Series 2022 A, 5% 7/1/28 (d) | 7,500 | 7,614 | |
| Puerto Rico Commonwealth Pub. Impt. Gen. Oblig.: | |||
| Series 2021 A1: | |||
0% 7/1/24 | 612 | 600 | |
5.625% 7/1/29 | 2,265 | 2,457 | |
| Series 2022 A1, 5.375% 7/1/25 | 6,360 | 6,500 | |
TOTAL PUERTO RICO | 17,171 | ||
| Rhode Island - 0.9% | |||
| Rhode Island Health & Edl. Bldg. Corp. Higher Ed. Facilities Rev. Series 2016: | |||
| 5% 5/15/24 | 2,300 | 2,308 | |
| 5% 5/15/25 | 5,385 | 5,465 | |
| Rhode Island Hsg. & Mtg. Fin. Corp. Series 2019 70, 4% 10/1/49 | 460 | 460 | |
| Rhode Island Hsg. & Mtg. Fin. Corp. Rev. Series 72 A, 3.5% 10/1/50 | 955 | 946 | |
| Rhode Island Student Ln. Auth. Student Ln. Rev.: | |||
| Series 2018 A, 5% 12/1/25 (c) | 845 | 869 | |
| Series 2019 A: | |||
5% 12/1/24 (c) | 1,275 | 1,292 | |
5% 12/1/25 (c) | 1,900 | 1,957 | |
5% 12/1/26 (c) | 1,000 | 1,047 | |
5% 12/1/28 (c) | 510 | 550 | |
| Series 2021 A, 5% 12/1/27 (c) | 900 | 959 | |
| Series A: | |||
4% 12/1/26 (c) | 355 | 356 | |
5% 12/1/26 (c) | 1,200 | 1,256 | |
| Tobacco Settlement Fing. Corp. Series 2015 A: | |||
| 5% 6/1/24 | 1,885 | 1,895 | |
| 5% 6/1/26 | 3,425 | 3,490 | |
| 5% 6/1/27 | 980 | 1,000 | |
TOTAL RHODE ISLAND | 23,850 | ||
| South Carolina - 0.7% | |||
| Scago Edl. Facilities Corp. for Colleton School District (School District of Colleton County Proj.) Series 2015, 5% 12/1/26 | 1,075 | 1,105 | |
| South Carolina Hsg. Fin. & Dev. Auth. Mtg. Rev.: | |||
| Series 2019 A, 4% 1/1/50 | 895 | 896 | |
| Series 2023 B, 6% 1/1/54 | 955 | 1,063 | |
| South Carolina Ports Auth. Ports Rev.: | |||
| Series 2015 (AMT), 5% 7/1/45 (Pre-Refunded to 7/1/25 @ 100) (c) | 2,910 | 2,982 | |
| Series 2015: | |||
5.25% 7/1/50 (Pre-Refunded to 7/1/25 @ 100) (c) | 4,805 | 4,941 | |
5.25% 7/1/55 (Pre-Refunded to 7/1/25 @ 100) (c) | 2,310 | 2,375 | |
| South Carolina Pub. Svc. Auth. Rev.: | |||
| Series 2015 A, 5% 12/1/25 | 1,000 | 1,018 | |
| Series 2021 A: | |||
5% 12/1/26 | 670 | 705 | |
5% 12/1/27 | 750 | 803 | |
| Series 2021 B: | |||
5% 12/1/24 | 1,400 | 1,419 | |
5% 12/1/25 | 500 | 515 | |
5% 12/1/26 | 500 | 526 | |
5% 12/1/27 | 450 | 482 | |
5% 12/1/28 | 800 | 871 | |
TOTAL SOUTH CAROLINA | 19,701 | ||
| South Dakota - 0.0% | |||
| South Dakota Hsg. Dev. Auth. Series 2023 G, 6.25% 5/1/55 | 610 | 676 | |
| Tennessee - 1.4% | |||
| Metropolitan Nashville Arpt. Auth. Rev. Series 2019 B: | |||
| 5% 7/1/26 (c) | 2,000 | 2,076 | |
| 5% 7/1/27 (c) | 2,435 | 2,571 | |
| 5% 7/1/28 (c) | 3,125 | 3,354 | |
| 5% 7/1/29 (c) | 3,800 | 4,140 | |
| 5% 7/1/30 (c) | 3,000 | 3,311 | |
| Nashville and Davidson County Metropolitan Govt. Gen. Oblig. Series 2022 B, 4% 1/1/26 | 8,000 | 8,216 | |
| Tennergy Corp. Gas Rev. Bonds Series 2019 A, 5%, tender 10/1/24 (b) | 11,590 | 11,691 | |
| Tennessee Hsg. Dev. Agcy. Residential Series 2021 3A, 3% 1/1/52 | 1,555 | 1,506 | |
TOTAL TENNESSEE | 36,865 | ||
| Texas - 13.3% | |||
| Aledo Independent School District Series 2015, 0% 2/15/24 | 1,195 | 1,190 | |
| Austin Arpt. Sys. Rev.: | |||
| Series 2019 B: | |||
5% 11/15/24 (c) | 675 | 682 | |
5% 11/15/25 (c) | 650 | 667 | |
| Series 2019, 5% 11/15/24 (c) | 2,500 | 2,526 | |
| Bastrop Independent School District Series 2023, 5% 2/15/30 | 1,150 | 1,309 | |
| Birdville Independent School District Series 2021, 5% 2/15/26 | 800 | 837 | |
| Boerne Independent School District Bonds Series 2023, 3.125%, tender 2/1/27 (b) | 1,445 | 1,448 | |
| Brazos County Gen. Oblig. Series 2020, 1.5% 9/1/32 | 1,335 | 1,116 | |
| Central Reg'l. Mobility Auth.: | |||
| Series 2016, 5% 1/1/26 | 2,800 | 2,909 | |
| Series 2020 F, 5% 1/1/25 | 4,455 | 4,491 | |
| Series 2021 C, 5% 1/1/27 | 6,865 | 7,110 | |
| City of Denton: | |||
| Series 2020 A, 5% 2/15/26 | 1,025 | 1,076 | |
| Series 2020, 2% 2/15/31 | 1,325 | 1,199 | |
| Clear Creek Independent School District Bonds Series 2021 B, 0.28%, tender 8/15/24 (b) | 4,370 | 4,286 | |
| Clint Independent School District Series 2015 A, 5% 2/15/26 | 1,600 | 1,637 | |
| Collin County Series 2020, 5% 2/15/26 | 1,040 | 1,091 | |
| Comal County Series 2017, 4% 2/1/26 | 1,780 | 1,827 | |
| Comal Independent School District Series 2020, 1.5% 2/1/31 | 7,135 | 6,182 | |
| Coppell Tex Series 2020: | |||
| 1% 2/1/31 | 1,395 | 1,144 | |
| 1.125% 2/1/32 | 1,405 | 1,134 | |
| Cypress-Fairbanks Independent School District Bonds: | |||
| Series 2015 B1, 0.28%, tender 8/15/24 (b) | 6,105 | 5,987 | |
| Series 2015 B2, 0.28%, tender 8/15/24 (b) | 9,645 | 9,459 | |
| Dallas Fort Worth Int'l. Arpt. Rev. Series 2020 A, 5% 11/1/26 | 2,595 | 2,770 | |
| Denton Independent School District: | |||
| Bonds Series 2014 B: | |||
2%, tender 8/1/24 (b) | 265 | 264 | |
2%, tender 8/1/24 (b) | 2,580 | 2,562 | |
2%, tender 8/1/24 (b) | 505 | 502 | |
| Series 2016, 0% 8/15/25 | 1,610 | 1,537 | |
| El Paso Independent School District Series 2020, 5% 8/15/24 | 650 | 658 | |
| El Paso Wtr. & Swr. Rev.: | |||
| Series 2017, 5% 3/1/30 | 1,750 | 1,876 | |
| Series 2020, 3% 3/1/30 | 1,150 | 1,156 | |
| Fort Bend Independent School District Bonds: | |||
| Series 2020 B, 0.875%, tender 8/1/25 (b) | 9,400 | 8,989 | |
| Series 2021 B, 0.72%, tender 8/1/26 (b) | 2,970 | 2,801 | |
| Fort Worth Gen. Oblig. Series 2020, 5% 3/1/26 | 3,800 | 3,983 | |
| Goose Creek Consolidated Independent School District Bonds Series 2021 B, 0.6%, tender 8/17/26 (b) | 3,500 | 3,298 | |
| Grand Parkway Trans. Corp. Bonds Series 2023, 5%, tender 4/1/28 (b) | 10,430 | 11,243 | |
| Hallsville Independent School District Series 2020, 5% 2/15/30 | 1,000 | 1,122 | |
| Harris County Cultural Ed. Facilities Fin. Corp. Med. Facilities Rev. Series 2016, 5% 11/15/25 | 1,500 | 1,554 | |
| Harris County Cultural Ed. Facilities Fin. Corp. Rev.: | |||
| Bonds: | |||
Series 2019 B, 5%, tender 12/1/26 (b) | 6,545 | 6,882 | |
Series 2020 A, 0.9%, tender 5/15/25 (b) | 4,845 | 4,649 | |
Series 2020 C, 5%, tender 12/1/26 (b) | 7,000 | 7,361 | |
| Series 2014 A, 5% 12/1/26 | 1,085 | 1,104 | |
| Hays Consolidated Independent School District Series 2022: | |||
| 5% 2/15/27 | 650 | 700 | |
| 5% 2/15/28 | 650 | 717 | |
| 5% 2/15/29 | 1,000 | 1,127 | |
| Houston Arpt. Sys. Rev.: | |||
| Series 2018 A, 5% 7/1/25 (c) | 1,550 | 1,584 | |
| Series 2018 C: | |||
5% 7/1/26 (c) | 500 | 520 | |
5% 7/1/27 (c) | 905 | 958 | |
| Series 2020 B, 5% 7/1/26 | 2,250 | 2,382 | |
| Houston Gen. Oblig. Series 2017 A, 5% 3/1/27 | 1,545 | 1,662 | |
| Hutto Independent School District Bonds Series 2015, 2%, tender 8/1/25 (b) | 1,250 | 1,230 | |
| Kilgore Independent School District Series 2020, 5% 2/15/26 | 1,075 | 1,126 | |
| Llano Texas Independent School District Series 2023: | |||
| 5% 2/15/28 | 1,150 | 1,261 | |
| 5% 2/15/29 | 500 | 560 | |
| 5% 2/15/30 | 1,500 | 1,711 | |
| 5% 2/15/31 | 750 | 812 | |
| Love Field Arpt. Modernization Rev.: | |||
| Series 2015: | |||
5% 11/1/26 (c) | 1,075 | 1,095 | |
5% 11/1/30 (c) | 1,960 | 1,992 | |
| Series 2021: | |||
5% 11/1/24 (c) | 2,615 | 2,644 | |
5% 11/1/25 (c) | 3,920 | 4,030 | |
5% 11/1/26 (c) | 2,845 | 2,962 | |
5% 11/1/27 (c) | 2,885 | 3,053 | |
5% 11/1/28 (c) | 11,150 | 12,011 | |
5% 11/1/29 (c) | 11,705 | 12,782 | |
| Lower Colorado River Auth. Rev.: | |||
| (LCRA Transmission Svcs. Corp. Proj.): | |||
Series 2021, 5% 5/15/25 | 1,315 | 1,353 | |
Series 2023, 5% 5/15/26 | 6,625 | 6,989 | |
| Series 2022: | |||
5% 5/15/26 (Assured Guaranty Muni. Corp. Insured) | 1,805 | 1,904 | |
5% 5/15/27 (Assured Guaranty Muni. Corp. Insured) | 1,385 | 1,496 | |
| Lubbock Elec. Lt. & Pwr. Sys. Rev. Series 2021, 5% 4/15/27 | 1,450 | 1,555 | |
| McKinney Independent School District Series 2021: | |||
| 5% 2/15/26 | 1,245 | 1,306 | |
| 5% 2/15/27 | 1,300 | 1,399 | |
| Medina Valley Texas Independent School District Series 2023: | |||
| 5% 2/15/28 (Permanent School Fund of Texas Insured) | 1,825 | 2,001 | |
| 5% 2/15/29 (Permanent School Fund of Texas Insured) | 1,605 | 1,797 | |
| 5% 2/15/30 (Permanent School Fund of Texas Insured) | 3,065 | 3,496 | |
| 5% 2/15/31 (Permanent School Fund of Texas Insured) | 4,555 | 5,281 | |
| Midlothian Independent School District Bonds Series 2013 C, 2%, tender 8/1/24 (b) | 1,645 | 1,633 | |
| Midway Independent School District Series 2021, 4% 8/1/27 | 1,425 | 1,494 | |
| Mission Econ. Dev. Corp. Solid Waste Disp. Rev. Bonds (Waste Mgmt., Inc. Proj.) Series 2018, 0.000% x SIFMA Municipal Swap Index 4.245%, tender 1/4/24 (b)(c)(f) | 8,320 | 8,277 | |
| New Caney Independent School District Bonds Series 2018, 1.25%, tender 8/15/24 (b) | 7,200 | 7,112 | |
| Newark Higher Ed. Fin. Corp. (Abilene Christian Univ. Proj.) Series 2016 A, 5% 4/1/26 | 2,425 | 2,519 | |
| North East Texas Independent School District Bonds Series 2019, 2.2%, tender 8/1/24 (b) | 2,345 | 2,321 | |
| North Texas Tollway Auth. Rev. Series 2021 B, 5% 1/1/29 | 1,970 | 2,206 | |
| Northside Independent School District Bonds: | |||
| Series 2019, 1.6%, tender 8/1/24 (b) | 7,660 | 7,588 | |
| Series 2020, 0.7%, tender 6/1/25 (b) | 11,510 | 11,138 | |
| Pasadena Independent School District Bonds Series 2015 B, 1.5%, tender 8/15/24 (b) | 6,615 | 6,544 | |
| Pecos Barstow Toyah Independent School District Series 2023, 5% 2/15/30 | 2,200 | 2,395 | |
| Pharr San Juan Alamo Independent School District Series 2016, 5% 2/1/26 | 1,130 | 1,155 | |
| Plano Wtrwks. & Swr. Sys. Rev. Series 2021, 4% 5/1/28 | 1,110 | 1,182 | |
| Prosper Independent School District Series 2021 A, 5% 2/15/26 | 1,015 | 1,064 | |
| San Antonio Arpt. Sys. Rev. Series 2019 A: | |||
| 5% 7/1/24 (c) | 1,750 | 1,762 | |
| 5% 7/1/24 (c) | 1,000 | 1,007 | |
| 5% 7/1/25 (c) | 1,250 | 1,278 | |
| 5% 7/1/25 (c) | 1,350 | 1,380 | |
| 5% 7/1/26 (c) | 1,500 | 1,561 | |
| 5% 7/1/26 (c) | 1,460 | 1,516 | |
| San Antonio Elec. & Gas Sys. Rev. Bonds: | |||
| Series 2015 D, 1.125%, tender 12/1/26 (b) | 10,810 | 9,846 | |
| Series 2022, 2%, tender 12/1/27 (b) | 3,145 | 2,956 | |
| Tarrant County College Series 2022, 5% 8/15/27 | 3,000 | 3,269 | |
| Tarrant County Cultural Ed. Facilities Fin. Corp. Hosp. Rev. Bonds (Baylor Scott & White Health Proj.) Series 2022 E, 5%, tender 5/15/26 (b) | 4,490 | 4,664 | |
| Tarrant County Cultural Ed. Facilities Fin. Corp. Rev. Series 2016 A, 5% 2/15/26 | 1,465 | 1,529 | |
| Texas Dept. of Hsg. & Cmnty. Affairs Residential Mtg. Rev. Series 2023 B, 6% 1/1/54 | 3,960 | 4,408 | |
| Texas Gen. Oblig. Series 2020 B: | |||
| 3% 8/1/25 (c) | 4,610 | 4,599 | |
| 3% 8/1/26 (c) | 4,845 | 4,838 | |
| 4% 8/1/27 (c) | 5,085 | 5,244 | |
| Texas Trans. Commission Hwy. Impt. Gen. Oblig. Bonds Series 2014 B, 0.65%, tender 4/1/26 (b) | 16,470 | 15,314 | |
| Texas Wtr. Dev. Board Rev.: | |||
| Series 2016: | |||
4% 10/15/30 | 4,600 | 4,730 | |
5% 4/15/29 | 7,500 | 7,959 | |
| Series 2022, 5% 8/1/30 | 1,210 | 1,401 | |
| Waco Gen. Oblig. Series 2021 A, 1.5% 2/1/31 | 3,770 | 3,193 | |
| Waxahachie Independent School District Series 2021, 3% 8/15/30 | 1,905 | 1,928 | |
| Wichita Falls Independent School District Series 2021: | |||
| 4% 2/1/25 | 600 | 607 | |
| 4% 2/1/26 | 850 | 872 | |
| 4% 2/1/27 | 1,100 | 1,145 | |
| 4% 2/1/28 | 900 | 950 | |
TOTAL TEXAS | 353,698 | ||
| Utah - 0.8% | |||
| Salt Lake City Arpt. Rev.: | |||
| Series 2017 A, 5% 7/1/27 (c) | 510 | 541 | |
| Series 2018 A, 5% 7/1/26 (c) | 2,550 | 2,654 | |
| Series 2021 B: | |||
5% 7/1/24 | 250 | 252 | |
5% 7/1/25 | 530 | 547 | |
5% 7/1/26 | 1,150 | 1,217 | |
5% 7/1/27 | 750 | 811 | |
| Utah County Hosp. Rev. Bonds Series 2020 B2, 5%, tender 8/1/26 (b) | 13,205 | 13,821 | |
TOTAL UTAH | 19,843 | ||
| Vermont - 0.2% | |||
| Vermont Hsg. Fin. Agcy. Series 2021 B, 3% 11/1/51 | 1,811 | 1,747 | |
| Vermont Student Assistant Corp. Ed. Ln. Rev.: | |||
| Series 2017 A: | |||
5% 6/15/26 (c) | 1,045 | 1,084 | |
5% 6/15/27 (c) | 560 | 591 | |
| Series 2021 A: | |||
5% 6/15/27 (c) | 350 | 369 | |
5% 6/15/28 (c) | 425 | 450 | |
5% 6/15/29 (c) | 400 | 428 | |
TOTAL VERMONT | 4,669 | ||
| Virginia - 0.9% | |||
| Arlington County IDA Hosp. Facilities Series 2020, 5% 7/1/25 | 500 | 513 | |
| Fairfax County Redev. & Hsg. Auth. Rev. Bonds (Dominion Square North Proj.) Series 2023, 5%, tender 1/1/28 (b) | 1,055 | 1,116 | |
| Fredericksburg Econ. Dev. Auth. Rev. Series 2014, 5% 6/15/24 | 2,290 | 2,306 | |
| Loudoun County Gen. Oblig. Series 2016 A, 2.5% 12/1/28 | 1,345 | 1,314 | |
| Louisa Indl. Dev. Auth. Poll. Cont. Rev. Bonds (Virginia Elec. and Pwr. Co. Proj.) Series 2008 B, 0.75%, tender 9/2/25 (b) | 6,750 | 6,283 | |
| Norfolk Arpt. Auth. Series 2021 A: | |||
| 5% 7/1/27 | 750 | 806 | |
| 5% 7/1/28 | 1,000 | 1,098 | |
| Norfolk Econ. Dev. Auth. Hosp. Facilities Rev. Bonds Series 2018 A, 5%, tender 11/1/28 (b) | 875 | 964 | |
| Stafford County Econ. Dev. Auth. Hosp. Facilities Rev. Series 2016: | |||
| 5% 6/15/24 | 1,185 | 1,193 | |
| 5% 6/15/25 | 980 | 1,005 | |
| 5% 6/15/26 | 1,680 | 1,755 | |
| Wise County Indl. Dev. Auth. Waste & Sewage Rev. Bonds (Virginia Elec. and Pwr. Co. Proj.): | |||
| Series 2009 A, 0.75%, tender 9/2/25 (b) | 3,000 | 2,793 | |
| Series 2010 A, 1.2%, tender 5/31/24 (b) | 1,725 | 1,698 | |
TOTAL VIRGINIA | 22,844 | ||
| Washington - 2.5% | |||
| Chelan County Pub. Util. District #1 Columbia River-Rock Island Hydro-Elec. Sys. Rev. Series A, 0% 6/1/28 (Nat'l. Pub. Fin. Guarantee Corp. Insured) | 1,230 | 1,086 | |
| King County Hsg. Auth. Rev.: | |||
| Series 2019: | |||
4% 11/1/24 | 1,075 | 1,083 | |
4% 11/1/25 | 1,260 | 1,281 | |
4% 11/1/30 | 1,575 | 1,638 | |
| Series 2021: | |||
3% 6/1/25 | 830 | 818 | |
4% 12/1/28 | 375 | 389 | |
4% 12/1/30 | 575 | 599 | |
4% 12/1/31 | 450 | 465 | |
| King County Swr. Rev. Bonds Series 2020 B, 0.875%, tender 1/1/26 (b) | 21,845 | 20,220 | |
| King County Wash Hsg. Auth. Afford (Kirkland Heights Proj.): | |||
| Series 2023 A1, 5% 1/1/28 | 760 | 787 | |
| Series 2023 A2, 5% 1/1/28 | 380 | 401 | |
| Port of Seattle Rev.: | |||
| Series 2013, 5% 7/1/24 (c) | 775 | 776 | |
| Series 2015 B, 5% 3/1/25 | 450 | 456 | |
| Series 2019, 5% 4/1/25 (c) | 2,700 | 2,754 | |
| Series 2021 C: | |||
5% 8/1/24 (c) | 5,290 | 5,336 | |
5% 8/1/25 (c) | 2,660 | 2,730 | |
5% 8/1/26 (c) | 3,655 | 3,812 | |
5% 8/1/27 (c) | 2,260 | 2,398 | |
5% 8/1/28 (c) | 6,320 | 6,809 | |
| Seattle Hsg. Auth. Rev.: | |||
| (Juniper Apts. Proj.) Series 2023, 5% 6/1/27 | 1,290 | 1,347 | |
| (Northgate Plaza Proj.) Series 2021, 1% 6/1/26 | 1,545 | 1,447 | |
| Tacoma Elec. Sys. Rev. Series 2017: | |||
| 5% 1/1/25 | 660 | 674 | |
| 5% 1/1/26 | 390 | 407 | |
| Washington Health Care Facilities Auth. Rev. (Virginia Mason Med. Ctr. Proj.) Series 2017: | |||
| 5% 8/15/25 | 1,450 | 1,478 | |
| 5% 8/15/26 | 2,560 | 2,639 | |
| 5% 8/15/27 | 2,425 | 2,537 | |
| Washington Hsg. Fin. Commission Series 2021 2N: | |||
| 5% 12/1/25 | 915 | 949 | |
| 5% 6/1/27 | 500 | 535 | |
TOTAL WASHINGTON | 65,851 | ||
| West Virginia - 0.2% | |||
| West Virginia Econ. Dev. Auth. Solid Waste Disp. Facilities Rev. Bonds (Appalachian Pwr. Co. Amos Proj.) Series 2011 A, 1%, tender 9/1/25 (b)(c) | 5,650 | 5,291 | |
| West Virginia Gen. Oblig. Series 2018 A, 5% 6/1/26 | 1,075 | 1,137 | |
TOTAL WEST VIRGINIA | 6,428 | ||
| Wisconsin - 1.3% | |||
| Blue Ridge Healthcare Pub. Fin. Auth. Series 2020 A, 5% 1/1/27 | 1,085 | 1,139 | |
| Madison Gen. Oblig. Series 2020 A, 1.375% 10/1/30 | 7,065 | 6,027 | |
| Milwaukee Gen. Oblig. Series 2018 N4, 5% 4/1/25 | 7,860 | 8,003 | |
| Roseman Univ. of Health Series 2018 A, 5% 12/1/27 | 760 | 779 | |
| Wisconsin Health & Edl. Facilities Bonds: | |||
| Series 2018 C1, 5%, tender 7/29/26 (b) | 1,210 | 1,264 | |
| Series 2020 C, 5%, tender 2/15/27 (b) | 5,000 | 5,180 | |
| Wisconsin Health & Edl. Facilities Auth. Rev.: | |||
| Bonds Series 2018 C3, 5%, tender 6/24/26 (b) | 2,675 | 2,791 | |
| Series 2018 B2, 5%, tender 6/24/26 (b) | 3,670 | 3,829 | |
| Wisconsin Hsg. & Econ. Dev. Auth.: | |||
| Series 2021 A, 3% 3/1/52 | 1,350 | 1,304 | |
| Series 2021 C, 3% 9/1/52 | 2,075 | 2,010 | |
| Wisconsin Hsg. & Econ. Dev. Auth. Hsg. Rev. Bonds Series 2021 C: | |||
| 0.61%, tender 5/1/24 (b) | 345 | 340 | |
| 0.81%, tender 5/1/25 (b) | 1,335 | 1,276 | |
TOTAL WISCONSIN | 33,942 | ||
| Wyoming - 0.0% | |||
| Laramie County Hosp. Rev. (Cheyenne Reg'l. Med. Ctr. Proj.) Series 2021, 4% 5/1/27 | 370 | 384 | |
| TOTAL MUNICIPAL BONDS (Cost $2,676,378) | 2,615,130 | ||
| Money Market Funds - 0.7% | |||
| Shares | Value ($) (000s) | ||
Fidelity Municipal Cash Central Fund 4.24% (g)(h) (Cost $19,565) | 19,560,688 | 19,565 | |
| TOTAL INVESTMENT IN SECURITIES - 99.3% (Cost $2,695,943) | 2,634,695 |
NET OTHER ASSETS (LIABILITIES) - 0.7% | 19,151 |
| NET ASSETS - 100.0% | 2,653,846 |
| (a) | Amount is stated in United States dollars unless otherwise noted. |
| (b) | Coupon rates for floating and adjustable rate securities reflect the rates in effect at period end. |
| (c) | Private activity obligations whose interest is subject to the federal alternative minimum tax for individuals. |
| (d) | Security exempt from registration under Rule 144A of the Securities Act of 1933. These securities may be resold in transactions exempt from registration, normally to qualified institutional buyers. At the end of the period, the value of these securities amounted to $20,904,000 or 0.8% of net assets. |
| (e) | Security or a portion of the security purchased on a delayed delivery or when-issued basis. |
| (f) | Coupon is indexed to a floating interest rate which may be multiplied by a specified factor and/or subject to caps or floors. |
| (g) | Information in this report regarding holdings by state and security types does not reflect the holdings of the Fidelity Municipal Cash Central Fund. |
| (h) | Affiliated fund that is generally available only to investment companies and other accounts managed by Fidelity Investments. The rate quoted is the annualized seven-day yield of the fund at period end. A complete unaudited listing of the fund's holdings as of its most recent quarter end is available upon request. In addition, each Fidelity Central Fund's financial statements, which are not covered by the Fund's Report of Independent Registered Public Accounting Firm, are available on the SEC's website or upon request. |
| Affiliate (Amounts in thousands) | Value, beginning of period ($) | Purchases ($) | Sales Proceeds ($) | Dividend Income ($) | Realized Gain (loss) ($) | Change in Unrealized appreciation (depreciation) ($) | Value, end of period ($) | % ownership, end of period |
| Fidelity Municipal Cash Central Fund 4.24% | 3,873 | 715,500 | 699,808 | 1,054 | - | - | 19,565 | 0.8% |
| Total | 3,873 | 715,500 | 699,808 | 1,054 | - | - | 19,565 | |
| Valuation Inputs at Reporting Date: | ||||
Description (Amounts in thousands) | Total ($) | Level 1 ($) | Level 2 ($) | Level 3 ($) |
Investments in Securities: | ||||
| Municipal Securities | 2,615,130 | - | 2,615,130 | - |
| Money Market Funds | 19,565 | 19,565 | - | - |
| Total Investments in Securities: | 2,634,695 | 19,565 | 2,615,130 | - |
| Statement of Assets and Liabilities | ||||
| Amounts in thousands (except per-share amounts) | December 31, 2023 | |||
| Assets | ||||
| Investment in securities, at value - See accompanying schedule: | ||||
Unaffiliated issuers (cost $2,676,378) | $ | 2,615,130 | ||
Fidelity Central Funds (cost $19,565) | 19,565 | |||
| Total Investment in Securities (cost $2,695,943) | $ | 2,634,695 | ||
| Cash | 100 | |||
| Receivable for fund shares sold | 2,491 | |||
| Interest receivable | 28,650 | |||
| Distributions receivable from Fidelity Central Funds | 126 | |||
| Receivable from investment adviser for expense reductions | 22 | |||
| Other receivables | 1 | |||
Total assets | 2,666,085 | |||
| Liabilities | ||||
| Payable for investments purchased on a delayed delivery basis | $ | 6,411 | ||
| Payable for fund shares redeemed | 3,844 | |||
| Distributions payable | 1,250 | |||
| Accrued management fee | 444 | |||
| Distribution and service plan fees payable | 31 | |||
| Other affiliated payables | 221 | |||
| Other payables and accrued expenses | 38 | |||
| Total Liabilities | 12,239 | |||
| Net Assets | $ | 2,653,846 | ||
| Net Assets consist of: | ||||
| Paid in capital | $ | 2,738,351 | ||
| Total accumulated earnings (loss) | (84,505) | |||
| Net Assets | $ | 2,653,846 | ||
| Net Asset Value and Maximum Offering Price | ||||
| Class A : | ||||
Net Asset Value and redemption price per share ($121,653 ÷ 11,718 shares)(a) | $ | 10.38 | ||
| Maximum offering price per share (100/97.25 of $10.38) | $ | 10.67 | ||
| Class M : | ||||
Net Asset Value and redemption price per share ($7,792 ÷ 752 shares)(a) | $ | 10.36 | ||
| Maximum offering price per share (100/97.25 of $10.36) | $ | 10.65 | ||
| Class C : | ||||
Net Asset Value and offering price per share ($4,562 ÷ 440 shares)(a)(b) | $ | 10.36 | ||
| Limited Term Municipal Income : | ||||
Net Asset Value, offering price and redemption price per share ($1,872,734 ÷ 180,708 shares) | $ | 10.36 | ||
| Class I : | ||||
Net Asset Value, offering price and redemption price per share ($294,036 ÷ 28,358 shares) | $ | 10.37 | ||
| Class Z : | ||||
Net Asset Value, offering price and redemption price per share ($353,069 ÷ 34,055 shares) | $ | 10.37 | ||
(a)Redemption price per share is equal to net asset value less any applicable contingent deferred sales charge. | ||||
(b)Corresponding Net Asset Value does not calculate due to rounding of fractional net assets and/or shares. | ||||
| Statement of Operations | ||||
| Amounts in thousands | Year ended December 31, 2023 | |||
| Investment Income | ||||
| Interest | $ | 55,901 | ||
| Income from Fidelity Central Funds | 1,054 | |||
| Total Income | 56,955 | |||
| Expenses | ||||
| Management fee | $ | 6,634 | ||
| Transfer agent fees | 2,807 | |||
| Distribution and service plan fees | 421 | |||
| Accounting fees and expenses | 126 | |||
| Custodian fees and expenses | 9 | |||
| Independent trustees' fees and expenses | 10 | |||
| Registration fees | 99 | |||
| Audit | 15 | |||
| Miscellaneous | 29 | |||
| Total expenses before reductions | 10,150 | |||
| Expense reductions | (1,182) | |||
| Total expenses after reductions | 8,968 | |||
| Net Investment income (loss) | 47,987 | |||
| Realized and Unrealized Gain (Loss) | ||||
| Net realized gain (loss) on: | ||||
| Investment Securities: | ||||
| Unaffiliated issuers | (11,359) | |||
| Total net realized gain (loss) | (11,359) | |||
| Change in net unrealized appreciation (depreciation) on: | ||||
| Investment Securities: | ||||
| Unaffiliated issuers | 66,472 | |||
| Total change in net unrealized appreciation (depreciation) | 66,472 | |||
| Net gain (loss) | 55,113 | |||
| Net increase (decrease) in net assets resulting from operations | $ | 103,100 | ||
| Statement of Changes in Net Assets | ||||
| Amount in thousands | Year ended December 31, 2023 | Year ended December 31, 2022 | ||
| Increase (Decrease) in Net Assets | ||||
| Operations | ||||
| Net investment income (loss) | $ | 47,987 | $ | 41,485 |
| Net realized gain (loss) | (11,359) | (12,224) | ||
| Change in net unrealized appreciation (depreciation) | 66,472 | (192,394) | ||
| Net increase (decrease) in net assets resulting from operations | 103,100 | (163,133) | ||
| Distributions to shareholders | (47,365) | (41,781) | ||
| Share transactions - net increase (decrease) | (282,666) | (583,612) | ||
| Total increase (decrease) in net assets | (226,931) | (788,526) | ||
| Net Assets | ||||
| Beginning of period | 2,880,777 | 3,669,303 | ||
| End of period | $ | 2,653,846 | $ | 2,880,777 |
| Fidelity Advisor® Limited Term Municipal Income Fund Class A |
| Years ended December 31, | 2023 | 2022 | 2021 | 2020 | 2019 | |||||
Selected Per-Share Data | ||||||||||
| Net asset value, beginning of period | $ | 10.16 | $ | 10.79 | $ | 10.89 | $ | 10.72 | $ | 10.49 |
| Income from Investment Operations | ||||||||||
Net investment income (loss) A,B | .150 | .109 | .102 | .141 | .150 | |||||
| Net realized and unrealized gain (loss) | .218 | (.629) | (.094) | .183 | .250 | |||||
| Total from investment operations | .368 | (.520) | .008 | .324 | .400 | |||||
| Distributions from net investment income | (.148) | (.110) | (.103) | (.142) | (.150) | |||||
| Distributions from net realized gain | - | - | (.005) | (.012) | (.020) | |||||
| Total distributions | (.148) | (.110) | (.108) | (.154) | (.170) | |||||
| Net asset value, end of period | $ | 10.38 | $ | 10.16 | $ | 10.79 | $ | 10.89 | $ | 10.72 |
Total Return C,D | 3.66% | (4.82)% | .07% | 3.04% | 3.83% | |||||
Ratios to Average Net Assets B,E,F | ||||||||||
| Expenses before reductions | .67% | .80% | .80% | .80% | .80% | |||||
| Expenses net of fee waivers, if any | .58% | .66% | .66% | .66% | .78% | |||||
| Expenses net of all reductions | .58% | .66% | .66% | .66% | .78% | |||||
| Net investment income (loss) | 1.47% | 1.06% | .94% | 1.31% | 1.41% | |||||
| Supplemental Data | ||||||||||
| Net assets, end of period (in millions) | $ | 122 | $ | 156 | $ | 223 | $ | 202 | $ | 180 |
Portfolio turnover rate G | 24% | 20% | 20% | 19% | 43% |
| Fidelity Advisor® Limited Term Municipal Income Fund Class M |
| Years ended December 31, | 2023 | 2022 | 2021 | 2020 | 2019 | |||||
Selected Per-Share Data | ||||||||||
| Net asset value, beginning of period | $ | 10.14 | $ | 10.77 | $ | 10.87 | $ | 10.70 | $ | 10.47 |
| Income from Investment Operations | ||||||||||
Net investment income (loss) A,B | .150 | .110 | .104 | .142 | .154 | |||||
| Net realized and unrealized gain (loss) | .218 | (.629) | (.095) | .182 | .250 | |||||
| Total from investment operations | .368 | (.519) | .009 | .324 | .404 | |||||
| Distributions from net investment income | (.148) | (.111) | (.104) | (.142) | (.154) | |||||
| Distributions from net realized gain | - | - | (.005) | (.012) | (.020) | |||||
| Total distributions | (.148) | (.111) | (.109) | (.154) | (.174) | |||||
| Net asset value, end of period | $ | 10.36 | $ | 10.14 | $ | 10.77 | $ | 10.87 | $ | 10.70 |
Total Return C,D | 3.67% | (4.82)% | .08% | 3.06% | 3.88% | |||||
Ratios to Average Net Assets B,E,F | ||||||||||
| Expenses before reductions | .63% | .72% | .72% | .74% | .75% | |||||
| Expenses net of fee waivers, if any | .58% | .65% | .65% | .65% | .74% | |||||
| Expenses net of all reductions | .58% | .65% | .65% | .65% | .74% | |||||
| Net investment income (loss) | 1.47% | 1.07% | .95% | 1.32% | 1.45% | |||||
| Supplemental Data | ||||||||||
| Net assets, end of period (in millions) | $ | 8 | $ | 9 | $ | 8 | $ | 10 | $ | 12 |
Portfolio turnover rate G | 24% | 20% | 20% | 19% | 43% |
| Fidelity Advisor® Limited Term Municipal Income Fund Class C |
| Years ended December 31, | 2023 | 2022 | 2021 | 2020 | 2019 | |||||
Selected Per-Share Data | ||||||||||
| Net asset value, beginning of period | $ | 10.14 | $ | 10.77 | $ | 10.87 | $ | 10.70 | $ | 10.47 |
| Income from Investment Operations | ||||||||||
Net investment income (loss) A,B | .076 | .035 | .024 | .064 | .072 | |||||
| Net realized and unrealized gain (loss) | .217 | (.629) | (.094) | .182 | .250 | |||||
| Total from investment operations | .293 | (.594) | (.070) | .246 | .322 | |||||
| Distributions from net investment income | (.073) | (.036) | (.025) | (.064) | (.072) | |||||
| Distributions from net realized gain | - | - | (.005) | (.012) | (.020) | |||||
| Total distributions | (.073) | (.036) | (.030) | (.076) | (.092) | |||||
| Net asset value, end of period | $ | 10.36 | $ | 10.14 | $ | 10.77 | $ | 10.87 | $ | 10.70 |
Total Return C,D | 2.91% | (5.51)% | (.65)% | 2.31% | 3.08% | |||||
Ratios to Average Net Assets B,E,F | ||||||||||
| Expenses before reductions | 1.34% | 1.50% | 1.51% | 1.52% | 1.54% | |||||
| Expenses net of fee waivers, if any | 1.31% | 1.38% | 1.38% | 1.38% | 1.52% | |||||
| Expenses net of all reductions | 1.31% | 1.38% | 1.38% | 1.38% | 1.52% | |||||
| Net investment income (loss) | .74% | .34% | .22% | .59% | .67% | |||||
| Supplemental Data | ||||||||||
| Net assets, end of period (in millions) | $ | 5 | $ | 8 | $ | 10 | $ | 15 | $ | 20 |
Portfolio turnover rate G | 24% | 20% | 20% | 19% | 43% |
| Fidelity® Limited Term Municipal Income Fund |
| Years ended December 31, | 2023 | 2022 | 2021 | 2020 | 2019 | |||||
Selected Per-Share Data | ||||||||||
| Net asset value, beginning of period | $ | 10.15 | $ | 10.77 | $ | 10.87 | $ | 10.70 | $ | 10.47 |
| Income from Investment Operations | ||||||||||
Net investment income (loss) A,B | .177 | .139 | .134 | .172 | .185 | |||||
| Net realized and unrealized gain (loss) | .208 | (.619) | (.095) | .182 | .250 | |||||
| Total from investment operations | .385 | (.480) | .039 | .354 | .435 | |||||
| Distributions from net investment income | (.175) | (.140) | (.134) | (.172) | (.185) | |||||
| Distributions from net realized gain | - | - | (.005) | (.012) | (.020) | |||||
| Total distributions | (.175) | (.140) | (.139) | (.184) | (.205) | |||||
| Net asset value, end of period | $ | 10.36 | $ | 10.15 | $ | 10.77 | $ | 10.87 | $ | 10.70 |
Total Return C | 3.84% | (4.46)% | .36% | 3.34% | 4.18% | |||||
Ratios to Average Net Assets B,D,E | ||||||||||
| Expenses before reductions | .34% | .47% | .46% | .46% | .46% | |||||
| Expenses net of fee waivers, if any | .31% | .37% | .37% | .37% | .45% | |||||
| Expenses net of all reductions | .31% | .37% | .37% | .37% | .45% | |||||
| Net investment income (loss) | 1.74% | 1.35% | 1.23% | 1.60% | 1.74% | |||||
| Supplemental Data | ||||||||||
| Net assets, end of period (in millions) | $ | 1,873 | $ | 2,006 | $ | 2,565 | $ | 2,420 | $ | 2,245 |
Portfolio turnover rate F | 24% | 20% | 20% | 19% | 43% |
| Fidelity Advisor® Limited Term Municipal Income Fund Class I |
| Years ended December 31, | 2023 | 2022 | 2021 | 2020 | 2019 | |||||
Selected Per-Share Data | ||||||||||
| Net asset value, beginning of period | $ | 10.15 | $ | 10.78 | $ | 10.88 | $ | 10.71 | $ | 10.48 |
| Income from Investment Operations | ||||||||||
Net investment income (loss) A,B | .177 | .139 | .133 | .172 | .178 | |||||
| Net realized and unrealized gain (loss) | .217 | (.629) | (.094) | .183 | .250 | |||||
| Total from investment operations | .394 | (.490) | .039 | .355 | .428 | |||||
| Distributions from net investment income | (.174) | (.140) | (.134) | (.173) | (.178) | |||||
| Distributions from net realized gain | - | - | (.005) | (.012) | (.020) | |||||
| Total distributions | (.174) | (.140) | (.139) | (.185) | (.198) | |||||
| Net asset value, end of period | $ | 10.37 | $ | 10.15 | $ | 10.78 | $ | 10.88 | $ | 10.71 |
Total Return C | 3.93% | (4.55)% | .36% | 3.34% | 4.11% | |||||
Ratios to Average Net Assets B,D,E | ||||||||||
| Expenses before reductions | .42% | .55% | .54% | .55% | .54% | |||||
| Expenses net of fee waivers, if any | .32% | .37% | .37% | .37% | .51% | |||||
| Expenses net of all reductions | .32% | .37% | .37% | .37% | .51% | |||||
| Net investment income (loss) | 1.73% | 1.35% | 1.23% | 1.60% | 1.68% | |||||
| Supplemental Data | ||||||||||
| Net assets, end of period (in millions) | $ | 294 | $ | 343 | $ | 420 | $ | 335 | $ | 276 |
Portfolio turnover rate F | 24% | 20% | 20% | 19% | 43% |
| Fidelity Advisor® Limited Term Municipal Income Fund Class Z |
| Years ended December 31, | 2023 | 2022 | 2021 | 2020 | 2019 | |||||
Selected Per-Share Data | ||||||||||
| Net asset value, beginning of period | $ | 10.15 | $ | 10.77 | $ | 10.87 | $ | 10.71 | $ | 10.48 |
| Income from Investment Operations | ||||||||||
Net investment income (loss) A,B | .181 | .145 | .140 | .178 | .189 | |||||
| Net realized and unrealized gain (loss) | .219 | (.619) | (.094) | .173 | .250 | |||||
| Total from investment operations | .400 | (.474) | .046 | .351 | .439 | |||||
| Distributions from net investment income | (.180) | (.146) | (.141) | (.179) | (.189) | |||||
| Distributions from net realized gain | - | - | (.005) | (.012) | (.020) | |||||
| Total distributions | (.180) | (.146) | (.146) | (.191) | (.209) | |||||
| Net asset value, end of period | $ | 10.37 | $ | 10.15 | $ | 10.77 | $ | 10.87 | $ | 10.71 |
Total Return C | 3.99% | (4.40)% | .42% | 3.31% | 4.22% | |||||
Ratios to Average Net Assets B,D,E | ||||||||||
| Expenses before reductions | .30% | .43% | .42% | .43% | .43% | |||||
| Expenses net of fee waivers, if any | .27% | .31% | .31% | .31% | .40% | |||||
| Expenses net of all reductions | .27% | .31% | .31% | .31% | .40% | |||||
| Net investment income (loss) | 1.78% | 1.41% | 1.29% | 1.66% | 1.79% | |||||
| Supplemental Data | ||||||||||
| Net assets, end of period (in millions) | $ | 353 | $ | 358 | $ | 444 | $ | 336 | $ | 214 |
Portfolio turnover rate F | 24% | 20% | 20% | 19% | 43% |
| Fidelity Central Fund | Investment Manager | Investment Objective | Investment Practices | Expense RatioA |
| Fidelity Money Market Central Funds | Fidelity Management & Research Company LLC (FMR) | Each fund seeks to obtain a high level of current income consistent with the preservation of capital and liquidity. | Short-term Investments | Less than .005% |
| Gross unrealized appreciation | $13,885 |
| Gross unrealized depreciation | (74,652) |
| Net unrealized appreciation (depreciation) | $(60,767) |
| Tax Cost | $2,695,462 |
| Capital loss carryforward | $(23,548) |
| Net unrealized appreciation (depreciation) on securities and other investments | $(60,767) |
| Short-term | $(7,999) |
| Long-term | (15,549) |
Total capital loss carryforward | $(23,548) |
| December 31, 2023 | December 31, 2022 | |
| Tax-exempt Income | $47,365 | $41,781 |
| Purchases ($) | Sales ($) | |
| Fidelity Limited Term Municipal Income Fund | 657,894 | 871,532 |
| Distribution Fee | Service Fee | Total Fees | Retained by FDC | |
| Class A | - % | .25% | $340 | $22 |
| Class M | - % | .25% | 21 | -A |
| Class C | .75% | .25% | 60 | 7 |
| $421 | $29 |
| Retained by FDC | |
| Class A | $2 |
| Class M | 1 |
Class CA | -B |
| $3 |
| Amount | % of Class-Level Average Net Assets | |
| Class A | $238 | .18 |
| Class M | 11 | .13 |
| Class C | 5 | .09 |
| Limited Term Municipal Income | 1,824 | .09 |
| Class I | 541 | .17 |
| Class Z | 188 | .05 |
| $2,807 |
| % of Average Net Assets | |
| Fidelity Limited Term Municipal Income Fund | -A |
| Purchases ($) | Sales ($) | Realized Gain (Loss) ($) | |
| Fidelity Limited Term Municipal Income Fund | - | 47,458 | (410) |
| Amount | |
| Fidelity Limited Term Municipal Income Fund | $3 |
| Expense Limitations | Reimbursement | |
| Class A | .66%/.55%A | $130 |
| Class M | .65%/.55%A | 4 |
| Class C | 1.38%/1.30%A | 2 |
| Limited Term Municipal Income | .37%/.30%A | 564 |
| Class I | .37%/.30%A | 321 |
| Class Z | .31%/noneA | 119 |
| $1,140 |
Year ended December 31, 2023 | Year ended December 31, 2022 | |
| Fidelity Limited Term Municipal Income Fund | ||
| Distributions to shareholders | ||
| Class A | $1,959 | $1,933 |
| Class M | 120 | 82 |
| Class C | 42 | 32 |
| Limited Term Municipal Income | 33,173 | 28,885 |
| Class I | 5,449 | 4,897 |
| Class Z | 6,622 | 5,952 |
Total | $47,365 | $41,781 |
| Shares | Shares | Dollars | Dollars | |
Year ended December 31, 2023 | Year ended December 31, 2022 | Year ended December 31, 2023 | Year ended December 31, 2022 | |
| Fidelity Limited Term Municipal Income Fund | ||||
| Class A | ||||
| Shares sold | 2,489 | 6,044 | $25,425 | $61,982 |
| Reinvestment of distributions | 184 | 180 | 1,879 | 1,849 |
| Shares redeemed | (6,334) | (11,521) | (64,635) | (118,312) |
| Net increase (decrease) | (3,661) | (5,297) | $(37,331) | $(54,481) |
| Class M | ||||
| Shares sold | 132 | 300 | $1,348 | $3,052 |
| Reinvestment of distributions | 11 | 7 | 112 | 76 |
| Shares redeemed | (263) | (148) | (2,686) | (1,516) |
| Net increase (decrease) | (120) | 159 | $(1,226) | $1,612 |
| Class C | ||||
| Shares sold | 59 | 403 | $616 | $4,152 |
| Reinvestment of distributions | 4 | 3 | 39 | 28 |
| Shares redeemed | (405) | (515) | (4,125) | (5,255) |
| Net increase (decrease) | (342) | (109) | $(3,470) | $(1,075) |
| Limited Term Municipal Income | ||||
| Shares sold | 53,880 | 112,135 | $547,805 | $1,145,791 |
| Reinvestment of distributions | 2,224 | 2,045 | 22,645 | 20,907 |
| Shares redeemed | (73,154) | (154,578) | (743,019) | (1,584,880) |
| Net increase (decrease) | (17,050) | (40,398) | $(172,569) | $(418,182) |
| Class I | ||||
| Shares sold | 11,502 | 31,496 | $117,161 | $322,175 |
| Reinvestment of distributions | 494 | 441 | 5,032 | 4,514 |
| Shares redeemed | (17,454) | (37,086) | (177,646) | (379,632) |
| Net increase (decrease) | (5,458) | (5,149) | $(55,453) | $(52,943) |
| Class Z | ||||
| Shares sold | 17,631 | 40,549 | $179,391 | $414,776 |
| Reinvestment of distributions | 387 | 402 | 3,938 | 4,114 |
| Shares redeemed | (19,252) | (46,884) | (195,945) | (477,433) |
| Net increase (decrease) | (1,234) | (5,933) | $(12,616) | $(58,543) |
| The Example is based on an investment of $1,000 invested at the beginning of the period and held for the entire period (July 1, 2023 to December 31, 2023). |
Annualized Expense Ratio- A | Beginning Account Value July 1, 2023 | Ending Account Value December 31, 2023 | Expenses Paid During Period- C July 1, 2023 to December 31, 2023 | |||||||
| Fidelity® Limited Term Municipal Income Fund | ||||||||||
| Class A | .55% | |||||||||
| Actual | $ 1,000 | $ 1,025.70 | $ 2.81 | |||||||
Hypothetical-B | $ 1,000 | $ 1,022.43 | $ 2.80 | |||||||
| Class M | .55% | |||||||||
| Actual | $ 1,000 | $ 1,025.70 | $ 2.81 | |||||||
Hypothetical-B | $ 1,000 | $ 1,022.43 | $ 2.80 | |||||||
| Class C | 1.27% | |||||||||
| Actual | $ 1,000 | $ 1,021.90 | $ 6.47 | |||||||
Hypothetical-B | $ 1,000 | $ 1,018.80 | $ 6.46 | |||||||
| Fidelity® Limited Term Municipal Income Fund | .29% | |||||||||
| Actual | $ 1,000 | $ 1,027.00 | $ 1.48 | |||||||
Hypothetical-B | $ 1,000 | $ 1,023.74 | $ 1.48 | |||||||
| Class I | .30% | |||||||||
| Actual | $ 1,000 | $ 1,027.00 | $ 1.53 | |||||||
Hypothetical-B | $ 1,000 | $ 1,023.69 | $ 1.53 | |||||||
| Class Z | .25% | |||||||||
| Actual | $ 1,000 | $ 1,028.20 | $ 1.28 | |||||||
Hypothetical-B | $ 1,000 | $ 1,023.95 | $ 1.28 | |||||||
| A special meeting of shareholders was held on October 18, 2023. The results of votes taken among shareholders on the proposal before them are reported below. Each vote reported represents one dollar of net asset value held on the record date for the meeting. | ||
| Proposal 1 | ||
| To elect a Board of Trustees. | ||
# of Votes | % of Votes | |
| Abigail P. Johnson | ||
| Affirmative | 11,160,118,778.550 | 97.240 |
| Withheld | 316,510,692.230 | 2.760 |
| TOTAL | 11,476,629,470.780 | 100.000 |
| Jennifer Toolin McAuliffe | ||
| Affirmative | 11,160,843,041.160 | 97.250 |
| Withheld | 315,786,429.620 | 2.750 |
| TOTAL | 11,476,629,470.780 | 100.000 |
| Christine J. Thompson | ||
| Affirmative | 11,156,602,115.000 | 97.210 |
| Withheld | 320,027,355.780 | 2.790 |
| TOTAL | 11,476,629,470.780 | 100.000 |
| Elizabeth S. Acton | ||
| Affirmative | 11,110,214,430.850 | 96.810 |
| Withheld | 366,415,039.930 | 3.190 |
| TOTAL | 11,476,629,470.780 | 100.000 |
| Laura M. Bishop | ||
| Affirmative | 11,132,012,161.210 | 97.000 |
| Withheld | 344,617,309.570 | 3.000 |
| TOTAL | 11,476,629,470.780 | 100.000 |
| Ann E. Dunwoody | ||
| Affirmative | 11,125,767,777.290 | 96.940 |
| Withheld | 350,861,693.490 | 3.060 |
| TOTAL | 11,476,629,470.780 | 100.000 |
| John Engler | ||
| Affirmative | 11,009,456,697.420 | 95.930 |
| Withheld | 467,172,773.360 | 4.070 |
| TOTAL | 11,476,629,470.780 | 100.000 |
| Robert F. Gartland | ||
| Affirmative | 11,139,433,974.390 | 97.060 |
| Withheld | 337,195,496.390 | 2.940 |
| TOTAL | 11,476,629,470.780 | 100.000 |
| Robert W. Helm | ||
| Affirmative | 11,140,155,147.040 | 97.070 |
| Withheld | 336,474,323.740 | 2.930 |
| TOTAL | 11,476,629,470.780 | 100.000 |
| Arthur E. Johnson | ||
| Affirmative | 11,087,922,630.810 | 96.610 |
| Withheld | 388,706,839.970 | 3.390 |
| TOTAL | 11,476,629,470.780 | 100.000 |
| Michael E. Kenneally | ||
| Affirmative | 11,003,372,175.210 | 95.880 |
| Withheld | 473,257,295.570 | 4.120 |
| TOTAL | 11,476,629,470.780 | 100.000 |
| Mark A. Murray | ||
| Affirmative | 11,139,176,322.830 | 97.060 |
| Withheld | 337,453,147.950 | 2.940 |
| TOTAL | 11,476,629,470.780 | 100.000 |
| Carol J. Zierhoffer | ||
| Affirmative | 11,137,882,609.000 | 97.050 |
| Withheld | 338,746,861.780 | 2.950 |
| TOTAL | 11,476,629,470.780 | 100.000 |
| Proposal 1 reflects trust wide proposal and voting results. | ||
 |


Contents
| Average Annual Total Returns | |||
Periods ended December 31, 2023 | Past 1 year | Past 5 years | Past 10 years |
| Fidelity® Michigan Municipal Income Fund | 6.00% | 1.94% | 2.85% |
| $10,000 Over 10 Years |
Let's say hypothetically that $10,000 was invested in Fidelity® Michigan Municipal Income Fund on December 31, 2013. The chart shows how the value of your investment would have changed, and also shows how the Bloomberg Municipal Bond Index performed over the same period. |
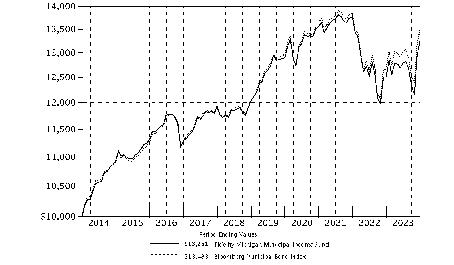 |
| Revenue Sources (% of Fund's net assets) | ||
| Health Care | 21.7 | |
| General Obligations | 20.0 | |
| Transportation | 12.9 | |
| Education | 11.7 | |
| Housing | 8.8 | |
| Water & Sewer | 6.9 | |
| Electric Utilities | 5.2 | |
| Others* (Individually Less Than 5%) | 12.8 | |
| 100.0 | ||
| *Includes net other assets | ||
Quality Diversification (% of Fund's net assets) |
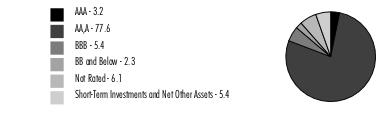 |
| We have used ratings from Moody's Investors Service, Inc. Where Moody's® ratings are not available, we have used S&P® ratings. All ratings are as of the date indicated and do not reflect subsequent changes. |
| Municipal Bonds - 94.7% | |||
Principal Amount (a) | Value ($) | ||
| Guam - 0.2% | |||
| Guam Pwr. Auth. Rev. Series 2022 A, 5% 10/1/44 | 1,000,000 | 1,047,405 | |
| Michigan - 92.7% | |||
| Ann Arbor Pub. School District Series 2023, 4% 5/1/40 | 3,000,000 | 3,124,490 | |
| Bloomfield Hills Schools District Series 2020, 4% 5/1/50 | 1,500,000 | 1,499,094 | |
| Byron Ctr. Pub. Schools Series 2023 II, 5.25% 5/1/53 | 3,570,000 | 3,910,193 | |
| Chippewa Valley Schools Series 2016 A: | |||
| 5% 5/1/32 | 1,000,000 | 1,030,942 | |
| 5% 5/1/33 | 1,000,000 | 1,030,044 | |
| 5% 5/1/34 | 1,075,000 | 1,105,369 | |
| Detroit Downtown Dev. Auth. Tax Series A: | |||
| 5% 7/1/29 (Assured Guaranty Muni. Corp. Insured) | 1,340,000 | 1,350,465 | |
| 5% 7/1/31 (Assured Guaranty Muni. Corp. Insured) | 1,775,000 | 1,787,906 | |
| Detroit Gen. Oblig.: | |||
| Series 2020: | |||
5.5% 4/1/35 | 1,040,000 | 1,152,677 | |
5.5% 4/1/36 | 435,000 | 479,725 | |
5.5% 4/1/37 | 465,000 | 509,475 | |
5.5% 4/1/38 | 490,000 | 531,339 | |
| Series 2021 A: | |||
5% 4/1/37 | 1,875,000 | 1,997,181 | |
5% 4/1/39 | 1,210,000 | 1,271,571 | |
| Series 2023 C, 6% 5/1/43 | 1,500,000 | 1,686,855 | |
| Detroit Swr. Disp. Rev.: | |||
| Series 2001 B, 5.5% 7/1/29 (Assured Guaranty Corp. Insured) | 25,000 | 26,425 | |
| Series 2006, 5% 7/1/36 (Nat'l. Pub. Fin. Guarantee Corp. Insured) | 10,000 | 10,016 | |
| Downriver Util. Wastewtr. Auth. Swr. Sys. Rev. Series 2018: | |||
| 5% 4/1/33 (Assured Guaranty Muni. Corp. Insured) | 735,000 | 800,617 | |
| 5% 4/1/34 (Assured Guaranty Muni. Corp. Insured) | 520,000 | 562,818 | |
| 5% 4/1/35 (Assured Guaranty Muni. Corp. Insured) | 500,000 | 538,482 | |
| Farmington Pub. School District Gen. Oblig. Series 2020, 4% 5/1/40 | 3,000,000 | 3,053,357 | |
| Flint Hosp. Bldg. Auth. Rev. Series 2020: | |||
| 4% 7/1/38 | 1,800,000 | 1,699,325 | |
| 4% 7/1/41 | 1,395,000 | 1,258,161 | |
| Gerald R. Ford Int'l. Arpt. Auth. Rev. Series 2021: | |||
| 5% 1/1/26 (b) | 225,000 | 233,858 | |
| 5% 1/1/27 (b) | 325,000 | 344,648 | |
| 5% 1/1/28 (b) | 235,000 | 253,494 | |
| 5% 1/1/29 (b) | 525,000 | 575,438 | |
| 5% 1/1/30 (b) | 425,000 | 471,718 | |
| 5% 1/1/31 (b) | 725,000 | 816,116 | |
| 5% 1/1/32 (b) | 725,000 | 826,814 | |
| 5% 1/1/33 (b) | 1,000,000 | 1,139,714 | |
| 5% 1/1/34 (b) | 1,000,000 | 1,138,676 | |
| 5% 1/1/35 (b) | 850,000 | 965,656 | |
| 5% 1/1/36 (b) | 600,000 | 677,738 | |
| 5% 1/1/37 (b) | 700,000 | 784,523 | |
| 5% 1/1/38 (b) | 1,170,000 | 1,291,417 | |
| 5% 1/1/39 (b) | 1,000,000 | 1,099,594 | |
| 5% 1/1/40 (b) | 1,000,000 | 1,094,482 | |
| 5% 1/1/41 (b) | 1,100,000 | 1,199,186 | |
| 5% 1/1/46 (b) | 2,000,000 | 2,138,104 | |
| Grand Rapids Pub. Schools Series 2017, 5% 5/1/29 (Assured Guaranty Muni. Corp. Insured) | 480,000 | 514,042 | |
| Grand Rapids San. Swr. Sys. Rev. Series 2018: | |||
| 5% 1/1/34 | 550,000 | 599,263 | |
| 5% 1/1/35 | 400,000 | 436,233 | |
| 5% 1/1/38 | 655,000 | 701,703 | |
| Grand Rapids Wtr. Supply Sys. Series 2016: | |||
| 5% 1/1/31 | 250,000 | 259,202 | |
| 5% 1/1/32 | 320,000 | 331,464 | |
| 5% 1/1/33 | 550,000 | 569,056 | |
| Grand Traverse County Hosp. Fin. Auth.: | |||
| Series 2019 A: | |||
5% 7/1/44 | 1,110,000 | 1,154,512 | |
5% 7/1/49 | 2,615,000 | 2,696,499 | |
| Series 2021, 3% 7/1/51 | 1,500,000 | 1,059,562 | |
| Grand Valley Michigan State Univ. Rev. Series 2018: | |||
| 5% 12/1/34 | 1,075,000 | 1,155,065 | |
| 5% 12/1/35 | 1,225,000 | 1,310,406 | |
| 5% 12/1/37 | 1,375,000 | 1,453,543 | |
| 5% 12/1/38 | 875,000 | 921,907 | |
| 5% 12/1/43 | 1,400,000 | 1,461,442 | |
| Grandville Pub. Schools District Series 2020: | |||
| 4% 5/1/39 (Assured Guaranty Muni. Corp. Insured) | 1,000,000 | 1,023,165 | |
| 4% 5/1/40 (Assured Guaranty Muni. Corp. Insured) | 1,300,000 | 1,329,021 | |
| Great Lakes Wtr. Auth. Sew Disp. Sys.: | |||
| Series 2016 B, 5% 7/1/27 | 15,000 | 15,824 | |
| Series 2018 A, 5% 7/1/43 | 10,000,000 | 10,551,907 | |
| Series 2018 B, 5% 7/1/29 | 15,000 | 16,921 | |
| Great Lakes Wtr. Auth. Wtr. Supply Sys. Rev.: | |||
| Series 2016 C, 5.25% 7/1/35 | 2,000,000 | 2,099,716 | |
| Series 2020 B: | |||
5% 7/1/45 | 1,850,000 | 1,982,688 | |
5% 7/1/49 | 1,300,000 | 1,389,713 | |
| Grosse Pointe Pub. School Sys. Series 2021, 3% 5/1/33 | 1,000,000 | 981,478 | |
| Holland School District Series 2023 II: | |||
| 4% 11/1/39 | 1,855,000 | 1,927,123 | |
| 4% 11/1/40 | 1,915,000 | 1,979,752 | |
| Kalamazoo County Mich Series 2021: | |||
| 2% 5/1/38 | 1,660,000 | 1,285,382 | |
| 3% 5/1/30 | 1,690,000 | 1,703,813 | |
| Kalamazoo Hosp. Fin. Auth. Hosp. Facilities Rev. Series 2016: | |||
| 4% 5/15/36 | 1,985,000 | 2,004,525 | |
| 5% 5/15/28 | 775,000 | 807,865 | |
| 5% 5/15/28 (Pre-Refunded to 5/15/26 @ 100) | 5,000 | 5,257 | |
| 5% 5/15/30 | 4,970,000 | 5,165,325 | |
| 5% 5/15/30 (Pre-Refunded to 5/15/26 @ 100) | 30,000 | 31,539 | |
| Kentwood Econ. Dev. Corp.: | |||
| Series 2021, 4% 11/15/45 | 500,000 | 382,077 | |
| Series 2022: | |||
4% 11/15/31 | 970,000 | 903,306 | |
4% 11/15/43 | 2,250,000 | 1,766,877 | |
| Lansing Board of Wtr. & Lt. Util. Rev. Bonds Series 2021 B, 2%, tender 7/1/26 (c) | 2,000,000 | 1,897,931 | |
| Lansing Mich Series 2023 B, 4% 6/1/40 (Assured Guaranty Muni. Corp. Insured) | 4,810,000 | 4,952,935 | |
| Lincoln Consolidated School District Series 2016 A: | |||
| 5% 5/1/29 | 1,430,000 | 1,497,686 | |
| 5% 5/1/31 | 500,000 | 522,058 | |
| 5% 5/1/32 | 1,000,000 | 1,043,886 | |
| Macomb Interceptor Drain Drainage District Series 2017 A, 5% 5/1/34 | 1,750,000 | 1,877,518 | |
| Marquette Board Lt. & Pwr. Elec. Util. Sys. Rev. Series 2016 A: | |||
| 5% 7/1/29 | 780,000 | 812,917 | |
| 5% 7/1/30 | 900,000 | 936,884 | |
| 5% 7/1/31 | 780,000 | 810,827 | |
| 5% 7/1/32 | 1,000,000 | 1,038,064 | |
| 5% 7/1/33 | 705,000 | 730,638 | |
| Michigan Bldg. Auth. Rev.: | |||
| (Facilities Prog.) Series I, 3% 10/15/45 | 8,670,000 | 7,398,232 | |
| Series 2021 I, 3% 10/15/51 | 1,770,000 | 1,418,716 | |
| Michigan Fin. Auth. Rev.: | |||
| (Charter County of Wayne Criminal Justice Ctr. Proj.) Series 2018: | |||
5% 11/1/33 | 3,250,000 | 3,575,364 | |
5% 11/1/35 | 1,000,000 | 1,094,987 | |
5% 11/1/36 | 1,250,000 | 1,367,418 | |
5% 11/1/37 | 1,500,000 | 1,625,802 | |
5% 11/1/38 | 1,595,000 | 1,715,345 | |
| (Detroit Wtr. And Sewerage Dept. Sewage Disp. Sys. Rev. And Rev. Rfdg. Local Proj. Bonds) Series 2014 C3, 5% 7/1/30 (Assured Guaranty Muni. Corp. Insured) | 6,000,000 | 6,027,217 | |
| (Detroit Wtr. And Sewerage Dept. Wtr. Supply Sys. Rev. Rfdg. Local Proj. Bonds) Series 2015, 5% 7/1/30 | 10,000 | 10,238 | |
| (Kalamazoo College Proj.) Series 2018: | |||
4% 12/1/36 | 790,000 | 801,223 | |
4% 12/1/47 | 2,610,000 | 2,495,161 | |
| (Lawrence Technological Univ. Proj.) Series 2017, 5% 2/1/47 | 3,195,000 | 3,031,564 | |
| (Trinity Health Proj.) Series 2017: | |||
5% 12/1/30 | 710,000 | 765,759 | |
5% 12/1/37 | 3,270,000 | 3,450,578 | |
| Bonds: | |||
Series 2015 D2, 1.2%, tender 4/13/28 (c) | 4,190,000 | 3,764,356 | |
Series 2016 E1, 4%, tender 8/15/24 (c) | 1,305,000 | 1,309,682 | |
| Series 2014 H1, 5% 10/1/39 | 4,725,000 | 4,753,219 | |
| Series 2015 C: | |||
5% 7/1/26 | 570,000 | 583,512 | |
5% 7/1/27 | 1,465,000 | 1,499,513 | |
5% 7/1/28 | 1,500,000 | 1,535,117 | |
| Series 2015 D1: | |||
5% 7/1/34 | 1,250,000 | 1,276,793 | |
5% 7/1/35 | 505,000 | 515,012 | |
| Series 2015 D2, 5% 7/1/34 | 1,000,000 | 1,018,144 | |
| Series 2016: | |||
5% 11/15/28 | 2,655,000 | 2,791,506 | |
5% 1/1/29 | 1,000,000 | 1,037,080 | |
5% 11/15/29 | 2,950,000 | 3,100,163 | |
5% 1/1/30 | 1,000,000 | 1,036,788 | |
5% 1/1/31 | 1,170,000 | 1,213,242 | |
5% 1/1/32 | 1,895,000 | 1,963,721 | |
5% 1/1/33 | 1,915,000 | 1,984,092 | |
5% 1/1/34 | 2,135,000 | 2,213,135 | |
5% 11/15/34 | 1,135,000 | 1,187,648 | |
5% 11/15/41 | 4,710,000 | 4,814,333 | |
| Series 2019 A: | |||
3% 12/1/49 | 2,000,000 | 1,573,715 | |
4% 2/15/44 | 4,140,000 | 4,052,215 | |
4% 12/1/49 | 8,180,000 | 7,805,463 | |
4% 2/15/50 | 6,530,000 | 6,165,887 | |
5% 11/15/48 | 9,865,000 | 10,247,673 | |
| Series 2020 A: | |||
4% 6/1/35 | 2,000,000 | 2,063,929 | |
4% 6/1/37 | 2,000,000 | 2,027,704 | |
4% 6/1/40 | 2,000,000 | 1,977,646 | |
4% 6/1/49 | 4,250,000 | 3,924,000 | |
| Series 2020: | |||
4% 11/1/55 | 2,500,000 | 2,356,285 | |
5% 6/1/40 | 3,000,000 | 3,162,075 | |
| Series 2021: | |||
3% 9/1/50 | 2,320,000 | 1,598,560 | |
5% 9/1/38 | 1,270,000 | 1,366,300 | |
| Series 2022: | |||
4% 2/1/27 | 185,000 | 182,094 | |
4% 2/1/32 | 285,000 | 275,596 | |
4% 2/1/42 | 1,120,000 | 957,289 | |
4% 4/15/42 | 2,000,000 | 1,993,933 | |
4% 12/1/51 | 1,100,000 | 816,151 | |
| Series 2023: | |||
5% 11/1/32 | 1,110,000 | 1,158,367 | |
5% 11/1/33 | 1,250,000 | 1,310,153 | |
5% 11/1/37 | 2,000,000 | 2,047,280 | |
5.25% 11/1/35 | 1,400,000 | 1,475,822 | |
| Michigan Gen. Oblig. Series 2020 A, 4% 5/15/40 | 500,000 | 514,554 | |
| Michigan Hosp. Fin. Auth. Rev.: | |||
| Series 2010 F, 4% 11/15/47 | 290,000 | 277,282 | |
| Series 2010 F4, 5% 11/15/47 | 6,070,000 | 6,406,078 | |
| Michigan Hsg. Dev. Auth. Rental Hsg. Rev.: | |||
| Series 2017 A, 3.75% 10/1/42 | 2,000,000 | 1,932,996 | |
| Series 2018 A, 3.8% 10/1/38 | 3,965,000 | 3,965,100 | |
| Series 2019 A1: | |||
3.35% 10/1/49 | 3,000,000 | 2,510,310 | |
3.6% 10/1/60 | 2,500,000 | 2,095,317 | |
| Series 2020 A1, 0.65% 10/1/24 | 225,000 | 220,259 | |
| Michigan Hsg. Dev. Auth. Single Family Mtg. Rev.: | |||
| Series 2019 B, 3.75% 6/1/50 | 2,160,000 | 2,144,997 | |
| Series 2020 C, 3% 6/1/51 | 2,590,000 | 2,522,690 | |
| Series 2021 A, 3% 6/1/52 | 2,915,000 | 2,830,098 | |
| Series 2022 A, 5% 6/1/53 | 2,255,000 | 2,349,863 | |
| Series 2022 D, 5.5% 6/1/53 | 2,405,000 | 2,555,473 | |
| Series 2023 A, 3.8% 12/1/33 | 1,490,000 | 1,514,775 | |
| Series 2023 B, 5.75% 6/1/54 | 2,000,000 | 2,166,221 | |
| Series A: | |||
3.5% 12/1/50 | 2,870,000 | 2,832,906 | |
4% 12/1/48 | 770,000 | 767,818 | |
| Series C, 4.25% 6/1/49 | 1,780,000 | 1,786,082 | |
| Michigan State Hsg. Dev. Auth. Series 2021 A: | |||
| 0.55% 4/1/25 | 2,750,000 | 2,619,884 | |
| 2.125% 10/1/36 | 1,775,000 | 1,453,555 | |
| 2.45% 10/1/46 | 2,000,000 | 1,409,756 | |
| 2.55% 10/1/51 | 1,920,000 | 1,330,444 | |
| Michigan State Univ. Revs. Series 2019 C, 4% 2/15/44 | 1,500,000 | 1,500,873 | |
| Michigan Strategic Fund Ltd. Oblig. Rev.: | |||
| (I-75 Impt. Proj.): | |||
Series 2017, 5% 6/30/25 (b) | 3,150,000 | 3,179,259 | |
Series 2018: | |||
4.25% 12/31/38 (Assured Guaranty Muni. Corp. Insured) (b) | 5,840,000 | 5,913,274 | |
5% 12/31/25 (b) | 2,200,000 | 2,231,110 | |
5% 12/31/26 (b) | 490,000 | 508,627 | |
5% 12/31/28 (b) | 335,000 | 356,756 | |
5% 6/30/29 (b) | 35,000 | 37,253 | |
5% 12/31/30 (b) | 4,080,000 | 4,339,932 | |
5% 6/30/31 (b) | 340,000 | 362,018 | |
5% 12/31/31 (b) | 3,180,000 | 3,384,785 | |
| (The Detroit Edison Co. Exempt Facilities Proj.) Series 2008 ET2, 1.35% 8/1/29 | 2,000,000 | 1,759,744 | |
| (The Detroit Edison Co. Poll. Cont. Bonds Proj.) Series 1995 CC, 1.45% 9/1/30 | 2,000,000 | 1,722,951 | |
| Bonds: | |||
(Consumer Energy Co. Proj.) Series 2019, 1.8%, tender 10/1/24 (b)(c) | 6,000,000 | 5,906,480 | |
(DTE Elec. Co. Exempt Facilities Proj.) Series 2023 DT, 3.875%, tender 6/3/30 (b)(c) | 7,000,000 | 6,984,672 | |
(Graphic Packaging Int'l., LLC Coated Recycled Board Machine Proj.) Series 2021, 4%, tender 10/1/26 (b)(c) | 5,000,000 | 4,932,049 | |
| Series 2020: | |||
4% 5/15/27 | 565,000 | 541,418 | |
5% 5/15/44 | 1,500,000 | 1,304,224 | |
| Michigan Technological Univ. Series 2021, 4% 10/1/46 | 2,835,000 | 2,789,184 | |
| Michigan Trunk Line Fund Rev. Series 2020 B, 4% 11/15/45 | 1,500,000 | 1,514,924 | |
| Northern Michigan Univ. Revs. Series 2021: | |||
| 4% 6/1/39 | 900,000 | 912,580 | |
| 4% 6/1/40 | 500,000 | 504,548 | |
| 4% 6/1/41 | 1,385,000 | 1,392,137 | |
| 4% 6/1/46 | 1,850,000 | 1,806,629 | |
| 5% 6/1/32 | 375,000 | 432,655 | |
| 5% 6/1/33 | 365,000 | 419,501 | |
| 5% 6/1/34 | 375,000 | 430,664 | |
| 5% 6/1/35 | 375,000 | 429,154 | |
| 5% 6/1/36 | 400,000 | 454,188 | |
| Oakland Univ. Rev.: | |||
| Series 2014: | |||
5% 3/1/28 | 335,000 | 335,507 | |
5% 3/1/29 | 525,000 | 525,828 | |
| Series 2016: | |||
5% 3/1/28 | 1,150,000 | 1,198,950 | |
5% 3/1/41 | 1,475,000 | 1,512,225 | |
| Series 2022 B: | |||
5% 3/1/36 | 1,135,000 | 1,275,749 | |
5% 3/1/37 | 1,265,000 | 1,410,265 | |
| Portage Pub. Schools: | |||
| Series 2016: | |||
5% 11/1/32 | 2,500,000 | 2,607,422 | |
5% 11/1/34 | 1,250,000 | 1,300,281 | |
| Series 2019, 4% 11/1/38 | 2,000,000 | 2,044,974 | |
| Series 2021, 4% 11/1/42 | 1,000,000 | 1,013,370 | |
| Ravenna Pub. Schools Gen. Oblig. Series 2021, 4% 5/1/51 | 2,140,000 | 2,083,343 | |
| Saginaw City School District Series 2021, 4% 5/1/47 | 3,000,000 | 2,992,926 | |
| Saginaw Hosp. Fin. Auth. Hosp. Rev. Series 2020 J: | |||
| 4% 7/1/36 | 770,000 | 792,756 | |
| 4% 7/1/37 | 820,000 | 838,831 | |
| 4% 7/1/39 | 1,430,000 | 1,443,069 | |
| 4% 7/1/40 | 490,000 | 492,140 | |
| Warren Consolidated School District: | |||
| Series 2016: | |||
5% 5/1/34 | 5,630,000 | 5,877,076 | |
5% 5/1/35 | 1,250,000 | 1,302,566 | |
| Series 2017, 4% 5/1/25 (Assured Guaranty Muni. Corp. Insured) | 500,000 | 507,214 | |
| Series 2018, 5% 5/1/32 | 1,100,000 | 1,196,999 | |
| Wayne County Arpt. Auth. Rev.: | |||
| Series 2014 C: | |||
5% 12/1/29 (b) | 720,000 | 724,728 | |
5% 12/1/31 (b) | 860,000 | 865,449 | |
| Series 2015 G, 5% 12/1/36 | 5,760,000 | 5,914,832 | |
| Series 2017 A: | |||
5% 12/1/37 | 545,000 | 577,947 | |
5% 12/1/42 | 1,455,000 | 1,519,236 | |
| Series 2017 B, 5% 12/1/47 (b) | 450,000 | 459,755 | |
| Series 2018 B, 5% 12/1/48 (b) | 5,000,000 | 5,147,671 | |
| Series 2018 D: | |||
5% 12/1/30 (b) | 4,365,000 | 4,695,889 | |
5% 12/1/31 (b) | 2,825,000 | 3,037,152 | |
5% 12/1/32 (b) | 2,945,000 | 3,164,799 | |
| Series 2021 A, 5% 12/1/38 | 1,250,000 | 1,416,348 | |
| Series 2021 B: | |||
5% 12/1/35 (b) | 1,225,000 | 1,358,448 | |
5% 12/1/37 (b) | 1,520,000 | 1,657,935 | |
5% 12/1/46 (b) | 1,280,000 | 1,349,781 | |
| Series 2023 B: | |||
5.25% 12/1/37 (Assured Guaranty Muni. Corp. Insured) (b) | 1,000,000 | 1,152,017 | |
5.25% 12/1/38 (Assured Guaranty Muni. Corp. Insured) (b) | 900,000 | 1,028,443 | |
5.5% 12/1/39 (Assured Guaranty Muni. Corp. Insured) (b) | 635,000 | 737,236 | |
5.5% 12/1/41 (Assured Guaranty Muni. Corp. Insured) (b) | 1,685,000 | 1,929,053 | |
5.5% 12/1/42 (Assured Guaranty Muni. Corp. Insured) (b) | 800,000 | 911,112 | |
5.5% 12/1/43 (Assured Guaranty Muni. Corp. Insured) (b) | 675,000 | 766,059 | |
| Series 2023 D, 5.25% 12/1/37 (Assured Guaranty Muni. Corp. Insured) (b) | 900,000 | 1,036,815 | |
| Wayne State Univ. Revs.: | |||
| Series 2019 A: | |||
4% 11/15/38 | 1,000,000 | 1,021,635 | |
4% 11/15/39 | 800,000 | 814,857 | |
| Series 2023 A: | |||
4% 11/15/39 (Build America Mutual Assurance Insured) | 2,000,000 | 2,065,459 | |
4% 11/15/40 (Build America Mutual Assurance Insured) | 1,500,000 | 1,537,526 | |
| Western Michigan Univ. Rev.: | |||
| Series 2014: | |||
5% 11/15/28 | 650,000 | 659,685 | |
5% 11/15/29 | 750,000 | 760,917 | |
5% 11/15/30 | 855,000 | 867,005 | |
5% 11/15/31 | 700,000 | 709,229 | |
| Series 2015 A, 5% 11/15/28 | 2,505,000 | 2,569,276 | |
| Series 2019 A, 5% 11/15/44 | 2,000,000 | 2,125,804 | |
| Series 2021 A: | |||
5% 11/15/31 (Assured Guaranty Muni. Corp. Insured) | 150,000 | 171,961 | |
5% 11/15/32 (Assured Guaranty Muni. Corp. Insured) | 300,000 | 343,490 | |
5% 11/15/34 (Assured Guaranty Muni. Corp. Insured) | 400,000 | 456,676 | |
5% 11/15/36 (Assured Guaranty Muni. Corp. Insured) | 400,000 | 451,482 | |
5% 11/15/38 (Assured Guaranty Muni. Corp. Insured) | 625,000 | 694,842 | |
5% 11/15/40 (Assured Guaranty Muni. Corp. Insured) | 635,000 | 698,595 | |
| Ypsilanti School District Series A: | |||
| 5% 5/1/29 | 1,305,000 | 1,371,286 | |
| 5% 5/1/32 | 2,000,000 | 2,099,739 | |
TOTAL MICHIGAN | 436,358,724 | ||
| Puerto Rico - 1.8% | |||
| Puerto Rico Commonwealth Pub. Impt. Gen. Oblig. Series 2021 A1: | |||
| 0% 7/1/33 | 1,643,730 | 1,024,730 | |
| 5.625% 7/1/27 | 195,000 | 206,216 | |
| 5.625% 7/1/29 | 595,000 | 645,321 | |
| 5.75% 7/1/31 | 1,410,000 | 1,568,423 | |
| Puerto Rico Hsg. Fin. Auth. Series 2020, 5% 12/1/27 | 1,340,000 | 1,436,345 | |
| Puerto Rico Indl., Tourist, Edl., Med. And Envir. Cont. Facilities Fing. Auth. Series 2021: | |||
| 4% 7/1/36 | 195,000 | 190,451 | |
| 5% 7/1/30 | 845,000 | 926,837 | |
| 5% 7/1/32 | 360,000 | 398,199 | |
| Puerto Rico Sales Tax Fing. Corp. Sales Tax Rev. Series 2019 A2, 4.329% 7/1/40 | 1,780,000 | 1,767,031 | |
TOTAL PUERTO RICO | 8,163,553 | ||
| TOTAL MUNICIPAL BONDS (Cost $459,033,949) | 445,569,682 | ||
| Municipal Notes - 2.4% | |||
Principal Amount (a) | Value ($) | ||
| Michigan - 2.4% | |||
| Michigan Fin. Auth. Rev. Series 2016 E3, 4.25% 1/5/24, VRDN (c) | 5,100,000 | 5,100,000 | |
| Michigan Hsg. Dev. Auth. Single Family Mtg. Rev. (Single Family Mort 12/17/87 Proj.) Series 2009 C, 3.7% 1/5/24 (Liquidity Facility TD Banknorth, NA), VRDN (c) | 1,425,000 | 1,425,000 | |
| RIB Floater Trust Various States Participating VRDN Series 2022 D1, 4.34% 1/2/24 (Liquidity Facility Barclays Bank PLC) (c)(d)(e) | 5,000,000 | 5,000,000 | |
| TOTAL MUNICIPAL NOTES (Cost $11,525,000) | 11,525,000 | ||
| Money Market Funds - 2.0% | |||
| Shares | Value ($) | ||
Fidelity Municipal Cash Central Fund 4.24% (f)(g) (Cost $9,622,000) | 9,620,076 | 9,622,000 | |
| TOTAL INVESTMENT IN SECURITIES - 99.1% (Cost $480,180,949) | 466,716,682 |
NET OTHER ASSETS (LIABILITIES) - 0.9% | 4,043,642 |
| NET ASSETS - 100.0% | 470,760,324 |
| VRDN | - | VARIABLE RATE DEMAND NOTE (A debt instrument that is payable upon demand, either daily, weekly or monthly) |
| (a) | Amount is stated in United States dollars unless otherwise noted. |
| (b) | Private activity obligations whose interest is subject to the federal alternative minimum tax for individuals. |
| (c) | Coupon rates for floating and adjustable rate securities reflect the rates in effect at period end. |
| (d) | Provides evidence of ownership in one or more underlying municipal bonds. |
| (e) | Coupon rates are determined by re-marketing agents based on current market conditions. |
| (f) | Information in this report regarding holdings by state and security types does not reflect the holdings of the Fidelity Municipal Cash Central Fund. |
| (g) | Affiliated fund that is generally available only to investment companies and other accounts managed by Fidelity Investments. The rate quoted is the annualized seven-day yield of the fund at period end. A complete unaudited listing of the fund's holdings as of its most recent quarter end is available upon request. In addition, each Fidelity Central Fund's financial statements, which are not covered by the Fund's Report of Independent Registered Public Accounting Firm, are available on the SEC's website or upon request. |
| Affiliate | Value, beginning of period ($) | Purchases ($) | Sales Proceeds ($) | Dividend Income ($) | Realized Gain (loss) ($) | Change in Unrealized appreciation (depreciation) ($) | Value, end of period ($) | % ownership, end of period |
| Fidelity Municipal Cash Central Fund 4.24% | - | 123,895,000 | 114,273,000 | 315,024 | - | - | 9,622,000 | 0.4% |
| Total | - | 123,895,000 | 114,273,000 | 315,024 | - | - | 9,622,000 | |
| Valuation Inputs at Reporting Date: | ||||
| Description | Total ($) | Level 1 ($) | Level 2 ($) | Level 3 ($) |
Investments in Securities: | ||||
| Municipal Securities | 457,094,682 | - | 457,094,682 | - |
| Money Market Funds | 9,622,000 | 9,622,000 | - | - |
| Total Investments in Securities: | 466,716,682 | 9,622,000 | 457,094,682 | - |
| Statement of Assets and Liabilities | ||||
| December 31, 2023 | ||||
| Assets | ||||
| Investment in securities, at value - See accompanying schedule: | ||||
Unaffiliated issuers (cost $470,558,949) | $ | 457,094,682 | ||
Fidelity Central Funds (cost $9,622,000) | 9,622,000 | |||
| Total Investment in Securities (cost $480,180,949) | $ | 466,716,682 | ||
| Receivable for fund shares sold | 28,457 | |||
| Interest receivable | 4,819,184 | |||
| Distributions receivable from Fidelity Central Funds | 49,655 | |||
| Prepaid expenses | 450 | |||
| Other receivables | 222 | |||
Total assets | 471,614,650 | |||
| Liabilities | ||||
| Payable to custodian bank | $ | 42,947 | ||
| Payable for fund shares redeemed | 293,466 | |||
| Distributions payable | 279,044 | |||
| Accrued management fee | 134,618 | |||
| Other affiliated payables | 49,207 | |||
| Audit fee payable | 49,489 | |||
| Other payables and accrued expenses | 5,555 | |||
| Total Liabilities | 854,326 | |||
| Net Assets | $ | 470,760,324 | ||
| Net Assets consist of: | ||||
| Paid in capital | $ | 495,345,985 | ||
| Total accumulated earnings (loss) | (24,585,661) | |||
| Net Assets | $ | 470,760,324 | ||
Net Asset Value, offering price and redemption price per share ($470,760,324 ÷ 40,630,492 shares) | $ | 11.59 | ||
| Statement of Operations | ||||
Year ended December 31, 2023 | ||||
| Investment Income | ||||
| Interest | $ | 14,254,120 | ||
| Income from Fidelity Central Funds | 315,024 | |||
| Total Income | 14,569,144 | |||
| Expenses | ||||
| Management fee | $ | 1,680,924 | ||
| Transfer agent fees | 486,990 | |||
| Accounting fees and expenses | 125,339 | |||
| Custodian fees and expenses | 6,867 | |||
| Independent trustees' fees and expenses | 1,780 | |||
| Registration fees | 25,655 | |||
| Audit | 55,101 | |||
| Legal | 8,091 | |||
| Miscellaneous | 5,803 | |||
| Total expenses before reductions | 2,396,550 | |||
| Expense reductions | (17,717) | |||
| Total expenses after reductions | 2,378,833 | |||
| Net Investment income (loss) | 12,190,311 | |||
| Realized and Unrealized Gain (Loss) | ||||
| Net realized gain (loss) on: | ||||
| Investment Securities: | ||||
| Unaffiliated issuers | (7,364,134) | |||
| Total net realized gain (loss) | (7,364,134) | |||
| Change in net unrealized appreciation (depreciation) on investment securities | 22,146,753 | |||
| Net gain (loss) | 14,782,619 | |||
| Net increase (decrease) in net assets resulting from operations | $ | 26,972,930 | ||
| Statement of Changes in Net Assets | ||||
Year ended December 31, 2023 | Year ended December 31, 2022 | |||
| Increase (Decrease) in Net Assets | ||||
| Operations | ||||
| Net investment income (loss) | $ | 12,190,311 | $ | 13,382,386 |
| Net realized gain (loss) | (7,364,134) | (3,890,904) | ||
| Change in net unrealized appreciation (depreciation) | 22,146,753 | (74,601,773) | ||
| Net increase (decrease) in net assets resulting from operations | 26,972,930 | (65,110,291) | ||
| Distributions to shareholders | (12,065,830) | (14,112,830) | ||
| Share transactions | ||||
| Proceeds from sales of shares | 67,072,433 | 91,927,922 | ||
| Reinvestment of distributions | 8,716,917 | 9,900,392 | ||
| Cost of shares redeemed | (116,762,011) | (257,381,337) | ||
Net increase (decrease) in net assets resulting from share transactions | (40,972,661) | (155,553,023) | ||
| Total increase (decrease) in net assets | (26,065,561) | (234,776,144) | ||
| Net Assets | ||||
| Beginning of period | 496,825,885 | 731,602,029 | ||
| End of period | $ | 470,760,324 | $ | 496,825,885 |
| Other Information | ||||
| Shares | ||||
| Sold | 5,949,640 | 7,997,442 | ||
| Issued in reinvestment of distributions | 775,301 | 859,107 | ||
| Redeemed | (10,413,316) | (22,425,043) | ||
| Net increase (decrease) | (3,688,375) | (13,568,494) | ||
| Fidelity® Michigan Municipal Income Fund |
| Years ended December 31, | 2023 | 2022 | 2021 | 2020 | 2019 | |||||
Selected Per-Share Data | ||||||||||
| Net asset value, beginning of period | $ | 11.21 | $ | 12.64 | $ | 12.77 | $ | 12.47 | $ | 11.97 |
| Income from Investment Operations | ||||||||||
Net investment income (loss) A,B | .283 | .261 | .265 | .283 | .309 | |||||
| Net realized and unrealized gain (loss) | .377 | (1.418) | (.070) | .347 | .541 | |||||
| Total from investment operations | .660 | (1.157) | .195 | .630 | .850 | |||||
| Distributions from net investment income | (.280) | (.260) | (.265) | (.284) | (.310) | |||||
| Distributions from net realized gain | - | (.013) | (.060) | (.046) | (.040) | |||||
| Total distributions | (.280) | (.273) | (.325) | (.330) | (.350) | |||||
| Net asset value, end of period | $ | 11.59 | $ | 11.21 | $ | 12.64 | $ | 12.77 | $ | 12.47 |
Total Return C | 6.00% | (9.18)% | 1.54% | 5.11% | 7.16% | |||||
Ratios to Average Net Assets B,D,E | ||||||||||
| Expenses before reductions | .49% | .49% | .48% | .48% | .48% | |||||
| Expenses net of fee waivers, if any | .49% | .49% | .48% | .48% | .48% | |||||
| Expenses net of all reductions | .49% | .49% | .48% | .48% | .48% | |||||
| Net investment income (loss) | 2.51% | 2.25% | 2.08% | 2.25% | 2.50% | |||||
| Supplemental Data | ||||||||||
| Net assets, end of period (000 omitted) | $ | 470,760 | $ | 496,826 | $ | 731,602 | $ | 716,407 | $ | 673,051 |
Portfolio turnover rate F | 21% | 8% | 13% | 13% | 14% |
| Fidelity Central Fund | Investment Manager | Investment Objective | Investment Practices | Expense RatioA |
| Fidelity Money Market Central Funds | Fidelity Management & Research Company LLC (FMR) | Each fund seeks to obtain a high level of current income consistent with the preservation of capital and liquidity. | Short-term Investments | Less than .005% |
| Gross unrealized appreciation | $6,507,982 |
| Gross unrealized depreciation | (19,853,783) |
| Net unrealized appreciation (depreciation) | $(13,345,801) |
| Tax Cost | $480,062,483 |
| Undistributed tax-exempt income | $617 |
| Capital loss carryforward | $(11,240,476) |
| Net unrealized appreciation (depreciation) on securities and other investments | $(13,345,801) |
| Short-term | $(983,759) |
| Long-term | (10,256,717) |
| Total capital loss carryforward | $(11,240,476) |
| December 31, 2023 | December 31, 2022 | |
| Tax-exempt Income | $12,065,830 | $13,373,131 |
| Long-term Capital Gains | - | 739,699 |
| Total | $12,065,830 | $14,112,830 |
| Purchases ($) | Sales ($) | |
| Fidelity Michigan Municipal Income Fund | 96,205,536 | 136,630,792 |
| % of Average Net Assets | |
| Fidelity Michigan Municipal Income Fund | 0.0258% |
| % of Average Net Assets | |
| Fidelity Michigan Municipal Income Fund | .03 |
| Maximum Management Fee Rate % | |
| Fidelity Michigan Municipal Income Fund | .44 |
| Purchases ($) | Sales ($) | Realized Gain (Loss) ($) | |
| Fidelity Michigan Municipal Income Fund | - | 11,800,000 | - |
| Amount | |
| Fidelity Michigan Municipal Income Fund | $913 |
| The Example is based on an investment of $1,000 invested at the beginning of the period and held for the entire period (July 1, 2023 to December 31, 2023). |
Annualized Expense Ratio- A | Beginning Account Value July 1, 2023 | Ending Account Value December 31, 2023 | Expenses Paid During Period- C July 1, 2023 to December 31, 2023 | |||||||
Fidelity® Michigan Municipal Income Fund ** | .48% | |||||||||
| Actual | $ 1,000 | $ 1,036.40 | $ 2.46 | |||||||
Hypothetical-B | $ 1,000 | $ 1,022.79 | $ 2.45 | |||||||
Annualized Expense Ratio- A | Expenses Paid | |||||
| Fidelity® Michigan Municipal Income Fund | .45% | |||||
| Actual | $ 2.31 | |||||
Hypothetical- B | $ 2.29 | |||||
| A Annualized expense ratio reflects expenses net of applicable fee waivers. | ||||||
| B 5% return per year before expenses |
| A special meeting of shareholders was held on October 18, 2023. The results of votes taken among shareholders on the proposal before them are reported below. Each vote reported represents one dollar of net asset value held on the record date for the meeting. | ||
| Proposal 1 | ||
| To elect a Board of Trustees. | ||
# of Votes | % of Votes | |
| Abigail P. Johnson | ||
| Affirmative | 11,160,118,778.550 | 97.240 |
| Withheld | 316,510,692.230 | 2.760 |
| TOTAL | 11,476,629,470.780 | 100.000 |
| Jennifer Toolin McAuliffe | ||
| Affirmative | 11,160,843,041.160 | 97.250 |
| Withheld | 315,786,429.620 | 2.750 |
| TOTAL | 11,476,629,470.780 | 100.000 |
| Christine J. Thompson | ||
| Affirmative | 11,156,602,115.000 | 97.210 |
| Withheld | 320,027,355.780 | 2.790 |
| TOTAL | 11,476,629,470.780 | 100.000 |
| Elizabeth S. Acton | ||
| Affirmative | 11,110,214,430.850 | 96.810 |
| Withheld | 366,415,039.930 | 3.190 |
| TOTAL | 11,476,629,470.780 | 100.000 |
| Laura M. Bishop | ||
| Affirmative | 11,132,012,161.210 | 97.000 |
| Withheld | 344,617,309.570 | 3.000 |
| TOTAL | 11,476,629,470.780 | 100.000 |
| Ann E. Dunwoody | ||
| Affirmative | 11,125,767,777.290 | 96.940 |
| Withheld | 350,861,693.490 | 3.060 |
| TOTAL | 11,476,629,470.780 | 100.000 |
| John Engler | ||
| Affirmative | 11,009,456,697.420 | 95.930 |
| Withheld | 467,172,773.360 | 4.070 |
| TOTAL | 11,476,629,470.780 | 100.000 |
| Robert F. Gartland | ||
| Affirmative | 11,139,433,974.390 | 97.060 |
| Withheld | 337,195,496.390 | 2.940 |
| TOTAL | 11,476,629,470.780 | 100.000 |
| Robert W. Helm | ||
| Affirmative | 11,140,155,147.040 | 97.070 |
| Withheld | 336,474,323.740 | 2.930 |
| TOTAL | 11,476,629,470.780 | 100.000 |
| Arthur E. Johnson | ||
| Affirmative | 11,087,922,630.810 | 96.610 |
| Withheld | 388,706,839.970 | 3.390 |
| TOTAL | 11,476,629,470.780 | 100.000 |
| Michael E. Kenneally | ||
| Affirmative | 11,003,372,175.210 | 95.880 |
| Withheld | 473,257,295.570 | 4.120 |
| TOTAL | 11,476,629,470.780 | 100.000 |
| Mark A. Murray | ||
| Affirmative | 11,139,176,322.830 | 97.060 |
| Withheld | 337,453,147.950 | 2.940 |
| TOTAL | 11,476,629,470.780 | 100.000 |
| Carol J. Zierhoffer | ||
| Affirmative | 11,137,882,609.000 | 97.050 |
| Withheld | 338,746,861.780 | 2.950 |
| TOTAL | 11,476,629,470.780 | 100.000 |
| Proposal 1 reflects trust wide proposal and voting results. | ||
 |


Contents
| Average Annual Total Returns | |||
Periods ended December 31, 2023 | Past 1 year | Past 5 years | Life of Fund A |
| Fidelity Flex® Conservative Income Municipal Bond Fund | 3.85% | 1.72% | 1.68% |
| $10,000 Over Life of Fund |
Let's say hypothetically that $10,000 was invested in Fidelity Flex® Conservative Income Municipal Bond Fund, on October 12, 2017, when the fund started. The chart shows how the value of your investment would have changed, and also shows how the Bloomberg Municipal Bond 1 Year (1-2 Y) Index performed over the same period. |
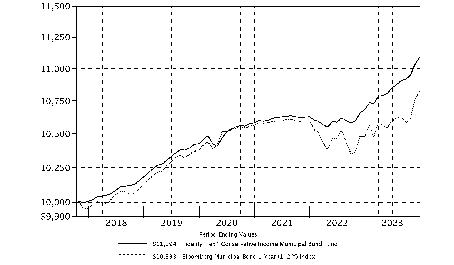 |
| Top Five States (% of Fund's net assets) | |
| California | 12.1 |
| Texas | 11.8 |
| Pennsylvania | 8.6 |
| New York | 8.0 |
| Illinois | 5.5 |
| Revenue Sources (% of Fund's net assets) | ||
| Synthetics | 21.8 | |
| General Obligations | 13.4 | |
| Industrial Development | 11.7 | |
| Resource Recovery | 9.9 | |
| Transportation | 9.5 | |
| Health Care | 8.8 | |
| Electric Utilities | 5.1 | |
| Others* (Individually Less Than 5%) | 19.8 | |
| 100.0 | ||
| *Includes net other assets | ||
Quality Diversification (% of Fund's net assets) |
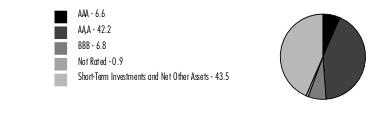 |
| We have used ratings from Moody's Investors Service, Inc. Where Moody's® ratings are not available, we have used S&P® ratings. All ratings are as of the date indicated and do not reflect subsequent changes. |
| Maturity Diversification (% of Fund's Investments) | ||
| Days | ||
| 1 - 7 | 36.9 | |
| 8 - 30 | 1.2 | |
| 31 - 60 | 10.0 | |
| 61 - 90 | 0.9 | |
| 91 - 180 | 5.7 | |
| > 180 | 45.3 | |
| The date shown for securities represents the date when principal payments must be paid, taking into account any call options exercised by the issuer and any permissible maturity shortening features other than interest rate resets. | ||
| Municipal Bonds - 56.4% | |||
Principal Amount (a) | Value ($) | ||
| Alabama - 1.1% | |||
| Black Belt Energy Gas District: | |||
| Series 2022 C1: | |||
5.25% 12/1/24 | 60,000 | 60,855 | |
5.25% 12/1/25 | 95,000 | 97,958 | |
| Series 2022 E: | |||
5% 6/1/24 | 85,000 | 85,477 | |
5% 6/1/25 | 90,000 | 91,696 | |
5% 6/1/26 | 125,000 | 129,120 | |
| Series 2023 C, 5.5% 6/1/27 | 80,000 | 83,592 | |
| Mobile Indl. Dev. Board Poll. Cont. Rev. Bonds (Alabama Pwr. Co. Barry Plant Proj.): | |||
| Series 2007 C, 3.78%, tender 6/16/26 (b) | 100,000 | 100,928 | |
| Series 2008, 3.65%, tender 1/10/25 (b) | 700,000 | 701,166 | |
| Southeast Alabama Gas Supply District Bonds (Proj. No. 2) Series 2018 A, 4%, tender 6/1/24 (b) | 470,000 | 470,227 | |
TOTAL ALABAMA | 1,821,019 | ||
| Alaska - 0.9% | |||
| Alaska Int'l. Arpts. Revs. Series 2021 C, 5% 10/1/25 (c) | 1,410,000 | 1,447,794 | |
| Arizona - 2.7% | |||
| Bullhead City Excise Taxes Series 2021 2, 0.6% 7/1/24 | 275,000 | 269,841 | |
| Chandler Indl. Dev. Auth. Indl. Dev. Rev.: | |||
| (Intel Corp. Proj.) Series 2022 2, 5%, tender 9/1/27 (b)(c) | 835,000 | 868,446 | |
| Bonds (Intel Corp. Proj.) Series 2019, 5%, tender 6/3/24 (b)(c) | 2,280,000 | 2,284,430 | |
| Phoenix Civic Impt. Board Arpt. Rev.: | |||
| Series 2017 D, 5% 7/1/24 | 225,000 | 227,166 | |
| Series 2023, 5% 7/1/26 (c) | 185,000 | 192,989 | |
| Phoenix Indl. Solid Waste Disp. Rev. Bonds (Republic Svc., Inc. Proj.) Series 2013, 4.9%, tender 2/1/24 (b)(c) | 500,000 | 500,072 | |
TOTAL ARIZONA | 4,342,944 | ||
| California - 3.3% | |||
| California Health Facilities Fing. Auth. Rev. Bonds Series 2016 B2, 4%, tender 10/1/24 (b) | 600,000 | 601,404 | |
| California Muni. Fin. Auth. Envir. Bonds (Aymium Williams Proj.) Series 2023, 4%, tender 6/21/24 (b)(c)(d) | 400,000 | 400,004 | |
| California Muni. Fin. Auth. Solid Waste Disp. Rev. Bonds: | |||
| (Republic Svcs., Inc. Proj.): | |||
Series 2021 A, 4.7%, tender 4/1/24 (b)(c) | 900,000 | 900,364 | |
Series 2021 B, 4.2%, tender 1/16/24 (b)(c) | 800,000 | 799,839 | |
| (Waste Mgmt., Inc. Proj.) Series 2017 A, 4.25%, tender 12/2/24 (b)(c) | 800,000 | 801,397 | |
| California Poll. Cont. Fing. Auth. Solid Waste Disp. Rev. Bonds (Republic Svcs. INC. Proj.) Series 2023, 4.25%, tender 2/15/24 (b)(c)(d) | 1,100,000 | 1,099,349 | |
| Long Beach Hbr. Rev. Series 2020 B, 5% 5/15/24 (c) | 150,000 | 150,883 | |
| Los Angeles Dept. Arpt. Rev.: | |||
| Series 2022 C: | |||
5% 5/15/24 (c) | 85,000 | 85,516 | |
5% 5/15/26 (c) | 200,000 | 208,101 | |
| Series 2022 G, 5% 5/15/25 (c) | 65,000 | 66,529 | |
| Series 2023 A: | |||
5% 5/15/24 (c) | 45,000 | 45,273 | |
5% 5/15/25 (c) | 30,000 | 30,705 | |
5% 5/15/26 (c) | 55,000 | 57,228 | |
| San Francisco City & County Arpts. Commission Int'l. Arpt. Rev. Series 2016 D, 5% 5/1/24 | 100,000 | 100,710 | |
TOTAL CALIFORNIA | 5,347,302 | ||
| Colorado - 0.5% | |||
| Colorado Health Facilities Auth. Rev. Series 2014 E, 5% 11/15/24 | 200,000 | 201,458 | |
| Denver City & County Arpt. Rev.: | |||
| Series 2018 A, 5% 12/1/27 (c) | 275,000 | 293,830 | |
| Series 2022 A, 5% 11/15/25 (c) | 165,000 | 169,708 | |
| Maiker Hsg. Partners Colo Multi Bonds Series 2023, 4.5%, tender 5/1/26 (b) | 200,000 | 200,172 | |
TOTAL COLORADO | 865,168 | ||
| Connecticut - 0.5% | |||
| Connecticut Gen. Oblig. Series 2016 A, 5% 3/15/24 | 200,000 | 200,788 | |
| Connecticut Health & Edl. Facilities Auth. Rev. Bonds Series 2010 A4, 1.1%, tender 2/11/25 (b) | 510,000 | 495,683 | |
| Hartford Gen. Oblig. Series 2015 C, 5% 7/15/25 (Assured Guaranty Muni. Corp. Insured) | 105,000 | 108,535 | |
TOTAL CONNECTICUT | 805,006 | ||
| District Of Columbia - 0.5% | |||
| Metropolitan Washington DC Arpts. Auth. Sys. Rev.: | |||
| Series 2014 A, 5% 10/1/24 (c) | 110,000 | 111,162 | |
| Series 2017 A, 5% 10/1/24 (c) | 100,000 | 101,056 | |
| Series 2020 A, 5% 10/1/24 (c) | 400,000 | 404,226 | |
| Washington Metropolitan Area Transit Auth. Series 2023 A, 5% 7/15/24 | 100,000 | 101,105 | |
TOTAL DISTRICT OF COLUMBIA | 717,549 | ||
| Florida - 1.6% | |||
| Broward County Fin. Auth. Multi-family Hsg. Rev. Bonds Series 2023, 4.05%, tender 3/1/26 (b) | 125,000 | 126,613 | |
| Citizens Property Ins. Corp. Series 2015 A1, 5% 6/1/25 (Pre-Refunded to 12/1/24 @ 100) | 345,000 | 350,328 | |
| Florida Hsg. Fin. Corp. Multi-family Mtg. Rev. Bonds Series 2023 C, 5%, tender 12/1/25 (b) | 75,000 | 77,061 | |
| Hillsborough County Aviation Auth. Rev. Series 2022 A, 5% 10/1/24 (c) | 200,000 | 202,245 | |
| Jacksonville Spl. Rev. Series 2022 A: | |||
| 5% 10/1/24 | 35,000 | 35,561 | |
| 5% 10/1/25 | 25,000 | 26,011 | |
| Lee County Arpt. Rev. Series 2021 A, 5% 10/1/24 (c) | 55,000 | 55,577 | |
| Miami Dade County Hsg. Multifamily Hsg. Rev. Bonds Series 2023: | |||
| 3.55%, tender 1/1/26 (b) | 290,000 | 290,150 | |
| 5%, tender 9/1/25 (b) | 250,000 | 255,309 | |
| 5%, tender 9/1/25 (b) | 135,000 | 138,327 | |
| 5%, tender 10/1/25 (b) | 420,000 | 432,770 | |
| Miami-Dade County Indl. Dev. Auth. Solid Waste Disp. Rev. Bonds: | |||
| (Waste Mgmt., Inc. Proj.) Series 2018 A, 0.000% x SIFMA Municipal Swap Index 4.245%, tender 1/4/24 (b)(c)(e) | 270,000 | 268,589 | |
| Series 2011, 5%, tender 11/1/24 (b)(c) | 200,000 | 201,006 | |
| Orange County Health Facilities Auth. Bonds Series 2021 C, 5%, tender 11/15/26 (b) | 190,000 | 200,788 | |
TOTAL FLORIDA | 2,660,335 | ||
| Georgia - 2.8% | |||
| Atlanta Arpt. Rev.: | |||
| Series 2014 C, 5% 1/1/24 (c) | 100,000 | 100,000 | |
| Series 2019 B, 5% 7/1/24 (c) | 100,000 | 100,712 | |
| Series 2020 B, 5% 7/1/25 (c) | 75,000 | 76,789 | |
| Burke County Indl. Dev. Auth. Poll. Cont. Rev. Bonds (Georgia Pwr. Co. Plant Vogtle Proj.): | |||
| Series 1995 4, 3.8%, tender 5/21/26 (b) | 200,000 | 201,516 | |
| Series 2012, 2.875%, tender 8/19/25 (b) | 210,000 | 206,262 | |
| Georgia Muni. Elec. Auth. Pwr. Rev. Series 2020 A, 5% 1/1/24 | 145,000 | 145,000 | |
| Main Street Natural Gas, Inc.: | |||
| Bonds Series 2019 B, 4%, tender 12/2/24 (b) | 265,000 | 265,588 | |
| Series 2022 A, 4% 12/1/25 | 70,000 | 70,063 | |
| Series 2022 B, 5% 6/1/26 | 1,900,000 | 1,947,592 | |
| Series 2023 A, 5% 6/1/24 | 650,000 | 652,138 | |
| Series 2023 B, 5% 3/1/25 | 390,000 | 395,626 | |
| Series 2023 D, 5% 12/1/26 | 75,000 | 77,430 | |
| Monroe County Dev. Auth. Poll. Cont. Rev. Bonds (Georgia Pwr. Co. Plant Scherer Proj.) Series 2009, 3.875%, tender 3/6/26 (b) | 170,000 | 171,421 | |
| Paulding County Hosp. Auth. Rev. Series 2022 A, 5% 4/1/25 | 150,000 | 153,597 | |
TOTAL GEORGIA | 4,563,734 | ||
| Guam - 0.1% | |||
| Guam Pwr. Auth. Rev. Series 2022 A: | |||
| 5% 10/1/24 | 70,000 | 70,611 | |
| 5% 10/1/25 | 85,000 | 86,945 | |
TOTAL GUAM | 157,556 | ||
| Hawaii - 0.2% | |||
| Honolulu City & County Multi-family housing Rev. Bonds Series 2023, 5%, tender 6/1/26 (b) | 370,000 | 384,803 | |
| Illinois - 5.3% | |||
| Champaign County Cmnty. Unit Series 2020 A, 0% 1/1/24 | 380,000 | 380,000 | |
| Chicago O'Hare Int'l. Arpt. Rev.: | |||
| Series 2015 A, 5% 1/1/24 (c) | 450,000 | 450,000 | |
| Series 2022 A, 5% 1/1/25 (c) | 270,000 | 273,853 | |
| Cook County Gen. Oblig. Series 2022 A: | |||
| 5% 11/15/24 | 350,000 | 355,872 | |
| 5% 11/15/25 | 255,000 | 264,998 | |
| Illinois Dev. Fin. Auth. Solid Waste Disp. Rev. Bonds (Waste Mgmt., Inc. Proj.) Series 2019, 5%, tender 11/1/24 (b)(c) | 800,000 | 804,026 | |
| Illinois Fin. Auth. Rev.: | |||
| Series 2015 A, 5% 11/15/24 | 100,000 | 101,463 | |
| Series 2016 C, 5% 2/15/24 | 105,000 | 105,241 | |
| Illinois Gen. Oblig.: | |||
| Series 2017 D: | |||
5% 11/1/24 | 1,700,000 | 1,724,564 | |
5% 11/1/26 | 85,000 | 89,631 | |
| Series 2022 B: | |||
5% 3/1/24 | 230,000 | 230,557 | |
5% 3/1/25 | 865,000 | 882,902 | |
5% 3/1/26 | 340,000 | 353,497 | |
| Series 2023 C, 5% 5/1/25 | 1,090,000 | 1,116,051 | |
| Illinois Hsg. Dev. Auth. Multi-family Hsg. Rev. Bonds Series 2023: | |||
| 4%, tender 6/1/25 (b) | 195,000 | 196,150 | |
| 5%, tender 2/1/26 (b) | 90,000 | 92,629 | |
| 5%, tender 2/1/26 (b) | 100,000 | 102,921 | |
| Illinois Sales Tax Rev. Series 2021 A, 4% 6/15/24 | 135,000 | 135,427 | |
| Railsplitter Tobacco Settlement Auth. Rev. Series 2017, 5% 6/1/24 (Escrowed to Maturity) | 405,000 | 408,188 | |
| Sales Tax Securitization Corp.: | |||
| Series 2023 C, 5% 1/1/24 | 305,000 | 305,000 | |
| Series 2023 D, 5% 1/1/24 | 155,000 | 155,000 | |
TOTAL ILLINOIS | 8,527,970 | ||
| Indiana - 0.6% | |||
| Indiana Fin. Auth. Rev. (Butler Univ. Proj.) Series 2019, 4% 2/1/24 | 200,000 | 200,118 | |
| Indianapolis Local Pub. Impt. (Indianapolis Arpt. Auth. Proj.) Series 2015 I, 4% 1/1/24 (c) | 500,000 | 500,000 | |
| Indianapolis Local Pub. Impt. Bond Bank (Indianapolis Arpt. Auth. Proj.) Series 2023 I2: | |||
| 5% 1/1/25 (c) | 105,000 | 106,488 | |
| 5% 1/1/26 (c) | 65,000 | 67,011 | |
| 5% 1/1/27 (c) | 130,000 | 136,145 | |
TOTAL INDIANA | 1,009,762 | ||
| Kentucky - 0.7% | |||
| Kentucky, Inc. Pub. Energy Bonds: | |||
| Series 2018 A, 4%, tender 3/15/24 (b) | 205,000 | 205,516 | |
| Series 2019 A1, 4%, tender 6/1/25 (b) | 150,000 | 150,268 | |
| Trimble County Envirl Facilities Re Bonds Series 2023, 4.7%, tender 6/1/27 (b)(c) | 800,000 | 812,310 | |
TOTAL KENTUCKY | 1,168,094 | ||
| Maine - 0.2% | |||
| Maine Hsg. Auth. Mtg. Bonds Series 2023 B, 3.125%, tender 5/1/24 (b) | 335,000 | 335,000 | |
| Maryland - 0.5% | |||
| Maryland Cmnty. Dev. Admin Dept. Hsg. & Cmnty. Dev. Series 2023 D, 3.5% 1/1/26 | 495,000 | 496,393 | |
| Maryland Dept. of Trans. Series 2022 A, 5% 12/1/24 | 25,000 | 25,495 | |
| Maryland Health & Higher Edl. Bonds Series 2020, 5%, tender 7/1/25 (b) | 185,000 | 188,166 | |
| Maryland Stadium Auth. Built to Learn Rev. Series 2022 A, 5% 6/1/24 | 120,000 | 120,940 | |
TOTAL MARYLAND | 830,994 | ||
| Massachusetts - 1.1% | |||
| Massachusetts Edl. Fing. Auth. Rev.: | |||
| Series 2014 I, 5% 1/1/25 (c) | 510,000 | 517,427 | |
| Series 2015 A, 5% 1/1/24 (c) | 580,000 | 580,000 | |
| Series 2016, 5% 7/1/24 (c) | 15,000 | 15,106 | |
| Series 2017 A, 5% 7/1/25 (c) | 80,000 | 81,826 | |
| Series 2018 B, 5% 7/1/25 (c) | 110,000 | 112,511 | |
| Series 2022 B: | |||
5% 7/1/24 (c) | 30,000 | 30,212 | |
5% 7/1/25 (c) | 65,000 | 66,484 | |
| Massachusetts School Bldg. Auth. Dedicated Sales Tax Rev. Series 2015 C, 5% 8/15/27 | 300,000 | 311,372 | |
| Massachusetts Tpk. Auth. Metropolitan Hwy. Sys. Rev. Series 1997 A, 0% 1/1/24 (Nat'l. Pub. Fin. Guarantee Corp. Insured) | 115,000 | 115,000 | |
TOTAL MASSACHUSETTS | 1,829,938 | ||
| Michigan - 0.5% | |||
| Lapeer Cmnty. Schools Series 2016, 5% 5/1/25 | 125,000 | 128,502 | |
| Michigan Fin. Auth. Rev.: | |||
| (Detroit Reg'l. Convention Facility Auth. Local Proj.) Series 2014 H1, 5% 10/1/24 | 45,000 | 45,060 | |
| Series 2022: | |||
5% 4/15/25 | 160,000 | 163,890 | |
5% 4/15/26 | 265,000 | 276,769 | |
| Michigan Hsg. Dev. Auth. Single Family Mtg. Rev. Series 2022 A, 2.5% 6/1/25 | 70,000 | 68,479 | |
| Wayne County Arpt. Auth. Rev. Series 2015 F, 5% 12/1/26 (c) | 55,000 | 56,110 | |
TOTAL MICHIGAN | 738,810 | ||
| Minnesota - 0.2% | |||
| Minnesota Hsg. Fin. Agcy. Series 2022 A, 5% 8/1/24 | 360,000 | 364,048 | |
| Missouri - 0.1% | |||
| Kansas City Planned Indl. Expansion Bonds Series 2023, 5%, tender 7/1/27 (b) | 150,000 | 157,220 | |
| Nebraska - 0.6% | |||
| Central Plains Energy Proj. Rev. Bonds Series 2019, 2.5%, tender 8/1/25 (b) | 435,000 | 424,872 | |
| Lincoln Arpt. Auth. Series 2021, 5% 7/1/25 (c) | 550,000 | 562,475 | |
TOTAL NEBRASKA | 987,347 | ||
| Nevada - 0.8% | |||
| Clark County School District: | |||
| Series 2017 A, 5% 6/15/25 | 545,000 | 560,831 | |
| Series 2021 C, 5% 6/15/25 | 320,000 | 329,295 | |
| Nevada Dept. of Bus. & Industry Bonds Series 2023 A, 3.7%, tender 1/31/24 (b)(c)(d) | 400,000 | 399,576 | |
TOTAL NEVADA | 1,289,702 | ||
| New Hampshire - 0.2% | |||
| New Hampshire St Hsg. Fin.: | |||
| Series 2023 3, 3.8% 7/1/26 | 170,000 | 171,623 | |
| Series 2023 4: | |||
3.625% 4/1/26 | 35,000 | 35,112 | |
3.7% 1/1/27 | 115,000 | 115,522 | |
TOTAL NEW HAMPSHIRE | 322,257 | ||
| New Jersey - 2.5% | |||
| New Jersey Econ. Dev. Auth.: | |||
| Series 2023 RRR: | |||
5% 3/1/25 | 465,000 | 476,069 | |
5% 3/1/26 | 360,000 | 376,687 | |
| Series 2024 SSS, 5% 6/15/26 (f) | 240,000 | 250,510 | |
| New Jersey Econ. Dev. Auth. Rev.: | |||
| (New Jersey Gen. Oblig. Proj.) Series 2017 B, 5% 11/1/24 | 185,000 | 188,060 | |
| Series 2019: | |||
5.25% 9/1/24 (d) | 520,000 | 527,726 | |
5.25% 9/1/26 (d) | 180,000 | 191,519 | |
| New Jersey Edl. Facility Series 2016 A, 5% 7/1/24 | 300,000 | 302,652 | |
| New Jersey Gen. Oblig. Series 2020 A, 5% 6/1/24 | 140,000 | 141,206 | |
| New Jersey Higher Ed. Student Assistance Auth. Student Ln. Rev.: | |||
| Series 2016 1A, 5% 12/1/24 (c) | 170,000 | 172,044 | |
| Series 2017 1A, 5% 12/1/24 (c) | 350,000 | 354,208 | |
| Series 2022 B, 5% 12/1/25 (c) | 250,000 | 257,011 | |
| New Jersey Tobacco Settlement Fing. Corp. Series 2018 A, 5% 6/1/24 | 255,000 | 256,534 | |
| New Jersey Trans. Trust Fund Auth.: | |||
| Series 2004 A, 5.75% 6/15/25 (Nat'l. Pub. Fin. Guarantee Corp. Insured) | 100,000 | 104,097 | |
| Series 2006 C, 0% 12/15/24 | 260,000 | 251,816 | |
| Series 2008 A, 0% 12/15/25 | 155,000 | 145,023 | |
| Series 2014 AA, 5% 6/15/25 | 100,000 | 100,936 | |
TOTAL NEW JERSEY | 4,096,098 | ||
| New Mexico - 0.2% | |||
| New Mexico Muni. Energy Acquisition Auth. Gas Supply Rev. Bonds Series 2019 A, 5%, tender 5/1/25 (b) | 305,000 | 310,045 | |
| New York - 4.6% | |||
| Genesee County Fdg. Corp. (Rochester Reg'l. Health Proj.) Series 2022 A: | |||
| 5% 12/1/24 | 175,000 | 176,916 | |
| 5% 12/1/25 | 175,000 | 179,484 | |
| Monroe County Indl. Dev. Agcy. Bonds (Andrews Terrace Cmnty. Partners, L.P. Proj.) Series 2023 B1, 5%, tender 7/1/27 (b) | 90,000 | 94,680 | |
| New York City Gen. Oblig. Series 2016 A, 5% 8/1/27 | 3,665,000 | 3,789,593 | |
| New York City Indl. Dev. Agcy. Rev. Series 2021 A, 5% 1/1/26 (Assured Guaranty Muni. Corp. Insured) | 35,000 | 36,288 | |
| New York Metropolitan Trans. Auth. Rev. Bonds Series 2019 A1, 5%, tender 11/15/24 (b) | 800,000 | 805,550 | |
| New York State Hsg. Fin. Agcy. Rev. Bonds Series 2023 E2, 3.8%, tender 5/1/27 (b) | 115,000 | 115,454 | |
| New York Trans. Dev. Corp.: | |||
| (Term. 4 JFK Int'l. Arpt. Proj.) Series 2020 A: | |||
5% 12/1/24 (c) | 625,000 | 630,612 | |
5% 12/1/25 (c) | 45,000 | 46,178 | |
| (Term. 4 John F. Kennedy Int'l. Arpt. Proj.) Series 2022, 5% 12/1/26 (c) | 330,000 | 344,113 | |
| Tobacco Settlement Asset Securitization Corp. Series 2017 A, 5% 6/1/25 | 205,000 | 208,418 | |
| Triborough Bridge & Tunnel Auth. Revs. Series 2023 A, 5% 11/15/24 | 630,000 | 642,202 | |
| Westchester County Indl. Dev. Bonds (Armory Plaza Hsg., L.P. Proj.) Series 2023, 3.625%, tender 6/1/24 (b) | 400,000 | 399,924 | |
TOTAL NEW YORK | 7,469,412 | ||
| New York And New Jersey - 1.1% | |||
| Port Auth. of New York & New Jersey: | |||
| Series 193, 5% 10/15/25 (c) | 265,000 | 273,595 | |
| Series 2014 186, 5% 10/15/26 (c) | 340,000 | 342,791 | |
| Series 2018, 5% 9/15/25 (c) | 145,000 | 149,450 | |
| Series 2023 242: | |||
5% 12/1/24 (c) | 85,000 | 86,297 | |
5% 12/1/25 (c) | 275,000 | 283,536 | |
5% 12/1/26 (c) | 565,000 | 593,804 | |
TOTAL NEW YORK AND NEW JERSEY | 1,729,473 | ||
| North Carolina - 0.7% | |||
| Charlotte Int'l. Arpt. Rev. Series 2023 B, 5% 7/1/27 (c) | 550,000 | 585,131 | |
| Charlotte-Mecklenburg Hosp. Auth. Health Care Sys. Rev. Bonds: | |||
| Series 2018 C, 3.45%, tender 10/31/25 (b) | 335,000 | 336,909 | |
| Series 2021 B, 5%, tender 12/2/24 (b) | 115,000 | 116,720 | |
TOTAL NORTH CAROLINA | 1,038,760 | ||
| Ohio - 1.1% | |||
| American Muni. Pwr., Inc. Rev.: | |||
| Series 2021 A, 5% 2/15/24 | 200,000 | 200,411 | |
| Series 2023 A: | |||
5% 2/15/25 | 55,000 | 56,245 | |
5% 2/15/26 | 300,000 | 312,643 | |
5% 2/15/27 | 475,000 | 506,433 | |
| Columbus-Franklin County Fin. Auth. Bonds (Dering Family Homes Proj.) Series 2023, 5%, tender 2/1/27 (b) | 130,000 | 135,359 | |
| Ohio Higher Ed. Facilities Commission Healthcare Rev. Series 2022, 5% 1/1/25 | 200,000 | 201,839 | |
| Ohio Higher Edl. Facility Commission Rev. Bonds (Case Western Reserve Univ. Proj.) Series 2019 C, 1.625%, tender 12/1/26 (b) | 70,000 | 66,747 | |
| Ohio Hosp. Facilities Rev. Series 2017 A, 5% 1/1/25 | 215,000 | 219,294 | |
| Ohio Tpk. Commission Tpk. Rev. (Infrastructure Projs.) Series 2022 A, 5% 2/15/25 | 105,000 | 107,563 | |
TOTAL OHIO | 1,806,534 | ||
| Oklahoma - 0.4% | |||
| Oklahoma County Independent School District #89 Oklahoma City Series 2023 A, 3% 7/1/26 | 700,000 | 703,933 | |
| Oregon - 0.4% | |||
| Port of Portland Arpt. Rev.: | |||
| Series 2022, 5% 7/1/25 (c) | 295,000 | 302,038 | |
| Series 26 C, 5% 7/1/24 (c) | 300,000 | 302,137 | |
TOTAL OREGON | 604,175 | ||
| Pennsylvania - 7.2% | |||
| Geisinger Auth. Health Sys. Rev. Bonds Series 2020 B, 5%, tender 2/15/27 (b) | 410,000 | 428,016 | |
| Monroeville Fin. Auth. UPMC Rev. Series 2023 C: | |||
| 5% 5/15/24 | 260,000 | 261,721 | |
| 5% 5/15/25 | 195,000 | 200,245 | |
| Pennsylvania Econ. Dev. Fing. Auth.: | |||
| Series 2023 A2: | |||
5% 5/15/24 | 430,000 | 432,845 | |
5% 5/15/26 | 500,000 | 523,862 | |
| Series 2023 B: | |||
5% 5/15/24 | 260,000 | 261,721 | |
5% 5/15/25 | 275,000 | 282,397 | |
| Pennsylvania Econ. Dev. Fing. Auth. Solid Waste Disp. Rev. Bonds: | |||
| (Republic Svcs., Inc. Proj.) Series 2019 B1, 4.6%, tender 1/16/24 (b)(c) | 1,200,000 | 1,199,947 | |
| (Republic Svcs., Inc. Proj.) Series 2014, 4.6%, tender 1/3/24 (b)(c) | 2,900,000 | 2,900,000 | |
| (Waste Mgmt., Inc. Proj.) Series 2013, 4.875%, tender 2/1/24 (b)(c) | 1,300,000 | 1,300,408 | |
| (Waste Mgmt., Inc. Proj.): | |||
Series 2021 A, SIFMA Municipal Swap Index + 0.400% 4.27%, tender 1/4/24 (b)(c)(e) | 100,000 | 99,555 | |
Series 2021 A2, 4.6%, tender 10/1/26 (b)(c) | 2,000,000 | 2,021,164 | |
| Pennsylvania Gen. Oblig. Series 2023: | |||
| 5% 9/1/26 | 780,000 | 829,749 | |
| 5% 9/1/27 | 780,000 | 849,633 | |
| Pennsylvania Hsg. Fin. Agcy. Series 2021 135 B: | |||
| 5% 4/1/24 (c) | 10,000 | 10,027 | |
| 5% 4/1/25 (c) | 15,000 | 15,234 | |
| Philadelphia Gas Works Rev. Series 2015 13, 5% 8/1/24 | 100,000 | 101,027 | |
TOTAL PENNSYLVANIA | 11,717,551 | ||
| Rhode Island - 0.6% | |||
| Rhode Island Health and Edl. Bldg. Corp. Higher Ed. Facility Rev.: | |||
| Series 2012, 5% 11/1/24 | 115,000 | 115,162 | |
| Series 2023: | |||
5% 11/1/25 | 500,000 | 519,583 | |
5% 11/1/26 | 350,000 | 371,792 | |
TOTAL RHODE ISLAND | 1,006,537 | ||
| South Carolina - 1.1% | |||
| Patriots Energy Group Fing. Agcy. Bonds Series 2018 A, 4%, tender 2/1/24 (b) | 1,045,000 | 1,045,532 | |
| South Carolina Pub. Svc. Auth. Rev.: | |||
| Series 2013, 5% 12/1/25 | 350,000 | 360,471 | |
| Series 2022 A, 5% 12/1/24 | 315,000 | 319,297 | |
TOTAL SOUTH CAROLINA | 1,725,300 | ||
| South Dakota - 0.3% | |||
| South Dakota Hsg. Dev. Auth. Bonds Series 2023 J, 3.875%, tender 12/12/24 (b) | 450,000 | 452,001 | |
| Tennessee - 0.5% | |||
| Memphis-Shelby County Arpt. Auth. Arpt. Rev. Series 2021 C, 1.875% 7/1/25 (c) | 80,000 | 76,947 | |
| Tennergy Corp. Gas Rev. Bonds Series 2019 A, 5%, tender 10/1/24 (b) | 715,000 | 721,217 | |
TOTAL TENNESSEE | 798,164 | ||
| Texas - 5.9% | |||
| Austin Arpt. Sys. Rev.: | |||
| Series 2019, 5% 11/15/24 (c) | 125,000 | 126,315 | |
| Series 2022, 5% 11/15/25 (c) | 105,000 | 107,709 | |
| Dallas Gen. Oblig. Series 2023 A, 5% 2/15/25 | 610,000 | 624,484 | |
| Dallas Hsg. Fin. Corp. Multi-family Hsg. Rev. Bonds Series 2023, 5%, tender 3/1/26 (b) | 190,000 | 195,056 | |
| Harris County Cultural Ed. Facilities Fin. Corp. Rev. Bonds: | |||
| Series 2019 B, 5%, tender 12/1/24 (b) | 205,000 | 208,018 | |
| Series 2020 A, 0.9%, tender 5/15/25 (b) | 155,000 | 148,740 | |
| Houston Arpt. Sys. Rev. Series 2021 A, 5% 7/1/25 (c) | 500,000 | 510,902 | |
| Houston Hsg. Fin. Corp. Multi-family Hsg. Rev. Bonds Series 2023, 5%, tender 8/1/26 (b) | 110,000 | 113,337 | |
| Houston Independent School District Bonds: | |||
| Series 2014 A2, 3.5%, tender 6/1/25 (b) | 585,000 | 588,549 | |
| Series 2023 C, 4%, tender 6/1/25 (b) | 435,000 | 440,620 | |
| Magnolia Independent School District Series 2023, 5% 8/15/24 | 475,000 | 481,061 | |
| Mission Econ. Dev. Corp. Solid Waste Disp. Rev. Bonds: | |||
| (Republic Svcs., Inc. Proj.) Series 2020 A, 4.9%, tender 2/1/24 (b)(c) | 1,400,000 | 1,400,201 | |
| (Waste Mgmt., Inc. Proj.) Series 2020 A, 4.5%, tender 3/1/24 (b)(c) | 800,000 | 800,158 | |
| North Texas Tollway Auth. Rev.: | |||
| Series 2017 B, 5% 1/1/24 | 5,000 | 5,000 | |
| Series 2021 B, 5% 1/1/26 | 65,000 | 67,958 | |
| Northside Independent School District Bonds Series 2023 B, 3%, tender 8/1/26 (b) | 630,000 | 626,731 | |
| Prosper Independent School District Bonds Series 2019 B, 4%, tender 8/15/26 (b) | 110,000 | 112,290 | |
| San Antonio Elec. & Gas Sys. Rev.: | |||
| Bonds Series 2018, SIFMA Municipal Swap Index + 0.870% 4.74%, tender 12/1/25 (b)(e) | 455,000 | 454,201 | |
| Series 2022, 5% 2/1/26 | 50,000 | 52,371 | |
| San Antonio Wtr. Sys. Rev. Bonds Series 2013 F, 1%, tender 11/1/26 (b) | 1,000,000 | 910,332 | |
| Tarrant County Cultural Ed. Facilities Fin. Corp. Hosp. Rev. Bonds (Baylor Scott & White Health Proj.) Series 2022 E, 5%, tender 5/15/26 (b) | 225,000 | 233,731 | |
| Texas A&M Univ. Rev. Series 2016 E, 4% 5/15/27 | 1,000,000 | 1,029,231 | |
| Texas Affordable Hsg. Corp. Multi-family Hsg. Rev. Bonds Series 2023, 3.625%, tender 1/1/27 (b) | 130,000 | 130,685 | |
| Texas Muni. Gas Acquisition & Su Series 2023 B, 5.25% 1/1/27 | 230,000 | 239,631 | |
| Travis County Hsg. Fin. Corp. Bonds Series 2023, 3.75%, tender 8/1/25 (b) | 30,000 | 30,112 | |
TOTAL TEXAS | 9,637,423 | ||
| Utah - 0.2% | |||
| Salt Lake City Arpt. Rev.: | |||
| Series 2018 A, 5% 7/1/24 (c) | 105,000 | 105,692 | |
| Series 2023 A: | |||
5% 7/1/25 (c) | 40,000 | 40,890 | |
5% 7/1/27 (c) | 60,000 | 63,628 | |
| Utah County Hosp. Rev. Bonds Series 2020 B2, 5%, tender 8/1/26 (b) | 160,000 | 167,469 | |
TOTAL UTAH | 377,679 | ||
| Virginia - 1.0% | |||
| Gloucester County Indl. Dev. Auth. Bonds Series 2003 A, 3.95%, tender 5/1/24 (b)(c) | 800,000 | 799,540 | |
| Southampton County Indl. Bonds (PRTA-Virginia One, LLC Proj.) Series 2023, 4.875%, tender 12/12/24 (b)(c) | 800,000 | 801,980 | |
TOTAL VIRGINIA | 1,601,520 | ||
| Washington - 1.2% | |||
| King County Swr. Rev. Bonds Series 2020 B, 0.875%, tender 1/1/26 (b) | 325,000 | 300,831 | |
| Port of Seattle Rev.: | |||
| Series 2015 B, 5% 3/1/24 | 100,000 | 100,300 | |
| Series 2015 C, 5% 4/1/24 (c) | 100,000 | 100,353 | |
| Series 2016, 5% 2/1/25 | 120,000 | 122,613 | |
| Series 2018 A, 5% 5/1/27 (c) | 250,000 | 264,072 | |
| Series 2021 C, 5% 8/1/24 (c) | 205,000 | 206,799 | |
| Series 2022 B: | |||
5% 8/1/24 (c) | 160,000 | 161,404 | |
5% 8/1/25 (c) | 150,000 | 153,970 | |
5% 8/1/26 (c) | 95,000 | 99,075 | |
| Seattle Hsg. Auth. Rev. (Juniper Apts. Proj.) Series 2023, 5% 6/1/27 | 80,000 | 83,551 | |
| Washington Gen. Oblig. Series 2015 E, 5% 7/1/25 | 270,000 | 276,187 | |
| Washington Hsg. Fin. Commission Multi-family Hsg. Rev. Bonds (Ardea At Totem Lake Apts. Proj.) Series 2023, 5%, tender 2/1/27 (b) | 135,000 | 140,173 | |
TOTAL WASHINGTON | 2,009,328 | ||
| West Virginia - 0.4% | |||
| West Virginia Econ. Dev. Auth. Solid Waste Disp. Facilities Rev. Bonds (Allegheny Metallurgical Proj.) Series 2023, 4.75%, tender 8/1/24 (b)(c) | 700,000 | 702,319 | |
| Wisconsin - 2.0% | |||
| Milwaukee County Arpt. Rev.: | |||
| Series 2023 A, 5% 12/1/24 (c) | 125,000 | 126,660 | |
| Series 2023 B, 5% 12/1/25 (c) | 800,000 | 823,633 | |
| Milwaukee Gen. Oblig. Series 2016, 2% 3/1/27 | 190,000 | 180,861 | |
| Pub. Fin. Auth. Health Care Sys. Rev. Series 2023 A, 5% 10/1/24 | 280,000 | 284,137 | |
| Wisconsin Health & Edl. Facilities Series 2016 A, 4% 11/15/46 (Pre-Refunded to 5/15/26 @ 100) | 885,000 | 907,200 | |
| Wisconsin Health & Edl. Facilities Auth. Rev.: | |||
| Series 2018 B2, 5%, tender 6/24/26 (b) | 330,000 | 344,278 | |
| Series 2022, 5% 10/1/25 | 360,000 | 372,124 | |
| Wisconsin Hsg. & Econ. Dev. Auth. Hsg. Rev. Bonds: | |||
| Series 2021 C, 0.61%, tender 5/1/24 (b) | 15,000 | 14,792 | |
| Series 2023 E, 3.875%, tender 5/1/27 (b) | 115,000 | 115,552 | |
TOTAL WISCONSIN | 3,169,237 | ||
| TOTAL MUNICIPAL BONDS (Cost $91,712,330) | 91,629,841 | ||
| Municipal Notes - 40.9% | |||
Principal Amount (a) | Value ($) | ||
| Alabama - 2.3% | |||
| Black Belt Energy Gas District Participating VRDN: | |||
| Series XF 30 73, 4.22% 1/5/24 (Liquidity Facility Morgan Stanley Bank, West Valley City Utah) (b)(g)(h) | 1,000,000 | 1,000,000 | |
| Series ZL 03 96, 4.17% 1/5/24 (Liquidity Facility Morgan Stanley Bank, West Valley City Utah) (b)(g)(h) | 300,000 | 300,000 | |
| Series ZL 03 97, 4.17% 1/5/24 (Liquidity Facility Morgan Stanley Bank, West Valley City Utah) (b)(g)(h) | 300,000 | 300,000 | |
| Health Care Auth. for Baptist Health Series 2013 B, 5.21% 1/5/24, VRDN (b) | 300,000 | 300,000 | |
| Southeast Energy Auth. Rev. Participating VRDN: | |||
| Series XG 04 10, 4.17% 1/5/24 (Liquidity Facility Morgan Stanley Bank, West Valley City Utah) (b)(g)(h) | 1,600,000 | 1,600,000 | |
| Series XM 10 62, 4.22% 1/5/24 (Liquidity Facility Morgan Stanley Bank, West Valley City Utah) (b)(g)(h) | 300,000 | 300,000 | |
TOTAL ALABAMA | 3,800,000 | ||
| Arizona - 0.2% | |||
| Arizona St Indl. Dev. Auth. Multi Participating VRDN Series XF 31 74, 4.24% 1/5/24 (Liquidity Facility Mizuho Cap. Markets LLC) (b)(g)(h) | 100,000 | 100,000 | |
| Mizuho Floater / Residual Trust V Participating VRDN Series Floater 91 57, 4.27% 2/2/24 (Liquidity Facility Mizuho Cap. Markets LLC) (b)(g)(h) | 200,000 | 200,000 | |
TOTAL ARIZONA | 300,000 | ||
| California - 8.8% | |||
| California Cmnty. Choice Fing. Auth. Clean Energy Proj. Rev. Participating VRDN Series XF 30 07, 4.17% 1/5/24 (Liquidity Facility Morgan Stanley Bank, West Valley City Utah) (b)(g)(h) | 2,005,000 | 2,005,000 | |
| California Health Facilities Fing. Auth. Rev. Participating VRDN Series MS 3389, 4.27% 1/5/24 (Liquidity Facility Toronto-Dominion Bank) (b)(g)(h) | 300,000 | 300,000 | |
| California Hsg. Fin. Agcy. Ltd. Obl Participating VRDN Series XF 31 27, 4.24% 1/5/24 (Liquidity Facility Mizuho Cap. Markets LLC) (b)(g)(h) | 200,000 | 200,000 | |
| California Statewide Cmntys. Dev. Auth. Multi-family Hsg. Rev. Participating VRDN: | |||
| Series Floater MIZ 91 13, 4.27% 2/2/24 (Liquidity Facility Mizuho Cap. Markets LLC) (b)(g)(h)(i) | 800,000 | 800,000 | |
| Series MIZ 91 21, 4.8% 1/2/24 (Liquidity Facility Mizuho Cap. Markets LLC) (b)(c)(g)(h) | 400,000 | 400,000 | |
| Los Angeles Cmnty. Redev. Agcy. Multi-family Hsg. Rev. Participating VRDN: | |||
| Series 2022 MIZ 90 89, 4.8% 1/2/24 (Liquidity Facility Mizuho Cap. Markets LLC) (b)(c)(g)(h) | 3,805,000 | 3,805,000 | |
| Series 2022 MIZ 90 90, 4.8% 1/2/24 (Liquidity Facility Mizuho Cap. Markets LLC) (b)(c)(g)(h) | 2,000,000 | 2,000,000 | |
| Mizuho Floater / Residual Trust V Participating VRDN Series Floater MIZ 90 97, 4.27% 1/5/24, LOC Mizuho Cap. Markets LLC (b)(g)(h) | 200,000 | 200,000 | |
| San Diego County Reg'l. Arpt. Auth. Arpt. Rev. Participating VRDN Series XM 10 54, 4.17% 1/5/24 (Liquidity Facility Morgan Stanley Bank, West Valley City Utah) (b)(c)(g)(h) | 2,300,000 | 2,300,000 | |
| San Francisco City & County Multi-family Hsg. Rev. Participating VRDN Series MIZ 91 15, 4.27% 2/2/24 (Liquidity Facility Mizuho Cap. Markets LLC) (b)(g)(h)(i) | 2,200,000 | 2,200,000 | |
TOTAL CALIFORNIA | 14,210,000 | ||
| Colorado - 1.0% | |||
| Colorado Health Facilities Auth. Rev. Bonds Participating VRDN Series XM 10 61, 4.17% 1/5/24 (Liquidity Facility JPMorgan Chase Bank) (b)(g)(h) | 300,000 | 300,000 | |
| Denver City & County Arpt. Rev. Participating VRDN: | |||
| Series Floaters XM 07 15, 4.17% 1/5/24 (Liquidity Facility Morgan Stanley Bank, West Valley City Utah) (b)(c)(g)(h) | 1,100,000 | 1,100,000 | |
| Series XM 10 20, 4.17% 1/5/24 (Liquidity Facility Morgan Stanley Bank, West Valley City Utah) (b)(c)(g)(h) | 300,000 | 300,000 | |
TOTAL COLORADO | 1,700,000 | ||
| Florida - 1.9% | |||
| Florida Ins. Assistance Interlo Series 2023 A2, 4.36% 1/5/24 (Liquidity Facility Florida Gen. Oblig.), VRDN (b) | 1,500,000 | 1,500,000 | |
| Lee Memorial Health Sys. Hosp. Rev. Series 2019 B, 4.38% 1/5/24, VRDN (b) | 1,440,000 | 1,440,000 | |
| Miami Dade County Hsg. Multifamily Hsg. Rev. Participating VRDN Series Floater MIZ 90 87, 4.27% 2/2/24 (Liquidity Facility Mizuho Cap. Markets LLC) (b)(g)(h)(i) | 200,000 | 200,000 | |
TOTAL FLORIDA | 3,140,000 | ||
| Georgia - 0.1% | |||
| Buford Hsg. Auth. Multifamily Participating VRDN Series XF 31 18, 4.24% 1/5/24 (Liquidity Facility Mizuho Cap. Markets LLC) (b)(g)(h) | 200,000 | 200,000 | |
| Hawaii - 1.7% | |||
| Hawaii Arpts. Sys. Rev. Participating VRDN: | |||
| Series XG 03 86, 4.17% 1/5/24 (Liquidity Facility Morgan Stanley Bank, West Valley City Utah) (b)(c)(g)(h) | 200,000 | 200,000 | |
| Series XM 10 55, 4.17% 1/5/24 (Liquidity Facility Morgan Stanley Bank, West Valley City Utah) (b)(c)(g)(h) | 2,500,000 | 2,500,000 | |
TOTAL HAWAII | 2,700,000 | ||
| Illinois - 0.2% | |||
| Chicago O'Hare Int'l. Arpt. Rev. Participating VRDN Series XL 04 98, 4.17% 1/5/24 (Liquidity Facility JPMorgan Chase Bank) (b)(c)(g)(h) | 400,000 | 400,000 | |
| Iowa - 0.9% | |||
| Louisa County Poll. Cont. Rev. Series 1994, 4.2% 1/3/24, VRDN (b) | 1,400,000 | 1,400,000 | |
| Kentucky - 0.5% | |||
| Meade County Indl. Bldg. Rev. (Nucor Steel Brandenburg Proj.) Series 2020 A1, 5.1% 1/2/24, VRDN (b)(c) | 800,000 | 800,000 | |
| Louisiana - 5.0% | |||
| Saint James Parish Gen. Oblig. (Nucor Steel Louisiana LLC Proj.) Series 2010 A1, 4.29% 1/5/24, VRDN (b) | 8,195,000 | 8,194,994 | |
| Maryland - 0.4% | |||
| Baltimore County Gen. Oblig. Participating VRDN Series 2022 032, 4.22% 2/9/24 (Liquidity Facility Barclays Bank PLC) (b)(g)(h) | 200,000 | 200,000 | |
| Integrace Obligated Group Participating VRDN Series 2022 024, 4.22% 2/9/24 (Liquidity Facility Barclays Bank PLC) (b)(g)(h) | 400,000 | 400,000 | |
TOTAL MARYLAND | 600,000 | ||
| Missouri - 0.4% | |||
| Kansas City Indl. Dev. Auth. Participating VRDN Series XL 03 3, 4.17% 1/5/24 (Liquidity Facility JPMorgan Chase Bank) (b)(c)(g)(h) | 500,000 | 500,000 | |
| Mizuho Floater / Residual Trust V Participating VRDN Series Floater MIZ 91 53, 4.27% 2/2/24 (Liquidity Facility Mizuho Cap. Markets LLC) (b)(g)(h) | 200,000 | 200,000 | |
TOTAL MISSOURI | 700,000 | ||
| New Jersey - 2.6% | |||
| Clifton Gen. Oblig. BAN Series 2023, 5% 11/26/24 | 1,000,000 | 1,014,067 | |
| Hazlet Township NJ BAN Series 2023, 5% 11/8/24 | 500,000 | 506,436 | |
| Manasquan N J BAN Series 2023, 5% 10/3/24 | 300,000 | 303,349 | |
| New Jersey Trans. Trust Fund Auth. Participating VRDN: | |||
| Series XM 09 29, 4.17% 1/5/24 (Liquidity Facility JPMorgan Chase Bank) (b)(g)(h) | 500,000 | 500,000 | |
| Series XM 10 47, 4.17% 1/5/24 (Liquidity Facility JPMorgan Chase Bank) (b)(g)(h) | 1,200,000 | 1,200,000 | |
| Ridgewood Gen. Oblig. BAN Series 2023 B, 5% 10/11/24 | 700,000 | 707,509 | |
TOTAL NEW JERSEY | 4,231,361 | ||
| New Mexico - 0.1% | |||
| New Mexico St Hosp. Equip. Ln. Co. Participating VRDN Series 2022 034, 4.22% 2/9/24 (Liquidity Facility Barclays Bank PLC) (b)(g)(h) | 195,000 | 195,000 | |
| New York - 3.4% | |||
| Albany City School District BAN Series 2023 B, 4.75% 6/27/24 | 400,000 | 402,515 | |
| Liberty Dev. Corp. Rev. Participating VRDN Series MS 1207, 4.22% 1/5/24 (Liquidity Facility Morgan Stanley Bank, West Valley City Utah) (b)(g)(h) | 100,000 | 100,000 | |
| New York Metropolitan Trans. Auth. Rev. Participating VRDN: | |||
| Series XF 13 21, 4.19% 1/5/24 (Liquidity Facility JPMorgan Chase Bank) (b)(g)(h) | 125,000 | 125,000 | |
| Series XF 13 55, 4.19% 1/5/24 (Liquidity Facility JPMorgan Chase Bank) (b)(g)(h) | 2,300,000 | 2,300,000 | |
| RIB Floater Trust Various States Participating VRDN Series Floater 2022 007, 4.32% 2/9/24 (Liquidity Facility Barclays Bank PLC) (b)(c)(g)(h) | 2,600,000 | 2,600,000 | |
TOTAL NEW YORK | 5,527,515 | ||
| Ohio - 1.4% | |||
| Allen County Hosp. Facilities Rev. Series 2012 B, 4.1% 1/5/24 (Liquidity Facility Ohio Gen. Oblig.), VRDN (b) | 875,000 | 875,000 | |
| Ohio Hosp. Rev.: | |||
| Series 2013 B, 4.32% 1/5/24, VRDN (b) | 500,000 | 500,000 | |
| Series 2015 B, 4.32% 1/4/27, VRDN (b) | 900,000 | 900,000 | |
TOTAL OHIO | 2,275,000 | ||
| Oklahoma - 0.5% | |||
| Oklahoma Dev. Fin. Auth. Health Sys. Rev. Series 2020 B, 4.43% 1/4/27, VRDN (b) | 675,000 | 675,000 | |
| Steele Duncan Plaza, LLC Participating VRDN Series MIZ 91 03, 4.27% 2/2/24 (Liquidity Facility Mizuho Cap. Markets LLC) (b)(g)(h)(i) | 120,919 | 120,919 | |
TOTAL OKLAHOMA | 795,919 | ||
| Pennsylvania - 1.4% | |||
| Montgomery County Higher Ed. & Health Auth. Rev. Series 2018 D, 4.42% 1/4/27, VRDN (b) | 800,000 | 800,000 | |
| Philadelphia Auth. for Indl. Dev. Series 2017 B, 4.43% 1/4/27, VRDN (b) | 1,450,000 | 1,450,000 | |
TOTAL PENNSYLVANIA | 2,250,000 | ||
| Texas - 5.9% | |||
| Brazos County Tex Hsg. Fin. Corp. M Participating VRDN Series XF 31 29, 4.24% 1/5/24 (Liquidity Facility Mizuho Cap. Markets LLC) (b)(g)(h) | 200,000 | 200,000 | |
| Ep Machuca Lp Participating VRDN Series MIZ 91 04, 3.97% 2/2/24 (Liquidity Facility Mizuho Cap. Markets LLC) (b)(g)(h)(i) | 200,000 | 200,000 | |
| Mizuho Floater / Residual Trust V Participating VRDN: | |||
| Series Floater MIZ 91 50, 4.27% 2/2/24 (Liquidity Facility Mizuho Cap. Markets LLC) (b)(g)(h)(i) | 1,000,000 | 1,000,000 | |
| Series MIZ 91 24, 4.27% 2/2/24 (Liquidity Facility Mizuho Cap. Markets LLC) (b)(g)(h)(i) | 1,300,000 | 1,300,000 | |
| Port Arthur Navigation District Envir. Facilities Rev. (Motiva Enterprises LLC Proj.): | |||
| Series 2004, 4.93% 1/5/24, VRDN (b)(c) | 5,600,000 | 5,600,000 | |
| Series 2010 D: | |||
4.85% 1/5/24, VRDN (b) | 1,100,000 | 1,100,000 | |
4.88% 1/5/24, VRDN (b) | 100,000 | 100,000 | |
TOTAL TEXAS | 9,500,000 | ||
| Utah - 0.4% | |||
| Salt Lake City Arpt. Rev. Participating VRDN Series XM 11 47, 3.9% 1/5/24 (Liquidity Facility JPMorgan Chase Bank) (b)(c)(g)(h) | 700,000 | 700,000 | |
| Virginia - 0.2% | |||
| Nat'l. Sr. Campuses Participating VRDN Series 2022 028, 4.2% 2/9/24 (Liquidity Facility Barclays Bank PLC) (b)(g)(h) | 300,000 | 300,000 | |
| Washington - 0.1% | |||
| Washington Econ. Dev. Fin. Auth. Rev. Participating VRDN Series Floaters 005, 4.22% 2/9/24 (Liquidity Facility Barclays Bank PLC) (b)(c)(g)(h) | 100,000 | 100,000 | |
| West Virginia - 0.2% | |||
| West Virginia Hosp. Fin. Auth. Hosp. Rev. Series 2018 E, 4.38% 1/4/27, VRDN (b) | 375,000 | 375,000 | |
| Wyoming - 1.3% | |||
| Lincoln County Envir. (PacifiCorp Proj.) Series 1995, 5.6% 1/5/24, VRDN (b)(c) | 900,000 | 900,000 | |
| Lincoln County Poll. Cont. Rev. (PacifiCorp Proj.) Series 1994, 5.55% 1/3/24, VRDN (b) | 100,000 | 100,000 | |
| Sweetwater County Env Imp Rev. (Pacificorp Proj.) Series 1995, 4.55% 1/2/24, VRDN (b)(c) | 700,000 | 700,000 | |
| Sweetwater County Poll. Cont. Rev. (PacifiCorp Proj.) Series 1994, 5.55% 1/3/24, VRDN (b) | 400,000 | 400,000 | |
TOTAL WYOMING | 2,100,000 | ||
| TOTAL MUNICIPAL NOTES (Cost $66,481,877) | 66,494,789 | ||
| Money Market Funds - 3.0% | |||
| Shares | Value ($) | ||
Fidelity Municipal Cash Central Fund 4.24% (j)(k) (Cost $4,769,000) | 4,768,046 | 4,769,000 | |
| TOTAL INVESTMENT IN SECURITIES - 100.3% (Cost $162,963,207) | 162,893,630 |
NET OTHER ASSETS (LIABILITIES) - (0.3)% | (426,182) |
| NET ASSETS - 100.0% | 162,467,448 |
| BAN | - | BOND ANTICIPATION NOTE |
| VRDN | - | VARIABLE RATE DEMAND NOTE (A debt instrument that is payable upon demand, either daily, weekly or monthly) |
| (a) | Amount is stated in United States dollars unless otherwise noted. |
| (b) | Coupon rates for floating and adjustable rate securities reflect the rates in effect at period end. |
| (c) | Private activity obligations whose interest is subject to the federal alternative minimum tax for individuals. |
| (d) | Security exempt from registration under Rule 144A of the Securities Act of 1933. These securities may be resold in transactions exempt from registration, normally to qualified institutional buyers. At the end of the period, the value of these securities amounted to $2,618,174 or 1.6% of net assets. |
| (e) | Coupon is indexed to a floating interest rate which may be multiplied by a specified factor and/or subject to caps or floors. |
| (f) | Security or a portion of the security purchased on a delayed delivery or when-issued basis. |
| (g) | Provides evidence of ownership in one or more underlying municipal bonds. |
| (h) | Coupon rates are determined by re-marketing agents based on current market conditions. |
| (i) | Restricted securities (including private placements) - Investment in securities not registered under the Securities Act of 1933 (excluding 144A issues). At the end of the period, the value of restricted securities (excluding 144A issues) amounted to $5,820,919 or 3.6% of net assets. |
| (j) | Information in this report regarding holdings by state and security types does not reflect the holdings of the Fidelity Municipal Cash Central Fund. |
| (k) | Affiliated fund that is generally available only to investment companies and other accounts managed by Fidelity Investments. The rate quoted is the annualized seven-day yield of the fund at period end. A complete unaudited listing of the fund's holdings as of its most recent quarter end is available upon request. In addition, each Fidelity Central Fund's financial statements, which are not covered by the Fund's Report of Independent Registered Public Accounting Firm, are available on the SEC's website or upon request. |
| Additional information on each restricted holding is as follows: | ||
| Security | Acquisition Date | Acquisition Cost ($) |
| California Statewide Cmntys. Dev. Auth. Multi-family Hsg. Rev. Participating VRDN Series Floater MIZ 91 13, 4.27% 2/2/24 (Liquidity Facility Mizuho Cap. Markets LLC) | 6/22/23 | 800,000 |
| Ep Machuca Lp Participating VRDN Series MIZ 91 04, 3.97% 2/2/24 (Liquidity Facility Mizuho Cap. Markets LLC) | 8/05/22 | 200,000 |
| Miami Dade County Hsg. Multifamily Hsg. Rev. Participating VRDN Series Floater MIZ 90 87, 4.27% 2/2/24 (Liquidity Facility Mizuho Cap. Markets LLC) | 1/27/22 | 200,000 |
| Mizuho Floater / Residual Trust V Participating VRDN Series Floater MIZ 91 50, 4.27% 2/2/24 (Liquidity Facility Mizuho Cap. Markets LLC) | 8/01/23 | 1,000,000 |
| Mizuho Floater / Residual Trust V Participating VRDN Series MIZ 91 24, 4.27% 2/2/24 (Liquidity Facility Mizuho Cap. Markets LLC) | 1/27/23 | 1,300,000 |
| San Francisco City & County Multi-family Hsg. Rev. Participating VRDN Series MIZ 91 15, 4.27% 2/2/24 (Liquidity Facility Mizuho Cap. Markets LLC) | 12/19/22 - 1/30/23 | 2,200,000 |
| Steele Duncan Plaza, LLC Participating VRDN Series MIZ 91 03, 4.27% 2/2/24 (Liquidity Facility Mizuho Cap. Markets LLC) | 8/11/22 | 120,919 |
| Affiliate | Value, beginning of period ($) | Purchases ($) | Sales Proceeds ($) | Dividend Income ($) | Realized Gain (loss) ($) | Change in Unrealized appreciation (depreciation) ($) | Value, end of period ($) | % ownership, end of period |
| Fidelity Municipal Cash Central Fund 4.24% | 8,524,997 | 30,922,994 | 34,679,000 | 95,946 | - | 9 | 4,769,000 | 0.2% |
| Total | 8,524,997 | 30,922,994 | 34,679,000 | 95,946 | - | 9 | 4,769,000 | �� |
| Valuation Inputs at Reporting Date: | ||||
| Description | Total ($) | Level 1 ($) | Level 2 ($) | Level 3 ($) |
Investments in Securities: | ||||
| Municipal Securities | 158,124,630 | - | 158,124,630 | - |
| Money Market Funds | 4,769,000 | 4,769,000 | - | - |
| Total Investments in Securities: | 162,893,630 | 4,769,000 | 158,124,630 | - |
| Statement of Assets and Liabilities | ||||
| December 31, 2023 | ||||
| Assets | ||||
| Investment in securities, at value - See accompanying schedule: | ||||
Unaffiliated issuers (cost $158,194,207) | $ | 158,124,630 | ||
Fidelity Central Funds (cost $4,769,000) | 4,769,000 | |||
| Total Investment in Securities (cost $162,963,207) | $ | 162,893,630 | ||
| Cash | 132,960 | |||
| Receivable for investments sold | 1,403 | |||
| Receivable for fund shares sold | 461,566 | |||
| Interest receivable | 1,367,390 | |||
| Distributions receivable from Fidelity Central Funds | 7,438 | |||
Total assets | 164,864,387 | |||
| Liabilities | ||||
| Payable for investments purchased | ||||
Regular delivery | $ | 1,400,000 | ||
Delayed delivery | 246,048 | |||
| Payable for fund shares redeemed | 246,869 | |||
| Distributions payable | 479,275 | |||
| Payable to investment adviser | 408 | |||
| Other payables and accrued expenses | 24,339 | |||
| Total Liabilities | 2,396,939 | |||
| Net Assets | $ | 162,467,448 | ||
| Net Assets consist of: | ||||
| Paid in capital | $ | 162,487,144 | ||
| Total accumulated earnings (loss) | (19,696) | |||
| Net Assets | $ | 162,467,448 | ||
Net Asset Value, offering price and redemption price per share ($162,467,448 ÷ 16,208,760 shares) | $ | 10.02 | ||
| Statement of Operations | ||||
Year ended December 31, 2023 | ||||
| Investment Income | ||||
| Interest | $ | 4,987,518 | ||
| Income from Fidelity Central Funds | 95,946 | |||
| Total Income | 5,083,464 | |||
| Expenses | ||||
| Independent trustees' fees and expenses | $ | 565 | ||
| Proxy | 24,337 | |||
| Total expenses before reductions | 24,902 | |||
| Expense reductions | (19,590) | |||
| Total expenses after reductions | 5,312 | |||
| Net Investment income (loss) | 5,078,152 | |||
| Realized and Unrealized Gain (Loss) | ||||
| Net realized gain (loss) on: | ||||
| Investment Securities: | ||||
| Unaffiliated issuers | 11,249 | |||
| Total net realized gain (loss) | 11,249 | |||
| Change in net unrealized appreciation (depreciation) on: | ||||
| Investment Securities: | ||||
| Unaffiliated issuers | 923,969 | |||
| Fidelity Central Funds | 9 | |||
| Total change in net unrealized appreciation (depreciation) | 923,978 | |||
| Net gain (loss) | 935,227 | |||
| Net increase (decrease) in net assets resulting from operations | $ | 6,013,379 | ||
| Statement of Changes in Net Assets | ||||
Year ended December 31, 2023 | Year ended December 31, 2022 | |||
| Increase (Decrease) in Net Assets | ||||
| Operations | ||||
| Net investment income (loss) | $ | 5,078,152 | $ | 1,743,736 |
| Net realized gain (loss) | 11,249 | 2,931 | ||
| Change in net unrealized appreciation (depreciation) | 923,978 | (1,094,837) | ||
| Net increase (decrease) in net assets resulting from operations | 6,013,379 | 651,830 | ||
| Distributions to shareholders | (5,042,075) | (1,742,874) | ||
| Share transactions | ||||
| Proceeds from sales of shares | 82,385,493 | 96,062,017 | ||
| Reinvestment of distributions | 54 | - | ||
| Cost of shares redeemed | (70,014,809) | (91,447,126) | ||
Net increase (decrease) in net assets resulting from share transactions | 12,370,738 | 4,614,891 | ||
| Total increase (decrease) in net assets | 13,342,042 | 3,523,847 | ||
| Net Assets | ||||
| Beginning of period | 149,125,406 | 145,601,559 | ||
| End of period | $ | 162,467,448 | $ | 149,125,406 |
| Other Information | ||||
| Shares | ||||
| Sold | 8,257,635 | 9,635,807 | ||
| Issued in reinvestment of distributions | 5 | - | ||
| Redeemed | (7,020,759) | (9,179,850) | ||
| Net increase (decrease) | 1,236,881 | 455,957 | ||
| Fidelity Flex® Conservative Income Municipal Bond Fund |
| Years ended December 31, | 2023 | 2022 | 2021 | 2020 | 2019 | |||||
Selected Per-Share Data | ||||||||||
| Net asset value, beginning of period | $ | 9.96 | $ | 10.03 | $ | 10.04 | $ | 10.02 | $ | 9.98 |
| Income from Investment Operations | ||||||||||
Net investment income (loss) A,B | .320 | .118 | .052 | .121 | .192 | |||||
| Net realized and unrealized gain (loss) | .057 | (.069) | (.007) | .026 | .044 | |||||
| Total from investment operations | .377 | .049 | .045 | .147 | .236 | |||||
| Distributions from net investment income | (.316) | (.119) | (.054) | (.125) | (.193) | |||||
| Distributions from net realized gain | (.001) | - | (.001) | (.002) | (.003) | |||||
| Total distributions | (.317) | (.119) | (.055) | (.127) | (.196) | |||||
| Net asset value, end of period | $ | 10.02 | $ | 9.96 | $ | 10.03 | $ | 10.04 | $ | 10.02 |
Total Return C | 3.85% | .49% | .45% | 1.48% | 2.39% | |||||
Ratios to Average Net Assets B,D,E | ||||||||||
| Expenses before reductions | .02% | -% F | -% F | -% F | -% F | |||||
Expenses net of fee waivers, if any F | -% | -% | -% | -% | -% | |||||
Expenses net of all reductions F | -% | -% | -% | -% | -% | |||||
| Net investment income (loss) | 3.21% | 1.19% | .52% | 1.21% | 1.92% | |||||
| Supplemental Data | ||||||||||
| Net assets, end of period (000 omitted) | $ | 162,467 | $ | 149,125 | $ | 145,602 | $ | 80,067 | $ | 54,558 |
Portfolio turnover rate G | 78% | 58% | 44% | 36% | 52% |
| Fidelity Central Fund | Investment Manager | Investment Objective | Investment Practices | Expense RatioA |
| Fidelity Money Market Central Funds | Fidelity Management & Research Company LLC (FMR) | Each fund seeks to obtain a high level of current income consistent with the preservation of capital and liquidity. | Short-term Investments | Less than .005% |
| Gross unrealized appreciation | $297,539 |
| Gross unrealized depreciation | (359,669) |
| Net unrealized appreciation (depreciation) | $(62,130) |
| Tax Cost | $162,955,760 |
| Undistributed tax-exempt income | $42,435 |
| Undistributed ordinary income | $- |
| Net unrealized appreciation (depreciation) on securities and other investments | $(62,130) |
| December 31, 2023 | December 31,2022 | |
| Tax-exempt Income | $5,026,343 | $1,742,874 |
| Ordinary Income | 15,732 | - |
| Total | $5,042,075 | $1,742,874 |
| Purchases ($) | Sales ($) | |
| Fidelity Flex Conservative Income Municipal Bond Fund | 86,302,796 | 56,970,014 |
| Purchases ($) | Sales ($) | Realized Gain (Loss) ($) | |
| Fidelity Flex Conservative Income Municipal Bond Fund | 710,258 | 5,705,000 | - |
| Reimbursement | |
| Fidelity Flex Conservative Income Municipal Bond Fund | $19,585 |
| The Example is based on an investment of $1,000 invested at the beginning of the period and held for the entire period (July 1, 2023 to December 31, 2023). |
Annualized Expense Ratio- A | Beginning Account Value July 1, 2023 | Ending Account Value December 31, 2023 | Expenses Paid During Period- C July 1, 2023 to December 31, 2023 | |||||||
| Fidelity Flex® Conservative Income Municipal Bond Fund | .01% | |||||||||
| Actual | $ 1,000 | $ 1,022.70 | $ .05 | |||||||
Hypothetical-B | $ 1,000 | $ 1,025.16 | $ .05 | |||||||
| A special meeting of shareholders was held on October 18, 2023. The results of votes taken among shareholders on the proposal before them are reported below. Each vote reported represents one dollar of net asset value held on the record date for the meeting. | ||
| Proposal 1 | ||
| To elect a Board of Trustees. | ||
# of Votes | % of Votes | |
| Abigail P. Johnson | ||
| Affirmative | 11,160,118,778.550 | 97.240 |
| Withheld | 316,510,692.230 | 2.760 |
| TOTAL | 11,476,629,470.780 | 100.000 |
| Jennifer Toolin McAuliffe | ||
| Affirmative | 11,160,843,041.160 | 97.250 |
| Withheld | 315,786,429.620 | 2.750 |
| TOTAL | 11,476,629,470.780 | 100.000 |
| Christine J. Thompson | ||
| Affirmative | 11,156,602,115.000 | 97.210 |
| Withheld | 320,027,355.780 | 2.790 |
| TOTAL | 11,476,629,470.780 | 100.000 |
| Elizabeth S. Acton | ||
| Affirmative | 11,110,214,430.850 | 96.810 |
| Withheld | 366,415,039.930 | 3.190 |
| TOTAL | 11,476,629,470.780 | 100.000 |
| Laura M. Bishop | ||
| Affirmative | 11,132,012,161.210 | 97.000 |
| Withheld | 344,617,309.570 | 3.000 |
| TOTAL | 11,476,629,470.780 | 100.000 |
| Ann E. Dunwoody | ||
| Affirmative | 11,125,767,777.290 | 96.940 |
| Withheld | 350,861,693.490 | 3.060 |
| TOTAL | 11,476,629,470.780 | 100.000 |
| John Engler | ||
| Affirmative | 11,009,456,697.420 | 95.930 |
| Withheld | 467,172,773.360 | 4.070 |
| TOTAL | 11,476,629,470.780 | 100.000 |
| Robert F. Gartland | ||
| Affirmative | 11,139,433,974.390 | 97.060 |
| Withheld | 337,195,496.390 | 2.940 |
| TOTAL | 11,476,629,470.780 | 100.000 |
| Robert W. Helm | ||
| Affirmative | 11,140,155,147.040 | 97.070 |
| Withheld | 336,474,323.740 | 2.930 |
| TOTAL | 11,476,629,470.780 | 100.000 |
| Arthur E. Johnson | ||
| Affirmative | 11,087,922,630.810 | 96.610 |
| Withheld | 388,706,839.970 | 3.390 |
| TOTAL | 11,476,629,470.780 | 100.000 |
| Michael E. Kenneally | ||
| Affirmative | 11,003,372,175.210 | 95.880 |
| Withheld | 473,257,295.570 | 4.120 |
| TOTAL | 11,476,629,470.780 | 100.000 |
| Mark A. Murray | ||
| Affirmative | 11,139,176,322.830 | 97.060 |
| Withheld | 337,453,147.950 | 2.940 |
| TOTAL | 11,476,629,470.780 | 100.000 |
| Carol J. Zierhoffer | ||
| Affirmative | 11,137,882,609.000 | 97.050 |
| Withheld | 338,746,861.780 | 2.950 |
| TOTAL | 11,476,629,470.780 | 100.000 |
| Proposal 1 reflects trust wide proposal and voting results. | ||
 |


Contents
| Average Annual Total Returns | |||
Periods ended December 31, 2023 | Past 1 year | Past 5 years | Life of Fund A |
| Fidelity Flex® Municipal Income Fund | 7.25% | 2.41% | 2.18% |
| $10,000 Over Life of Fund |
Let's say hypothetically that $10,000 was invested in Fidelity Flex® Municipal Income Fund, on October 12, 2017, when the fund started. The chart shows how the value of your investment would have changed, and also shows how the Bloomberg Municipal Bond Index performed over the same period. |
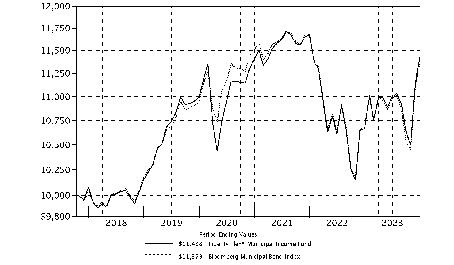 |
| Top Five States (% of Fund's net assets) | |
| Illinois | 12.0 |
| New York | 8.9 |
| Pennsylvania | 7.2 |
| California | 5.9 |
| Connecticut | 5.3 |
| Revenue Sources (% of Fund's net assets) | ||
| General Obligations | 22.1 | |
| Transportation | 17.7 | |
| Health Care | 12.7 | |
| Special Tax | 9.9 | |
| Housing | 9.8 | |
| Education | 8.8 | |
| Others* (Individually Less Than 5%) | 19.0 | |
| 100.0 | ||
| *Includes net other assets | ||
Quality Diversification (% of Fund's net assets) |
 |
| We have used ratings from Moody's Investors Service, Inc. Where Moody's® ratings are not available, we have used S&P® ratings. All ratings are as of the date indicated and do not reflect subsequent changes. |
| Municipal Bonds - 95.7% | |||
Principal Amount (a) | Value ($) | ||
| Alabama - 0.6% | |||
| Auburn Univ. Gen. Fee Rev. Series 2018 A, 5% 6/1/43 | 100,000 | 106,317 | |
| Black Belt Energy Gas District Bonds: | |||
| Series 2022 E, 5%, tender 6/1/28 (b) | 1,190,000 | 1,246,254 | |
| Series 2023 D1, 5.5%, tender 2/1/29 (b) | 1,085,000 | 1,161,101 | |
| Homewood Edl. Bldg. Auth. Rev. Series 2019 A: | |||
| 4% 12/1/33 | 110,000 | 112,862 | |
| 4% 12/1/41 | 85,000 | 82,948 | |
| 4% 12/1/49 | 190,000 | 172,748 | |
| Jefferson County Gen. Oblig. Series 2018 A, 5% 4/1/26 | 100,000 | 104,729 | |
| Lower Alabama Gas District Bonds (No. 2 Proj.) Series 2020, 4%, tender 12/1/25 (b) | 1,095,000 | 1,099,044 | |
| Montgomery Med. Clinic Facilities Series 2015, 5% 3/1/36 | 425,000 | 353,269 | |
TOTAL ALABAMA | 4,439,272 | ||
| Alaska - 0.2% | |||
| Alaska Hsg. Fin. Corp. Series 2021 A, 4% 12/1/29 | 845,000 | 899,717 | |
| Alaska Hsg. Fin. Corp. Mtg. Rev. Series 2022 A, 3% 6/1/51 | 180,000 | 173,976 | |
TOTAL ALASKA | 1,073,693 | ||
| Arizona - 3.1% | |||
| Arizona Health Facilities Auth. Rev. (Scottsdale Lincoln Hospitals Proj.) Series 2014 A, 5% 12/1/39 | 185,000 | 186,139 | |
| Arizona Indl. Dev. Auth. Hosp. Rev. Series 2021 A, 5% 2/1/28 | 1,000,000 | 1,088,023 | |
| Arizona Indl. Dev. Auth. Lease Rev. Series 2020 A, 4% 9/1/46 | 1,750,000 | 1,669,875 | |
| Arizona Indl. Dev. Auth. Rev.: | |||
| (Provident Group-Eastern Michigan Univ. Parking Proj.) Series 2018: | |||
5% 5/1/26 | 450,000 | 270,000 | |
5% 5/1/29 | 290,000 | 159,500 | |
5% 5/1/33 | 565,000 | 310,750 | |
| Series 2019 2, 3.625% 5/20/33 | 410,526 | 388,629 | |
| Bullhead City Excise Taxes Series 2021 2: | |||
| 0.95% 7/1/26 | 250,000 | 234,329 | |
| 1.15% 7/1/27 | 375,000 | 347,874 | |
| 1.3% 7/1/28 | 485,000 | 445,836 | |
| 1.5% 7/1/29 | 600,000 | 553,941 | |
| 1.65% 7/1/30 | 825,000 | 739,190 | |
| 1.7% 7/1/31 | 450,000 | 397,004 | |
| Chandler Indl. Dev. Auth. Indl. Dev. Rev.: | |||
| (Intel Corp. Proj.) Series 2022 2, 5%, tender 9/1/27 (b)(c) | 3,220,000 | 3,348,978 | |
| Bonds (Intel Corp. Proj.): | |||
Series 2005, 3.8%, tender 6/15/28 (b) | 2,190,000 | 2,236,028 | |
Series 2007, 4.1%, tender 6/15/28 (b)(c) | 925,000 | 941,142 | |
Series 2019, 5%, tender 6/3/24 (b)(c) | 1,980,000 | 1,983,847 | |
| Glendale Union School District 205 Series A: | |||
| 4% 7/1/36 (Assured Guaranty Muni. Corp. Insured) | 545,000 | 579,353 | |
| 4% 7/1/37 (Assured Guaranty Muni. Corp. Insured) | 1,000,000 | 1,052,570 | |
| Glendale Indl. Dev. Auth. (Terraces of Phoenix Proj.) Series 2018 A: | |||
| 5% 7/1/38 | 10,000 | 9,601 | |
| 5% 7/1/48 | 10,000 | 8,783 | |
| Maricopa County Indl. Dev. Auth.: | |||
| (Creighton Univ. Proj.) Series 2020, 5% 7/1/47 | 100,000 | 105,848 | |
| Series 2021 A, 4% 9/1/51 | 775,000 | 746,156 | |
| Maricopa County Indl. Dev. Auth. Sr. Living Facilities Series 2016: | |||
| 5.75% 1/1/36 (d) | 300,000 | 242,188 | |
| 6% 1/1/48 (d) | 300,000 | 213,214 | |
| Maricopa County Rev.: | |||
| Series 2017 D, 3% 1/1/48 | 840,000 | 657,312 | |
| Series 2019 E, 3% 1/1/49 | 500,000 | 386,539 | |
| Phoenix Ariz Indl. Dev. Auth. Rev.: | |||
| (Guam Facilities Foundation, Inc. Projs.) Series 2014, 5.375% 2/1/41 | 615,000 | 584,489 | |
| (Guam Facilities Foundation, Inc. Proj.) Series 2014, 5.125% 2/1/34 | 400,000 | 393,155 | |
| Phoenix Civic Impt. Board Arpt. Rev. Series 2019 B, 5% 7/1/35 (c) | 300,000 | 325,740 | |
| Phoenix Civic Impt. Corp. Wtr. Sys. Rev. Series 2021 A, 5% 7/1/45 | 1,000,000 | 1,108,867 | |
| Western Maricopa Ed. Ctr. District Series 2019 B, 5% 7/1/24 | 190,000 | 191,708 | |
TOTAL ARIZONA | 21,906,608 | ||
| California - 5.9% | |||
| California Edl. Facilities Auth. Rev. Series T1, 5% 3/15/39 | 65,000 | 81,519 | |
| California Gen. Oblig.: | |||
| Series 2020, 4% 11/1/37 | 1,000,000 | 1,062,811 | |
| Series 2021: | |||
5% 9/1/32 | 2,175,000 | 2,585,834 | |
5% 10/1/41 | 5,435,000 | 6,157,717 | |
| California Hsg. Fin. Agcy.: | |||
| Series 2021 1, 3.5% 11/20/35 | 345,196 | 336,074 | |
| Series 2023 A1, 4.375% 9/20/36 | 1,285,066 | 1,289,777 | |
| California Pub. Works Board Lease Rev. (Various Cap. Projs.): | |||
| Series 2021 B, 4% 5/1/46 | 1,265,000 | 1,283,999 | |
| Series 2022 C, 5% 8/1/32 | 285,000 | 338,536 | |
| California Statewide Cmntys. Dev. Auth. Rev. Series 2015, 5% 2/1/45 | 105,000 | 55,650 | |
| Fresno Arpt. Rev. Series 2023 A: | |||
| 5% 7/1/32 (Build America Mutual Assurance Insured) (c) | 680,000 | 772,301 | |
| 5% 7/1/48 (Build America Mutual Assurance Insured) (c) | 2,000,000 | 2,144,426 | |
| 5% 7/1/53 (Build America Mutual Assurance Insured) (c) | 2,200,000 | 2,339,406 | |
| Golden State Tobacco Securitization Corp. Tobacco Settlement Rev. Series 2021 B2, 0% 6/1/66 | 10,435,000 | 1,227,697 | |
| Los Angeles Dept. Arpt. Rev. Series F, 5% 5/15/44 (c) | 175,000 | 183,785 | |
| Los Angeles Dept. of Wtr. & Pwr. Rev.: | |||
| Series 2021 B, 5% 7/1/51 | 1,550,000 | 1,708,747 | |
| Series B, 5% 7/1/50 | 1,070,000 | 1,173,826 | |
| Los Angeles Hbr. Dept. Rev. Series 2019 A: | |||
| 5% 8/1/24 (c) | 310,000 | 313,200 | |
| 5% 8/1/25 (c) | 110,000 | 113,374 | |
| Los Angeles Unified School District Ctfs. of Prtn. Series 2023 A, 5% 10/1/35 | 1,000,000 | 1,219,356 | |
| Middle Fork Proj. Fin. Auth. Series 2020, 5% 4/1/26 | 1,000,000 | 1,031,857 | |
| Mount Diablo Unified School District Series 2022 B: | |||
| 4% 8/1/31 | 225,000 | 250,729 | |
| 4% 8/1/34 | 320,000 | 354,086 | |
| Poway Unified School District Series B, 0% 8/1/38 | 1,030,000 | 613,107 | |
| Sacramento County Arpt. Sys. Rev. Series 2018 C, 5% 7/1/39 (c) | 105,000 | 110,038 | |
| San Diego County Wtr. Auth. Fing. Agcy. Wtr. Rev. Series 2022 A: | |||
| 5% 5/1/47 | 635,000 | 716,202 | |
| 5% 5/1/52 | 1,080,000 | 1,207,493 | |
| San Francisco City & County Arpts. Commission Int'l. Arpt. Rev.: | |||
| Series 2018 G, 5% 5/1/27 (c) | 560,000 | 591,521 | |
| Series 2019 A, 5% 5/1/49 (c) | 3,000,000 | 3,105,099 | |
| Series 2019 B, 5% 5/1/49 | 45,000 | 48,079 | |
| Series 2022 A: | |||
5% 5/1/26 (c) | 815,000 | 846,050 | |
5% 5/1/27 (c) | 830,000 | 876,988 | |
5% 5/1/28 (c) | 1,105,000 | 1,188,336 | |
5% 5/1/29 (c) | 740,000 | 808,895 | |
| Series 2022 B, 5% 5/1/52 | 2,240,000 | 2,461,192 | |
| Sanger Unified School District Series 2018 C, 3% 8/1/48 | 2,265,000 | 1,887,440 | |
| Univ. of California Revs.: | |||
| Series 2018 AZ, 5% 5/15/43 | 130,000 | 140,234 | |
| Series 2023 BM, 5% 5/15/36 | 180,000 | 221,461 | |
| Washington Township Health Care District Rev.: | |||
| Series 2017 A, 5% 7/1/35 | 190,000 | 196,009 | |
| Series 2017 B: | |||
5% 7/1/29 | 115,000 | 119,700 | |
5% 7/1/30 | 230,000 | 239,339 | |
TOTAL CALIFORNIA | 41,401,890 | ||
| Colorado - 2.1% | |||
| Arkansas River Pwr. Auth. Rev. Series 2018 A: | |||
| 5% 10/1/38 | 40,000 | 41,465 | |
| 5% 10/1/43 | 50,000 | 51,421 | |
| Colorado Health Facilities Auth. Rev. Bonds Series 2016 C, 5%, tender 11/15/26 (b) | 275,000 | 290,614 | |
| Colorado Health Facilities Auth. Rev. Bonds: | |||
| (Parkview Med. Ctr., Inc. Proj.) Series 2016, 4% 9/1/35 | 35,000 | 35,578 | |
| Bonds Series 2019 B: | |||
5%, tender 8/1/26 (b) | 110,000 | 113,749 | |
5%, tender 11/19/26 (b) | 20,000 | 21,318 | |
5%, tender 11/19/26 (b) | 190,000 | 200,839 | |
| Series 2019 A: | |||
5% 11/1/25 | 435,000 | 450,146 | |
5% 11/15/39 | 190,000 | 207,758 | |
| Series 2019 A1, 4% 8/1/44 | 1,060,000 | 1,045,301 | |
| Series 2019 A2: | |||
3.25% 8/1/49 | 600,000 | 448,386 | |
4% 8/1/49 | 1,715,000 | 1,644,904 | |
5% 8/1/44 | 845,000 | 879,973 | |
| Series 2020 A: | |||
4% 9/1/45 | 775,000 | 765,135 | |
4% 9/1/50 | 210,000 | 201,135 | |
| Colorado Hsg. & Fin. Auth.: | |||
| Series 2019 F, 4.25% 11/1/49 | 40,000 | 40,214 | |
| Series 2019 H, 4.25% 11/1/49 | 15,000 | 15,077 | |
| Colorado Reg'l. Trans. District Ctfs. of Prtn. Series 2020, 5% 6/1/31 | 105,000 | 117,497 | |
| Colorado Reg'l. Trans. District Sales Tax Rev. (Fastracks Proj.) Series 2021 B, 5% 11/1/28 | 725,000 | 813,695 | |
| Denver City & County Arpt. Rev.: | |||
| Series 2017 A, 5% 11/15/26 (c) | 50,000 | 52,557 | |
| Series 2018 A, 5% 12/1/34 (c) | 1,125,000 | 1,296,266 | |
| Denver City & County Board Wtr. Rev.: | |||
| Series 2020 A: | |||
5% 9/15/45 | 1,190,000 | 1,307,253 | |
5% 9/15/46 | 1,820,000 | 1,992,229 | |
| Series 2020 B, 5% 9/15/28 | 2,000,000 | 2,233,210 | |
| Univ. of Colorado Enterprise Sys. Rev. Bonds: | |||
| Series 2021 C3A, 2%, tender 10/15/25 (b) | 255,000 | 248,638 | |
| Series 2021 C3B, 2%, tender 10/15/26 (b) | 210,000 | 201,956 | |
| Vauxmont Metropolitan District: | |||
| Series 2019, 5% 12/15/25 (Assured Guaranty Muni. Corp. Insured) | 40,000 | 41,608 | |
| Series 2020, 5% 12/1/30 (Assured Guaranty Muni. Corp. Insured) | 220,000 | 246,799 | |
TOTAL COLORADO | 15,004,721 | ||
| Connecticut - 5.3% | |||
| Bridgeport Gen. Oblig. Series 2021 A: | |||
| 5% 8/1/32 | 300,000 | 342,937 | |
| 5% 8/1/33 | 800,000 | 913,223 | |
| 5% 8/1/34 | 500,000 | 568,738 | |
| Connecticut Gen. Oblig.: | |||
| Series 2016 B, 5% 5/15/26 | 125,000 | 132,024 | |
| Series 2016 D, 5% 8/15/25 | 210,000 | 217,497 | |
| Series 2018 F: | |||
5% 9/15/24 | 100,000 | 101,441 | |
5% 9/15/25 | 100,000 | 103,777 | |
| Series 2019 A, 5% 4/15/26 | 115,000 | 121,202 | |
| Series 2020 A, 4% 1/15/34 | 300,000 | 320,116 | |
| Series 2021 A: | |||
3% 1/15/35 | 1,150,000 | 1,130,725 | |
3% 1/15/37 | 1,910,000 | 1,818,131 | |
3% 1/15/39 | 215,000 | 194,682 | |
| Series 2021 D, 5% 7/15/24 | 260,000 | 262,831 | |
| Series 2022 B, 4% 1/15/37 | 2,480,000 | 2,638,206 | |
| Series 2022 C: | |||
4% 6/15/39 | 300,000 | 312,948 | |
4% 6/15/41 | 250,000 | 257,458 | |
5% 6/15/30 | 400,000 | 462,603 | |
5% 6/15/31 | 500,000 | 588,866 | |
5% 6/15/34 | 350,000 | 418,067 | |
5% 6/15/37 | 250,000 | 291,651 | |
5% 6/15/38 | 300,000 | 345,683 | |
5% 6/15/40 | 500,000 | 568,234 | |
5% 6/15/42 | 500,000 | 563,237 | |
| Series 2022 D, 5% 9/15/30 | 650,000 | 755,234 | |
| Series 2022: | |||
5% 6/15/28 | 500,000 | 555,087 | |
5% 6/15/29 | 410,000 | 465,023 | |
| Connecticut Health & Edl. Facilities Auth. Rev.: | |||
| Bonds Series 2020 B: | |||
5%, tender 1/1/25 (b) | 200,000 | 202,697 | |
5%, tender 1/1/27 (b) | 330,000 | 346,560 | |
| Series 2018 K1: | |||
5% 7/1/26 | 680,000 | 695,256 | |
5% 7/1/28 | 1,120,000 | 1,168,281 | |
| Series 2019 A, 5% 7/1/49 (d) | 130,000 | 113,181 | |
| Series 2019 Q-1: | |||
5% 11/1/25 | 90,000 | 93,672 | |
5% 11/1/26 | 95,000 | 101,102 | |
| Series 2020 K, 4% 7/1/45 | 1,000,000 | 1,001,953 | |
| Series 2021 G: | |||
4% 3/1/46 | 235,000 | 236,912 | |
4% 3/1/51 | 380,000 | 377,513 | |
| Series 2021 S, 4% 6/1/51 | 240,000 | 239,420 | |
| Series 2022 M: | |||
4% 7/1/39 | 415,000 | 413,212 | |
4% 7/1/52 | 355,000 | 337,569 | |
| Series 2023 E: | |||
4% 7/15/42 | 800,000 | 800,959 | |
4% 7/15/43 | 500,000 | 497,383 | |
5% 7/15/33 | 225,000 | 257,907 | |
5% 7/15/34 | 745,000 | 847,080 | |
5% 7/15/36 | 750,000 | 837,825 | |
| Series A, 5% 7/1/26 | 160,000 | 161,318 | |
| Series K1: | |||
5% 7/1/27 | 1,100,000 | 1,136,674 | |
5% 7/1/30 | 1,000,000 | 1,040,790 | |
5% 7/1/34 | 725,000 | 749,415 | |
5% 7/1/36 | 450,000 | 461,779 | |
5% 7/1/39 | 490,000 | 495,543 | |
| Series K3, 5% 7/1/43 | 215,000 | 215,261 | |
| Series L1: | |||
4% 7/1/28 | 750,000 | 772,588 | |
4% 7/1/29 | 750,000 | 776,901 | |
4% 7/1/30 | 1,000,000 | 1,039,470 | |
| Series N: | |||
5% 7/1/25 | 390,000 | 389,500 | |
5% 7/1/26 | 575,000 | 574,998 | |
5% 7/1/27 | 430,000 | 431,775 | |
| Series R, 5% 6/1/36 | 900,000 | 1,000,859 | |
| Connecticut Hsg. Fin. Auth.: | |||
| Series 2021 B1, 3% 11/15/49 | 265,000 | 256,927 | |
| Series 2022 A1: | |||
5% 11/15/26 | 200,000 | 211,751 | |
5% 5/15/27 | 220,000 | 235,084 | |
5% 11/15/27 | 230,000 | 248,335 | |
5% 5/15/28 | 225,000 | 244,913 | |
5% 11/15/28 | 220,000 | 241,295 | |
5% 5/15/29 | 225,000 | 247,724 | |
5% 11/15/29 | 125,000 | 138,686 | |
5% 5/15/30 | 375,000 | 416,830 | |
5% 11/15/30 | 175,000 | 195,835 | |
| Series 2022 A2: | |||
5% 5/15/24 (c) | 595,000 | 598,173 | |
5% 11/15/24 (c) | 965,000 | 977,873 | |
5% 5/15/25 (c) | 400,000 | 408,329 | |
5% 11/15/25 (c) | 300,000 | 308,999 | |
5% 5/15/26 (c) | 425,000 | 441,426 | |
| Univ. of Connecticut Gen. Oblig. Series 2019 A, 5% 11/1/25 | 140,000 | 145,661 | |
TOTAL CONNECTICUT | 37,582,815 | ||
| District Of Columbia - 0.6% | |||
| Metropolitan Washington Arpts. Auth. Dulles Toll Road Rev.: | |||
| (Dulles Metrorail and Cap. Impt. Projs.): | |||
Series 2019 A: | |||
5% 10/1/31 | 185,000 | 202,447 | |
5% 10/1/44 | 1,000,000 | 1,054,302 | |
Series 2019 B, 3% 10/1/50 (Assured Guaranty Muni. Corp. Insured) | 890,000 | 699,272 | |
| (Dulles Metrorail And Cap. Impt. Projs.) Series 2019 B, 4% 10/1/49 | 1,160,000 | 1,094,533 | |
| Metropolitan Washington DC Arpts. Auth. Sys. Rev.: | |||
| Series 2017 A, 5% 10/1/26 (c) | 440,000 | 461,320 | |
| Series 2019 A, 5% 10/1/25 (c) | 70,000 | 71,936 | |
| Series 2020 A: | |||
5% 10/1/26 (c) | 320,000 | 335,506 | |
5% 10/1/27 (c) | 110,000 | 117,575 | |
5% 10/1/28 (c) | 55,000 | 59,775 | |
| Washington Convention & Sports Auth. Series 2018 A: | |||
| 5% 10/1/24 | 100,000 | 101,448 | |
| 5% 10/1/25 | 100,000 | 103,679 | |
TOTAL DISTRICT OF COLUMBIA | 4,301,793 | ||
| Florida - 3.9% | |||
| Atlantic Beach Health Care Facilities Series A, 5% 11/15/43 | 255,000 | 251,197 | |
| Broward County Arpt. Sys. Rev.: | |||
| Series 2015 C, 5% 10/1/24 (c) | 45,000 | 45,446 | |
| Series 2017, 5% 10/1/42 (c) | 1,365,000 | 1,406,474 | |
| Series 2019 A, 5% 10/1/49 (c) | 1,000,000 | 1,032,821 | |
| Cap. Projs. Fin. Auth. Student Hsg. Rev. (Cap. Projs. Ln. Prog. - Florida Univs.) Series 2020 A, 5% 10/1/30 | 500,000 | 527,995 | |
| Escambia County Health Facilities Auth. Health Facilities Rev. Series 2020 A: | |||
| 3% 8/15/50 (Assured Guaranty Muni. Corp. Insured) | 485,000 | 381,290 | |
| 4% 8/15/45 | 110,000 | 101,032 | |
| Florida Dev. Fin. Corp. Healthcare Facility Rev. Series 2021, 4% 11/15/38 | 725,000 | 738,356 | |
| Florida Higher Edl. Facilities Fing. Auth. (St. Leo Univ. Proj.) Series 2019, 5% 3/1/24 | 390,000 | 388,841 | |
| Florida Hsg. Fin. Corp. Multi-family Mtg. Rev. Bonds Series 2023 C, 5%, tender 12/1/25 (b) | 300,000 | 308,246 | |
| Florida Hsg. Fin. Corp. Rev. Series 2019 1, 4% 7/1/50 | 105,000 | 104,845 | |
| Florida Mid-Bay Bridge Auth. Rev. Series 2015 A: | |||
| 5% 10/1/27 | 105,000 | 107,335 | |
| 5% 10/1/29 | 80,000 | 81,870 | |
| 5% 10/1/30 | 70,000 | 71,624 | |
| Fort Pierce Utils. Auth. Series 2022 A: | |||
| 5% 10/1/30 (Assured Guaranty Muni. Corp. Insured) | 175,000 | 199,866 | |
| 5% 10/1/34 (Assured Guaranty Muni. Corp. Insured) | 300,000 | 351,652 | |
| 5% 10/1/36 (Assured Guaranty Muni. Corp. Insured) | 475,000 | 549,876 | |
| 5% 10/1/37 (Assured Guaranty Muni. Corp. Insured) | 425,000 | 484,594 | |
| 5% 10/1/39 (Assured Guaranty Muni. Corp. Insured) | 475,000 | 533,427 | |
| 5% 10/1/40 (Assured Guaranty Muni. Corp. Insured) | 450,000 | 502,666 | |
| 5% 10/1/41 (Assured Guaranty Muni. Corp. Insured) | 400,000 | 446,746 | |
| 5% 10/1/42 (Assured Guaranty Muni. Corp. Insured) | 400,000 | 446,660 | |
| Greater Orlando Aviation Auth. Arpt. Facilities Rev.: | |||
| Series 2017 A, 5% 10/1/31 (c) | 125,000 | 132,527 | |
| Series 2019 A: | |||
5% 10/1/24 (c) | 300,000 | 303,059 | |
5% 10/1/25 (c) | 300,000 | 308,041 | |
5% 10/1/32 (c) | 300,000 | 329,149 | |
5% 10/1/38 (c) | 430,000 | 459,343 | |
5% 10/1/54 (c) | 1,620,000 | 1,678,377 | |
| Hillsborough County Aviation Auth. Rev. Series 2022 A, 5% 10/1/26 (c) | 2,750,000 | 2,883,252 | |
| Lee Memorial Health Sys. Hosp. Rev. Series 2019 A1, 5% 4/1/44 | 665,000 | 694,771 | |
| Miami-Dade County Aviation Rev.: | |||
| Series 2015 A: | |||
5% 10/1/27 (c) | 620,000 | 630,111 | |
5% 10/1/38 (c) | 80,000 | 80,484 | |
| Series 2016 A, 5% 10/1/29 | 145,000 | 151,789 | |
| Series 2017 B, 5% 10/1/40 (c) | 810,000 | 835,078 | |
| Series 2020 A: | |||
4% 10/1/40 | 300,000 | 304,816 | |
5% 10/1/25 | 245,000 | 253,674 | |
| Miami-Dade County Expressway Auth. Series 2014 A, 5% 7/1/25 | 395,000 | 398,324 | |
| Miami-Dade County School Board Ctfs. of Prtn.: | |||
| Bonds Series 2014 A, 5%, tender 5/1/24 (b) | 100,000 | 100,589 | |
| Series 2015 A, 5% 5/1/28 | 290,000 | 296,787 | |
| Series 2015 D, 5% 2/1/26 | 10,000 | 10,408 | |
| Miami-Dade County Wtr. & Swr. Rev. Series 2021, 5% 10/1/32 | 155,000 | 181,366 | |
| Orange County Health Facilities Auth. Series 2016 A, 5% 10/1/39 | 60,000 | 61,807 | |
| Orange County Hsg. Fin. Auth. Multi-family Rev. Bonds Series 2021 B, 0.55%, tender 7/1/24 (b) | 1,600,000 | 1,566,483 | |
| Palm Beach County Health Facilities Auth. Hosp. Rev. (Jupiter Med. Ctr. Proj.) Series 2022: | |||
| 5% 11/1/29 | 175,000 | 187,456 | |
| 5% 11/1/32 | 200,000 | 219,447 | |
| 5% 11/1/34 | 310,000 | 339,077 | |
| 5% 11/1/37 | 385,000 | 408,782 | |
| 5% 11/1/39 | 400,000 | 420,434 | |
| 5% 11/1/41 | 400,000 | 418,646 | |
| Palm Beach County Health Facilities Auth. Rev. Series 2015 C, 5% 5/15/30 | 495,000 | 468,086 | |
| Pinellas County Hsg. Fin. Auth. Bonds Series 2021 B, 0.65%, tender 7/1/24 (b) | 365,000 | 357,492 | |
| South Miami Health Facilities Auth. Hosp. Rev. (Baptist Med. Ctr., FL. Proj.) Series 2017: | |||
| 5% 8/15/26 | 100,000 | 105,088 | |
| 5% 8/15/42 | 5,000 | 5,166 | |
| Tallahassee Health Facilities Rev.: | |||
| (Tallahassee Memorial Healthcare, Inc. Proj.) Series 2016 A, 5% 12/1/26 | 100,000 | 102,817 | |
| Series 2015 A, 5% 12/1/40 | 410,000 | 413,159 | |
| Tampa Hosp. Rev. (H. Lee Moffitt Cancer Ctr. Proj.): | |||
| Series 2016 B, 5% 7/1/29 | 25,000 | 26,070 | |
| Series 2020 B: | |||
4% 7/1/39 | 1,000,000 | 1,015,465 | |
4% 7/1/45 | 825,000 | 819,636 | |
| Tampa Tax Allocation (H. Lee Moffitt Cancer Ctr. Proj.) Series 2020 A: | |||
| 0% 9/1/34 | 700,000 | 473,230 | |
| 0% 9/1/35 | 750,000 | 484,914 | |
| 0% 9/1/36 | 800,000 | 491,674 | |
| Volusia County Edl. Facilities Auth. Rev. (Embry-Riddle Aeronautical Univ., Inc. Proj.) Series 2020 A: | |||
| 5% 10/15/44 | 30,000 | 31,818 | |
| 5% 10/15/49 | 60,000 | 62,971 | |
TOTAL FLORIDA | 27,574,522 | ||
| Georgia - 5.2% | |||
| Atlanta Arpt. Passenger Facilities Charge Rev. Series 2023 E, 5% 7/1/39 (c) | 520,000 | 577,327 | |
| Atlanta Arpt. Rev.: | |||
| Series 2014 C, 5% 1/1/29 (c) | 140,000 | 140,000 | |
| Series 2019 B, 5% 7/1/25 (c) | 60,000 | 61,431 | |
| Burke County Indl. Dev. Auth. Poll. Cont. Rev.: | |||
| (Georgia Transmission Corp. Proj.) Series 2012, 2.75% 1/1/52 (b) | 610,000 | 433,254 | |
| Bonds (Georgia Pwr. Co. Plant Vogtle Proj.): | |||
Series 1994, 2.15%, tender 6/13/24 (b) | 1,140,000 | 1,126,476 | |
Series 2013 1st, 2.925%, tender 3/12/24 (b) | 330,000 | 328,915 | |
| DeKalb Private Hosp. Auth. Rev. Series 2019 B, 5% 7/1/27 | 210,000 | 227,326 | |
| Fulton County Dev. Auth. Rev. Series 2019, 4% 6/15/49 | 40,000 | 38,940 | |
| Gainesville & Hall County Hosp. Auth. Rev. Series 2020 A, 3% 2/15/47 | 1,895,000 | 1,512,338 | |
| Georgia Muni. Elec. Auth. Pwr. Rev.: | |||
| Series 2019 A: | |||
4% 1/1/49 | 245,000 | 235,740 | |
5% 1/1/26 | 165,000 | 171,821 | |
5% 1/1/30 | 55,000 | 60,137 | |
5% 1/1/34 | 375,000 | 406,767 | |
| Series 2021 A: | |||
4% 1/1/35 (Assured Guaranty Muni. Corp. Insured) | 400,000 | 418,490 | |
4% 1/1/36 (Assured Guaranty Muni. Corp. Insured) | 410,000 | 429,501 | |
4% 1/1/37 (Assured Guaranty Muni. Corp. Insured) | 470,000 | 489,547 | |
4% 1/1/40 (Assured Guaranty Muni. Corp. Insured) | 385,000 | 392,865 | |
4% 1/1/41 | 480,000 | 481,590 | |
5% 1/1/25 (Assured Guaranty Muni. Corp. Insured) | 200,000 | 203,699 | |
5% 1/1/26 (Assured Guaranty Muni. Corp. Insured) | 425,000 | 442,150 | |
5% 1/1/28 (Assured Guaranty Muni. Corp. Insured) | 400,000 | 434,311 | |
5% 1/1/31 (Assured Guaranty Muni. Corp. Insured) | 360,000 | 402,478 | |
5% 1/1/32 (Assured Guaranty Muni. Corp. Insured) | 330,000 | 368,257 | |
5% 1/1/32 (Assured Guaranty Muni. Corp. Insured) | 280,000 | 312,461 | |
| Georgia Road & Thruway Auth. Rev. Series 2020, 5% 6/1/31 | 1,000,000 | 1,149,049 | |
| Glynn-Brunswick Memorial Hosp. Auth. Rev. (Southeast Georgia Health Sys. Proj.) Series 2017: | |||
| 4% 8/1/43 | 5,000 | 4,683 | |
| 5% 8/1/39 | 5,000 | 5,046 | |
| 5% 8/1/43 | 5,000 | 5,069 | |
| Hosp. Auth. of Savannah Auth. Rev. Series 2019 A: | |||
| 4% 7/1/36 | 195,000 | 198,686 | |
| 4% 7/1/43 | 205,000 | 203,433 | |
| Main Street Natural Gas, Inc. Bonds: | |||
| Series 2021 A, 4%, tender 9/1/27 (b) | 12,000,000 | 12,070,415 | |
| Series 2022 E, 4%, tender 12/1/29 (b) | 3,595,000 | 3,622,128 | |
| Series 2023 C, 5%, tender 9/1/30 (b) | 1,000,000 | 1,069,807 | |
| Series 2023 D, 5%, tender 12/1/30 (b) | 3,940,000 | 4,190,422 | |
| Monroe County Dev. Auth. Poll. Cont. Rev. (Georgia Pwr. Co. Plant Scherer Proj.) Series 1995, 2.25% 7/1/25 | 200,000 | 192,785 | |
| Private Colleges & Univs. Auth. Rev.: | |||
| (The Savannah College of Art & Design Projs.) Series 2021: | |||
4% 4/1/39 | 1,365,000 | 1,393,772 | |
5% 4/1/24 | 675,000 | 677,933 | |
5% 4/1/29 | 500,000 | 553,286 | |
5% 4/1/36 | 135,000 | 151,261 | |
| Series 2020 B: | |||
5% 9/1/25 | 180,000 | 187,100 | |
5% 9/1/34 | 1,000,000 | 1,155,404 | |
| Series A, 5% 6/1/24 | 130,000 | 130,863 | |
TOTAL GEORGIA | 36,656,963 | ||
| Hawaii - 1.3% | |||
| Hawaii Arpts. Sys. Rev.: | |||
| Series 2018 A: | |||
5% 7/1/33 (c) | 350,000 | 374,716 | |
5% 7/1/48 (c) | 2,800,000 | 2,876,427 | |
| Series 2022 A, 5% 7/1/42 (c) | 1,245,000 | 1,342,815 | |
| Series 2022 B, 5% 7/1/24 (c) | 3,350,000 | 3,373,374 | |
| Hawaii Gen. Oblig. Series 2020 A, 4% 7/1/36 (c) | 40,000 | 41,170 | |
| Honolulu City & County Gen. Oblig.: | |||
| (Honolulu Rail Transit Proj.) Series 2020 B, 5% 3/1/29 | 1,000,000 | 1,129,121 | |
| Series 2017 A, 5% 9/1/33 | 5,000 | 5,416 | |
TOTAL HAWAII | 9,143,039 | ||
| Idaho - 0.1% | |||
| Idaho Hsg. & Fin. Assoc. Single Family Mtg.: | |||
| Series 2019 A, 4% 1/1/50 | 15,000 | 14,987 | |
| Series 2021 A, 5% 7/15/31 | 610,000 | 706,254 | |
TOTAL IDAHO | 721,241 | ||
| Illinois - 12.0% | |||
| Champaign County Cmnty. Unit Series 2019, 4% 6/1/26 | 15,000 | 15,410 | |
| Chicago Board of Ed.: | |||
| Series 2012 A, 5% 12/1/42 | 830,000 | 819,402 | |
| Series 2018 A: | |||
5% 12/1/29 | 350,000 | 362,768 | |
5% 12/1/30 | 160,000 | 165,263 | |
5% 12/1/31 | 150,000 | 154,385 | |
| Series 2018 C, 5% 12/1/46 | 3,250,000 | 3,232,305 | |
| Series 2019 A: | |||
5% 12/1/29 | 125,000 | 131,946 | |
5% 12/1/30 | 405,000 | 423,525 | |
5% 12/1/30 | 100,000 | 104,574 | |
| Series 2022 B: | |||
4% 12/1/35 | 600,000 | 600,115 | |
4% 12/1/36 | 1,005,000 | 993,679 | |
| Chicago Gen. Oblig.: | |||
| Series 2015 C, 5% 1/1/27 | 215,000 | 219,935 | |
| Series 2020 A: | |||
5% 1/1/27 | 400,000 | 418,772 | |
5% 1/1/30 | 615,000 | 667,858 | |
| Series 2021 A, 5% 1/1/32 | 7,725,000 | 8,449,486 | |
| Series 2021 B, 4% 1/1/32 | 375,000 | 380,467 | |
| Series 2023 A: | |||
5% 1/1/29 | 1,000,000 | 1,073,823 | |
5% 1/1/33 | 895,000 | 991,191 | |
| Chicago Midway Arpt. Rev.: | |||
| Series 2013 A, 5.5% 1/1/29 (c) | 200,000 | 200,288 | |
| Series 2014 B: | |||
5% 1/1/26 | 100,000 | 100,108 | |
5% 1/1/28 | 270,000 | 270,292 | |
| Series 2016 A, 4% 1/1/33 (c) | 305,000 | 307,680 | |
| Series 2016 B, 4% 1/1/35 | 200,000 | 202,651 | |
| Chicago O'Hare Int'l. Arpt. Rev.: | |||
| Series 2012 B, 4% 1/1/29 (c) | 400,000 | 400,095 | |
| Series 2017 B, 5% 1/1/37 | 50,000 | 52,783 | |
| Series 2018 A, 5% 1/1/48 (c) | 90,000 | 92,743 | |
| Series 2022 C, 5% 1/1/40 (c) | 1,850,000 | 1,998,131 | |
| Series 2023, 5% 1/1/38 (Build America Mutual Assurance Insured) | 1,000,000 | 1,109,958 | |
| Chicago O'Hare Int'l. Arpt. Spl. Facilities Rev. Series 2018: | |||
| 5% 7/1/38 (c) | 50,000 | 51,436 | |
| 5% 7/1/48 (c) | 600,000 | 604,674 | |
| Cook County Gen. Oblig.: | |||
| Series 2016 A, 5% 11/15/31 | 500,000 | 521,171 | |
| Series 2021 A: | |||
5% 11/15/24 | 50,000 | 50,839 | |
5% 11/15/33 | 425,000 | 477,434 | |
| Series 2021 B: | |||
4% 11/15/25 | 180,000 | 183,808 | |
4% 11/15/26 | 90,000 | 93,331 | |
4% 11/15/27 | 90,000 | 94,743 | |
4% 11/15/28 | 45,000 | 47,179 | |
| DuPage & Cook Counties Cmnty. Unit School District #205 Series 2022, 4% 9/15/42 | 2,100,000 | 2,124,367 | |
| Illinois Fin. Auth.: | |||
| Bonds Series 2020 B, 5%, tender 11/15/24 (b) | 400,000 | 401,402 | |
| Series 2020 A: | |||
3% 5/15/50 | 1,570,000 | 1,137,690 | |
3% 5/15/50 (Build America Mutual Assurance Insured) | 710,000 | 560,080 | |
3.25% 8/15/49 | 285,000 | 225,300 | |
4% 5/15/50 | 1,000,000 | 926,968 | |
| Series 2021 A, 4% 8/15/37 | 2,155,000 | 2,229,921 | |
| Series 2022 A: | |||
5% 10/1/29 | 350,000 | 371,427 | |
5% 10/1/30 | 230,000 | 245,677 | |
5% 10/1/31 | 215,000 | 231,014 | |
| Illinois Fin. Auth. Academic Facilities: | |||
| (Provident Group UIUC Properties LLC Univ. of Illinois at Urbana-Champaign Proj.) Series 2019 A, 5% 10/1/25 | 200,000 | 206,115 | |
| (Provident Group UIUC Properties LLC Univ. of Illinois at Urbana-Champaign Proj.) Series 2019 A: | |||
5% 10/1/26 | 200,000 | 210,229 | |
5% 10/1/31 | 200,000 | 221,131 | |
5% 10/1/38 | 200,000 | 212,291 | |
| Illinois Fin. Auth. Health Svcs. Facility Lease Rev. (Provident Group - UIC Surgery Ctr. LLC - Univ. of Illinois Health Svcs. Facility Proj.) Series 2020, 4% 10/1/55 | 400,000 | 350,790 | |
| Illinois Fin. Auth. Rev.: | |||
| (Bradley Univ. Proj.) Series 2017 C: | |||
5% 8/1/24 | 45,000 | 45,231 | |
5% 8/1/30 | 615,000 | 647,863 | |
| (Depaul Univ., IL Proj.): | |||
Series 2016 A, 5% 10/1/28 | 10,000 | 10,557 | |
Series 2016, 5% 10/1/29 | 30,000 | 31,639 | |
| (OSF Healthcare Sys.) Series 2018 A: | |||
4.125% 5/15/47 | 750,000 | 738,282 | |
5% 5/15/43 | 790,000 | 824,891 | |
| (Presence Health Proj.) Series 2016 C, 5% 2/15/36 | 15,000 | 15,657 | |
| Series 2015 A, 5% 11/15/25 | 150,000 | 154,170 | |
| Series 2015 C: | |||
4.125% 8/15/37 | 60,000 | 59,268 | |
5% 8/15/26 | 35,000 | 35,912 | |
5% 8/15/44 | 1,130,000 | 1,145,483 | |
| Series 2016 A: | |||
5% 8/15/24 (Escrowed to Maturity) | 65,000 | 65,699 | |
5% 7/1/33 (Pre-Refunded to 7/1/26 @ 100) | 10,000 | 10,572 | |
5% 7/1/36 (Pre-Refunded to 7/1/26 @ 100) | 45,000 | 47,575 | |
| Series 2016 B, 5% 8/15/35 | 250,000 | 262,878 | |
| Series 2016 C: | |||
4% 2/15/41 | 35,000 | 34,632 | |
5% 2/15/34 | 50,000 | 52,604 | |
| Series 2016: | |||
5% 5/15/29 | 10,000 | 10,405 | |
5% 12/1/29 | 620,000 | 645,240 | |
5% 12/1/33 | 485,000 | 502,236 | |
5% 12/1/40 | 85,000 | 86,928 | |
5% 12/1/46 | 2,695,000 | 2,743,310 | |
| Series 2017 A, 5% 7/15/42 | 1,000,000 | 1,048,479 | |
| Series 2019: | |||
4% 9/1/35 | 60,000 | 52,941 | |
5% 9/1/36 | 295,000 | 283,995 | |
5% 9/1/38 | 100,000 | 93,951 | |
| Illinois Gen. Oblig.: | |||
| Series 2014: | |||
5% 2/1/25 | 520,000 | 520,504 | |
5% 5/1/28 | 50,000 | 50,246 | |
| Series 2016: | |||
5% 1/1/26 | 5,000 | 5,182 | |
5% 2/1/26 | 400,000 | 415,221 | |
5% 2/1/27 | 585,000 | 619,230 | |
5% 11/1/29 | 1,400,000 | 1,462,561 | |
| Series 2017 C, 5% 11/1/29 | 345,000 | 369,384 | |
| Series 2017 D, 5% 11/1/27 | 850,000 | 913,551 | |
| Series 2017, 4% 2/1/24 | 30,000 | 30,012 | |
| Series 2018 A: | |||
5% 10/1/24 | 25,000 | 25,320 | |
5% 10/1/28 | 1,500,000 | 1,634,831 | |
| Series 2018 B: | |||
5% 5/1/24 | 1,500,000 | 1,507,983 | |
5% 10/1/24 | 1,050,000 | 1,063,432 | |
| Series 2019 B: | |||
5% 9/1/24 | 105,000 | 106,181 | |
5% 9/1/25 | 20,000 | 20,601 | |
| Series 2020 C, 4% 10/1/37 | 1,815,000 | 1,841,718 | |
| Series 2021 A, 5% 3/1/32 | 450,000 | 505,123 | |
| Series 2022 A, 5% 3/1/32 | 650,000 | 739,421 | |
| Series 2022 B: | |||
5% 3/1/29 | 650,000 | 712,997 | |
5% 3/1/33 | 1,700,000 | 1,926,380 | |
| Series 2023 B: | |||
5% 5/1/35 | 1,915,000 | 2,153,988 | |
5.25% 5/1/41 | 670,000 | 741,831 | |
| Series 2023 D, 5% 7/1/29 | 1,615,000 | 1,780,074 | |
| Series May 2014, 5% 5/1/39 | 1,700,000 | 1,703,694 | |
| Illinois Hsg. Dev. Auth. Series 2021, 3% 4/1/51 | 640,000 | 620,266 | |
| Illinois Hsg. Dev. Auth. Rev. Series 2019 D, 2.7% 10/1/34 | 115,000 | 106,428 | |
| Illinois Sales Tax Rev. Series 2013, 5% 6/15/24 | 285,000 | 285,266 | |
| Illinois Toll Hwy. Auth. Toll Hwy. Rev.: | |||
| Series 2019 A, 5% 1/1/44 | 105,000 | 113,630 | |
| Series A, 5% 1/1/40 | 220,000 | 244,523 | |
| Kendall, Kane & Will Counties Cmnty. Unit School District #308: | |||
| Series 2008, 0% 2/1/25 (Assured Guaranty Muni. Corp. Insured) | 315,000 | 303,757 | |
| Series 2015, 4% 2/1/30 | 800,000 | 807,127 | |
| Metropolitan Pier & Exposition: | |||
| (McCormick Place Expansion Proj.): | |||
Series 2002 A, 0% 6/15/36 (Nat'l. Pub. Fin. Guarantee Corp. Insured) | 2,280,000 | 1,466,250 | |
Series 2010 B1: | |||
0% 6/15/43 (Assured Guaranty Muni. Corp. Insured) | 610,000 | 272,856 | |
0% 6/15/44 (Assured Guaranty Muni. Corp. Insured) | 1,680,000 | 710,649 | |
0% 6/15/47 (Assured Guaranty Muni. Corp. Insured) | 155,000 | 54,972 | |
| Series 1994 A, 0% 6/15/25 | 25,000 | 23,747 | |
| Series 1994, 0% 6/15/28 (Nat'l. Pub. Fin. Guarantee Corp. Insured) | 1,200,000 | 1,037,987 | |
| Series 2002 A: | |||
0% 6/15/32 (Nat'l. Pub. Fin. Guarantee Corp. Insured) | 30,000 | 22,648 | |
0% 6/15/35 (Nat'l. Pub. Fin. Guarantee Corp. Insured) | 240,000 | 162,278 | |
| Series 2017 A, 5% 6/15/57 | 875,000 | 892,732 | |
| Series 2020 A: | |||
4% 6/15/50 | 1,170,000 | 1,110,176 | |
5% 6/15/50 | 1,730,000 | 1,787,775 | |
| Series 2022 A: | |||
0% 12/15/35 | 420,000 | 274,530 | |
0% 6/15/40 | 1,725,000 | 869,547 | |
4% 12/15/47 | 5,000,000 | 4,820,745 | |
| Northern Illinois Univ. Revs. Series 2020 B, 4% 4/1/40 (Build America Mutual Assurance Insured) | 455,000 | 457,396 | |
| Sales Tax Securitization Corp. Series 2023 C, 5% 1/1/31 | 1,000,000 | 1,132,418 | |
| Schaumburg Village Gen. Oblig. Series 2023, 4% 12/1/30 | 680,000 | 722,842 | |
| Univ. of Illinois Board of Trustees Ctfs. of Prtn. (Univ. of Illinois Rev. Proj.) Series 2014 A, 5% 10/1/26 | 15,000 | 15,183 | |
| Univ. of Illinois Rev. Series 2018 A, 5% 4/1/30 | 100,000 | 109,070 | |
TOTAL ILLINOIS | 84,643,311 | ||
| Indiana - 0.9% | |||
| Indiana Fin. Auth. Envir. Facilities Rev. Bonds (Indianapolis Pwr. & Lt. Co. Proj.): | |||
| Series 2020 A, 0.75%, tender 4/1/26 (b) | 50,000 | 45,863 | |
| Series 2020 B, 0.95%, tender 4/1/26 (b)(c) | 100,000 | 92,361 | |
| Indiana Fin. Auth. Health Sys. Rev. Series 2016 A, 4% 11/1/51 | 1,885,000 | 1,699,507 | |
| Indiana Fin. Auth. Rev. Series 2016, 5% 9/1/30 | 50,000 | 52,899 | |
| Indiana Fin. Auth. Wastewtr. Util. Rev. Series 2021 2, 5% 10/1/41 | 1,000,000 | 1,118,165 | |
| Indiana Hsg. & Cmnty. Dev. Auth.: | |||
| Series 2021 B: | |||
3% 7/1/50 | 105,000 | 102,262 | |
5% 7/1/25 | 690,000 | 709,614 | |
| Series 2021 C1, 3% 1/1/52 | 1,130,000 | 1,089,884 | |
| Series A, 3.75% 1/1/49 | 290,000 | 288,278 | |
| Indianapolis Local Pub. Impt. (Indianapolis Arpt. Auth. Proj.) Series 2014 D: | |||
| 5% 1/1/28 (c) | 75,000 | 75,284 | |
| 5% 1/1/30 (c) | 85,000 | 85,321 | |
| Saint Joseph County Econ. Dev. Auth. Rev. (St. Mary's College Proj.): | |||
| Series 2019, 4% 4/1/46 | 215,000 | 200,715 | |
| Series 2020, 5% 4/1/30 | 105,000 | 115,105 | |
| Whiting Envir. Facilities Rev. Bonds (BP Products North America, Inc. Proj.) Series 2019 A, 5%, tender 6/5/26 (b)(c) | 695,000 | 706,854 | |
TOTAL INDIANA | 6,382,112 | ||
| Iowa - 0.5% | |||
| Iowa Fin. Auth. Rev.: | |||
| Series 2019 A1, 4% 5/15/55 | 545,000 | 328,175 | |
| Series A: | |||
5% 5/15/43 | 35,000 | 28,173 | |
5% 5/15/48 | 420,000 | 320,411 | |
| Iowa Student Ln. Liquidity Corp. Student Ln. Rev. Series 2019 B, 5% 12/1/27 (c) | 155,000 | 163,740 | |
| Tobacco Settlement Auth. Tobacco Settlement Rev.: | |||
| Series 2021 A2: | |||
4% 6/1/40 | 425,000 | 422,186 | |
5% 6/1/27 | 250,000 | 263,251 | |
5% 6/1/28 | 500,000 | 534,576 | |
5% 6/1/29 | 600,000 | 649,473 | |
5% 6/1/30 | 700,000 | 766,312 | |
| Series 2021 B1, 4% 6/1/49 | 260,000 | 261,391 | |
TOTAL IOWA | 3,737,688 | ||
| Kentucky - 1.4% | |||
| Ashland Med. Ctr. Rev.: | |||
| (Ashland Hosp. Corp. D/B/A Kings Daughters Med. Ctr. Proj.) Series 2016 A, 4% 2/1/36 | 300,000 | 300,743 | |
| Series 2019: | |||
3% 2/1/40 (Assured Guaranty Muni. Corp. Insured) | 370,000 | 310,437 | |
4% 2/1/37 | 175,000 | 175,439 | |
5% 2/1/25 | 280,000 | 283,653 | |
| Carroll County Poll. Ctlr Rev. Bonds (Kentucky Utils. Co. Proj.) Series 2016 A, 1.55%, tender 9/1/26 (b) | 1,000,000 | 929,245 | |
| Kentucky Econ. Dev. Fin. Auth. Series 2019 A2, 5% 8/1/30 | 345,000 | 377,629 | |
| Kentucky State Property & Buildings Commission Rev.: | |||
| (Proj. No. 118) Series 2018, 5% 4/1/25 | 175,000 | 179,586 | |
| (Proj. No. 119) Series 2018: | |||
5% 5/1/26 | 80,000 | 84,113 | |
5% 5/1/29 | 85,000 | 92,954 | |
5% 5/1/32 | 20,000 | 21,866 | |
5% 5/1/33 | 15,000 | 16,388 | |
5% 5/1/34 | 20,000 | 21,785 | |
5% 5/1/35 | 10,000 | 10,816 | |
5% 5/1/36 | 10,000 | 10,789 | |
5% 5/1/38 | 1,000,000 | 1,068,703 | |
| Series A: | |||
4% 11/1/35 | 600,000 | 616,614 | |
5% 11/1/29 | 150,000 | 165,467 | |
| Kentucky, Inc. Pub. Energy: | |||
| Bonds Series A, 4%, tender 6/1/26 (b) | 1,505,000 | 1,496,883 | |
| Series 2024 A1: | |||
5% 2/1/30 | 755,000 | 793,914 | |
5% 2/1/31 | 805,000 | 849,281 | |
5% 2/1/32 | 600,000 | 643,818 | |
| Louisville & Jefferson County: | |||
| Bonds: | |||
Series 2020 C, 5%, tender 10/1/26 (b) | 70,000 | 73,129 | |
Series 2020 D, 5%, tender 10/1/29 (b) | 85,000 | 92,490 | |
| Series 2016 A, 5% 10/1/32 | 70,000 | 72,777 | |
| Series 2020 A: | |||
3% 10/1/43 | 1,230,000 | 964,047 | |
4% 10/1/40 | 195,000 | 193,328 | |
| Louisville Reg'l. Arpt. Auth. Sys. Rev. Series 2014 A, 5% 7/1/24 (c) | 65,000 | 65,463 | |
TOTAL KENTUCKY | 9,911,357 | ||
| Louisiana - 0.4% | |||
| Louisiana Hsg. Corp. Single Fami (Home Ownership Prog.) Series 2023 C, 5.75% 12/1/53 | 235,000 | 258,457 | |
| Louisiana Pub. Facilities Auth. Rev.: | |||
| (Ochsner Clinic Foundation Proj.): | |||
Series 2015, 5% 5/15/47 | 195,000 | 196,988 | |
Series 2017, 5% 5/15/27 | 115,000 | 121,746 | |
| (Tulane Univ. of Louisiana Proj.): | |||
Series 2016 A, 5% 12/15/28 | 15,000 | 15,919 | |
Series 2017 A, 5% 12/15/32 | 165,000 | 178,173 | |
| Series 2018 E, 5% 7/1/38 | 100,000 | 106,583 | |
| New Orleans Aviation Board Rev. (North Term. Proj.) Series 2017 B, 5% 1/1/48 (c) | 2,000,000 | 2,021,292 | |
TOTAL LOUISIANA | 2,899,158 | ||
| Maine - 0.4% | |||
| Auburn (Edward Little High School Proj.) Series 2021, 2.375% 11/1/40 | 2,300,000 | 1,738,533 | |
| Maine Health & Higher Edl. Facilities Auth. Rev.: | |||
| Series 2014, 5% 7/1/30 (Pre-Refunded to 7/1/24 @ 100) | 585,000 | 590,603 | |
| Series 2016 A: | |||
4% 7/1/41 | 85,000 | 78,275 | |
4% 7/1/46 | 85,000 | 73,588 | |
5% 7/1/41 | 25,000 | 25,048 | |
5% 7/1/46 | 155,000 | 145,391 | |
| Series 2017 B, 5% 7/1/29 | 10,000 | 10,641 | |
TOTAL MAINE | 2,662,079 | ||
| Maryland - 1.7% | |||
| Hsg. Opportunities Commission of Montgomery County Series 2021 C, 0.8% 7/1/25 | 100,000 | 94,549 | |
| Maryland Cmnty. Dev. Admin Dept. Hsg. & Cmnty. Dev.: | |||
| Series 2019 B, 4% 9/1/49 | 55,000 | 54,910 | |
| Series 2019 C: | |||
3.5% 3/1/50 | 515,000 | 508,481 | |
5% 9/1/28 | 115,000 | 125,635 | |
| Series 2021 C, 0.6% 7/1/24 | 600,000 | 591,592 | |
| Maryland Econ. Dev. Corp. Air Cargo Series 2019: | |||
| 5% 7/1/25 (c) | 510,000 | 517,179 | |
| 5% 7/1/26 (c) | 230,000 | 235,764 | |
| Maryland Gen. Oblig. Series 2022 2C, 4% 3/1/28 | 1,000,000 | 1,067,855 | |
| Maryland Health & Higher Edl. Series 2021 A: | |||
| 2.5% 7/1/51 | 1,210,000 | 800,736 | |
| 3% 7/1/46 | 1,265,000 | 985,236 | |
| 3% 7/1/51 | 915,000 | 667,685 | |
| 4% 6/1/55 | 190,000 | 162,335 | |
| 5% 6/1/29 | 120,000 | 128,734 | |
| Maryland Stadium Auth. Built to Learn Rev. Series 2021, 4% 6/1/46 | 180,000 | 180,995 | |
| Maryland Trans. Auth. Trans. Facility Projs. Rev. Series 2020, 5% 7/1/40 | 2,000,000 | 2,212,332 | |
| Prince Georges County Ctfs. of Prtn. Series 2021: | |||
| 5% 10/1/25 | 1,610,000 | 1,670,907 | |
| 5% 10/1/26 | 1,650,000 | 1,754,105 | |
TOTAL MARYLAND | 11,759,030 | ||
| Massachusetts - 3.4% | |||
| Massachusetts Bay Trans. Auth. Sales Tax Rev. Series 2021 A1, 5% 7/1/35 | 820,000 | 957,439 | |
| Massachusetts Commonwealth Trans. Fund Rev.: | |||
| (Rail Enhancement Prog.) Series 2021 B: | |||
5% 6/1/26 | 350,000 | 370,850 | |
5% 6/1/27 | 500,000 | 543,945 | |
5% 6/1/41 | 1,250,000 | 1,335,614 | |
| Series 2021 A, 5% 6/1/51 | 1,860,000 | 1,997,315 | |
| Massachusetts Dev. Fin. Agcy. Rev.: | |||
| (Lawrence Gen. Hosp.) Series 2014 A, 5.25% 7/1/34 | 40,000 | 36,552 | |
| Series 2016 A, 5% 1/1/31 | 40,000 | 41,501 | |
| Series 2016 I: | |||
5% 7/1/30 | 195,000 | 201,884 | |
5% 7/1/41 | 140,000 | 141,774 | |
| Series 2017 A: | |||
5% 1/1/36 | 325,000 | 338,914 | |
5% 1/1/37 | 1,050,000 | 1,090,322 | |
| Series 2017, 5% 7/1/36 | 275,000 | 282,356 | |
| Series 2018, 5% 1/1/43 | 180,000 | 183,195 | |
| Series 2019 K: | |||
5% 7/1/25 | 125,000 | 128,350 | |
5% 7/1/26 | 165,000 | 173,096 | |
5% 7/1/27 | 195,000 | 208,725 | |
| Series 2019: | |||
5% 7/1/27 | 440,000 | 457,849 | |
5% 9/1/59 | 235,000 | 248,197 | |
| Series 2020 A, 4% 7/1/45 | 480,000 | 423,876 | |
| Series 2021 V, 5% 7/1/55 | 1,245,000 | 1,516,872 | |
| Series 2021: | |||
4% 7/1/26 | 240,000 | 237,476 | |
4% 7/1/27 | 255,000 | 251,972 | |
4% 7/1/28 | 325,000 | 320,270 | |
4% 7/1/29 | 340,000 | 333,750 | |
4% 7/1/30 | 355,000 | 346,661 | |
4% 7/1/31 | 370,000 | 359,716 | |
| Series M: | |||
4% 10/1/50 | 490,000 | 415,165 | |
5% 10/1/45 | 370,000 | 373,369 | |
| Massachusetts Edl. Fing. Auth. Rev. Series 2016, 5% 7/1/24 (c) | 210,000 | 211,486 | |
| Massachusetts Gen. Oblig.: | |||
| Series 2019 A, 5% 1/1/49 | 2,000,000 | 2,124,425 | |
| Series 2019 C, 5% 5/1/49 | 345,000 | 367,747 | |
| Series 2022 C, 5.25% 10/1/47 | 2,000,000 | 2,263,253 | |
| Series E, 5% 11/1/50 | 1,640,000 | 1,772,005 | |
| Massachusetts Hsg. Fin. Auth. Series 2021 223, 3% 6/1/47 | 605,000 | 589,121 | |
| Massachusetts Port Auth. Rev.: | |||
| Series 2019 A, 5% 7/1/40 (c) | 500,000 | 531,338 | |
| Series 2021 E: | |||
5% 7/1/41 (c) | 1,000,000 | 1,078,477 | |
5% 7/1/46 (c) | 290,000 | 306,638 | |
5% 7/1/51 (c) | 1,000,000 | 1,047,996 | |
| Massachusetts Port Auth. Spl. Facilities Rev. (Bosfuel Proj.) Series 2019 A, 5% 7/1/49 (c) | 230,000 | 237,272 | |
TOTAL MASSACHUSETTS | 23,846,763 | ||
| Michigan - 1.3% | |||
| Flint Hosp. Bldg. Auth. Rev. Series 2020: | |||
| 4% 7/1/41 | 140,000 | 126,267 | |
| 5% 7/1/25 | 60,000 | 60,541 | |
| 5% 7/1/27 | 265,000 | 273,050 | |
| Grand Rapids Pub. Schools Series 2019, 5% 11/1/26 (Assured Guaranty Muni. Corp. Insured) | 180,000 | 190,703 | |
| Grand Traverse County Hosp. Fin. Auth. Series 2021, 3% 7/1/51 | 395,000 | 279,018 | |
| Great Lakes Wtr. Auth. Sew Disp. Sys. Series 2018 A, 5% 7/1/48 | 200,000 | 208,507 | |
| Great Lakes Wtr. Auth. Wtr. Supply Sys. Rev. Series 2016 D, 5% 7/1/27 | 100,000 | 105,144 | |
| Kalamazoo Hosp. Fin. Auth. Hosp. Facilities Rev. Series 2016, 4% 5/15/36 | 185,000 | 186,820 | |
| Michigan Fin. Auth. Rev.: | |||
| (Charter County of Wayne Criminal Justice Ctr. Proj.) Series 2018, 5% 11/1/43 | 50,000 | 53,389 | |
| (Henry Ford Health Sys. Proj.) Series 2016, 5% 11/15/25 | 570,000 | 587,830 | |
| Series 2016, 5% 11/15/26 | 160,000 | 168,363 | |
| Series 2019 A: | |||
3% 12/1/49 | 555,000 | 436,706 | |
5% 11/15/48 | 55,000 | 57,134 | |
| Series 2020 A, 4% 6/1/49 | 135,000 | 124,645 | |
| Series 2020, 5% 6/1/40 | 1,105,000 | 1,164,698 | |
| Series 2021: | |||
4% 9/1/31 | 665,000 | 698,319 | |
5% 9/1/32 | 690,000 | 771,438 | |
5% 9/1/33 | 650,000 | 722,424 | |
5% 9/1/36 | 505,000 | 552,107 | |
| Michigan Hosp. Fin. Auth. Rev. Series 2008 C, 5% 12/1/32 | 10,000 | 10,783 | |
| Michigan Hsg. Dev. Auth. Single Family Mtg. Rev. Series A, 3.5% 12/1/50 | 570,000 | 562,633 | |
| Michigan State Hsg. Dev. Auth. Series 2021 A, 2.45% 10/1/46 | 555,000 | 391,207 | |
| Michigan Strategic Fund Ltd. Oblig. Rev. Bonds (Consumer Energy Co. Proj.) Series 2019, 1.8%, tender 10/1/24 (b)(c) | 175,000 | 172,272 | |
| Univ. of Michigan Rev. Series 2020 A, 5% 4/1/50 | 1,000,000 | 1,082,159 | |
| Wayne County Arpt. Auth. Rev.: | |||
| Series 2017 A, 5% 12/1/29 | 45,000 | 48,550 | |
| Series 2017 B, 5% 12/1/42 (c) | 150,000 | 154,859 | |
| Series 2018 D, 5% 12/1/29 (c) | 85,000 | 91,686 | |
TOTAL MICHIGAN | 9,281,252 | ||
| Minnesota - 0.7% | |||
| Duluth Econ. Dev. Auth. Health Care Facilities Rev. Series 2018 A: | |||
| 5% 2/15/48 | 220,000 | 223,962 | |
| 5% 2/15/58 | 270,000 | 273,345 | |
| Maple Grove Health Care Sys. Rev. Series 2015, 5% 9/1/26 | 60,000 | 61,539 | |
| Minneapolis & Saint Paul Metropolitan Arpts. Commission Arpt. Rev. Series 2022 B: | |||
| 5% 1/1/34 (c) | 210,000 | 236,423 | |
| 5% 1/1/37 (c) | 520,000 | 576,230 | |
| Minnesota Higher Ed. Facilities Auth. Rev.: | |||
| Series 2018 A: | |||
5% 10/1/30 | 500,000 | 538,111 | |
5% 10/1/45 | 30,000 | 30,583 | |
| Series 2023, 4.25% 10/1/38 | 300,000 | 303,316 | |
| Minnesota Hsg. Fin. Agcy.: | |||
| Series 2023 F, 5.75% 7/1/53 | 150,000 | 161,969 | |
| Series B, 4% 8/1/39 | 2,050,000 | 2,075,568 | |
| Shakopee Sr. Hsg. Rev. Bonds Series 2018, 5.85%, tender 11/1/25 (b)(d) | 255,000 | 247,401 | |
TOTAL MINNESOTA | 4,728,447 | ||
| Mississippi - 0.4% | |||
| Mississippi Bus. finance Corp. Exempt Facilities Rev. Bonds (Enviva, Inc. Proj.) Series 2022, 7.75%, tender 7/15/32 (b)(c) | 2,200,000 | 1,378,340 | |
| Mississippi Home Corp. Series 2021 B: | |||
| 3% 6/1/51 | 275,000 | 268,376 | |
| 5% 6/1/25 | 750,000 | 770,386 | |
| Mississippi Hosp. Equip. & Facilities Auth.: | |||
| Bonds Series II, 5%, tender 3/1/27 (b) | 80,000 | 84,124 | |
| Series I, 5% 10/1/24 | 70,000 | 70,817 | |
TOTAL MISSISSIPPI | 2,572,043 | ||
| Missouri - 0.7% | |||
| Cape Girardeau County Indl. Dev. Auth.: | |||
| (Southeast Hosp. Proj.) Series 2017 A, 5% 3/1/36 | 105,000 | 110,173 | |
| Series 2021, 4% 3/1/41 | 250,000 | 250,958 | |
| Kansas City Wtr. Rev. Series 2020 A, 4% 12/1/44 | 1,200,000 | 1,216,792 | |
| Missouri Health & Edl. Facilities Rev. Series 2018 A, 5% 11/15/43 | 1,000,000 | 1,040,712 | |
| Missouri Hsg. Dev. Commission Single Family Mtg. Rev.: | |||
| Series 2019, 4% 5/1/50 | 15,000 | 15,000 | |
| Series 2021 A, 3% 5/1/52 | 455,000 | 441,277 | |
| Saint Louis Arpt. Rev. Series A, 5.25% 7/1/26 (Assured Guaranty Muni. Corp. Insured) | 570,000 | 606,605 | |
| Saint Louis County Indl. Dev. Auth. Sr. Living Facilities Rev. Series 2018 A: | |||
| 5.125% 9/1/48 | 25,000 | 22,201 | |
| 5.25% 9/1/53 | 1,240,000 | 1,096,548 | |
TOTAL MISSOURI | 4,800,266 | ||
| Montana - 0.1% | |||
| Montana Board Hsg. Single Family: | |||
| Series 2017 A, 4% 12/1/47 (c) | 5,000 | 4,986 | |
| Series 2019 B, 4% 6/1/50 | 10,000 | 10,018 | |
| Montana Facility Fin. Auth. Series 2021 A, 3% 6/1/50 | 575,000 | 416,485 | |
| Montana Facility Fin. Auth. Rev. (Benefis Health Sys. Proj.) Series 2016, 5% 2/15/32 | 30,000 | 31,321 | |
TOTAL MONTANA | 462,810 | ||
| Nebraska - 1.3% | |||
| Central Plains Energy Proj. Rev. Bonds: | |||
| (Proj. No. 4) Series 2023 A1, 5%, tender 11/1/29 (b) | 2,290,000 | 2,427,547 | |
| Series 2019, 4%, tender 8/1/25 (b) | 725,000 | 728,985 | |
| Douglas County Neb Edl. Facilities Rev. (Creighton Univ. Projs.) Series 2021 A, 3% 7/1/51 | 260,000 | 187,403 | |
| Nebraska Invt. Fin. Auth. Single Family Hsg. Rev.: | |||
| Series 2019 B, 4% 9/1/49 (c) | 40,000 | 39,775 | |
| Series 2019 E, 3.75% 9/1/49 (c) | 60,000 | 59,424 | |
| Series 2020 A, 3.5% 9/1/50 | 700,000 | 691,874 | |
| Series 2022 B: | |||
5% 3/1/25 (c) | 1,090,000 | 1,108,213 | |
5% 9/1/25 (c) | 1,105,000 | 1,132,956 | |
5% 3/1/26 (c) | 1,100,000 | 1,138,099 | |
5% 9/1/26 (c) | 1,140,000 | 1,190,828 | |
5% 3/1/30 (c) | 400,000 | 432,847 | |
TOTAL NEBRASKA | 9,137,951 | ||
| Nevada - 0.3% | |||
| Clark County Arpt. Rev. Series 2014 A2, 5% 7/1/30 | 115,000 | 115,996 | |
| Nevada Hsg. Division Single Family Mtg. Rev.: | |||
| Series 2019 A, 4% 4/1/49 | 270,000 | 270,253 | |
| Series 2019 B, 4% 10/1/49 | 25,000 | 25,025 | |
| Series 2021 B, 3% 10/1/51 | 1,935,000 | 1,870,057 | |
| Tahoe-Douglas Visitors Auth. Series 2020, 5% 7/1/45 | 195,000 | 197,383 | |
TOTAL NEVADA | 2,478,714 | ||
| New Hampshire - 0.8% | |||
| Nat'l. Fin. Auth. Hosp. Rev. (St. Luke's Univ. Health Network Proj.) Series 2021 B: | |||
| 3% 8/15/51 (Assured Guaranty Muni. Corp. Insured) | 490,000 | 371,984 | |
| 5% 8/15/30 | 1,405,000 | 1,562,587 | |
| Nat'l. Finnance Auth.: | |||
| Series 2020 1, 4.125% 1/20/34 | 221,220 | 218,705 | |
| Series 2023 2A, 3.875% 1/20/38 | 1,617,621 | 1,566,107 | |
| New Hampshire Health & Ed. Facilities Auth.: | |||
| (Dartmouth-Hitchcock Oblgtd Grp Proj.) Series 2018 A: | |||
5% 8/1/26 | 105,000 | 109,530 | |
5% 8/1/37 | 100,000 | 104,670 | |
| Series 2023 B, 5% 11/1/43 (c) | 550,000 | 600,162 | |
| New Hampshire Nat'l. Fin. Auth. Series 2022 2, 4% 10/20/36 | 1,476,629 | 1,449,810 | |
TOTAL NEW HAMPSHIRE | 5,983,555 | ||
| New Jersey - 4.5% | |||
| New Jersey Econ. Dev. Auth.: | |||
| Series 2018 EEE: | |||
5% 6/15/43 | 800,000 | 843,153 | |
5% 6/15/43 (Pre-Refunded to 12/15/28 @ 100) | 470,000 | 530,390 | |
| Series 2023 RRR, 5% 3/1/25 | 1,890,000 | 1,934,991 | |
| Series A, 5% 11/1/40 | 360,000 | 387,680 | |
| Series QQQ: | |||
4% 6/15/46 | 610,000 | 603,682 | |
5% 6/15/27 | 35,000 | 37,673 | |
5% 6/15/28 | 40,000 | 43,989 | |
| New Jersey Econ. Dev. Auth. Rev.: | |||
| (Black Horse EHT Urban Renewal LLC Proj.) Series 2019 A, 5% 10/1/39 (d) | 100,000 | 65,905 | |
| (NJ Transit Corp. Projs.) Series A, 4% 11/1/27 | 370,000 | 384,597 | |
| Series 2014 PP, 4% 6/15/30 (Pre-Refunded to 6/15/24 @ 100) | 70,000 | 70,216 | |
| Series 2014 RR, 5% 6/15/32 (Pre-Refunded to 6/15/24 @ 100) | 60,000 | 60,451 | |
| Series 2014 UU, 5% 6/15/30 (Pre-Refunded to 6/15/24 @ 100) | 70,000 | 70,620 | |
| Series 2018 EEE, 5% 6/15/28 | 410,000 | 450,891 | |
| Series LLL: | |||
4% 6/15/44 | 315,000 | 315,404 | |
5% 6/15/44 | 180,000 | 191,252 | |
| Series MMM, 4% 6/15/35 | 90,000 | 93,449 | |
| Series PP, 5% 6/15/31 (Pre-Refunded to 6/15/24 @ 100) | 260,000 | 261,953 | |
| New Jersey Edl. Facility Series 2016 B, 4% 9/1/26 | 500,000 | 514,120 | |
| New Jersey Gen. Oblig. Series 2020 A, 5% 6/1/29 | 205,000 | 231,328 | |
| New Jersey Health Care Facilities Fing. Auth. Rev. Series 2016: | |||
| 4% 7/1/48 | 100,000 | 91,856 | |
| 5% 7/1/41 | 65,000 | 65,763 | |
| New Jersey Higher Ed. Student Assistance Auth. Student Ln. Rev.: | |||
| Series 2017 1A, 5% 12/1/26 (c) | 530,000 | 551,621 | |
| Series 2018 B: | |||
5% 12/1/25 (c) | 500,000 | 514,023 | |
5% 12/1/26 (c) | 485,000 | 504,786 | |
5% 12/1/27 (c) | 850,000 | 897,611 | |
| Series 2020: | |||
5% 12/1/24 (c) | 100,000 | 101,202 | |
5% 12/1/25 (c) | 235,000 | 241,591 | |
5% 12/1/25 (c) | 60,000 | 61,683 | |
5% 12/1/26 (c) | 205,000 | 213,363 | |
5% 12/1/27 (c) | 145,000 | 153,122 | |
5% 12/1/27 (c) | 40,000 | 42,241 | |
| Series 2023 B, 5% 12/1/30 (c) | 3,780,000 | 4,121,880 | |
| New Jersey Tobacco Settlement Fing. Corp.: | |||
| Series 2018 A, 5.25% 6/1/46 | 1,915,000 | 1,974,122 | |
| Series 2018 B, 5% 6/1/46 | 500,000 | 507,506 | |
| New Jersey Tpk. Auth. Tpk. Rev.: | |||
| Series 2015 E, 5% 1/1/34 | 190,000 | 193,539 | |
| Series D, 5% 1/1/28 | 170,000 | 179,313 | |
| New Jersey Trans. Trust Fund Auth.: | |||
| (Trans. Prog.) Series 2019 AA, 5.25% 6/15/43 | 505,000 | 539,063 | |
| Series 2006 C, 0% 12/15/33 (Assured Guaranty Muni. Corp. Insured) | 780,000 | 571,371 | |
| Series 2010 A, 0% 12/15/27 | 250,000 | 220,685 | |
| Series 2014 AA, 5% 6/15/25 | 100,000 | 100,936 | |
| Series 2016 A, 5% 6/15/27 | 160,000 | 168,013 | |
| Series 2018 A, 5% 12/15/32 | 100,000 | 110,243 | |
| Series 2019 BB, 4% 6/15/50 | 370,000 | 358,731 | |
| Series 2021 A: | |||
4% 6/15/34 | 140,000 | 148,007 | |
5% 6/15/32 | 295,000 | 340,304 | |
5% 6/15/33 | 1,000,000 | 1,153,963 | |
| Series 2022 A, 4% 6/15/39 | 720,000 | 737,448 | |
| Series 2022 AA: | |||
5% 6/15/33 | 250,000 | 293,302 | |
5% 6/15/36 | 1,460,000 | 1,680,099 | |
| Series 2022 BB: | |||
4% 6/15/46 | 1,385,000 | 1,372,669 | |
4% 6/15/50 | 1,000,000 | 969,543 | |
| Series AA: | |||
4% 6/15/38 | 185,000 | 189,871 | |
4% 6/15/45 | 1,535,000 | 1,531,135 | |
4% 6/15/50 | 1,980,000 | 1,919,696 | |
5% 6/15/40 | 210,000 | 231,350 | |
| Series BB: | |||
5% 6/15/33 | 1,000,000 | 1,100,817 | |
5% 6/15/50 | 70,000 | 72,949 | |
| South Jersey Trans. Auth. Trans. Sys. Rev. Series 2022 A: | |||
| 5% 11/1/36 | 450,000 | 510,676 | |
| 5% 11/1/40 | 150,000 | 162,824 | |
TOTAL NEW JERSEY | 31,990,661 | ||
| New Mexico - 0.3% | |||
| New Mexico Edl. Assistance Foundation Series 2021 1A: | |||
| 5% 9/1/26 (c) | 1,045,000 | 1,090,235 | |
| 5% 9/1/27 (c) | 350,000 | 370,649 | |
| 5% 9/1/29 (c) | 150,000 | 163,047 | |
| New Mexico Mtg. Fin. Auth.: | |||
| Series 2019 C, 4% 1/1/50 | 130,000 | 129,915 | |
| Series 2019 D, 3.75% 1/1/50 | 40,000 | 39,765 | |
| Santa Fe Retirement Fac. Series 2019 A: | |||
| 5% 5/15/34 | 10,000 | 9,585 | |
| 5% 5/15/39 | 5,000 | 4,535 | |
| 5% 5/15/44 | 5,000 | 4,374 | |
| 5% 5/15/49 | 15,000 | 12,496 | |
TOTAL NEW MEXICO | 1,824,601 | ||
| New York - 8.9% | |||
| Buffalo and Erie County Indl. Land Rev. (Catholic Health Sys., Inc. Proj.) Series 2015, 5% 7/1/25 | 400,000 | 390,039 | |
| Long Island Pwr. Auth. Elec. Sys. Rev. Bonds Series 2021 B, 1.5%, tender 9/1/26 (b) | 500,000 | 472,405 | |
| Monroe County Indl. Dev. Corp. (Univ. of Rochester Proj.) Series 2015 B, 4% 7/1/35 | 5,000 | 5,052 | |
| MTA Hudson Rail Yards Trust Oblig. Series 2016 A, 5% 11/15/56 | 100,000 | 99,996 | |
| New York City Edl. Construction Fund Series 2021 B: | |||
| 5% 4/1/46 | 675,000 | 726,594 | |
| 5% 4/1/52 | 520,000 | 553,892 | |
| New York City Gen. Oblig.: | |||
| Series 2018 A, 5% 8/1/24 | 100,000 | 101,245 | |
| Series 2024 A, 5% 8/1/41 | 1,135,000 | 1,307,682 | |
| Series E, 5% 8/1/30 | 1,025,000 | 1,081,926 | |
| New York City Hsg. Dev. Corp. Multifamily Hsg.: | |||
| Bonds: | |||
Series 2021 C2, 0.7%, tender 7/1/25 (b) | 270,000 | 256,076 | |
Series 2021 K2, 0.9%, tender 1/1/26 (b) | 2,075,000 | 1,933,314 | |
Series 2021, 0.6%, tender 7/1/25 (b) | 385,000 | 364,594 | |
| Series A 1 B, 5% 5/1/30 | 490,000 | 547,353 | |
| New York City Muni. Wtr. Fin. Auth. Wtr. & Swr. Sys. Rev. Series GG 1, 5% 6/15/48 | 1,350,000 | 1,454,263 | |
| New York City Transitional Fin. Auth.: | |||
| Series 2024 B, 5% 5/1/39 | 4,750,000 | 5,576,349 | |
| Series 2024, 5% 11/1/29 (e) | 4,000,000 | 4,580,402 | |
| New York City Trust Cultural Resources Rev. Series 2021, 5% 7/1/31 | 660,000 | 774,456 | |
| New York Dorm. Auth. Rev.: | |||
| Bonds Series 2019 B2, 5%, tender 5/1/24 (b) | 100,000 | 100,116 | |
| Series 2020 A: | |||
4% 9/1/37 | 350,000 | 350,115 | |
4% 9/1/39 | 700,000 | 682,633 | |
| Series 2022 A: | |||
5% 7/15/37 | 110,000 | 117,510 | |
5% 7/15/42 | 310,000 | 321,227 | |
| New York Dorm. Auth. Sales Tax Rev. Series 2023 A1, 5% 3/15/41 | 3,915,000 | 4,500,399 | |
| New York Metropolitan Trans. Auth. Rev.: | |||
| Series 2015 A1, 5% 11/15/29 | 120,000 | 122,410 | |
| Series 2016 A, 5% 11/15/31 | 100,000 | 103,530 | |
| Series 2016 C1, 5% 11/15/33 | 1,000,000 | 1,039,587 | |
| Series 2017 B, 5% 11/15/24 | 565,000 | 574,914 | |
| Series 2017 C1, 5% 11/15/30 | 325,000 | 352,388 | |
| Series 2017 D: | |||
5% 11/15/25 | 1,635,000 | 1,698,056 | |
5% 11/15/30 | 2,220,000 | 2,407,081 | |
| Series 2020 D: | |||
4% 11/15/46 | 2,050,000 | 1,984,369 | |
4% 11/15/47 | 150,000 | 144,499 | |
| New York State Dorm. Auth.: | |||
| Series 2019 D, 3% 2/15/49 | 1,065,000 | 854,624 | |
| Series 2021 A, 4% 3/15/38 | 1,000,000 | 1,051,422 | |
| Series 2021 E: | |||
3% 3/15/50 | 1,060,000 | 844,963 | |
4% 3/15/39 | 1,000,000 | 1,043,490 | |
| New York State Envir. Facilities Corp. Rev. (2010 Master Fing. Prog.) Series 2021 B: | |||
| 5% 2/15/28 | 160,000 | 177,517 | |
| 5% 8/15/28 | 235,000 | 263,976 | |
| 5% 2/15/29 | 100,000 | 113,636 | |
| 5% 8/15/29 | 200,000 | 229,752 | |
| 5% 2/15/30 | 340,000 | 394,510 | |
| 5% 8/15/30 | 400,000 | 468,854 | |
| New York State Hsg. Fin. Agcy. Rev.: | |||
| Bonds: | |||
Series 2021 J2, 1.1%, tender 5/1/27 (b) | 1,105,000 | 1,008,473 | |
Series 2021 K2, 1%, tender 11/1/26 (b) | 300,000 | 279,533 | |
Series 2023 C2, 3.8%, tender 5/1/29 (b) | 3,120,000 | 3,131,278 | |
| Series J, 0.75% 5/1/25 | 225,000 | 213,773 | |
| New York State Mtg. Agcy. Homeowner Mtg.: | |||
| Series 2021 232, 5% 10/1/25 (c) | 765,000 | 784,198 | |
| Series 2021 239, 3.25% 10/1/51 | 960,000 | 935,493 | |
| Series 221, 3.5% 10/1/32 (c) | 20,000 | 19,678 | |
| New York State Urban Dev. Corp.: | |||
| Series 2020 C, 4% 3/15/39 | 1,000,000 | 1,039,089 | |
| Series 2020 E: | |||
4% 3/15/44 | 1,675,000 | 1,695,804 | |
4% 3/15/45 | 1,350,000 | 1,363,696 | |
| New York State Urban Eev Corp. Series 2019 A, 5% 3/15/37 | 1,105,000 | 1,233,457 | |
| New York Trans. Dev. Corp.: | |||
| (Delta Air Lines, Inc. - Laguardia Arpt. Terminals C&D Redev. Proj.) Series 2020, 5% 10/1/40 (c) | 1,000,000 | 1,011,053 | |
| (Term. 4 John F. Kennedy Int'l. Arpt. Proj.) Series 2022: | |||
5% 12/1/32 (c) | 380,000 | 425,185 | |
5% 12/1/33 (c) | 590,000 | 659,521 | |
5% 12/1/34 (c) | 645,000 | 719,301 | |
5% 12/1/35 (c) | 325,000 | 360,290 | |
5% 12/1/36 (c) | 220,000 | 241,862 | |
5% 12/1/37 (c) | 590,000 | 642,258 | |
5% 12/1/38 (c) | 1,430,000 | 1,545,108 | |
5% 12/1/39 (c) | 1,090,000 | 1,170,347 | |
5% 12/1/40 (c) | 925,000 | 988,165 | |
5% 12/1/41 (c) | 840,000 | 890,303 | |
5% 12/1/42 (c) | 420,000 | 443,012 | |
| Niagara Area Dev. Corp. Rev. (Catholic Health Sys., Inc. Proj.) Series 2022, 4.5% 7/1/52 | 555,000 | 407,288 | |
| Oneida County Local Dev. Corp. Rev. (Mohawk Valley Health Sys. Proj.) Series 2019 A, 5% 12/1/29 (Assured Guaranty Muni. Corp. Insured) | 600,000 | 600,509 | |
| Onondaga Civic Dev. Corp. (Le Moyne College Proj.) Series 2015, 5% 7/1/27 | 295,000 | 302,216 | |
| Suffolk County Econ. Dev. Corp. Rev. Series 2021: | |||
| 5.125% 11/1/41 (d) | 100,000 | 82,566 | |
| 5.375% 11/1/54 (d) | 100,000 | 77,105 | |
TOTAL NEW YORK | 62,437,777 | ||
| New York And New Jersey - 0.1% | |||
| Port Auth. of New York & New Jersey Series 2017 202, 5% 10/15/29 (c) | 500,000 | 526,656 | |
| North Carolina - 0.1% | |||
| New Hanover County Hosp. Rev. Series 2017, 5% 10/1/27 (Escrowed to Maturity) | 10,000 | 10,844 | |
| North Carolina Med. Care Commission Health Care Facilities Rev.: | |||
| Bonds Series 2019 C, 2.55%, tender 6/1/26 (b) | 300,000 | 295,986 | |
| Series 2020 A, 3% 7/1/45 | 365,000 | 295,510 | |
| Series 2021 A, 4% 3/1/51 | 280,000 | 198,693 | |
| North Carolina State Ed. Assistance Auth. Student Ln. Rev. Series 2023 A, 5% 6/1/43 (c) | 160,000 | 165,636 | |
TOTAL NORTH CAROLINA | 966,669 | ||
| North Dakota - 0.2% | |||
| North Dakota Hsg. Fin. Agcy.: | |||
| Series 2021 A, 3% 1/1/52 | 190,000 | 184,957 | |
| Series 2021 B, 3% 7/1/52 | 620,000 | 599,211 | |
| Univ. of North Dakota Series 2021 A, 3% 6/1/61 (Assured Guaranty Muni. Corp. Insured) | 790,000 | 560,892 | |
TOTAL NORTH DAKOTA | 1,345,060 | ||
| Ohio - 4.5% | |||
| Akron Bath Copley Hosp. District Rev.: | |||
| Series 2016, 5.25% 11/15/46 | 495,000 | 502,420 | |
| Series 2020, 4% 11/15/38 | 1,500,000 | 1,434,890 | |
| Allen County Hosp. Facilities Rev. (Mercy Health) Series 2017 A: | |||
| 5% 8/1/25 | 10,000 | 10,300 | |
| 5% 8/1/26 | 390,000 | 410,185 | |
| 5% 8/1/27 | 10,000 | 10,740 | |
| 5% 8/1/28 | 10,000 | 10,863 | |
| 5% 8/1/29 | 10,000 | 10,852 | |
| 5% 8/1/30 | 10,000 | 10,847 | |
| American Muni. Pwr., Inc. (Solar Electricity Prepayment Proj.) Series 2019 A, 5% 2/15/44 | 175,000 | 184,622 | |
| Buckeye Tobacco Settlement Fing. Auth.: | |||
| Series 2020 A2: | |||
3% 6/1/48 | 550,000 | 423,742 | |
4% 6/1/48 | 180,000 | 166,241 | |
5% 6/1/34 | 370,000 | 404,415 | |
| Series 2020 B2, 5% 6/1/55 | 1,370,000 | 1,287,465 | |
| Cleveland Arpt. Sys. Rev. Series 2016 A, 5% 1/1/25 (Assured Guaranty Muni. Corp. Insured) | 145,000 | 147,782 | |
| Cleveland Wtr. Rev. Series 2020, 5% 1/1/28 | 800,000 | 878,799 | |
| County of Cuyahoga (Ballpark Impt. Proj.) Series 2022 A, 4% 1/1/35 | 8,000,000 | 8,512,826 | |
| Fairfield County Hosp. Facilities Rev. (Fairfield Med. Ctr. Proj.) Series 2013, 4.25% 6/15/24 | 110,000 | 109,781 | |
| Franklin County Convention Facilities Auth. (Greater Columbus Convention Ctr. Hotel Expansion Proj.) Series 2019: | |||
| 5% 12/1/44 | 60,000 | 57,215 | |
| 5% 12/1/46 | 200,000 | 212,181 | |
| 5% 12/1/51 | 200,000 | 210,708 | |
| Kent State Univ. Revs. Series 2016, 5% 5/1/30 | 1,495,000 | 1,563,355 | |
| Lancaster Port Auth. Gas Rev.: | |||
| Bonds Series 2019, 5%, tender 2/1/25 (b) | 255,000 | 258,256 | |
| Series 2019, 5% 2/1/25 | 160,000 | 162,494 | |
| Middleburg Heights Hosp. Rev. Series 2021 A, 4% 8/1/41 | 430,000 | 411,780 | |
| Ohio Gen. Oblig.: | |||
| Series 2021 A: | |||
5% 3/1/28 | 110,000 | 121,346 | |
5% 3/1/28 | 140,000 | 154,441 | |
5% 3/1/29 | 160,000 | 180,576 | |
5% 3/1/29 | 210,000 | 237,006 | |
5% 3/1/30 | 190,000 | 218,769 | |
5% 3/1/30 | 290,000 | 333,911 | |
| Series 2021 B: | |||
5% 2/1/28 | 205,000 | 225,709 | |
5% 2/1/29 | 385,000 | 433,771 | |
5% 2/1/30 | 320,000 | 367,866 | |
| Series 2021 C: | |||
5% 3/15/28 | 275,000 | 303,641 | |
5% 3/15/29 | 480,000 | 542,160 | |
5% 3/15/30 | 480,000 | 553,092 | |
| Ohio Hosp. Facilities Rev. Series 2021 B: | |||
| 5% 1/1/26 | 320,000 | 334,497 | |
| 5% 1/1/27 | 750,000 | 804,258 | |
| Ohio Hosp. Rev. Series 2020 A: | |||
| 4% 1/15/50 | 40,000 | 37,785 | |
| 5% 1/15/31 | 300,000 | 330,154 | |
| Ohio Hsg. Fin. Agcy. Residential Mtg. Rev.: | |||
| (Mtg. Backed Securities Prog.) Series 2019 B, 4.5% 3/1/50 | 10,000 | 10,089 | |
| (Mtg.-Backed Securities Prog.) Series 2023 B, 6% 3/1/55 | 380,000 | 422,732 | |
| Series 2021 C, 3.25% 3/1/51 | 4,335,000 | 4,235,716 | |
| Ohio Major New State Infrastructure Rev. Series 2021 1A: | |||
| 5% 12/15/25 | 800,000 | 835,316 | |
| 5% 12/15/28 | 1,250,000 | 1,403,873 | |
| Ohio Tpk. Commission Tpk. Rev.: | |||
| (Infrastructure Projs.) Series 2022 A: | |||
5% 2/15/32 | 70,000 | 82,886 | |
5% 2/15/38 | 185,000 | 214,626 | |
| Series A, 5% 2/15/51 | 600,000 | 649,993 | |
| Scioto County Hosp. Facilities Rev. Series 2019, 5% 2/15/29 | 100,000 | 104,497 | |
| Univ. of Akron Gen. Receipts Series 2019 A, 4% 1/1/27 | 220,000 | 227,095 | |
| Washington County Hosp. Rev. Series 2022: | |||
| 6% 12/1/28 | 215,000 | 221,209 | |
| 6% 12/1/29 | 230,000 | 238,028 | |
| 6% 12/1/30 | 245,000 | 254,458 | |
| 6% 12/1/31 | 260,000 | 270,785 | |
TOTAL OHIO | 31,743,044 | ||
| Oklahoma - 0.1% | |||
| Oklahoma City Arpt. Trust Series 33, 5% 7/1/47 (c) | 200,000 | 205,751 | |
| Oklahoma Dev. Fin. Auth. Health Sys. Rev. Series 2015 A, 5% 8/15/24 | 250,000 | 251,889 | |
| Oklahoma Dev. Fin. Auth. Rev. (Oklahoma City Univ. Proj.) Series 2019, 5% 8/1/44 | 125,000 | 125,346 | |
| Oklahoma Hsg. Fin. Agcy. Single Family Mtg. Rev. (Homeownership Ln. Prog.) Series 2023 C, 6% 3/1/54 | 70,000 | 77,902 | |
TOTAL OKLAHOMA | 660,888 | ||
| Oregon - 0.4% | |||
| Oregon State Hsg. & Cmnty. Svcs. Dept.: | |||
| (Single-Family Mtg. Prog.) Series 2019 A, 2.65% 7/1/39 | 160,000 | 135,338 | |
| Series 2019 A, 4% 7/1/50 | 875,000 | 873,114 | |
| Port of Portland Arpt. Rev.: | |||
| Series 2020 27A, 5% 7/1/45 (c) | 650,000 | 684,997 | |
| Series 27 A, 5% 7/1/36 (c) | 240,000 | 262,465 | |
| Salem Hosp. Facility Auth. Rev. (Salem Health Projs.) Series 2019 A, 3% 5/15/49 | 850,000 | 641,591 | |
TOTAL OREGON | 2,597,505 | ||
| Pennsylvania - 7.2% | |||
| Allegheny County Arpt. Auth. Rev. Series 2021 A: | |||
| 5% 1/1/51 (c) | 2,105,000 | 2,189,898 | |
| 5% 1/1/56 (c) | 1,280,000 | 1,328,587 | |
| Allegheny County Indl. Dev. Auth. Rev. Series 2021: | |||
| 3.5% 12/1/31 | 170,000 | 139,019 | |
| 4% 12/1/41 | 270,000 | 187,801 | |
| 4.25% 12/1/50 | 300,000 | 193,854 | |
| Bucks County Indl. Dev. Auth. Hosp. Rev. Series 2021: | |||
| 5% 7/1/27 | 475,000 | 467,855 | |
| 5% 7/1/28 | 525,000 | 515,408 | |
| 5% 7/1/29 | 550,000 | 537,332 | |
| 5% 7/1/36 | 120,000 | 110,722 | |
| Centre County Pennsylvania Hosp. Auth. Rev. (Mount Nittany Med. Ctr. Proj.) Series 2018 A, 5% 11/15/25 | 100,000 | 103,643 | |
| Chartiers Valley School District Series 2021 A, 3% 10/15/49 | 1,155,000 | 895,024 | |
| Commonwealth Fing. Auth. Rev. Series 2020 A, 5% 6/1/28 | 305,000 | 335,473 | |
| Delaware County Auth. Rev.: | |||
| (Cabrini College) Series 2017, 5% 7/1/47 | 510,000 | 515,209 | |
| Series 2017, 5% 7/1/28 | 445,000 | 466,569 | |
| Doylestown Hosp. Auth. Hosp. Rev. Series 2016 A: | |||
| 5% 7/1/46 | 15,000 | 13,012 | |
| 5% 7/1/46 (Pre-Refunded to 7/1/26 @ 100) | 5,000 | 5,274 | |
| Dubois Hosp. Auth. Hosp. Rev.: | |||
| (Penn Highlands Healthcare Proj.) Series 2018: | |||
4% 7/15/37 | 40,000 | 40,271 | |
5% 7/15/36 | 500,000 | 525,708 | |
| Series 2020, 4% 7/15/45 | 500,000 | 469,198 | |
| Geisinger Auth. Health Sys. Rev. Series 2017 A1, 5% 2/15/45 | 100,000 | 101,993 | |
| Lehigh County Gen. Purp. Auth. Rev. (Muhlenberg College Proj.) Series 2017, 5% 2/1/39 | 60,000 | 62,177 | |
| Lehigh County Gen. Purp. Hosp. Rev. Series 2016 A, 4% 7/1/35 | 5,060,000 | 5,113,796 | |
| Monroeville Fin. Auth. UPMC Rev. Series 2012, 5% 2/15/26 | 95,000 | 98,984 | |
| Montgomery County Higher Ed. & Health Auth. Rev.: | |||
| Series 2016 A, 5% 10/1/40 | 330,000 | 319,506 | |
| Series 2019, 4% 9/1/44 | 185,000 | 180,800 | |
| Series 2020, 5% 4/1/27 | 300,000 | 303,571 | |
| Northampton County Gen. Purp. Auth. Hosp. Rev.: | |||
| (St. Luke's Univ. Health Network Proj.) Series 2018 A, 4% 8/15/48 | 195,000 | 181,340 | |
| Series 2016 A, 5% 8/15/46 | 50,000 | 50,901 | |
| Pennsylvania Ctfs. Prtn. Series 2018 A: | |||
| 5% 7/1/24 | 300,000 | 302,726 | |
| 5% 7/1/26 | 455,000 | 481,037 | |
| 5% 7/1/27 | 500,000 | 541,775 | |
| 5% 7/1/34 | 450,000 | 486,503 | |
| Pennsylvania Higher Edl. Facilities Auth. Rev. (Drexel Univ. Proj.): | |||
| Series 2016, 5% 5/1/35 | 500,000 | 514,160 | |
| Series 2017, 5% 5/1/35 | 10,000 | 10,435 | |
| Pennsylvania Hsg. Fin. Agcy.: | |||
| Series 2021 134B, 5% 10/1/27 (c) | 1,160,000 | 1,219,720 | |
| Series 2021 137, 3% 10/1/51 | 845,000 | 814,552 | |
| Series 2022 138: | |||
3% 10/1/52 | 1,350,000 | 1,300,725 | |
5% 4/1/26 | 1,100,000 | 1,147,137 | |
5% 10/1/26 | 600,000 | 632,633 | |
5% 4/1/27 | 500,000 | 532,931 | |
5% 10/1/27 | 450,000 | 484,628 | |
5% 4/1/28 | 465,000 | 503,973 | |
5% 10/1/28 | 475,000 | 519,753 | |
5% 4/1/29 | 480,000 | 527,466 | |
5% 10/1/29 | 1,000,000 | 1,107,415 | |
5% 4/1/30 | 1,010,000 | 1,120,771 | |
5% 10/1/30 | 695,000 | 776,474 | |
| Pennsylvania Tpk. Commission Tpk. Rev.: | |||
| Series 2015 B, 5% 12/1/45 | 265,000 | 269,648 | |
| Series 2016 A1, 5% 12/1/41 | 1,215,000 | 1,239,056 | |
| Series 2021 A, 4% 12/1/50 | 1,000,000 | 979,797 | |
| Series 2021 B: | |||
5% 12/1/28 | 625,000 | 691,818 | |
5% 12/1/29 | 1,000,000 | 1,126,417 | |
| Philadelphia Arpt. Rev.: | |||
| Series 2017 B: | |||
5% 7/1/35 (c) | 50,000 | 52,362 | |
5% 7/1/47 (c) | 970,000 | 990,560 | |
| Series 2020 C, 5% 7/1/29 (c) | 595,000 | 648,219 | |
| Series 2021: | |||
5% 7/1/26 (c) | 2,920,000 | 3,031,161 | |
5% 7/1/27 (c) | 4,020,000 | 4,243,984 | |
5% 7/1/28 (c) | 425,000 | 456,164 | |
5% 7/1/34 (c) | 1,000,000 | 1,115,540 | |
5% 7/1/35 (c) | 1,000,000 | 1,111,310 | |
| Philadelphia Auth. for Indl. Dev.: | |||
| Series 2015 1, 5% 4/1/33 | 70,000 | 71,456 | |
| Series 2017 A, 5% 9/1/42 | 760,000 | 777,501 | |
| Philadelphia Gas Works Rev. Series 2020 A, 5% 8/1/32 (Assured Guaranty Muni. Corp. Insured) | 1,000,000 | 1,131,461 | |
| Philadelphia Gen. Oblig.: | |||
| Series 2014 A, 5.25% 7/15/27 (Pre-Refunded to 1/15/24 @ 100) | 275,000 | 275,191 | |
| Series 2019 A, 5% 8/1/26 | 220,000 | 232,566 | |
| Philadelphia School District: | |||
| Series 2018 A, 5% 9/1/25 | 50,000 | 51,469 | |
| Series 2018 B, 5% 9/1/43 | 50,000 | 52,507 | |
| Series 2019 A: | |||
4% 9/1/35 | 170,000 | 175,988 | |
5% 9/1/34 (Assured Guaranty Muni. Corp. Insured) | 80,000 | 88,200 | |
| Series 2019 B, 5% 9/1/26 | 415,000 | 435,451 | |
| Series 2019 C, 5% 9/1/33 | 315,000 | 350,065 | |
| Philadelphia Wtr. & Wastewtr. Rev. Series 2023 B, 5.5% 9/1/53 (Assured Guaranty Muni. Corp. Insured) | 1,000,000 | 1,145,205 | |
| Pittsburgh Wtr. & Swr. Auth. Wtr. & Swr. Sys. Rev. Series 2019 A, 5% 9/1/44 (Assured Guaranty Muni. Corp. Insured) | 70,000 | 75,280 | |
| Southcentral Pennsylvania Gen. Auth. Rev.: | |||
| (Hanover Hosp., Inc. PA Proj.) Series 2015, 5% 12/1/28 | 45,000 | 46,574 | |
| Series 2019 A: | |||
4% 6/1/44 | 50,000 | 49,137 | |
4% 6/1/49 | 115,000 | 109,038 | |
5% 6/1/25 | 200,000 | 205,352 | |
5% 6/1/44 | 85,000 | 89,604 | |
5% 6/1/49 | 135,000 | 140,582 | |
| State Pub. School Bldg. Auth. Lease Rev. (The School District of Philadelphia Proj.) Series 2016 A, 5% 6/1/32 (Assured Guaranty Muni. Corp. Insured) | 315,000 | 331,252 | |
| Union County Hosp. Auth. Rev. Series 2018 B, 5% 8/1/43 | 185,000 | 191,716 | |
TOTAL PENNSYLVANIA | 50,459,370 | ||
| Puerto Rico - 1.6% | |||
| Puerto Rico Commonwealth Aqueduct & Swr. Auth.: | |||
| Series 2021 A, 5% 7/1/33 (d) | 900,000 | 912,913 | |
| Series 2021 B: | |||
5% 7/1/33 (d) | 250,000 | 253,587 | |
5% 7/1/37 (d) | 960,000 | 964,165 | |
| Series 2022 A, 4% 7/1/42 (d) | 960,000 | 847,144 | |
| Puerto Rico Commonwealth Pub. Impt. Gen. Oblig. Series 2021 A1: | |||
| 0% 7/1/33 | 2,273,421 | 1,417,290 | |
| 4% 7/1/33 | 1,608,885 | 1,575,264 | |
| 4% 7/1/35 | 575,000 | 555,935 | |
| 5.625% 7/1/27 | 190,000 | 200,928 | |
| 5.625% 7/1/29 | 999,707 | 1,084,255 | |
| Puerto Rico Sales Tax Fing. Corp. Sales Tax Rev. Series 2019 A2, 4.329% 7/1/40 | 3,795,000 | 3,767,349 | |
TOTAL PUERTO RICO | 11,578,830 | ||
| Rhode Island - 0.2% | |||
| Rhode Island Health & Edl. Bldg. Corp. Higher Ed. Facilities Rev.: | |||
| Series 2016 B, 5% 9/1/36 | 500,000 | 490,683 | |
| Series 2016, 5% 5/15/39 | 215,000 | 217,339 | |
| Rhode Island Hsg. & Mtg. Fin. Corp. Series 2019 70, 4% 10/1/49 | 25,000 | 25,008 | |
| Rhode Island Student Ln. Auth. Student Ln. Rev.: | |||
| Series 2023 A, 5% 12/1/30 (c) | 730,000 | 802,132 | |
| Series A, 4% 12/1/26 (c) | 35,000 | 35,116 | |
TOTAL RHODE ISLAND | 1,570,278 | ||
| South Carolina - 1.2% | |||
| Charleston County Arpt. District Series 2019, 5% 7/1/48 | 395,000 | 417,800 | |
| Patriots Energy Group Fing. Agcy. Bonds Series 2018 A, 4%, tender 2/1/24 (b) | 1,000,000 | 1,000,509 | |
| South Carolina Hsg. Fin. & Dev. Auth. Mtg. Rev.: | |||
| Series 2019 A, 4% 1/1/50 | 45,000 | 45,056 | |
| Series 2023 B, 6% 1/1/54 | 235,000 | 261,529 | |
| South Carolina Jobs-Econ. Dev. Auth.: | |||
| Series 2019 C, 5% 7/1/33 | 170,000 | 184,799 | |
| Series 2023: | |||
4% 2/1/42 | 1,115,000 | 1,129,962 | |
5% 2/1/40 | 835,000 | 927,967 | |
| South Carolina Jobs-Econ. Dev. Auth. Econ. Dev. Rev. Series 2022 A, 4% 4/1/52 | 1,000,000 | 978,706 | |
| South Carolina Ports Auth. Ports Rev.: | |||
| Series 2015, 5.25% 7/1/55 (Pre-Refunded to 7/1/25 @ 100) (c) | 255,000 | 262,193 | |
| Series 2018, 5% 7/1/43 (c) | 520,000 | 536,889 | |
| South Carolina Pub. Svc. Auth. Rev.: | |||
| Series 2016 A: | |||
5% 12/1/26 | 140,000 | 146,189 | |
5% 12/1/29 | 500,000 | 520,672 | |
5% 12/1/33 | 15,000 | 15,497 | |
5% 12/1/38 | 80,000 | 81,596 | |
| Series 2016 B: | |||
5% 12/1/31 | 105,000 | 109,826 | |
5% 12/1/35 | 195,000 | 201,567 | |
5% 12/1/41 | 175,000 | 178,612 | |
| Spartanburg County Reg'l. Health Series 2017 A: | |||
| 4% 4/15/43 | 30,000 | 29,453 | |
| 4% 4/15/48 | 20,000 | 18,955 | |
| 5% 4/15/48 | 1,415,000 | 1,465,026 | |
TOTAL SOUTH CAROLINA | 8,512,803 | ||
| South Dakota - 0.1% | |||
| South Dakota Health & Edl. Facilities Auth. Rev. Series 2020 A, 3% 9/1/45 | 475,000 | 369,796 | |
| Tennessee - 1.5% | |||
| Chattanooga Health Ed. & Hsg. Facility Board Rev. Series 2019 A1: | |||
| 4% 8/1/44 | 575,000 | 567,026 | |
| 5% 8/1/25 | 135,000 | 138,175 | |
| Memphis-Shelby County Arpt. Auth. Arpt. Rev. Series 2018: | |||
| 5% 7/1/26 (c) | 450,000 | 465,822 | |
| 5% 7/1/37 (c) | 200,000 | 210,251 | |
| 5% 7/1/38 (c) | 1,315,000 | 1,373,524 | |
| Metropolitan Govt. of Nashville & Davidson County Series 2023: | |||
| 5% 5/1/38 | 900,000 | 1,001,079 | |
| 5% 5/1/40 | 800,000 | 881,273 | |
| Metropolitan Nashville Arpt. Auth. Rev.: | |||
| Series 2015 B, 4% 7/1/25 (c) | 55,000 | 55,357 | |
| Series 2019 B: | |||
5% 7/1/38 (c) | 655,000 | 703,738 | |
5% 7/1/54 (c) | 225,000 | 232,113 | |
| Nashville and Davidson County Metropolitan Govt. Gen. Oblig. Series 2021 C, 5% 1/1/30 | 2,400,000 | 2,761,829 | |
| Nashville and Davidson County Metropolitan Govt. Health & Edl. Facilities Board Rev. (Lipscomb Univ. Proj.) Series 2019 A, 4% 10/1/49 | 1,000,000 | 850,000 | |
| Tennessee Hsg. Dev. Agcy. Series 2015 A, 3.5% 7/1/45 | 185,000 | 183,471 | |
| Tennessee Hsg. Dev. Agcy. Residential: | |||
| Series 2019 3: | |||
2.6% 7/1/39 | 65,000 | 53,680 | |
2.8% 7/1/44 | 75,000 | 59,667 | |
| Series 2019 4, 2.9% 7/1/39 | 45,000 | 39,113 | |
| Series 2021 1, 3% 7/1/51 | 570,000 | 555,549 | |
| Series 2021 3A, 3% 1/1/52 | 255,000 | 247,006 | |
TOTAL TENNESSEE | 10,378,673 | ||
| Texas - 4.8% | |||
| Austin Cmnty. College District Rev. (Highland Campus Parking Garage Proj.) Series 2018 C: | |||
| 5% 8/1/25 | 200,000 | 206,635 | |
| 5% 8/1/26 | 200,000 | 211,885 | |
| Birdville Independent School District Series 2020, 2.375% 2/15/35 | 170,000 | 153,899 | |
| Brazos County Gen. Oblig. Series 2020, 2.125% 9/1/40 | 355,000 | 252,157 | |
| Central Reg'l. Mobility Auth.: | |||
| Series 2020 B, 5% 1/1/45 | 1,000,000 | 1,066,060 | |
| Series 2021 B: | |||
5% 1/1/33 | 640,000 | 727,143 | |
5% 1/1/34 | 650,000 | 737,462 | |
5% 1/1/35 | 550,000 | 622,355 | |
5% 1/1/36 | 850,000 | 956,327 | |
5% 1/1/37 | 1,100,000 | 1,228,959 | |
5% 1/1/38 | 1,100,000 | 1,211,580 | |
| Series 2021 C, 5% 1/1/27 | 775,000 | 802,682 | |
| Denton Independent School District Bonds Series 2014 B: | |||
| 2%, tender 8/1/24 (b) | 15,000 | 14,916 | |
| 2%, tender 8/1/24 (b) | 70,000 | 69,499 | |
| 2%, tender 8/1/24 (b) | 15,000 | 14,916 | |
| Fort Bend Independent School District Bonds Series 2021 B, 0.72%, tender 8/1/26 (b) | 405,000 | 381,960 | |
| Garland Elec. Util. Sys. Rev. Series 2021 A: | |||
| 4% 3/1/35 | 765,000 | 809,529 | |
| 4% 3/1/36 | 750,000 | 788,668 | |
| Grand Parkway Trans. Corp. Bonds Series 2023, 5%, tender 4/1/28 (b) | 2,545,000 | 2,743,280 | |
| Harris County Cultural Ed. Facilities Fin. Corp. Rev. Series 2015, 4% 12/1/45 | 220,000 | 206,957 | |
| Harris County Flood Cont. District Series 2021 A: | |||
| 5% 10/1/25 | 690,000 | 716,462 | |
| 5% 10/1/26 | 900,000 | 960,237 | |
| Houston Arpt. Sys. Rev.: | |||
| Series 2018 A, 5% 7/1/41 (c) | 1,000,000 | 1,040,454 | |
| Series 2018 C: | |||
5% 7/1/26 (c) | 200,000 | 208,100 | |
5% 7/1/30 (c) | 120,000 | 128,460 | |
| Series 2018 D, 5% 7/1/39 | 260,000 | 277,900 | |
| Houston City of Higher Ed. Fin. Corp. (Houston Baptist Univ. Proj.) Series 2021: | |||
| 3.375% 10/1/37 | 500,000 | 421,918 | |
| 4% 10/1/51 | 1,200,000 | 960,400 | |
| Houston Gen. Oblig. Series 2017 A, 5% 3/1/32 | 25,000 | 26,828 | |
| Houston Hsg. Fin. Corp. Multi-family Hsg. Rev. Bonds Series 2023, 5%, tender 8/1/26 (b) | 465,000 | 479,107 | |
| Houston Util. Sys. Rev.: | |||
| Series 2016 B, 5% 11/15/34 | 5,000 | 5,244 | |
| Series 2020 C, 5% 11/15/45 | 1,000,000 | 1,095,799 | |
| Series 2021 A, 5% 11/15/26 | 445,000 | 474,183 | |
| Love Field Arpt. Modernization Rev.: | |||
| Series 2015, 5% 11/1/30 (c) | 320,000 | 325,212 | |
| Series 2017, 5% 11/1/31 (c) | 25,000 | 25,811 | |
| Lower Colorado River Auth. Rev. (LCRA Transmission Svcs. Corp. Proj.) Series 2020, 5% 5/15/24 | 300,000 | 302,151 | |
| Mansfield Tex Series 2020, 2.375% 2/15/36 | 565,000 | 481,531 | |
| Midlothian Independent School District Bonds Series 2013 C, 2%, tender 8/1/24 (b) | 100,000 | 99,285 | |
| New Hope Cultural Ed. Facilities Fin. Corp. (Childrens Med. Ctr. of Dallas) Series 2017 A: | |||
| 5% 8/15/27 | 10,000 | 10,788 | |
| 5% 8/15/47 | 10,000 | 10,331 | |
| North Texas Tollway Auth. Rev.: | |||
| Series 2019 B, 5% 1/1/25 | 85,000 | 86,790 | |
| Series 2021 B, 4% 1/1/32 | 2,000,000 | 2,130,458 | |
| Pflugerville Gen. Oblig. Series 2020, 1.875% 8/1/36 | 1,095,000 | 845,759 | |
| San Antonio Elec. & Gas Sys. Rev. Series 2017, 5% 2/1/33 | 5,000 | 5,311 | |
| San Antonio Wtr. Sys. Rev.: | |||
| Series 2018 A, 5% 5/15/33 | 5,000 | 5,508 | |
| Series 2020 A, 5% 5/15/50 | 475,000 | 511,837 | |
| Southwest Higher Ed. Auth. Rev. (Southern Methodist Univ. Proj.) Series 2016 A, 3% 10/1/32 | 370,000 | 339,551 | |
| Tarrant County Cultural Ed. Facilities Fin. Corp. Rev.: | |||
| Series 2017 A, 5% 2/15/24 | 265,000 | 265,535 | |
| Series 2018 A, 5% 7/1/29 | 305,000 | 333,521 | |
| Texas Dept. of Hsg. & Cmnty. Affairs Multi-family Hsg. Rev. Series 2019, 2.95% 7/1/36 | 122,156 | 109,860 | |
| Texas Dept. of Hsg. & Cmnty. Affairs Residential Mtg. Rev. Series 2023 B, 6% 1/1/54 | 975,000 | 1,085,348 | |
| Texas Dept. of Hsg. & Cmnty. Affairs Single Family Mtg. Rev.: | |||
| Series 2019 A, 4% 3/1/50 | 70,000 | 70,075 | |
| Series A, 3.5% 3/1/51 | 140,000 | 137,796 | |
| Texas Muni. Gas Acquisition & Su Bonds Series 2023 B, 5.5%, tender 1/1/34 (b) | 295,000 | 327,839 | |
| Texas Private Activity Bond Surface Trans. Corp. (LBJ Infrastructure Group LLC I-635 Managed Lanes Proj.) Series 2020 A, 4% 6/30/37 | 1,000,000 | 1,020,184 | |
| Texas Trans. Commission Series 2019 A, 0% 8/1/41 | 250,000 | 110,443 | |
| Texas Trans. Commission Hwy. Impt. Gen. Oblig. Bonds Series 2014 B, 0.65%, tender 4/1/26 (b) | 2,380,000 | 2,212,909 | |
| Univ. of North Texas Univ. Rev. Series 2022 A, 5% 4/15/47 | 2,000,000 | 2,096,043 | |
| Waco Gen. Oblig. Series 2020, 2.375% 2/1/40 | 660,000 | 538,103 | |
TOTAL TEXAS | 33,489,940 | ||
| Utah - 0.2% | |||
| Salt Lake City Arpt. Rev.: | |||
| Series 2017 A, 5% 7/1/37 (c) | 385,000 | 401,135 | |
| Series 2018 A: | |||
5% 7/1/33 (c) | 175,000 | 187,434 | |
5.25% 7/1/48 (c) | 130,000 | 135,132 | |
| Series 2023 A, 5.25% 7/1/37 (c) | 310,000 | 354,306 | |
TOTAL UTAH | 1,078,007 | ||
| Vermont - 0.2% | |||
| Vermont Hsg. Fin. Agcy. Series 2021 B, 3% 11/1/51 | 298,000 | 287,452 | |
| Vermont Student Assistant Corp. Ed. Ln. Rev.: | |||
| Series 2019 A, 5% 6/15/25 (c) | 635,000 | 646,916 | |
| Series 2020 A, 5% 6/15/26 (c) | 620,000 | 643,081 | |
TOTAL VERMONT | 1,577,449 | ||
| Virginia - 1.0% | |||
| Lynchburg Econ. Dev. Series 2021, 3% 1/1/51 | 425,000 | 316,435 | |
| Roanoke Econ. Dev. Auth. Edl. Facilities Series 2018 A, 5% 9/1/24 | 315,000 | 317,499 | |
| Salem Econ. Dev. Auth. Series 2020: | |||
| 4% 4/1/40 | 120,000 | 113,824 | |
| 5% 4/1/25 | 165,000 | 167,318 | |
| 5% 4/1/36 | 500,000 | 532,386 | |
| Virginia College Bldg. Auth. Edl. Facilities Rev.: | |||
| (21St Century Collage and Equip. Programs) Series 2021 A: | |||
4% 2/1/34 | 1,850,000 | 1,997,910 | |
4% 2/1/35 | 1,700,000 | 1,825,977 | |
| Series 2019 A, 3% 2/1/36 | 195,000 | 190,232 | |
| Virginia Small Bus. Fing. Auth. (Elizabeth River Crossings OpCo, LLC Proj.) Series 2022, 4% 7/1/34 (c) | 1,465,000 | 1,489,034 | |
| Wise County Indl. Dev. Auth. Waste & Sewage Rev. Bonds (Virginia Elec. and Pwr. Co. Proj.) Series 2010 A, 1.2%, tender 5/31/24 (b) | 125,000 | 123,050 | |
TOTAL VIRGINIA | 7,073,665 | ||
| Washington - 2.5% | |||
| King County Hsg. Auth. Rev. Series 2021, 4% 12/1/29 | 230,000 | 240,423 | |
| King County Swr. Rev. Series 2017, 5% 7/1/34 | 10,000 | 10,775 | |
| Port of Seattle Rev.: | |||
| Series 2013, 5% 7/1/24 (c) | 55,000 | 55,036 | |
| Series 2015 B, 5% 3/1/25 | 70,000 | 70,946 | |
| Series 2015 C, 5% 4/1/24 (c) | 50,000 | 50,177 | |
| Series 2018 A, 5% 5/1/31 (c) | 350,000 | 367,629 | |
| Series 2019 A, 4% 4/1/44 (c) | 100,000 | 97,082 | |
| Series 2021 C: | |||
5% 8/1/24 (c) | 445,000 | 448,905 | |
5% 8/1/25 (c) | 365,000 | 374,660 | |
5% 8/1/26 (c) | 495,000 | 516,233 | |
5% 8/1/27 (c) | 305,000 | 323,602 | |
5% 8/1/28 (c) | 860,000 | 926,564 | |
| Seattle Hsg. Auth. Rev. (Northgate Plaza Proj.) Series 2021, 1% 6/1/26 | 200,000 | 187,300 | |
| Spokane Pub. Facilities District Hotel/Motel Tax & Sales/Use Tax Rev. Series 2017, 5% 12/1/41 | 295,000 | 306,331 | |
| Washington Convention Ctr. Pub. Facilities: | |||
| Series 2021 B: | |||
3% 7/1/43 | 130,000 | 105,906 | |
3% 7/1/58 (Assured Guaranty Muni. Corp. Insured) | 1,805,000 | 1,319,276 | |
| Series 2021, 4% 7/1/31 | 2,540,000 | 2,528,170 | |
| Washington Gen. Oblig. Series 2021 C, 5% 2/1/44 | 3,010,000 | 3,329,751 | |
| Washington Health Care Facilities Auth. Rev.: | |||
| (Overlake Hosp. Med. Ctr., WA. Proj.) Series 2017 B: | |||
5% 7/1/25 | 5,000 | 5,070 | |
5% 7/1/30 | 5,000 | 5,213 | |
5% 7/1/31 | 10,000 | 10,421 | |
5% 7/1/42 | 100,000 | 101,867 | |
| Series 2017, 4% 8/15/42 | 100,000 | 91,092 | |
| Series 2019 A2, 5% 8/1/44 | 255,000 | 265,554 | |
| Series 2020, 5% 9/1/40 | 735,000 | 787,116 | |
| Washington Higher Ed. Facilities Auth. Rev.: | |||
| (Gonzaga Univ. Proj.) Series 2019 A, 3% 4/1/49 | 725,000 | 531,689 | |
| (Whitworth Univ. Proj.) Series 2016 A, 5% 10/1/25 | 550,000 | 563,239 | |
| Washington Hsg. Fin. Commission Series 2021 2N: | |||
| 5% 6/1/26 | 970,000 | 1,016,392 | |
| 5% 12/1/27 | 985,000 | 1,064,509 | |
| 5% 12/1/28 | 500,000 | 548,864 | |
| 5% 12/1/29 | 500,000 | 555,122 | |
| Washington Hsg. Fin. Commission Nonprofit Hsg. Rev. (Judson Park Proj.) Series 2018, 5% 7/1/38 (d) | 100,000 | 94,858 | |
| Washington Hsg. Fin. Commission Nonprofit Rev. (Seattle Academy of Arts and Sciences Proj.) Series 2023, 5.125% 7/1/33 (d) | 740,000 | 816,966 | |
TOTAL WASHINGTON | 17,716,738 | ||
| West Virginia - 0.0% | |||
| West Virginia Hosp. Fin. Auth. Hosp. Rev. Series 2018 A, 5% 1/1/32 | 50,000 | 51,399 | |
| Wisconsin - 1.1% | |||
| Blue Ridge Healthcare Pub. Fin. Auth. Series 2020 A, 5% 1/1/31 | 60,000 | 64,879 | |
| Howard Suamico Scd Series 2021, 2% 3/1/38 | 265,000 | 205,512 | |
| Pub. Fin. Auth. Edl. Facilities Series 2018 A: | |||
| 5.25% 10/1/43 | 160,000 | 160,790 | |
| 5.25% 10/1/48 | 160,000 | 157,694 | |
| Pub. Fin. Auth. Hosp. Rev. Series 2019 A, 5% 10/1/44 | 355,000 | 370,787 | |
| Pub. Fin. Auth. Wisconsin Retirement Facility Rev. Series 2018: | |||
| 5% 10/1/43 (d) | 45,000 | 39,219 | |
| 5% 10/1/48 (d) | 40,000 | 33,609 | |
| 5% 10/1/53 (d) | 30,000 | 24,613 | |
| Roseman Univ. of Health: | |||
| Series 2020: | |||
3% 4/1/25 (d) | 215,000 | 209,914 | |
3% 4/1/25 (Escrowed to Maturity) (d) | 5,000 | 5,000 | |
5% 4/1/40 (d) | 95,000 | 91,813 | |
5% 4/1/40 (Pre-Refunded to 4/1/30 @ 100) (d) | 5,000 | 5,716 | |
| Series 2021 A: | |||
3% 7/1/50 | 380,000 | 288,560 | |
4.5% 6/1/56 (d) | 1,870,000 | 1,444,128 | |
| Series 2021 B, 6.5% 6/1/56 (d) | 500,000 | 417,321 | |
| Wisconsin Gen. Oblig. Series 2021 A, 5% 5/1/32 | 1,430,000 | 1,581,903 | |
| Wisconsin Health & Edl. Facilities: | |||
| Series 2016 A: | |||
3.5% 2/15/40 | 50,000 | 44,088 | |
4% 11/15/46 | 195,000 | 187,452 | |
4% 11/15/46 (Pre-Refunded to 5/15/26 @ 100) | 80,000 | 82,007 | |
| Series 2016, 4% 12/1/46 | 675,000 | 662,188 | |
| Series 2019 A: | |||
5% 12/1/28 | 150,000 | 163,438 | |
5% 12/1/29 | 150,000 | 165,936 | |
| Series 2019 B1, 2.825% 11/1/28 | 50,000 | 44,866 | |
| Series 2019: | |||
5% 10/1/24 | 175,000 | 177,301 | |
5% 10/1/30 | 195,000 | 215,703 | |
| Wisconsin Hsg. & Econ. Dev. Auth.: | |||
| Series 2021 A, 3% 3/1/52 | 175,000 | 169,025 | |
| Series 2021 C, 3% 9/1/52 | 360,000 | 348,744 | |
| Wisconsin Hsg. & Econ. Dev. Auth. Hsg. Rev. Bonds Series 2021 C: | |||
| 0.61%, tender 5/1/24 (b) | 60,000 | 59,169 | |
| 0.81%, tender 5/1/25 (b) | 225,000 | 215,045 | |
TOTAL WISCONSIN | 7,636,420 | ||
| Wyoming - 0.4% | |||
| Wyoming Cmnty. Dev. Auth. Hsg. Rev. Series 2022 3: | |||
| 5% 6/1/24 (c) | 675,000 | 679,621 | |
| 5% 12/1/24 (c) | 695,000 | 705,732 | |
| 5% 6/1/25 (c) | 700,000 | 716,879 | |
| 5% 12/1/25 (c) | 375,000 | 387,555 | |
TOTAL WYOMING | 2,489,787 | ||
| TOTAL MUNICIPAL BONDS (Cost $695,167,647) | 673,169,109 | ||
| Money Market Funds - 3.9% | |||
| Shares | Value ($) | ||
Fidelity Municipal Cash Central Fund 4.24% (f)(g) (Cost $27,616,985) | 27,611,478 | 27,616,986 | |
| TOTAL INVESTMENT IN SECURITIES - 99.6% (Cost $722,784,632) | 700,786,095 |
NET OTHER ASSETS (LIABILITIES) - 0.4% | 2,940,917 |
| NET ASSETS - 100.0% | 703,727,012 |
| (a) | Amount is stated in United States dollars unless otherwise noted. |
| (b) | Coupon rates for floating and adjustable rate securities reflect the rates in effect at period end. |
| (c) | Private activity obligations whose interest is subject to the federal alternative minimum tax for individuals. |
| (d) | Security exempt from registration under Rule 144A of the Securities Act of 1933. These securities may be resold in transactions exempt from registration, normally to qualified institutional buyers. At the end of the period, the value of these securities amounted to $7,202,526 or 1.0% of net assets. |
| (e) | Security or a portion of the security purchased on a delayed delivery or when-issued basis. |
| (f) | Information in this report regarding holdings by state and security types does not reflect the holdings of the Fidelity Municipal Cash Central Fund. |
| (g) | Affiliated fund that is generally available only to investment companies and other accounts managed by Fidelity Investments. The rate quoted is the annualized seven-day yield of the fund at period end. A complete unaudited listing of the fund's holdings as of its most recent quarter end is available upon request. In addition, each Fidelity Central Fund's financial statements, which are not covered by the Fund's Report of Independent Registered Public Accounting Firm, are available on the SEC's website or upon request. |
| Affiliate | Value, beginning of period ($) | Purchases ($) | Sales Proceeds ($) | Dividend Income ($) | Realized Gain (loss) ($) | Change in Unrealized appreciation (depreciation) ($) | Value, end of period ($) | % ownership, end of period |
| Fidelity Municipal Cash Central Fund 4.24% | 17,795,993 | 98,203,980 | 88,383,000 | 1,034,718 | - | 13 | 27,616,986 | 1.1% |
| Total | 17,795,993 | 98,203,980 | 88,383,000 | 1,034,718 | - | 13 | 27,616,986 | |
| Valuation Inputs at Reporting Date: | ||||
| Description | Total ($) | Level 1 ($) | Level 2 ($) | Level 3 ($) |
Investments in Securities: | ||||
| Municipal Securities | 673,169,109 | - | 673,169,109 | - |
| Money Market Funds | 27,616,986 | 27,616,986 | - | - |
| Total Investments in Securities: | 700,786,095 | 27,616,986 | 673,169,109 | - |
| Statement of Assets and Liabilities | ||||
| December 31, 2023 | ||||
| Assets | ||||
| Investment in securities, at value - See accompanying schedule: | ||||
Unaffiliated issuers (cost $695,167,647) | $ | 673,169,109 | ||
Fidelity Central Funds (cost $27,616,985) | 27,616,986 | |||
| Total Investment in Securities (cost $722,784,632) | $ | 700,786,095 | ||
| Cash | 99,819 | |||
| Receivable for fund shares sold | 1,191,420 | |||
| Interest receivable | 8,555,323 | |||
| Distributions receivable from Fidelity Central Funds | 76,527 | |||
| Other receivables | 53 | |||
Total assets | 710,709,237 | |||
| Liabilities | ||||
| Payable for investments purchased on a delayed delivery basis | $ | 4,506,640 | ||
| Payable for fund shares redeemed | 819,391 | |||
| Distributions payable | 1,615,553 | |||
| Payable to investment adviser | 1,766 | |||
| Other payables and accrued expenses | 38,875 | |||
| Total Liabilities | 6,982,225 | |||
| Net Assets | $ | 703,727,012 | ||
| Net Assets consist of: | ||||
| Paid in capital | $ | 732,947,126 | ||
| Total accumulated earnings (loss) | (29,220,114) | |||
| Net Assets | $ | 703,727,012 | ||
Net Asset Value, offering price and redemption price per share ($703,727,012 ÷ 71,273,523 shares) | $ | 9.87 | ||
| Statement of Operations | ||||
Year ended December 31, 2023 | ||||
| Investment Income | ||||
| Interest | $ | 16,725,743 | ||
| Income from Fidelity Central Funds | 1,034,718 | |||
| Total Income | 17,760,461 | |||
| Expenses | ||||
| Independent trustees' fees and expenses | $ | 2,323 | ||
| Proxy | 38,875 | |||
| Total expenses before reductions | 41,198 | |||
| Expense reductions | (19,758) | |||
| Total expenses after reductions | 21,440 | |||
| Net Investment income (loss) | 17,739,021 | |||
| Realized and Unrealized Gain (Loss) | ||||
| Net realized gain (loss) on: | ||||
| Investment Securities: | ||||
| Unaffiliated issuers | (932,466) | |||
| Total net realized gain (loss) | (932,466) | |||
| Change in net unrealized appreciation (depreciation) on: | ||||
| Investment Securities: | ||||
| Unaffiliated issuers | 29,403,404 | |||
| Fidelity Central Funds | 13 | |||
| Total change in net unrealized appreciation (depreciation) | 29,403,417 | |||
| Net gain (loss) | 28,470,951 | |||
| Net increase (decrease) in net assets resulting from operations | $ | 46,209,972 | ||
| Statement of Changes in Net Assets | ||||
Year ended December 31, 2023 | Year ended December 31, 2022 | |||
| Increase (Decrease) in Net Assets | ||||
| Operations | ||||
| Net investment income (loss) | $ | 17,739,021 | $ | 12,721,505 |
| Net realized gain (loss) | (932,466) | (6,696,419) | ||
| Change in net unrealized appreciation (depreciation) | 29,403,417 | (64,898,138) | ||
| Net increase (decrease) in net assets resulting from operations | 46,209,972 | (58,873,052) | ||
| Distributions to shareholders | (17,380,630) | (12,667,680) | ||
| Share transactions | ||||
| Proceeds from sales of shares | 276,425,905 | 299,711,432 | ||
| Reinvestment of distributions | 146 | 13 | ||
| Cost of shares redeemed | (210,149,477) | (263,494,616) | ||
Net increase (decrease) in net assets resulting from share transactions | 66,276,574 | 36,216,829 | ||
| Total increase (decrease) in net assets | 95,105,916 | (35,323,903) | ||
| Net Assets | ||||
| Beginning of period | 608,621,096 | 643,944,999 | ||
| End of period | $ | 703,727,012 | $ | 608,621,096 |
| Other Information | ||||
| Shares | ||||
| Sold | 28,860,862 | 30,761,210 | ||
| Issued in reinvestment of distributions | 15 | 1 | ||
| Redeemed | (22,022,436) | (27,284,108) | ||
| Net increase (decrease) | 6,838,441 | 3,477,103 | ||
| Fidelity Flex® Municipal Income Fund |
| Years ended December 31, | 2023 | 2022 | 2021 | 2020 | 2019 | |||||
Selected Per-Share Data | ||||||||||
| Net asset value, beginning of period | $ | 9.45 | $ | 10.56 | $ | 10.50 | $ | 10.35 | $ | 9.85 |
| Income from Investment Operations | ||||||||||
Net investment income (loss) A,B | .259 | .200 | .173 | .232 | .275 | |||||
| Net realized and unrealized gain (loss) | .414 | (1.111) | .068 | .153 | .531 | |||||
| Total from investment operations | .673 | (.911) | .241 | .385 | .806 | |||||
| Distributions from net investment income | (.253) | (.199) | (.177) | (.235) | (.278) | |||||
| Distributions from net realized gain | - | - | (.004) | - | (.028) | |||||
| Total distributions | (.253) | (.199) | (.181) | (.235) | (.306) | |||||
| Net asset value, end of period | $ | 9.87 | $ | 9.45 | $ | 10.56 | $ | 10.50 | $ | 10.35 |
Total Return C | 7.25% | (8.63)% | 2.31% | 3.79% | 8.26% | |||||
Ratios to Average Net Assets B,D,E | ||||||||||
| Expenses before reductions | .01% | -% F | -% F | -% F | -% F | |||||
Expenses net of fee waivers, if any F | -% | -% | -% | -% | -% | |||||
Expenses net of all reductions F | -% | -% | -% | -% | -% | |||||
| Net investment income (loss) | 2.71% | 2.07% | 1.65% | 2.26% | 2.70% | |||||
| Supplemental Data | ||||||||||
| Net assets, end of period (000 omitted) | $ | 703,727 | $ | 608,621 | $ | 643,945 | $ | 311,999 | $ | 188,914 |
Portfolio turnover rate G | 5% | 16% | 5% | 24% | 18% |
| Fidelity Central Fund | Investment Manager | Investment Objective | Investment Practices | Expense RatioA |
| Fidelity Money Market Central Funds | Fidelity Management & Research Company LLC (FMR) | Each fund seeks to obtain a high level of current income consistent with the preservation of capital and liquidity. | Short-term Investments | Less than .005% |
| Gross unrealized appreciation | $12,554,207 |
| Gross unrealized depreciation | (34,136,842) |
| Net unrealized appreciation (depreciation) | $(21,582,635) |
| Tax Cost | $722,368,730 |
| Capital loss carryforward | $(7,632,956) |
| Net unrealized appreciation (depreciation) on securities and other investments | $(21,582,635) |
Short-term | $(2,844,609) |
Long-term | (4,788,347) |
| Total capital loss carryforward | $(7,632,956) |
| December 31, 2023 | December 31, 2022 | |
| Tax-exempt Income | $17,380,630 | $12,667,680 |
| Total | $17,380,630 | $12,667,680 |
| Purchases ($) | Sales ($) | |
| Fidelity Flex Municipal Income Fund | 100,611,535 | 31,402,488 |
| Reimbursement | |
| Fidelity Flex Municipal Income Fund | $19,238 |
| The Example is based on an investment of $1,000 invested at the beginning of the period and held for the entire period (July 1, 2023 to December 31, 2023). |
Annualized Expense Ratio- A | Beginning Account Value July 1, 2023 | Ending Account Value December 31, 2023 | Expenses Paid During Period- C July 1, 2023 to December 31, 2023 | |||||||
| Fidelity Flex® Municipal Income Fund | .01% | |||||||||
| Actual | $ 1,000 | $ 1,040.30 | $ .05 | |||||||
Hypothetical-B | $ 1,000 | $ 1,025.16 | $ .05 | |||||||
| A special meeting of shareholders was held on October 18, 2023. The results of votes taken among shareholders on the proposal before them are reported below. Each vote reported represents one dollar of net asset value held on the record date for the meeting. | ||
| Proposal 1 | ||
| To elect a Board of Trustees. | ||
# of Votes | % of Votes | |
| Abigail P. Johnson | ||
| Affirmative | 11,160,118,778.550 | 97.240 |
| Withheld | 316,510,692.230 | 2.760 |
| TOTAL | 11,476,629,470.780 | 100.000 |
| Jennifer Toolin McAuliffe | ||
| Affirmative | 11,160,843,041.160 | 97.250 |
| Withheld | 315,786,429.620 | 2.750 |
| TOTAL | 11,476,629,470.780 | 100.000 |
| Christine J. Thompson | ||
| Affirmative | 11,156,602,115.000 | 97.210 |
| Withheld | 320,027,355.780 | 2.790 |
| TOTAL | 11,476,629,470.780 | 100.000 |
| Elizabeth S. Acton | ||
| Affirmative | 11,110,214,430.850 | 96.810 |
| Withheld | 366,415,039.930 | 3.190 |
| TOTAL | 11,476,629,470.780 | 100.000 |
| Laura M. Bishop | ||
| Affirmative | 11,132,012,161.210 | 97.000 |
| Withheld | 344,617,309.570 | 3.000 |
| TOTAL | 11,476,629,470.780 | 100.000 |
| Ann E. Dunwoody | ||
| Affirmative | 11,125,767,777.290 | 96.940 |
| Withheld | 350,861,693.490 | 3.060 |
| TOTAL | 11,476,629,470.780 | 100.000 |
| John Engler | ||
| Affirmative | 11,009,456,697.420 | 95.930 |
| Withheld | 467,172,773.360 | 4.070 |
| TOTAL | 11,476,629,470.780 | 100.000 |
| Robert F. Gartland | ||
| Affirmative | 11,139,433,974.390 | 97.060 |
| Withheld | 337,195,496.390 | 2.940 |
| TOTAL | 11,476,629,470.780 | 100.000 |
| Robert W. Helm | ||
| Affirmative | 11,140,155,147.040 | 97.070 |
| Withheld | 336,474,323.740 | 2.930 |
| TOTAL | 11,476,629,470.780 | 100.000 |
| Arthur E. Johnson | ||
| Affirmative | 11,087,922,630.810 | 96.610 |
| Withheld | 388,706,839.970 | 3.390 |
| TOTAL | 11,476,629,470.780 | 100.000 |
| Michael E. Kenneally | ||
| Affirmative | 11,003,372,175.210 | 95.880 |
| Withheld | 473,257,295.570 | 4.120 |
| TOTAL | 11,476,629,470.780 | 100.000 |
| Mark A. Murray | ||
| Affirmative | 11,139,176,322.830 | 97.060 |
| Withheld | 337,453,147.950 | 2.940 |
| TOTAL | 11,476,629,470.780 | 100.000 |
| Carol J. Zierhoffer | ||
| Affirmative | 11,137,882,609.000 | 97.050 |
| Withheld | 338,746,861.780 | 2.950 |
| TOTAL | 11,476,629,470.780 | 100.000 |
| Proposal 1 reflects trust wide proposal and voting results. | ||
 |


Contents
| Average Annual Total Returns | |||
Periods ended December 31, 2023 | Past 1 year | Past 5 years | Past 10 years |
| Fidelity® Minnesota Municipal Income Fund | 5.02% | 1.87% | 2.43% |
| $10,000 Over 10 Years |
Let's say hypothetically that $10,000 was invested in Fidelity® Minnesota Municipal Income Fund on December 31, 2013. The chart shows how the value of your investment would have changed, and also shows how the Bloomberg Municipal Bond Index performed over the same period. |
 |
| Revenue Sources (% of Fund's net assets) | ||
| General Obligations | 37.3 | |
| Health Care | 28.8 | |
| Education | 10.9 | |
| Housing | 7.1 | |
| Electric Utilities | 5.6 | |
| Others* (Individually Less Than 5%) | 10.3 | |
| 100.0 | ||
| *Includes net other assets | ||
Quality Diversification (% of Fund's net assets) |
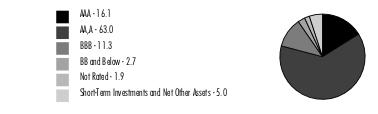 |
| We have used ratings from Moody's Investors Service, Inc. Where Moody's® ratings are not available, we have used S&P® ratings. All ratings are as of the date indicated and do not reflect subsequent changes. |
| Municipal Bonds - 95.0% | |||
Principal Amount (a) | Value ($) | ||
| Guam - 0.2% | |||
| Guam Pwr. Auth. Rev. Series 2022 A, 5% 10/1/44 | 1,000,000 | 1,047,405 | |
| Minnesota - 93.3% | |||
| Albany Independent School District #745 (Minnesota School district Cr. Enhancement Prog.) Series 2022 A, 4.125% 2/1/41 | 1,130,000 | 1,167,826 | |
| Anoka-Hennepin Independent School District 11 Series 2014 A: | |||
| 5% 2/1/25 | 1,015,000 | 1,016,501 | |
| 5% 2/1/26 | 1,220,000 | 1,221,748 | |
| 5% 2/1/27 | 1,285,000 | 1,286,811 | |
| 5% 2/1/28 | 1,345,000 | 1,346,874 | |
| 5% 2/1/29 | 1,415,000 | 1,416,938 | |
| 5% 2/1/34 | 1,800,000 | 1,802,279 | |
| Chaska Elec. Rev. Series 2015 A: | |||
| 5% 10/1/26 | 1,000,000 | 1,035,532 | |
| 5% 10/1/29 | 785,000 | 813,980 | |
| Chaska Independent School District #112 Gen. Oblig. (Minnesota School District Cr. Enhancement Prog.) Series 2016 A: | |||
| 5% 2/1/30 | 1,400,000 | 1,466,055 | |
| 5% 2/1/31 | 3,600,000 | 3,768,367 | |
| City of Ramsey Series 2022 A: | |||
| 5% 12/15/29 | 670,000 | 770,715 | |
| 5% 12/15/30 | 665,000 | 779,964 | |
| 5% 12/15/31 | 740,000 | 885,605 | |
| 5% 12/15/32 | 775,000 | 944,124 | |
| 5% 12/15/33 | 565,000 | 691,194 | |
| 5% 12/15/34 | 455,000 | 554,424 | |
| City of Virginia Series 2020 A: | |||
| 4% 2/1/37 (Assured Guaranty Muni. Corp. Insured) | 1,000,000 | 1,025,156 | |
| 4% 2/1/39 (Assured Guaranty Muni. Corp. Insured) | 1,000,000 | 1,016,159 | |
| City of White Bear Lake (YMCA of Greater Twin Cities Proj.) Series 2018: | |||
| 5% 6/1/25 | 565,000 | 576,427 | |
| 5% 6/1/26 | 500,000 | 518,591 | |
| 5% 6/1/28 | 1,000,000 | 1,065,923 | |
| 5% 6/1/30 | 625,000 | 674,674 | |
| 5% 6/1/31 | 700,000 | 755,624 | |
| 5% 6/1/33 | 1,400,000 | 1,510,914 | |
| Ctr. City Health Care Facilities (Hazelden Betty Ford Foundation Proj.) Series 2014: | |||
| 5% 11/1/25 | 250,000 | 251,860 | |
| 5% 11/1/26 | 500,000 | 503,516 | |
| 5% 11/1/27 | 920,000 | 926,097 | |
| Dassel Cokato Mischd # 466 (Minnesota School District Cr. Enhancement Prog.) Series 2023 A: | |||
| 4% 2/1/41 | 415,000 | 425,936 | |
| 4% 2/1/42 | 750,000 | 766,926 | |
| 4% 2/1/43 | 960,000 | 979,015 | |
| Dawson-Boyd Independent School District Series 2019 A: | |||
| 4% 2/1/33 | 1,140,000 | 1,199,345 | |
| 4% 2/1/36 | 1,360,000 | 1,421,102 | |
| 4% 2/1/37 | 1,200,000 | 1,247,801 | |
| Delano Minn Series 2023 A: | |||
| 4% 2/1/40 | 1,060,000 | 1,092,726 | |
| 4% 2/1/41 | 1,100,000 | 1,126,318 | |
| 5% 2/1/39 | 1,010,000 | 1,120,335 | |
| Dilworth Gen. Oblig. Series 2022 A: | |||
| 3.5% 2/1/34 | 455,000 | 465,611 | |
| 3.5% 2/1/35 | 470,000 | 479,855 | |
| 3.5% 2/1/36 | 490,000 | 498,082 | |
| 4% 2/1/38 | 1,030,000 | 1,073,230 | |
| 4% 2/1/40 | 1,115,000 | 1,145,672 | |
| 4% 2/1/42 | 1,205,000 | 1,228,422 | |
| Duluth Econ. Dev. Auth. Series 2021 A, 4% 7/1/41 | 930,000 | 723,418 | |
| Duluth Econ. Dev. Auth. Health Care Facilities Rev.: | |||
| Series 2018 A: | |||
4.25% 2/15/48 | 2,030,000 | 1,951,548 | |
5% 2/15/43 | 1,500,000 | 1,539,142 | |
5% 2/15/48 | 3,000,000 | 3,054,030 | |
5% 2/15/58 | 3,125,000 | 3,163,715 | |
| Series 2021 A: | |||
4% 6/15/32 | 535,000 | 534,433 | |
4% 6/15/35 | 550,000 | 543,662 | |
| Series 2022 A: | |||
4% 6/15/37 | 1,140,000 | 1,093,562 | |
4% 6/15/38 | 400,000 | 375,645 | |
4% 6/15/39 | 250,000 | 231,766 | |
5% 6/15/25 | 565,000 | 571,536 | |
5% 6/15/26 | 360,000 | 368,631 | |
5% 6/15/28 | 935,000 | 979,896 | |
5% 6/15/29 | 1,035,000 | 1,093,460 | |
5% 6/15/31 | 1,220,000 | 1,309,111 | |
5% 6/15/33 | 1,170,000 | 1,263,094 | |
| Series 2022 B: | |||
5.25% 6/15/47 | 2,500,000 | 2,577,385 | |
5.25% 6/15/52 | 1,250,000 | 1,273,402 | |
| Duluth Independent School District #709 Ctfs. of Prtn.: | |||
| Series 2019 B: | |||
5% 2/1/25 | 375,000 | 383,325 | |
5% 2/1/27 | 370,000 | 394,606 | |
| Series 2021 B, 3% 3/1/32 | 540,000 | 491,045 | |
| Eden Prairie Independent School District Series 2023 A: | |||
| 4% 2/1/35 | 1,050,000 | 1,142,563 | |
| 4% 2/1/36 | 915,000 | 983,391 | |
| Elk River Independent School District #728: | |||
| Series 2019 A, 3% 2/1/33 | 2,925,000 | 2,903,027 | |
| Series 2020 A, 4% 2/1/31 | 2,120,000 | 2,254,394 | |
| Fridley Independent School District #14 (MN School District Cr. Enhancement Prog.) Series 2016 A, 3% 2/1/35 | 300,000 | 294,527 | |
| Hawley Independent School District #150 Series 2023 A: | |||
| 5% 2/1/39 | 620,000 | 683,764 | |
| 5% 2/1/40 | 650,000 | 711,706 | |
| Hennepin County Gen. Oblig.: | |||
| Series 2016 B, 5% 12/1/31 | 1,155,000 | 1,230,175 | |
| Series 2019 B, 5% 12/15/39 | 3,725,000 | 4,064,501 | |
| Series 2020 C, 5% 12/15/37 | 2,500,000 | 2,801,899 | |
| Itasca Co. Minn Independent # 318 (Minnesota School District Cr. Enhancement Prog.) Series 2022 B, 4% 2/1/39 | 475,000 | 492,658 | |
| Itasca County (Minnesota County Cr. Enhancement Prog.) Series 2020 B, 2% 2/1/35 | 600,000 | 513,326 | |
| Lake Elmo Minn Series 2021 A: | |||
| 2% 2/1/35 | 1,185,000 | 999,580 | |
| 2% 2/1/36 | 1,205,000 | 1,004,790 | |
| Le Sueur-Henderson ISD No. 2397 (Minnesota School District Cr. Enhancement Prog.) Series 2022 A, 4.5% 2/1/42 | 2,495,000 | 2,619,284 | |
| Maple Grove Gen. Oblig. Impt. Series 2020 A: | |||
| 1.5% 2/1/33 | 715,000 | 586,396 | |
| 1.625% 2/1/34 | 790,000 | 646,494 | |
| Maple Grove Health Care Sys. Rev.: | |||
| Series 2015: | |||
4% 9/1/35 | 1,250,000 | 1,250,046 | |
5% 9/1/25 | 215,000 | 220,229 | |
5% 9/1/28 | 695,000 | 712,493 | |
5% 9/1/30 | 1,500,000 | 1,536,635 | |
5% 9/1/31 | 1,300,000 | 1,330,396 | |
5% 9/1/32 | 1,000,000 | 1,021,574 | |
| Series 2017: | |||
5% 5/1/26 | 1,355,000 | 1,399,242 | |
5% 5/1/27 | 1,400,000 | 1,468,418 | |
5% 5/1/28 | 2,915,000 | 3,056,480 | |
5% 5/1/29 | 1,000,000 | 1,047,955 | |
5% 5/1/30 | 900,000 | 942,956 | |
5% 5/1/31 | 580,000 | 606,518 | |
5% 5/1/32 | 500,000 | 521,051 | |
| Maple River Independent School District No. 2135 Series 2020 A, 4% 2/1/45 | 2,750,000 | 2,777,158 | |
| Metropolitan Council Gen. Oblig. Rev. Series 2020 B, 2.125% 3/1/36 | 1,000,000 | 821,350 | |
| Minneapolis & Saint Paul Metropolitan Arpts. Commission Arpt. Rev.: | |||
| Series 2016 A: | |||
5% 1/1/30 | 4,275,000 | 4,588,701 | |
5% 1/1/31 | 2,375,000 | 2,547,052 | |
5% 1/1/32 | 2,900,000 | 3,107,018 | |
| Series 2016 D: | |||
5% 1/1/27 (b) | 350,000 | 367,155 | |
5% 1/1/28 (b) | 430,000 | 450,189 | |
5% 1/1/29 (b) | 225,000 | 235,894 | |
5% 1/1/30 (b) | 480,000 | 503,172 | |
5% 1/1/31 (b) | 200,000 | 209,589 | |
5% 1/1/32 (b) | 200,000 | 209,500 | |
5% 1/1/33 (b) | 220,000 | 230,006 | |
5% 1/1/34 (b) | 225,000 | 234,819 | |
5% 1/1/35 (b) | 225,000 | 234,465 | |
5% 1/1/36 (b) | 220,000 | 228,709 | |
5% 1/1/37 (b) | 250,000 | 259,051 | |
5% 1/1/41 (b) | 725,000 | 744,704 | |
| Series 2022 B: | |||
4.25% 1/1/42 (b) | 1,780,000 | 1,804,795 | |
5% 1/1/47 (b) | 1,600,000 | 1,681,758 | |
| Series 2023 A, 5% 1/1/35 | 900,000 | 1,073,215 | |
| Minneapolis Gen. Oblig. Series 2019, 3% 12/1/40 | 395,000 | 346,902 | |
| Minneapolis Health Care Sys. Rev.: | |||
| Bonds Series 2023 B, 5%, tender 11/15/30 (c) | 10,335,000 | 11,464,490 | |
| Series 2015 A: | |||
5% 11/15/27 (Assured Guaranty Muni. Corp. Insured) | 850,000 | 872,051 | |
5% 11/15/32 | 2,200,000 | 2,249,889 | |
| Series 2018 A: | |||
5% 11/15/34 | 3,350,000 | 3,487,150 | |
5% 11/15/35 | 2,500,000 | 2,593,450 | |
5% 11/15/36 | 2,500,000 | 2,576,376 | |
5% 11/15/49 | 4,935,000 | 4,941,698 | |
| Series 2021: | |||
4% 11/15/36 | 5,410,000 | 5,646,798 | |
4% 11/15/37 | 5,410,000 | 5,587,562 | |
4% 11/15/38 | 1,785,000 | 1,832,746 | |
4% 11/15/39 | 1,265,000 | 1,288,706 | |
4% 11/15/40 | 8,860,000 | 8,939,613 | |
| Minneapolis Spl. School District: | |||
| (Minnesota School District Cr. Enhancement Prog.) Series 2018 B, 5% 2/1/32 | 895,000 | 981,173 | |
| (MN School District Cr. Enhancement Prog.): | |||
Series 2018 A, 5% 2/1/33 | 1,000,000 | 1,086,138 | |
Series 2018 B, 5% 2/1/33 | 3,190,000 | 3,464,781 | |
| Series 2017 A, 4% 2/1/33 | 1,415,000 | 1,482,514 | |
| Series 2017 B: | |||
4% 2/1/33 | 2,595,000 | 2,718,816 | |
4% 2/1/34 | 2,595,000 | 2,707,056 | |
| Series 2020 B, 4% 2/1/36 | 1,745,000 | 1,840,732 | |
| Series 2020 C, 4% 2/1/38 | 1,665,000 | 1,723,265 | |
| Series 2021 B: | |||
5% 2/1/41 | 1,180,000 | 1,326,807 | |
5% 2/1/42 | 1,235,000 | 1,384,457 | |
| Series 2021 C: | |||
5% 2/1/40 | 1,585,000 | 1,799,492 | |
5% 2/1/41 | 1,660,000 | 1,867,651 | |
5% 2/1/42 | 1,745,000 | 1,957,355 | |
| Series 2022 B: | |||
5% 2/1/34 | 850,000 | 1,010,271 | |
5% 2/1/41 | 1,195,000 | 1,370,540 | |
5% 2/1/42 | 1,255,000 | 1,426,770 | |
5% 2/1/43 | 1,320,000 | 1,488,089 | |
| Minnesota Armory Bldg. Commission Series 2021 A, 3% 6/1/38 | 1,900,000 | 1,745,234 | |
| Minnesota Ctfs. Prtn. (Minnesota Gen. Oblig. Proj.) Series 2014, 5% 6/1/39 | 2,445,000 | 2,454,637 | |
| Minnesota Gen. Oblig.: | |||
| Series 2016 D, 2.25% 8/1/29 | 420,000 | 401,167 | |
| Series 2018 B, 4% 8/1/35 | 5,270,000 | 5,547,850 | |
| Series 2020 A: | |||
5% 8/1/35 | 6,000,000 | 6,940,808 | |
5% 8/1/37 | 6,000,000 | 6,855,320 | |
| Series 2021 A: | |||
4% 9/1/39 | 2,645,000 | 2,771,302 | |
4% 9/1/41 | 10,000,000 | 10,230,806 | |
| Series 2021 B, 4% 9/1/32 | 2,000,000 | 2,190,861 | |
| Series 2022 A, 5% 8/1/41 | 1,530,000 | 1,764,520 | |
| Minnesota Higher Ed. Facilities Auth. Rev.: | |||
| (Univ. of St Thomas) Series 2017 A, 5% 10/1/29 | 760,000 | 818,657 | |
| Series 2016 A, 5% 5/1/46 | 3,610,000 | 3,280,074 | |
| Series 2017 A, 4% 10/1/35 | 800,000 | 818,624 | |
| Series 2017: | |||
3% 3/1/34 | 430,000 | 421,626 | |
5% 3/1/31 | 1,000,000 | 1,068,914 | |
5% 10/1/31 | 590,000 | 632,788 | |
5% 3/1/34 | 530,000 | 565,864 | |
5% 10/1/34 | 440,000 | 469,936 | |
5% 10/1/35 | 555,000 | 590,471 | |
| Series 2018 A: | |||
5% 10/1/34 | 1,155,000 | 1,231,164 | |
5% 10/1/35 | 500,000 | 529,981 | |
5% 10/1/45 | 3,650,000 | 3,720,871 | |
| Series 2019: | |||
4% 12/1/24 | 100,000 | 99,765 | |
4% 12/1/25 | 180,000 | 180,426 | |
4% 12/1/26 | 190,000 | 191,073 | |
4% 12/1/27 | 195,000 | 196,854 | |
4% 12/1/28 | 240,000 | 242,955 | |
4% 12/1/29 | 285,000 | 288,538 | |
4% 12/1/30 | 200,000 | 201,946 | |
4% 12/1/31 | 450,000 | 453,310 | |
4% 12/1/32 | 690,000 | 693,629 | |
4% 12/1/33 | 750,000 | 752,245 | |
4% 12/1/34 | 225,000 | 225,174 | |
5% 10/1/29 | 400,000 | 446,324 | |
5% 10/1/40 | 1,000,000 | 1,068,764 | |
| Series 2021: | |||
3% 3/1/40 | 365,000 | 328,758 | |
3% 3/1/43 | 325,000 | 278,354 | |
4% 3/1/24 | 205,000 | 205,306 | |
4% 10/1/24 | 440,000 | 442,093 | |
4% 3/1/25 | 175,000 | 177,068 | |
4% 10/1/25 | 585,000 | 593,341 | |
4% 3/1/26 | 100,000 | 102,510 | |
4% 10/1/26 | 600,000 | 616,126 | |
4% 10/1/28 | 675,000 | 707,325 | |
4% 10/1/29 | 460,000 | 485,273 | |
4% 3/1/30 | 150,000 | 161,211 | |
4% 3/1/31 | 250,000 | 271,746 | |
4% 3/1/32 | 140,000 | 151,423 | |
4% 3/1/33 | 390,000 | 420,021 | |
4% 3/1/34 | 150,000 | 161,055 | |
4% 3/1/35 | 125,000 | 133,951 | |
4% 3/1/36 | 125,000 | 133,245 | |
4% 3/1/37 | 100,000 | 105,412 | |
4% 10/1/46 | 2,750,000 | 2,759,605 | |
4% 10/1/50 | 1,000,000 | 985,146 | |
| Series 2022 A: | |||
5% 10/1/47 | 1,000,000 | 1,052,607 | |
5% 10/1/52 | 1,000,000 | 1,044,672 | |
| Series 2023, 5% 3/1/45 | 5,645,000 | 6,256,075 | |
| Series Eight-G, 5% 12/1/31 | 1,000,000 | 1,033,945 | |
| Series Eight-J, 5% 3/1/27 | 500,000 | 510,791 | |
| Series Eight-L: | |||
5% 4/1/28 | 920,000 | 963,145 | |
5% 4/1/29 | 1,005,000 | 1,053,845 | |
5% 4/1/35 | 500,000 | 522,892 | |
| Minnesota Hsg. Fin. Agcy.: | |||
| (Mtg. Backed Securities Pass Through Prog.) Series 2019 C, 3.15% 6/1/49 | 749,313 | 687,938 | |
| (Mtg.-Backed Securities Pass-Through Prog.) Series H, 2.47% 1/1/50 | 1,628,497 | 1,439,420 | |
| Series 2015 A: | |||
5% 8/1/29 | 1,000,000 | 1,010,695 | |
5% 8/1/30 | 1,000,000 | 1,010,818 | |
5% 8/1/31 | 1,000,000 | 1,009,992 | |
5% 8/1/32 | 1,000,000 | 1,009,661 | |
5% 8/1/33 | 1,000,000 | 1,009,225 | |
| Series 2016 B, 3.5% 7/1/46 | 2,150,000 | 2,131,766 | |
| Series 2019 B, 4.25% 7/1/49 | 2,620,000 | 2,632,603 | |
| Series 2020 G, 3% 1/1/51 | 1,160,000 | 1,130,980 | |
| Series 2021 D, 3% 1/1/52 | 1,705,000 | 1,655,374 | |
| Series 2021 G, 2.4% 7/1/33 (b) | 830,000 | 722,183 | |
| Series 2021 H, 3% 7/1/52 | 1,160,000 | 1,124,928 | |
| Series 2021, 3% 7/1/51 | 3,335,000 | 3,247,284 | |
| Series 2022 M, 6% 1/1/53 | 2,470,000 | 2,663,406 | |
| Series 2023 B, 5.75% 7/1/53 | 3,000,000 | 3,219,366 | |
| Series 2023 E, 6.25% 7/1/54 | 2,000,000 | 2,214,237 | |
| Series 2023, 6% 7/1/53 | 1,000,000 | 1,093,373 | |
| Series B: | |||
3.5% 7/1/50 | 7,020,000 | 6,938,124 | |
4% 8/1/36 | 2,000,000 | 2,092,282 | |
| Series E, 3.5% 7/1/50 | 3,565,000 | 3,523,389 | |
| Series I, 3% 1/1/51 | 4,085,000 | 3,980,974 | |
| Minnesota Muni. Gas Agcy. Rev. Bonds Series 2022 A, 4%, tender 12/1/27 (c) | 7,000,000 | 7,043,793 | |
| Minnesota Muni. Pwr. Agcy. Elec. Rev.: | |||
| Series 2014: | |||
5% 10/1/27 | 750,000 | 760,660 | |
5% 10/1/30 | 1,000,000 | 1,013,991 | |
| Series 2016: | |||
3% 10/1/34 | 250,000 | 239,701 | |
4% 10/1/41 | 1,000,000 | 1,005,824 | |
5% 10/1/32 | 1,500,000 | 1,584,628 | |
5% 10/1/33 | 400,000 | 422,242 | |
5% 10/1/35 | 400,000 | 420,512 | |
5% 10/1/36 | 1,000,000 | 1,047,780 | |
| Minnesota Office of Higher Ed. Series2023, 5% 11/1/33 (b) | 3,600,000 | 4,013,565 | |
| Moorhead Series 2021 A, 2.125% 2/1/40 | 365,000 | 272,681 | |
| Moorhead Edl. Facilities Rev. (The Concordia College Corp. Proj.) Series 2016, 5% 12/1/25 | 1,320,000 | 1,329,225 | |
| Moorhead ISD No. 152: | |||
| (MN School District Cr. Enhancement Prog.) Series 2020 A, 2.5% 2/1/37 | 1,500,000 | 1,317,188 | |
| Series 2020 A, 4% 2/1/31 | 2,015,000 | 2,128,258 | |
| Mounds View Independent School District #621 (Minnesota School District Cr. Enhancement Prog.) Series 2018 A: | |||
| 3.45% 2/1/37 | 2,000,000 | 2,000,911 | |
| 3.55% 2/1/38 | 2,000,000 | 1,978,662 | |
| Nashwauk Keewatin Independent School District # 319 Gen. Oblig. Series 2022 A: | |||
| 4% 2/1/35 | 200,000 | 215,075 | |
| 4% 2/1/36 | 1,000,000 | 1,069,501 | |
| North St. Paul Maplewood-Oakdale Indpendent School District: | |||
| (Minnesota School District Cr. Enhancement Prog.) Series 2019 B, 3% 2/1/42 | 3,090,000 | 2,690,143 | |
| (MN School District Cr. Enhancement Prog.) Series 2019 B, 4% 2/1/32 | 3,120,000 | 3,286,096 | |
| Northern Muni. Pwr. Agcy. Elec. Sys. Rev.: | |||
| Series 2013 A: | |||
5% 1/1/24 | 650,000 | 650,000 | |
5% 1/1/25 | 975,000 | 976,247 | |
5% 1/1/31 | 1,740,000 | 1,742,199 | |
| Series 2016: | |||
5% 1/1/28 | 500,000 | 520,569 | |
5% 1/1/29 | 920,000 | 958,575 | |
5% 1/1/30 | 520,000 | 541,700 | |
5% 1/1/31 | 350,000 | 364,537 | |
| Series 2017: | |||
5% 1/1/31 | 400,000 | 424,691 | |
5% 1/1/33 | 475,000 | 502,572 | |
5% 1/1/35 | 520,000 | 549,450 | |
| Series 2023: | |||
5% 1/1/30 (Assured Guaranty Muni. Corp. Insured) | 1,050,000 | 1,177,663 | |
5% 1/1/31 (Assured Guaranty Muni. Corp. Insured) | 500,000 | 567,903 | |
5% 1/1/32 (Assured Guaranty Muni. Corp. Insured) | 345,000 | 391,493 | |
5% 1/1/33 (Assured Guaranty Muni. Corp. Insured) | 360,000 | 407,554 | |
| Northfield Minn Series 2021 A, 2% 2/1/29 | 300,000 | 291,815 | |
| Osseo Independent School District #279 Series 2020 A, 1.875% 2/1/37 | 3,205,000 | 2,517,944 | |
| Red Rock Central Independent School District Series 2022 A, 2.375% 2/1/45 | 1,310,000 | 954,865 | |
| Richfield Independent School District #280 Series 2018 A, 3.5% 2/1/43 | 260,000 | 247,158 | |
| Robbinsdale Independent School District 281 (MN School District Cr. Enhancement Prog.): | |||
| Series 2016, 3% 2/1/31 | 300,000 | 301,837 | |
| Series 2019 B, 5% 2/1/30 | 955,000 | 1,046,037 | |
| Rochester Ind. School District #535 (Minnesota School District Cr. Enhancement Prog.) Series 2020 A, 3% 2/1/35 | 1,515,000 | 1,442,491 | |
| Rochester Elec. Util. Rev. Series 2017 A, 5% 12/1/42 | 1,100,000 | 1,140,909 | |
| Rochester Gen. Oblig. Series 2020 C: | |||
| 1.5% 2/1/32 | 990,000 | 827,270 | |
| 1.625% 2/1/34 | 1,255,000 | 1,026,092 | |
| 1.75% 2/1/35 | 1,215,000 | 989,295 | |
| Rochester Health Care Facilities Rev.: | |||
| Series 2016 B: | |||
5% 11/15/31 | 3,750,000 | 4,419,017 | |
5% 11/15/33 | 1,220,000 | 1,483,811 | |
5% 11/15/35 | 4,000,000 | 4,936,533 | |
| Series 2018, 4% 11/15/48 | 3,400,000 | 3,362,382 | |
| Series 2022: | |||
4% 11/15/39 | 2,670,000 | 2,828,923 | |
5% 11/15/57 | 3,500,000 | 3,870,564 | |
| Roseville Independent School District Series 2021 A: | |||
| 5% 4/1/27 | 850,000 | 889,842 | |
| 5% 4/1/28 | 1,100,000 | 1,169,561 | |
| Roseville Independent School District #623 (MN School District Cr. Enhancement Prog.) Series 2018 A, 5% 2/1/29 | 5,180,000 | 5,537,252 | |
| Saint Cloud Health Care Rev.: | |||
| Series 2016 A: | |||
5% 5/1/29 | 1,125,000 | 1,175,592 | |
5% 5/1/30 | 1,000,000 | 1,044,198 | |
5% 5/1/31 | 1,000,000 | 1,043,220 | |
| Series 2019, 5% 5/1/48 | 6,000,000 | 6,296,263 | |
| Saint Paul Port Auth. District Series 2021 1: | |||
| 3% 10/1/26 | 100,000 | 100,072 | |
| 3% 10/1/34 | 285,000 | 278,211 | |
| 4% 10/1/41 | 500,000 | 489,832 | |
| Saint Paul Sales Tax Rev. Series 2014 G: | |||
| 5% 11/1/26 | 1,000,000 | 1,016,618 | |
| 5% 11/1/28 | 1,000,000 | 1,015,959 | |
| Sauk Rapids Minn Independent School District # 47 Series 2020 A, 2.5% 2/1/39 | 2,925,000 | 2,438,705 | |
| Shakopee Health Care Facilities Rev. Series 2014: | |||
| 5% 9/1/24 | 1,000,000 | 1,009,829 | |
| 5% 9/1/25 | 1,345,000 | 1,358,647 | |
| 5% 9/1/26 | 1,575,000 | 1,587,389 | |
| 5% 9/1/28 | 1,000,000 | 1,006,372 | |
| 5% 9/1/34 | 1,065,000 | 1,071,296 | |
| Shakopee Sr. Hsg. Rev. Bonds Series 2018, 5.85%, tender 11/1/25 (c)(d) | 2,900,000 | 2,813,582 | |
| South Washington County Independent School District #833 (Minnesota School District Cr. Enhancement Prog.) Series 2020 A, 3% 2/1/33 | 295,000 | 292,553 | |
| Southern Minnesota Muni. Pwr. Agcy. Pwr. Supply Sys. Rev.: | |||
| (Cap. Appreciation) Series 1994 A, 0% 1/1/26 (Nat'l. Pub. Fin. Guarantee Corp. Insured) | 3,320,000 | 3,095,420 | |
| Series 2015 A: | |||
5% 1/1/34 | 1,695,000 | 1,765,065 | |
5% 1/1/36 | 1,000,000 | 1,038,378 | |
| Series 2019 A, 5% 1/1/34 | 1,230,000 | 1,396,268 | |
| St Paul Independent School District (Minnesota School District Cr. Enhancement Prog.) Series 2022 E, 4% 2/1/40 | 1,575,000 | 1,649,819 | |
| St Paul Minn Wtr. Rev.: | |||
| Series 2021 F, 2% 12/1/41 | 1,220,000 | 847,676 | |
| Series 2023 A, 4% 12/1/47 | 1,000,000 | 1,017,487 | |
| St. Paul Hsg. & Redev. Auth. Health Care Facilities Rev.: | |||
| (Fairview Hsp & Hltcare Srv Sys. Proj.) Series 2017 A, 5% 11/15/47 | 4,395,000 | 4,487,648 | |
| Series 2015 A: | |||
5% 7/1/29 | 5,000,000 | 5,100,116 | |
5% 7/1/30 | 5,015,000 | 5,113,726 | |
| Series 2017 A: | |||
5% 11/15/28 | 460,000 | 488,069 | |
5% 11/15/30 | 650,000 | 689,451 | |
5% 11/15/31 | 845,000 | 895,817 | |
5% 11/15/33 | 3,410,000 | 3,612,128 | |
5% 11/15/34 | 665,000 | 704,131 | |
| Univ. of Minnesota Gen. Oblig.: | |||
| Series 2017 A, 5% 9/1/33 | 5,025,000 | 5,436,906 | |
| Series 2017 B, 5% 12/1/32 | 2,000,000 | 2,176,008 | |
| Series 2020 A: | |||
5% 11/1/31 | 1,070,000 | 1,245,947 | |
5% 11/1/33 | 1,015,000 | 1,177,405 | |
5% 11/1/45 | 6,050,000 | 6,639,128 | |
| Warren / Alvarado / Oslo Minni Series 2023 A: | |||
| 3.75% 2/1/42 | 1,030,000 | 1,022,724 | |
| 3.75% 2/1/43 | 845,000 | 836,080 | |
| Watertown Independent School District #111 (Minnesota School District Cr. Enhancement Prog.) Series 2020 A, 0% 2/1/29 | 1,000,000 | 837,660 | |
| Wayzata Sr Hsg. Rev. Series 2019: | |||
| 5% 8/1/49 | 500,000 | 485,233 | |
| 5% 8/1/54 | 1,000,000 | 956,243 | |
| West Saint Paul Independent School District #197 (Minnesota School District Cr. Enhancement Prog.) Series 2018 A: | |||
| 3.6% 2/1/37 | 2,000,000 | 2,009,601 | |
| 3.65% 2/1/38 | 2,000,000 | 1,987,457 | |
| 4% 2/1/41 | 2,400,000 | 2,428,855 | |
| Western Minnesota Muni. Pwr. Agcy. Pwr. Supply Rev. Series 2015 A, 5% 1/1/31 | 1,820,000 | 1,898,477 | |
| White Bear Lake Independent School District #624 Gen. Oblig.: | |||
| Series 2020 A, 3% 2/1/31 | 1,860,000 | 1,870,400 | |
| Series 2022 A, 4% 2/1/32 | 4,795,000 | 5,202,457 | |
| Wright County Series 2018 A: | |||
| 3.1% 12/1/32 | 1,790,000 | 1,757,966 | |
| 3.15% 12/1/33 | 1,865,000 | 1,833,990 | |
| 3.25% 12/1/34 | 2,345,000 | 2,319,114 | |
| 3.35% 12/1/36 | 2,440,000 | 2,387,523 | |
| Wright County Ctfs. of Prtn. Series 2019 A, 5% 12/1/31 | 1,000,000 | 1,141,384 | |
TOTAL MINNESOTA | 522,585,491 | ||
| Puerto Rico - 1.5% | |||
| Puerto Rico Commonwealth Pub. Impt. Gen. Oblig. Series 2021 A1: | |||
| 0% 7/1/33 | 1,705,673 | 1,063,346 | |
| 5.625% 7/1/27 | 190,000 | 200,928 | |
| 5.625% 7/1/29 | 595,000 | 645,321 | |
| 5.75% 7/1/31 | 1,420,000 | 1,579,546 | |
| Puerto Rico Hsg. Fin. Auth. Series 2020, 5% 12/1/27 | 1,225,000 | 1,313,077 | |
| Puerto Rico Indl., Tourist, Edl., Med. And Envir. Cont. Facilities Fing. Auth. Series 2021: | |||
| 4% 7/1/36 | 105,000 | 102,551 | |
| 4% 7/1/41 | 85,000 | 80,311 | |
| 5% 7/1/27 | 530,000 | 558,635 | |
| 5% 7/1/30 | 565,000 | 619,720 | |
| 5% 7/1/32 | 380,000 | 420,321 | |
| Puerto Rico Sales Tax Fing. Corp. Sales Tax Rev. Series 2019 A2, 4.329% 7/1/40 | 2,080,000 | 2,064,845 | |
TOTAL PUERTO RICO | 8,648,601 | ||
| TOTAL MUNICIPAL BONDS (Cost $540,092,165) | 532,281,497 | ||
| Municipal Notes - 1.7% | |||
Principal Amount (a) | Value ($) | ||
| Minnesota - 1.7% | |||
| Minneapolis Health Care Sys. Rev. (Fairview Health Svcs.) Series 2018 C, 4.05% 1/2/24, LOC Wells Fargo Bank NA, VRDN (c) | 6,590,000 | 6,590,000 | |
| Mizuho Floater / Residual Trust V Participating VRDN Series Floater MIZ 91 45, 4.42% 1/2/24 (Liquidity Facility Mizuho Cap. Markets LLC) (c)(e)(f) | 2,855,000 | 2,855,000 | |
| TOTAL MUNICIPAL NOTES (Cost $9,445,000) | 9,445,000 | ||
| TOTAL INVESTMENT IN SECURITIES - 96.7% (Cost $549,537,165) | 541,726,497 |
NET OTHER ASSETS (LIABILITIES) - 3.3% | 18,544,937 |
| NET ASSETS - 100.0% | 560,271,434 |
| VRDN | - | VARIABLE RATE DEMAND NOTE (A debt instrument that is payable upon demand, either daily, weekly or monthly) |
| (a) | Amount is stated in United States dollars unless otherwise noted. |
| (b) | Private activity obligations whose interest is subject to the federal alternative minimum tax for individuals. |
| (c) | Coupon rates for floating and adjustable rate securities reflect the rates in effect at period end. |
| (d) | Security exempt from registration under Rule 144A of the Securities Act of 1933. These securities may be resold in transactions exempt from registration, normally to qualified institutional buyers. At the end of the period, the value of these securities amounted to $2,813,582 or 0.5% of net assets. |
| (e) | Provides evidence of ownership in one or more underlying municipal bonds. |
| (f) | Coupon rates are determined by re-marketing agents based on current market conditions. |
| Valuation Inputs at Reporting Date: | ||||
| Description | Total ($) | Level 1 ($) | Level 2 ($) | Level 3 ($) |
Investments in Securities: | ||||
| Municipal Securities | 541,726,497 | - | 541,726,497 | - |
| Total Investments in Securities: | 541,726,497 | - | 541,726,497 | - |
| Statement of Assets and Liabilities | ||||
| December 31, 2023 | ||||
| Assets | ||||
Investment in securities, at value - See accompanying schedule Unaffiliated issuers (cost $549,537,165): | $ | 541,726,497 | ||
| Cash | 11,232,172 | |||
| Receivable for fund shares sold | 2,759,974 | |||
| Interest receivable | 6,730,124 | |||
| Prepaid expenses | 526 | |||
| Other receivables | 2,258 | |||
Total assets | 562,451,551 | |||
| Liabilities | ||||
| Payable for fund shares redeemed | $ | 1,451,689 | ||
| Distributions payable | 450,360 | |||
| Accrued management fee | 160,013 | |||
| Other affiliated payables | 63,117 | |||
| Other payables and accrued expenses | 54,938 | |||
| Total Liabilities | 2,180,117 | |||
| Net Assets | $ | 560,271,434 | ||
| Net Assets consist of: | ||||
| Paid in capital | $ | 577,842,863 | ||
| Total accumulated earnings (loss) | (17,571,429) | |||
| Net Assets | $ | 560,271,434 | ||
Net Asset Value, offering price and redemption price per share ($560,271,434 ÷ 50,208,279 shares) | $ | 11.16 | ||
| Statement of Operations | ||||
Year ended December 31, 2023 | ||||
| Investment Income | ||||
| Interest | $ | 16,462,848 | ||
| Expenses | ||||
| Management fee | $ | 1,980,745 | ||
| Transfer agent fees | 646,041 | |||
| Accounting fees and expenses | 140,494 | |||
| Custodian fees and expenses | 7,533 | |||
| Independent trustees' fees and expenses | 2,074 | |||
| Registration fees | 49,387 | |||
| Audit | 55,108 | |||
| Legal | 10,119 | |||
| Miscellaneous | 5,868 | |||
| Total expenses before reductions | 2,897,369 | |||
| Expense reductions | (25,842) | |||
| Total expenses after reductions | 2,871,527 | |||
| Net Investment income (loss) | 13,591,321 | |||
| Realized and Unrealized Gain (Loss) | ||||
| Net realized gain (loss) on: | ||||
| Investment Securities: | ||||
| Unaffiliated issuers | (6,678,499) | |||
| Total net realized gain (loss) | (6,678,499) | |||
| Change in net unrealized appreciation (depreciation) on investment securities | 19,893,997 | |||
| Net gain (loss) | 13,215,498 | |||
| Net increase (decrease) in net assets resulting from operations | $ | 26,806,819 | ||
| Statement of Changes in Net Assets | ||||
Year ended December 31, 2023 | Year ended December 31, 2022 | |||
| Increase (Decrease) in Net Assets | ||||
| Operations | ||||
| Net investment income (loss) | $ | 13,591,321 | $ | 12,655,805 |
| Net realized gain (loss) | (6,678,499) | (3,615,939) | ||
| Change in net unrealized appreciation (depreciation) | 19,893,997 | (60,238,095) | ||
| Net increase (decrease) in net assets resulting from operations | 26,806,819 | (51,198,229) | ||
| Distributions to shareholders | (13,432,199) | (12,925,960) | ||
| Share transactions | ||||
| Proceeds from sales of shares | 153,854,585 | 282,521,007 | ||
| Reinvestment of distributions | 8,080,739 | 8,361,606 | ||
| Cost of shares redeemed | (187,906,039) | (352,961,319) | ||
Net increase (decrease) in net assets resulting from share transactions | (25,970,715) | (62,078,706) | ||
| Total increase (decrease) in net assets | (12,596,095) | (126,202,895) | ||
| Net Assets | ||||
| Beginning of period | 572,867,529 | 699,070,424 | ||
| End of period | $ | 560,271,434 | $ | 572,867,529 |
| Other Information | ||||
| Shares | ||||
| Sold | 14,214,139 | 25,812,038 | ||
| Issued in reinvestment of distributions | 743,064 | 756,599 | ||
| Redeemed | (17,409,872) | (32,118,809) | ||
| Net increase (decrease) | (2,452,669) | (5,550,172) | ||
| Fidelity® Minnesota Municipal Income Fund |
| Years ended December 31, | 2023 | 2022 | 2021 | 2020 | 2019 | |||||
Selected Per-Share Data | ||||||||||
| Net asset value, beginning of period | $ | 10.88 | $ | 12.01 | $ | 12.18 | $ | 11.91 | $ | 11.41 |
| Income from Investment Operations | ||||||||||
Net investment income (loss) A,B | .259 | .230 | .227 | .251 | .280 | |||||
| Net realized and unrealized gain (loss) | .277 | (1.126) | (.143) | .296 | .525 | |||||
| Total from investment operations | .536 | (.896) | .084 | .547 | .805 | |||||
| Distributions from net investment income | (.256) | (.229) | (.222) | (.251) | (.280) | |||||
| Distributions from net realized gain | - | (.005) | (.032) | (.026) | (.025) | |||||
| Total distributions | (.256) | (.234) | (.254) | (.277) | (.305) | |||||
| Net asset value, end of period | $ | 11.16 | $ | 10.88 | $ | 12.01 | $ | 12.18 | $ | 11.91 |
Total Return C | 5.02% | (7.47)% | .70% | 4.65% | 7.12% | |||||
Ratios to Average Net Assets B,D,E | ||||||||||
| Expenses before reductions | .51% | .51% | .49% | .49% | .49% | |||||
| Expenses net of fee waivers, if any | .50% | .50% | .49% | .49% | .49% | |||||
| Expenses net of all reductions | .50% | .50% | .48% | .49% | .49% | |||||
| Net investment income (loss) | 2.38% | 2.07% | 1.88% | 2.09% | 2.38% | |||||
| Supplemental Data | ||||||||||
| Net assets, end of period (000 omitted) | $ | 560,271 | $ | 572,868 | $ | 699,070 | $ | 673,488 | $ | 593,754 |
Portfolio turnover rate F | 19% | 17% | 7% | 9% | 9% |
| Gross unrealized appreciation | $7,884,619 |
| Gross unrealized depreciation | (15,517,259) |
| Net unrealized appreciation (depreciation) | $(7,632,640) |
| Tax Cost | $549,359,137 |
| Undistributed tax-exempt income | $355,651 |
| Capital loss carryforward | $(10,294,439) |
| Net unrealized appreciation (depreciation) on securities and other investments | $(7,632,640) |
Short-term | $(915,024) |
Long-term | (9,379,415) |
| Total capital loss carryforward | $(10,294,439) |
| December 31, 2023 | December 31, 2022 | |
| Tax-exempt Income | $13,432,199 | $12,636,975 |
| Long-term Capital Gains | - | 288,985 |
| Total | $13,432,199 | $12,925,960 |
| Purchases ($) | Sales ($) | |
| Fidelity Minnesota Municipal Income Fund | 102,371,516 | 137,508,343 |
| % of Average Net Assets | |
| Fidelity Minnesota Municipal Income Fund | 0.0245% |
| % of Average Net Assets | |
| Fidelity Minnesota Municipal Income Fund | .02 |
| Maximum Management Fee Rate % | |
| Fidelity Minnesota Municipal Income Fund | .45 |
| Purchases ($) | Sales ($) | Realized Gain (Loss) ($) | |
| Fidelity Minnesota Municipal Income Fund | - | 10,700,000 | - |
| Amount | |
| Fidelity Minnesota Municipal Income Fund | $1,054 |
| The Example is based on an investment of $1,000 invested at the beginning of the period and held for the entire period (July 1, 2023 to December 31, 2023). |
Annualized Expense Ratio- A | Beginning Account Value July 1, 2023 | Ending Account Value December 31, 2023 | Expenses Paid During Period- C July 1, 2023 to December 31, 2023 | |||||||
Fidelity® Minnesota Municipal Income Fund ** | .49% | |||||||||
| Actual | $ 1,000 | $ 1,033.80 | $ 2.51 | |||||||
Hypothetical-B | $ 1,000 | $ 1,022.74 | $ 2.50 | |||||||
Annualized Expense Ratio- A | Expenses Paid | |||||
| Fidelity® Minnesota Municipal Income Fund | .46% | |||||
| Actual | $ 2.36 | |||||
Hypothetical- B | $ 2.35 | |||||
| A Annualized expense ratio reflects expenses net of applicable fee waivers. | ||||||
| B 5% return per year before expenses |
| A special meeting of shareholders was held on October 18, 2023. The results of votes taken among shareholders on the proposal before them are reported below. Each vote reported represents one dollar of net asset value held on the record date for the meeting. | ||
| Proposal 1 | ||
| To elect a Board of Trustees. | ||
# of Votes | % of Votes | |
| Abigail P. Johnson | ||
| Affirmative | 11,160,118,778.550 | 97.240 |
| Withheld | 316,510,692.230 | 2.760 |
| TOTAL | 11,476,629,470.780 | 100.000 |
| Jennifer Toolin McAuliffe | ||
| Affirmative | 11,160,843,041.160 | 97.250 |
| Withheld | 315,786,429.620 | 2.750 |
| TOTAL | 11,476,629,470.780 | 100.000 |
| Christine J. Thompson | ||
| Affirmative | 11,156,602,115.000 | 97.210 |
| Withheld | 320,027,355.780 | 2.790 |
| TOTAL | 11,476,629,470.780 | 100.000 |
| Elizabeth S. Acton | ||
| Affirmative | 11,110,214,430.850 | 96.810 |
| Withheld | 366,415,039.930 | 3.190 |
| TOTAL | 11,476,629,470.780 | 100.000 |
| Laura M. Bishop | ||
| Affirmative | 11,132,012,161.210 | 97.000 |
| Withheld | 344,617,309.570 | 3.000 |
| TOTAL | 11,476,629,470.780 | 100.000 |
| Ann E. Dunwoody | ||
| Affirmative | 11,125,767,777.290 | 96.940 |
| Withheld | 350,861,693.490 | 3.060 |
| TOTAL | 11,476,629,470.780 | 100.000 |
| John Engler | ||
| Affirmative | 11,009,456,697.420 | 95.930 |
| Withheld | 467,172,773.360 | 4.070 |
| TOTAL | 11,476,629,470.780 | 100.000 |
| Robert F. Gartland | ||
| Affirmative | 11,139,433,974.390 | 97.060 |
| Withheld | 337,195,496.390 | 2.940 |
| TOTAL | 11,476,629,470.780 | 100.000 |
| Robert W. Helm | ||
| Affirmative | 11,140,155,147.040 | 97.070 |
| Withheld | 336,474,323.740 | 2.930 |
| TOTAL | 11,476,629,470.780 | 100.000 |
| Arthur E. Johnson | ||
| Affirmative | 11,087,922,630.810 | 96.610 |
| Withheld | 388,706,839.970 | 3.390 |
| TOTAL | 11,476,629,470.780 | 100.000 |
| Michael E. Kenneally | ||
| Affirmative | 11,003,372,175.210 | 95.880 |
| Withheld | 473,257,295.570 | 4.120 |
| TOTAL | 11,476,629,470.780 | 100.000 |
| Mark A. Murray | ||
| Affirmative | 11,139,176,322.830 | 97.060 |
| Withheld | 337,453,147.950 | 2.940 |
| TOTAL | 11,476,629,470.780 | 100.000 |
| Carol J. Zierhoffer | ||
| Affirmative | 11,137,882,609.000 | 97.050 |
| Withheld | 338,746,861.780 | 2.950 |
| TOTAL | 11,476,629,470.780 | 100.000 |
| Proposal 1 reflects trust wide proposal and voting results. | ||
 |


Contents
| Average Annual Total Returns | |||
Periods ended December 31, 2023 | Past 1 year | Past 5 years | Past 10 years |
| Fidelity® Pennsylvania Municipal Income Fund | 6.38% | 2.01% | 2.90% |
| $10,000 Over 10 Years |
Let's say hypothetically that $10,000 was invested in Fidelity® Pennsylvania Municipal Income Fund on December 31, 2013. The chart shows how the value of your investment would have changed, and also shows how the Bloomberg Municipal Bond Index performed over the same period. |
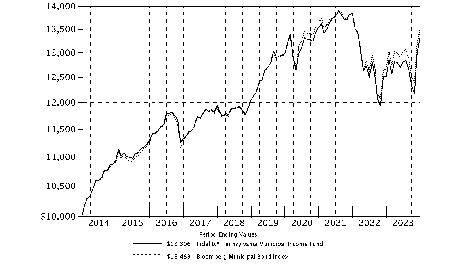 |
| Revenue Sources (% of Fund's net assets) | ||
| Health Care | 26.5 | |
| Education | 19.0 | |
| Transportation | 17.7 | |
| General Obligations | 13.9 | |
| Housing | 8.2 | |
| Others* (Individually Less Than 5%) | 14.7 | |
| 100.0 | ||
| *Includes net other assets | ||
Quality Diversification (% of Fund's net assets) |
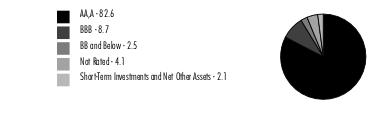 |
| We have used ratings from Moody's Investors Service, Inc. Where Moody's® ratings are not available, we have used S&P® ratings. All ratings are as of the date indicated and do not reflect subsequent changes. |
| Municipal Bonds - 97.9% | |||
Principal Amount (a) | Value ($) | ||
| Pennsylvania - 95.5% | |||
| Allegheny County Arpt. Auth. Rev. Series 2021 A, 5% 1/1/51 (b) | 12,000,000 | 12,483,976 | |
| Allegheny County Higher Ed. Bldg. Auth. Univ. Rev.: | |||
| Series 2017, 5% 10/15/47 | 1,660,000 | 1,542,237 | |
| Series 2018: | |||
5% 3/1/33 | 1,570,000 | 1,697,730 | |
5% 3/1/34 | 2,250,000 | 2,429,813 | |
| Series 2022 A: | |||
5% 3/1/24 | 500,000 | 501,418 | |
5% 3/1/27 | 1,740,000 | 1,847,104 | |
5% 3/1/31 | 1,105,000 | 1,258,056 | |
5% 3/1/34 | 645,000 | 745,693 | |
| Allegheny County Indl. Dev. Auth. Rev. Series 2021, 4.25% 12/1/50 | 3,000,000 | 1,938,543 | |
| Butler County Hosp. Auth. Hosp. Rev. (Butler Health Sys. Proj.) Series 2015 A: | |||
| 5% 7/1/26 | 500,000 | 503,822 | |
| 5% 7/1/27 | 490,000 | 494,639 | |
| 5% 7/1/28 | 540,000 | 545,617 | |
| 5% 7/1/29 | 710,000 | 717,618 | |
| 5% 7/1/30 | 685,000 | 692,269 | |
| 5% 7/1/35 | 1,885,000 | 1,901,706 | |
| 5% 7/1/39 | 6,675,000 | 6,688,516 | |
| Cap. Region Wtr. Wtr. Rev. Series 2018: | |||
| 5% 7/15/30 | 1,500,000 | 1,645,179 | |
| 5% 7/15/31 | 1,250,000 | 1,367,435 | |
| Centre County Pennsylvania Hosp. Auth. Rev. (Mount Nittany Med. Ctr. Proj.): | |||
| Series 2016 A: | |||
4% 11/15/32 | 350,000 | 354,619 | |
4% 11/15/34 | 250,000 | 252,865 | |
4% 11/15/35 | 200,000 | 201,964 | |
5% 11/15/28 | 840,000 | 867,926 | |
5% 11/15/29 | 1,625,000 | 1,675,793 | |
5% 11/15/30 | 685,000 | 705,260 | |
| Series 2016 B: | |||
4% 11/15/40 | 600,000 | 600,946 | |
4% 11/15/47 | 3,605,000 | 3,525,970 | |
| Series 2018 A: | |||
5% 11/15/26 | 1,140,000 | 1,204,404 | |
5% 11/15/27 | 225,000 | 240,550 | |
5% 11/15/28 | 200,000 | 213,655 | |
5% 11/15/29 | 200,000 | 212,776 | |
| Chartiers Valley School District Series 2021 A, 3% 10/15/49 | 4,000,000 | 3,099,650 | |
| Chester County Health & Ed. Facilities Auth. Health Sys. Rev. Series 2017 A, 5% 10/1/35 | 2,125,000 | 2,265,077 | |
| Commonwealth Fing. Auth. Rev. Series 2020 A, 5% 6/1/32 | 3,500,000 | 3,998,140 | |
| Commonwealth Fing. Auth. Tobacco Series 2018, 4% 6/1/39 (Assured Guaranty Muni. Corp. Insured) | 9,555,000 | 9,624,854 | |
| Cumberland County Muni. Auth. Rev. (Dickinson College Proj.) Series 2016: | |||
| 5% 5/1/30 | 1,000,000 | 1,038,018 | |
| 5% 5/1/31 | 500,000 | 518,781 | |
| 5% 5/1/32 | 750,000 | 777,660 | |
| 5% 5/1/33 | 2,210,000 | 2,289,997 | |
| 5% 5/1/34 | 1,000,000 | 1,035,290 | |
| Dallas Area Muni. Auth. Univ. Rev. (Misericordia Univ. Proj.) Series 2019, 5% 5/1/48 | 4,000,000 | 3,631,103 | |
| Dauphin County Gen. Auth. (Pinnacle Health Sys. Proj.) Series 2016 A: | |||
| 5% 6/1/34 | 1,275,000 | 1,323,894 | |
| 5% 6/1/35 | 1,000,000 | 1,037,269 | |
| 5% 6/1/36 | 625,000 | 646,901 | |
| Delaware County Auth. Rev.: | |||
| (Cabrini College) Series 2017, 5% 7/1/47 | 2,000,000 | 2,020,428 | |
| Series 2017, 5% 7/1/25 | 1,000,000 | 1,006,718 | |
| Doylestown Hosp. Auth. Hosp. Rev.: | |||
| Series 2016 A: | |||
5% 7/1/46 | 2,845,000 | 2,467,861 | |
5% 7/1/46 (Pre-Refunded to 7/1/26 @ 100) | 655,000 | 690,857 | |
| Series 2019 A, 4% 7/1/45 | 1,215,000 | 904,036 | |
| Dubois Hosp. Auth. Hosp. Rev.: | |||
| (Penn Highlands Healthcare Proj.) Series 2018, 5% 7/15/25 | 200,000 | 204,372 | |
| Series 2020: | |||
4% 7/15/45 | 1,520,000 | 1,426,362 | |
5% 7/15/31 | 1,030,000 | 1,098,252 | |
5% 7/15/34 | 1,000,000 | 1,065,896 | |
5% 7/15/36 | 1,400,000 | 1,477,209 | |
5% 7/15/39 | 1,160,000 | 1,207,248 | |
| East Lycoming School District Series 2021, 3% 9/15/35 | 700,000 | 662,514 | |
| Geisinger Auth. Health Sys. Rev. Series 2014 A, 4% 6/1/41 | 2,000,000 | 2,000,393 | |
| Lackawanna County Indl. Dev. Auth. Rev. (Univ. of Scranton Proj.) Series 2017: | |||
| 5% 11/1/24 | 590,000 | 597,967 | |
| 5% 11/1/25 | 665,000 | 685,758 | |
| 5% 11/1/27 | 1,105,000 | 1,182,975 | |
| Lancaster County Hosp. Auth. Health Ctr. Rev. Series 2016: | |||
| 5% 8/15/34 | 1,000,000 | 1,053,528 | |
| 5% 8/15/36 | 1,000,000 | 1,048,503 | |
| Lancaster Muni. Auth. Rev. Series 2023 B, 5% 6/1/29 | 4,000,000 | 4,483,546 | |
| Lehigh County Gen. Purp. Auth. Rev.: | |||
| (Muhlenberg College Proj.) Series 2017, 5% 2/1/39 | 4,010,000 | 4,155,483 | |
| Series 2021 A, 4% 11/1/51 | 4,000,000 | 3,441,946 | |
| Lehigh County Gen. Purp. Hosp. Rev. Series 2019 A: | |||
| 4% 7/1/49 | 5,000,000 | 4,798,122 | |
| 5% 7/1/36 | 2,905,000 | 3,117,705 | |
| 5% 7/1/44 | 5,000,000 | 5,240,450 | |
| Monroe County Hosp. Auth. Rev. Series 2016, 5% 7/1/33 | 3,675,000 | 3,792,108 | |
| Monroeville Fin. Auth. UPMC Rev. Series 2023 C: | |||
| 5% 5/15/36 | 280,000 | 319,645 | |
| 5% 5/15/37 | 330,000 | 372,029 | |
| 5% 5/15/38 | 390,000 | 432,512 | |
| 5% 5/15/39 | 250,000 | 275,158 | |
| Montgomery County Higher Ed. & Health Auth. Rev.: | |||
| Series 2014 A: | |||
5% 10/1/24 | 335,000 | 334,267 | |
5% 10/1/25 | 750,000 | 748,688 | |
5% 10/1/26 | 1,000,000 | 999,984 | |
5% 10/1/27 | 1,000,000 | 1,000,003 | |
| Series 2016 A, 5% 10/1/40 | 4,000,000 | 3,872,799 | |
| Series 2018 A, 5% 9/1/26 | 1,500,000 | 1,568,439 | |
| Series 2019: | |||
4% 9/1/34 | 2,500,000 | 2,551,182 | |
4% 9/1/35 | 1,400,000 | 1,426,105 | |
4% 9/1/36 | 1,200,000 | 1,222,569 | |
4% 9/1/37 | 1,000,000 | 1,017,379 | |
| Montgomery County Indl. Dev. Auth. Series 2017, 5% 12/1/36 | 2,670,000 | 2,834,669 | |
| Northampton County Gen. Purp. Auth. Hosp. Rev. (St. Luke's Univ. Health Network Proj.) Series 2018 A, 4% 8/15/48 | 4,500,000 | 4,184,762 | |
| Parkland School District Series 2021 C, 3% 2/1/35 | 665,000 | 630,150 | |
| Pennsylvania Ctfs. Prtn. Series 2018 A: | |||
| 5% 7/1/29 | 300,000 | 328,497 | |
| 5% 7/1/30 | 375,000 | 409,358 | |
| 5% 7/1/31 | 425,000 | 463,023 | |
| Pennsylvania Econ. Dev. Fing. Auth.: | |||
| Series 2023 A2: | |||
5% 5/15/36 | 400,000 | 459,424 | |
5% 5/15/37 | 500,000 | 567,976 | |
5% 5/15/38 | 500,000 | 559,986 | |
5% 5/15/39 | 620,000 | 690,695 | |
| Series 2023 B: | |||
5% 5/15/36 | 450,000 | 516,852 | |
5% 5/15/37 | 425,000 | 482,780 | |
5% 5/15/38 | 575,000 | 643,983 | |
5% 5/15/39 | 800,000 | 891,220 | |
| Pennsylvania Econ. Dev. Fing. Auth. Indl. Dev. Rev. (Presbyterian Sr. Living project) Series 2023 B1, 4.5% 7/1/35 | 2,910,000 | 2,962,430 | |
| Pennsylvania Econ. Dev. Fing. Auth. Solid Waste Disp. Rev. Bonds (Waste Mgmt., Inc. Proj.) Series 2021 A2, 4.6%, tender 10/1/26 (b)(c) | 10,845,000 | 10,959,764 | |
| Pennsylvania Gen. Oblig.: | |||
| Series 2016, 3% 9/15/35 | 315,000 | 311,834 | |
| Series 2020, 2% 5/1/39 | 500,000 | 376,101 | |
| Series 2021: | |||
2% 5/15/37 | 1,060,000 | 852,398 | |
2% 5/15/38 | 4,825,000 | 3,749,011 | |
| Pennsylvania Higher Ed. Assistance Agcy. Rev. Series 2023 A: | |||
| 5% 6/1/29 (b) | 2,965,000 | 3,186,840 | |
| 5% 6/1/30 (b) | 2,895,000 | 3,146,101 | |
| 5% 6/1/31 (b) | 4,450,000 | 4,875,775 | |
| 5% 6/1/32 (b) | 5,200,000 | 5,718,456 | |
| Pennsylvania Higher Edl. Facilities Auth. Rev.: | |||
| (Drexel Univ. Proj.) Series 2016, 5% 5/1/35 | 2,000,000 | 2,056,641 | |
| Series 2016, 5% 5/1/33 | 2,200,000 | 2,263,398 | |
| Series 2019 A: | |||
4% 3/1/37 | 1,150,000 | 1,183,596 | |
5% 3/1/36 | 1,000,000 | 1,086,120 | |
5% 3/1/38 | 1,055,000 | 1,121,606 | |
5% 3/1/39 | 1,000,000 | 1,055,924 | |
| Pennsylvania Hsg. Fin. Agcy.: | |||
| Series 2019 130A, 4% 10/1/49 | 880,000 | 877,345 | |
| Series 2019 131, 3.5% 4/1/49 | 2,485,000 | 2,460,147 | |
| Series 2020 13 2A, 3.5% 4/1/51 | 1,175,000 | 1,162,917 | |
| Series 2020 133: | |||
5% 10/1/24 | 850,000 | 860,546 | |
5% 10/1/27 | 650,000 | 700,018 | |
5% 10/1/28 | 950,000 | 1,039,506 | |
5% 4/1/29 | 100,000 | 109,889 | |
5% 10/1/29 | 450,000 | 498,337 | |
| Series 2021 134B: | |||
5% 4/1/24 (b) | 1,255,000 | 1,258,228 | |
5% 10/1/24 (b) | 1,000,000 | 1,009,093 | |
5% 10/1/25 (b) | 370,000 | 378,654 | |
5% 4/1/26 (b) | 995,000 | 1,025,611 | |
5% 10/1/26 (b) | 1,500,000 | 1,555,461 | |
| Series 2021 135B: | |||
5% 4/1/29 (b) | 2,400,000 | 2,573,372 | |
5% 10/1/29 (b) | 2,410,000 | 2,600,102 | |
| Series 2021 137: | |||
2.45% 10/1/41 | 1,305,000 | 1,040,777 | |
5% 4/1/24 | 225,000 | 225,950 | |
5% 10/1/24 | 265,000 | 268,288 | |
5% 4/1/25 | 200,000 | 204,352 | |
5% 10/1/25 | 220,000 | 227,030 | |
5% 4/1/26 | 240,000 | 250,285 | |
5% 10/1/26 | 280,000 | 295,229 | |
5% 4/1/27 | 225,000 | 239,819 | |
5% 10/1/27 | 225,000 | 242,314 | |
5% 4/1/28 | 250,000 | 270,953 | |
5% 10/1/28 | 260,000 | 284,496 | |
5% 4/1/29 | 310,000 | 340,655 | |
5% 10/1/29 | 365,000 | 404,206 | |
| Series 2023 142A: | |||
4.5% 10/1/38 | 5,925,000 | 6,218,126 | |
5% 10/1/43 | 2,000,000 | 2,132,796 | |
| Pennsylvania Hsg. Fin. Agcy. Single Family Mtg. Rev.: | |||
| Series 2015 B, 3.8% 10/1/35 | 1,080,000 | 1,082,727 | |
| Series 2016 121, 2.8% 10/1/31 | 350,000 | 328,276 | |
| Series 2017 125B, 3.65% 10/1/42 | 620,000 | 583,404 | |
| Pennsylvania Pub. School Bldg. Auth. School Rev. Series 2014 B2, 5% 12/1/25 | 335,000 | 341,096 | |
| Pennsylvania Tpk. Commission Tpk. Rev.: | |||
| (Sub Lien Proj.) Series 2017 B-1, 5% 6/1/34 | 5,000,000 | 5,313,418 | |
| Series 2013 A2: | |||
5% 12/1/28 | 500,000 | 534,491 | |
5% 12/1/38 | 2,500,000 | 2,648,961 | |
| Series 2014 A2, 0% 12/1/40 (d) | 5,500,000 | 5,704,129 | |
| Series 2019 A, 5% 12/1/37 | 5,815,000 | 6,408,722 | |
| Series 2020 B, 5% 12/1/50 | 5,000,000 | 5,366,293 | |
| Series 2021 A: | |||
4% 12/1/44 | 4,000,000 | 4,017,246 | |
4% 12/1/45 | 4,000,000 | 4,010,636 | |
4% 12/1/50 | 2,000,000 | 1,959,594 | |
| Series 2021 B: | |||
4% 12/1/40 | 1,000,000 | 1,020,911 | |
4% 12/1/41 | 1,000,000 | 1,018,081 | |
4% 12/1/42 | 1,500,000 | 1,516,292 | |
5% 12/1/46 | 2,000,000 | 2,180,936 | |
| Philadelphia Arpt. Rev.: | |||
| Series 2017 A, 5% 7/1/42 | 350,000 | 365,904 | |
| Series 2017 B: | |||
5% 7/1/31 (b) | 1,000,000 | 1,055,244 | |
5% 7/1/33 (b) | 2,250,000 | 2,367,931 | |
5% 7/1/37 (b) | 5,065,000 | 5,265,473 | |
5% 7/1/47 (b) | 3,035,000 | 3,099,328 | |
| Philadelphia Auth. for Indl. Dev.: | |||
| Series 2017, 5% 11/1/47 | 5,000,000 | 5,085,484 | |
| Series 2020 A, 4% 11/1/45 | 3,825,000 | 3,631,532 | |
| Series 2020 C: | |||
4% 11/1/35 | 1,750,000 | 1,782,483 | |
4% 11/1/36 | 1,500,000 | 1,524,126 | |
4% 11/1/37 | 1,255,000 | 1,266,462 | |
4% 11/1/38 | 1,000,000 | 1,004,915 | |
| Philadelphia Gas Works Rev.: | |||
| Series 16 A, 5% 8/1/50 (Assured Guaranty Muni. Corp. Insured) | 8,835,000 | 9,516,831 | |
| Series 2015 13: | |||
5% 8/1/29 | 2,000,000 | 2,048,423 | |
5% 8/1/30 | 1,500,000 | 1,530,523 | |
5% 8/1/31 | 1,100,000 | 1,121,029 | |
| Series 2016 14: | |||
5% 10/1/33 | 1,500,000 | 1,561,034 | |
5% 10/1/34 | 500,000 | 519,679 | |
| Philadelphia Gen. Oblig.: | |||
| Series 2017 A, 5% 8/1/30 | 1,500,000 | 1,615,391 | |
| Series 2019 B: | |||
5% 2/1/38 | 3,000,000 | 3,256,633 | |
5% 2/1/39 | 7,600,000 | 8,205,572 | |
| Philadelphia School District: | |||
| Series 2018 A: | |||
5% 9/1/29 | 1,250,000 | 1,352,348 | |
5% 9/1/30 | 1,000,000 | 1,080,865 | |
5% 9/1/33 | 1,000,000 | 1,076,173 | |
| Series 2019 A: | |||
4% 9/1/37 | 2,100,000 | 2,150,539 | |
4% 9/1/38 | 2,300,000 | 2,338,741 | |
4% 9/1/39 | 2,000,000 | 2,026,655 | |
| Philadelphia Wtr. & Wastewtr. Rev.: | |||
| Series 2020, 5% 10/1/40 | 3,195,000 | 3,466,401 | |
| Series 2023 B, 5.5% 9/1/53 (Assured Guaranty Muni. Corp. Insured) | 5,000,000 | 5,726,024 | |
| Pittsburgh & Allegheny County Parking Sys. Series 2017: | |||
| 5% 12/15/32 | 500,000 | 532,788 | |
| 5% 12/15/33 | 500,000 | 532,158 | |
| Pittsburgh Wtr. & Swr. Auth. Wtr. & Swr. Sys. Rev.: | |||
| Series 2019 A, 5% 9/1/44 (Assured Guaranty Muni. Corp. Insured) | 3,600,000 | 3,871,525 | |
| Series 2019 B: | |||
4% 9/1/34 (Assured Guaranty Muni. Corp. Insured) | 2,000,000 | 2,093,475 | |
4% 9/1/35 (Assured Guaranty Muni. Corp. Insured) | 400,000 | 417,312 | |
| Reading School District Series 2017, 5% 3/1/35 (Assured Guaranty Muni. Corp. Insured) | 1,000,000 | 1,059,421 | |
| Southcentral Pennsylvania Gen. Auth. Rev. Series 2015: | |||
| 4% 12/1/30 | 1,040,000 | 1,060,153 | |
| 5% 12/1/27 | 1,480,000 | 1,533,351 | |
| 5% 12/1/29 | 1,000,000 | 1,032,893 | |
| State Pub. School Bldg. Auth. Delaware County Cmnty. College Proj. Series 2023: | |||
| 5% 10/1/37 (Build America Mutual Assurance Insured) | 530,000 | 584,168 | |
| 5% 10/1/38 (Build America Mutual Assurance Insured) | 600,000 | 655,538 | |
| 5.25% 10/1/44 (Build America Mutual Assurance Insured) | 1,100,000 | 1,188,137 | |
| Susquehanna Area Reg'l. Arp Auth. Series 2017: | |||
| 5% 1/1/35 (b) | 1,000,000 | 1,033,304 | |
| 5% 1/1/38 (b) | 1,125,000 | 1,150,696 | |
| Union County Hosp. Auth. Rev. Series 2018 B, 5% 8/1/48 | 6,000,000 | 6,172,499 | |
| West Mifflin Area School District Series 2016: | |||
| 5% 4/1/24 (Assured Guaranty Muni. Corp. Insured) | 1,250,000 | 1,255,278 | |
| 5% 4/1/26 (Assured Guaranty Muni. Corp. Insured) | 1,000,000 | 1,047,291 | |
| 5% 4/1/28 (Assured Guaranty Muni. Corp. Insured) | 1,390,000 | 1,466,161 | |
| Westmoreland County Indl. Dev. Auth. (Excela Health Proj.) Series 2020 A: | |||
| 4% 7/1/26 | 1,000,000 | 1,009,096 | |
| 4% 7/1/37 | 1,400,000 | 1,337,944 | |
| 5% 7/1/27 | 200,000 | 209,192 | |
| 5% 7/1/28 | 1,130,000 | 1,193,960 | |
| 5% 7/1/29 | 500,000 | 532,019 | |
| 5% 7/1/30 | 1,000,000 | 1,067,932 | |
TOTAL PENNSYLVANIA | 386,752,848 | ||
| Pennsylvania, New Jersey - 0.9% | |||
| Delaware River Port Auth. Pennsylvania & New Jersey Rev. Series 2018 A: | |||
| 5% 1/1/37 | 1,000,000 | 1,096,434 | |
| 5% 1/1/38 | 1,300,000 | 1,424,256 | |
| 5% 1/1/39 | 1,000,000 | 1,092,076 | |
TOTAL PENNSYLVANIA, NEW JERSEY | 3,612,766 | ||
| Puerto Rico - 1.5% | |||
| Puerto Rico Commonwealth Aqueduct & Swr. Auth. Series 2021 B, 5% 7/1/37 (e) | 1,155,000 | 1,160,011 | |
| Puerto Rico Commonwealth Pub. Impt. Gen. Oblig. Series 2021 A1: | |||
| 0% 7/1/33 | 1,225,367 | 763,915 | |
| 5.625% 7/1/27 | 145,000 | 153,340 | |
| 5.625% 7/1/29 | 440,000 | 477,212 | |
| 5.75% 7/1/31 | 1,045,000 | 1,162,412 | |
| Puerto Rico Sales Tax Fing. Corp. Sales Tax Rev.: | |||
| Series 2018 A1, 0% 7/1/31 | 1,155,000 | 845,316 | |
| Series 2019 A2, 4.329% 7/1/40 | 1,455,000 | 1,444,399 | |
TOTAL PUERTO RICO | 6,006,605 | ||
| TOTAL MUNICIPAL BONDS (Cost $404,174,329) | 396,372,219 | ||
| Money Market Funds - 1.0% | |||
| Shares | Value ($) | ||
Fidelity Municipal Cash Central Fund 4.24% (f)(g) (Cost $3,849,000) | 3,848,230 | 3,849,000 | |
| TOTAL INVESTMENT IN SECURITIES - 98.9% (Cost $408,023,329) | 400,221,219 |
NET OTHER ASSETS (LIABILITIES) - 1.1% | 4,483,042 |
| NET ASSETS - 100.0% | 404,704,261 |
| (a) | Amount is stated in United States dollars unless otherwise noted. |
| (b) | Private activity obligations whose interest is subject to the federal alternative minimum tax for individuals. |
| (c) | Coupon rates for floating and adjustable rate securities reflect the rates in effect at period end. |
| (d) | Security initially issued in zero coupon form which converts to coupon form at a specified rate and date. The rate shown is the rate at period end. |
| (e) | Security exempt from registration under Rule 144A of the Securities Act of 1933. These securities may be resold in transactions exempt from registration, normally to qualified institutional buyers. At the end of the period, the value of these securities amounted to $1,160,011 or 0.3% of net assets. |
| (f) | Information in this report regarding holdings by state and security types does not reflect the holdings of the Fidelity Municipal Cash Central Fund. |
| (g) | Affiliated fund that is generally available only to investment companies and other accounts managed by Fidelity Investments. The rate quoted is the annualized seven-day yield of the fund at period end. A complete unaudited listing of the fund's holdings as of its most recent quarter end is available upon request. In addition, each Fidelity Central Fund's financial statements, which are not covered by the Fund's Report of Independent Registered Public Accounting Firm, are available on the SEC's website or upon request. |
| Affiliate | Value, beginning of period ($) | Purchases ($) | Sales Proceeds ($) | Dividend Income ($) | Realized Gain (loss) ($) | Change in Unrealized appreciation (depreciation) ($) | Value, end of period ($) | % ownership, end of period |
| Fidelity Municipal Cash Central Fund 4.24% | - | 82,585,000 | 78,736,000 | 347,668 | - | - | 3,849,000 | 0.2% |
| Total | - | 82,585,000 | 78,736,000 | 347,668 | - | - | 3,849,000 | |
| Valuation Inputs at Reporting Date: | ||||
| Description | Total ($) | Level 1 ($) | Level 2 ($) | Level 3 ($) |
Investments in Securities: | ||||
| Municipal Securities | 396,372,219 | - | 396,372,219 | - |
| Money Market Funds | 3,849,000 | 3,849,000 | - | - |
| Total Investments in Securities: | 400,221,219 | 3,849,000 | 396,372,219 | - |
| Statement of Assets and Liabilities | ||||
| December 31, 2023 | ||||
| Assets | ||||
| Investment in securities, at value - See accompanying schedule: | ||||
Unaffiliated issuers (cost $404,174,329) | $ | 396,372,219 | ||
Fidelity Central Funds (cost $3,849,000) | 3,849,000 | |||
| Total Investment in Securities (cost $408,023,329) | $ | 400,221,219 | ||
| Cash | 163,033 | |||
| Receivable for fund shares sold | 71,780 | |||
| Interest receivable | 5,052,614 | |||
| Distributions receivable from Fidelity Central Funds | 20,988 | |||
| Prepaid expenses | 371 | |||
| Other receivables | 429 | |||
Total assets | 405,530,434 | |||
| Liabilities | ||||
| Payable for fund shares redeemed | $ | 208,958 | ||
| Distributions payable | 406,560 | |||
| Accrued management fee | 115,641 | |||
| Other affiliated payables | 41,434 | |||
| Other payables and accrued expenses | 53,580 | |||
| Total Liabilities | 826,173 | |||
| Net Assets | $ | 404,704,261 | ||
| Net Assets consist of: | ||||
| Paid in capital | $ | 418,096,291 | ||
| Total accumulated earnings (loss) | (13,392,030) | |||
| Net Assets | $ | 404,704,261 | ||
Net Asset Value, offering price and redemption price per share ($404,704,261 ÷ 38,260,061 shares) | $ | 10.58 | ||
| Statement of Operations | ||||
Year ended December 31, 2023 | ||||
| Investment Income | ||||
| Interest | $ | 12,797,074 | ||
| Income from Fidelity Central Funds | 347,668 | |||
| Total Income | 13,144,742 | |||
| Expenses | ||||
| Management fee | $ | 1,398,505 | ||
| Transfer agent fees | 397,761 | |||
| Accounting fees and expenses | 104,493 | |||
| Custodian fees and expenses | 5,964 | |||
| Independent trustees' fees and expenses | 1,465 | |||
| Registration fees | 24,356 | |||
| Audit | 55,095 | |||
| Legal | 12,749 | |||
| Miscellaneous | 3,872 | |||
| Total expenses before reductions | 2,004,260 | |||
| Expense reductions | (14,504) | |||
| Total expenses after reductions | 1,989,756 | |||
| Net Investment income (loss) | 11,154,986 | |||
| Realized and Unrealized Gain (Loss) | ||||
| Net realized gain (loss) on: | ||||
| Investment Securities: | ||||
| Unaffiliated issuers | (3,848,915) | |||
| Total net realized gain (loss) | (3,848,915) | |||
| Change in net unrealized appreciation (depreciation) on investment securities | 17,144,301 | |||
| Net gain (loss) | 13,295,386 | |||
| Net increase (decrease) in net assets resulting from operations | $ | 24,450,372 | ||
| Statement of Changes in Net Assets | ||||
Year ended December 31, 2023 | Year ended December 31, 2022 | |||
| Increase (Decrease) in Net Assets | ||||
| Operations | ||||
| Net investment income (loss) | $ | 11,154,986 | $ | 10,937,191 |
| Net realized gain (loss) | (3,848,915) | (2,131,805) | ||
| Change in net unrealized appreciation (depreciation) | 17,144,301 | (59,341,779) | ||
| Net increase (decrease) in net assets resulting from operations | 24,450,372 | (50,536,393) | ||
| Distributions to shareholders | (10,991,793) | (10,893,254) | ||
| Share transactions | ||||
| Proceeds from sales of shares | 95,418,253 | 209,068,548 | ||
| Reinvestment of distributions | 6,257,235 | 6,861,043 | ||
| Cost of shares redeemed | (117,452,279) | (302,424,436) | ||
Net increase (decrease) in net assets resulting from share transactions | (15,776,791) | (86,494,845) | ||
| Total increase (decrease) in net assets | (2,318,212) | (147,924,492) | ||
| Net Assets | ||||
| Beginning of period | 407,022,473 | 554,946,965 | ||
| End of period | $ | 404,704,261 | $ | 407,022,473 |
| Other Information | ||||
| Shares | ||||
| Sold | 9,413,921 | 20,229,877 | ||
| Issued in reinvestment of distributions | 610,459 | 655,071 | ||
| Redeemed | (11,587,825) | (28,961,466) | ||
| Net increase (decrease) | (1,563,445) | (8,076,518) | ||
| Fidelity® Pennsylvania Municipal Income Fund |
| Years ended December 31, | 2023 | 2022 | 2021 | 2020 | 2019 | |||||
Selected Per-Share Data | ||||||||||
| Net asset value, beginning of period | $ | 10.22 | $ | 11.59 | $ | 11.59 | $ | 11.39 | $ | 10.92 |
| Income from Investment Operations | ||||||||||
Net investment income (loss) A,B | .284 | .255 | .251 | .275 | .310 | |||||
| Net realized and unrealized gain (loss) | .355 | (1.372) | .013 | .209 | .523 | |||||
| Total from investment operations | .639 | (1.117) | .264 | .484 | .833 | |||||
| Distributions from net investment income | (.279) | (.253) | (.251) | (.272) | (.307) | |||||
| Distributions from net realized gain | - | - | (.013) | (.012) | (.056) | |||||
| Total distributions | (.279) | (.253) | (.264) | (.284) | (.363) | |||||
| Net asset value, end of period | $ | 10.58 | $ | 10.22 | $ | 11.59 | $ | 11.59 | $ | 11.39 |
Total Return C | 6.38% | (9.66)% | 2.30% | 4.32% | 7.71% | |||||
Ratios to Average Net Assets B,D,E | ||||||||||
| Expenses before reductions | .50% | .49% | .48% | .49% | .48% | |||||
| Expenses net of fee waivers, if any | .49% | .49% | .48% | .49% | .48% | |||||
| Expenses net of all reductions | .49% | .49% | .48% | .48% | .48% | |||||
| Net investment income (loss) | 2.76% | 2.41% | 2.16% | 2.42% | 2.74% | |||||
| Supplemental Data | ||||||||||
| Net assets, end of period (000 omitted) | $ | 404,704 | $ | 407,022 | $ | 554,947 | $ | 535,587 | $ | 516,717 |
Portfolio turnover rate F | 21% | 7% | 5% | 17% | 20% |
| Fidelity Central Fund | Investment Manager | Investment Objective | Investment Practices | Expense RatioA |
| Fidelity Money Market Central Funds | Fidelity Management & Research Company LLC (FMR) | Each fund seeks to obtain a high level of current income consistent with the preservation of capital and liquidity. | Short-term Investments | Less than .005% |
| Gross unrealized appreciation | $6,705,767 |
| Gross unrealized depreciation | (14,294,815) |
| Net unrealized appreciation (depreciation) | $(7,589,048) |
| Tax Cost | $407,810,267 |
| Undistributed tax-exempt income | $176,657 |
| Capital loss carryforward | $(5,979,639) |
| Net unrealized appreciation (depreciation) on securities and other investments | $(7,589,048) |
| Short-term | $(1,946,636) |
| Long-term | (4,033,003) |
| Total capital loss carryforward | $(5,979,639) |
| December 31, 2023 | December 31, 2022 | |
| Tax-exempt Income | $10,991,793 | $10,893,254 |
| Purchases ($) | Sales ($) | |
| Fidelity Pennsylvania Municipal Income Fund | 87,292,326 | 80,596,689 |
| % of Average Net Assets | |
| Fidelity Pennsylvania Municipal Income Fund | 0.0258% |
| % of Average Net Assets | |
| Fidelity Pennsylvania Municipal Income Fund | .03 |
| Maximum Management Fee Rate % | |
| Fidelity Pennsylvania Municipal Income Fund | .44 |
| Amount | |
| Fidelity Pennsylvania Municipal Income Fund | $744 |
| The Example is based on an investment of $1,000 invested at the beginning of the period and held for the entire period (July 1, 2023 to December 31, 2023). |
Annualized Expense Ratio- A | Beginning Account Value July 1, 2023 | Ending Account Value December 31, 2023 | Expenses Paid During Period- C July 1, 2023 to December 31, 2023 | |||||||
Fidelity® Pennsylvania Municipal Income Fund ** | .48% | |||||||||
| Actual | $ 1,000 | $ 1,038.80 | $ 2.47 | |||||||
Hypothetical-B | $ 1,000 | $ 1,022.79 | $ 2.45 | |||||||
Annualized Expense Ratio- A | Expenses Paid | |||||
| Fidelity® Pennsylvania Municipal Income Fund | .45% | |||||
| Actual | $ 2.31 | |||||
Hypothetical- B | $ 2.29 | |||||
| A Annualized expense ratio reflects expenses net of applicable fee waivers. | ||||||
| B 5% return per year before expenses |
| A special meeting of shareholders was held on October 18, 2023. The results of votes taken among shareholders on the proposal before them are reported below. Each vote reported represents one dollar of net asset value held on the record date for the meeting. | ||
| Proposal 1 | ||
| To elect a Board of Trustees. | ||
# of Votes | % of Votes | |
| Abigail P. Johnson | ||
| Affirmative | 11,160,118,778.550 | 97.240 |
| Withheld | 316,510,692.230 | 2.760 |
| TOTAL | 11,476,629,470.780 | 100.000 |
| Jennifer Toolin McAuliffe | ||
| Affirmative | 11,160,843,041.160 | 97.250 |
| Withheld | 315,786,429.620 | 2.750 |
| TOTAL | 11,476,629,470.780 | 100.000 |
| Christine J. Thompson | ||
| Affirmative | 11,156,602,115.000 | 97.210 |
| Withheld | 320,027,355.780 | 2.790 |
| TOTAL | 11,476,629,470.780 | 100.000 |
| Elizabeth S. Acton | ||
| Affirmative | 11,110,214,430.850 | 96.810 |
| Withheld | 366,415,039.930 | 3.190 |
| TOTAL | 11,476,629,470.780 | 100.000 |
| Laura M. Bishop | ||
| Affirmative | 11,132,012,161.210 | 97.000 |
| Withheld | 344,617,309.570 | 3.000 |
| TOTAL | 11,476,629,470.780 | 100.000 |
| Ann E. Dunwoody | ||
| Affirmative | 11,125,767,777.290 | 96.940 |
| Withheld | 350,861,693.490 | 3.060 |
| TOTAL | 11,476,629,470.780 | 100.000 |
| John Engler | ||
| Affirmative | 11,009,456,697.420 | 95.930 |
| Withheld | 467,172,773.360 | 4.070 |
| TOTAL | 11,476,629,470.780 | 100.000 |
| Robert F. Gartland | ||
| Affirmative | 11,139,433,974.390 | 97.060 |
| Withheld | 337,195,496.390 | 2.940 |
| TOTAL | 11,476,629,470.780 | 100.000 |
| Robert W. Helm | ||
| Affirmative | 11,140,155,147.040 | 97.070 |
| Withheld | 336,474,323.740 | 2.930 |
| TOTAL | 11,476,629,470.780 | 100.000 |
| Arthur E. Johnson | ||
| Affirmative | 11,087,922,630.810 | 96.610 |
| Withheld | 388,706,839.970 | 3.390 |
| TOTAL | 11,476,629,470.780 | 100.000 |
| Michael E. Kenneally | ||
| Affirmative | 11,003,372,175.210 | 95.880 |
| Withheld | 473,257,295.570 | 4.120 |
| TOTAL | 11,476,629,470.780 | 100.000 |
| Mark A. Murray | ||
| Affirmative | 11,139,176,322.830 | 97.060 |
| Withheld | 337,453,147.950 | 2.940 |
| TOTAL | 11,476,629,470.780 | 100.000 |
| Carol J. Zierhoffer | ||
| Affirmative | 11,137,882,609.000 | 97.050 |
| Withheld | 338,746,861.780 | 2.950 |
| TOTAL | 11,476,629,470.780 | 100.000 |
| Proposal 1 reflects trust wide proposal and voting results. | ||
 |


Contents
| Average Annual Total Returns | |||
Periods ended December 31, 2023 | Past 1 year | Past 5 years | Past 10 years |
| Fidelity® Ohio Municipal Income Fund | 5.43% | 1.78% | 2.96% |
| $10,000 Over 10 Years |
Let's say hypothetically that $10,000 was invested in Fidelity® Ohio Municipal Income Fund on December 31, 2013. The chart shows how the value of your investment would have changed, and also shows how the Bloomberg Municipal Bond Index performed over the same period. |
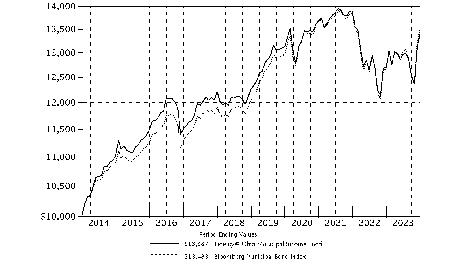 |
| Revenue Sources (% of Fund's net assets) | ||
| Health Care | 37.0 | |
| Education | 19.6 | |
| Special Tax | 8.8 | |
| Other | 6.8 | |
| General Obligations | 5.0 | |
| Others* (Individually Less Than 5%) | 22.8 | |
| 100.0 | ||
| *Includes net other assets | ||
Quality Diversification (% of Fund's net assets) |
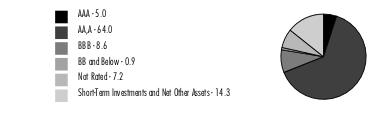 |
| We have used ratings from Moody's Investors Service, Inc. Where Moody's® ratings are not available, we have used S&P® ratings. All ratings are as of the date indicated and do not reflect subsequent changes. |
| Municipal Bonds - 85.7% | |||
Principal Amount (a) | Value ($) | ||
| Ohio - 84.1% | |||
| Akron Bath Copley Hosp. District Rev.: | |||
| (Summa Health Sys.) Series 2016, 5% 11/15/25 | 1,000,000 | 1,028,351 | |
| Series 2016: | |||
5% 11/15/26 | 535,000 | 559,220 | |
5.25% 11/15/32 | 1,000,000 | 1,054,883 | |
5.25% 11/15/34 | 1,500,000 | 1,575,408 | |
5.25% 11/15/41 | 10,545,000 | 10,789,809 | |
5.25% 11/15/46 | 2,650,000 | 2,689,722 | |
| Series 2020, 3% 11/15/40 | 5,400,000 | 4,400,502 | |
| Akron Income Tax Rev. Series 2022: | |||
| 4% 12/1/28 | 1,380,000 | 1,458,537 | |
| 4% 12/1/29 | 1,500,000 | 1,601,346 | |
| 4% 12/1/30 | 1,210,000 | 1,289,295 | |
| 4% 12/1/31 | 1,105,000 | 1,173,287 | |
| 4% 12/1/32 | 1,285,000 | 1,359,398 | |
| 4% 12/1/33 | 1,300,000 | 1,372,085 | |
| Allen County Hosp. Facilities Rev.: | |||
| (Mercy Health) Series 2017 A: | |||
4% 8/1/36 | 5,000,000 | 5,119,335 | |
5% 8/1/42 | 4,175,000 | 4,358,186 | |
| Series 2020 A: | |||
4% 12/1/40 | 11,880,000 | 12,005,389 | |
5% 12/1/35 | 750,000 | 837,612 | |
| American Muni. Pwr., Inc. Rev. Series 2023 A: | |||
| 5% 2/15/28 | 10,000,000 | 10,893,052 | |
| 5% 2/15/39 | 4,250,000 | 4,885,350 | |
| Bath Loc School District Series 2020, 2.125% 12/1/40 (Build America Mutual Assurance Insured) | 670,000 | 508,173 | |
| Buckeye Tobacco Settlement Fing. Auth.: | |||
| Series 2020 A2: | |||
3% 6/1/48 | 1,500,000 | 1,155,660 | |
4% 6/1/37 | 5,975,000 | 6,066,900 | |
4% 6/1/38 | 1,000,000 | 1,005,084 | |
4% 6/1/39 | 1,000,000 | 999,263 | |
4% 6/1/48 | 5,750,000 | 5,310,473 | |
5% 6/1/27 | 1,000,000 | 1,054,408 | |
5% 6/1/35 | 2,000,000 | 2,177,928 | |
5% 6/1/36 | 2,000,000 | 2,165,957 | |
| Series 2020 B2, 5% 6/1/55 | 1,400,000 | 1,315,658 | |
| Chillicothe Hosp. Facilities Rev. (Adena Health Sys. Oblig. Group Proj.) Series 2017, 5% 12/1/47 | 8,535,000 | 8,653,747 | |
| Cleveland Arpt. Sys. Rev.: | |||
| Series 2018 A: | |||
5% 1/1/43 (Assured Guaranty Muni. Corp. Insured) (b) | 1,750,000 | 1,814,092 | |
5% 1/1/48 (Assured Guaranty Muni. Corp. Insured) (b) | 3,000,000 | 3,075,728 | |
| Series 2019 B: | |||
5% 1/1/24 (b) | 1,200,000 | 1,200,000 | |
5% 1/1/25 (b) | 1,125,000 | 1,140,172 | |
5% 1/1/26 (b) | 710,000 | 730,581 | |
5% 1/1/27 (b) | 700,000 | 732,885 | |
| Cleveland Gen. Oblig.: | |||
| Series 2012, 5% 12/1/25 | 25,000 | 25,041 | |
| Series 2021 A: | |||
3% 12/1/31 | 270,000 | 269,738 | |
3% 12/1/35 | 370,000 | 361,488 | |
3% 12/1/36 | 430,000 | 411,565 | |
| Cleveland Income Tax Rev. Series 2018 A: | |||
| 5% 10/1/33 | 600,000 | 656,544 | |
| 5% 10/1/36 | 700,000 | 759,755 | |
| 5% 10/1/39 | 2,040,000 | 2,186,536 | |
| 5% 10/1/43 | 5,000,000 | 5,301,606 | |
| Cleveland Ohio Wtr. Poll. Ctl. Rev. Series 2016, 5% 11/15/36 | 450,000 | 461,392 | |
| Cleveland Pub. Library Facilities Series 2019 A: | |||
| 4% 12/1/33 | 425,000 | 451,648 | |
| 4% 12/1/34 | 370,000 | 392,337 | |
| 4% 12/1/35 | 620,000 | 652,144 | |
| 4% 12/1/36 | 1,400,000 | 1,451,579 | |
| 4% 12/1/37 | 1,115,000 | 1,147,150 | |
| 4% 12/1/38 | 650,000 | 665,046 | |
| Cleveland Pub. Pwr. Sys. Rev.: | |||
| Series 2018: | |||
5% 11/15/32 (Assured Guaranty Muni. Corp. Insured) | 365,000 | 400,672 | |
5% 11/15/34 (Assured Guaranty Muni. Corp. Insured) | 785,000 | 858,427 | |
5% 11/15/36 (Assured Guaranty Muni. Corp. Insured) | 1,000,000 | 1,084,436 | |
5% 11/15/38 (Assured Guaranty Muni. Corp. Insured) | 830,000 | 891,822 | |
| Series 2020 A: | |||
4% 11/15/35 (Assured Guaranty Muni. Corp. Insured) | 1,000,000 | 1,041,340 | |
4% 11/15/36 (Assured Guaranty Muni. Corp. Insured) | 1,000,000 | 1,031,546 | |
4% 11/15/37 (Assured Guaranty Muni. Corp. Insured) | 1,000,000 | 1,019,918 | |
| Cleveland-Cuyahoga County Port Auth. (The Cleveland Museum of Natural History Proj.) Series 2021: | |||
| 4% 7/1/46 | 850,000 | 842,997 | |
| 4% 7/1/51 | 1,000,000 | 974,569 | |
| Cleveland-Cuyahoga County Port Auth. Dev. Lease Rev. (Administrative Headquarters Proj.) Series 2013, 5% 7/1/37 | 3,000,000 | 3,501,617 | |
| Cleveland-Cuyahoga County Port Auth. Rev. (Euclid Avenue Dev. Corp. Proj.) Series 2022 A: | |||
| 5% 8/1/34 | 1,865,000 | 2,068,760 | |
| 5% 8/1/35 | 1,910,000 | 2,109,070 | |
| 5% 8/1/36 | 2,065,000 | 2,263,538 | |
| 5% 8/1/37 | 2,170,000 | 2,357,107 | |
| 5.5% 8/1/47 | 3,000,000 | 3,258,186 | |
| County of Cuyahoga (Ballpark Impt. Proj.) Series 2022 A: | |||
| 4% 1/1/36 | 3,855,000 | 4,078,149 | |
| 4% 1/1/37 | 3,755,000 | 3,941,584 | |
| Cuyahoga County Econ. Dev. Rev. (The Cleveland Orchestra Proj.) Series 2019: | |||
| 5% 1/1/29 | 325,000 | 355,749 | |
| 5% 1/1/30 | 250,000 | 275,902 | |
| 5% 1/1/31 | 525,000 | 579,637 | |
| 5% 1/1/32 | 500,000 | 551,359 | |
| 5% 1/1/33 | 400,000 | 441,311 | |
| 5% 1/1/34 | 300,000 | 331,567 | |
| 5% 1/1/35 | 500,000 | 552,763 | |
| 5% 1/1/36 | 440,000 | 484,181 | |
| 5% 1/1/37 | 400,000 | 436,406 | |
| 5% 1/1/39 | 1,400,000 | 1,506,966 | |
| 5% 1/1/40 | 1,620,000 | 1,738,993 | |
| Cuyahoga County Hosp. Rev. Series 2017: | |||
| 5% 2/15/26 | 1,750,000 | 1,802,303 | |
| 5% 2/15/27 | 1,700,000 | 1,779,312 | |
| 5% 2/15/28 | 2,385,000 | 2,473,046 | |
| 5% 2/15/30 | 3,000,000 | 3,115,917 | |
| 5% 2/15/31 | 1,500,000 | 1,552,955 | |
| 5% 2/15/32 | 1,450,000 | 1,496,255 | |
| 5% 2/15/42 | 5,135,000 | 5,167,926 | |
| Fairfield County Hosp. Facilities Rev. (Fairfield Med. Ctr. Proj.) Series 2013, 5.25% 6/15/43 | 5,000,000 | 4,687,506 | |
| Forest Hills Local School District Series 2015, 3.5% 12/1/33 | 790,000 | 780,959 | |
| Franklin County Convention Facilities Auth. (Greater Columbus Convention Ctr. Hotel Expansion Proj.) Series 2019: | |||
| 5% 12/1/44 | 2,500,000 | 2,383,970 | |
| 5% 12/1/51 | 6,000,000 | 5,569,753 | |
| Franklin County Hosp. Facilities Rev. Series 2016 C, 4% 11/1/40 | 3,000,000 | 3,015,506 | |
| Hamilton County Convention Facilities Auth. Rev. Series 2014, 5% 12/1/27 | 3,825,000 | 3,827,834 | |
| Hamilton County Healthcare Rev.: | |||
| (Life Enriching Cmntys. Proj.) Series 2016, 5% 1/1/31 | 1,350,000 | 1,362,223 | |
| Series 2023 A, 5.25% 1/1/38 | 1,755,000 | 1,777,585 | |
| Hamilton County Hosp. Facilities Rev. Series 2014, 5% 2/1/44 | 1,275,000 | 1,275,348 | |
| Kent State Univ. Revs.: | |||
| Series 2016, 5% 5/1/30 | 1,125,000 | 1,176,438 | |
| Series 2020 A: | |||
5% 5/1/45 | 1,250,000 | 1,345,901 | |
5% 5/1/50 | 1,700,000 | 1,814,341 | |
| Lake County Hosp. Facilities Rev. Series 2015, 5% 8/15/27 (Pre-Refunded to 8/15/25 @ 100) | 770,000 | 790,616 | |
| Lancaster Port Auth. Gas Rev.: | |||
| Bonds Series 2019, 5%, tender 2/1/25 (c) | 6,235,000 | 6,314,616 | |
| Series 2019, 5% 8/1/24 | 655,000 | 660,560 | |
| Miami County Hosp. Facilities Rev. (Kettering Health Network Obligated Group Proj.) Series 2019: | |||
| 5% 8/1/45 | 5,500,000 | 5,681,452 | |
| 5% 8/1/49 | 1,750,000 | 1,793,496 | |
| Miami Univ. Series 2022 A: | |||
| 5% 9/1/29 | 545,000 | 616,427 | |
| 5% 9/1/30 | 500,000 | 575,874 | |
| 5% 9/1/31 | 700,000 | 819,957 | |
| 5% 9/1/32 | 735,000 | 856,052 | |
| 5% 9/1/33 | 780,000 | 908,143 | |
| Middleburg Heights Hosp. Rev.: | |||
| Series 2020 A: | |||
4% 8/1/41 | 905,000 | 864,949 | |
4% 8/1/47 | 3,000,000 | 2,718,251 | |
| Series 2021 A, 4% 8/1/41 | 3,000,000 | 2,872,886 | |
| Milford Exempt Village School District Series 2015, 3.5% 12/1/31 | 500,000 | 502,298 | |
| Montgomery County Hosp. Rev.: | |||
| (Kettering Health Network Obligated Group Proj.) Series 2021: | |||
3% 8/1/51 | 4,880,000 | 3,546,005 | |
4% 8/1/37 | 1,125,000 | 1,150,509 | |
4% 8/1/41 | 850,000 | 853,779 | |
4% 8/1/51 | 2,000,000 | 1,873,589 | |
5% 8/1/32 | 750,000 | 838,226 | |
5% 8/1/36 | 1,225,000 | 1,349,449 | |
5% 8/1/38 | 1,000,000 | 1,084,256 | |
5% 8/1/39 | 1,100,000 | 1,186,329 | |
| Series 2021, 4% 8/1/46 | 1,230,000 | 1,204,743 | |
| Northeast Ohio Reg'l. Swr. District Wastewtr. Rev.: | |||
| Series 2016, 3% 11/15/36 | 250,000 | 238,091 | |
| Series 2019, 3% 11/15/34 | 1,385,000 | 1,356,162 | |
| Ohio Cap. Facilities Lease (Ohio Gen. Oblig. Proj.) Series 2017 A: | |||
| 5% 10/1/35 | 1,450,000 | 1,555,835 | |
| 5% 10/1/36 | 1,250,000 | 1,335,282 | |
| 5% 10/1/37 | 1,430,000 | 1,520,267 | |
| Ohio Higher Edl. Facility Commission Rev.: | |||
| (Case Western Reserve Univ. Proj.) Series 2019 B: | |||
5% 12/1/37 | 835,000 | 918,797 | |
5% 12/1/38 | 1,100,000 | 1,205,630 | |
5% 12/1/39 | 775,000 | 845,604 | |
| (Denison Univ. 2021 Proj.) Series 2021: | |||
5% 11/1/30 | 300,000 | 345,515 | |
5% 11/1/33 | 300,000 | 341,711 | |
5% 11/1/35 | 300,000 | 339,421 | |
5% 11/1/41 | 300,000 | 326,702 | |
| (Kenyon College 2020 Proj.) Series 2020: | |||
5% 7/1/38 | 2,500,000 | 2,725,259 | |
5% 7/1/39 | 2,640,000 | 2,861,154 | |
| (Kenyon College, Oh. Proj.) Series 2017: | |||
4% 7/1/36 | 400,000 | 408,142 | |
4% 7/1/37 | 450,000 | 458,226 | |
5% 7/1/28 | 400,000 | 426,913 | |
5% 7/1/29 | 735,000 | 784,645 | |
5% 7/1/30 | 300,000 | 320,643 | |
5% 7/1/31 | 400,000 | 427,204 | |
5% 7/1/33 | 650,000 | 692,672 | |
5% 7/1/35 | 1,550,000 | 1,645,457 | |
5% 7/1/42 | 1,400,000 | 1,457,224 | |
| (Oberlin College 2023 Proj.): | |||
Series 2023 A, 5.25% 10/1/53 | 8,955,000 | 10,054,612 | |
Series 2023 B: | |||
5% 10/1/37 | 1,270,000 | 1,489,674 | |
5% 10/1/38 | 1,330,000 | 1,544,647 | |
| (Otterbein Univ. 2022 Proj.) Series 2022 A, 4% 12/1/46 | 1,250,000 | 1,100,346 | |
| (The College of Wooster 2018 Proj.) Series 2018: | |||
5% 9/1/33 | 1,445,000 | 1,583,905 | |
5% 9/1/45 | 4,255,000 | 4,466,679 | |
| (Univ. of Dayton 2018 Proj.) Series A, 5% 12/1/48 | 1,000,000 | 1,043,227 | |
| (Univ. of Dayton 2020 Proj.) Series 2020: | |||
3% 2/1/37 | 1,335,000 | 1,208,091 | |
4% 2/1/36 | 900,000 | 934,700 | |
5% 2/1/34 | 1,000,000 | 1,109,230 | |
5% 2/1/35 | 800,000 | 884,172 | |
| (Univ. of Dayton Proj.) Series 2018 B: | |||
4% 12/1/33 | 1,155,000 | 1,195,676 | |
5% 12/1/29 | 1,310,000 | 1,429,907 | |
5% 12/1/31 | 1,130,000 | 1,225,285 | |
5% 12/1/35 | 1,000,000 | 1,072,025 | |
5% 12/1/36 | 1,000,000 | 1,066,274 | |
| (Xavier Univ. Proj.) Series 2015 C, 5% 5/1/29 | 855,000 | 877,579 | |
| Bonds (Case Western Reserve Univ. Proj.) Series 2019 C, 1.625%, tender 12/1/26 (c) | 5,000,000 | 4,767,644 | |
| Series 2019, 4% 10/1/49 | 3,270,000 | 3,084,365 | |
| Ohio Hosp. Facilities Rev. Series 2021 B: | |||
| 5% 1/1/32 | 1,580,000 | 1,864,574 | |
| 5% 1/1/35 | 230,000 | 269,292 | |
| 5% 1/1/36 | 540,000 | 627,769 | |
| 5% 1/1/37 | 250,000 | 288,546 | |
| 5% 1/1/38 | 855,000 | 972,568 | |
| 5% 1/1/39 | 925,000 | 1,047,128 | |
| Ohio Hosp. Rev.: | |||
| Series 2020 A, 4% 1/15/50 | 1,000,000 | 944,615 | |
| Series 2020: | |||
3% 1/15/45 | 2,500,000 | 1,948,976 | |
4% 11/15/37 | 1,025,000 | 997,076 | |
4% 11/15/39 | 1,115,000 | 1,053,706 | |
4% 11/15/40 | 1,110,000 | 1,037,623 | |
4% 11/15/41 | 1,175,000 | 1,080,614 | |
5% 11/15/33 | 1,270,000 | 1,361,165 | |
5% 11/15/35 | 1,465,000 | 1,560,027 | |
| Series 2021 A, 3% 1/15/46 | 5,000,000 | 3,805,673 | |
| Ohio Hsg. Fin. Agcy. Residential Mtg. Rev.: | |||
| (Mtg. - Backed Securities Prog.) Series 2021 C, 2.7% 9/1/46 | 3,900,000 | 2,899,187 | |
| (Mtg. Backed Securities Prog.): | |||
Series 2017 B, 4.5% 3/1/47 (b) | 290,000 | 290,352 | |
Series 2019 B, 4.5% 3/1/50 | 3,735,000 | 3,768,381 | |
| (Mtg.-Backed Secrities Prog.) Series 2023 A, 5.5% 3/1/53 | 4,000,000 | 4,264,934 | |
| (Mtg.-Backed Securities Prog.) Series 2022 A: | |||
2.3% 3/1/33 | 1,910,000 | 1,690,957 | |
5% 3/1/30 | 400,000 | 443,362 | |
5% 3/1/31 | 600,000 | 674,422 | |
5% 9/1/31 | 640,000 | 723,951 | |
| Series 2021 C, 3.25% 3/1/51 | 7,220,000 | 7,054,642 | |
| Series 2022 B, 5% 3/1/52 | 2,880,000 | 2,986,171 | |
| Ohio Spl. Oblig.: | |||
| (Administrative Bldg. Fund Projs.) Series 2020 B, 5% 4/1/39 | 1,865,000 | 2,059,914 | |
| Series 2021 A: | |||
5% 4/1/37 | 1,680,000 | 1,906,814 | |
5% 4/1/38 | 1,000,000 | 1,122,263 | |
5% 4/1/39 | 1,000,000 | 1,117,209 | |
5% 4/1/40 | 1,110,000 | 1,233,816 | |
5% 4/1/41 | 750,000 | 830,218 | |
| Ohio State Univ. Gen. Receipts Series 2023 C, 5.25% 12/1/46 | 10,000,000 | 11,398,690 | |
| Ohio Tpk. Commission Tpk. Rev.: | |||
| (Infrastructure Proj.) Series 2005 A, 0% 2/15/43 | 10,000,000 | 4,526,669 | |
| Series A, 5% 2/15/46 | 7,500,000 | 8,199,354 | |
| Ohio Wtr. Dev. Auth. Wtr. Poll. Cont. Rev. Series 2019 B, 3% 12/1/33 | 435,000 | 428,835 | |
| Port Auth. Econ. Dev. Rev.: | |||
| (Univ. of Northwestern Ohio Proj.) Series 2021, 4% 12/1/35 | 1,300,000 | 1,232,882 | |
| Series 2021, 4% 12/1/31 | 710,000 | 691,680 | |
| Ross County Hosp. Facilities Rev. (Adena Health Sys. Obligated Group Proj.) Series 2019, 5% 12/1/49 | 2,000,000 | 2,060,275 | |
| Scioto County Hosp. Facilities Rev. Series 2016: | |||
| 5% 2/15/28 | 5,030,000 | 5,208,671 | |
| 5% 2/15/30 | 3,860,000 | 3,973,079 | |
| 5% 2/15/32 | 2,550,000 | 2,612,322 | |
| 5% 2/15/33 | 2,460,000 | 2,514,587 | |
| 5% 2/15/34 | 4,450,000 | 4,550,903 | |
| Univ. of Cincinnati Gen. Receipts: | |||
| Series 2016 A: | |||
5% 6/1/32 | 745,000 | 779,949 | |
5% 6/1/34 | 585,000 | 610,361 | |
| Series 2019 A, 3% 6/1/39 | 3,000,000 | 2,686,242 | |
| Univ. of Toledo Gen. Receipts Series 2018 A: | |||
| 5% 6/1/26 | 600,000 | 629,840 | |
| 5% 6/1/27 | 350,000 | 375,876 | |
| Village of Bluffton Hosp. Facilities Blanchard Valley Reg Health Ctr. Series 2017: | |||
| 4% 12/1/32 | 1,500,000 | 1,530,685 | |
| 5% 12/1/29 | 825,000 | 874,794 | |
| 5% 12/1/31 | 750,000 | 795,080 | |
| Washington County Hosp. Rev. Series 2022: | |||
| 6% 12/1/28 | 200,000 | 205,776 | |
| 6% 12/1/29 | 215,000 | 222,504 | |
| 6% 12/1/30 | 230,000 | 238,879 | |
| 6% 12/1/31 | 245,000 | 255,163 | |
| West Carrollton Ohio City Schd Series 2020 A, 3% 12/1/44 | 2,150,000 | 1,793,798 | |
| Wright State Univ. Gen. Receipts Series 2022 A: | |||
| 5% 5/1/25 (Build America Mutual Assurance Insured) | 490,000 | 502,242 | |
| 5% 5/1/26 (Build America Mutual Assurance Insured) | 520,000 | 544,934 | |
| 5% 5/1/27 (Build America Mutual Assurance Insured) | 545,000 | 583,507 | |
| 5% 5/1/28 (Build America Mutual Assurance Insured) | 565,000 | 618,633 | |
| 5% 5/1/29 (Build America Mutual Assurance Insured) | 600,000 | 669,912 | |
| 5% 5/1/30 (Build America Mutual Assurance Insured) | 235,000 | 267,007 | |
| 5% 5/1/31 (Build America Mutual Assurance Insured) | 250,000 | 288,164 | |
| 5% 5/1/32 (Build America Mutual Assurance Insured) | 260,000 | 302,983 | |
TOTAL OHIO | 423,971,972 | ||
| Puerto Rico - 1.6% | |||
| Puerto Rico Commonwealth Aqueduct & Swr. Auth. Series 2021 B, 5% 7/1/37 (d) | 1,455,000 | 1,461,313 | |
| Puerto Rico Commonwealth Pub. Impt. Gen. Oblig. Series 2021 A1: | |||
| 0% 7/1/33 | 1,634,241 | 1,018,814 | |
| 5.625% 7/1/27 | 190,000 | 200,928 | |
| 5.625% 7/1/29 | 590,000 | 639,898 | |
| 5.75% 7/1/31 | 1,395,000 | 1,551,737 | |
| Puerto Rico Sales Tax Fing. Corp. Sales Tax Rev.: | |||
| Series 2018 A1, 0% 7/1/31 | 1,515,000 | 1,108,791 | |
| Series 2019 A2, 4.329% 7/1/40 | 1,860,000 | 1,846,448 | |
TOTAL PUERTO RICO | 7,827,929 | ||
| TOTAL MUNICIPAL BONDS (Cost $439,256,490) | 431,799,901 | ||
| Municipal Notes - 9.4% | |||
Principal Amount (a) | Value ($) | ||
| Ohio - 9.4% | |||
| East Alabama Health Care Auth. Participating VRDN Series BAML 5036, 4.14% 1/2/24 (Liquidity Facility Bank of America NA) (c)(e)(f) | 1,750,000 | 1,750,000 | |
| Franklin County Hosp. Facilities Rev. Series 2022, 4.05% 1/2/24 (Liquidity Facility JPMorgan Chase Bank), VRDN (c) | 8,100,000 | 8,100,000 | |
| Ohio Higher Edl. Facility Commission Rev. (Cleveland Clinic Foundation Proj.) Series 2008 B4, 4.2% 1/2/24 (Liquidity Facility Barclays Bank PLC), VRDN (c) | 24,820,000 | 24,819,988 | |
| Ohio Hosp. Facilities Rev. Participating VRDN Series Floater BAML 50 40, 4.09% 1/2/24 (Liquidity Facility Bank of America NA) (c)(e)(f) | 3,000,000 | 3,000,000 | |
| RIB Floater Trust Various States Participating VRDN Series 2022 D1, 4% 1/2/24 (Liquidity Facility Barclays Bank PLC) (c)(e)(f) | 9,495,000 | 9,495,000 | |
| TOTAL MUNICIPAL NOTES (Cost $47,164,997) | 47,164,988 | ||
| Money Market Funds - 4.4% | |||
| Shares | Value ($) | ||
Fidelity Municipal Cash Central Fund 4.24% (g)(h) (Cost $22,416,404) | 22,411,921 | 22,416,404 | |
| TOTAL INVESTMENT IN SECURITIES - 99.5% (Cost $508,837,891) | 501,381,293 |
NET OTHER ASSETS (LIABILITIES) - 0.5% | 2,674,162 |
| NET ASSETS - 100.0% | 504,055,455 |
| VRDN | - | VARIABLE RATE DEMAND NOTE (A debt instrument that is payable upon demand, either daily, weekly or monthly) |
| (a) | Amount is stated in United States dollars unless otherwise noted. |
| (b) | Private activity obligations whose interest is subject to the federal alternative minimum tax for individuals. |
| (c) | Coupon rates for floating and adjustable rate securities reflect the rates in effect at period end. |
| (d) | Security exempt from registration under Rule 144A of the Securities Act of 1933. These securities may be resold in transactions exempt from registration, normally to qualified institutional buyers. At the end of the period, the value of these securities amounted to $1,461,313 or 0.3% of net assets. |
| (e) | Provides evidence of ownership in one or more underlying municipal bonds. |
| (f) | Coupon rates are determined by re-marketing agents based on current market conditions. |
| (g) | Information in this report regarding holdings by state and security types does not reflect the holdings of the Fidelity Municipal Cash Central Fund. |
| (h) | Affiliated fund that is generally available only to investment companies and other accounts managed by Fidelity Investments. The rate quoted is the annualized seven-day yield of the fund at period end. A complete unaudited listing of the fund's holdings as of its most recent quarter end is available upon request. In addition, each Fidelity Central Fund's financial statements, which are not covered by the Fund's Report of Independent Registered Public Accounting Firm, are available on the SEC's website or upon request. |
| Affiliate | Value, beginning of period ($) | Purchases ($) | Sales Proceeds ($) | Dividend Income ($) | Realized Gain (loss) ($) | Change in Unrealized appreciation (depreciation) ($) | Value, end of period ($) | % ownership, end of period |
| Fidelity Municipal Cash Central Fund 4.24% | - | 99,197,404 | 76,781,000 | 701,667 | - | - | 22,416,404 | 0.9% |
| Total | - | 99,197,404 | 76,781,000 | 701,667 | - | - | 22,416,404 | |
| Valuation Inputs at Reporting Date: | ||||
| Description | Total ($) | Level 1 ($) | Level 2 ($) | Level 3 ($) |
Investments in Securities: | ||||
| Municipal Securities | 478,964,889 | - | 478,964,889 | - |
| Money Market Funds | 22,416,404 | 22,416,404 | - | - |
| Total Investments in Securities: | 501,381,293 | 22,416,404 | 478,964,889 | - |
| Statement of Assets and Liabilities | ||||
| December 31, 2023 | ||||
| Assets | ||||
| Investment in securities, at value - See accompanying schedule: | ||||
Unaffiliated issuers (cost $486,421,487) | $ | 478,964,889 | ||
Fidelity Central Funds (cost $22,416,404) | 22,416,404 | |||
| Total Investment in Securities (cost $508,837,891) | $ | 501,381,293 | ||
| Cash | 100,197 | |||
| Receivable for fund shares sold | 51,969 | |||
| Interest receivable | 5,255,075 | |||
| Distributions receivable from Fidelity Central Funds | 97,091 | |||
| Prepaid expenses | 474 | |||
| Other receivables | 568 | |||
Total assets | 506,886,667 | |||
| Liabilities | ||||
| Payable for fund shares redeemed | $ | 2,127,477 | ||
| Distributions payable | 451,192 | |||
| Accrued management fee | 144,809 | |||
| Other affiliated payables | 53,226 | |||
| Other payables and accrued expenses | 54,508 | |||
| Total Liabilities | 2,831,212 | |||
| Net Assets | $ | 504,055,455 | ||
| Net Assets consist of: | ||||
| Paid in capital | $ | 523,007,188 | ||
| Total accumulated earnings (loss) | (18,951,733) | |||
| Net Assets | $ | 504,055,455 | ||
Net Asset Value, offering price and redemption price per share ($504,055,455 ÷ 44,017,171 shares) | $ | 11.45 | ||
| Statement of Operations | ||||
Year ended December 31, 2023 | ||||
| Investment Income | ||||
| Interest | $ | 15,040,380 | ||
| Income from Fidelity Central Funds | 701,667 | |||
| Total Income | 15,742,047 | |||
| Expenses | ||||
| Management fee | $ | 1,780,128 | ||
| Transfer agent fees | 525,990 | |||
| Accounting fees and expenses | 131,257 | |||
| Custodian fees and expenses | 6,883 | |||
| Independent trustees' fees and expenses | 1,870 | |||
| Registration fees | 25,165 | |||
| Audit | 55,103 | |||
| Legal | 587 | |||
| Miscellaneous | 5,253 | |||
| Total expenses before reductions | 2,532,236 | |||
| Expense reductions | (18,980) | |||
| Total expenses after reductions | 2,513,256 | |||
| Net Investment income (loss) | 13,228,791 | |||
| Realized and Unrealized Gain (Loss) | ||||
| Net realized gain (loss) on: | ||||
| Investment Securities: | ||||
| Unaffiliated issuers | (8,159,500) | |||
| Total net realized gain (loss) | (8,159,500) | |||
| Change in net unrealized appreciation (depreciation) on investment securities | 21,583,469 | |||
| Net gain (loss) | 13,423,969 | |||
| Net increase (decrease) in net assets resulting from operations | $ | 26,652,760 | ||
| Statement of Changes in Net Assets | ||||
Year ended December 31, 2023 | Year ended December 31, 2022 | |||
| Increase (Decrease) in Net Assets | ||||
| Operations | ||||
| Net investment income (loss) | $ | 13,228,791 | $ | 12,981,459 |
| Net realized gain (loss) | (8,159,500) | (3,655,544) | ||
| Change in net unrealized appreciation (depreciation) | 21,583,469 | (69,553,192) | ||
| Net increase (decrease) in net assets resulting from operations | 26,652,760 | (60,227,277) | ||
| Distributions to shareholders | (13,023,068) | (12,952,540) | ||
| Share transactions | ||||
| Proceeds from sales of shares | 87,432,066 | 191,298,771 | ||
| Reinvestment of distributions | 8,233,937 | 8,354,939 | ||
| Cost of shares redeemed | (126,970,252) | (321,989,652) | ||
Net increase (decrease) in net assets resulting from share transactions | (31,304,249) | (122,335,942) | ||
| Total increase (decrease) in net assets | (17,674,557) | (195,515,759) | ||
| Net Assets | ||||
| Beginning of period | 521,730,012 | 717,245,771 | ||
| End of period | $ | 504,055,455 | $ | 521,730,012 |
| Other Information | ||||
| Shares | ||||
| Sold | 7,927,835 | 16,957,245 | ||
| Issued in reinvestment of distributions | 737,902 | 736,204 | ||
| Redeemed | (11,480,668) | (28,417,832) | ||
| Net increase (decrease) | (2,814,931) | (10,724,383) | ||
| Fidelity® Ohio Municipal Income Fund |
| Years ended December 31, | 2023 | 2022 | 2021 | 2020 | 2019 | |||||
Selected Per-Share Data | ||||||||||
| Net asset value, beginning of period | $ | 11.14 | $ | 12.46 | $ | 12.53 | $ | 12.38 | $ | 11.89 |
| Income from Investment Operations | ||||||||||
Net investment income (loss) A,B | .288 | .251 | .253 | .287 | .319 | |||||
| Net realized and unrealized gain (loss) | .306 | (1.321) | (.064) | .235 | .515 | |||||
| Total from investment operations | .594 | (1.070) | .189 | .522 | .834 | |||||
| Distributions from net investment income | (.284) | (.250) | (.253) | (.287) | (.319) | |||||
| Distributions from net realized gain | - | - | (.006) | (.085) | (.025) | |||||
| Total distributions | (.284) | (.250) | (.259) | (.372) | (.344) | |||||
| Net asset value, end of period | $ | 11.45 | $ | 11.14 | $ | 12.46 | $ | 12.53 | $ | 12.38 |
Total Return C | 5.43% | (8.60)% | 1.52% | 4.28% | 7.08% | |||||
Ratios to Average Net Assets B,D,E | ||||||||||
| Expenses before reductions | .49% | .49% | .48% | .48% | .48% | |||||
| Expenses net of fee waivers, if any | .49% | .49% | .48% | .48% | .48% | |||||
| Expenses net of all reductions | .49% | .49% | .48% | .48% | .48% | |||||
| Net investment income (loss) | 2.58% | 2.19% | 2.02% | 2.31% | 2.60% | |||||
| Supplemental Data | ||||||||||
| Net assets, end of period (000 omitted) | $ | 504,055 | $ | 521,730 | $ | 717,246 | $ | 702,067 | $ | 672,948 |
Portfolio turnover rate F | 21% | 14% | 6% | 20% | 10% |
| Fidelity Central Fund | Investment Manager | Investment Objective | Investment Practices | Expense RatioA |
| Fidelity Money Market Central Funds | Fidelity Management & Research Company LLC (FMR) | Each fund seeks to obtain a high level of current income consistent with the preservation of capital and liquidity. | Short-term Investments | Less than .005% |
| Gross unrealized appreciation | $8,526,928 |
| Gross unrealized depreciation | (15,747,747) |
| Net unrealized appreciation (depreciation) | $(7,220,819) |
| Tax Cost | $508,602,112 |
| Undistributed tax-exempt income | $89,108 |
| Undistributed ordinary income | $9 |
| Capital loss carryforward | $(11,820,031) |
| Net unrealized appreciation (depreciation) on securities and other investments | $(7,220,819) |
Short-term | $(1,525,935) |
Long-term | (10,294,096) |
| Total capital loss carryforward | $(11,820,031) |
| December 31, 2023 | December 31, 2022 | |
| Tax-exempt Income | $13,023,068 | $12,952,540 |
| Purchases ($) | Sales ($) | |
| Fidelity Ohio Municipal Income Fund | 94,374,852 | 134,512,778 |
| % of Average Net Assets | |
| Fidelity Ohio Municipal Income Fund | 0.0255% |
| % of Average Net Assets | |
| Fidelity Ohio Municipal Income Fund | .03 |
| Maximum Management Fee Rate % | |
Fidelity Ohio Municipal Income Fund | .44 |
| Purchases ($) | Sales ($) | Realized Gain (Loss) ($) | |
| Fidelity Ohio Municipal Income Fund | - | 7,200,000 | - |
| Amount | |
| Fidelity Ohio Municipal Income Fund | $951 |
| The Example is based on an investment of $1,000 invested at the beginning of the period and held for the entire period (July 1, 2023 to December 31, 2023). |
Annualized Expense Ratio- A | Beginning Account Value July 1, 2023 | Ending Account Value December 31, 2023 | Expenses Paid During Period- C July 1, 2023 to December 31, 2023 | |||||||
Fidelity® Ohio Municipal Income Fund ** | .48% | |||||||||
| Actual | $ 1,000 | $ 1,032.60 | $ 2.46 | |||||||
Hypothetical-B | $ 1,000 | $ 1,022.79 | $ 2.45 | |||||||
Annualized Expense Ratio- A | Expenses Paid | |||||
| Fidelity® Ohio Municipal Income Fund | .45% | |||||
| Actual | $ 2.31 | |||||
Hypothetical- B | $ 2.29 | |||||
| A Annualized expense ratio reflects expenses net of applicable fee waivers. | ||||||
| B 5% return per year before expenses |
| A special meeting of shareholders was held on October 18, 2023. The results of votes taken among shareholders on the proposal before them are reported below. Each vote reported represents one dollar of net asset value held on the record date for the meeting. | ||
| Proposal 1 | ||
| To elect a Board of Trustees. | ||
# of Votes | % of Votes | |
| Abigail P. Johnson | ||
| Affirmative | 11,160,118,778.550 | 97.240 |
| Withheld | 316,510,692.230 | 2.760 |
| TOTAL | 11,476,629,470.780 | 100.000 |
| Jennifer Toolin McAuliffe | ||
| Affirmative | 11,160,843,041.160 | 97.250 |
| Withheld | 315,786,429.620 | 2.750 |
| TOTAL | 11,476,629,470.780 | 100.000 |
| Christine J. Thompson | ||
| Affirmative | 11,156,602,115.000 | 97.210 |
| Withheld | 320,027,355.780 | 2.790 |
| TOTAL | 11,476,629,470.780 | 100.000 |
| Elizabeth S. Acton | ||
| Affirmative | 11,110,214,430.850 | 96.810 |
| Withheld | 366,415,039.930 | 3.190 |
| TOTAL | 11,476,629,470.780 | 100.000 |
| Laura M. Bishop | ||
| Affirmative | 11,132,012,161.210 | 97.000 |
| Withheld | 344,617,309.570 | 3.000 |
| TOTAL | 11,476,629,470.780 | 100.000 |
| Ann E. Dunwoody | ||
| Affirmative | 11,125,767,777.290 | 96.940 |
| Withheld | 350,861,693.490 | 3.060 |
| TOTAL | 11,476,629,470.780 | 100.000 |
| John Engler | ||
| Affirmative | 11,009,456,697.420 | 95.930 |
| Withheld | 467,172,773.360 | 4.070 |
| TOTAL | 11,476,629,470.780 | 100.000 |
| Robert F. Gartland | ||
| Affirmative | 11,139,433,974.390 | 97.060 |
| Withheld | 337,195,496.390 | 2.940 |
| TOTAL | 11,476,629,470.780 | 100.000 |
| Robert W. Helm | ||
| Affirmative | 11,140,155,147.040 | 97.070 |
| Withheld | 336,474,323.740 | 2.930 |
| TOTAL | 11,476,629,470.780 | 100.000 |
| Arthur E. Johnson | ||
| Affirmative | 11,087,922,630.810 | 96.610 |
| Withheld | 388,706,839.970 | 3.390 |
| TOTAL | 11,476,629,470.780 | 100.000 |
| Michael E. Kenneally | ||
| Affirmative | 11,003,372,175.210 | 95.880 |
| Withheld | 473,257,295.570 | 4.120 |
| TOTAL | 11,476,629,470.780 | 100.000 |
| Mark A. Murray | ||
| Affirmative | 11,139,176,322.830 | 97.060 |
| Withheld | 337,453,147.950 | 2.940 |
| TOTAL | 11,476,629,470.780 | 100.000 |
| Carol J. Zierhoffer | ||
| Affirmative | 11,137,882,609.000 | 97.050 |
| Withheld | 338,746,861.780 | 2.950 |
| TOTAL | 11,476,629,470.780 | 100.000 |
| Proposal 1 reflects trust wide proposal and voting results. | ||
 |
Item 2.
Code of Ethics
As of the end of the period, December 31, 2023, Fidelity Municipal Trust (the trust) has adopted a code of ethics, as defined in Item 2 of Form N-CSR, that applies to its President and Treasurer and its Chief Financial Officer. A copy of the code of ethics is filed as an exhibit to this Form N-CSR.
Item 3.
Audit Committee Financial Expert
The Board of Trustees of the trust has determined that Elizabeth S. Acton is an audit committee financial expert, as defined in Item 3 of Form N-CSR. Ms. Acton is independent for purposes of Item 3 of Form N-CSR.
Item 4.
Principal Accountant Fees and Services
Fees and Services
The following table presents fees billed by PricewaterhouseCoopers LLP (“PwC”) in each of the last two fiscal years for services rendered to Fidelity Conservative Income Municipal Bond Fund, Fidelity Flex Conservative Income Municipal Bond Fund, Fidelity Flex Municipal Income Fund, Fidelity Limited Term Municipal Income Fund, Fidelity Michigan Municipal Income Fund, Fidelity Minnesota Municipal Income Fund, Fidelity Municipal Income Fund, Fidelity Ohio Municipal Income Fund and Fidelity Pennsylvania Municipal Income Fund (the “Funds”):
Services Billed by PwC
December 31, 2023 FeesA
Audit Fees | Audit-Related Fees | Tax Fees | All Other Fees | |
Fidelity Conservative Income Municipal Bond Fund | $47,600 | $3,500 | $5,500 | $1,500 |
Fidelity Flex Conservative Income Municipal Bond Fund | $47,400 | $3,600 | $5,500 | $1,500 |
Fidelity Flex Municipal Income Fund | $47,400 | $3,600 | $5,500 | $1,500 |
Fidelity Limited Term Municipal Income Fund | $53,500 | $4,000 | $5,500 | $1,700 |
Fidelity Michigan Municipal Income Fund | $43,400 | $3,300 | $5,500 | $1,400 |
Fidelity Minnesota Municipal Income Fund | $43,400 | $3,300 | $5,500 | $1,400 |
Fidelity Municipal Income Fund | $54,800 | $4,100 | $5,600 | $1,700 |
Fidelity Ohio Municipal Income Fund | $43,400 | $3,300 | $5,500 | $1,400 |
Fidelity Pennsylvania Municipal Income Fund | $43,400 | $3,300 | $5,500 | $1,400 |
December 31, 2022 FeesA
Audit Fees | Audit-Related Fees | Tax Fees | All Other Fees | |
Fidelity Conservative Income Municipal Bond Fund | $43,600 | $3,500 | $5,200 | $1,600 |
Fidelity Flex Conservative Income Municipal Bond Fund | $45,300 | $3,700 | $5,200 | $1,600 |
Fidelity Flex Municipal Income Fund | $45,300 | $3,700 | $5,200 | $1,600 |
Fidelity Limited Term Municipal Income Fund | $51,000 | $4,100 | $5,200 | $1,800 |
Fidelity Michigan Municipal Income Fund | $41,500 | $3,400 | $5,200 | $1,500 |
Fidelity Minnesota Municipal Income Fund | $41,500 | $3,400 | $5,200 | $1,500 |
Fidelity Municipal Income Fund | $52,100 | $4,200 | $5,300 | $1,800 |
Fidelity Ohio Municipal Income Fund | $41,500 | $3,400 | $5,200 | $1,500 |
Fidelity Pennsylvania Municipal Income Fund | $41,500 | $3,400 | $5,200 | $1,500 |
A Amounts may reflect rounding.
The following table(s) present(s) fees billed by PwC that were required to be approved by the Audit Committee for services that relate directly to the operations and financial reporting of the Fund(s) and that are rendered on behalf of Fidelity Management & Research Company LLC ("FMR") and entities controlling, controlled by, or under common control with FMR (not including any sub-adviser whose role is primarily portfolio management and is subcontracted with or overseen by another investment adviser) that provide ongoing services to the Fund(s) (“Fund Service Providers”):
Services Billed by PwC
December 31, 2023A | December 31, 2022A | |
Audit-Related Fees | $8,284,200 | $7,914,600 |
Tax Fees | $1,000 | $1,000 |
All Other Fees | $- | $- |
A Amounts may reflect rounding.
“Audit-Related Fees” represent fees billed for assurance and related services that are reasonably related to the performance of the fund audit or the review of the fund's financial statements and that are not reported under Audit Fees.
“Tax Fees” represent fees billed for tax compliance, tax advice or tax planning that relate directly to the operations and financial reporting of the fund.
“All Other Fees” represent fees billed for services provided to the fund or Fund Service Provider, a significant portion of which are assurance related, that relate directly to the operations and financial reporting of the fund, excluding those services that are reported under Audit Fees, Audit-Related Fees or Tax Fees.
Assurance services must be performed by an independent public accountant.
* * *
The aggregate non-audit fees billed by PwC for services rendered to the Fund(s), FMR (not including any sub-adviser whose role is primarily portfolio management and is subcontracted with or overseen by another investment adviser), and any Fund Service Provider for each of the last two fiscal years of the Fund(s) are as follows:
Billed By | December 31, 2023A | December 31, 2022A |
PwC | $13,682,900 | $12,977,100 |
A Amounts may reflect rounding.
The trust's Audit Committee has considered non-audit services that were not pre-approved that were provided by PwC to Fund Service Providers to be compatible with maintaining the independence of PwC in its(their) audit of the Fund(s), taking into account representations from PwC, in accordance with Public Company Accounting Oversight Board rules, regarding its independence from the Fund(s) and its(their) related entities and FMR’s review of the appropriateness and permissibility under applicable law of such non-audit services prior to their provision to the Fund(s) Service Providers.
Audit Committee Pre-Approval Policies and Procedures
The trust’s Audit Committee must pre-approve all audit and non-audit services provided by a fund’s independent registered public accounting firm relating to the operations or financial reporting of the fund. Prior to the commencement of any audit or non-audit services to a fund, the Audit Committee reviews the services to determine whether they are appropriate and permissible under applicable law.
The Audit Committee has adopted policies and procedures to, among other purposes, provide a framework for the Committee’s consideration of non-audit services by the audit firms that audit the Fidelity funds. The policies and procedures require that any non-audit service provided by a fund audit firm to a Fidelity fund and any non-audit service provided by a fund auditor to a Fund Service Provider that relates directly to the operations and financial reporting of a Fidelity fund (“Covered Service”) are subject to approval by the Audit Committee before such service is provided.
All Covered Services must be approved in advance of provision of the service either: (i) by formal resolution of the Audit Committee, or (ii) by oral or written approval of the service by the Chair of the Audit Committee (or if the Chair is unavailable, such other member of the Audit Committee as may be designated by the Chair to act in the Chair’s absence). The approval contemplated by (ii) above is permitted where the Treasurer determines that action on such an engagement is necessary before the next meeting of the Audit Committee.
Non-audit services provided by a fund audit firm to a Fund Service Provider that do not relate directly to the operations and financial reporting of a Fidelity fund are reported to the Audit Committee periodically.
Non-Audit Services Approved Pursuant to Rule 2-01(c)(7)(i)(C) and (ii) of Regulation S-X (“De Minimis Exception”)
There were no non-audit services approved or required to be approved by the Audit Committee pursuant to the De Minimis Exception during the Fund’s(s’) last two fiscal years relating to services provided to (i) the Fund(s) or (ii) any Fund Service Provider that relate directly to the operations and financial reporting of the Fund(s).
The Registrant has not retained, for the preparation of the audit report on the financial statements included in the Form N-CSR, a registered public accounting firm that has a branch or office that is located in a foreign jurisdiction and that the Public Company Accounting Oversight Board (the “PCAOB”) has determined that the PCAOB is unable to inspect or investigate completely because of a position taken by an authority in the foreign jurisdiction.
The Registrant is not a “foreign issuer,” as defined in 17 CFR 240.3b-4.
Item 5.
Audit Committee of Listed Registrants
Not applicable.
Item 6.
Investments
(a)
Not applicable.
(b)
Not applicable.
Item 7.
Disclosure of Proxy Voting Policies and Procedures for Closed-End Management Investment Companies
Not applicable.
Item 8.
Portfolio Managers of Closed-End Management Investment Companies
Not applicable.
Item 9.
Purchase of Equity Securities by Closed-End Management Investment Company and Affiliated Purchasers
Not applicable.
Item 10.
Submission of Matters to a Vote of Security Holders
There were no material changes to the procedures by which shareholders may recommend nominees to the trust’s Board of Trustees.
Item 11.
Controls and Procedures
(a)(i) The President and Treasurer and the Chief Financial Officer have concluded that the trust’s disclosure controls and procedures (as defined in Rule 30a-3(c) under the Investment Company Act) provide reasonable assurances that material information relating to the trust is made known to them by the appropriate persons, based on their evaluation of these controls and procedures as of a date within 90 days of the filing date of this report.
(a)(ii) There was no change in the trust’s internal control over financial reporting (as defined in Rule 30a-3(d) under the Investment Company Act) that occurred during the period covered by this report that has materially affected, or is reasonably likely to materially affect, the trust’s internal control over financial reporting.
Item 12.
Disclosure of Securities Lending Activities for Closed-End Management
Investment Companies
Not applicable.
Item 18.
Recovery of Erroneously Awarded Compensation
(a)
Not applicable.
(b)
Not applicable.
Item 19.
Exhibits
(a) | (1) | Code of Ethics pursuant to Item 2 of Form N-CSR is filed and attached hereto as EX-99.CODE ETH. |
(a) | (2) | |
(a) | (3) | Not applicable. |
(b) |
SIGNATURES
Pursuant to the requirements of the Securities Exchange Act of 1934 and the Investment Company Act of 1940, the registrant has duly caused this report to be signed on its behalf by the undersigned, thereunto duly authorized.
Fidelity Municipal Trust
By: | /s/Laura M. Del Prato |
Laura M. Del Prato | |
President and Treasurer | |
Date: | February 22, 2024 |
Pursuant to the requirements of the Securities Exchange Act of 1934 and the Investment Company Act of 1940, this report has been signed below by the following persons on behalf of the registrant and in the capacities and on the dates indicated.
By: | /s/Laura M. Del Prato |
Laura M. Del Prato | |
President and Treasurer | |
Date: | February 22, 2024 |
By: | /s/John J. Burke III |
John J. Burke III | |
Chief Financial Officer | |
Date: | February 22, 2024 |