UNITED STATES
SECURITIES AND EXCHANGE COMMISSION
Washington, D.C. 20549
FORM N-CSR
CERTIFIED SHAREHOLDER REPORT OF REGISTERED
MANAGEMENT INVESTMENT COMPANIES
Investment Company Act file number 811-02628
Fidelity Municipal Trust
(Exact name of registrant as specified in charter)
82 Devonshire St., Boston, Massachusetts 02109
(Address of principal executive offices) (Zip code)
Scott C. Goebel, Secretary
82 Devonshire St.
Boston, Massachusetts 02109
(Name and address of agent for service)
Registrant's telephone number, including area code: 617-563-7000
Date of fiscal year end: | December 31 |
| |
Date of reporting period: | December 31, 2012 |
Item 1. Reports to Stockholders
Fidelity®
Michigan Municipal
Income Fund
and
Fidelity
Michigan Municipal Money Market Fund
Annual Report
December 31, 2012
(Fidelity Cover Art)
Contents
Performance | (Click Here) | How the fund has done over time. |
Management's Discussion of Fund Performance | (Click Here) | The Portfolio Manager's review of fund performance and strategy. |
Shareholder Expense Example | (Click Here) | An example of shareholder expenses. |
Fidelity® Michigan Municipal Income Fund |
Investment Changes | (Click Here) | A summary of major shifts in the fund's investments over the past six months. |
Investments | (Click Here) | A complete list of the fund's investments with their market values. |
Financial Statements | (Click Here) | Statements of assets and liabilities, operations, and changes in net assets, as well as financial highlights. |
Fidelity Michigan Municipal Money Market Fund |
Investment Changes/
Performance | (Click Here) | A summary of major shifts in the fund's investments over the past six months. |
Investments | (Click Here) | A complete list of the fund's investments. |
Financial Statements | (Click Here) | Statements of assets and liabilities, operations, and changes in net assets, as well as financial highlights. |
Notes | (Click Here) | Notes to the Financial Statements |
Report of Independent Registered Public Accounting Firm | (Click Here) | |
Trustees and Officers | (Click Here) | |
Distributions | (Click Here) | |
Board Approval of Investment Advisory Contracts and Management Fees | (Click Here) | |
To view a fund's proxy voting guidelines and proxy voting record for the 12-month period ended June 30, visit http://www.fidelity.com/proxyvotingresults or visit the Securities and Exchange Commission's (SEC) web site at http://www.sec.gov. You may also call 1-800-544-8544 to request a free copy of the proxy voting guidelines.
Standard & Poor's, S&P and S&P 500 are registered service marks of The McGraw-Hill Companies, Inc. and have been licensed for use by Fidelity Distributors Corporation.
Other third-party marks appearing herein are the property of their respective owners.
All other marks appearing herein are registered or unregistered trademarks or service marks of FMR LLC or an affiliated company. © 2013 FMR LLC. All rights reserved.
Annual Report
This report and the financial statements contained herein are submitted for the general information of the shareholders of the funds. This report is not authorized for distribution to prospective investors in the funds unless preceded or accompanied by an effective prospectus.
A fund files its complete schedule of portfolio holdings with the SEC for the first and third quarters of each fiscal year on Form N-Q. Forms N-Q are available on the SEC's web site at http://www.sec.gov. A fund's Forms N-Q may be reviewed and copied at the SEC's Public Reference Room in Washington, DC. Information regarding the operation of the SEC's Public Reference Room may be obtained by calling 1-800-SEC-0330. For a complete list of a fund's portfolio holdings, view the most recent holdings listing, semiannual report, or annual report on Fidelity's web site at http://www.fidelity.com, http://www.advisor.fidelity.com, or http://www.401k.com, as applicable.
NOT FDIC INSURED • MAY LOSE VALUE • NO BANK GUARANTEE
Neither the funds nor Fidelity Distributors Corporation is a bank.
Annual Report
Fidelity® Michigan Municipal Income Fund
Performance: The Bottom Line
Average annual total return reflects the change in the value of an investment, assuming reinvestment of the fund's distributions from dividend income and capital gains (the profits earned upon the sale of securities that have grown in value, if any) and assuming a constant rate of performance each year. The $10,000 table and the fund's returns do not reflect the deduction of taxes that a shareholder would pay on fund distributions or the redemption of fund shares. During periods of reimbursement by Fidelity, a fund's total return will be greater than it would be had the reimbursement not occurred. How a fund did yesterday is no guarantee of how it will do tomorrow.
Average Annual Total Returns
Periods ended December 31, 2012 | Past 1
year | Past 5
years | Past 10
years |
Fidelity Michigan Municipal Income Fund | 6.19% | 5.32% | 4.71% |
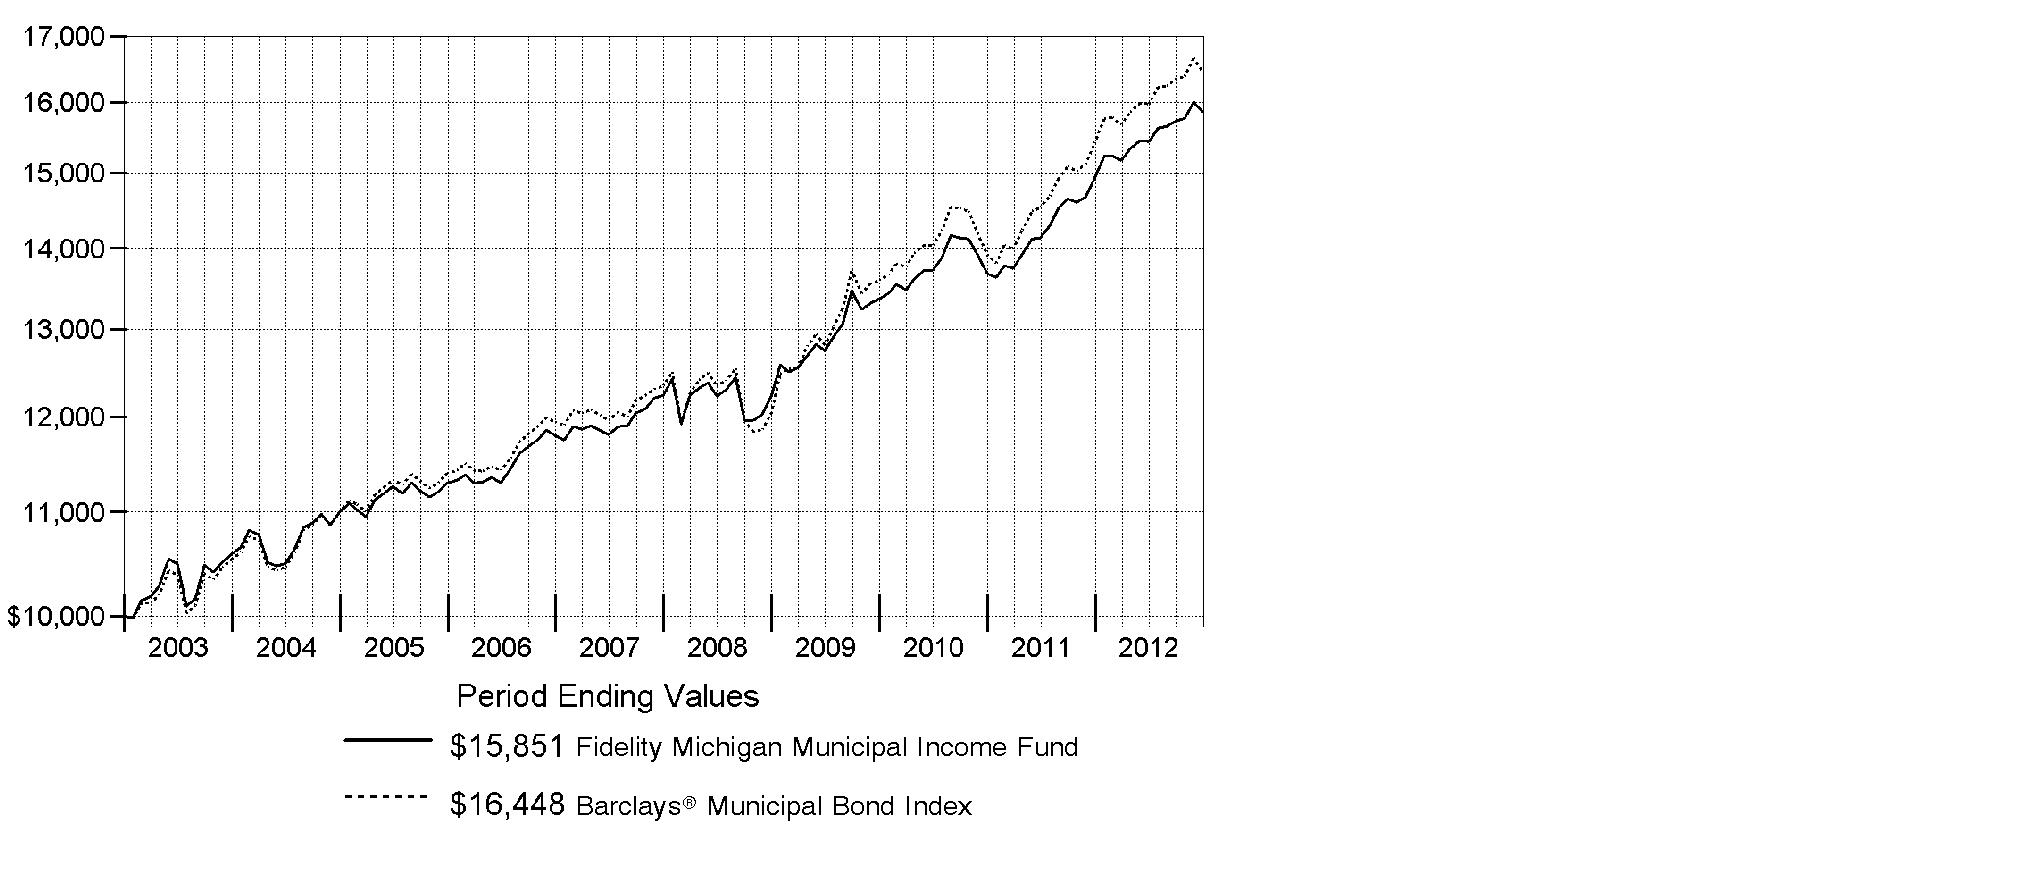
$10,000 Over 10 Years
Let's say hypothetically that $10,000 was invested in Fidelity Michigan Municipal Income Fund on December 31, 2002. The chart shows how the value of your investment would have changed, and also shows how the Barclays® Municipal Bond Index performed over the same period.
Annual Report
Market Recap: Powered by improving issuer fundamentals and favorable supply and demand, the bull market for municipal bonds rolled on in 2012, with the Barclays® Municipal Bond Index advancing 6.78%. By contrast, taxable investment-grade debt gained 4.21%, as tracked by the Barclays® U.S. Aggregate Bond Index. Muni investors were encouraged by a recovery in tax revenues for many issuers. And despite a handful of well-publicized bankruptcies by local issuers, the overall muni default rate declined and remained low. Even with a surge in refinancings, the overall supply of newly issued muni bonds was muted. As for demand, munis drew heavy interest from investors seeking a yield advantage over U.S. Treasuries, and from those looking for a perceived safe haven amid mixed U.S. economic data and the ongoing financial crisis in Europe. Investors' appetite for tax-advantaged investments in advance of potentially higher federal tax rates in 2013 also fueled demand, particularly in November, while a steady stream of municipal redemptions (calls and maturities), many of which were reinvested in the muni market, competed for limited new supply. The muni market sold off in December due to concern about proposals to limit the federal tax exemption of muni debt, profit-taking in advance of higher capital gains rates, and ratings downgrades of Puerto Rico debt to borderline investment grade.
Comments from Jamie Pagliocco, Portfolio Manager of Fidelity® Michigan Municipal Income Fund: For the year, the fund returned 6.19%, while the Barclays Michigan Enhanced Municipal Bond Index - which tracks the types of securities in which the fund invests - rose 7.10%. Versus the benchmark, the fund was hurt by out-of-benchmark exposure to Puerto Rico bonds and an underweighting in par bonds. The negative impact of these factors offset the benefit of having larger-than-benchmark exposure to health care bonds. Puerto Rico bonds lagged because investors became increasingly concerned about the territory's poor economic and fiscal prospects, as well as the new governor's willingness and ability to bolster its pension funds while also balancing revenues and spending. In December, the bonds suffered a significant sell-off after a major credit rating agency cut Puerto Rico's credit rating. Par bonds, which sell at or near their face value, outperformed premium bonds, in which the fund was overweight, thanks to comparatively strong demand from individual investors. The health care sector was one of the muni market's biggest gainers for the period, as investors searching for yield were drawn to these securities.
The views expressed above reflect those of the portfolio manager(s) only through the end of the period as stated on the cover of this report and do not necessarily represent the views of Fidelity or any other person in the Fidelity organization. Any such views are subject to change at any time based upon market or other conditions and Fidelity disclaims any responsibility to update such views. These views may not be relied on as investment advice and, because investment decisions for a Fidelity fund are based on numerous factors, may not be relied on as an indication of trading intent on behalf of any Fidelity fund.
Annual Report
Shareholder Expense Example
As a shareholder of a Fund, you incur two types of costs: (1) transaction costs, including redemption fees and (2) ongoing costs, including management fees and other Fund expenses. This Example is intended to help you understand your ongoing costs (in dollars) of investing in the Funds and to compare these costs with the ongoing costs of investing in other mutual funds.
The Example is based on an investment of $1,000 invested at the beginning of the period and held for the entire period (July 1, 2012 to December 31, 2012).
Actual Expenses
The first line of the accompanying table for each fund provides information about actual account values and actual expenses. You may use the information in this line, together with the amount you invested, to estimate the expenses that you paid over the period. Simply divide your account value by $1,000.00 (for example, an $8,600 account value divided by $1,000.00 = 8.6), then multiply the result by the number in the first line for a fund under the heading entitled "Expenses Paid During Period" to estimate the expenses you paid on your account during this period. A small balance maintenance fee of $12.00 that is charged once a year may apply for certain accounts with a value of less than $2,000. This fee is not included in the table below. If it was, the estimate of expenses you paid during the period would be higher, and your ending account value lower, by this amount. In addition, each Fund, as a shareholder in the underlying Fidelity Central Funds, will indirectly bear its pro-rata share of the fees and expenses incurred by the underlying Fidelity Central Funds. These fees and expenses are not included in the Fund's annualized expense ratio used to calculate the expense estimate in the table below.
Hypothetical Example for Comparison Purposes
The second line of the accompanying table for each fund provides information about hypothetical account values and hypothetical expenses based on a fund's actual expense ratio and an assumed rate of return of 5% per year before expenses, which is not the Fund's actual return. The hypothetical account values and expenses may not be used to estimate the actual ending account balance or expenses you paid for the period. You may use this information to compare the ongoing costs of investing in the Fund and other funds. To do so, compare this 5% hypothetical example with the 5% hypothetical examples that appear in the shareholder reports of the other funds. A small balance maintenance fee of $12.00 that is charged once a year may apply for certain accounts with a value of less than $2,000. This fee is not included in the table below. If it was, the estimate of expenses you paid during the period would be higher, and your ending account value lower, by this amount. In addition, each Fund, as a shareholder in the underlying Fidelity Central Funds, will indirectly bear its pro-rata share of the fees and expenses incurred by the underlying Fidelity Central Funds. These fees and expenses are not included in the Fund's annualized expense ratio used to calculate the expense estimate in the table below.
Please note that the expenses shown in the table are meant to highlight your ongoing costs only and do not reflect any transaction costs. Therefore, the second line of the table is useful in comparing ongoing costs only, and will not help you determine the relative total costs of owning different funds. In addition, if these transactional costs were included, your costs would have been higher.
Annual Report
Shareholder Expense Example - continued
| Annualized
Expense Ratio | Beginning
Account Value
July 1, 2012 | Ending
Account Value
December 31, 2012 | Expenses Paid
During Period*
July 1, 2012
to December 31, 2012 |
Fidelity Michigan Municipal Income Fund | .48% | | | |
Actual | | $ 1,000.00 | $ 1,027.00 | $ 2.45 |
Hypothetical A | | $ 1,000.00 | $ 1,022.72 | $ 2.44 |
Fidelity Michigan Municipal Money Market Fund | .19% | | | |
Actual | | $ 1,000.00 | $ 1,000.10 | $ .96** |
Hypothetical A | | $ 1,000.00 | $ 1,024.18 | $ .97** |
A 5% return per year before expenses
* Expenses are equal to each Fund's annualized expense ratio, multiplied by the average account value over the period, multiplied by 184/366 (to reflect the one-half year period).
** If certain fees were not voluntarily waived by Fidelity Management & Research Company (FMR) or its affiliates during the period, the annualized expense ratio for the Fidelity Michigan Municipal Money Market Fund would have been .54% and the expenses paid in the actual and hypothetical examples above would have been $2.71 and $2.75, respectively.
Annual Report
Fidelity Michigan Municipal Income Fund
Investment Changes (Unaudited)
Top Five Sectors as of December 31, 2012 |
| % of fund's
net assets | % of fund's net assets
6 months ago |
General Obligations | 41.1 | 43.5 |
Health Care | 19.5 | 16.8 |
Water & Sewer | 15.3 | 18.1 |
Education | 5.9 | 4.8 |
Special Tax | 5.2 | 6.0 |
Weighted Average Maturity as of December 31, 2012 |
| | 6 months ago |
Years | 5.4 | 5.6 |
This is a weighted average of all the maturities of the securities held in a fund. Weighted Average Maturity (WAM) can be used as a measure of sensitivity to interest rate changes and market changes. Generally, the longer the maturity, the greater the sensitivity to such changes. WAM is based on the dollar-weighted average length of time until principal payments must be paid. Depending on the types of securities held in a fund, certain maturity shortening devices (e.g., demand features, interest rate resets, and call options) may be taken into account when calculating the WAM. |
Duration as of December 31, 2012 |
| | 6 months ago |
Years | 6.0 | 6.4 |
Duration estimates how much a bond fund's price will change with a change in comparable interest rates. If rates rise 1%, for example, a fund with a 5-year duration is likely to lose about 5% of its value. Other factors also can influence a bond fund's performance and share price. Accordingly, a bond fund's actual performance may differ from this example. Duration takes into account any call or put option embedded in the bonds. |
Quality Diversification (% of fund's net assets) |
As of December 31, 2012 | As of June 30, 2012 |
 | AAA 4.9% | | | AAA 7.0% | |
 | AA,A 81.3% | | | AA,A 80.0% | |
 | BBB 7.6% | | | BBB 8.8% | |
 | BB and Below 2.1% | | | BB and Below 0.9% | |
 | Not Rated 0.5% | | | Not Rated 0.6% | |
 | Short-Term
Investments and
Net Other Assets 3.6% | | | Short-Term
Investments and
Net Other Assets 2.7% | |

We have used ratings from Moody's Investors Service, Inc. Where Moody's® ratings are not available, we have used S&P® ratings. All ratings are as of the date indicated and do not reflect subsequent changes. |
Annual Report
Fidelity Michigan Municipal Income Fund
Investments December 31, 2012
Showing Percentage of Net Assets
Municipal Bonds - 96.4% |
| Principal
Amount | | Value |
Guam - 0.5% |
Guam Ed. Fing. Foundation Ctfs. of Prtn.: | | | | |
(Guam Pub. School Facilities Proj.) Series 2006 A, 5% 10/1/16 | | $ 1,045,000 | | $ 1,100,594 |
Series 2006 A, 5% 10/1/23 | | 1,000,000 | | 1,008,060 |
Guam Pwr. Auth. Rev. Series 2012 A, 5% 10/1/23 (FSA Insured) | | 1,175,000 | | 1,376,524 |
| | 3,485,178 |
Michigan - 94.0% |
Algonac Cmnty. Schools Series 2008, 5.25% 5/1/28 (FSA Insured) | | 1,575,000 | | 1,762,945 |
Allegan Pub. School District Series 2008: | | | | |
5% 5/1/14 (Nat'l. Pub. Fin. Guarantee Corp. Insured) | | 1,570,000 | | 1,661,672 |
5% 5/1/16 (Nat'l. Pub. Fin. Guarantee Corp. Insured) | | 1,545,000 | | 1,735,777 |
Ann Arbor Bldg. Auth. Series 2005 A: | | | | |
5% 3/1/17 (Nat'l. Pub. Fin. Guarantee Corp. Insured) | | 1,405,000 | | 1,530,059 |
5% 3/1/18 (Nat'l. Pub. Fin. Guarantee Corp. Insured) | | 1,440,000 | | 1,564,603 |
Ann Arbor Econ. Dev. Corp. Ltd. Oblig. Rev. (Glacier Hills, Inc. Proj.) 8.375% 1/15/19 (Escrowed to Maturity) | | 2,033,000 | | 2,444,906 |
Ann Arbor Pub. School District 5% 5/1/28 | | 2,900,000 | | 3,486,264 |
Bay City Gen. Oblig. Series 1991, 0% 6/1/15 (AMBAC Insured) | | 1,725,000 | | 1,618,637 |
Brighton Area School District Livingston County Series II, 0% 5/1/15 (AMBAC Insured) | | 10,000,000 | | 9,750,400 |
Caledonia Cmnty. Schools Counties of Kent, Allegan and Barry Series 2003: | | | | |
5.25% 5/1/17 | | 1,370,000 | | 1,389,180 |
5.25% 5/1/18 | | 1,100,000 | | 1,115,807 |
Carman-Ainsworth Cmnty. School District Series 2005: | | | | |
5% 5/1/16 (FSA Insured) | | 1,000,000 | | 1,096,540 |
5% 5/1/17 (FSA Insured) | | 2,065,000 | | 2,252,832 |
Carrier Creek Drainage District #326 Series 2005: | | | | |
5% 6/1/16 (AMBAC Insured) | | 1,620,000 | | 1,765,687 |
5% 6/1/25 (AMBAC Insured) | | 1,775,000 | | 1,896,960 |
Charles Stewart Mott Cmnty. College Series 2005, 5% 5/1/17 (Nat'l. Pub. Fin. Guarantee Corp. Insured) | | 1,675,000 | | 1,827,358 |
Charter Township of Commerce Gen. Oblig. Series 2009 B, 5.125% 12/1/38 | | 970,000 | | 1,128,711 |
Chelsea School District Series 2008: | | | | |
5% 5/1/15 (Nat'l. Pub. Fin. Guarantee Corp. Insured) | | 1,720,000 | | 1,859,888 |
5% 5/1/18 (Nat'l. Pub. Fin. Guarantee Corp. Insured) | | 1,675,000 | | 1,931,242 |
Municipal Bonds - continued |
| Principal
Amount | | Value |
Michigan - continued |
Clarkston Cmnty. Schools Series 2008: | | | | |
5% 5/1/15 (FSA Insured) | | $ 1,905,000 | | $ 2,082,889 |
5% 5/1/16 (FSA Insured) | | 1,855,000 | | 2,090,529 |
Comstock Park Pub. Schools Series 2005, 5% 5/1/16 (FSA Insured) | | 1,000,000 | | 1,086,860 |
Detroit City School District: | | | | |
Series 2003 B, 5% 5/1/24 (Pre-Refunded to 5/1/13 @ 100) | | 5,000,000 | | 5,076,900 |
Series 2003, 5.25% 5/1/15 (Pre-Refunded to 5/1/13 @ 100) | | 3,085,000 | | 3,134,977 |
Series 2005 A, 5.25% 5/1/30 | | 5,000,000 | | 6,005,950 |
Detroit Gen. Oblig.: | | | | |
Series 2004 B1, 5% 4/1/13 (AMBAC Insured) | | 2,000,000 | | 2,000,080 |
Series 2004, 5% 4/1/15 (AMBAC Insured) | | 3,800,000 | | 3,720,276 |
Series 2005 B, 5% 4/1/13 (FSA Insured) | | 1,830,000 | | 1,841,255 |
Series 2005 C, 5% 4/1/13 (FSA Insured) | | 1,995,000 | | 2,007,269 |
Detroit School District Series 2012 A, 5% 5/1/24 | | 5,000,000 | | 5,901,600 |
Detroit Swr. Disp. Rev.: | | | | |
Series 1998, 5.5% 7/1/17 (Nat'l. Pub. Fin. Guarantee Corp. Insured) | | 3,050,000 | | 3,422,680 |
Series 2001 E, 5.75% 7/1/31 (Berkshire Hathaway Assurance Corp. Insured) (FGIC Insured) | | 2,700,000 | | 3,135,645 |
Series 2003 B, 7.5% 7/1/33 (FSA Insured) | | 2,600,000 | | 3,238,586 |
Series 2003, 5% 7/1/32 (FSA Insured) | | 535,000 | | 541,891 |
Series 2006: | | | | |
5% 7/1/15 (Nat'l. Pub. Fin. Guarantee Corp. Insured) | | 1,085,000 | | 1,155,818 |
5% 7/1/36 (Nat'l. Pub. Fin. Guarantee Corp. Insured) | | 7,800,000 | | 7,904,598 |
Series A, 0% 7/1/14 (Nat'l. Pub. Fin. Guarantee Corp. Insured) | | 6,730,000 | | 6,457,502 |
Detroit Wtr. Supply Sys. Rev.: | | | | |
Series 1993, 6.5% 7/1/15 (Nat'l. Pub. Fin. Guarantee Corp. Insured) | | 6,340,000 | | 6,928,352 |
Series 2003 A, 5% 7/1/34 (Nat'l. Pub. Fin. Guarantee Corp. Insured) | | 5,000,000 | | 5,084,650 |
Series 2004: | | | | |
5% 7/1/20 (Nat'l. Pub. Fin. Guarantee Corp. Insured) | | 5,000,000 | | 5,436,400 |
5.25% 7/1/16 (Nat'l. Pub. Fin. Guarantee Corp. Insured) | | 1,000,000 | | 1,103,390 |
5.25% 7/1/17 (Nat'l. Pub. Fin. Guarantee Corp. Insured) | | 2,000,000 | | 2,182,800 |
Municipal Bonds - continued |
| Principal
Amount | | Value |
Michigan - continued |
Detroit Wtr. Supply Sys. Rev.: - continued | | | | |
5.25% 7/1/21 (Nat'l. Pub. Fin. Guarantee Corp. Insured) | | $ 6,035,000 | | $ 6,422,145 |
Series 2005 B, 5.5% 7/1/35 (Berkshire Hathaway Assurance Corp. Insured) (FGIC Insured) | | 2,800,000 | | 3,057,124 |
Series 2006 B, 7% 7/1/36 (FSA Insured) | | 2,700,000 | | 3,258,441 |
Series 2006, 5% 7/1/33 (FSA Insured) | | 5,000,000 | | 5,216,050 |
Detroit/Wayne Co. Stadium Auth. Series 2012: | | | | |
5% 10/1/21 (FSA Insured) | | 1,000,000 | | 1,128,940 |
5% 10/1/22 (FSA Insured) | | 1,000,000 | | 1,129,030 |
DeWitt Pub. Schools Gen. Oblig. Series 2008: | | | | |
5% 5/1/15 (Nat'l. Pub. Fin. Guarantee Corp. Insured) | | 1,475,000 | | 1,603,119 |
5% 5/1/17 (Nat'l. Pub. Fin. Guarantee Corp. Insured) | | 1,550,000 | | 1,772,131 |
Dexter Cmnty. Schools (School Bldg. and Site Proj.) Series 1998, 5.1% 5/1/18 (Nat'l. Pub. Fin. Guarantee Corp. Insured) | | 1,000,000 | | 1,142,240 |
Durand Area Schools Gen. Oblig. Series 2006: | | | | |
5% 5/1/27 (FSA Insured) | | 1,225,000 | | 1,326,161 |
5% 5/1/28 (FSA Insured) | | 1,250,000 | | 1,350,725 |
5% 5/1/29 (FSA Insured) | | 1,275,000 | | 1,374,782 |
East Grand Rapids Pub. School District Gen. Oblig. Series 2004: | | | | |
5% 5/1/16 (FSA Insured) | | 1,425,000 | | 1,509,175 |
5% 5/1/17 (FSA Insured) | | 1,985,000 | | 2,100,348 |
East Lansing School District Gen. Oblig. Series 2005, 5% 5/1/30 (Nat'l. Pub. Fin. Guarantee Corp. Insured) | | 3,530,000 | | 3,823,025 |
Farmington Pub. School District Gen. Oblig. Series 2005, 5% 5/1/18 (FSA Insured) | | 4,500,000 | | 4,927,860 |
Fenton Area Pub. Schools Gen. Oblig. Series 2005, 5% 5/1/14 (Nat'l. Pub. Fin. Guarantee Corp. Insured) | | 1,775,000 | | 1,878,642 |
Ferris State Univ. Rev. Series 2005: | | | | |
5% 10/1/16 (Nat'l. Pub. Fin. Guarantee Corp. Insured) | | 1,255,000 | | 1,326,861 |
5% 10/1/17 (Nat'l. Pub. Fin. Guarantee Corp. Insured) | | 1,320,000 | | 1,391,372 |
Fraser Pub. School District Series 2005: | | | | |
5% 5/1/16 (FSA Insured) | | 1,055,000 | | 1,146,637 |
5% 5/1/17 (FSA Insured) | | 1,615,000 | | 1,750,224 |
Garden City School District: | | | | |
Series 2005: | | | | |
5% 5/1/14 (FSA Insured) | | 1,210,000 | | 1,278,159 |
5% 5/1/17 (FSA Insured) | | 1,390,000 | | 1,514,753 |
Series 2006, 5% 5/1/19 (FSA Insured) | | 1,205,000 | | 1,352,540 |
Municipal Bonds - continued |
| Principal
Amount | | Value |
Michigan - continued |
Genesee County Gen. Oblig. Series 2005: | | | | |
5% 5/1/17 (Nat'l. Pub. Fin. Guarantee Corp. Insured) | | $ 1,355,000 | | $ 1,468,454 |
5% 5/1/18 (Nat'l. Pub. Fin. Guarantee Corp. Insured) | | 1,505,000 | | 1,629,930 |
Gibraltar School District Series 2005: | | | | |
5% 5/1/16 (FSA Insured) | | 1,230,000 | | 1,336,838 |
5% 5/1/17 (FSA Insured) | | 1,230,000 | | 1,332,988 |
Grand Ledge Pub. Schools District (School Bldg. & Site Proj.) Series 2007: | | | | |
5% 5/1/23 (Nat'l. Pub. Fin. Guarantee Corp. Insured) | | 1,175,000 | | 1,333,895 |
5% 5/1/24 (Nat'l. Pub. Fin. Guarantee Corp. Insured) | | 1,300,000 | | 1,471,158 |
5% 5/1/28 (Nat'l. Pub. Fin. Guarantee Corp. Insured) | | 4,300,000 | | 4,793,984 |
Grand Rapids Cmnty. College Series 2008: | | | | |
5% 5/1/17 (FSA Insured) | | 1,315,000 | | 1,501,086 |
5% 5/1/19 (FSA Insured) | | 1,315,000 | | 1,572,753 |
Grand Rapids San. Swr. Sys. Rev.: | | | | |
Series 2004, 5% 1/1/28 (Nat'l. Pub. Fin. Guarantee Corp. Insured) | | 2,500,000 | | 2,652,300 |
Series 2005: | | | | |
5% 1/1/34 (Nat'l. Pub. Fin. Guarantee Corp. Insured) | | 3,000,000 | | 3,278,250 |
5.125% 1/1/25 (Nat'l. Pub. Fin. Guarantee Corp. Insured) | | 2,000,000 | | 2,204,600 |
Series 2008, 5% 1/1/38 | | 3,320,000 | | 3,763,884 |
Series 2010, 5% 1/1/28 | | 3,000,000 | | 3,790,860 |
Series 2012, 5% 1/1/37 | | 1,250,000 | | 1,437,650 |
Grand Rapids Wtr. Supply Sys. Series 2005, 5% 1/1/35 (Nat'l. Pub. Fin. Guarantee Corp. Insured) | | 5,000,000 | | 5,516,300 |
Grand Traverse County Hosp. Series 2011 A, 5.375% 7/1/35 | | 2,000,000 | | 2,229,860 |
Grand Valley Michigan State Univ. Rev.: | | | | |
Series 2007, 5% 12/1/19 (AMBAC Insured) | | 500,000 | | 568,530 |
Series 2008, 5% 12/1/33 (FSA Insured) | | 5,000,000 | | 5,433,200 |
Series 2009, 5.625% 12/1/29 | | 2,400,000 | | 2,780,352 |
Grosse Ile Township School District Unltd. Tax Gen. Oblig. Series 2006: | | | | |
5% 5/1/29 (Nat'l. Pub. Fin. Guarantee Corp. Insured) | | 1,950,000 | | 2,083,302 |
5% 5/1/32 (Nat'l. Pub. Fin. Guarantee Corp. Insured) | | 1,950,000 | | 2,066,123 |
Harper Creek Cmnty. School District (School Bldg. & Site Proj.) Series 2008: | | | | |
4.75% 5/1/27 (FSA Insured) | | 500,000 | | 552,070 |
5.25% 5/1/21 (FSA Insured) | | 2,000,000 | | 2,355,500 |
5.25% 5/1/24 (FSA Insured) | | 2,100,000 | | 2,406,474 |
Municipal Bonds - continued |
| Principal
Amount | | Value |
Michigan - continued |
Haslett Pub. Schools Series 2005, 5% 5/1/16 (Nat'l. Pub. Fin. Guarantee Corp. Insured) | | $ 1,100,000 | | $ 1,195,546 |
Hudsonville Pub. Schools: | | | | |
Series 2005, 5% 5/1/16 (FSA Insured) | | 1,000,000 | | 1,098,980 |
5.25% 5/1/41 | | 1,750,000 | | 1,984,290 |
Huron Valley School District Series 2003, 5.25% 5/1/16 | | 2,450,000 | | 2,486,334 |
Ingham, Eaton and Clinton Counties Lansing School District 5% 5/1/22 | | 1,730,000 | | 2,105,375 |
Jackson County Hosp. Fin. Auth. Hosp. Rev. (Allegiance Health Proj.) Series 2010 A, 5% 6/1/37 (FSA Insured) | | 2,250,000 | | 2,424,353 |
Kalamazoo Hosp. Fin. Auth. Hosp. Facilities Rev. (Bronson Methodist Hosp. Proj.) Series 2003 B, 5.25% 5/15/14 (FSA Insured) | | 1,200,000 | | 1,270,932 |
Kalamazoo Pub. Schools Series 2006: | | | | |
5% 5/1/17 (FSA Insured) | | 3,165,000 | | 3,596,928 |
5.25% 5/1/16 (FSA Insured) | | 1,500,000 | | 1,702,665 |
Kent County Arpt. Rev. (Gerald R. Ford Int'l. Arpt. Proj.) Series 2007, 5% 1/1/37 | | 4,180,000 | | 4,551,393 |
Kent County Bldg. Auth. Series 2005, 5.5% 6/1/21 | | 3,025,000 | | 3,875,630 |
Kent Hosp. Fin. Auth. Hosp. Facilities Rev. (Spectrum Health Sys. Proj.): | | | | |
Series 2011 A, 5.5% 11/15/25 | | 5,000,000 | | 5,889,700 |
Series 2011 C, 5% 1/15/42 | | 5,000,000 | | 5,458,950 |
Kentwood Pub. Schools Series 2012: | | | | |
4% 5/1/21 | | 1,000,000 | | 1,155,970 |
4% 5/1/22 | | 1,000,000 | | 1,150,070 |
L'Anse Creuse Pub. Schools: | | | | |
Series 2005, 5% 5/1/24 (FSA Insured) | | 1,350,000 | | 1,464,008 |
Series 2012: | | | | |
5% 5/1/22 | | 1,500,000 | | 1,830,615 |
5% 5/1/23 | | 1,500,000 | | 1,814,055 |
Lansing Board Wtr. & Lt. Rev. 5.5% 7/1/41 | | 5,000,000 | | 5,877,650 |
Lansing Cmnty. College: | | | | |
5% 5/1/23 | | 1,135,000 | | 1,394,052 |
5% 5/1/25 | | 1,540,000 | | 1,868,405 |
Lapeer Cmnty. Schools Series 2007: | | | | |
5% 5/1/19 (FSA Insured) | | 1,350,000 | | 1,576,611 |
5% 5/1/20 (FSA Insured) | | 1,425,000 | | 1,652,387 |
5% 5/1/22 (FSA Insured) | | 1,395,000 | | 1,597,010 |
Lenawee Co. Hosp. Fin. Auth. Hosp. Rev. (ProMedica Heathcare Oblig. Group Proj.) Series 2011 B, 6% 11/15/35 | | 3,030,000 | | 3,590,156 |
Municipal Bonds - continued |
| Principal
Amount | | Value |
Michigan - continued |
Lincoln Consolidated School District Series 2008: | | | | |
5% 5/1/14 (FSA Insured) | | $ 1,460,000 | | $ 1,545,249 |
5% 5/1/16 (FSA Insured) | | 1,425,000 | | 1,589,588 |
Michigan Bldg. Auth. Rev.: | | | | |
(Facilities Prog.) Series 2008 I, 6% 10/15/38 | | 5,000,000 | | 5,965,950 |
Series 1, 5.25% 10/15/16 (FSA Insured) | | 5,000,000 | | 5,186,350 |
Series 2009 I, 5.25% 10/15/25 (Assured Guaranty Corp. Insured) | | 2,000,000 | | 2,379,460 |
Series IA 5.375% 10/15/41 | | 3,000,000 | | 3,429,210 |
Series IA, 5.5% 10/15/45 | | 10,000,000 | | 11,483,800 |
Michigan Fin. Auth. Rev.: | | | | |
(Trinity Health Sys. Proj.): | | | | |
Series 2010 A, 5% 12/1/27 | | 1,100,000 | | 1,270,577 |
Series 2011 MI, 5% 12/1/39 | | 7,000,000 | | 7,679,490 |
Series 2012 A: | | | | |
4.125% 6/1/32 | | 3,000,000 | | 2,958,480 |
5% 6/1/39 | | 11,425,000 | | 12,074,278 |
Series 2012 B, 5% 7/1/22 | | 2,600,000 | | 2,944,500 |
Series 2012: | | | | |
5% 11/15/24 | | 425,000 | | 491,202 |
5% 11/15/25 | | 1,000,000 | | 1,148,460 |
5% 11/1/26 | | 5,000,000 | | 5,645,400 |
5% 11/15/26 | | 800,000 | | 913,680 |
5% 11/15/36 | | 4,200,000 | | 4,622,100 |
5% 11/15/42 | | 4,500,000 | | 4,890,375 |
Michigan Gen. Oblig. Series 2007, 5.25% 9/15/21 (FSA Insured) | | 5,000,000 | | 5,761,300 |
Michigan Hosp. Fin. Auth. Rev.: | | | | |
(Ascension Health Sr. Cr. Group Proj.) Series 2010 F, 5% 11/15/23 | | 7,500,000 | | 8,747,700 |
(Henry Ford Health Sys. Proj.): | | | | |
Series 2006 A: | | | | |
5% 11/15/14 | | 1,000,000 | | 1,062,930 |
5% 11/15/17 | | 1,000,000 | | 1,110,990 |
Series 2009, 5.25% 11/15/24 | | 3,000,000 | | 3,413,820 |
(McLaren Health Care Corp. Proj.): | | | | |
Series 2008 A: | | | | |
5.25% 5/15/15 | | 1,615,000 | | 1,779,326 |
5.75% 5/15/38 | | 6,880,000 | | 7,720,117 |
Series 2012 A: | | | | |
5% 6/1/24 | | 2,765,000 | | 3,176,211 |
5% 6/1/25 | | 2,895,000 | | 3,302,761 |
Municipal Bonds - continued |
| Principal
Amount | | Value |
Michigan - continued |
Michigan Hosp. Fin. Auth. Rev.: - continued | | | | |
(MidMichigan Obligated Group Proj.): | | | | |
Series 2002 A, 5.5% 4/15/18 (AMBAC Insured) | | $ 2,000,000 | | $ 2,005,080 |
Series 2009 A, 6.125% 6/1/39 | | 3,740,000 | | 4,301,374 |
(Oakwood Hosp. Proj.) Series 2007, 5% 7/15/17 | | 1,000,000 | | 1,131,630 |
(Sisters of Mercy Health Corp. Proj.) Series 1993, 5.375% 8/15/14 (Escrowed to Maturity) | | 125,000 | | 130,553 |
(Sparrow Hosp. Obligated Group Proj.) Series 2007: | | | | |
5% 11/15/17 | | 535,000 | | 615,180 |
5% 11/15/18 | | 1,725,000 | | 1,967,966 |
5% 11/15/19 | | 1,000,000 | | 1,135,380 |
5% 11/15/20 | | 2,000,000 | | 2,249,060 |
5% 11/15/31 | | 5,000,000 | | 5,351,050 |
(Trinity Health Sys. Proj.): | | | | |
Series 2008 A, 6.5% 12/1/33 | | 5,000,000 | | 6,061,450 |
5% 12/1/26 | | 3,725,000 | | 4,135,644 |
5% 12/1/26 (Pre-Refunded to 12/1/16 @ 100) | | 830,000 | | 968,403 |
Michigan Muni. Bond Auth. Rev.: | | | | |
(Local Govt. Ln. Prog.): | | | | |
Series 2007, 5% 12/1/21 (AMBAC Insured) | | 1,155,000 | | 1,179,659 |
Series G, 0% 5/1/19 (AMBAC Insured) | | 1,865,000 | | 1,488,233 |
(State Clean Wtr. Revolving Fund Proj.) Series 2006, 5% 10/1/27 | | 4,225,000 | | 4,808,980 |
Series 2005, 5% 10/1/23 | | 385,000 | | 462,065 |
Series 2009, 5% 10/1/26 | | 5,000,000 | | 5,913,800 |
Series C, 0% 6/15/15 (FSA Insured) | | 3,000,000 | | 2,883,840 |
Michigan Strategic Fund Ltd. Oblig. Rev.: | | | | |
(Cadillac Place Office Bldg. Proj.) Series 2011, 5.25% 10/15/26 | | 3,585,000 | | 4,084,641 |
(Detroit Edison Co. Proj.) Series BB, 7% 5/1/21 (AMBAC Insured) | | 8,520,000 | | 11,108,802 |
Michigan Technological Univ. Series 2008, 5.25% 10/1/17 (Assured Guaranty Corp. Insured) | | 1,875,000 | | 2,177,869 |
Michigan Trunk Line Fund Rev.: | | | | |
Series 1998 A, 5.5% 11/1/16 | | 3,000,000 | | 3,518,910 |
Series 2005, 5.5% 11/1/20 (FSA Insured) | | 2,500,000 | | 3,182,725 |
Series 2006, 5.25% 11/1/15 (Nat'l. Pub. Fin. Guarantee Corp. Insured) | | 5,000,000 | | 5,629,200 |
Series 2011, 5% 11/15/36 | | 2,000,000 | | 2,295,820 |
North Kent Swr. Auth. Wtr. & Swr. Rev. Series 2006: | | | | |
5% 11/1/19 (Nat'l. Pub. Fin. Guarantee Corp. Insured) | | 420,000 | | 478,300 |
Municipal Bonds - continued |
| Principal
Amount | | Value |
Michigan - continued |
North Kent Swr. Auth. Wtr. & Swr. Rev. Series 2006: - continued | | | | |
5% 11/1/20 (Nat'l. Pub. Fin. Guarantee Corp. Insured) | | $ 490,000 | | $ 553,901 |
5% 11/1/22 (Nat'l. Pub. Fin. Guarantee Corp. Insured) | | 1,645,000 | | 1,839,340 |
5% 11/1/23 (Nat'l. Pub. Fin. Guarantee Corp. Insured) | | 1,290,000 | | 1,434,815 |
Northview Pub. Schools District Series 2008, 5% 5/1/21 (FSA Insured) | | 1,070,000 | | 1,218,002 |
Northville Pub. Schools Series 2005: | | | | |
5% 5/1/15 (FSA Insured) | | 1,525,000 | | 1,665,925 |
5% 5/1/16 (FSA Insured) | | 1,475,000 | | 1,603,119 |
5% 5/1/17 (FSA Insured) | | 3,675,000 | | 3,920,747 |
Oakland Univ. Rev. Series 2012: | | | | |
5% 3/1/24 | | 1,170,000 | | 1,377,663 |
5% 3/1/25 | | 1,225,000 | | 1,430,555 |
5% 3/1/26 | | 1,290,000 | | 1,496,336 |
5% 3/1/37 | | 4,000,000 | | 4,397,360 |
Okemos Pub. School District Series 1993, 0% 5/1/13 (Nat'l. Pub. Fin. Guarantee Corp. Insured) | | 1,700,000 | | 1,693,336 |
Olivet Cmnty. School District (School Bldg. & Site Proj.) Series 2008: | | | | |
5.25% 5/1/23 (FSA Insured) | | 1,010,000 | | 1,172,782 |
5.25% 5/1/27 (FSA Insured) | | 1,135,000 | | 1,281,222 |
Ottawa County Wtr. Supply Sys. Rev. Series 2010: | | | | |
4.5% 5/1/33 | | 2,680,000 | | 3,017,546 |
5% 5/1/37 | | 1,100,000 | | 1,249,083 |
Petoskey Pub. School District Series 2005: | | | | |
5% 5/1/14 (Nat'l. Pub. Fin. Guarantee Corp. Insured) | | 1,430,000 | | 1,513,498 |
5% 5/1/16 (Nat'l. Pub. Fin. Guarantee Corp. Insured) | | 1,175,000 | | 1,291,302 |
Plainwell Cmnty. School District: | | | | |
(School Bldg. & Site Proj.) Series 2008: | | | | |
5% 5/1/23 (Assured Guaranty Corp. Insured) | | 1,885,000 | | 2,165,149 |
5% 5/1/28 (Assured Guaranty Corp. Insured) | | 1,000,000 | | 1,118,590 |
Series 2005: | | | | |
5% 5/1/15 (FSA Insured) | | 1,030,000 | | 1,123,194 |
5% 5/1/16 (FSA Insured) | | 1,025,000 | | 1,114,032 |
Plymouth-Canton Cmnty. School District Series 2008, 5% 5/1/20 (FSA Insured) | | 5,000,000 | | 5,945,900 |
Portage Pub. Schools Series 2008, 5% 5/1/22 (FSA Insured) | | 4,300,000 | | 5,055,338 |
Municipal Bonds - continued |
| Principal
Amount | | Value |
Michigan - continued |
Ravenna Pub. Schools Gen. Oblig. (2008 School Bldg. and Site Proj.) Series 2008: | | | | |
5% 5/1/31 (FSA Insured) | | $ 2,080,000 | | $ 2,315,726 |
5% 5/1/38 (FSA Insured) | | 1,000,000 | | 1,090,510 |
Riverview Cmnty. School District Series 2004: | | | | |
5% 5/1/14 | | 630,000 | | 666,786 |
5% 5/1/15 | | 955,000 | | 1,004,756 |
5% 5/1/17 | | 1,000,000 | | 1,050,740 |
5% 5/1/18 | | 1,000,000 | | 1,049,650 |
Rochester Cmnty. School District: | | | | |
4% 5/1/19 | | 1,375,000 | | 1,557,683 |
5% 5/1/19 (Nat'l. Pub. Fin. Guarantee Corp. Insured) | | 1,475,000 | | 1,758,864 |
Rockford Pub. Schools Gen. Oblig. (2008 School Bldg. and Site Proj.) 5% 5/1/30 (FSA Insured) | | 3,975,000 | | 4,388,122 |
Royal Oak Hosp. Fin. Auth. Hosp. Rev. (William Beaumont Hosp. Proj.) Series 2009 V: | | | | |
8% 9/1/29 | | 1,790,000 | | 2,250,352 |
8.25% 9/1/39 | | 3,425,000 | | 4,372,629 |
Saginaw Hosp. Fin. Auth. Hosp. Rev. (Covenant Med. Ctr., Inc.) Series 2010 H, 5% 7/1/30 | | 5,000,000 | | 5,304,300 |
Saint Clair County Gen. Oblig.: | | | | |
Series 2004: | | | | |
5% 4/1/17 (AMBAC Insured) | | 1,380,000 | | 1,448,448 |
5% 4/1/19 (AMBAC Insured) | | 1,475,000 | | 1,546,095 |
5% 4/1/26 | | 1,495,000 | | 1,737,325 |
Shepherd Pub. Schools Series 2008, 5% 5/1/17 (FSA Insured) | | 1,025,000 | | 1,171,432 |
South Haven Gen. Oblig. Series 2009: | | | | |
4.875% 12/1/28 (Assured Guaranty Corp. Insured) | | 2,500,000 | | 2,855,775 |
5.125% 12/1/33 (Assured Guaranty Corp. Insured) | | 1,000,000 | | 1,142,390 |
South Redford School District Series 2005, 5% 5/1/16 (Nat'l. Pub. Fin. Guarantee Corp. Insured) | | 1,125,000 | | 1,236,353 |
Three Rivers Cmnty. Schools Series 2008: | | | | |
5% 5/1/14 (FSA Insured) | | 1,765,000 | | 1,868,058 |
5% 5/1/16 (FSA Insured) | | 1,750,000 | | 1,946,088 |
Troy School District: | | | | |
Series 2006: | | | | |
5% 5/1/15 (Nat'l. Pub. Fin. Guarantee Corp. Insured) | | 1,000,000 | | 1,087,340 |
5% 5/1/16 (Nat'l. Pub. Fin. Guarantee Corp. Insured) | | 1,000,000 | | 1,117,230 |
5% 5/1/15 (Pre-Refunded to 5/1/14 @ 100) | | 2,135,000 | | 2,267,882 |
Municipal Bonds - continued |
| Principal
Amount | | Value |
Michigan - continued |
Univ. of Michigan Univ. Rev. Series 2010 C, 5% 4/1/26 | | $ 6,085,000 | | $ 7,260,074 |
Utica Cmnty. Schools: | | | | |
Series 2004, 5% 5/1/17 (Pre-Refunded to 11/1/13 @ 100) | | 3,000,000 | | 3,117,600 |
Series 2007: | | | | |
5% 5/1/15 (Nat'l. Pub. Fin. Guarantee Corp. Insured) | | 1,000,000 | | 1,095,810 |
5% 5/1/16 (Nat'l. Pub. Fin. Guarantee Corp. Insured) | | 2,000,000 | | 2,260,960 |
Waverly Cmnty. School District Series 2005, 5% 5/1/17 (FSA Insured) | | 3,090,000 | | 3,383,056 |
Wayne Charter County Gen. Oblig. Series 2001 A, 5.5% 12/1/17 (Nat'l. Pub. Fin. Guarantee Corp. Insured) | | 1,000,000 | | 1,001,730 |
Wayne County Arpt. Auth. Rev.: | | | | |
(Detroit Metropolitan Wayne County Arpt. Proj.) Series 2012 A: | | | | |
5% 12/1/24 | | 2,875,000 | | 3,416,161 |
5% 12/1/25 | | 5,120,000 | | 6,030,387 |
Series 2011 A, 5% 12/1/21 (b) | | 5,000,000 | | 5,780,750 |
Series 2012 A, 5% 12/1/23 | | 2,300,000 | | 2,743,900 |
West Ottawa Pub. School District Series 2012 A: | | | | |
5% 5/1/25 | | 4,310,000 | | 5,065,586 |
5% 5/1/26 | | 2,000,000 | | 2,331,100 |
Western Michigan Univ. Rev.: | | | | |
Series 2005, 5% 11/15/35 (Nat'l. Pub. Fin. Guarantee Corp. Insured) | | 5,435,000 | | 5,658,324 |
Series 2008, 5% 11/15/20 (FSA Insured) | | 5,280,000 | | 6,096,288 |
Western Townships Utils. Auth. Swr. Disp. Sys. Rev. Series 2012, 5% 1/1/23 | | 1,000,000 | | 1,209,010 |
Williamston Cmnty. Schools Gen. Oblig. Series 2005, 5% 5/1/18 (Nat'l. Pub. Fin. Guarantee Corp. Insured) | | 1,000,000 | | 1,096,060 |
Willow Run Cmnty. Schools County of Washtenaw Series 2005, 5% 5/1/17 (FSA Insured) | | 1,875,000 | | 2,045,550 |
Wyoming Sewage Disp. Sys. Rev. Series 2005, 5% 6/1/30 (Nat'l. Pub. Fin. Guarantee Corp. Insured) | | 4,000,000 | | 4,263,160 |
Zeeland Pub. Schools: | | | | |
Series 2004, 5.25% 5/1/16 (Pre-Refunded to 5/1/14 @ 100) | | 1,050,000 | | 1,118,817 |
Municipal Bonds - continued |
| Principal
Amount | | Value |
Michigan - continued |
Zeeland Pub. Schools: - continued | | | | |
Series 2005: | | | | |
5% 5/1/16 (Nat'l. Pub. Fin. Guarantee Corp. Insured) | | $ 2,035,000 | | $ 2,231,459 |
5% 5/1/17 (Nat'l. Pub. Fin. Guarantee Corp. Insured) | | 170,000 | | 185,463 |
| | 652,176,687 |
Puerto Rico - 1.5% |
Puerto Rico Elec. Pwr. Auth. Pwr. Rev. Series QQ, 5.5% 7/1/18 (XL Cap. Assurance, Inc. Insured) | | 1,000,000 | | 1,083,030 |
Puerto Rico Pub. Bldg. Auth. Rev. Bonds Series M2, 5.75%, tender 7/1/17 (a) | | 2,000,000 | | 2,128,220 |
Puerto Rico Sales Tax Fing. Corp. Sales Tax Rev.: | | | | |
Series 2007 A: | | | | |
0% 8/1/41 (Nat'l. Pub. Fin. Guarantee Corp. Insured) | | 4,300,000 | | 858,194 |
0% 8/1/47 (AMBAC Insured) | | 1,000,000 | | 139,440 |
Series 2009 A: | | | | |
6% 8/1/42 | | 4,000,000 | | 4,274,720 |
6.5% 8/1/44 | | 1,500,000 | | 1,644,915 |
| | 10,128,519 |
Virgin Islands - 0.4% |
Virgin Islands Pub. Fin. Auth.: | | | | |
(Cruzan Proj.) Series 2009 A, 6% 10/1/39 | | 1,500,000 | | 1,670,010 |
Series 2009 B, 5% 10/1/25 | | 1,200,000 | | 1,318,536 |
| | 2,988,546 |
TOTAL INVESTMENT PORTFOLIO - 96.4% (Cost $619,930,771) | | 668,778,930 |
NET OTHER ASSETS (LIABILITIES) - 3.6% | | 24,902,772 |
NET ASSETS - 100% | $ 693,681,702 |
Legend |
(a) Coupon rates for floating and adjustable rate securities reflect the rates in effect at period end. |
(b) Private activity obligations whose interest is subject to the federal alternative minimum tax for individuals. |
Other Information |
All investments are categorized as Level 2 under the Fair Value Hierarchy. The inputs or methodology used for valuing securities may not be an indication of the risk associated with investing in those securities. For more information on valuation inputs, please refer to the Investment Valuation section in the accompanying Notes to Financial Statements. |
The distribution of municipal securities by revenue source, as a percentage of total net assets, is as follows (Unaudited): |
General Obligations | 41.1% |
Health Care | 19.5% |
Water & Sewer | 15.3% |
Education | 5.9% |
Special Tax | 5.2% |
Others* (Individually Less Than 5%) | 13.0% |
| 100.0% |
* Includes net other assets (liabilities) |
See accompanying notes which are an integral part of the financial statements.
Annual Report
Fidelity Michigan Municipal Income Fund
Statement of Assets and Liabilities
| December 31, 2012 |
| | |
Assets | | |
Investment in securities, at value - See accompanying schedule: Unaffiliated issuers (cost $619,930,771) | | $ 668,778,930 |
Cash | | 18,964,468 |
Receivable for fund shares sold | | 686,168 |
Interest receivable | | 7,091,837 |
Prepaid expenses | | 1,654 |
Other receivables | | 3,309 |
Total assets | | 695,526,366 |
| | |
Liabilities | | |
Payable for fund shares redeemed | $ 670,860 | |
Distributions payable | 796,896 | |
Accrued management fee | 211,864 | |
Transfer agent fee payable | 93,936 | |
Other affiliated payables | 27,337 | |
Other payables and accrued expenses | 43,771 | |
Total liabilities | | 1,844,664 |
| | |
Net Assets | | $ 693,681,702 |
Net Assets consist of: | | |
Paid in capital | | $ 644,304,661 |
Undistributed net investment income | | 141,530 |
Accumulated undistributed net realized gain (loss) on investments | | 387,352 |
Net unrealized appreciation (depreciation) on investments | | 48,848,159 |
Net Assets, for 55,306,816 shares outstanding | | $ 693,681,702 |
Net Asset Value, offering price and redemption price per share ($693,681,702 ÷ 55,306,816 shares) | | $ 12.54 |
See accompanying notes which are an integral part of the financial statements.
Annual Report
Statement of Operations
| Year ended December 31, 2012 |
| | |
Investment Income | | |
Interest | | $ 26,948,665 |
| | |
Expenses | | |
Management fee | $ 2,427,741 | |
Transfer agent fees | 543,768 | |
Accounting fees and expenses | 155,183 | |
Custodian fees and expenses | 8,010 | |
Independent trustees' compensation | 2,455 | |
Registration fees | 23,487 | |
Audit | 49,973 | |
Legal | 7,602 | |
Miscellaneous | 5,658 | |
Total expenses before reductions | 3,223,877 | |
Expense reductions | (12,493) | 3,211,384 |
Net investment income (loss) | | 23,737,281 |
Realized and Unrealized Gain (Loss) Net realized gain (loss) on: | | |
Investment securities: | | |
Unaffiliated issuers | | 709,792 |
Change in net unrealized appreciation (depreciation) on investment securities | | 14,987,681 |
Net gain (loss) | | 15,697,473 |
Net increase (decrease) in net assets resulting from operations | | $ 39,434,754 |
See accompanying notes which are an integral part of the financial statements.
Annual Report
Fidelity Michigan Municipal Income Fund
Financial Statements - continued
Statement of Changes in Net Assets
| Year ended
December 31,
2012 | Year ended
December 31,
2011 |
Increase (Decrease) in Net Assets | | |
Operations | | |
Net investment income (loss) | $ 23,737,281 | $ 23,231,202 |
Net realized gain (loss) | 709,792 | (1,334) |
Change in net unrealized appreciation (depreciation) | 14,987,681 | 28,932,158 |
Net increase (decrease) in net assets resulting
from operations | 39,434,754 | 52,162,026 |
Distributions to shareholders from net investment income | (23,650,013) | (23,214,211) |
Distributions to shareholders from net realized gain | (220,908) | (352,543) |
Total distributions | (23,870,921) | (23,566,754) |
Share transactions
Proceeds from sales of shares | 114,227,329 | 71,220,723 |
Reinvestment of distributions | 14,619,749 | 14,650,857 |
Cost of shares redeemed | (72,723,778) | (119,227,678) |
Net increase (decrease) in net assets resulting from share transactions | 56,123,300 | (33,356,098) |
Redemption fees | 328 | 2,805 |
Total increase (decrease) in net assets | 71,687,461 | (4,758,021) |
| | |
Net Assets | | |
Beginning of period | 621,994,241 | 626,752,262 |
End of period (including undistributed net investment income of $141,530 and undistributed net investment income of $45,485, respectively) | $ 693,681,702 | $ 621,994,241 |
Other Information Shares | | |
Sold | 9,150,950 | 6,005,757 |
Issued in reinvestment of distributions | 1,169,914 | 1,233,872 |
Redeemed | (5,820,774) | (10,174,511) |
Net increase (decrease) | 4,500,090 | (2,934,882) |
See accompanying notes which are an integral part of the financial statements.
Annual Report
Financial Highlights
Years ended December 31, | 2012 | 2011 | 2010 | 2009 | 2008 |
Selected Per-Share Data | | | | | |
Net asset value, beginning of period | $ 12.24 | $ 11.66 | $ 11.85 | $ 11.29 | $ 11.76 |
Income from Investment Operations | | | | | |
Net investment income (loss) B | .445 | .463 | .462 | .460 | .457 |
Net realized and unrealized gain (loss) | .303 | .586 | (.184) | .575 | (.465) |
Total from investment operations | .748 | 1.049 | .278 | 1.035 | (.008) |
Distributions from net investment income | (.444) | (.462) | (.461) | (.460) | (.457) |
Distributions from net realized gain | (.004) | (.007) | (.007) | (.015) | (.005) |
Total distributions | (.448) | (.469) | (.468) | (.475) | (.462) |
Redemption fees added to paid in capital B,D | - | - | - | - | - |
Net asset value, end of period | $ 12.54 | $ 12.24 | $ 11.66 | $ 11.85 | $ 11.29 |
Total Return A | 6.19% | 9.20% | 2.32% | 9.30% | (.06)% |
Ratios to Average Net Assets C |
Expenses before reductions | .49% | .49% | .49% | .50% | .49% |
Expenses net of fee waivers, if any | .49% | .49% | .49% | .50% | .49% |
Expenses net of all reductions | .48% | .49% | .49% | .50% | .47% |
Net investment income (loss) | 3.57% | 3.90% | 3.86% | 3.94% | 3.96% |
Supplemental Data | | | | | |
Net assets, end of period (000 omitted) | $ 693,682 | $ 621,994 | $ 626,752 | $ 645,195 | $ 568,852 |
Portfolio turnover rate | 10% | 9% | 7% | 6% | 19% |
A Total returns would have been lower if certain expenses had not been reduced during the applicable periods shown.
B Calculated based on average shares outstanding during the period.
C Expense ratios reflect operating expenses of the Fund. Expenses before reductions do not reflect amounts reimbursed by the investment adviser or reductions from expense offset arrangements and do not represent the amount paid by the Fund during periods when reimbursements or reductions occur. Expenses net of fee waivers reflect expenses after reimbursement by the investment adviser but prior to reductions from expense offset arrangements. Expenses net of all reductions represent the net expenses paid by the Fund.
D Amount represents less than $.001 per share.
See accompanying notes which are an integral part of the financial statements.
Annual Report
Fidelity Michigan Municipal Money Market Fund
Investment Changes/Performance (Unaudited)
Effective Maturity Diversification |
Days | % of fund's
investments 12/31/12 | % of fund's
investments 6/30/12 | % of fund's
investments
12/31/11 |
1 - 7 | 80.1 | 75.0 | 75.0 |
8 - 30 | 5.5 | 5.4 | 4.7 |
31 - 60 | 2.6 | 1.2 | 4.6 |
61 - 90 | 0.0 | 6.7 | 2.7 |
91 - 180 | 3.8 | 4.7 | 7.0 |
> 180 | 8.0 | 7.0 | 6.0 |
Effective maturity is determined in accordance with the requirements of Rule 2a-7 under the Investment Company Act of 1940. |
Weighted Average Maturity |
| 12/31/12 | 6/30/12 | 12/31/11 |
Fidelity Michigan Municipal Money Market Fund | 29 Days | 38 Days | 34 Days |
All Tax-Free Money Market Funds Average* | 34 Days | 30 Days | 32 Days |
This is a weighted average of all the maturities of the securities held in a fund. Weighted Average Maturity (WAM) can be used as a measure of sensitivity to interest rate changes and market changes. Generally, the longer the maturity, the greater the sensitivity to such changes. WAM is based on the dollar-weighted average length of time until principal payments must be paid. Depending on the types of securities held in a fund, certain maturity shortening devices (e.g., demand features, interest rate resets, and call options) may be taken into account when calculating the WAM. |
* Source: iMoneyNet Inc.
Weighted Average Life |
| 12/31/12 | 6/30/12 | 12/31/11 |
Fidelity Michigan Municipal Money Market Fund | 29 Days | 38 Days | 34 Days |
Weighted Average Life (WAL) is the weighted average of the life of the securities held in a fund or portfolio and can be used as a measure of sensitivity to changes in liquidity and/or credit risk. Generally, the higher the value, the greater the sensitivity. WAL is based on the dollar-weighted average length of time until principal payments must be paid, taking into account any call options exercised by the issuer and any permissible maturity shortening features other than interest rate resets. The difference between WAM and WAL is that WAM takes into account interest rate resets and WAL does not. WAL for money market funds is not the same as WAL of a mortgage- or asset-backed security. |
Asset Allocation (% of fund's net assets) |
As of December 31, 2012 | As of June 30, 2012 |
| Variable Rate
Demand Notes
(VRDNs) 67.0% | | | Variable Rate
Demand Notes
(VRDNs) 71.7% | |
 | Other
Municipal Debt 21.6% | | | Other
Municipal Debt 25.2% | |
| Investment
Companies 9.0% | | | Investment
Companies 4.1% | |
| Net Other Assets (Liabilities) 2.4% | |  | Net Other Assets (Liabilities)** (1.0)% | |

Current and Historical Seven-Day Yields
| 12/31/12 | 9/30/12 | 6/30/12 | 3/31/12 | 1/2/12 |
Fidelity Michigan Municipal Money Market Fund | 0.01% | 0.01% | 0.01% | 0.01% | 0.01% |
Yield refers to the income paid by the fund over a given period. Yields for money market funds are usually for seven-day periods, as they are here, though they are expressed as annual percentage rates. Past performance is no guarantee of future results. Yield will vary and it's possible to lose money investing in the Fund. A portion of the Fund's expenses was reimbursed and/or waived. Absent such reimbursements and/or waivers the yield for the period ending December 31, 2012, the most recent period shown in the table, would have been -0.38%.
** Net Other Assets (Liabilities) are not included in the pie chart.
Annual Report
Fidelity Michigan Municipal Money Market Fund
Investments December 31, 2012
Showing Percentage of Net Assets
Variable Rate Demand Note - 67.0% |
| Principal
Amount | | Value |
Alabama - 0.0% |
Decatur Indl. Dev. Board Exempt Facilities Rev. (Nucor Steel Decatur LLC Proj.) Series 2003 A, 0.39% 1/7/13, VRDN (a)(c) | $ 600,000 | | $ 600,000 |
Delaware - 0.3% |
Delaware Econ. Dev. Auth. Rev. (Delmarva Pwr. & Lt. Co. Proj.): | | | |
Series 1987, 0.26% 1/2/13, VRDN (a)(c) | 2,300,000 | | 2,300,000 |
Series 1999 A, 0.39% 1/7/13, VRDN (a) | 400,000 | | 400,000 |
| | 2,700,000 |
Louisiana - 0.6% |
Louisiana Pub. Facilities Auth. Rev. (Air Products & Chemicals, Inc. Proj.): | | | |
Series 2002, 0.14% 1/7/13, VRDN (a)(c) | 2,800,000 | | 2,800,000 |
Series 2003, 0.14% 1/7/13, VRDN (a)(c) | 3,000,000 | | 3,000,000 |
Saint James Parish Gen. Oblig. (Nucor Steel Louisiana LLC Proj.) Series 2010 B1, 0.35% 1/7/13, VRDN (a) | 300,000 | | 300,000 |
| | 6,100,000 |
Michigan - 64.5% |
Central Michigan Univ. Rev. Series 2008 A, 0.13% 1/7/13, LOC JPMorgan Chase Bank, VRDN (a) | 1,900,000 | | 1,900,000 |
Detroit City School District Participating VRDN Series Solar 06 01, 0.13% 1/7/13 (Liquidity Facility U.S. Bank NA, Cincinnati) (a)(d) | 29,980,000 | | 29,980,000 |
Grand Rapids Econ. Dev. Corp. (Cornerstone Univ. Proj.) 0.13% 1/7/13, LOC PNC Bank NA, VRDN (a) | 6,475,000 | | 6,475,000 |
Grand Traverse County Hosp. Series 2011 B, 0.14% 1/7/13, LOC JPMorgan Chase Bank, VRDN (a) | 19,825,000 | | 19,825,000 |
Grand Valley Michigan State Univ. Rev.: | | | |
Series 2005, 0.11% 1/7/13, LOC PNC Bank NA, VRDN (a) | 29,180,000 | | 29,180,000 |
Series 2008 B, 0.13% 1/7/13, LOC U.S. Bank NA, Cincinnati, VRDN (a) | 20,940,000 | | 20,940,000 |
Kent Hosp. Fin. Auth. Hosp. Facilities Rev.: | | | |
(Metropolitan Hosp. Proj.) Series 2012, 0.12% 1/7/13, LOC Bank of America NA, VRDN (a) | 8,375,000 | | 8,375,000 |
(Spectrum Health Sys. Proj.) Series 2008 B3, 0.14% 1/7/13 (Liquidity Facility Wells Fargo Bank NA), VRDN (a) | 3,700,000 | | 3,700,000 |
Livonia Econ. Dev. Corp. (Madonna Univ. Proj.) Series 2009, 0.14% 1/7/13, LOC Fed. Home Ln. Bank Chicago, VRDN (a) | 8,675,000 | | 8,675,000 |
Michigan Bldg. Auth. Rev.: | | | |
Participating VRDN Series Solar 06 21, 0.13% 1/7/13 (Liquidity Facility U.S. Bank NA, Cincinnati) (a)(d) | 18,185,000 | | 18,185,000 |
Variable Rate Demand Note - continued |
| Principal
Amount | | Value |
Michigan - continued |
Michigan Bldg. Auth. Rev.: - continued | | | |
Series 2007 I, 0.14% 1/7/13, LOC JPMorgan Chase Bank, VRDN (a) | $ 3,100,000 | | $ 3,100,000 |
Series 2011 IIB, 0.14% 1/7/13, LOC JPMorgan Chase Bank, VRDN (a) | 3,000,000 | | 3,000,000 |
Michigan Fin. Auth. Rev.: | | | |
Participating VRDN: | | | |
Series RBC O 32, 0.13% 1/7/13 (Liquidity Facility Royal Bank of Canada) (a)(d) | 3,850,000 | | 3,850,000 |
Series ROC II R 14014, 0.14% 1/7/13 (Liquidity Facility Citibank NA) (a)(d) | 8,600,000 | | 8,600,000 |
Series 2012 C, 0.13% 1/7/13, LOC Citibank NA, VRDN (a) | 26,500,000 | | 26,500,000 |
Michigan Higher Ed. Rev. (Thomas M. Cooley Law School Proj.) Series 2008 A, 0.13% 1/7/13, LOC Wells Fargo Bank NA, VRDN (a) | 565,000 | | 565,000 |
Michigan Hosp. Fin. Auth. Rev.: | | | |
(Henry Ford Health Sys. Proj.) Series 2007, 0.13% 1/7/13, LOC JPMorgan Chase Bank, VRDN (a) | 21,165,000 | | 21,165,000 |
(Trinity Health Sys. Proj.) Series 2005 F, 0.11% 1/7/13, VRDN (a) | 2,200,000 | | 2,200,000 |
Participating VRDN Series RBC O 33, 0.13% 1/7/13 (Liquidity Facility Royal Bank of Canada) (a)(d) | 2,500,000 | | 2,500,000 |
Michigan Hsg. Dev. Auth. Ltd.: | | | |
(Sand Creek Apts., Phase I Proj.) Series 2007 A, 0.16% 1/7/13, LOC Citibank NA, VRDN (a)(c) | 3,700,000 | | 3,700,000 |
(Sand Creek II Apts. Proj.) Series 2007 A, 0.16% 1/7/13, LOC Citibank NA, VRDN (a)(c) | 5,495,000 | | 5,495,000 |
(Teal Run I Apts. Proj.) Series 2007 A, 0.16% 1/7/13, LOC Citibank NA, VRDN (a)(c) | 6,350,000 | | 6,350,000 |
Michigan Hsg. Dev. Auth. Multi-family Hsg. Rev.: | | | |
(Canton Club East Apts. Proj.) Series 1998 A, 0.14% 1/7/13, LOC Fannie Mae, VRDN (a)(c) | 6,700,000 | | 6,700,000 |
(Hunt Club Apts. Proj.) 0.14% 1/7/13, LOC Fannie Mae, VRDN (a)(c) | 6,595,000 | | 6,595,000 |
Michigan Hsg. Dev. Auth. Single Family Mtg. Rev.: | | | |
Series 2007 B, 0.16% 1/7/13 (Liquidity Facility Fannie Mae) (Liquidity Facility Freddie Mac), VRDN (a)(c) | 75,300,000 | | 75,300,000 |
Series 2009 D, 0.14% 1/7/13 (Liquidity Facility Fannie Mae) (Liquidity Facility Freddie Mac), VRDN (a) | 35,470,000 | | 35,470,000 |
Michigan Hsg. Dev. Ltd. Oblig. Rev. (JAS Non-Profit Hsg. Corp. VI Proj.) Series 2000, 0.15% 1/7/13, LOC JPMorgan Chase Bank, VRDN (a) | 6,000,000 | | 6,000,000 |
Variable Rate Demand Note - continued |
| Principal
Amount | | Value |
Michigan - continued |
Michigan State Univ. Revs. Series 2000 A, 0.15% 1/7/13 (Liquidity Facility Northern Trust Co.), VRDN (a) | $ 2,100,000 | | $ 2,100,000 |
Michigan Strategic Fund Indl. Dev. Rev. (Lapeer Industries, Inc. Proj.) Series 2007, 0.29% 1/7/13, LOC Bank of America NA, VRDN (a)(c) | 900,000 | | 900,000 |
Michigan Strategic Fund Ltd. Oblig. Rev.: | | | |
(Air Products and Chemicals, Inc. Proj.) Series 2007 V1, 0.11% 1/2/13, VRDN (a) | 34,350,000 | | 34,350,000 |
(Almond Products, Inc. Proj.) 0.29% 1/7/13, LOC Bank of America NA, VRDN (a)(c) | 5,715,000 | | 5,715,000 |
(BC & C Proj.) 0.23% 1/7/13, LOC Comerica Bank, VRDN (a)(c) | 475,000 | | 475,000 |
(Consumers Energy Co. Proj.) 0.14% 1/7/13, LOC JPMorgan Chase Bank, VRDN (a)(c) | 4,500,000 | | 4,500,000 |
(Evangelical Homes of Michigan Proj.) Series 2008, 0.18% 1/7/13, LOC JPMorgan Chase Bank, VRDN (a) | 6,800,000 | | 6,800,000 |
(Greenpath, Inc. Proj.) Series 2011, 0.12% 1/7/13, LOC PNC Bank NA, VRDN (a) | 5,705,000 | | 5,705,000 |
(Henry Ford Museum & Greenfield Village Projs.) Series 2002, 0.14% 1/2/13, LOC Comerica Bank, VRDN (a) | 10,550,000 | | 10,550,000 |
(S & S LLC Proj.) Series 2000, 0.4% 1/7/13, LOC U.S. Bank NA, Cincinnati, VRDN (a)(c) | 1,005,000 | | 1,005,000 |
(The Kroger Co. Recovery Zone Facilities Bond Proj.) Series 2010, 0.13% 1/7/13, LOC Bank of Tokyo-Mitsubishi UFJ Ltd., VRDN (a) | 19,000,000 | | 19,000,000 |
(The YMCA of Greater Grand Rapids Proj.) Series 2010, 0.14% 1/7/13, LOC Comerica Bank, VRDN (a) | 10,250,000 | | 10,250,000 |
(Van Andel Research Institute Proj.) Series 2008, 0.13% 1/7/13, LOC Bank of America NA, VRDN (a) | 100,400,000 | | 100,399,999 |
(YMCA Metropolitan Detroit Proj.) Series 2001, 0.14% 1/7/13, LOC JPMorgan Chase Bank, VRDN (a) | 10,330,000 | | 10,330,000 |
(YMCA Metropolitan Lansing Proj.) Series 2002, 0.28% 1/7/13, LOC Bank of America NA, VRDN (a) | 8,225,000 | | 8,225,000 |
Oakland County Econ. Dev. Corp. Ltd. Oblig. Rev. (Osmic, Inc. Proj.) Series 2001 A, 0.2% 1/7/13, LOC JPMorgan Chase Bank, VRDN (a)(c) | 4,300,000 | | 4,300,000 |
Univ. of Michigan Univ. Rev. Series 2012 D2, 0.12% 1/7/13, VRDN (a) | 10,000,000 | | 10,000,000 |
Waterford Econ. Dev. Corp. Ltd. Oblig. Rev. (Canterbury Health Care, Inc. Proj.) Series 2009, 0.16% 1/7/13, LOC Fed. Home Ln. Bank of Boston, VRDN (a) | 5,650,000 | | 5,650,000 |
Wayne County Arpt. Auth. Rev.: | | | |
0.13% 1/7/13, LOC PNC Bank NA, VRDN (a)(c) | 8,995,000 | | 8,995,000 |
Variable Rate Demand Note - continued |
| Principal
Amount | | Value |
Michigan - continued |
Wayne County Arpt. Auth. Rev.: - continued | | | |
0.14% 1/7/13, LOC JPMorgan Chase Bank, VRDN (a)(c) | $ 8,975,000 | | $ 8,975,000 |
0.14% 1/7/13, LOC JPMorgan Chase Bank, VRDN (a) | 13,000,000 | | 13,000,000 |
| | 635,549,999 |
Minnesota - 0.3% |
St. Paul City Port Auth. District Heating Rev. Series 2009 8R, 0.19% 1/7/13, LOC Deutsche Bank AG, VRDN (a)(c) | 3,060,000 | | 3,060,000 |
Nebraska - 0.2% |
Douglas County Solid Waste Disp. Rev. (Waste Mgmt., Inc. Proj.) Series A, 0.18% 1/7/13, LOC Bank of America NA, VRDN (a)(c) | 1,000,000 | | 1,000,000 |
Stanton County Indl. Dev. Rev. (Nucor Corp. Proj.) Series 1996, 0.39% 1/7/13, VRDN (a)(c) | 600,000 | | 600,000 |
| | 1,600,000 |
New Jersey - 0.1% |
Salem County Poll. Cont. Fin. Auth. Rev. (Pub. Svc. Elec. and Gas Co. Proj.): | | | |
Series 2003 B1, 0.33% 1/7/13, VRDN (a) | 100,000 | | 100,000 |
Series 2012 A, 0.37% 1/7/13, VRDN (a)(c) | 500,000 | | 500,000 |
| | 600,000 |
New York - 0.0% |
Dutchess County Indl. Dev. Agcy. Civic Facility Rev. (Lutheran Ctr. at Poughkeepsie, Inc. Proj.) 0.26% 1/7/13, LOC KeyBank NA, VRDN (a) | 100,000 | | 100,000 |
North Carolina - 0.1% |
Parson County Indl. Facilities and Poll. Cont. Fing. Auth. (CertainTeed Gypsum NC, Inc. Proj.) Series 2010, 0.22% 1/7/13, LOC Cr. Industriel et Commercial, VRDN (a) | 700,000 | | 700,000 |
Ohio - 0.3% |
Ohio Air Quality Dev. Auth. Rev. (Cincinnati Gas & Elec. Co. Proj.) Series B, 0.24% 1/7/13, VRDN (a) | 2,300,000 | | 2,300,000 |
Ohio Higher Edl. Facility Commission Rev. (Univ. Hosp. Health Sys. Proj.) Series 2008 B, 0.18% 1/7/13, LOC RBS Citizens NA, VRDN (a) | 1,000,000 | | 1,000,000 |
| | 3,300,000 |
Puerto Rico - 0.2% |
Puerto Rico Commonwealth Pub. Impt. Gen. Oblig. Series 2003 C5-2, 0.13% 1/7/13, LOC Barclays Bank PLC NY Branch, VRDN (a) | 1,770,000 | | 1,770,000 |
Variable Rate Demand Note - continued |
| Principal
Amount | | Value |
South Carolina - 0.1% |
Oconee County Poll. Cont. Rev. (Duke Energy Corp. Proj.) Series 1999 A, 0.19% 1/2/13, VRDN (a) | $ 1,000,000 | | $ 1,000,000 |
Texas - 0.1% |
Port Arthur Navigation District Indl. Dev. Corp. Exempt Facilities Rev. (Air Products Proj.) Series 2000, 0.14% 1/7/13, VRDN (a)(c) | 1,000,000 | | 1,000,000 |
Virginia - 0.2% |
Newport News Indl. Dev. Auth. (CNU Warwick LLC Student Apts. Proj.) 0.18% 1/7/13, LOC Bank of America NA, VRDN (a) | 1,510,000 | | 1,510,000 |
Virginia Hsg. Dev. Auth. Commonwealth Mtg. Rev. Participating VRDN Series BA 1046, 0.22% 1/7/13 (Liquidity Facility Bank of America NA) (a)(c)(d) | 1,000,000 | | 1,000,000 |
| | 2,510,000 |
TOTAL VARIABLE RATE DEMAND NOTE | 660,589,999 |
Other Municipal Debt - 21.6% |
| | | |
Kentucky - 0.2% |
Trimble County Poll. Cont. Rev. Bonds (Louisville Gas & Elec. Co. Proj.) Series 2001 B, 0.4% tender 1/16/13, CP mode (c) | 1,400,000 | | 1,400,000 |
Massachusetts - 0.2% |
Massachusetts Indl. Fin. Agcy. Poll. Cont. Rev. Bonds Series 1993 B, 0.45% tender 1/15/13, CP mode | 2,000,000 | | 2,000,000 |
Michigan - 20.7% |
Clarkston Cmnty. Schools Bonds 5% 5/1/13 | 2,750,000 | | 2,791,734 |
Michigan Bldg. Auth. Rev.: | | | |
Bonds: | | | |
(Facilities Prog.) Series 2011 A, 5% 10/15/13 | 1,110,000 | | 1,151,611 |
Series I, 5.25% 10/15/13 | 2,000,000 | | 2,077,831 |
Series 6, 0.21% 1/17/13, LOC State Street Bank & Trust Co., Boston, LOC U.S. Bank NA, Cincinnati, CP | 47,280,000 | | 47,280,000 |
Michigan Fin. Auth. Rev. Bonds: | | | |
Series 2012 A, 2% 7/1/13 | 32,870,000 | | 33,165,459 |
Series 2012, 2% 1/1/14 | 3,800,000 | | 3,867,326 |
Michigan Gen. Oblig. Bonds: | | | |
Series 2001, 5.5% 12/1/13 | 3,500,000 | | 3,668,718 |
Series 2003 A, 5% 5/1/13 | 1,600,000 | | 1,624,137 |
Series 2012 A, 5% 9/15/13 | 1,300,000 | | 1,343,132 |
Other Municipal Debt - continued |
| Principal
Amount | | Value |
Michigan - continued |
Michigan Hosp. Fin. Auth. Rev. Bonds: | | | |
(Ascension Health Cr. Group Proj.) Series 2010 F4, 1.35%, tender 4/1/13 (a) | $ 5,925,000 | | $ 5,941,690 |
(Ascension Health Sr. Cr. Group Proj.) Series 2010 F: | | | |
0.22%, tender 7/29/13 (a) | 7,600,000 | | 7,600,000 |
0.22%, tender 7/29/13 (a) | 8,800,000 | | 8,800,000 |
0.22%, tender 7/29/13 (a) | 7,100,000 | | 7,100,000 |
(Trinity Health Sys. Proj.) Series 2008 C: | | | |
0.16% tender 1/2/13, CP mode | 17,300,000 | | 17,300,000 |
0.16% tender 2/12/13, CP mode | 10,595,000 | | 10,595,000 |
0.19% tender 2/4/13, CP mode | 11,915,000 | | 11,915,000 |
Series 2002 A, 5.75% 4/1/13 (Pre-Refunded to 4/1/13 @ 100) | 10,150,000 | | 10,288,186 |
Series 2012 A, 2% 6/1/13 | 7,340,000 | | 7,392,017 |
Michigan Muni. Bond Auth. Rev. Bonds: | | | |
Series 2002, 5.5% 10/1/13 | 5,000,000 | | 5,198,259 |
Series 2010, 5% 10/1/13 | 2,095,000 | | 2,169,793 |
Michigan State Univ. Revs. Bonds: | | | |
Series 2010 C, 5% 2/15/13 | 2,500,000 | | 2,514,714 |
Series WF 11 33 C, 0.27%, tender 6/13/13 (Liquidity Facility Wells Fargo Bank NA) (a)(d)(e) | 7,625,000 | | 7,625,000 |
Michigan Trunk Line Fund Rev. Bonds Series 2004, 5.25% 11/1/13 | 1,000,000 | | 1,041,756 |
Troy School District Bonds Series 2004, 5% 5/1/13 (Michigan Gen. Oblig. Guaranteed) | 1,090,000 | | 1,106,607 |
| | 203,557,970 |
New Hampshire - 0.2% |
New Hampshire Bus. Fin. Auth. Poll. Cont. Rev. Bonds (New England Pwr. Co. Proj.): | | | |
Series 1990 A, 0.5% tender 1/9/13, CP mode (c) | 1,600,000 | | 1,600,000 |
Series A1, 0.4% tender 1/16/13, CP mode (c) | 600,000 | | 600,000 |
| | 2,200,000 |
Virginia - 0.3% |
Halifax County Indl. Dev. Auth. Poll. Cont. Rev. Bonds (Virginia Elec. & Pwr. Co. Proj.) Series 1992, 0.95% tender 1/4/13, CP mode (c) | 3,200,000 | | 3,200,000 |
TOTAL OTHER MUNICIPAL DEBT | 212,357,970 |
Investment Company - 9.0% |
| Principal
Amount | | Value |
Fidelity Municipal Cash Central Fund, 0.16% (b)(f) | $ 88,658,000 | | $ 88,658,000 |
TOTAL INVESTMENT PORTFOLIO - 97.6% (Cost $961,605,969) | | 961,605,969 |
NET OTHER ASSETS (LIABILITIES) - 2.4% | | 23,993,794 |
NET ASSETS - 100% | $ 985,599,763 |
Security Type Abbreviations |
CP | - | COMMERCIAL PAPER |
VRDN | - | VARIABLE RATE DEMAND NOTE (A debt instrument that is payable upon demand, either daily, weekly or monthly) |
Legend |
(a) Coupon rates for floating and adjustable rate securities reflect the rates in effect at period end. |
(b) Affiliated fund that is available only to investment companies and other accounts managed by Fidelity Investments. The rate quoted is the annualized seven-day yield of the fund at period end. A complete unaudited listing of the fund's holdings as of its most recent quarter end is available upon request. In addition, each Fidelity Central Fund's financial statements, which are not covered by the Fund's Report of Independent Registered Public Accounting Firm, are available on the SEC's website or upon request. |
(c) Private activity obligations whose interest is subject to the federal alternative minimum tax for individuals. |
(d) Provides evidence of ownership in one or more underlying municipal bonds. |
(e) Restricted securities - Investment in securities not registered under the Securities Act of 1933 (excluding 144A issues). At the end of the period, the value of restricted securities (excluding 144A issues) amounted to $7,625,000 or 0.8% of net assets. |
Additional information on each restricted holding is as follows: |
Security | Acquisition Date | Cost |
Michigan State Univ. Revs. Bonds Series WF 11 33 C, 0.27%, tender 6/13/13 (Liquidity Facility Wells Fargo Bank NA) | 3/17/11 - 5/15/12 | $ 7,625,000 |
(f) Information in this report regarding holdings by state and security types does not reflect the holdings of the Fidelity Municipal Cash Central Fund. |
Affiliated Central Funds |
Information regarding fiscal year to date income earned by the Fund from investments in Fidelity Central Funds is as follows: |
Fund | Income earned |
Fidelity Municipal Cash Central Fund | $ 111,471 |
Other Information |
The date shown for securities represents the date when principal payments must be paid, taking into account any call options exercised by the issuer and any permissible maturity shortening features other than interest rate resets. |
All investments are categorized as Level 2 under the Fair Value Hierarchy. The inputs or methodology used for valuing securities may not be an indication of the risk associated with investing in those securities. For more information on valuation inputs, please refer to the Investment Valuation section in the accompanying Notes to Financial Statements. |
See accompanying notes which are an integral part of the financial statements.
Annual Report
Fidelity Michigan Municipal Money Market Fund
Statement of Assets and Liabilities
| December 31, 2012 |
| | |
Assets | | |
Investment in securities, at value - See accompanying schedule: Unaffiliated issuers (cost $872,947,969) | $ 872,947,969 | |
Fidelity Central Funds (cost $88,658,000) | 88,658,000 | |
Total Investments (cost $961,605,969) | | $ 961,605,969 |
Cash | | 18,916,385 |
Receivable for fund shares sold | | 19,787,050 |
Interest receivable | | 951,806 |
Distributions receivable from Fidelity Central Funds | | 12,766 |
Prepaid expenses | | 1,926 |
Other receivables | | 1,013 |
Total assets | | 1,001,276,915 |
| | |
Liabilities | | |
Payable for investments purchased | $ 3,700,014 | |
Payable for fund shares redeemed | 11,704,388 | |
Distributions payable | 262 | |
Accrued management fee | 102,736 | |
Other affiliated payables | 137,487 | |
Other payables and accrued expenses | 32,265 | |
Total liabilities | | 15,677,152 |
| | |
Net Assets | | $ 985,599,763 |
Net Assets consist of: | | |
Paid in capital | | $ 985,599,016 |
Accumulated undistributed net realized gain (loss) on investments | | 747 |
Net Assets, for 984,642,216 shares outstanding | | $ 985,599,763 |
Net Asset Value, offering price and redemption price per share ($985,599,763 ÷ 984,642,216 shares) | | $ 1.00 |
See accompanying notes which are an integral part of the financial statements.
Annual Report
Fidelity Michigan Municipal Money Market Fund
Financial Statements - continued
Statement of Operations
| Year ended December 31, 2012 |
| | |
Investment Income | | |
Interest | | $ 1,617,951 |
Income from Fidelity Central Funds | | 111,471 |
Total income | | 1,729,422 |
| | |
Expenses | | |
Management fee | $ 3,194,267 | |
Transfer agent fees | 1,374,080 | |
Accounting fees and expenses | 107,219 | |
Custodian fees and expenses | 11,759 | |
Independent trustees' compensation | 3,157 | |
Registration fees | 32,771 | |
Audit | 37,273 | |
Legal | 10,427 | |
Miscellaneous | 5,754 | |
Total expenses before reductions | 4,776,707 | |
Expense reductions | (3,134,975) | 1,641,732 |
Net investment income (loss) | | 87,690 |
Realized and Unrealized Gain (Loss) Net realized gain (loss) on: | | |
Investment securities: | | |
Unaffiliated issuers | 51 | |
Capital gain distributions from Fidelity Central Funds | 422 | |
Total net realized gain (loss) | | 473 |
Net increase in net assets resulting from operations | | $ 88,163 |
See accompanying notes which are an integral part of the financial statements.
Annual Report
Statement of Changes in Net Assets
| Year ended
December 31,
2012 | Year ended
December 31,
2011 |
Increase (Decrease) in Net Assets | | |
Operations | | |
Net investment income (loss) | $ 87,690 | $ 86,215 |
Net realized gain (loss) | 473 | (10) |
Net increase in net assets resulting
from operations | 88,163 | 86,205 |
Distributions to shareholders from net investment income | (87,525) | (86,008) |
Share transactions at net asset value of $1.00 per share
Proceeds from sales of shares | 2,293,893,207 | 2,427,760,562 |
Reinvestment of distributions | 85,435 | 85,070 |
Cost of shares redeemed | (2,184,015,562) | (2,442,465,101) |
Net increase (decrease) in net assets and shares resulting from share transactions | 109,963,080 | (14,619,469) |
Total increase (decrease) in net assets | 109,963,718 | (14,619,272) |
| | |
Net Assets | | |
Beginning of period | 875,636,045 | 890,255,317 |
End of period | $ 985,599,763 | $ 875,636,045 |
See accompanying notes which are an integral part of the financial statements.
Annual Report
Financial Highlights
Years ended December 31, | 2012 | 2011 | 2010 | 2009 | 2008 |
Selected Per-Share Data | | | | | |
Net asset value, beginning of period | $ 1.00 | $ 1.00 | $ 1.00 | $ 1.00 | $ 1.00 |
Income from Investment Operations | | | | | |
Net investment income (loss) | - D | - D | - D | - D | .017 |
Net realized and unrealized gain (loss) D | - | - | - | - | - |
Total from investment operations | - D | - D | - D | - D | .017 |
Distributions from net investment income | - D | - D | - D | - D | (.017) |
Distributions from net realized gain | - | - | - | - D | - |
Total distributions | - D | - D | - D | - D | (.017) |
Net asset value, end of period | $ 1.00 | $ 1.00 | $ 1.00 | $ 1.00 | $ 1.00 |
Total Return A | .01% | .01% | .01% | .02% | 1.68% |
Ratios to Average Net Assets B,C |
Expenses before reductions | .55% | .55% | .55% | .60% | .54% |
Expenses net of fee waivers, if any | .19% | .22% | .30% | .48% | .54% |
Expenses net of all reductions | .19% | .22% | .30% | .48% | .48% |
Net investment income (loss) | .01% | .01% | .01% | .02% | 1.66% |
Supplemental Data | | | | | |
Net assets, end of period (000 omitted) | $ 985,600 | $ 875,636 | $ 890,255 | $ 902,486 | $ 1,121,825 |
A Total returns would have been lower if certain expenses had not been reduced during the applicable periods shown.
B Fees and expenses of any underlying Fidelity Central Funds are not included in the Fund's expense ratio. The Fund indirectly bears its proportionate share of the expenses of any underlying Fidelity Central Funds.
C Expense ratios reflect operating expenses of the Fund. Expenses before reductions do not reflect amounts reimbursed or waived or reductions from expense offset arrangements and do not represent the amount paid by the Fund during periods when reimbursements, waivers or reductions occur. Expenses net of fee waivers reflect expenses after reimbursement and waivers but prior to reductions from expense offset arrangements. Expenses net of all reductions represent the net expenses paid by the Fund.
D Amount represents less than $.001 per share.
See accompanying notes which are an integral part of the financial statements.
Annual Report
Notes to Financial Statements
For the period ended December 31, 2012
1. Organization.
Fidelity Michigan Municipal Income Fund (the Income Fund) is a fund of Fidelity Municipal Trust. Fidelity Michigan Municipal Money Market Fund (the Money Market Fund) is a fund of Fidelity Municipal Trust II. Each Trust is registered under the Investment Company Act of 1940, as amended (the 1940 Act), as an open-end management investment company. Fidelity Municipal Trust and Fidelity Municipal Trust II (the Trusts) are organized as a Massachusetts business trust and a Delaware statutory trust, respectively. The Income Fund is a non-diversified fund. Each Fund is authorized to issue an unlimited number of shares. Each Fund may be affected by economic and political developments in the state of Michigan.
2. Investments in Fidelity Central Funds.
The Funds may invest in Fidelity Central Funds, which are open-end investment companies available only to other investment companies and accounts managed by Fidelity Management & Research Company (FMR) and its affiliates. The Funds' Schedules of Investments list each of the Fidelity Central Funds held as of period end, if any, as an investment of each Fund, but do not include the underlying holdings of each Fidelity Central Fund. As an Investing Fund, each Fund indirectly bears its proportionate share of the expenses of the underlying Fidelity Central Funds.
The Money Market Central Funds seek preservation of capital and current income and are managed by Fidelity Investments Money Management, Inc. (FIMM), an affiliate of FMR.
A complete unaudited list of holdings for each Fidelity Central Fund is available upon request or at the Securities and Exchange Commission (the SEC) website at www.sec.gov. In addition, the financial statements of the Fidelity Central Funds, which are not covered by the Funds' Report of Independent Registered Public Accounting Firm, are available on the SEC website or upon request.
3. Significant Accounting Policies.
The financial statements have been prepared in conformity with accounting principles generally accepted in the United States of America (GAAP), which require management to make certain estimates and assumptions at the date of the financial statements. Actual results could differ from those estimates. Subsequent events, if any, through the date that the financial statements were issued have been evaluated in the preparation of the financial statements. The following summarizes the significant accounting policies of the Funds:
Annual Report
3. Significant Accounting Policies - continued
Investment Valuation. Investments are valued as of 4:00 p.m. Eastern time on the last calendar day of the period. In accordance with valuation policies and procedures approved by the Board of Trustees (the Board), the Income Fund attempts to obtain prices from one or more third party pricing vendors or brokers to value its investments. When current market prices, quotations or rates are not readily available or reliable, investments will be fair valued in good faith by the FMR Fair Value Committee (the Committee), in accordance with procedures adopted by the Board. Factors used in determining fair value vary by investment type and may include market or investment specific events, changes in interest rates and credit quality. The frequency with which these procedures are used cannot be predicted and they may be utilized to a significant extent. The Committee oversees the Income Fund's valuation policies and procedures and is responsible for approving and reporting to the Board all fair value determinations.
Each Fund categorizes the inputs to valuation techniques used to value their investments into a disclosure hierarchy consisting of three levels as shown below:
Level 1 - quoted prices in active markets for identical investments
Level 2 - other significant observable inputs (including quoted prices for similar investments, interest rates, prepayment speeds, etc.)
Level 3 - unobservable inputs (including the Fund's own assumptions based on the best information available)
Valuation techniques used to value each Fund's investments by major category are as follows:
For the Income Fund, debt securities, including restricted securities, are valued based on evaluated prices received from third party pricing vendors or from brokers who make markets in such securities. For municipal securities, pricing vendors utilize matrix pricing which considers yield or price of bonds of comparable quality, coupon, maturity and type as well as broker-supplied prices and are generally categorized as Level 2 in the hierarchy. When independent prices are unavailable or unreliable, debt securities may be valued utilizing pricing methodologies which consider similar factors that would be used by third party pricing vendors. These are generally categorized as Level 2 in the hierarchy but may be Level 3 depending on the circumstances.
For the Money Market Fund, as permitted by compliance with certain conditions under Rule 2a-7 of the 1940 Act, securities are valued at amortized cost, which approximates fair value. The amortized cost of an instrument is determined by valuing it at its original cost and thereafter amortizing any discount or premium from its face value at a constant rate until maturity. Securities held by a money market fund are generally high quality and liquid; however, they are reflected as Level 2 because the inputs used to determine fair value are not quoted prices in an active market.
Annual Report
Notes to Financial Statements - continued
3. Significant Accounting Policies - continued
Investment Valuation - continued
For the Income Fund, changes in valuation techniques may result in transfers in or out of an assigned level within the disclosure hierarchy.
Investment Transactions and Income. For financial reporting purposes, the Funds' investment holdings and net asset value (NAV) include trades executed through the end of the last business day of the period. The NAV per share for processing shareholder transactions is calculated as of the close of business of the New York Stock Exchange (NYSE), normally 4:00 p.m. Eastern time and includes trades executed through the end of the prior business day for the Income Fund and trades executed through the end of the current business day for the Money Market Fund. Gains and losses on securities sold are determined on the basis of identified cost. Interest income and distributions from the Fidelity Central Funds are accrued as earned. Interest income includes coupon interest and amortization of premium and accretion of discount on debt securities.
Expenses. Expenses directly attributable to a fund are charged to that fund. Expenses attributable to more than one fund are allocated among the respective funds on the basis of relative net assets or other appropriate methods. Expense estimates are accrued in the period to which they relate and adjustments are made when actual amounts are known.
Income Tax Information and Distributions to Shareholders. Each year, each Fund intends to qualify as a regulated investment company under Subchapter M of the Internal Revenue Code, including distributing substantially all of its taxable income and realized gains. As a result, no provision for income taxes is required. As of December 31, 2012, each Fund did not have any unrecognized tax benefits in the financial statements; nor is each Fund aware of any tax positions for which it is reasonably possible that the total amounts of unrecognized tax benefits will significantly change in the next twelve months. Each Fund files a U.S. federal tax return, in addition to state and local tax returns as required. A fund's federal income tax returns are subject to examination by the Internal Revenue Service (IRS) for a period of three fiscal years after they are filed. State and local tax returns may be subject to examination for an additional fiscal year depending on the jurisdiction.
Dividends are declared and recorded daily and paid monthly from net investment income. Distributions from realized gains, if any, are declared and recorded on the ex-dividend date. Income and capital gain distributions are determined in accordance with income tax regulations, which may differ from GAAP. In addition, the Funds claimed a portion of the payment made to redeeming shareholders as a distribution for income tax purposes.
Annual Report
3. Significant Accounting Policies - continued
Income Tax Information and Distributions to Shareholders - continued
Capital accounts within the financial statements are adjusted for permanent book-tax differences. These adjustments have no impact on net assets or the results of operations. Temporary book-tax differences will reverse in a subsequent period.
Book-tax differences are primarily due to market discount, deferred trustees compensation and capital loss carryforwards.
The Funds purchase municipal securities whose interest, in the opinion of the issuer, is free from federal income tax. There is no assurance that the IRS will agree with this opinion. In the event the IRS determines that the issuer does not comply with relevant tax requirements, interest payments from a security could become federally taxable, possibly retroactively to the date the security was issued.
The federal tax cost of investment securities and unrealized appreciation (depreciation) as of period end were as follows for each Fund:
| Tax cost | Gross unrealized
appreciation | Gross unrealized
depreciation | Net unrealized
appreciation
(depreciation) on
securities and
other investments |
Fidelity Michigan Municipal Income Fund | $ 619,860,744 | $ 49,082,922 | $ (164,736) | $ 48,918,186 |
Fidelity Michigan Municipal Money Market Fund | 961,605,969 | - | - | - |
The tax-based components of distributable earnings as of period end were as follows for each Fund:
| Undistributed tax-exempt
income | Undistributed long-term
capital gain | Net unrealized appreciation
(depreciation) |
Fidelity Michigan Municipal Income Fund | $ 72,122 | $ 387,351 | $ 48,918,186 |
Fidelity Michigan Municipal Money Market Fund | 892 | - | - |
Annual Report
Notes to Financial Statements - continued
3. Significant Accounting Policies - continued
Income Tax Information and Distributions to Shareholders - continued
The tax character of distributions paid was as follows:
December 31, 2012 | | | |
| Tax-Exempt
Income | Long-term
Capital Gains | Total |
Fidelity Michigan Municipal Income Fund | $ 23,650,013 | $ 220,908 | $ 23,870,921 |
Fidelity Michigan Municipal Money Market Fund | 87,525 | - | 87,525 |
December 31, 2011 | | | |
| Tax-Exempt
Income | Long-term
Capital Gains | Total |
Fidelity Michigan Municipal Income Fund | $ 23,214,211 | $ 352,543 | $ 23,566,754 |
Fidelity Michigan Municipal Money Market Fund | 86,062 | - | 86,062 |
Short-Term Trading (Redemption) Fees. Shares held by investors in the Income Fund less than 30 days are subject to a redemption fee equal to ..50% of the net asset value of shares redeemed. All redemption fees, which reduce the proceeds of the shareholder redemption, are retained by the Fund and accounted for as an addition to paid in capital.
Restricted Securities. The Funds may invest in securities that are subject to legal or contractual restrictions on resale. These securities generally may be resold in transactions exempt from registration or to the public if the securities are registered. Disposal of these securities may involve time-consuming negotiations and expense, and prompt sale at an acceptable price may be difficult. Information regarding restricted securities is included at the end of each applicable Fund's Schedule of Investments.
4. Purchases and Sales of Investments.
Purchases and sales of securities, other than short-term securities, for the Income Fund aggregated $116,949,220 and $62,373,669, respectively.
5. Fees and Other Transactions with Affiliates.
Management Fee. FMR and its affiliates provide the Funds with investment management related services for which the Funds pay a monthly management fee. The management fee is the sum of an individual fund fee rate and an annualized group fee rate. The individual fund fee rate is applied to each Fund's average net assets. The group fee rate is
Annual Report
5. Fees and Other Transactions with Affiliates - continued
Management Fee - continued
based upon the average net assets of all the mutual funds advised by FMR. The group fee rate decreases as assets under management increase and increases as assets under management decrease. For the period, each Fund's annual management fee rate expressed as a percentage of each Fund's average net assets was as follows:
| Individual Rate | Group Rate | Total |
Fidelity Michigan Municipal Income Fund | .25% | .12% | .37% |
Fidelity Michigan Municipal Money Market Fund | .25% | .12% | .37% |
Transfer Agent and Accounting Fees. Citibank, N.A. (Citibank) is the custodian, transfer agent and servicing agent for the Funds. Citibank has entered into a sub-arrangement with Fidelity Investments Institutional Operations Company, Inc. (FIIOC), an affiliate of FMR, under which FIIOC performs the activities associated with the Funds' transfer agency, dividend disbursing and shareholder servicing functions. The Funds pay Citibank account fees and asset-based fees that vary according to account size and type of account. FIIOC pays for typesetting, printing and mailing of shareholder reports, except proxy statements. For the period, the transfer agent fees were equivalent to the following annual rates expressed as a percentage of average net assets:
Fidelity Michigan Municipal Income Fund | .08% |
Fidelity Michigan Municipal Money Market Fund | .16% |
During the period, FMR or its affiliates waived a portion of these fees for the Money Market Fund.
Citibank also has a sub-arrangement with Fidelity Service Company, Inc. (FSC), an affiliate of FMR, under which FSC maintains the Fund's accounting records. The fee is paid to Citibank and is based on the level of average net assets for each month.
6. Committed Line of Credit.
The Income Fund participates with other funds managed by FMR or an affiliate in a $4.25 billion credit facility (the "line of credit") to be utilized for temporary or emergency purposes to fund shareholder redemptions or for other short-term liquidity purposes. The participating funds have agreed to pay commitment fees on their pro-rata portion of the line of credit, which are reflected in Miscellaneous expenses on the Statement of Operations, and are as follows:
Fidelity Michigan Municipal Income Fund | $ 1,769 |
During the period, there were no borrowings on this line of credit.
Annual Report
Notes to Financial Statements - continued
7. Expense Reductions.
Additionally, FMR or its affiliates voluntarily agreed to waive certain fees for the Money Market Fund in order to maintain a minimum annualized yield of .01%. Such arrangements may be discontinued by FMR at any time. For the period, the amount of the waiver was $3,133,739.
In addition, through arrangements with each applicable Fund's custodian, credits realized as a result of uninvested cash balances were used to reduce each applicable Fund's expenses. All of the applicable expense reductions are noted in the table below.
| Custody
expense
reduction | Transfer Agent expense
reduction | Accounting
expense
reduction |
| | | |
Fidelity Michigan Municipal Income Fund | $ 7,114 | $ 5,374 | $ 5 |
Fidelity Michigan Municipal MoneyMarket Fund | 1,236 | - | - |
8. Other.
The Funds' organizational documents provide former and current trustees and officers with a limited indemnification against liabilities arising in connection with the performance of their duties to the Funds. In the normal course of business, the Funds may also enter into contracts that provide general indemnifications. The Funds' maximum exposure under these arrangements is unknown as this would be dependent on future claims that may be made against the Funds. The risk of material loss from such claims is considered remote.
Annual Report
To the Trustees of Fidelity Municipal Trust and Fidelity Municipal Trust II and the Shareholders of Fidelity Michigan Municipal Income Fund and Fidelity Michigan Municipal Money Market Fund:
In our opinion, the accompanying statements of assets and liabilities, including the schedules of investments, and the related statements of operations and of changes in net assets and the financial highlights present fairly, in all material respects, the financial position of Fidelity Michigan Municipal Income Fund (a fund of Fidelity Municipal Trust) and Fidelity Michigan Municipal Money Market Fund (a fund of Fidelity Municipal Trust II) at December 31, 2012, the results of each of their operations for the year then ended, the changes in their net assets for each of the two years in the period then ended and the financial highlights for each of the five years in the period then ended, in conformity with accounting principles generally accepted in the United States of America. These financial statements and financial highlights (hereafter referred to as "financial statements") are the responsibility of the Fidelity Municipal Trust's and Fidelity Municipal Trust II's management. Our responsibility is to express an opinion on these financial statements based on our audits. We conducted our audits of these financial statements in accordance with the standards of the Public Company Accounting Oversight Board (United States). Those standards require that we plan and perform the audit to obtain reasonable assurance about whether the financial statements are free of material misstatement. An audit includes examining, on a test basis, evidence supporting the amounts and disclosures in the financial statements, assessing the accounting principles used and significant estimates made by management, and evaluating the overall financial statement presentation. We believe that our audits, which included confirmation of securities at December 31, 2012 by correspondence with the custodian and brokers, provide a reasonable basis for our opinion.
PricewaterhouseCoopers LLP
Boston, Massachusetts
February 13, 2013
Annual Report
The Trustees and executive officers of the trusts and funds, as applicable, are listed below. The Board of Trustees governs each fund and is responsible for protecting the interests of shareholders. The Trustees are experienced executives who meet periodically throughout the year to oversee each fund's activities, review contractual arrangements with companies that provide services to each fund, oversee management of the risks associated with such activities and contractual arrangements, and review each fund's performance. Except for Elizabeth S. Acton and James C. Curvey, each of the Trustees oversees 218 funds advised by FMR or an affiliate. Ms. Acton oversees 200 funds advised by FMR or an affiliate. Mr. Curvey oversees 452 funds advised by FMR or an affiliate.
The Trustees hold office without limit in time except that (a) any Trustee may resign; (b) any Trustee may be removed by written instrument, signed by at least two-thirds of the number of Trustees prior to such removal; (c) any Trustee who requests to be retired or who has become incapacitated by illness or injury may be retired by written instrument signed by a majority of the other Trustees; and (d) any Trustee may be removed at any special meeting of shareholders by a two-thirds vote of the outstanding voting securities of the trust. Each Trustee who is not an interested person (as defined in the 1940 Act) (Independent Trustee), shall retire not later than the last day of the month in which his or her 75th birthday occurs. The Independent Trustees may waive this mandatory retirement age policy with respect to individual Trustees. The executive officers hold office without limit in time, except that any officer may resign or may be removed by a vote of a majority of the Trustees at any regular meeting or any special meeting of the Trustees. Except as indicated, each individual has held the office shown or other offices in the same company for the past five years.
Experience, Skills, Attributes, and Qualifications of the Funds' Trustees. The Governance and Nominating Committee has adopted a statement of policy that describes the experience, qualifications, attributes, and skills that are necessary and desirable for potential Independent Trustee candidates (Statement of Policy). The Board believes that each Trustee satisfied at the time he or she was initially elected or appointed a Trustee, and continues to satisfy, the standards contemplated by the Statement of Policy. The Governance and Nominating Committee also engages professional search firms to help identify potential Independent Trustee candidates who have the experience, qualifications, attributes, and skills consistent with the Statement of Policy. From time to time, additional criteria based on the composition and skills of the current Independent Trustees, as well as experience or skills that may be appropriate in light of future changes to board composition, business conditions, and regulatory or other developments, have also been considered by the professional search firms and the Governance and Nominating Committee. In addition, the Board takes into account the Trustees' commitment and participation in Board and committee meetings, as well as their leadership of standing and ad hoc committees throughout their tenure.
In determining that a particular Trustee was and continues to be qualified to serve as a Trustee, the Board has considered a variety of criteria, none of which, in isolation, was controlling. The Board believes that, collectively, the Trustees have balanced and diverse experience, qualifications, attributes, and skills, which allow the Board to operate effectively in governing each fund and protecting the interests of shareholders. Information about the specific experience, skills, attributes, and qualifications of each Trustee, which in each case led to the Board's conclusion that the Trustee should serve (or continue to serve) as a trustee of the funds, is provided below.
Annual Report
Trustees and Officers - continued
Board Structure and Oversight Function. Abigail P. Johnson is an interested person (as defined in the 1940 Act) and currently serves as Chairman. The Trustees have determined that an interested Chairman is appropriate and benefits shareholders because an interested Chairman has a personal and professional stake in the quality and continuity of services provided to the funds. Independent Trustees exercise their informed business judgment to appoint an individual of their choosing to serve as Chairman, regardless of whether the Trustee happens to be independent or a member of management. The Independent Trustees have determined that they can act independently and effectively without having an Independent Trustee serve as Chairman and that a key structural component for assuring that they are in a position to do so is for the Independent Trustees to constitute a substantial majority for the Board. The Independent Trustees also regularly meet in executive session. Albert R. Gamper, Jr. serves as Chairman of the Independent Trustees and as such (i) acts as a liaison between the Independent Trustees and management with respect to matters important to the Independent Trustees and (ii) with management prepares agendas for Board meetings.
Fidelity funds are overseen by different Boards of Trustees. The funds' Board oversees Fidelity's investment-grade bond, money market, and asset allocation funds and another Board oversees Fidelity's equity and high income funds. The asset allocation funds may invest in Fidelity funds that are overseen by such other Board. The use of separate Boards, each with its own committee structure, allows the Trustees of each group of Fidelity funds to focus on the unique issues of the funds they oversee, including common research, investment, and operational issues. On occasion, the separate Boards establish joint committees to address issues of overlapping consequences for the Fidelity funds overseen by each Board.
The Trustees operate using a system of committees to facilitate the timely and efficient consideration of all matters of importance to the Trustees, each fund, and fund shareholders and to facilitate compliance with legal and regulatory requirements and oversight of the funds' activities and associated risks. The Board, acting through its committees, has charged FMR and its affiliates with (i) identifying events or circumstances the occurrence of which could have demonstrably adverse effects on the funds' business and/or reputation; (ii) implementing processes and controls to lessen the possibility that such events or circumstances occur or to mitigate the effects of such events or circumstances if they do occur; and (iii) creating and maintaining a system designed to evaluate continuously business and market conditions in order to facilitate the identification and implementation processes described in (i) and (ii) above. Because the day-to-day operations and activities of the funds are carried out by or through FMR, its affiliates and other service providers, the funds' exposure to risks is mitigated but not eliminated by the processes overseen by the Trustees. While each of the Board's committees has responsibility for overseeing different aspects of the funds' activities, oversight is exercised primarily through the Operations and Audit Committees. In addition, an ad hoc Board committee of Independent Trustees has worked with FMR to enhance the Board's oversight of investment and financial risks, legal and regulatory risks, technology risks, and operational risks, including the development of additional risk reporting to the Board. The Operations Committee also worked and continues to work with FMR to enhance the stress tests required under SEC regulations for money market funds. Appropriate personnel, including but not limited to the funds' Chief Compliance Officer (CCO), FMR's internal auditor, the independent accountants, the funds' Treasurer and portfolio management personnel, make periodic reports to the Board's committees, as appropriate, including an annual review of FMR's risk management program for the Fidelity funds. The responsibilities of each standing committee, including their oversight responsibilities, are described further under "Standing Committees of the Funds' Trustees."
Annual Report
The funds' Statement of Additional Information (SAI) includes more information about the Trustees. To request a free copy, call Fidelity at 1-800-544-8544.
Interested Trustees*:
Correspondence intended for each Trustee who is an interested person may be sent to Fidelity Investments, 82 Devonshire Street, Boston, Massachusetts 02109.
Name, Age; Principal Occupations and Other Relevant Experience+ |
Abigail P. Johnson (51) |
| Year of Election or Appointment: 2009 Ms. Johnson is Trustee and Chairman of the Board of Trustees of certain Trusts. Ms. Johnson serves as President of Fidelity Financial Services (2012-present) and President of Personal, Workplace and Institutional Services (2005-present). Ms. Johnson is Chairman and Director of FMR Co., Inc. (2011-present), Chairman and Director of FMR (2011-present), and the Vice Chairman and Director (2007-present) of FMR LLC. Previously, Ms. Johnson served as President and a Director ofFMR (2001-2005), a Trustee of other investment companies advised by FMR, Fidelity Investments Money Management, Inc., and FMR Co., Inc. (2001-2005), Senior Vice President of the Fidelity funds (2001-2005), and managed a number of Fidelity funds. Ms. Abigail P. Johnson and Mr. Arthur E. Johnson are not related. |
James C. Curvey (77) |
| Year of Election or Appointment: 2007 Mr. Curvey also serves as Trustee (2007-present) of other investment companies advised by FMR. Mr. Curvey is a Director of Fidelity Investments Money Management, Inc. (2009-present), Director of Fidelity Research & Analysis Co. (2009-present) and Director of FMR and FMR Co., Inc. (2007-present). Mr. Curvey is also Vice Chairman (2007-present) and Director of FMR LLC. In addition, Mr. Curvey serves as an Overseer for the Boston Symphony Orchestra and a member of the Trustees of Villanova University. Previously, Mr. Curvey was the Vice Chairman (2006-2007) and Director (2000-2007) of FMR Corp. |
* Trustees have been determined to be "Interested Trustees" by virtue of, among other things, their affiliation with the trusts or various entities under common control with FMR.
+ The information above includes each Trustee's principal occupation during the last five years and other information relating to the experience, attributes, and skills relevant to each Trustee's qualifications to serve as a Trustee, which led to the conclusion that each Trustee should serve as a Trustee for each fund.
Independent Trustees:
Correspondence intended for each Independent Trustee (that is, the Trustees other than the Interested Trustees) may be sent to Fidelity Investments, P.O. Box 55235, Boston, Massachusetts 02205-5235.
Name, Age; Principal Occupations and Other Relevant Experience+ |
Elizabeth S. Acton (61) |
| Year of Election or Appointment: 2013 Ms. Acton is Trustee of certain Trusts. Prior to her retirement in April 2012, Ms. Acton was Executive Vice President, Finance (November 2011-April 2012), Executive Vice President, Chief Financial Officer (April 2002-November 2011), and Treasurer (May 2004-May 2005) of Comerica Incorporated (financial services). Prior to joining Comerica, Ms. Acton held a variety of positions at Ford Motor Company (1983-2002), including Vice President and Treasurer (2000-2002) and Executive Vice President and Chief Financial Officer of Ford Motor Credit Company (1998-2000). Ms. Acton currently serves as a member of the Board of Directors and Audit and Finance Committees of Beazer Homes USA, Inc. (homebuilding, 2012-present). |
Albert R. Gamper, Jr. (70) |
| Year of Election or Appointment: 2006 Mr. Gamper is Chairman of the Independent Trustees of the Fixed Income and Asset Allocation Funds (2012-present). Prior to his retirement in December 2004, Mr. Gamper served as Chairman of the Board of CIT Group Inc. (commercial finance). During his tenure with CIT Group Inc. Mr. Gamper served in numerous senior management positions, including Chairman (1987-1989; 1999-2001; 2002-2004), Chief Executive Officer (1987-2004), and President (2002-2003). Mr. Gamper currently serves as a member of the Board of Directors of Public Service Enterprise Group (utilities, 2000-present), a member of the Board of Trustees, Rutgers University (2004-present), and Chairman of the Board of Barnabas Health Care System. Previously, Mr. Gamper served as Vice Chairman of the Independent Trustees of the Fixed Income and Asset Allocation Funds (2011-2012) and as Chairman of the Board of Governors, Rutgers University (2004-2007). |
Robert F. Gartland (61) |
| Year of Election or Appointment: 2010 Mr. Gartland is Chairman and an investor in Gartland and Mellina Group Corp. (consulting, 2009-present). Previously, Mr. Gartland served as a partner and investor of Vietnam Partners LLC (investments and consulting, 2008-2011). Prior to his retirement, Mr. Gartland held a variety of positions at Morgan Stanley (financial services, 1979-2007) including Managing Director (1987-2007). |
Arthur E. Johnson (65) |
| Year of Election or Appointment: 2008 Mr. Johnson serves as a member of the Board of Directors of Eaton Corporation (diversified power management, 2009-present), AGL Resources, Inc. (holding company, 2002-present) and Booz Allen Hamilton (management consulting, 2011-present). Prior to his retirement, Mr. Johnson served as Senior Vice President of Corporate Strategic Development of Lockheed Martin Corporation (defense contractor, 1999-2009). He previously served on the Board of Directors of IKON Office Solutions, Inc. (1999-2008) and Delta Airlines (2005-2007). Mr. Arthur E. Johnson is not related to Ms. Abigail P. Johnson. |
Michael E. Kenneally (58) |
| Year of Election or Appointment: 2009 Previously, Mr. Kenneally served as a Member of the Advisory Board for certain Fidelity Fixed Income and Asset Allocation Funds (2008-2009). Prior to his retirement, Mr. Kenneally served as Chairman and Global Chief Executive Officer of Credit Suisse Asset Management (2003-2005). Mr. Kenneally was a Director of the Credit Suisse Funds (U.S. mutual funds, 2004-2008) and certain other closed-end funds (2004-2005) and was awarded the Chartered Financial Analyst (CFA) designation in 1991. |
James H. Keyes (72) |
| Year of Election or Appointment: 2007 Mr. Keyes serves as a member of the Boards of Navistar International Corporation (manufacture and sale of trucks, buses, and diesel engines, since 2002) and Pitney Bowes, Inc. (integrated mail, messaging, and document management solutions, since 1998). Prior to his retirement, Mr. Keyes served as Chairman and Chief Executive Officer of Johnson Controls (automotive, building, and energy, 1998-2002) and as a member of the Board of LSI Logic Corporation (semiconductor technologies, 1984-2008). |
Marie L. Knowles (66) |
| Year of Election or Appointment: 2001 Ms. Knowles is Vice Chairman of the Independent Trustees of the Fixed Income and Asset Allocation Funds (2012-present). Prior to Ms. Knowles' retirement in June 2000, she served as Executive Vice President and Chief Financial Officer of Atlantic Richfield Company (ARCO) (diversified energy, 1996-2000). From 1993 to 1996, she was a Senior Vice President of ARCO and President of ARCO Transportation Company. She served as a Director of ARCO from 1996 to 1998. Ms. Knowles currently serves as a Director and Chairman of the Audit Committee of McKesson Corporation (healthcare service, since 2002). Ms. Knowles is an Honorary Trustee of the Brookings Institution and a member of the Board of the Catalina Island Conservancy and of the Santa Catalina Island Company (2009-present). She also serves as a member of the Advisory Board for the School of Engineering of the University of Southern California and the Foundation Board of the School of Architecture at the University of Virginia (2007-present). Previously, Ms. Knowles served as a Director of Phelps Dodge Corporation (copper mining and manufacturing, 1994-2007). |
Kenneth L. Wolfe (73) |
| Year of Election or Appointment: 2005 Prior to his retirement, Mr. Wolfe served as Chairman and a Director (2007-2009) and Chairman and Chief Executive Officer (1994-2001) of Hershey Foods Corporation. He also served as a member of the Boards of Adelphia Communications Corporation (telecommunications, 2003-2006), Bausch & Lomb, Inc. (medical/pharmaceutical, 1993-2007), and Revlon, Inc. (personal care products, 2004-2009). Mr. Wolfe previously served as Chairman of the Independent Trustees of the Fixed Income and Asset Allocation Funds (2008-2012). |
+ The information above includes each Trustee's principal occupation during the last five years and other information relating to the experience, attributes, and skills relevant to each Trustee's qualifications to serve as a Trustee, which led to the conclusion that each Trustee should serve as a Trustee for each fund.
Executive Officers:
Correspondence intended for each executive officer may be sent to Fidelity Investments, 82 Devonshire Street, Boston, Massachusetts 02109.
Name, Age; Principal Occupation |
Stephanie J. Dorsey (43) |
| Year of Election or Appointment: 2013 President and Treasurer of Fidelity's Fixed Income and Asset Allocation Funds. Ms. Dorsey also serves as Assistant Treasurer of other Fidelity funds (2010-present) and is an employee of Fidelity Investments (2008-present). Previously, Ms. Dorsey served as Deputy Treasurer of Fidelity's Fixed Income and Asset Allocation Funds (2008-2013), Treasurer (2004-2008) of the JPMorgan Mutual Funds and Vice President (2004-2008) of JPMorgan Chase Bank. |
Charles S. Morrison (52) |
| Year of Election or Appointment: 2012 Vice President of Fidelity's Fixed Income and Asset Allocation Funds. Mr. Morrison also serves as President, Fixed Income and is an employee of Fidelity Investments. Previously, Mr. Morrison served as Vice President of Fidelity's Money Market Funds (2005-2009), President, Money Market Group Leader of FMR (2009), and Senior Vice President, Money Market Group of FMR (2004-2009). Mr. Morrison also served as Vice President of Fidelity's Bond Funds (2002-2005), certain Balanced Funds (2002-2005), and certain Asset Allocation Funds (2002-2007), and as Senior Vice President (2002-2005) of Fidelity's Fixed Income Division. |
Robert P. Brown (49) |
| Year of Election or Appointment: 2012 Vice President of Fidelity's Bond Funds. Mr. Brown also serves as Executive Vice President of Fidelity Investments Money Management, Inc. (2010-present), President, Bond Group of FMR (2011-present), Director and Managing Director, Research of Fidelity Management & Research (U.K.) Inc. (2008-present) and is an employee of Fidelity Investments. Previously, Mr. Brown served as President, Money Market Group of FMR (2010-2011) and Vice President of Fidelity's Money Market Funds (2010-2012). |
Nancy D. Prior (45) |
| Year of Election or Appointment: 2012 Vice President of Fidelity's Money Market Funds. Ms. Prior also serves as President, Money Market Group of FMR (2011-present) and is an employee of Fidelity Investments (2002-present). Previously, Ms. Prior served as Managing Director of Research (2009-2011), Senior Vice President and Deputy General Counsel (2007-2009), and Assistant Secretary of Fidelity's Fixed Income and Asset Allocation Funds (2008-2009). |
Scott C. Goebel (44) |
| Year of Election or Appointment: 2008 Secretary and Chief Legal Officer (CLO) of the Fidelity funds. Mr. Goebel also serves as Secretary of Fidelity Investments Money Management, Inc. (FIMM) (2010-present) and Fidelity Research and Analysis Company (FRAC) (2010-present); Secretary and CLO of The North Carolina Capital Management Trust: Cash and Term Portfolios (2008-present); General Counsel, Secretary, and Senior Vice President of FMR (2008-present) and FMR Co., Inc. (2008-present); employed by FMR LLC or an affiliate (2001-present); Chief Legal Officer of Fidelity Management & Research (Hong Kong) Limited (2008-present) and Assistant Secretary of Fidelity Management & Research (Japan) Inc. (2008-present), and Fidelity Management & Research (U.K.) Inc. (2008-present). Previously, Mr. Goebel served as Assistant Secretary of FIMM (2008-2010), FRAC (2008-2010), and the Funds (2007-2008) and as Vice President and Secretary of Fidelity Distributors Corporation (FDC) (2005-2007). |
Ramon Herrera (38) |
| Year of Election or Appointment: 2012 Assistant Secretary of Fidelity's Fixed Income and Asset Allocation Funds. Mr. Herrera also serves as Vice President, Associate General Counsel (2010-present) and is an employee of Fidelity Investments (2004-present). |
Elizabeth Paige Baumann (44) |
| Year of Election or Appointment: 2012 Anti-Money Laundering (AML) Officer of the Fidelity funds. Ms. Baumann also serves as AML Officer of The North Carolina Capital Management Trust: Cash and Term Portfolios (2012-present), Chief AML Officer of FMR LLC (2012-present), and is an employee of Fidelity Investments. Previously, Ms. Baumann served as Vice President and Deputy Anti-Money Laundering Officer (2007-2012). |
Christine Reynolds (54) |
| Year of Election or Appointment: 2008 Chief Financial Officer of the Fidelity funds. Ms. Reynolds became President of Fidelity Pricing and Cash Management Services (FPCMS) in August 2008. Ms. Reynolds served as Chief Operating Officer of FPCMS (2007-2008). Previously, Ms. Reynolds served as President, Treasurer, and Anti-Money Laundering officer of the Fidelity funds (2004-2007). |
Michael H. Whitaker (45) |
| Year of Election or Appointment: 2008 Chief Compliance Officer of Fidelity's Fixed Income and Asset Allocation Funds. Mr. Whitaker also serves as Chief Compliance Officer of The North Carolina Capital Management Trust: Cash and Term Portfolios (2008-present). Mr. Whitaker is an employee of Fidelity Investments (2007-present). Prior to joining Fidelity Investments, Mr. Whitaker worked at MFS Investment Management where he served as Senior Vice President and Chief Compliance Officer (2004-2006), and Assistant General Counsel. |
Joseph F. Zambello (55) |
| Year of Election or Appointment: 2011 Deputy Treasurer of the Fidelity funds. Mr. Zambello is an employee of Fidelity Investments. Previously, Mr. Zambello served as Vice Presidentof FMR's Program Management Group (2009-2011) and Vice President of the Transfer Agent Oversight Group (2005-2009). |
Stephen Sadoski (41) |
| Year of Election or Appointment: 2012 Assistant Treasurer of Fidelity's Fixed Income and Asset Allocation Funds. Mr. Sadoski also serves as Deputy Treasurer of other Fidelity funds (2012-present) and is an employee of Fidelity Investments (2012-present). Previously, Mr. Sadoski served as an assistant chief accountant in the Division of Investment Management of the Securities and Exchange Commission (SEC) (2009-2012) and as a senior manager at Deloitte & Touche (1997-2009). |
Adrien E. Deberghes (45) |
| Year of Election or Appointment: 2010 Assistant Treasurer of Fidelity's Fixed Income and Asset Allocation Funds. Mr. Deberghes also serves as Vice President and Assistant Treasurer (2011-present) and Deputy Treasurer (2008-present) of other Fidelity funds, and is an employee of Fidelity Investments (2008-present). Previously, Mr. Deberghes served as Senior Vice President of Mutual Fund Administration at State Street Corporation (2007-2008), Senior Director of Mutual Fund Administration at Investors Bank & Trust (2005-2007), and Director of Finance for Dunkin' Brands (2000-2005). |
Kenneth B. Robins (43) |
| Year of Election or Appointment: 2009 Assistant Treasurer of the Fidelity Fixed Income and Asset Allocation Funds. Mr. Robins also serves as President and Treasurer of other Fidelity funds (2008-present; 2010-present) and is an employee of Fidelity Investments (2004-present). Previously, Mr. Robins served as Deputy Treasurer of the Fidelity funds (2005-2008) and Treasurer and Chief Financial Officer of The North Carolina Capital Management Trust: Cash and Term Portfolios (2006-2008). |
Gary W. Ryan (54) |
| Year of Election or Appointment: 2005 Assistant Treasurer of the Fidelity funds. Mr. Ryan is an employee of Fidelity Investments. Previously, Mr. Ryan served as Vice President of Fund Reporting in Fidelity Pricing and Cash Management Services (FPCMS) (1999-2005). |
Jonathan Davis (44) |
| Year of Election or Appointment: 2010 Assistant Treasurer of the Fidelity funds. Mr. Davis is also Assistant Treasurer of Fidelity Rutland Square Trust II and Fidelity Commonwealth Trust II. Mr. Davis is an employee of Fidelity Investments. Previously, Mr. Davis served as Vice President and Associate General Counsel of FMR LLC (2003-2010). |
Annual Report
The Board of Trustees of each fund voted to pay to shareholders of record at the opening of business on record date, the following distributions per share derived from capital gains realized from sales of portfolio securities:
Fund | Pay Date | Record Date | Capital Gains |
Fidelity Michigan Municipal Income Fund | 2/11/13 | 02/08/13 | $0.008 |
Fidelity Michigan Municipal Money Market Fund | 2/11/13 | 02/08/13 | - |
The funds hereby designate as capital gain dividend the amounts noted below for the taxable year ended December 31, 2012, or, if subsequently determined to be different, the net capital gain of such year.
Fund | |
Fidelity Michigan Municipal Income Fund | $588,642 |
Fidelity Michigan Municipal Money Market Fund | $347 |
During fiscal year ended 2012, 100% of Fidelity Michigan Municipal Income Fund and Fidelity Michigan Municipal Money Market Fund's income dividends were free from federal income tax, and 0.85% of Fidelity Michigan Municipal Income Fund and 25.89% of Fidelity Michigan Municipal Money Market Fund's income dividends were subject to the federal alternative minimum tax.
The fund will notify shareholders in January 2013 of amounts for use in preparing 2012 income tax returns.
Annual Report
Board Approval of Investment Advisory Contracts and Management Fees
Fidelity Michigan Municipal Income Fund / Fidelity Michigan Municipal Money Market Fund
Each year, the Board of Trustees, including the Independent Trustees (together, the Board), votes on the renewal of the management contract and sub-advisory agreements (together, the Advisory Contracts) for each fund. The Board, assisted by the advice of fund counsel and Independent Trustees' counsel, requests and considers a broad range of information relevant to the renewal of the Advisory Contracts throughout the year.
The Board meets regularly and, at each of its meetings, covers an extensive agenda of topics and materials and considers factors that are relevant to its annual consideration of the renewal of each fund's Advisory Contracts, including the services and support provided to each fund and its shareholders. The Board has established three standing committees, Operations, Audit, and Governance and Nominating, each composed of and chaired by Independent Trustees with varying backgrounds, to which the Board has assigned specific subject matter responsibilities in order to enhance effective decision-making by the Board. The Operations Committee, of which all of the Independent Trustees are members, meets regularly throughout the year and, among other matters, considers matters specifically related to the annual consideration of the renewal of each fund's Advisory Contracts. The Board, acting directly and through its Committees, requests and receives information concerning the annual consideration of the renewal of each fund's Advisory Contracts. The Board also meets as needed to consider matters specifically related to the Board's annual consideration of the renewal of Advisory Contracts. Members of the Board may also meet with trustees of other Fidelity funds through ad hoc joint committees to discuss certain matters relevant to the Fidelity funds.
At its September 2012 meeting, the Board of Trustees, including the Independent Trustees, unanimously determined to renew each fund's Advisory Contracts. In reaching its determination, the Board considered all factors it believed relevant, including (i) the nature, extent, and quality of the services to be provided to each fund and its shareholders (including the investment performance of each fund); (ii) the competitiveness of each fund's management fee and total expense ratio relative to peer funds; (iii) the total costs of the services to be provided by and the profits to be realized by Fidelity from its relationship with each fund; (iv) the extent to which economies of scale exist and would be realized as each fund grows; and (v) whether fee levels reflect these economies of scale, if any, for the benefit of fund shareholders.
In considering whether to renew the Advisory Contracts for each fund, the Board reached a determination, with the assistance of fund counsel and Independent Trustees' counsel and through the exercise of its business judgment, that the renewal of the Advisory Contracts is in the best interests of each fund and its shareholders and that the compensation payable under the Advisory Contracts is fair and reasonable. The Board's decision to renew the Advisory Contracts was not based on any single factor, but rather was based on a comprehensive consideration of all the information provided to the Board at its meetings throughout the year. The Board, in reaching its determination to renew the Advisory Contracts, was aware that shareholders in each fund have a broad range of investment choices available to them, including a wide choice among mutual funds offered by Fidelity's competitors, and that each fund's shareholders, who have the opportunity to review and weigh the disclosure provided by the fund in its prospectus and other public disclosures, have chosen to invest in that fund, managed by Fidelity.
Annual Report
Nature, Extent, and Quality of Services Provided. The Board considered the staffing within the investment adviser, FMR, and the sub-advisers (together, the Investment Advisers), including the backgrounds of the funds' investment personnel, and also considered the funds' investment objectives, strategies, and related investment philosophies. The Independent Trustees also had discussions with senior management of Fidelity's investment operations and investment groups. The Board considered the structure of the portfolio manager compensation program and whether this structure provides appropriate incentives to act in the best interests of each fund.
Resources Dedicated to Investment Management and Support Services. The Board reviewed the general qualifications and capabilities of the Investment Advisers' investment staff, including its size, education, experience, and resources, as well as the Investment Advisers' approach to recruiting, managing, and compensating investment personnel. The Board also noted that FMR has continued to increase the resources devoted to non-U.S. offices, including expansion of Fidelity's global investment organization. The Board noted that Fidelity's analysts have extensive resources, tools and capabilities that allow them to conduct sophisticated quantitative and fundamental analysis, as well as credit analysis of issuers, counterparties and guarantors. The Board also believes that Fidelity's investment professionals have sufficient access to global information and data so as to provide competitive investment results over time, and that those professionals also have access to sophisticated tools that permit them to assess portfolio construction and risk and performance attribution characteristics continuously, as well as to transmit new information and research conclusions rapidly around the world. Additionally, in its deliberations, the Board considered the Investment Advisers' trading and risk management capabilities and resources, which are an integral part of the investment management process.
Shareholder and Administrative Services. The Board considered (i) the nature, extent, quality, and cost of advisory, administrative, and shareholder services performed by the Investment Advisers and their affiliates under the Advisory Contracts and under separate agreements covering transfer agency and pricing and bookkeeping services for each fund; (ii) the nature and extent of the supervision of third party service providers, principally custodians and subcustodians; and (iii) the resources devoted to, and the record of compliance with, each fund's compliance policies and procedures.
Annual Report
Board Approval of Investment Advisory Contracts and
Management Fees - continued
The Board noted that the growth of fund assets over time across the complex allows Fidelity to reinvest in the development of services designed to enhance the value or convenience of the Fidelity funds as investment vehicles. These services include 24-hour access to account information and market information through telephone representatives and over the Internet, investor education materials and asset allocation tools, and the expanded availability of Fidelity Investor Centers.
Investment in a Large Fund Family. The Board considered the benefits to shareholders of investing in a Fidelity fund, including the benefits of investing in a fund that is part of a large family of funds offering a variety of investment disciplines and providing a large variety of mutual fund investor services. The Board noted that Fidelity had taken, or had made recommendations that resulted in the Fidelity funds taking, a number of actions over the previous year that benefited particular funds, including (i) continuing to dedicate additional resources to investment research and support of the senior management team that oversees asset management; (ii) persisting in efforts to enhance Fidelity's research capabilities, in particular, international research; (iii) launching new funds and making other enhancements to meet client needs for global and income-oriented solutions; (iv) continuing to launch dedicated lower cost underlying funds to meet investment management's portfolio construction needs related to expanding underlying fund options, specifically for the Freedom Fund product lines; (v) adopting a sector neutral investment approach for certain funds and utilizing a team of portfolio managers to manage certain sector-neutral funds; (vi) rationalizing product lines and gaining increased efficiencies through combinations of several funds with other funds; (vii) strengthening the Spartan Index Fund product line by adding new funds and/or new low-cost institutional share classes, restructuring fund expenses to accommodate new classes, and reducing investment minimums for certain classes of shares; (viii) modifying the eligibility criteria for Institutional Class shares to increase their appeal to government entities and charitable investors; and (ix) reducing certain transfer agent fee rates.
Investment Performance. The Board considered whether each fund has operated in accordance with its investment objective, as well as its record of compliance with its investment restrictions. It also reviewed each fund's absolute investment performance, as well as each fund's relative investment performance measured over multiple periods against (i) a broad-based securities market index (bond fund only, as money market funds are typically not compared against a market index), and (ii) a peer group of mutual funds deemed appropriate by Fidelity and reviewed by the Board. For each fund, the following charts considered by the Board show, over the one-, three-, and five-year periods ended December 31, 2011, the fund's cumulative total returns, the cumulative total returns of a broad-based securities market index ("benchmark") (bond fund only), and a range of cumulative total returns of a peer group of mutual funds identified by Lipper Inc. as having an investment objective similar to that of the fund. The box within each chart shows the 25th percentile return (top of box) and the 75th percentile return (bottom of box) of the peer group. Returns shown above the box are in the first quartile and returns shown below the box are in the fourth quartile. The percentage beaten number noted below each chart corresponds to the percentile box and represents the percentage of funds in the peer group whose performance was equal to or lower than that of the fund.
Annual Report
Fidelity Michigan Municipal Income Fund
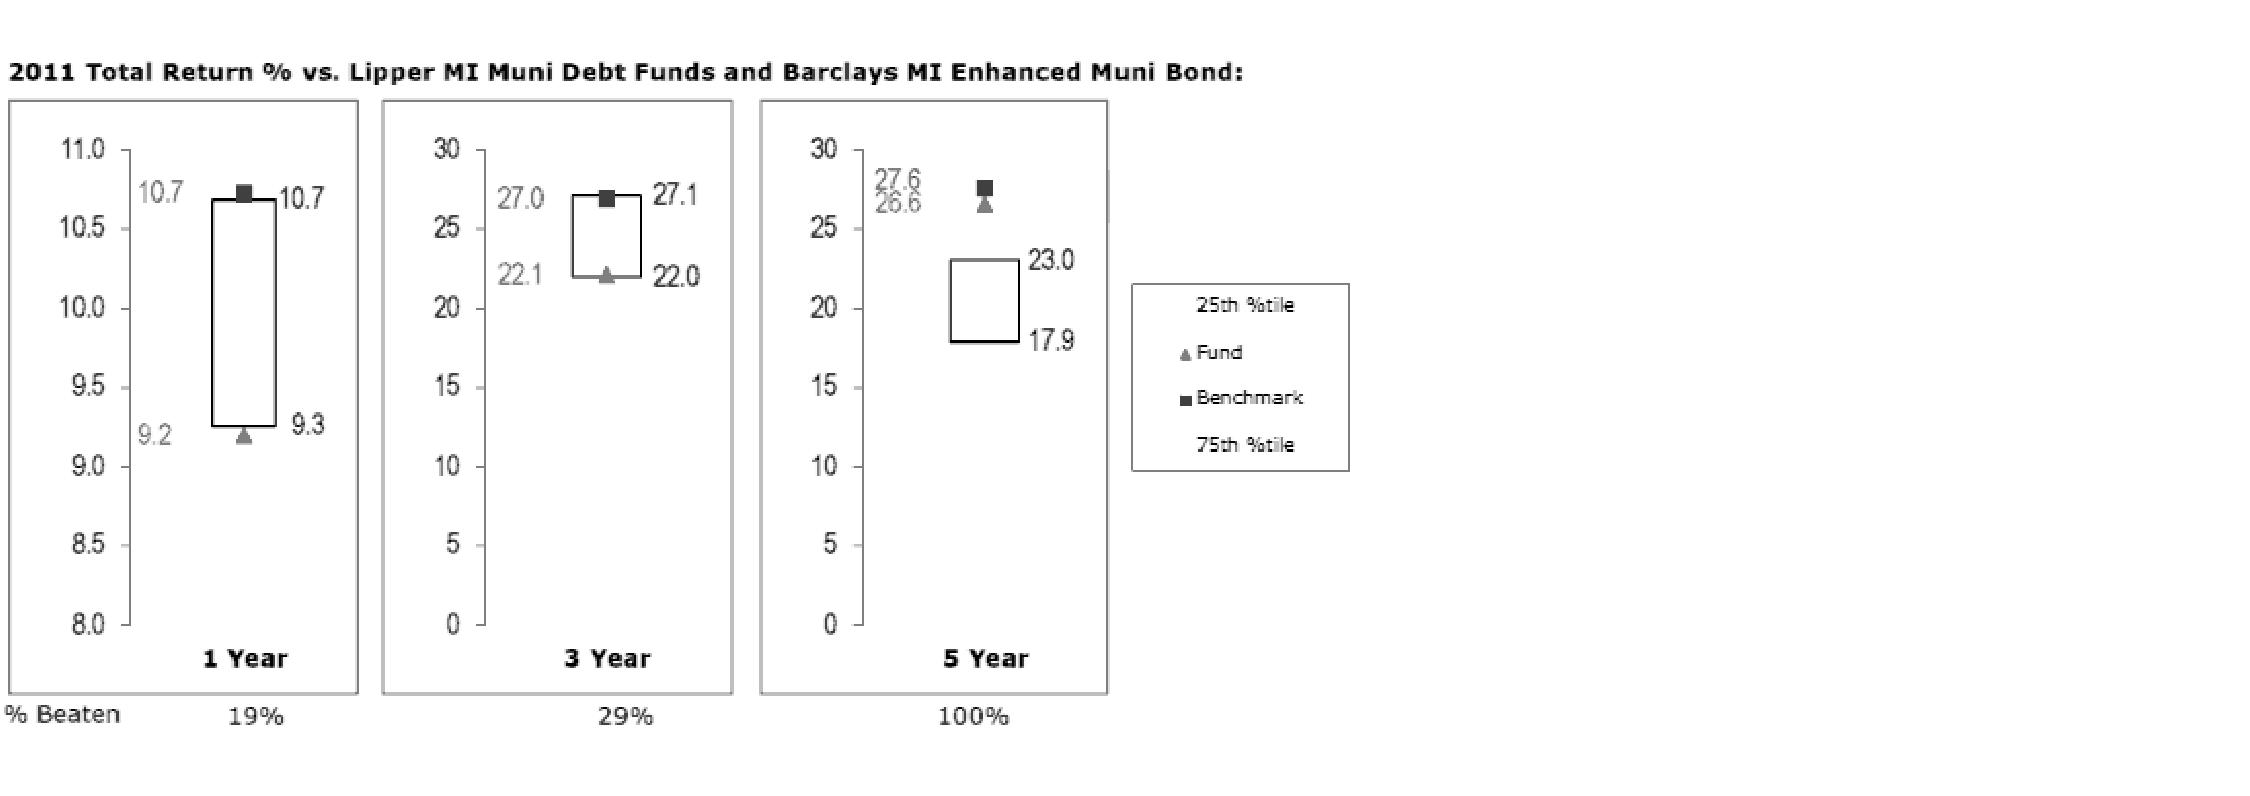
The Board reviewed the fund's relative investment performance against its peer group and noted that the performance of the fund was in the fourth quartile for the one-year period, the third quartile for the three-year period, and the first quartile for the five-year period. The Board also noted that the investment performance of the fund was lower than its benchmark for all the periods shown. The Board discussed with FMR actions to improve the fund's disappointing performance. The Board also reviewed the fund's performance since inception as well as performance in the current year. The Board will continue to closely monitor the performance of the fund in the coming year and discuss with FMR other appropriate actions to address the performance of the fund.
Annual Report
Board Approval of Investment Advisory Contracts and
Management Fees - continued
Fidelity Michigan Municipal Money Market Fund
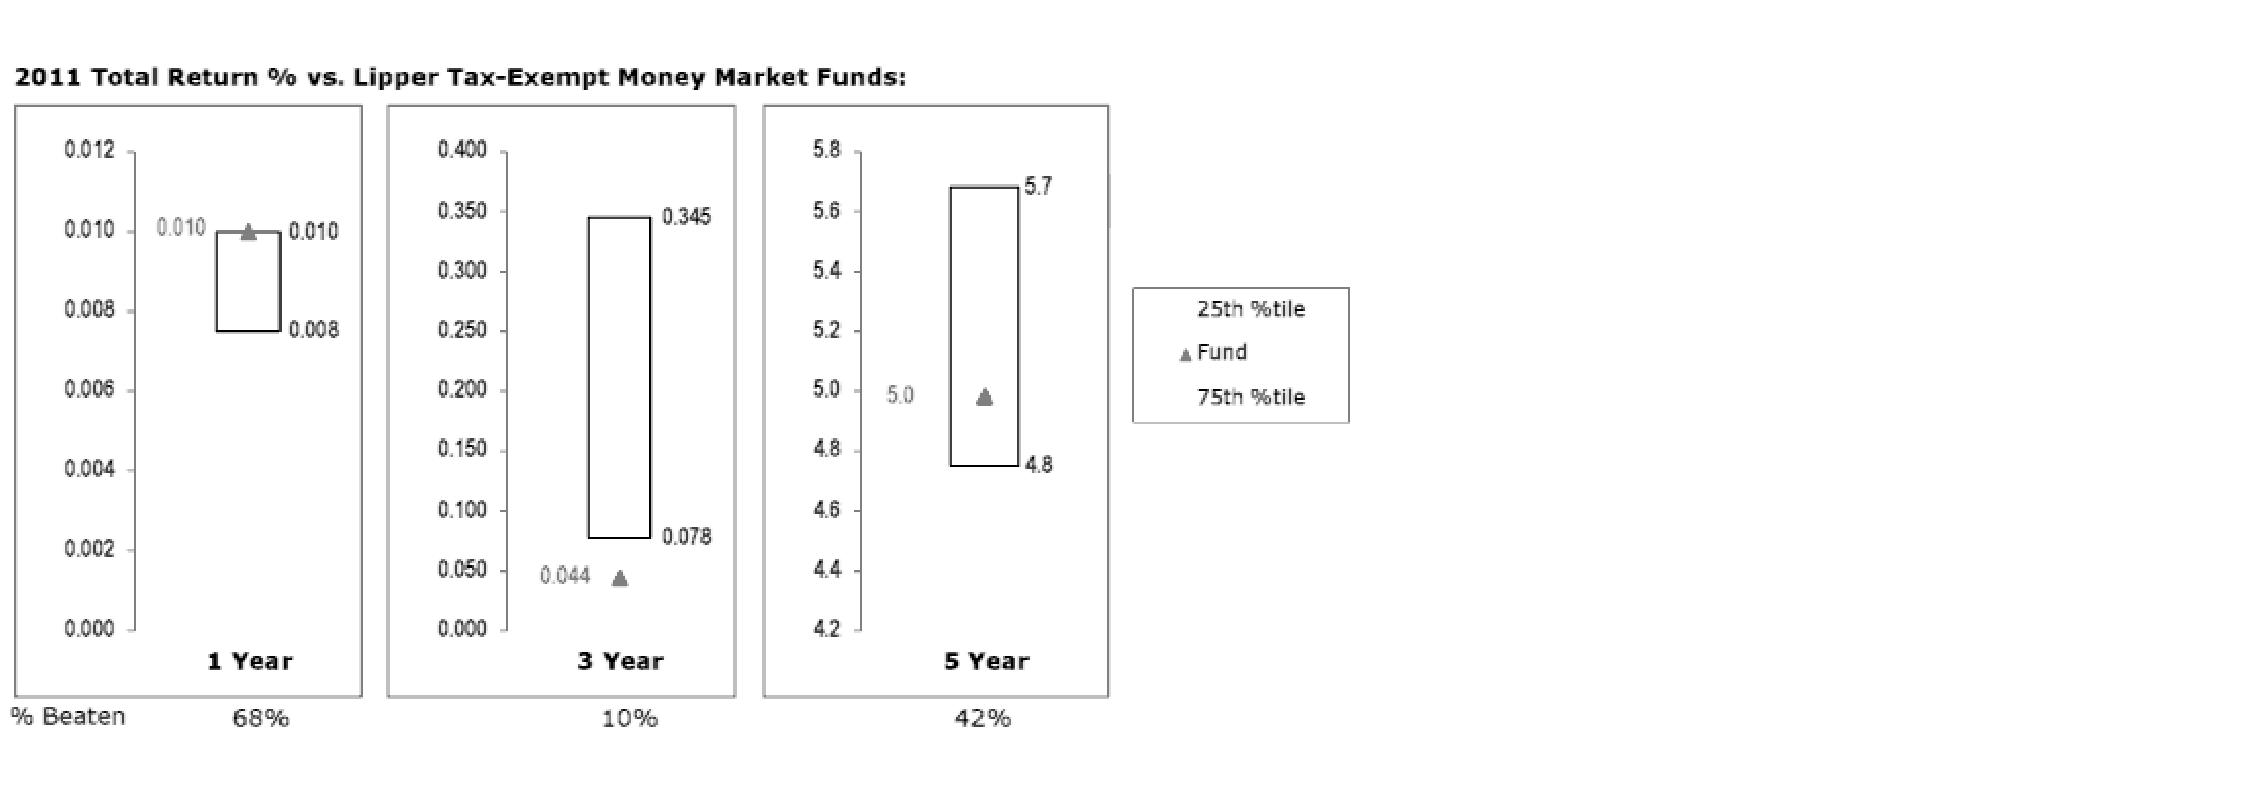
The Board reviewed the fund's relative investment performance against its peer group and noted that the performance of the fund was in the second quartile for the one-year period, the fourth quartile for the three-year period, and the third quartile for the five-year period. The Board considered that FMR had taken steps to provide shareholders with stability of principal and to enhance safety and liquidity. The Board noted that there was a portfolio management change for the fund in December 2011. The Board also reviewed the fund's performance since inception as well as performance in the current year.
The Board noted as a general matter that the percentage beaten numbers for money market funds in recent years were less meaningful than in earlier years, as many competitors have been waiving fees to maintain a one basis point yield and performance differences among funds may not be apparent due to rounding.
Based on its review, the Board concluded that the nature, extent, and quality of services provided to each fund under the Advisory Contracts should benefit each fund's shareholders.
Competitiveness of Management Fee and Total Expense Ratio. The Board considered each fund's management fee and total expense ratio compared to "mapped groups" of competitive funds and classes. Fidelity creates "mapped groups" by combining similar Lipper investment objective categories that have comparable management fee characteristics. Combining Lipper investment objective categories aids the Board's management fee and total expense ratio comparisons by broadening the competitive group used for comparison and by reducing the number of universes to which various Fidelity funds are compared.
Annual Report
Management Fee. The Board considered two proprietary management fee comparisons for the 12-month periods shown in the charts below. The group of Lipper funds used by the Board for management fee comparisons is referred to below as the "Total Mapped Group" and, for the reasons explained above, is broader than the Lipper peer group used by the Board for performance comparisons. The Total Mapped Group comparison focuses on a fund's standing relative to the total universe of comparable funds available to investors in terms of gross management fees before expense reimbursements or caps. "TMG %" represents the percentage of funds in the Total Mapped Group that had management fees that were lower than a fund's. For example, a TMG % of 38% would mean that 62% of the funds in the Total Mapped Group had higher management fees than a fund. The "Asset-Size Peer Group" (ASPG) comparison focuses on a fund's standing relative to non-Fidelity funds similar in size to the fund within the Total Mapped Group. The ASPG represents at least 15% of the funds in the Total Mapped Group with comparable asset size and management fee characteristics, subject to a minimum of 50 funds (or all funds in the Total Mapped Group if fewer than 50). Additional information, such as the ASPG quartile in which a fund's management fee ranked, is also included in the charts and considered by the Board.
Fidelity Michigan Municipal Income Fund

Annual Report
Board Approval of Investment Advisory Contracts and
Management Fees - continued
Fidelity Michigan Municipal Money Market Fund
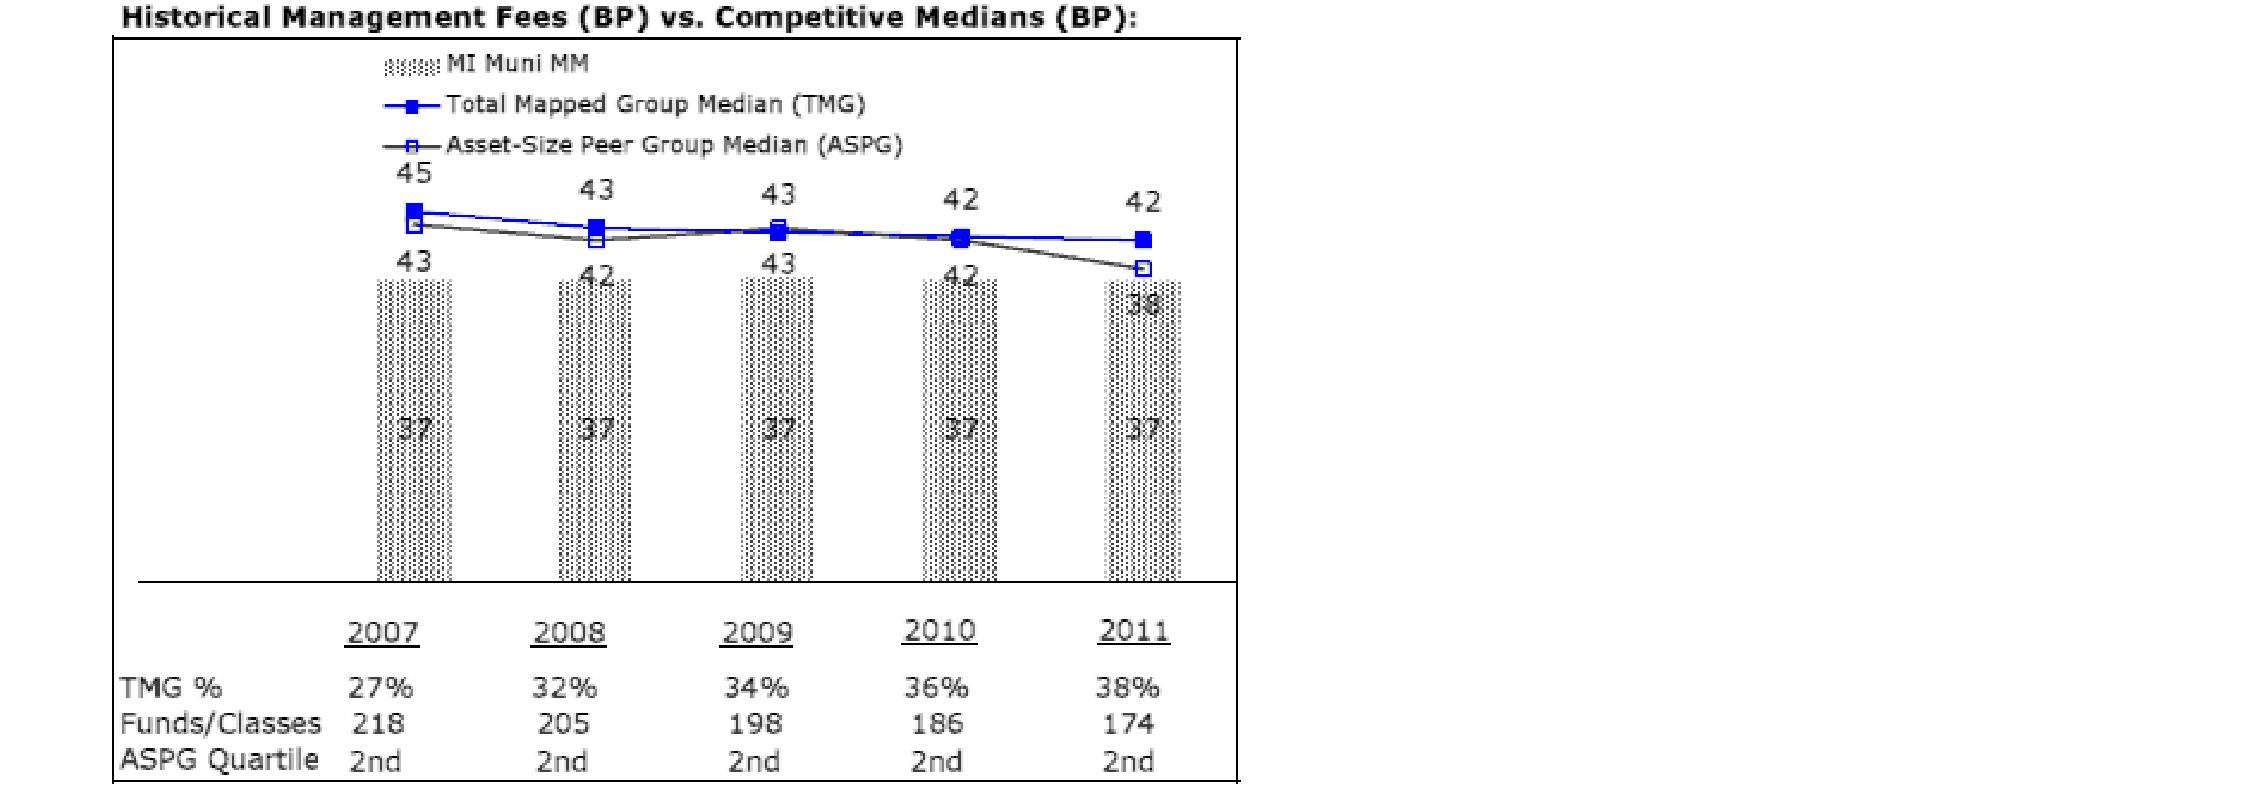
The Board noted that each fund's management fee ranked below the median of its Total Mapped Group and below the median of its ASPG for 2011.
Based on its review, the Board concluded that each fund's management fee is fair and reasonable in light of the services that the fund receives and the other factors considered.
Total Expense Ratio. In its review of each fund's total expense ratio, the Board considered the fund's management fee as well as other fund expenses, such as transfer agent fees, pricing and bookkeeping fees, and custodial, legal, and audit fees. The Board also noted the effects of any waivers and reimbursements on fees and expenses. As part of its review, the Board also considered the current and historical total expense ratios of each fund compared to competitive fund median expenses. Each fund is compared to those funds and classes in the Total Mapped Group (used by the Board for management fee comparisons) that have a similar sales load structure.
The Board noted that each fund's total expense ratio ranked below its competitive median for 2011. The Board considered that Fidelity has been voluntarily waiving part or all of the transfer agent fees and/or management fees to maintain a minimum yield for Fidelity Michigan Municipal Money Market Fund, and also noted that Fidelity retains the ability to be repaid in certain circumstances.
Fees Charged to Other Fidelity Clients. The Board also considered Fidelity fee structures and other information with respect to clients of FMR and its affiliates, such as other mutual funds advised or subadvised by FMR or its affiliates, pension plan clients, and other institutional clients. The Board noted the findings of the 2010 ad hoc joint committee (created with the board of other Fidelity funds), which reviewed and compared Fidelity's institutional investment advisory business with its business of providing services to the Fidelity funds, including the differences in services provided, fees charged, and costs incurred, as well as competition in their respective marketplaces.
Annual Report
Based on its review of total expense ratios and fees charged to other Fidelity clients, the Board concluded that each fund's total expense ratio was reasonable in light of the services that the fund and its shareholders receive and the other factors considered.
Costs of the Services and Profitability. The Board considered the revenues earned and the expenses incurred by Fidelity in conducting the business of developing, marketing, distributing, managing, administering and servicing each fund and its shareholders. The Board also considered the level of Fidelity's profits in respect of all the Fidelity funds.
On an annual basis, FMR presents to the Board Fidelity's profitability for each fund. Fidelity calculates the profitability for each fund, as well as aggregate profitability for groups of Fidelity funds and all Fidelity funds, using a series of detailed revenue and cost allocation methodologies which originate with the books and records of Fidelity on which Fidelity's audited financial statements are based. The Audit Committee of the Board reviews any significant changes from the prior year's methodologies.
PricewaterhouseCoopers LLP (PwC), independent registered public accounting firm and auditor to Fidelity and certain Fidelity funds, has been engaged annually by the Board as part of the Board's assessment of Fidelity's profitability analysis. PwC's engagement includes the review and assessment of Fidelity's methodologies used in determining the revenues and expenses attributable to Fidelity's mutual fund business, and completion of agreed-upon procedures surrounding the mathematical accuracy of fund profitability and its conformity to allocation methodologies. After considering PwC's reports issued under the engagement and information provided by Fidelity, the Board concluded that while other allocation methods may also be reasonable, Fidelity's profitability methodologies are reasonable in all material respects.
The Board also reviewed Fidelity's non-fund businesses and fall-out benefits related to the mutual fund business as well as cases where Fidelity's affiliates may benefit from or be related to the funds' business.
The Board considered the costs of the services provided by and the profits realized by Fidelity in connection with the operation of each fund and was satisfied that the profitability was not excessive in the circumstances.
Economies of Scale. The Board considered whether there have been economies of scale in respect of the management of the Fidelity funds, whether the Fidelity funds (including each fund) have appropriately benefited from any such economies of scale, and whether there is potential for realization of any further economies of scale. The Board considered the extent to which each fund will benefit from economies of scale through increased services to the fund, through waivers or reimbursements, or through fee or expense reductions. The Board also noted that in 2009, it and the board of other Fidelity funds created an ad hoc committee (the Economies of Scale Committee) to analyze whether FMR attains economies of scale in respect of the management and servicing of the Fidelity funds, whether the Fidelity funds have appropriately benefited from such economies of scale, and whether there is potential for realization of any further economies of scale.
Annual Report
Board Approval of Investment Advisory Contracts and
Management Fees - continued
The Board recognized that each fund's management contract incorporates a "group fee" structure, which provides for lower group fee rates as total fund assets under FMR's management increase, and for higher group fee rates as total fund assets under FMR's management decrease. FMR calculates the group fee rates based on a tiered asset "breakpoint" schedule that varies based on asset class. The Board considered that the group fee is designed to deliver the benefits of economies of scale to fund shareholders when total Fidelity fund assets increase, even if assets of any particular fund are unchanged or have declined, because some portion of Fidelity's costs are attributable to services provided to all Fidelity funds, and all funds benefit if those costs can be allocated among more assets. The Board concluded that, given the group fee structure, fund shareholders will benefit from lower management fees as assets under FMR's management increase at the fund complex level, regardless of whether Fidelity achieves any such economies of scale.
The Board concluded, taking into account the analysis of the Economies of Scale Committee, that economies of scale, if any, are being appropriately shared between fund shareholders and Fidelity.
Additional Information Requested by the Board. In order to develop fully the factual basis for consideration of the Fidelity funds' Advisory Contracts, the Board requested and received additional information on certain topics, including: (i) Fidelity's fund profitability methodology, profitability trends for certain funds, and the impact of certain factors on fund profitability results; (ii) portfolio manager changes that have occurred during the past year and the amount of the investment that each portfolio manager has made in the Fidelity fund(s) that he or she manages; (iii) Fidelity's compensation structure for portfolio managers, research analysts, and other key personnel, including its effects on fund profitability, the rationale for the compensation structure, and the extent to which current market conditions have affected retention and recruitment; (iv) the compensation paid to fund sub-advisers on behalf of the Fidelity funds; (v) Fidelity's fee structures, including the group fee structure, and the rationale for recommending different fees among different categories of funds and classes; (vi) Fidelity's voluntary waiver of its fees to maintain minimum yields for certain money market funds and classes as well as contractual waivers in place for certain funds;(vii) regulatory and industry developments, including those affecting money market funds and target date funds, and the potential impact to Fidelity; (viii) Fidelity's transfer agent fees, expenses, and services, and drivers for determining the transfer agent fee structure of different funds and classes; (ix) management fee rates charged by FMR or Fidelity entities to other Fidelity clients; (x) the allocation of and historical trends in Fidelity's realization of fall-out benefits; and (xi) explanations regarding the relative total expense ratios of certain funds and classes, total expense competitive trends, and actions that might be taken by FMR to reduce total expense ratios for certain funds and classes or to achieve further economies of scale.
Annual Report
Based on its evaluation of all of the conclusions noted above, and after considering all factors it believed relevant, the Board ultimately concluded that the advisory fee structures are fair and reasonable, and that each fund's Advisory Contracts should be renewed.
Annual Report
Investment Adviser
Fidelity Management & Research Company
Boston, MA
Investment Sub-Advisers
Fidelity Investments Money
Management, Inc.
Fidelity Management & Research
(U.K.) Inc.
Fidelity Management & Research
(Hong Kong) Limited
Fidelity Management & Research
(Japan) Inc.
General Distributor
Fidelity Distributors Corporation
Smithfield, RI
Transfer and Service Agents
Citibank, N.A.
New York, NY
Fidelity Investments Institutional
Operations Company, Inc.
Boston, MA
Fidelity Service Company, Inc.
Boston, MA
Custodian
Citibank, N.A.
New York, NY
The Fidelity Telephone Connection
Mutual Fund 24-Hour Service
Exchanges/Redemptions
and Account Assistance 1-800-544-6666
Product Information 1-800-544-6666
Retirement Accounts 1-800-544-4774 (8 a.m. - 9 p.m.)
TDD Service 1-800-544-0118
for the deaf and hearing impaired
(9 a.m. - 9 p.m. Eastern time)
Fidelity Automated Service
Telephone (FAST®)
1-800-544-5555
Automated line for quickest service
(Fidelity Investment logo)(registered trademark)
Corporate Headquarters
82 Devonshire St., Boston, MA 02109
www.fidelity.com
MIR-UANN-0213
1.787737.109
Fidelity®
Minnesota Municipal Income
Fund
Annual Report
December 31, 2012
(Fidelity Cover Art)
Contents
Performance | (Click Here) | How the fund has done over time. |
Management's Discussion of Fund Performance | (Click Here) | The Portfolio Manager's review of fund performance and strategy. |
Shareholder Expense Example | (Click Here) | An example of shareholder expenses. |
Investment Changes | (Click Here) | A summary of major shifts in the fund's investments over the past six months. |
Investments | (Click Here) | A complete list of the fund's investments with their market values. |
Financial Statements | (Click Here) | Statements of assets and liabilities, operations, and changes in net assets, as well as financial highlights. |
Notes | (Click Here) | Notes to the financial statements. |
Report of Independent Registered Public Accounting Firm | (Click Here) | |
Trustees and Officers | (Click Here) | |
Distributions | (Click Here) | |
Board Approval of Investment Advisory Contracts and Management Fees | (Click Here) | |
To view a fund's proxy voting guidelines and proxy voting record for the 12-month period ended June 30, visit http://www.fidelity.com/proxyvotingresults or visit the Securities and Exchange Commission's (SEC) web site at http://www.sec.gov. You may also call 1-800-544-8544 to request a free copy of the proxy voting guidelines.
Standard & Poor's, S&P and S&P 500 are registered service marks of The McGraw-Hill Companies, Inc. and have been licensed for use by Fidelity Distributors Corporation.
Other third party marks appearing herein are the property of their respective owners.
All other marks appearing herein are registered or unregistered trademarks or service marks of FMR LLC or an affiliated company. © 2013 FMR LLC. All rights reserved.
Annual Report
This report and the financial statements contained herein are submitted for the general information of the shareholders of the fund. This report is not authorized for distribution to prospective investors in the fund unless preceded or accompanied by an effective prospectus.
A fund files its complete schedule of portfolio holdings with the SEC for the first and third quarters of each fiscal year on Form N-Q. Forms N-Q are available on the SEC's web site at http://www.sec.gov. A fund's Forms N-Q may be reviewed and copied at the SEC's Public Reference Room in Washington, DC. Information regarding the operation of the SEC's Public Reference Room may be obtained by calling 1-800-SEC-0330. For a complete list of a fund's portfolio holdings, view the most recent holdings listing, semiannual report, or annual report on Fidelity's web site at http://www.fidelity.com, http://www.advisor.fidelity.com, or http://www.401k.com, as applicable.
NOT FDIC INSURED • MAY LOSE VALUE • NO BANK GUARANTEE
Neither the fund nor Fidelity Distributors Corporation is a bank.
Annual Report
Average annual total return reflects the change in the value of an investment, assuming reinvestment of the fund's distributions from dividend income and capital gains (the profits earned upon the sale of securities that have grown in value, if any) and assuming a constant rate of performance each year. The $10,000 table and the fund's returns do not reflect the deduction of taxes that a shareholder would pay on fund distributions or the redemption of fund shares. During periods of reimbursement by Fidelity, a fund's total return will be greater than it would be had the reimbursement not occurred. How a fund did yesterday is no guarantee of how it will do tomorrow.
Average Annual Total Returns
Periods ended December 31, 2012 | Past 1
year | Past 5
years | Past 10
years |
Fidelity® Minnesota Municipal Income Fund | 4.91% | 5.14% | 4.48% |
$10,000 Over 10 Years
Let's say hypothetically that $10,000 was invested in Fidelity® Minnesota Municipal Income Fund on December 31, 2002. The chart shows how the value of your investment would have changed, and also shows how the Barclays® Municipal Bond Index performed over the same period.
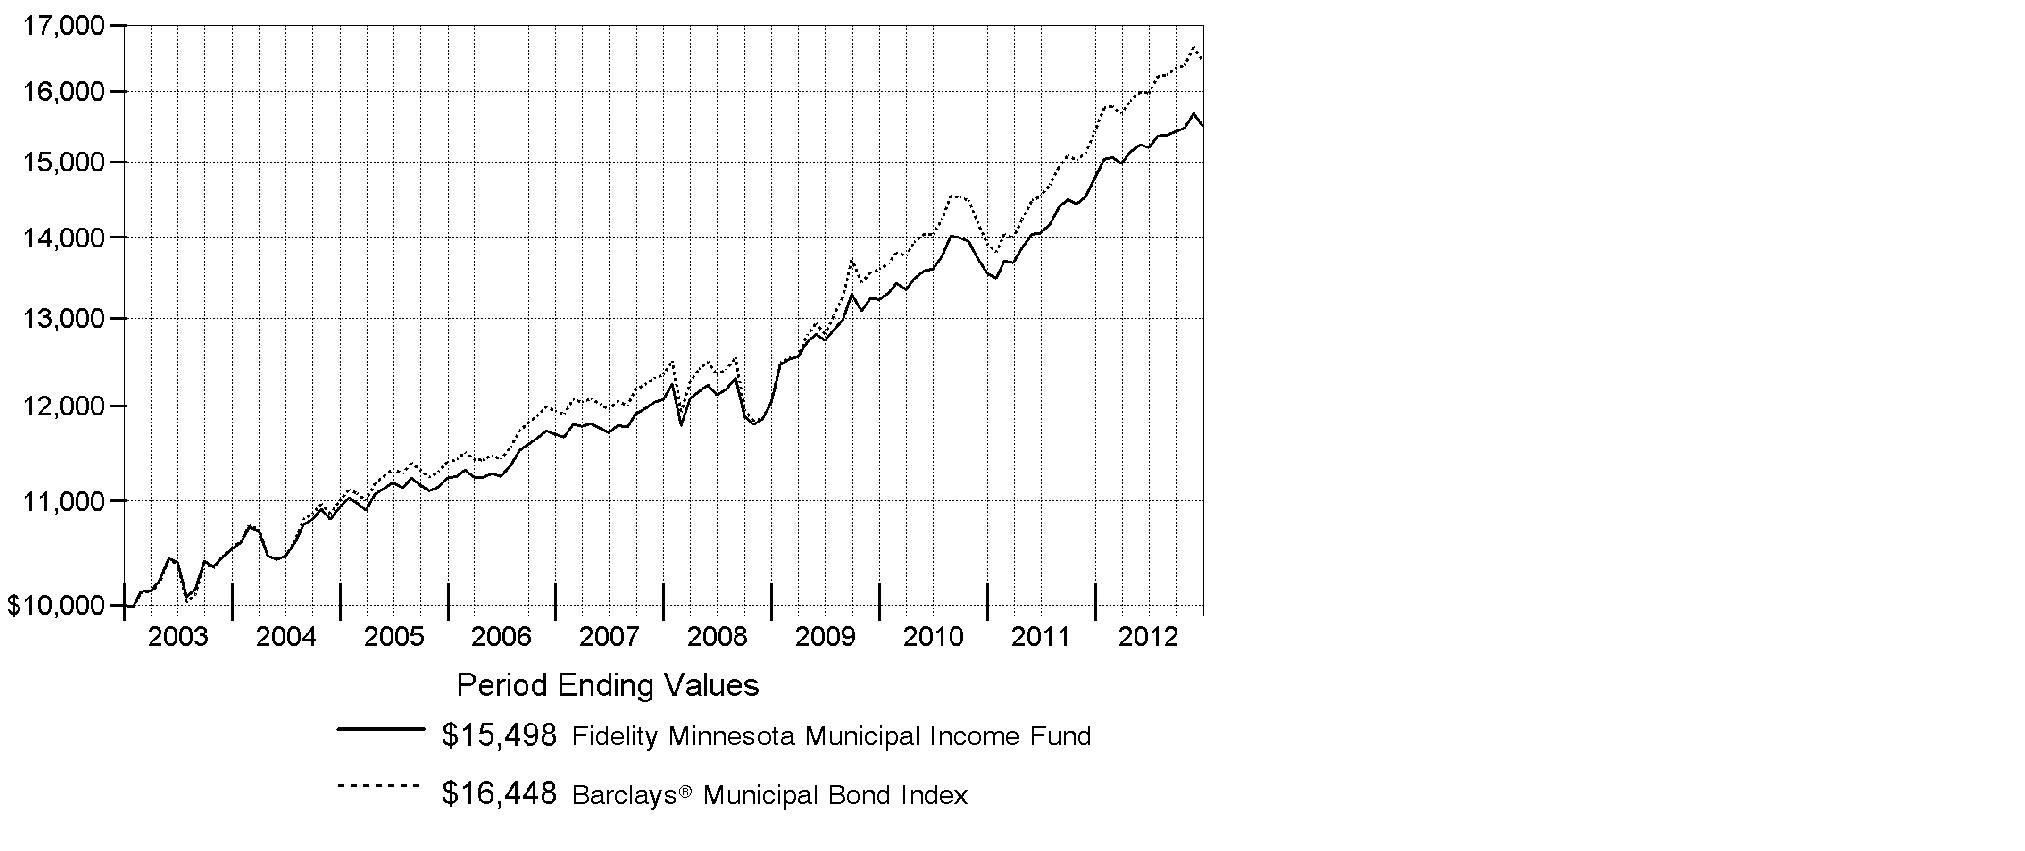
Annual Report
Market Recap: Powered by improving issuer fundamentals and favorable supply and demand, the bull market for municipal bonds rolled on in 2012, with the Barclays® Municipal Bond Index advancing 6.78%. By contrast, taxable investment-grade debt gained 4.21%, as tracked by the Barclays® U.S. Aggregate Bond Index. Muni investors were encouraged by a recovery in tax revenues for many issuers. And despite a handful of well-publicized bankruptcies by local issuers, the overall muni default rate declined and remained low. Even with a surge in refinancings, the overall supply of newly issued muni bonds was muted. As for demand, munis drew heavy interest from investors seeking a yield advantage over U.S. Treasuries, and from those looking for a perceived safe haven amid mixed U.S. economic data and the ongoing financial crisis in Europe. Investors' appetite for tax-advantaged investments in advance of potentially higher federal tax rates in 2013 also fueled demand, particularly in November, while a steady stream of municipal redemptions (calls and maturities), many of which were reinvested in the muni market, competed for limited new supply. The muni market sold off in December due to concern about proposals to limit the federal tax exemption of muni debt, profit-taking in advance of higher capital gains rates, and ratings downgrades of Puerto Rico debt to borderline investment grade.
Comments from Kevin Ramundo Portfolio Manager of Fidelity® Minnesota Municipal Income Fund: For the year, the fund returned 4.91%, while the Barclays Minnesota Enhanced Modified 2% Tobacco Municipal Bond Index - which tracks the types of securities in which the fund investments - rose 5.18%. (This benchmark was modified on January 25, 2012, to include a 2% cap on tobacco bonds.) Versus the benchmark, the fund benefited from two sector decisions and yield-curve positioning, offsetting the negative impact of holding certain Puerto Rico bonds. The fund benefited from underweighting housing bonds, which lagged due to rising prepayment fears, and overweighting health care bonds, which outperformed as yield-hungry investors gravitated to the sector. The fund's overweighting in bonds with maturities between 20 and 30 years was beneficial because they outpaced their intermediate-term counterparts. The fund's investments in Puerto Rico bonds underperformed due to worries about the U.S. territory's weak economy and deteriorating fiscal situation. They suffered a significant sell-off in December, following a downgrade by one credit rating agency.
The views expressed above reflect those of the portfolio manager(s) only through the end of the period as stated on the cover of this report and do not necessarily represent the views of Fidelity or any other person in the Fidelity organization. Any such views are subject to change at any time based upon market or other conditions and Fidelity disclaims any responsibility to update such views. These views may not be relied on as investment advice and, because investment decisions for a Fidelity fund are based on numerous factors, may not be relied on as an indication of trading intent on behalf of any Fidelity fund.
Annual Report
Shareholder Expense Example
As a shareholder of the Fund, you incur two types of costs: (1) transaction costs including redemption fees and (2) ongoing costs, including management fees and other Fund expenses. This Example is intended to help you understand your ongoing costs (in dollars) of investing in the Fund and to compare these costs with the ongoing costs of investing in other mutual funds.
The Example is based on an investment of $1,000 invested at the beginning of the period and held for the entire period (July 1, 2012 to December 31, 2012).
Actual Expenses
The first line of the accompanying table provides information about actual account values and actual expenses. You may use the information in this line, together with the amount you invested, to estimate the expenses that you paid over the period. Simply divide your account value by $1,000.00 (for example, an $8,600 account value divided by $1,000.00 = 8.6), then multiply the result by the number in the first line under the heading entitled "Expenses Paid During Period" to estimate the expenses you paid on your account during this period. A small balance maintenance fee of $12.00 that is charged once a year may apply for certain accounts with a value of less than $2,000. This fee is not included in the table below. If it was, the estimate of expenses you paid during the period would be higher, and your ending account value lower, by this amount.
Hypothetical Example for Comparison Purposes
The second line of the accompanying table provides information about hypothetical account values and hypothetical expenses based on the Fund's actual expense ratio and an assumed rate of return of 5% per year before expenses, which is not the Fund's actual return. The hypothetical account values and expenses may not be used to estimate the actual ending account balance or expenses you paid for the period. You may use this information to compare the ongoing costs of investing in the Fund and other funds. To do so, compare this 5% hypothetical example with the 5% hypothetical examples that appear in the shareholder reports of the other funds. A small balance maintenance fee of $12.00 that is charged once a year may apply for certain accounts with a value of less than $2,000. This fee is not included in the table below. If it was, the estimate of expenses you paid during the period would be higher, and your ending account value lower, by this amount.
Please note that the expenses shown in the table are meant to highlight your ongoing costs only and do not reflect any transaction costs. Therefore, the second line of the table is useful in comparing ongoing costs only, and will not help you determine the relative total costs of owning different funds. In addition, if these transactional costs were included, your costs would have been higher.
Annual Report
Shareholder Expense Example - continued
| Annualized
Expense Ratio | Beginning
Account Value
July 1, 2012 | Ending
Account Value
December 31, 2012 | Expenses Paid
During Period*
July 1, 2012
to December 31, 2012 |
Actual | .49% | $ 1,000.00 | $ 1,020.00 | $ 2.49 |
Hypothetical (5% return per year before expenses) | | $ 1,000.00 | $ 1,022.67 | $ 2.49 |
* Expenses are equal to the Fund's annualized expense ratio, multiplied by the average account value over the period, multiplied by 184/366 (to reflect the one-half year period).
Annual Report
Investment Changes (Unaudited)
Top Five Sectors as of December 31, 2012 |
| % of fund's
net assets | % of fund's net assets
6 months ago |
General Obligations | 37.1 | 32.6 |
Health Care | 18.7 | 18.9 |
Electric Utilities | 13.1 | 12.1 |
Escrowed/Pre-Refunded | 8.4 | 8.8 |
Education | 7.8 | 7.2 |
Weighted Average Maturity as of December 31, 2012 |
| | 6 months ago |
Years | 5.3 | 5.4 |
This is a weighted average of all the maturities of the securities held in a fund. Weighted Average Maturity (WAM) can be used as a measure of sensitivity to interest rate changes and market changes. Generally, the longer the maturity, the greater the sensitivity to such changes. WAM is based on the dollar-weighted average length of time until principal payments must be paid. Depending on the types of securities held in a fund, certain maturity shortening devices (e.g., demand features, interest rate resets, and call options) may be taken into account when calculating the WAM. |
Duration as of December 31, 2012 |
| | 6 months ago |
Years | 5.4 | 5.8 |
Duration estimates how much a bond fund's price will change with a change in comparable interest rates. If rates rise 1%, for example, a fund with a 5-year duration is likely to lose about 5% of its value. Other factors also can influence a bond fund's performance and share price. Accordingly, a bond fund's actual performance may differ from this example. Duration takes into account any call or put option embedded in the bonds. |
Quality Diversification (% of fund's net assets) |
As of December 31, 2012 | As of June 30, 2012 |
 | AAA 6.7% | | | AAA 6.4% | |
 | AA,A 82.9% | | | AA,A 82.6% | |
 | BBB 5.3% | | | BBB 5.0% | |
 | BB and Below 0.6% | | | BB and Below 0.6% | |
 | Not Rated 0.4% | | | Not Rated 0.4% | |
 | Short-Term
Investments and
Net Other Assets
(Liabilities) 4.1% | | | Short-Term
Investments and
Net Other Assets
(Liabilities) 5.0% | |

We have used ratings from Moody's Investors Service, Inc. Where Moody's® ratings are not available, we have used S&P® ratings. All ratings are as of the date indicated and do not reflect subsequent changes. |
Annual Report
Investments December 31, 2012
Showing Percentage of Net Assets
Municipal Bonds - 95.9% |
| Principal
Amount | | Value |
Guam - 0.5% |
Guam Ed. Fing. Foundation Ctfs. of Prtn. Series 2006 A, 5% 10/1/23 | | $ 1,500,000 | | $ 1,512,090 |
Guam Pwr. Auth. Rev. Series 2012 A, 5% 10/1/21 (FSA Insured) | | 1,100,000 | | 1,296,724 |
| | 2,808,814 |
Minnesota - 93.7% |
Alexandria Independent School District #206 Gen. Oblig. (Minnesota School District Cr. Enhancement Prog.) Series 2008 A, 5% 2/1/17 (FSA Insured) | | 1,000,000 | | 1,160,630 |
Breckenridge Gen. Oblig. (Catholic Health Initiatives Proj.) Series 2004 A, 5% 5/1/30 | | 4,575,000 | | 4,743,086 |
Burnsville-Eagan-Savage Independent School District #191 Gen. Oblig. (Minnesota School Distric Cr. Enhancement Prog.) Series 2007 A, 5% 2/1/17 (FSA Insured) | | 525,000 | | 608,417 |
Cambridge Independent School District #911 Gen. Oblig. (Minnesota School District Prog.) Series 2005 C, 5% 4/1/14 (Nat'l. Pub. Fin. Guarantee Corp. Insured) | | 1,200,000 | | 1,263,516 |
Chaska Elec. Rev. (Generating Facilities Proj.) Series 2005 A: | | | | |
5.25% 10/1/20 | | 2,000,000 | | 2,195,560 |
5.25% 10/1/25 | | 1,955,000 | | 2,129,093 |
Chaska Independent School District #112 Gen. Oblig.: | | | | |
(Cr. Enhancement Prog.) Series 2012 A: | | | | |
5% 2/1/19 | | 4,090,000 | | 5,000,598 |
5% 2/1/22 | | 4,975,000 | | 6,316,658 |
(School Bldg. Proj.) Series 2007 A, 5% 2/1/17 (Nat'l. Pub. Fin. Guarantee Corp. Insured) | | 750,000 | | 872,760 |
Series 2009 A: | | | | |
4% 2/1/16 | | 1,000,000 | | 1,101,500 |
5% 2/1/17 | | 1,000,000 | | 1,163,680 |
Duluth Independent School District #709 Ctfs. of Prtn. Series 2009 B: | | | | |
4% 3/1/16 | | 1,445,000 | | 1,518,941 |
4% 3/1/17 | | 1,495,000 | | 1,598,888 |
4% 3/1/18 | | 1,235,000 | | 1,329,058 |
5% 3/1/30 | | 2,770,000 | | 2,854,125 |
Elk River Independent School District #728: | | | | |
Series 2002 A: | | | | |
5% 2/1/16 (FSA Insured) (Pre-Refunded to 2/1/13 @ 100) | | 3,000,000 | | 3,010,260 |
Municipal Bonds - continued |
| Principal
Amount | | Value |
Minnesota - continued |
Elk River Independent School District #728: - continued | | | | |
Series 2002 A: | | | | |
5.25% 2/1/18 (FSA Insured) (Pre-Refunded to 2/1/13 @ 100) | | $ 3,600,000 | | $ 3,612,996 |
Series 2004 A, 5% 2/1/17 (FGIC Insured) (Pre-Refunded to 8/1/14 @ 100) | | 1,000,000 | | 1,068,050 |
Series 2006 A, 5% 2/1/19 (FSA Insured) | | 3,500,000 | | 3,947,895 |
Hennepin County Gen. Oblig. Series 2010 E, 5% 12/15/20 | | 4,945,000 | | 6,216,409 |
Hennepin County Sales Tax Rev. (Ballpark Proj.) Series 2007 A, 5% 12/15/24 | | 1,000,000 | | 1,169,920 |
Lake Superior Independent School District #381 Series 2002 A: | | | | |
5% 4/1/15 (FSA Insured) (Pre-Refunded to 4/1/13 @ 100) | | 1,970,000 | | 1,991,709 |
5% 4/1/16 (FSA Insured) (Pre-Refunded to 4/1/13 @ 100) | | 2,065,000 | | 2,087,756 |
5% 4/1/17 (FSA Insured) (Pre-Refunded to 4/1/13 @ 100) | | 2,165,000 | | 2,188,858 |
5% 4/1/18 (FSA Insured) (Pre-Refunded to 4/1/13 @ 100) | | 1,260,000 | | 1,273,885 |
Lakeville Independent School District #194: | | | | |
Series 2002 A, 5% 2/1/22 (FGIC Insured) (Pre-Refunded to 2/1/22 @ 100) | | 1,000,000 | | 1,003,420 |
Series 2012 D: | | | | |
5% 2/1/18 | | 5,185,000 | | 6,169,113 |
5% 2/1/20 | | 1,570,000 | | 1,936,344 |
Maple Grove Health Care Sys. Rev. (Maple Grove Hosp. Corp. Proj.) Series 2007: | | | | |
5% 5/1/16 | | 1,000,000 | | 1,099,740 |
5.25% 5/1/24 | | 1,500,000 | | 1,619,430 |
5.25% 5/1/25 | | 2,000,000 | | 2,150,880 |
5.25% 5/1/28 | | 3,720,000 | | 3,954,434 |
Metropolitan Council Gen. Oblig. Rev. (Wastewtr. Proj.) Series 2008 C, 5% 3/1/21 (Pre-Refunded to 3/1/16 @ 100) | | 5,000,000 | | 5,633,550 |
Minneapolis & Saint Paul Hsg. & Redev. Auth. Health Care Sys. Rev.: | | | | |
(Children's Health Care Proj.): | | | | |
Series 1995 B, 5% 8/15/25 (FSA Insured) | | 3,000,000 | | 3,496,620 |
Series 2010 A, 5.25% 8/15/25 | | 1,000,000 | | 1,148,440 |
(Children's Hospitals and Clinics Proj.) Series 2004 A1, 5% 8/15/34 (FSA Insured) | | 500,000 | | 562,890 |
Municipal Bonds - continued |
| Principal
Amount | | Value |
Minnesota - continued |
Minneapolis & Saint Paul Hsg. & Redev. Auth. Health Care Sys. Rev.: - continued | | | | |
(HealthPartners Obligated Group Proj.) Series 2003: | | | | |
5.875% 12/1/29 | | $ 800,000 | | $ 833,456 |
6% 12/1/19 | | 2,815,000 | | 2,944,546 |
Minneapolis & Saint Paul Metropolitan Arpts. Commission Arpt. Rev.: | | | | |
Series 2005 A: | | | | |
5% 1/1/15 (AMBAC Insured) | | 2,000,000 | | 2,158,600 |
5% 1/1/35 (AMBAC Insured) | | 8,500,000 | | 9,064,315 |
Series 2005 C, 5% 1/1/31 (Nat'l. Pub. Fin. Guarantee Corp. Insured) | | 2,090,000 | | 2,235,130 |
Series 2007 A, 5% 1/1/21 | | 5,000,000 | | 5,765,850 |
Series 2007 B, 5% 1/1/18 (Nat'l. Pub. Fin. Guarantee Corp. Insured) | | 2,000,000 | | 2,304,640 |
Series 2008 A: | | | | |
5% 1/1/13 (b) | | 655,000 | | 655,000 |
5% 1/1/14 (b) | | 3,000,000 | | 3,131,850 |
Series 2010 D, 5% 1/1/17 (b) | | 4,155,000 | | 4,685,427 |
Series 2012 B, 5% 1/1/26 | | 1,250,000 | | 1,474,888 |
Series 2012, 5% 1/1/27 | | 1,500,000 | | 1,762,020 |
Series B, 5% 1/1/20 (Nat'l. Pub. Fin. Guarantee Corp. Insured) | | 2,830,000 | | 3,239,586 |
Minneapolis Gen. Oblig. Series 2009: | | | | |
4% 12/1/20 | | 2,800,000 | | 3,092,796 |
4% 12/1/21 | | 2,330,000 | | 2,563,326 |
Minneapolis Health Care Sys. Rev. (Fairview Health Svcs. Proj.): | | | | |
Series 2005 D, 5% 11/15/34 (AMBAC Insured) | | 5,120,000 | | 5,334,426 |
Series 2008 B, 6.5% 11/15/38 (Assured Guaranty Corp. Insured) | | 3,500,000 | | 4,246,305 |
Minneapolis Spl. School District #1 Series 2005 A, 5% 2/1/17 (FSA Insured) | | 2,000,000 | | 2,093,700 |
Minnesota 911 Rev.: | | | | |
(Pub. Safety Radio Communications Sys. Proj.) Series 2009, 5% 6/1/21 (Assured Guaranty Corp. Insured) | | 2,220,000 | | 2,680,961 |
5% 6/1/21 | | 2,000,000 | | 2,415,280 |
Minnesota Agric. & Econ. Dev. Board Rev. (Essentia Health Obligated Group Proj.): | | | | |
Series 2008 C1: | | | | |
5% 2/15/16 (Assured Guaranty Corp. Insured) | | 415,000 | | 461,434 |
5% 2/15/30 (Assured Guaranty Corp. Insured) | | 3,750,000 | | 4,194,000 |
Municipal Bonds - continued |
| Principal
Amount | | Value |
Minnesota - continued |
Minnesota Agric. & Econ. Dev. Board Rev. (Essentia Health Obligated Group Proj.): - continued | | | | |
Series 2008 C1: | | | | |
5.25% 2/15/23 (Assured Guaranty Corp. Insured) | | $ 1,660,000 | | $ 1,951,048 |
5.5% 2/15/25 (Assured Guaranty Corp. Insured) | | 2,500,000 | | 2,937,850 |
Series 2008, 5% 2/15/17 (Assured Guaranty Corp. Insured) | | 1,975,000 | | 2,252,290 |
Minnesota Gen. Oblig.: | | | | |
Series 2008 A, 5% 6/1/21 | | 3,300,000 | | 3,952,806 |
Series 2009 A, 5% 12/1/23 | | 15,540,000 | | 19,142,320 |
Series 2009 H, 5% 11/1/21 | | 4,590,000 | | 5,692,243 |
Series 2010 A, 5% 8/1/27 | | 5,000,000 | | 6,160,050 |
Series 2010 D: | | | | |
5% 8/1/21 | | 1,000,000 | | 1,257,050 |
5% 8/1/22 | | 5,000,000 | | 6,264,850 |
5% 8/1/23 | | 10,000,000 | | 12,448,600 |
Series 2011 B: | | | | |
5% 10/1/24 | | 2,500,000 | | 3,105,500 |
5% 10/1/30 | | 3,000,000 | | 3,643,320 |
Series 2012 A, 5% 8/1/24 | | 5,000,000 | | 6,311,050 |
5% 11/1/15 | | 5,135,000 | | 5,580,821 |
5% 6/1/21 | | 8,585,000 | | 9,838,668 |
5% 8/1/22 | | 2,600,000 | | 3,067,766 |
5% 11/1/24 (Pre-Refunded to 11/1/14 @ 100) | | 9,155,000 | | 9,914,682 |
5% 11/1/26 | | 4,270,000 | | 4,890,303 |
Minnesota Higher Ed. Facilities Auth. Rev.: | | | | |
(College of St. Scholastica, Inc. Proj.) Series Seven-H, 5.25% 12/1/35 | | 1,000,000 | | 1,097,530 |
(Gustovus Adolphus College Proj.) Series Seven-B: | | | | |
5% 10/1/22 | | 2,250,000 | | 2,639,565 |
5% 10/1/23 | | 1,000,000 | | 1,167,010 |
(Hamline Univ. Proj.) Series Seven-E: | | | | |
5% 10/1/17 | | 1,565,000 | | 1,766,509 |
5% 10/1/19 | | 1,000,000 | | 1,150,170 |
(Macalester College Proj.) Series Six-P: | | | | |
5% 3/1/21 | | 2,315,000 | | 2,611,459 |
5% 3/1/22 | | 2,535,000 | | 2,850,962 |
(St. Olaf College Proj.) Series Six-O, 5% 10/1/15 | | 1,000,000 | | 1,101,310 |
(Univ. of St. Thomas Proj.): | | | | |
Series Seven-A, 5% 10/1/39 | | 1,650,000 | | 1,847,852 |
Series Six-I, 5% 4/1/23 | | 1,000,000 | | 1,110,650 |
Series Six-X, 5.25% 4/1/39 | | 1,500,000 | | 1,626,570 |
Municipal Bonds - continued |
| Principal
Amount | | Value |
Minnesota - continued |
Minnesota Higher Ed. Facilities Auth. Rev.: - continued | | | | |
Series Seven-Q: | | | | |
5% 10/1/17 | | $ 495,000 | | $ 563,285 |
5% 10/1/18 | | 400,000 | | 461,020 |
5% 10/1/19 | | 780,000 | | 906,563 |
5% 10/1/20 | | 1,140,000 | | 1,327,222 |
Minnesota Muni. Pwr. Agcy. Elec. Rev.: | | | | |
Series 2005, 5.25% 10/1/21 | | 8,450,000 | | 9,193,009 |
Series 2007, 5.25% 10/1/22 | | 1,000,000 | | 1,134,660 |
Minnesota Pub. Facilities Auth. Drinking Wtr. Rev. Series 2005 A, 5% 3/1/21 | | 5,060,000 | | 5,534,375 |
Minnesota State Colleges & Univs. Board of Trustees Rev.: | | | | |
Series 2005 A, 5% 10/1/18 (Nat'l. Pub. Fin. Guarantee Corp. Insured) | | 1,465,000 | | 1,637,460 |
Series 2009 A: | | | | |
4% 10/1/17 | | 1,445,000 | | 1,640,220 |
4% 10/1/18 | | 1,490,000 | | 1,718,998 |
4% 10/1/19 | | 1,550,000 | | 1,798,636 |
4% 10/1/20 | | 1,580,000 | | 1,821,392 |
Series 2011 A, 5% 10/1/30 | | 1,495,000 | | 1,794,598 |
Minnesota State Gen. Fdg. Rev. Series 2012 B: | | | | |
5% 3/1/27 | | 4,340,000 | | 5,262,641 |
5% 3/1/28 | | 4,275,000 | | 5,160,395 |
5% 3/1/29 | | 2,250,000 | | 2,703,735 |
North Saint Paul-Maplewood-Oakdale Independent School District 622 Series 2006 B: | | | | |
5% 2/1/17 (FSA Insured) | | 1,525,000 | | 1,778,608 |
5% 8/1/17 (FSA Insured) | | 1,575,000 | | 1,803,517 |
Northeast Metropolitan Intermediate School District #916 Ctfs. of Prtn. Series 2004, 5% 1/1/13 | | 1,000,000 | | 1,000,000 |
Northern Muni. Pwr. Agcy. Elec. Sys. Rev.: | | | | |
Series 2009 A, 5% 1/1/16 (Assured Guaranty Corp. Insured) | | 3,000,000 | | 3,375,540 |
Series 2010 A1: | | | | |
5% 1/1/19 | | 3,000,000 | | 3,590,040 |
5% 1/1/20 | | 2,100,000 | | 2,524,326 |
Series A, 5% 1/1/18 (Assured Guaranty Corp. Insured) | | 3,000,000 | | 3,557,130 |
Northfield Hosp. Rev. Series 2006: | | | | |
5.375% 11/1/26 | | 1,000,000 | | 1,069,860 |
5.5% 11/1/16 | | 1,025,000 | | 1,153,617 |
Municipal Bonds - continued |
| Principal
Amount | | Value |
Minnesota - continued |
Owatonna Pub. Utils. Commission Pub. Utils. Rev. Series 2003: | | | | |
5% 1/1/13 (AMBAC Insured) | | $ 800,000 | | $ 800,000 |
5% 1/1/15 (AMBAC Insured) | | 715,000 | | 717,217 |
Ramsey County Gen. Oblig.: | | | | |
Series 2003 A, 5% 2/1/18 | | 1,530,000 | | 1,535,554 |
Series 2012 B: | | | | |
5% 2/1/19 | | 1,585,000 | | 1,949,376 |
5% 2/1/20 | | 1,635,000 | | 2,047,641 |
5% 2/1/21 | | 1,350,000 | | 1,713,933 |
Rochester Elec. Util. Rev. Series 2007 C, 5% 12/1/30 | | 2,000,000 | | 2,284,360 |
Rochester Gen. Oblig. Series 2012 A, 5% 2/1/23 | | 4,400,000 | | 5,565,516 |
Rochester Health Care Facilities Rev.: | | | | |
(Mayo Clinic Proj.) Series 2008 E, 5% 11/15/38 | | 4,000,000 | | 4,584,640 |
(Mayo Foundation Proj.) Series 2006, 5% 11/15/36 | | 2,000,000 | | 2,156,260 |
Bonds: | | | | |
(Mayo Clinic Proj.): | | | | |
Series 2011, 4%, tender 11/15/18 (a) | | 2,475,000 | | 2,845,037 |
Series B, 4%, tender 11/15/18 (a) | | 3,000,000 | | 3,448,530 |
(Mayo Foundation Proj.) Series C, 4.5%, tender 11/15/21 (a) | | 1,100,000 | | 1,329,284 |
Saint Cloud Health Care Rev. (CentraCare Health Sys. Proj.) Series 2010 A, 5.125% 5/1/30 | | 5,000,000 | | 5,568,600 |
Saint Paul Hsg. & Redev. Auth. Hosp. Rev. (HealthEast Proj.) Series 2005, 5.25% 11/15/14 | | 1,000,000 | | 1,052,800 |
Saint Paul Independent School District #625: | | | | |
Series 2002 A: | | | | |
5% 2/1/17 (FSA Insured) | | 220,000 | | 220,752 |
5% 2/1/18 (FSA Insured) | | 395,000 | | 396,351 |
Series 2004 B, 5% 2/1/17 (FSA Insured) (Pre-Refunded to 2/1/15 @ 100) | | 1,300,000 | | 1,412,970 |
Series 2004 C, 5% 2/1/16 (FSA Insured) (Pre-Refunded to 2/1/15 @ 100) | | 1,025,000 | | 1,114,073 |
Saint Paul Port Auth. Series 2007-2, 5% 3/1/37 | | 1,500,000 | | 1,654,050 |
Saint Paul Port Auth. Lease Rev.: | | | | |
(HealthEast Midway Campus Proj.) Series 2003 A, 5.75% 5/1/25 | | 2,000,000 | | 2,093,600 |
(Regions Hosp. Package Proj.) Series 2007-1: | | | | |
5% 8/1/13 | | 430,000 | | 436,562 |
5% 8/1/14 | | 455,000 | | 472,381 |
5% 8/1/15 | | 480,000 | | 506,659 |
5% 8/1/16 | | 500,000 | | 532,950 |
Municipal Bonds - continued |
| Principal
Amount | | Value |
Minnesota - continued |
Saint Paul Port Auth. Lease Rev.: - continued | | | | |
Series 2003 12: | | | | |
5.125% 12/1/27 | | $ 5,000,000 | | $ 5,206,000 |
5.25% 12/1/18 | | 3,685,000 | | 3,848,614 |
Shakopee Health Care Facilities Rev. (Saint Francis Reg'l. Med. Ctr. Proj.) Series 2004, 5.25% 9/1/34 | | 2,520,000 | | 2,568,283 |
Southern Minnesota Muni. Pwr. Agcy. Pwr. Supply Sys. Rev.: | | | | |
(Cap. Appreciation) Series 1994 A: | | | | |
0% 1/1/19 (Nat'l. Pub. Fin. Guarantee Corp. Insured) | | 6,210,000 | | 5,379,661 |
0% 1/1/21 (Nat'l. Pub. Fin. Guarantee Corp. Insured) | | 14,670,000 | | 11,783,971 |
0% 1/1/26 (Nat'l. Pub. Fin. Guarantee Corp. Insured) | | 2,000,000 | | 1,300,580 |
Series 2002 A: | | | | |
5.25% 1/1/15 (AMBAC Insured) | | 1,125,000 | | 1,226,295 |
5.25% 1/1/16 (AMBAC Insured) | | 4,490,000 | | 5,073,790 |
Series 2009 A: | | | | |
5% 1/1/13 | | 2,500,000 | | 2,500,000 |
5% 1/1/14 | | 960,000 | | 1,004,448 |
5.25% 1/1/30 | | 2,000,000 | | 2,301,880 |
5.5% 1/1/24 | | 500,000 | | 595,860 |
Spring Lake Park Independent School District #16: | | | | |
Series 2004 B: | | | | |
5% 2/1/15 (Nat'l. Pub. Fin. Guarantee Corp. Insured) (Pre-Refunded to 2/1/15 @ 100) | | 2,085,000 | | 2,092,131 |
5% 2/1/16 (Nat'l. Pub. Fin. Guarantee Corp. Insured) (Pre-Refunded to 2/1/16 @ 100) | | 2,230,000 | | 2,237,627 |
5% 2/1/17 (Nat'l. Pub. Fin. Guarantee Corp. Insured) (Pre-Refunded to 2/1/17 @ 100) | | 2,400,000 | | 2,408,208 |
Series 2006 A, 5% 2/1/29 (FSA Insured) | | 4,000,000 | | 4,349,840 |
St. Louis Park Health Care Facilities Rev. (Park Nicollet Health Svcs. Proj.): | | | | |
Series 2008 C: | | | | |
5.5% 7/1/17 | | 535,000 | | 617,797 |
5.75% 7/1/30 | | 3,715,000 | | 4,226,704 |
Series 2009, 5.75% 7/1/39 | | 9,000,000 | | 10,189,170 |
St. Paul Hsg. & Redev. Auth. Health Care Facilities Rev.: | | | | |
(Allina Health Sys. Proj.): | | | | |
Series 2007 A: | | | | |
5% 11/15/15 (Nat'l. Pub. Fin. Guarantee Corp. Insured) | | 240,000 | | 264,881 |
Municipal Bonds - continued |
| Principal
Amount | | Value |
Minnesota - continued |
St. Paul Hsg. & Redev. Auth. Health Care Facilities Rev.: - continued | | | | |
Series 2007 A: | | | | |
5% 11/15/22 (Nat'l. Pub. Fin. Guarantee Corp. Insured) | | $ 2,100,000 | | $ 2,354,310 |
Series 2009 A1, 5.25% 11/15/29 | | 3,000,000 | | 3,331,260 |
(Gillette Children's Speciality Healthcare Proj.) 5% 2/1/16 | | 1,460,000 | | 1,523,087 |
(HealthPartners Oblig. Group Proj.) Series 2006: | | | | |
5% 5/15/15 | | 250,000 | | 270,365 |
5% 5/15/16 | | 345,000 | | 381,349 |
5.25% 5/15/17 | | 590,000 | | 659,313 |
5.25% 5/15/26 | | 1,000,000 | | 1,066,410 |
5.25% 5/15/36 | | 1,000,000 | | 1,050,870 |
(Regions Hosp. Proj.) 5.3% 5/15/28 | | 1,250,000 | | 1,251,225 |
Series 2009 A2, 5.5% 11/15/24 | | 2,000,000 | | 2,298,640 |
Univ. of Minnesota Gen. Oblig.: | | | | |
Series 2009 A: | | | | |
5% 4/1/23 | | 200,000 | | 236,970 |
5.125% 4/1/34 | | 1,000,000 | | 1,148,300 |
5.25% 4/1/29 | | 1,000,000 | | 1,178,210 |
Series 2009 C: | | | | |
5% 12/1/17 | | 1,000,000 | | 1,190,060 |
5% 12/1/21 | | 1,000,000 | | 1,204,260 |
Series 2011 D: | | | | |
5% 12/1/23 | | 1,180,000 | | 1,472,982 |
5% 12/1/26 | | 1,020,000 | | 1,256,375 |
5% 12/1/36 | | 1,000,000 | | 1,181,010 |
Univ. of Minnesota Spl. Purp. Rev.: | | | | |
(State Supported Biomedical Science Research Facilities Fdg. Prog.) Series 2011 B, 5% 8/1/25 | | 2,095,000 | | 2,567,611 |
(State Supported Stadium Proj.) Series 2006: | | | | |
5% 8/1/20 | | 6,625,000 | | 7,550,778 |
5% 8/1/29 | | 4,000,000 | | 4,472,160 |
Series 2010 A, 5% 8/1/25 | | 1,800,000 | | 2,186,262 |
Virginia Hsg. & Redev. Auth. Health Care Facility Lease Rev. Series 2005, 5.25% 10/1/25 | | 440,000 | | 457,833 |
Watertown Independent School District #111 Series 2005 A, 5% 2/1/22 (FSA Insured) (Pre-Refunded to 2/1/22 @ 100) | | 1,495,000 | | 1,654,711 |
Wayzata Independent School District #284 Series 2004 B, 5% 2/1/16 (FSA Insured) | | 1,005,000 | | 1,099,550 |
West Saint Paul Independent School District #197 Series 2012 A, 4% 2/1/24 | | 3,530,000 | | 4,090,988 |
Municipal Bonds - continued |
| Principal
Amount | | Value |
Minnesota - continued |
Western Minnesota Muni. Pwr. Agcy. Pwr. Supply Rev.: | | | | |
Series 1977 A, 6.375% 1/1/16 (Escrowed to Maturity) | | $ 630,000 | | $ 685,352 |
Series 2003 A, 5% 1/1/30 (Pre-Refunded to 1/1/13 @ 100) | | 3,000,000 | | 3,000,000 |
Series 2006 A, 5% 1/1/16 (FSA Insured) | | 2,000,000 | | 2,239,620 |
Series 2012 A: | | | | |
5% 1/1/26 | | 5,000,000 | | 6,163,800 |
5% 1/1/27 | | 1,750,000 | | 2,150,330 |
| | 523,417,123 |
Puerto Rico - 1.5% |
Puerto Rico Pub. Bldg. Auth. Rev. Bonds Series M2, 5.75%, tender 7/1/17 (a) | | 600,000 | | 638,466 |
Puerto Rico Sales Tax Fing. Corp. Sales Tax Rev.: | | | | |
Series 2009 A, 6% 8/1/42 | | 1,000,000 | | 1,068,680 |
Series 2011 C: | | | | |
0% 8/1/37 | | 6,800,000 | | 1,716,864 |
0% 8/1/38 | | 1,310,000 | | 308,872 |
0% 8/1/39 | | 19,550,000 | | 4,333,844 |
| | 8,066,726 |
Virgin Islands - 0.2% |
Virgin Islands Pub. Fin. Auth. Series 2009 B, 5% 10/1/25 | | 1,000,000 | | 1,098,780 |
TOTAL INVESTMENT PORTFOLIO - 95.9% (Cost $499,430,874) | | 535,391,443 |
NET OTHER ASSETS (LIABILITIES) - 4.1% | | 22,961,432 |
NET ASSETS - 100% | $ 558,352,875 |
Legend |
(a) Coupon rates for floating and adjustable rate securities reflect the rates in effect at period end. |
(b) Private activity obligations whose interest is subject to the federal alternative minimum tax for individuals. |
Other Information |
All investments are categorized as Level 2 under the Fair Value Hierarchy. The inputs or methodology used for valuing securities may not be an indication of the risk associated with investing in those securities. For more information on valuation inputs, please refer to the Investment Valuation section in the accompanying Notes to Financial Statements. |
The distribution of municipal securities by revenue source, as a percentage of total net assets, is as follows (Unaudited): |
General Obligations | 37.1% |
Health Care | 18.7% |
Electric Utilities | 13.1% |
Escrowed/Pre-Refunded | 8.4% |
Education | 7.8% |
Transportation | 6.5% |
Others* (Individually Less Than 5%) | 8.4% |
| 100.0% |
* Includes net other assets |
See accompanying notes which are an integral part of the financial statements.
Annual Report
Statement of Assets and Liabilities
| December 31, 2012 |
| | |
Assets | | |
Investment in securities, at value - See accompanying schedule: Unaffiliated issuers (cost $499,430,874) | | $ 535,391,443 |
Cash | | 17,364,826 |
Receivable for fund shares sold | | 811,478 |
Interest receivable | | 6,716,020 |
Prepaid expenses | | 1,335 |
Other receivables | | 2,949 |
Total assets | | 560,288,051 |
| | |
Liabilities | | |
Payable for fund shares redeemed | $ 1,195,134 | |
Distributions payable | 422,724 | |
Accrued management fee | 169,986 | |
Other affiliated payables | 102,056 | |
Other payables and accrued expenses | 45,276 | |
Total liabilities | | 1,935,176 |
| | |
Net Assets | | $ 558,352,875 |
Net Assets consist of: | | |
Paid in capital | | $ 521,237,656 |
Undistributed net investment income | | 109,670 |
Accumulated undistributed net realized gain (loss) on investments | | 1,044,980 |
Net unrealized appreciation (depreciation) on investments | | 35,960,569 |
Net Assets, for 46,563,598 shares outstanding | | $ 558,352,875 |
Net Asset Value, offering price and redemption price per share ($558,352,875 ÷ 46,563,598 shares) | | $ 11.99 |
See accompanying notes which are an integral part of the financial statements.
Annual Report
Statement of Operations
| Year ended December 31, 2012 |
| | |
Investment Income | | |
Interest | | $ 19,487,127 |
| | |
Expenses | | |
Management fee | $ 1,987,500 | |
Transfer agent fees | 457,850 | |
Accounting fees and expenses | 136,382 | |
Custodian fees and expenses | 6,421 | |
Independent trustees' compensation | 1,990 | |
Registration fees | 42,547 | |
Audit | 49,773 | |
Legal | 5,153 | |
Miscellaneous | 4,144 | |
Total expenses before reductions | 2,691,760 | |
Expense reductions | (19,624) | 2,672,136 |
Net investment income (loss) | | 16,814,991 |
Realized and Unrealized Gain (Loss) Net realized gain (loss) on: | | |
Investment securities: | | |
Unaffiliated issuers | | 1,904,427 |
Change in net unrealized appreciation (depreciation) on investment securities | | 7,300,524 |
Net gain (loss) | | 9,204,951 |
Net increase (decrease) in net assets resulting from operations | | $ 26,019,942 |
See accompanying notes which are an integral part of the financial statements.
Annual Report
Financial Statements - continued
Statement of Changes in Net Assets
| Year ended
December 31,
2012 | Year ended
December 31,
2011 |
Increase (Decrease) in Net Assets | | |
Operations | | |
Net investment income (loss) | $ 16,814,991 | $ 17,307,768 |
Net realized gain (loss) | 1,904,427 | 2,028,016 |
Change in net unrealized appreciation (depreciation) | 7,300,524 | 23,563,920 |
Net increase (decrease) in net assets resulting
from operations | 26,019,942 | 42,899,704 |
Distributions to shareholders from net investment income | (16,764,965) | (17,313,267) |
Distributions to shareholders from net realized gain | (694,638) | (2,223,703) |
Total distributions | (17,459,603) | (19,536,970) |
Share transactions
Proceeds from sales of shares | 89,995,969 | 74,910,585 |
Reinvestment of distributions | 12,563,280 | 13,858,387 |
Cost of shares redeemed | (71,860,327) | (90,716,185) |
Net increase (decrease) in net assets resulting from share transactions | 30,698,922 | (1,947,213) |
Redemption fees | 1,313 | 4,082 |
Total increase (decrease) in net assets | 39,260,574 | 21,419,603 |
| | |
Net Assets | | |
Beginning of period | 519,092,301 | 497,672,698 |
End of period (including undistributed net investment income of $109,670 and undistributed net investment income of $39,589, respectively) | $ 558,352,875 | $ 519,092,301 |
Other Information Shares | | |
Sold | 7,511,037 | 6,529,176 |
Issued in reinvestment of distributions | 1,046,586 | 1,202,602 |
Redeemed | (5,994,406) | (7,968,872) |
Net increase (decrease) | 2,563,217 | (237,094) |
See accompanying notes which are an integral part of the financial statements.
Annual Report
Financial Highlights
Years ended December 31, | 2012 | 2011 | 2010 | 2009 | 2008 |
Selected Per-Share Data | | | | |
Net asset value, beginning of period | $ 11.80 | $ 11.25 | $ 11.38 | $ 10.74 | $ 11.22 |
Income from Investment Operations | | | | | |
Net investment income (loss) B | .371 | .403 | .393 | .403 | .430 |
Net realized and unrealized gain (loss) | .204 | .601 | (.115) | .648 | (.460) |
Total from investment operations | .575 | 1.004 | .278 | 1.051 | (.030) |
Distributions from net investment income | (.370) | (.403) | (.394) | (.404) | (.430) |
Distributions from net realized gain | (.015) | (.051) | (.014) | (.007) | (.020) |
Total distributions | (.385) | (.454) | (.408) | (.411) | (.450) |
Redemption fees added to paid in capital B, D | - | - | - | - | - |
Net asset value, end of period | $ 11.99 | $ 11.80 | $ 11.25 | $ 11.38 | $ 10.74 |
Total Return A | 4.91% | 9.09% | 2.42% | 9.89% | (.28)% |
Ratios to Average Net Assets C | | | | |
Expenses before reductions | .49% | .49% | .50% | .51% | .50% |
Expenses net of fee waivers, if any | .49% | .49% | .50% | .51% | .50% |
Expenses net of all reductions | .49% | .49% | .49% | .51% | .47% |
Net investment income (loss) | 3.09% | 3.50% | 3.41% | 3.59% | 3.91% |
Supplemental Data | | | | |
Net assets, end of period (000 omitted) | $ 558,353 | $ 519,092 | $ 497,673 | $ 473,438 | $ 372,276 |
Portfolio turnover rate | 15% | 9% | 13% | 7% | 9% |
A Total returns would have been lower if certain expenses had not been reduced during the applicable periods shown.
B Calculated based on average shares outstanding during the period.
C Expense ratios reflect operating expenses of the Fund. Expenses before reductions do not reflect amounts reimbursed by the investment adviser or reductions from expense offset arrangements and do not represent the amount paid by the Fund during periods when reimbursements or reductions occur. Expenses net of fee waivers reflect expenses after reimbursement by the investment adviser but prior to reductions from expense offset arrangements. Expenses net of all reductions represent the net expenses paid by the Fund.
D Amount represents less than $.001 per share.
See accompanying notes which are an integral part of the financial statements.
Annual Report
Notes to Financial Statements
For the period ended December 31, 2012
1. Organization.
Fidelity Minnesota Municipal Income Fund (the Fund) is a non-diversified fund of Fidelity Municipal Trust (the Trust) and is authorized to issue an unlimited number of shares. The Trust is registered under the Investment Company Act of 1940, as amended (the 1940 Act), as an open-end management investment company organized as a Massachusetts business trust. The Fund may be affected by economic and political developments in the state of Minnesota.
2. Significant Accounting Policies.
The financial statements have been prepared in conformity with accounting principles generally accepted in the United States of America (GAAP), which require management to make certain estimates and assumptions at the date of the financial statements. Actual results could differ from those estimates. Subsequent events, if any, through the date that the financial statements were issued have been evaluated in the preparation of the financial statements. The following summarizes the significant accounting policies of the Fund:
Investment Valuation. Investments are valued as of 4:00 p.m. Eastern time on the last calendar day of the period. In accordance with valuation policies and procedures approved by the Board of Trustees (the Board), the Fund attempts to obtain prices from one or more third party pricing vendors or brokers to value its investments. When current market prices, quotations or rates are not readily available or reliable, investments will be fair valued in good faith by the Fidelity Management & Research Company (FMR) Fair Value Committee (the Committee), in accordance with procedures adopted by the Board. Factors used in determining fair value vary by investment type and may include market or investment specific events, changes in interest rates and credit quality. The frequency with which these procedures are used cannot be predicted and they may be utilized to a significant extent. The Committee oversees the Fund's valuation policies and procedures and is responsible for approving and reporting to the Board all fair value determinations.
The Fund categorizes the inputs to valuation techniques used to value its investments into a disclosure hierarchy consisting of three levels as shown below:
Level 1 - quoted prices in active markets for identical investments
Level 2 - other significant observable inputs (including quoted prices for similar investments, interest rates, prepayment speeds, etc.)
Level 3 - unobservable inputs (including the Fund's own assumptions based on the best information available)
Annual Report
Notes to Financial Statements - continued
2. Significant Accounting Policies - continued
Investment Valuation - continued
Valuation techniques used to value the Fund's investments by major category are as follows:
Debt securities, including restricted securities, are valued based on evaluated prices received from third party pricing vendors or from brokers who make markets in such securities. For municipal securities, pricing vendors utilize matrix pricing which considers yield or price of bonds of comparable quality, coupon, maturity and type as well as broker-supplied prices and are generally categorized as Level 2 in the hierarchy. When independent prices are unavailable or unreliable, debt securities may be valued utilizing pricing methodologies which consider similar factors that would be used by third party pricing vendors. These are generally categorized as Level 2 in the hierarchy but may be Level 3 depending on the circumstances.
Changes in valuation techniques may result in transfers in or out of an assigned level within the disclosure hierarchy.
Investment Transactions and Income. For financial reporting purposes, the Fund's investment holdings and net asset value (NAV) include trades executed through the end of the last business day of the period. The NAV per share for processing shareholder transactions is calculated as of the close of business of the New York Stock Exchange (NYSE), normally 4:00 p.m. Eastern time and includes trades executed through the end of the prior business day. Gains and losses on securities sold are determined on the basis of identified cost. Interest income is accrued as earned. Interest income includes coupon interest and amortization of premium and accretion of discount on debt securities.
Expenses. Expenses directly attributable to a fund are charged to that fund. Expenses attributable to more than one fund are allocated among the respective funds on the basis of relative net assets or other appropriate methods. Expense estimates are accrued in the period to which they relate and adjustments are made when actual amounts are known.
Income Tax Information and Distributions to Shareholders. Each year, the Fund intends to qualify as a regulated investment company under Subchapter M of the Internal Revenue Code, including distributing substantially all of its taxable income and realized gains. As a result, no provision for income taxes is required. As of December 31, 2012, the Fund did not have any unrecognized tax benefits in the financial statements; nor is the Fund aware of any tax positions for which it is reasonably possible that the total amounts of unrecognized tax benefits will significantly change in the next twelve months. The Fund files a U.S. federal tax return, in addition to state and local tax returns as required. A fund's federal income tax returns are subject to examination by the Internal Revenue Service (IRS) for a period of three fiscal years after they are filed.
Annual Report
2. Significant Accounting Policies - continued
Income Tax Information and Distributions to Shareholders - continued
State and local tax returns may be subject to examination for an additional fiscal year depending on the jurisdiction.
Dividends are declared and recorded daily and paid monthly from net investment income. Distributions from realized gains, if any, are declared and recorded on the ex-dividend date. Income and capital gain distributions are determined in accordance with income tax regulations, which may differ from GAAP. In addition, the Fund claimed a portion of the payment made to redeeming shareholders as a distribution for income tax purposes.
Capital accounts within the financial statements are adjusted for permanent book-tax differences. These adjustments have no impact on net assets or the results of operations. Temporary book-tax differences will reverse in a subsequent period.
Book-tax differences are primarily due to market discount, deferred trustees compensation and losses deferred due to futures transactions.
The Fund purchases municipal securities whose interest, in the opinion of the issuer, is free from federal income tax. There is no assurance that the Internal Revenue Service (IRS) will agree with this opinion. In the event the IRS determines that the issuer does not comply with relevant tax requirements, interest payments from a security could become federally taxable, possibly retroactively to the date the security was issued.
The federal tax cost of investment securities and unrealized appreciation (depreciation) as of period end were as follows:
Gross unrealized appreciation | $ 36,565,164 |
Gross unrealized depreciation | (604,595) |
Net unrealized appreciation (depreciation) on securities and other investments | $ 35,960,569 |
| |
Tax Cost | $ 499,430,874 |
The tax-based components of distributable earnings as of period end were as follows:
Undistributed tax-exempt income | $ 110,032 |
Undistributed ordinary income | $ 227,970 |
Undistributed long-term capital gain | $ 859,311 |
Net unrealized appreciation (depreciation) | $ 35,960,569 |
Annual Report
Notes to Financial Statements - continued
2. Significant Accounting Policies - continued
Income Tax Information and Distributions to Shareholders - continued
The tax character of distributions paid was as follows:
| December 31, 2012 | December 31, 2011 |
Tax-exempt Income | $ 16,764,965 | $ 17,313,267 |
Long-term Capital Gains | 694,638 | 2,223,703 |
Total | $ 17,459,603 | $ 19,536,970 |
Short-Term Trading (Redemption) Fees. Shares held by investors in the Fund less than 30 days are subject to a redemption fee equal to .50% of the net asset value of shares redeemed. All redemption fees, which reduce the proceeds of the shareholder redemption, are retained by the Fund and accounted for as an addition to paid in capital.
3. Purchases and Sales of Investments.
Purchases and sales of securities, other than short-term securities, aggregated $95,212,535 and $75,908,810, respectively.
4. Fees and Other Transactions with Affiliates.
Management Fee. FMR and its affiliates provide the Fund with investment management related services for which the Fund pays a monthly management fee. The management fee is the sum of an individual fund fee rate that is based on an annual rate of .25% of the Fund's average net assets and an annualized group fee rate that averaged .12% during the period. The group fee rate is based upon the average net assets of all the mutual funds advised by FMR. The group fee rate decreases as assets under management increase and increases as assets under management decrease. For the period, the total annual management fee rate was .37% of the Fund's average net assets.
Transfer Agent and Accounting Fees. Citibank, N.A. (Citibank) is the custodian, transfer agent and servicing agent for the Fund. Citibank has entered into a sub-arrangement with Fidelity Investments Institutional Operations Company, Inc. (FIIOC), an affiliate of FMR, under which FIIOC performs the activities associated with the Fund's transfer agency, dividend disbursing and shareholder servicing functions. The Fund pays Citibank account fees and asset-based fees that vary according to account size and type of account. FIIOC pays for typesetting, printing and mailing of shareholder reports, except proxy statements. For the period, transfer agent fees were equivalent to an annual rate of .08% of average net assets.
Citibank also has a sub-arrangement with Fidelity Service Company, Inc. (FSC), an affiliate of FMR, under which FSC maintains the Fund's accounting records. The fee is paid to Citibank and is based on the level of average net assets for each month.
Annual Report
5. Committed Line of Credit.
The Fund participates with other funds managed by FMR or an affiliate in a $4.25 billion credit facility (the "line of credit") to be utilized for temporary or emergency purposes to fund shareholder redemptions or for other short-term liquidity purposes. The Fund has agreed to pay commitment fees on its pro-rata portion of the line of credit, which amounted to $1,462 and is reflected in Miscellaneous expenses on the Statement of Operations. During the period, there were no borrowings on this line of credit.
6. Expense Reductions.
Through arrangements with the Fund's custodian, credits realized as a result of uninvested cash balances were used to reduce the Fund's expenses. During the period, these credits reduced the Fund's custody, transfer agent and accounting expenses by $6,050 and $13,570 and $4, respectively.
7. Other.
The Fund's organizational documents provide former and current trustees and officers with a limited indemnification against liabilities arising in connection with the performance of their duties to the Fund. In the normal course of business, the Fund may also enter into contracts that provide general indemnifications. The Fund's maximum exposure under these arrangements is unknown as this would be dependent on future claims that may be made against the Fund. The risk of material loss from such claims is considered remote.
Annual Report
To the Trustees of Fidelity Municipal Trust and the Shareholders of Fidelity Minnesota Municipal Income Fund:
In our opinion, the accompanying statement of assets and liabilities, including the schedule of investments, and the related statements of operations and of changes in net assets and the financial highlights present fairly, in all material respects, the financial position of Fidelity Minnesota Municipal Income Fund (a fund of Fidelity Municipal Trust) at December 31, 2012, the results of its operations for the year then ended, the changes in its net assets for each of the two years in the period then ended and the financial highlights for each of the five years in the period then ended, in conformity with accounting principles generally accepted in the United States of America. These financial statements and financial highlights (hereafter referred to as "financial statements") are the responsibility of the Fidelity Minnesota Municipal Income Fund's management. Our responsibility is to express an opinion on these financial statements based on our audits. We conducted our audits of these financial statements in accordance with the standards of the Public Company Accounting Oversight Board (United States). Those standards require that we plan and perform the audit to obtain reasonable assurance about whether the financial statements are free of material misstatement. An audit includes examining, on a test basis, evidence supporting the amounts and disclosures in the financial statements, assessing the accounting principles used and significant estimates made by management, and evaluating the overall financial statement presentation. We believe that our audits, which included confirmation of securities at December 31, 2012 by correspondence with the custodian and brokers, provide a reasonable basis for our opinion.
PricewaterhouseCoopers LLP
Boston, Massachusetts
February 11, 2013
Annual Report
The Trustees and executive officers of the trust and fund, as applicable, are listed below. The Board of Trustees governs the fund and is responsible for protecting the interests of shareholders. The Trustees are experienced executives who meet periodically throughout the year to oversee the fund's activities, review contractual arrangements with companies that provide services to the fund, oversee management of the risks associated with such activities and contractual arrangements, and review the fund's performance. Except for James C. Curvey and Elizabeth S. Acton, each of the Trustees oversees 218 funds advised by FMR or an affiliate. Mr. Curvey oversees 452 funds advised by FMR or an affiliate. Ms. Acton oversees 200 funds advised by FMR or an affiliate.
The Trustees hold office without limit in time except that (a) any Trustee may resign; (b) any Trustee may be removed by written instrument, signed by at least two-thirds of the number of Trustees prior to such removal; (c) any Trustee who requests to be retired or who has become incapacitated by illness or injury may be retired by written instrument signed by a majority of the other Trustees; and (d) any Trustee may be removed at any special meeting of shareholders by a two-thirds vote of the outstanding voting securities of the trust. Each Trustee who is not an interested person (as defined in the 1940 Act) (Independent Trustee), shall retire not later than the last day of the month in which his or her 75th birthday occurs. The Independent Trustees may waive this mandatory retirement age policy with respect to individual Trustees. The executive officers hold office without limit in time, except that any officer may resign or may be removed by a vote of a majority of the Trustees at any regular meeting or any special meeting of the Trustees. Except as indicated, each individual has held the office shown or other offices in the same company for the past five years.
Experience, Skills, Attributes, and Qualifications of the Fund's Trustees. The Governance and Nominating Committee has adopted a statement of policy that describes the experience, qualifications, attributes, and skills that are necessary and desirable for potential Independent Trustee candidates (Statement of Policy). The Board believes that each Trustee satisfied at the time he or she was initially elected or appointed a Trustee, and continues to satisfy, the standards contemplated by the Statement of Policy. The Governance and Nominating Committee also engages professional search firms to help identify potential Independent Trustee candidates who have the experience, qualifications, attributes, and skills consistent with the Statement of Policy. From time to time, additional criteria based on the composition and skills of the current Independent Trustees, as well as experience or skills that may be appropriate in light of future changes to board composition, business conditions, and regulatory or other developments, have also been considered by the professional search firms and the Governance and Nominating Committee. In addition, the Board takes into account the Trustees' commitment and participation in Board and committee meetings, as well as their leadership of standing and ad hoc committees throughout their tenure.
In determining that a particular Trustee was and continues to be qualified to serve as a Trustee, the Board has considered a variety of criteria, none of which, in isolation, was controlling. The Board believes that, collectively, the Trustees have balanced and diverse experience, qualifications, attributes, and skills, which allow the Board to operate effectively in governing the fund and protecting the interests of shareholders. Information about the specific experience, skills, attributes, and qualifications of each Trustee, which in each case led to the Board's conclusion that the Trustee should serve (or continue to serve) as a trustee of the fund, is provided below.
Annual Report
Board Structure and Oversight Function. Abigail P. Johnson is an interested person (as defined in the 1940 Act) and currently serves as Chairman. The Trustees have determined that an interested Chairman is appropriate and benefits shareholders because an interested Chairman has a personal and professional stake in the quality and continuity of services provided to the fund. Independent Trustees exercise their informed business judgment to appoint an individual of their choosing to serve as Chairman, regardless of whether the Trustee happens to be independent or a member of management. The Independent Trustees have determined that they can act independently and effectively without having an Independent Trustee serve as Chairman and that a key structural component for assuring that they are in a position to do so is for the Independent Trustees to constitute a substantial majority for the Board. The Independent Trustees also regularly meet in executive session. Albert R. Gamper, Jr. serves as Chairman of the Independent Trustees and as such (i) acts as a liaison between the Independent Trustees and management with respect to matters important to the Independent Trustees and (ii) with management prepares agendas for Board meetings.
Fidelity funds are overseen by different Boards of Trustees. The fund's Board oversees Fidelity's investment-grade bond, money market, and asset allocation funds and another Board oversees Fidelity's equity and high income funds. The asset allocation funds may invest in Fidelity funds that are overseen by such other Board. The use of separate Boards, each with its own committee structure, allows the Trustees of each group of Fidelity funds to focus on the unique issues of the funds they oversee, including common research, investment, and operational issues. On occasion, the separate Boards establish joint committees to address issues of overlapping consequences for the Fidelity funds overseen by each Board.
The Trustees operate using a system of committees to facilitate the timely and efficient consideration of all matters of importance to the Trustees, the fund, and fund shareholders and to facilitate compliance with legal and regulatory requirements and oversight of the fund's activities and associated risks. The Board, acting through its committees, has charged FMR and its affiliates with (i) identifying events or circumstances the occurrence of which could have demonstrably adverse effects on the fund's business and/or reputation; (ii) implementing processes and controls to lessen the possibility that such events or circumstances occur or to mitigate the effects of such events or circumstances if they do occur; and (iii) creating and maintaining a system designed to evaluate continuously business and market conditions in order to facilitate the identification and implementation processes described in (i) and (ii) above. Because the day-to-day operations and activities of the fund are carried out by or through FMR, its affiliates and other service providers, the fund's exposure to risks is mitigated but not eliminated by the processes overseen by the Trustees. While each of the Board's committees has responsibility for overseeing different aspects of the fund's activities, oversight is exercised primarily through the Operations and Audit Committees. In addition, an ad hoc Board committee of Independent Trustees has worked with FMR to enhance the Board's oversight of investment and financial risks, legal and regulatory risks, technology risks, and operational risks, including the development of additional risk reporting to the Board. Appropriate personnel, including but not limited to the fund's Chief Compliance Officer (CCO), FMR's internal auditor, the independent accountants, the fund's Treasurer and portfolio management personnel, make periodic reports to the Board's committees, as appropriate, including an annual review of FMR's risk management program for the Fidelity funds. The responsibilities of each standing committee, including their oversight responsibilities, are described further under "Standing Committees of the Fund's Trustees."
Annual Report
Trustees and Officers - continued
The fund's Statement of Additional Information (SAI) includes more information about the Trustees. To request a free copy, call Fidelity at 1-800-544-8544.
Interested Trustees*:
Correspondence intended for each Trustee who is an interested person may be sent to Fidelity Investments, 82 Devonshire Street, Boston, Massachusetts 02109.
Name, Age; Principal Occupations and Other Relevant Experience+ |
Abigail P. Johnson (51) |
| Year of Election or Appointment: 2009 Ms. Johnson is Trustee and Chairman of the Board of Trustees of certain Trusts. Ms. Johnson serves as President of Fidelity Financial Services (2012-present) and President of Personal, Workplace and Institutional Services (2005-present). Ms. Johnson is Chairman and Director of FMR Co., Inc. (2011-present), Chairman and Director of FMR (2011-present), and the Vice Chairman and Director (2007-present) of FMR LLC. Previously, Ms. Johnson served as President and a Director of FMR (2001-2005), a Trustee of other investment companies advised by FMR, Fidelity Investments Money Management, Inc., and FMR Co., Inc. (2001-2005), Senior Vice President of the Fidelity funds (2001-2005), and managed a number of Fidelity funds. Ms. Abigail P. Johnson and Mr. Arthur E. Johnson are not related. |
James C. Curvey (77) |
| Year of Election or Appointment: 2007 Mr. Curvey also serves as Trustee (2007-present) of other investment companies advised by FMR. Mr. Curvey is a Director of Fidelity Investments Money Management, Inc. (2009-present), Director of Fidelity Research & Analysis Co. (2009-present) and Director of FMR and FMR Co., Inc. (2007-present). Mr. Curvey is also Vice Chairman (2007-present) and Director of FMR LLC. In addition, Mr. Curvey serves as an Overseer for the Boston Symphony Orchestra and a member of the Trustees of Villanova University. Previously, Mr. Curvey was the Vice Chairman (2006-2007) and Director (2000-2007) of FMR Corp. |
* Trustees have been determined to be "Interested Trustees" by virtue of, among other things, their affiliation with the trust or various entities under common control with FMR.
+ The information above includes each Trustee's principal occupation during the last five years and other information relating to the experience, attributes, and skills relevant to each Trustee's qualifications to serve as a Trustee, which led to the conclusion that each Trustee should serve as a Trustee for the fund.
Independent Trustees:
Correspondence intended for each Independent Trustee (that is, the Trustees other than the Interested Trustees) may be sent to Fidelity Investments, P.O. Box 55235, Boston, Massachusetts 02205-5235.
Name, Age; Principal Occupations and Other Relevant Experience+ |
Elizabeth S. Acton (61) |
| Year of Election or Appointment: 2013 Ms. Acton is Trustee of certain Trusts. Prior to her retirement in April 2012, Ms. Acton was Executive Vice President, Finance (November 2011-April 2012), Executive Vice President, Chief Financial Officer (April 2002-November 2011), and Treasurer (May 2004-May 2005) of Comerica Incorporated (financial services). Prior to joining Comerica, Ms. Acton held a variety of positions at Ford Motor Company (1983-2002), including Vice President and Treasurer (2000-2002) and Executive Vice President and Chief Financial Officer of Ford Motor Credit Company (1998-2000). Ms. Acton currently serves as a member of the Board of Directors and Audit and Finance Committees of Beazer Homes USA, Inc. (homebuilding, 2012-present). |
Albert R. Gamper, Jr. (70) |
| Year of Election or Appointment: 2006 Mr. Gamper is Chairman of the Independent Trustees of the Fixed Income and Asset Allocation Funds (2012-present). Prior to his retirement in December 2004, Mr. Gamper served as Chairman of the Board of CIT Group Inc. (commercial finance). During his tenure with CIT Group Inc. Mr. Gamper served in numerous senior management positions, including Chairman (1987-1989; 1999-2001; 2002-2004), Chief Executive Officer (1987-2004), and President (2002-2003). Mr. Gamper currently serves as a member of the Board of Directors of Public Service Enterprise Group (utilities, 2000-present), a member of the Board of Trustees, Rutgers University (2004-present), and Chairman of the Board of Barnabas Health Care System. Previously, Mr. Gamper served as Vice Chairman of the Independent Trustees of the Fixed Income and Asset Allocation Funds (2011-2012) and as Chairman of the Board of Governors, Rutgers University (2004-2007). |
Robert F. Gartland (61) |
| Year of Election or Appointment: 2010 Mr. Gartland is Chairman and an investor in Gartland and Mellina Group Corp. (consulting, 2009-present). Previously, Mr. Gartland served as a partner and investor of Vietnam Partners LLC (investments and consulting, 2008-2011). Prior to his retirement, Mr. Gartland held a variety of positions at Morgan Stanley (financial services, 1979-2007) including Managing Director (1987-2007). |
Arthur E. Johnson (65) |
| Year of Election or Appointment: 2008 Mr. Johnson serves as a member of the Board of Directors of Eaton Corporation (diversified power management, 2009-present), AGL Resources, Inc. (holding company, 2002-present) and Booz Allen Hamilton (management consulting, 2011-present). Prior to his retirement, Mr. Johnson served as Senior Vice President of Corporate Strategic Development of Lockheed Martin Corporation (defense contractor, 1999-2009). He previously served on the Board of Directors of IKON Office Solutions, Inc. (1999-2008) and Delta Airlines (2005-2007). Mr. Arthur E. Johnson is not related to Ms. Abigail P. Johnson. |
Michael E. Kenneally (58) |
| Year of Election or Appointment: 2009 Previously, Mr. Kenneally served as a Member of the Advisory Board for certain Fidelity Fixed Income and Asset Allocation Funds (2008-2009). Prior to his retirement, Mr. Kenneally served as Chairman and Global Chief Executive Officer of Credit Suisse Asset Management (2003-2005). Mr. Kenneally was a Director of the Credit Suisse Funds (U.S. mutual funds, 2004-2008) and certain other closed-end funds (2004-2005) and was awarded the Chartered Financial Analyst (CFA) designation in 1991. |
James H. Keyes (72) |
| Year of Election or Appointment: 2007 Mr. Keyes serves as a member of the Boards of Navistar International Corporation (manufacture and sale of trucks, buses, and diesel engines, since 2002) and Pitney Bowes, Inc. (integrated mail, messaging, and document management solutions, since 1998). Prior to his retirement, Mr. Keyes served as Chairman and Chief Executive Officer of Johnson Controls (automotive, building, and energy, 1998-2002) and as a member of the Board of LSI Logic Corporation (semiconductor technologies, 1984-2008). |
Marie L. Knowles (66) |
| Year of Election or Appointment: 2001 Ms. Knowles is Vice Chairman of the Independent Trustees of the Fixed Income and Asset Allocation Funds (2012-present). Prior to Ms. Knowles' retirement in June 2000, she served as Executive Vice President and Chief Financial Officer of Atlantic Richfield Company (ARCO) (diversified energy, 1996-2000). From 1993 to 1996, she was a Senior Vice President of ARCO and President of ARCO Transportation Company. She served as a Director of ARCO from 1996 to 1998. Ms. Knowles currently serves as a Director and Chairman of the Audit Committee of McKesson Corporation (healthcare service, since 2002). Ms. Knowles is an Honorary Trustee of the Brookings Institution and a member of the Board of the Catalina Island Conservancy and of the Santa Catalina Island Company (2009-present). She also serves as a member of the Advisory Board for the School of Engineering of the University of Southern California and the Foundation Board of the School of Architecture at the University of Virginia (2007-present). Previously, Ms. Knowles served as a Director of Phelps Dodge Corporation (copper mining and manufacturing, 1994-2007). |
Kenneth L. Wolfe (73) |
| Year of Election or Appointment: 2005 Prior to his retirement, Mr. Wolfe served as Chairman and a Director (2007-2009) and Chairman and Chief Executive Officer (1994-2001) of Hershey Foods Corporation. He also served as a member of the Boards of Adelphia Communications Corporation (telecommunications, 2003-2006), Bausch & Lomb, Inc. (medical/pharmaceutical, 1993-2007), and Revlon, Inc. (personal care products, 2004-2009). Mr. Wolfe previously served as Chairman of the Independent Trustees of the Fixed Income and Asset Allocation Funds (2008-2012). |
+ The information above includes each Trustee's principal occupation during the last five years and other information relating to the experience, attributes, and skills relevant to each Trustee's qualifications to serve as a Trustee, which led to the conclusion that each Trustee should serve as a Trustee for the fund.
Executive Officers:
Correspondence intended for each executive officer may be sent to Fidelity Investments, 82 Devonshire Street, Boston, Massachusetts 02109.
Name, Age; Principal Occupation |
Stephanie J. Dorsey (43) |
| Year of Election or Appointment: 2013 President and Treasurer of Fidelity's Fixed Income and Asset Allocation Funds. Ms. Dorsey also serves as Assistant Treasurer of other Fidelity funds (2010-present) and is an employee of Fidelity Investments (2008-present). Previously, Ms. Dorsey served as Deputy Treasurer of Fidelity's Fixed Income and Asset Allocation Funds (2008-2013), Treasurer (2004-2008) of the JPMorgan Mutual Funds and Vice President (2004-2008) of JPMorgan Chase Bank. |
Charles S. Morrison (52) |
| Year of Election or Appointment: 2012 Vice President of Fidelity's Fixed Income and Asset Allocation Funds. Mr. Morrison also serves as President, Fixed Income and is an employee of Fidelity Investments. Previously, Mr. Morrison served as Vice President of Fidelity's Money Market Funds (2005-2009), President, Money Market Group Leader of FMR (2009), and Senior Vice President, Money Market Group of FMR (2004-2009). Mr. Morrison also served as Vice President of Fidelity's Bond Funds (2002-2005), certain Balanced Funds (2002-2005), and certain Asset Allocation Funds (2002-2007), and as Senior Vice President (2002-2005) of Fidelity's Fixed Income Division. |
Robert P. Brown (49) |
| Year of Election or Appointment: 2012 Vice President of Fidelity's Bond Funds. Mr. Brown also serves as Executive Vice President of Fidelity Investments Money Management, Inc. (2010-present), President, Bond Group of FMR (2011-present), Director and Managing Director, Research of Fidelity Management & Research (U.K.) Inc. (2008-present) and is an employee of Fidelity Investments. Previously, Mr. Brown served as President, Money Market Group of FMR (2010-2011) and Vice President of Fidelity's Money Market Funds (2010-2012). |
Scott C. Goebel (44) |
| Year of Election or Appointment: 2008 Secretary and Chief Legal Officer (CLO) of the Fidelity funds. Mr. Goebel also serves as Secretary of Fidelity Investments Money Management, Inc. (FIMM) (2010-present) and Fidelity Research and Analysis Company (FRAC) (2010-present); Secretary and CLO of The North Carolina Capital Management Trust: Cash and Term Portfolios (2008-present); General Counsel, Secretary, and Senior Vice President of FMR (2008-present) and FMR Co., Inc. (2008-present); employed by FMR LLC or an affiliate (2001-present); Chief Legal Officer of Fidelity Management & Research (Hong Kong) Limited (2008-present) and Assistant Secretary of Fidelity Management & Research (Japan) Inc. (2008-present), and Fidelity Management & Research (U.K.) Inc. (2008-present). Previously, Mr. Goebel served as Assistant Secretary of FIMM (2008-2010), FRAC (2008-2010), and the Funds (2007-2008) and as Vice President and Secretary of Fidelity Distributors Corporation (FDC) (2005-2007). |
Ramon Herrera (38) |
| Year of Election or Appointment: 2012 Assistant Secretary of Fidelity's Fixed Income and Asset Allocation Funds. Mr. Herrera also serves as Vice President, Associate General Counsel (2010-present) and is an employee of Fidelity Investments (2004-present). |
Elizabeth Paige Baumann (44) |
| Year of Election or Appointment: 2012 Anti-Money Laundering (AML) Officer of the Fidelity funds. Ms. Baumann also serves as AML Officer of The North Carolina Capital Management Trust: Cash and Term Portfolios (2012-present), Chief AML Officer of FMR LLC (2012-present), and is an employee of Fidelity Investments. Previously, Ms. Baumann served as Vice President and Deputy Anti-Money Laundering Officer (2007-2012). |
Christine Reynolds (54) |
| Year of Election or Appointment: 2008 Chief Financial Officer of the Fidelity funds. Ms. Reynolds became President of Fidelity Pricing and Cash Management Services (FPCMS) in August 2008. Ms. Reynolds served as Chief Operating Officer of FPCMS (2007-2008). Previously, Ms. Reynolds served as President, Treasurer, and Anti-Money Laundering officer of the Fidelity funds (2004-2007). |
Michael H. Whitaker (45) |
| Year of Election or Appointment: 2008 Chief Compliance Officer of Fidelity's Fixed Income and Asset Allocation Funds. Mr. Whitaker also serves as Chief Compliance Officer of The North Carolina Capital Management Trust: Cash and Term Portfolios (2008-present). Mr. Whitaker is an employee of Fidelity Investments (2007-present). Prior to joining Fidelity Investments, Mr. Whitaker worked at MFS Investment Management where he served as Senior Vice President and Chief Compliance Officer (2004-2006), and Assistant General Counsel. |
Joseph F. Zambello (55) |
| Year of Election or Appointment: 2011 Deputy Treasurer of the Fidelity funds. Mr. Zambello is an employee of Fidelity Investments. Previously, Mr. Zambello served as Vice President of FMR's Program Management Group (2009-2011) and Vice President of the Transfer Agent Oversight Group (2005-2009). |
Stephen Sadoski (41) |
| Year of Election or Appointment: 2013 Deputy Treasurer of Fidelity's Fixed Income and Asset Allocation Funds. Mr. Sadoski also serves as Deputy Treasurer of other Fidelity funds (2012-present) and is an employee of Fidelity Investments (2012-present). Previously, Mr. Sadoski served as Assistant Treasurer of Fidelity's Fixed Income and Asset Allocation Funds (2012-2013), an assistant chief accountant in the Division of Investment Management of the Securities and Exchange Commission (SEC) (2009-2012) and as a senior manager at Deloitte & Touche (1997-2009). |
Adrien E. Deberghes (45) |
| Year of Election or Appointment: 2010 Assistant Treasurer of Fidelity's Fixed Income and Asset Allocation Funds. Mr. Deberghes also serves as Vice President and Assistant Treasurer (2011-present) and Deputy Treasurer (2008-present) of other Fidelity funds, and is an employee of Fidelity Investments (2008-present). Previously, Mr. Deberghes served as Senior Vice President of Mutual Fund Administration at State Street Corporation (2007-2008), Senior Director of Mutual Fund Administration at Investors Bank & Trust (2005-2007), and Director of Finance for Dunkin' Brands (2000-2005). |
Kenneth B. Robins (43) |
| Year of Election or Appointment: 2009 Assistant Treasurer of the Fidelity Fixed Income and Asset Allocation Funds. Mr. Robins also serves as President and Treasurer of other Fidelity funds (2008-present; 2010-present) and is an employee of Fidelity Investments (2004-present). Previously, Mr. Robins served as Deputy Treasurer of the Fidelity funds (2005-2008) and Treasurer and Chief Financial Officer of The North Carolina Capital Management Trust: Cash and Term Portfolios (2006-2008). |
Gary W. Ryan (54) |
| Year of Election or Appointment: 2005 Assistant Treasurer of the Fidelity funds. Mr. Ryan is an employee of Fidelity Investments. Previously, Mr. Ryan served as Vice President of Fund Reporting in Fidelity Pricing and Cash Management Services (FPCMS) (1999-2005). |
Jonathan Davis (44) |
| Year of Election or Appointment: 2010 Assistant Treasurer of the Fidelity funds. Mr. Davis is also Assistant Treasurer of Fidelity Rutland Square Trust II and Fidelity Commonwealth Trust II. Mr. Davis is an employee of Fidelity Investments. Previously, Mr. Davis served as Vice President and Associate General Counsel of FMR LLC (2003-2010). |
Annual Report
The Board of Trustees of Fidelity Minnesota Municipal Income Fund voted to pay on February 11, 2013, to shareholders of record at the opening of business on February 8, 2013, a distribution of $0.025 per share derived from capital gains realized from sales of portfolio securities.
The fund hereby designates as a capital gain dividend with respect to the taxable year ended December 31, 2012, $1,553,950, or, if subsequently determined to be different, the net capital gain of such year.
During fiscal year ended 2012, 100% of the fund's income dividends was free from federal income tax, and 1.44% of the fund's income dividends was subject to the federal alternative minimum tax.
The fund will notify shareholders in January 2013 of amounts for use in preparing 2012 income tax returns.
Annual Report
Board Approval of Investment Advisory Contracts and Management Fees
Fidelity Minnesota Municipal Income Fund
Each year, the Board of Trustees, including the Independent Trustees (together, the Board), votes on the renewal of the management contract and sub-advisory agreements (together, the Advisory Contracts) for the fund. The Board, assisted by the advice of fund counsel and Independent Trustees' counsel, requests and considers a broad range of information relevant to the renewal of the Advisory Contracts throughout the year.
The Board meets regularly and, at each of its meetings, covers an extensive agenda of topics and materials and considers factors that are relevant to its annual consideration of the renewal of the fund's Advisory Contracts, including the services and support provided to the fund and its shareholders. The Board has established three standing committees, Operations, Audit, and Governance and Nominating, each composed of and chaired by Independent Trustees with varying backgrounds, to which the Board has assigned specific subject matter responsibilities in order to enhance effective decision-making by the Board. The Operations Committee, of which all of the Independent Trustees are members, meets regularly throughout the year and, among other matters, considers matters specifically related to the annual consideration of the renewal of the fund's Advisory Contracts. The Board, acting directly and through its Committees, requests and receives information concerning the annual consideration of the renewal of the fund's Advisory Contracts. The Board also meets as needed to consider matters specifically related to the Board's annual consideration of the renewal of Advisory Contracts. Members of the Board may also meet with trustees of other Fidelity funds through ad hoc joint committees to discuss certain matters relevant to the Fidelity funds.
At its September 2012 meeting, the Board of Trustees, including the Independent Trustees, unanimously determined to renew the fund's Advisory Contracts. In reaching its determination, the Board considered all factors it believed relevant, including (i) the nature, extent, and quality of the services to be provided to the fund and its shareholders (including the investment performance of the fund); (ii) the competitiveness of the fund's management fee and total expense ratio relative to peer funds; (iii) the total costs of the services to be provided by and the profits to be realized by Fidelity from its relationship with the fund; (iv) the extent to which economies of scale exist and would be realized as the fund grows; and (v) whether fee levels reflect these economies of scale, if any, for the benefit of fund shareholders.
In considering whether to renew the Advisory Contracts for the fund, the Board reached a determination, with the assistance of fund counsel and Independent Trustees' counsel and through the exercise of its business judgment, that the renewal of the Advisory Contracts is in the best interests of the fund and its shareholders and that the compensation payable under the Advisory Contracts is fair and reasonable. The Board's decision to renew the Advisory Contracts was not based on any single factor, but rather was based on a comprehensive consideration of all the information provided to the Board at its meetings throughout the year. The Board, in reaching its determination to renew the Advisory Contracts, was aware that shareholders in the fund have a broad range of investment choices available to them, including a wide choice among mutual funds offered by Fidelity's competitors, and that the fund's shareholders, who have the opportunity to review and weigh the disclosure provided by the fund in its prospectus and other public disclosures, have chosen to invest in this fund, managed by Fidelity.
Annual Report
Board Approval of Investment Advisory Contracts and
Management Fees - continued
Nature, Extent, and Quality of Services Provided. The Board considered the staffing within the investment adviser, FMR, and the sub-advisers (together, the Investment Advisers), including the backgrounds of the fund's investment personnel, and also considered the fund's investment objective, strategies, and related investment philosophy. The Independent Trustees also had discussions with senior management of Fidelity's investment operations and investment groups. The Board considered the structure of the portfolio manager compensation program and whether this structure provides appropriate incentives to act in the best interests of the fund.
Resources Dedicated to Investment Management and Support Services. The Board reviewed the general qualifications and capabilities of the Investment Advisers' investment staff, including its size, education, experience, and resources, as well as the Investment Advisers' approach to recruiting, managing, and compensating investment personnel. The Board also noted that FMR has continued to increase the resources devoted to non-U.S. offices, including expansion of Fidelity's global investment organization. The Board noted that Fidelity's analysts have extensive resources, tools and capabilities that allow them to conduct sophisticated quantitative and fundamental analysis, as well as credit analysis of issuers, counterparties and guarantors. The Board also believes that Fidelity's investment professionals have sufficient access to global information and data so as to provide competitive investment results over time, and that those professionals also have access to sophisticated tools that permit them to assess portfolio construction and risk and performance attribution characteristics continuously, as well as to transmit new information and research conclusions rapidly around the world. Additionally, in its deliberations, the Board considered the Investment Advisers' trading and risk management capabilities and resources, which are an integral part of the investment management process.
Shareholder and Administrative Services. The Board considered (i) the nature, extent, quality, and cost of advisory, administrative, and shareholder services performed by the Investment Advisers and their affiliates under the Advisory Contracts and under separate agreements covering transfer agency and pricing and bookkeeping services for the fund; (ii) the nature and extent of the supervision of third party service providers, principally custodians and subcustodians; and (iii) the resources devoted to, and the record of compliance with, the fund's compliance policies and procedures.
Annual Report
The Board noted that the growth of fund assets over time across the complex allows Fidelity to reinvest in the development of services designed to enhance the value or convenience of the Fidelity funds as investment vehicles. These services include 24-hour access to account information and market information through telephone representatives and over the Internet, investor education materials and asset allocation tools, and the expanded availability of Fidelity Investor Centers.
Investment in a Large Fund Family. The Board considered the benefits to shareholders of investing in a Fidelity fund, including the benefits of investing in a fund that is part of a large family of funds offering a variety of investment disciplines and providing a large variety of mutual fund investor services. The Board noted that Fidelity had taken, or had made recommendations that resulted in the Fidelity funds taking, a number of actions over the previous year that benefited particular funds, including (i) continuing to dedicate additional resources to investment research and support of the senior management team that oversees asset management; (ii) persisting in efforts to enhance Fidelity's research capabilities, in particular, international research; (iii) launching new funds and making other enhancements to meet client needs for global and income-oriented solutions; (iv) continuing to launch dedicated lower cost underlying funds to meet investment management's portfolio construction needs related to expanding underlying fund options, specifically for the Freedom Fund product lines; (v) adopting a sector neutral investment approach for certain funds and utilizing a team of portfolio managers to manage certain sector-neutral funds; (vi) rationalizing product lines and gaining increased efficiencies through combinations of several funds with other funds; (vii) strengthening the Spartan Index Fund product line by adding new funds and/or new low-cost institutional share classes, restructuring fund expenses to accommodate new classes, and reducing investment minimums for certain classes of shares; (viii) modifying the eligibility criteria for Institutional Class shares to increase their appeal to government entities and charitable investors; and (ix) reducing certain transfer agent fee rates.
Investment Performance. The Board considered whether the fund has operated in accordance with its investment objective, as well as its record of compliance with its investment restrictions. It also reviewed the fund's absolute investment performance, as well as the fund's relative investment performance measured over multiple periods against (i) a broad-based securities market index, and (ii) a peer group of mutual funds deemed appropriate by Fidelity and reviewed by the Board. The following charts considered by the Board show, over the one-, three-, and five-year periods ended December 31, 2011, the fund's cumulative total returns, the cumulative total returns of a broad-based securities market index ("benchmark"), and a range of cumulative total returns of a peer group of mutual funds identified by Lipper Inc. as having an investment objective similar to that of the fund. The box within each chart shows the 25th percentile return (top of box) and the 75th percentile return (bottom of box) of the peer group. Returns shown above the box are in the first quartile and returns shown below the box are in the fourth quartile. The percentage beaten number noted below each chart corresponds to the percentile box and represents the percentage of funds in the peer group whose performance was equal to or lower than that of the fund.
Annual Report
Board Approval of Investment Advisory Contracts and
Management Fees - continued
Fidelity Minnesota Municipal Income Fund
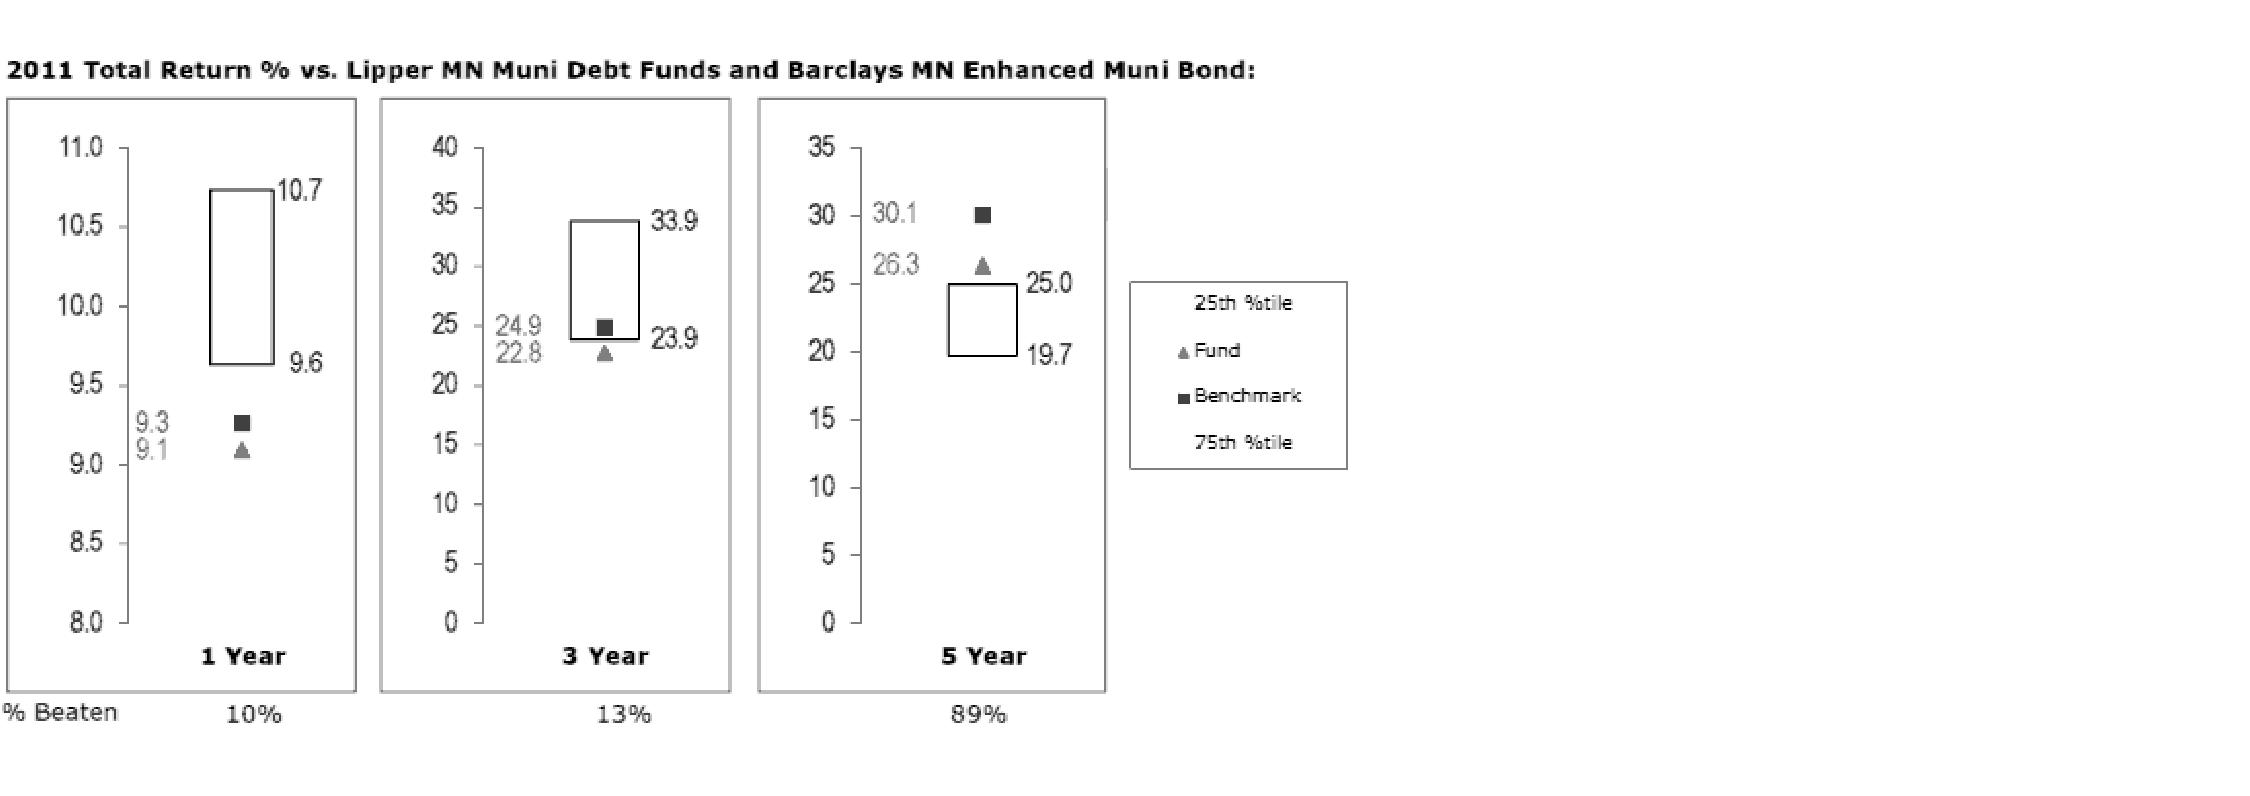
The Board reviewed the fund's relative investment performance against its peer group and noted that the performance of the fund was in the fourth quartile for the one- and three-year periods and the first quartile for the five-year period. The Board also noted that the investment performance of the fund was lower than its benchmark for all the periods shown. The Board discussed with FMR actions to improve the fund's disappointing performance. The Board noted that this fund had underperformed in the past and discussed with FMR its disappointment with the continued underperformance of the fund. The Board also reviewed the fund's performance since inception as well as performance in the current year. The Board will continue to closely monitor the performance of the fund in the coming year and discuss with FMR other appropriate actions to address the performance of the fund.
Based on its review, the Board concluded that the nature, extent, and quality of services provided to the fund under the Advisory Contracts should benefit the fund's shareholders.
Competitiveness of Management Fee and Total Expense Ratio. The Board considered the fund's management fee and total expense ratio compared to "mapped groups" of competitive funds and classes. Fidelity creates "mapped groups" by combining similar Lipper investment objective categories that have comparable management fee characteristics. Combining Lipper investment objective categories aids the Board's management fee and total expense ratio comparisons by broadening the competitive group used for comparison and by reducing the number of universes to which various Fidelity funds are compared.
Annual Report
Management Fee. The Board considered two proprietary management fee comparisons for the 12-month periods shown in the chart below. The group of Lipper funds used by the Board for management fee comparisons is referred to below as the "Total Mapped Group" and, for the reasons explained above, is broader than the Lipper peer group used by the Board for performance comparisons. The Total Mapped Group comparison focuses on a fund's standing relative to the total universe of comparable funds available to investors in terms of gross management fees before expense reimbursements or caps. "TMG %" represents the percentage of funds in the Total Mapped Group that had management fees that were lower than the fund's. For example, a TMG % of 7% means that 93% of the funds in the Total Mapped Group had higher management fees than the fund. The "Asset-Size Peer Group" (ASPG) comparison focuses on a fund's standing relative to non-Fidelity funds similar in size to the fund within the Total Mapped Group. The ASPG represents at least 15% of the funds in the Total Mapped Group with comparable asset size and management fee characteristics, subject to a minimum of 50 funds (or all funds in the Total Mapped Group if fewer than 50). Additional information, such as the ASPG quartile in which the fund's management fee ranked, is also included in the chart and considered by the Board.
Fidelity Minnesota Municipal Income Fund

Annual Report
Board Approval of Investment Advisory Contracts and
Management Fees - continued
The Board noted that the fund's management fee ranked below the median of its Total Mapped Group and below the median of its ASPG for 2011.
Based on its review, the Board concluded that the fund's management fee is fair and reasonable in light of the services that the fund receives and the other factors considered.
Total Expense Ratio. In its review of the fund's total expense ratio, the Board considered the fund's management fee as well as other fund expenses, such as transfer agent fees, pricing and bookkeeping fees, and custodial, legal, and audit fees. The Board also noted the effects of any waivers and reimbursements on fees and expenses. As part of its review, the Board also considered the current and historical total expense ratios of the fund compared to competitive fund median expenses. The fund is compared to those funds and classes in the Total Mapped Group (used by the Board for management fee comparisons) that have a similar sales load structure.
The Board noted that the fund's total expense ratio ranked below its competitive median for 2011.
Fees Charged to Other Fidelity Clients. The Board also considered Fidelity fee structures and other information with respect to clients of FMR and its affiliates, such as other mutual funds advised or subadvised by FMR or its affiliates, pension plan clients, and other institutional clients. The Board noted the findings of the 2010 ad hoc joint committee (created with the board of other Fidelity funds), which reviewed and compared Fidelity's institutional investment advisory business with its business of providing services to the Fidelity funds, including the differences in services provided, fees charged, and costs incurred, as well as competition in their respective marketplaces.
Based on its review of total expense ratios and fees charged to other Fidelity clients, the Board concluded that the fund's total expense ratio was reasonable in light of the services that the fund and its shareholders receive and the other factors considered.
Costs of the Services and Profitability. The Board considered the revenues earned and the expenses incurred by Fidelity in conducting the business of developing, marketing, distributing, managing, administering and servicing the fund and its shareholders. The Board also considered the level of Fidelity's profits in respect of all the Fidelity funds.
On an annual basis, FMR presents to the Board Fidelity's profitability for the fund. Fidelity calculates the profitability for each fund, as well as aggregate profitability for groups of Fidelity funds and all Fidelity funds, using a series of detailed revenue and cost allocation methodologies which originate with the books and records of Fidelity on which Fidelity's audited financial statements are based. The Audit Committee of the Board reviews any significant changes from the prior year's methodologies.
Annual Report
PricewaterhouseCoopers LLP (PwC), independent registered public accounting firm and auditor to Fidelity and certain Fidelity funds, has been engaged annually by the Board as part of the Board's assessment of Fidelity's profitability analysis. PwC's engagement includes the review and assessment of Fidelity's methodologies used in determining the revenues and expenses attributable to Fidelity's mutual fund business, and completion of agreed-upon procedures surrounding the mathematical accuracy of fund profitability and its conformity to allocation methodologies. After considering PwC's reports issued under the engagement and information provided by Fidelity, the Board concluded that while other allocation methods may also be reasonable, Fidelity's profitability methodologies are reasonable in all material respects.
The Board also reviewed Fidelity's non-fund businesses and fall-out benefits related to the mutual fund business as well as cases where Fidelity's affiliates may benefit from or be related to the fund's business.
The Board considered the costs of the services provided by and the profits realized by Fidelity in connection with the operation of the fund and was satisfied that the profitability was not excessive in the circumstances.
Economies of Scale. The Board considered whether there have been economies of scale in respect of the management of the Fidelity funds, whether the Fidelity funds (including the fund) have appropriately benefited from any such economies of scale, and whether there is potential for realization of any further economies of scale. The Board considered the extent to which the fund will benefit from economies of scale through increased services to the fund, through waivers or reimbursements, or through fee or expense reductions. The Board also noted that in 2009, it and the board of other Fidelity funds created an ad hoc committee (the Economies of Scale Committee) to analyze whether FMR attains economies of scale in respect of the management and servicing of the Fidelity funds, whether the Fidelity funds have appropriately benefited from such economies of scale, and whether there is potential for realization of any further economies of scale.
The Board recognized that the fund's management contract incorporates a "group fee" structure, which provides for lower group fee rates as total fund assets under FMR's management increase, and for higher group fee rates as total fund assets under FMR's management decrease. FMR calculates the group fee rates based on a tiered asset "breakpoint" schedule that varies based on asset class. The Board considered that the group fee is designed to deliver the benefits of economies of scale to fund shareholders when total Fidelity fund assets increase, even if assets of any particular fund are unchanged or have declined, because some portion of Fidelity's costs are attributable to services provided to all Fidelity funds, and all funds benefit if those costs can be allocated among more assets. The Board concluded that, given the group fee structure, fund shareholders will benefit from lower management fees as assets under FMR's management increase at the fund complex level, regardless of whether Fidelity achieves any such economies of scale.
Annual Report
Board Approval of Investment Advisory Contracts and
Management Fees - continued
The Board concluded, taking into account the analysis of the Economies of Scale Committee, that economies of scale, if any, are being appropriately shared between fund shareholders and Fidelity.
Additional Information Requested by the Board. In order to develop fully the factual basis for consideration of the Fidelity funds' Advisory Contracts, the Board requested and received additional information on certain topics, including: (i) Fidelity's fund profitability methodology, profitability trends for certain funds, and the impact of certain factors on fund profitability results; (ii) portfolio manager changes that have occurred during the past year and the amount of the investment that each portfolio manager has made in the Fidelity fund(s) that he or she manages; (iii) Fidelity's compensation structure for portfolio managers, research analysts, and other key personnel, including its effects on fund profitability, the rationale for the compensation structure, and the extent to which current market conditions have affected retention and recruitment; (iv) the compensation paid to fund sub-advisers on behalf of the Fidelity funds; (v) Fidelity's fee structures, including the group fee structure, and the rationale for recommending different fees among different categories of funds and classes; (vi) Fidelity's voluntary waiver of its fees to maintain minimum yields for certain money market funds and classes as well as contractual waivers in place for certain funds; (vii) regulatory and industry developments, including those affecting money market funds and target date funds, and the potential impact to Fidelity; (viii) Fidelity's transfer agent fees, expenses, and services, and drivers for determining the transfer agent fee structure of different funds and classes; (ix) management fee rates charged by FMR or Fidelity entities to other Fidelity clients; (x) the allocation of and historical trends in Fidelity's realization of fall-out benefits; and (xi) explanations regarding the relative total expense ratios of certain funds and classes, total expense competitive trends, and actions that might be taken by FMR to reduce total expense ratios for certain funds and classes or to achieve further economies of scale.
Based on its evaluation of all of the conclusions noted above, and after considering all factors it believed relevant, the Board ultimately concluded that the advisory fee structures are fair and reasonable, and that the fund's Advisory Contracts should be renewed.
Annual Report
Investment Adviser
Fidelity Management & Research Company
Boston, MA
Investment Sub-Advisers
Fidelity Investments Money
Management Inc.
Fidelity Management & Research (U.K.) Inc.
Fidelity Management & Research (Japan) Inc.
Fidelity Management & Research
(Hong Kong) Limited
General Distributor
Fidelity Distributors Corporation
Smithfield, RI
Transfer and Service Agents
Citibank, N.A.
New York, NY
Fidelity Investments Institutional Operations Company, Inc.
Boston, MA
Fidelity Service Company, Inc.
Boston, MA
Custodian
Citibank, N.A.
New York, NY
The Fidelity Telephone Connection
Mutual Fund 24-Hour Service
Exchanges/Redemptions
and Account Assistance 1-800-544-6666
Product Information 1-800-544-6666
Retirement Accounts 1-800-544-4774 (8 a.m. - 9 p.m.)
TDD Service 1-800-544-0118
for the deaf and hearing impaired
(9 a.m. - 9 p.m. Eastern time)
Fidelity Automated Service
Telephone (FAST®)
1-800-544-5555
Automated line for quickest service
(Fidelity Investment logo)(registered trademark)
Corporate Headquarters
82 Devonshire St., Boston, MA 02109
www.fidelity.com
MNF-UANN-0213
1.787738.109
Fidelity®
Municipal Income
Fund
Annual Report
December 31, 2012
(Fidelity Cover Art)
Contents
Performance | (Click Here) | How the fund has done over time. |
Management's Discussion of Fund Performance | (Click Here) | The Portfolio Manager's review of fund performance and strategy. |
Shareholder Expense Example | (Click Here) | An example of shareholder expenses. |
Investment Changes | (Click Here) | A summary of major shifts in the fund's investments over the past six months. |
Investments | (Click Here) | A complete list of the fund's investments with their market values. |
Financial Statements | (Click Here) | Statements of assets and liabilities, operations, and changes in net assets, as well as financial highlights. |
Notes | (Click Here) | Notes to the financial statements. |
Report of Independent Registered Public Accounting Firm | (Click Here) | |
Trustees and Officers | (Click Here) | |
Distributions | (Click Here) | |
Board Approval of Investment Advisory Contracts and Management Fees | (Click Here) | |
To view a fund's proxy voting guidelines and proxy voting record for the 12-month period ended June 30, visit http://www.fidelity.com/proxyvotingresults or visit the Securities and Exchange Commission's (SEC) web site at http://www.sec.gov. You may also call 1-800-544-8544 to request a free copy of the proxy voting guidelines.
Standard & Poor's, S&P and S&P 500 are registered service marks of The McGraw-Hill Companies, Inc. and have been licensed for use by Fidelity Distributors Corporation.
Other third party marks appearing herein are the property of their respective owners.
All other marks appearing herein are registered or unregistered trademarks or service marks of FMR LLC or an affiliated company. © 2013 FMR LLC. All rights reserved.
Annual Report
This report and the financial statements contained herein are submitted for the general information of the shareholders of the fund. This report is not authorized for distribution to prospective investors in the fund unless preceded or accompanied by an effective prospectus.
A fund files its complete schedule of portfolio holdings with the SEC for the first and third quarters of each fiscal year on Form N-Q. Forms N-Q are available on the SEC's web site at http://www.sec.gov. A fund's Forms N-Q may be reviewed and copied at the SEC's Public Reference Room in Washington, DC. Information regarding the operation of the SEC's Public Reference Room may be obtained by calling 1-800-SEC-0330. For a complete list of a fund's portfolio holdings, view the most recent holdings listing, semiannual report, or annual report on Fidelity's web site at http://www.fidelity.com, http://www.advisor.fidelity.com, or http://www.401k.com, as applicable.
NOT FDIC INSURED • MAY LOSE VALUE • NO BANK GUARANTEE
Neither the fund nor Fidelity Distributors Corporation is a bank.
Annual Report
Average annual total return reflects the change in the value of an investment, assuming reinvestment of the fund's distributions from dividend income and capital gains (the profits earned upon the sale of securities that have grown in value, if any) and assuming a constant rate of performance each year. The $10,000 table and the fund's returns do not reflect the deduction of taxes that a shareholder would pay on fund distributions or the redemption of fund shares. During periods of reimbursement by Fidelity, a fund's total return will be greater than it would be had the reimbursement not occurred. How a fund did yesterday is no guarantee of how it will do tomorrow.
Average Annual Total Returns
Periods ended December 31, 2012 | Past 1
year | Past 5
years | Past 10
years |
Fidelity® Municipal Income Fund | 7.92% | 5.74% | 5.07% |
$10,000 Over 10 Years
Let's say hypothetically that $10,000 was invested in Fidelity® Municipal Income Fund on December 31, 2002. The chart shows how the value of your investment would have changed, and also shows how the Barclays® Municipal Bond Index performed over the same period.
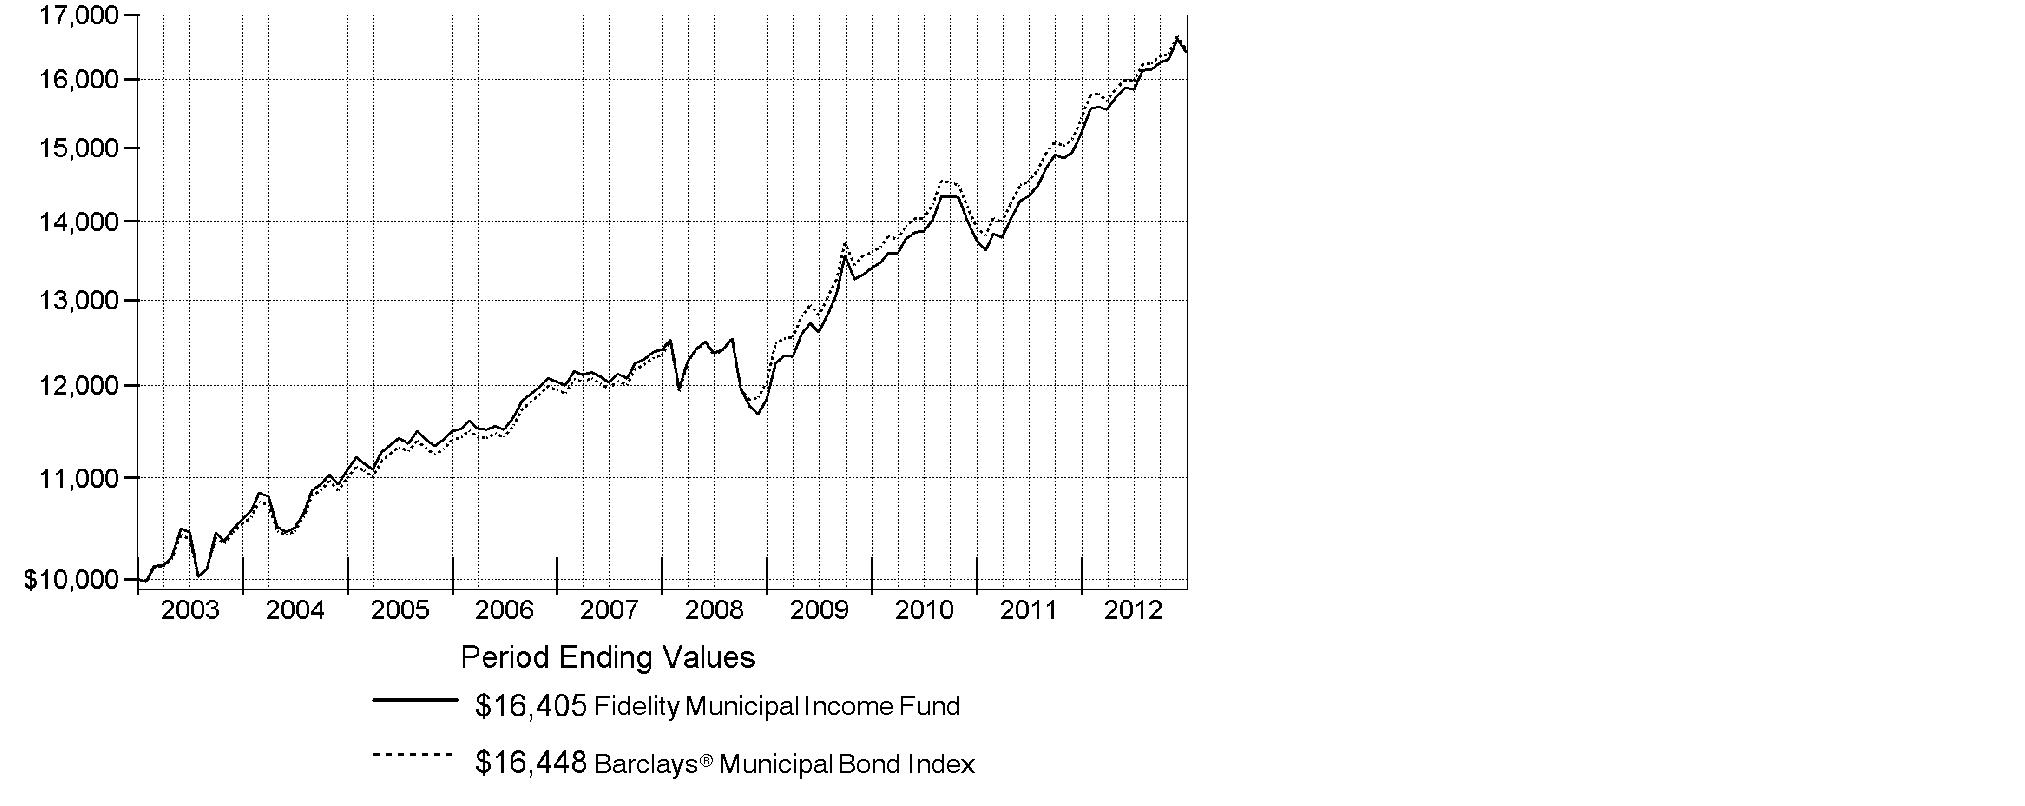
Annual Report
Market Recap: Powered by improving issuer fundamentals and favorable supply and demand, the bull market for municipal bonds rolled on in 2012, with the Barclays® Municipal Bond Index advancing 6.78%. By contrast, taxable investment-grade debt gained 4.21%, as tracked by the Barclays® U.S. Aggregate Bond Index. Muni investors were encouraged by a recovery in tax revenues for many issuers. And despite a handful of well-publicized bankruptcies by local issuers, the overall muni default rate declined and remained low. Even with a surge in refinancings, the overall supply of newly issued muni bonds was muted. As for demand, munis drew heavy interest from investors seeking a yield advantage over U.S. Treasuries, and from those looking for a perceived safe haven amid mixed U.S. economic data and the ongoing financial crisis in Europe. Investors' appetite for tax-advantaged investments in advance of potentially higher federal tax rates in 2013 also fueled demand, particularly in November, while a steady stream of municipal redemptions (calls and maturities), many of which were reinvested in the muni market, competed for limited new supply. The muni market sold off in December due to concern about proposals to limit the federal tax exemption of muni debt, profit-taking in advance of higher capital gains rates, and ratings downgrades of Puerto Rico debt to borderline investment grade.
Comments from Jamie Pagliocco, Lead Portfolio Manager of Fidelity® Municipal Income Fund: For the year, the fund returned 7.92%, while the Barclays 3+ Year Municipal Bond Index - which tracks the types of securities in which the fund invests - rose 7.52%. The fund's significant underweighting in Puerto Rico bonds and overweighting in health care securities were the two primary factors leading to its outperformance. Puerto Rico bonds lagged the municipal market because investors became increasingly concerned about the territory's poor economic prospects, high debt load and dramatically underfunded pensions. In December, the bonds suffered a significant sell-off after one of the major credit rating agencies cut Puerto Rico's credit rating to one level above speculative grade. The fund's larger-than-benchmark stake in health care bonds contributed because the sector was one of the muni market's biggest gainers as yield-hungry investors clamored for these bonds, which offer attractive yields relative to other sectors. Detracting from the fund's performance was its underweighting in industrial development bonds, which, like health care bonds, drew heavy demand from investors looking for yield, and outperformed the index as a result.
The views expressed above reflect those of the portfolio manager(s) only through the end of the period as stated on the cover of this report and do not necessarily represent the views of Fidelity or any other person in the Fidelity organization. Any such views are subject to change at any time based upon market or other conditions and Fidelity disclaims any responsibility to update such views. These views may not be relied on as investment advice and, because investment decisions for a Fidelity fund are based on numerous factors, may not be relied on as an indication of trading intent on behalf of any Fidelity fund.
Annual Report
Shareholder Expense Example
As a shareholder of the Fund, you incur two types of costs: (1) transaction costs, including redemption fees and (2) ongoing costs, including management fees and other Fund expenses. This Example is intended to help you understand your ongoing costs (in dollars) of investing in the Fund and to compare these costs with the ongoing costs of investing in other mutual funds.
The Example is based on an investment of $1,000 invested at the beginning of the period and held for the entire period (July 1, 2012 to December 31, 2012).
Actual Expenses
The first line of the accompanying table provides information about actual account values and actual expenses. You may use the information in this line, together with the amount you invested, to estimate the expenses that you paid over the period. Simply divide your account value by $1,000.00 (for example, an $8,600 account value divided by $1,000.00 = 8.6), then multiply the result by the number in the first line under the heading entitled "Expenses Paid During Period" to estimate the expenses you paid on your account during this period. A small balance maintenance fee of $12.00 that is charged once a year may apply for certain accounts with a value of less than $2,000. This fee is not included in the table below. If it was, the estimate of expenses you paid during the period would be higher, and your ending account value lower, by this amount. In addition, the Fund, as a shareholder in the underlying Fidelity Central Funds, will indirectly bear its pro-rata share of the fees and expenses incurred by the underlying Fidelity Central Funds. These fees and expenses are not included in the Fund's annualized expense ratio used to calculate the expense estimate in the table below.
Hypothetical Example for Comparison Purposes
The second line of the accompanying table provides information about hypothetical account values and hypothetical expenses based on the Fund's actual expense ratio and an assumed rate of return of 5% per year before expenses, which is not the Fund's actual return. The hypothetical account values and expenses may not be used to estimate the actual ending account balance or expenses you paid for the period. You may use this information to compare the ongoing costs of investing in the Fund and other funds. To do so, compare this 5% hypothetical example with the 5% hypothetical examples that appear in the shareholder reports of the other funds. A small balance maintenance fee of $12.00 that is charged once a year may apply for certain accounts with a value of less than $2,000. This fee is not included in the table below. If it was, the estimate of expenses you paid during the period would be higher, and your ending account value lower, by this amount. In addition, the Fund, as a shareholder in the underlying Fidelity Central Funds, will indirectly bear its pro-rata share of the fees and expenses incurred by the underlying Fidelity Central Funds. These fees and expenses are not included in the Fund's annualized expense ratio used to calculate the expense estimate in the table below.
Please note that the expenses shown in the table are meant to highlight your ongoing costs only and do not reflect any transaction costs. Therefore, the second line of the table is useful in comparing ongoing costs only, and will not help you determine the relative total costs of owning different funds. In addition, if these transactional costs were included, your costs would have been higher.
Annual Report
Shareholder Expense Example - continued
| Annualized
Expense Ratio | Beginning
Account Value
July 1, 2012 | Ending
Account Value
December 31, 2012 | Expenses Paid
During Period*
July 1, 2012 to
December 31, 2012 |
Actual | .46% | $ 1,000.00 | $ 1,035.30 | $ 2.35 |
Hypothetical (5% return per year before expenses) | | $ 1,000.00 | $ 1,022.82 | $ 2.34 |
* Expenses are equal to the Fund's annualized expense ratio, multiplied by the average account value over the period, multiplied by 184/366 (to reflect the one-half year period).
Annual Report
Investment Changes (Unaudited)
Top Five States as of December 31, 2012 |
| % of fund's
net assets | % of fund's net assets
6 months ago |
California | 18.3 | 18.4 |
Illinois | 13.0 | 13.5 |
New York | 12.4 | 12.3 |
Texas | 9.7 | 10.6 |
Florida | 9.5 | 9.0 |
Top Five Sectors as of December 31, 2012 |
| % of fund's
net assets | % of fund's net assets
6 months ago |
General Obligations | 35.6 | 35.1 |
Health Care | 17.4 | 16.1 |
Water & Sewer | 10.0 | 10.6 |
Transportation | 9.3 | 9.5 |
Special Tax | 7.9 | 8.8 |
Weighted Average Maturity as of December 31, 2012 |
| | 6 months ago |
Years | 6.0 | 5.9 |
This is a weighted average of all the maturities of the securities held in a fund. Weighted Average Maturity (WAM) can be used as a measure of sensitivity to interest rate changes and market changes. Generally, the longer the maturity, the greater the sensitivity to such changes. WAM is based on the dollar-weighted average length of time until principal payments must be paid. Depending on the types of securities held in a fund, certain maturity shortening devices (e.g., demand features, interest rate resets, and call options) may be taken into account when calculating the WAM. |
Duration as of December 31, 2012 |
| | 6 months ago |
Years | 7.1 | 7.6 |
Duration estimates how much a bond fund's price will change with a change in comparable interest rates. If rates rise 1%, for example, a fund with a 5-year duration is likely to lose about 5% of its value. Other factors also can influence a bond fund's performance and share price. Accordingly, a bond fund's actual performance may differ from this example. Duration takes into account any call or put option embedded in the bonds. |
Quality Diversification (% of fund's net assets) |
As of December 31, 2012 | As of June 30, 2012 |
 | AAA 7.7% | | | AAA 8.6% | |
 | AA,A 80.8% | | | AA,A 79.5% | |
 | BBB 7.5% | | | BBB 8.6% | |
 | BB and Below 0.8% | | | BB and Below 0.3% | |
 | Not Rated 2.0% | | | Not Rated 1.7% | |
 | Short-Term
Investments and
Net Other Assets 1.2% | | | Short-Term
Investments and
Net Other Assets 1.3% | |

We have used ratings from Moody's Investors Service, Inc. Where Moody's® ratings are not available, we have used S&P® ratings. All ratings are as of the date indicated and do not reflect subsequent changes. |
Annual Report
Investments December 31, 2012
Showing Percentage of Net Assets
Municipal Bonds - 98.8% |
| Principal
Amount (000s) | | Value (000s) |
Alabama - 0.1% |
Jefferson County Ltd. Oblig. School Warrants Series 2004 A, 5.5% 1/1/22 | | $ 5,500 | | $ 5,493 |
Univ. of Alabama at Birmingham Hosp. Rev. Series 2008 A, 5.75% 9/1/22 | | 3,000 | | 3,463 |
| | 8,956 |
Arizona - 1.7% |
Arizona Ctfs. of Partnership Series 2010 A: | | | | |
5% 10/1/18 (FSA Insured) | | 2,670 | | 3,140 |
5.25% 10/1/20 (FSA Insured) | | 8,000 | | 9,582 |
5.25% 10/1/26 (FSA Insured) | | 2,570 | | 2,994 |
5.25% 10/1/28 (FSA Insured) | | 8,345 | | 9,682 |
Arizona Health Facilities Auth. Rev. (Banner Health Sys. Proj.): | | | | |
Series 2007 A, 5% 1/1/21 | | 2,000 | | 2,270 |
Series 2007 B, 1.051% 1/1/37 (c) | | 3,000 | | 2,563 |
Series 2008 D: | | | | |
5.5% 1/1/38 | | 12,000 | | 13,223 |
6% 1/1/27 | | 2,600 | | 3,033 |
Arizona State Lottery Rev. Series 2010 A, 5% 7/1/21 (FSA Insured) | | 5,800 | | 6,872 |
Arizona State Univ. Ctfs. of Partnership (Research Infrastructure Proj.) Series 2004: | | | | |
5.25% 9/1/21 | | 2,545 | | 2,703 |
5.25% 9/1/22 | | 1,000 | | 1,062 |
Goodyear McDowell Road Commercial Corridor Impt. District 5.25% 1/1/18 (AMBAC Insured) | | 1,660 | | 1,852 |
Marana Muni. Property Corp. Facilities Rev. Series 2008 A, 5% 7/1/21 | | 1,580 | | 1,804 |
Maricopa County Indl. Dev. Auth. Hosp. Facilities Rev. (Samaritan Health Svcs. Proj.) Series 1990 A, 7% 12/1/16 (Escrowed to Maturity) | | 2,000 | | 2,278 |
Maricopa County Poll. Cont. Rev. (Southern California Edison Co. Proj.) Series 2000 A, 5% 6/1/35 | | 3,600 | | 4,012 |
McAllister Academic Village LLC Rev. (Arizona State Univ. Hassayampa Academic Village Proj.) Series 2008, 5.25% 7/1/39 | | 4,800 | | 5,214 |
Phoenix Civic Impt. Corp. District Rev. (Plaza Expansion Proj.) Series 2005 B, 0% 7/1/38 (Nat'l. Pub. Fin. Guarantee Corp. Insured) (a) | | 12,000 | | 14,653 |
Phoenix Civic Impt. Corp. Excise Tax Rev. Series 2011 C: | | | | |
5% 7/1/22 | | 1,000 | | 1,222 |
5% 7/1/23 | | 2,000 | | 2,439 |
Municipal Bonds - continued |
| Principal
Amount (000s) | | Value (000s) |
Arizona - continued |
Pima County Swr. Sys. Rev.: | | | | |
Series 2011 B, 5% 7/1/22 | | $ 1,500 | | $ 1,826 |
Series 2012 A: | | | | |
5% 7/1/24 | | 1,140 | | 1,387 |
5% 7/1/26 | | 1,000 | | 1,194 |
Salt Verde Finl. Corp. Sr. Gas Rev. Series 2007: | | | | |
5.25% 12/1/21 | | 3,500 | | 4,103 |
5.5% 12/1/29 | | 7,900 | | 9,642 |
Scottsdale Indl. Dev. Auth. Hosp. Rev. (Scottsdale Healthcare Proj.) Series 2006 C, 5% 9/1/35 (FSA Insured) | | 845 | | 932 |
Univ. Med. Ctr. Corp. Hosp. Rev. Series 2011, 6% 7/1/39 | | 3,000 | | 3,497 |
Univ. of Arizona Univ. Revs. Series 2005 A: | | | | |
5% 6/1/18 (AMBAC Insured) | | 1,000 | | 1,097 |
5% 6/1/31 (AMBAC Insured) | | 2,025 | | 2,197 |
| | 116,473 |
California - 18.3% |
ABAG Fin. Auth. for Nonprofit Corps. Rev. (Sharp HealthCare Proj.) Series 2009 B, 6.25% 8/1/39 | | 2,800 | | 3,343 |
ABC Unified School District Series 1997 C, 0% 8/1/28 (Nat'l. Pub. Fin. Guarantee Corp. Insured) | | 3,925 | | 1,978 |
Bay Area Toll Auth. San Francisco Bay Toll Bridge Rev. Series 2009 F1, 5.625% 4/1/44 | | 6,350 | | 7,367 |
Cabrillo Unified School District Series A, 0% 8/1/20 (AMBAC Insured) | | 4,275 | | 3,294 |
California Dept. of Wtr. Resources: | | | | |
(Central Valley Proj.): | | | | |
Series AL: | | | | |
5% 12/1/19 | | 1,300 | | 1,629 |
5% 12/1/22 | | 5,875 | | 7,531 |
Series AM, 5% 12/1/22 (b) | | 6,500 | | 8,218 |
Series AI: | | | | |
5% 12/1/16 | | 2,195 | | 2,557 |
5% 12/1/18 | | 10,315 | | 12,650 |
5% 12/1/19 | | 1,000 | | 1,253 |
California Econ. Recovery: | | | | |
Series 2009 A, 5% 7/1/22 | | 7,500 | | 8,442 |
Series A, 5% 7/1/18 | | 5,700 | | 6,885 |
Municipal Bonds - continued |
| Principal
Amount (000s) | | Value (000s) |
California - continued |
California Edl. Facilities Auth. Rev. (Loyola Marymount Univ. Proj.) Series 2001 A: | | | | |
0% 10/1/16 (Nat'l. Pub. Fin. Guarantee Corp. Insured) | | $ 2,140 | | $ 1,951 |
0% 10/1/17 (Nat'l. Pub. Fin. Guarantee Corp. Insured) | | 2,050 | | 1,804 |
0% 10/1/18 (Nat'l. Pub. Fin. Guarantee Corp. Insured) | | 1,675 | | 1,422 |
0% 10/1/22 (Nat'l. Pub. Fin. Guarantee Corp. Insured) | | 5,000 | | 3,529 |
California Gen. Oblig.: | | | | |
Series 2007, 5.625% 5/1/20 | | 210 | | 211 |
5% 3/1/19 | | 1,800 | | 2,125 |
5% 8/1/19 | | 16,310 | | 18,732 |
5% 8/1/20 | | 5,355 | | 6,134 |
5% 10/1/22 | | 2,300 | | 2,728 |
5% 11/1/22 | | 3,100 | | 3,611 |
5% 12/1/22 | | 6,800 | | 7,940 |
5% 11/1/24 | | 1,600 | | 1,845 |
5% 3/1/26 | | 5,100 | | 5,617 |
5% 6/1/27 (AMBAC Insured) | | 4,100 | | 4,370 |
5% 9/1/27 | | 10,500 | | 11,688 |
5% 2/1/31 (Pre-Refunded to 2/1/13 @ 100) | | 2,195 | | 2,203 |
5% 2/1/31 (Pre-Refunded to 2/1/13 @ 100) | | 2,305 | | 2,313 |
5% 9/1/31 | | 22,500 | | 24,811 |
5% 12/1/31 (Nat'l. Pub. Fin. Guarantee Corp. Insured) | | 5,595 | | 5,848 |
5% 9/1/32 | | 24,995 | | 27,478 |
5% 9/1/33 | | 19,115 | | 20,972 |
5% 9/1/35 | | 4,050 | | 4,420 |
5.125% 11/1/24 | | 4,300 | | 4,442 |
5.125% 2/1/26 | | 2,500 | | 2,601 |
5.25% 2/1/16 | | 1,320 | | 1,355 |
5.25% 2/1/16 (Pre-Refunded to 8/1/13 @ 100) | | 2,480 | | 2,551 |
5.25% 2/1/19 | | 165 | | 169 |
5.25% 2/1/19 (Pre-Refunded to 8/1/13 @ 100) | | 5,455 | | 5,612 |
5.25% 2/1/20 | | 40 | | 41 |
5.25% 2/1/20 (Pre-Refunded to 8/1/13 @ 100) | | 1,960 | | 2,016 |
5.25% 9/1/23 | | 24,300 | | 29,642 |
5.25% 2/1/24 | | 4,000 | | 4,095 |
5.25% 2/1/28 | | 4,800 | | 4,910 |
5.25% 11/1/28 | | 4,485 | | 4,630 |
Municipal Bonds - continued |
| Principal
Amount (000s) | | Value (000s) |
California - continued |
California Gen. Oblig.: - continued | | | | |
5.25% 12/1/33 | | $ 160 | | $ 168 |
5.25% 4/1/35 | | 12,000 | | 13,985 |
5.25% 3/1/38 | | 9,000 | | 10,126 |
5.25% 11/1/40 | | 3,200 | | 3,721 |
5.5% 8/1/27 | | 14,700 | | 17,367 |
5.5% 4/1/28 | | 10 | | 11 |
5.5% 8/1/29 | | 9,850 | | 11,552 |
5.5% 4/1/30 | | 5 | | 5 |
5.5% 11/1/33 | | 39,350 | | 40,887 |
5.5% 3/1/40 | | 5,900 | | 6,922 |
5.6% 3/1/36 | | 2,550 | | 3,028 |
5.75% 4/1/31 | | 5,020 | | 5,938 |
6% 3/1/33 | | 23,800 | | 29,741 |
6% 4/1/38 | | 19,600 | | 23,478 |
6% 11/1/39 | | 10,020 | | 12,193 |
6.5% 4/1/33 | | 7,900 | | 9,839 |
California Health Facilities Fing. Auth. Rev.: | | | | |
(Catholic Healthcare West Proj.): | | | | |
Series 2008 H, 5.125% 7/1/22 | | 2,160 | | 2,350 |
Series 2008 L, 5.125% 7/1/22 | | 3,635 | | 3,954 |
Series 2009 E, 5.625% 7/1/25 | | 10,000 | | 11,525 |
(Cedars-Sinai Med. Ctr. Proj.) Series 2005, 5% 11/15/13 | | 1,000 | | 1,039 |
(St. Joseph Health Sys. Proj.) Series 2009 A, 5.75% 7/1/39 | | 6,800 | | 7,749 |
(Stanford Health and Clinics Proj.) Series 2012 A, 5% 8/15/51 | | 10,000 | | 11,172 |
(Stanford Hosp. & Clinics Proj.) Series 2010 B, 5.75% 11/15/31 | | 12,500 | | 15,234 |
Bonds (Catholic Healthcare West Proj.) Series 2009 D, 5%, tender 7/1/14 (c) | | 5,900 | | 6,242 |
California Pub. Works Board Lease Rev.: | | | | |
(Butterfield State Office Complex Proj.) Series 2005 A, 5.25% 6/1/30 | | 14,000 | | 14,720 |
(Dept. of Health Svcs. Proj.) Series 2005 K, 5% 11/1/23 | | 4,575 | | 4,890 |
(Madera County, Valley State Prison for Women Proj.) Series 2005 H, 5% 6/1/16 | | 6,000 | | 6,559 |
(Monterey Bay Campus Library Proj.) Series 2009 D, 6.25% 4/1/34 | | 7,280 | | 8,704 |
Municipal Bonds - continued |
| Principal
Amount (000s) | | Value (000s) |
California - continued |
California Pub. Works Board Lease Rev.: - continued | | | | |
(Office of Emergency Svcs. Proj.) Series 2007 A: | | | | |
5% 3/1/21 | | $ 3,515 | | $ 3,904 |
5% 3/1/22 | | 1,695 | | 1,866 |
(Porterville Developmental Ctr. Hsg. Expansion and Recreation Complex Proj.) Series 2009 C, 6.25% 4/1/34 | | 2,825 | | 3,394 |
(Univ. Proj.) Series 2011 B, 5.25% 10/1/26 | | 2,515 | | 2,939 |
(Various California State Univ. Projs.) Series 1993 A, 5.25% 12/1/13 | | 935 | | 939 |
(Various Cap. Projects) Series 2011 A: | | | | |
5% 10/1/27 | | 10,000 | | 11,404 |
5.25% 10/1/26 | | 5,000 | | 5,817 |
(Various Cap. Projs.): | | | | |
Series 2012 A: | | | | |
5% 4/1/25 | | 4,700 | | 5,454 |
5% 4/1/26 | | 13,495 | | 15,600 |
Series 2012 G, 5% 11/1/25 | | 4,000 | | 4,650 |
(Various Judicial Council Projects) Series 2011 D: | | | | |
5% 12/1/22 | | 4,100 | | 4,860 |
5% 12/1/23 | | 7,355 | | 8,566 |
Series 2005 B, 5.25% 11/1/24 (XL Cap. Assurance, Inc. Insured) | | 1,575 | | 1,702 |
Series 2005 H: | | | | |
5% 6/1/17 | | 5,000 | | 5,435 |
5% 6/1/18 | | 10,300 | | 11,162 |
Series 2005 J, 5% 1/1/17 | | 6,105 | | 6,762 |
Series 2009 G1, 5.75% 10/1/30 | | 2,500 | | 2,922 |
Series 2009 I: | | | | |
6.125% 11/1/29 | | 1,600 | | 1,964 |
6.375% 11/1/34 | | 4,600 | | 5,657 |
Series 2010 A, 5.75% 3/1/30 | | 4,900 | | 5,704 |
Series B, 5.25% 11/1/26 (XL Cap. Assurance, Inc. Insured) | | 2,860 | | 3,079 |
California State Univ. Rev. Series 2009 A, 6% 11/1/40 | | 5,000 | | 5,874 |
California Statewide Cmntys. Dev. Auth. Rev.: | | | | |
(St. Joseph Health Sys. Proj.) Series 2007 C, 5.75% 7/1/47 (FGIC Insured) | | 5,000 | | 5,544 |
(State of California Proposition 1A Receivables Prog.) Series 2009, 5% 6/15/13 | | 26,800 | | 27,367 |
(Sutter Health Proj.) Series 2011 A, 6% 8/15/42 | | 11,700 | | 13,889 |
Series 2012 A, 5% 4/1/42 | | 7,200 | | 8,028 |
Municipal Bonds - continued |
| Principal
Amount (000s) | | Value (000s) |
California - continued |
Clovis Pub. Fing. Auth. Wastewtr. Rev. Series 2005, 5% 8/1/35 (Nat'l. Pub. Fin. Guarantee Corp. Insured) | | $ 9,380 | | $ 9,609 |
Encinitas Union School District Series 1996: | | | | |
0% 8/1/20 (Nat'l. Pub. Fin. Guarantee Corp. Insured) | | 3,500 | | 2,748 |
0% 8/1/21 (Nat'l. Pub. Fin. Guarantee Corp. Insured) | | 2,810 | | 2,085 |
Fontana Unified School District Gen. Oblig. 5% 5/1/19 (Assured Guaranty Corp. Insured) | | 1,300 | | 1,576 |
Foothill-De Anza Cmnty. College District Series C, 5% 8/1/40 | | 5,000 | | 5,678 |
Foothill/Eastern Trans. Corridor Agcy. Toll Road Rev.: | | | | |
Series 1995 A, 5% 1/1/35 (Nat'l. Pub. Fin. Guarantee Corp. Insured) | | 5,070 | | 5,070 |
Series 1999: | | | | |
5% 1/15/16 (Nat'l. Pub. Fin. Guarantee Corp. Insured) | | 2,800 | | 2,805 |
5.75% 1/15/40 | | 6,300 | | 6,305 |
5.875% 1/15/27 | | 2,500 | | 2,581 |
Golden State Tobacco Securitization Corp. Tobacco Settlement Rev.: | | | | |
Series 2005 A: | | | | |
5% 6/1/45 | | 27,395 | | 28,483 |
5% 6/1/45 | | 5,305 | | 5,516 |
5% 6/1/45 (FSA Insured) | | 445 | | 465 |
Long Beach Unified School District Series A: | | | | |
5.5% 8/1/28 | | 3,810 | | 4,532 |
5.5% 8/1/29 | | 2,000 | | 2,370 |
Los Angeles Cmnty. College District Series 2008 A, 6% 8/1/33 | | 7,000 | | 8,654 |
Los Angeles Cmnty. Redev. Agcy. Lease Rev. (Vermont Manchester Social Svcs. Proj.) Series 2005: | | | | |
5% 9/1/18 (AMBAC Insured) | | 1,000 | | 1,079 |
5% 9/1/19 (AMBAC Insured) | | 2,545 | | 2,730 |
Los Angeles County Metropolitan Trans. Auth. Sales Tax Rev. Series 2013 A, 5% 7/1/20 (b) | | 21,300 | | 25,859 |
Los Angeles Dept. of Wtr. & Pwr. Rev.: | | | | |
Series 2005 A1, 5% 7/1/35 | | 4,000 | | 4,357 |
Series A2, 5% 7/1/25 (FSA Insured) | | 1,800 | | 1,986 |
Los Angeles Muni. Impt. Corp. Lease Rev. Series 2012 C: | | | | |
5% 3/1/23 | | 5,335 | | 6,207 |
5% 3/1/27 | | 2,000 | | 2,263 |
Los Angeles Wastewtr. Sys. Rev.: | | | | |
Series 2009 A, 5.75% 6/1/34 | | 9,715 | | 11,593 |
Municipal Bonds - continued |
| Principal
Amount (000s) | | Value (000s) |
California - continued |
Los Angeles Wastewtr. Sys. Rev.: - continued | | | | |
Series 2012 B, 5% 6/1/28 | | $ 16,785 | | $ 20,299 |
Madera County Ctfs. of Prtn. (Children's Hosp. Central California Proj.) Series 2010, 5.375% 3/15/36 | | 3,000 | | 3,215 |
Monrovia Unified School District Series B, 0% 8/1/29 (Nat'l. Pub. Fin. Guarantee Corp. Insured) | | 4,525 | | 2,164 |
Monterey County Pub. Impt. Corp. Ctfs. of Prtn. Series 2007, 5% 8/1/19 (AMBAC Insured) | | 2,320 | | 2,626 |
Newport Beach Rev.: | | | | |
(Hoag Memorial Hosp. Presbyterian Proj.) Series 2011 A, 6% 12/1/40 | | 2,000 | | 2,421 |
Bonds (Hoag Memorial Hosp. Presbyterian Proj.) Series 2009 E, 5%, tender 2/7/13 (c) | | 5,100 | | 5,122 |
North City West School Facilities Fing. Auth. Spl. Tax Series C, 5% 9/1/19 (AMBAC Insured) | | 3,015 | | 3,511 |
Oakland Gen. Oblig.: | | | | |
Series 2009 B, 6% 1/15/34 | | 2,500 | | 2,881 |
Series 2012: | | | | |
5% 1/15/26 | | 4,535 | | 5,330 |
5% 1/15/28 | | 4,345 | | 5,038 |
5% 1/15/29 | | 5,370 | | 6,185 |
Oakland Unified School District Alameda County Series 2009 A, 6.5% 8/1/22 | | 2,320 | | 2,724 |
Oakland-Alameda County Coliseum Auth. (Oakland Coliseum Proj.): | | | | |
Series 2012 A, 5% 2/1/24 | | 8,200 | | 9,501 |
Series 2012 A. 5% 2/1/19 | | 4,190 | | 4,869 |
Port of Oakland Rev.: | | | | |
Series 2007 B, 5% 11/1/19 (Nat'l. Pub. Fin. Guarantee Corp. Insured) | | 7,000 | | 8,027 |
Series 2012 P: | | | | |
5% 5/1/23 (f) | | 6,455 | | 7,584 |
5% 5/1/24 (f) | | 9,900 | | 11,526 |
Series C, 5% 11/1/18 (Nat'l. Pub. Fin. Guarantee Corp. Insured) | | 6,650 | | 7,716 |
Poway Unified School District: | | | | |
(District #2007-1 School Facilities Proj.) Series 2008 A, 0% 8/1/32 | | 4,900 | | 2,031 |
Series B: | | | | |
0% 8/1/37 | | 7,800 | | 2,379 |
0% 8/1/38 | | 10,200 | | 2,950 |
0% 8/1/39 | | 20,100 | | 5,524 |
0% 8/1/40 | | 3,000 | | 783 |
Municipal Bonds - continued |
| Principal
Amount (000s) | | Value (000s) |
California - continued |
Poway Unified School District: - continued | | | | |
0% 8/1/41 | | $ 13,610 | | $ 3,375 |
Poway Unified School District Pub. Fing. Auth. Lease Rev. Bonds Series 2008 B, 0%, tender 12/1/14 (FSA Insured) (c) | | 5,980 | | 5,786 |
Sacramento City Fing. Auth. Rev. Series A, 0% 12/1/26 (FGIC Insured) | | 4,200 | | 2,151 |
Sacramento Muni. Util. District Elec. Rev. Series 2012 Y, 5% 8/15/26 | | 10,000 | | 12,172 |
San Bernardino Cmnty. College District Series A: | | | | |
6.25% 8/1/33 | | 2,200 | | 2,722 |
6.375% 8/1/26 | | 4,080 | | 5,100 |
San Bernardino County Ctfs. of Prtn. (Arrowhead Proj.) Series 2009 A, 5.25% 8/1/26 | | 2,800 | | 3,034 |
San Diego Convention Ctr. Expansion Series 2012 A, 5% 4/15/25 | | 10,425 | | 11,840 |
San Diego Unified School District: | | | | |
Series 2008 C: | | | | |
0% 7/1/34 | | 3,600 | | 1,296 |
0% 7/1/39 | | 9,650 | | 2,535 |
0% 7/1/41 | | 21,370 | | 4,978 |
Series 2008 E: | | | | |
0% 7/1/47 (a) | | 7,400 | | 2,862 |
0% 7/1/49 | | 25,500 | | 3,889 |
San Joaquin County Ctfs. of Prtn. (County Administration Bldg. Proj.) Series 2007, 5% 11/15/18 (Nat'l. Pub. Fin. Guarantee Corp. Insured) | | 3,495 | | 3,920 |
San Leandro Unified School District Series 2006 B, 6.25% 8/1/33 (FSA Insured) | | 6,375 | | 7,572 |
San Marcos Unified School District: | | | | |
Series 2010 B, 0% 8/1/47 | | 18,400 | | 3,172 |
Series A, 5% 8/1/38 | | 5,150 | | 5,783 |
San Mateo County Cmnty. College District Series A, 0% 9/1/26 (Nat'l. Pub. Fin. Guarantee Corp. Insured) | | 5,430 | | 3,344 |
Santa Clara County Fing. Auth. Rev. (El Camino Hosp. Proj.) Series 2007 C, 5.75% 2/1/41 (AMBAC Insured) | | 10,000 | | 10,908 |
Santa Monica-Malibu Unified School District Series 1999, 0% 8/1/20 (Nat'l. Pub. Fin. Guarantee Corp. Insured) | | 2,815 | | 2,381 |
Sonoma County Jr. College District Rev. Series 2002 B, 5% 8/1/28 (FSA Insured) | | 2,200 | | 2,411 |
Municipal Bonds - continued |
| Principal
Amount (000s) | | Value (000s) |
California - continued |
Sweetwater Union High School District Series 2008 A, 5.625% 8/1/47 (FSA Insured) | | $ 45,225 | | $ 50,822 |
Torrance Ctfs. of Prtn. (Refing. & Pub. Impt. Proj.) Series B, 5.25% 6/1/34 (AMBAC Insured) | | 4,475 | | 4,576 |
Turlock Health Facilities Rev. Ctfs. Series 2004 A, 5.375% 10/15/34 | | 1,500 | | 1,560 |
Union Elementary School District: | | | | |
Series A, 0% 9/1/19 (Nat'l. Pub. Fin. Guarantee Corp. Insured) | | 1,750 | | 1,489 |
Series B, 0% 9/1/22 (Nat'l. Pub. Fin. Guarantee Corp. Insured) | | 1,500 | | 1,103 |
Univ. of California Revs.: | | | | |
(UCLA Med. Ctr. Proj.): | | | | |
Series A: | | | | |
5.5% 5/15/15 (AMBAC Insured) | | 1,110 | | 1,125 |
5.5% 5/15/16 (AMBAC Insured) | | 1,170 | | 1,185 |
5.5% 5/15/17 (AMBAC Insured) | | 1,235 | | 1,250 |
5.5% 5/15/19 (AMBAC Insured) | | 1,375 | | 1,390 |
5.5% 5/15/22 (AMBAC Insured) | | 370 | | 374 |
5.5% 5/15/23 (AMBAC Insured) | | 380 | | 384 |
Series B: | | | | |
5.5% 5/15/15 (AMBAC Insured) | | 1,890 | | 1,997 |
5.5% 5/15/17 (AMBAC Insured) | | 2,545 | | 2,662 |
Series 2009 O: | | | | |
5.25% 5/15/39 | | 2,400 | | 2,753 |
5.75% 5/15/30 | | 12,000 | | 14,652 |
Val Verde Unified School District Ctfs. of Prtn. Series B, 5% 1/1/30 (FGIC Insured) | | 1,495 | | 1,530 |
Ventura County Cmnty. College District Series C, 5.5% 8/1/33 | | 5,100 | | 6,106 |
Washington Township Health Care District Rev.: | | | | |
Series 2007 A: | | | | |
5% 7/1/18 | | 1,185 | | 1,319 |
5% 7/1/27 | | 1,840 | | 1,957 |
Series 2009 A, 5.75% 7/1/24 | | 1,705 | | 1,984 |
Series 2010 A, 5.5% 7/1/38 | | 3,815 | | 4,180 |
West Contra Costa Unified School District: | | | | |
(Election of 2005 Proj.) Series B, 5.625% 8/1/35 (Berkshire Hathaway Assurance Corp. Insured) | | 3,850 | | 4,451 |
Municipal Bonds - continued |
| Principal
Amount (000s) | | Value (000s) |
California - continued |
West Contra Costa Unified School District: - continued | | | | |
Series 2012: | | | | |
5% 8/1/24 | | $ 3,625 | | $ 4,264 |
5% 8/1/25 | | 10,000 | | 11,690 |
| | 1,241,535 |
Colorado - 1.4% |
Aurora Hosp. Rev. (Children's Hosp. Assoc. Proj.) Series 2010 A, 5% 12/1/40 | | 4,000 | | 4,367 |
Colorado Ctfs. of Prtn. (UCDHSC Fitzsimons Academic Proj.) Series 2005 B: | | | | |
5% 11/1/17 (Nat'l. Pub. Fin. Guarantee Corp. Insured) | | 2,475 | | 2,719 |
5.25% 11/1/24 (Pre-Refunded to 11/1/15 @ 100) | | 2,600 | | 2,949 |
Colorado Health Facilities Auth. Retirement Hsg. Rev. (Liberty Heights Proj.): | | | | |
Series B, 0% 7/15/20 (Escrowed to Maturity) | | 5,800 | | 5,113 |
0% 7/15/22 (Escrowed to Maturity) | | 15,700 | | 12,733 |
Colorado Health Facilities Auth. Rev. (Parkview Episcopal Med. Ctr. Proj.) Series B: | | | | |
5% 9/1/19 | | 1,115 | | 1,257 |
5% 9/1/22 | | 1,500 | | 1,667 |
Colorado Springs Utils. Rev. Series 2012 C2, 5% 11/15/37 | | 3,000 | | 3,487 |
Colorado Wtr. Resources and Pwr. Dev. Auth. Wtr. Resources Rev. (Parker Wtr. and Sanitation District Proj.) Series 2004 D, 5.25% 9/1/43 (Pre-Refunded to 9/1/14 @ 100) | | 33,385 | | 36,070 |
Denver City & County Arpt. Rev.: | | | | |
Series 2007 E, 5% 11/15/32 (AMBAC Insured) | | 2,500 | | 2,775 |
5% 11/15/15 (f) | | 3,000 | | 3,340 |
Denver Health & Hosp. Auth. Healthcare Rev. Series 2007 A, 5% 12/1/13 | | 3,005 | | 3,134 |
Douglas and Elbert Counties School District #RE1 Series 2004: | | | | |
5.75% 12/15/20 (Pre-Refunded to 12/15/14 @ 100) | | 1,500 | | 1,657 |
5.75% 12/15/22 (Pre-Refunded to 12/15/14 @ 100) | | 1,000 | | 1,104 |
E-470 Pub. Hwy. Auth. Rev.: | | | | |
Series 1997 B, 0% 9/1/15 (Nat'l. Pub. Fin. Guarantee Corp. Insured) | | 3,500 | | 3,301 |
Municipal Bonds - continued |
| Principal
Amount (000s) | | Value (000s) |
Colorado - continued |
E-470 Pub. Hwy. Auth. Rev.: - continued | | | | |
Series 2000 B, 0% 9/1/20 (Nat'l. Pub. Fin. Guarantee Corp. Insured) | | $ 12,075 | | $ 9,167 |
Series 2010 A, 0% 9/1/41 | | 9,600 | | 2,198 |
Series 2010 C, 5.375% 9/1/26 | | 1,000 | | 1,102 |
| | 98,140 |
District Of Columbia - 1.1% |
District of Columbia Hosp. Rev. (Sibley Memorial Hosp. Proj.) Series 2009, 6.375% 10/1/39 | | 8,140 | | 9,418 |
District of Columbia Rev.: | | | | |
(Medlantic/Helix Proj.) Series 1998 C, 5% 8/15/17 (FSA Insured) | | 1,700 | | 1,909 |
Series B, 4.75% 6/1/32 | | 2,200 | | 2,404 |
District of Columbia Wtr. & Swr. Auth. Pub. Util. Rev. Series 2007 A, 5.5% 10/1/41 | | 23,535 | | 27,498 |
Metropolitan Washington Arpts. Auth. Dulles Toll Road Rev. Series 2009 B: | | | | |
0% 10/1/33 (Assured Guaranty Corp. Insured) | | 15,000 | | 5,552 |
0% 10/1/34 (Assured Guaranty Corp. Insured) | | 15,000 | | 5,236 |
0% 10/1/35 (Assured Guaranty Corp. Insured) | | 33,975 | | 11,249 |
0% 10/1/39 (Assured Guaranty Corp. Insured) | | 5,030 | | 1,295 |
Metropolitan Washington DC Arpts. Auth. Sys. Rev. Series 2010 A, 5% 10/1/39 | | 3,200 | | 3,733 |
Washington DC Metropolitan Transit Auth. Rev. Series 2009 A: | | | | |
5.125% 7/1/32 | | 1,000 | | 1,138 |
5.25% 7/1/27 | | 4,390 | | 5,129 |
5.25% 7/1/28 | | 3,000 | | 3,493 |
| | 78,054 |
Florida - 9.5% |
Alachua County Health Facilities Auth. Health Facilities Rev. (Avmed/Santa Fe Health Care Sys. Proj.) Series 1993, 6.05% 11/15/16 (Escrowed to Maturity) | | 3,870 | | 4,254 |
Boynton Beach Util. Sys. Rev. Series 2002, 5.5% 11/1/19 (Nat'l. Pub. Fin. Guarantee Corp. Insured) | | 3,300 | | 3,775 |
Brevard County School Board Ctfs. of Prtn.Series 2007 B: | | | | |
5% 7/1/24 (AMBAC Insured) | | 1,365 | | 1,543 |
5% 7/1/25 (AMBAC Insured) | | 3,540 | | 3,967 |
Broward County Arpt. Sys. Rev. Series 2012 Q1, 5% 10/1/25 | | 5,215 | | 6,256 |
Municipal Bonds - continued |
| Principal
Amount (000s) | | Value (000s) |
Florida - continued |
Broward County Gen. Oblig. (Parks & Land Preservation Proj.) Series 2005: | | | | |
5% 1/1/24 (Pre-Refunded to 1/1/15 @ 100) | | $ 1,000 | | $ 1,092 |
5% 1/1/25 (Pre-Refunded to 1/1/15 @ 100) | | 1,000 | | 1,092 |
Broward County School Board Ctfs. of Prtn.: | | | | |
Series 2003 A: | | | | |
5.25% 7/1/16 (Pre-Refunded to 7/1/13 @ 100) | | 6,060 | | 6,209 |
5.25% 7/1/20 (Pre-Refunded to 7/1/13 @ 100) | | 3,000 | | 3,074 |
Series 2007 A: | | | | |
5% 7/1/17 (Nat'l. Pub. Fin. Guarantee Corp. Insured) | | 3,660 | | 4,180 |
5% 7/1/19 (Nat'l. Pub. Fin. Guarantee Corp. Insured) | | 3,700 | | 4,186 |
Series 2012 A: | | | | |
5% 7/1/23 | | 21,020 | | 24,717 |
5% 7/1/27 | | 5,695 | | 6,533 |
Broward County Wtr. & Swr. Util. Rev. Series 2009 A, 5.25% 10/1/34 | | 8,500 | | 10,047 |
Cap. Projs. Fin. Auth. Student Hsg. Rev. Series 2000 F1, 5.5% 10/1/13 (Nat'l. Pub. Fin. Guarantee Corp. Insured) | | 1,265 | | 1,265 |
Citizens Property Ins. Corp.: | | | | |
Series 2010 A1: | | | | |
5% 6/1/15 (FSA Insured) | | 5,000 | | 5,461 |
5% 6/1/16 (FSA Insured) | | 7,500 | | 8,411 |
Series 2011 A1: | | | | |
5% 6/1/19 | | 1,715 | | 2,008 |
5% 6/1/20 | | 3,000 | | 3,547 |
Series 2012 A1, 5% 6/1/21 | | 8,400 | | 9,907 |
Collier County Indl. Dev. Auth. Healthcare Facilities Rev. (NCH Healthcare Sys. Proj.) Series 2011, 6.25% 10/1/39 | | 24,285 | | 28,273 |
Emerald Coast Utils. Auth. Rev.: | | | | |
5.25% 1/1/26 (Nat'l. Pub. Fin. Guarantee Corp. Insured) | | 1,000 | | 1,069 |
5.25% 1/1/36 (Nat'l. Pub. Fin. Guarantee Corp. Insured) | | 1,310 | | 1,377 |
Escambia City Health Facilities Auth. Rev. (Ascension Health Cr. Group Proj.) Series 2002 C, 5.75% 11/15/32 | | 6,900 | | 6,993 |
Escambia County Utils. Auth. Util. Sys. Rev. Series 1992 B, 6.25% 1/1/15 (Nat'l. Pub. Fin. Guarantee Corp. Insured) | | 3,050 | | 3,232 |
Municipal Bonds - continued |
| Principal
Amount (000s) | | Value (000s) |
Florida - continued |
Florida Board of Ed. Series 2003 J, 5% 6/1/31 (Pre-Refunded to 6/1/13 @ 101) | | $ 2,500 | | $ 2,574 |
Florida Board of Ed. Lottery Rev. Series 2011 A, 5% 7/1/20 | | 12,400 | | 15,199 |
Florida Board of Ed. Pub. Ed. Cap. Outlay: | | | | |
Series 2006 E, 5% 6/1/35 | | 3,200 | | 3,704 |
Series 2011 E: | | | | |
5% 6/1/24 | | 6,600 | | 8,017 |
5% 6/1/27 | | 6,500 | | 7,780 |
Series 2011 F, 5% 6/1/23 | | 6,045 | | 7,495 |
Series A, 5.5% 6/1/38 | | 2,000 | | 2,394 |
Florida Dept. of Children and Family Svcs. Ctfs. of Prtn. (South Florida Evaluation Treatment Ctr. Proj.): | | | | |
5% 10/1/16 | | 2,025 | | 2,243 |
5% 10/1/17 | | 2,130 | | 2,360 |
Florida Dept. of Trans. Rev. Series 2005 A: | | | | |
5% 7/1/17 | | 3,360 | | 3,712 |
5% 7/1/18 | | 3,320 | | 3,660 |
Florida Gen. Oblig.: | | | | |
(Dept. of Trans. Right-of-Way and Bridge Construction Proj.) Series 2003 A, 5% 7/1/33 (Pre-Refunded to 7/1/13 @ 101) | | 395 | | 408 |
Series 2008 A, 5.25% 7/1/37 | | 3,000 | | 3,454 |
Series 2011 B, 5% 7/1/23 | | 10,175 | | 12,450 |
Series 2012 A, 5% 7/1/25 | | 8,940 | | 10,854 |
Florida Muni. Pwr. Agcy. Rev.: | | | | |
(St. Lucie Proj.) Series 2012 A, 5% 10/1/26 | | 3,100 | | 3,713 |
Series A, 6.25% 10/1/31 | | 3,000 | | 3,603 |
Florida Wtr. Poll. Cont. Fing. Corp. Rev. Series 2003, 5.25% 1/15/20 | | 1,950 | | 2,049 |
Gulf Breeze Util. Sys. Rev. Series 2004, 5% 10/1/16 (AMBAC Insured) | | 1,010 | | 1,070 |
Halifax Hosp. Med. Ctr. Rev.: | | | | |
Series 2006 A: | | | | |
5% 6/1/38 | | 2,995 | | 3,173 |
5.25% 6/1/19 | | 2,375 | | 2,631 |
Series 2006 B1, 5.5% 6/1/38 (FSA Insured) | | 3,575 | | 3,853 |
Highlands County Health Facilities Auth. Rev. (Adventist Health Sys./Sunbelt, Inc. Prog.): | | | | |
Series 2005 A: | | | | |
5% 11/15/15 | | 1,000 | | 1,121 |
5% 11/15/17 | | 1,200 | | 1,322 |
Municipal Bonds - continued |
| Principal
Amount (000s) | | Value (000s) |
Florida - continued |
Highlands County Health Facilities Auth. Rev. (Adventist Health Sys./Sunbelt, Inc. Prog.): - continued | | | | |
Series 2005 A: | | | | |
5% 11/15/22 | | $ 1,000 | | $ 1,102 |
Series 2005 B: | | | | |
5% 11/15/15 | | 875 | | 981 |
5% 11/15/15 (Escrowed to Maturity) | | 125 | | 140 |
5% 11/15/16 | | 1,040 | | 1,153 |
5% 11/15/16 (Pre-Refunded to 11/15/15 @ 100) | | 150 | | 168 |
5% 11/15/30 | | 3,565 | | 3,782 |
5% 11/15/30 (Pre-Refunded to 11/15/15 @ 100) | | 485 | | 545 |
Series 2006 G: | | | | |
5% 11/15/14 | | 1,285 | | 1,388 |
5% 11/15/14 (Escrowed to Maturity) | | 45 | | 49 |
5% 11/15/15 | | 965 | | 1,082 |
5% 11/15/15 (Escrowed to Maturity) | | 35 | | 39 |
5% 11/15/16 | | 1,020 | | 1,158 |
5% 11/15/16 (Escrowed to Maturity) | | 30 | | 35 |
5.125% 11/15/17 | | 2,750 | | 3,128 |
5.125% 11/15/17 (Pre-Refunded to 11/15/16 @ 100) | | 95 | | 110 |
5.125% 11/15/18 | | 965 | | 1,089 |
5.125% 11/15/18 (Pre-Refunded to 11/15/16 @ 100) | | 35 | | 41 |
5.125% 11/15/19 | | 1,930 | | 2,169 |
5.125% 11/15/19 (Pre-Refunded to 11/15/16 @ 100) | | 70 | | 81 |
Series 2008 B, 6% 11/15/37 | | 11,000 | | 13,010 |
Hillsborough County Indl. Dev.: | | | | |
(H Lee Moffitt Cancer Ctr. Proj.) Series A: | | | | |
5% 7/1/17 | | 1,930 | | 2,176 |
5% 7/1/18 | | 2,125 | | 2,373 |
(Tampa Gen. Hosp. Proj.) Series 2006, 5.25% 10/1/41 | | 8,405 | | 8,772 |
Hillsborough County Indl. Dev. Auth. Indl. Dev. Rev.: | | | | |
(Health Facilities/Univ. Cmnty. Hosp. Proj.) Series 2008 B, 8% 8/15/32 (Pre-Refunded to 8/15/19 @ 101) | | 4,900 | | 6,912 |
(Univ. Cmnty. Hosp. Proj.) Series 2008 A, 5.625% 8/15/29 (Pre-Refunded to 8/15/18 @ 100) | | 2,270 | | 2,843 |
Jacksonville Elec. Auth. Elec. Sys. Rev.: | | | | |
Series 2006 A, 5% 10/1/41 (FSA Insured) | | 18,800 | | 20,215 |
Series 2009 B, 5% 10/1/18 | | 7,500 | | 7,897 |
Municipal Bonds - continued |
| Principal
Amount (000s) | | Value (000s) |
Florida - continued |
Jacksonville Elec. Auth. Elec. Sys. Rev.: - continued | | | | |
Series Three 2010 D, 5% 10/1/38 | | $ 8,100 | | $ 9,158 |
Jacksonville Sales Tax Rev.: | | | | |
Series 2003, 5.25% 10/1/19 (Pre-Refunded to 10/1/13 @ 100) | | 1,500 | | 1,556 |
Series 2012, 5% 10/1/24 | | 5,500 | | 6,608 |
Lee County Arpt. Rev. Series 2011 A, 5.375% 10/1/32 (f) | | 5,260 | | 5,950 |
Marco Island Util. Sys. Rev. 5% 10/1/33 (Nat'l. Pub. Fin. Guarantee Corp. Insured) | | 5,025 | | 5,111 |
Melbourne Wtr. & Swr. Rev. 5% 10/1/34 (Nat'l. Pub. Fin. Guarantee Corp. Insured) | | 5,000 | | 5,175 |
Miami Beach Health Facilities Auth. Hosp. Rev. (Mount Sinai Med. Ctr. of Florida Proj.) Series 2012, 5% 11/15/23 | | 2,000 | | 2,234 |
Miami Beach Wtr. & Swr. Rev. 5.5% 9/1/27 (AMBAC Insured) | | 6,000 | | 6,017 |
Miami-Dade County Aviation Rev.: | | | | |
Series 2010 A, 5.375% 10/1/41 | | 5,800 | | 6,599 |
Series 2010 A1, 5.5% 10/1/30 | | 3,000 | | 3,512 |
Series 2010 B, 5% 10/1/35 (FSA Insured) | | 13,610 | | 15,297 |
Series 2012 A: | | | | |
5% 10/1/23 (f) | | 7,500 | | 8,793 |
5% 10/1/24 (f) | | 9,050 | | 10,560 |
5% 10/1/30 (f) | | 6,095 | | 6,898 |
5% 10/1/31 (f) | | 2,500 | | 2,820 |
Miami-Dade County Cap. Asset Acquisition Series 2012 A, 5% 10/1/26 | | 3,750 | | 4,331 |
Miami-Dade County Expressway Auth.: | | | | |
Series 2010 A, 5% 7/1/40 | | 9,500 | | 10,366 |
Series B, 5.25% 7/1/25 (Nat'l. Pub. Fin. Guarantee Corp. Insured) | | 5,000 | | 5,280 |
Miami-Dade County Gen. Oblig. (Bldg. Better Cmntys. Prog.) 5% 7/1/35 (Nat'l. Pub. Fin. Guarantee Corp. Insured) | | 4,565 | | 4,966 |
Miami-Dade County School Board Ctfs. of Prtn.: | | | | |
Series 2008 A: | | | | |
5% 8/1/17 (AMBAC Insured) | | 3,500 | | 3,931 |
5% 8/1/18 (AMBAC Insured) | | 4,000 | | 4,553 |
5% 8/1/20 (AMBAC Insured) | | 2,500 | | 2,832 |
5% 8/1/21 (AMBAC Insured) | | 5,095 | | 5,743 |
5% 8/1/22 (AMBAC Insured) | | 3,325 | | 3,729 |
Series 2011 B, 5.625% 5/1/31 | | 6,600 | | 7,745 |
Municipal Bonds - continued |
| Principal
Amount (000s) | | Value (000s) |
Florida - continued |
Miami-Dade County Transit Sales Surtax Rev. Series 2012, 5% 7/1/24 | | $ 2,255 | | $ 2,703 |
Ocala Util. Sys. Rev. Series B, 5.25% 10/1/22 (Nat'l. Pub. Fin. Guarantee Corp. Insured) | | 1,000 | | 1,102 |
Orange County Edl. Facilities Auth. Ed. Rev. (Rollins College Proj.): | | | | |
5.25% 12/1/32 (AMBAC Insured) | | 1,350 | | 1,509 |
5.25% 12/1/37 (AMBAC Insured) | | 1,365 | | 1,496 |
Orange County Health Facilities Auth. (Orlando Health, Inc.) Series 2009, 5.125% 10/1/26 | | 5,000 | | 5,634 |
Orange County Health Facilities Auth. Rev. (Orlando Reg'l. Health Care Sys. Proj.) Series 1996 A, 6.25% 10/1/18 (Nat'l. Pub. Fin. Guarantee Corp. Insured) | | 4,500 | | 5,365 |
Orange County Sales Tax Rev. Series 2002 B, 5% 1/1/25 (Pre-Refunded to 1/1/13 @ 100) | | 2,800 | | 2,800 |
Orange County School Board Ctfs. of Prtn.: | | | | |
Series 1997 A, 0% 8/1/13 (Nat'l. Pub. Fin. Guarantee Corp. Insured) | | 2,275 | | 2,256 |
Series A, 5% 8/1/16 (Nat'l. Pub. Fin. Guarantee Corp. Insured) | | 2,940 | | 3,273 |
Orlando & Orange County Expressway Auth. Rev. Series 2012, 5% 7/1/22 | | 2,500 | | 3,023 |
Orlando Utils. Commission Util. Sys. Rev.: | | | | |
Series 2009 B, 5% 10/1/33 | | 3,700 | | 4,313 |
Series 2012 A: | | | | |
5% 10/1/23 | | 2,300 | | 2,911 |
5% 10/1/25 | | 1,100 | | 1,410 |
Series 2013 A: | | | | |
5% 10/1/24 (b) | | 6,300 | | 8,041 |
5% 10/1/25 (b) | | 4,800 | | 6,151 |
Palm Beach County Solid Waste Auth. Rev. Series 2011, 5% 10/1/24 | | 11,100 | | 13,047 |
Pasco County School Board Ctfs. of Prtn. Series A, 5% 8/1/30 (AMBAC Insured) | | 4,000 | | 4,250 |
Peace River/Manasota Reg'l. Wtr. Supply Auth. Rev. Series A: | | | | |
5% 10/1/30 (FSA Insured) | | 3,105 | | 3,350 |
5% 10/1/35 (FSA Insured) | | 5,000 | | 5,376 |
Plant City Util. Sys. Rev. 6% 10/1/15 (Nat'l. Pub. Fin. Guarantee Corp. Insured) | | 1,395 | | 1,508 |
Polk County Pub. Facilities Rev. 5% 12/1/33 (Nat'l. Pub. Fin. Guarantee Corp. Insured) | | 2,000 | | 2,110 |
Municipal Bonds - continued |
| Principal
Amount (000s) | | Value (000s) |
Florida - continued |
Port Orange Gen. Oblig. 5% 4/1/29 (Nat'l. Pub. Fin. Guarantee Corp. Insured) | | $ 2,015 | | $ 2,247 |
Reedy Creek Impt. District Utils. Rev. Series 1, 5.25% 10/1/19 (Nat'l. Pub. Fin. Guarantee Corp. Insured) | | 3,700 | | 3,824 |
Seminole County School Board Ctfs. of Prtn.: | | | | |
Series 2005 A, 5% 7/1/16 (Nat'l. Pub. Fin. Guarantee Corp. Insured) | | 1,645 | | 1,810 |
Series A, 5% 7/1/20 (Nat'l. Pub. Fin. Guarantee Corp. Insured) | | 1,745 | | 1,914 |
South Lake County Hosp. District (South Lake Hosp., Inc.): | | | | |
Series 2009 A, 6.25% 4/1/39 | | 3,300 | | 3,795 |
Series 2010: | | | | |
5% 10/1/25 | | 4,140 | | 4,506 |
5.25% 10/1/34 | | 3,500 | | 3,865 |
St. Johns County School Board 5.25% 7/1/16 (Nat'l. Pub. Fin. Guarantee Corp. Insured) | | 1,400 | | 1,535 |
St. Petersburg Pub. Util. Rev. Series 2009 A, 5.5% 10/1/37 | | 7,000 | | 8,051 |
Sumter County School District Rev. (Multi-District Ln. Prog.) 7.15% 11/1/15 (Escrowed to Maturity) | | 985 | | 1,164 |
Tallahassee Energy Sys. Rev. 5% 10/1/35 (Nat'l. Pub. Fin. Guarantee Corp. Insured) | | 3,065 | | 3,213 |
Tampa Bay Wtr. Reg'l. Wtr. Supply Auth. Util. Sys. Rev. Series 2011 B, 5% 10/1/18 | | 6,900 | | 8,355 |
Tampa Health Sys. Rev. (Baycare Health Sys. Proj.) Series 2010, 5% 11/15/23 | | 8,080 | | 9,232 |
Tampa Tax Allocation (H. Lee Moffitt Cancer Ctr. Proj.) Series 2012 A, 5% 9/1/22 | | 2,300 | | 2,764 |
Univ. of Central Florida Athletics Assoc., Inc. Ctfs. of Prtn. Series A: | | | | |
5% 10/1/17 (Nat'l. Pub. Fin. Guarantee Corp. Insured) | | 1,805 | | 1,905 |
5% 10/1/35 (Nat'l. Pub. Fin. Guarantee Corp. Insured) | | 3,275 | | 3,329 |
5.25% 10/1/34 (Nat'l. Pub. Fin. Guarantee Corp. Insured) | | 2,000 | | 2,032 |
USF Fing. Corp. Ctfs. of Prtn. (Master Lease Prog.) Series A: | | | | |
5.25% 7/1/15 (AMBAC Insured) | | 2,690 | | 2,905 |
Municipal Bonds - continued |
| Principal
Amount (000s) | | Value (000s) |
Florida - continued |
USF Fing. Corp. Ctfs. of Prtn. (Master Lease Prog.) Series A: - continued | | | | |
5.25% 7/1/16 (AMBAC Insured) | | $ 2,830 | | $ 3,058 |
Walton County School Board Ctfs. of Prtn. 5.25% 7/1/18 (FSA Insured) | | 1,865 | | 2,171 |
| | 646,812 |
Georgia - 3.5% |
Atlanta Tax Allocation (Atlantic Station Proj.) Series 2007, 5.25% 12/1/20 (Assured Guaranty Corp. Insured) | | 2,000 | | 2,211 |
Atlanta Wtr. & Wastewtr. Rev.: | | | | |
Series 2004, 5% 11/1/43 | | 36,165 | | 38,271 |
Series 2009 A: | | | | |
6% 11/1/25 | | 9,785 | | 12,341 |
6.25% 11/1/39 | | 10,800 | | 13,273 |
Augusta Wtr. & Swr. Rev. Series 2004, 5.25% 10/1/39 (FSA Insured) | | 11,600 | | 12,368 |
Colquitt County Dev. Auth. Rev. Series C, 0% 12/1/21 (Escrowed to Maturity) | | 10,200 | | 8,528 |
DeKalb County Hosp. Auth. Rev. (DeKalb Med. Ctr., Inc. Proj.) Series 2010: | | | | |
6% 9/1/30 | | 7,745 | | 9,150 |
6.125% 9/1/40 | | 7,510 | | 8,846 |
DeKalb County Wtr. & Swr. Rev. Series 2011 A: | | | | |
5.25% 10/1/36 | | 3,000 | | 3,456 |
5.25% 10/1/41 | | 5,600 | | 6,409 |
Fulton County Wtr. & Swr. Rev. Series 2011: | | | | |
5% 1/1/23 | | 1,500 | | 1,826 |
5% 1/1/24 | | 6,500 | | 7,875 |
Georgia Gen. Oblig.: | | | | |
Series 2007 E, 5% 8/1/22 | | 575 | | 672 |
Series 2009 I, 5% 7/1/20 | | 10,250 | | 12,982 |
Series 2011 E2, 5% 9/1/20 | | 10,000 | | 12,697 |
Georgia Muni. Elec. Auth. Pwr. Rev.: | | | | |
Series C, 5% 1/1/22 | | 7,700 | | 9,493 |
Series GG, 5% 1/1/22 | | 4,000 | | 5,005 |
Georgia Muni. Gas Auth. Rev. (Gas Portfolio III Proj.) Series S: | | | | |
5% 10/1/22 | | 3,425 | | 4,161 |
5% 10/1/23 | | 4,000 | | 4,795 |
Greene County Dev. Auth. Health Sys. Rev. Series 2012, 5% 11/15/37 (b) | | 1,600 | | 1,716 |
Municipal Bonds - continued |
| Principal
Amount (000s) | | Value (000s) |
Georgia - continued |
Main Street Natural Gas, Inc. Georgia Gas Proj. Rev. Series A, 5.25% 9/15/19 | | $ 1,915 | | $ 2,222 |
Metropolitan Atlanta Rapid Transit Auth. Sales Tax Rev. Third Series 2009 A, 5.25% 7/1/36 | | 8,500 | | 9,843 |
Richmond County Dev. Auth. Rev. (Southern Care Corp. Facility Proj.): | | | | |
Series A, 0% 12/1/21 (Escrowed to Maturity) | | 5,615 | | 4,695 |
Series C, 0% 12/1/21 (Escrowed to Maturity) | | 19,400 | | 16,220 |
Richmond County Hosp. Auth. (Univ. Health Svcs., Inc. Proj.) Series 2009, 5.5% 1/1/36 | | 13,550 | | 14,676 |
Savannah Econ. Dev. Auth. Rev. (Southern Care Corp. Proj.) Series C, 0% 12/1/21 (Escrowed to Maturity) | | 18,045 | | 15,087 |
Valdosta & Lowndes County Hosp. (South Georgia Med. Ctr. Proj.) 5% 10/1/20 | | 1,570 | | 1,730 |
| | 240,548 |
Hawaii - 0.1% |
Honolulu City & County Board of Wtr. Supply Wtr. Sys. Rev. Series B: | | | | |
5% 7/1/13 (Nat'l. Pub. Fin. Guarantee Corp. Insured) (f) | | 1,000 | | 1,020 |
5% 7/1/14 (Nat'l. Pub. Fin. Guarantee Corp. Insured) (f) | | 1,140 | | 1,209 |
5% 7/1/15 (Nat'l. Pub. Fin. Guarantee Corp. Insured) (f) | | 1,430 | | 1,567 |
5.25% 7/1/18 (Nat'l. Pub. Fin. Guarantee Corp. Insured) (f) | | 3,205 | | 3,617 |
| | 7,413 |
Idaho - 0.2% |
Idaho Health Facilities Auth. Rev.: | | | | |
(St. Luke's Health Sys. Proj.) Series 2008 A: | | | | |
6.5% 11/1/28 | | 4,340 | | 5,078 |
6.75% 11/1/37 | | 4,300 | | 5,088 |
(Trinity Health Group Proj.) 2008 B, 6.25% 12/1/33 | | 2,190 | | 2,624 |
| | 12,790 |
Illinois - 13.0% |
Boone & Winnebago County Cmnty. Unit School District 200: | | | | |
0% 1/1/21 (Nat'l. Pub. Fin. Guarantee Corp. Insured) | | 1,810 | | 1,393 |
0% 1/1/22 (Nat'l. Pub. Fin. Guarantee Corp. Insured) | | 1,950 | | 1,425 |
Municipal Bonds - continued |
| Principal
Amount (000s) | | Value (000s) |
Illinois - continued |
Chicago Board of Ed.: | | | | |
Series 1999 A, 0% 12/1/16 (Nat'l. Pub. Fin. Guarantee Corp. Insured) | | $ 3,200 | | $ 2,992 |
Series 2011A, 5.5% 12/1/39 | | 7,900 | | 9,133 |
Series 2012 A, 5% 12/1/42 | | 19,200 | | 21,120 |
Chicago Gen. Oblig.: | | | | |
(Cap. Impt. Proj.) Series 1999: | | | | |
0% 1/1/27 (Nat'l. Pub. Fin. Guarantee Corp. Insured) | | 4,700 | | 2,588 |
0% 1/1/39 (Nat'l. Pub. Fin. Guarantee Corp. Insured) | | 15,200 | | 4,222 |
(City Colleges Proj.): | | | | |
0% 1/1/14 (Nat'l. Pub. Fin. Guarantee Corp. Insured) | | 17,000 | | 16,819 |
0% 1/1/15 (Nat'l. Pub. Fin. Guarantee Corp. Insured) | | 20,000 | | 19,444 |
(Neighborhoods Alive 21 Prog.): | | | | |
Series 2003, 5% 1/1/33 (AMBAC Insured) | | 2,100 | | 2,181 |
5% 1/1/28 (Pre-Refunded to 1/1/14 @ 100) | | 2,000 | | 2,093 |
Series 2003 A, 5.25% 1/1/22 (Nat'l. Pub. Fin. Guarantee Corp. Insured) | | 740 | | 742 |
Series 2003 C, 5% 1/1/35 (Nat'l. Pub. Fin. Guarantee Corp. Insured) | | 1,445 | | 1,499 |
Series 2004 A, 5.25% 1/1/29 (FSA Insured) | | 435 | | 453 |
Series 2007 C, 5% 1/1/30 (Nat'l. Pub. Fin. Guarantee Corp. Insured) | | 20,300 | | 22,051 |
Series 2009 A, 5% 1/1/27 (FSA Insured) | | 5,200 | | 5,806 |
Series 2011 A, 5% 1/1/40 | | 11,260 | | 12,135 |
Series 2012 A, 5% 1/1/33 | | 10,000 | | 11,181 |
Series A, 5% 1/1/42 (AMBAC Insured) | | 40 | | 40 |
Chicago Midway Arpt. Rev. Series B: | | | | |
5.25% 1/1/13 (Nat'l. Pub. Fin. Guarantee Corp. Insured) (f) | | 2,910 | | 2,910 |
5.25% 1/1/14 (Nat'l. Pub. Fin. Guarantee Corp. Insured) (f) | | 3,060 | | 3,069 |
Chicago Motor Fuel Tax Rev. Series A: | | | | |
5% 1/1/33 (AMBAC Insured) | | 3,810 | | 3,878 |
5.25% 1/1/19 (AMBAC Insured) | | 1,780 | | 1,823 |
Chicago O'Hare Int'l. Arpt. Rev.: | | | | |
Series 2008 A, 5% 1/1/16 (FSA Insured) | | 6,800 | | 7,613 |
Series 2011 C, 6.5% 1/1/41 | | 19,400 | | 24,796 |
Chicago Park District Gen. Oblig.: | | | | |
Series 2010 C, 5.25% 1/1/40 | | 7,700 | | 8,858 |
Municipal Bonds - continued |
| Principal
Amount (000s) | | Value (000s) |
Illinois - continued |
Chicago Park District Gen. Oblig.: - continued | | | | |
Series A: | | | | |
5.25% 1/1/18 (Nat'l. Pub. Fin. Guarantee Corp. Insured) | | $ 4,690 | | $ 4,803 |
5.25% 1/1/19 (Nat'l. Pub. Fin. Guarantee Corp. Insured) | | 3,000 | | 3,072 |
5.25% 1/1/20 (Nat'l. Pub. Fin. Guarantee Corp. Insured) | | 2,195 | | 2,247 |
Chicago Transit Auth. Cap. Grant Receipts Rev.: | | | | |
(Fed. Transit Administration Section 5307 Proj.): | | | | |
Series 2006 A, 5% 6/1/21 | | 2,600 | | 2,893 |
Series 2008 A: | | | | |
5.25% 6/1/23 (Assured Guaranty Corp. Insured) | | 2,425 | | 2,722 |
5.25% 6/1/25 (Assured Guaranty Corp. Insured) | | 3,495 | | 3,892 |
5% 6/1/20 (AMBAC Insured) | | 5,610 | | 6,271 |
5% 6/1/20 (Pre-Refunded to 12/1/16 @ 100) | | 1,390 | | 1,622 |
Chicago Wtr. Rev. Series 2000, 0% 11/1/16 (AMBAC Insured) | | 7,555 | | 6,865 |
Cook County Forest Preservation District: | | | | |
(Ltd. Tax Proj.) Series 2012 B, 5% 12/15/37 | | 2,500 | | 2,860 |
Series 2012 A, 5% 11/15/22 | | 2,000 | | 2,482 |
Series 2012 C, 5% 12/15/37 | | 1,000 | | 1,144 |
Cook County Gen. Oblig.: | | | | |
Series 2004 B: | | | | |
5.25% 11/15/26 (Pre-Refunded to 11/15/14 @ 100) | | 2,700 | | 2,947 |
5.25% 11/15/28 (Pre-Refunded to 11/15/14 @ 100) | | 1,400 | | 1,528 |
Series 2010 A, 5.25% 11/15/33 | | 19,775 | | 22,397 |
Series 2012 C: | | | | |
5% 11/15/24 | | 9,400 | | 11,162 |
5% 11/15/25 | | 14,500 | | 17,123 |
Series B, 5% 11/15/19 (Nat'l. Pub. Fin. Guarantee Corp. Insured) | | 2,600 | | 3,051 |
DuPage County Forest Preserve District Rev. Series 2000, 0% 11/1/17 | | 6,665 | | 6,157 |
Franklin Park Village Cook County Gen. Oblig. Series B, 5% 7/1/18 (AMBAC Insured) | | 1,450 | | 1,470 |
Grundy, Kendall & Will County Cmnty. High School District #111 Gen. Oblig. Series 2006 A: | | | | |
5.25% 5/1/25 (Nat'l. Pub. Fin. Guarantee Corp. Insured) | | 5,000 | | 5,546 |
Municipal Bonds - continued |
| Principal
Amount (000s) | | Value (000s) |
Illinois - continued |
Grundy, Kendall & Will County Cmnty. High School District #111 Gen. Oblig. Series 2006 A: - continued | | | | |
5.5% 5/1/23 (Nat'l. Pub. Fin. Guarantee Corp. Insured) | | $ 3,000 | | $ 3,372 |
Illinois Dedicated Tax Rev. Series B, 0% 12/15/18 (AMBAC Insured) | | 4,500 | | 3,715 |
Illinois Dev. Fin. Auth. Retirement Hsg. Regency Park Rev. 0% 7/15/23 (Escrowed to Maturity) | | 29,680 | | 22,776 |
Illinois Dev. Fin. Auth. Rev.: | | | | |
(DePaul Univ. Proj.) Series 2004 C, 5.625% 10/1/17 | | 2,800 | | 3,033 |
(Revolving Fund-Master Trust Prog.): | | | | |
5.5% 9/1/18 | | 5,365 | | 5,383 |
5.5% 9/1/19 | | 4,405 | | 4,420 |
Illinois Edl. Facilities Auth. Rev. (Univ. of Chicago Proj.) Series 2005 A, 5.25% 7/1/41 | | 55 | | 55 |
Illinois Fin. Auth. Gas Supply Rev. Bonds (Peoples Gas Lt. and Coke Co. Proj.) Series 2005 A, 4.3%, tender 6/1/16 (AMBAC Insured) (c) | | 3,860 | | 4,230 |
Illinois Fin. Auth. Rev.: | | | | |
(Advocate Health Care Proj.) Series 2010 A, 5.5% 4/1/44 | | 3,000 | | 3,321 |
(Advocate Heath Care Proj.) Series 2008 D, 6.5% 11/1/38 | | 4,300 | | 5,147 |
(Central DuPage Health Proj.) Series 2009 B, 5.375% 11/1/39 | | 6,500 | | 7,192 |
(Children's Memorial Hosp. Proj.) Series 2008 A: | | | | |
5.25% 8/15/33 (Assured Guaranty Corp. Insured) | | 7,800 | | 8,683 |
5.25% 8/15/47 (Assured Guaranty Corp. Insured) | | 2,000 | | 2,143 |
(Edward Hosp. Obligated Group Proj.) Series 2008 A: | | | | |
5.5% 2/1/40 (AMBAC Insured) | | 2,850 | | 3,035 |
6% 2/1/28 (AMBAC Insured) | | 2,080 | | 2,342 |
(Newman Foundation Proj.): | | | | |
5% 2/1/32 (Radian Asset Assurance, Inc. Insured) | | 1,300 | | 1,304 |
5% 2/1/37 (Radian Asset Assurance, Inc. Insured) | | 10,000 | | 9,986 |
(Northwest Cmnty. Hosp. Proj.) Series 2008 A, 5.5% 7/1/38 | | 12,615 | | 13,636 |
(Northwestern Memorial Hosp. Proj.) Series 2009 A, 6% 8/15/39 | | 4,000 | | 4,647 |
(Palos Cmnty. Hosp. Proj.) Series 2010 C, 5.375% 5/15/25 | | 25,230 | | 28,680 |
(Provena Health Proj.) Series 2010 A, 6% 5/1/28 | | 13,500 | | 15,346 |
(Rush Univ. Med. Ctr. Proj.): | | | | |
Series 2009 C, 6.625% 11/1/39 | | 8,200 | | 9,916 |
Municipal Bonds - continued |
| Principal
Amount (000s) | | Value (000s) |
Illinois - continued |
Illinois Fin. Auth. Rev.: - continued | | | | |
(Rush Univ. Med. Ctr. Proj.): | | | | |
Series 2009 D, 6.625% 11/1/39 | | $ 8,000 | | $ 9,674 |
(Sherman Health Systems Proj.) Series 2007 A, 5.5% 8/1/37 | | 15,775 | | 17,357 |
(Southern Illinois Healthcare Enterprises, Inc. Proj.) Series 2005, 5.25% 3/1/30 | | 5,900 | | 6,537 |
(The Carle Foundation Proj.) Series 2009 A, 5.5% 2/15/16 (Assured Guaranty Corp. Insured) | | 5,385 | | 5,967 |
(The Univ. of Chicago Med. Ctr. Proj.) Series 2009 B, 5% 8/15/23 | | 5,550 | | 6,415 |
Series 2012, 5% 11/15/43 | | 4,395 | | 4,713 |
Series 2008 A, 5.625% 1/1/37 | | 25,735 | | 28,158 |
Series 2009 A, 7.25% 11/1/38 | | 1,280 | | 1,589 |
Series 2009: | | | | |
6.875% 8/15/38 | | 430 | | 516 |
7% 8/15/44 | | 1,560 | | 1,874 |
Series 2010 A: | | | | |
5.5% 8/15/24 | | 2,830 | | 3,205 |
5.75% 8/15/29 | | 2,320 | | 2,624 |
Series 2012 A, 5% 5/15/22 | | 2,120 | | 2,462 |
Series 2012, 5% 9/1/38 | | 11,000 | | 11,621 |
5.25% 5/1/25 | | 7,000 | | 8,029 |
Illinois Gen. Oblig.: | | | | |
Series 2006: | | | | |
5% 1/1/19 | | 4,200 | | 4,826 |
5.5% 1/1/31 | | 3,000 | | 3,651 |
Series 2010, 5% 1/1/23 (FSA Insured) | | 6,600 | | 7,409 |
Series 2012: | | | | |
5% 3/1/23 | | 4,000 | | 4,595 |
5% 3/1/35 | | 2,000 | | 2,197 |
5% 3/1/37 | | 1,000 | | 1,093 |
Illinois Health Facilities Auth. Rev.: | | | | |
(Delnor-Cmnty. Hosp. Proj.) Series 2002 D, 5.25% 5/15/32 (FSA Insured) | | 3,000 | | 3,253 |
(Lake Forest Hosp. Proj.): | | | | |
Series A, 6.25% 7/1/22 | | 4,200 | | 4,218 |
6% 7/1/33 | | 3,775 | | 3,859 |
(Lutheran Gen. Health Care Sys. Proj.) Series C: | | | | |
6% 4/1/18 | | 3,000 | | 3,436 |
7% 4/1/14 | | 975 | | 1,010 |
(Sherman Hosp. Proj.) 5.25% 8/1/27 (AMBAC Insured) | | 3,000 | | 3,005 |
Municipal Bonds - continued |
| Principal
Amount (000s) | | Value (000s) |
Illinois - continued |
Illinois Reg'l. Trans. Auth. Series A, 8% 6/1/17 (AMBAC Insured) | | $ 4,500 | | $ 5,496 |
Illinois Sales Tax Rev. Series 2010, 5% 6/15/17 | | 13,500 | | 15,772 |
Illinois Unemployment Ins. Fund Bldg. Receipts Series 2012 A: | | | | |
5% 6/15/19 | | 2,900 | | 3,192 |
5% 12/15/19 | | 1,000 | | 1,101 |
Kane & DeKalb Counties Cmnty. Unit School District #302 5.5% 2/1/25 (FSA Insured) | | 3,000 | | 3,346 |
Kane, McHenry, Cook & DeKalb Counties Unit School District #300: | | | | |
Series 2001, 0% 12/1/17 (AMBAC Insured) | | 3,700 | | 3,430 |
Series 2007, 6.5% 1/1/20 (AMBAC Insured) | | 7,865 | | 9,900 |
0% 12/1/21 (AMBAC Insured) | | 5,000 | | 3,948 |
Lake County Cmnty. Consolidated School District #73 Gen. Oblig.: | | | | |
0% 12/1/14 (Escrowed to Maturity) | | 630 | | 623 |
0% 12/1/14 (Nat'l. Pub. Fin. Guarantee Corp. Insured) | | 1,370 | | 1,334 |
0% 12/1/16 (Escrowed to Maturity) | | 585 | | 564 |
0% 12/1/16 (Nat'l. Pub. Fin. Guarantee Corp. Insured) | | 1,905 | | 1,775 |
Lake County Cmnty. High School District #117, Antioch Series B, 0% 12/1/18 (Nat'l. Pub. Fin. Guarantee Corp. Insured) | | 7,240 | | 6,172 |
Lake County Forest Preservation District Series 2007 A, 0.556% 12/15/13 (c) | | 970 | | 970 |
Lake County Warren Township High School District #121, Gurnee Series C: | | | | |
5.5% 3/1/24 (Pre-Refunded to 3/1/14 @ 101) | | 2,945 | | 3,152 |
5.625% 3/1/21 (AMBAC Insured) | | 2,505 | | 2,665 |
5.75% 3/1/19 (Escrowed to Maturity) | | 2,240 | | 2,388 |
McHenry & Kane Counties Cmnty. Consolidated School District #158 Series 2003, 0% 1/1/19 (Nat'l. Pub. Fin. Guarantee Corp. Insured) | | 3,000 | | 2,387 |
Metropolitan Pier & Exposition: | | | | |
(McCormick Place Expansion Proj.): | | | | |
Series 1992 A, 0% 6/15/20 (Nat'l. Pub. Fin. Guarantee Corp. Insured) | | 3,610 | | 2,835 |
Series 1996 A, 0% 6/15/23 (Nat'l. Pub. Fin. Guarantee Corp. Insured) | | 5,300 | | 3,562 |
Series 2002 B, 5.5% 6/15/20 (Nat'l. Pub. Fin. Guarantee Corp. Insured) | | 2,000 | | 2,294 |
Municipal Bonds - continued |
| Principal
Amount (000s) | | Value (000s) |
Illinois - continued |
Metropolitan Pier & Exposition: - continued | | | | |
(McCormick Place Expansion Proj.): | | | | |
Series 2010 B1, 0% 6/15/44 (FSA Insured) | | $ 49,500 | | $ 10,637 |
Series 2012 B: | | | | |
0% 12/15/51 | | 16,200 | | 2,305 |
5% 6/15/52 | | 19,400 | | 21,136 |
Series A: | | | | |
0% 6/15/19 (Nat'l. Pub. Fin. Guarantee Corp. Insured) | | 3,305 | | 2,690 |
0% 6/15/19 (Nat'l. Pub. Fin. Guarantee Corp. Insured) | | 2,935 | | 2,466 |
0% 6/15/36 (Nat'l. Pub. Fin. Guarantee Corp. Insured) | | 4,445 | | 1,455 |
Series 1996 A, 0% 6/15/24 | | 3,060 | | 1,969 |
Series 2002 A, 0% 12/15/30 (Nat'l. Pub. Fin. Guarantee Corp. Insured) | | 32,600 | | 14,875 |
Series 2002, 0% 6/15/13 (Escrowed to Maturity) | | 4,155 | | 4,145 |
Series 2010 B1: | | | | |
0% 6/15/43 (FSA Insured) | | 45,400 | | 10,245 |
0% 6/15/45 (FSA Insured) | | 27,900 | | 5,655 |
0% 6/15/46 (FSA Insured) | | 6,250 | | 1,190 |
0% 6/15/47 (FSA Insured) | | 16,540 | | 2,998 |
Series A: | | | | |
0% 6/15/13 (Escrowed to Maturity) | | 5,415 | | 5,403 |
0% 12/15/19 (Nat'l. Pub. Fin. Guarantee Corp. Insured) | | 2,115 | | 1,708 |
0% 6/15/13 (Nat'l. Pub. Fin. Guarantee Corp. Insured) | | 210 | | 209 |
0% 6/15/15 | | 7,915 | | 7,502 |
0% 6/15/15 (Escrowed to Maturity) | | 5,355 | | 5,263 |
0% 6/15/15 (Escrowed to Maturity) | | 1,730 | | 1,700 |
Quincy Hosp. Rev.: | | | | |
(Blessing Hosp. Proj.) 5% 11/15/16 | | 1,200 | | 1,298 |
Series 2007, 5% 11/15/14 | | 1,000 | | 1,047 |
5% 11/15/18 | | 1,000 | | 1,092 |
Schaumburg Village Gen. Oblig. Series B, 5% 12/1/38 (Nat'l. Pub. Fin. Guarantee Corp. Insured) | | 11,350 | | 12,128 |
Univ. of Illinois Board of Trustees Ctfs. of Prtn. Series 2009 A: | | | | |
5% 10/1/17 | | 1,300 | | 1,512 |
5% 10/1/18 | | 1,435 | | 1,694 |
5% 10/1/20 | | 1,290 | | 1,513 |
Municipal Bonds - continued |
| Principal
Amount (000s) | | Value (000s) |
Illinois - continued |
Univ. of Illinois Rev.: | | | | |
(Auxiliary Facilities Sys. Proj.): | | | | |
Series 1991: | | | | |
0% 4/1/17 (Nat'l. Pub. Fin. Guarantee Corp. Insured) | | $ 16,270 | | $ 15,016 |
0% 4/1/20 (Nat'l. Pub. Fin. Guarantee Corp. Insured) | | 8,000 | | 6,522 |
Series 1999 A, 0% 4/1/21 (Nat'l. Pub. Fin. Guarantee Corp. Insured) | | 4,965 | | 3,800 |
Series 2009 A, 5.75% 4/1/38 | | 7,805 | | 8,828 |
Series 2010 A: | | | | |
5% 4/1/25 | | 5,125 | | 5,877 |
5.25% 4/1/30 | | 3,200 | | 3,661 |
Will County Cmnty. Unit School District #365-U: | | | | |
0% 11/1/14 (Escrowed to Maturity) | | 2,305 | | 2,275 |
0% 11/1/14 (FSA Insured) | | 1,995 | | 1,955 |
0% 11/1/16 (Escrowed to Maturity) | | 1,615 | | 1,552 |
0% 11/1/16 (FSA Insured) | | 4,885 | | 4,575 |
0% 11/1/17 (FSA Insured) | | 3,200 | | 2,908 |
0% 11/1/19 (Escrowed to Maturity) | | 675 | | 606 |
0% 11/1/19 (FSA Insured) | | 4,325 | | 3,653 |
| | 880,142 |
Indiana - 3.1% |
Avon 2000 Cmnty. School Bldg. Corp. Series 2005, 5% 7/15/17 (FSA Insured) | | 2,835 | | 3,093 |
Clark-Pleasant 2004 School Bldg. Corp.: | | | | |
5.25% 7/15/23 (Pre-Refunded to 7/15/15 @ 100) | | 1,545 | | 1,731 |
5.25% 7/15/25 (Pre-Refunded to 7/15/15 @ 100) | | 1,720 | | 1,927 |
Crown Point Multi-School Bldg. Corp. 0% 1/15/21 (Nat'l. Pub. Fin. Guarantee Corp. Insured) | | 7,480 | | 6,026 |
Franklin Township Independent School Bldg. Corp., Marion County: | | | | |
5% 7/15/24 (Nat'l. Pub. Fin. Guarantee Corp. Insured) | | 895 | | 980 |
5% 7/15/24 (Pre-Refunded to 7/15/15 @ 100) | | 470 | | 523 |
5.25% 7/15/17 (Pre-Refunded to 7/15/15 @ 100) | | 1,885 | | 2,112 |
GCS School Bldg. Corp. One 5% 7/15/22 (FSA Insured) | | 1,545 | | 1,682 |
Hobart Bldg. Corp. Series 2006, 6.5% 1/15/29 (Nat'l. Pub. Fin. Guarantee Corp. Insured) | | 25,900 | | 33,001 |
Indiana Bond Bank Series B: | | | | |
5% 2/1/19 (Pre-Refunded to 8/1/13 @ 100) | | 1,940 | | 1,992 |
Municipal Bonds - continued |
| Principal
Amount (000s) | | Value (000s) |
Indiana - continued |
Indiana Bond Bank Series B: - continued | | | | |
5% 2/1/20 (Pre-Refunded to 8/1/13 @ 100) | | $ 1,635 | | $ 1,679 |
Indiana Dev. Fin. Auth. Solid Waste Disp. Rev. Bonds (Waste Mgmt., Inc. Proj.) Series 2001, 4.7%, tender 10/1/15 (c)(f) | | 3,500 | | 3,729 |
Indiana Fin. Auth. Health Sys. Rev. (Sisters of Saint Francis Health Svcs., Inc. Obligated Group Proj.): | | | | |
Series 2008 C, 5.375% 11/1/32 | | 7,815 | | 8,659 |
Series 2009 A, 5.25% 11/1/39 | | 5,300 | | 5,828 |
Indiana Fin. Auth. Rev.: | | | | |
(Trinity Health Cr. Group Proj.) Series 2009 A, 5.25% 12/1/38 | | 8,000 | | 8,857 |
Series 2012: | | | | |
5% 3/1/30 | | 2,500 | | 2,773 |
5% 3/1/41 | | 3,900 | | 4,212 |
Indiana Health & Edl. Facilities Fing. Auth. Hosp. Rev. Series B: | | | | |
5% 2/15/14 | | 1,060 | | 1,111 |
5% 2/15/15 | | 1,500 | | 1,633 |
Indiana Health & Edl. Facilities Fing. Auth. Rev. Bonds (Ascension Health Sr. Cr. Group Proj.) Series 2006 B1, 4.1%, tender 11/3/16 (c) | | 11,200 | | 12,511 |
Indiana Health Facilities Fing. Auth. Hosp. Rev. (Columbus Reg'l. Hosp. Proj.) Series 1993, 7% 8/15/15 (FSA Insured) | | 1,220 | | 1,267 |
Indiana Health Facility Fing. Auth. Rev. Bonds: | | | | |
(Ascension Health Cr. Group Proj.) Series 2001 A2, 1.6%, tender 2/1/17 (c) | | 7,700 | | 7,850 |
(Ascension Health Subordinate Cr. Proj.) Series 2005 A1, 5%, tender 5/1/13 (c) | | 3,000 | | 3,046 |
Indiana Muni. Pwr. Agcy. Pwr. Supply Sys. Rev.: | | | | |
Series 2011 A: | | | | |
5% 1/1/22 | | 2,000 | | 2,413 |
5% 1/1/23 | | 1,800 | | 2,151 |
Series A, 5% 1/1/32 (Nat'l. Pub. Fin. Guarantee Corp. Insured) | | 2,500 | | 2,663 |
Indiana State Fin. Auth. Wastewtr.: | | | | |
(CWA Auth. Proj.) Series 2012 A: | | | | |
5% 10/1/26 | | 2,545 | | 3,077 |
5% 10/1/37 | | 4,500 | | 5,169 |
Series 2011 A, 5.25% 10/1/25 | | 1,750 | | 2,126 |
Series 2011 B, 5% 10/1/41 | | 5,500 | | 6,108 |
Municipal Bonds - continued |
| Principal
Amount (000s) | | Value (000s) |
Indiana - continued |
Indiana Trans. Fin. Auth. Hwy. Rev. Series 1993 A: | | | | |
0% 6/1/16 (AMBAC Insured) | | $ 6,470 | | $ 6,044 |
0% 6/1/18 (AMBAC Insured) | | 1,700 | | 1,508 |
Indianapolis Local Pub. Impt. Bond Bank (Indianapolis Arpt. Auth. Proj.) Series 2006 F: | | | | |
5% 1/1/16 (AMBAC Insured) (f) | | 1,525 | | 1,699 |
5% 1/1/17 (AMBAC Insured) (f) | | 1,700 | | 1,923 |
5.25% 1/1/14 (AMBAC Insured) (f) | | 2,675 | | 2,800 |
Jasper County Indl. Poll. Ctl. Rev. (Northern Indiana Pub. Svc. Co. Proj.) Series 1988 C, 5.6% 11/1/16 (Nat'l. Pub. Fin. Guarantee Corp. Insured) | | 4,000 | | 4,482 |
Lake Central Multi-District School Bldg. Corp. Series 2012 B: | | | | |
4% 7/15/18 | | 400 | | 454 |
5% 1/15/30 | | 24,540 | | 29,091 |
Purdue Univ. Rev. (Student Facilities Sys. Proj.) Series 2009 B: | | | | |
5% 7/1/24 | | 1,150 | | 1,349 |
5% 7/1/25 | | 1,000 | | 1,167 |
5% 7/1/26 | | 1,325 | | 1,540 |
5% 7/1/29 | | 670 | | 772 |
5% 7/1/35 | | 3,000 | | 3,376 |
Southmont School Bldg. Corp. Series 2004, 5% 7/15/15 (Pre-Refunded to 1/15/13 @ 100) | | 2,000 | | 2,003 |
Wayne Township Marion County School Bldg. Corp. Series 2007, 5.5% 1/15/31 (Nat'l. Pub. Fin. Guarantee Corp. Insured) | | 5,560 | | 6,124 |
Westfield Washington Multi-School Bldg. Corp. Series A, 5% 7/15/18 (FSA Insured) | | 1,500 | | 1,620 |
Zionsville Cmnty. Schools Bldg. Series 2005, 5% 7/15/20 (FSA Insured) | | 1,945 | | 2,336 |
| | 208,217 |
Iowa - 0.1% |
Iowa Fin. Auth. Health Facilities Rev. Series 2008 A, 5.625% 8/15/37 (Assured Guaranty Corp. Insured) | | 4,800 | | 5,464 |
Kansas - 0.7% |
Kansas Dev. Fin. Agcy. (Adventist Health Sys./Sunbelt Obligated Group Proj.): | | | | |
Series 2009 C, 5.75% 11/15/38 | | 10,600 | | 12,303 |
Series 2009 D, 5% 11/15/29 | | 4,600 | | 5,084 |
Municipal Bonds - continued |
| Principal
Amount (000s) | | Value (000s) |
Kansas - continued |
Kansas Dev. Fin. Auth. Health Facilities Rev.: | | | | |
(Hayes Med. Ctr., Inc. Proj.) Series 2010 Q, 5% 5/15/35 | | $ 4,000 | | $ 4,306 |
(KU Health Sys. Proj.) Series 2011 H, 5.125% 3/1/39 | | 2,500 | | 2,704 |
Leavenworth County Unified School District #453 Gen. Oblig. Series 2009 A, 5.25% 9/1/24 (Assured Guaranty Corp. Insured) | | 1,575 | | 1,873 |
Overland Park Sales Tax Spl. Oblig. Rev. Series 2012, 4.375% 12/15/23 | | 4,800 | | 4,792 |
Topeka Combined Util. Impt. Rev. Series 2005 A: | | | | |
6% 8/1/20 (XL Cap. Assurance, Inc. Insured) | | 1,200 | | 1,359 |
6% 8/1/25 (XL Cap. Assurance, Inc. Insured) | | 1,100 | | 1,235 |
6% 8/1/27 (XL Cap. Assurance, Inc. Insured) | | 1,235 | | 1,386 |
Wichita Hosp. Facilities Rev. (Via Christi Health Sys., Inc. Proj.) Series 2009 X: | | | | |
4% 11/15/18 | | 1,300 | | 1,455 |
5% 11/15/17 | | 2,500 | | 2,901 |
Wyandotte County/Kansas City Unified Govt. Util. Sys. Rev. Series 2012 A: | | | | |
5% 9/1/23 | | 1,860 | | 2,251 |
5% 9/1/25 | | 4,000 | | 4,792 |
| | 46,441 |
Kentucky - 1.4% |
Ashland Med. Ctr. Rev. (Ashland Hosp. Corp. d/b/a/ King's Daughters Med. Ctr. Proj.) Series 2010 B, 5% 2/1/22 | | 1,355 | | 1,513 |
Kentucky Econ. Dev. Fin. Auth. Hosp. Rev.: | | | | |
(Baptist Healthcare Sys. Proj.) Series A: | | | | |
5% 8/15/16 | | 9,410 | | 10,494 |
5% 8/15/17 | | 3,650 | | 4,144 |
(St. Elizabeth Med. Ctr., Inc. Proj.) Series 2009 A, 5.5% 5/1/39 | | 4,000 | | 4,426 |
Kentucky Econ. Dev. Fin. Auth. Rev. (Ashland Hosp. Corp. d/b/a/ King's Daughters Med. Ctr. Proj.) Series 2010 A, 5% 2/1/30 | | 5,000 | | 5,379 |
Louisville & Jefferson County Metropolitan Govt. Health Facilities Rev. (Jewish Hosp. & St. Mary's HealthCare Proj.) Series 2008, 6.125% 2/1/37 (Pre-Refunded to 2/1/18 @ 100) | | 36,220 | | 45,731 |
Municipal Bonds - continued |
| Principal
Amount (000s) | | Value (000s) |
Kentucky - continued |
Louisville & Jefferson County Metropolitan Swr. District Swr. & Drain Sys. Rev. Series A, 5.25% 5/15/37 (Nat'l. Pub. Fin. Guarantee Corp. Insured) | | $ 15,750 | | $ 16,615 |
Pikeville Hosp. Rev. (Pikeville Med. Ctr., Inc. Proj.) Series 2011, 6.5% 3/1/41 | | 3,000 | | 3,527 |
| | 91,829 |
Louisiana - 0.9% |
Louisiana Pub. Facilities Auth. Rev. (Nineteenth Judicial District Court Proj.) Series 2007: | | | | |
5.375% 6/1/19 (Nat'l. Pub. Fin. Guarantee Corp. Insured) | | 1,000 | | 1,140 |
5.375% 6/1/32 (Nat'l. Pub. Fin. Guarantee Corp. Insured) | | 1,900 | | 2,067 |
5.5% 6/1/41 (Nat'l. Pub. Fin. Guarantee Corp. Insured) | | 15,500 | | 16,716 |
Monroe-West Monroe Pub. Trust Fing. Auth. Mtg. Rev. Series C, 0% 8/20/14 | | 8,625 | | 8,288 |
New Orleans Aviation Board Rev.: | | | | |
Series 2007 A, 5% 1/1/17 (FSA Insured) (f) | | 1,420 | | 1,565 |
Series 2007 B2, 5% 1/1/16 (FSA Insured) (f) | | 1,000 | | 1,086 |
New Orleans Gen. Oblig.: | | | | |
Series 2005: | | | | |
5% 12/1/29 (Nat'l. Pub. Fin. Guarantee Corp. Insured) | | 4,690 | | 4,977 |
5.25% 12/1/24 (Nat'l. Pub. Fin. Guarantee Corp. Insured) | | 3,450 | | 3,734 |
Series 2012: | | | | |
5% 12/1/22 | | 8,645 | | 10,117 |
5% 12/1/30 | | 2,000 | | 2,253 |
5% 12/1/31 | | 1,000 | | 1,121 |
5% 12/1/32 | | 1,500 | | 1,672 |
0% 9/1/13 (AMBAC Insured) | | 3,350 | | 3,293 |
0% 9/1/14 (AMBAC Insured) | | 3,165 | | 3,027 |
Tobacco Settlement Fing. Corp. Series 2001 B, 5.875% 5/15/39 | | 1,000 | | 1,024 |
| | 62,080 |
Maine - 0.2% |
Maine Tpk. Auth. Tpk. Rev.: | | | | |
Series 2007, 5.25% 7/1/37 (AMBAC Insured) | | 9,060 | | 9,979 |
6% 7/1/38 | | 2,700 | | 3,201 |
| | 13,180 |
Municipal Bonds - continued |
| Principal
Amount (000s) | | Value (000s) |
Maryland - 0.6% |
Baltimore Convention Ctr. Hotel Rev. Series A, 5.25% 9/1/39 (XL Cap. Assurance, Inc. Insured) | | $ 4,710 | | $ 4,785 |
Baltimore Proj. Rev. (Wtr. Proj.) Series 2009 A, 5.75% 7/1/39 | | 1,250 | | 1,468 |
Maryland Econ. Dev. Corp. Student Hsg. Rev. (Univ. of Maryland, Baltimore County Student Hsg. Proj.) Series 2006: | | | | |
5% 6/1/14 (CIFG North America Insured) | | 1,020 | | 1,083 |
5% 6/1/16 (CIFG North America Insured) | | 1,000 | | 1,119 |
5% 6/1/19 (CIFG North America Insured) | | 1,500 | | 1,638 |
Maryland Health & Higher Edl. Facilities Auth. Rev.: | | | | |
(Anne Arundel Health Sys. Proj.) Series 2010, 5% 7/1/40 | | 2,000 | | 2,162 |
(Doctors Cmnty. Hosp. Proj.) Series 2010, 5.75% 7/1/38 | | 2,245 | | 2,465 |
(Johns Hopkins Med. Institutions Utils. Proj.) Series 2005 B, 5% 5/15/35 | | 2,700 | | 2,942 |
(Univ. of Maryland Med. Sys. Proj.) Series 2010, 5.125% 7/1/39 | | 4,400 | | 4,823 |
(Upper Chesapeake Hosp. Proj.) Series 2008 C, 6% 1/1/38 | | 3,000 | | 3,368 |
(Washington County Health Sys. Proj.) Series 2008: | | | | |
6% 1/1/28 | | 5,000 | | 5,503 |
6% 1/1/43 | | 1,500 | | 1,619 |
Washington Suburban San. District 5% 6/1/20 | | 6,630 | | 8,193 |
| | 41,168 |
Massachusetts - 2.2% |
Massachusetts Bay Trans. Auth. Series 1992 B, 6.2% 3/1/16 | | 3,800 | | 4,088 |
Massachusetts Dev. Fin. Agcy. Rev.: | | | | |
(Boston Univ. Proj.) Series U4, 5.7% 10/1/40 | | 7,500 | | 8,383 |
Bonds (Dominion Energy Brayton Point Proj.) Series 2010 A, 2.25%, tender 9/1/16 (c) | | 2,135 | | 2,201 |
Series I, 6.75% 1/1/36 | | 3,000 | | 3,598 |
Massachusetts Gen. Oblig. Series 2007 C: | | | | |
5.25% 8/1/22 | | 7,700 | | 9,111 |
5.25% 8/1/23 | | 3,600 | | 4,254 |
5.25% 8/1/24 | | 9,000 | | 10,605 |
Massachusetts Health & Edl. Facilities Auth. Rev.: | | | | |
(Blood Research Institute Proj.) Series A, 6.5% 2/1/22 (g) | | 2,825 | | 2,838 |
(South Shore Hosp. Proj.) Series F, 5.75% 7/1/29 | | 4,455 | | 4,462 |
Municipal Bonds - continued |
| Principal
Amount (000s) | | Value (000s) |
Massachusetts - continued |
Massachusetts Health & Edl. Facilities Auth. Rev.: - continued | | | | |
Bonds (Baystate Health Sys. Proj.) Series 2009 K, 5%, tender 7/1/13 (c) | | $ 4,000 | | $ 4,072 |
Massachusetts Port Auth. Spl. Facilities Rev. (Delta Air Lines, Inc. Proj.) Series 2001 A, 5.5% 1/1/14 (AMBAC Insured) (f) | | 2,540 | | 2,548 |
Massachusetts School Bldg. Auth. Dedicated Sales Tax Rev.: | | | | |
Series 2005 A: | | | | |
5% 8/15/23 (Pre-Refunded to 8/15/15 @ 100) | | 29,965 | | 33,537 |
5% 8/15/26 (Pre-Refunded to 8/15/15 @ 100) | | 10,000 | | 11,192 |
5% 8/15/30 (Pre-Refunded to 8/15/15 @ 100) | | 3,865 | | 4,315 |
Series 2007 A: | | | | |
4.5% 8/15/35 | | 13,790 | | 14,916 |
5% 8/15/22 (AMBAC Insured) | | 2,900 | | 3,395 |
Series 2012 A, 5% 8/15/30 (Pre-Refunded to 8/15/15 @ 100) | | 24,035 | | 26,833 |
Massachusetts Wtr. Poll. Abatement Trust Wtr. Poll. Abatement Rev. (MWRA Ln. Prog.) Series 1998 A, 5.25% 8/1/13 | | 90 | | 90 |
| | 150,438 |
Michigan - 2.3% |
Detroit School District Series 2012 A, 5% 5/1/23 | | 4,000 | | 4,747 |
Detroit Swr. Disp. Rev.: | | | | |
Series 2001 E, 5.75% 7/1/31 (Berkshire Hathaway Assurance Corp. Insured) (FGIC Insured) | | 8,000 | | 9,291 |
Series 2003 B, 7.5% 7/1/33 (FSA Insured) | | 4,200 | | 5,232 |
Series 2006, 5% 7/1/36 (Nat'l. Pub. Fin. Guarantee Corp. Insured) | | 20,700 | | 20,978 |
Detroit Wtr. Supply Sys. Rev.: | | | | |
Series 2003 A, 5% 7/1/34 (Nat'l. Pub. Fin. Guarantee Corp. Insured) | | 12,000 | | 12,203 |
Series 2004 A, 5.25% 7/1/15 (Nat'l. Pub. Fin. Guarantee Corp. Insured) | | 2,380 | | 2,568 |
Series 2004, 5.25% 7/1/16 (Nat'l. Pub. Fin. Guarantee Corp. Insured) | | 1,685 | | 1,859 |
Series 2005 B, 5.5% 7/1/35 (Berkshire Hathaway Assurance Corp. Insured) (FGIC Insured) | | 5,000 | | 5,459 |
Series 2006 B, 7% 7/1/36 (FSA Insured) | | 4,900 | | 5,913 |
DeWitt Pub. Schools Gen. Oblig. 5% 5/1/21 (Nat'l. Pub. Fin. Guarantee Corp. Insured) | | 1,650 | | 1,900 |
Municipal Bonds - continued |
| Principal
Amount (000s) | | Value (000s) |
Michigan - continued |
Ferris State Univ. Rev. 5% 10/1/20 (Nat'l. Pub. Fin. Guarantee Corp. Insured) | | $ 3,165 | | $ 3,308 |
Fowlerville Cmnty. School District 5.25% 5/1/17 (Pre-Refunded to 5/1/14 @ 100) | | 1,425 | | 1,518 |
Kent Hosp. Fin. Auth. Hosp. Facilities Rev. Bonds (Spectrum Health Sys. Proj.) Series 2008 A, 5.25%, tender 1/15/14 (c) | | 3,300 | | 3,451 |
Lansing Board Wtr. & Lt. Rev. 5.5% 7/1/41 | | 2,500 | | 2,939 |
Lapeer Cmnty. Schools Series 2007, 5% 5/1/33 (FSA Insured) | | 2,600 | | 2,851 |
Michigan Fin. Auth. Rev.: | | | | |
Series 2012 A: | | | | |
4.125% 6/1/32 | | 5,950 | | 5,868 |
5% 6/1/20 | | 2,050 | | 2,329 |
5% 6/1/27 | | 3,000 | | 3,275 |
5% 6/1/39 | | 5,375 | | 5,680 |
Series 2012 B, 5% 7/1/22 | | 3,900 | | 4,417 |
Series 2012, 5% 11/15/42 | | 11,825 | | 12,851 |
Michigan Hosp. Fin. Auth. Rev.: | | | | |
(McLaren Health Care Corp. Proj.) Series 2008 A, 5.75% 5/15/38 | | 3,000 | | 3,366 |
(Sisters of Mercy Health Corp. Proj.) Series 1993, 5.375% 8/15/14 (Escrowed to Maturity) | | 95 | | 99 |
(Trinity Health Sys. Proj.): | | | | |
Series 2008 A, 6.5% 12/1/33 | | 4,000 | | 4,849 |
5% 12/1/26 | | 1,115 | | 1,238 |
5% 12/1/26 (Pre-Refunded to 12/1/16 @ 100) | | 245 | | 286 |
Series 2012 A: | | | | |
5% 6/1/23 | | 2,395 | | 2,787 |
5% 6/1/26 | | 2,000 | | 2,273 |
Portage Pub. Schools 5% 5/1/21 (FSA Insured) | | 6,300 | | 7,453 |
Royal Oak Hosp. Fin. Auth. Hosp. Rev. (William Beaumont Hosp. Proj.) Series 2009 V, 8.25% 9/1/39 | | 3,400 | | 4,341 |
Three Rivers Cmnty. Schools 5% 5/1/21 (FSA Insured) | | 1,710 | | 1,957 |
Wayne County Arpt. Auth. Rev.: | | | | |
Series 2010 A, 5% 12/1/18 (f) | | 2,100 | | 2,434 |
Series 2011 A, 5% 12/1/19 (f) | | 3,805 | | 4,384 |
| | 154,104 |
Minnesota - 0.9% |
Maple Grove Health Care Sys. Rev.: | | | | |
(Maple Grove Hosp. Corp. Proj.) Series 2007, 5.25% 5/1/28 | | 3,500 | | 3,721 |
Municipal Bonds - continued |
| Principal
Amount (000s) | | Value (000s) |
Minnesota - continued |
Maple Grove Health Care Sys. Rev.: - continued | | | | |
5% 5/1/20 | | $ 1,000 | | $ 1,087 |
Minneapolis & Saint Paul Hsg. & Redev. Auth. Health Care Sys. Rev. (HealthPartners Obligated Group Proj.) 6% 12/1/18 | | 1,000 | | 1,046 |
Minneapolis & Saint Paul Metropolitan Arpts. Commission Arpt. Rev. Series 2005 A, 5% 1/1/35 (AMBAC Insured) | | 4,000 | | 4,266 |
Minnesota 911 Rev. (Pub. Safety Radio Communications Sys. Proj.) Series 2009, 5% 6/1/20 (Assured Guaranty Corp. Insured) | | 3,835 | | 4,699 |
Minnesota Agric. & Econ. Dev. Board Rev. (Health Care Sys. Proj.) Series 2000 A, 6.375% 11/15/29 | | 210 | | 211 |
Saint Paul Port Auth. Lease Rev. Series 2003 11: | | | | |
5.25% 12/1/18 | | 1,710 | | 1,786 |
5.25% 12/1/19 | | 2,850 | | 2,977 |
St. Louis Park Health Care Facilities Rev. (Park Nicollet Health Svcs. Proj.): | | | | |
Series 2008 C, 5.5% 7/1/18 | | 5,600 | | 6,589 |
Series 2009, 5.75% 7/1/39 | | 20,700 | | 23,435 |
St. Paul Hsg. & Redev. Auth. Health Care Facilities Rev. (HealthPartners Oblig. Group Proj.): | | | | |
Series 2006, 5.25% 5/15/36 | | 4,250 | | 4,466 |
5.25% 5/15/18 | | 1,650 | | 1,826 |
5.25% 5/15/23 | | 2,000 | | 2,149 |
| | 58,258 |
Mississippi - 0.0% |
Mississippi Hosp. Equip. & Facilities Auth. (Mississippi Baptist Med. Ctr. Proj.) Series 2007 A, 5% 8/15/14 | | 2,500 | | 2,624 |
Missouri - 0.1% |
Metropolitan St. Louis Swr. District Wastewtr. Sys. Rev. Series 2008 A, 5.75% 5/1/38 | | 1,000 | | 1,171 |
Missouri Dev. Fin. Board Infrastructure Facilities Rev. (City of Branson-Branson Landing Proj.) Series 2005 A, 6% 6/1/20 | | 2,125 | | 2,522 |
| | 3,693 |
Montana - 0.1% |
Forsyth Poll. Cont. Rev. (Portland Gen. Elec. Co. Proj.) Series 1998 A, 5% 5/1/33 | | 3,900 | | 4,434 |
Nebraska - 0.5% |
Central Plains Energy Proj. Rev. (Nebraska Gas Proj.) Series 2007 B, 0.708% 12/1/17 (c) | | 7,900 | | 7,258 |
Municipal Bonds - continued |
| Principal
Amount (000s) | | Value (000s) |
Nebraska - continued |
Douglas County Hosp. Auth. #2 Health Facilities Rev. (Children's Hosp. Proj.): | | | | |
6% 8/15/23 | | $ 2,130 | | $ 2,414 |
6% 8/15/28 | | 3,500 | | 3,943 |
6.125% 8/15/31 | | 2,250 | | 2,533 |
Nebraska Pub. Pwr. District Rev. Series 2012 C: | | | | |
5% 1/1/23 | | 2,250 | | 2,598 |
5% 1/1/24 | | 1,000 | | 1,151 |
Omaha Pub. Pwr. District Elec. Rev. Series A: | | | | |
5% 2/1/34 (Pre-Refunded to 2/1/14 @ 100) | | 4,700 | | 4,937 |
5% 2/1/46 (Pre-Refunded to 2/1/14 @ 100) | | 5,500 | | 5,778 |
| | 30,612 |
Nevada - 0.4% |
Clark County Arpt. Rev. Series 2003 C: | | | | |
5.375% 7/1/17 (AMBAC Insured) (f) | | 4,310 | | 4,392 |
5.375% 7/1/19 (AMBAC Insured) (f) | | 1,100 | | 1,121 |
5.375% 7/1/21 (AMBAC Insured) (f) | | 1,600 | | 1,629 |
Clark County Wtr. Reclamation District Series 2009 A, 5.25% 7/1/29 (Berkshire Hathaway Assurance Corp. Insured) | | 4,300 | | 5,161 |
Las Vegas Valley Wtr. District Wtr. Impt. Gen. Oblig. Series 2011 C, 5% 6/1/24 | | 5,415 | | 6,513 |
Washoe County Gen. Oblig. (Reno Sparks Proj.) Series B: | | | | |
0% 7/1/13 (FSA Insured) | | 4,590 | | 4,560 |
0% 7/1/14 (FSA Insured) | | 3,000 | | 2,926 |
| | 26,302 |
New Hampshire - 0.5% |
New Hampshire Bus. Fin. Auth. Rev. Series 2009 A, 6.125% 10/1/39 | | 9,300 | | 10,551 |
New Hampshire Health & Ed. Facilities Auth. Rev.: | | | | |
(Dartmouth College Proj.) Series 2009, 5.25% 6/1/39 | | 4,000 | | 4,710 |
(Dartmouth-Hitchcock Obligated Group Proj.) Series 2010, 5% 8/1/40 | | 4,700 | | 5,136 |
Series 2012: | | | | |
4% 7/1/32 | | 1,800 | | 1,824 |
5% 7/1/24 | | 1,000 | | 1,157 |
5% 7/1/25 | | 1,185 | | 1,365 |
New Hampshire Tpk. Sys. Rev.: | | | | |
Series 2012 B: | | | | |
5% 2/1/19 | | 2,000 | | 2,410 |
Municipal Bonds - continued |
| Principal
Amount (000s) | | Value (000s) |
New Hampshire - continued |
New Hampshire Tpk. Sys. Rev.: - continued | | | | |
Series 2012 B: | | | | |
5% 2/1/24 | | $ 1,775 | | $ 2,151 |
5% 10/1/18 | | 4,315 | | 5,177 |
| | 34,481 |
New Jersey - 1.3% |
Garden State Preservation Trust Open Space & Farmland Preservation Series 2005 A, 5.8% 11/1/19 (Pre-Refunded to 11/1/15 @ 100) | | 5,100 | | 5,863 |
New Jersey Econ. Dev. Auth. School Facilities Construction Rev.: | | | | |
Series 2005 O: | | | | |
5.125% 3/1/28 | | 6,000 | | 6,467 |
5.125% 3/1/30 | | 5,000 | | 5,372 |
5.25% 3/1/21 (Nat'l. Pub. Fin. Guarantee Corp. Insured) | | 2,800 | | 3,059 |
5.25% 3/1/23 | | 4,500 | | 4,892 |
5.25% 3/1/25 | | 9,900 | | 10,741 |
5.25% 3/1/26 | | 11,305 | | 12,250 |
Series 2005 P, 5.125% 9/1/28 | | 2,445 | | 2,689 |
Series 2009 AA, 5.5% 12/15/29 | | 4,000 | | 4,666 |
Series 2012, 5% 6/15/21 | | 4,600 | | 5,349 |
New Jersey Health Care Facilities Fing. Auth. Rev. Series 2008, 6.625% 7/1/38 | | 8,630 | | 9,967 |
New Jersey Tpk. Auth. Tpk. Rev. Series 2009 E, 5.25% 1/1/40 | | 3,000 | | 3,371 |
New Jersey Trans. Trust Fund Auth.: | | | | |
Series 2001 A, 6% 6/15/35 | | 3,900 | | 4,771 |
Series B, 5.5% 12/15/21 (Nat'l. Pub. Fin. Guarantee Corp. Insured) | | 5,000 | | 6,324 |
Union County Impt. Auth. (Juvenile Detention Ctr. Facility Proj.) Series 2005, 5.5% 5/1/28 (Nat'l. Pub. Fin. Guarantee Corp. Insured) | | 5,560 | | 5,857 |
| | 91,638 |
New Mexico - 0.1% |
New Mexico Edl. Assistance Foundation Series 2010 A1: | | | | |
4% 12/1/17 | | 5,000 | | 5,529 |
5% 12/1/18 | | 2,000 | | 2,315 |
| | 7,844 |
Municipal Bonds - continued |
| Principal
Amount (000s) | | Value (000s) |
New York - 12.4% |
Albany Indl. Dev. Agcy. Civic Facility Rev. (St. Peters Hosp. Proj.) Series 2008 A: | | | | |
5.25% 11/15/16 | | $ 1,955 | | $ 2,255 |
5.25% 11/15/17 (St.Peters Hosp. Insured) | | 1,500 | | 1,767 |
Erie County Indl. Dev. Agcy. School Facilities Rev. (Buffalo City School District Proj.) Series 2004: | | | | |
5.75% 5/1/16 (Pre-Refunded to 5/1/14 @ 100) | | 13,120 | | 14,072 |
5.75% 5/1/18 (Pre-Refunded to 5/1/14 @ 100) | | 14,720 | | 15,788 |
5.75% 5/1/20 (Pre-Refunded to 5/1/14 @ 100) | | 8,000 | | 8,581 |
5.75% 5/1/21 (Pre-Refunded to 5/1/14 @ 100) | | 3,845 | | 4,124 |
5.75% 5/1/22 (Pre-Refunded to 5/1/14 @ 100) | | 1,000 | | 1,073 |
5.75% 5/1/23 (Pre-Refunded to 5/1/14 @ 100) | | 3,000 | | 3,218 |
5.75% 5/1/24 (Pre-Refunded to 5/1/14 @ 100) | | 3,000 | | 3,218 |
5.75% 5/1/25 (Pre-Refunded to 5/1/14 @ 100) | | 3,400 | | 3,647 |
5.75% 5/1/26 (Pre-Refunded to 5/1/14 @ 100) | | 5,200 | | 5,577 |
Hudson Yards Infrastructure Corp. New York Rev.: | | | | |
Series 2012 A, 5.75% 2/15/47 | | 14,600 | | 17,310 |
Series A: | | | | |
5% 2/15/47 | | 14,500 | | 15,360 |
5% 2/15/47 | | 13,100 | | 13,877 |
Long Island Pwr. Auth. Elec. Sys. Rev. Series 2012 A, 5% 9/1/42 | | 13,000 | | 14,597 |
New York City Gen. Oblig.: | | | | |
Series 2003 A: | | | | |
5.5% 8/1/20 (Nat'l. Pub. Fin. Guarantee Corp. Insured) | | 6,990 | | 7,193 |
5.5% 8/1/20 (Pre-Refunded to 8/1/13 @ 100) | | 50 | | 52 |
Series 2008 A1, 5.25% 8/15/27 | | 9,940 | | 11,746 |
Series 2008 D1, 5.125% 12/1/22 | | 5,000 | | 6,004 |
Series 2009 I-1, 5.625% 4/1/29 | | 3,600 | | 4,398 |
Series 2012 A, 5% 8/1/24 | | 7,400 | | 8,896 |
Series 2012 F, 5% 8/1/24 | | 32,525 | | 39,443 |
Series 2012 G1: | | | | |
5% 4/1/25 | | 13,700 | | 16,573 |
5% 4/1/27 | | 19,380 | | 23,214 |
Series 2013 D, 5% 8/1/23 (b) | | 19,300 | | 24,239 |
New York City Indl. Dev. Agcy. Civic Facility Rev. (Polytechnic Univ. NY Proj.) 5.25% 11/1/27 (ACA Finl. Guaranty Corp. Insured) | | 3,100 | | 3,375 |
New York City Indl. Dev. Agcy. Rev.: | | | | |
(Queens Baseball Stadium Proj.) 5% 1/1/19 (AMBAC Insured) | | 3,735 | | 3,911 |
Municipal Bonds - continued |
| Principal
Amount (000s) | | Value (000s) |
New York - continued |
New York City Indl. Dev. Agcy. Rev.: - continued | | | | |
(Yankee Stadium Proj.) Series 2006, 5% 3/1/31 | | $ 4,725 | | $ 5,016 |
New York City Muni. Wtr. Fin. Auth. Wtr. & Swr. Sys. Rev.: | | | | |
Series 2007 DD, 4.75% 6/15/36 | | 2,900 | | 3,196 |
Series 2009 A, 5.75% 6/15/40 | | 1,500 | | 1,787 |
Series 2009 C, 5% 6/15/44 | | 5,675 | | 6,422 |
Series 2009 EE, 5.25% 6/15/40 | | 11,600 | | 13,436 |
Series 2009 FF 2, 5.5% 6/15/40 | | 17,800 | | 20,938 |
Series 2011 EE, 5.375% 6/15/43 | | 42,080 | | 49,621 |
Series 2012 AA, 5% 6/15/44 | | 11,900 | | 13,390 |
Series 2012 CC, 5% 6/15/45 | | 11,100 | | 12,561 |
Series 2012 EE, 5.25% 6/15/30 | | 28,100 | | 34,673 |
Series GG, 5% 6/15/43 | | 12,340 | | 13,885 |
New York City Transitional Fin. Auth. Bldg. Aid Rev.: | | | | |
Series 2009 S1: | | | | |
5.5% 7/15/31 | | 4,000 | | 4,612 |
5.5% 7/15/38 | | 1,600 | | 1,833 |
5.625% 7/15/38 | | 2,825 | | 3,255 |
Series 2009 S3: | | | | |
5.25% 1/15/34 | | 24,000 | | 27,142 |
5.25% 1/15/39 | | 3,400 | | 3,778 |
5.375% 1/15/34 | | 2,750 | | 3,129 |
Series 2009 S4: | | | | |
5.5% 1/15/39 | | 8,800 | | 10,157 |
5.75% 1/15/39 | | 4,100 | | 4,789 |
Series 2011 S2 A, 5% 7/15/40 | | 17,200 | | 19,331 |
Series S1, 5% 7/15/26 | | 10,000 | | 12,090 |
New York City Transitional Fin. Auth. Rev.: | | | | |
Series 2004 B, 5% 8/1/32 (Pre-Refunded to 8/1/13 @ 100) | | 8,845 | | 9,085 |
Series 2004 C, 5% 2/1/33 (Pre-Refunded to 2/1/14 @ 100) | | 945 | | 993 |
5% 2/1/31 | | 200 | | 201 |
5% 2/1/31 (Pre-Refunded to 2/1/13 @ 100) | | 3,300 | | 3,312 |
5.25% 8/1/19 (Pre-Refunded to 8/1/13 @ 100) | | 1,880 | | 1,934 |
New York Dorm. Auth. Mental Health Svcs. Facilities Impt. Rev.: | | | | |
(State Univ. Proj.) Series 2012 A: | | | | |
5% 5/15/21 | | 10,710 | | 13,275 |
5% 5/15/22 | | 4,300 | | 5,343 |
Municipal Bonds - continued |
| Principal
Amount (000s) | | Value (000s) |
New York - continued |
New York Dorm. Auth. Mental Health Svcs. Facilities Impt. Rev.: - continued | | | | |
Series 2012 A: | | | | |
4% 5/15/21 | | $ 3,500 | | $ 4,054 |
5% 5/15/23 | | 5,600 | | 6,888 |
New York Dorm. Auth. Personal Income Tax Rev.: | | | | |
(Ed. Proj.) Series 2008 B, 5.75% 3/15/36 | | 3,400 | | 4,146 |
Series 2009 A, 5% 2/15/39 | | 4,000 | | 4,561 |
New York Dorm. Auth. Revs.: | | | | |
(City Univ. Sys. Consolidation Proj.) Series A, 5.75% 7/1/13 | | 2,410 | | 2,475 |
(New York Univ. Hosp. Ctr. Proj.): | | | | |
Series 2006 A: | | | | |
5% 7/1/15 | | 3,000 | | 3,287 |
5% 7/1/16 | | 1,400 | | 1,572 |
Series 2007 A, 5% 7/1/14 | | 1,895 | | 2,011 |
Series 2007 B, 5.25% 7/1/24 | | 2,000 | | 2,186 |
(State Univ. Edl. Facilities Proj.) Series A: | | | | |
5.25% 5/15/15 (Nat'l. Pub. Fin. Guarantee Corp. Insured) | | 12,400 | | 13,339 |
5.875% 5/15/17 (Nat'l. Pub. Fin. Guarantee Corp. Insured) | | 6,865 | | 8,028 |
(Suffolk County Judicial Facilities Proj.) Series A, 9.5% 4/15/14 (Escrowed to Maturity) | | 690 | | 738 |
Series 2002 A, 5.75% 10/1/17 (Nat'l. Pub. Fin. Guarantee Corp. Insured) | | 20 | | 20 |
Series 2010 A, 5% 7/1/26 | | 4,000 | | 4,568 |
New York Metropolitan Trans. Auth. Dedicated Tax Fund Rev. Series 2009 B, 5% 11/15/34 | | 11,800 | | 13,269 |
New York Metropolitan Trans. Auth. Rev.: | | | | |
Series 2008 A, 5.25% 11/15/36 | | 26,700 | | 29,374 |
Series 2010 D, 5.25% 11/15/40 | | 6,600 | | 7,451 |
Series 2012 D, 5% 11/15/25 | | 25,900 | | 31,027 |
Series 2012 F, 5% 11/15/24 | | 12,400 | | 14,938 |
New York Sales Tax Asset Receivables Corp. Series 2005 A, 5.25% 10/15/27 (AMBAC Insured) | | 10,500 | | 11,328 |
New York Thruway Auth. Gen. Rev. Series 2005 G: | | | | |
5% 1/1/32 (FSA Insured) | | 2,900 | | 3,115 |
5.25% 1/1/27 | | 12,500 | | 13,746 |
New York Thruway Auth. Personal Income Tax Rev. Series 2007 A, 5.25% 3/15/25 | | 3,500 | | 4,067 |
Niagara Falls City Niagara County Pub. Impt. 7.5% 3/1/18 (Nat'l. Pub. Fin. Guarantee Corp. Insured) | | 460 | | 564 |
Municipal Bonds - continued |
| Principal
Amount (000s) | | Value (000s) |
New York - continued |
Tobacco Settlement Fing. Corp.: | | | | |
Series 2003 A1: | | | | |
5.25% 6/1/21 (AMBAC Insured) | | $ 5,645 | | $ 5,752 |
5.25% 6/1/22 (AMBAC Insured) | | 9,850 | | 10,035 |
5.5% 6/1/18 (Nat'l. Pub. Fin. Guarantee Corp. Insured) | | 170 | | 171 |
5.5% 6/1/19 | | 4,050 | | 4,133 |
Series 2003 B, 5.5% 6/1/18 | | 2,225 | | 2,233 |
Series 2003B 1C: | | | | |
5.5% 6/1/19 | | 10,800 | | 11,021 |
5.5% 6/1/20 | | 2,700 | | 2,755 |
5.5% 6/1/20 (Nat'l. Pub. Fin. Guarantee Corp. Insured) | | 5,050 | | 5,153 |
5.5% 6/1/22 | | 10,065 | | 10,267 |
Series 2011: | | | | |
5% 6/1/17 | | 11,700 | | 13,598 |
5% 6/1/17 | | 10,700 | | 12,436 |
Triborough Bridge & Tunnel Auth. Revs. 5% 11/15/22 | | 5,300 | | 6,674 |
| | 843,672 |
New York & New Jersey - 0.2% |
Port Auth. of New York & New Jersey 124th Series, 5% 8/1/13 (Nat'l. Pub. Fin. Guarantee Corp. Insured) (f) | | 3,400 | | 3,412 |
Port Auth. of New York & New Jersey Spl. Oblig. Rev. (JFK Int'l. Air Term. Spl. Proj.) Series 6, 6.25% 12/1/13 (Nat'l. Pub. Fin. Guarantee Corp. Insured) (f) | | 10,275 | | 10,668 |
| | 14,080 |
North Carolina - 1.0% |
Catawba County Ctfs. of Prtn. (Pub. School and Cmnty. College Proj.) 5.25% 6/1/20 (Pre-Refunded to 6/1/14 @ 100) | | 1,800 | | 1,924 |
Charlotte Int'l. Arpt. Rev. (Charlotte Douglas Int'l. Arpt. Proj.) Series 2010 B, 5.5% 7/1/23 (f) | | 1,200 | | 1,431 |
Charlotte-Mecklenburg Hosp. Auth. Health Care Sys. Rev. Series A, 5% 1/15/20 (FSA Insured) | | 960 | | 1,102 |
Dare County Ctfs. of Prtn.: | | | | |
5.25% 6/1/17 (Pre-Refunded to 6/1/14 @ 100) | | 1,620 | | 1,720 |
5.25% 6/1/18 (Pre-Refunded to 6/1/14 @ 100) | | 1,620 | | 1,717 |
5.25% 6/1/19 (Pre-Refunded to 6/1/14 @ 100) | | 1,540 | | 1,628 |
5.25% 6/1/22 (Pre-Refunded to 6/1/14 @ 100) | | 1,620 | | 1,702 |
5.25% 6/1/23 (Pre-Refunded to 6/1/14 @ 100) | | 1,620 | | 1,699 |
Municipal Bonds - continued |
| Principal
Amount (000s) | | Value (000s) |
North Carolina - continued |
Nash Health Care Sys. Health Care Facilities Rev. Series 2012, 5% 11/1/41 | | $ 4,040 | | $ 4,388 |
North Carolina Ctfs. of Prtn. (Repair and Renovation Proj.) Series 2004 B, 5.25% 6/1/17 (Pre-Refunded to 6/1/14 @ 100) | | 3,600 | | 3,849 |
North Carolina Eastern Muni. Pwr. Agcy. Pwr. Sys. Rev. Series 2009 B, 5% 1/1/26 | | 11,300 | | 12,897 |
North Carolina Infrastructure Fin. Corp. Ctfs. of Prtn. (North Carolina Correctional Facilities Proj.) Series A: | | | | |
5% 2/1/19 (Pre-Refunded to 2/1/14 @ 100) | | 2,945 | | 3,094 |
5% 2/1/20 (Pre-Refunded to 2/1/14 @ 100) | | 1,500 | | 1,576 |
North Carolina Med. Care Cmnty. Health (Memorial Mission Hosp. Proj.): | | | | |
Series 2007, 5% 10/1/20 | | 1,225 | | 1,397 |
5% 10/1/21 | | 5,690 | | 6,456 |
North Carolina Med. Care Commission Health Care Facilities Rev. (Rex Healthcare Proj.) Series 2010 A, 5% 7/1/30 | | 7,830 | | 8,609 |
North Carolina Muni. Pwr. Agcy. #1 Catawba Elec. Rev.: | | | | |
Series 2009 A, 5% 1/1/30 | | 2,300 | | 2,609 |
Series 2010 B, 5% 1/1/20 | | 6,700 | | 8,137 |
| | 65,935 |
North Dakota - 0.2% |
Cass County Health Care Facilities Rev. (Essentia Health Obligated Group Proj.) Series 2008, 5.125% 2/15/37 (Assured Guaranty Corp. Insured) | | 4,600 | | 4,998 |
Fargo Health Sys. Rev. (Sanford Proj.) Series 2011, 6% 11/1/28 | | 1,500 | | 1,824 |
Grand Forks Health Care Sys. Rev. (Altru Health Sys. Proj.) 5% 12/1/14 (Assured Guaranty Corp. Insured) | | 1,675 | | 1,792 |
Mercer County Poll. Cont. Rev. (Antelope Valley Station/Basin Elec. Pwr. Coop. Proj.) 7.2% 6/30/13 (AMBAC Insured) | | 3,625 | | 3,741 |
Ward County Health Care Facility Rev. (Trinity Med. Ctr. Proj.): | | | | |
5.125% 7/1/19 | | 2,765 | | 2,968 |
5.25% 7/1/15 | | 1,300 | | 1,416 |
| | 16,739 |
Ohio - 0.6% |
American Muni. Pwr., Inc. Rev. (Freemont Energy Ctr. Proj.) Series 2012 B, 5% 2/15/42 | | 2,500 | | 2,780 |
Municipal Bonds - continued |
| Principal
Amount (000s) | | Value (000s) |
Ohio - continued |
Buckeye Tobacco Settlement Fing. Auth. Series 2007 A1: | | | | |
5% 6/1/16 | | $ 4,400 | | $ 4,840 |
5% 6/1/17 | | 5,045 | | 5,681 |
Cleveland Parking Facilities Rev.: | | | | |
5.25% 9/15/18 (Escrowed to Maturity) | | 640 | | 793 |
5.25% 9/15/18 (FSA Insured) | | 1,360 | | 1,583 |
Franklin County Hosp. Rev. (Nationwide Children's Hosp. Proj.) Series 2009, 5.25% 11/1/40 | | 1,500 | | 1,671 |
Lake County Hosp. Facilities Rev. (Lake Hosp. Sys., Inc. Proj.) Series 2008 C, 6% 8/15/43 | | 5,000 | | 5,559 |
Lucas County Hosp. Rev. (ProMedica Heathcare Oblig. Group Proj.) Series 2011 A, 6.5% 11/15/37 | | 6,000 | | 7,423 |
Ohio Air Quality Dev. Auth. Rev. Series 2009 C, 5.625% 6/1/18 | | 2,000 | | 2,335 |
Ohio Higher Edl. Facility Commission Rev. (Cleveland Clinic Foundation Proj.) Series 2008 A, 5.5% 1/1/43 | | 1,500 | | 1,651 |
Ohio Wtr. Dev. Auth. Poll. Cont. Facilities Rev. Bonds (FirstEnergy Corp. Proj.) Series 2009 A, 5.875%, tender 6/1/16 (c) | | 8,500 | | 9,505 |
| | 43,821 |
Oklahoma - 0.4% |
Oklahoma City Pub. Property Auth. Hotel Tax Rev.: | | | | |
5.5% 10/1/22 (Nat'l. Pub. Fin. Guarantee Corp. Insured) | | 2,845 | | 3,138 |
5.5% 10/1/23 (Nat'l. Pub. Fin. Guarantee Corp. Insured) | | 3,005 | | 3,307 |
5.5% 10/1/24 (Nat'l. Pub. Fin. Guarantee Corp. Insured) | | 3,175 | | 3,495 |
Oklahoma City Wtr. Utils. Trust Wtr. and Swr. Rev. Series 2009 A, 5% 7/1/34 | | 1,000 | | 1,150 |
Oklahoma Dev. Fin. Auth. Health Sys. Rev. (Integris Baptist Med. Ctr. Proj.) Series C, 5.5% 8/15/20 | | 5,000 | | 5,925 |
Oklahoma Dev. Fin. Auth. Rev. (Saint John Health Sys. Proj.) 5% 2/15/42 | | 7,540 | | 8,329 |
Tulsa County Indl. Auth. Health Care Rev. 5% 12/15/19 | | 1,680 | | 1,909 |
| | 27,253 |
Oregon - 0.4% |
Clackamas County School District #62C, Oregon City Series 2004, 5% 6/15/19 (FSA Insured) | | 3,395 | | 3,596 |
Clackamas County School District #7J: | | | | |
5.25% 6/1/23 | | 2,000 | | 2,552 |
Municipal Bonds - continued |
| Principal
Amount (000s) | | Value (000s) |
Oregon - continued |
Clackamas County School District #7J: - continued | | | | |
5.25% 6/1/24 (FSA Insured) | | $ 2,605 | | $ 3,363 |
Multnomah County Hosp. Facilities Auth. Rev. (Adventist Health Sys./West Proj.) Series 2009 A, 5.125% 9/1/40 | | 2,500 | | 2,771 |
Oregon Facilities Auth. Rev. (Legacy Health Sys. Proj.) Series 2009 A, 5% 3/15/30 | | 1,000 | | 1,085 |
Oregon State Dept. of Administrative Svcs. Lottery Rev. Series 2011 A, 5.25% 4/1/31 | | 5,600 | | 6,754 |
Port Morrow Poll. Cont. Rev. (Portland Gen. Elec. Co. Proj.) Series 1998 A, 5% 5/1/33 | | 5,000 | | 5,615 |
Washington County School District #15: | | | | |
5.5% 6/15/20 (FSA Insured) | | 1,770 | | 2,240 |
5.5% 6/15/21 (FSA Insured) | | 1,060 | | 1,362 |
| | 29,338 |
Pennsylvania - 1.6% |
Allegheny County Arpt. Auth. Rev. (Pittsburg Int'l. Arpt. Proj.) Series B, 5% 1/1/16 (Nat'l. Pub. Fin. Guarantee Corp. Insured) (f) | | 3,000 | | 3,266 |
Allegheny County Hosp. Dev. Auth. Rev.: | | | | |
(Pittsburgh Med. Ctr. Proj.) Series B, 5% 6/15/16 | | 1,365 | | 1,546 |
(Univ. of Pittsburgh Med. Ctr. Proj.) Series 2009 A, 5.625% 8/15/39 | | 6,225 | | 7,011 |
Annville-Cleona School District Series 2005: | | | | |
5.5% 3/1/24 (FSA Insured) | | 1,350 | | 1,482 |
5.5% 3/1/25 (FSA Insured) | | 1,400 | | 1,534 |
Centre County Hosp. Auth. Rev. (Mount Nittany Med. Ctr. Proj.) Series 2011, 7% 11/15/46 | | 2,600 | | 3,348 |
Easton Area School District Series 2006: | | | | |
7.75% 4/1/25 (FSA Insured) | | 2,180 | | 2,625 |
7.75% 4/1/25 (FSA Insured) (Pre-Refunded to 4/1/16 @ 100) | | 2,620 | | 3,221 |
Econ. Dev. Fin. Auth. Unemployment Compensation Rev. Series 2012 B: | | | | |
5% 7/1/21 | | 5,300 | | 6,273 |
5% 1/1/23 | | 2,000 | | 2,243 |
Mifflin County School District Series 2007, 7.75% 9/1/30 (XL Cap. Assurance, Inc. Insured) | | 3,400 | | 4,204 |
Monroeville Fin. Auth. UPMC Rev. Series 2012, 5% 2/15/25 | | 4,680 | | 5,577 |
Municipal Bonds - continued |
| Principal
Amount (000s) | | Value (000s) |
Pennsylvania - continued |
Montgomery County Higher Ed. & Health Auth. Hosp. Rev. (Abington Memorial Hosp. Proj.): | | | | |
Series 1993 A, 6% 6/1/22 (AMBAC Insured) | | $ 2,000 | | $ 2,505 |
Series 2012 A, 5% 6/1/27 | | 4,105 | | 4,698 |
Series A, 6.125% 6/1/14 (AMBAC Insured) | | 5,230 | | 5,622 |
Pennsylvania Convention Ctr. Auth. Rev. Series A, 6.7% 9/1/16 (Escrowed to Maturity) | | 1,130 | | 1,273 |
Pennsylvania Higher Edl. Facilities Auth. Rev.: | | | | |
(The Univ. of Pennsylvania Health Sys. Proj.) Series 2009 A, 5.25% 8/15/21 | | 2,900 | | 3,479 |
(Univ. of Pennsylvania Health Sys. Proj.) Series A, 5% 8/15/16 | | 3,600 | | 3,984 |
Pennsylvania Tpk. Commission Tpk. Rev. Series 2009 D, 5.5% 12/1/41 | | 12,600 | | 14,142 |
Philadelphia Gas Works Rev.: | | | | |
(1975 Gen. Ordinance Proj.) Seventeenth Series, 5.375% 7/1/20 (FSA Insured) | | 4,000 | | 4,074 |
(1998 Gen. Ordinance Proj.): | | | | |
Fifth Series A1, 5% 9/1/33 (FSA Insured) | | 1,095 | | 1,130 |
Ninth Series, 5.25% 8/1/40 | | 3,750 | | 4,023 |
Seventh Series, 5% 10/1/37 (AMBAC Insured) | | 8,900 | | 9,276 |
Philadelphia Gen. Oblig.: | | | | |
Series 2008 A, 5.25% 12/15/32 (FSA Insured) | | 2,500 | | 2,777 |
Series 2008 B, 7.125% 7/15/38 (Assured Guaranty Corp. Insured) | | 3,200 | | 3,684 |
Philadelphia Redev. Auth. Rev. (Philadelphia Neighborhood Transformation Initiative Proj.) Series 2005 C, 5% 4/15/31 (Nat'l. Pub. Fin. Guarantee Corp. Insured) | | 3,000 | | 3,126 |
Philadelphia School District Series 2005 A, 5% 8/1/22 (AMBAC Insured) | | 1,675 | | 1,787 |
Southeastern Pennsylvania Trans. Auth. Rev. Series 2011: | | | | |
5% 6/1/22 | | 1,000 | | 1,190 |
5% 6/1/23 | | 2,500 | | 2,948 |
| | 112,048 |
Puerto Rico - 0.7% |
Puerto Rico Commonwealth Hwy. & Trans. Auth. Trans. Rev.: | | | | |
Series 1998, 5.75% 7/1/22 (CIFG North America Insured) | | 2,300 | | 2,310 |
Series 2003, 5.75% 7/1/19 (FGIC Insured) | | 3,240 | | 3,262 |
Municipal Bonds - continued |
| Principal
Amount (000s) | | Value (000s) |
Puerto Rico - continued |
Puerto Rico Commonwealth Infrastructure Fing. Auth. Series C, 5.5% 7/1/21 | | $ 3,000 | | $ 3,158 |
Puerto Rico Govt. Dev. Bank Series 2006 C, 5.25% 1/1/15 (f) | | 5,000 | | 5,104 |
Puerto Rico Pub. Bldg. Auth. Rev.: | | | | |
Bonds Series M2: | | | | |
5.5%, tender 7/1/17 (AMBAC Insured) (c) | | 4,600 | | 4,848 |
5.75%, tender 7/1/17 (c) | | 8,500 | | 9,045 |
Series N: | | | | |
5.5% 7/1/21 | | 5,000 | | 5,152 |
5.5% 7/1/22 | | 3,250 | | 3,330 |
Puerto Rico Sales Tax Fing. Corp. Sales Tax Rev.: | | | | |
Series 2007 A, 0% 8/1/41 (Nat'l. Pub. Fin. Guarantee Corp. Insured) | | 7,165 | | 1,430 |
Series 2009 A, 6% 8/1/42 | | 7,600 | | 8,122 |
Series A, 0% 8/1/54 (AMBAC Insured) | | 6,000 | | 484 |
| | 46,245 |
Rhode Island - 0.1% |
Rhode Island Health & Edl. Bldg. Corp. Higher Ed. Facilities Rev. (Univ. of Rhode Island Univ. Revs. Proj.): | | | | |
Series 2004 A, 5.5% 9/15/24 (AMBAC Insured) | | 3,400 | | 3,598 |
Series A: | | | | |
5.25% 9/15/15 (AMBAC Insured) | | 1,725 | | 1,848 |
5.25% 9/15/16 (AMBAC Insured) | | 1,815 | | 1,940 |
5.25% 9/15/18 (AMBAC Insured) | | 1,005 | | 1,069 |
| | 8,455 |
South Carolina - 1.8% |
Greenwood Fifty School Facilities Installment: | | | | |
5% 12/1/18 (Assured Guaranty Corp. Insured) | | 3,930 | | 4,679 |
5% 12/1/19 (Assured Guaranty Corp. Insured) | | 2,375 | | 2,823 |
Lexington County Health Svcs. District, Inc. Hosp. Rev.: | | | | |
5% 11/1/18 | | 1,090 | | 1,261 |
5% 11/1/19 | | 1,000 | | 1,153 |
Lexington One School Facilities Corp. Rev. (Lexington County School District No. 1 Proj.) 5.25% 12/1/18 | | 1,540 | | 1,750 |
Richland County Hosp. Facilities Rev. (Cmnty. Provider Pooled Ln. Prog.) Series A, 7.125% 7/1/17 (Escrowed to Maturity) | | 610 | | 699 |
Rock Hill Util. Sys. Rev. Series 2003 A: | | | | |
5.375% 1/1/17 (FSA Insured) | | 1,380 | | 1,380 |
5.375% 1/1/17 (Pre-Refunded to 1/1/13 @ 100) | | 720 | | 720 |
Municipal Bonds - continued |
| Principal
Amount (000s) | | Value (000s) |
South Carolina - continued |
Rock Hill Util. Sys. Rev. Series 2003 A: - continued | | | | |
5.375% 1/1/23 (Pre-Refunded to 1/1/13 @ 100) | | $ 1,025 | | $ 1,025 |
South Carolina Jobs-Econ. Dev. Auth. Econ. Dev. Rev. Series 2013. 5% 11/1/27 (b) | | 7,700 | | 8,399 |
South Carolina Jobs-Econ. Dev. Auth. Health Facilities Rev. (Bishop Gadsden Proj.): | | | | |
5% 4/1/15 | | 1,000 | | 1,067 |
5% 4/1/24 | | 4,000 | | 4,199 |
South Carolina Pub. Svc. Auth. (Santee Cooper) Rev. Oblig.: | | | | |
Series 2012 B: | | | | |
5% 12/1/18 | | 5,000 | | 6,049 |
5% 12/1/20 | | 1,500 | | 1,864 |
Series 2012 C: | | | | |
5% 12/1/14 | | 1,000 | | 1,086 |
5% 12/1/14 | | 2,000 | | 2,172 |
5% 12/1/16 | | 5,065 | | 5,848 |
5% 12/1/16 | | 2,000 | | 2,309 |
5% 12/1/19 | | 13,990 | | 17,254 |
Series 2012 D, 5% 12/1/43 | | 18,250 | | 20,412 |
South Carolina Pub. Svc. Auth. Rev.: | | | | |
(Santee Cooper Proj.) Series 2009 B: | | | | |
5.25% 1/1/34 | | 6,000 | | 6,920 |
5.25% 1/1/39 | | 2,800 | | 3,219 |
Series 2004 A, 5% 1/1/39 | | 7,600 | | 7,882 |
Series 2005 B, 5% 1/1/19 (Nat'l. Pub. Fin. Guarantee Corp. Insured) | | 2,500 | | 2,815 |
Series A, 5% 1/1/36 (Nat'l. Pub. Fin. Guarantee Corp. Insured) | | 5,000 | | 5,405 |
Univ. of South Carolina Athletic Facilities Rev. Series 2008 A, 5.5% 5/1/38 | | 6,900 | | 7,870 |
| | 120,260 |
South Dakota - 0.2% |
South Dakota Health & Edl. Facilities Auth. Rev.: | | | | |
(Reg'l. Health Proj.) Series 2010: | | | | |
4.625% 9/1/27 | | 1,000 | | 1,060 |
5% 9/1/28 | | 3,000 | | 3,252 |
Series 2012 E, 5% 11/1/37 | | 7,300 | | 7,987 |
| | 12,299 |
Municipal Bonds - continued |
| Principal
Amount (000s) | | Value (000s) |
Tennessee - 0.5% |
Clarksville Natural Gas Acquisition Corp. Gas Rev.: | | | | |
Series 2006, 5% 12/15/13 | | $ 8,000 | | $ 8,299 |
5% 12/15/14 | | 3,870 | | 4,153 |
Jackson Hosp. Rev. (Jackson-Madison County Gen. Hosp. Proj.) Series 2008, 5.75% 4/1/41 | | 6,600 | | 7,339 |
Knox County Health Edl. & Hsg. Facilities Board Rev. (Univ. Health Sys. Proj.) 5% 4/1/15 | | 5,245 | | 5,682 |
Memphis-Shelby County Arpt. Auth. Arpt. Rev. Series 2010 B: | | | | |
5.75% 7/1/23 (f) | | 5,820 | | 6,865 |
5.75% 7/1/24 (f) | | 2,400 | | 2,794 |
| | 35,132 |
Texas - 9.7% |
Aledo Independent School District (School Bldg. Proj.) Series 2006 A, 5% 2/15/43 | | 6,800 | | 7,622 |
Argyle Independent School District Series 2005, 5.25% 8/15/40 (FSA Insured) | | 1,745 | | 1,810 |
Austin Cmnty. College District Pub. Facilities Lease Rev. (Round Rock Campus Proj.) Series 2008, 5.25% 8/1/33 | | 5,000 | | 5,920 |
Austin Cmnty. College District Rev. (Convention Ctr. Proj.) Series 2002, 0% 2/1/22 (AMBAC Insured) | | 2,900 | | 2,288 |
Austin Elec. Util. Sys. Rev.: | | | | |
0% 5/15/17 (Nat'l. Pub. Fin. Guarantee Corp. Insured) | | 9,200 | | 8,464 |
0% 5/15/18 (Nat'l. Pub. Fin. Guarantee Corp. Insured) | | 5,000 | | 4,453 |
Austin Wtr. & Wastewtr. Sys. Rev.: | | | | |
Series 2004 A, 5% 11/15/27 (AMBAC Insured) | | 1,780 | | 1,916 |
Series 2005 A, 5% 5/15/31 (AMBAC Insured) | | 4,690 | | 5,085 |
Bastrop Independent School District Series 2007: | | | | |
5.25% 2/15/37 | | 2,700 | | 3,075 |
5.25% 2/15/42 | | 5,000 | | 5,620 |
Beaumont Independent School District 5% 2/15/38 (Assured Guaranty Corp. Insured) | | 1,450 | | 1,612 |
Boerne Independent School District Series 2004, 5.25% 2/1/35 (Pre-Refunded to 2/1/13 @ 100) | | 5,100 | | 5,119 |
Canyon Reg'l. Wtr. Auth. Contract Rev. (Wells Ranch Proj.): | | | | |
5% 8/1/19 (AMBAC Insured) | | 1,695 | | 1,942 |
5% 8/1/20 (AMBAC Insured) | | 1,780 | | 2,027 |
Coppell Independent School District 0% 8/15/20 | | 2,000 | | 1,727 |
Municipal Bonds - continued |
| Principal
Amount (000s) | | Value (000s) |
Texas - continued |
Corpus Christi Util. Sys. Rev.: | | | | |
5% 7/15/21 | | $ 4,500 | | $ 5,542 |
5% 7/15/22 | | 2,500 | | 3,087 |
5% 7/15/24 | | 2,255 | | 2,722 |
5.25% 7/15/18 (FSA Insured) | | 3,305 | | 3,886 |
5.25% 7/15/19 (FSA Insured) | | 4,000 | | 4,664 |
Cypress-Fairbanks Independent School District Series A, 0% 2/15/16 | | 9,700 | | 9,453 |
Dallas Area Rapid Transit Sales Tax Rev. Series 2008, 5.25% 12/1/38 | | 21,000 | | 24,467 |
Dallas Fort Worth Int'l. Arpt. Rev.: | | | | |
Series 2009 A, 5% 11/1/23 | | 1,250 | | 1,423 |
Series A, 5% 11/1/42 | | 14,800 | | 16,297 |
5% 11/1/13 (XL Cap. Assurance, Inc. Insured) (f) | | 2,665 | | 2,764 |
5% 11/1/14 (XL Cap. Assurance, Inc. Insured) (f) | | 2,625 | | 2,831 |
5% 11/1/17 (XL Cap. Assurance, Inc. Insured) (f) | | 4,325 | | 4,613 |
Dallas Independent School District Series 2008, 6.375% 2/15/34 | | 1,800 | | 2,218 |
Del Mar College District 5.25% 8/15/20 (Pre-Refunded to 8/15/13 @ 100) | | 2,960 | | 3,051 |
DeSoto Independent School District 0% 8/15/20 | | 3,335 | | 2,879 |
Duncanville Independent School District 5.65% 2/15/28 | | 30 | | 30 |
Freer Independent School District Series 2007, 5.25% 8/15/37 | | 4,215 | | 4,770 |
Gainesville Independent School District Series 2006, 5.25% 2/15/36 | | 1,900 | | 2,087 |
Garland Wtr. & Swr. Rev. 5.25% 3/1/23 (AMBAC Insured) | | 1,315 | | 1,382 |
Grand Prairie Independent School District 0% 2/15/16 | | 3,775 | | 3,679 |
Guadalupe-Blanco River Auth. Contract Rev. (Western Canyon Reg'l. Wtr. Supply Proj.): | | | | |
5.25% 4/15/15 (Nat'l. Pub. Fin. Guarantee Corp. Insured) | | 1,570 | | 1,590 |
5.25% 4/15/16 (Nat'l. Pub. Fin. Guarantee Corp. Insured) | | 1,680 | | 1,701 |
5.25% 4/15/17 (Nat'l. Pub. Fin. Guarantee Corp. Insured) | | 2,295 | | 2,323 |
5.25% 4/15/18 (Nat'l. Pub. Fin. Guarantee Corp. Insured) | | 1,915 | | 1,938 |
5.25% 4/15/19 (Nat'l. Pub. Fin. Guarantee Corp. Insured) | | 1,000 | | 1,011 |
5.25% 4/15/20 (Nat'l. Pub. Fin. Guarantee Corp. Insured) | | 1,565 | | 1,582 |
Municipal Bonds - continued |
| Principal
Amount (000s) | | Value (000s) |
Texas - continued |
Gulf Coast Waste Disp. Auth. Solid Waste Disp. Rev. Bonds (Waste Mgmt. of Texas, Inc. Denton County Proj.) Series 2003 B, 3.5%, tender 5/1/13 (c)(f) | | $ 2,500 | | $ 2,525 |
Harris County Cultural Ed. Facilities Fin. Corp. Med. Facilities Rev. (Baylor College of Medicine Proj.) Series 2012 A, 5% 11/15/37 | | 14,050 | | 15,820 |
Harris County Gen. Oblig.: | | | | |
(Permanent Impt. Proj.) Series 1996, 0% 10/1/14 (Nat'l. Pub. Fin. Guarantee Corp. Insured) | | 11,000 | | 10,871 |
(Road Proj.): | | | | |
Series 1996, 0% 10/1/13 (Nat'l. Pub. Fin. Guarantee Corp. Insured) | | 5,550 | | 5,529 |
Series 2008 B, 5.25% 8/15/47 | | 25,440 | | 28,783 |
Series 2002: | | | | |
0% 8/15/25 (Nat'l. Pub. Fin. Guarantee Corp. Insured) | | 3,000 | | 2,166 |
0% 8/15/28 (Nat'l. Pub. Fin. Guarantee Corp. Insured) | | 5,000 | | 3,244 |
5.25% 10/1/24 (Pre-Refunded to 10/1/14 @ 100) | | 1,020 | | 1,105 |
5.25% 10/1/24 (Pre-Refunded to 10/1/14 @ 100) | | 1,700 | | 1,847 |
Harris County Health Facilities Dev. Corp. Hosp. Rev. (Memorial Hermann Healthcare Sys. Proj.) Series 2008 B, 7.25% 12/1/35 | | 3,200 | | 4,000 |
Houston Arpt. Sys. Rev. Series 2011 A: | | | | |
5% 7/1/23 (f) | | 3,000 | | 3,523 |
5% 7/1/25 (f) | | 1,500 | | 1,731 |
Houston Independent School District: | | | | |
Bonds Series 2012, 2.5%, tender 6/1/15 (c) | | 10,600 | | 11,013 |
Series 2005 A, 0% 2/15/16 | | 5,500 | | 5,360 |
0% 8/15/13 | | 9,835 | | 9,819 |
Humble Independent School District: | | | | |
Series 2000: | | | | |
0% 2/15/16 | | 3,000 | | 2,924 |
0% 2/15/17 | | 3,480 | | 3,328 |
Series 2005 B, 5.25% 2/15/22 (Nat'l. Pub. Fin. Guarantee Corp. Insured) | | 1,995 | | 2,171 |
Series 2009, 5% 2/15/34 | | 4,300 | | 5,009 |
Judson Independent School District Series 2005 B, 5% 2/1/22 (FSA Insured) | | 2,250 | | 2,349 |
Keller Independent School District Series 1996 A, 0% 8/15/17 | | 2,000 | | 1,895 |
Kermit Independent School District 5.25% 2/15/37 | | 4,130 | | 4,618 |
Kingsville Independent School District 5.25% 2/15/37 | | 3,650 | | 4,089 |
Municipal Bonds - continued |
| Principal
Amount (000s) | | Value (000s) |
Texas - continued |
Liberty Hill Independent School District (School Bldg. Proj.) Series 2006, 5.25% 8/1/35 | | $ 8,615 | | $ 9,470 |
Lower Colorado River Auth. Rev.: | | | | |
Series 2010, 5.25% 5/15/18 (Pre-Refunded to 5/15/13 @ 100) | | 80 | | 81 |
Series 2012, 5.25% 5/15/18 (Pre-Refunded to 5/15/13 @ 100) | | 95 | | 97 |
5% 5/15/31 | | 665 | | 665 |
5% 5/15/31 (AMBAC Insured) | | 150 | | 150 |
5.25% 5/15/18 | | 480 | | 488 |
5.25% 5/15/18 (Pre-Refunded to 5/15/13 @ 100) | | 5 | | 5 |
5.25% 5/15/18 (Pre-Refunded to 5/15/13 @ 100) | | 10 | | 10 |
5.25% 5/15/18 (Pre-Refunded to 5/15/13 @ 100) | | 10 | | 10 |
5.25% 5/15/18 (Pre-Refunded to 5/15/13 @ 100) | | 60 | | 61 |
5.25% 5/15/18 (Pre-Refunded to 5/15/13 @ 100) | | 1,140 | | 1,161 |
5.75% 5/15/37 | | 540 | | 583 |
5.75% 5/15/37 (Pre-Refunded to 5/15/15 @ 100) | | 130 | | 146 |
5.75% 5/15/37 (Pre-Refunded to 5/15/15 @ 100) | | 5,970 | | 6,718 |
Lower Colorado River Auth. Transmission Contract Rev. (LCRA Transmission Svcs. Corp. Proj.) Series C: | | | | |
5.25% 5/15/18 (Pre-Refunded to 5/15/13 @ 100) | | 1,000 | | 1,018 |
5.25% 5/15/19 (Pre-Refunded to 5/15/13 @ 100) | | 1,000 | | 1,018 |
5.25% 5/15/20 (Pre-Refunded to 5/15/13 @ 100) | | 2,000 | | 2,037 |
Mansfield Independent School District 5.5% 2/15/18 | | 40 | | 40 |
Midway Independent School District Series 2000, 0% 8/15/19 | | 3,600 | | 3,229 |
Navasota Independent School District: | | | | |
Series 2005, 5.25% 8/15/34 (Nat'l. Pub. Fin. Guarantee Corp. Insured) | | 2,275 | | 2,386 |
5.5% 8/15/25 (Nat'l. Pub. Fin. Guarantee Corp. Insured) | | 1,675 | | 1,780 |
New Caney Independent School District Series 2007 A, 5.25% 2/15/37 | | 2,680 | | 3,095 |
North Forest Independent School District Series B, 5% 8/15/18 (FSA Insured) | | 1,470 | | 1,640 |
North Texas Muni. Wtr. District Wtr. Sys. Rev. Series 2006, 5% 9/1/35 | | 4,000 | | 4,504 |
North Texas Tollway Auth. Dallas North Tollway Sys. Rev. Series 2003 A, 5% 1/1/28 (Pre-Refunded to 1/1/13 @ 100) | | 7,175 | | 7,175 |
North Texas Tollway Auth. Rev.: | | | | |
Bonds Series 2008 E3, 5.75%, tender 1/1/16 (c) | | 4,000 | | 4,536 |
Municipal Bonds - continued |
| Principal
Amount (000s) | | Value (000s) |
Texas - continued |
North Texas Tollway Auth. Rev.: - continued | | | | |
Series 2008 A: | | | | |
6% 1/1/23 | | $ 4,800 | | $ 5,678 |
6% 1/1/24 | | 2,000 | | 2,343 |
Series 2008 I, 0% 1/1/42 (Assured Guaranty Corp. Insured) (a) | | 7,200 | | 7,911 |
Series 2009 A, 6.25% 1/1/39 | | 10,200 | | 11,651 |
Series 2011 A: | | | | |
5.5% 9/1/41 | | 3,950 | | 4,708 |
6% 9/1/41 | | 6,200 | | 7,732 |
Series 2011 D, 5% 9/1/28 | | 13,000 | | 15,449 |
Pflugerville Gen. Oblig. 5.5% 8/1/22 (Pre-Refunded to 8/1/13 @ 100) | | 1,000 | | 1,030 |
Prosper Independent School District: | | | | |
Series 2005, 5.125% 8/15/30 | | 3,110 | | 3,417 |
5.375% 8/15/37 | | 15,255 | | 17,419 |
Robstown Independent School District 5.25% 2/15/29 (Pre-Refunded to 2/15/14 @ 100) | | 3,165 | | 3,341 |
Rockdale Independent School District Series 2007, 5.25% 2/15/37 | | 5,100 | | 5,585 |
San Antonio Arpt. Sys. Rev.: | | | | |
5% 7/1/15 (FSA Insured) (f) | | 2,510 | | 2,748 |
5% 7/1/17 (FSA Insured) (f) | | 2,765 | | 3,161 |
5% 7/1/17 (FSA Insured) (f) | | 2,385 | | 2,704 |
5.25% 7/1/19 (FSA Insured) (f) | | 2,635 | | 2,965 |
5.25% 7/1/20 (FSA Insured) (f) | | 3,215 | | 3,601 |
5.25% 7/1/20 (FSA Insured) (f) | | 2,775 | | 3,109 |
San Antonio Elec. & Gas Sys. Rev.: | | | | |
Series 2008, 5% 2/1/24 | | 2,590 | | 3,049 |
Series 2012, 5.25% 2/1/25 | | 4,200 | | 5,484 |
San Antonio Wtr. Sys. Rev. Series 2012: | | | | |
5% 5/15/24 | | 7,500 | | 9,333 |
5% 5/15/25 | | 10,000 | | 12,351 |
5% 5/15/27 | | 10,000 | | 12,206 |
San Jacinto Cmnty. College District Series 2009, 5% 2/15/39 | | 3,620 | | 4,041 |
Snyder Independent School District: | | | | |
5.25% 2/15/21 (AMBAC Insured) | | 1,035 | | 1,108 |
5.25% 2/15/22 (AMBAC Insured) | | 1,090 | | 1,165 |
5.25% 2/15/30 (AMBAC Insured) | | 1,800 | | 1,904 |
Southwest Higher Ed. Auth. Rev. (Southern Methodist Univ. Proj.) Series 2010, 5% 10/1/35 | | 1,700 | | 1,969 |
Municipal Bonds - continued |
| Principal
Amount (000s) | | Value (000s) |
Texas - continued |
Spring Branch Independent School District Series 2008, 5.25% 2/1/38 | | $ 2,000 | | $ 2,272 |
Tarrant County Cultural Ed. Facilities Fin. Corp. Hosp. Rev.: | | | | |
(Baylor Health Care Sys. Proj.) Series 2009, 5.75% 11/15/24 | | 6,900 | | 8,087 |
(Hendrick Med. Ctr. Proj.) Series 2009 B: | | | | |
5.25% 9/1/26 (Assured Guaranty Corp. Insured) | | 1,785 | | 2,018 |
5.25% 9/1/27 (Assured Guaranty Corp. Insured) | | 2,375 | | 2,674 |
Texas Gen. Oblig.: | | | | |
(Trans. Commission Mobility Fund Proj.): | | | | |
Series 2005 A, 4.75% 4/1/35 | | 8,380 | | 8,938 |
Series 2008, 4.75% 4/1/37 | | 21,920 | | 24,408 |
Series 2006 A, 5% 4/1/29 | | 2,820 | | 3,177 |
Series 2006, 5% 4/1/27 | | 5,600 | | 6,275 |
Series 2008, 5% 4/1/25 | | 4,300 | | 5,068 |
5.75% 8/1/26 | | 1,175 | | 1,179 |
Texas Muni. Pwr. Agy. Rev. 0% 9/1/16 (Nat'l. Pub. Fin. Guarantee Corp. Insured) | | 18,715 | | 17,862 |
Texas Private Activity Bond Surface Trans. Corp.: | | | | |
(LBJ Infrastructure Group LLC IH-635 Managed Lanes Proj.) Series 2010, 7% 6/30/40 | | 5,200 | | 6,313 |
(NTE Mobility Partners LLC North Tarrant Express Managed Lanes Proj.) Series 2009, 6.875% 12/31/39 | | 11,200 | | 13,373 |
Texas Pub. Fin. Auth. Bldg. Rev. Series 1990, 0% 2/1/14 (Nat'l. Pub. Fin. Guarantee Corp. Insured) | | 6,910 | | 6,775 |
Texas Trans. Commission Central Texas Tpk. Sys. Rev. Bonds Series 2012 B, 1.25%, tender 2/15/15 (c) | | 3,200 | | 3,209 |
Texas Trans. Commission State Hwy. Fund Rev. Series 2007: | | | | |
5% 4/1/23 | | 2,320 | | 2,703 |
5% 4/1/25 | | 3,400 | | 3,945 |
5% 4/1/26 | | 4,300 | | 4,978 |
Texas Wtr. Dev. Board Rev.: | | | | |
Series B, 5.375% 7/15/16 | | 5,000 | | 5,016 |
5.625% 7/15/21 | | 1,315 | | 1,319 |
Trinity River Auth. Rev. (Tarrant County Wtr. Proj.) 5% 2/1/17 (Nat'l. Pub. Fin. Guarantee Corp. Insured) | | 4,930 | | 5,437 |
Tyler Health Facilities Dev. Corp. Hosp. Rev. (Mother Frances Hosp. Reg'l. Health Care Ctr. Proj.) 5.75% 7/1/27 (Pre-Refunded to 7/1/13 @ 100) | | 1,000 | | 1,027 |
Waller Independent School District 5.5% 2/15/37 | | 4,920 | | 5,699 |
Municipal Bonds - continued |
| Principal
Amount (000s) | | Value (000s) |
Texas - continued |
Weatherford Independent School District 0% 2/15/33 | | $ 6,985 | | $ 3,552 |
Wylie Independent School District Series 2001, 0% 8/15/20 | | 1,790 | | 1,545 |
| | 660,503 |
Utah - 0.6% |
Intermountain Pwr. Agcy. Pwr. Supply Rev. Series A, 6% 7/1/16 (Escrowed to Maturity) | | 9,205 | | 9,239 |
Salt Lake City Hosp. Rev. (Intermountain Health Care Hosp., Inc. Proj.) Series A, 8.125% 5/15/15 (Escrowed to Maturity) | | 1,070 | | 1,161 |
Utah Associated Muni. Pwr. Sys. Rev. (Payson Pwr. Proj.): | | | | |
Series A: | | | | |
5.25% 4/1/16 (Pre-Refunded to 4/1/13 @ 100) | | 3,590 | | 3,634 |
5.25% 4/1/17 (Pre-Refunded to 4/1/13 @ 100) | | 4,335 | | 4,388 |
5% 9/1/22 | | 3,180 | | 3,819 |
Utah State Board of Regents Rev. Series 2011 B: | | | | |
5% 8/1/24 | | 2,670 | | 3,138 |
5% 8/1/25 | | 2,175 | | 2,545 |
Utah Transit Auth. Sales Tax Rev. Series 2008 A, 5.25% 6/15/38 | | 9,070 | | 10,574 |
| | 38,498 |
Vermont - 0.2% |
Vermont Edl. & Health Bldg. Fin. Agcy. Rev.: | | | | |
(Fletcher Allen Health Care, Inc. Proj.) Series 2000 A, 6.125% 12/1/27 (AMBAC Insured) | | 7,120 | | 7,144 |
(Middlebury College Proj.) Series 2006 A, 5% 10/31/46 | | 4,075 | | 4,502 |
| | 11,646 |
Virginia - 0.3% |
King George County Indl. Dev. Auth. Solid Waste Disp. Fac. Rev. Bonds (King George Landfill, Inc. Proj.) Series 2003 A, 3.5%, tender 5/1/13 (c)(f) | | 4,050 | | 4,079 |
Virginia Beach Dev. Auth. Hosp. Facilities Rev. (Virginia Beach Gen. Hosp. Proj.) 6% 2/15/13 (AMBAC Insured) | | 1,460 | | 1,469 |
Virginia Small Bus. Fing. Auth. (95 Express Lane LLC Proj.) Series 2012: | | | | |
5% 7/1/34 (f) | | 6,000 | | 6,211 |
Municipal Bonds - continued |
| Principal
Amount (000s) | | Value (000s) |
Virginia - continued |
Virginia Small Bus. Fing. Auth. (95 Express Lane LLC Proj.) Series 2012: - continued | | | | |
5% 1/1/40 (f) | | $ 4,200 | | $ 4,292 |
York County Econ. Dev. Auth. Poll. Cont. Rev. Bonds (Virginia Elec. and Pwr. Co. Proj.) Series 2009 A, 4.05%, tender 5/1/14 (c) | | 3,700 | | 3,855 |
| | 19,906 |
Washington - 3.0% |
Central Puget Sound Reg'l. Trans. Auth. Sales & Use Tax Rev. Series 2007 A, 5% 11/1/27 (Pre-Refunded to 5/1/15 @ 100) | | 3,500 | | 3,875 |
Chelan County Pub. Util. District #1 Columbia River-Rock Island Hydro-Elec. Sys. Rev. Series 1997 A, 0% 6/1/17 (Nat'l. Pub. Fin. Guarantee Corp. Insured) | | 7,200 | | 6,572 |
Chelan County Pub. Util. District #1 Rev. Bonds Series 2005 A, 5.125%, tender 7/1/15 (FGIC Insured) (c)(f) | | 2,430 | | 2,598 |
Clark County School District #37, Vancouver Series 2001 C, 0% 12/1/19 (Nat'l. Pub. Fin. Guarantee Corp. Insured) | | 2,030 | | 1,729 |
Energy Northwest Elec. Rev. Series 2012 A, 5% 7/1/21 | | 20,000 | | 25,216 |
Grant County Pub. Util. District #2 Wanapum Hydro Elec. Rev. Series B: | | | | |
5.25% 1/1/18 (Nat'l. Pub. Fin. Guarantee Corp. Insured) (f) | | 1,590 | | 1,701 |
5.25% 1/1/20 (Nat'l. Pub. Fin. Guarantee Corp. Insured) (f) | | 1,760 | | 1,870 |
5.25% 1/1/23 (Nat'l. Pub. Fin. Guarantee Corp. Insured) (f) | | 2,055 | | 2,172 |
Kent Spl. Events Ctr. Pub. Facilities District Rev.: | | | | |
5.25% 12/1/25 (FSA Insured) | | 2,575 | | 2,931 |
5.25% 12/1/36 (FSA Insured) | | 9,180 | | 10,098 |
King County Gen. Oblig. (Swr. Proj.) Series 2005, 5% 1/1/26 (Pre-Refunded to 1/1/15 @ 100) | | 5,000 | | 5,459 |
King County Swr. Rev.: | | | | |
Series 2008, 5.75% 1/1/43 | | 22,700 | | 26,784 |
Series 2009, 5.25% 1/1/42 | | 2,600 | | 2,997 |
Series 2010, 5% 1/1/50 | | 6,500 | | 7,196 |
Pierce County School District #10 Tacoma Series A, 5% 12/1/18 (FSA Insured) | | 4,000 | | 4,468 |
Snohomish County School District #4, Lake Stevens 5.125% 12/1/19 (Pre-Refunded to 12/1/15 @ 100) | | 1,875 | | 2,126 |
Municipal Bonds - continued |
| Principal
Amount (000s) | | Value (000s) |
Washington - continued |
Spokane Pub. Facilities District Hotel/Motel Tax & Sales/Use Tax Rev.: | | | | |
5.75% 12/1/19 (Nat'l. Pub. Fin. Guarantee Corp. Insured) | | $ 2,000 | | $ 2,086 |
5.75% 12/1/21 (Nat'l. Pub. Fin. Guarantee Corp. Insured) | | 2,000 | | 2,084 |
Washington Gen. Oblig.: | | | | |
Series 2008 D, 5% 1/1/24 | | 2,975 | | 3,488 |
Series B, 5% 7/1/28 (Pre-Refunded to 7/1/15 @ 100) | | 395 | | 440 |
Series R 97A: | | | | |
0% 7/1/17 (Escrowed to Maturity) | | 7,045 | | 6,715 |
0% 7/1/19 (Escrowed to Maturity) | | 9,100 | | 8,323 |
Washington Health Care Facilities Auth. Rev.: | | | | |
(Catholic Health Initiatives Proj.) Series 2008 D, 6.375% 10/1/36 | | 5,000 | | 5,953 |
(Childrens Hosp. Reg'l. Med. Ctr. Proj.) Series 2008 C, 5.5% 10/1/35 | | 10,000 | | 11,275 |
(MultiCare Health Sys. Proj.) Series 2010 A: | | | | |
5.25% 8/15/19 | | 3,850 | | 4,497 |
5.25% 8/15/20 | | 2,000 | | 2,306 |
(Providence Health Systems Proj.): | | | | |
Series 2006 D, 5.25% 10/1/33 | | 2,000 | | 2,227 |
Series 2012 A: | | | | |
5% 10/1/25 | | 5,130 | | 6,029 |
5% 10/1/26 | | 13,395 | | 15,618 |
(Seattle Children's Hosp. Proj.) Series 2009, 5.625% 10/1/38 | | 7,550 | | 8,647 |
5.7% 7/1/38 | | 11,300 | | 12,425 |
7% 7/1/39 | | 3,000 | | 3,479 |
| | 203,384 |
West Virginia - 0.1% |
West Virginia Hosp. Fin. Auth. Hosp. Rev.: | | | | |
(West Virginia United Health Sys. Proj.) Series 2008 E, 5.625% 6/1/35 | | 700 | | 771 |
(West Virginia Univ. Hospitals, Inc. Proj.) Series 2003 D, 5.5% 6/1/33 (FSA Insured) | | 2,600 | | 2,948 |
| | 3,719 |
Wisconsin - 0.4% |
Wisconsin Gen. Oblig. Series 2008 D, 5.5% 5/1/26 | | 1,245 | | 1,526 |
Municipal Bonds - continued |
| Principal
Amount (000s) | | Value (000s) |
Wisconsin - continued |
Wisconsin Health & Edl. Facilities Auth. Rev.: | | | | |
(Agnesian HealthCare, Inc. Proj.) Series 2010: | | | | |
5.5% 7/1/40 | | $ 2,375 | | $ 2,554 |
5.75% 7/1/30 | | 2,655 | | 3,014 |
(Children's Hosp. of Wisconsin Proj.) 5.25% 8/15/22 | | 2,000 | | 2,345 |
(Children's Hosp. Proj.) Series 2008 B, 5.375% 8/15/37 | | 8,045 | | 8,918 |
(Marshfield Clinic Proj.) Series A, 5.375% 2/15/34 | | 3,250 | | 3,427 |
(Wheaton Franciscan Healthcare Sys. Proj.) Series 2003 A: | | | | |
5.5% 8/15/15 | | 1,480 | | 1,522 |
5.5% 8/15/16 | | 975 | | 1,002 |
Series 2012, 4% 10/1/23 | | 2,500 | | 2,763 |
| | 27,071 |
Wyoming - 0.1% |
Campbell County Solid Waste Facilities Rev. (Basin Elec. Pwr. Coop. - Dry Fork Station Facilities Proj.) Series 2009 A, 5.75% 7/15/39 | | 8,600 | | 9,742 |
TOTAL MUNICIPAL BONDS (Cost $6,180,455) |
6,713,416
|
Money Market Funds - 0.0% |
| Shares | | |
Fidelity Municipal Cash Central Fund, 0.16% (d)(e)
(Cost $100) | 100,000 | |
100
|
TOTAL INVESTMENT PORTFOLIO - 98.8% (Cost $6,180,555) | | 6,713,516 |
NET OTHER ASSETS (LIABILITIES) - 1.2% | | 78,459 |
NET ASSETS - 100% | $ 6,791,975 |
Legend |
(a) Security initially issued in zero coupon form which converts to coupon form at a specified rate and date. The rate shown is the rate at period end. |
(b) Security or a portion of the security purchased on a delayed delivery or when-issued basis. |
(c) Coupon rates for floating and adjustable rate securities reflect the rates in effect at period end. |
(d) Information in this report regarding holdings by state and security types does not reflect the holdings of the Fidelity Municipal Cash Central Fund. |
(e) Affiliated fund that is available only to investment companies and other accounts managed by Fidelity Investments. The rate quoted is the annualized seven-day yield of the fund at period end. A complete unaudited listing of the fund's holdings as of its most recent quarter end is available upon request. In addition, each Fidelity Central Fund's financial statements, which are not covered by the Fund's Report of Independent Registered Public Accounting Firm, are available on the SEC's website or upon request. |
(f) Private activity obligations whose interest is subject to the federal alternative minimum tax for individuals. |
(g) Restricted securities - Investment in securities not registered under the Securities Act of 1933 (excluding 144A issues). At the end of the period, the value of restricted securities (excluding 144A issues) amounted to $2,838,000 or 0.0% of net assets. |
Additional information on each restricted holding is as follows: |
Security | Acquisition
Date | Acquisition
Cost (000s) |
Massachusetts Health & Edl. Facilities Auth. Rev. (Blood Research Institute Proj.) Series A, 6.5% 2/1/22 | 9/3/92 | $ 2,663 |
Affiliated Central Funds |
Information regarding fiscal year to date income earned by the Fund from investments in Fidelity Central Funds is as follows: |
Fund | Income earned
(Amounts in thousands) |
Fidelity Municipal Cash Central Fund | $ 117 |
Other Information |
The following is a summary of the inputs used, as of December 31, 2012, involving the Fund's assets and liabilities carried at fair value. The inputs or methodology used for valuing securities may not be an indication of the risk associated with investing in those securities. For more information on valuation inputs, and their aggregation into the levels used in the table below, please refer to the Investment Valuation section in the accompanying Notes to Financial Statements. |
Valuation Inputs at Reporting Date: |
Description
(Amounts in thousands) | Total | Level 1 | Level 2 | Level 3 |
Investments in Securities: | | | | |
Municipal Securities | $ 6,713,416 | $ - | $ 6,713,416 | $ - |
Money Market Funds | 100 | 100 | - | - |
Total Investments in Securities: | $ 6,713,516 | $ 100 | $ 6,713,416 | $ - |
The distribution of municipal securities by revenue source, as a percentage of total net assets, is as follows (Unaudited): |
General Obligations | 35.6% |
Health Care | 17.4% |
Water & Sewer | 10.0% |
Transportation | 9.3% |
Special Tax | 7.9% |
Escrowed/Pre-Refunded | 7.2% |
Electric Utilities | 7.0% |
Others* (Individually Less Than 5%) | 5.6% |
| 100.0% |
* Includes net other assets |
See accompanying notes which are an integral part of the financial statements.
Annual Report
Statement of Assets and Liabilities
Amounts in thousands (except per-share amount) | December 31, 2012 |
| | |
Assets | | |
Investment in securities, at value - See accompanying schedule: Unaffiliated issuers (cost $6,180,455) | $ 6,713,416 | |
Fidelity Central Funds (cost $100) | 100 | |
Total Investments (cost $6,180,555) | | $ 6,713,516 |
Cash | | 95,202 |
Receivable for fund shares sold | | 8,396 |
Interest receivable | | 80,183 |
Distributions receivable from Fidelity Central Funds | | 4 |
Prepaid expenses | | 17 |
Other receivables | | 12 |
Total assets | | 6,897,330 |
| | |
Liabilities | | |
Payable for investments purchased on a delayed delivery basis | $ 82,189 | |
Payable for fund shares redeemed | 11,767 | |
Distributions payable | 8,159 | |
Accrued management fee | 2,086 | |
Other affiliated payables | 1,011 | |
Other payables and accrued expenses | 143 | |
Total liabilities | | 105,355 |
| | |
Net Assets | | $ 6,791,975 |
Net Assets consist of: | | |
Paid in capital | | $ 6,267,512 |
Undistributed net investment income | | 1,075 |
Accumulated undistributed net realized gain (loss) on investments | | (9,573) |
Net unrealized appreciation (depreciation) on investments | | 532,961 |
Net Assets, for 500,619 shares outstanding | | $ 6,791,975 |
Net Asset Value, offering price and redemption price per share ($6,791,975 ÷ 500,619 shares) | | $ 13.57 |
See accompanying notes which are an integral part of the financial statements.
Annual Report
Statement of Operations
Amounts in thousands | Year ended December 31, 2012 |
| | |
Investment Income | | |
Interest | | $ 263,163 |
Income from Fidelity Central Funds | | 117 |
Total income | | 263,280 |
| | |
Expenses | | |
Management fee | $ 23,684 | |
Transfer agent fees | 5,069 | |
Accounting fees and expenses | 720 | |
Custodian fees and expenses | 76 | |
Independent trustees' compensation | 24 | |
Registration fees | 216 | |
Audit | 74 | |
Legal | 18 | |
Miscellaneous | 54 | |
Total expenses before reductions | 29,935 | |
Expense reductions | (101) | 29,834 |
Net investment income (loss) | | 233,446 |
Realized and Unrealized Gain (Loss) Net realized gain (loss) on: | | |
Investment securities: | | |
Unaffiliated issuers | 3,818 | |
Capital gain distributions from Fidelity Central Funds | 1 | |
Total net realized gain (loss) | | 3,819 |
Change in net unrealized appreciation (depreciation) on investment securities | | 247,297 |
Net gain (loss) | | 251,116 |
Net increase (decrease) in net assets resulting from operations | | $ 484,562 |
See accompanying notes which are an integral part of the financial statements.
Annual Report
Financial Statements - continued
Statement of Changes in Net Assets
Amounts in thousands | Year ended
December 31,
2012 | Year ended
December 31,
2011 |
Increase (Decrease) in Net Assets | | |
Operations | | |
Net investment income (loss) | $ 233,446 | $ 227,027 |
Net realized gain (loss) | 3,819 | 1,487 |
Change in net unrealized appreciation (depreciation) | 247,297 | 331,458 |
Net increase (decrease) in net assets resulting
from operations | 484,562 | 559,972 |
Distributions to shareholders from net investment income | (231,561) | (227,872) |
Distributions to shareholders from net realized gain | (300) | (905) |
Total distributions | (231,861) | (228,777) |
Share transactions
Proceeds from sales of shares | 1,423,313 | 1,259,784 |
Reinvestment of distributions | 139,259 | 144,401 |
Cost of shares redeemed | (939,923) | (1,473,902) |
Net increase (decrease) in net assets resulting from share transactions | 622,649 | (69,717) |
Redemption fees | 53 | 55 |
Total increase (decrease) in net assets | 875,403 | 261,533 |
| | |
Net Assets | | |
Beginning of period | 5,916,572 | 5,655,039 |
End of period (including undistributed net investment income of $1,075 and distributions in excess of net investment income of $401, respectively) | $ 6,791,975 | $ 5,916,572 |
Other Information Shares | | |
Sold | 106,259 | 100,767 |
Issued in reinvestment of distributions | 10,356 | 11,488 |
Redeemed | (70,017) | (118,949) |
Net increase (decrease) | 46,598 | (6,694) |
See accompanying notes which are an integral part of the financial statements.
Annual Report
Financial Highlights
Years ended December 31, | 2012 | 2011 | 2010 | 2009 | 2008 |
Selected Per-Share Data | | | | | |
Net asset value, beginning of period | $ 13.03 | $ 12.27 | $ 12.46 | $ 11.49 | $ 12.58 |
Income from Investment Operations | | | | | |
Net investment income (loss) B | .483 | .513 | .516 | .517 | .515 |
Net realized and unrealized gain (loss) | .537 | .764 | (.189) | .970 | (1.081) |
Total from investment operations | 1.020 | 1.277 | .327 | 1.487 | (.566) |
Distributions from net investment income | (.479) | (.515) | (.516) | (.517) | (.513) |
Distributions from net realized gain | (.001) | (.002) | (.001) | - F | (.011) |
Total distributions | (.480) | (.517) | (.517) | (.517) | (.524) |
Redemption fees added to paid in capital B,F | - | - | - | - | - |
Net asset value, end of period | $ 13.57 | $ 13.03 | $ 12.27 | $ 12.46 | $ 11.49 |
Total Return A | 7.92% | 10.64% | 2.58% | 13.14% | (4.61)% |
Ratios to Average Net Assets C,E |
Expenses before reductions | .46% | .46% | .46% | .48% | .47% |
Expenses net of fee waivers, if any | .46% | .46% | .46% | .48% | .47% |
Expenses net of all reductions | .46% | .46% | .46% | .48% | .46% |
Net investment income (loss) | 3.60% | 4.08% | 4.08% | 4.25% | 4.23% |
Supplemental Data | | | | | |
Net assets, end of period (in millions) | $ 6,792 | $ 5,917 | $ 5,655 | $ 5,641 | $ 4,545 |
Portfolio turnover rate D | 10% | 11% | 10% | 10% | 15% |
A Total returns would have been lower if certain expenses had not been reduced during the applicable periods shown.
B Calculated based on average shares outstanding during the period.
C Fees and expenses of any underlying Fidelity Central Funds are not included in the Fund's expense ratio. The Fund indirectly bears its proportionate share of the expenses of any underlying Fidelity Central Funds.
D Amount does not include the portfolio activity of any underlying Fidelity Central Funds.
E Expense ratios reflect operating expenses of the Fund. Expenses before reductions do not reflect amounts reimbursed by the investment adviser or reductions from expense offset arrangements and do not represent the amount paid by the Fund during periods when reimbursements or reductions occur. Expenses net of fee waivers reflect expenses after reimbursement by the investment adviser but prior to reductions from expense offset arrangements. Expenses net of all reductions represent the net expenses paid by the Fund.
F Amount represents less than $.001 per share.
See accompanying notes which are an integral part of the financial statements.
Annual Report
Notes to Financial Statements
For the period ended December 31, 2012
(Amounts in thousands except percentages)
1. Organization.
Fidelity Municipal Income Fund (the Fund) is a fund of Fidelity Municipal Trust (the Trust) and is authorized to issue an unlimited number of shares. The Trust is registered under the Investment Company Act of 1940, as amended (the 1940 Act), as an open-end management investment company organized as a Massachusetts business trust.
2. Investments in Fidelity Central Funds.
The Fund invests in Fidelity Central Funds, which are open-end investment companies available only to other investment companies and accounts managed by Fidelity Management & Research Company (FMR) and its affiliates. The Fund's Schedule of Investments lists each of the Fidelity Central Funds held as of period end, if any, as an investment of the Fund, but does not include the underlying holdings of each Fidelity Central Fund. As an Investing Fund, the Fund indirectly bears its proportionate share of the expenses of the underlying Fidelity Central Funds.
The Money Market Central Funds seek preservation of capital and current income and are managed by Fidelity Investments Money Management, Inc. (FIMM), an affiliate of FMR.
A complete unaudited list of holdings for each Fidelity Central Fund is available upon request or at the Securities and Exchange Commission (the SEC) website at www.sec.gov. In addition, the financial statements of the Fidelity Central Funds, which are not covered by the Fund's Report of Independent Registered Public Accounting Firm, are available on the SEC website or upon request.
3. Significant Accounting Policies.
The financial statements have been prepared in conformity with accounting principles generally accepted in the United States of America (GAAP), which require management to make certain estimates and assumptions at the date of the financial statements. Actual results could differ from those estimates. Subsequent events, if any, through the date that the financial statements were issued have been evaluated in the preparation of the financial statements. The following summarizes the significant accounting policies of the Fund:
Investment Valuation. Investments are valued as of 4:00 p.m. Eastern time on the last calendar day of the period. In accordance with valuation policies and procedures approved by the Board of Trustees (the Board), the Fund attempts to obtain prices from one or more third party pricing vendors or brokers to value its investments. When current market prices, quotations or rates are not readily available or reliable, investments will be fair valued in good faith by the FMR Fair Value Committee (the Committee), in accordance with procedures adopted by the Board. Factors used in determining
Annual Report
3. Significant Accounting Policies - continued
Investment Valuation - continued
fair value vary by investment type and may include market or investment specific events, changes in interest rates and credit quality. The frequency with which these procedures are used cannot be predicted and they may be utilized to a significant extent. The Committee oversees the Fund's valuation policies and procedures and is responsible for approving and reporting to the Board all fair value determinations.
The Fund categorizes the inputs to valuation techniques used to value its investments into a disclosure hierarchy consisting of three levels as shown below:
Level 1 - quoted prices in active markets for identical investments
Level 2 - other significant observable inputs (including quoted prices for similar investments, interest rates, prepayment speeds, etc.)
Level 3 - unobservable inputs (including the Fund's own assumptions based on the best information available)
Valuation techniques used to value the Fund's investments by major category are as follows:
Debt securities, including restricted securities, are valued based on evaluated prices received from third party pricing vendors or from brokers who make markets in such securities. For municipal securities, pricing vendors utilize matrix pricing which considers yield or price of bonds of comparable quality, coupon, maturity and type as well as broker-supplied prices and are generally categorized as Level 2 in the hierarchy.
When independent prices are unavailable or unreliable, debt securities may be valued utilizing pricing methodologies which consider similar factors that would be used by third party pricing vendors. These are generally categorized as Level 2 in the hierarchy but may be Level 3 depending on the circumstances.
Investments in open-end mutual funds, including the Fidelity Central Funds, are valued at their closing net asset value (NAV) each business day and are categorized as Level 1 in the hierarchy.
Changes in valuation techniques may result in transfers in or out of an assigned level within the disclosure hierarchy. The aggregate value of investments by input level, as of December 31, 2012, is included at the end of the Fund's Schedule of Investments.
Investment Transactions and Income. For financial reporting purposes, the Fund's investment holdings and NAV include trades executed through the end of the last business day of the period. The NAV per share for processing shareholder transactions is calculated as of the close of business of the New York Stock Exchange (NYSE), normally
Annual Report
Notes to Financial Statements - continued
(Amounts in thousands except percentages)
3. Significant Accounting Policies - continued
Investment Transactions and Income - continued
4:00 p.m. Eastern time and includes trades executed through the end of the prior business day. Gains and losses on securities sold are determined on the basis of identified cost. Interest income and distributions from the Fidelity Central Funds are accrued as earned. Interest income includes coupon interest and amortization of premium and accretion of discount on debt securities.
Expenses. Expenses directly attributable to a fund are charged to that fund. Expenses attributable to more than one fund are allocated among the respective funds on the basis of relative net assets or other appropriate methods. Expense estimates are accrued in the period to which they relate and adjustments are made when actual amounts are known.
Income Tax Information and Distributions to Shareholders. Each year, the Fund intends to qualify as a regulated investment company under Subchapter M of the Internal Revenue Code, including distributing substantially all of its taxable income and realized gains. As a result, no provision for income taxes is required. As of December 31, 2012, the Fund did not have any unrecognized tax benefits in the financial statements; nor is the Fund aware of any tax positions for which it is reasonably possible that the total amounts of unrecognized tax benefits will significantly change in the next twelve months. The Fund files a U.S. federal tax return, in addition to state and local tax returns as required. A fund's federal income tax returns are subject to examination by the Internal Revenue Service (IRS) for a period of three fiscal years after they are filed. State and local tax returns may be subject to examination for an additional fiscal year depending on the jurisdiction.
Dividends are declared and recorded daily and paid monthly from net investment income. Distributions from realized gains, if any, are declared and recorded on the ex-dividend date. Income and capital gain distributions are determined in accordance with income tax regulations, which may differ from GAAP.
Capital accounts within the financial statements are adjusted for permanent book-tax differences. These adjustments have no impact on net assets or the results of operations. Temporary book-tax differences will reverse in a subsequent period.
Book-tax differences are primarily due to market discount, deferred trustees compensation, capital loss carryforwards, and losses deferred due to futures contracts and excise tax regulations.
The Fund purchases municipal securities whose interest, in the opinion of the issuer, is free from federal income tax. There is no assurance that the IRS will agree with this opinion. In the event the IRS determines that the issuer does not comply with relevant tax requirements, interest payments from a security could become federally taxable, possibly retroactively to the date the security was issued.
Annual Report
3. Significant Accounting Policies - continued
Income Tax Information and Distributions to Shareholders - continued
The federal tax cost of investment securities and unrealized appreciation (depreciation) as of period end were as follows:
Gross unrealized appreciation | $ 538,674 |
Gross unrealized depreciation | (5,156) |
Net unrealized appreciation (depreciation) on securities and other investments | $ 533,518 |
| |
Tax Cost | $ 6,179,998 |
The tax-based components of distributable earnings as of period end were as follows:
Undistributed tax-exempt income | $ 526 |
Capital loss carryforward | $ (8,968) |
Net unrealized appreciation (depreciation) | $ 533,518 |
Capital loss carryforwards are only available to offset future capital gains of the Fund to the extent provided by regulations and may be limited. Under the Regulated Investment Company Modernization Act of 2010 (the Act), the Fund is permitted to carry forward capital losses incurred in taxable years beginning after December 22, 2010 for an unlimited period and such capital losses are required to be used prior to any losses that expire. Capital loss carryforwards were as follows:
Fiscal year of expiration | |
2016 | $ (6,182) |
2018 | (2,786) |
Total capital loss carryforward | $ (8,968) |
The tax character of distributions paid was as follows:
| December 31, 2012 | December 31, 2011 |
Tax-exempt Income | $ 231,561 | $ 227,872 |
Ordinary Income | 300 | 905 |
Total | $ 231,861 | $ 228,777 |
Short-Term Trading (Redemption) Fees. Shares held by investors in the Fund less than 30 days are subject to a redemption fee equal to .50% of the net asset value of shares redeemed. All redemption fees, which reduce the proceeds of the shareholder redemption, are retained by the Fund and accounted for as an addition to paid in capital.
Annual Report
Notes to Financial Statements - continued
(Amounts in thousands except percentages)
3. Significant Accounting Policies - continued
Delayed Delivery Transactions and When-Issued Securities. During the period, the Fund transacted in securities on a delayed delivery or when-issued basis. Payment and delivery may take place after the customary settlement period for that security. The price of the underlying securities and the date when the securities will be delivered and paid for are fixed at the time the transaction is negotiated. The securities purchased on a delayed delivery or when-issued basis are identified as such in the Fund's Schedule of Investments. The Fund may receive compensation for interest forgone in the purchase of a delayed delivery or when-issued security. With respect to purchase commitments, the Fund identifies securities as segregated in its records with a value at least equal to the amount of the commitment. Losses may arise due to changes in the value of the underlying securities or if the counterparty does not perform under the contract's terms, or if the issuer does not issue the securities due to political, economic, or other factors.
Restricted Securities. The Fund may invest in securities that are subject to legal or contractual restrictions on resale. These securities generally may be resold in transactions exempt from registration or to the public if the securities are registered. Disposal of these securities may involve time-consuming negotiations and expense, and prompt sale at an acceptable price may be difficult. Information regarding restricted securities is included at the end of the Fund's Schedule of Investments.
4. Purchases and Sales of Investments.
Purchases and sales of securities, other than short-term securities, aggregated $1,427,105 and $660,355, respectively.
5. Fees and Other Transactions with Affiliates.
Management Fee. FMR and its affiliates provide the Fund with investment management related services for which the Fund pays a monthly management fee. The management fee is the sum of an individual fund fee rate that is based on an annual rate of .25% of the Fund's average net assets and an annualized group fee rate that averaged .12% during the period. The group fee rate is based upon the average net assets of all the mutual funds advised by FMR. The group fee rate decreases as assets under management increase and increases as assets under management decrease. For the period, the total annual management fee rate was .37% of the Fund's average net assets.
Transfer Agent and Accounting Fees. Citibank, N.A. (Citibank) is the custodian, transfer agent and servicing agent for the Fund. Citibank has entered into a sub-arrangement with Fidelity Investments Institutional Operations Company, Inc. (FIIOC), an affiliate of FMR, under which FIIOC performs the activities associated with the Fund's transfer agency, dividend disbursing and shareholder servicing functions. The Fund pays Citibank account fees and asset-based fees that vary according to account size and type
Annual Report
5. Fees and Other Transactions with Affiliates - continued
Transfer Agent and Accounting Fees - continued
of account. FIIOC pays for typesetting, printing and mailing of shareholder reports, except proxy statements. For the period, transfer agent fees were equivalent to an annual rate of .08% of average net assets.
Citibank also has a sub-arrangement with Fidelity Service Company, Inc. (FSC), an affiliate of FMR, under which FSC maintains the Fund's accounting records. The fee is paid to Citibank and is based on the level of average net assets for each month.
6. Committed Line of Credit.
The Fund participates with other funds managed by FMR or an affiliate in a $4.25 billion credit facility (the "line of credit") to be utilized for temporary or emergency purposes to fund shareholder redemptions or for other short-term liquidity purposes. The Fund has agreed to pay commitment fees on its pro-rata portion of the line of credit, which amounted to $17 and is reflected in Miscellaneous expenses on the Statement of Operations. During the period, there were no borrowings on this line of credit.
7. Expense Reductions.
Through arrangements with the Fund's custodian and transfer agent, credits realized as a result of uninvested cash balances were used to reduce the Fund's expenses. During the period, these credits reduced the Fund's custody and transfer agent expenses by $72 and $29, respectively.
8. Other.
The Fund's organizational documents provide former and current trustees and officers with a limited indemnification against liabilities arising in connection with the performance of their duties to the Fund. In the normal course of business, the Fund may also enter into contracts that provide general indemnifications. The Fund's maximum exposure under these arrangements is unknown as this would be dependent on future claims that may be made against the Fund. The risk of material loss from such claims is considered remote.
Annual Report
To the Trustees of Fidelity Municipal Trust and the Shareholders of Fidelity Municipal Income Fund:
In our opinion, the accompanying statement of assets and liabilities, including the schedule of investments, and the related statements of operations and of changes in net assets and the financial highlights present fairly, in all material respects, the financial position of Fidelity Municipal Income Fund (a fund of Fidelity Municipal Trust) at December 31, 2012, the results of its operations for the year then ended, the changes in its net assets for each of the two years in the period then ended and the financial highlights for each of the five years in the period then ended, in conformity with accounting principles generally accepted in the United States of America. These financial statements and financial highlights (hereafter referred to as "financial statements") are the responsibility of the Fidelity Municipal Income Fund's management. Our responsibility is to express an opinion on these financial statements based on our audits. We conducted our audits of these financial statements in accordance with the standards of the Public Company Accounting Oversight Board (United States). Those standards require that we plan and perform the audit to obtain reasonable assurance about whether the financial statements are free of material misstatement. An audit includes examining, on a test basis, evidence supporting the amounts and disclosures in the financial statements, assessing the accounting principles used and significant estimates made by management, and evaluating the overall financial statement presentation. We believe that our audits, which included confirmation of securities at December 31, 2012 by correspondence with the custodian and brokers, provide a reasonable basis for our opinion.
PricewaterhouseCoopers LLP
Boston, Massachusetts
February 12, 2013
Annual Report
The Trustees and executive officers of the trust and fund, as applicable, are listed below. The Board of Trustees governs the fund and is responsible for protecting the interests of shareholders. The Trustees are experienced executives who meet periodically throughout the year to oversee the fund's activities, review contractual arrangements with companies that provide services to the fund, oversee management of the risks associated with such activities and contractual arrangements, and review the fund's performance. Except for Elizabeth S. Acton and James C. Curvey, each of the Trustees oversees 218 funds advised by FMR or an affiliate. Ms. Acton oversees 200 funds advised by FMR or an affiliate. Mr. Curvey oversees 452 funds advised by FMR or an affiliate.
The Trustees hold office without limit in time except that (a) any Trustee may resign; (b) any Trustee may be removed by written instrument, signed by at least two-thirds of the number of Trustees prior to such removal; (c) any Trustee who requests to be retired or who has become incapacitated by illness or injury may be retired by written instrument signed by a majority of the other Trustees; and (d) any Trustee may be removed at any special meeting of shareholders by a two-thirds vote of the outstanding voting securities of the trust. Each Trustee who is not an interested person (as defined in the 1940 Act) (Independent Trustee), shall retire not later than the last day of the month in which his or her 75th birthday occurs. The Independent Trustees may waive this mandatory retirement age policy with respect to individual Trustees. The executive officers hold office without limit in time, except that any officer may resign or may be removed by a vote of a majority of the Trustees at any regular meeting or any special meeting of the Trustees. Except as indicated, each individual has held the office shown or other offices in the same company for the past five years.
Experience, Skills, Attributes, and Qualifications of the Fund's Trustees. The Governance and Nominating Committee has adopted a statement of policy that describes the experience, qualifications, attributes, and skills that are necessary and desirable for potential Independent Trustee candidates (Statement of Policy). The Board believes that each Trustee satisfied at the time he or she was initially elected or appointed a Trustee, and continues to satisfy, the standards contemplated by the Statement of Policy. The Governance and Nominating Committee also engages professional search firms to help identify potential Independent Trustee candidates who have the experience, qualifications, attributes, and skills consistent with the Statement of Policy. From time to time, additional criteria based on the composition and skills of the current Independent Trustees, as well as experience or skills that may be appropriate in light of future changes to board composition, business conditions, and regulatory or other developments, have also been considered by the professional search firms and the Governance and Nominating Committee. In addition, the Board takes into account the Trustees' commitment and participation in Board and committee meetings, as well as their leadership of standing and ad hoc committees throughout their tenure.
In determining that a particular Trustee was and continues to be qualified to serve as a Trustee, the Board has considered a variety of criteria, none of which, in isolation, was controlling. The Board believes that, collectively, the Trustees have balanced and diverse experience, qualifications, attributes, and skills, which allow the Board to operate effectively in governing the fund and protecting the interests of shareholders. Information about the specific experience, skills, attributes, and qualifications of each Trustee, which in each case led to the Board's conclusion that the Trustee should serve (or continue to serve) as a trustee of the fund, is provided below.
Annual Report
Board Structure and Oversight Function. Abigail P. Johnson is an interested person (as defined in the 1940 Act) and currently serves as Chairman. The Trustees have determined that an interested Chairman is appropriate and benefits shareholders because an interested Chairman has a personal and professional stake in the quality and continuity of services provided to the fund. Independent Trustees exercise their informed business judgment to appoint an individual of their choosing to serve as Chairman, regardless of whether the Trustee happens to be independent or a member of management. The Independent Trustees have determined that they can act independently and effectively without having an Independent Trustee serve as Chairman and that a key structural component for assuring that they are in a position to do so is for the Independent Trustees to constitute a substantial majority for the Board. The Independent Trustees also regularly meet in executive session. Albert R. Gamper, Jr. serves as Chairman of the Independent Trustees and as such (i) acts as a liaison between the Independent Trustees and management with respect to matters important to the Independent Trustees and (ii) with management prepares agendas for Board meetings.
Fidelity funds are overseen by different Boards of Trustees. The fund's Board oversees Fidelity's investment-grade bond, money market, and asset allocation funds and another Board oversees Fidelity's equity and high income funds. The asset allocation funds may invest in Fidelity funds that are overseen by such other Board. The use of separate Boards, each with its own committee structure, allows the Trustees of each group of Fidelity funds to focus on the unique issues of the funds they oversee, including common research, investment, and operational issues. On occasion, the separate Boards establish joint committees to address issues of overlapping consequences for the Fidelity funds overseen by each Board.
The Trustees operate using a system of committees to facilitate the timely and efficient consideration of all matters of importance to the Trustees, the fund, and fund shareholders and to facilitate compliance with legal and regulatory requirements and oversight of the fund's activities and associated risks. The Board, acting through its committees, has charged FMR and its affiliates with (i) identifying events or circumstances the occurrence of which could have demonstrably adverse effects on the fund's business and/or reputation; (ii) implementing processes and controls to lessen the possibility that such events or circumstances occur or to mitigate the effects of such events or circumstances if they do occur; and (iii) creating and maintaining a system designed to evaluate continuously business and market conditions in order to facilitate the identification and implementation processes described in (i) and (ii) above. Because the day-to-day operations and activities of the fund are carried out by or through FMR, its affiliates and other service providers, the fund's exposure to risks is mitigated but not eliminated by the processes overseen by the Trustees. While each of the Board's committees has responsibility for overseeing different aspects of the fund's activities, oversight is exercised primarily through the Operations and Audit Committees. In addition, an ad hoc Board committee of Independent Trustees has worked with FMR to enhance the Board's oversight of investment and financial risks, legal and regulatory risks, technology risks, and operational risks, including the development of additional risk reporting to the Board. Appropriate personnel, including but not limited to the fund's Chief Compliance Officer (CCO), FMR's internal auditor, the independent accountants, the fund's Treasurer and portfolio management personnel, make periodic reports to the Board's committees, as appropriate, including an annual review of FMR's risk management program for the Fidelity funds. The responsibilities of each standing committee, including their oversight responsibilities, are described further under "Standing Committees of the Fund's Trustees."
Annual Report
Trustees and Officers - continued
The fund's Statement of Additional Information (SAI) includes more information about the Trustees. To request a free copy, call Fidelity at 1-800-544-8544.
Interested Trustees*:
Correspondence intended for each Trustee who is an interested person may be sent to Fidelity Investments, 82 Devonshire Street, Boston, Massachusetts 02109.
Name, Age; Principal Occupations and Other Relevant Experience+ |
Abigail P. Johnson (51) |
| Year of Election or Appointment: 2009 Ms. Johnson is Trustee and Chairman of the Board of Trustees of certain Trusts. Ms. Johnson serves as President of Fidelity Financial Services (2012-present) and President of Personal, Workplace and Institutional Services (2005-present). Ms. Johnson is Chairman and Director of FMR Co., Inc. (2011-present), Chairman and Director of FMR (2011-present), and the Vice Chairman and Director (2007-present) of FMR LLC. Previously, Ms. Johnson served as President and a Director of FMR (2001-2005), a Trustee of other investment companies advised by FMR, Fidelity Investments Money Management, Inc., and FMR Co., Inc. (2001-2005), Senior Vice President of the Fidelity funds (2001-2005), and managed a number of Fidelity funds. Ms. Abigail P. Johnson and Mr. Arthur E. Johnson are not related. |
James C. Curvey (77) |
| Year of Election or Appointment: 2007 Mr. Curvey also serves as Trustee (2007-present) of other investment companies advised by FMR. Mr. Curvey is a Director of Fidelity Investments Money Management, Inc. (2009-present), Director of Fidelity Research & Analysis Co. (2009-present) and Director of FMR and FMR Co., Inc. (2007-present). Mr. Curvey is also Vice Chairman (2007-present) and Director of FMR LLC. In addition, Mr. Curvey serves as an Overseer for the Boston Symphony Orchestra and a member of the Trustees of Villanova University. Previously, Mr. Curvey was the Vice Chairman (2006-2007) and Director (2000-2007) of FMR Corp. |
* Trustees have been determined to be "Interested Trustees" by virtue of, among other things, their affiliation with the trust or various entities under common control with FMR.
+ The information above includes each Trustee's principal occupation during the last five years and other information relating to the experience, attributes, and skills relevant to each Trustee's qualifications to serve as a Trustee, which led to the conclusion that each Trustee should serve as a Trustee for the fund.
Independent Trustees:
Correspondence intended for each Independent Trustee (that is, the Trustees other than the Interested Trustees) may be sent to Fidelity Investments, P.O. Box 55235, Boston, Massachusetts 02205-5235.
Name, Age; Principal Occupations and Other Relevant Experience+ |
Elizabeth S. Acton (61) |
| Year of Election or Appointment: 2013 Ms. Acton is Trustee of certain Trusts. Prior to her retirement in April 2012, Ms. Acton was Executive Vice President, Finance (November 2011-April 2012), Executive Vice President, Chief Financial Officer (April 2002-November 2011), and Treasurer (May 2004-May 2005) of Comerica Incorporated (financial services). Prior to joining Comerica, Ms. Acton held a variety of positions at Ford Motor Company (1983-2002), including Vice President and Treasurer (2000-2002) and Executive Vice President and Chief Financial Officer of Ford Motor Credit Company (1998-2000). Ms. Acton currently serves as a member of the Board of Directors and Audit and Finance Committees of Beazer Homes USA, Inc. (homebuilding, 2012-present). |
Albert R. Gamper, Jr. (70) |
| Year of Election or Appointment: 2006 Mr. Gamper is Chairman of the Independent Trustees of the Fixed Income and Asset Allocation Funds (2012-present). Prior to his retirement in December 2004, Mr. Gamper served as Chairman of the Board of CIT Group Inc. (commercial finance). During his tenure with CIT Group Inc. Mr. Gamper served in numerous senior management positions, including Chairman (1987-1989; 1999-2001; 2002-2004), Chief Executive Officer (1987-2004), and President (2002-2003). Mr. Gamper currently serves as a member of the Board of Directors of Public Service Enterprise Group (utilities, 2000-present), a member of the Board of Trustees, Rutgers University (2004-present), and Chairman of the Board of Barnabas Health Care System. Previously, Mr. Gamper served as Vice Chairman of the Independent Trustees of the Fixed Income and Asset Allocation Funds (2011-2012) and as Chairman of the Board of Governors, Rutgers University (2004-2007). |
Robert F. Gartland (61) |
| Year of Election or Appointment: 2010 Mr. Gartland is Chairman and an investor in Gartland and Mellina Group Corp. (consulting, 2009-present). Previously, Mr. Gartland served as a partner and investor of Vietnam Partners LLC (investments and consulting, 2008-2011). Prior to his retirement, Mr. Gartland held a variety of positions at Morgan Stanley (financial services, 1979-2007) including Managing Director (1987-2007). |
Arthur E. Johnson (65) |
| Year of Election or Appointment: 2008 Mr. Johnson serves as a member of the Board of Directors of Eaton Corporation (diversified power management, 2009-present), AGL Resources, Inc. (holding company, 2002-present) and Booz Allen Hamilton (management consulting, 2011-present). Prior to his retirement, Mr. Johnson served as Senior Vice President of Corporate Strategic Development of Lockheed Martin Corporation (defense contractor, 1999-2009). He previously served on the Board of Directors of IKON Office Solutions, Inc. (1999-2008) and Delta Airlines (2005-2007). Mr. Arthur E. Johnson is not related to Ms. Abigail P. Johnson. |
Michael E. Kenneally (58) |
| Year of Election or Appointment: 2009 Previously, Mr. Kenneally served as a Member of the Advisory Board for certain Fidelity Fixed Income and Asset Allocation Funds (2008-2009). Prior to his retirement, Mr. Kenneally served as Chairman and Global Chief Executive Officer of Credit Suisse Asset Management (2003-2005). Mr. Kenneally was a Director of the Credit Suisse Funds (U.S. mutual funds, 2004-2008) and certain other closed-end funds (2004-2005) and was awarded the Chartered Financial Analyst (CFA) designation in 1991. |
James H. Keyes (72) |
| Year of Election or Appointment: 2007 Mr. Keyes serves as a member of the Boards of Navistar International Corporation (manufacture and sale of trucks, buses, and diesel engines, since 2002) and Pitney Bowes, Inc. (integrated mail, messaging, and document management solutions, since 1998). Prior to his retirement, Mr. Keyes served as Chairman and Chief Executive Officer of Johnson Controls (automotive, building, and energy, 1998-2002) and as a member of the Board of LSI Logic Corporation (semiconductor technologies, 1984-2008). |
Marie L. Knowles (66) |
| Year of Election or Appointment: 2001 Ms. Knowles is Vice Chairman of the Independent Trustees of the Fixed Income and Asset Allocation Funds (2012-present). Prior to Ms. Knowles' retirement in June 2000, she served as Executive Vice President and Chief Financial Officer of Atlantic Richfield Company (ARCO) (diversified energy, 1996-2000). From 1993 to 1996, she was a Senior Vice President of ARCO and President of ARCO Transportation Company. She served as a Director of ARCO from 1996 to 1998. Ms. Knowles currently serves as a Director and Chairman of the Audit Committee of McKesson Corporation (healthcare service, since 2002). Ms. Knowles is an Honorary Trustee of the Brookings Institution and a member of the Board of the Catalina Island Conservancy and of the Santa Catalina Island Company (2009-present). She also serves as a member of the Advisory Board for the School of Engineering of the University of Southern California and the Foundation Board of the School of Architecture at the University of Virginia (2007-present). Previously, Ms. Knowles served as a Director of Phelps Dodge Corporation (copper mining and manufacturing, 1994-2007). |
Kenneth L. Wolfe (73) |
| Year of Election or Appointment: 2005 Prior to his retirement, Mr. Wolfe served as Chairman and a Director (2007-2009) and Chairman and Chief Executive Officer (1994-2001) of Hershey Foods Corporation. He also served as a member of the Boards of Adelphia Communications Corporation (telecommunications, 2003-2006), Bausch & Lomb, Inc. (medical/pharmaceutical, 1993-2007), and Revlon, Inc. (personal care products, 2004-2009). Mr. Wolfe previously served as Chairman of the Independent Trustees of the Fixed Income and Asset Allocation Funds (2008-2012). |
+ The information above includes each Trustee's principal occupation during the last five years and other information relating to the experience, attributes, and skills relevant to each Trustee's qualifications to serve as a Trustee, which led to the conclusion that each Trustee should serve as a Trustee for the fund.
Executive Officers:
Correspondence intended for each executive officer may be sent to Fidelity Investments, 82 Devonshire Street, Boston, Massachusetts 02109.
Name, Age; Principal Occupation |
Stephanie J. Dorsey (43) |
| Year of Election or Appointment: 2013 President and Treasurer of Fidelity's Fixed Income and Asset Allocation Funds. Ms. Dorsey also serves as Assistant Treasurer of other Fidelity funds (2010-present) and is an employee of Fidelity Investments (2008-present). Previously, Ms. Dorsey served as Deputy Treasurer of Fidelity's Fixed Income and Asset Allocation Funds (2008-2013), Treasurer (2004-2008) of the JPMorgan Mutual Funds and Vice President (2004-2008) of JPMorgan Chase Bank. |
Charles S. Morrison (52) |
| Year of Election or Appointment: 2012 Vice President of Fidelity's Fixed Income and Asset Allocation Funds. Mr. Morrison also serves as President, Fixed Income and is an employee of Fidelity Investments. Previously, Mr. Morrison served as Vice President of Fidelity's Money Market Funds (2005-2009), President, Money Market Group Leader of FMR (2009), and Senior Vice President, Money Market Group of FMR (2004-2009). Mr. Morrison also served as Vice President of Fidelity's Bond Funds (2002-2005), certain Balanced Funds (2002-2005), and certain Asset Allocation Funds (2002-2007), and as Senior Vice President (2002-2005) of Fidelity's Fixed Income Division. |
Robert P. Brown (49) |
| Year of Election or Appointment: 2012 Vice President of Fidelity's Bond Funds. Mr. Brown also serves as Executive Vice President of Fidelity Investments Money Management, Inc. (2010-present), President, Bond Group of FMR (2011-present), Director and Managing Director, Research of Fidelity Management & Research (U.K.) Inc. (2008-present) and is an employee of Fidelity Investments. Previously, Mr. Brown served as President, Money Market Group of FMR (2010-2011) and Vice President of Fidelity's Money Market Funds (2010-2012). |
Scott C. Goebel (44) |
| Year of Election or Appointment: 2008 Secretary and Chief Legal Officer (CLO) of the Fidelity funds. Mr. Goebel also serves as Secretary of Fidelity Investments Money Management, Inc. (FIMM) (2010-present) and Fidelity Research and Analysis Company (FRAC) (2010-present); Secretary and CLO of The North Carolina Capital Management Trust: Cash and Term Portfolios (2008-present); General Counsel, Secretary, and Senior Vice President of FMR (2008-present) and FMR Co., Inc. (2008-present); employed by FMR LLC or an affiliate (2001-present); Chief Legal Officer of Fidelity Management & Research (Hong Kong) Limited (2008-present) and Assistant Secretary of Fidelity Management & Research (Japan) Inc. (2008-present), and Fidelity Management & Research (U.K.) Inc. (2008-present). Previously, Mr. Goebel served as Assistant Secretary of FIMM (2008-2010), FRAC (2008-2010), and the Funds (2007-2008) and as Vice President and Secretary of Fidelity Distributors Corporation (FDC) (2005-2007). |
Ramon Herrera (38) |
| Year of Election or Appointment: 2012 Assistant Secretary of Fidelity's Fixed Income and Asset Allocation Funds. Mr. Herrera also serves as Vice President, Associate General Counsel (2010-present) and is an employee of Fidelity Investments (2004-present). |
Elizabeth Paige Baumann (44) |
| Year of Election or Appointment: 2012 Anti-Money Laundering (AML) Officer of the Fidelity funds. Ms. Baumann also serves as AML Officer of The North Carolina Capital Management Trust: Cash and Term Portfolios (2012-present), Chief AML Officer of FMR LLC (2012-present), and is an employee of Fidelity Investments. Previously, Ms. Baumann served as Vice President and Deputy Anti-Money Laundering Officer (2007-2012). |
Christine Reynolds (54) |
| Year of Election or Appointment: 2008 Chief Financial Officer of the Fidelity funds. Ms. Reynolds became President of Fidelity Pricing and Cash Management Services (FPCMS) in August 2008. Ms. Reynolds served as Chief Operating Officer of FPCMS (2007-2008). Previously, Ms. Reynolds served as President, Treasurer, and Anti-Money Laundering officer of the Fidelity funds (2004-2007). |
Michael H. Whitaker (45) |
| Year of Election or Appointment: 2008 Chief Compliance Officer of Fidelity's Fixed Income and Asset Allocation Funds. Mr. Whitaker also serves as Chief Compliance Officer of The North Carolina Capital Management Trust: Cash and Term Portfolios (2008-present). Mr. Whitaker is an employee of Fidelity Investments (2007-present). Prior to joining Fidelity Investments, Mr. Whitaker worked at MFS Investment Management where he served as Senior Vice President and Chief Compliance Officer (2004-2006), and Assistant General Counsel. |
Joseph F. Zambello (55) |
| Year of Election or Appointment: 2011 Deputy Treasurer of the Fidelity funds. Mr. Zambello is an employee of Fidelity Investments. Previously, Mr. Zambello served as Vice President of FMR's Program Management Group (2009-2011) and Vice President of the Transfer Agent Oversight Group (2005-2009). |
Stephen Sadoski (41) |
| Year of Election or Appointment: 2013 Deputy Treasurer of Fidelity's Fixed Income and Asset Allocation Funds. Mr. Sadoski also serves as Deputy Treasurer of other Fidelity funds (2012-present) and is an employee of Fidelity Investments (2012-present). Previously, Mr. Sadoski served as Assistant Treasurer of Fidelity's Fixed Income and Asset Allocation Funds (2012-2013), an assistant chief accountant in the Division of Investment Management of the Securities and Exchange Commission (SEC) (2009-2012) and as a senior manager at Deloitte & Touche (1997-2009). |
Adrien E. Deberghes (45) |
| Year of Election or Appointment: 2010 Assistant Treasurer of Fidelity's Fixed Income and Asset Allocation Funds. Mr. Deberghes also serves as Vice President and Assistant Treasurer (2011-present) and Deputy Treasurer (2008-present) of other Fidelity funds, and is an employee of Fidelity Investments (2008-present). Previously, Mr. Deberghes served as Senior Vice President of Mutual Fund Administration at State Street Corporation (2007-2008), Senior Director of Mutual Fund Administration at Investors Bank & Trust (2005-2007), and Director of Finance for Dunkin' Brands (2000-2005). |
Kenneth B. Robins (43) |
| Year of Election or Appointment: 2009 Assistant Treasurer of the Fidelity Fixed Income and Asset Allocation Funds. Mr. Robins also serves as President and Treasurer of other Fidelity funds (2008-present; 2010-present) and is an employee of Fidelity Investments (2004-present). Previously, Mr. Robins served as Deputy Treasurer of the Fidelity funds (2005-2008) and Treasurer and Chief Financial Officer of The North Carolina Capital Management Trust: Cash and Term Portfolios (2006-2008). |
Gary W. Ryan (54) |
| Year of Election or Appointment: 2005 Assistant Treasurer of the Fidelity funds. Mr. Ryan is an employee of Fidelity Investments. Previously, Mr. Ryan served as Vice President of Fund Reporting in Fidelity Pricing and Cash Management Services (FPCMS) (1999-2005). |
Jonathan Davis (44) |
| Year of Election or Appointment: 2010 Assistant Treasurer of the Fidelity funds. Mr. Davis is also Assistant Treasurer of Fidelity Rutland Square Trust II and Fidelity Commonwealth Trust II. Mr. Davis is an employee of Fidelity Investments. Previously, Mr. Davis served as Vice President and Associate General Counsel of FMR LLC (2003-2010). |
Annual Report
During fiscal year ended 2012, 100% of the fund's income dividends was free from federal income tax, and 2.82% of the fund's income dividends was subject to the federal alternative minimum tax.
The fund will notify shareholders in January 2013 of amounts for use in preparing 2012 income tax returns.
Annual Report
Board Approval of Investment Advisory Contracts and Management Fees
Fidelity Municipal Income Fund
Each year, the Board of Trustees, including the Independent Trustees (together, the Board), votes on the renewal of the management contract and sub-advisory agreements (together, the Advisory Contracts) for the fund. The Board, assisted by the advice of fund counsel and Independent Trustees' counsel, requests and considers a broad range of information relevant to the renewal of the Advisory Contracts throughout the year.
The Board meets regularly and, at each of its meetings, covers an extensive agenda of topics and materials and considers factors that are relevant to its annual consideration of the renewal of the fund's Advisory Contracts, including the services and support provided to the fund and its shareholders. The Board has established three standing committees, Operations, Audit, and Governance and Nominating, each composed of and chaired by Independent Trustees with varying backgrounds, to which the Board has assigned specific subject matter responsibilities in order to enhance effective decision-making by the Board. The Operations Committee, of which all of the Independent Trustees are members, meets regularly throughout the year and, among other matters, considers matters specifically related to the annual consideration of the renewal of the fund's Advisory Contracts. The Board, acting directly and through its Committees, requests and receives information concerning the annual consideration of the renewal of the fund's Advisory Contracts. The Board also meets as needed to consider matters specifically related to the Board's annual consideration of the renewal of Advisory Contracts. Members of the Board may also meet with trustees of other Fidelity funds through ad hoc joint committees to discuss certain matters relevant to the Fidelity funds.
At its September 2012 meeting, the Board of Trustees, including the Independent Trustees, unanimously determined to renew the fund's Advisory Contracts. In reaching its determination, the Board considered all factors it believed relevant, including (i) the nature, extent, and quality of the services to be provided to the fund and its shareholders (including the investment performance of the fund); (ii) the competitiveness of the fund's management fee and total expense ratio relative to peer funds; (iii) the total costs of the services to be provided by and the profits to be realized by Fidelity from its relationship with the fund; (iv) the extent to which economies of scale exist and would be realized as the fund grows; and (v) whether fee levels reflect these economies of scale, if any, for the benefit of fund shareholders.
In considering whether to renew the Advisory Contracts for the fund, the Board reached a determination, with the assistance of fund counsel and Independent Trustees' counsel and through the exercise of its business judgment, that the renewal of the Advisory Contracts is in the best interests of the fund and its shareholders and that the compensation payable under the Advisory Contracts is fair and reasonable. The Board's decision to renew the Advisory Contracts was not based on any single factor, but rather was based on a comprehensive consideration of all the information provided to the Board at its meetings throughout the year. The Board, in reaching its determination to renew the Advisory Contracts, was aware that shareholders in the fund have a broad range of investment choices available to them, including a wide choice among mutual funds offered by Fidelity's competitors, and that the fund's shareholders, who have the opportunity to review and weigh the disclosure provided by the fund in its prospectus and other public disclosures, have chosen to invest in this fund, managed by Fidelity.
Annual Report
Board Approval of Investment Advisory Contracts and
Management Fees - continued
Nature, Extent, and Quality of Services Provided. The Board considered the staffing within the investment adviser, FMR, and the sub-advisers (together, the Investment Advisers), including the backgrounds of the fund's investment personnel, and also considered the fund's investment objective, strategies, and related investment philosophy. The Independent Trustees also had discussions with senior management of Fidelity's investment operations and investment groups. The Board considered the structure of the portfolio manager compensation program and whether this structure provides appropriate incentives to act in the best interests of the fund.
Resources Dedicated to Investment Management and Support Services. The Board reviewed the general qualifications and capabilities of the Investment Advisers' investment staff, including its size, education, experience, and resources, as well as the Investment Advisers' approach to recruiting, managing, and compensating investment personnel. The Board also noted that FMR has continued to increase the resources devoted to non-U.S. offices, including expansion of Fidelity's global investment organization. The Board noted that Fidelity's analysts have extensive resources, tools and capabilities that allow them to conduct sophisticated quantitative and fundamental analysis, as well as credit analysis of issuers, counterparties and guarantors. The Board also believes that Fidelity's investment professionals have sufficient access to global information and data so as to provide competitive investment results over time, and that those professionals also have access to sophisticated tools that permit them to assess portfolio construction and risk and performance attribution characteristics continuously, as well as to transmit new information and research conclusions rapidly around the world. Additionally, in its deliberations, the Board considered the Investment Advisers' trading and risk management capabilities and resources, which are an integral part of the investment management process.
Shareholder and Administrative Services. The Board considered (i) the nature, extent, quality, and cost of advisory, administrative, and shareholder services performed by the Investment Advisers and their affiliates under the Advisory Contracts and under separate agreements covering transfer agency and pricing and bookkeeping services for the fund; (ii) the nature and extent of the supervision of third party service providers, principally custodians and subcustodians; and (iii) the resources devoted to, and the record of compliance with, the fund's compliance policies and procedures.
Annual Report
The Board noted that the growth of fund assets over time across the complex allows Fidelity to reinvest in the development of services designed to enhance the value or convenience of the Fidelity funds as investment vehicles. These services include 24-hour access to account information and market information through telephone representatives and over the Internet, investor education materials and asset allocation tools, and the expanded availability of Fidelity Investor Centers.
Investment in a Large Fund Family. The Board considered the benefits to shareholders of investing in a Fidelity fund, including the benefits of investing in a fund that is part of a large family of funds offering a variety of investment disciplines and providing a large variety of mutual fund investor services. The Board noted that Fidelity had taken, or had made recommendations that resulted in the Fidelity funds taking, a number of actions over the previous year that benefited particular funds, including (i) continuing to dedicate additional resources to investment research and support of the senior management team that oversees asset management; (ii) persisting in efforts to enhance Fidelity's research capabilities, in particular, international research; (iii) launching new funds and making other enhancements to meet client needs for global and income-oriented solutions; (iv) continuing to launch dedicated lower cost underlying funds to meet investment management's portfolio construction needs related to expanding underlying fund options, specifically for the Freedom Fund product lines; (v) adopting a sector neutral investment approach for certain funds and utilizing a team of portfolio managers to manage certain sector-neutral funds; (vi) rationalizing product lines and gaining increased efficiencies through combinations of several funds with other funds; (vii) strengthening the Spartan Index Fund product line by adding new funds and/or new low-cost institutional share classes, restructuring fund expenses to accommodate new classes, and reducing investment minimums for certain classes of shares; (viii) modifying the eligibility criteria for Institutional Class shares to increase their appeal to government entities and charitable investors; and (ix) reducing certain transfer agent fee rates.
Investment Performance. The Board considered whether the fund has operated in accordance with its investment objective, as well as its record of compliance with its investment restrictions. It also reviewed the fund's absolute investment performance, as well as the fund's relative investment performance measured over multiple periods against (i) a broad-based securities market index, and (ii) a peer group of mutual funds deemed appropriate by Fidelity and reviewed by the Board. The following charts considered by the Board show, over the one-, three-, and five-year periods ended December 31, 2011, the fund's cumulative total returns, the cumulative total returns of a broad-based securities market index ("benchmark"), and a range of cumulative total returns of a peer group of mutual funds identified by Lipper Inc. as having an investment objective similar to that of the fund. The box within each chart shows the 25th percentile return (top of box) and the 75th percentile return (bottom of box) of the peer group. Returns shown above the box are in the first quartile and returns shown below the box are in the fourth quartile. The percentage beaten number noted below each chart corresponds to the percentile box and represents the percentage of funds in the peer group whose performance was equal to or lower than that of the fund.
Annual Report
Board Approval of Investment Advisory Contracts and
Management Fees - continued
Fidelity Municipal Income Fund
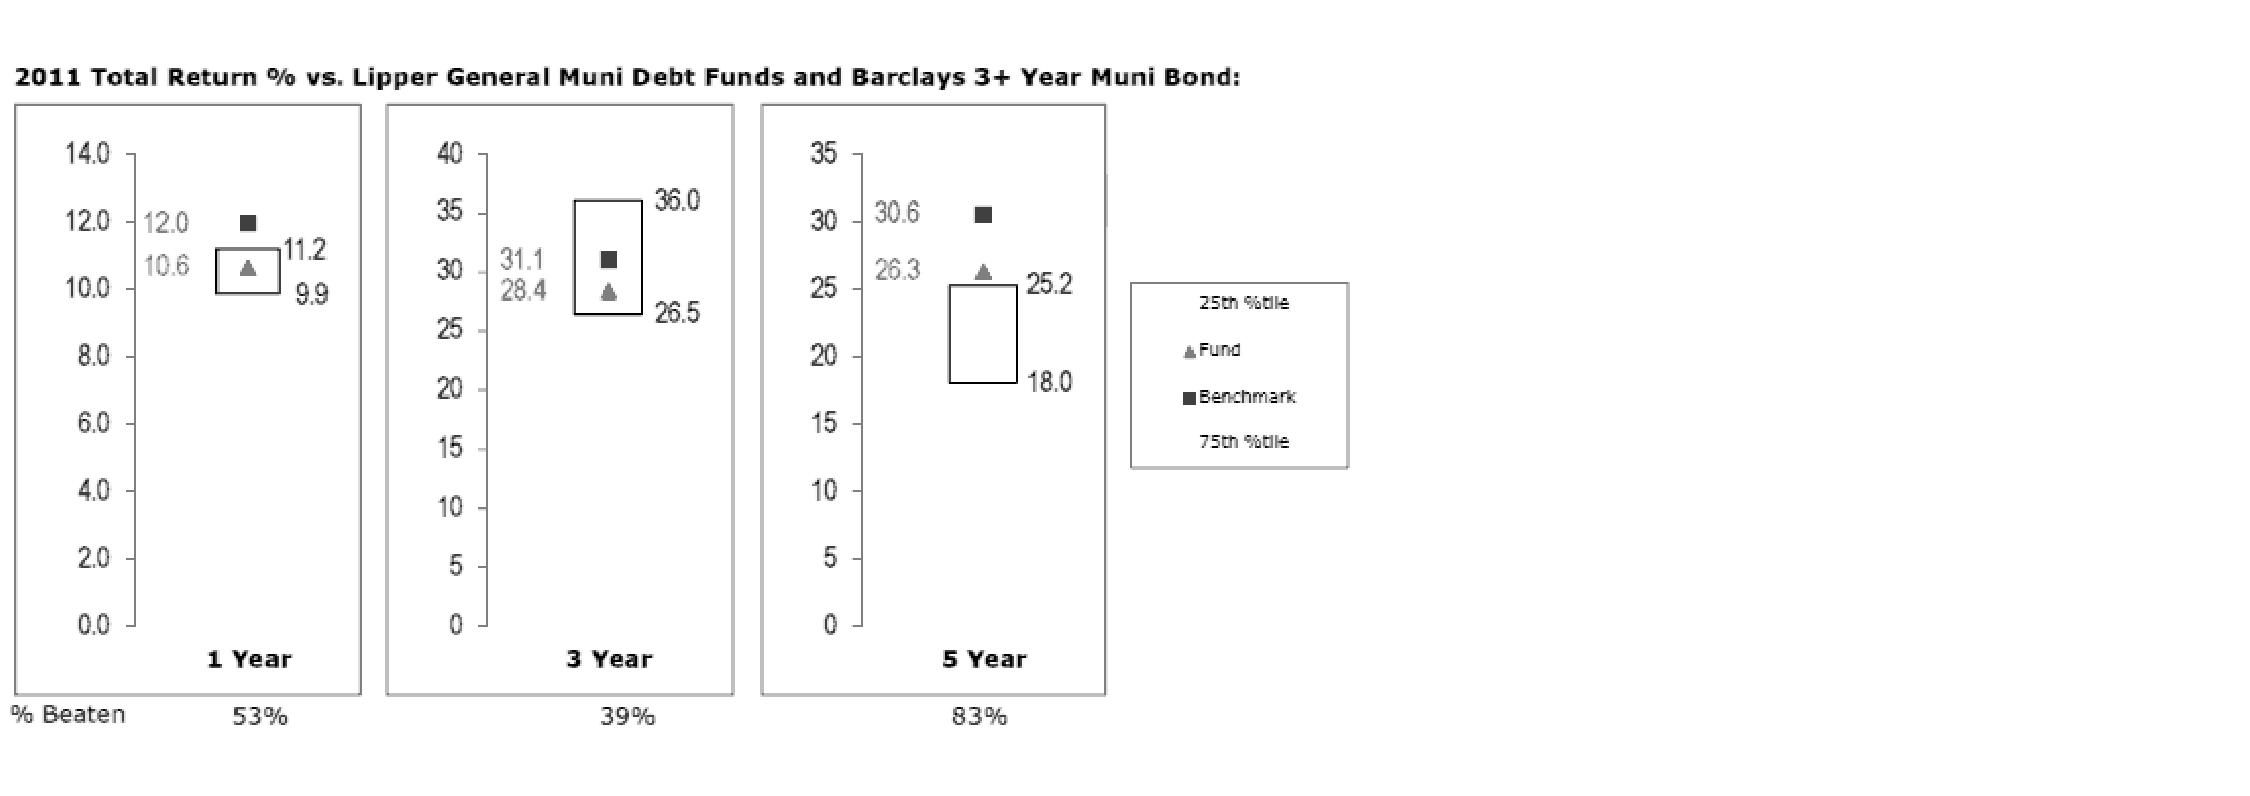
The Board reviewed the fund's relative investment performance against its peer group and noted that the performance of the fund was in the second quartile for the one-year period, the third quartile for the three-year period, and the first quartile for the five-year period. The Board also noted that the investment performance of the fund was lower than its benchmark for all the periods shown. The Board discussed with FMR actions to improve the fund's below-benchmark performance. The Board also reviewed the fund's performance since inception as well as performance in the current year. The Board will continue to closely monitor the performance of the fund in the coming year and discuss with FMR if other actions to address performance are appropriate.
Based on its review, the Board concluded that the nature, extent, and quality of services provided to the fund under the Advisory Contracts should benefit the fund's shareholders.
Competitiveness of Management Fee and Total Expense Ratio. The Board considered the fund's management fee and total expense ratio compared to "mapped groups" of competitive funds and classes. Fidelity creates "mapped groups" by combining similar Lipper investment objective categories that have comparable management fee characteristics. Combining Lipper investment objective categories aids the Board's management fee and total expense ratio comparisons by broadening the competitive group used for comparison and by reducing the number of universes to which various Fidelity funds are compared.
Annual Report
Management Fee. The Board considered two proprietary management fee comparisons for the 12-month periods shown in the chart below. The group of Lipper funds used by the Board for management fee comparisons is referred to below as the "Total Mapped Group" and, for the reasons explained above, is broader than the Lipper peer group used by the Board for performance comparisons. The Total Mapped Group comparison focuses on a fund's standing relative to the total universe of comparable funds available to investors in terms of gross management fees before expense reimbursements or caps. "TMG %" represents the percentage of funds in the Total Mapped Group that had management fees that were lower than the fund's. For example, a TMG % of 7% means that 93% of the funds in the Total Mapped Group had higher management fees than the fund. The "Asset-Size Peer Group" (ASPG) comparison focuses on a fund's standing relative to non-Fidelity funds similar in size to the fund within the Total Mapped Group. The ASPG represents at least 15% of the funds in the Total Mapped Group with comparable asset size and management fee characteristics, subject to a minimum of 50 funds (or all funds in the Total Mapped Group if fewer than 50). Additional information, such as the ASPG quartile in which the fund's management fee ranked, is also included in the chart and considered by the Board.
Fidelity Municipal Income Fund
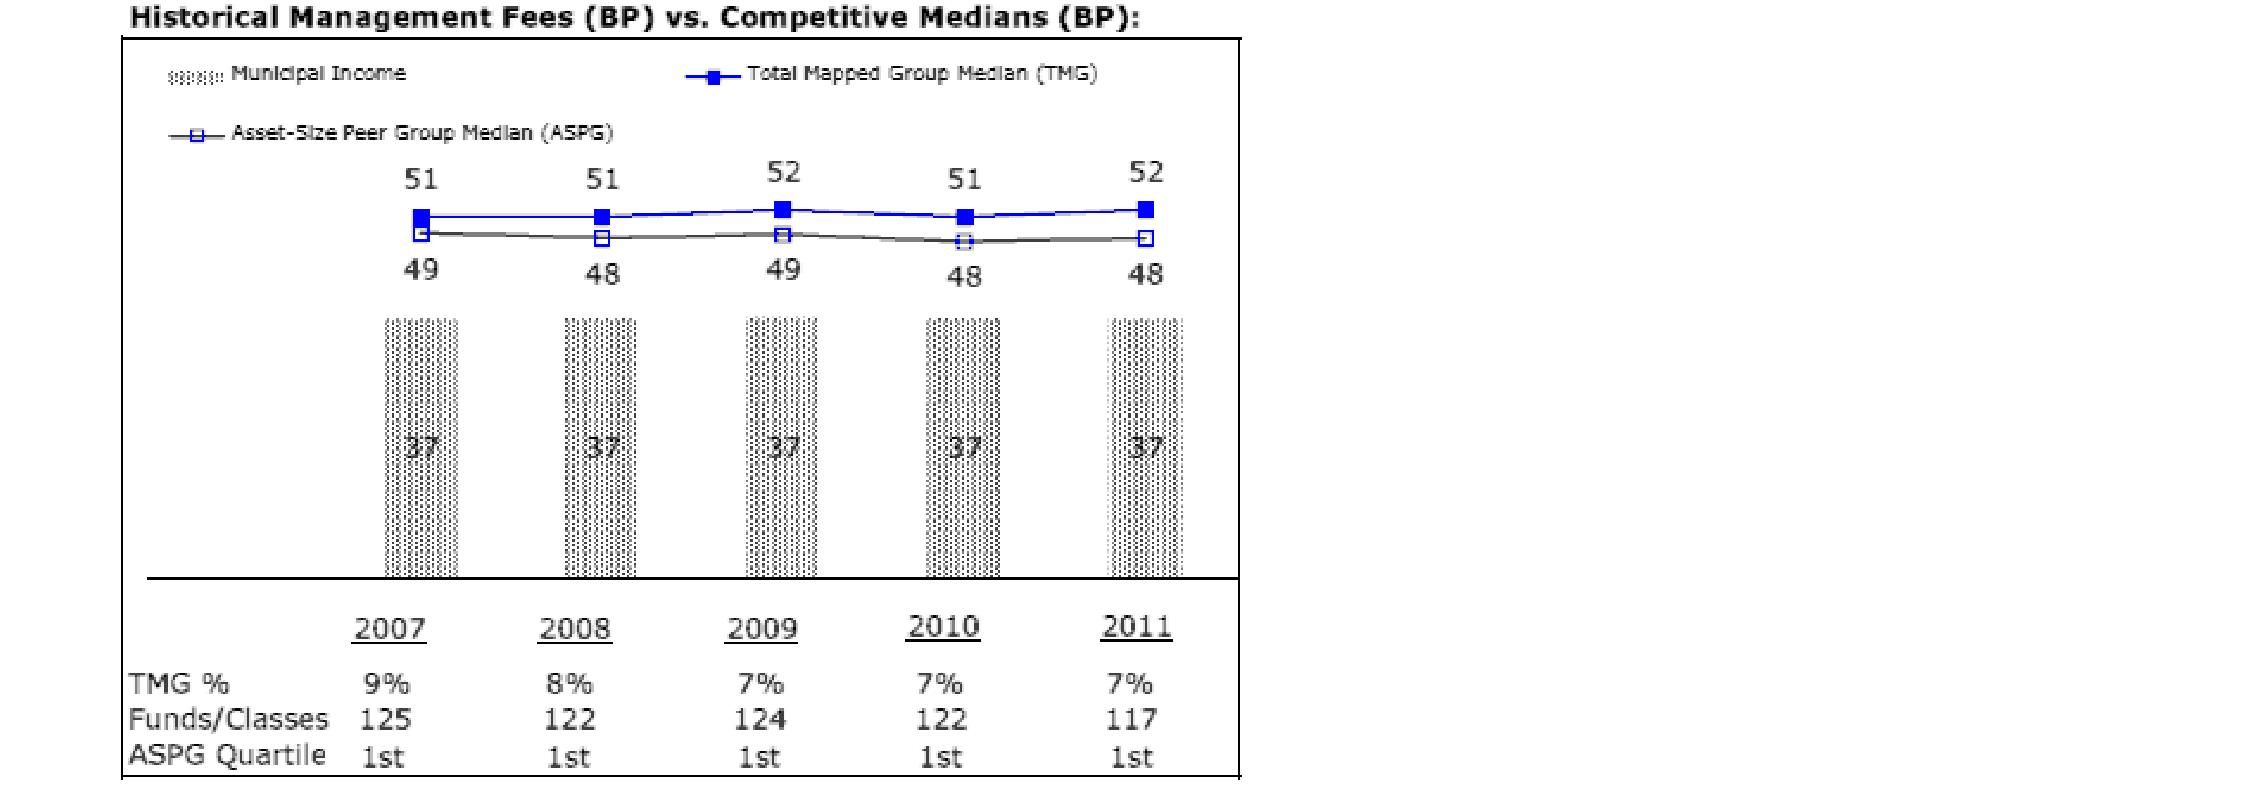
The Board noted that the fund's management fee ranked below the median of its Total Mapped Group and below the median of its ASPG for 2011.
Annual Report
Board Approval of Investment Advisory Contracts and
Management Fees - continued
Based on its review, the Board concluded that the fund's management fee is fair and reasonable in light of the services that the fund receives and the other factors considered.
Total Expense Ratio. In its review of the fund's total expense ratio, the Board considered the fund's management fee as well as other fund expenses, such as transfer agent fees, pricing and bookkeeping fees, and custodial, legal, and audit fees. The Board also noted the effects of any waivers and reimbursements on fees and expenses. As part of its review, the Board also considered the current and historical total expense ratios of the fund compared to competitive fund median expenses. The fund is compared to those funds and classes in the Total Mapped Group (used by the Board for management fee comparisons) that have a similar sales load structure.
The Board noted that the fund's total expense ratio ranked below its competitive median for 2011.
Fees Charged to Other Fidelity Clients. The Board also considered Fidelity fee structures and other information with respect to clients of FMR and its affiliates, such as other mutual funds advised or subadvised by FMR or its affiliates, pension plan clients, and other institutional clients. The Board noted the findings of the 2010 ad hoc joint committee (created with the board of other Fidelity funds), which reviewed and compared Fidelity's institutional investment advisory business with its business of providing services to the Fidelity funds, including the differences in services provided, fees charged, and costs incurred, as well as competition in their respective marketplaces.
Based on its review of total expense ratios and fees charged to other Fidelity clients, the Board concluded that the fund's total expense ratio was reasonable in light of the services that the fund and its shareholders receive and the other factors considered.
Costs of the Services and Profitability. The Board considered the revenues earned and the expenses incurred by Fidelity in conducting the business of developing, marketing, distributing, managing, administering and servicing the fund and its shareholders. The Board also considered the level of Fidelity's profits in respect of all the Fidelity funds.
On an annual basis, FMR presents to the Board Fidelity's profitability for the fund. Fidelity calculates the profitability for each fund, as well as aggregate profitability for groups of Fidelity funds and all Fidelity funds, using a series of detailed revenue and cost allocation methodologies which originate with the books and records of Fidelity on which Fidelity's audited financial statements are based. The Audit Committee of the Board reviews any significant changes from the prior year's methodologies.
PricewaterhouseCoopers LLP (PwC), independent registered public accounting firm and auditor to Fidelity and certain Fidelity funds, has been engaged annually by the Board as part of the Board's assessment of Fidelity's profitability analysis. PwC's engagement includes the review and assessment of Fidelity's methodologies used in determining the revenues and expenses attributable to Fidelity's mutual fund business, and completion of agreed-upon procedures surrounding the mathematical accuracy of fund profitability and its conformity to allocation methodologies. After considering PwC's reports issued under the engagement and information provided by Fidelity, the Board concluded that while other allocation methods may also be reasonable, Fidelity's profitability methodologies are reasonable in all material respects.
Annual Report
The Board also reviewed Fidelity's non-fund businesses and fall-out benefits related to the mutual fund business as well as cases where Fidelity's affiliates may benefit from or be related to the fund's business.
The Board considered the costs of the services provided by and the profits realized by Fidelity in connection with the operation of the fund and was satisfied that the profitability was not excessive in the circumstances.
Economies of Scale. The Board considered whether there have been economies of scale in respect of the management of the Fidelity funds, whether the Fidelity funds (including the fund) have appropriately benefited from any such economies of scale, and whether there is potential for realization of any further economies of scale. The Board considered the extent to which the fund will benefit from economies of scale through increased services to the fund, through waivers or reimbursements, or through fee or expense reductions. The Board also noted that in 2009, it and the board of other Fidelity funds created an ad hoc committee (the Economies of Scale Committee) to analyze whether FMR attains economies of scale in respect of the management and servicing of the Fidelity funds, whether the Fidelity funds have appropriately benefited from such economies of scale, and whether there is potential for realization of any further economies of scale.
The Board recognized that the fund's management contract incorporates a "group fee" structure, which provides for lower group fee rates as total fund assets under FMR's management increase, and for higher group fee rates as total fund assets under FMR's management decrease. FMR calculates the group fee rates based on a tiered asset "breakpoint" schedule that varies based on asset class. The Board considered that the group fee is designed to deliver the benefits of economies of scale to fund shareholders when total Fidelity fund assets increase, even if assets of any particular fund are unchanged or have declined, because some portion of Fidelity's costs are attributable to services provided to all Fidelity funds, and all funds benefit if those costs can be allocated among more assets. The Board concluded that, given the group fee structure, fund shareholders will benefit from lower management fees as assets under FMR's management increase at the fund complex level, regardless of whether Fidelity achieves any such economies of scale.
Annual Report
Board Approval of Investment Advisory Contracts and
Management Fees - continued
The Board concluded, taking into account the analysis of the Economies of Scale Committee, that economies of scale, if any, are being appropriately shared between fund shareholders and Fidelity.
Additional Information Requested by the Board. In order to develop fully the factual basis for consideration of the Fidelity funds' Advisory Contracts, the Board requested and received additional information on certain topics, including: (i) Fidelity's fund profitability methodology, profitability trends for certain funds, and the impact of certain factors on fund profitability results; (ii) portfolio manager changes that have occurred during the past year and the amount of the investment that each portfolio manager has made in the Fidelity fund(s) that he or she manages; (iii) Fidelity's compensation structure for portfolio managers, research analysts, and other key personnel, including its effects on fund profitability, the rationale for the compensation structure, and the extent to which current market conditions have affected retention and recruitment; (iv) the compensation paid to fund sub-advisers on behalf of the Fidelity funds; (v) Fidelity's fee structures, including the group fee structure, and the rationale for recommending different fees among different categories of funds and classes; (vi) Fidelity's voluntary waiver of its fees to maintain minimum yields for certain money market funds and classes as well as contractual waivers in place for certain funds; (vii) regulatory and industry developments, including those affecting money market funds and target date funds, and the potential impact to Fidelity; (viii) Fidelity's transfer agent fees, expenses, and services, and drivers for determining the transfer agent fee structure of different funds and classes; (ix) management fee rates charged by FMR or Fidelity entities to other Fidelity clients; (x) the allocation of and historical trends in Fidelity's realization of fall-out benefits; and (xi) explanations regarding the relative total expense ratios of certain funds and classes, total expense competitive trends, and actions that might be taken by FMR to reduce total expense ratios for certain funds and classes or to achieve further economies of scale.
Based on its evaluation of all of the conclusions noted above, and after considering all factors it believed relevant, the Board ultimately concluded that the advisory fee structures are fair and reasonable, and that the fund's Advisory Contracts should be renewed.
Annual Report
Investment Adviser
Fidelity Management & Research Company
Boston, MA
Investment Sub-Advisers
Fidelity Investments Money
Management, Inc.
Fidelity Management & Research
(U.K.) Inc.
Fidelity Management & Research
(Hong Kong) Limited
Fidelity Management & Research
(Japan) Inc.
General Distributor
Fidelity Distributors Corporation
Smithfield, RI
Transfer and Service Agents
Citibank, N.A.
New York, NY
Fidelity Investments Institutional
Operations Company, Inc.
Boston, MA
Fidelity Service Company, Inc.
Boston, MA
Custodian
Citibank, N.A.
New York, NY
The Fidelity Telephone Connection
Mutual Fund 24-Hour Service
Exchanges/Redemptions
and Account Assistance 1-800-544-6666
Product Information 1-800-544-6666
Retirement Accounts 1-800-544-4774
(8 a.m. - 9 p.m.)
TDD Service 1-800-544-0118
for the deaf and hearing impaired
(9 a.m. - 9 p.m. Eastern time)
Fidelity Automated Service
Telephone(FAST®)
1-800-544-5555
Automated line for quickest service
(Fidelity Investment logo)(registered trademark)
Corporate Headquarters
82 Devonshire St., Boston, MA 02109
www.fidelity.com
HIY-UANN-0213
1.787741.109
Fidelity®
Ohio Municipal Income Fund
and
Fidelity
Ohio Municipal Money Market
Fund
Annual Report
December 31, 2012
(Fidelity Cover Art)
Contents
Performance | (Click Here) | How the fund has done over time. |
Management's Discussion of Fund Performance | (Click Here) | The Portfolio Manager's review of fund performance and strategy. |
Shareholder Expense Example | (Click Here) | An example of shareholder expenses. |
Fidelity® Ohio Municipal Income Fund |
Investment Changes | (Click Here) | A summary of major shifts in the fund's investments over the past six months. |
Investments | (Click Here) | A complete list of the fund's investments with their market values. |
Financial Statements | (Click Here) | Statements of assets and liabilities, operations, and changes in net assets, as well as financial highlights. |
Fidelity Ohio Municipal Money Market Fund |
Investment
Changes/Performance | (Click Here) | A summary of major shifts in the fund's investments over the past six months. |
Investments | (Click Here) | A complete list of the fund's investments. |
Financial Statements | (Click Here) | Statements of assets and liabilities, operations, and changes in net assets, as well as financial highlights. |
Notes | (Click Here) | Notes to the financial statements. |
Report of Independent Registered Public Accounting Firm | (Click Here) | |
Trustees and Officers | (Click Here) | |
Distributions | (Click Here) | |
Board Approval of Investment Advisory Contracts and Management Fees | (Click Here) | |
To view a fund's proxy voting guidelines and proxy voting record for the 12-month period ended June 30, visit http://www.fidelity.com/proxyvotingresults or visit the Securities and Exchange Commission's (SEC) web site at http://www.sec.gov. You may also call 1-800-544-8544 to request a free copy of the proxy voting guidelines.
Standard & Poor's, S&P and S&P 500 are registered service marks of The McGraw-Hill Companies, Inc. and have been licensed for use by Fidelity Distributors Corporation.
Other third party marks appearing herein are the property of their respective owners.
All other marks appearing herein are registered or unregistered trademarks or service marks of FMR LLC or an affiliated company. © 2013 FMR LLC. All rights reserved.
Annual Report
This report and the financial statements contained herein are submitted for the general information of the shareholders of the funds. This report is not authorized for distribution to prospective investors in the funds unless preceded or accompanied by an effective prospectus.
A fund files its complete schedule of portfolio holdings with the SEC for the first and third quarters of each fiscal year on Form N-Q. Forms N-Q are available on the SEC's web site at http://www.sec.gov. A fund's Forms N-Q may be reviewed and copied at the SEC's Public Reference Room in Washington, DC. Information regarding the operation of the SEC's Public Reference Room may be obtained by calling 1-800-SEC-0330. For a complete list of a fund's portfolio holdings, view the most recent holdings listing, semiannual report, or annual report on Fidelity's web site at http://www.fidelity.com, http://www.advisor.fidelity.com, or http://www.401k.com, as applicable.
NOT FDIC INSURED • MAY LOSE VALUE • NO BANK GUARANTEE
Neither the funds nor Fidelity Distributors Corporation is a bank.
Annual Report
Fidelity® Ohio Municipal Income Fund
Average annual total return reflects the change in the value of an investment, assuming reinvestment of the fund's distributions from dividend income and capital gains (the profits earned upon the sale of securities that have grown in value, if any) and assuming a constant rate of performance each year. The $10,000 table and the fund's returns do not reflect the deduction of taxes that a shareholder would pay on fund distributions or the redemption of fund shares. During periods of reimbursement by Fidelity, a fund's total return will be greater than it would be had the reimbursement not occurred. How a fund did yesterday is no guarantee of how it will do tomorrow.
Average Annual Total Returns
Periods ended December 31, 2012 | Past 1
year | Past 5
years | Past 10
years |
Fidelity Ohio Municipal Income Fund | 7.14% | 5.53% | 4.88% |
$10,000 Over 10 Years
Let's say hypothetically that $10,000 was invested in Fidelity Ohio Municipal Income Fund on December 31, 2002. The chart shows how the value of your investment would have changed, and also shows how the Barclays® Municipal Bond Index performed over the same period.
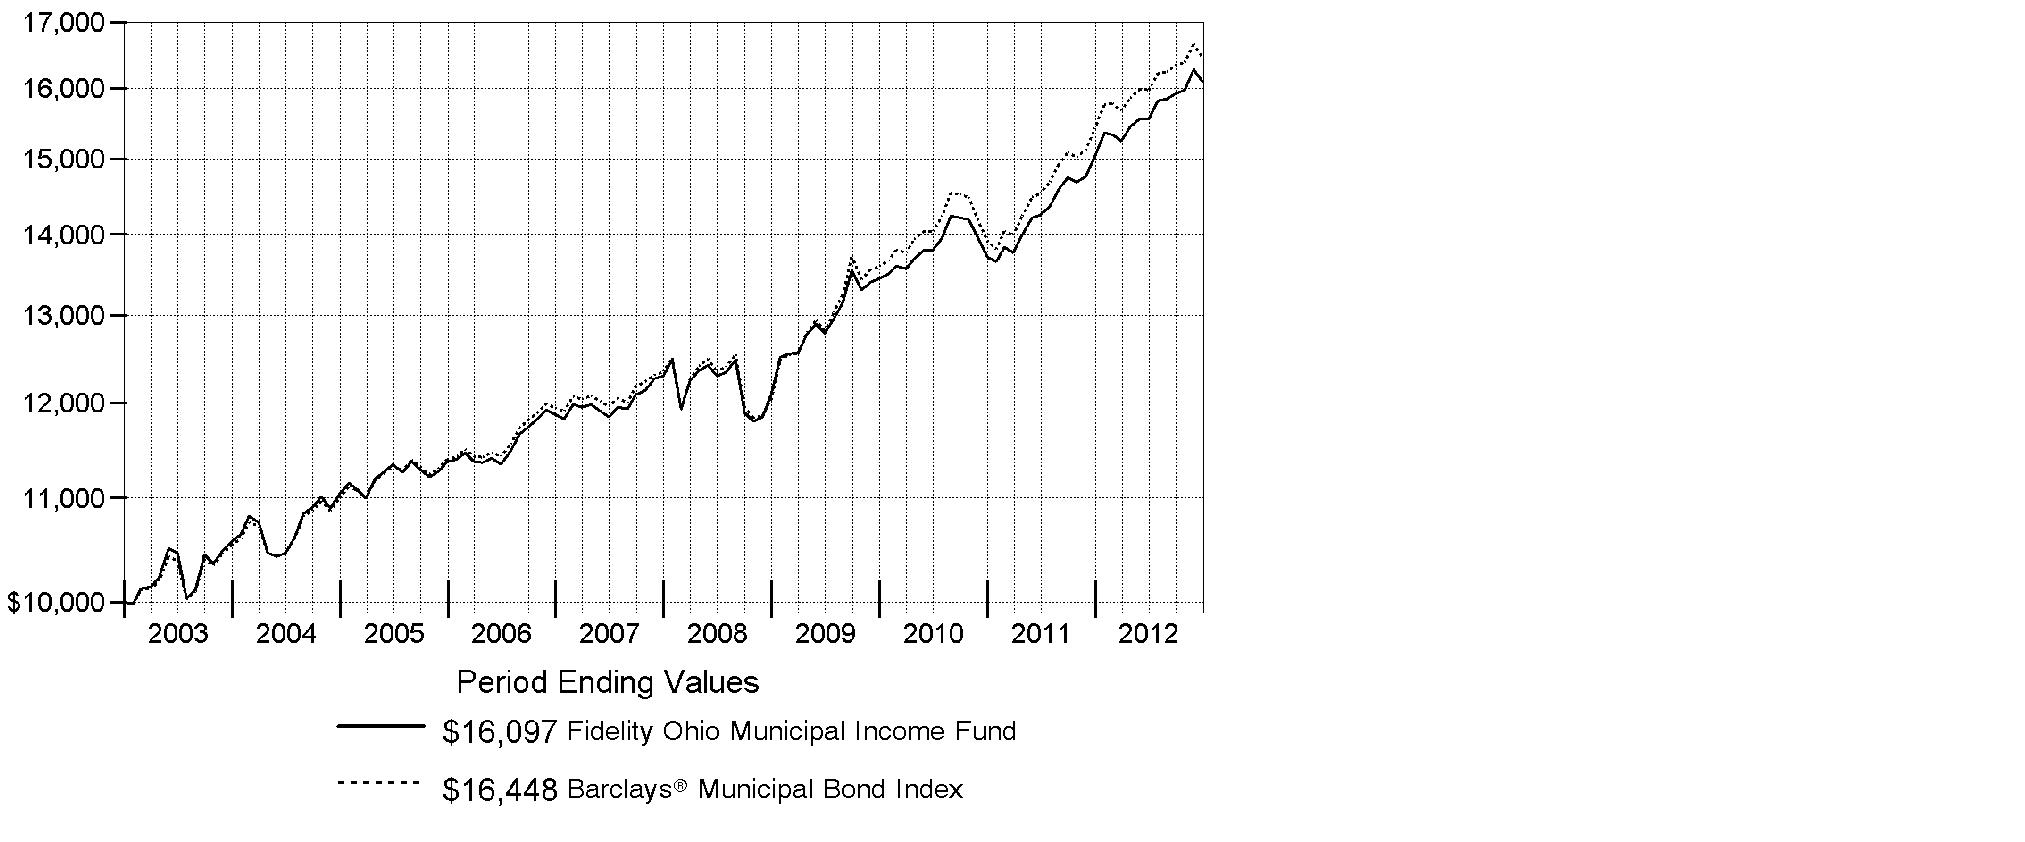
Annual Report
Fidelity Ohio Municipal Income Fund
Market Recap: Powered by improving issuer fundamentals and favorable supply and demand, the bull market for municipal bonds rolled on in 2012, with the Barclays® Municipal Bond Index advancing 6.78%. By contrast, taxable investment-grade debt gained 4.21%, as tracked by the Barclays® U.S. Aggregate Bond Index. Muni investors were encouraged by a recovery in tax revenues for many issuers. And despite a handful of well-publicized bankruptcies by local issuers, the overall muni default rate declined and remained low. Even with a surge in refinancings, the overall supply of newly issued muni bonds was muted. As for demand, munis drew heavy interest from investors seeking a yield advantage over U.S. Treasuries, and from those looking for a perceived safe haven amid mixed U.S. economic data and the ongoing financial crisis in Europe. Investors' appetite for tax-advantaged investments in advance of potentially higher federal tax rates in 2013 also fueled demand, particularly in November, while a steady stream of municipal redemptions (calls and maturities), many of which were reinvested in the muni market, competed for limited new supply. The muni market sold off in December due to concern about proposals to limit the federal tax exemption of muni debt, profit-taking in advance of higher capital gains rates, and ratings downgrades of Puerto Rico debt to borderline investment grade.
Comments from Jamie Pagliocco, Portfolio Manager of Fidelity® Ohio Municipal Income Fund: For the year, the fund returned 7.14%, while the Barclays Ohio 4+ Year Enhanced Modified Municipal Bond Index - which tracks the types of securities in which the fund invests - rose 7.41%. (This benchmark was modified during the period to remove a 2% cap on tobacco bonds.) Versus the benchmark, the fund benefited from overweighting bonds that were advance refunded and underweighting housing bonds. Advance refunded bonds outpaced the benchmark, in part because of their lower yields and higher prices as their maturities shortened, and their backing by U.S. government bonds. Housing bonds lagged due to growing prepayment fears. Detracting from performance was an out-of-benchmark exposure to Puerto Rico bonds, which lagged because investors became concerned about the territory's poor economic and fiscal prospects, and the new governor's willingness and ability to bolster its pension funds while also balancing revenues and spending. In December, the bonds suffered a significant sell-off after a major credit rating agency cut Puerto Rico's credit rating. The fund's underweighting in industrial development bonds also detracted because these securities drew heavy demand from investors seeking yield.
The views expressed above reflect those of the portfolio manager(s) only through the end of the period as stated on the cover of this report and do not necessarily represent the views of Fidelity or any other person in the Fidelity organization. Any such views are subject to change at any time based upon market or other conditions and Fidelity disclaims any responsibility to update such views. These views may not be relied on as investment advice and, because investment decisions for a Fidelity fund are based on numerous factors, may not be relied on as an indication of trading intent on behalf of any Fidelity fund.
Annual Report
Shareholder Expense Example
As a shareholder of a Fund, you incur two types of costs: (1) transaction costs, including redemption fees and (2) ongoing costs, including management fees and other Fund expenses. This Example is intended to help you understand your ongoing costs (in dollars) of investing in the Funds and to compare these costs with the ongoing costs of investing in other mutual funds.
The Example is based on an investment of $1,000 invested at the beginning of the period and held for the entire period (July 1, 2012 to December 31, 2012).
Actual Expenses
The first line of the accompanying table for each fund provides information about actual account values and actual expenses. You may use the information in this line, together with the amount you invested, to estimate the expenses that you paid over the period. Simply divide your account value by $1,000.00 (for example, an $8,600 account value divided by $1,000.00 = 8.6), then multiply the result by the number in the first line for a fund under the heading entitled "Expenses Paid During Period" to estimate the expenses you paid on your account during this period. A small balance maintenance fee of $12.00 that is charged once a year may apply for certain accounts with a value of less than $2,000. This fee is not included in the table below. If it was, the estimate of expenses you paid during the period would be higher, and your ending account value lower, by this amount. In addition, each Fund, as a shareholder in the underlying Fidelity Central Funds, will indirectly bear its pro-rata share of the fees and expenses incurred by the underlying Fidelity Central Funds. These fees and expenses are not included in the Fund's annualized expense ratio used to calculate the expense estimate in the table below.
Hypothetical Example for Comparison Purposes
The second line of the accompanying table for each fund provides information about hypothetical account values and hypothetical expenses based on a fund's actual expense ratio and an assumed rate of return of 5% per year before expenses, which is not the Fund's actual return. The hypothetical account values and expenses may not be used to estimate the actual ending account balance or expenses you paid for the period. You may use this information to compare the ongoing costs of investing in the Fund and other funds. To do so, compare this 5% hypothetical example with the 5% hypothetical examples that appear in the shareholder reports of the other funds. A small balance maintenance fee of $12.00 that is charged once a year may apply for certain accounts with a value of less than $2,000. This fee is not included in the table below. If it was, the estimate of expenses you paid during the period would be higher, and your ending account value lower, by this amount. In addition, each Fund, as a shareholder in the underlying Fidelity Central Funds, will indirectly bear its pro-rata share of the fees and expenses incurred by the underlying Fidelity Central Funds. These fees and expenses are not included in the Fund's annualized expense ratio used to calculate the expense estimate in the table below.
Please note that the expenses shown in the table are meant to highlight your ongoing costs only and do not reflect any transaction costs. Therefore, the second line of the table is useful in comparing ongoing costs only, and will not help you determine the relative total costs of owning different funds. In addition, if these transactional costs were included, your costs would have been higher.
Annual Report
| Annualized
Expense Ratio | Beginning
Account Value
July 1, 2012 | Ending
Account Value
December 31, 2012 | Expenses Paid
During Period*
July 1, 2012 to
December 31, 2012 |
Fidelity Ohio Municipal Income Fund | .48% | | | |
Actual | | $ 1,000.00 | $ 1,034.80 | $ 2.46 |
HypotheticalA | | $ 1,000.00 | $ 1,022.72 | $ 2.44 |
Fidelity Ohio Municipal Money Market Fund | .19% | | | |
Actual | | $ 1,000.00 | $ 1,000.10 | $ .96** |
HypotheticalA | | $ 1,000.00 | $ 1,024.18 | $ .97** |
A 5% return per year before expenses
* Expenses are equal to each Fund's annualized expense ratio, multiplied by the average account value over the period, multiplied by 184/366 (to reflect the one-half year period).
** If certain fees were not voluntarily waived by Fidelity Management & Research Company (FMR) or its affiliates during the period, the annualized expense ratio for the Fidelity Ohio Municipal Money Market Fund would have been 0.52% and the expenses paid in the actual and hypothetical examples above would have been $2.61 and $2.64, respectively.
Annual Report
Fidelity Ohio Municipal Income Fund
Investment Changes (Unaudited)
Top Five Sectors as of December 31, 2012 |
| % of fund's
net assets | % of fund's net assets
6 months ago |
General Obligations | 36.8 | 36.6 |
Health Care | 18.0 | 17.9 |
Education | 14.3 | 14.9 |
Water & Sewer | 10.5 | 10.6 |
Electric Utilities | 5.7 | 5.5 |
Weighted Average Maturity as of December 31, 2012 |
| | 6 months ago |
Years | 6.3 | 6.0 |
This is a weighted average of all the maturities of the securities held in a fund. Weighted Average Maturity (WAM) can be used as a measure of sensitivity to interest rate changes and market changes. Generally, the longer the maturity, the greater the sensitivity to such changes. WAM is based on the dollar-weighted average length of time until principal payments must be paid. Depending on the types of securities held in a fund, certain maturity shortening devices (e.g., demand features, interest rate resets, and call options) may be taken into account when calculating the WAM. |
Duration as of December 31, 2012 |
| | 6 months ago |
Years | 7.1 | 7.5 |
Duration estimates how much a bond fund's price will change with a change in comparable interest rates. If rates rise 1%, for example, a fund with a 5-year duration is likely to lose about 5% of its value. Other factors also can influence a bond fund's performance and share price. Accordingly, a bond fund's actual performance may differ from this example. Duration takes into account any call or put option embedded in the bonds. |
Quality Diversification (% of fund's net assets) |
As of December 31, 2012 | As of June 30, 2012 |
 | AAA 9.4% | | | AAA 8.7% | |
 | AA,A 82.4% | | | AA,A 82.8% | |
 | BBB 6.1% | | | BBB 7.3% | |
 | BB and Below 0.3% | |  | BB and Below 0.0% | |
 | Not Rated 0.2% | | | Not Rated 0.1% | |
 | Short-Term
Investments and
Net Other Assets 1.6% | | | Short-Term
Investments and
Net Other Assets 1.1% | |

We have used ratings from Moody's Investors Service, Inc. Where Moody's® ratings are not available, we have used S&P® ratings. All ratings are as of the date indicated and do not reflect subsequent changes. |
Annual Report
Fidelity Ohio Municipal Income Fund
Investments December 31, 2012
Showing Percentage of Net Assets
Municipal Bonds - 98.4% |
| Principal
Amount | | Value |
Guam - 0.4% |
Guam Ed. Fing. Foundation Ctfs. of Prtn. Series 2006 A, 5% 10/1/23 | | $ 1,600,000 | | $ 1,612,896 |
Guam Pwr. Auth. Rev. Series 2012 A, 5% 10/1/23 (FSA Insured) | | 1,000,000 | | 1,171,510 |
| | 2,784,406 |
Ohio - 95.4% |
Akron Bath Copley Hosp. District Rev.: | | | | |
(Akron Gen. Health Systems Proj.) Series A: | | | | |
5% 1/1/14 | | 1,500,000 | | 1,555,875 |
5% 1/1/15 | | 1,275,000 | | 1,359,125 |
(Children's Hosp. Med. Ctr. Proj.): | | | | |
Series 2012 5% 11/15/22 | | 1,000,000 | | 1,152,480 |
Series 2012, 5% 11/15/23 | | 3,245,000 | | 3,702,999 |
Akron Ctfs. of Prtn. Series 2005, 5% 12/1/15 (Assured Guaranty Corp. Insured) | | 1,475,000 | | 1,606,541 |
Allen County Hosp. Facilities Rev. (Catholic Healthcare Partners Proj.) Series 2010 B, 5.25% 9/1/27 | | 5,000,000 | | 5,742,350 |
American Muni. Pwr., Inc. Rev.: | | | | |
(Amp Freemont Energy Ctr. Proj.) Series 2012: | | | | |
5% 2/15/25 | | 4,000,000 | | 4,721,080 |
5.25% 2/15/28 | | 8,040,000 | | 9,550,555 |
(Prairie State Energy Campus Proj.): | | | | |
Series 2008 A, 5% 2/15/38 | | 4,075,000 | | 4,436,412 |
Series 2009 A, 5.75% 2/15/39 (Assured Guaranty Corp. Insured) | | 3,000,000 | | 3,490,380 |
Avon Gen. Oblig. Series 2009 B: | | | | |
5% 12/1/36 | | 1,040,000 | | 1,208,002 |
5% 12/1/37 | | 1,095,000 | | 1,267,922 |
Beavercreek City School District Series 2009, 5% 12/1/36 | | 2,250,000 | | 2,510,528 |
Bowling Green City School District 5% 12/1/34 (FSA Insured) | | 2,000,000 | | 2,273,680 |
Buckeye Tobacco Settlement Fing. Auth. Series 2007 A1: | | | | |
5% 6/1/16 | | 2,800,000 | | 3,080,252 |
5% 6/1/17 | | 2,865,000 | | 3,225,904 |
Buckeye Valley Local School District Delaware County Series A, 6.85% 12/1/15 (Nat'l. Pub. Fin. Guarantee Corp. Insured) | | 915,000 | | 989,920 |
Bucyrus City School District 5% 12/1/30 (FSA Insured) | | 5,120,000 | | 5,651,968 |
Butler County Hosp. Facilities Rev.: | | | | |
(Kettering Health Network Obligated Group Proj.) Series 2011, 6.375% 4/1/36 | | 5,030,000 | | 6,101,440 |
Municipal Bonds - continued |
| Principal
Amount | | Value |
Ohio - continued |
Butler County Hosp. Facilities Rev.: - continued | | | | |
(UC Health Proj.) Series 2010, 5.5% 11/1/40 | | $ 3,025,000 | | $ 3,348,524 |
Butler County Sales Tax (Govt. Svcs. Ctr. Proj.) Series A, 5% 12/15/16 (AMBAC Insured) | | 2,455,000 | | 2,710,688 |
Butler County Trans. Impt. District Series 2007, 5% 12/1/18 (XL Cap. Assurance, Inc. Insured) | | 1,015,000 | | 1,205,769 |
Canal Winchester Local School District Series B, 5% 12/1/18 (Nat'l. Pub. Fin. Guarantee Corp. Insured) | | 1,030,000 | | 1,096,270 |
Cincinnati City School District 5.25% 12/1/18 (Nat'l. Pub. Fin. Guarantee Corp. Insured) | | 3,000,000 | | 3,654,630 |
Cincinnati City School District Ctfs. of Prtn. (School Impt. Proj.) 5% 12/15/28 (FSA Insured) | | 1,000,000 | | 1,136,940 |
Cincinnati Gen. Oblig.: | | | | |
Series 2009 A: | | | | |
4.5% 12/1/29 | | 500,000 | | 552,935 |
5% 12/1/20 | | 1,240,000 | | 1,501,677 |
Series 2012 F: | | | | |
5% 12/1/20 | | 3,045,000 | | 3,803,449 |
5% 12/1/21 | | 2,765,000 | | 3,479,835 |
Cincinnati Wtr. Sys. Rev.: | | | | |
Series A, 5% 12/1/36 | | 1,750,000 | | 2,027,708 |
Series B, 5% 12/1/32 | | 6,500,000 | | 7,512,570 |
Cleveland Arpt. Sys. Rev. Series 2000 C, 5% 1/1/20 (FSA Insured) | | 3,500,000 | | 3,972,920 |
Cleveland Gen. Oblig.: | | | | |
Series 2005, 5.5% 10/1/20 (AMBAC Insured) | | 7,350,000 | | 9,085,335 |
Series 2012, 5% 12/1/25 | | 2,350,000 | | 2,761,227 |
Series C: | | | | |
5.25% 11/15/20 (Nat'l. Pub. Fin. Guarantee Corp. Insured) | | 1,100,000 | | 1,343,694 |
5.25% 11/15/21 (Nat'l. Pub. Fin. Guarantee Corp. Insured) | | 1,145,000 | | 1,401,056 |
5.25% 11/15/22 (Nat'l. Pub. Fin. Guarantee Corp. Insured) | | 1,210,000 | | 1,483,823 |
5.25% 11/15/23 (Nat'l. Pub. Fin. Guarantee Corp. Insured) | | 1,885,000 | | 2,303,093 |
Cleveland Muni. School District Series 2004: | | | | |
5.25% 12/1/17 (FSA Insured) | | 2,215,000 | | 2,354,368 |
5.25% 12/1/19 (FSA Insured) | | 1,045,000 | | 1,109,832 |
5.25% 12/1/23 (FSA Insured) | | 1,000,000 | | 1,059,570 |
Cleveland Parking Facilities Rev.: | | | | |
5.25% 9/15/17 (Escrowed to Maturity) | | 1,440,000 | | 1,733,342 |
5.25% 9/15/17 (FSA Insured) | | 3,040,000 | | 3,482,229 |
Municipal Bonds - continued |
| Principal
Amount | | Value |
Ohio - continued |
Cleveland Pub. Pwr. Sys. Rev. Series 2010: | | | | |
5% 11/15/15 | | $ 2,335,000 | | $ 2,578,447 |
5% 11/15/16 | | 1,820,000 | | 2,058,966 |
Cleveland State Univ. Gen. Receipts Series 2012: | | | | |
5% 6/1/24 | | 1,920,000 | | 2,279,232 |
5% 6/1/25 | | 2,500,000 | | 2,948,175 |
5% 6/1/26 | | 3,075,000 | | 3,599,749 |
Cleveland Wtr. Rev. Series 2012 X, 5% 1/1/42 | | 3,000,000 | | 3,434,160 |
Cleveland Wtrwks. Rev.: | | | | |
(First Mtg. Prog.) Series G, 5.5% 1/1/13 (Nat'l. Pub. Fin. Guarantee Corp. Insured) | | 20,000 | | 20,000 |
Series 2007 O, 5% 1/1/37 | | 3,200,000 | | 3,575,680 |
Columbus City School District (School Facilities Construction and Impt. Proj.): | | | | |
Series 2006, 5% 12/1/18 (FSA Insured) | | 5,000,000 | | 5,756,350 |
Series 2009 B: | | | | |
5% 12/1/26 | | 1,805,000 | | 2,146,326 |
5% 12/1/28 | | 3,105,000 | | 3,665,856 |
5% 12/1/29 | | 1,000,000 | | 1,176,420 |
Columbus Gen. Oblig. Series 2012 A, 4% 2/15/27 | | 10,000,000 | | 11,393,791 |
Columbus Metropolitan Library Facility 5% 12/1/23 | | 1,000,000 | | 1,191,800 |
Columbus Swr. Sys. Rev. Series 2008 A, 5% 6/1/24 | | 1,515,000 | | 1,768,899 |
Cuyahoga Cmnty. College District Gen. Oblig. Series 2009 C: | | | | |
5% 8/1/25 | | 1,140,000 | | 1,320,542 |
5% 8/1/27 | | 1,200,000 | | 1,379,148 |
Cuyahoga County Gen. Oblig. Series 2012 A: | | | | |
4% 12/1/27 | | 1,575,000 | | 1,735,225 |
5% 12/1/25 | | 765,000 | | 923,386 |
Dayton Gen. Oblig.: | | | | |
4% 12/1/22 | | 750,000 | | 837,675 |
4% 12/1/25 | | 1,540,000 | | 1,671,393 |
Dayton School District (School Facility Construction & Impt. Proj.) Series 2003 A, 5% 12/1/31 (Nat'l. Pub. Fin. Guarantee Corp. Insured) | | 4,975,000 | | 5,024,651 |
Dublin City School District 5% 12/1/21 | | 1,200,000 | | 1,441,116 |
Fairfield City School District 7.45% 12/1/14 (Nat'l. Pub. Fin. Guarantee Corp. Insured) | | 400,000 | | 421,504 |
Fairview Park Gen. Oblig.: | | | | |
Series 2012: | | | | |
4% 12/1/22 | | 1,225,000 | | 1,398,068 |
4% 12/1/23 | | 1,395,000 | | 1,567,199 |
Municipal Bonds - continued |
| Principal
Amount | | Value |
Ohio - continued |
Fairview Park Gen. Oblig.: - continued | | | | |
Series 2012: | | | | |
4% 12/1/24 | | $ 1,490,000 | | $ 1,656,016 |
5% 12/1/30 (Pre-Refunded to 12/1/15 @ 100) | | 5,955,000 | | 6,729,567 |
Franklin County Hosp. Rev. (Nationwide Children's Hosp. Proj.): | | | | |
Series 2009, 5.25% 11/1/40 | | 5,000,000 | | 5,568,600 |
Series A: | | | | |
5% 11/1/15 | | 260,000 | | 289,279 |
5% 11/1/16 | | 265,000 | | 302,641 |
Gallia County Local School District (School Impt. Proj.) 5% 12/1/33 (FSA Insured) | | 3,000,000 | | 3,222,150 |
Greater Cleveland Reg'l. Transit Auth. Series 2012: | | | | |
5% 12/1/23 | | 1,000,000 | | 1,203,840 |
5% 12/1/24 | | 1,800,000 | | 2,154,168 |
5% 12/1/25 | | 1,170,000 | | 1,393,002 |
Hamilton County Convention Facilities Auth. Rev.: | | | | |
5% 12/1/17 (Nat'l. Pub. Fin. Guarantee Corp. Insured) | | 1,985,000 | | 2,094,314 |
5% 12/1/18 (Nat'l. Pub. Fin. Guarantee Corp. Insured) | | 1,075,000 | | 1,139,038 |
5% 12/1/19 (Nat'l. Pub. Fin. Guarantee Corp. Insured) | | 2,190,000 | | 2,307,121 |
5% 12/1/19 (Nat'l. Pub. Fin. Guarantee Corp. Insured) | | 1,130,000 | | 1,196,986 |
Hamilton County Econ. Dev. Rev. (King Highland Cmnty. Urban Redev. Corp. Proj.) Series A, 5% 6/1/17 (Nat'l. Pub. Fin. Guarantee Corp. Insured) | | 1,070,000 | | 1,194,345 |
Hamilton County Health Care Facilities Rev. (Christ Hosp. Proj.) Series 2012, 5.25% 6/1/24 | | 3,000,000 | | 3,446,190 |
Hamilton County Hosp. Facilities Rev. (Childrens Hosp. Med. Ctr. Proj.) Series 2004 J: | | | | |
5.25% 5/15/15 (Nat'l. Pub. Fin. Guarantee Corp. Insured) | | 1,835,000 | | 1,932,897 |
5.25% 5/15/17 (Nat'l. Pub. Fin. Guarantee Corp. Insured) | | 2,585,000 | | 2,703,858 |
5.25% 5/15/18 (Nat'l. Pub. Fin. Guarantee Corp. Insured) | | 2,720,000 | | 2,838,293 |
Hamilton County Sales Tax Rev. Series 2011 A, 5% 12/1/24 | | 4,870,000 | | 5,655,239 |
Hamilton County Student Hsg. Rev. (Stratford Heights Proj.) Series 2010, 5% 6/1/30 (FSA Insured) | | 2,500,000 | | 2,801,650 |
Municipal Bonds - continued |
| Principal
Amount | | Value |
Ohio - continued |
Hamilton County Swr. Sys. Rev.: | | | | |
(Metropolitan Swr. District Proj.) Series 2005 B, 5% 12/1/30 (Nat'l. Pub. Fin. Guarantee Corp. Insured) | | $ 4,000,000 | | $ 4,413,760 |
Series 06A, 5% 12/1/17 (Nat'l. Pub. Fin. Guarantee Corp. Insured) | | 2,050,000 | | 2,376,340 |
Hamilton Wtrwks. Rev. 5% 10/15/16 (Nat'l. Pub. Fin. Guarantee Corp. Insured) | | 1,000,000 | | 1,013,330 |
Hancock County Hosp. Facilities Rev. (Blanchard Valley Reg'l. Health Ctr. Proj.) Series 2011 A, 6.25% 12/1/34 | | 4,100,000 | | 4,817,049 |
Hilliard Gen. Oblig. 5% 12/1/18 (Nat'l. Pub. Fin. Guarantee Corp. Insured) | | 1,000,000 | | 1,119,270 |
Huber Heights City School District Unltd. Tax School Impt. Gen. Oblig. Series 2009, 5% 12/1/36 | | 1,500,000 | | 1,670,055 |
Huber Heights Wtr. Sys. Rev. 5% 12/1/30 (Nat'l. Pub. Fin. Guarantee Corp. Insured) | | 2,285,000 | | 2,500,773 |
Kent City School District Series 2004, 5% 12/1/20 (Nat'l. Pub. Fin. Guarantee Corp. Insured) | | 1,400,000 | | 1,513,078 |
Kent State Univ. Revs.: | | | | |
Series 2009 B: | | | | |
5% 5/1/26 (Assured Guaranty Corp. Insured) | | 4,100,000 | | 4,703,848 |
5% 5/1/28 (Assured Guaranty Corp. Insured) | | 5,000,000 | | 5,698,650 |
5% 5/1/29 (Assured Guaranty Corp. Insured) | | 1,000,000 | | 1,135,990 |
5% 5/1/30 (Assured Guaranty Corp. Insured) | | 1,115,000 | | 1,262,459 |
Series 2012 A: | | | | |
5% 5/1/24 | | 1,385,000 | | 1,673,925 |
5% 5/1/25 | | 1,500,000 | | 1,803,240 |
5% 5/1/26 | | 1,600,000 | | 1,913,184 |
Kings Local School District 5% 12/1/19 (Nat'l. Pub. Fin. Guarantee Corp. Insured) | | 1,365,000 | | 1,487,413 |
Lake County Hosp. Facilities Rev. (Lake Hosp. Sys., Inc. Proj.) Series 2008 C: | | | | |
5% 8/15/14 | | 2,055,000 | | 2,183,849 |
5% 8/15/15 | | 1,160,000 | | 1,269,307 |
5% 8/15/16 | | 1,260,000 | | 1,411,238 |
5% 8/15/17 | | 1,000,000 | | 1,141,050 |
Lakewood City School District: | | | | |
0% 12/1/15 (FSA Insured) | | 1,500,000 | | 1,436,625 |
0% 12/1/16 (FSA Insured) | | 1,200,000 | | 1,125,360 |
Lancaster Ohio City School District Series 2012: | | | | |
5% 10/1/37 | | 2,000,000 | | 2,304,600 |
5% 10/1/49 | | 3,000,000 | | 3,363,330 |
Municipal Bonds - continued |
| Principal
Amount | | Value |
Ohio - continued |
Licking Heights Local School District 5% 12/1/32 (Nat'l. Pub. Fin. Guarantee Corp. Insured) | | $ 1,500,000 | | $ 1,626,675 |
Lucas County Hosp. Rev.: | | | | |
(Promedia Health Care Oblig. Group Proj.): | | | | |
5% 11/15/13 (AMBAC Insured) | | 1,135,000 | | 1,176,450 |
5% 11/15/38 | | 1,090,000 | | 1,150,506 |
(ProMedica Heathcare Oblig. Group Proj.) Series 2011 A, 6.5% 11/15/37 | | 2,800,000 | | 3,464,160 |
Series 2011 D: | | | | |
5% 11/15/22 | | 1,000,000 | | 1,196,750 |
5% 11/15/25 | | 5,000,000 | | 5,879,450 |
Lucas-Plaza Hsg. Dev. Corp. Mtg. Rev. (The Plaza Section 8 Assisted Proj.) Series 1991 A, 0% 6/1/24 (Escrowed to Maturity) | | 9,000,000 | | 6,732,990 |
Marysville Village School District 5% 12/1/29 (FSA Insured) | | 4,000,000 | | 4,355,120 |
Marysville Wastewtr. Treatment Sys. Rev.: | | | | |
4% 12/1/20 (XL Cap. Assurance, Inc. Insured) | | 115,000 | | 122,427 |
4.125% 12/1/21 (XL Cap. Assurance, Inc. Insured) | | 85,000 | | 90,370 |
4.15% 12/1/22 (XL Cap. Assurance, Inc. Insured) | | 25,000 | | 26,443 |
Miami Univ. Gen. Receipts Series 2012, 4% 9/1/28 | | 2,195,000 | | 2,389,323 |
Miamisburg City School District: | | | | |
Series 2008, 5% 12/1/33 | | 1,340,000 | | 1,550,005 |
Series 2009, 5% 12/1/23 (Assured Guaranty Corp. Insured) | | 1,405,000 | | 1,670,657 |
Middleburg Heights Hosp. Rev.: | | | | |
Series 2011, 5.25% 8/1/41 | | 3,000,000 | | 3,258,510 |
Series 2012 A, 5% 8/1/47 | | 10,000,000 | | 10,673,800 |
Milford Exempt Village School District 5.25% 12/1/33 | | 5,000,000 | | 5,601,950 |
Montgomery County Rev.: | | | | |
(Catholic Health Initiatives Proj.): | | | | |
Series 2008 D, 6.25% 10/1/33 | | 2,500,000 | | 3,007,325 |
Series C1, 5% 10/1/41 (FSA Insured) | | 5,000,000 | | 5,313,500 |
(Miami Valley Hosp. Proj.) Series 2009 A, 6% 11/15/28 (Pre-Refunded to 11/15/14 @ 100) | | 2,000,000 | | 2,210,540 |
Bonds (Catholic Health Initiatives Proj.) Series 2008 D2, 5.25%, tender 11/12/13 (a) | | 2,000,000 | | 2,082,580 |
Series A, 6.25% 11/15/39 (Pre-Refunded to 11/15/14 @ 100) | | 2,250,000 | | 2,497,298 |
North Olmsted Gen. Oblig. Series D, 5.25% 12/1/20 (AMBAC Insured) | | 2,075,000 | | 2,413,910 |
Northmont City School District Series 2012 A, 5% 11/1/49 | | 5,000,000 | | 5,564,950 |
Municipal Bonds - continued |
| Principal
Amount | | Value |
Ohio - continued |
Ohio Air Quality Dev. Auth. Rev. Series 2009 C, 5.625% 6/1/18 | | $ 2,600,000 | | $ 3,035,786 |
Ohio Bldg. Auth. (Adult Correctional Bldg. Fund Proj.): | | | | |
Series 2009 B, 5% 10/1/24 | | 1,790,000 | | 2,082,880 |
Series 2010 A, 5% 10/1/24 | | 6,030,000 | | 7,197,227 |
Ohio Gen. Oblig.: | | | | |
(College Savings Prog.) 0% 8/1/14 | | 1,375,000 | | 1,349,123 |
(Common Schools Proj.) Series 2006 D, 5% 9/15/21 | | 500,000 | | 567,175 |
(Higher Ed. Cap. Facilities Proj.) Series 2005 B, 5% 5/1/16 | | 1,000,000 | | 1,137,530 |
(Infrastructure Impt. Proj.) Series A, 5% 3/1/26 | | 1,850,000 | | 2,059,272 |
Series 2006 D, 5% 9/15/20 | | 5,000,000 | | 5,705,900 |
Series 2008 A: | | | | |
5.375% 9/1/23 | | 1,165,000 | | 1,408,858 |
5.375% 9/1/28 | | 7,210,000 | | 8,619,411 |
Series 2011 A, 5% 9/15/21 | | 6,450,000 | | 8,134,224 |
Series 2012 A: | | | | |
5% 2/1/26 | | 1,000,000 | | 1,208,160 |
5% 2/1/27 | | 5,000,000 | | 5,997,750 |
Series 2012 B: | | | | |
5% 9/1/21 | | 1,390,000 | | 1,751,456 |
5% 3/15/25 | | 7,500,000 | | 9,114,075 |
Series Q, 5% 4/1/25 | | 1,845,000 | | 2,243,907 |
Ohio Higher Edl. Facility Commission Rev.: | | | | |
(Case Western Reserve Univ. Proj.): | | | | |
Series 1990 B, 6.5% 10/1/20 | | 2,335,000 | | 2,863,107 |
Series 1994: | | | | |
6.125% 10/1/15 | | 2,000,000 | | 2,283,500 |
6.25% 10/1/16 | | 2,500,000 | | 2,971,650 |
(Cleveland Clinic Foundation Proj.) Series 2008 A: | | | | |
5.25% 1/1/33 | | 1,635,000 | | 1,812,365 |
5.5% 1/1/43 | | 3,500,000 | | 3,851,680 |
(John Carroll Univ. Proj.) 5% 4/1/17 | | 1,000,000 | | 1,089,400 |
(Kenyon College Proj.) Series 2010, 5.25% 7/1/44 | | 2,750,000 | | 3,017,245 |
(Univ. Hosp. Health Sys. Proj.): | | | | |
Series 2007 A, 5.25% 1/15/46 | | 4,000,000 | | 4,149,680 |
Series 2010 A, 5.25% 1/15/23 | | 2,500,000 | | 2,845,650 |
(Univ. of Dayton Proj.): | | | | |
Series 2004, 5% 12/1/17 (AMBAC Insured) | | 2,170,000 | | 2,334,074 |
Series 2009, 5.5% 12/1/36 | | 5,000,000 | | 5,706,900 |
Ohio Hosp. Facilities Rev.: | | | | |
(Cleveland Clinic Proj.) Series 2009 A, 5.5% 1/1/39 | | 7,000,000 | | 7,871,500 |
Municipal Bonds - continued |
| Principal
Amount | | Value |
Ohio - continued |
Ohio Hosp. Facilities Rev.: - continued | | | | |
Series 2011 A, 5% 1/1/32 | | $ 3,500,000 | | $ 3,951,675 |
Ohio Muni. Elec. Gen. Agcy. (Belleville Hydroelectric Proj.) 5% 2/15/17 (AMBAC Insured) | | 1,215,000 | | 1,274,389 |
Ohio State Univ. Gen. Receipts: | | | | |
Series 2009 A: | | | | |
5% 12/1/26 | | 2,000,000 | | 2,360,860 |
5% 12/1/26 (Pre-Refunded to 12/1/18 @ 100) | | 225,000 | | 276,653 |
Series 2012 A, 4% 6/1/27 | | 1,270,000 | | 1,462,684 |
Ohio Tpk. Commission Tpk. Rev.: | | | | |
Series 1998 A, 5.5% 2/15/20 (Nat'l. Pub. Fin. Guarantee Corp. Insured) | | 3,000,000 | | 3,774,510 |
Series 2010 A, 5% 2/15/31 | | 5,000,000 | | 5,698,000 |
Ohio Univ. Gen. Receipts Athens: | | | | |
Series A, 5% 12/1/33 (FSA Insured) | | 1,190,000 | | 1,301,134 |
Series B, 5% 12/1/31 (FSA Insured) | | 3,540,000 | | 3,913,399 |
Ohio Wtr. Dev. Auth. Poll. Cont. Facilities Rev. Bonds (FirstEnergy Corp. Proj.) Series 2009 A, 5.875%, tender 6/1/16 (a) | | 1,020,000 | | 1,140,635 |
Ohio Wtr. Dev. Auth. Rev.: | | | | |
(Drinking Wtr. Fund Prog.): | | | | |
Series 2004, 5% 12/1/17 | | 80,000 | | 84,870 |
Series 2005: | | | | |
5.25% 6/1/18 | | 2,610,000 | | 3,181,773 |
5.25% 12/1/18 | | 2,610,000 | | 3,224,577 |
(Fresh Wtr. Impt. Proj.): | | | | |
Series 2005, 5.5% 6/1/17 | | 4,710,000 | | 5,642,062 |
Series 2009 B, 5% 12/1/24 | | 1,025,000 | | 1,319,237 |
Series B, 5.5% 6/1/16 (FSA Insured) | | 1,560,000 | | 1,811,753 |
(Fresh Wtr. Proj.) Series 2009 B, 5% 12/1/25 | | 1,950,000 | | 2,522,442 |
(Pure Wtr. Proj.) Series I, 6% 12/1/16 (Escrowed to Maturity) | | 885,000 | | 973,527 |
5.25% 12/1/15 (Nat'l. Pub. Fin. Guarantee Corp. Insured) | | 1,180,000 | | 1,331,370 |
5.25% 6/1/17 (Nat'l. Pub. Fin. Guarantee Corp. Insured) | | 1,160,000 | | 1,363,847 |
Ohio Wtr. Dev. Auth. Wtr. Poll. Cont. Rev.: | | | | |
(Wtr. Quality Proj.): | | | | |
Series 2010 A: | | | | |
5% 12/1/29 | | 2,000,000 | | 2,365,480 |
5% 6/1/30 | | 1,000,000 | | 1,178,520 |
Series 2010, 5% 12/1/22 | | 3,000,000 | | 3,666,750 |
Municipal Bonds - continued |
| Principal
Amount | | Value |
Ohio - continued |
Ohio Wtr. Dev. Auth. Wtr. Poll. Cont. Rev.: - continued | | | | |
Series 2005 B, 0% 12/1/14 | | $ 1,500,000 | | $ 1,473,960 |
5.25% 12/1/19 | | 1,975,000 | | 2,488,816 |
Olentangy Local School District: | | | | |
5% 12/1/30 (FSA Insured) | | 4,025,000 | | 4,494,154 |
5% 12/1/36 | | 2,700,000 | | 3,039,417 |
Reynoldsburg City School District (School Facilities Construction & Impt. Proj.): | | | | |
0% 12/1/16 | | 1,250,000 | | 1,153,775 |
0% 12/1/17 | | 1,250,000 | | 1,121,075 |
5% 12/1/32 | | 1,500,000 | | 1,710,555 |
RiverSouth Auth. Rev. Series 2005 A, 5.25% 12/1/15 | | 1,000,000 | | 1,129,830 |
Rocky River Gen. Oblig. 5% 12/1/19 (AMBAC Insured) | | 2,125,000 | | 2,303,840 |
Ross County Hosp. Facilities Rev. (Adena Health Sys. Proj.) Series 2008, 5.75% 12/1/35 | | 2,600,000 | | 2,876,094 |
Scioto County Marine Term. Facilities Rev. (Norfolk Southern Corp. Proj.) 5.3% 8/15/13 | | 3,000,000 | | 3,006,630 |
South-Western City School District Franklin & Pickway County Series 2012 B, 5% 12/1/36 | | 2,000,000 | | 2,315,060 |
Springboro Cmnty. City School District 5.25% 12/1/20 (FSA Insured) | | 2,780,000 | | 3,463,102 |
St. Marys City School District: | | | | |
5% 12/1/27 (FSA Insured) | | 470,000 | | 521,051 |
5% 12/1/35 (FSA Insured) | | 2,500,000 | | 2,703,725 |
Strongsville Gen. Oblig. (Street Impt. Proj.) Series 2009, 5% 12/1/27 | | 1,680,000 | | 2,043,569 |
Summit County Gen. Oblig.: | | | | |
5.25% 12/1/20 | | 1,645,000 | | 1,707,592 |
5.25% 12/1/21 | | 1,740,000 | | 1,804,258 |
Sylvania City School District Series 2009, 5.25% 12/1/36 (Assured Guaranty Corp. Insured) | | 7,055,000 | | 8,098,082 |
Tallmadge School District Gen. Oblig. 5% 12/1/31 (Pre-Refunded to 6/1/15 @ 100) | | 4,000,000 | | 4,434,440 |
Toledo City School District (School Facilities Impt. Proj.) Series 2009, 5.375% 12/1/35 | | 1,000,000 | | 1,139,880 |
Toledo Gen. Oblig. Series 2012 A, 5% 12/1/20 | | 1,635,000 | | 1,960,349 |
Toledo Wtrwks. Rev.: | | | | |
5% 11/15/16 (AMBAC Insured) | | 840,000 | | 871,870 |
5% 11/15/16 (Pre-Refunded to 11/15/13 @ 100) | | 270,000 | | 281,084 |
5% 11/15/30 (Nat'l. Pub. Fin. Guarantee Corp. Insured) | | 3,500,000 | | 3,835,860 |
Univ. of Akron Gen. Receipts Series A, 5.25% 1/1/30 (FSA Insured) | | 3,000,000 | | 3,368,430 |
Municipal Bonds - continued |
| Principal
Amount | | Value |
Ohio - continued |
Univ. of Cincinnati Gen. Receipts: | | | | |
Series 2004 A: | | | | |
5% 6/1/18 (AMBAC Insured) (Pre-Refunded to 6/1/18 @ 100) | | $ 1,445,000 | | $ 1,529,186 |
5% 6/1/19 (AMBAC Insured) (Pre-Refunded to 6/1/19 @ 100) | | 1,520,000 | | 1,606,351 |
Series 2008 C: | | | | |
5% 6/1/22 (FSA Insured) | | 1,000,000 | | 1,165,310 |
5% 6/1/23 (FSA Insured) | | 2,000,000 | | 2,321,660 |
5% 6/1/24 (FSA Insured) | | 2,000,000 | | 2,313,860 |
Series 2010 F, 5% 6/1/32 | | 2,000,000 | | 2,319,380 |
Series 2012 A: | | | | |
5% 6/1/22 | | 2,000,000 | | 2,467,800 |
5% 6/1/23 | | 2,000,000 | | 2,443,100 |
Series 2012 C: | | | | |
4% 6/1/28 | | 2,000,000 | | 2,199,100 |
5% 6/1/24 | | 1,230,000 | | 1,506,848 |
West Muskingum Local School District School Facilities Construction and Impt. 5% 12/1/30 (Pre-Refunded to 12/1/13 @ 100) | | 670,000 | | 698,482 |
Wood County Hosp. Facilities Rev. (Hosp. Proj.) Series 2012, 5% 12/1/27 | | 3,500,000 | | 3,795,820 |
Wright State Univ. Gen. Receipts Series 2011 A, 5% 5/1/23 | | 2,665,000 | | 3,171,670 |
| | 617,399,958 |
Puerto Rico - 2.1% |
Puerto Rico Commonwealth Aqueduct & Swr. Auth. Series 2012 A, 5.75% 7/1/37 | | 1,900,000 | | 1,856,091 |
Puerto Rico Commonwealth Pub. Impt. Gen. Oblig. Series 2012 A, 5.5% 7/1/39 | | 1,500,000 | | 1,477,365 |
Puerto Rico Elec. Pwr. Auth. Pwr. Rev.: | | | | |
Series KK, 5.5% 7/1/15 | | 1,800,000 | | 1,934,172 |
Series QQ, 5.5% 7/1/17 (XL Cap. Assurance, Inc. Insured) | | 1,300,000 | | 1,397,682 |
Puerto Rico Pub. Bldg. Auth. Rev. Bonds Series M2, 5.75%, tender 7/1/17 (a) | | 1,000,000 | | 1,064,110 |
Puerto Rico Sales Tax Fing. Corp. Sales Tax Rev.: | | | | |
Series 2007 A: | | | | |
0% 8/1/41 (Nat'l. Pub. Fin. Guarantee Corp. Insured) | | 3,300,000 | | 658,614 |
0% 8/1/45 (Nat'l. Pub. Fin. Guarantee Corp. Insured) | | 1,100,000 | | 172,997 |
Municipal Bonds - continued |
| Principal
Amount | | Value |
Puerto Rico - continued |
Puerto Rico Sales Tax Fing. Corp. Sales Tax Rev.: - continued | | | | |
0% 8/1/47 (AMBAC Insured) | | $ 1,000,000 | | $ 139,440 |
Series 2009 A, 6% 8/1/42 | | 1,000,000 | | 1,068,680 |
Series 2010 C, 6% 8/1/39 | | 1,800,000 | | 1,928,664 |
Series 2011 C: | | | | |
0% 8/1/39 | | 6,990,000 | | 1,549,543 |
0% 8/1/41 | | 1,600,000 | | 314,912 |
| | 13,562,270 |
Virgin Islands - 0.5% |
Virgin Islands Pub. Fin. Auth.: | | | | |
(Cruzan Proj.) Series 2009 A, 6% 10/1/39 | | 1,000,000 | | 1,113,340 |
Series 2009 A, 6.75% 10/1/37 | | 1,000,000 | | 1,159,100 |
Series 2009 B, 5% 10/1/25 | | 1,000,000 | | 1,098,780 |
| | 3,371,220 |
TOTAL INVESTMENT PORTFOLIO - 98.4% (Cost $589,627,219) | | 637,117,854 |
NET OTHER ASSETS (LIABILITIES) - 1.6% | | 10,206,149 |
NET ASSETS - 100% | $ 647,324,003 |
Legend |
(a) Coupon rates for floating and adjustable rate securities reflect the rates in effect at period end. |
Other Information |
All investments are categorized as Level 2 under the Fair Value Hierarchy. The inputs or methodology used for valuing securities may not be an indication of the risk associated with investing in those securities. For more information on valuation inputs, please refer to the Investment Valuation section in the accompanying Notes to Financial Statements. |
The distribution of municipal securities by revenue source, as a percentage of total net assets, is as follows (Unaudited): |
General Obligations | 36.8% |
Health Care | 18.0% |
Education | 14.3% |
Water & Sewer | 10.5% |
Electric Utilities | 5.7% |
Special Tax | 5.6% |
Others* (Individually Less Than 5%) | 9.1% |
| 100.0% |
* Includes net other assets |
See accompanying notes which are an integral part of the financial statements.
Annual Report
Fidelity Ohio Municipal Income Fund
Statement of Assets and Liabilities
| December 31, 2012 |
| | |
Assets | | |
Investment in securities, at value - See accompanying schedule: Unaffiliated issuers (cost $589,627,219) | | $ 637,117,854 |
Cash | | 5,633,630 |
Receivable for fund shares sold | | 555,802 |
Interest receivable | | 5,602,897 |
Prepaid expenses | | 1,530 |
Other receivables | | 1,411 |
Total assets | | 648,913,124 |
| | |
Liabilities | | |
Payable for fund shares redeemed | $ 511,597 | |
Distributions payable | 715,768 | |
Accrued management fee | 197,478 | |
Transfer agent fee payable | 87,479 | |
Other affiliated payables | 25,920 | |
Other payables and accrued expenses | 50,879 | |
Total liabilities | | 1,589,121 |
| | |
Net Assets | | $ 647,324,003 |
Net Assets consist of: | | |
Paid in capital | | $ 599,234,592 |
Undistributed net investment income | | 62,642 |
Accumulated undistributed net realized gain (loss) on investments | | 536,134 |
Net unrealized appreciation (depreciation) on investments | | 47,490,635 |
Net Assets, for 52,232,889 shares outstanding | | $ 647,324,003 |
Net Asset Value, offering price and redemption price per share ($647,324,003 ÷ 52,232,889 shares) | | $ 12.39 |
See accompanying notes which are an integral part of the financial statements.
Annual Report
Fidelity Ohio Municipal Income Fund
Financial Statements - continued
Statement of Operations
| Year ended December 31, 2012 |
| | |
Investment Income | | |
Interest | | $ 23,695,440 |
| | |
Expenses | | |
Management fee | $ 2,213,749 | |
Transfer agent fees | 503,062 | |
Accounting fees and expenses | 146,039 | |
Custodian fees and expenses | 7,389 | |
Independent trustees' compensation | 2,224 | |
Registration fees | 29,251 | |
Audit | 49,870 | |
Legal | 3,456 | |
Miscellaneous | 5,054 | |
Total expenses before reductions | 2,960,094 | |
Expense reductions | (10,104) | 2,949,990 |
Net investment income (loss) | | 20,745,450 |
Realized and Unrealized Gain (Loss) Net realized gain (loss) on: | | |
Investment securities: | | |
Unaffiliated issuers | | 3,199,697 |
Change in net unrealized appreciation (depreciation) on investment securities | | 17,596,699 |
Net gain (loss) | | 20,796,396 |
Net increase (decrease) in net assets resulting from operations | | $ 41,541,846 |
See accompanying notes which are an integral part of the financial statements.
Annual Report
Statement of Changes in Net Assets
| Year ended
December 31,
2012 | Year ended
December 31,
2011 |
Increase (Decrease) in Net Assets | | |
Operations | | |
Net investment income (loss) | $ 20,745,450 | $ 20,003,125 |
Net realized gain (loss) | 3,199,697 | 800,331 |
Change in net unrealized appreciation (depreciation) | 17,596,699 | 27,060,115 |
Net increase (decrease) in net assets resulting
from operations | 41,541,846 | 47,863,571 |
Distributions to shareholders from net investment income | (20,683,610) | (20,007,020) |
Distributions to shareholders from net realized gain | (2,427,967) | - |
Total distributions | (23,111,577) | (20,007,020) |
Share transactions
Proceeds from sales of shares | 125,756,638 | 81,031,529 |
Reinvestment of distributions | 14,300,752 | 12,501,977 |
Cost of shares redeemed | (66,106,639) | (99,473,703) |
Net increase (decrease) in net assets resulting from share transactions | 73,950,751 | (5,940,197) |
Redemption fees | 1,102 | 1,055 |
Total increase (decrease) in net assets | 92,382,122 | 21,917,409 |
| | |
Net Assets | | |
Beginning of period | 554,941,881 | 533,024,472 |
End of period (including undistributed net investment income of $62,642 and distributions in excess of net investment income of $5,134, respectively) | $ 647,324,003 | $ 554,941,881 |
Other Information Shares | | |
Sold | 10,223,539 | 6,982,450 |
Issued in reinvestment of distributions | 1,160,824 | 1,074,162 |
Redeemed | (5,371,717) | (8,656,173) |
Net increase (decrease) | 6,012,646 | (599,561) |
See accompanying notes which are an integral part of the financial statements.
Annual Report
Financial Highlights
Years ended December 31, | 2012 | 2011 | 2010 | 2009 | 2008 |
Selected Per-Share Data | | | | | |
Net asset value, beginning of period | $ 12.01 | $ 11.38 | $ 11.60 | $ 10.87 | $ 11.51 |
Income from Investment Operations | | | | | |
Net investment income (loss) B | .421 | .443 | .447 | .455 | .449 |
Net realized and unrealized gain (loss) | .426 | .630 | (.216) | .737 | (.632) |
Total from investment operations | .847 | 1.073 | .231 | 1.192 | (.183) |
Distributions from net investment income | (.420) | (.443) | (.447) | (.455) | (.449) |
Distributions from net realized gain | (.047) | - | (.004) | (.007) | (.008) |
Total distributions | (.467) | (.443) | (.451) | (.462) | (.457) |
Redemption fees added to paid in capital B, D | - | - | - | - | - |
Net asset value, end of period | $ 12.39 | $ 12.01 | $ 11.38 | $ 11.60 | $ 10.87 |
Total Return A | 7.14% | 9.62% | 1.95% | 11.11% | (1.62)% |
Ratios to Average Net Assets C | | | | | |
Expenses before reductions | .49% | .49% | .49% | .50% | .49% |
Expenses net of fee waivers, if any | .49% | .49% | .49% | .50% | .49% |
Expenses net of all reductions | .49% | .49% | .48% | .50% | .47% |
Net investment income (loss) | 3.42% | 3.81% | 3.82% | 3.99% | 4.01% |
Supplemental Data | | | | | |
Net assets, end of period (000 omitted) | $ 647,324 | $ 554,942 | $ 533,024 | $ 523,499 | $ 429,831 |
Portfolio turnover rate | 14% | 8% | 7% | 10% | 11% |
A Total returns would have been lower if certain expenses had not been reduced during the applicable periods shown.
B Calculated based on average shares outstanding during the period.
C Expense ratios reflect operating expenses of the Fund. Expenses before reductions do not reflect amounts reimbursed by the investment adviser or reductions from expense offset arrangements and do not represent the amount paid by the Fund during periods when reimbursements or reductions occur. Expenses net of fee waivers reflect expenses after reimbursement by the investment adviser but prior to reductions from expense offset arrangements. Expenses net of all reductions represent the net expenses paid by the Fund.
D Amount represents less than $.001 per share.
See accompanying notes which are an integral part of the financial statements.
Annual Report
Fidelity Ohio Municipal Money Market Fund
Effective Maturity Diversification |
Days | % of fund's investments
12/31/12 | % of fund's investments
6/30/12 | % of fund's
investments
12/31/11 |
1 - 7 | 79.1 | 77.1 | 77.0 |
8 - 30 | 1.4 | 1.9 | 0.2 |
31 - 60 | 2.4 | 1.7 | 1.6 |
61 - 90 | 2.3 | 2.2 | 1.7 |
91 - 180 | 9.8 | 11.0 | 12.9 |
> 180 | 5.0 | 6.1 | 6.6 |
Effective maturity is determined in accordance with the requirements of Rule 2a-7 under the Investment Company Act of 1940. |
Weighted Average Maturity |
| 12/31/12 | 6/30/12 | 12/31/11 |
Fidelity Ohio Municipal Money Market Fund | 32 Days | 46 Days | 43 Days |
Ohio Tax-Free Money Market Average* | 34 Days | 42 Days | 37 Days |
This is a weighted average of all the maturities of the securities held in a fund. Weighted Average Maturity (WAM) can be used as a measure of sensitivity to interest rate changes and market changes. Generally, the longer the maturity, the greater the sensitivity to such changes. WAM is based on the dollar-weighted average length of time until principal payments must be paid. Depending on the types of securities held in a fund, certain maturity shortening devices (e.g., demand features, interest rate resets, and call options) may be taken into account when calculating the WAM. |
Weighted Average Life |
| 12/31/12 | 6/30/12 | 12/31/11 |
Fidelity Ohio Municipal Money Market Fund | 32 Days | 46 Days | 43 Days |
Weighted Average Life (WAL) is the weighted average of the life of the securities held in a fund or portfolio and can be used as a measure of sensitivity to changes in liquidity and/or credit risk. Generally, the higher the value, the greater the sensitivity. WAL is based on the dollar-weighted average length of time until principal payments must be paid, taking into account any call options exercised by the issuer and any permissible maturity shortening features other than interest rate resets. The difference between WAM and WAL is that WAM takes into account interest rate resets and WAL does not. WAL for money market funds is not the same as WAL of a mortgage- or asset-backed security. |
Asset Allocation (% of fund's net assets) |
As of December 31, 2012 | As of June 30, 2012 |
| Variable Rate Demand Notes (VRDNs) 62.1% | | | Variable Rate Demand Notes (VRDNs) 65.2% | |
 | Other Municipal
Debt 18.8% | | | Other Municipal
Debt 26.8% | |
| Investment
Companies 7.4% | | | Investment
Companies 9.1% | |
| Net Other Assets (Liabilities) 11.7% | | | Net Other Assets (Liabilities)** (1.1)% | |

* Source: iMoneyNet, Inc.
** Net Other Assets are not included in the pie chart.
Current and Historical Seven-Day Yields
| 12/31/12 | 9/30/12 | 6/30/12 | 3/31/12 | 1/2/12 |
Fidelity Ohio Municipal Money Market Fund | 0.01% | 0.01% | 0.01% | 0.01% | 0.01% |
Yield refers to the income paid by the fund over a given period. Yields for money market funds are usually for seven-day periods, as they are here, though they are expressed as annual percentage rates. Past performance is no guarantee of future results. Yield will vary and it's possible to lose money investing in the Fund. A portion of the Fund's expenses was reimbursed and/or waived. Absent such reimbursements and/or waivers the yield for the period ending December 31, 2012, the most recent period shown in the table, would have been -0.36%.
Annual Report
Fidelity Ohio Municipal Money Market Fund
Investments December 31, 2012
Showing Percentage of Net Assets
Variable Rate Demand Note - 62.1% |
| Principal Amount | | Value |
Alabama - 0.0% |
Decatur Indl. Dev. Board Exempt Facilities Rev. (Nucor Steel Decatur LLC Proj.) Series 2003 A, 0.39% 1/7/13, VRDN (a)(d) | $ 700,000 | | $ 700,000 |
Delaware - 0.1% |
Delaware Econ. Dev. Auth. Rev. (Delmarva Pwr. & Lt. Co. Proj.) Series 1987, 0.26% 1/2/13, VRDN (a)(d) | 1,100,000 | | 1,100,000 |
Georgia - 0.1% |
Burke County Indl. Dev. Auth. Poll. Cont. Rev. (Georgia Pwr. Co. Plant Vogtle Proj.) Eighth Series 1994, 0.2% 1/2/13, VRDN (a) | 1,110,000 | | 1,110,000 |
Kentucky - 0.1% |
Elizabethtown Indl. Bldg. Rev. (Altec Industries, Inc. Proj.) Series 1997, 0.22% 1/7/13, LOC Wells Fargo Bank NA, VRDN (a)(d) | 1,000,000 | | 1,000,000 |
Louisiana - 0.0% |
Saint James Parish Gen. Oblig. (Nucor Steel Louisiana LLC Proj.) Series 2010 B1, 0.35% 1/7/13, VRDN (a) | 500,000 | | 500,000 |
Nebraska - 0.1% |
Stanton County Indl. Dev. Rev. (Nucor Corp. Proj.) Series 1996, 0.39% 1/7/13, VRDN (a)(d) | 700,000 | | 700,000 |
New Jersey - 0.1% |
Salem County Poll. Cont. Fin. Auth. Rev. (Pub. Svc. Elec. and Gas Co. Proj.): | | | |
Series 2003 B1, 0.33% 1/7/13, VRDN (a) | 200,000 | | 200,000 |
Series 2012 A, 0.37% 1/7/13, VRDN (a)(d) | 700,000 | | 700,000 |
| | 900,000 |
New York - 0.0% |
Dutchess County Indl. Dev. Agcy. Civic Facility Rev. (Lutheran Ctr. at Poughkeepsie, Inc. Proj.) 0.26% 1/7/13, LOC KeyBank NA, VRDN (a) | 100,000 | | 100,000 |
Ohio - 60.9% |
Akron Bath Copley Hosp. District Rev. (Akron Gen. Health Systems Proj.) Series 2008, 0.15% 1/7/13, LOC JPMorgan Chase Bank, VRDN (a) | 15,700,000 | | 15,700,000 |
Allen County Hosp. Facilities Rev.: | | | |
(Catholic Healthcare Partners Proj.): | | | |
Series 2008 A, 0.14% 1/2/13, LOC Bank of America NA, VRDN (a) | 44,520,000 | | 44,520,000 |
Series 2010 D, 0.14% 1/7/13, LOC JPMorgan Chase Bank, VRDN (a) | 42,700,000 | | 42,700,000 |
Series 2012 B, 0.12% 1/7/13, VRDN (a) | 32,450,000 | | 32,450,000 |
Variable Rate Demand Note - continued |
| Principal Amount | | Value |
Ohio - continued |
Alliance Hosp. Rev. (Alliance Obligated Group Proj.) Series 2003, 0.13% 1/2/13, LOC JPMorgan Chase Bank, VRDN (a) | $ 7,100,000 | | $ 7,100,000 |
Cincinnati Wtr. Sys. Rev. Participating VRDN Series MS 3280, 0.18% 1/7/13 (Liquidity Facility Morgan Stanley Bank, West Valley City Utah) (a)(e) | 3,330,000 | | 3,330,000 |
Cleveland Arpt. Sys. Rev.: | | | |
Series 2009 A, 0.14% 1/7/13, LOC Bank of New York, New York, VRDN (a)(d) | 24,470,000 | | 24,470,000 |
Series 2009 D, 0.11% 1/7/13, LOC PNC Bank NA, VRDN (a) | 20,785,000 | | 20,785,000 |
Columbus City School District Participating VRDN Series 1488, 0.16% 1/7/13 (Liquidity Facility JPMorgan Chase Bank) (a)(e) | 10,945,000 | | 10,945,000 |
Columbus Gen. Oblig.: | | | |
(San. Swr. Proj.) Series 2006 1, 0.13% 1/7/13, VRDN (a) | 2,385,000 | | 2,385,000 |
Participating VRDN Series Clipper 08 2, 0.13% 1/7/13 (Liquidity Facility State Street Bank & Trust Co., Boston) (a)(e) | 4,000,000 | | 4,000,000 |
Columbus Swr. Sys. Rev. Participating VRDN: | | | |
Series BBT 08 13, 0.13% 1/7/13 (Liquidity Facility Branch Banking & Trust Co.) (a)(e) | 3,200,000 | | 3,200,000 |
Series Putters 2456, 0.14% 1/7/13 (Liquidity Facility JPMorgan Chase Bank) (a)(e) | 5,805,000 | | 5,805,000 |
Cuyahoga County Hosp. Facilities Rev. (Sisters of Charity of Saint Augustine Health Sys. Proj.) Series 2000, 0.11% 1/7/13, LOC PNC Bank NA, VRDN (a) | 3,400,000 | | 3,400,000 |
Cuyahoga County Hsg. Rev. (Euclid Avenue Hsg. Corp. Proj.) Series 2009 A, 0.11% 1/7/13, LOC PNC Bank NA, VRDN (a) | 17,000,000 | | 17,000,000 |
Cuyahoga County Indl. Dev. Rev. (Pubco Corp. Proj.) Series 2001, 0.24% 1/7/13, LOC PNC Bank NA, VRDN (a)(d) | 270,000 | | 270,000 |
Franklin County Hosp. Facilities Rev. Participating VRDN Series Putters 4152, 0.14% 1/7/13 (Liquidity Facility JPMorgan Chase Bank) (a)(e) | 4,400,000 | | 4,400,000 |
Franklin County Hosp. Rev.: | | | |
(OhioHealth Corp. Proj.) Series D, 0.12% 1/7/13, LOC U.S. Bank NA, Cincinnati, VRDN (a) | 9,195,000 | | 9,195,000 |
(U.S. Health Corp. of Columbus Proj.) Series 1996 B, 0.13% 1/7/13, LOC U.S. Bank NA, Cincinnati, VRDN (a) | 8,160,000 | | 8,160,000 |
Participating VRDN: | | | |
Series BC 11 21B, 0.13% 1/7/13 (Liquidity Facility Barclays Bank PLC) (a)(e) | 4,660,000 | | 4,660,000 |
Variable Rate Demand Note - continued |
| Principal Amount | | Value |
Ohio - continued |
Franklin County Hosp. Rev.: - continued | | | |
Series WF 11 78C, 0.16% 1/7/13 (Liquidity Facility Wells Fargo Bank NA) (a)(e) | $ 12,035,000 | | $ 12,035,000 |
Hamilton County Health Care Facilities Rev. (The Children's Home of Cincinnati Proj.) Series 2009, 0.12% 1/7/13, LOC U.S. Bank NA, Cincinnati, VRDN (a) | 3,275,000 | | 3,275,000 |
Hamilton County Hosp. Facilities Rev.: | | | |
(Children's Hosp. Med. Ctr. Proj.): | | | |
Series 1997 A, 0.12% 1/7/13, LOC PNC Bank NA, VRDN (a) | 12,580,000 | | 12,580,000 |
Series 2000, 0.12% 1/7/13, LOC JPMorgan Chase Bank, VRDN (a) | 4,715,000 | | 4,715,000 |
Series 2002 I, 0.12% 1/7/13, LOC U.S. Bank NA, Cincinnati, VRDN (a) | 17,335,000 | | 17,335,000 |
Series 2007 M, 0.15% 1/7/13, LOC JPMorgan Chase Bank, VRDN (a) | 1,700,000 | | 1,700,000 |
(Elizabeth Gamble Deaconess Home Assoc. Proj.) Series 2002 B, 0.11% 1/7/13, LOC PNC Bank NA, VRDN (a) | 1,900,000 | | 1,900,000 |
Kent State Univ. Revs. Series 2008 B, 0.15% 1/7/13, LOC Bank of America NA, VRDN (a) | 44,800,000 | | 44,800,000 |
Lake County Indl. Dev. Rev. (Norshar Co. Proj.) 0.35% 1/7/13, LOC JPMorgan Chase Bank, VRDN (a)(d) | 1,955,000 | | 1,955,000 |
Lancaster Port Auth. Gas Rev. 0.13% 1/7/13 (Liquidity Facility Royal Bank of Canada), VRDN (a) | 44,045,000 | | 44,045,000 |
Lima Hosp. Rev. (Lima Memorial Hosp. Proj.) 0.15% 1/7/13, LOC JPMorgan Chase Bank, VRDN (a) | 905,000 | | 905,000 |
Lorain County Port Auth. Edl. Facilities Rev. (St. Ignatius High School Proj.) 0.13% 1/7/13, LOC U.S. Bank NA, Cincinnati, VRDN (a) | 2,050,000 | | 2,050,000 |
Lucas County Hosp. Rev. Participating VRDN Series BC 11 31B, 0.13% 1/7/13 (Liquidity Facility Barclays Bank PLC) (a)(e) | 8,475,000 | | 8,475,000 |
Middletown Dev. Rev. (Bishop Fenwick High School Proj.) 0.22% 1/7/13, LOC JPMorgan Chase Bank, VRDN (a) | 8,745,000 | | 8,745,000 |
Middletown Hosp. Facilities Rev. (Atrium Med. Ctr. Obligated Group Proj.) Series 2008 A, 0.15% 1/7/13, LOC JPMorgan Chase Bank, VRDN (a) | 4,520,000 | | 4,520,000 |
Ohio Air Quality Dev. Auth. Rev.: | | | |
(Cincinnati Gas & Elec. Co. Proj.): | | | |
Series A, 0.34% 1/7/13, VRDN (a) | 2,600,000 | | 2,600,000 |
Series B, 0.24% 1/7/13, VRDN (a) | 2,700,000 | | 2,700,000 |
(Dayton Pwr. & Lt. Co. Proj.): | | | |
Series 2008 A, 0.16% 1/7/13, LOC JPMorgan Chase Bank, VRDN (a)(d) | 25,600,000 | | 25,600,000 |
Variable Rate Demand Note - continued |
| Principal Amount | | Value |
Ohio - continued |
Ohio Air Quality Dev. Auth. Rev.: - continued | | | |
Series 2008 B, 0.15% 1/7/13, LOC JPMorgan Chase Bank, VRDN (a)(d) | $ 20,900,000 | | $ 20,900,000 |
(FirstEnergy Nuclear Generation Corp. Proj.) Series 2008 C, 0.11% 1/2/13, LOC Bank of Nova Scotia New York Branch, VRDN (a)(d) | 11,000,000 | | 11,000,000 |
(Ohio Valley Elec. Corp. Proj.): | | | |
Series 2009 C, 0.12% 1/7/13, LOC Bank of Tokyo-Mitsubishi UFJ Ltd., VRDN (a) | 15,700,000 | | 15,700,000 |
Series 2009 D, 0.12% 1/7/13, LOC Bank of Tokyo-Mitsubishi UFJ Ltd., VRDN (a) | 24,400,000 | | 24,400,000 |
(Timken Co. Proj.) 0.24% 1/7/13, LOC KeyBank NA, VRDN (a) | 650,000 | | 650,000 |
Ohio Gen. Oblig.: | | | |
(Common Schools Proj.) Series 2005 B, 0.13% 1/7/13, VRDN (a) | 1,695,000 | | 1,695,000 |
(Infrastructure Impt. Proj.) Series 2003 B, 0.11% 1/7/13, VRDN (a) | 1,100,000 | | 1,100,000 |
Participating VRDN Series MT 818, 0.15% 1/7/13 (Liquidity Facility Bank of America NA) (a)(e) | 5,085,000 | | 5,085,000 |
Ohio Higher Edl. Facility Commission Rev.: | | | |
(Case Western Reserve Univ. Proj.) Series 2008 A, 0.14% 1/7/13, LOC PNC Bank NA, VRDN (a) | 33,450,000 | | 33,450,000 |
(Cleveland Clinic Foundation Proj.) Series 2008 B4, 0.12% 1/2/13, VRDN (a) | 11,510,000 | | 11,510,000 |
(Ohio Northern Univ. Proj.) Series 2008 A, 0.13% 1/7/13, LOC JPMorgan Chase Bank, VRDN (a) | 17,120,000 | | 17,120,000 |
(Univ. Hosp. Health Sys. Proj.) Series 2008 B, 0.18% 1/7/13, LOC RBS Citizens NA, VRDN (a) | 10,000,000 | | 10,000,000 |
(Xavier Univ. Proj.): | | | |
Series 2008 A, 0.11% 1/7/13, LOC U.S. Bank NA, Cincinnati, VRDN (a) | 9,100,000 | | 9,100,000 |
Series B, 0.11% 1/7/13, LOC PNC Bank NA, VRDN (a) | 7,000,000 | | 7,000,000 |
Series 2008 B1, 0.13% 1/2/13, LOC U.S. Bank NA, Cincinnati, VRDN (a) | 3,030,000 | | 3,030,000 |
Ohio Hosp. Facilities Rev. Participating VRDN: | | | |
Series Putters 3552, 0.14% 1/7/13 (Liquidity Facility JPMorgan Chase Bank) (a)(e) | 2,440,000 | | 2,440,000 |
Series Putters 3558, 0.14% 1/7/13 (Liquidity Facility JPMorgan Chase Bank) (a)(e) | 1,200,000 | | 1,200,000 |
Variable Rate Demand Note - continued |
| Principal Amount | | Value |
Ohio - continued |
Ohio Hsg. Fin. Agcy. Mtg. Rev.: | | | |
(Mtg.-Backed Securities Prog.): | | | |
Series 2005 B1, 0.13% 1/7/13 (Liquidity Facility Fed. Home Ln. Bank, Cincinnati), VRDN (a)(d) | $ 18,500,000 | | $ 18,500,000 |
Series 2005 B2, 0.14% 1/7/13 (Liquidity Facility Fed. Home Ln. Bank, Cincinnati), VRDN (a)(d) | 5,000,000 | | 5,000,000 |
Series 2005 F, 0.14% 1/7/13 (Liquidity Facility Fed. Home Ln. Bank, Cincinnati), VRDN (a)(d) | 14,800,000 | | 14,800,000 |
Series F, 0.12% 1/7/13 (Liquidity Facility Fed. Home Ln. Bank, Cincinnati), VRDN (a)(d) | 2,000,000 | | 2,000,000 |
Participating VRDN Series Merlots 06 A2, 0.21% 1/7/13 (Liquidity Facility Wells Fargo Bank NA) (a)(d)(e) | 1,440,000 | | 1,440,000 |
Series 2004 D, 0.14% 1/7/13 (Liquidity Facility Fed. Home Ln. Bank, Cincinnati), VRDN (a)(d) | 10,860,000 | | 10,860,000 |
Ohio Hsg. Fin. Agcy. Multi-family Hsg. Rev.: | | | |
(Pedcor Invts. Willow Lake Apts. Proj.) Series B, 0.3% 1/7/13, LOC Fed. Home Ln. Bank, Indianapolis, VRDN (a)(d) | 425,000 | | 425,000 |
(Wingate at Belle Meadows Proj.) 0.15% 1/7/13, LOC Fed. Home Ln. Bank, Cincinnati, VRDN (a)(d) | 8,610,000 | | 8,610,000 |
Ohio Hsg. Fin. Agcy. Residential Mtg. Rev.: | | | |
(Mtg.-Backed Securities Prog.) Series 2008 D, 0.13% 1/7/13 (Liquidity Facility Fed. Home Ln. Bank, Cincinnati), VRDN (a)(d) | 20,550,000 | | 20,550,000 |
Participating VRDN: | | | |
Series BC 11 115B, 0.17% 1/7/13 (Liquidity Facility Barclays Bank PLC) (a)(d)(e) | 2,370,000 | | 2,370,000 |
Series Putters 4180, 0.19% 1/7/13 (Liquidity Facility JPMorgan Chase Bank) (a)(d)(e) | 2,380,000 | | 2,380,000 |
Series 2008 B, 0.16% 1/7/13 (Liquidity Facility Fed. Home Ln. Bank, Cincinnati), VRDN (a)(d) | 25,715,000 | | 25,715,000 |
Series 2008 H, 0.13% 1/7/13 (Liquidity Facility Fed. Home Ln. Bank, Cincinnati), VRDN (a)(d) | 4,100,000 | | 4,100,000 |
Ohio Wtr. Dev. Auth. (Waste Mgmt., Inc. Proj.) Series B, 0.18% 1/7/13, LOC Bank of America NA, VRDN (a)(d) | 6,900,000 | | 6,900,000 |
Ohio Wtr. Dev. Auth. Poll. Cont. Facilities Rev.: | | | |
(FirstEnergy Nuclear Generation Corp. Proj.): | | | |
Series 2006 B, 0.15% 1/7/13, LOC Wells Fargo Bank NA, VRDN (a) | 12,500,000 | | 12,500,000 |
Series 2008 C, 0.11% 1/2/13, LOC Bank of Nova Scotia New York Branch, VRDN (a)(d) | 11,600,000 | | 11,600,000 |
Series 2010 C, 0.13% 1/2/13, LOC UBS AG, VRDN (a) | 8,450,000 | | 8,450,000 |
Variable Rate Demand Note - continued |
| Principal Amount | | Value |
Ohio - continued |
Olentangy Local School District Participating VRDN Series Solar 07-7, 0.13% 1/7/13 (Liquidity Facility U.S. Bank NA, Cincinnati) (a)(e) | $ 12,300,000 | | $ 12,300,000 |
Richland County Health Care Facilities Rev. (Wesleyan Sr. Living Proj.) Series 2004 A, 0.13% 1/7/13, LOC JPMorgan Chase Bank, VRDN (a) | 2,420,000 | | 2,420,000 |
Village of Indian Hill Econ. Dev. Rev. (Cincinnati Country Day School Proj.) Series 1999, 0.15% 1/7/13, LOC PNC Bank NA, VRDN (a) | 4,345,000 | | 4,345,000 |
Wood County Indl. Dev. Rev. (CMC Group Proj.) Series 2001, 0.21% 1/7/13, LOC PNC Bank NA, VRDN (a)(d) | 875,000 | | 875,000 |
Zanesville-Muskingum Port Auth. Indl. Dev. Rev. (Almana II LLC Proj.) Series 2000, 0.75% 1/7/13, LOC JPMorgan Chase Bank, VRDN (a)(d) | 1,350,000 | | 1,350,000 |
| | 817,280,000 |
Tennessee - 0.1% |
Clarksville Pub. Bldg. Auth. Rev. (Tennessee Muni. Bond Fund Proj.) Series 2001, 0.2% 1/2/13, LOC Bank of America NA, VRDN (a) | 1,415,000 | | 1,415,000 |
Texas - 0.4% |
Port Arthur Navigation District Indl. Dev. Corp. Exempt Facilities Rev. (Air Products Proj.) Series 2010 A, 0.16% 1/7/13 (Total SA Guaranteed), VRDN (a) | 5,000,000 | | 5,000,000 |
Virginia - 0.2% |
Virginia Hsg. Dev. Auth. Commonwealth Mtg. Rev. Participating VRDN Series BA 1047, 0.22% 1/7/13 (Liquidity Facility Bank of America NA) (a)(d)(e) | 3,200,000 | | 3,200,000 |
TOTAL VARIABLE RATE DEMAND NOTE |
833,005,000
|
Other Municipal Debt - 18.8% |
| | | |
Kentucky - 0.1% |
Trimble County Poll. Cont. Rev. Bonds (Louisville Gas & Elec. Co. Proj.) Series 2001 B, 0.4% tender 1/16/13, CP mode (d) | 1,600,000 | | 1,600,000 |
Massachusetts - 0.3% |
Massachusetts Indl. Fin. Agcy. Poll. Cont. Rev. Bonds (New England Pwr. Co. Proj.) Series 1992, 0.45% tender 1/9/13, CP mode | 4,200,000 | | 4,200,000 |
Other Municipal Debt - continued |
| Principal Amount | | Value |
New Hampshire - 0.1% |
New Hampshire Bus. Fin. Auth. Poll. Cont. Rev. Bonds (New England Pwr. Co. Proj.) Series 1990 A, 0.5% tender 1/9/13, CP mode (d) | $ 1,200,000 | | $ 1,200,000 |
Ohio - 18.3% |
American Muni. Pwr. Bonds (Omega Joint Venture 6 Proj.) 0.32%, tender 2/15/13 (a) | 2,959,000 | | 2,959,000 |
Avon Gen. Oblig. BAN Series 2012-1, 1% 6/27/13 | 5,955,000 | | 5,973,677 |
Beachwood Gen. Oblig. BAN 1% 8/7/13 | 1,735,000 | | 1,742,440 |
Columbus Gen. Oblig.: | | | |
BAN Series 2012-1, 1.5% 11/21/13 | 7,000,000 | | 7,079,917 |
Bonds: | | | |
Series 2010 A, 4% 6/1/13 | 1,000,000 | | 1,015,731 |
Series 2011 A, 5% 7/1/13 | 1,390,000 | | 1,422,941 |
Cuyahoga County Rev. Bonds (Cleveland Clinic Health Sys. Obligated Group Prog.) Series 2003 A, 5.5% 1/1/13 | 1,070,000 | | 1,070,000 |
Delaware Gen. Oblig. BAN: | | | |
Series 2012 B, 1.25% 4/24/13 | 3,850,000 | | 3,860,889 |
Series 2012, 1% 4/24/13 | 4,530,000 | | 4,541,004 |
Franklin County Hosp. Rev. Bonds (U.S. Health Corp. of Columbus Proj.) Series 2011 B, 0.25%, tender 7/9/13 (a) | 20,400,000 | | 20,400,000 |
Green Gen. Oblig. BAN Series 2012 B, 0.75% 6/19/13 | 1,473,000 | | 1,475,373 |
Hancock County Gen. Oblig. BAN Series 2012, 1.5% 3/15/13 | 5,565,000 | | 5,577,955 |
Independence Gen. Oblig. BAN Series 2012, 1.125% 4/19/13 | 1,500,000 | | 1,503,204 |
Mason City School District BAN Series 2012, 2% 1/31/13 | 5,000,000 | | 5,006,756 |
Mason Gen. Oblig. BAN 1.5% 6/27/13 | 3,200,000 | | 3,216,992 |
Ohio Bldg. Auth. Bonds Series 2003 A: | | | |
5% 4/1/13 | 1,900,000 | | 1,922,056 |
5% 4/1/13 | 1,400,000 | | 1,416,259 |
Ohio Gen. Oblig. Bonds: | | | |
(Higher Ed. Proj.) Series 2005 C, 5% 8/1/13 | 1,000,000 | | 1,027,868 |
Series 2003 A: | | | |
4.5% 3/15/13 (Pre-Refunded to 3/15/13 @ 100) | 1,000,000 | | 1,008,486 |
5% 3/15/13 | 2,900,000 | | 2,928,014 |
Series 2006 D, 5% 9/15/13 | 1,550,000 | | 1,602,004 |
Series 2009 C: | | | |
5% 8/1/13 | 1,000,000 | | 1,027,363 |
5% 9/15/13 | 6,000,000 | | 6,201,304 |
Series 2012 A: | | | |
2% 2/1/13 | 10,900,000 | | 10,916,530 |
4% 2/1/13 | 4,515,000 | | 4,529,524 |
Other Municipal Debt - continued |
| Principal Amount | | Value |
Ohio - continued |
Ohio Gen. Oblig. Bonds: - continued | | | |
Series J, 5% 5/1/13 | $ 3,785,000 | | $ 3,844,825 |
Series Q, 4% 4/1/13 | 1,305,000 | | 1,317,215 |
Ohio Higher Edl. Facility Commission Rev. Bonds: | | | |
(The Cleveland Clinic Foundation Proj.): | | | |
Series 2008 B5: | | | |
0.2% tender 4/4/13, CP mode | 22,700,000 | | 22,700,000 |
0.21% tender 3/6/13, CP mode | 7,100,000 | | 7,100,000 |
0.21% tender 3/7/13, CP mode | 10,200,000 | | 10,200,000 |
0.22% tender 5/8/13, CP mode | 2,000,000 | | 2,000,000 |
Series 2008 B6, 0.21% tender 2/7/13, CP mode | 5,000,000 | | 5,000,000 |
Series 2008 B5, 0.2% tender 1/10/13, CP mode | 10,300,000 | | 10,300,000 |
Series 2008 B6: | | | |
0.19% tender 6/6/13, CP mode | 12,300,000 | | 12,300,000 |
0.22% tender 5/8/13, CP mode | 23,900,000 | | 23,900,000 |
Series 2012 A, 2% 1/1/13 | 3,335,000 | | 3,335,000 |
Ohio State Univ. Gen. Receipts Bonds Series 2003 B, 5.25% 6/1/13 (Pre-Refunded to 6/1/13 @ 100) | 4,090,000 | | 4,175,086 |
Ohio Wtr. Dev. Auth. Rev. Bonds Series 2010 B, 5% 6/1/13 | 2,785,000 | | 2,840,092 |
Ohio Wtr. Dev. Auth. Wtr. Poll. Cont. Rev. Bonds: | | | |
Series 2004: | | | |
5% 6/1/13 | 2,300,000 | | 2,345,553 |
5% 6/1/13 | 2,315,000 | | 2,360,680 |
Series 2009, 5% 12/1/13 | 1,000,000 | | 1,043,411 |
Portage County Gen. Oblig. BAN Series 2012, 1.5% 10/30/13 | 15,150,000 | | 15,307,440 |
Univ. of Cincinnati Gen. Receipts BAN: | | | |
Series 2012 B, 2% 5/9/13 | 10,600,000 | | 10,662,981 |
Series 2012 D, 1.5% 12/12/13 | 2,500,000 | | 2,528,268 |
Worthington City School District BAN Series 2012, 1.125% 4/16/13 | 2,500,000 | | 2,506,451 |
TOTAL OTHER MUNICIPAL DEBT |
252,192,289
|
Investment Company - 7.4% |
| Shares | | Value |
Fidelity Municipal Cash Central Fund, 0.16% (b)(c) | 99,499,000 | | $ 99,499,000 |
TOTAL INVESTMENT PORTFOLIO - 88.3% (Cost $1,184,696,289) | | 1,184,696,289 |
NET OTHER ASSETS (LIABILITIES) - 11.7% | | 157,690,657 |
NET ASSETS - 100% | $ 1,342,386,946 |
Security Type Abbreviations |
BAN | - | BOND ANTICIPATION NOTE |
CP | - | COMMERCIAL PAPER |
VRDN | - | VARIABLE RATE DEMAND NOTE (A debt instrument that is payable upon demand, either daily, weekly or monthly) |
Legend |
(a) Coupon rates for floating and adjustable rate securities reflect the rates in effect at period end. |
(b) Information in this report regarding holdings by state and security types does not reflect the holdings of the Fidelity Municipal Cash Central Fund. |
(c) Affiliated fund that is available only to investment companies and other accounts managed by Fidelity Investments. The rate quoted is the annualized seven-day yield of the fund at period end. A complete unaudited listing of the fund's holdings as of its most recent quarter end is available upon request. In addition, each Fidelity Central Fund's financial statements, which are not covered by the Fund's Report of Independent Registered Public Accounting Firm, are available on the SEC's website or upon request. |
(d) Private activity obligations whose interest is subject to the federal alternative minimum tax for individuals. |
(e) Provides evidence of ownership in one or more underlying municipal bonds. |
Affiliated Central Funds |
Information regarding fiscal year to date income earned by the Fund from investments in Fidelity Central Funds is as follows: |
Fund | Income earned |
Fidelity Municipal Cash Central Fund | $ 184,547 |
Other Information |
The date shown for securities represents the date when principal payments must be paid, taking into account any call options exercised by the issuer and any permissible maturity shortening features other than interest rate resets. |
All investments are categorized as Level 2 under the Fair Value Hierarchy. The inputs or methodology used for valuing securities may not be an indication of the risk associated with investing in those securities. For more information on valuation inputs, please refer to the Investment Valuation section in the accompanying Notes to Financial Statements. |
See accompanying notes which are an integral part of the financial statements.
Annual Report
Fidelity Ohio Municipal Money Market Fund
Statement of Assets and Liabilities
| December 31, 2012 |
| | |
Assets | | |
Investment in securities, at value - See accompanying schedule: Unaffiliated issuers (cost $1,085,197,289) | $ 1,085,197,289 | |
Fidelity Central Funds (cost $99,499,000) | 99,499,000 | |
Total Investments (cost $1,184,696,289) | | $ 1,184,696,289 |
Cash | | 49,266,963 |
Receivable for investments sold | | 2,200,000 |
Receivable for fund shares sold | | 121,228,838 |
Interest receivable | | 1,217,732 |
Distributions receivable from Fidelity Central Funds | | 11,455 |
Prepaid expenses | | 2,505 |
Other receivables | | 5,961 |
Total assets | | 1,358,629,743 |
| | |
Liabilities | | |
Payable for fund shares redeemed | $ 15,923,673 | |
Distributions payable | 495 | |
Accrued management fee | 137,754 | |
Other affiliated payables | 148,137 | |
Other payables and accrued expenses | 32,738 | |
Total liabilities | | 16,242,797 |
| | |
Net Assets | | $ 1,342,386,946 |
Net Assets consist of: | | |
Paid in capital | | $ 1,342,384,217 |
Accumulated undistributed net realized gain (loss) on investments | | 2,729 |
Net Assets, for 1,341,898,376 shares outstanding | | $ 1,342,386,946 |
Net Asset Value, offering price and redemption price per share ($1,342,386,946 ÷ 1,341,898,376 shares) | | $ 1.00 |
See accompanying notes which are an integral part of the financial statements.
Annual Report
Statement of Operations
| Year ended December 31, 2012 |
| | |
Investment Income | | |
Interest | | $ 2,024,317 |
Income from Fidelity Central Funds | | 184,547 |
Total income | | 2,208,864 |
| | |
Expenses | | |
Management fee | $ 3,978,845 | |
Transfer agent fees | 1,493,338 | |
Accounting fees and expenses | 123,968 | |
Custodian fees and expenses | 13,821 | |
Independent trustees' compensation | 3,918 | |
Registration fees | 33,400 | |
Audit | 37,629 | |
Legal | 6,525 | |
Miscellaneous | 6,687 | |
Total expenses before reductions | 5,698,131 | |
Expense reductions | (3,598,310) | 2,099,821 |
Net investment income (loss) | | 109,043 |
Realized and Unrealized Gain (Loss) Net realized gain (loss) on: | | |
Investment securities: | | |
Unaffiliated issuers | 7,271 | |
Capital gain distributions from Fidelity Central Funds | 1,063 | |
Total net realized gain (loss) | | 8,334 |
Net increase in net assets resulting from operations | | $ 117,377 |
See accompanying notes which are an integral part of the financial statements.
Annual Report
Fidelity Ohio Municipal Money Market Fund
Financial Statements - continued
Statement of Changes in Net Assets
| Year ended
December 31, 2012 | Year ended
December 31, 2011 |
Increase (Decrease) in Net Assets | | |
Operations | | |
Net investment income (loss) | $ 109,043 | $ 100,582 |
Net realized gain (loss) | 8,334 | (29) |
Net increase in net assets resulting
from operations | 117,377 | 100,553 |
Distributions to shareholders from net investment income | (109,032) | (100,344) |
Share transactions at net asset value of $1.00 per share
Proceeds from sales of shares | 2,976,266,019 | 3,000,350,460 |
Reinvestment of distributions | 105,697 | 99,383 |
Cost of shares redeemed | (2,740,593,789) | (2,904,823,286) |
Net increase (decrease) in net assets and shares resulting from share transactions | 235,777,927 | 95,626,557 |
Total increase (decrease) in net assets | 235,786,272 | 95,626,766 |
| | |
Net Assets | | |
Beginning of period | 1,106,600,674 | 1,010,973,908 |
End of period | $ 1,342,386,946 | $ 1,106,600,674 |
See accompanying notes which are an integral part of the financial statements.
Annual Report
Financial Highlights
Years ended December 31, | 2012 | 2011 | 2010 | 2009 | 2008 |
Selected Per-Share Data | | | | | |
Net asset value, beginning of period | $ 1.00 | $ 1.00 | $ 1.00 | $ 1.00 | $ 1.00 |
Income from Investment Operations | | | | | |
Net investment income (loss) | - D | - D | - D | - D | .018 |
Distributions from net investment income | - D | - D | - D | - D | (.018) |
Net asset value, end of period | $ 1.00 | $ 1.00 | $ 1.00 | $ 1.00 | $ 1.00 |
Total Return A | .01% | .01% | .01% | .15% | 1.77% |
Ratios to Average Net Assets B, C |
Expenses before reductions | .52% | .52% | .52% | .57% | .54% |
Expenses net of fee waivers, if any | .19% | .24% | .37% | .55% | .54% |
Expenses net of all reductions | .19% | .24% | .37% | .55% | .48% |
Net investment income (loss) | .01% | .01% | .01% | .15% | 1.75% |
Supplemental Data | | | | | |
Net assets, end of period (000 omitted) | $ 1,342,387 | $ 1,106,601 | $ 1,010,974 | $ 1,029,552 | $ 1,224,236 |
A Total returns would have been lower if certain expenses had not been reduced during the applicable periods shown.
B Fees and expenses of any underlying Fidelity Central Funds are not included in the Fund's expense ratio. The Fund indirectly bears its proportionate share of the expenses of any underlying Fidelity Central Funds.
C Expense ratios reflect operating expenses of the Fund. Expenses before reductions do not reflect amounts reimbursed or waived or reductions from expense offset arrangements and do not represent the amount paid by the Fund during periods when reimbursements, waivers or reductions occur. Expenses net of fee waivers reflect expenses after reimbursement and waivers but prior to reductions from expense offset arrangements. Expenses net of all reductions represent the net expenses paid by the Fund.
D Amount represents less than $.001 per share.
See accompanying notes which are an integral part of the financial statements.
Annual Report
Notes to Financial Statements
For the period ended December 31, 2012
1. Organization.
Fidelity Ohio Municipal Income Fund (the Income Fund) is a fund of Fidelity Municipal Trust. Fidelity Ohio Municipal Money Market Fund (the Money Market Fund) is a fund of Fidelity Municipal Trust II. Each Trust is registered under the Investment Company Act of 1940, as amended (the 1940 Act), as an open-end management investment company. Fidelity Municipal Trust and Fidelity Municipal Trust II (the Trusts) are organized as a Massachusetts business trust and a Delaware statutory trust, respectively. Each Fund is authorized to issue an unlimited number of shares. Each Fund may be affected by economic and political developments in the state of Ohio.
2. Investments in Fidelity Central Funds.
The Funds may invest in Fidelity Central Funds, which are open-end investment companies available only to other investment companies and accounts managed by Fidelity Management & Research Company (FMR) and its affiliates. The Funds' Schedules of Investments list each of the Fidelity Central Funds held as of period end, if any, as an investment of each Fund, but do not include the underlying holdings of each Fidelity Central Fund. As an Investing Fund, each Fund indirectly bears its proportionate share of the expenses of the underlying Fidelity Central Funds.
The Money Market Central Funds seek preservation of capital and current income and are managed by Fidelity Investments Money Management, Inc. (FIMM), an affiliate of FMR.
A complete unaudited list of holdings for each Fidelity Central Fund is available upon request or at the Securities and Exchange Commission (the SEC) website at www.sec.gov. In addition, the financial statements of the Fidelity Central Funds, which are not covered by the Funds' Report of Independent Registered Public Accounting Firm, are available on the SEC website or upon request.
3. Significant Accounting Policies.
The financial statements have been prepared in conformity with accounting principles generally accepted in the United States of America (GAAP), which require management to make certain estimates and assumptions at the date of the financial statements. Actual results could differ from those estimates. Subsequent events, if any, through the date that the financial statements were issued have been evaluated in the preparation of the financial statements. The following summarizes the significant accounting policies of the Funds:
Investment Valuation. Investments are valued as of 4:00 p.m. Eastern time on the last calendar day of the period. In accordance with valuation policies and procedures approved by the Board of Trustees (the Board), the Income Fund attempts to obtain prices
Annual Report
3. Significant Accounting Policies - continued
Investment Valuation - continued
from one or more third party pricing vendors or brokers to value its investments. When current market prices, quotations or rates are not readily available or reliable, investments will be fair valued in good faith by the FMR Fair Value Committee (the Committee), in accordance with procedures adopted by the Board. Factors used in determining fair value vary by investment type and may include market or investment specific events, changes in interest rates and credit quality. The frequency with which these procedures are used cannot be predicted and they may be utilized to a significant extent. The Committee oversees the Income Fund's valuation policies and procedures and is responsible for approving and reporting to the Board all fair value determinations.
Each Fund categorizes the inputs to valuation techniques used to value their investments into a disclosure hierarchy consisting of three levels as shown below:
Level 1 - quoted prices in active markets for identical investments
Level 2 - other significant observable inputs (including quoted prices for similar investments, interest rates, prepayment speeds, etc.)
Level 3 - unobservable inputs (including the Fund's own assumptions based on the best information available)
Valuation techniques used to value each Fund's investments by major category are as follows:
For the Income Fund, debt securities, including restricted securities, are valued based on evaluated prices received from third party pricing vendors or from brokers who make markets in such securities. For municipal securities, pricing vendors utilize matrix pricing which considers yield or price of bonds of comparable quality, coupon, maturity and type as well as broker-supplied prices and are generally categorized as Level 2 in the hierarchy.
When independent prices are unavailable or unreliable, debt securities may be valued utilizing pricing methodologies which consider similar factors that would be used by third party pricing vendors. These are generally categorized as Level 2 in the hierarchy but may be Level 3 depending on the circumstances.
For the Money Market Fund, as permitted by compliance with certain conditions under Rule 2a-7 of the 1940 Act, securities are valued at amortized cost, which approximates fair value. The amortized cost of an instrument is determined by valuing it at its original cost and thereafter amortizing any discount or premium from its face value at a constant rate until maturity. Securities held by a money market fund are generally high quality
Annual Report
Notes to Financial Statements - continued
3. Significant Accounting Policies - continued
Investment Valuation - continued
and liquid; however, they are reflected as Level 2 because the inputs used to determine fair value are not quoted prices in an active market.
For the Income Fund, changes in valuation techniques may result in transfers in or out of an assigned level within the disclosure hierarchy.
Investment Transactions and Income. For financial reporting purposes, the Funds' investment holdings and net asset value (NAV) include trades executed through the end of the last business day of the period. The NAV per share for processing shareholder transactions is calculated as of the close of business of the New York Stock Exchange (NYSE), normally 4:00 p.m. Eastern time and includes trades executed through the end of the prior business day for the Income Fund and trades executed through the end of the current business day for the Money Market Fund. Gains and losses on securities sold are determined on the basis of identified cost. Dividend income is recorded on the ex-dividend date, except for certain dividends from foreign securities where the ex-dividend date may have passed, which are recorded as soon as the Funds are informed of the ex-dividend date. Non-cash dividends included in dividend income, if any, are recorded at the fair market value of the securities received. Interest income and distributions from the Fidelity Central Funds are accrued as earned. Interest income includes coupon interest and amortization of premium and accretion of discount on debt securities.
Expenses. Expenses directly attributable to a fund are charged to that fund. Expenses attributable to more than one fund are allocated among the respective funds on the basis of relative net assets or other appropriate methods. Expense estimates are accrued in the period to which they relate and adjustments are made when actual amounts are known.
Income Tax Information and Distributions to Shareholders. Each year, each Fund intends to qualify as a regulated investment company under Subchapter M of the Internal Revenue Code, including distributing substantially all of its taxable income and realized gains. As a result, no provision for income taxes is required. As of December 31, 2012, each Fund did not have any unrecognized tax benefits in the financial statements; nor is each Fund aware of any tax positions for which it is reasonably possible that the total amounts of unrecognized tax benefits will significantly change in the next twelve months. Each Fund files a U.S. federal tax return, in addition to state and local tax returns as required. A fund's federal income tax returns are subject to examination by the Internal Revenue Service (IRS) for a period of three fiscal years after they are filed. State and local tax returns may be subject to examination for an additional fiscal year depending on the jurisdiction.
Dividends are declared and recorded daily and paid monthly from net investment income. Distributions from realized gains, if any, are declared and recorded on the
Annual Report
3. Significant Accounting Policies - continued
Income Tax Information and Distributions to Shareholders - continued
ex-dividend date. Income and capital gain distributions are determined in accordance with income tax regulations, which may differ from GAAP. In addition, the Money Market Fund claimed a portion of the payment made to redeeming shareholders as a distribution for income tax purposes.
Capital accounts within the financial statements are adjusted for permanent book-tax differences. These adjustments have no impact on net assets or the results of operations. Temporary book-tax differences will reverse in a subsequent period.
Book-tax differences are primarily due to market discount, deferred trustees compensation, capital loss carryforwards, losses deferred due to futures transactions and excise tax regulations.
The Funds purchase municipal securities whose interest, in the opinion of the issuer, is free from federal income tax. There is no assurance that the IRS will agree with this opinion. In the event the IRS determines that the issuer does not comply with relevant tax requirements, interest payments from a security could become federally taxable, possibly retroactively to the date the security was issued.
The federal tax cost of investment securities and unrealized appreciation (depreciation) as of period end were as follows for each Fund:
| Tax cost | Gross unrealized
appreciation | Gross unrealized
depreciation | Net unrealized appreciation
(depreciation) on securities and other investments |
Fidelity Ohio Municipal Income Fund | $ 589,635,454 | $ 48,076,594 | $ (594,194) | $ 47,482,400 |
Fidelity Ohio Municipal Money Market Fund | $ 1,184,696,289 | - | - | - |
The tax-based components of distributable earnings as of period end were as follows for each Fund:
| Undistributed
tax-exempt
income | Undistributed
long-term
capital gain | Net unrealized
appreciation
(depreciation) |
Fidelity Ohio Municipal Income Fund | $ 71,401 | $ 663,883 | $ 47,482,400 |
Fidelity Ohio Municipal Money Market Fund | 2,954 | - | - |
Annual Report
Notes to Financial Statements - continued
3. Significant Accounting Policies - continued
Income Tax Information and Distributions to Shareholders - continued
The tax character of distributions paid was as follows:
December 31, 2012 | | | |
| Tax-Exempt
Income | Long-term
Capital Gains | Total |
Fidelity Ohio Municipal Income Fund | $ 20,683,610 | $ 2,427,967 | $ 23,111,577 |
Fidelity Ohio Municipal Money Market Fund | 109,032 | - | 109,032 |
December 31, 2011 | | | |
| Tax-Exempt
Income | Long-term
Capital Gains | Total |
Fidelity Ohio Municipal Income Fund | $ 20,007,020 | $ - | $ 20,007,020 |
Fidelity Ohio Municipal Money Market Fund | 100,344 | - | 100,344 |
Short-Term Trading (Redemption) Fees. Shares held by investors in the Income Fund less than 30 days are subject to a redemption fee equal to ..50% of the net asset value of shares redeemed. All redemption fees, which reduce the proceeds of the shareholder redemption, are retained by the Fund and accounted for as an addition to paid in capital.
4. Purchases and Sales of Investments.
Purchases and sales of securities, other than short-term securities, for the Income Fund aggregated $167,550,583 and $82,554,423, respectively.
5. Fees and Other Transactions with Affiliates.
Management Fee. FMR and its affiliates provide the Funds with investment management related services for which the Funds pay a monthly management fee. The management fee is the sum of an individual fund fee rate and an annualized group fee rate. The individual fund fee rate is applied to each Fund's average net assets. The group fee rate is based upon the average net assets of all the mutual funds advised by FMR. The group fee rate decreases as assets under management increase and increases as assets under management decrease. For the period, each Fund's annual management fee rate expressed as a percentage of each Fund's average net assets was as follows:
| Individual Rate | Group Rate | Total |
Fidelity Ohio Municipal Income Fund | .25% | .12% | .37% |
Fidelity Ohio Municipal Money Market Fund | .25% | .12% | .37% |
Annual Report
5. Fees and Other Transactions with Affiliates - continued
Transfer Agent and Accounting Fees. Citibank, N.A. (Citibank) is the custodian, transfer agent and servicing agent for the Funds. Citibank has entered into a sub-arrangement with Fidelity Investments Institutional Operations Company, Inc. (FIIOC), an affiliate of FMR, under which FIIOC performs the activities associated with the Funds' transfer agency, dividend disbursing and shareholder servicing functions. The Funds pay Citibank account fees and asset-based fees that vary according to account size and type of account. FIIOC pays for typesetting, printing and mailing of shareholder reports, except proxy statements. For the period, the transfer agent fees were equivalent to the following annual rates expressed as a percentage of average net assets:
Fidelity Ohio Municipal Income Fund | .08% |
Fidelity Ohio Municipal Money Market Fund | .14% |
During the period, FMR or its affiliates waived a portion of these fees for the Money Market Fund.
Citibank also has a sub-arrangement with Fidelity Service Company, Inc. (FSC), an affiliate of FMR, under which FSC maintains each Fund's accounting records. The fee is paid to Citibank and is based on the level of average net assets for each month.
6. Committed Line of Credit.
The Income Fund participates with other funds managed by FMR or an affiliate in a $4.25 billion credit facility (the "line of credit") to be utilized for temporary or emergency purposes to fund shareholder redemptions or for other short-term liquidity purposes. The participating funds have agreed to pay commitment fees on their pro-rata portion of the line of credit, which are reflected in Miscellaneous expenses on the Statement of Operations, and are as follows:
Fidelity Ohio Municipal Income Fund | $ 1,594 |
During the period, there were no borrowings on this line of credit.
7. Expense Reductions.
FMR or its affiliates voluntarily agreed to waive certain fees for the Money Market Fund in order to maintain a minimum annualized yield of .01%. Such arrangements may be discontinued by FMR at any time. For the period, the amount of the waiver was $3,591,717.
Annual Report
Notes to Financial Statements - continued
7. Expense Reductions - continued
In addition, through arrangements with each applicable Fund's custodian, credits realized as a result of uninvested cash balances were used to reduce each applicable Fund's expenses. All of the applicable expense reductions are noted in the table below.
| Custody
expense
reduction | Transfer
Agent
expense
reduction | Accounting
expense
reduction |
Fidelity Ohio Municipal Income Fund | $ 6,733 | $ 3,366 | $ 5 |
Fidelity Ohio Municipal Money Market Fund | 1,867 | 4,724 | 2 |
8. Other.
The Funds' organizational documents provide former and current trustees and officers with a limited indemnification against liabilities arising in connection with the performance of their duties to the Funds. In the normal course of business, the Funds may also enter into contracts that provide general indemnifications. The Funds' maximum exposure under these arrangements is unknown as this would be dependent on future claims that may be made against the Funds. The risk of material loss from such claims is considered remote.
Annual Report
To the Trustees of Fidelity Municipal Trust and Fidelity Municipal Trust II and the Shareholders of Fidelity Ohio Municipal Income Fund and Fidelity Ohio Municipal Money Market Fund:
In our opinion, the accompanying statements of assets and liabilities, including the schedules of investments, and the related statements of operations and of changes in net assets and the financial highlights present fairly, in all material respects, the financial position of Fidelity Ohio Municipal Income Fund (a fund of Fidelity Municipal Trust) and Fidelity Ohio Municipal Money Market Fund (a fund of Fidelity Municipal Trust II) at December 31, 2012, the results of each of their operations for the year then ended, the changes in their net assets for each of the two years in the period then ended and their financial highlights for each of the five years in the period then ended, in conformity with accounting principles generally accepted in the United States of America. These financial statements and financial highlights (hereafter referred to as "financial statements") are the responsibility of the Fidelity Municipal Trust's and Fidelity Municipal Trust II's management. Our responsibility is to express an opinion on these financial statements based on our audits. We conducted our audits of these financial statements in accordance with the standards of the Public Company Accounting Oversight Board (United States). Those standards require that we plan and perform the audit to obtain reasonable assurance about whether the financial statements are free of material misstatement. An audit includes examining, on a test basis, evidence supporting the amounts and disclosures in the financial statements, assessing the accounting principles used and significant estimates made by management, and evaluating the overall financial statement presentation. We believe that our audits, which included confirmation of securities at December 31, 2012 by correspondence with the custodian and brokers, provide a reasonable basis for our opinion.
PricewaterhouseCoopers LLP
Boston, Massachusetts
February 11, 2013
Annual Report
The Trustees and executive officers of the trusts and funds, as applicable, are listed below. The Board of Trustees governs each fund and is responsible for protecting the interests of shareholders. The Trustees are experienced executives who meet periodically throughout the year to oversee each fund's activities, review contractual arrangements with companies that provide services to each fund, oversee management of the risks associated with such activities and contractual arrangements, and review each fund's performance. Except for Elizabeth S. Acton and James C. Curvey, each of the Trustees oversees 218 funds advised by FMR or an affiliate. Ms. Acton oversees 200 funds advised by FMR or an affiliate. Mr. Curvey oversees 452 funds advised by FMR or an affiliate.
The Trustees hold office without limit in time except that (a) any Trustee may resign; (b) any Trustee may be removed by written instrument, signed by at least two-thirds of the number of Trustees prior to such removal; (c) any Trustee who requests to be retired or who has become incapacitated by illness or injury may be retired by written instrument signed by a majority of the other Trustees; and (d) any Trustee may be removed at any special meeting of shareholders by a two-thirds vote of the outstanding voting securities of the trust. Each Trustee who is not an interested person (as defined in the 1940 Act) (Independent Trustee), shall retire not later than the last day of the month in which his or her 75th birthday occurs. The Independent Trustees may waive this mandatory retirement age policy with respect to individual Trustees. The executive officers hold office without limit in time, except that any officer may resign or may be removed by a vote of a majority of the Trustees at any regular meeting or any special meeting of the Trustees. Except as indicated, each individual has held the office shown or other offices in the same company for the past five years.
Experience, Skills, Attributes, and Qualifications of the Funds' Trustees. The Governance and Nominating Committee has adopted a statement of policy that describes the experience, qualifications, attributes, and skills that are necessary and desirable for potential Independent Trustee candidates (Statement of Policy). The Board believes that each Trustee satisfied at the time he or she was initially elected or appointed a Trustee, and continues to satisfy, the standards contemplated by the Statement of Policy. The Governance and Nominating Committee also engages professional search firms to help identify potential Independent Trustee candidates who have the experience, qualifications, attributes, and skills consistent with the Statement of Policy. From time to time, additional criteria based on the composition and skills of the current Independent Trustees, as well as experience or skills that may be appropriate in light of future changes to board composition, business conditions, and regulatory or other developments, have also been considered by the professional search firms and the Governance and Nominating Committee. In addition, the Board takes into account the Trustees' commitment and participation in Board and committee meetings, as well as their leadership of standing and ad hoc committees throughout their tenure.
In determining that a particular Trustee was and continues to be qualified to serve as a Trustee, the Board has considered a variety of criteria, none of which, in isolation, was controlling. The Board believes that, collectively, the Trustees have balanced and diverse experience, qualifications, attributes, and skills, which allow the Board to operate effectively in governing each fund and protecting the interests of shareholders. Information about the specific experience, skills, attributes, and qualifications of each Trustee, which in each case led to the Board's conclusion that the Trustee should serve (or continue to serve) as a trustee of the funds, is provided below.
Annual Report
Trustees and Officers - continued
Board Structure and Oversight Function. Abigail P. Johnson is an interested person (as defined in the 1940 Act) and currently serves as Chairman. The Trustees have determined that an interested Chairman is appropriate and benefits shareholders because an interested Chairman has a personal and professional stake in the quality and continuity of services provided to the funds. Independent Trustees exercise their informed business judgment to appoint an individual of their choosing to serve as Chairman, regardless of whether the Trustee happens to be independent or a member of management. The Independent Trustees have determined that they can act independently and effectively without having an Independent Trustee serve as Chairman and that a key structural component for assuring that they are in a position to do so is for the Independent Trustees to constitute a substantial majority for the Board. The Independent Trustees also regularly meet in executive session. Albert R. Gamper, Jr. serves as Chairman of the Independent Trustees and as such (i) acts as a liaison between the Independent Trustees and management with respect to matters important to the Independent Trustees and (ii) with management prepares agendas for Board meetings.
Fidelity funds are overseen by different Boards of Trustees. The funds' Board oversees Fidelity's investment-grade bond, money market, and asset allocation funds and another Board oversees Fidelity's equity and high income funds. The asset allocation funds may invest in Fidelity funds that are overseen by such other Board. The use of separate Boards, each with its own committee structure, allows the Trustees of each group of Fidelity funds to focus on the unique issues of the funds they oversee, including common research, investment, and operational issues. On occasion, the separate Boards establish joint committees to address issues of overlapping consequences for the Fidelity funds overseen by each Board.
The Trustees operate using a system of committees to facilitate the timely and efficient consideration of all matters of importance to the Trustees, each fund, and fund shareholders and to facilitate compliance with legal and regulatory requirements and oversight of the funds' activities and associated risks. The Board, acting through its committees, has charged FMR and its affiliates with (i) identifying events or circumstances the occurrence of which could have demonstrably adverse effects on the funds' business and/or reputation; (ii) implementing processes and controls to lessen the possibility that such events or circumstances occur or to mitigate the effects of such events or circumstances if they do occur; and (iii) creating and maintaining a system designed to evaluate continuously business and market conditions in order to facilitate the identification and implementation processes described in (i) and (ii) above. Because the day-to-day operations and activities of the funds are carried out by or through FMR, its affiliates and other service providers, the funds' exposure to risks is mitigated but not eliminated by the processes overseen by the Trustees. While each of the Board's committees has responsibility for overseeing different aspects of the funds' activities, oversight is exercised primarily through the Operations and Audit Committees. In addition, an ad hoc Board committee of Independent Trustees has worked with FMR to enhance the Board's oversight of investment and financial risks, legal and regulatory risks, technology risks, and operational risks, including the development of additional risk reporting to the Board. The Operations Committee also worked and continues to work with FMR to enhance the stress tests required under SEC regulations for money market funds. Appropriate personnel, including but not limited to the funds' Chief Compliance Officer (CCO), FMR's internal auditor, the independent accountants, the funds' Treasurer and portfolio management personnel, make periodic reports to the Board's committees, as appropriate, including an annual review of FMR's risk management program for the Fidelity funds. The responsibilities of each standing committee, including their oversight responsibilities, are described further under "Standing Committees of the Funds' Trustees."
Annual Report
The funds' Statement of Additional Information (SAI) includes more information about the Trustees. To request a free copy, call Fidelity at 1-800-544-8544.
Interested Trustees*:
Correspondence intended for each Trustee who is an interested person may be sent to Fidelity Investments, 82 Devonshire Street, Boston, Massachusetts 02109.
Name, Age; Principal Occupations and Other Relevant Experience+ |
Abigail P. Johnson (51) |
| Year of Election or Appointment: 2009 Ms. Johnson is Trustee and Chairman of the Board of Trustees of certain Trusts. Ms. Johnson serves as President of Fidelity Financial Services (2012-present) and President of Personal, Workplace and Institutional Services (2005-present). Ms. Johnson is Chairman and Director of FMR Co., Inc. (2011-present), Chairman and Director of FMR (2011-present), and the Vice Chairman and Director (2007-present) of FMR LLC. Previously, Ms. Johnson served as President and a Director of FMR (2001-2005), a Trustee of other investment companies advised by FMR, Fidelity Investments Money Management, Inc., and FMR Co., Inc. (2001-2005), Senior Vice President of the Fidelity funds (2001-2005), and managed a number of Fidelity funds. Ms. Abigail P. Johnson and Mr. Arthur E. Johnson are not related. |
James C. Curvey (77) |
| Year of Election or Appointment: 2007 Mr. Curvey also serves as Trustee (2007-present) of other investment companies advised by FMR. Mr. Curvey is a Director of Fidelity Investments Money Management, Inc. (2009-present), Director of Fidelity Research & Analysis Co. (2009-present) and Director of FMR and FMR Co., Inc. (2007-present). Mr. Curvey is also Vice Chairman (2007-present) and Director of FMR LLC. In addition, Mr. Curvey serves as an Overseer for the Boston Symphony Orchestra and a member of the Trustees of Villanova University. Previously, Mr. Curvey was the Vice Chairman (2006-2007) and Director (2000-2007) of FMR Corp. |
* Trustees have been determined to be "Interested Trustees" by virtue of, among other things, their affiliation with the trusts or various entities under common control with FMR.
+ The information above includes each Trustee's principal occupation during the last five years and other information relating to the experience, attributes, and skills relevant to each Trustee's qualifications to serve as a Trustee, which led to the conclusion that each Trustee should serve as a Trustee for each fund.
Independent Trustees:
Correspondence intended for each Independent Trustee (that is, the Trustees other than the Interested Trustees) may be sent to Fidelity Investments, P.O. Box 55235, Boston, Massachusetts 02205-5235.
Name, Age; Principal Occupations and Other Relevant Experience+ |
Elizabeth S. Acton (61) |
| Year of Election or Appointment: 2013 Ms. Acton is Trustee of certain Trusts. Prior to her retirement in April 2012, Ms. Acton was Executive Vice President, Finance (November 2011-April 2012), Executive Vice President, Chief Financial Officer (April 2002-November 2011), and Treasurer (May 2004-May 2005) of Comerica Incorporated (financial services). Prior to joining Comerica, Ms. Acton held a variety of positions at Ford Motor Company (1983-2002), including Vice President and Treasurer (2000-2002) and Executive Vice President and Chief Financial Officer of Ford Motor Credit Company (1998-2000). Ms. Acton currently serves as a member of the Board of Directors and Audit and Finance Committees of Beazer Homes USA, Inc. (homebuilding, 2012-present). |
Albert R. Gamper, Jr. (70) |
| Year of Election or Appointment: 2006 Mr. Gamper is Chairman of the Independent Trustees of the Fixed Income and Asset Allocation Funds (2012-present). Prior to his retirement in December 2004, Mr. Gamper served as Chairman of the Board of CIT Group Inc. (commercial finance). During his tenure with CIT Group Inc. Mr. Gamper served in numerous senior management positions, including Chairman (1987-1989; 1999-2001; 2002-2004), Chief Executive Officer (1987-2004), and President (2002-2003). Mr. Gamper currently serves as a member of the Board of Directors of Public Service Enterprise Group (utilities, 2000-present), a member of the Board of Trustees, Rutgers University (2004-present), and Chairman of the Board of Barnabas Health Care System. Previously, Mr. Gamper served as Vice Chairman of the Independent Trustees of the Fixed Income and Asset Allocation Funds (2011-2012) and as Chairman of the Board of Governors, Rutgers University (2004-2007). |
Robert F. Gartland (61) |
| Year of Election or Appointment: 2010 Mr. Gartland is Chairman and an investor in Gartland and Mellina Group Corp. (consulting, 2009-present). Previously, Mr. Gartland served as a partner and investor of Vietnam Partners LLC (investments and consulting, 2008-2011). Prior to his retirement, Mr. Gartland held a variety of positions at Morgan Stanley (financial services, 1979-2007) including Managing Director (1987-2007). |
Arthur E. Johnson (65) |
| Year of Election or Appointment: 2008 Mr. Johnson serves as a member of the Board of Directors of Eaton Corporation (diversified power management, 2009-present), AGL Resources, Inc. (holding company, 2002-present) and Booz Allen Hamilton (management consulting, 2011-present). Prior to his retirement, Mr. Johnson served as Senior Vice President of Corporate Strategic Development of Lockheed Martin Corporation (defense contractor, 1999-2009). He previously served on the Board of Directors of IKON Office Solutions, Inc. (1999-2008) and Delta Airlines (2005-2007). Mr. Arthur E. Johnson is not related to Ms. Abigail P. Johnson. |
Michael E. Kenneally (58) |
| Year of Election or Appointment: 2009 Previously, Mr. Kenneally served as a Member of the Advisory Board for certain Fidelity Fixed Income and Asset Allocation Funds (2008-2009). Prior to his retirement, Mr. Kenneally served as Chairman and Global Chief Executive Officer of Credit Suisse Asset Management (2003-2005). Mr. Kenneally was a Director of the Credit Suisse Funds (U.S. mutual funds, 2004-2008) and certain other closed-end funds (2004-2005) and was awarded the Chartered Financial Analyst (CFA) designation in 1991. |
James H. Keyes (72) |
| Year of Election or Appointment: 2007 Mr. Keyes serves as a member of the Boards of Navistar International Corporation (manufacture and sale of trucks, buses, and diesel engines, since 2002) and Pitney Bowes, Inc. (integrated mail, messaging, and document management solutions, since 1998). Prior to his retirement, Mr. Keyes served as Chairman and Chief Executive Officer of Johnson Controls (automotive, building, and energy, 1998-2002) and as a member of the Board of LSI Logic Corporation (semiconductor technologies, 1984-2008). |
Marie L. Knowles (66) |
| Year of Election or Appointment: 2001 Ms. Knowles is Vice Chairman of the Independent Trustees of the Fixed Income and Asset Allocation Funds (2012-present). Prior to Ms. Knowles' retirement in June 2000, she served as Executive Vice President and Chief Financial Officer of Atlantic Richfield Company (ARCO) (diversified energy, 1996-2000). From 1993 to 1996, she was a Senior Vice President of ARCO and President of ARCO Transportation Company. She served as a Director of ARCO from 1996 to 1998. Ms. Knowles currently serves as a Director and Chairman of the Audit Committee of McKesson Corporation (healthcare service, since 2002). Ms. Knowles is an Honorary Trustee of the Brookings Institution and a member of the Board of the Catalina Island Conservancy and of the Santa Catalina Island Company (2009-present). She also serves as a member of the Advisory Board for the School of Engineering of the University of Southern California and the Foundation Board of the School of Architecture at the University of Virginia (2007-present). Previously, Ms. Knowles served as a Director of Phelps Dodge Corporation (copper mining and manufacturing, 1994-2007). |
Kenneth L. Wolfe (73) |
| Year of Election or Appointment: 2005 Prior to his retirement, Mr. Wolfe served as Chairman and a Director (2007-2009) and Chairman and Chief Executive Officer (1994-2001) of Hershey Foods Corporation. He also served as a member of the Boards of Adelphia Communications Corporation (telecommunications, 2003-2006), Bausch & Lomb, Inc. (medical/pharmaceutical, 1993-2007), and Revlon, Inc. (personal care products, 2004-2009). Mr. Wolfe previously served as Chairman of the Independent Trustees of the Fixed Income and Asset Allocation Funds (2008-2012). |
+ The information above includes each Trustee's principal occupation during the last five years and other information relating to the experience, attributes, and skills relevant to each Trustee's qualifications to serve as a Trustee, which led to the conclusion that each Trustee should serve as a Trustee for each fund.
Executive Officers:
Correspondence intended for each executive officer may be sent to Fidelity Investments, 82 Devonshire Street, Boston, Massachusetts 02109.
Name, Age; Principal Occupation |
Stephanie J. Dorsey (43) |
| Year of Election or Appointment: 2013 President and Treasurer of Fidelity's Fixed Income and Asset Allocation Funds. Ms. Dorsey also serves as Assistant Treasurer of other Fidelity funds (2010-present) and is an employee of Fidelity Investments (2008-present). Previously, Ms. Dorsey served as Deputy Treasurer of Fidelity's Fixed Income and Asset Allocation Funds (2008-2013), Treasurer (2004-2008) of the JPMorgan Mutual Funds and Vice President (2004-2008) of JPMorgan Chase Bank. |
Charles S. Morrison (52) |
| Year of Election or Appointment: 2012 Vice President of Fidelity's Fixed Income and Asset Allocation Funds. Mr. Morrison also serves as President, Fixed Income and is an employee of Fidelity Investments. Previously, Mr. Morrison served as Vice President of Fidelity's Money Market Funds (2005-2009), President, Money Market Group Leader of FMR (2009), and Senior Vice President, Money Market Group of FMR (2004-2009). Mr. Morrison also served as Vice President of Fidelity's Bond Funds (2002-2005), certain Balanced Funds (2002-2005), and certain Asset Allocation Funds (2002-2007), and as Senior Vice President (2002-2005) of Fidelity's Fixed Income Division. |
Robert P. Brown (49) |
| Year of Election or Appointment: 2012 Vice President of Fidelity's Bond Funds. Mr. Brown also serves as Executive Vice President of Fidelity Investments Money Management, Inc. (2010-present), President, Bond Group of FMR (2011-present), Director and Managing Director, Research of Fidelity Management & Research (U.K.) Inc. (2008-present) and is an employee of Fidelity Investments. Previously, Mr. Brown served as President, Money Market Group of FMR (2010-2011) and Vice President of Fidelity's Money Market Funds (2010-2012). |
Nancy D. Prior (45) |
| Year of Election or Appointment: 2012 Vice President of Fidelity's Money Market Funds. Ms. Prior also serves as President, Money Market Group of FMR (2011-present) and is an employee of Fidelity Investments (2002-present). Previously, Ms. Prior served as Managing Director of Research (2009-2011), Senior Vice President and Deputy General Counsel (2007-2009), and Assistant Secretary of Fidelity's Fixed Income and Asset Allocation Funds (2008-2009). |
Scott C. Goebel (44) |
| Year of Election or Appointment: 2008 Secretary and Chief Legal Officer (CLO) of the Fidelity funds. Mr. Goebel also serves as Secretary of Fidelity Investments Money Management, Inc. (FIMM) (2010-present) and Fidelity Research and Analysis Company (FRAC) (2010-present); Secretary and CLO of The North Carolina Capital Management Trust: Cash and Term Portfolios (2008-present); General Counsel, Secretary, and Senior Vice President of FMR (2008-present) and FMR Co., Inc. (2008-present); employed by FMR LLC or an affiliate (2001-present); Chief Legal Officer of Fidelity Management & Research (Hong Kong) Limited (2008-present) and Assistant Secretary of Fidelity Management & Research (Japan) Inc. (2008-present), and Fidelity Management & Research (U.K.) Inc. (2008-present). Previously, Mr. Goebel served as Assistant Secretary of FIMM (2008-2010), FRAC (2008-2010), and the Funds (2007-2008) and as Vice President and Secretary of Fidelity Distributors Corporation (FDC) (2005-2007). |
Ramon Herrera (38) |
| Year of Election or Appointment: 2012 Assistant Secretary of Fidelity's Fixed Income and Asset Allocation Funds. Mr. Herrera also serves as Vice President, Associate General Counsel (2010-present) and is an employee of Fidelity Investments (2004-present). |
Elizabeth Paige Baumann (44) |
| Year of Election or Appointment: 2012 Anti-Money Laundering (AML) Officer of the Fidelity funds. Ms. Baumann also serves as AML Officer of The North Carolina Capital Management Trust: Cash and Term Portfolios (2012-present), Chief AML Officer of FMR LLC (2012-present), and is an employee of Fidelity Investments. Previously, Ms. Baumann served as Vice President and Deputy Anti-Money Laundering Officer (2007-2012). |
Christine Reynolds (54) |
| Year of Election or Appointment: 2008 Chief Financial Officer of the Fidelity funds. Ms. Reynolds became President of Fidelity Pricing and Cash Management Services (FPCMS) in August 2008. Ms. Reynolds served as Chief Operating Officer of FPCMS (2007-2008). Previously, Ms. Reynolds served as President, Treasurer, and Anti-Money Laundering officer of the Fidelity funds (2004-2007). |
Michael H. Whitaker (45) |
| Year of Election or Appointment: 2008 Chief Compliance Officer of Fidelity's Fixed Income and Asset Allocation Funds. Mr. Whitaker also serves as Chief Compliance Officer of The North Carolina Capital Management Trust: Cash and Term Portfolios (2008-present). Mr. Whitaker is an employee of Fidelity Investments (2007-present). Prior to joining Fidelity Investments, Mr. Whitaker worked at MFS Investment Management where he served as Senior Vice President and Chief Compliance Officer (2004-2006), and Assistant General Counsel. |
Joseph F. Zambello (55) |
| Year of Election or Appointment: 2011 Deputy Treasurer of the Fidelity funds. Mr. Zambello is an employee of Fidelity Investments. Previously, Mr. Zambello served as Vice President of FMR's Program Management Group (2009-2011) and Vice President of the Transfer Agent Oversight Group (2005-2009). |
Stephen Sadoski (41) |
| Year of Election or Appointment: 2013 Deputy Treasurer of Fidelity's Fixed Income and Asset Allocation Funds. Mr. Sadoski also serves as Deputy Treasurer of other Fidelity funds (2012-present) and is an employee of Fidelity Investments (2012-present). Previously, Mr. Sadoski served as Assistant Treasurer of Fidelity's Fixed Income and Asset Allocation Funds (2012-2013), an assistant chief accountant in the Division of Investment Management of the Securities and Exchange Commission (SEC) (2009-2012) and as a senior manager at Deloitte & Touche (1997-2009). |
Adrien E. Deberghes (45) |
| Year of Election or Appointment: 2010 Assistant Treasurer of Fidelity's Fixed Income and Asset Allocation Funds. Mr. Deberghes also serves as Vice President and Assistant Treasurer (2011-present) and Deputy Treasurer (2008-present) of other Fidelity funds, and is an employee of Fidelity Investments (2008-present). Previously, Mr. Deberghes served as Senior Vice President of Mutual Fund Administration at State Street Corporation (2007-2008), Senior Director of Mutual Fund Administration at Investors Bank & Trust (2005-2007), and Director of Finance for Dunkin' Brands (2000-2005). |
Kenneth B. Robins (43) |
| Year of Election or Appointment: 2009 Assistant Treasurer of the Fidelity Fixed Income and Asset Allocation Funds. Mr. Robins also serves as President and Treasurer of other Fidelity funds (2008-present; 2010-present) and is an employee of Fidelity Investments (2004-present). Previously, Mr. Robins served as Deputy Treasurer of the Fidelity funds (2005-2008) and Treasurer and Chief Financial Officer of The North Carolina Capital Management Trust: Cash and Term Portfolios (2006-2008). |
Gary W. Ryan (54) |
| Year of Election or Appointment: 2005 Assistant Treasurer of the Fidelity funds. Mr. Ryan is an employee of Fidelity Investments. Previously, Mr. Ryan served as Vice President of Fund Reporting in Fidelity Pricing and Cash Management Services (FPCMS) (1999-2005). |
Jonathan Davis (44) |
| Year of Election or Appointment: 2010 Assistant Treasurer of the Fidelity funds. Mr. Davis is also Assistant Treasurer of Fidelity Rutland Square Trust II and Fidelity Commonwealth Trust II. Mr. Davis is an employee of Fidelity Investments. Previously, Mr. Davis served as Vice President and Associate General Counsel of FMR LLC (2003-2010). |
Annual Report
The Board of Trustees of each fund voted to pay to shareholders of record at the opening of business on record date, the following distributions per share derived from capital gains realized from sales of portfolio securities:
Fund | Pay Date | Record Date | Capital Gains |
Fidelity Ohio Municipal Income Fund | 02/11/13 | 02/08/13 | $0.014 |
Fidelity Ohio Municipal Money Market Fund | 02/11/13 | 02/08/13 | $0.000 |
The funds hereby designate as capital gain dividend the amounts noted below for the taxable year ended December 31, 2012, or, if subsequently determined to be different, the net capital gain of such year.
Fund | |
Fidelity Ohio Municipal Income Fund | $ 3,144,038 |
Fidelity Ohio Municipal Money Market Fund | $ 992 |
During fiscal year ended 2012, 100% of each fund's income dividends were free from federal income tax, and 1.06% and 19.31% of Fidelity Ohio Municipal Income Fund and Fidelity Ohio Municipal Money Market Fund 's income dividends, respectively, were subject to the federal alternative minimum tax.
The fund will notify shareholders in January 2013 of amounts for use in preparing 2012 income tax returns.
Annual Report
Board Approval of Investment Advisory Contracts and Management Fees
Fidelity Ohio Municipal Income Fund / Fidelity Ohio Municipal Money Market Fund
Each year, the Board of Trustees, including the Independent Trustees (together, the Board), votes on the renewal of the management contract and sub-advisory agreements (together, the Advisory Contracts) for each fund. The Board, assisted by the advice of fund counsel and Independent Trustees' counsel, requests and considers a broad range of information relevant to the renewal of the Advisory Contracts throughout the year.
The Board meets regularly and, at each of its meetings, covers an extensive agenda of topics and materials and considers factors that are relevant to its annual consideration of the renewal of each fund's Advisory Contracts, including the services and support provided to each fund and its shareholders. The Board has established three standing committees, Operations, Audit, and Governance and Nominating, each composed of and chaired by Independent Trustees with varying backgrounds, to which the Board has assigned specific subject matter responsibilities in order to enhance effective decision-making by the Board. The Operations Committee, of which all of the Independent Trustees are members, meets regularly throughout the year and, among other matters, considers matters specifically related to the annual consideration of the renewal of each fund's Advisory Contracts. The Board, acting directly and through its Committees, requests and receives information concerning the annual consideration of the renewal of each fund's Advisory Contracts. The Board also meets as needed to consider matters specifically related to the Board's annual consideration of the renewal of Advisory Contracts. Members of the Board may also meet with trustees of other Fidelity funds through ad hoc joint committees to discuss certain matters relevant to the Fidelity funds.
At its September 2012 meeting, the Board of Trustees, including the Independent Trustees, unanimously determined to renew each fund's Advisory Contracts. In reaching its determination, the Board considered all factors it believed relevant, including (i) the nature, extent, and quality of the services to be provided to each fund and its shareholders (including the investment performance of each fund); (ii) the competitiveness of each fund's management fee and total expense ratio relative to peer funds; (iii) the total costs of the services to be provided by and the profits to be realized by Fidelity from its relationship with each fund; (iv) the extent to which economies of scale exist and would be realized as each fund grows; and (v) whether fee levels reflect these economies of scale, if any, for the benefit of fund shareholders.
In considering whether to renew the Advisory Contracts for each fund, the Board reached a determination, with the assistance of fund counsel and Independent Trustees' counsel and through the exercise of its business judgment, that the renewal of the Advisory Contracts is in the best interests of each fund and its shareholders and that the compensation payable under the Advisory Contracts is fair and reasonable. The Board's decision to renew the Advisory Contracts was not based on any single factor, but rather was based on a comprehensive consideration of all the information provided to the Board at its meetings throughout the year. The Board, in reaching its determination to renew the Advisory Contracts, was aware that shareholders in each fund have a broad range of investment choices available to them, including a wide choice among mutual funds offered by Fidelity's competitors, and that each fund's shareholders, who have the opportunity to review and weigh the disclosure provided by the fund in its prospectus and other public disclosures, have chosen to invest in that fund, managed by Fidelity.
Annual Report
Nature, Extent, and Quality of Services Provided. The Board considered the staffing within the investment adviser, FMR, and the sub-advisers (together, the Investment Advisers), including the backgrounds of the funds' investment personnel, and also considered the funds' investment objectives, strategies, and related investment philosophies. The Independent Trustees also had discussions with senior management of Fidelity's investment operations and investment groups. The Board considered the structure of the portfolio manager compensation program and whether this structure provides appropriate incentives to act in the best interests of each fund.
Resources Dedicated to Investment Management and Support Services. The Board reviewed the general qualifications and capabilities of the Investment Advisers' investment staff, including its size, education, experience, and resources, as well as the Investment Advisers' approach to recruiting, managing, and compensating investment personnel. The Board also noted that FMR has continued to increase the resources devoted to non-U.S. offices, including expansion of Fidelity's global investment organization. The Board noted that Fidelity's analysts have extensive resources, tools and capabilities that allow them to conduct sophisticated quantitative and fundamental analysis, as well as credit analysis of issuers, counterparties and guarantors. The Board also believes that Fidelity's investment professionals have sufficient access to global information and data so as to provide competitive investment results over time, and that those professionals also have access to sophisticated tools that permit them to assess portfolio construction and risk and performance attribution characteristics continuously, as well as to transmit new information and research conclusions rapidly around the world. Additionally, in its deliberations, the Board considered the Investment Advisers' trading and risk management capabilities and resources, which are an integral part of the investment management process.
Shareholder and Administrative Services. The Board considered (i) the nature, extent, quality, and cost of advisory, administrative, and shareholder services performed by the Investment Advisers and their affiliates under the Advisory Contracts and under separate agreements covering transfer agency and pricing and bookkeeping services for each fund; (ii) the nature and extent of the supervision of third party service providers, principally custodians and subcustodians; and (iii) the resources devoted to, and the record of compliance with, each fund's compliance policies and procedures.
Annual Report
Board Approval of Investment Advisory Contracts and
Management Fees - continued
The Board noted that the growth of fund assets over time across the complex allows Fidelity to reinvest in the development of services designed to enhance the value or convenience of the Fidelity funds as investment vehicles. These services include 24-hour access to account information and market information through telephone representatives and over the Internet, investor education materials and asset allocation tools, and the expanded availability of Fidelity Investor Centers.
Investment in a Large Fund Family. The Board considered the benefits to shareholders of investing in a Fidelity fund, including the benefits of investing in a fund that is part of a large family of funds offering a variety of investment disciplines and providing a large variety of mutual fund investor services. The Board noted that Fidelity had taken, or had made recommendations that resulted in the Fidelity funds taking, a number of actions over the previous year that benefited particular funds, including (i) continuing to dedicate additional resources to investment research and support of the senior management team that oversees asset management; (ii) persisting in efforts to enhance Fidelity's research capabilities, in particular, international research; (iii) launching new funds and making other enhancements to meet client needs for global and income-oriented solutions; (iv) continuing to launch dedicated lower cost underlying funds to meet investment management's portfolio construction needs related to expanding underlying fund options, specifically for the Freedom Fund product lines; (v) adopting a sector neutral investment approach for certain funds and utilizing a team of portfolio managers to manage certain sector-neutral funds; (vi) rationalizing product lines and gaining increased efficiencies through combinations of several funds with other funds; (vii) strengthening the Spartan Index Fund product line by adding new funds and/or new low-cost institutional share classes, restructuring fund expenses to accommodate new classes, and reducing investment minimums for certain classes of shares; (viii) modifying the eligibility criteria for Institutional Class shares to increase their appeal to government entities and charitable investors; and (ix) reducing certain transfer agent fee rates.
Investment Performance. The Board considered whether each fund has operated in accordance with its investment objective, as well as its record of compliance with its investment restrictions. It also reviewed each fund's absolute investment performance, as well as each fund's relative investment performance measured over multiple periods against (i) a broad-based securities market index (bond fund only, as money market funds are typically not compared against a market index), and (ii) a peer group of mutual funds deemed appropriate by Fidelity and reviewed by the Board. For each fund, the following charts considered by the Board show, over the one-, three-, and five-year periods ended December 31, 2011, the fund's cumulative total returns, the cumulative total returns of a broad-based securities market index ("benchmark") (bond fund only), and a range of cumulative total returns of a peer group of mutual funds identified by Lipper Inc. as having an investment objective similar to that of the fund. The box within each chart shows the 25th percentile return (top of box) and the 75th percentile return (bottom of box) of the peer group. Returns shown above the box are in the first quartile and returns shown below the box are in the fourth quartile. The percentage beaten number noted below each chart corresponds to the percentile box and represents the percentage of funds in the peer group whose performance was equal to or lower than that of the fund.
Annual Report
Fidelity Ohio Municipal Income Fund
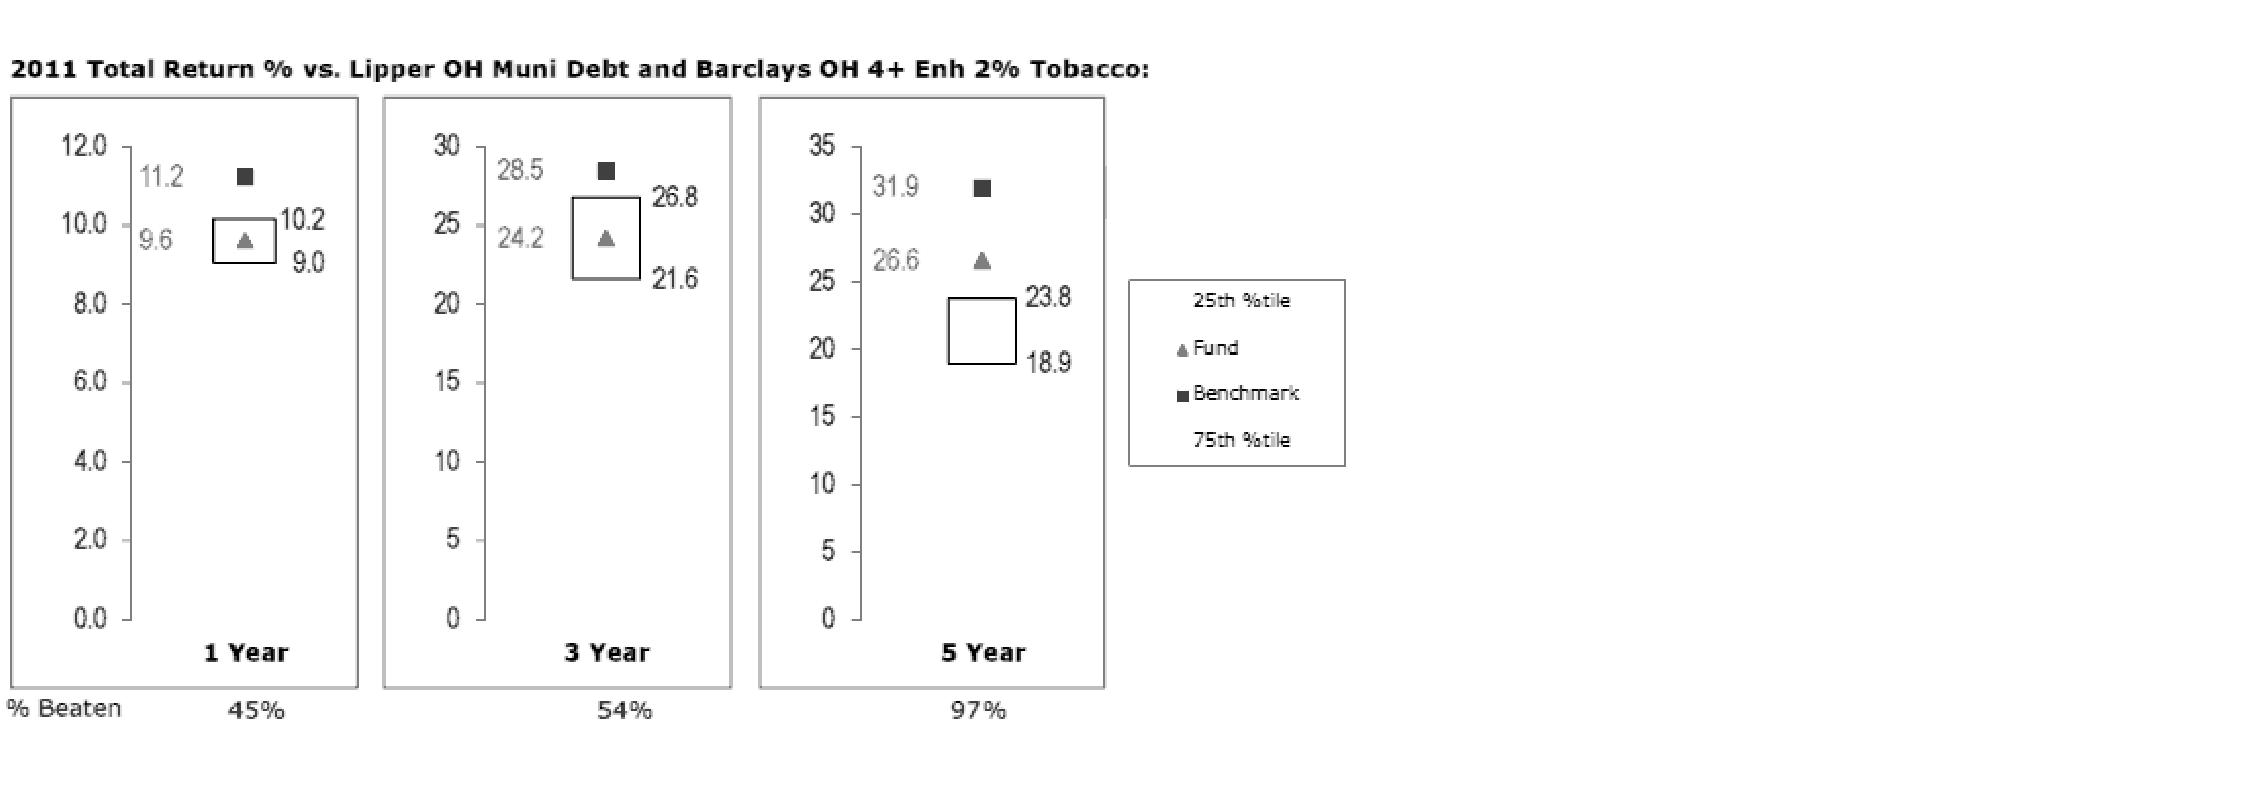
The Board reviewed the fund's relative investment performance against its peer group and noted that the performance of the fund was in the third quartile for the one-year period, the second quartile for the three-year period, and the first quartile for the five-year period. The Board also noted that the investment performance of the fund was lower than its benchmark for all the periods shown. The Board discussed with FMR actions to improve the fund's below-benchmark performance. The Board noted that there was a portfolio management change for the fund in December 2011. The Board also reviewed the fund's performance since inception as well as performance in the current year. The Board will continue to closely monitor the performance of the fund in the coming year and discuss with FMR if other actions to address performance are appropriate.
Annual Report
Board Approval of Investment Advisory Contracts and
Management Fees - continued
Fidelity Ohio Municipal Money Market Fund
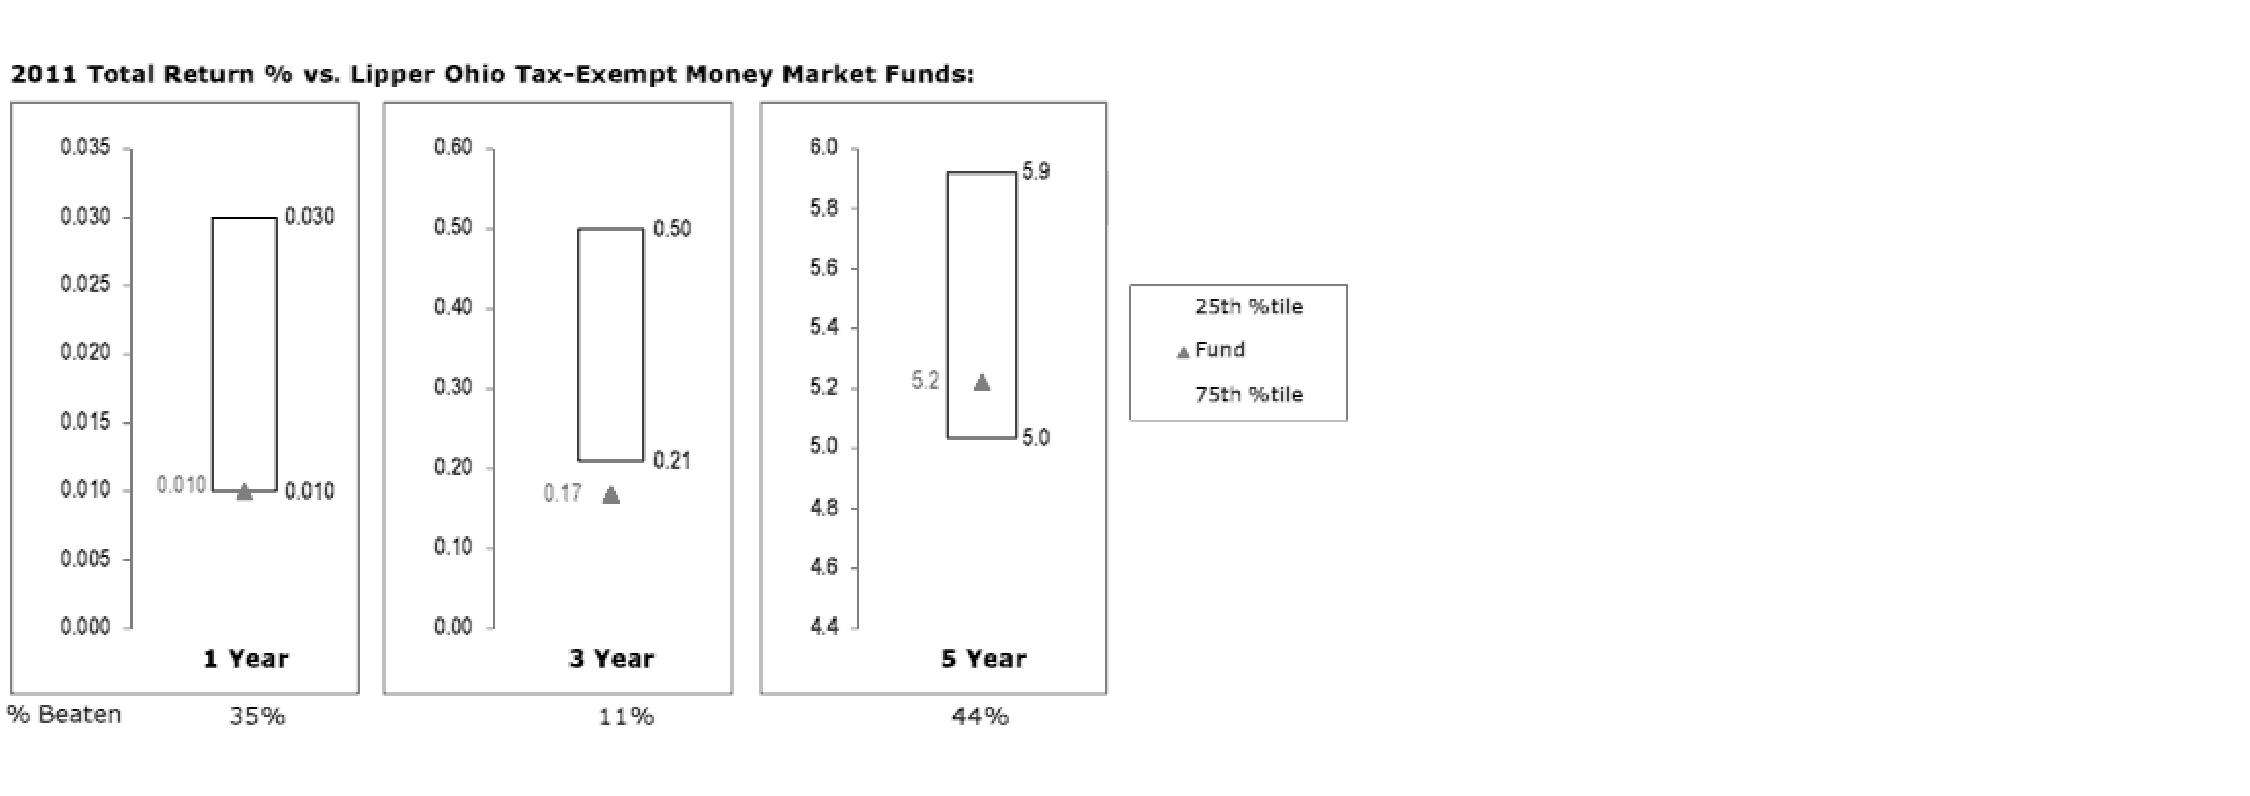
The Board reviewed the fund's relative investment performance against its peer group and noted that the performance of the fund was in the third quartile for the one- and five-year periods and the fourth quartile for the three-year period. The Board considered that FMR had taken steps to provide shareholders with stability of principal and to enhance safety and liquidity, which contributed to the fund's weakened performance relative to its peer group. The Board noted that there was a portfolio management change for the fund in December 2011. The Board also reviewed the fund's performance since inception as well as performance in the current year.
The Board noted as a general matter that the percentage beaten numbers for money market funds in recent years were less meaningful than in earlier years, as many competitors have been waiving fees to maintain a one basis point yield and performance differences among funds may not be apparent due to rounding.
Based on its review, the Board concluded that the nature, extent, and quality of services provided to each fund under the Advisory Contracts should benefit each fund's shareholders.
Competitiveness of Management Fee and Total Expense Ratio. The Board considered each fund's management fee and total expense ratio compared to "mapped groups" of competitive funds and classes. Fidelity creates "mapped groups" by combining similar Lipper investment objective categories that have comparable management fee characteristics. Combining Lipper investment objective categories aids the Board's management fee and total expense ratio comparisons by broadening the competitive group used for comparison and by reducing the number of universes to which various Fidelity funds are compared.
Annual Report
Management Fee. The Board considered two proprietary management fee comparisons for the 12-month periods shown in the charts below. The group of Lipper funds used by the Board for management fee comparisons is referred to below as the "Total Mapped Group" and, for the reasons explained above, is broader than the Lipper peer group used by the Board for performance comparisons. The Total Mapped Group comparison focuses on a fund's standing relative to the total universe of comparable funds available to investors in terms of gross management fees before expense reimbursements or caps. "TMG %" represents the percentage of funds in the Total Mapped Group that had management fees that were lower than a fund's. For example, a TMG % of 38% would mean that 62% of the funds in the Total Mapped Group had higher management fees than a fund. The "Asset-Size Peer Group" (ASPG) comparison focuses on a fund's standing relative to non-Fidelity funds similar in size to the fund within the Total Mapped Group. The ASPG represents at least 15% of the funds in the Total Mapped Group with comparable asset size and management fee characteristics, subject to a minimum of 50 funds (or all funds in the Total Mapped Group if fewer than 50). Additional information, such as the ASPG quartile in which a fund's management fee ranked, is also included in the charts and considered by the Board.
Fidelity Ohio Municipal Income Fund
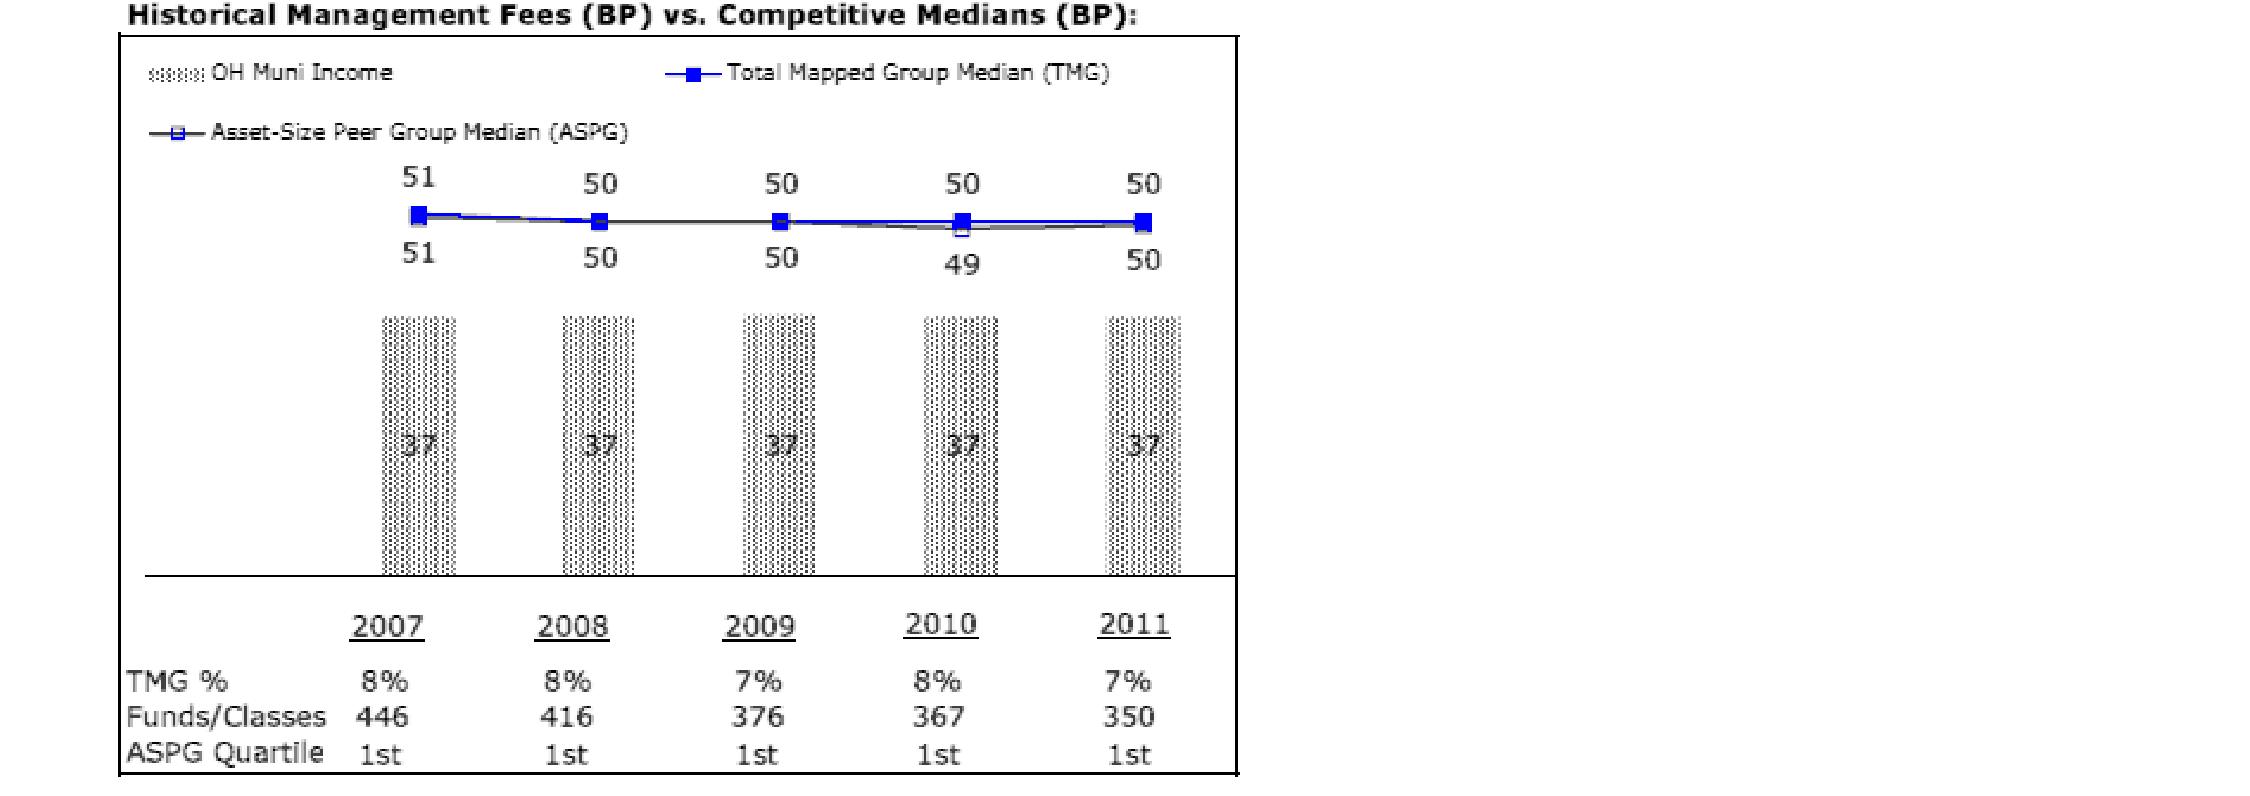
Annual Report
Board Approval of Investment Advisory Contracts and
Management Fees - continued
Fidelity Ohio Municipal Money Market Fund
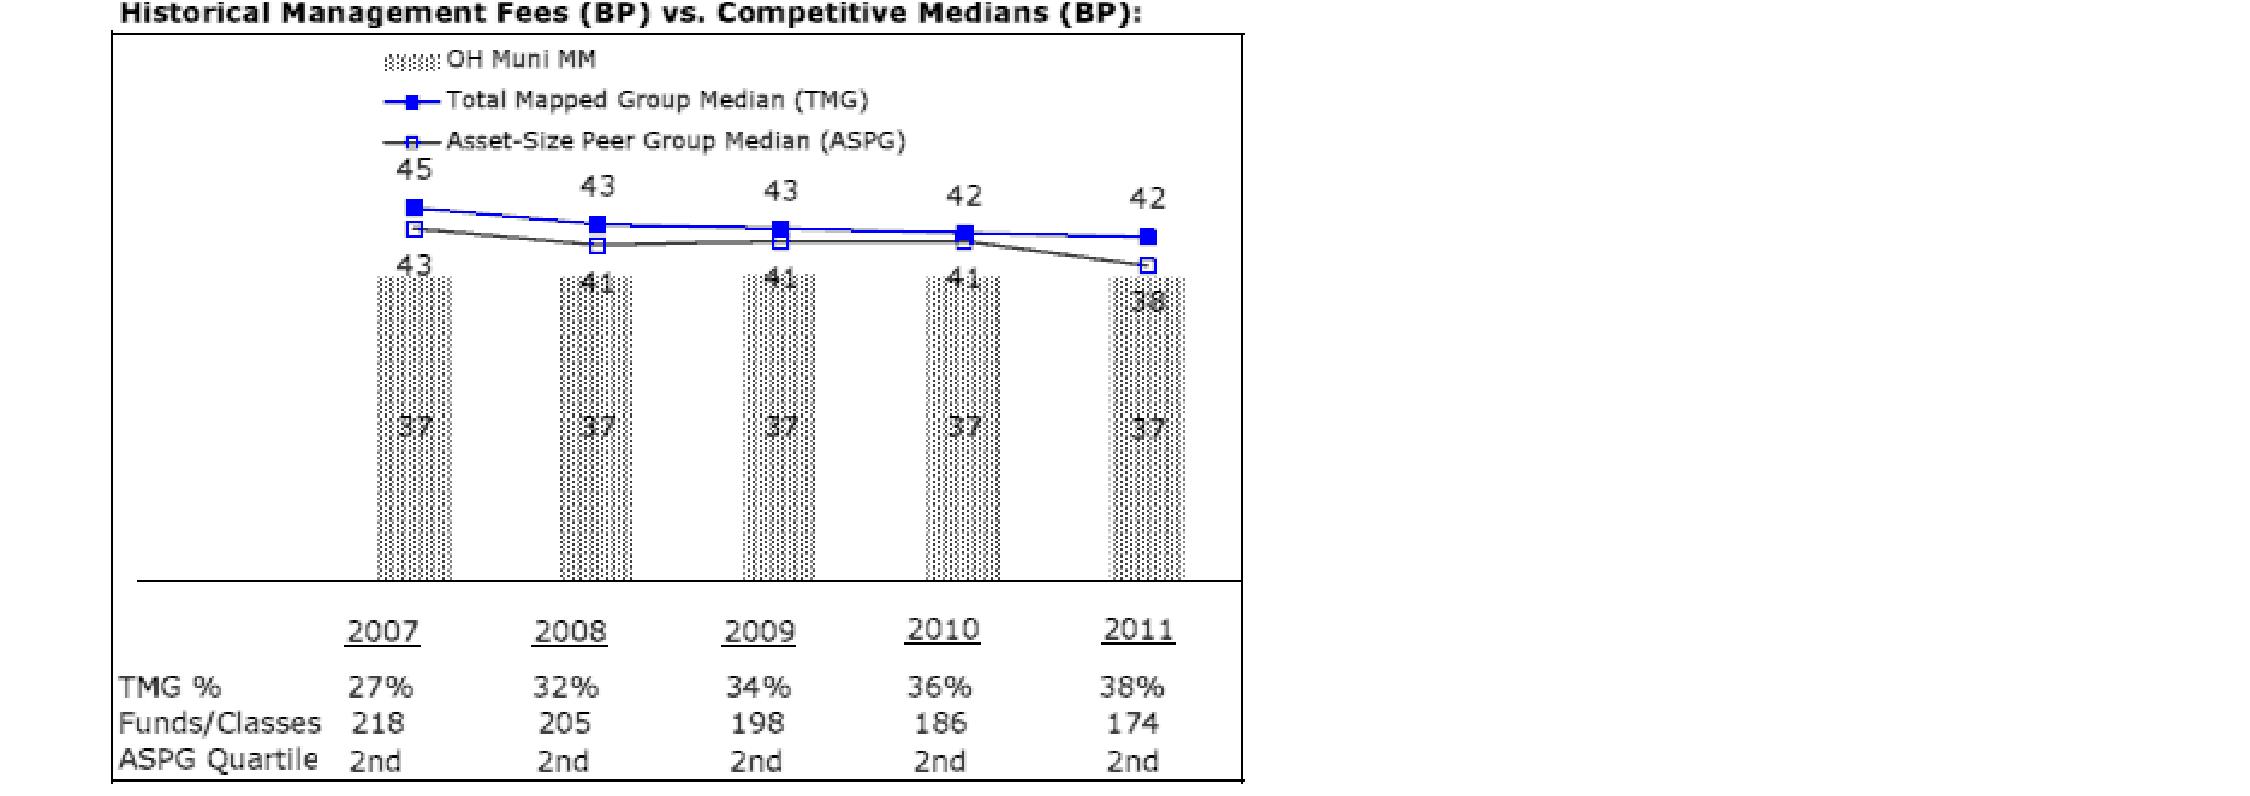
The Board noted that each fund's management fee ranked below the median of its Total Mapped Group and below the median of its ASPG for 2011.
Based on its review, the Board concluded that each fund's management fee is fair and reasonable in light of the services that the fund receives and the other factors considered.
Total Expense Ratio. In its review of each fund's total expense ratio, the Board considered the fund's management fee as well as other fund expenses, such as transfer agent fees, pricing and bookkeeping fees, and custodial, legal, and audit fees. The Board also noted the effects of any waivers and reimbursements on fees and expenses. As part of its review, the Board also considered the current and historical total expense ratios of each fund compared to competitive fund median expenses. Each fund is compared to those funds and classes in the Total Mapped Group (used by the Board for management fee comparisons) that have a similar sales load structure.
The Board noted that each fund's total expense ratio ranked below its competitive median for 2011. The Board considered that Fidelity has been voluntarily waiving part or all of the transfer agent fees and/or management fees to maintain a minimum yield for Fidelity Ohio Municipal Money Market Fund, and also noted that Fidelity retains the ability to be repaid in certain circumstances.
Fees Charged to Other Fidelity Clients. The Board also considered Fidelity fee structures and other information with respect to clients of FMR and its affiliates, such as other mutual funds advised or subadvised by FMR or its affiliates, pension plan clients, and other institutional clients. The Board noted the findings of the 2010 ad hoc joint committee (created with the board of other Fidelity funds), which reviewed and compared Fidelity's institutional investment advisory business with its business of providing services to the Fidelity funds, including the differences in services provided, fees charged, and costs incurred, as well as competition in their respective marketplaces.
Annual Report
Based on its review of total expense ratios and fees charged to other Fidelity clients, the Board concluded that each fund's total expense ratio was reasonable in light of the services that the fund and its shareholders receive and the other factors considered.
Costs of the Services and Profitability. The Board considered the revenues earned and the expenses incurred by Fidelity in conducting the business of developing, marketing, distributing, managing, administering and servicing each fund and its shareholders. The Board also considered the level of Fidelity's profits in respect of all the Fidelity funds.
On an annual basis, FMR presents to the Board Fidelity's profitability for each fund. Fidelity calculates the profitability for each fund, as well as aggregate profitability for groups of Fidelity funds and all Fidelity funds, using a series of detailed revenue and cost allocation methodologies which originate with the books and records of Fidelity on which Fidelity's audited financial statements are based. The Audit Committee of the Board reviews any significant changes from the prior year's methodologies.
PricewaterhouseCoopers LLP (PwC), independent registered public accounting firm and auditor to Fidelity and certain Fidelity funds, has been engaged annually by the Board as part of the Board's assessment of Fidelity's profitability analysis. PwC's engagement includes the review and assessment of Fidelity's methodologies used in determining the revenues and expenses attributable to Fidelity's mutual fund business, and completion of agreed-upon procedures surrounding the mathematical accuracy of fund profitability and its conformity to allocation methodologies. After considering PwC's reports issued under the engagement and information provided by Fidelity, the Board concluded that while other allocation methods may also be reasonable, Fidelity's profitability methodologies are reasonable in all material respects.
The Board also reviewed Fidelity's non-fund businesses and fall-out benefits related to the mutual fund business as well as cases where Fidelity's affiliates may benefit from or be related to the funds' business.
The Board considered the costs of the services provided by and the profits realized by Fidelity in connection with the operation of each fund and was satisfied that the profitability was not excessive in the circumstances.
Economies of Scale. The Board considered whether there have been economies of scale in respect of the management of the Fidelity funds, whether the Fidelity funds (including each fund) have appropriately benefited from any such economies of scale, and whether there is potential for realization of any further economies of scale. The Board considered the extent to which each fund will benefit from economies of scale through increased services to the fund, through waivers or reimbursements, or through fee or expense reductions. The Board also noted that in 2009, it and the board of other Fidelity funds created an ad hoc committee (the Economies of Scale Committee) to analyze whether FMR attains economies of scale in respect of the management and servicing of the Fidelity funds, whether the Fidelity funds have appropriately benefited from such economies of scale, and whether there is potential for realization of any further economies of scale.
Annual Report
Board Approval of Investment Advisory Contracts and
Management Fees - continued
The Board recognized that each fund's management contract incorporates a "group fee" structure, which provides for lower group fee rates as total fund assets under FMR's management increase, and for higher group fee rates as total fund assets under FMR's management decrease. FMR calculates the group fee rates based on a tiered asset "breakpoint" schedule that varies based on asset class. The Board considered that the group fee is designed to deliver the benefits of economies of scale to fund shareholders when total Fidelity fund assets increase, even if assets of any particular fund are unchanged or have declined, because some portion of Fidelity's costs are attributable to services provided to all Fidelity funds, and all funds benefit if those costs can be allocated among more assets. The Board concluded that, given the group fee structure, fund shareholders will benefit from lower management fees as assets under FMR's management increase at the fund complex level, regardless of whether Fidelity achieves any such economies of scale.
The Board concluded, taking into account the analysis of the Economies of Scale Committee, that economies of scale, if any, are being appropriately shared between fund shareholders and Fidelity.
Additional Information Requested by the Board. In order to develop fully the factual basis for consideration of the Fidelity funds' Advisory Contracts, the Board requested and received additional information on certain topics, including: (i) Fidelity's fund profitability methodology, profitability trends for certain funds, and the impact of certain factors on fund profitability results; (ii) portfolio manager changes that have occurred during the past year and the amount of the investment that each portfolio manager has made in the Fidelity fund(s) that he or she manages; (iii) Fidelity's compensation structure for portfolio managers, research analysts, and other key personnel, including its effects on fund profitability, the rationale for the compensation structure, and the extent to which current market conditions have affected retention and recruitment; (iv) the compensation paid to fund sub-advisers on behalf of the Fidelity funds; (v) Fidelity's fee structures, including the group fee structure, and the rationale for recommending different fees among different categories of funds and classes; (vi) Fidelity's voluntary waiver of its fees to maintain minimum yields for certain money market funds and classes as well as contractual waivers in place for certain funds; (vii) regulatory and industry developments, including those affecting money market funds and target date funds, and the potential impact to Fidelity; (viii) Fidelity's transfer agent fees, expenses, and services, and drivers for determining the transfer agent fee structure of different funds and classes; (ix) management fee rates charged by FMR or Fidelity entities to other Fidelity clients; (x) the allocation of and historical trends in Fidelity's realization of fall-out benefits; and (xi) explanations regarding the relative total expense ratios of certain funds and classes, total expense competitive trends, and actions that might be taken by FMR to reduce total expense ratios for certain funds and classes or to achieve further economies of scale.
Annual Report
Based on its evaluation of all of the conclusions noted above, and after considering all factors it believed relevant, the Board ultimately concluded that the advisory fee structures are fair and reasonable, and that each fund's Advisory Contracts should be renewed.
Annual Report
Investment Adviser
Fidelity Management & Research Company
Boston, MA
Investment Sub-Advisers
Fidelity Investments Money
Management, Inc.
Fidelity Management & Research
(Hong Kong) Limited
Fidelity Management & Research
(Japan) Inc.
Fidelity Management & Research
(U.K.) Inc.
General Distributor
Fidelity Distributors Corporation
Smithfield, RI
Transfer and Service Agents
Fidelity Investments Institutional
Operations Company, Inc.
Boston, MA
Citibank, N.A.
New York, NY
Fidelity Service Company, Inc.
Boston, MA
Custodian
Citibank, N.A.
New York, NY
The Fidelity Telephone Connection
Mutual Fund 24-Hour Service
Exchanges/Redemptions
and Account Assistance 1-800-544-6666
Product Information 1-800-544-6666
Retirement Accounts 1-800-544-4774 (8 a.m. - 9 p.m.)
TDD Service 1-800-544-0118
for the deaf and hearing impaired
(9 a.m. - 9 p.m. Eastern time)
Fidelity Automated Service
Telephone (FAST®)
1-800-544-5555
Automated lines for quickest service
(Fidelity Investment logo)(registered trademark)
Corporate Headquarters
82 Devonshire St., Boston, MA 02109
www.fidelity.com
OFF-UANN-0213
1.787739.109
Fidelity®
Pennsylvania Municipal
Income Fund
and
Fidelity
Pennsylvania Municipal
Money Market Fund
Annual Report
December 31, 2012
(Fidelity Cover Art)
Contents
Performance | (Click Here) | How the fund has done over time. |
Management's Discussion of Fund Performance | (Click Here) | The Portfolio Manager's review of fund performance and strategy. |
Shareholder Expense Example | (Click Here) | An example of shareholder expenses. |
Fidelity® Pennsylvania Municipal Income Fund |
Investment Changes | (Click Here) | A summary of major shifts in the fund's investments over the past six months. |
Investments | (Click Here) | A complete list of the fund's investments with their market values. |
Financial Statements | (Click Here) | Statements of assets and liabilities, operations, and changes in net assets, as well as financial highlights. |
Fidelity Pennsylvania Municipal Money Market Fund |
Investment
Changes/Performance | (Click Here) | A summary of major shifts in the fund's investments over the past six months. |
Investments | (Click Here) | A complete list of the fund's investments. |
Financial Statements | (Click Here) | Statements of assets and liabilities, operations, and changes in net assets, as well as financial highlights. |
Notes | (Click Here) | Notes to the financial statements. |
Report of Independent Registered Public Accounting Firm | (Click Here) | |
Trustees and Officers | (Click Here) | |
Distributions | (Click Here) | |
Board Approval of Investment Advisory Contracts and Management Fees | (Click Here) | |
To view a fund's proxy voting guidelines and proxy voting record for the 12-month period ended June 30, visit http://www.fidelity.com/proxyvotingresults or visit the Securities and Exchange Commission's (SEC) web site at http://www.sec.gov. You may also call 1-800-544-8544 to request a free copy of the proxy voting guidelines.
Standard & Poor's, S&P and S&P 500 are registered service marks of The McGraw-Hill Companies, Inc. and have been licensed for use by Fidelity Distributors Corporation.
Other third party marks appearing herein are the property of their respective owners.
All other marks appearing herein are registered or unregistered trademarks or service marks of FMR LLC or an affiliated company. © 2013 FMR LLC. All rights reserved.
Annual Report
This report and the financial statements contained herein are submitted for the general information of the shareholders of the funds. This report is not authorized for distribution to prospective investors in the funds unless preceded or accompanied by an effective prospectus.
A fund files its complete schedule of portfolio holdings with the SEC for the first and third quarters of each fiscal year on Form N-Q. Forms N-Q are available on the SEC's web site at http://www.sec.gov. A fund's Forms N-Q may be reviewed and copied at the SEC's Public Reference Room in Washington, DC. Information regarding the operation of the SEC's Public Reference Room may be obtained by calling 1-800-SEC-0330. For a complete list of a fund's portfolio holdings, view the most recent holdings listing, semiannual report, or annual report on Fidelity's web site at http://www.fidelity.com, http://www.advisor.fidelity.com, or http://www.401k.com, as applicable.
NOT FDIC INSURED • MAY LOSE VALUE • NO BANK GUARANTEE
Neither the funds nor Fidelity Distributors Corporation is a bank.
Annual Report
Fidelity® Pennsylvania Municipal Income Fund
Average annual total return reflects the change in the value of an investment, assuming reinvestment of the fund's distributions from dividend income and capital gains (the profits earned upon the sale of securities that have grown in value, if any) and assuming a constant rate of performance each year. The $10,000 table and the fund's returns do not reflect the deduction of taxes that a shareholder would pay on fund distributions or the redemption of fund shares. During periods of reimbursement by Fidelity, a fund's total return will be greater than it would be had the reimbursement not occurred. How a fund did yesterday is no guarantee of how it will do tomorrow.
Average Annual Total Returns
Periods ended December 31, 2012 | Past 1
year | Past 5
years | Past 10
years |
Fidelity Pennsylvania Municipal Income Fund | 7.13% | 5.48% | 4.74% |
$10,000 Over 10 Years
Let's say hypothetically that $10,000 was invested in Fidelity Pennsylvania Municipal Income Fund on December 31, 2002. The chart shows how the value of your investment would have changed, and also shows how the Barclays® Municipal Bond Index performed over the same period.
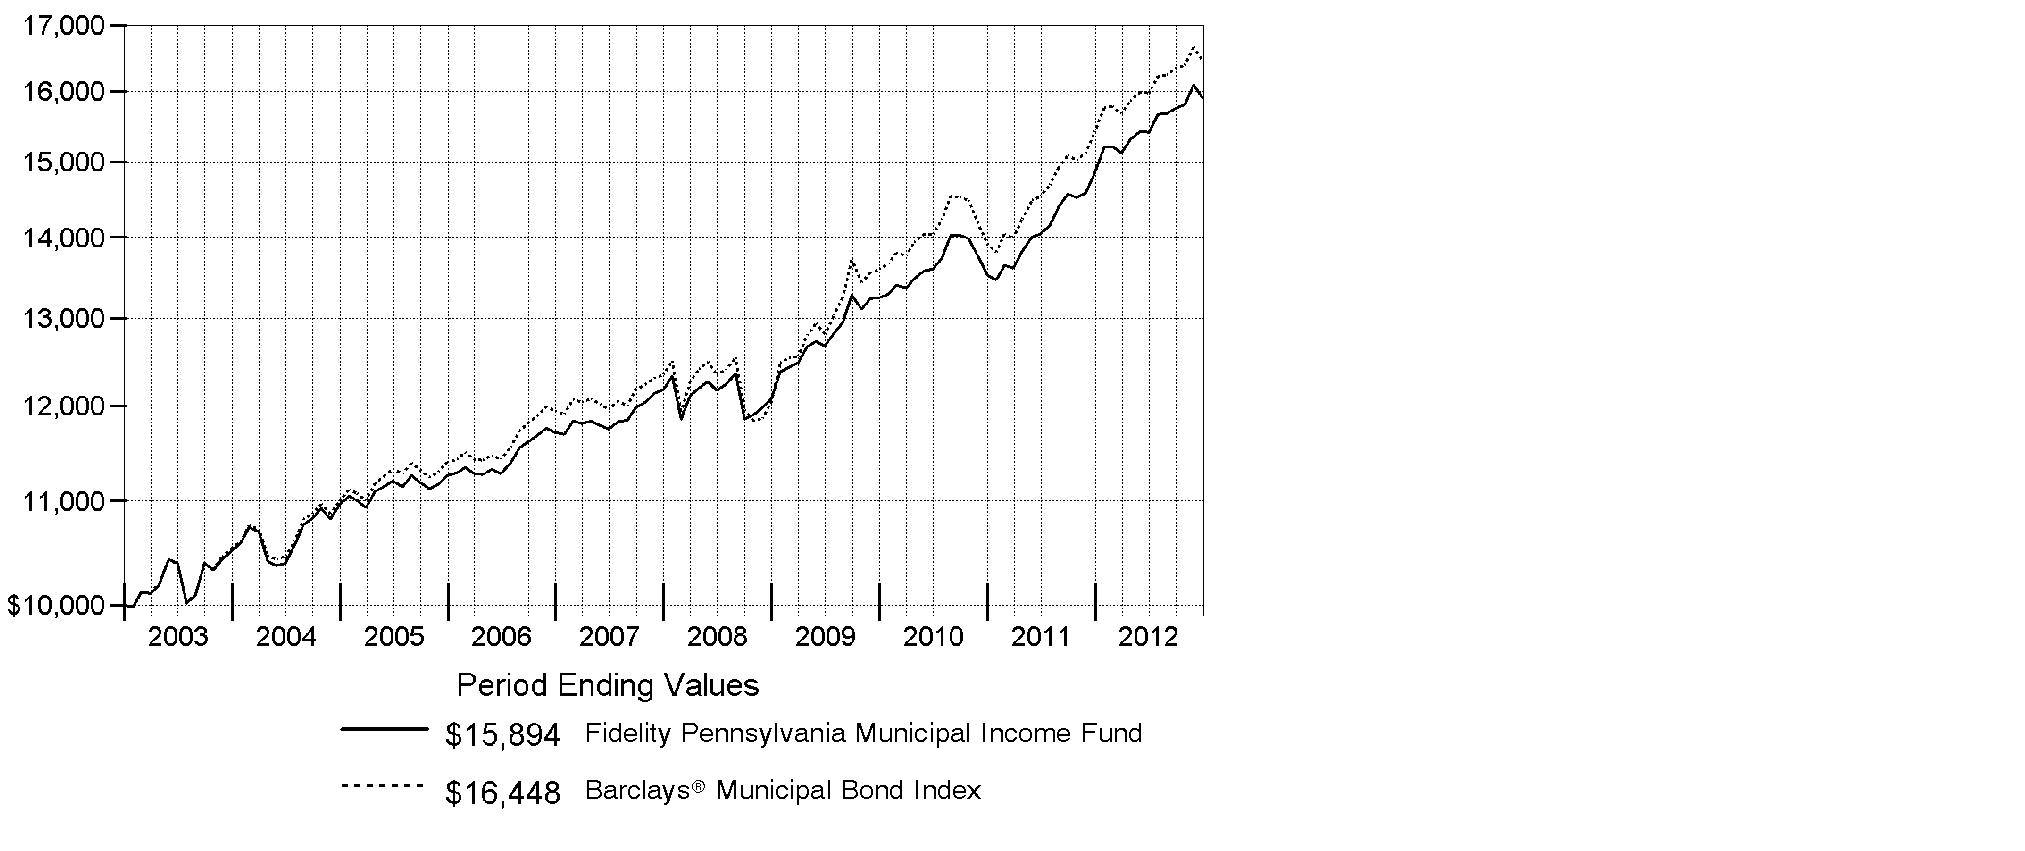
Annual Report
Market Recap: Powered by improving issuer fundamentals and favorable supply and demand, the bull market for municipal bonds rolled on in 2012, with the Barclays® Municipal Bond Index advancing 6.78%. By contrast, taxable investment-grade debt gained 4.21%, as tracked by the Barclays® U.S. Aggregate Bond Index. Muni investors were encouraged by a recovery in tax revenues for many issuers. And despite a handful of well-publicized bankruptcies by local issuers, the overall muni default rate declined and remained low. Even with a surge in refinancings, the overall supply of newly issued muni bonds was muted. As for demand, munis drew heavy interest from investors seeking a yield advantage over U.S. Treasuries, and from those looking for a perceived safe haven amid mixed U.S. economic data and the ongoing financial crisis in Europe. Investors' appetite for tax-advantaged investments in advance of potentially higher federal tax rates in 2013 also fueled demand, particularly in November, while a steady stream of municipal redemptions (calls and maturities), many of which were reinvested in the muni market, competed for limited new supply. The muni market sold off in December due to concern about proposals to limit the federal tax exemption of muni debt, profit-taking in advance of higher capital gains rates, and ratings downgrades of Puerto Rico debt to borderline investment grade.
Comments from Mark Sommer, Portfolio Manager of Fidelity® Pennsylvania Municipal Income Fund: For the year, the fund returned 7.13%, while the Barclays Pennsylvania Enhanced Municipal Bond Index - which tracks the types of securities in which the fund invests - rose 7.07%. Versus the index, the fund's performance was bolstered by our overweighting in both health care and premium coupon callable securities, offsetting the negative impact of out-of-index exposure to Puerto Rico bonds. The overweighting in health care was a plus, thanks largely to investors' prodigious appetite for higher-yielding tax-free securities. The fund's overweighting in premium coupon callable bonds, which carry coupons above prevailing rates and can be redeemed by their issuers before maturity, helped because these securities generally outpaced the index for the year overall. Owning Puerto Rico bonds, which are free from federal and state taxes, detracted from the fund's performance versus the index because the securities underperformed due to worries about the U.S. territory's weak economy and large unfunded pension liability. The bonds suffered a significant sell-off in December, when Moody's downgraded Puerto Rico general obligation (GO) debt - and the debt of several related issuers - to one level above speculative grade.
The views expressed above reflect those of the portfolio manager(s) only through the end of the period as stated on the cover of this report and do not necessarily represent the views of Fidelity or any other person in the Fidelity organization. Any such views are subject to change at any time based upon market or other conditions and Fidelity disclaims any responsibility to update such views. These views may not be relied on as investment advice and, because investment decisions for a Fidelity fund are based on numerous factors, may not be relied on as an indication of trading intent on behalf of any Fidelity fund.
Annual Report
Shareholder Expense Example
As a shareholder of a Fund, you incur two types of costs: (1) transaction costs, including redemption fees and (2) ongoing costs, including management fees and other Fund expenses. This Example is intended to help you understand your ongoing costs (in dollars) of investing in the Funds and to compare these costs with the ongoing costs of investing in other mutual funds.
The Example is based on an investment of $1,000 invested at the beginning of the period and held for the entire period (July 1, 2012 to December 31, 2012).
Actual Expenses
The first line of the accompanying table for each fund provides information about actual account values and actual expenses. You may use the information in this line, together with the amount you invested, to estimate the expenses that you paid over the period. Simply divide your account value by $1,000.00 (for example, an $8,600 account value divided by $1,000.00 = 8.6), then multiply the result by the number in the first line for a fund under the heading entitled "Expenses Paid During Period" to estimate the expenses you paid on your account during this period. A small balance maintenance fee of $12.00 that is charged once a year may apply for certain accounts with a value of less than $2,000. This fee is not included in the table below. If it was, the estimate of expenses you paid during the period would be higher, and your ending account value lower, by this amount. In addition, each Fund, as a shareholder in the underlying Fidelity Central Funds, will indirectly bear its pro-rata share of the fees and expenses incurred by the underlying Fidelity Central Funds. These fees and expenses are not included in the Fund's annualized expense ratio used to calculate the expense estimate in the table below.
Hypothetical Example for Comparison Purposes
The second line of the accompanying table for each fund provides information about hypothetical account values and hypothetical expenses based on a fund's actual expense ratio and an assumed rate of return of 5% per year before expenses, which is not the Fund's actual return. The hypothetical account values and expenses may not be used to estimate the actual ending account balance or expenses you paid for the period. You may use this information to compare the ongoing costs of investing in the Fund and other funds. To do so, compare this 5% hypothetical example with the 5% hypothetical examples that appear in the shareholder reports of the other funds. A small balance maintenance fee of $12.00 that is charged once a year may apply for certain accounts with a value of less than $2,000. This fee is not included in the table below. If it was, the estimate of expenses you paid during the period would be higher, and your ending account value lower, by this amount. In addition, each Fund, as a shareholder in the underlying Fidelity Central Funds, will indirectly bear its pro-rata share of the fees and expenses incurred by the underlying Fidelity Central Funds. These fees and expenses are not included in the Fund's annualized expense ratio used to calculate the expense estimate in the table below.
Please note that the expenses shown in the table are meant to highlight your ongoing costs only and do not reflect any transaction costs. Therefore, the second line of the table is useful in comparing ongoing costs only, and will not help you determine the relative total costs of owning different funds. In addition, if these transactional costs were included, your costs would have been higher.
Annual Report
Shareholder Expense Example - continued
| Annualized
Expense Ratio | Beginning
Account Value
July 1, 2012 | Ending
Account Value
December 31, 2012 | Expenses Paid
During Period*
July 1, 2012
to December 31, 2012 |
Fidelity Pennsylvania Municipal Income Fund | .48% | | | |
Actual | | $ 1,000.00 | $ 1,031.50 | $ 2.45 |
HypotheticalA | | $ 1,000.00 | $ 1,022.72 | $ 2.44 |
Fidelity Pennsylvania Municipal Money Market Fund | .18% | | | |
Actual | | $ 1,000.00 | $ 1,000.10 | $ .90** |
HypotheticalA | | $ 1,000.00 | $ 1,024.23 | $ .92** |
A 5% return per year before expenses
* Expenses are equal to each Fund's annualized expense ratio, multiplied by the average account value over the period, multiplied by 184/366 (to reflect the one-half year period).
** If certain fees were not voluntarily waived by Fidelity Management & Research Company (FMR) or its affiliates during the period, the annualized expense ratio for Fidelity Pennsylvania Municipal Money Market Fund would have been 0.50% and the expenses paid in the actual and hypothetical examples above would have been $2.51 and $2.54, respectively.
Annual Report
Fidelity Pennsylvania Municipal Income Fund
Investment Changes (Unaudited)
Top Five Sectors as of December 31, 2012 |
| % of fund's
net assets | % of fund's net assets
6 months ago |
General Obligations | 29.8 | 32.7 |
Health Care | 20.1 | 17.3 |
Education | 15.1 | 11.9 |
Transportation | 9.5 | 9.7 |
Electric Utilities | 7.6 | 7.6 |
Weighted Average Maturity as of December 31, 2012 |
| | 6 months ago |
Years | 6.0 | 5.8 |
This is a weighted average of all the maturities of the securities held in a fund. Weighted Average Maturity (WAM) can be used as a measure of sensitivity to interest rate changes and market changes. Generally, the longer the maturity, the greater the sensitivity to such changes. WAM is based on the dollar-weighted average length of time until principal payments must be paid. Depending on the types of securities held in a fund, certain maturity shortening devices (e.g., demand features, interest rate resets, and call options) may be taken into account when calculating the WAM. |
Duration as of December 31, 2012 |
| | 6 months ago |
Years | 6.7 | 6.9 |
Duration estimates how much a bond fund's price will change with a change in comparable interest rates. If rates rise 1%, for example, a fund with a 5-year duration is likely to lose about 5% of its value. Other factors also can influence a bond fund's performance and share price. Accordingly, a bond fund's actual performance may differ from this example. Duration takes into account any call or put option embedded in the bonds. |
Quality Diversification (% of fund's net assets) |
As of December 31, 2012 | As of June 30, 2012 |
 | AAA 0.7% | | | AAA 0.1% | |
 | AA,A 83.8% | | | AA,A 83.0% | |
 | BBB 10.2% | | | BBB 9.9% | |
 | BB and Below 0.6% | | | BB and Below 0.6% | |
 | Not Rated 0.9% | | | Not Rated 0.9% | |
 | Short-Term
Investments and
Net Other Assets
(Liabilities) 3.8% | | | Short-Term
Investments and
Net Other Assets
(Liabilities) 5.5% | |

We have used ratings from Moody's Investors Service, Inc. Where Moody's® ratings are not available, we have used S&P® ratings. All ratings are as of the date indicated and do not reflect subsequent changes. |
Annual Report
Fidelity Pennsylvania Municipal Income Fund
Investments December 31, 2012
Showing Percentage of Net Assets
Municipal Bonds - 96.3% |
| Principal Amount | | Value |
Guam - 0.2% |
Guam Pwr. Auth. Rev. Series 2012 A, 5% 10/1/24 (FSA Insured) | | $ 900,000 | | $ 1,048,554 |
New Jersey/Pennsylvania - 1.5% |
Delaware River Joint Toll Bridge Commission Pennsylvania-New Jersey Bridge Rev.: | | | | |
Series 2012 A: | | | | |
5% 7/1/22 | | 500,000 | | 610,710 |
5% 7/1/23 | | 1,000,000 | | 1,209,140 |
Series A, 5% 7/1/27 (Nat'l. Pub. Fin. Guarantee Corp. Insured) | | 1,425,000 | | 1,570,364 |
Delaware River Port Auth. Pennsylvania & New Jersey Rev. Series 2010 D, 5% 1/1/30 | | 3,500,000 | | 3,959,760 |
| | 7,349,974 |
Pennsylvania - 94.0% |
Adams County Indl. Dev. Auth. Rev. (Gettysburg College Proj.) Series 2010, 5% 8/15/24 | | 1,000,000 | | 1,147,670 |
Allegheny County Arpt. Auth. Rev.: | | | | |
(Pittsburg Int'l. Arpt. Proj.) Series B, 5% 1/1/16 (Nat'l. Pub. Fin. Guarantee Corp. Insured) (b) | | 2,545,000 | | 2,770,283 |
Series 2006 B: | | | | |
5% 1/1/21 (FGIC Insured) (b) | | 3,190,000 | | 3,645,245 |
5% 1/1/22 (Nat'l. Pub. Fin. Guarantee Corp. Insured) (b) | | 1,650,000 | | 1,888,788 |
Allegheny County Arpt. Rev. (Pittsburgh Int'l. Arpt. Proj.) Series A1, 5.75% 1/1/14 (Nat'l. Pub. Fin. Guarantee Corp. Insured) (b) | | 3,000,000 | | 3,125,040 |
Allegheny County Higher Ed. Bldg. Auth. Series 2012 A, 5% 3/1/24 | | 4,000,000 | | 4,876,080 |
Allegheny County Hosp. Dev. Auth. Rev.: | | | | |
(Pittsburgh Med. Ctr. Proj.) Series A, 5% 9/1/14 | | 2,525,000 | | 2,715,461 |
(Univ. of Pittsburgh Med. Ctr. Proj.) Series 2009 A, 5% 8/15/21 | | 2,000,000 | | 2,321,520 |
Allegheny County Port Auth. Spl. Rev. 5% 3/1/17 | | 2,000,000 | | 2,273,340 |
Allegheny County Sanitation Auth. Swr. Rev.: | | | | |
Series 2010, 5% 6/1/40 (FSA Insured) | | 6,690,000 | | 7,460,956 |
Series A, 5% 12/1/30 (Nat'l. Pub. Fin. Guarantee Corp. Insured) | | 1,725,000 | | 1,880,181 |
Annville-Cleona School District Series 2005: | | | | |
6% 3/1/28 (FSA Insured) | | 1,500,000 | | 1,653,255 |
6% 3/1/31 (FSA Insured) | | 1,975,000 | | 2,168,767 |
Municipal Bonds - continued |
| Principal Amount | | Value |
Pennsylvania - continued |
Beaver County Indl. Dev. Auth. Poll. Cont. Rev. Bonds (FirstEnergy Nuclear Generation Corp. Proj.) Series 2008 A, 2.7%, tender 4/2/18 (a) | | $ 3,000,000 | | $ 3,013,080 |
Berks County Muni. Auth. Rev.: | | | | |
(Reading Hosp. & Med. Ctr. Proj.) Series 2009 A3, 5.25% 11/1/18 | | 3,000,000 | | 3,575,340 |
Series 2012 A, 5% 11/1/40 | | 3,590,000 | | 3,972,945 |
Bucks County Cmnty. College Auth. College Bldg. Rev. 5% 6/15/28 | | 250,000 | | 291,755 |
Bucks County Wtr. & Swr. Auth. Sys. Rev. Series 2006, 5% 6/1/15 (FSA Insured) | | 1,785,000 | | 1,950,880 |
Butler County Hosp. Auth. Hosp. Rev. (Butler Health Sys. Proj.) Series 2009 B, 7.125% 7/1/29 | | 1,035,000 | | 1,310,972 |
Centennial School District: | | | | |
Series 2010 A, 5% 12/15/30 | | 3,000,000 | | 3,609,360 |
Series A, 5.25% 12/15/37 (FSA Insured) | | 5,000,000 | | 5,900,700 |
Central Bradford Prog. Auth. Rev. Series 2011, 5.375% 12/1/41 | | 2,000,000 | | 2,276,600 |
Centre County Hosp. Auth. Rev. (Mount Nittany Med. Ctr. Proj.) Series 2011, 7% 11/15/46 | | 2,000,000 | | 2,575,260 |
Chambersburg Area School District Series 2007: | | | | |
5.25% 3/1/26 (Nat'l. Pub. Fin. Guarantee Corp. Insured) | | 2,000,000 | | 2,213,500 |
5.25% 3/1/27 (Nat'l. Pub. Fin. Guarantee Corp. Insured) | | 2,000,000 | | 2,210,160 |
5.25% 3/1/29 (Nat'l. Pub. Fin. Guarantee Corp. Insured) | | 3,600,000 | | 3,973,284 |
Cumberland County Muni. Auth. Rev. (Dickinson College Proj.) Series 2012: | | | | |
5% 11/1/37 | | 1,520,000 | | 1,696,046 |
5% 11/1/42 | | 3,000,000 | | 3,331,710 |
Dauphin County Gen. Auth. (Pinnacle Health Sys. Proj.) Series 2009 A, 5.25% 6/1/17 | | 3,000,000 | | 3,331,680 |
Delaware County Auth. College Rev. (Haverford College Proj.) Series 2010 A, 5% 11/15/31 | | 4,090,000 | | 4,717,897 |
Delaware County Auth. Univ. Rev.: | | | | |
Series 2010, 5.25% 12/1/31 | | 2,450,000 | | 2,812,992 |
Series 2012: | | | | |
5% 8/1/21 | | 350,000 | | 426,503 |
5% 8/1/22 | | 300,000 | | 366,942 |
Municipal Bonds - continued |
| Principal Amount | | Value |
Pennsylvania - continued |
East Stroudsburg Area School District: | | | | |
Series 2007 A: | | | | |
7.5% 9/1/22 (Nat'l. Pub. Fin. Guarantee Corp. Insured) | | $ 1,000,000 | | $ 1,277,780 |
7.75% 9/1/27 (Nat'l. Pub. Fin. Guarantee Corp. Insured) | | 8,200,000 | | 10,399,896 |
Series 2007, 7.75% 9/1/28 (Pre-Refunded to 9/1/16 @ 100) | | 2,750,000 | | 3,455,843 |
Easton Area School District Series 2006: | | | | |
7.5% 4/1/22 (FSA Insured) | | 2,700,000 | | 3,240,108 |
7.75% 4/1/25 (FSA Insured) | | 395,000 | | 475,604 |
7.75% 4/1/25 (FSA Insured) (Pre-Refunded to 4/1/16 @ 100) | | 480,000 | | 590,184 |
Econ. Dev. Fin. Auth. Unemployment Compensation Rev. Series 2012 B, 5% 7/1/23 | | 2,600,000 | | 2,870,894 |
Erie County Hosp. Auth. Rev. (Saint Vincent Health Ctr. Proj.) Series 2010 A, 7% 7/1/27 | | 2,750,000 | | 3,030,610 |
Franklin County Indl. Dev. Auth. (The Chambersburg Hosp. Proj.) Series 2010: | | | | |
5.3% 7/1/30 | | 1,770,000 | | 1,992,011 |
5.375% 7/1/42 | | 2,130,000 | | 2,329,496 |
Kennett Consolidated School District Series A, 5.25% 2/15/15 (FGIC Insured) | | 705,000 | | 709,040 |
Lancaster County Hosp. Auth. Health Ctr. Rev. (Masonic Homes Proj.) Series 2006, 5% 11/1/20 | | 1,065,000 | | 1,177,911 |
Luzerne County Indl. Dev. Auth. Wtr. Facilities Rev. (Pennsylvania-American Wtr. Co. Proj.) Series 2009, 5.5% 12/1/39 | | 2,500,000 | | 2,784,925 |
Lycoming County Auth. Health Sys. Rev. (Susquehanna Health Sys.) Series 2009 A, 5.5% 7/1/21 | | 3,500,000 | | 4,043,900 |
Mifflin County School District Series 2007: | | | | |
7.5% 9/1/26 (XL Cap. Assurance, Inc. Insured) | | 1,125,000 | | 1,392,075 |
7.75% 9/1/30 (XL Cap. Assurance, Inc. Insured) | | 1,175,000 | | 1,452,782 |
Monroe County Hosp. Auth. Rev.: | | | | |
(Pocono Med. Ctr. Proj.) Series 2012 A, 5% 1/1/32 | | 1,400,000 | | 1,521,380 |
(Ponco Med. Ctr. Proj.) Series 2012 A, 5% 1/1/41 | | 1,750,000 | | 1,875,615 |
Monroeville Fin. Auth. UPMC Rev. Series 2012: | | | | |
5% 2/15/26 | | 1,500,000 | | 1,769,625 |
5% 2/15/27 | | 3,625,000 | | 4,279,711 |
Montgomery County Indl. Dev. Series 2012 A, 5% 10/1/41 | | 5,000,000 | | 5,467,700 |
Municipal Bonds - continued |
| Principal Amount | | Value |
Pennsylvania - continued |
Montgomery County Higher Ed. & Health Auth. Hosp. Rev. (Abington Memorial Hosp. Proj.): | | | | |
Series 2009 A, 5% 6/1/17 | | $ 2,000,000 | | $ 2,286,460 |
Series 2012 A: | | | | |
5% 6/1/23 | | 3,850,000 | | 4,518,399 |
5% 6/1/24 | | 1,500,000 | | 1,746,960 |
Series A, 6% 6/1/16 (AMBAC Insured) | | 1,000,000 | | 1,153,650 |
Montgomery County Higher Ed. & Health Auth. Rev. (Dickinson College Proj.) Series 2006 FF1, 5% 5/1/28 (CDC IXIS Finl. Guaranty Insured) | | 900,000 | | 967,158 |
Mount Lebanon School District Series 2009 A, 5% 2/15/15 | | 500,000 | | 543,595 |
North Hampton County Gen. Purp. Auth. Hosp. Rev. (St. Luke's Hosp. Proj.) Series 2010 A: | | | | |
5.25% 8/15/16 | | 1,245,000 | | 1,389,047 |
5.25% 8/15/18 | | 1,450,000 | | 1,642,981 |
Northampton County Gen. Oblig. Series 2012 B: | | | | |
5% 10/1/23 | | 1,000,000 | | 1,256,260 |
5% 10/1/25 | | 2,500,000 | | 3,100,800 |
5% 10/1/26 | | 2,500,000 | | 3,083,550 |
Oxford Area School District Series 2007 D: | | | | |
5.375% 2/1/27 (Nat'l. Pub. Fin. Guarantee Corp. Insured) | | 795,000 | | 877,195 |
5.375% 2/1/27 (Pre-Refunded to 8/1/15 @ 100) | | 995,000 | | 1,118,669 |
Pennsylvania Econ. Dev. Auth. Governmental Lease (Forum Place Proj.) Series 2012: | | | | |
5% 3/1/24 | | 1,745,000 | | 2,056,256 |
5% 3/1/25 | | 3,255,000 | | 3,815,478 |
Pennsylvania Econ. Dev. Fing. Auth. Exempt Facilities Rev. Bonds (PPL Energy Supply LLC Proj.) Series 2009 A, 3%, tender 9/1/15 (a) | | 2,000,000 | | 2,077,340 |
Pennsylvania Econ. Dev. Fing. Auth. Health Sys. Rev. (Albert Einstein Med. Ctr. Proj.) Series 2009 A, 5.25% 10/15/15 | | 2,000,000 | | 2,146,780 |
Pennsylvania Econ. Dev. Fing. Auth. Solid Waste Disp. Rev. Bonds (Waste Mgmt., Inc. Proj.) Series 2009, 1.75%, tender 12/1/15 (a) | | 4,000,000 | | 3,988,720 |
Pennsylvania Gen. Oblig.: | | | | |
First Series 2007 A, 5% 11/1/23 | | 9,710,000 | | 11,444,588 |
First Series 2008, 5% 5/15/27 | | 805,000 | | 935,241 |
First Series 2009, 5% 3/15/27 | | 3,000,000 | | 3,601,410 |
First Series 2011: | | | | |
5% 11/15/24 | | 5,000,000 | | 6,153,400 |
Municipal Bonds - continued |
| Principal Amount | | Value |
Pennsylvania - continued |
Pennsylvania Gen. Oblig.: - continued | | | | |
First Series 2011: | | | | |
5% 11/15/25 | | $ 4,000,000 | | $ 4,897,400 |
Second Series 2005, 5% 1/1/25 | | 9,900,000 | | 10,983,753 |
Second Series 2007 A, 5% 8/1/25 | | 2,500,000 | | 2,909,525 |
Second Series 2009: | | | | |
5% 4/15/25 | | 500,000 | | 603,840 |
5% 4/15/28 | | 5,000,000 | | 5,985,400 |
Pennsylvania Higher Edl. Facilities Auth. Rev.: | | | | |
(Slippery Rock Univ. Proj.) Series 2007 A, 5% 7/1/39 (XL Cap. Assurance, Inc. Insured) | | 2,500,000 | | 2,587,300 |
(Thomas Jefferson Univ. Proj.) Series 2012: | | | | |
5% 3/1/18 | | 250,000 | | 292,190 |
5% 3/1/20 | | 300,000 | | 360,183 |
5% 3/1/22 | | 275,000 | | 333,968 |
5% 3/1/23 | | 585,000 | | 709,225 |
5% 3/1/42 | | 2,950,000 | | 3,309,871 |
(Univ. of Pennsylvania Health Sys. Proj.): | | | | |
Series 2005 A, 5% 8/15/17 (AMBAC Insured) | | 3,000,000 | | 3,309,630 |
Series 2009 A, 5.25% 8/15/22 | | 2,655,000 | | 3,176,123 |
Series 2011 A, 5.75% 8/15/41 | | 4,980,000 | | 5,823,014 |
First Series 2012, 5% 4/1/20 | | 750,000 | | 901,523 |
First Series: | | | | |
5% 4/1/21 | | 500,000 | | 605,405 |
5% 4/1/22 | | 600,000 | | 732,486 |
5% 4/1/23 | | 800,000 | | 970,712 |
5% 4/1/24 | | 1,100,000 | | 1,327,645 |
Series 2010 E, 5% 5/15/31 | | 2,500,000 | | 2,763,675 |
Series 2010: | | | | |
5% 9/1/30 | | 1,150,000 | | 1,353,596 |
5% 9/1/31 | | 1,025,000 | | 1,201,782 |
Series 2011 A, 5% 9/1/41 | | 2,000,000 | | 2,292,160 |
Pennsylvania State Univ.: | | | | |
Series 2005, 5% 9/1/29 | | 1,550,000 | | 1,699,777 |
Series 2008 A, 5% 8/15/29 | | 3,945,000 | | 4,397,531 |
Series 2010: | | | | |
5% 3/1/22 | | 2,640,000 | | 3,128,954 |
5% 3/1/40 | | 3,635,000 | | 4,048,045 |
Pennsylvania Tpk. Commission Oil Franchise Tax Rev. Series 2003 C, 5% 12/1/29 (Nat'l. Pub. Fin. Guarantee Corp. Insured) | | 3,000,000 | | 3,365,700 |
Municipal Bonds - continued |
| Principal Amount | | Value |
Pennsylvania - continued |
Pennsylvania Tpk. Commission Tpk. Rev.: | | | | |
Series 2006 A: | | | | |
5% 12/1/23 (AMBAC Insured) | | $ 7,695,000 | | $ 8,624,710 |
5% 12/1/25 (AMBAC Insured) | | 7,345,000 | | 8,195,992 |
5% 12/1/26 (AMBAC Insured) | | 3,500,000 | | 3,896,865 |
Series 2008 B1, 5.5% 6/1/33 | | 4,000,000 | | 4,612,160 |
Series 2008 C4, 6.25% 6/1/38 (Assured Guaranty Corp. Insured) | | 2,000,000 | | 2,432,480 |
Philadelphia Auth. Indl. Dev. Lease Rev. Series 2007 A, 5% 10/1/13 (Nat'l. Pub. Fin. Guarantee Corp. Insured) | | 1,500,000 | | 1,539,675 |
Philadelphia Gas Works Rev.: | | | | |
(1975 Gen. Ordinance Proj.): | | | | |
Eighteenth Series: | | | | |
5.25% 8/1/17 (Assured Guaranty Corp. Insured) | | 1,500,000 | | 1,591,080 |
5.25% 8/1/19 (Assured Guaranty Corp. Insured) | | 1,000,000 | | 1,056,850 |
5.25% 8/1/20 (Assured Guaranty Corp. Insured) | | 1,000,000 | | 1,053,480 |
Seventeenth Series, 5.375% 7/1/20 (FSA Insured) | | 2,700,000 | | 2,749,842 |
(1998 Gen. Ordinance Proj.): | | | | |
Fifth Series A1: | | | | |
5% 9/1/33 (FSA Insured) | | 2,800,000 | | 2,889,376 |
5.25% 9/1/17 (Assured Guaranty Corp. Insured) | | 3,665,000 | | 3,896,042 |
5.25% 9/1/18 (Assured Guaranty Corp. Insured) | | 3,340,000 | | 3,542,604 |
Ninth Series, 5.25% 8/1/40 | | 5,595,000 | | 6,002,652 |
Seventh Series, 5% 10/1/37 (AMBAC Insured) | | 5,245,000 | | 5,466,864 |
Philadelphia Gen. Oblig.: | | | | |
Series 2008 A, 5.25% 12/15/32 (FSA Insured) | | 6,000,000 | | 6,664,620 |
Series 2008 B, 7.125% 7/15/38 (Assured Guaranty Corp. Insured) | | 3,550,000 | | 4,087,222 |
Philadelphia Hospitals & Higher Ed. Facilities Auth. Health Systems Rev. (Jefferson Health Sys. Proj.) Series 2010 B, 5.25% 5/15/30 | | 4,000,000 | | 4,525,600 |
Philadelphia Hospitals & Higher Ed. Facilities Auth. Hosp. Rev. (Children's Hosp. of Philadelphia Proj.) Series 2011 D, 5% 7/1/32 | | 2,500,000 | | 2,896,725 |
Philadelphia Redev. Auth. Rev.: | | | | |
(Philadelphia Neighborhood Transformation Initiative Proj.) Series 2005 C, 5% 4/15/31 (Nat'l. Pub. Fin. Guarantee Corp. Insured) | | 1,000,000 | | 1,042,150 |
Series 2012: | | | | |
5% 4/15/21 | | 1,000,000 | | 1,189,200 |
5% 4/15/25 | | 2,230,000 | | 2,598,686 |
Municipal Bonds - continued |
| Principal Amount | | Value |
Pennsylvania - continued |
Philadelphia School District: | | | | |
Series 2005 A, 5% 8/1/22 (AMBAC Insured) | | $ 2,900,000 | | $ 3,094,619 |
Series 2005 D, 5.5% 6/1/16 (FSA Insured) | | 2,030,000 | | 2,317,712 |
Series 2010 C, 5% 9/1/21 | | 4,000,000 | | 4,680,760 |
Philadelphia Wtr. & Wastewtr. Rev.: | | | | |
Series 2010 C, 5% 8/1/40 (FSA Insured) | | 4,000,000 | | 4,500,880 |
Series 2011 A, 5% 1/1/41 | | 2,715,000 | | 3,018,754 |
Pittsburgh & Allegheny County Sports & Exhibition Auth. Series 2012, 5% 2/1/25 (FSA Insured) | | 2,250,000 | | 2,652,818 |
Pittsburgh Gen. Oblig.: | | | | |
Series 2006 B: | | | | |
5.25% 9/1/15 (FSA Insured) | | 2,000,000 | | 2,226,320 |
5.25% 9/1/16 (FSA Insured) | | 3,000,000 | | 3,423,120 |
Series 2012 A, 5% 9/1/22 | | 2,000,000 | | 2,383,080 |
Pittsburgh School District Series 2012 A, 5% 9/1/21 (FSA Insured) | | 4,000,000 | | 4,882,000 |
Pittsburgh Wtr. & Swr. Auth. Wtr. & Swr. Sys. Rev. Series 1993 A: | | | | |
6.5% 9/1/13 (Escrowed to Maturity) | | 1,670,000 | | 1,738,153 |
6.5% 9/1/13 (FGIC Insured) | | 1,875,000 | | 1,930,088 |
South Fork Muni. Auth. Hosp. Rev. (Conemaugh Health Sys. Proj.) Series 2010, 5.25% 7/1/23 | | 1,000,000 | | 1,114,450 |
Southcentral Pennsylvania Gen. Auth. Rev. (WellSpan Health Obligated Group Proj.) Series 2008 A, 6% 6/1/25 | | 2,500,000 | | 2,916,600 |
Southeastern Pennsylvania Trans. Auth. Rev. Series 2010, 5% 3/1/16 | | 1,500,000 | | 1,676,610 |
State Pub. School Bldg. Auth. College Rev.: | | | | |
(Delaware County Cmnty. College Proj.) Series 2008, 5% 10/1/20 (FSA Insured) | | 1,000,000 | | 1,154,480 |
(Montgomery County Cmnty. College Proj.)Series 2008: | | | | |
5% 5/1/27 (FSA Insured) | | 1,775,000 | | 1,980,829 |
5% 5/1/28 (FSA Insured) | | 1,000,000 | | 1,112,800 |
Unionville-Chadds Ford School District Gen. Oblig. Series 2009 A, 5% 6/1/32 | | 3,000,000 | | 3,513,150 |
Univ. of Pittsburgh Commonwealth Sys. of Higher Ed. (Univ. Cap. Proj.): | | | | |
Series 2000 B, 5.25% 9/15/34 | | 2,000,000 | | 2,314,440 |
Series 2000 C, 5% 9/15/35 | | 2,000,000 | | 2,268,220 |
Series 2007 B, 5.25% 9/15/28 | | 2,500,000 | | 2,958,650 |
Series 2009 A, 5% 9/15/16 | | 1,150,000 | | 1,325,145 |
Municipal Bonds - continued |
| Principal Amount | | Value |
Pennsylvania - continued |
Univ. of Pittsburgh Commonwealth Sys. of Higher Ed. (Univ. Cap. Proj.): - continued | | | | |
Series 2009 B: | | | | |
5% 9/15/28 | | $ 2,000,000 | | $ 2,306,420 |
5.5% 9/15/24 | | 5,250,000 | | 6,380,693 |
West Shore Area Auth. Hosp. Series 2011 B, 5.75% 1/1/41 | | 1,500,000 | | 1,696,605 |
Westmoreland County Gen. Oblig. Series 1992, 0% 8/1/15 (Escrowed to Maturity) | | 4,290,000 | | 4,190,858 |
Westmoreland County Indl. Dev. Auth. Rev. (Excela Health Proj.) Series 2010 A, 5% 7/1/25 | | 4,365,000 | | 4,850,912 |
Westmoreland County Muni. Auth. Muni. Svc. Rev. Series 2001 A: | | | | |
0% 8/15/19 (Nat'l. Pub. Fin. Guarantee Corp. Insured) | | 5,000,000 | | 4,281,350 |
0% 8/15/20 (Nat'l. Pub. Fin. Guarantee Corp. Insured) | | 2,500,000 | | 2,067,575 |
0% 8/15/22 (Nat'l. Pub. Fin. Guarantee Corp. Insured) | | 6,550,000 | | 4,994,572 |
Wilson School District Series 2007, 5.25% 6/1/25 (XL Cap. Assurance, Inc. Insured) | | 5,740,000 | | 6,332,942 |
| | 458,436,112 |
Puerto Rico - 0.6% |
Puerto Rico Elec. Pwr. Auth. Pwr. Rev. Series QQ, 5.25% 7/1/13 (XL Cap. Assurance, Inc. Insured) | | 500,000 | | 506,625 |
Puerto Rico Sales Tax Fing. Corp. Sales Tax Rev. Series 2011 C: | | | | |
0% 8/1/39 | | 8,200,000 | | 1,817,776 |
0% 8/1/41 | | 1,200,000 | | 236,184 |
| | 2,560,585 |
TOTAL INVESTMENT PORTFOLIO - 96.3% (Cost $434,848,179) | | 469,395,225 |
NET OTHER ASSETS (LIABILITIES) - 3.7% | | 18,227,244 |
NET ASSETS - 100% | $ 487,622,469 |
Legend |
(a) Coupon rates for floating and adjustable rate securities reflect the rates in effect at period end. |
(b) Private activity obligations whose interest is subject to the federal alternative minimum tax for individuals. |
Other Information |
All investments are categorized as Level 2 under the Fair Value Hierarchy. The inputs or methodology used for valuing securities may not be an indication of the risk associated with investing in those securities. For more information on valuation inputs, please refer to the Investment Valuation section in the accompanying Notes to Financial Statements. |
The distribution of municipal securities by revenue source, as a percentage of total net assets, is as follows (Unaudited): |
General Obligations | 29.8% |
Health Care | 20.1% |
Education | 15.1% |
Transportation | 9.5% |
Electric Utilities | 7.6% |
Water & Sewer | 6.5% |
Others* (Individually Less Than 5%) | 11.4% |
| 100.0% |
* Includes net other assets |
See accompanying notes which are an integral part of the financial statements.
Annual Report
Fidelity Pennsylvania Municipal Income Fund
Statement of Assets and Liabilities
| December 31, 2012 |
| | |
Assets | | |
Investment in securities, at value - See accompanying schedule: Unaffiliated issuers (cost $434,848,179) | | $ 469,395,225 |
Cash | | 13,321,785 |
Receivable for fund shares sold | | 217,394 |
Interest receivable | | 5,830,301 |
Prepaid expenses | | 1,165 |
Other receivables | | 2,202 |
Total assets | | 488,768,072 |
| | |
Liabilities | | |
Payable for fund shares redeemed | $ 404,923 | |
Distributions payable | 463,035 | |
Accrued management fee | 149,659 | |
Transfer agent fee payable | 62,117 | |
Other affiliated payables | 21,605 | |
Other payables and accrued expenses | 44,264 | |
Total liabilities | | 1,145,603 |
| | |
Net Assets | | $ 487,622,469 |
Net Assets consist of: | | |
Paid in capital | | $ 452,841,920 |
Undistributed net investment income | | 53,621 |
Accumulated undistributed net realized gain (loss) on investments | | 179,882 |
Net unrealized appreciation (depreciation) on investments | | 34,547,046 |
Net Assets, for 42,514,132 shares outstanding | | $ 487,622,469 |
Net Asset Value, offering price and redemption price per share ($487,622,469 ÷ 42,514,132 shares) | | $ 11.47 |
See accompanying notes which are an integral part of the financial statements.
Annual Report
Fidelity Pennsylvania Municipal Income Fund
Financial Statements - continued
Statement of Operations
| Year ended December 31, 2012 |
| | |
Investment Income | | |
Interest | | $ 17,917,016 |
| | |
Expenses | | |
Management fee | $ 1,686,055 | |
Transfer agent fees | 351,122 | |
Accounting fees and expenses | 119,549 | |
Custodian fees and expenses | 5,658 | |
Independent trustees' compensation | 1,684 | |
Registration fees | 25,958 | |
Audit | 49,630 | |
Legal | 3,825 | |
Miscellaneous | 3,378 | |
Total expenses before reductions | 2,246,859 | |
Expense reductions | (9,886) | 2,236,973 |
Net investment income (loss) | | 15,680,043 |
Realized and Unrealized Gain (Loss) Net realized gain (loss) on: | | |
Investment securities: | | |
Unaffiliated issuers | | 1,748,180 |
Change in net unrealized appreciation (depreciation) on investment securities | | 13,917,672 |
Net gain (loss) | | 15,665,852 |
Net increase (decrease) in net assets resulting from operations | | $ 31,345,895 |
See accompanying notes which are an integral part of the financial statements.
Annual Report
Statement of Changes in Net Assets
| Year ended
December 31, 2012 | Year ended
December 31, 2011 |
Increase (Decrease) in Net Assets | | |
Operations | | |
Net investment income (loss) | $ 15,680,043 | $ 15,776,914 |
Net realized gain (loss) | 1,748,180 | (233,547) |
Change in net unrealized appreciation (depreciation) | 13,917,672 | 21,854,173 |
Net increase (decrease) in net assets resulting
from operations | 31,345,895 | 37,397,540 |
Distributions to shareholders from net investment income | (15,632,766) | (15,776,599) |
Distributions to shareholders from net realized gain | (1,100,705) | - |
Total distributions | (16,733,471) | (15,776,599) |
Share transactions
Proceeds from sales of shares | 116,905,113 | 76,315,039 |
Reinvestment of distributions | 11,001,986 | 9,732,684 |
Cost of shares redeemed | (79,594,140) | (113,940,721) |
Net increase (decrease) in net assets resulting from share transactions | 48,312,959 | (27,892,998) |
Redemption fees | 4,500 | 3,483 |
Total increase (decrease) in net assets | 62,929,883 | (6,268,574) |
| | |
Net Assets | | |
Beginning of period | 424,692,586 | 430,961,160 |
End of period (including undistributed net investment income of $53,621 and undistributed net investment income of $6,346, respectively) | $ 487,622,469 | $ 424,692,586 |
Other Information Shares | | |
Sold | 10,275,493 | 7,114,011 |
Issued in reinvestment of distributions | 963,856 | 904,776 |
Redeemed | (6,995,178) | (10,739,144) |
Net increase (decrease) | 4,244,171 | (2,720,357) |
See accompanying notes which are an integral part of the financial statements.
Annual Report
Financial Highlights
Years ended December 31, | 2012 | 2011 | 2010 | 2009 | 2008 |
Selected Per-Share Data | | | | | |
Net asset value, beginning of period | $ 11.10 | $ 10.51 | $ 10.78 | $ 10.21 | $ 10.73 |
Income from Investment Operations | | | | | |
Net investment income (loss) B | .387 | .415 | .418 | .407 | .416 |
Net realized and unrealized gain (loss) | .395 | .590 | (.197) | .569 | (.497) |
Total from investmentoperations | .782 | 1.005 | .221 | .976 | (.081) |
Distributions from net investment income | (.386) | (.415) | (.418) | (.407) | (.416) |
Distributions from net realized gain | (.026) | - | (.073) | - | (.023) |
Total distributions | (.412) | (.415) | (.491) | (.407) | (.439) |
Redemption fees added to paid in capital B | - D | - D | - D | .001 | - D |
Net asset value, end of period | $ 11.47 | $ 11.10 | $ 10.51 | $ 10.78 | $ 10.21 |
Total Return A | 7.13% | 9.76% | 2.02% | 9.70% | (.77)% |
Ratios to Average Net Assets C | | | | | |
Expenses before reductions | .49% | .50% | .50% | .51% | .50% |
Expenses net of fee waivers, if any | .49% | .50% | .50% | .51% | .50% |
Expenses net of all reductions | .48% | .50% | .50% | .51% | .46% |
Net investment income (loss) | 3.40% | 3.87% | 3.85% | 3.84% | 3.96% |
Supplemental Data | | | | | |
Net assets, end of period (000 omitted) | $ 487,622 | $ 424,693 | $ 430,961 | $ 428,569 | $ 326,566 |
Portfolio turnover rate | 16% | 12% | 19% | 8% | 17% |
A Total returns would have been lower if certain expenses had not been reduced during the applicable periods shown.
B Calculated based on average shares outstanding during the period.
C Expense ratios reflect operating expenses of the Fund. Expenses before reductions do not reflect amounts reimbursed by the investment adviser or reductions from expense offset arrangements and do not represent the amount paid by the Fund during periods when reimbursements or reductions occur. Expenses net of fee waivers reflect expenses after reimbursement by the investment adviser but prior to reductions from expense offset arrangements. Expenses net of all reductions represent the net expenses paid by the Fund.
D Amount represents less than $.001 per share.
See accompanying notes which are an integral part of the financial statements.
Annual Report
Fidelity Pennsylvania Municipal Money Market Fund
Effective Maturity Diversification |
Days | % of fund's investments 12/31/12 | % of fund's investments 6/30/12 | % of fund's
investments
12/31/11 |
1 - 7 | 86.8 | 87.5 | 86.3 |
8 - 30 | 0.6 | 1.6 | 0.6 |
31 - 60 | 4.1 | 3.1 | 4.2 |
61 - 90 | 0.1 | 0.7 | 1.0 |
91 - 180 | 4.8 | 0.7 | 4.3 |
> 180 | 3.6 | 6.4 | 3.6 |
Effective maturity is determined in accordance with the requirements of Rule 2a-7 under the Investment Company Act of 1940. |
Weighted Average Maturity |
| 12/31/12 | 6/30/12 | 12/31/11 |
Fidelity Pennsylvania Municipal Money Market Fund | 22 Days | 28 Days | 22 Days |
Pennsylvania Tax-Free Money Market Funds Average* | 26 Days | 30 Days | 25 Days |
This is a weighted average of all the maturities of the securities held in a fund. Weighted Average Maturity (WAM) can be used as a measure of sensitivity to interest rate changes and market changes. Generally, the longer the maturity, the greater the sensitivity to such changes. WAM is based on the dollar-weighted average length of time until principal payments must be paid. Depending on the types of securities held in a fund, certain maturity shortening devices (e.g., demand features, interest rate resets, and call options) may be taken into account when calculating the WAM. |
Weighted Average Life |
| 12/31/12 | 6/30/12 | 12/31/11 |
Fidelity Pennsylvania Municipal Money Market Fund | 22 Days | 28 Days | 22 Days |
Weighted Average Life (WAL) is the weighted average of the life of the securities held in a fund or portfolio and can be used as a measure of sensitivity to changes in liquidity and/or credit risk. Generally, the higher the value, the greater the sensitivity. WAL is based on the dollar-weighted average length of time until principal payments must be paid, taking into account any call options exercised by the issuer and any permissible maturity shortening features other than interest rate resets. The difference between WAM and WAL is that WAM takes into account interest rate resets and WAL does not. WAL for money market funds is not the same as WAL of a mortgage- or asset-backed security. |
Asset Allocation (% of fund's net assets) |
As of December 31, 2012 | As of June 30, 2012 |
| Variable Rate Demand Notes (VRDNs) 74.4% | | | Variable Rate Demand Notes (VRDNs) 73.9% | |
| Other Municipal
Debt 19.7% | | | Other Municipal
Debt 17.6% | |
| Investment
Companies 0.9% | | | Investment
Companies 10.4% | |
| Net Other Assets (Liabilities) 5.0% | | | Net Other Assets (Liabilities)** (1.9)% | |

* Source: iMoneyNet, Inc.
** Net Other Assets (Liabilities) are not included in the pie chart.
Current and Historical Seven-Day Yields
| 12/31/12 | 9/30/12 | 6/30/12 | 3/31/12 | 1/2/12 |
Fidelity Pennsylvania Municipal Money Market Fund | 0.01% | 0.01% | 0.01% | 0.01% | 0.01% |
Yield refers to the income paid by the fund over a given period. Yields for money market funds are usually for seven-day periods, as they are here, though they are expressed as annual percentage rates. Past performance is no guarantee of future results. Yield will vary and it's possible to lose money investing in the Fund. A portion of the Fund's expenses was reimbursed and/or waived. Absent such reimbursements and/or waivers the yield for the period ending December 31, 2012, the most recent period shown in the table, would have been -0.33%.
Annual Report
Fidelity Pennsylvania Municipal Money Market Fund
Investments December 31, 2012
Showing Percentage of Net Assets
Variable Rate Demand Note - 74.4% |
| Principal Amount | | Value |
Alabama - 0.1% |
Decatur Indl. Dev. Board Exempt Facilities Rev. (Nucor Steel Decatur LLC Proj.) Series 2003 A, 0.39% 1/7/13, VRDN (a)(d) | $ 400,000 | | $ 400,000 |
District Of Columbia - 0.1% |
District of Columbia Rev. (American Psychological Assoc. Proj.) Series 2003, 0.17% 1/7/13, LOC Bank of America NA, VRDN (a) | 900,000 | | 900,000 |
Florida - 0.4% |
Collier County Hsg. Fin. Auth. Multi-family Rev. (George Washington Carver Apts. Proj.) Series 2005, 0.21% 1/7/13, LOC PNC Bank NA, VRDN (a)(d) | 3,270,000 | | 3,270,000 |
Georgia - 0.2% |
Coweta County Dev. Auth. Rev. (W. Y. Industries, Inc. Proj.) Series 2007, 0.3% 1/7/13, LOC Wells Fargo Bank NA, VRDN (a)(d) | 1,890,000 | | 1,890,000 |
Iowa - 0.4% |
Iowa Fin. Auth. Poll. Cont. Facility Rev. (MidAmerican Energy Proj.) Series 2008 B, 0.17% 1/7/13, VRDN (a) | 3,200,000 | | 3,200,000 |
Louisiana - 0.1% |
Saint James Parish Gen. Oblig. (Nucor Steel Louisiana LLC Proj.) Series 2010 B1: | | | |
0.35% 1/7/13, VRDN (a) | 300,000 | | 300,000 |
0.4% 1/7/13, VRDN (a) | 780,000 | | 780,000 |
| | 1,080,000 |
Nebraska - 0.1% |
Stanton County Indl. Dev. Rev. (Nucor Corp. Proj.) Series 1996, 0.39% 1/7/13, VRDN (a)(d) | 400,000 | | 400,000 |
New Jersey - 0.1% |
Salem County Poll. Cont. Fin. Auth. Rev. (Pub. Svc. Elec. and Gas Co. Proj.): | | | |
Series 2003 B1, 0.33% 1/7/13, VRDN (a) | 100,000 | | 100,000 |
Series 2012 A, 0.37% 1/7/13, VRDN (a)(d) | 500,000 | | 500,000 |
| | 600,000 |
New York - 0.0% |
Dutchess County Indl. Dev. Agcy. Civic Facility Rev. (Lutheran Ctr. at Poughkeepsie, Inc. Proj.) 0.26% 1/7/13, LOC KeyBank NA, VRDN (a) | 100,000 | | 100,000 |
North Carolina - 0.1% |
Parson County Indl. Facilities and Poll. Cont. Fing. Auth. (CertainTeed Gypsum NC, Inc. Proj.) Series 2010, 0.22% 1/7/13, LOC Cr. Industriel et Commercial, VRDN (a) | 800,000 | | 800,000 |
Variable Rate Demand Note - continued |
| Principal Amount | | Value |
Pennsylvania - 72.2% |
Allegheny County Hosp. Dev. Auth. Rev.: | | | |
(Children's Institute Pittsburgh Proj.) Series 2005 A, 0.12% 1/7/13, LOC PNC Bank NA, VRDN (a) | $ 3,190,000 | | $ 3,190,000 |
(Jefferson Reg'l. Med. Ctr.) Series 2010 A, 0.12% 1/7/13, LOC PNC Bank NA, VRDN (a) | 8,640,000 | | 8,640,000 |
(South Hills Health Sys. Proj.) Series 2000 A, 0.13% 1/7/13, LOC PNC Bank NA, VRDN (a) | 4,600,000 | | 4,600,000 |
(UPMC Health Sys. Proj.) Series 2010 B2, 0.14% 1/7/13, LOC Deutsche Bank AG New York Branch, VRDN (a) | 7,500,000 | | 7,500,000 |
Allegheny County Indl. Dev. Auth. Rev.: | | | |
(Doren, Inc. Proj.) Series 1997 C, 0.24% 1/1/13, LOC PNC Bank NA, VRDN (a)(d) | 300,000 | | 300,000 |
(R.I. Lampus Co. Proj.) Series 1997 A, 0.24% 1/1/13, LOC PNC Bank NA, VRDN (a)(d) | 710,000 | | 710,000 |
(The Neighborhood Academy Proj.) 0.13% 1/7/13, LOC PNC Bank NA, VRDN (a) | 4,500,000 | | 4,500,000 |
(The Watson Institute Friendship Academy Proj.) Series 2010, 0.12% 1/7/13, LOC PNC Bank NA, VRDN (a) | 3,750,000 | | 3,750,000 |
(Union Elec. Steel Co. Proj.) Series 1996 A, 0.16% 1/7/13, LOC PNC Bank NA, VRDN (a)(d) | 3,120,000 | | 3,120,000 |
(United Jewish Federation Proj.) Series 1996 A, 0.13% 1/7/13, LOC PNC Bank NA, VRDN (a) | 400,000 | | 400,000 |
Beaver County Indl. Dev. Auth. Poll. Cont. Rev.: | | | |
(FirstEnergy Nuclear Generation Corp. Proj.) Series 2006 B, 0.13% 1/2/13, LOC Citibank NA, VRDN (a) | 6,000,000 | | 6,000,000 |
Series 2005 A, 0.15% 1/7/13, LOC Bank of Nova Scotia New York Branch, VRDN (a) | 10,000,000 | | 10,000,000 |
Berks County Muni. Auth. Rev. Participating VRDN Series Putters 3779 Z, 0.14% 1/7/13 (Liquidity Facility JPMorgan Chase Bank) (a)(e) | 2,750,000 | | 2,750,000 |
Bucks County Indl. Dev. Auth. Rev.: | | | |
(Lutheran Cmnty. at Telford Healthcare Ctr., Inc. Proj.) Series 2007 B, 0.15% 1/7/13, LOC Citizens Bank of Pennsylvania, VRDN (a) | 3,650,000 | | 3,650,000 |
(Snowball Real Estate LP Proj.) 0.35% 1/7/13, LOC Wells Fargo Bank NA, VRDN (a)(d) | 1,305,000 | | 1,305,000 |
Butler County Gen. Auth. Rev. (Erie School District Proj.) Series 2011, 0.12% 1/7/13, LOC PNC Bank NA, VRDN (a) | 5,350,000 | | 5,350,000 |
Chester County Indl. Dev. Auth. Student Hsg. Rev. (West Chester Univ. Proj.): | | | |
Series 2008 A1, 0.14% 1/7/13, LOC Citizens Bank of Pennsylvania, VRDN (a) | 20,240,000 | | 20,240,000 |
Series 2008 A2, 0.13% 1/7/13, LOC TD Banknorth, NA, VRDN (a) | 27,905,000 | | 27,905,000 |
Variable Rate Demand Note - continued |
| Principal Amount | | Value |
Pennsylvania - continued |
Crawford County Indl. Dev. Auth. College Rev. (Allegheny College Proj.) Series 2009 B, 0.13% 1/7/13, LOC PNC Bank NA, VRDN (a) | $ 2,000,000 | | $ 2,000,000 |
Cumberland County Muni. Auth. Rev. (Messiah Village Proj.) Series 2008 B, 0.25% 1/7/13, LOC Citizens Bank of Pennsylvania, VRDN (a) | 8,000,000 | | 8,000,000 |
Delaware County Auth. Rev. (White Horse Village Proj.): | | | |
Series 2006 A, 0.15% 1/2/13, LOC Citizens Bank of Pennsylvania, VRDN (a) | 1,915,000 | | 1,915,000 |
Series 2006 B, 0.15% 1/2/13, LOC Citizens Bank of Pennsylvania, VRDN (a) | 4,900,000 | | 4,900,000 |
Delaware County Indl. Dev. Auth. Rev. (The Agnes Irwin School Proj.) Series 2003, 0.19% 1/7/13, LOC Citizens Bank of Pennsylvania, VRDN (a) | 8,640,000 | | 8,640,000 |
Erie County Hosp. Auth. Rev. (Saint Vincent Health Ctr. Proj.) Series 2010 B, 0.13% 1/7/13, LOC Manufacturers & Traders Trust Co., VRDN (a) | 13,000,000 | | 13,000,000 |
Geisinger Auth. Health Sys. Rev. Participating VRDN: | | | |
Series Putters 3446, 0.14% 1/7/13 (Liquidity Facility JPMorgan Chase Bank) (a)(e) | 6,600,000 | | 6,600,000 |
Series Putters 3915 Z, 0.14% 1/7/13 (Liquidity Facility JPMorgan Chase Bank) (a)(e) | 5,000,000 | | 5,000,000 |
Series WF 11 69C, 0.16% 1/7/13 (Liquidity Facility Wells Fargo Bank NA) (a)(e) | 1,600,000 | | 1,600,000 |
Haverford Township School District Series 2009, 0.12% 1/7/13, LOC TD Banknorth, NA, VRDN (a) | 6,675,000 | | 6,675,000 |
Montgomery County Redev. Auth. Multi-family Hsg. Rev. (Kingswood Apts. Proj.) Series 2001 A, 0.13% 1/7/13, LOC Fannie Mae, VRDN (a) | 12,675,000 | | 12,675,000 |
Moon Indl. Dev. Auth. Commercial Dev. Rev. (One Thorn Run Ctr. Proj.) Series 1995 A, 0.16% 1/7/13, LOC PNC Bank NA, VRDN (a)(d) | 1,990,000 | | 1,990,000 |
Northampton Indl. Dev. Auth. Rev. (Ultra-Poly Corp./Portland Ind. Park Proj.) Series 1997, 0.21% 1/7/13, LOC PNC Bank NA, VRDN (a)(d) | 647,000 | | 647,000 |
Pennsylvania Econ. Dev. Fing. Auth. Indl. Dev. Rev.: | | | |
(Leidy's, Inc. Proj.) Series 1995 D7, 0.16% 1/7/13, LOC PNC Bank NA, VRDN (a)(d) | 400,000 | | 400,000 |
Series 1999 C4, 0.24% 1/7/13, LOC PNC Bank NA, VRDN (a)(d) | 400,000 | | 400,000 |
Series 2002 B5, 0.16% 1/7/13, LOC PNC Bank NA, VRDN (a)(d) | 5,000,000 | | 5,000,000 |
Series 2004 B, 0.13% 1/7/13, LOC PNC Bank NA, VRDN (a) | 1,200,000 | | 1,200,000 |
Variable Rate Demand Note - continued |
| Principal Amount | | Value |
Pennsylvania - continued |
Pennsylvania Econ. Dev. Fing. Auth. Indl. Dev. Rev.: - continued | | | |
Series 2004 D2, 0.16% 1/7/13, LOC PNC Bank NA, VRDN (a)(d) | $ 900,000 | | $ 900,000 |
Pennsylvania Econ. Dev. Fing. Auth. Manufacturing Facility Rev. (Dodge Realty Partners Proj.) Series 2007, 0.19% 1/7/13, LOC Citibank NA, VRDN (a)(d) | 6,000,000 | | 6,000,000 |
Pennsylvania Gen. Oblig. Participating VRDN: | | | |
Series Putters 3350, 0.14% 1/7/13 (Liquidity Facility JPMorgan Chase Bank) (a)(e) | 4,540,000 | | 4,540,000 |
Series Putters 3352Z, 0.14% 1/7/13 (Liquidity Facility JPMorgan Chase Bank) (a)(e) | 4,435,000 | | 4,435,000 |
Series Putters 4014, 0.14% 1/7/13 (Liquidity Facility JPMorgan Chase Bank) (a)(e) | 3,000,000 | | 3,000,000 |
Series Putters 4201, 0.13% 1/2/13 (Liquidity Facility JPMorgan Chase Bank) (a)(e) | 1,995,000 | | 1,995,000 |
Series RBC O 34, 0.13% 1/7/13 (Liquidity Facility Royal Bank of Canada) (a)(e) | 5,000,000 | | 5,000,000 |
Series ROC II R 11505, 0.13% 1/7/13 (Liquidity Facility Citibank NA) (a)(e) | 11,000,000 | | 11,000,000 |
Series ROC II R 14002, 0.14% 1/7/13 (Liquidity Facility Citibank NA) (a)(e) | 7,800,000 | | 7,800,000 |
Series WF 11 121C, 0.16% 1/7/13 (Liquidity Facility Wells Fargo Bank NA) (a)(e) | 14,370,000 | | 14,370,000 |
Pennsylvania Higher Edl. Facilities Auth. College & Univ. Revs. (St. Josephs Univ. Proj.) Series 2008 A, 0.14% 1/7/13, LOC TD Banknorth, NA, VRDN (a) | 7,000,000 | | 7,000,000 |
Pennsylvania Higher Edl. Facilities Auth. Rev.: | | | |
(Holy Family Univ. Proj.) Series 2008, 0.12% 1/7/13, LOC TD Banknorth, NA, VRDN (a) | 4,435,000 | | 4,435,000 |
(Thomas Jefferson Univ. Proj.) Series 2008 B, 0.15% 1/7/13, LOC JPMorgan Chase Bank, VRDN (a) | 3,000,000 | | 3,000,000 |
Participating VRDN: | | | |
ROC II R 11721, 0.14% 1/7/13 (Liquidity Facility Citibank NA) (a)(e) | 7,500,000 | | 7,500,000 |
Series MS 3252, 0.18% 1/7/13 (Liquidity Facility Morgan Stanley Bank, West Valley City Utah) (a)(e) | 5,840,000 | | 5,840,000 |
Series Putters 3583Z, 0.14% 1/7/13 (Liquidity Facility JPMorgan Chase Bank) (a)(e) | 6,060,000 | | 6,060,000 |
Series ROC II R 14041, 0.15% 1/7/13 (Liquidity Facility Deutsche Postbank AG) (a)(e) | 7,200,000 | | 7,200,000 |
Series WF 11 26C, 0.16% 1/7/13 (Liquidity Facility Wells Fargo Bank NA) (a)(e) | 3,000,000 | | 3,000,000 |
Variable Rate Demand Note - continued |
| Principal Amount | | Value |
Pennsylvania - continued |
Pennsylvania Hsg. Fin. Agcy. Single Family Mtg. Rev. Participating VRDN: | | | |
Series MT 827, 0.22% 1/7/13 (Liquidity Facility Bank of America NA) (a)(d)(e) | $ 6,045,000 | | $ 6,045,000 |
Series Putters 3786 Z, 0.22% 1/7/13 (Liquidity Facility JPMorgan Chase Bank) (a)(d)(e) | 4,745,000 | | 4,745,000 |
Series Putters 3950, 0.14% 1/7/13 (Liquidity Facility JPMorgan Chase Bank) (a)(e) | 3,000,000 | | 3,000,000 |
Series Putters 4109, 0.18% 1/2/13 (Liquidity Facility JPMorgan Chase Bank) (a)(d)(e) | 6,790,000 | | 6,790,000 |
Series Putters 4141 Z, 0.14% 1/7/13 (Liquidity Facility JPMorgan Chase Bank) (a)(e) | 4,875,000 | | 4,875,000 |
Pennsylvania Intergovernmental Coop. Auth. Spl. Tax Rev. Participating VRDN Series Putters 3481, 0.14% 1/7/13 (Liquidity Facility JPMorgan Chase Bank) (a)(e) | 5,035,000 | | 5,035,000 |
Pennsylvania State Pub. School Participating VRDN Series Solar 06 161, 0.13% 1/7/13 (Liquidity Facility U.S. Bank NA, Cincinnati) (a)(e) | 3,925,000 | | 3,925,000 |
Pennsylvania Tpk. Commission Tpk. Rev.: | | | |
Series 2008 B1, 0.13% 1/7/13, LOC Barclays Bank PLC, VRDN (a) | 25,925,000 | | 25,925,000 |
Series 2008 C, 0.13% 1/7/13, LOC Barclays Bank PLC, VRDN (a) | 20,875,000 | | 20,875,000 |
Philadelphia Arpt. Rev.: | | | |
Series 2005 C1, 0.15% 1/7/13, LOC TD Banknorth, NA, VRDN (a)(d) | 21,195,000 | | 21,195,000 |
Series 2005 C2, 0.15% 1/7/13, LOC Royal Bank of Canada, VRDN (a)(d) | 11,000,000 | | 11,000,000 |
Philadelphia Auth. for Indl. Dev. Rev.: | | | |
(Spl. People in Northeast, Inc. Proj.) Series 2006, 0.16% 1/7/13, LOC Citizens Bank of Pennsylvania, VRDN (a) | 7,000,000 | | 7,000,000 |
(The Franklin Institute Proj.) Series 2006, 0.14% 1/7/13, LOC Bank of America NA, VRDN (a) | 9,200,000 | | 9,200,000 |
(William Penn Charter School Proj.) Series 2008, 0.12% 1/7/13, LOC PNC Bank NA, VRDN (a) | 2,260,000 | | 2,260,000 |
Philadelphia Gas Works Rev. (1998 Gen. Ordinance Proj.): | | | |
Eighth Series B, 0.14% 1/7/13, LOC Wells Fargo Bank NA, VRDN (a) | 7,400,000 | | 7,400,000 |
Eighth Series C, 0.14% 1/7/13, LOC Bank of Nova Scotia New York Branch, VRDN (a) | 4,000,000 | | 4,000,000 |
Eighth Series D, 0.12% 1/7/13, LOC Bank of America NA, VRDN (a) | 24,000,000 | | 24,000,000 |
Variable Rate Demand Note - continued |
| Principal Amount | | Value |
Pennsylvania - continued |
Philadelphia Hospitals & Higher Ed. Facilities Auth. Health Systems Rev. Participating VRDN Series ROC II R 11867, 0.13% 1/7/13 (Liquidity Facility Citibank NA) (a)(e) | $ 5,500,000 | | $ 5,500,000 |
Philadelphia Hospitals & Higher Ed. Facilities Auth. Hosp. Rev. Participating VRDN Series Putters 3975, 0.14% 1/7/13 (Liquidity Facility JPMorgan Chase Bank) (a)(e) | 3,665,000 | | 3,665,000 |
Philadelphia Wtr. & Wastewtr. Rev. Series 2005 B, 0.13% 1/7/13, LOC Bank of America NA, VRDN (a) | 12,900,000 | | 12,900,000 |
RBC Muni. Products, Inc. Trust Participating VRDN: | | | |
Series RBC E 22, 0.13% 1/7/13 (Liquidity Facility Royal Bank of Canada) (a)(e) | 20,760,000 | | 20,760,000 |
Series RBC E 28, 0.13% 1/7/13 (Liquidity Facility Royal Bank of Canada) (a)(e) | 13,740,000 | | 13,740,000 |
Series RBC E 29, 0.13% 1/7/13 (Liquidity Facility Royal Bank of Canada) (a)(e) | 6,500,000 | | 6,500,000 |
Series RBC E 30, 0.13% 1/7/13 (Liquidity Facility Royal Bank of Canada) (a)(e) | 10,000,000 | | 10,000,000 |
Ridley School District Series 2009, 0.12% 1/7/13, LOC TD Banknorth, NA, VRDN (a) | 6,330,000 | | 6,330,000 |
Schuylkill County Indl. Dev. Auth. Rev. (KP Tamaqua LP Proj.) Series 2007, 0.23% 1/7/13, LOC Citizens Bank of Pennsylvania, VRDN (a)(d) | 1,920,000 | | 1,920,000 |
Somerset County Gen. Oblig. Series 2009 A, 0.12% 1/7/13, LOC PNC Bank NA, VRDN (a) | 4,470,000 | | 4,470,000 |
South Fork Muni. Auth. Hosp. Rev. (Conemaugh Health Ctr. Proj.) Series A, 0.13% 1/7/13, LOC PNC Bank NA, VRDN (a) | 6,700,000 | | 6,700,000 |
Washington County Auth. Rev. 0.13% 1/7/13, VRDN (a) | 1,000,000 | | 1,000,000 |
Westmoreland County Indl. Dev. Auth. Rev. (Excela Health Proj.) Series 2010 B, 0.12% 1/7/13, LOC PNC Bank NA, VRDN (a) | 5,155,000 | | 5,155,000 |
Wilkens Area Indl. Dev. Auth. Rev. (Fairview Extended Care Proj.) Series B, 0.2% 1/7/13, LOC Bank of America NA, VRDN (a) | 5,665,000 | | 5,665,000 |
| | 569,202,000 |
Puerto Rico - 0.2% |
Puerto Rico Commonwealth Pub. Impt. Gen. Oblig. Series 2003 C5-2, 0.13% 1/7/13, LOC Barclays Bank PLC NY Branch, VRDN (a) | 1,700,000 | | 1,700,000 |
South Carolina - 0.1% |
Oconee County Poll. Cont. Rev. (Duke Energy Corp. Proj.) Series 1999 B, 0.21% 1/2/13, VRDN (a)(d) | 500,000 | | 500,000 |
Variable Rate Demand Note - continued |
| Principal Amount | | Value |
Texas - 0.2% |
Harris County Cultural Ed. Facilities Fin. Corp. Rev. (YMCA of the Greater Houston Area Proj.) Series 2008 C, 0.16% 1/2/13, LOC Bank of America NA, VRDN (a) | $ 1,200,000 | | $ 1,200,000 |
Virginia - 0.1% |
Virginia Hsg. Dev. Auth. Commonwealth Mtg. Rev. Participating VRDN Series BA 1047, 0.22% 1/7/13 (Liquidity Facility Bank of America NA) (a)(d)(e) | 1,000,000 | | 1,000,000 |
TOTAL VARIABLE RATE DEMAND NOTE |
586,242,000
|
Other Municipal Debt - 19.7% |
| | | |
Kentucky - 0.1% |
Trimble County Poll. Cont. Rev. Bonds (Louisville Gas & Elec. Co. Proj.) Series 2001 B, 0.4% tender 1/16/13, CP mode (d) | 1,100,000 | | 1,100,000 |
Massachusetts - 0.1% |
Massachusetts Indl. Fin. Agcy. Poll. Cont. Rev. Bonds (New England Pwr. Co. Proj.) Series 1993 A, 0.45% tender 1/23/13, CP mode | 1,200,000 | | 1,200,000 |
New Hampshire - 0.3% |
New Hampshire Bus. Fin. Auth. Poll. Cont. Rev. Bonds (New England Pwr. Co. Proj.): | | | |
Series 1990 A, 0.5% tender 1/9/13, CP mode (d) | 1,300,000 | | 1,300,000 |
Series 1990 B, 0.45% tender 1/15/13, CP mode | 800,000 | | 800,000 |
| | 2,100,000 |
Pennsylvania - 19.2% |
Allegheny County Hosp. Dev. Auth. Rev. Bonds: | | | |
(Pittsburgh Med. Ctr. Proj.) Series 2008 B, 5% 6/15/13 | 2,800,000 | | 2,859,903 |
Series 2011 A, 3% 10/15/13 | 1,320,000 | | 1,347,437 |
Lehigh County Gen. Oblig. Bonds Series 2011, 3% 11/15/13 | 6,030,000 | | 6,174,264 |
Pennsylvania Gen. Oblig. Bonds: | | | |
First Series 2003, 5% 1/1/13 | 1,950,000 | | 1,950,000 |
First Series 2004, 5.25% 2/1/13 | 4,500,000 | | 4,519,121 |
First Series 2008, 5% 5/15/13 | 3,850,000 | | 3,917,841 |
First Series 2009, 5% 3/15/13 | 1,000,000 | | 1,009,601 |
First Series 2011, 4% 11/15/13 | 3,000,000 | | 3,097,918 |
First Series 2012, 3% 1/1/13 | 5,600,000 | | 5,600,000 |
Fourth Series 2004, 5% 7/1/13 (Escrowed to Maturity) | 3,190,000 | | 3,265,688 |
Second Series 2004, 5.5% 6/1/13 | 1,000,000 | | 1,021,826 |
Second Series 2008, 5% 2/15/13 | 1,000,000 | | 1,005,875 |
Series 2002, 5.5% 2/1/13 | 3,950,000 | | 3,967,624 |
Other Municipal Debt - continued |
| Principal Amount | | Value |
Pennsylvania - continued |
Pennsylvania Gen. Oblig. Bonds: - continued | | | |
Series 2004, 5.25% 7/1/13 | $ 1,000,000 | | $ 1,025,025 |
Series 2009, 5% 7/1/13 | 2,925,000 | | 2,994,403 |
Series 2010 A, 5% 5/1/13 | 10,380,000 | | 10,543,547 |
Third Series, 5% 9/1/13 | 300,000 | | 309,314 |
Pennsylvania Higher Edl. Facilities Auth. Rev. Bonds: | | | |
First Series 2012, 1% 4/1/13 | 4,805,000 | | 4,814,490 |
Series AM, 3% 6/15/13 | 1,965,000 | | 1,989,221 |
Pennsylvania Hsg. Fin. Agcy. Single Family Mtg. Rev. Bonds Series 114A, 0.4% 4/1/13 (d) | 1,960,000 | | 1,960,000 |
Pennsylvania Infrastructure Invt. Auth. Rev. Series 2010 A, 0.17% 1/7/13, LOC Bank of America NA, CP | 48,780,000 | | 48,780,000 |
Pennsylvania State Univ. Bonds Series 2009 A, 4% 3/1/13 | 1,500,000 | | 1,509,191 |
Philadelphia Gen. Oblig. TRAN Series 2012 A, 2% 6/28/13 | 7,300,000 | | 7,362,521 |
Philadelphia Hospitals & Higher Ed. Facilities Auth. Health Systems Rev. Bonds (Jefferson Health Sys. Proj.) Series 2010 B, 4% 5/15/13 | 1,500,000 | | 1,519,710 |
Swarthmore Borough Auth. College Rev. Bonds Series 2008, 5% 9/15/13 | 1,875,000 | | 1,937,403 |
Univ. of Pittsburgh Commonwealth Sys. of Higher Ed.: | | | |
BAN Series 2012, 2% 7/2/13 | 6,700,000 | | 6,759,703 |
Bonds: | | | |
(Higher Ed. Proj.) 0.2% tender 2/5/13, CP mode | 10,805,000 | | 10,805,000 |
(Univ. Cap. Proj.) Series 2012 C, 0.21% tender 2/5/13, CP mode | 9,000,000 | | 9,000,000 |
| | 151,046,626 |
TOTAL OTHER MUNICIPAL DEBT |
155,446,626
|
Investment Company - 0.9% |
| Shares | | |
Fidelity Municipal Cash Central Fund, 0.16% (b)(c) | 7,312,000 | |
7,312,000
|
TOTAL INVESTMENT PORTFOLIO - 95.0% (Cost $749,000,626) | | 749,000,626 |
NET OTHER ASSETS (LIABILITIES) - 5.0% | | 39,484,878 |
NET ASSETS - 100% | $ 788,485,504 |
Security Type Abbreviations |
BAN | - | BOND ANTICIPATION NOTE |
CP | - | COMMERCIAL PAPER |
TRAN | - | TAX AND REVENUE ANTICIPATION NOTE |
VRDN | - | VARIABLE RATE DEMAND NOTE (A debt instrument that is payable upon demand, either daily, weekly or monthly) |
Legend |
(a) Coupon rates for floating and adjustable rate securities reflect the rates in effect at period end. |
(b) Information in this report regarding holdings by state and security types does not reflect the holdings of the Fidelity Municipal Cash Central Fund. |
(c) Affiliated fund that is available only to investment companies and other accounts managed by Fidelity Investments. The rate quoted is the annualized seven-day yield of the fund at period end. A complete unaudited listing of the fund's holdings as of its most recent quarter end is available upon request. In addition, each Fidelity Central Fund's financial statements, which are not covered by the Fund's Report of Independent Registered Public Accounting Firm, are available on the SEC's website or upon request. |
(d) Private activity obligations whose interest is subject to the federal alternative minimum tax for individuals. |
(e) Provides evidence of ownership in one or more underlying municipal bonds. |
Affiliated Central Funds |
Information regarding fiscal year to date income earned by the Fund from investments in Fidelity Central Funds is as follows: |
Fund | Income earned |
Fidelity Municipal Cash Central Fund | $ 54,328 |
Other Information |
The date shown for securities represents the date when principal payments must be paid, taking into account any call options exercised by the issuer and any permissible maturity shortening features other than interest rate resets. |
All investments are categorized as Level 2 under the Fair Value Hierarchy. The inputs or methodology used for valuing securities may not be an indication of the risk associated with investing in those securities. For more information on valuation inputs, please refer to the Investment Valuation section in the accompanying Notes to Financial Statements. |
See accompanying notes which are an integral part of the financial statements.
Annual Report
Fidelity Pennsylvania Municipal Money Market Fund
Statement of Assets and Liabilities
| December 31, 2012 |
| | |
Assets | | |
Investment in securities, at value - See accompanying schedule: Unaffiliated issuers (cost $741,688,626) | $ 741,688,626 | |
Fidelity Central Funds (cost $7,312,000) | 7,312,000 | |
Total Investments (cost $749,000,626) | | $ 749,000,626 |
Cash | | 35,970,854 |
Receivable for fund shares sold | | 21,138,473 |
Interest receivable | | 905,004 |
Distributions receivable from Fidelity Central Funds | | 1,674 |
Other receivables | | 1,951 |
Total assets | | 807,018,582 |
| | |
Liabilities | | |
Payable for fund shares redeemed | 18,435,760 | |
Distributions payable | 246 | |
Accrued management fee | 96,839 | |
Other affiliated payables | 233 | |
Total liabilities | | 18,533,078 |
| | |
Net Assets | | $ 788,485,504 |
Net Assets consist of: | | |
Paid in capital | | $ 788,482,184 |
Accumulated undistributed net realized gain (loss) on investments | | 3,320 |
Net Assets, for 788,321,379 shares outstanding | | $ 788,485,504 |
Net Asset Value, offering price and redemption price per share ($788,485,504 ÷ 788,321,379 shares) | | $ 1.00 |
See accompanying notes which are an integral part of the financial statements.
Annual Report
Fidelity Pennsylvania Municipal Money Market Fund
Financial Statements - continued
Statement of Operations
| Year ended December 31, 2012 |
| | |
Investment Income | | |
Interest | | $ 1,242,697 |
Income from Fidelity Central Funds | | 54,328 |
Total income | | 1,297,025 |
| | |
Expenses | | |
Management fee | $ 3,405,416 | |
Independent trustees' compensation | 2,432 | |
Total expenses before reductions | 3,407,848 | |
Expense reductions | (2,179,116) | 1,228,732 |
Net investment income (loss) | | 68,293 |
Realized and Unrealized Gain (Loss) Net realized gain (loss) on: | | |
Investment securities: | | |
Unaffiliated issuers | 31,801 | |
Capital gain distributions from Fidelity Central Funds | 662 | |
Total net realized gain (loss) | | 32,463 |
Net increase in net assets resulting from operations | | $ 100,756 |
See accompanying notes which are an integral part of the financial statements.
Annual Report
Statement of Changes in Net Assets
| Year ended
December 31, 2012 | Year ended
December 31, 2011 |
Increase (Decrease) in Net Assets | | |
Operations | | |
Net investment income (loss) | $ 68,293 | $ 66,169 |
Net realized gain (loss) | 32,463 | 14,020 |
Net increase in net assets resulting
from operations | 100,756 | 80,189 |
Distributions to shareholders from net investment income | (68,278) | (66,105) |
Share transactions at net asset value of $1.00 per share
Proceeds from sales of shares | 1,885,238,135 | 1,803,354,473 |
Reinvestment of distributions | 66,921 | 65,495 |
Cost of shares redeemed | (1,783,013,637) | (1,788,062,125) |
Net increase (decrease) in net assets and shares resulting from share transactions | 102,291,419 | 15,357,843 |
Total increase (decrease) in net assets | 102,323,897 | 15,371,927 |
| | |
Net Assets | | |
Beginning of period | 686,161,607 | 670,789,680 |
End of period | $ 788,485,504 | $ 686,161,607 |
See accompanying notes which are an integral part of the financial statements.
Annual Report
Financial Highlights
Years ended December 31, | 2012 | 2011 | 2010 | 2009 | 2008 |
Selected Per-Share Data | | | | | |
Net asset value, beginning of period | $ 1.00 | $ 1.00 | $ 1.00 | $ 1.00 | $ 1.00 |
Income from Investment Operations | | | | | |
Net investment income (loss) | - D | - D | - D | .001 | .018 |
Net realized and unrealized gain (loss) D | - | - | - | - | - |
Total from investment operations | - D | - D | - D | .001 | .018 |
Distributions from net investment income | - D | - D | - D | (.001) | (.018) |
Distributions from net realized gain | - | - | - | - | - D |
Total distributions | - D | - D | - D | (.001) | (.018) |
Net asset value, end of period | $ 1.00 | $ 1.00 | $ 1.00 | $ 1.00 | $ 1.00 |
Total Return A | .01% | .01% | .01% | .09% | 1.85% |
Ratios to Average Net Assets B, C | | | | | |
Expenses before reductions | .50% | .50% | .50% | .53% | .51% |
Expenses net of fee waivers, if any | .18% | .22% | .30% | .49% | .51% |
Expenses net of all reductions | .18% | .22% | .30% | .49% | .46% |
Net investment income (loss) | .01% | .01% | .01% | .09% | 1.82% |
Supplemental Data | | | | | |
Net assets, end of period (000 omitted) | $ 788,486 | $ 686,162 | $ 670,790 | $ 678,148 | $ 848,937 |
A Total returns would have been lower if certain expenses had not been reduced during the applicable periods shown.
B Fees and expenses of any underlying Fidelity Central Funds are not included in the Fund's expense ratio. The Fund indirectly bears its proportionate share of the expenses of any underlying Fidelity Central Funds.
C Expense ratios reflect operating expenses of the Fund. Expenses before reductions do not reflect amounts reimbursed or waived or reductions from expense offset arrangements and do not represent the amount paid by the Fund during periods when reimbursements, waivers or reductions occur. Expenses net of fee waivers reflect expenses after reimbursement and waivers but prior to reductions from expense offset arrangements. Expenses net of all reductions represent the net expenses paid by the Fund.
D Amount represents less than $.001 per share.
See accompanying notes which are an integral part of the financial statements.
Annual Report
Notes to Financial Statements
For the period ended December 31, 2012
1. Organization.
Fidelity Pennsylvania Municipal Income Fund (the Income Fund) is a fund of Fidelity Municipal Trust. Fidelity Pennsylvania Municipal Money Market Fund (the Money Market Fund) is a fund of Fidelity Municipal Trust II. Each Trust is registered under the Investment Company Act of 1940, as amended (the 1940 Act), as an open-end management investment company. Fidelity Municipal Trust and Fidelity Municipal Trust II (the Trusts) are organized as a Massachusetts business trust and a Delaware statutory trust, respectively. Each Fund is authorized to issue an unlimited number of shares. Each Fund may be affected by economic and political developments in the state of Pennsylvania.
2. Investments in Fidelity Central Funds.
The Funds may invest in Fidelity Central Funds, which are open-end investment companies available only to other investment companies and accounts managed by Fidelity Management & Research Company (FMR) and its affiliates. The Funds' Schedules of Investments list each of the Fidelity Central Funds held as of period end, if any, as an investment of each Fund, but do not include the underlying holdings of each Fidelity Central Fund. As an Investing Fund, each Fund indirectly bears its proportionate share of the expenses of the underlying Fidelity Central Funds.
The Money Market Central Funds seek preservation of capital and current income and are managed by Fidelity Investments Money Management, Inc. (FIMM), an affiliate of FMR.
A complete unaudited list of holdings for each Fidelity Central Fund is available upon request or at the Securities and Exchange Commission (the SEC) website at www.sec.gov. In addition, the financial statements of the Fidelity Central Funds, which are not covered by the Funds' Report of Independent Registered Public Accounting Firm, are available on the SEC website or upon request.
3. Significant Accounting Policies.
The financial statements have been prepared in conformity with accounting principles generally accepted in the United States of America (GAAP), which require management to make certain estimates and assumptions at the date of the financial statements. Actual results could differ from those estimates. Subsequent events, if any, through the date that the financial statements were issued have been evaluated in the preparation of the financial statements. The following summarizes the significant accounting policies of the Funds:
Investment Valuation. Investments are valued as of 4:00 p.m. Eastern time on the last calendar day of the period. In accordance with valuation policies and procedures approved by the Board of Trustees (the Board), the Income Fund attempts to obtain prices
Annual Report
Notes to Financial Statements - continued
3. Significant Accounting Policies - continued
Investment Valuation - continued
from one or more third party pricing vendors or brokers to value its investments. When current market prices, quotations or rates are not readily available or reliable, investments will be fair valued in good faith by the FMR Fair Value Committee (the Committee), in accordance with procedures adopted by the Board. Factors used in determining fair value vary by investment type and may include market or investment specific events, changes in interest rates and credit quality. The frequency with which these procedures are used cannot be predicted and they may be utilized to a significant extent. The Committee oversees the Income Fund's valuation policies and procedures and is responsible for approving and reporting to the Board all fair value determinations.
Each Fund categorizes the inputs to valuation techniques used to value their investments into a disclosure hierarchy consisting of three levels as shown below:
Level 1 - quoted prices in active markets for identical investments
Level 2 - other significant observable inputs (including quoted prices for similar investments, interest rates, prepayment speeds, etc.)
Level 3 - unobservable inputs (including the Fund's own assumptions based on the best information available)
Valuation techniques used to value each Fund's investments by major category are as follows:
For the Income Fund, debt securities, including restricted securities, are valued based on evaluated prices received from third party pricing vendors or from brokers who make markets in such securities. For municipal securities, pricing vendors utilize matrix pricing which considers yield or price of bonds of comparable quality, coupon, maturity and type as well as broker-supplied prices and are generally categorized as Level 2 in the hierarchy. When independent prices are unavailable or unreliable, debt securities may be valued utilizing pricing methodologies which consider similar factors that would be used by third party pricing vendors. These are generally categorized as Level 2 in the hierarchy but may be Level 3 depending on the circumstances.
For the Money Market Fund, as permitted by compliance with certain conditions under Rule 2a-7 of the 1940 Act, securities are valued at amortized cost, which approximates fair value. The amortized cost of an instrument is determined by valuing it at its original cost and thereafter amortizing any discount or premium from its face value at a constant rate until maturity. Securities held by a money market fund are generally high quality and liquid; however, they are reflected as Level 2 because the inputs used to determine fair value are not quoted prices in an active market.
Annual Report
3. Significant Accounting Policies - continued
Investment Valuation - continued
For the Income Fund, changes in valuation techniques may result in transfers in or out of an assigned level within the disclosure hierarchy.
Investment Transactions and Income. For financial reporting purposes, the Funds' investment holdings and net asset value (NAV) include trades executed through the end of the last business day of the period. The NAV per share for processing shareholder transactions is calculated as of the close of business of the New York Stock Exchange (NYSE), normally 4:00 p.m. Eastern time and includes trades executed through the end of the prior business day for the Income Fund and trades executed through the end of the current business day for the Money Market Fund. Gains and losses on securities sold are determined on the basis of identified cost. Interest income and distributions from the Fidelity Central Funds are accrued as earned. Interest income includes coupon interest and amortization of premium and accretion of discount on debt securities.
Expenses. Expenses directly attributable to a fund are charged to that fund. Expenses attributable to more than one fund are allocated among the respective funds on the basis of relative net assets or other appropriate methods. Expense estimates are accrued in the period to which they relate and adjustments are made when actual amounts are known.
Income Tax Information and Distributions to Shareholders. Each year, each Fund intends to qualify as a regulated investment company under Subchapter M of the Internal Revenue Code, including distributing substantially all of its taxable income and realized gains. As a result, no provision for income taxes is required. As of December 31, 2012, each Fund did not have any unrecognized tax benefits in the financial statements; nor is each Fund aware of any tax positions for which it is reasonably possible that the total amounts of unrecognized tax benefits will significantly change in the next twelve months. Each Fund files a U.S. federal tax return, in addition to state and local tax returns as required. A fund's federal income tax returns are subject to examination by the Internal Revenue Service (IRS) for a period of three fiscal years after they are filed. State and local tax returns may be subject to examination for an additional fiscal year depending on the jurisdiction.
Dividends are declared and recorded daily and paid monthly from net investment income. Distributions from realized gains, if any, are declared and recorded on the ex-dividend date. Income and capital gain distributions are determined in accordance with income tax regulations, which may differ from GAAP. In addition, the Funds claimed a portion of the payment made to redeeming shareholders as a distribution for income tax purposes.
Annual Report
Notes to Financial Statements - continued
3. Significant Accounting Policies - continued
Income Tax Information and Distributions to Shareholders - continued
Capital accounts within the financial statements are adjusted for permanent book-tax differences. These adjustments have no impact on net assets or the results of operations. Temporary book-tax differences will reverse in a subsequent period.
Book-tax differences are primarily due to market discount, deferred trustees compensation, capital loss carryforwards and excise tax regulations.
The Funds purchase municipal securities whose interest, in the opinion of the issuer, is free from federal income tax. There is no assurance that the Internal Revenue Service (IRS) will agree with this opinion. In the event the IRS determines that the issuer does not comply with relevant tax requirements, interest payments from a security could become federally taxable, possibly retroactively to the date the security was issued.
The federal tax cost of investment securities and unrealized appreciation (depreciation) as of period end were as follows for each Fund:
| Tax cost | Gross unrealized
appreciation | Gross unrealized
depreciation | Net unrealized
appreciation
(depreciation) on
securities and other investments |
Fidelity Pennsylvania Municipal Income Fund | $ 434,848,017 | $ 34,687,659 | $ (140,451) | $ 34,547,208 |
Fidelity Pennsylvania Municipal Money Market Fund | 749,000,626 | - | - | - |
The tax-based components of distributable earnings as of period end were as follows for each Fund:
| Undistributed tax-exempt
income | Undistributed
ordinary
income | Undistributed long-term
capital gain | Net
unrealized
appreciation
(depreciation) |
Fidelity Pennsylvania Municipal Income Fund | $ 53,777 | $ 1 | $ 179,881 | $ 34,547,208 |
Fidelity Pennsylvania Municipal Money Market Fund | 3,546 | - | - | - |
Annual Report
3. Significant Accounting Policies - continued
Income Tax Information and Distributions to Shareholders - continued
The tax character of distributions paid was as follows:
December 31, 2012 | | | |
| Tax-Exempt
Income | Long-term
Capital Gains | Total |
Fidelity Pennsylvania Municipal Income Fund | $ 15,632,766 | $ 1,100,705 | $ 16,733,471 |
Fidelity Pennsylvania Municipal Money Market Fund | 68,278 | - | 68,278 |
December 31, 2011 | |
| Tax-Exempt
Income |
Fidelity Pennsylvania Municipal Income Fund | $ 15,776,599 |
Fidelity Pennsylvania Municipal Money Market Fund | 66,105 |
Short-Term Trading (Redemption) Fees. Shares held by investors in the Income Fund less than 30 days are subject to a redemption fee equal to ..50% of the net asset value of shares redeemed. All redemption fees, which reduce the proceeds of the shareholder redemption, are retained by the Fund and accounted for as an addition to paid in capital.
4. Purchases and Sales of Investments.
Purchases and sales of securities, other than short-term securities, for the Income Fund aggregated $113,312,762 and $73,112,425, respectively.
5. Fees and Other Transactions with Affiliates.
Management Fee. FMR and its affiliates provide the Income Fund with investment management related services for which the Fund pays a monthly management fee. The management fee is the sum of an individual fund fee rate that is based on an annual rate of .25% of the Fund's average net assets and an annualized group fee rate that averaged .12% during the period. The group fee rate is based upon the average net assets of all the mutual funds advised by FMR. The group fee rate decreases as assets under management increase and increases as assets under management decrease. For the period, the total annual management fee rate was .37% of the Fund's average net assets.
FMR and its affiliates provide the Money Market Fund with investment management related services for which the Fund pays a monthly management fee that is based on an annual rate of .50% of the Fund's average net assets. Under the management contract, FMR pays all other expenses, except the compensation of the independent Trustees and certain other expenses such as interest expense, including commitment fees. The
Annual Report
Notes to Financial Statements - continued
5. Fees and Other Transactions with Affiliates - continued
Management Fee - continued
management fee paid to FMR by the Fund is reduced by an amount equal to the fees and expenses paid by the Fund to the independent Trustees.
Transfer Agent and Accounting Fees. Citibank, N.A. (Citibank) is the custodian, transfer agent and servicing agent for the Funds. Citibank has entered into a sub-arrangement with Fidelity Investments Institutional Operations Company, Inc. (FIIOC), an affiliate of FMR, under which FIIOC performs the activities associated with the Funds' transfer agency, dividend disbursing and shareholder servicing functions. Under the terms of the management fee contract, FMR pays transfer agent fees on behalf of the Money Market Fund(s). The Income Fund pays Citibank account fees and asset-based fees that vary according to account size and type of account. FIIOC pays for typesetting, printing and mailing of shareholder reports, except proxy statements. For the period, the Income Fund's transfer agent fees were equivalent to the following annual rates expressed as a percentage of average net assets:
Fidelity Pennsylvania Municipal Income Fund | .08% |
Citibank also has a sub-arrangement with Fidelity Service Company, Inc. (FSC), an affiliate of FMR, under which FSC maintains the Fund's accounting records. The fee is paid to Citibank and is based on the level of average net assets for each month.
6. Committed Line of Credit.
The Income Fund participates with other funds managed by FMR or an affiliate in a $4.25 billion credit facility (the "line of credit") to be utilized for temporary or emergency purposes to fund shareholder redemptions or for other short-term liquidity purposes. The participating funds have agreed to pay commitment fees on their pro-rata portion of the line of credit, which are reflected in Miscellaneous expenses on the Statement of Operations, and are as follows:
Fidelity Pennsylvania Municipal Income Fund | $ 1,216 |
During the period, there were no borrowings on this line of credit.
7. Expense Reductions.
FMR or its affiliates voluntarily agreed to waive certain fees for the Money Market Fund in order to maintain a minimum annualized yield of .01%. Such arrangements may be discontinued by FMR at any time. For the period, the amount of the waiver was $2,176,804.
Annual Report
7. Expense Reductions - continued
Through arrangements with the Income Fund's and Market Market Fund, credits realized as a result of uninvested cash balances were used to reduce fund expenses. These expense reductions are noted in the table below.
| Custody
expense
reduction | Transfer
Agent
expense
reduction | Accounting
expense
reduction |
| | | |
Fidelity Pennsylvania Municipal Income Fund | $ 4,766 | $ 5,116 | $ 4 |
Fidelity Pennsylvania Municipal Money Market Fund | 1,240 | 1,072 | - |
8. Other.
The Funds' organizational documents provide former and current trustees and officers with a limited indemnification against liabilities arising in connection with the performance of their duties to the Funds. In the normal course of business, the Funds may also enter into contracts that provide general indemnifications. The Funds' maximum exposure under these arrangements is unknown as this would be dependent on future claims that may be made against the Funds. The risk of material loss from such claims is considered remote.
Annual Report
To the Trustees of Fidelity Municipal Trust and Fidelity Municipal Trust II and the Shareholders of Fidelity Pennsylvania Municipal Income Fund and Fidelity Pennsylvania Municipal Money Market Fund:
In our opinion, the accompanying statements of assets and liabilities, including the schedules of investments, and the related statements of operations and of changes in net assets and the financial highlights present fairly, in all material respects, the financial position of Fidelity Pennsylvania Municipal Income Fund (a fund of Fidelity Municipal Trust) and Fidelity Pennsylvania Municipal Money Market Fund a fund of Fidelity Municipal Trust II) at December 31, 2012, the results of each of their operations for the year then ended, the changes in their net assets for each of the two years in the period then ended and the financial highlights for each of the five years in the period then ended, in conformity with accounting principles generally accepted in the United States of America. These financial statements and financial highlights (hereafter referred to as "financial statements") are the responsibility of the Fidelity Municipal Trust's and Fidelity Municipal Trust II's management. Our responsibility is to express an opinion on these financial statements based on our audits. We conducted our audits of these financial statements in accordance with the standards of the Public Company Accounting Oversight Board (United States). Those standards require that we plan and perform the audit to obtain reasonable assurance about whether the financial statements are free of material misstatement. An audit includes examining, on a test basis, evidence supporting the amounts and disclosures in the financial statements, assessing the accounting principles used and significant estimates made by management, and evaluating the overall financial statement presentation. We believe that our audits, which included confirmation of securities at December 31, 2012 by correspondence with the custodian and brokers, provide a reasonable basis for our opinion.
PricewaterhouseCoopers LLP
Boston, Massachusetts
February 14, 2013
Annual Report
The Trustees and executive officers of the trusts and funds, as applicable, are listed below. The Board of Trustees governs each fund and is responsible for protecting the interests of shareholders. The Trustees are experienced executives who meet periodically throughout the year to oversee each fund's activities, review contractual arrangements with companies that provide services to each fund, oversee management of the risks associated with such activities and contractual arrangements, and review each fund's performance. Except for Elizabeth S. Acton and James C. Curvey, each of the Trustees oversees 218 funds advised by FMR or an affiliate. Ms. Acton oversees 200 funds advised by FMR or an affiliate. Mr. Curvey oversees 452 funds advised by FMR or an affiliate.
The Trustees hold office without limit in time except that (a) any Trustee may resign; (b) any Trustee may be removed by written instrument, signed by at least two-thirds of the number of Trustees prior to such removal; (c) any Trustee who requests to be retired or who has become incapacitated by illness or injury may be retired by written instrument signed by a majority of the other Trustees; and (d) any Trustee may be removed at any special meeting of shareholders by a two-thirds vote of the outstanding voting securities of the trust. Each Trustee who is not an interested person (as defined in the 1940 Act) (Independent Trustee), shall retire not later than the last day of the month in which his or her 75th birthday occurs. The Independent Trustees may waive this mandatory retirement age policy with respect to individual Trustees. The executive officers hold office without limit in time, except that any officer may resign or may be removed by a vote of a majority of the Trustees at any regular meeting or any special meeting of the Trustees. Except as indicated, each individual has held the office shown or other offices in the same company for the past five years.
Experience, Skills, Attributes, and Qualifications of the Funds' Trustees. The Governance and Nominating Committee has adopted a statement of policy that describes the experience, qualifications, attributes, and skills that are necessary and desirable for potential Independent Trustee candidates (Statement of Policy). The Board believes that each Trustee satisfied at the time he or she was initially elected or appointed a Trustee, and continues to satisfy, the standards contemplated by the Statement of Policy. The Governance and Nominating Committee also engages professional search firms to help identify potential Independent Trustee candidates who have the experience, qualifications, attributes, and skills consistent with the Statement of Policy. From time to time, additional criteria based on the composition and skills of the current Independent Trustees, as well as experience or skills that may be appropriate in light of future changes to board composition, business conditions, and regulatory or other developments, have also been considered by the professional search firms and the Governance and Nominating Committee. In addition, the Board takes into account the Trustees' commitment and participation in Board and committee meetings, as well as their leadership of standing and ad hoc committees throughout their tenure.
In determining that a particular Trustee was and continues to be qualified to serve as a Trustee, the Board has considered a variety of criteria, none of which, in isolation, was controlling. The Board believes that, collectively, the Trustees have balanced and diverse experience, qualifications, attributes, and skills, which allow the Board to operate effectively in governing each fund and protecting the interests of shareholders. Information about the specific experience, skills, attributes, and qualifications of each Trustee, which in each case led to the Board's conclusion that the Trustee should serve (or continue to serve) as a trustee of the funds, is provided below.
Annual Report
Trustees and Officers - continued
Board Structure and Oversight Function. Abigail P. Johnson is an interested person (as defined in the 1940 Act) and currently serves as Chairman. The Trustees have determined that an interested Chairman is appropriate and benefits shareholders because an interested Chairman has a personal and professional stake in the quality and continuity of services provided to the funds. Independent Trustees exercise their informed business judgment to appoint an individual of their choosing to serve as Chairman, regardless of whether the Trustee happens to be independent or a member of management. The Independent Trustees have determined that they can act independently and effectively without having an Independent Trustee serve as Chairman and that a key structural component for assuring that they are in a position to do so is for the Independent Trustees to constitute a substantial majority for the Board. The Independent Trustees also regularly meet in executive session. Albert R. Gamper, Jr. serves as Chairman of the Independent Trustees and as such (i) acts as a liaison between the Independent Trustees and management with respect to matters important to the Independent Trustees and (ii) with management prepares agendas for Board meetings.
Fidelity funds are overseen by different Boards of Trustees. The funds' Board oversees Fidelity's investment-grade bond, money market, and asset allocation funds and another Board oversees Fidelity's equity and high income funds. The asset allocation funds may invest in Fidelity funds that are overseen by such other Board. The use of separate Boards, each with its own committee structure, allows the Trustees of each group of Fidelity funds to focus on the unique issues of the funds they oversee, including common research, investment, and operational issues. On occasion, the separate Boards establish joint committees to address issues of overlapping consequences for the Fidelity funds overseen by each Board.
The Trustees operate using a system of committees to facilitate the timely and efficient consideration of all matters of importance to the Trustees, each fund, and fund shareholders and to facilitate compliance with legal and regulatory requirements and oversight of the funds' activities and associated risks. The Board, acting through its committees, has charged FMR and its affiliates with (i) identifying events or circumstances the occurrence of which could have demonstrably adverse effects on the funds' business and/or reputation; (ii) implementing processes and controls to lessen the possibility that such events or circumstances occur or to mitigate the effects of such events or circumstances if they do occur; and (iii) creating and maintaining a system designed to evaluate continuously business and market conditions in order to facilitate the identification and implementation processes described in (i) and (ii) above. Because the day-to-day operations and activities of the funds are carried out by or through FMR, its affiliates and other service providers, the funds' exposure to risks is mitigated but not eliminated by the processes overseen by the Trustees. While each of the Board's committees has responsibility for overseeing different aspects of the funds' activities, oversight is exercised primarily through the Operations and Audit Committees. In addition, an ad hoc Board committee of Independent Trustees has worked with FMR to enhance the Board's oversight of investment and financial risks, legal and regulatory risks, technology risks, and operational risks, including the development of additional risk reporting to the Board. The Operations Committee also worked and continues to work with FMR to enhance the stress tests required under SEC regulations for money market funds. Appropriate personnel, including but not limited to the funds' Chief Compliance Officer (CCO), FMR's internal auditor, the independent accountants, the funds' Treasurer and portfolio management personnel, make periodic reports to the Board's committees, as appropriate, including an annual review of FMR's risk management program for the Fidelity funds. The responsibilities of each standing committee, including their oversight responsibilities, are described further under "Standing Committees of the Funds' Trustees."
Annual Report
The funds' Statement of Additional Information (SAI) includes more information about the Trustees. To request a free copy, call Fidelity at 1-800-544-8544.
Interested Trustees*:
Correspondence intended for each Trustee who is an interested person may be sent to Fidelity Investments, 82 Devonshire Street, Boston, Massachusetts 02109.
Name, Age; Principal Occupations and Other Relevant Experience+ |
Abigail P. Johnson (51) |
| Year of Election or Appointment: 2009 Ms. Johnson is Trustee and Chairman of the Board of Trustees of certain Trusts. Ms. Johnson serves as President of Fidelity Financial Services (2012-present) and President of Personal, Workplace and Institutional Services (2005-present). Ms. Johnson is Chairman and Director of FMR Co., Inc. (2011-present), Chairman and Director of FMR (2011-present), and the Vice Chairman and Director (2007-present) of FMR LLC. Previously, Ms. Johnson served as President and a Director of FMR (2001-2005), a Trustee of other investment companies advised by FMR, Fidelity Investments Money Management, Inc., and FMR Co., Inc. (2001-2005), Senior Vice President of the Fidelity funds (2001-2005), and managed a number of Fidelity funds. Ms. Abigail P. Johnson and Mr. Arthur E. Johnson are not related. |
James C. Curvey (77) |
| Year of Election or Appointment: 2007 Mr. Curvey also serves as Trustee (2007-present) of other investment companies advised by FMR. Mr. Curvey is a Director of Fidelity Investments Money Management, Inc. (2009-present), Director of Fidelity Research & Analysis Co. (2009-present) and Director of FMR and FMR Co., Inc. (2007-present). Mr. Curvey is also Vice Chairman (2007-present) and Director of FMR LLC. In addition, Mr. Curvey serves as an Overseer for the Boston Symphony Orchestra and a member of the Trustees of Villanova University. Previously, Mr. Curvey was the Vice Chairman (2006-2007) and Director (2000-2007) of FMR Corp. |
* Trustees have been determined to be "Interested Trustees" by virtue of, among other things, their affiliation with the trusts or various entities under common control with FMR.
+ The information above includes each Trustee's principal occupation during the last five years and other information relating to the experience, attributes, and skills relevant to each Trustee's qualifications to serve as a Trustee, which led to the conclusion that each Trustee should serve as a Trustee for each fund.
Independent Trustees:
Correspondence intended for each Independent Trustee (that is, the Trustees other than the Interested Trustees) may be sent to Fidelity Investments, P.O. Box 55235, Boston, Massachusetts 02205-5235.
Name, Age; Principal Occupations and Other Relevant Experience+ |
Elizabeth S. Acton (61) |
| Year of Election or Appointment: 2013 Ms. Acton is Trustee of certain Trusts. Prior to her retirement in April 2012, Ms. Acton was Executive Vice President, Finance (November 2011-April 2012), Executive Vice President, Chief Financial Officer (April 2002-November 2011), and Treasurer (May 2004-May 2005) of Comerica Incorporated (financial services). Prior to joining Comerica, Ms. Acton held a variety of positions at Ford Motor Company (1983-2002), including Vice President and Treasurer (2000-2002) and Executive Vice President and Chief Financial Officer of Ford Motor Credit Company (1998-2000). Ms. Acton currently serves as a member of the Board of Directors and Audit and Finance Committees of Beazer Homes USA, Inc. (homebuilding, 2012-present). |
Albert R. Gamper, Jr. (70) |
| Year of Election or Appointment: 2006 Mr. Gamper is Chairman of the Independent Trustees of the Fixed Income and Asset Allocation Funds (2012-present). Prior to his retirement in December 2004, Mr. Gamper served as Chairman of the Board of CIT Group Inc. (commercial finance). During his tenure with CIT Group Inc. Mr. Gamper served in numerous senior management positions, including Chairman (1987-1989; 1999-2001; 2002-2004), Chief Executive Officer (1987-2004), and President (2002-2003). Mr. Gamper currently serves as a member of the Board of Directors of Public Service Enterprise Group (utilities, 2000-present), a member of the Board of Trustees, Rutgers University (2004-present), and Chairman of the Board of Barnabas Health Care System. Previously, Mr. Gamper served as Vice Chairman of the Independent Trustees of the Fixed Income and Asset Allocation Funds (2011-2012) and as Chairman of the Board of Governors, Rutgers University (2004-2007). |
Robert F. Gartland (61) |
| Year of Election or Appointment: 2010 Mr. Gartland is Chairman and an investor in Gartland and Mellina Group Corp. (consulting, 2009-present). Previously, Mr. Gartland served as a partner and investor of Vietnam Partners LLC (investments and consulting, 2008-2011). Prior to his retirement, Mr. Gartland held a variety of positions at Morgan Stanley (financial services, 1979-2007) including Managing Director (1987-2007). |
Arthur E. Johnson (65) |
| Year of Election or Appointment: 2008 Mr. Johnson serves as a member of the Board of Directors of Eaton Corporation (diversified power management, 2009-present), AGL Resources, Inc. (holding company, 2002-present) and Booz Allen Hamilton (management consulting, 2011-present). Prior to his retirement, Mr. Johnson served as Senior Vice President of Corporate Strategic Development of Lockheed Martin Corporation (defense contractor, 1999-2009). He previously served on the Board of Directors of IKON Office Solutions, Inc. (1999-2008) and Delta Airlines (2005-2007). Mr. Arthur E. Johnson is not related to Ms. Abigail P. Johnson. |
Michael E. Kenneally (58) |
| Year of Election or Appointment: 2009 Previously, Mr. Kenneally served as a Member of the Advisory Board for certain Fidelity Fixed Income and Asset Allocation Funds (2008-2009). Prior to his retirement, Mr. Kenneally served as Chairman and Global Chief Executive Officer of Credit Suisse Asset Management (2003-2005). Mr. Kenneally was a Director of the Credit Suisse Funds (U.S. mutual funds, 2004-2008) and certain other closed-end funds (2004-2005) and was awarded the Chartered Financial Analyst (CFA) designation in 1991. |
James H. Keyes (72) |
| Year of Election or Appointment: 2007 Mr. Keyes serves as a member of the Boards of Navistar International Corporation (manufacture and sale of trucks, buses, and diesel engines, since 2002) and Pitney Bowes, Inc. (integrated mail, messaging, and document management solutions, since 1998). Prior to his retirement, Mr. Keyes served as Chairman and Chief Executive Officer of Johnson Controls (automotive, building, and energy, 1998-2002) and as a member of the Board of LSI Logic Corporation (semiconductor technologies, 1984-2008). |
Marie L. Knowles (66) |
| Year of Election or Appointment: 2001 Ms. Knowles is Vice Chairman of the Independent Trustees of the Fixed Income and Asset Allocation Funds (2012-present). Prior to Ms. Knowles' retirement in June 2000, she served as Executive Vice President and Chief Financial Officer of Atlantic Richfield Company (ARCO) (diversified energy, 1996-2000). From 1993 to 1996, she was a Senior Vice President of ARCO and President of ARCO Transportation Company. She served as a Director of ARCO from 1996 to 1998. Ms. Knowles currently serves as a Director and Chairman of the Audit Committee of McKesson Corporation (healthcare service, since 2002). Ms. Knowles is an Honorary Trustee of the Brookings Institution and a member of the Board of the Catalina Island Conservancy and of the Santa Catalina Island Company (2009-present). She also serves as a member of the Advisory Board for the School of Engineering of the University of Southern California and the Foundation Board of the School of Architecture at the University of Virginia (2007-present). Previously, Ms. Knowles served as a Director of Phelps Dodge Corporation (copper mining and manufacturing, 1994-2007). |
Kenneth L. Wolfe (73) |
| Year of Election or Appointment: 2005 Prior to his retirement, Mr. Wolfe served as Chairman and a Director (2007-2009) and Chairman and Chief Executive Officer (1994-2001) of Hershey Foods Corporation. He also served as a member of the Boards of Adelphia Communications Corporation (telecommunications, 2003-2006), Bausch & Lomb, Inc. (medical/pharmaceutical, 1993-2007), and Revlon, Inc. (personal care products, 2004-2009). Mr. Wolfe previously served as Chairman of the Independent Trustees of the Fixed Income and Asset Allocation Funds (2008-2012). |
+ The information above includes each Trustee's principal occupation during the last five years and other information relating to the experience, attributes, and skills relevant to each Trustee's qualifications to serve as a Trustee, which led to the conclusion that each Trustee should serve as a Trustee for each fund.
Executive Officers:
Correspondence intended for each executive officer may be sent to Fidelity Investments, 82 Devonshire Street, Boston, Massachusetts 02109.
Name, Age; Principal Occupation |
Stephanie J. Dorsey (43) |
| Year of Election or Appointment: 2013 President and Treasurer of Fidelity's Fixed Income and Asset Allocation Funds. Ms. Dorsey also serves as Assistant Treasurer of other Fidelity funds (2010-present) and is an employee of Fidelity Investments (2008-present). Previously, Ms. Dorsey served as Deputy Treasurer of Fidelity's Fixed Income and Asset Allocation Funds (2008-2013), Treasurer (2004-2008) of the JPMorgan Mutual Funds and Vice President (2004-2008) of JPMorgan Chase Bank. |
Charles S. Morrison (52) |
| Year of Election or Appointment: 2012 Vice President of Fidelity's Fixed Income and Asset Allocation Funds. Mr. Morrison also serves as President, Fixed Income and is an employee of Fidelity Investments. Previously, Mr. Morrison served as Vice President of Fidelity's Money Market Funds (2005-2009), President, Money Market Group Leader of FMR (2009), and Senior Vice President, Money Market Group of FMR (2004-2009). Mr. Morrison also served as Vice President of Fidelity's Bond Funds (2002-2005), certain Balanced Funds (2002-2005), and certain Asset Allocation Funds (2002-2007), and as Senior Vice President (2002-2005) of Fidelity's Fixed Income Division. |
Robert P. Brown (49) |
| Year of Election or Appointment: 2012 Vice President of Fidelity's Bond Funds. Mr. Brown also serves as Executive Vice President of Fidelity Investments Money Management, Inc. (2010-present), President, Bond Group of FMR (2011-present), Director and Managing Director, Research of Fidelity Management & Research (U.K.) Inc. (2008-present) and is an employee of Fidelity Investments. Previously, Mr. Brown served as President, Money Market Group of FMR (2010-2011) and Vice President of Fidelity's Money Market Funds (2010-2012). |
Nancy D. Prior (45) |
| Year of Election or Appointment: 2012 Vice President of Fidelity's Money Market Funds. Ms. Prior also serves as President, Money Market Group of FMR (2011-present) and is an employee of Fidelity Investments (2002-present). Previously, Ms. Prior served as Managing Director of Research (2009-2011), Senior Vice President and Deputy General Counsel (2007-2009), and Assistant Secretary of Fidelity's Fixed Income and Asset Allocation Funds (2008-2009). |
Scott C. Goebel (44) |
| Year of Election or Appointment: 2008 Secretary and Chief Legal Officer (CLO) of the Fidelity funds. Mr. Goebel also serves as Secretary of Fidelity Investments Money Management, Inc. (FIMM) (2010-present) and Fidelity Research and Analysis Company (FRAC) (2010-present); Secretary and CLO of The North Carolina Capital Management Trust: Cash and Term Portfolios (2008-present); General Counsel, Secretary, and Senior Vice President of FMR (2008-present) and FMR Co., Inc. (2008-present); employed by FMR LLC or an affiliate (2001-present); Chief Legal Officer of Fidelity Management & Research (Hong Kong) Limited (2008-present) and Assistant Secretary of Fidelity Management & Research (Japan) Inc. (2008-present), and Fidelity Management & Research (U.K.) Inc. (2008-present). Previously, Mr. Goebel served as Assistant Secretary of FIMM (2008-2010), FRAC (2008-2010), and the Funds (2007-2008) and as Vice President and Secretary of Fidelity Distributors Corporation (FDC) (2005-2007). |
Ramon Herrera (38) |
| Year of Election or Appointment: 2012 Assistant Secretary of Fidelity's Fixed Income and Asset Allocation Funds. Mr. Herrera also serves as Vice President, Associate General Counsel (2010-present) and is an employee of Fidelity Investments (2004-present). |
Elizabeth Paige Baumann (44) |
| Year of Election or Appointment: 2012 Anti-Money Laundering (AML) Officer of the Fidelity funds. Ms. Baumann also serves as AML Officer of The North Carolina Capital Management Trust: Cash and Term Portfolios (2012-present), Chief AML Officer of FMR LLC (2012-present), and is an employee of Fidelity Investments. Previously, Ms. Baumann served as Vice President and Deputy Anti-Money Laundering Officer (2007-2012). |
Christine Reynolds (54) |
| Year of Election or Appointment: 2008 Chief Financial Officer of the Fidelity funds. Ms. Reynolds became President of Fidelity Pricing and Cash Management Services (FPCMS) in August 2008. Ms. Reynolds served as Chief Operating Officer of FPCMS (2007-2008). Previously, Ms. Reynolds served as President, Treasurer, and Anti-Money Laundering officer of the Fidelity funds (2004-2007). |
Michael H. Whitaker (45) |
| Year of Election or Appointment: 2008 Chief Compliance Officer of Fidelity's Fixed Income and Asset Allocation Funds. Mr. Whitaker also serves as Chief Compliance Officer of The North Carolina Capital Management Trust: Cash and Term Portfolios (2008-present). Mr. Whitaker is an employee of Fidelity Investments (2007-present). Prior to joining Fidelity Investments, Mr. Whitaker worked at MFS Investment Management where he served as Senior Vice President and Chief Compliance Officer (2004-2006), and Assistant General Counsel. |
Joseph F. Zambello (55) |
| Year of Election or Appointment: 2011 Deputy Treasurer of the Fidelity funds. Mr. Zambello is an employee of Fidelity Investments. Previously, Mr. Zambello served as Vice President of FMR's Program Management Group (2009-2011) and Vice President of the Transfer Agent Oversight Group (2005-2009). |
Stephen Sadoski (41) |
| Year of Election or Appointment: 2013 Deputy Treasurer of Fidelity's Fixed Income and Asset Allocation Funds. Mr. Sadoski also serves as Deputy Treasurer of other Fidelity funds (2012-present) and is an employee of Fidelity Investments (2012-present). Previously, Mr. Sadoski served as Assistant Treasurer of Fidelity's Fixed Income and Asset Allocation Funds (2012-2013), an assistant chief accountant in the Division of Investment Management of the Securities and Exchange Commission (SEC) (2009-2012) and as a senior manager at Deloitte & Touche (1997-2009). |
Adrien E. Deberghes (45) |
| Year of Election or Appointment: 2010 Assistant Treasurer of Fidelity's Fixed Income and Asset Allocation Funds. Mr. Deberghes also serves as Vice President and Assistant Treasurer (2011-present) and Deputy Treasurer (2008-present) of other Fidelity funds, and is an employee of Fidelity Investments (2008-present). Previously, Mr. Deberghes served as Senior Vice President of Mutual Fund Administration at State Street Corporation (2007-2008), Senior Director of Mutual Fund Administration at Investors Bank & Trust (2005-2007), and Director of Finance for Dunkin' Brands (2000-2005). |
Kenneth B. Robins (43) |
| Year of Election or Appointment: 2009 Assistant Treasurer of the Fidelity Fixed Income and Asset Allocation Funds. Mr. Robins also serves as President and Treasurer of other Fidelity funds (2008-present; 2010-present) and is an employee of Fidelity Investments (2004-present). Previously, Mr. Robins served as Deputy Treasurer of the Fidelity funds (2005-2008) and Treasurer and Chief Financial Officer of The North Carolina Capital Management Trust: Cash and Term Portfolios (2006-2008). |
Gary W. Ryan (54) |
| Year of Election or Appointment: 2005 Assistant Treasurer of the Fidelity funds. Mr. Ryan is an employee of Fidelity Investments. Previously, Mr. Ryan served as Vice President of Fund Reporting in Fidelity Pricing and Cash Management Services (FPCMS) (1999-2005). |
Jonathan Davis (44) |
| Year of Election or Appointment: 2010 Assistant Treasurer of the Fidelity funds. Mr. Davis is also Assistant Treasurer of Fidelity Rutland Square Trust II and Fidelity Commonwealth Trust II. Mr. Davis is an employee of Fidelity Investments. Previously, Mr. Davis served as Vice President and Associate General Counsel of FMR LLC (2003-2010). |
Annual Report
The Board of Trustees of each fund voted to pay to shareholders of record at the opening of business on record date, the following distributions per share derived from capital gains realized from sales of portfolio securities:
Fund | Pay Date | Record Date | Capital Gains |
| | | |
Fidelity Pennsylvania Municipal Income Fund | 02/11/13 | 02/08/13 | $0.006 |
Fidelity Pennsylvania Municipal Money Market Fund | 02/11/13 | 02/08/13 | $0.000 |
The funds hereby designate as capital gain dividend the amounts noted below for the taxable year ended December 31, 2012, or, if subsequently determined to be different, the net capital gain of such year.
Fund | |
Fidelity Pennsylvania Municipal Income Fund | $ 1,305,106 |
Fidelity Pennsylvania Municipal Money Market Fund | $ 3,644 |
During fiscal year ended 2012, 100% of each fund's income dividends were free from federal income tax, and 2.83% of Fidelity Pennsylvania Municipal Income Fund and 16.27% of Fidelity Pennsylvania Municipal Money Market's income dividends were subject to the federal alternative minimum tax.
The fund will notify shareholders in January 2013 of amounts for use in preparing 2012 income tax returns.
Annual Report
Board Approval of Investment Advisory Contracts and Management Fees
Fidelity Pennsylvania Municipal Income Fund / Fidelity Pennsylvania Municipal Money Market Fund
Each year, the Board of Trustees, including the Independent Trustees (together, the Board), votes on the renewal of the management contract and sub-advisory agreements (together, the Advisory Contracts) for each fund. The Board, assisted by the advice of fund counsel and Independent Trustees' counsel, requests and considers a broad range of information relevant to the renewal of the Advisory Contracts throughout the year.
The Board meets regularly and, at each of its meetings, covers an extensive agenda of topics and materials and considers factors that are relevant to its annual consideration of the renewal of each fund's Advisory Contracts, including the services and support provided to each fund and its shareholders. The Board has established three standing committees, Operations, Audit, and Governance and Nominating, each composed of and chaired by Independent Trustees with varying backgrounds, to which the Board has assigned specific subject matter responsibilities in order to enhance effective decision-making by the Board. The Operations Committee, of which all of the Independent Trustees are members, meets regularly throughout the year and, among other matters, considers matters specifically related to the annual consideration of the renewal of each fund's Advisory Contracts. The Board, acting directly and through its Committees, requests and receives information concerning the annual consideration of the renewal of each fund's Advisory Contracts. The Board also meets as needed to consider matters specifically related to the Board's annual consideration of the renewal of Advisory Contracts. Members of the Board may also meet with trustees of other Fidelity funds through ad hoc joint committees to discuss certain matters relevant to the Fidelity funds.
At its September 2012 meeting, the Board of Trustees, including the Independent Trustees, unanimously determined to renew each fund's Advisory Contracts. In reaching its determination, the Board considered all factors it believed relevant, including (i) the nature, extent, and quality of the services to be provided to each fund and its shareholders (including the investment performance of each fund); (ii) the competitiveness of each fund's management fee and total expense ratio relative to peer funds; (iii) the total costs of the services to be provided by and the profits to be realized by Fidelity from its relationship with each fund; (iv) the extent to which economies of scale exist and would be realized as each fund grows; and (v) whether fee levels reflect these economies of scale, if any, for the benefit of fund shareholders.
In considering whether to renew the Advisory Contracts for each fund, the Board reached a determination, with the assistance of fund counsel and Independent Trustees' counsel and through the exercise of its business judgment, that the renewal of the Advisory Contracts is in the best interests of each fund and its shareholders and that the compensation payable under the Advisory Contracts is fair and reasonable. The Board's decision to renew the Advisory Contracts was not based on any single factor, but rather was based on a comprehensive consideration of all the information provided to the Board at its meetings throughout the year. The Board, in reaching its determination to renew the Advisory Contracts, was aware that shareholders in each fund have a broad range of investment choices available to them, including a wide choice among mutual funds offered by Fidelity's competitors, and that each fund's shareholders, who have the opportunity to review and weigh the disclosure provided by the fund in its prospectus and other public disclosures, have chosen to invest in that fund, managed by Fidelity.
Annual Report
Nature, Extent, and Quality of Services Provided. The Board considered the staffing within the investment adviser, FMR, and the sub-advisers (together, the Investment Advisers), including the backgrounds of the funds' investment personnel, and also considered the funds' investment objectives, strategies, and related investment philosophies. The Independent Trustees also had discussions with senior management of Fidelity's investment operations and investment groups. The Board considered the structure of the portfolio manager compensation program and whether this structure provides appropriate incentives to act in the best interests of each fund.
Resources Dedicated to Investment Management and Support Services. The Board reviewed the general qualifications and capabilities of the Investment Advisers' investment staff, including its size, education, experience, and resources, as well as the Investment Advisers' approach to recruiting, managing, and compensating investment personnel. The Board also noted that FMR has continued to increase the resources devoted to non-U.S. offices, including expansion of Fidelity's global investment organization. The Board noted that Fidelity's analysts have extensive resources, tools and capabilities that allow them to conduct sophisticated quantitative and fundamental analysis, as well as credit analysis of issuers, counterparties and guarantors. The Board also believes that Fidelity's investment professionals have sufficient access to global information and data so as to provide competitive investment results over time, and that those professionals also have access to sophisticated tools that permit them to assess portfolio construction and risk and performance attribution characteristics continuously, as well as to transmit new information and research conclusions rapidly around the world. Additionally, in its deliberations, the Board considered the Investment Advisers' trading and risk management capabilities and resources, which are an integral part of the investment management process.
Shareholder and Administrative Services. The Board considered (i) the nature, extent, quality, and cost of advisory, administrative, and shareholder services performed by the Investment Advisers and their affiliates under the Advisory Contracts and under separate agreements covering transfer agency and pricing and bookkeeping services for each fund; (ii) the nature and extent of the supervision of third party service providers, principally custodians and subcustodians; and (iii) the resources devoted to, and the record of compliance with, each fund's compliance policies and procedures.
The Board noted that the growth of fund assets over time across the complex allows Fidelity to reinvest in the development of services designed to enhance the value or convenience of the Fidelity funds as investment vehicles. These services include 24-hour access to account information and market information through telephone representatives and over the Internet, investor education materials and asset allocation tools, and the expanded availability of Fidelity Investor Centers.
Annual Report
Board Approval of Investment Advisory Contracts and
Management Fees - continued
Investment in a Large Fund Family. The Board considered the benefits to shareholders of investing in a Fidelity fund, including the benefits of investing in a fund that is part of a large family of funds offering a variety of investment disciplines and providing a large variety of mutual fund investor services. The Board noted that Fidelity had taken, or had made recommendations that resulted in the Fidelity funds taking, a number of actions over the previous year that benefited particular funds, including (i) continuing to dedicate additional resources to investment research and support of the senior management team that oversees asset management; (ii) persisting in efforts to enhance Fidelity's research capabilities, in particular, international research; (iii) launching new funds and making other enhancements to meet client needs for global and income-oriented solutions; (iv) continuing to launch dedicated lower cost underlying funds to meet investment management's portfolio construction needs related to expanding underlying fund options, specifically for the Freedom Fund product lines; (v) adopting a sector neutral investment approach for certain funds and utilizing a team of portfolio managers to manage certain sector-neutral funds; (vi) rationalizing product lines and gaining increased efficiencies through combinations of several funds with other funds; (vii) strengthening the Spartan Index Fund product line by adding new funds and/or new low-cost institutional share classes, restructuring fund expenses to accommodate new classes, and reducing investment minimums for certain classes of shares; (viii) modifying the eligibility criteria for Institutional Class shares to increase their appeal to government entities and charitable investors; and (ix) reducing certain transfer agent fee rates.
Investment Performance. The Board considered whether each fund has operated in accordance with its investment objective, as well as its record of compliance with its investment restrictions. It also reviewed each fund's absolute investment performance, as well as each fund's relative investment performance measured over multiple periods against (i) a broad-based securities market index (bond fund only, as money market funds are typically not compared against a market index), and (ii) a peer group of mutual funds deemed appropriate by Fidelity and reviewed by the Board. For each fund, the following charts considered by the Board show, over the one-, three-, and five-year periods ended December 31, 2011, the fund's cumulative total returns, the cumulative total returns of a broad-based securities market index ("benchmark") (bond fund only), and a range of cumulative total returns of a peer group of mutual funds identified by Lipper Inc. as having an investment objective similar to that of the fund. The box within each chart shows the 25th percentile return (top of box) and the 75th percentile return (bottom of box) of the peer group. Returns shown above the box are in the first quartile and returns shown below the box are in the fourth quartile. The percentage beaten number noted below each chart corresponds to the percentile box and represents the percentage of funds in the peer group whose performance was equal to or lower than that of the fund.
Annual Report
Fidelity Pennsylvania Municipal Income Fund
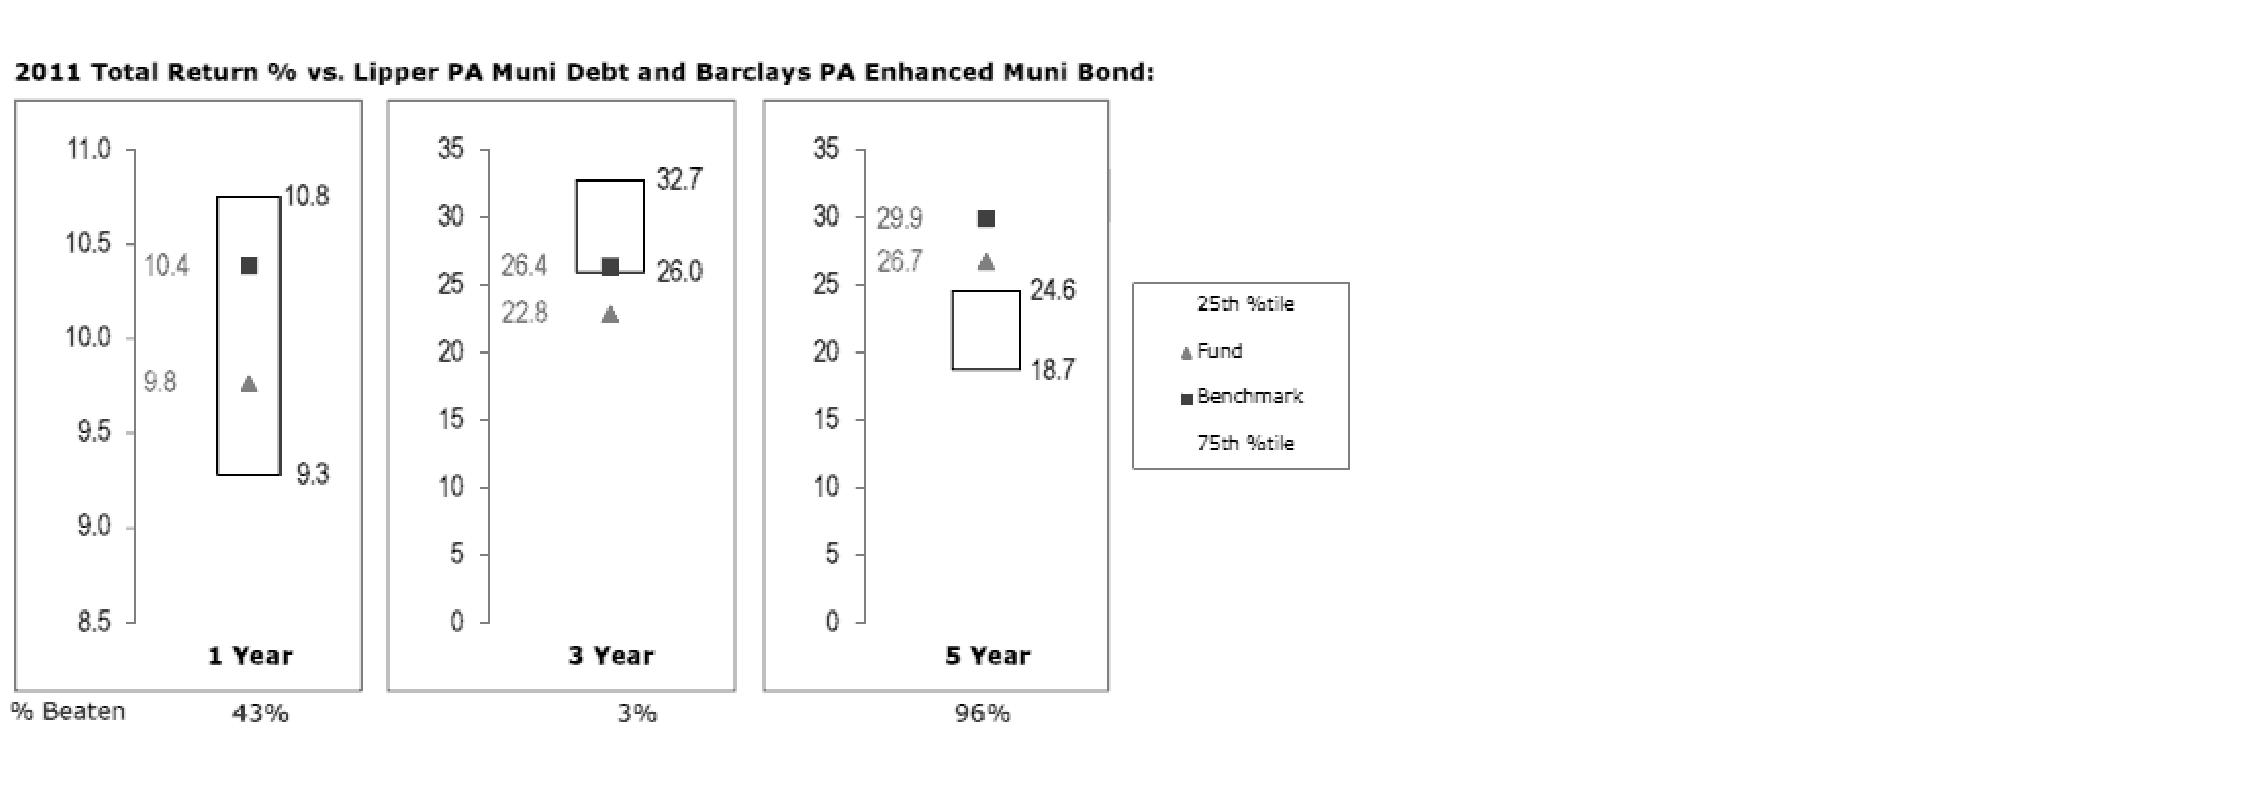
The Board reviewed the fund's relative investment performance against its peer group and noted that the performance of the fund was in the third quartile for the one-year period, the fourth quartile for the three-year period, and the first quartile for the five-year period. The Board also noted that the investment performance of the fund was lower than its benchmark for all the periods shown. The Board discussed with FMR actions to improve the fund's disappointing performance. The Board noted that this fund had underperformed in the past and discussed with FMR its disappointment with the continued underperformance of the fund. The Board noted that there was a portfolio management change for the fund in December 2011. The Board also reviewed the fund's performance since inception as well as performance in the current year. The Board will continue to closely monitor the performance of the fund in the coming year and discuss with FMR other appropriate actions to address the performance of the fund.
Annual Report
Board Approval of Investment Advisory Contracts and
Management Fees - continued
Fidelity Pennsylvania Municipal Money Market Fund
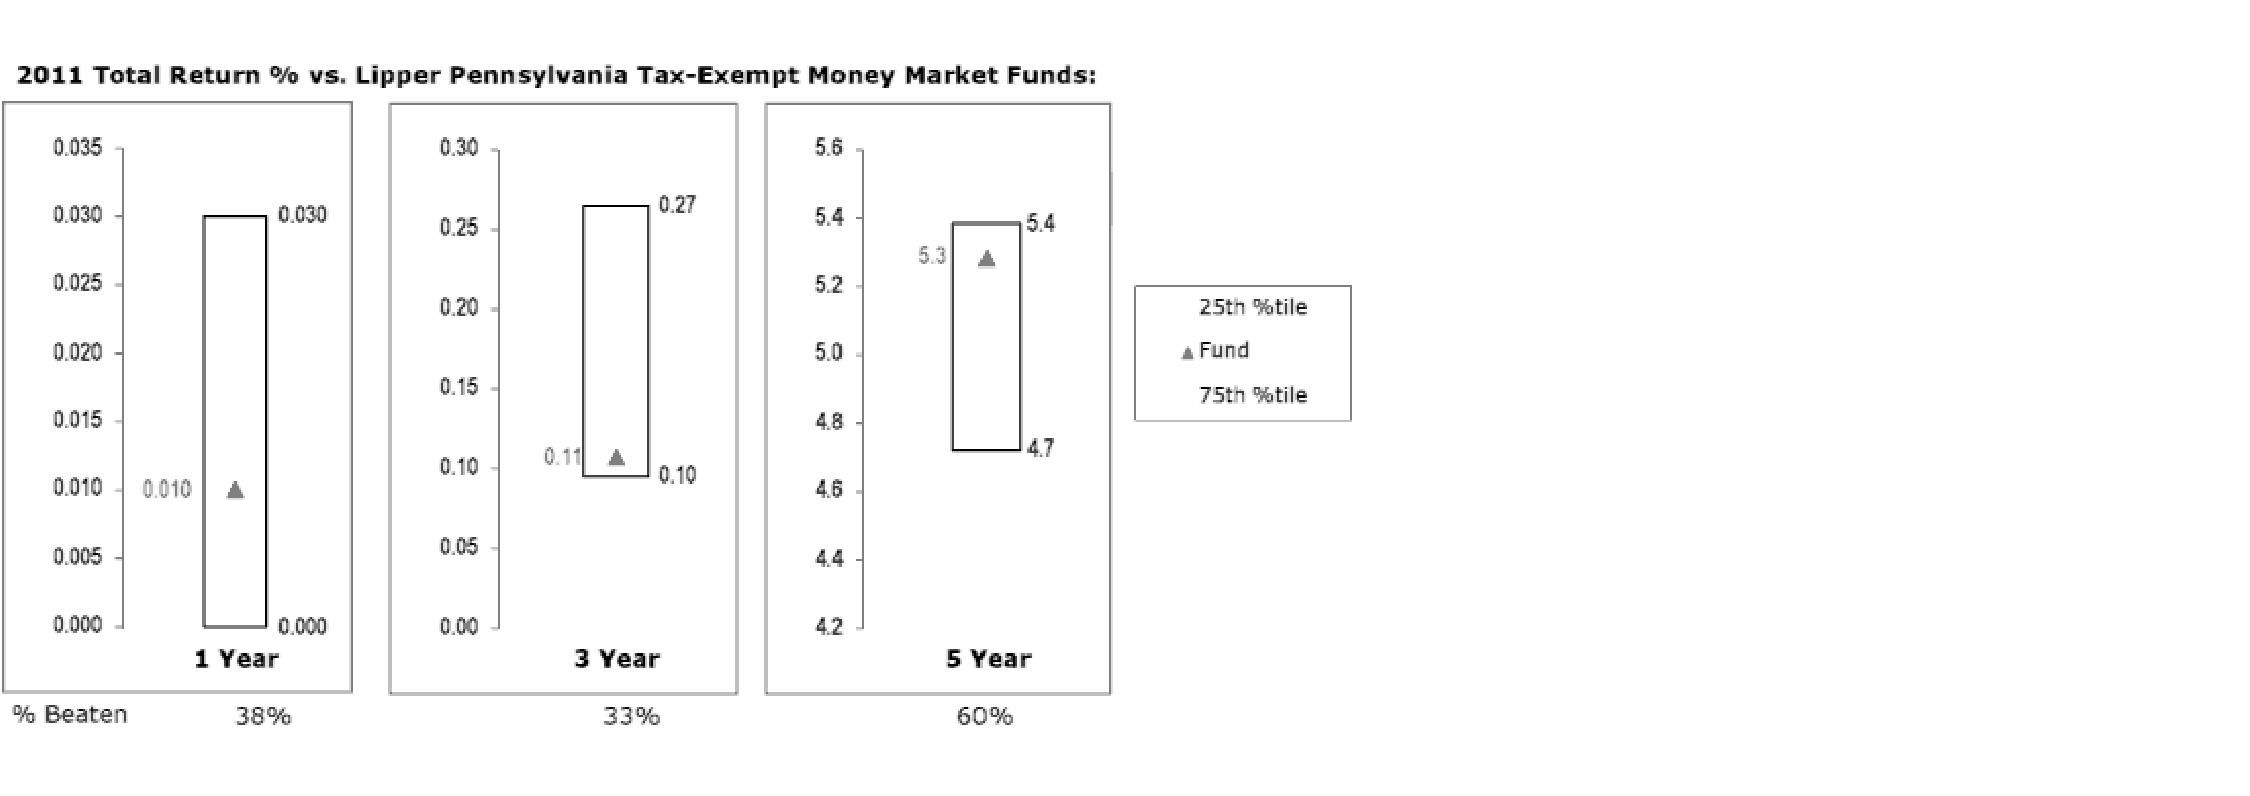
The Board reviewed the fund's relative investment performance against its peer group and noted that the performance of the fund was in the third quartile for the one- and three-year periods and the second quartile for the five-year period. The Board considered that FMR had taken steps to provide shareholders with stability of principal and to enhance safety and liquidity, which contributed to the fund's weakened performance relative to its peer group. The Board noted that there was a portfolio management change for the fund in December 2011. The Board also reviewed the fund's performance since inception as well as performance in the current year.
The Board noted as a general matter that the percentage beaten numbers for money market funds in recent years were less meaningful than in earlier years, as many competitors have been waiving fees to maintain a one basis point yield and performance differences among funds may not be apparent due to rounding.
Based on its review, the Board concluded that the nature, extent, and quality of services provided to each fund under the Advisory Contracts should benefit each fund's shareholders.
Competitiveness of Management Fee and Total Expense Ratio. The Board considered each fund's management fee and total expense ratio compared to "mapped groups" of competitive funds and classes. Fidelity creates "mapped groups" by combining similar Lipper investment objective categories that have comparable management fee characteristics. Combining Lipper investment objective categories aids the Board's management fee and total expense ratio comparisons by broadening the competitive group used for comparison and by reducing the number of universes to which various Fidelity funds are compared.
Annual Report
Management Fee. The Board considered two proprietary management fee comparisons for the 12-month periods shown in the charts below. The group of Lipper funds used by the Board for management fee comparisons is referred to below as the "Total Mapped Group" and, for the reasons explained above, is broader than the Lipper peer group used by the Board for performance comparisons. The Total Mapped Group comparison focuses on a fund's standing relative to the total universe of comparable funds available to investors in terms of gross management fees before expense reimbursements or caps. "TMG %" represents the percentage of funds in the Total Mapped Group that had management fees that were lower than a fund's. For example, a TMG % of 30% would mean that 70% of the funds in the Total Mapped Group had higher management fees than a fund. The "Asset-Size Peer Group" (ASPG) comparison focuses on a fund's standing relative to non-Fidelity funds similar in size to the fund within the Total Mapped Group. The ASPG represents at least 15% of the funds in the Total Mapped Group with comparable asset size and management fee characteristics, subject to a minimum of 50 funds (or all funds in the Total Mapped Group if fewer than 50). Additional information, such as the ASPG quartile in which a fund's management fee ranked, is also included in the charts and considered by the Board. Because the vast majority of competitor funds' management fees do not cover non-management expenses, for a more meaningful comparison of management fees, Fidelity Pennsylvania Municipal Money Market Fund is compared on the basis of a hypothetical "net management fee," which is derived by subtracting payments made by FMR for non-management expenses (including transfer agent fees, pricing and bookkeeping fees, and fees paid to non-affiliated custodians) from the fund's all-inclusive fee. In this regard, the Board considered that net management fees can vary from year to year because of differences in non-management expenses.
Annual Report
Board Approval of Investment Advisory Contracts and
Management Fees - continued
Fidelity Pennsylvania Municipal Income Fund
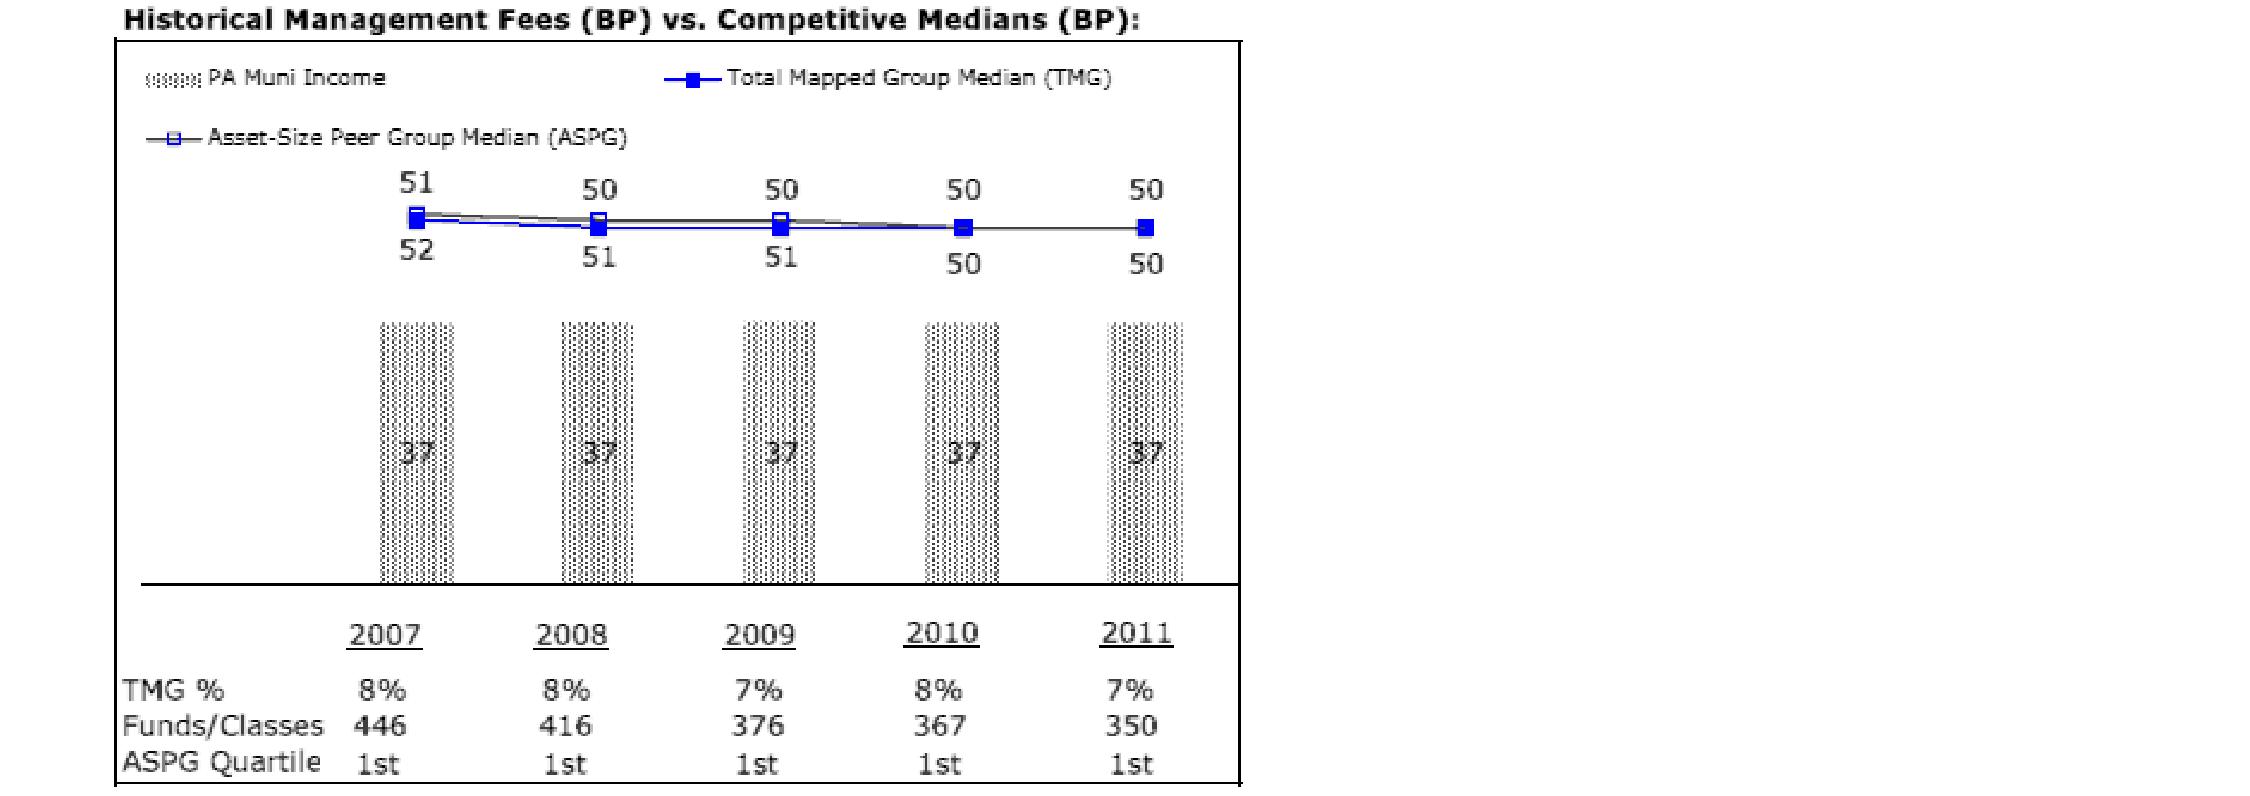
The Board noted that the fund's management fee ranked below the median of its Total Mapped Group and below the median of its ASPG for 2011.
Fidelity Pennsylvania Municipal Money Market Fund
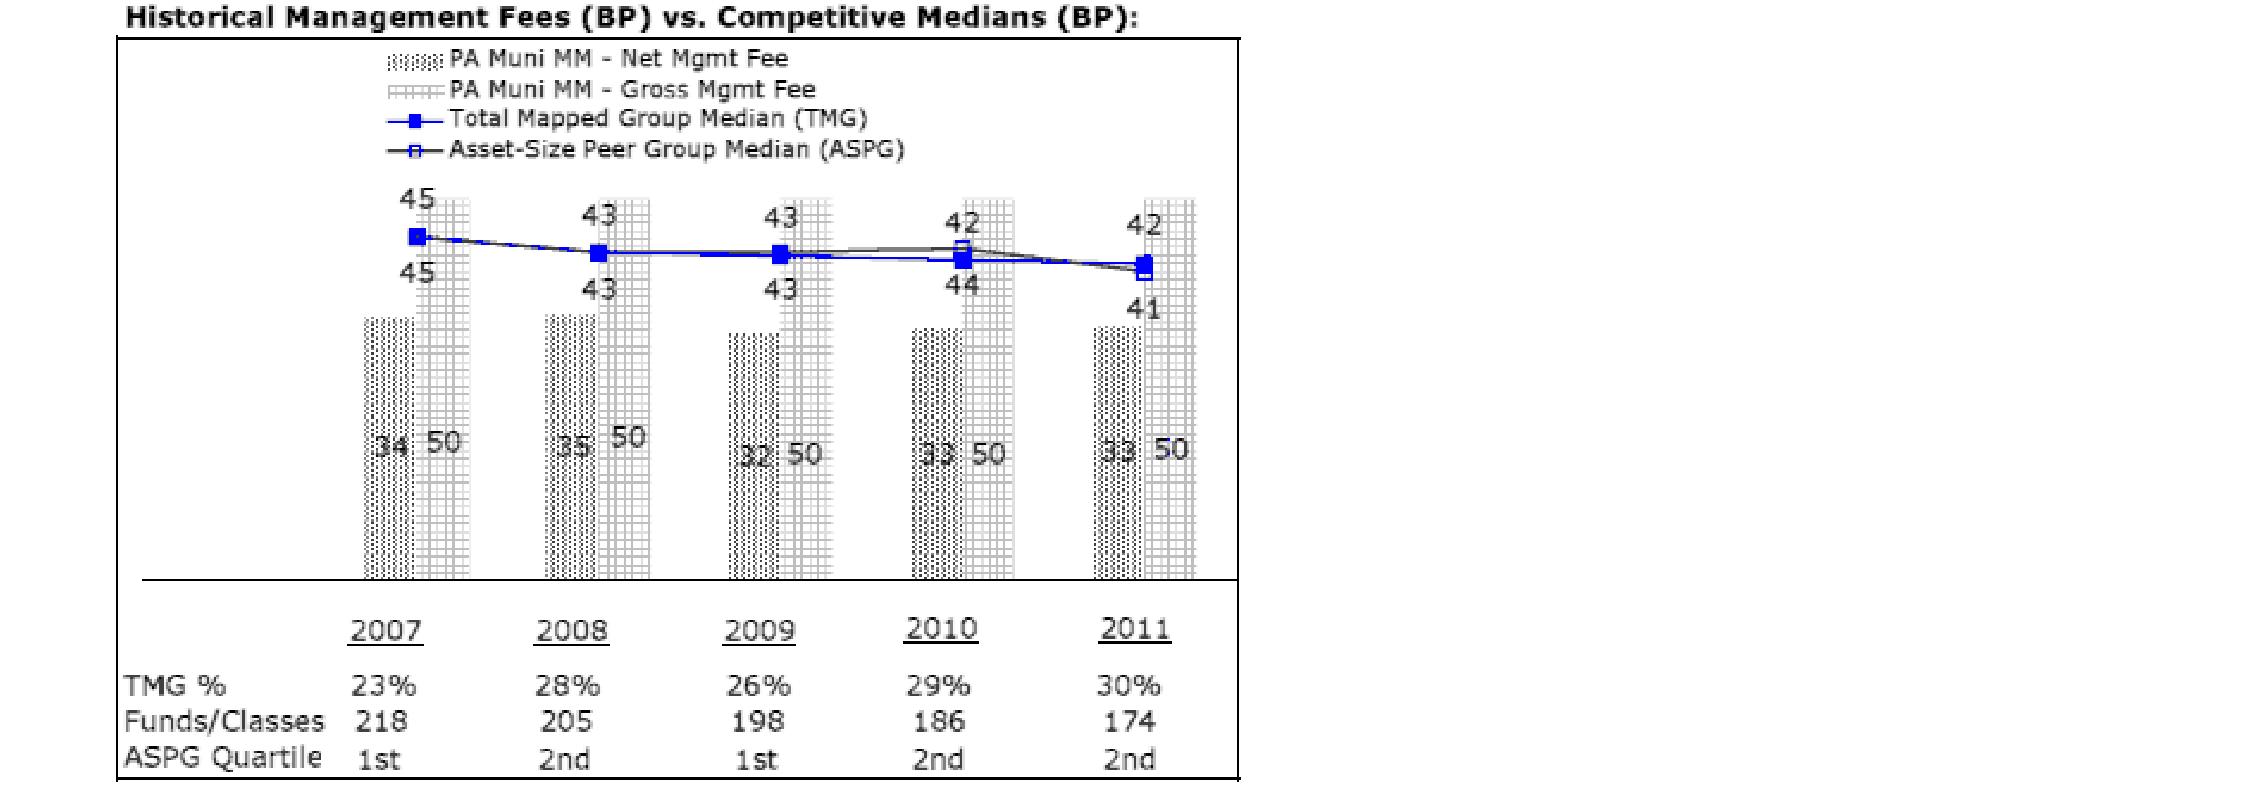
The Board noted that the fund's hypothetical net management fee ranked below the median of its Total Mapped Group and below the median of its ASPG for 2011.
Annual Report
Based on its review, the Board concluded that each fund's management fee is fair and reasonable in light of the services that the fund receives and the other factors considered.
Total Expense Ratio. In its review of Fidelity Pennsylvania Municipal Income Fund's total expense ratio, the Board considered the fund's management fee as well as other fund expenses, such as transfer agent fees, pricing and bookkeeping fees, and custodial, legal, and audit fees. The Board also noted the effects of any waivers and reimbursements on fees and expenses.
In its review of Fidelity Pennsylvania Municipal Money Market Fund's total expense ratio, the Board considered the fund's hypothetical net management fee as well as the fund's all-inclusive fee. The Board also considered other expenses, such as transfer agent fees, pricing and bookkeeping fees, and custodial, legal, and audit fees, paid by FMR under the all-inclusive arrangement. The Board also noted the effects of any waivers and reimbursements on fees and expenses.
As part of its review, the Board also considered the current and historical total expense ratios of each fund compared to competitive fund median expenses. Each fund is compared to those funds and classes in the Total Mapped Group (used by the Board for management fee comparisons) that have a similar sales load structure.
The Board noted that each fund's total expense ratio ranked below its competitive median for 2011. The Board considered that Fidelity has been voluntarily waiving part or all of the management fees to maintain a minimum yield for Fidelity Pennsylvania Municipal Money Market Fund, and also noted that Fidelity retains the ability to be repaid in certain circumstances.
Fees Charged to Other Fidelity Clients. The Board also considered Fidelity fee structures and other information with respect to clients of FMR and its affiliates, such as other mutual funds advised or subadvised by FMR or its affiliates, pension plan clients, and other institutional clients. The Board noted the findings of the 2010 ad hoc joint committee (created with the board of other Fidelity funds), which reviewed and compared Fidelity's institutional investment advisory business with its business of providing services to the Fidelity funds, including the differences in services provided, fees charged, and costs incurred, as well as competition in their respective marketplaces.
Based on its review of total expense ratios and fees charged to other Fidelity clients, the Board concluded that each fund's total expense ratio was reasonable in light of the services that the fund and its shareholders receive and the other factors considered.
Costs of the Services and Profitability. The Board considered the revenues earned and the expenses incurred by Fidelity in conducting the business of developing, marketing, distributing, managing, administering and servicing each fund and its shareholders. The Board also considered the level of Fidelity's profits in respect of all the Fidelity funds.
Annual Report
Board Approval of Investment Advisory Contracts and
Management Fees - continued
On an annual basis, FMR presents to the Board Fidelity's profitability for each fund. Fidelity calculates the profitability for each fund, as well as aggregate profitability for groups of Fidelity funds and all Fidelity funds, using a series of detailed revenue and cost allocation methodologies which originate with the books and records of Fidelity on which Fidelity's audited financial statements are based. The Audit Committee of the Board reviews any significant changes from the prior year's methodologies.
PricewaterhouseCoopers LLP (PwC), independent registered public accounting firm and auditor to Fidelity and certain Fidelity funds, has been engaged annually by the Board as part of the Board's assessment of Fidelity's profitability analysis. PwC's engagement includes the review and assessment of Fidelity's methodologies used in determining the revenues and expenses attributable to Fidelity's mutual fund business, and completion of agreed-upon procedures surrounding the mathematical accuracy of fund profitability and its conformity to allocation methodologies. After considering PwC's reports issued under the engagement and information provided by Fidelity, the Board concluded that while other allocation methods may also be reasonable, Fidelity's profitability methodologies are reasonable in all material respects.
The Board also reviewed Fidelity's non-fund businesses and fall-out benefits related to the mutual fund business as well as cases where Fidelity's affiliates may benefit from or be related to the funds' business.
The Board considered the costs of the services provided by and the profits realized by Fidelity in connection with the operation of each fund and was satisfied that the profitability was not excessive in the circumstances.
Economies of Scale. The Board considered whether there have been economies of scale in respect of the management of the Fidelity funds, whether the Fidelity funds (including each fund) have appropriately benefited from any such economies of scale, and whether there is potential for realization of any further economies of scale. The Board considered the extent to which each fund will benefit from economies of scale through increased services to the fund, through waivers or reimbursements, or through fee or expense reductions. The Board also noted that in 2009, it and the board of other Fidelity funds created an ad hoc committee (the Economies of Scale Committee) to analyze whether FMR attains economies of scale in respect of the management and servicing of the Fidelity funds, whether the Fidelity funds have appropriately benefited from such economies of scale, and whether there is potential for realization of any further economies of scale.
The Board recognized that Fidelity Pennsylvania Municipal Income Fund's management contract incorporates a "group fee" structure, which provides for lower group fee rates as total fund assets under FMR's management increase, and for higher group fee rates as total fund assets under FMR's management decrease. FMR calculates the group fee rates based on a tiered asset "breakpoint" schedule that varies based on asset class. The Board considered that the group fee is designed to deliver the benefits of economies of scale to fund shareholders when total Fidelity fund assets increase, even if assets of any particular fund are unchanged or have declined, because some portion of Fidelity's costs are attributable to services provided to all Fidelity funds, and all funds benefit if those costs can be allocated among more assets. The Board concluded that, given the group fee structure, fund shareholders will benefit from lower management fees as assets under FMR's management increase at the fund complex level, regardless of whether Fidelity achieves any such economies of scale.
Annual Report
The Board concluded, taking into account the analysis of the Economies of Scale Committee, that economies of scale, if any, are being appropriately shared between fund shareholders and Fidelity.
Additional Information Requested by the Board. In order to develop fully the factual basis for consideration of the Fidelity funds' Advisory Contracts, the Board requested and received additional information on certain topics, including: (i) Fidelity's fund profitability methodology, profitability trends for certain funds, and the impact of certain factors on fund profitability results; (ii) portfolio manager changes that have occurred during the past year and the amount of the investment that each portfolio manager has made in the Fidelity fund(s) that he or she manages; (iii) Fidelity's compensation structure for portfolio managers, research analysts, and other key personnel, including its effects on fund profitability, the rationale for the compensation structure, and the extent to which current market conditions have affected retention and recruitment; (iv) the compensation paid to fund sub-advisers on behalf of the Fidelity funds; (v) Fidelity's fee structures, including the group fee structure, and the rationale for recommending different fees among different categories of funds and classes; (vi) Fidelity's voluntary waiver of its fees to maintain minimum yields for certain money market funds and classes as well as contractual waivers in place for certain funds; (vii) regulatory and industry developments, including those affecting money market funds and target date funds, and the potential impact to Fidelity; (viii) Fidelity's transfer agent fees, expenses, and services, and drivers for determining the transfer agent fee structure of different funds and classes; (ix) management fee rates charged by FMR or Fidelity entities to other Fidelity clients; (x) the allocation of and historical trends in Fidelity's realization of fall-out benefits; and (xi) explanations regarding the relative total expense ratios of certain funds and classes, total expense competitive trends, and actions that might be taken by FMR to reduce total expense ratios for certain funds and classes or to achieve further economies of scale.
Based on its evaluation of all of the conclusions noted above, and after considering all factors it believed relevant, the Board ultimately concluded that the advisory fee structures are fair and reasonable, and that each fund's Advisory Contracts should be renewed.
Annual Report
Investment Adviser
Fidelity Management & Research Company
Boston, MA
Investment Sub-Advisers
Fidelity Management & Research
(U.K.) Inc.
Fidelity Investments Money
Management, Inc.
Fidelity Management & Research
(Japan) Inc.
Fidelity Management & Research
(Hong Kong) Limited
General Distributor
Fidelity Distributors Corporation
Smithfield, RI
Transfer and Service Agents
Citibank, N.A.
New York, NY
Fidelity Investments Institutional
Operations Company, Inc.
Boston, MA
Fidelity Service Company, Inc.
Boston, MA
Custodian
Citibank, N.A.
New York, NY
The Fidelity Telephone Connection
Mutual Fund 24-Hour Service
Exchanges/Redemptions
and Account Assistance 1-800-544-6666
Product Information 1-800-544-6666
Retirement Accounts 1-800-544-4774 (8 a.m. - 9 p.m.)
TDD Service 1-800-544-0118
for the deaf and hearing impaired
(9 a.m. - 9 p.m. Eastern time)
Fidelity Automated Service
Telephone (FAST®)
1-800-544-5555
Automated line for quickest service
(Fidelity Investment logo)(registered trademark)
Corporate Headquarters
82 Devonshire St., Boston, MA 02109
www.fidelity.com
PFR-UANN-0213
1.787740.109
Fidelity®
Short-Intermediate
Municipal Income Fund
Annual Report
December 31, 2012
(Fidelity Cover Art)
Contents
Performance | (Click Here) | How the fund has done over time. |
Management's Discussion of Fund Performance | (Click Here) | The Portfolio Manager's review of fund performance, strategy and outlook. |
Shareholder Expense Example | (Click Here) | An example of shareholder expenses. |
Investment Changes | (Click Here) | A summary of major shifts in the fund's investments over the past six months. |
Investments | (Click Here) | A complete list of the fund's investments with their market values. |
Financial Statements | (Click Here) | Statements of assets and liabilities, operations, and changes in net assets, as well as financial highlights. |
Notes | (Click Here) | Notes to the financial statements. |
Report of Independent Registered Public Accounting Firm | (Click Here) | |
Trustees and Officers | (Click Here) | |
Distributions | (Click Here) | |
Board Approval of Investment Advisory Contracts and Management Fees | (Click Here) | |
To view a fund's proxy voting guidelines and proxy voting record for the 12-month period ended June 30, visit http://www.fidelity.com/proxyvotingresults or visit the Securities and Exchange Commission's (SEC) web site at http://www.sec.gov. You may also call 1-800-544-8544 to request a free copy of the proxy voting guidelines.
Standard & Poor's, S&P and S&P 500 are registered service marks of The McGraw-Hill Companies, Inc. and have been licensed for use by Fidelity Distributors Corporation.
Other third party marks appearing herein are the property of their respective owners.
All other marks appearing herein are registered or unregistered trademarks or service marks of FMR LLC or an affiliated company. © 2013 FMR LLC. All rights reserved.
Annual Report
Semia
This report and the financial statements contained herein are submitted for the general information of the shareholders of the fund. This report is not authorized for distribution to prospective investors in the fund unless preceded or accompanied by an effective prospectus.
A fund files its complete schedule of portfolio holdings with the SEC for the first and third quarters of each fiscal year on Form N-Q. Forms N-Q are available on the SEC's web site at http://www.sec.gov. A fund's Forms N-Q may be reviewed and copied at the SEC's Public Reference Room in Washington, DC. Information regarding the operation of the SEC's Public Reference Room may be obtained by calling 1-800-SEC-0330. For a complete list of a fund's portfolio holdings, view the most recent holdings listing, semiannual report, or annual report on Fidelity's web site at http://www.fidelity.com, http://www.advisor.fidelity.com, or http://www.401k.com, as applicable.
NOT FDIC INSURED • MAY LOSE VALUE • NO BANK GUARANTEE
Neither the fund nor Fidelity Distributors Corporation is a bank.
Annual Report
Average annual total return reflects the change in the value of an investment, assuming reinvestment of the class' distributions from dividend income and capital gains (the profits earned upon the sale of securities that have grown in value, if any) and assuming a constant rate of performance each year. The $10,000 table and the fund's returns do not reflect the deduction of taxes that a shareholder would pay on fund distributions or the redemption of fund shares. During periods of reimbursement by Fidelity, a fund's total return will be greater than it would be had the reimbursement not occurred. How a fund did yesterday is no guarantee of how it will do tomorrow.
Average Annual Total Returns
Periods ended December 31, 2012 | Past 1
year | Past 5
years | Past 10
years |
Fidelity® Short-Intermediate Municipal Income Fund | 2.25% | 3.54% | 3.09% |
$10,000 Over 10 Years
Let's say hypothetically that $10,000 was invested in Fidelity® Short-Intermediate Municipal Income Fund, a class of the fund, on December 31, 2002. The chart shows how the value of your investment would have changed, and also shows how the Barclays® Municipal Bond Index performed over the same period.
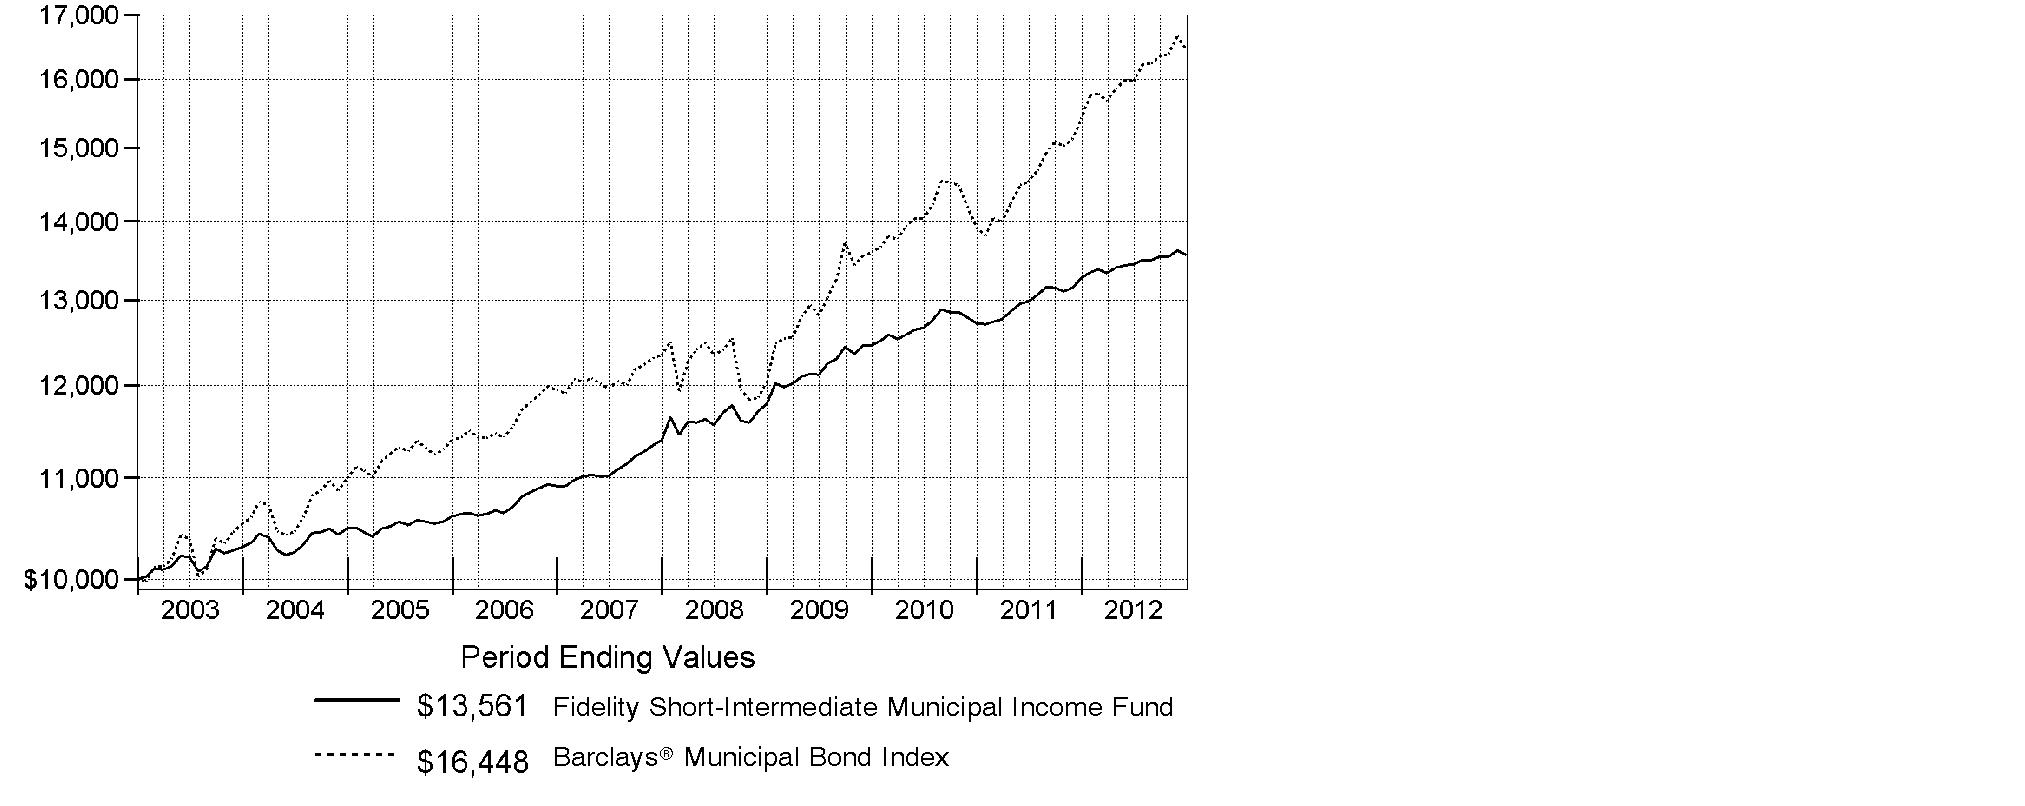
Annual Report
Market Recap: Powered by improving issuer fundamentals and favorable supply and demand, the bull market for municipal bonds rolled on in 2012, with the Barclays® Municipal Bond Index advancing 6.78%. By contrast, taxable investment-grade debt gained 4.21%, as tracked by the Barclays® U.S. Aggregate Bond Index. Muni investors were encouraged by a recovery in tax revenues for many issuers. And despite a handful of well-publicized bankruptcies by local issuers, the overall muni default rate declined and remained low. Even with a surge in refinancings, the overall supply of newly issued muni bonds was muted. As for demand, munis drew heavy interest from investors seeking a yield advantage over U.S. Treasuries, and from those looking for a perceived safe haven amid mixed U.S. economic data and the ongoing financial crisis in Europe. Investors' appetite for tax-advantaged investments in advance of potentially higher federal tax rates in 2013 also fueled demand, particularly in November, while a steady stream of municipal redemptions (calls and maturities), many of which were reinvested in the muni market, competed for limited new supply. The muni market sold off in December due to concern about proposals to limit the federal tax exemption of muni debt, profit-taking in advance of higher capital gains rates, and ratings downgrades of Puerto Rico debt to borderline investment grade.
Comments from Mark Sommer, Lead Portfolio Manager of Fidelity® Short-Intermediate Municipal Income Fund: For the year, the fund's Retail Class shares returned 2.25%, while the Barclays 1-6 Year Municipal Bond Index - which tracks the types of securities in which the fund invests - rose 2.00%. The fund's performance was bolstered by our overweighting in both health care and California general obligation bonds (GOs) issued by the state, as well as yield-curve positioning. Health care bonds were a plus, thanks largely to investors' prodigious appetite for higher-yielding tax-free securities. The larger-than-benchmark stake in California state GOs proved advantageous, as these securities rallied strongly. In terms of yield-curve positioning, the fund benefited from its maturity "barbell" approach. The fund's relative performance was hurt by its underweighting in prepaid gas bonds, which recovered in the second half of the year as the credit quality of the underwriters of such securities - including banks, broker-dealers and other financial institutions - improved and in response to heavy investor demand.
The views expressed above reflect those of the portfolio manager(s) only through the end of the period as stated on the cover of this report and do not necessarily represent the views of Fidelity or any other person in the Fidelity organization. Any such views are subject to change at any time based upon market or other conditions and Fidelity disclaims any responsibility to update such views. These views may not be relied on as investment advice and, because investment decisions for a Fidelity fund are based on numerous factors, may not be relied on as an indication of trading intent on behalf of any Fidelity fund.
Annual Report
Shareholder Expense Example
As a shareholder of the Fund, you incur two types of costs: (1) transaction costs, including sales charges (loads) on purchase payments or redemption proceeds, redemption fees and (2) ongoing costs, including management fees, distribution and/or service (12b-1) fees and other Fund expenses. This Example is intended to help you understand your ongoing costs (in dollars) of investing in the Fund and to compare these costs with the ongoing costs of investing in other mutual funds.
The Example is based on an investment of $1,000 invested at the beginning of the period and held for the entire period (July 1, 2012 to December 31, 2012).
Actual Expenses
The first line of the accompanying table for each class of the Fund provides information about actual account values and actual expenses. You may use the information in this line, together with the amount you invested, to estimate the expenses that you paid over the period. Simply divide your account value by $1,000.00 (for example, an $8,600 account value divided by $1,000.00 = 8.6), then multiply the result by the number in the first line for a class of the Fund under the heading entitled "Expenses Paid During Period" to estimate the expenses you paid on your account during this period. A small balance maintenance fee of $12.00 that is charged once a year may apply for certain accounts with a value of less than $2,000. This fee is not included in the table below. If it was, the estimate of expenses you paid during the period would be higher, and your ending account value lower, by this amount. In addition, the Fund, as a shareholder in the underlying Fidelity Central Funds, will indirectly bear its pro-rata share of the fees and expenses incurred by the underlying Fidelity Central Funds. These fees and expenses are not included in the Fund's annualized expense ratio used to calculate the expense estimate in the table below.
Hypothetical Example for Comparison Purposes
The second line of the accompanying table for each class of the Fund provides information about hypothetical account values and hypothetical expenses based on a Class' actual expense ratio and an assumed rate of return of 5% per year before expenses, which is not the Class' actual return. The hypothetical account values and expenses may not be used to estimate the actual ending account balance or expenses you paid for the period. You may use this information to compare the ongoing costs of investing in the Fund and other funds. To do so, compare this 5% hypothetical example with the 5% hypothetical examples that appear in the shareholder reports of the other funds. A small balance maintenance fee of $12.00 that is charged once a year may apply for certain accounts with a value of less than $2,000. This fee is not included in the table below. If it was, the estimate of expenses you paid during the period would be higher, and your ending account value lower, by this amount. In addition, the Fund, as a shareholder in the underlying Fidelity Central Funds, will indirectly bear its pro-rata share of the fees and expenses incurred by the underlying Fidelity Central Funds. These fees and expenses are not included in the Fund's annualized expense ratio used to calculate the expense estimate in the table below.
Please note that the expenses shown in the table are meant to highlight your ongoing costs only and do not reflect any transaction costs. Therefore, the second line of the table is useful in comparing ongoing costs only, and will not help you determine the relative total costs of owning different funds. In addition, if these transactional costs were included, your costs would have been higher.
Annual Report
Shareholder Expense Example - continued
| Annualized Expense Ratio | Beginning
Account Value
July 1, 2012 | Ending
Account Value
December 31, 2012 | Expenses Paid
During Period*
July 1, 2012 to
December 31, 2012 |
Class A | .78% | | | |
Actual | | $ 1,000.00 | $ 1,007.50 | $ 3.94 |
HypotheticalA | | $ 1,000.00 | $ 1,021.22 | $ 3.96 |
Class T | .76% | | | |
Actual | | $ 1,000.00 | $ 1,008.50 | $ 3.84 |
HypotheticalA | | $ 1,000.00 | $ 1,021.32 | $ 3.86 |
Class B | 1.43% | | | |
Actual | | $ 1,000.00 | $ 1,004.20 | $ 7.20 |
HypotheticalA | | $ 1,000.00 | $ 1,017.95 | $ 7.25 |
Class C | 1.53% | | | |
Actual | | $ 1,000.00 | $ 1,003.70 | $ 7.71 |
HypotheticalA | | $ 1,000.00 | $ 1,017.44 | $ 7.76 |
Short-Intermediate Municipal Income | .48% | | | |
Actual | | $ 1,000.00 | $ 1,009.00 | $ 2.42 |
HypotheticalA | | $ 1,000.00 | $ 1,022.72 | $ 2.44 |
Institutional Class | .54% | | | |
Actual | | $ 1,000.00 | $ 1,008.70 | $ 2.73 |
HypotheticalA | | $ 1,000.00 | $ 1,022.42 | $ 2.75 |
A 5% return per year before expenses
* Expenses are equal to each Class' annualized expense ratio, multiplied by the average account value over the period, multiplied by 184/366 (to reflect the one-half year period).
Annual Report
Investment Changes (Unaudited)
Top Five States as of December 31, 2012 |
| % of fund's
net assets | % of fund's net assets
6 months ago |
California | 14.2 | 11.4 |
New York | 11.6 | 12.6 |
Illinois | 8.5 | 7.4 |
Florida | 8.1 | 8.3 |
Texas | 7.7 | 5.5 |
Top Five Sectors as of December 31, 2012 |
| % of fund's
net assets | % of fund's net assets
6 months ago |
General Obligations | 36.4 | 32.1 |
Electric Utilities | 12.7 | 12.8 |
Special Tax | 12.1 | 11.1 |
Health Care | 9.3 | 8.6 |
Transportation | 7.1 | 5.2 |
Weighted Average Maturity as of December 31, 2012 |
| | 6 months ago |
Years | 3.2 | 3.2 |
This is a weighted average of all the maturities of the securities held in a fund. Weighted Average Maturity (WAM) can be used as a measure of sensitivity to interest rate changes and market changes. Generally, the longer the maturity, the greater the sensitivity to such changes. WAM is based on the dollar-weighted average length of time until principal payments must be paid. Depending on the types of securities held in a fund, certain maturity shortening devices (e.g., demand features, interest rate resets, and call options) may be taken into account when calculating the WAM. |
Duration as of December 31, 2012 |
| | 6 months ago |
Years | 2.9 | 2.8 |
Duration estimates how much a bond fund's price will change with a change in comparable interest rates. If rates rise 1%, for example, a fund with a 5-year duration is likely to lose about 5% of its value. Other factors also can influence a bond fund's performance and share price. Accordingly, a bond fund's actual performance may differ from this example. Duration takes into account any call or put option embedded in the bonds. |
Quality Diversification (% of fund's net assets) |
As of December 31, 2012 | As of June 30, 2012 |
 | AAA 10.6% | | | AAA 8.5% | |
 | AA,A 71.8% | | | AA,A 69.7% | |
 | BBB 5.3% | | | BBB 4.2% | |
 | BB and Below 0.2% | | | BB and Below 0.1% | |
 | Not Rated 4.0% | | | Not Rated 1.6% | |
 | Short-Term
Investments and
Net Other Assets 8.1% | | | Short-Term
Investments and
Net Other Assets 15.9% | |

We have used ratings from Moody's Investors Service, Inc. Where Moody's® ratings are not available, we have used S&P® ratings. All ratings are as of the date indicated and do not reflect subsequent changes. |
Annual Report
Investments December 31, 2012
Showing Percentage of Net Assets
Municipal Bonds - 89.0% |
| Principal Amount (000s) | | Value (000s) |
Alabama - 0.1% |
Mobile Indl. Dev. Board Poll. Cont. Rev. Bonds Series 2007 B, 4.875%, tender 3/19/13 (b) | | $ 2,615 | | $ 2,639 |
Univ. of Alabama at Birmingham Hosp. Rev. Series 2008 A, 5% 9/1/13 | | 1,175 | | 1,207 |
| | 3,846 |
Arizona - 3.3% |
Arizona Ctfs. of Partnership Series 2010 A: | | | | |
5% 10/1/14 (FSA Insured) | | 5,000 | | 5,383 |
5% 10/1/16 (FSA Insured) | | 13,000 | | 14,685 |
Arizona Health Facilities Auth. Rev. (Banner Health Sys. Proj.): | | | | |
Series 2008 A, 5% 1/1/13 | | 2,000 | | 2,000 |
Series 2008 D: | | | | |
5% 1/1/13 | | 3,250 | | 3,250 |
5% 1/1/14 | | 2,255 | | 2,357 |
Arizona School Facilities Board Ctfs. of Prtn.: | | | | |
Series 2004 B, 5.25% 9/1/15 (FSA Insured) | | 6,470 | | 6,943 |
Series 2005 A1, 5% 9/1/14 (Nat'l. Pub. Fin. Guarantee Corp. Insured) | | 2,000 | | 2,138 |
Series 2005 A2, 5% 9/1/16 (Nat'l. Pub. Fin. Guarantee Corp. Insured) | | 11,000 | | 12,081 |
Series 2008: | | | | |
5.5% 9/1/13 | | 18,780 | | 19,413 |
5.5% 9/1/16 | | 1,385 | | 1,593 |
Arizona Wtr. Infrastructure Fin. Auth. Rev.
Series 2009 A: | | | | |
5% 10/1/18 | | 1,000 | | 1,220 |
5% 10/1/20 | | 5,180 | | 6,342 |
Coconino County Poll. Cont. Corp. Rev. Bonds (Arizona Pub. Svc. Co. Navajo Proj.) Series 2009 A, 5.5%, tender 6/1/14 (b) | | 6,000 | | 6,370 |
Maricopa County Poll. Cont. Rev. Bonds (Arizona Pub. Svc. Co. Palo Verde Proj.) Series 2009 A, 6%, tender 5/1/14 (b) | | 4,800 | | 5,110 |
Mesa Hwy. Proj. Advancement Series 2011 A: | | | | |
5% 7/1/17 | | 12,085 | | 13,328 |
5% 7/1/18 | | 5,200 | | 5,736 |
Navajo County Poll. Cont. Corp. Rev. Bonds (Arizona Pub. Svc. Co. Cholla Proj.) Series 2009 A, 1.25%, tender 5/30/14 (b) | | 2,800 | | 2,807 |
Phoenix Civic Impt. Corp. Wtr. Sys. Rev.: | | | | |
Series 2009 A, 5% 7/1/15 | | 5,835 | | 6,477 |
Municipal Bonds - continued |
| Principal Amount (000s) | | Value (000s) |
Arizona - continued |
Phoenix Civic Impt. Corp. Wtr. Sys. Rev.: - continued | | | | |
Series 2009 B, 5% 7/1/16 | | $ 5,090 | | $ 5,828 |
Pima County Swr. Sys. Rev.: | | | | |
Series 2011 B, 5% 7/1/19 | | 3,225 | | 3,905 |
Series 2012 A: | | | | |
5% 7/1/18 | | 825 | | 981 |
5% 7/1/19 | | 1,550 | | 1,877 |
Tucson Gen. Oblig. Series 2005, 5% 7/1/16 (Nat'l. Pub. Fin. Guarantee Corp. Insured) | | 1,250 | | 1,382 |
Tucson Wtr. Rev. Series 2001 A, 5% 7/1/15 (Nat'l. Pub. Fin. Guarantee Corp. Insured) | | 1,645 | | 1,698 |
Univ. Med. Ctr. Corp. Hosp. Rev. Series 2011: | | | | |
5% 7/1/16 | | 3,055 | | 3,388 |
5% 7/1/17 | | 3,315 | | 3,733 |
5% 7/1/18 | | 3,365 | | 3,835 |
| | 143,860 |
California - 11.9% |
California Dept. of Wtr. Resources (Central Valley Proj.) Series AM, 5% 12/1/13 (a) | | 3,000 | | 3,099 |
California Dept. of Wtr. Resources Pwr. Supply Rev.: | | | | |
Series 2010 L, 5% 5/1/17 | | 12,000 | | 14,077 |
Series 2010 M, 5% 5/1/16 | | 8,000 | | 9,123 |
California Econ. Recovery: | | | | |
Bonds Series B, 5%, tender 7/1/14 (b) | | 5,000 | | 5,322 |
Series 2009 A: | | | | |
5% 7/1/15 | | 3,660 | | 3,909 |
5% 7/1/15 (Pre-Refunded to 7/1/14 @ 100) | | 2,540 | | 2,716 |
5.25% 7/1/13 (Escrowed to Maturity) | | 1,185 | | 1,214 |
5.25% 7/1/13 (Nat'l. Pub. Fin. Guarantee Corp. Insured) | | 1,255 | | 1,286 |
5.25% 7/1/14 | | 1,780 | | 1,910 |
5.25% 7/1/14 (Escrowed to Maturity) | | 520 | | 558 |
California Gen. Oblig.: | | | | |
5% 11/1/13 | | 9,060 | | 9,414 |
5% 9/1/18 | | 7,500 | | 9,004 |
5% 9/1/19 | | 20,000 | | 24,391 |
5% 9/1/20 | | 20,000 | | 24,575 |
California Health Facilities Fing. Auth. Rev.: | | | | |
(Catholic Healthcare West Proj.) Series 2008 H, 5.125% 7/1/22 | | 1,945 | | 2,116 |
Municipal Bonds - continued |
| Principal Amount (000s) | | Value (000s) |
California - continued |
California Health Facilities Fing. Auth. Rev.: - continued | | | | |
(Children's Hosp. of Orange County Proj.) Series 2009 A, 5% 11/1/13 | | $ 1,100 | | $ 1,132 |
Bonds: | | | | |
(Catholic Healthcare West Proj.): | | | | |
Series 2009 D, 5%, tender 7/1/14 (b) | | 2,900 | | 3,068 |
Series 2009 F, 5%, tender 7/1/14 (b) | | 3,200 | | 3,386 |
(Children's Hosp. of Orange County Proj.) Series 2012 A, 1.93%, tender 7/1/17 (b) | | 4,000 | | 4,009 |
(St. Joseph Health Sys. Proj.) Series 2009 C, 5%, tender 10/16/14 (b) | | 4,300 | | 4,591 |
California Poll. Cont. Fing. Auth. Ctfs. of Prtn. (San Diego Gas & Elec. Co. Proj.) 5.9% 6/1/14 (Nat'l. Pub. Fin. Guarantee Corp. Insured) | | 34,000 | | 36,493 |
California Poll. Cont. Fing. Auth. Solid Waste Disp. Rev. Bonds: | | | | |
(Republic Svcs., Inc. Proj.) Series 2010 A, 0.6%, tender 2/1/13 (b)(e) | | 16,200 | | 16,201 |
(Waste Mgmt., Inc. Proj.) Series 2003 A, 5%, tender 5/1/13 (b)(e) | | 2,300 | | 2,334 |
California Pub. Works Board Lease Rev.: | | | | |
(Dept. of Corrections & Rehab. Proj.) Series 2011 C, 5% 10/1/18 | | 1,750 | | 2,058 |
(Riverside Campus Proj.) Series 2012 H, 5% 4/1/22 | | 1,000 | | 1,191 |
(Univ. Proj.) Series 2011 B: | | | | |
5% 10/1/18 | | 2,740 | | 3,249 |
5% 10/1/19 | | 1,490 | | 1,791 |
(Various Cap. Proj.) Series 2012 G, 5% 11/1/22 | | 1,250 | | 1,501 |
(Various Cap. Projects) Series 2011 A: | | | | |
5% 10/1/18 | | 6,475 | | 7,616 |
5% 10/1/19 | | 5,000 | | 5,921 |
5% 10/1/20 | | 2,525 | | 3,032 |
(Various Cap. Projs.) Series 2012 A, 5% 4/1/21 | | 1,000 | | 1,195 |
(Various Judicial Council Projects) Series 2011 D, 5% 12/1/19 | | 4,100 | | 4,905 |
Series 2009 J, 5% 11/1/17 | | 2,300 | | 2,684 |
Series 2010 A: | | | | |
5% 3/1/16 | | 2,000 | | 2,236 |
5% 3/1/17 | | 5,405 | | 6,186 |
California State Univ. Rev. Series 2007 C, 5% 11/1/13 (FSA Insured) | | 1,335 | | 1,387 |
Municipal Bonds - continued |
| Principal Amount (000s) | | Value (000s) |
California - continued |
California Statewide Cmntys. Dev. Auth. Rev.: | | | | |
(State of California Proposition 1A Receivables Prog.) Series 2009: | | | | |
4% 6/15/13 | | $ 1,000 | | $ 1,017 |
5% 6/15/13 | | 16,650 | | 17,002 |
Bonds: | | | | |
Series 2002 C, 5%, tender 5/1/17 (b) | | 4,000 | | 4,637 |
Series 2009 E2, 5%, tender 5/1/17 (b) | | 2,000 | | 2,319 |
Contra Costa Trans. Auth. Sales Tax Rev. Bonds Series 2012 A, 0.511%, tender 12/12/15 (b) | | 12,500 | | 12,500 |
East Bay Muni. Util. District Wtr. Sys. Rev. Bonds Series 2011 A2, 0.48%, tender 7/1/14 (b) | | 56,000 | | 56,116 |
Golden State Tobacco Securitization Corp. Tobacco Settlement Rev. Series 2003 B: | | | | |
5.5% 6/1/43 (Pre-Refunded to 6/1/13 @ 100) | | 2,000 | | 2,043 |
5.625% 6/1/38 (Pre-Refunded to 6/1/13 @ 100) | | 3,030 | | 3,097 |
Irvine Reassessment District 12-1 Ltd. Oblig. 2% 9/2/13 | | 1,000 | | 1,008 |
Los Angeles County Metropolitan Trans. Auth. Sales Tax Rev.: | | | | |
Series 2009 A, 5% 7/1/13 | | 4,155 | | 4,253 |
Series 2009 B, 5% 7/1/17 | | 12,905 | | 15,229 |
Series 2013 A: | | | | |
5% 7/1/18 (a) | | 9,750 | | 11,539 |
5% 7/1/19 (a) | | 4,400 | | 5,294 |
Los Angeles County Pub. Works Fing. Auth. Lease Rev. Series 2010 A, 5% 8/1/17 | | 5,000 | | 5,785 |
Los Angeles Gen. Oblig. Series 2011 B, 5% 9/1/18 | | 20,960 | | 25,445 |
Los Angeles Muni. Impt. Corp. Lease Rev. Series 2012 C: | | | | |
4.625% 3/1/18 | | 1,500 | | 1,721 |
5% 3/1/19 | | 2,935 | | 3,459 |
Los Angeles Unified School District Series 2009 KRY, 5% 7/1/13 | | 10,740 | | 10,992 |
Los Angeles Unified School District Ctfs. of Prtn. (Multiple Properties Proj.) Series 2010 A: | | | | |
5% 12/1/16 | | 2,025 | | 2,291 |
5% 12/1/17 | | 9,790 | | 11,221 |
Los Angeles Wastewtr. Sys. Rev. Series 2009 A, 5% 6/1/15 | | 12,240 | | 13,547 |
Monterey County Pub. Impt. Corp. Ctfs. of Prtn. (Refing. Proj.) Series 2009, 5% 8/1/17 (FSA Insured) | | 2,130 | | 2,434 |
Newport Beach Rev. Bonds (Hoag Memorial Hosp. Presbyterian Proj.) Series 2009 E, 5%, tender 2/7/13 (b) | | 2,500 | | 2,511 |
Municipal Bonds - continued |
| Principal Amount (000s) | | Value (000s) |
California - continued |
Northern California Pwr. Agcy. Rev.: | | | | |
(Geothermal #3 Proj.) Series 2009 A: | | | | |
5% 7/1/13 | | $ 1,020 | | $ 1,043 |
5% 7/1/14 | | 1,120 | | 1,193 |
5% 7/1/15 | | 2,170 | | 2,397 |
(Hydroelectric #1 Proj.) Series 2010 A: | | | | |
4% 7/1/15 | | 2,000 | | 2,160 |
5% 7/1/18 | | 2,000 | | 2,385 |
Port of Oakland Rev. Series 2012 P, 5% 5/1/21 (e) | | 2,500 | | 2,982 |
Poway Unified School District Pub. Fing. Auth. Lease Rev. Bonds Series 2008 B, 0%, tender 12/1/14 (FSA Insured) (b) | | 7,115 | | 6,884 |
Riverside County Asset Leasing Rev. (Riverside Cap. Proj.) Series 2012 A: | | | | |
4% 6/1/17 | | 1,750 | | 1,916 |
5% 6/1/17 | | 3,700 | | 4,206 |
5% 6/1/18 | | 6,470 | | 7,464 |
Sacramento Muni. Util. District Elec. Rev. Series 2011 X, 5% 8/15/21 | | 4,000 | | 4,952 |
Sacramento Pwr. Auth. Cogeneration Proj. Rev. Series 2005 A, 5% 7/1/18 (AMBAC Insured) | | 2,890 | | 3,072 |
San Bernardino County Ctfs. of Prtn. (Arrowhead Proj.) Series 2009 A: | | | | |
5% 8/1/16 | | 5,450 | | 5,993 |
5% 8/1/18 | | 8,000 | | 9,035 |
San Diego Cmnty. College District Series 2007, 0% 8/1/16 (FSA Insured) | | 1,160 | | 1,111 |
San Diego Pub. Facilities Fing. Auth. Swr. Rev.: | | | | |
Series 2009 A: | | | | |
5% 5/15/13 | | 5,415 | | 5,509 |
5% 5/15/15 | | 1,845 | | 2,035 |
Series 2009 B, 5% 5/15/14 | | 7,000 | | 7,442 |
Stockton Unified School District Gen. Oblig. 5% 7/1/18 (FSA Insured) | | 1,035 | | 1,193 |
| | 517,312 |
Municipal Bonds - continued |
| Principal Amount (000s) | | Value (000s) |
Colorado - 0.1% |
Colorado Health Facilities Auth. Rev. Bonds (Catholic Health Initiatives Proj.) Series 2008 C4, 4%, tender 11/12/15 (b) | | $ 4,200 | | $ 4,567 |
Univ. of Colorado Enterprise Sys. Rev. Series 2009 A, 5% 6/1/17 | | 500 | | 586 |
| | 5,153 |
Connecticut - 1.6% |
Connecticut Dev. Auth. Poll. Cont. Rev. Bonds Series 2011 A, 1.55%, tender 4/1/15 (b)(e) | | 4,300 | | 4,323 |
Connecticut Gen. Oblig.: | | | | |
(Econ. Recovery Proj.) Series 2009 A, 5% 1/1/15 | | 10,500 | | 11,431 |
Series 2012 C, 5% 6/1/21 | | 23,420 | | 29,305 |
Series 2012 D, 0.42% 9/15/15 (b) | | 6,000 | | 6,005 |
Connecticut Health & Edl. Facilities Auth. Rev.: | | | | |
Bonds (Ascension Health Cr. Group Proj.) Series 1998 B, 1.55%, tender 2/1/17 (b) | | 2,585 | | 2,630 |
Series D, 4% 7/1/14 | | 1,000 | | 1,043 |
Connecticut Spl. Tax Oblig. Trans. Infrastructure Rev.: | | | | |
Series 1998 A, 5.5% 10/1/13 | | 4,300 | | 4,468 |
Series 2009 1, 5% 2/1/14 | | 2,500 | | 2,627 |
Series 2011 A, 5% 12/1/18 | | 5,575 | | 6,737 |
| | 68,569 |
District Of Columbia - 0.5% |
District of Columbia Gen. Oblig. Series 2007 B, 5% 6/1/16 (AMBAC Insured) | | 3,555 | | 4,034 |
District of Columbia Income Tax Rev. Series 2009 C, 5% 12/1/13 | | 5,500 | | 5,741 |
District of Columbia Rev. (Medlantic/Helix Proj.) Series 1998 C, 5% 8/15/15 (FSA Insured) | | 1,500 | | 1,616 |
District of Columbia Univ. Rev. Bonds (Georgetown Univ. Proj.) Series 2001 B, 4.7%, tender 4/1/18 (b) | | 8,500 | | 9,560 |
Washington DC Metropolitan Transit Auth. Rev. Series 2009 A, 5% 7/1/14 | | 1,000 | | 1,062 |
| | 22,013 |
Florida - 8.1% |
Alachua County Health Facilities Auth. Health Facilities Rev. (Shands Teaching Hospitals & Clinics, Inc. Proj.) Series 2010 B: | | | | |
5% 12/1/14 | | 4,000 | | 4,320 |
5% 12/1/15 | | 4,395 | | 4,884 |
Municipal Bonds - continued |
| Principal Amount (000s) | | Value (000s) |
Florida - continued |
Broward County Arpt. Sys. Rev.: | | | | |
Series 2012 P1, 3% 10/1/13 (e) | | $ 4,000 | | $ 4,078 |
Series 2012 Q1, 5% 10/1/21 | | 1,000 | | 1,228 |
Broward County School Board Ctfs. of Prtn.: | | | | |
Series 2008 A, 5% 7/1/15 (FSA Insured) | | 5,495 | | 6,009 |
Series 2012 A: | | | | |
5% 7/1/19 | | 7,000 | | 8,338 |
5% 7/1/20 | | 15,070 | | 18,120 |
Citizens Property Ins. Corp.: | | | | |
Series 2010 A1, 5% 6/1/15 (FSA Insured) | | 14,000 | | 15,291 |
Series 2010 A3, 1.88% 6/1/13 (b) | | 47,300 | | 47,589 |
Clay County Infrastructure Sales Surtax Rev. 5% 10/1/15 (Assured Guaranty Corp. Insured) | | 7,745 | | 8,405 |
Clearwater Wtr. and Swr. Rev.: | | | | |
Series 2009 B, 5% 12/1/14 | | 2,000 | | 2,169 |
Series 2011: | | | | |
4% 12/1/16 | | 1,265 | | 1,394 |
5% 12/1/17 | | 1,685 | | 1,947 |
5% 12/1/18 | | 685 | | 810 |
5% 12/1/19 | | 1,820 | | 2,178 |
5% 12/1/20 | | 1,000 | | 1,205 |
Collier County Indl. Dev. Auth. Healthcare Facilities Rev. (NCH Healthcare Sys. Proj.) Series 2011: | | | | |
5% 10/1/14 | | 1,355 | | 1,438 |
5% 10/1/16 | | 1,530 | | 1,699 |
5% 10/1/17 | | 1,455 | | 1,639 |
Escambia City Health Facilities Auth. Rev. (Ascension Health Cr. Group Proj.) Series 2003 A, 5.25% 11/15/13 | | 4,265 | | 4,442 |
Escambia County Solid Waste Disp. Rev. Bonds (Gulf Pwr. Co. Proj.) Series 2009, 1.35%, tender 6/2/15 (b) | | 1,900 | | 1,905 |
Florida Board of Ed. Series 2005 B, 5% 1/1/18 | | 21,080 | | 23,073 |
Florida Board of Ed. Lottery Rev. Series 2011 A, 5% 7/1/20 | | 8,600 | | 10,541 |
Florida Board of Ed. Pub. Ed. Cap. Outlay: | | | | |
Series 2009 C, 5% 6/1/20 | | 3,625 | | 4,443 |
Series 2009 D, 5.5% 6/1/16 | | 7,910 | | 9,175 |
Florida Dept. of Envir. Protection Rev. Series 2012 A, 5% 7/1/19 | | 15,800 | | 19,111 |
Florida Gen. Oblig. (Dept. of Trans. Right-of-Way and Bridge Construction Proj.) Series 2005 B, 6.375% 7/1/13 | | 8,020 | | 8,264 |
Municipal Bonds - continued |
| Principal Amount (000s) | | Value (000s) |
Florida - continued |
Florida Hurricane Catastrophe Fund Fin. Corp. Rev. Series 2010 A, 5% 7/1/15 | | $ 20,000 | | $ 22,052 |
Florida Muni. Pwr. Agcy. Rev. (Stanton II Proj.) Series 2012 A, 5% 10/1/18 | | 2,850 | | 3,405 |
Gainesville Utils. Sys. Rev. Series 2012 A, 5% 10/1/21 | | 2,110 | | 2,611 |
Greater Orlando Aviation Auth. Arpt. Facilities Rev. Series 2011 C: | | | | |
5% 10/1/19 | | 1,705 | | 2,062 |
5% 10/1/20 | | 1,000 | | 1,220 |
Highlands County Health Facilities Auth. Rev.: | | | | |
(Adventist Health Sys./Sunbelt, Inc. Prog.) Series 2009 E, 5% 11/15/15 | | 2,345 | | 2,628 |
Bonds (Adventist Health Sys./Sunbelt, Inc. Prog.) Series 2008 A, 6.1%, tender 11/14/13 (b) | | 1,000 | | 1,044 |
Hillsborough County Indl. Dev. Auth. Poll. Cont. Rev. Bonds (Tampa Elec. Co. Proj.) Series 2007 B, 5.15%, tender 9/1/13 (b) | | 1,750 | | 1,800 |
Indian River County Wtr. & Swr. Rev.: | | | | |
5% 9/1/15 | | 1,000 | | 1,099 |
5% 9/1/17 | | 1,000 | | 1,155 |
JEA Wtr. & Swr. Sys. Rev. Series 2010 D, 5% 10/1/21 | | 1,945 | | 2,375 |
Kissimmee Util. Auth. Elec. Sys. Rev. Series 2003: | | | | |
5.25% 10/1/14 | | 775 | | 830 |
5.25% 10/1/15 | | 3,525 | | 3,895 |
Miami Beach Health Facilities Auth. Hosp. Rev. (Mount Sinai Med. Ctr. of Florida Proj.) Series 2012: | | | | |
5% 11/15/21 | | 1,000 | | 1,131 |
5% 11/15/22 | | 485 | | 547 |
Miami-Dade County Pub. Facilities Rev. (Jackson Health Sys. Proj.) Series 2005 B: | | | | |
5% 6/1/14 (Nat'l. Pub. Fin. Guarantee Corp. Insured) | | 4,790 | | 5,086 |
5% 6/1/19 (Nat'l. Pub. Fin. Guarantee Corp. Insured) | | 3,875 | | 4,206 |
Miami-Dade County Transit Sales Surtax Rev. Series 2012, 5% 7/1/19 | | 1,250 | | 1,505 |
Miami-Dade County Wtr. & Swr. Rev. Series 2008 A, 5% 10/1/14 (FSA Insured) | | 4,000 | | 4,316 |
Orange County Health Facilities Auth. (Orlando Health, Inc.) Series 2009: | | | | |
5% 10/1/15 | | 2,210 | | 2,421 |
5% 10/1/16 | | 1,000 | | 1,113 |
Orange County Health Facilities Auth. Rev. (Orlando Reg'l. Healthcare Sys. Proj.) Series 2008 A: | | | | |
5% 11/1/13 (FSA Insured) | | 1,000 | | 1,024 |
Municipal Bonds - continued |
| Principal Amount (000s) | | Value (000s) |
Florida - continued |
Orange County Health Facilities Auth. Rev. (Orlando Reg'l. Healthcare Sys. Proj.) Series 2008 A: - continued | | | | |
5% 11/1/15 (FSA Insured) | | $ 1,825 | | $ 1,999 |
Orlando & Orange County Expressway Auth. Rev.: | | | | |
Series 2010 B, 5% 7/1/15 (FSA Insured) | | 1,430 | | 1,578 |
Series 2012, 5% 7/1/19 | | 1,000 | | 1,206 |
Orlando Utils. Commission Util. Sys. Rev.: | | | | |
Series 2009 C, 5% 10/1/17 | | 1,500 | | 1,776 |
Series 2010 C, 5% 10/1/17 | | 1,895 | | 2,243 |
Series 2011 B: | | | | |
5% 10/1/18 | | 2,250 | | 2,724 |
5% 10/1/19 | | 2,325 | | 2,885 |
Pasco County Solid Waste Disp. & Resource Recovery Sys. Rev.: | | | | |
Series 2011: | | | | |
5% 10/1/17 (e) | | 4,465 | | 5,122 |
5% 10/1/19 (e) | | 2,025 | | 2,381 |
5% 10/1/18 (e) | | 2,745 | | 3,194 |
Sarasota County School Board Ctfs. of Prtn. (Master Lease Prog.): | | | | |
5% 7/1/13 | | 3,435 | | 3,512 |
5% 7/1/14 | | 2,000 | | 2,132 |
Tampa Bay Wtr. Reg'l. Wtr. Supply Auth. Util. Sys. Rev.: | | | | |
Series 2011 B, 5% 10/1/18 | | 4,700 | | 5,691 |
Series 2011, 5% 10/1/19 | | 5,590 | | 6,937 |
Tampa Health Sys. Rev. (Baycare Health Sys. Proj.) Series 2010: | | | | |
5% 11/15/16 | | 2,500 | | 2,846 |
5% 11/15/17 | | 1,500 | | 1,743 |
Tampa Solid Waste Sys. Rev. Series 2010: | | | | |
4% 10/1/14 (FSA Insured) (e) | | 3,000 | | 3,160 |
5% 10/1/15 (FSA Insured) (e) | | 2,920 | | 3,226 |
5% 10/1/16 (FSA Insured) (e) | | 6,000 | | 6,782 |
5% 10/1/17 (FSA Insured) (e) | | 5,000 | | 5,753 |
Tampa Tax Allocation (H. Lee Moffitt Cancer Ctr. Proj.) Series 2012 A, 5% 9/1/20 | | 1,800 | | 2,135 |
Titusville Wtr. & Swr. Rev. Series 2010, 5% 10/1/17 (Assured Guaranty Corp. Insured) | | 1,135 | | 1,301 |
| | 351,546 |
Municipal Bonds - continued |
| Principal Amount (000s) | | Value (000s) |
Georgia - 3.5% |
Appling County Dev. Auth. Poll. Cont. Rev. Bonds (Oglethorpe Pwr. Corp. Hatch Proj.) Series 2011 A, 2.5%, tender 3/1/13 (b) | | $ 5,000 | | $ 5,016 |
Atlanta Arpt. Rev. Series 2011 B, 5% 1/1/13 (e) | | 1,000 | | 1,000 |
Burke County Indl. Dev. Auth. Poll. Cont. Rev. Bonds: | | | | |
(Georgia Pwr. Co. Plant Vogtle Proj.): | | | | |
Fifth Series 1994, 2.3%, tender 4/1/14 (b) | | 8,000 | | 8,179 |
Fourth Series 1995: | | | | |
1.2%, tender 4/1/14 (b) | | 3,450 | | 3,480 |
1.2%, tender 4/1/14 (b) | | 4,800 | | 4,842 |
(Oglethorpe Pwr. Corp. Vogtle Proj.) Series 2011 A, 2.5%, tender 3/1/13 (b) | | 3,500 | | 3,511 |
Fulton County Facilities Corp. Ctfs. of Prtn. (Gen. Purp. Proj.) Series 2009: | | | | |
5% 11/1/13 | | 7,550 | | 7,827 |
5% 11/1/14 | | 7,490 | | 7,984 |
Fulton County Wtr. & Swr. Rev. Series 2011: | | | | |
5% 1/1/19 | | 4,000 | | 4,856 |
5% 1/1/20 | | 4,000 | | 4,917 |
Georgia Muni. Elec. Auth. Pwr. Rev.: | | | | |
Series B, 5% 1/1/17 | | 2,750 | | 3,156 |
Series GG: | | | | |
5% 1/1/16 | | 680 | | 760 |
5% 1/1/20 | | 675 | | 826 |
5% 1/1/21 | | 1,670 | | 2,076 |
Georgia Muni. Gas Auth. Rev. (Gas Portfolio III Proj.) Series R, 5% 10/1/21 | | 5,000 | | 6,050 |
Metropolitan Atlanta Rapid Transit Auth. Sales Tax Rev. Bonds Series 2000 A, 0.38%, tender 9/1/14 (b) | | 13,800 | | 13,805 |
Monroe County Dev. Auth. Poll. Cont. Rev. Bonds: | | | | |
(Georgia Pwr. Co. Plant Scherer Proj.) First Series 1995, 0.8%, tender 7/1/14 (b) | | 17,900 | | 17,916 |
(Oglethorpe Pwr. Corp. Scherer Proj.) Series 2011 A, 2.5%, tender 3/1/13 (b) | | 11,500 | | 11,537 |
Muni. Elec. Auth. of Georgia: | | | | |
(Combined Cycle Proj.) Series A, 5% 11/1/18 | | 2,000 | | 2,379 |
(Proj. One): | | | | |
Series 2008 A: | | | | |
5% 1/1/13 | | 2,000 | | 2,000 |
5.25% 1/1/17 (Berkshire Hathaway Assurance Corp. Insured) | | 7,925 | | 9,172 |
Series 2008 D: | | | | |
5.75% 1/1/19 | | 14,890 | | 18,196 |
Municipal Bonds - continued |
| Principal Amount (000s) | | Value (000s) |
Georgia - continued |
Muni. Elec. Auth. of Georgia: - continued | | | | |
(Proj. One): | | | | |
Series 2008 D: | | | | |
5.75% 1/1/20 | | $ 3,555 | | $ 4,338 |
Richmond County Hosp. Auth. (Univ. Health Svcs., Inc. Proj.) Series 2009: | | | | |
5% 1/1/14 | | 1,305 | | 1,354 |
5% 1/1/15 | | 1,040 | | 1,110 |
5% 1/1/16 | | 2,415 | | 2,624 |
5% 1/1/18 | | 1,530 | | 1,708 |
| | 150,619 |
Hawaii - 0.7% |
Hawaii Arpts. Sys. Rev.: | | | | |
Series 2010 B, 5% 7/1/15 (e) | | 3,900 | | 4,290 |
Series 2011, 5% 7/1/19 (e) | | 4,000 | | 4,693 |
Hawaii Gen. Oblig.: | | | | |
Series DR: | | | | |
5% 6/1/16 | | 7,645 | | 8,728 |
5% 6/1/16 (Escrowed to Maturity) | | 2,895 | | 3,320 |
Series DY: | | | | |
5% 2/1/15 | | 3,500 | | 3,825 |
5% 2/1/16 | | 4,000 | | 4,520 |
| | 29,376 |
Illinois - 8.5% |
Chicago Board of Ed. Series 2009 D: | | | | |
5% 12/1/17 (Assured Guaranty Corp. Insured) | | 4,115 | | 4,760 |
5% 12/1/18 (Assured Guaranty Corp. Insured) | | 2,335 | | 2,726 |
Chicago Gen. Oblig.: | | | | |
(City Colleges Proj.): | | | | |
Series 1999: | | | | |
0% 1/1/17 (Nat'l. Pub. Fin. Guarantee Corp. Insured) | | 7,200 | | 6,650 |
0% 1/1/18 (Nat'l. Pub. Fin. Guarantee Corp. Insured) | | 3,000 | | 2,683 |
0% 1/1/19 (Nat'l. Pub. Fin. Guarantee Corp. Insured) | | 9,805 | | 8,439 |
Series1999, 0% 1/1/20 (Nat'l. Pub. Fin. Guarantee Corp. Insured) | | 14,755 | | 12,090 |
Series 2012 B: | | | | |
5.125% 1/1/15 (AMBAC Insured) | | 3,000 | | 3,219 |
5.125% 1/1/15 (Pre-Refunded to 1/1/14 @ 100) | | 995 | | 1,042 |
Series A, 5% 1/1/17 (FSA Insured) | | 3,465 | | 3,839 |
Series B, 5% 1/1/17 (FSA Insured) | | 5,115 | | 5,617 |
Municipal Bonds - continued |
| Principal Amount (000s) | | Value (000s) |
Illinois - continued |
Chicago Midway Arpt. Rev. Bonds Series 2010 B, 5%, tender 1/1/15 (b) | | $ 5,000 | | $ 5,374 |
Chicago O'Hare Int'l. Arpt. Rev.: | | | | |
Series 2008 A, 5% 1/1/13 (FSA Insured) | | 4,000 | | 4,000 |
Series 2010 D, 5.25% 1/1/17 (e) | | 1,000 | | 1,154 |
Series 2010 E: | | | | |
5% 1/1/15 (e) | | 4,000 | | 4,321 |
5% 1/1/16 (e) | | 1,500 | | 1,671 |
Series 2011 B, 5% 1/1/18 | | 6,500 | | 7,553 |
Series 2012 A: | | | | |
5% 1/1/14 (e) | | 3,500 | | 3,652 |
5% 1/1/14 (e) | | 2,000 | | 2,087 |
5% 1/1/21 | | 1,400 | | 1,662 |
Series 2012 B, 5% 1/1/21 (e) | | 4,605 | | 5,373 |
Chicago Sales Tax Rev. Series 1998, 5.5% 1/1/16 (FGIC Insured) (FSA Insured) | | 1,710 | | 1,927 |
Chicago Transit Auth. Cap. Grant Receipts Rev.: | | | | |
(Fed. Transit Administration Section 5309 Proj.) Series 2008 A, 5% 6/1/13 | | 3,765 | | 3,831 |
5% 6/1/19 (Assured Guaranty Corp. Insured) | | 2,085 | | 2,345 |
5% 6/1/19 (Assured Guaranty Corp. Insured) (Pre-Refunded to 12/1/16 @ 100) | | 415 | | 484 |
Cook County Gen. Oblig. Series 2012 C: | | | | |
5% 11/15/19 | | 1,500 | | 1,802 |
5% 11/15/20 | | 2,500 | | 3,029 |
5% 11/15/21 | | 3,000 | | 3,633 |
Cook County Thorton Township High School District #205 5.5% 12/1/16 (Assured Guaranty Corp. Insured) | | 2,500 | | 2,893 |
Illinois Fin. Auth. Gas Supply Rev. Bonds (The Peoples Gas Lt. and Coke Co. Proj.): | | | | |
Series 2010 B, 2.625%, tender 8/1/15 (b) | | 9,500 | | 9,740 |
Series 2010, 2.125%, tender 7/1/14 (b) | | 11,500 | | 11,689 |
Illinois Fin. Auth. Hosp. Rev. (KishHealth Sys. Proj.) Series 2008, 5.25% 10/1/15 | | 2,220 | | 2,407 |
Illinois Fin. Auth. Rev.: | | | | |
(Advocate Health Care Proj.) Series 2010 D, 5% 4/1/15 | | 550 | | 600 |
(Kewanee Hosp. Proj.) Series 2006, 5% 8/15/26 | | 3,865 | | 4,069 |
(Northwest Cmnty. Hosp. Proj.) Series 2008 A: | | | | |
5% 7/1/13 | | 415 | | 423 |
5% 7/1/15 | | 1,000 | | 1,088 |
Municipal Bonds - continued |
| Principal Amount (000s) | | Value (000s) |
Illinois - continued |
Illinois Fin. Auth. Rev.: - continued | | | | |
(Palos Cmnty. Hosp. Proj.) Series 2010 C: | | | | |
5% 5/15/16 | | $ 2,060 | | $ 2,259 |
5% 5/15/17 | | 3,520 | | 3,912 |
(Provena Health Proj.) Series 2010 A: | | | | |
5% 5/1/13 | | 2,000 | | 2,025 |
5% 5/1/14 | | 2,000 | | 2,094 |
5.75% 5/1/19 | | 2,650 | | 3,109 |
(Rush Univ. Med. Ctr. Proj.) Series 2006 B: | | | | |
5% 11/1/15 (Nat'l. Pub. Fin. Guarantee Corp. Insured) | | 3,075 | | 3,408 |
5% 11/1/16 (Nat'l. Pub. Fin. Guarantee Corp. Insured) | | 1,700 | | 1,925 |
Bonds (Advocate Health Care Proj.) Series 2008 C B3, 4.375%, tender 7/1/14 (b) | | 4,000 | | 4,211 |
Series 2012 A, 5% 5/15/23 | | 1,300 | | 1,490 |
Series 2012: | | | | |
5% 9/1/19 | | 1,115 | | 1,282 |
5% 9/1/20 | | 1,470 | | 1,698 |
5% 9/1/21 | | 1,645 | | 1,916 |
5% 9/1/22 | | 2,165 | | 2,518 |
Illinois Gen. Oblig.: | | | | |
Series 2002, 5.5% 8/1/15 (Nat'l. Pub. Fin. Guarantee Corp. Insured) | | 1,495 | | 1,656 |
Series 2003 A, 5.25% 10/1/13 (FSA Insured) | | 3,755 | | 3,894 |
Series 2004 B, 5% 3/1/14 | | 15,500 | | 16,199 |
Series 2004, 5% 11/1/16 | | 11,000 | | 12,439 |
Series 2005: | | | | |
5% 4/1/13 (AMBAC Insured) | | 5,000 | | 5,055 |
5% 4/1/17 (AMBAC Insured) | | 8,050 | | 8,669 |
Series 2007 A, 5.5% 6/1/15 | | 1,000 | | 1,101 |
Series 2007 B, 5% 1/1/17 | | 9,835 | | 11,143 |
Series 2009 A, 3.5% 9/1/13 (Escrowed to Maturity) | | 3,000 | | 3,064 |
Series 2010: | | | | |
4% 1/1/13 | | 3,695 | | 3,695 |
5% 1/1/15 (FSA Insured) | | 20,000 | | 21,512 |
Series 2012: | | | | |
2% 2/1/13 | | 9,500 | | 9,511 |
3% 8/1/13 | | 4,800 | | 4,869 |
3% 9/1/13 | | 2,000 | | 2,033 |
4% 3/1/14 | | 5,000 | | 5,168 |
5% 3/1/13 | | 5,000 | | 5,036 |
Municipal Bonds - continued |
| Principal Amount (000s) | | Value (000s) |
Illinois - continued |
Illinois Gen. Oblig.: - continued | | | | |
Series 2012: | | | | |
5% 3/1/19 | | $ 5,500 | | $ 6,331 |
5% 8/1/22 | | 5,700 | | 6,525 |
Illinois Health Facilities Auth. Rev.: | | | | |
(Delnor-Cmnty. Hosp. Proj.) Series 2003 A: | | | | |
5% 5/15/15 (FSA Insured) | | 2,250 | | 2,440 |
5% 5/15/16 (FSA Insured) | | 2,325 | | 2,582 |
Series 2003 A, 5% 5/15/17 (FSA Insured) | | 2,150 | | 2,443 |
Illinois Sales Tax Rev.: | | | | |
Series 2009 B: | | | | |
4.5% 6/15/16 | | 5,000 | | 5,583 |
4.5% 6/15/17 | | 6,075 | | 6,893 |
Series 2010, 5% 6/15/15 | | 8,800 | | 9,698 |
Series 2011, 4% 6/15/13 | | 2,600 | | 2,643 |
Illinois Unemployment Ins. Fund Bldg. Receipts Series 2012 A: | | | | |
1.5% 6/15/21 | | 5,500 | | 5,504 |
4% 6/15/20 | | 1,000 | | 1,047 |
5% 6/15/20 | | 6,000 | | 6,496 |
Kane County Forest Preserve District Series 2012, 4% 12/15/14 | | 3,200 | | 3,419 |
Lake County Cmnty. Consolidated School District #73 Gen. Oblig.: | | | | |
0% 12/1/15 (Escrowed to Maturity) | | 580 | | 568 |
0% 12/1/15 (Nat'l. Pub. Fin. Guarantee Corp. Insured) | | 1,520 | | 1,451 |
Metropolitan Pier & Exposition: | | | | |
(McCormick Place Expansion Proj.) Series 1996 A, 0% 12/15/13 (Nat'l. Pub. Fin. Guarantee Corp. Insured) | | 2,725 | | 2,682 |
Series A, 0% 6/15/14 (Escrowed to Maturity) | | 8,625 | | 8,553 |
0% 6/15/14 (Nat'l. Pub. Fin. Guarantee Corp. Insured) | | 700 | | 680 |
Univ. of Illinois Rev. 0% 4/1/14 | | 2,350 | | 2,318 |
Will County Cmnty. Unit School District #365-U: | | | | |
0% 11/1/14 (Escrowed to Maturity) | | 1,025 | | 1,011 |
0% 11/1/14 (FSA Insured) | | 875 | | 857 |
0% 11/1/16 (Escrowed to Maturity) | | 740 | | 711 |
0% 11/1/16 (FSA Insured) | | 2,235 | | 2,093 |
| | 367,291 |
Municipal Bonds - continued |
| Principal Amount (000s) | | Value (000s) |
Indiana - 2.0% |
Indiana Fin. Auth. Health Sys. Rev. (Sisters of Saint Francis Health Svcs., Inc. Obligated Group Proj.) Series 2008 C, 5% 11/1/13 | | $ 3,000 | | $ 3,108 |
Indiana Fin. Auth. Hosp. Rev. (Parkview Health Sys. Oblig. Group Proj.) Series 2009 A: | | | | |
5% 5/1/14 | | 3,500 | | 3,685 |
5% 5/1/15 | | 6,420 | | 6,985 |
Indiana Fin. Auth. Rev.: | | | | |
(Trinity Health Cr. Group Proj.) Series 2009 A: | | | | |
5% 12/1/14 | | 1,250 | | 1,352 |
5% 12/1/15 | | 2,135 | | 2,384 |
(Wabash Valley Correctional Facilities Proj.) Series 2009 A, 5% 7/1/15 | | 8,025 | | 8,846 |
(Wabash Valley Correctional Facility Proj.) Series 2009 A, 5% 7/1/14 | | 2,500 | | 2,663 |
Series 2010 A, 5% 2/1/17 | | 2,800 | | 3,258 |
Series 2012: | | | | |
5% 3/1/20 | | 650 | | 757 |
5% 3/1/21 | | 1,225 | | 1,422 |
Indiana Health & Edl. Facilities Fing. Auth. Rev. Bonds (Ascension Health Sr. Cr. Group Proj.) Series 2006 B1, 4.1%, tender 11/3/16 (b) | | 4,000 | | 4,468 |
Indiana Health Facility Fing. Auth. Rev. Bonds (Ascension Health Cr. Group Proj.): | | | | |
Series 2001 A1, 1.5%, tender 8/1/14 (b) | | 3,400 | | 3,451 |
Series 2001 A2, 1.6%, tender 2/1/17 (b) | | 2,200 | | 2,243 |
Indiana Muni. Pwr. Agcy. Pwr. Supply Sys. Rev. Series 2011 A: | | | | |
5% 1/1/19 | | 1,470 | | 1,767 |
5% 1/1/20 | | 1,250 | | 1,517 |
Indiana State Fin. Auth. Wastewtr. (CWA Auth. Proj.) Series 2012 A: | | | | |
5% 10/1/20 | | 825 | | 1,023 |
5% 10/1/22 | | 1,600 | | 2,008 |
Indianapolis Local Pub. Impt. Bond Bank (Wtrwks. Proj.) Series F, 5% 7/1/15 (Nat'l. Pub. Fin. Guarantee Corp. Insured) | | 515 | | 567 |
Indianapolis Thermal Energy Sys. Series 2010 B: | | | | |
5% 10/1/16 | | 5,000 | | 5,598 |
5% 10/1/17 | | 5,000 | | 5,709 |
Jasper County Indl. Poll. Ctl. Rev. (Northern Indiana Pub. Svc. Co. Proj.) Series 1988 B, 5.2% 6/1/13 (Nat'l. Pub. Fin. Guarantee Corp. Insured) | | 3,000 | | 3,050 |
Municipal Bonds - continued |
| Principal Amount (000s) | | Value (000s) |
Indiana - continued |
Lake Central Multi-District School Bldg. Corp. Series 2012 B: | | | | |
4% 1/15/19 | | $ 1,000 | | $ 1,139 |
4% 1/15/20 | | 1,345 | | 1,539 |
4% 1/15/21 | | 1,250 | | 1,434 |
5% 7/15/19 | | 1,680 | | 2,035 |
5% 7/15/20 | | 1,170 | | 1,432 |
5% 7/15/21 | | 1,000 | | 1,233 |
Purdue Univ. Rev.: | | | | |
(Student Facilities Sys. Proj.) Series 2009 B: | | | | |
4% 7/1/17 | | 500 | | 567 |
5% 7/1/15 | | 315 | | 350 |
5% 7/1/16 | | 500 | | 573 |
Series Z-1: | | | | |
5% 7/1/16 | | 1,215 | | 1,394 |
5% 7/1/17 | | 1,000 | | 1,179 |
5% 7/1/18 | | 1,500 | | 1,812 |
Univ. of Southern Indiana Rev. Series J: | | | | |
5% 10/1/14 (Assured Guaranty Corp. Insured) | | 1,985 | | 2,121 |
5% 10/1/15 (Assured Guaranty Corp. Insured) | | 1,000 | | 1,102 |
5% 10/1/16 (Assured Guaranty Corp. Insured) | | 1,165 | | 1,319 |
| | 85,090 |
Iowa - 0.0% |
Iowa Fin. Auth. Health Facilities Rev. Series 2005 A, 5% 2/15/16 (Assured Guaranty Corp. Insured) | | 1,700 | | 1,884 |
Kansas - 0.7% |
Kansas Dev. Fin. Agcy. (Adventist Health Sys./Sunbelt Obligated Group Proj.) Series 2009 D: | | | | |
5% 11/15/14 | | 575 | | 616 |
5% 11/15/15 | | 625 | | 691 |
5% 11/15/16 | | 875 | | 991 |
Overland Park Sales Tax Spl. Oblig. Rev. Series 2012, 4.375% 12/15/23 | | 3,100 | | 3,095 |
Wichita Hosp. Facilities Rev.: | | | | |
(Via Christi Health Sys., Inc. Proj.) Series 2009 X, 5% 11/15/14 | | 2,000 | | 2,159 |
(Via Christi Health Sys., Inc. Proj.) Series 2009 III A: | | | | |
5% 11/15/14 | | 2,405 | | 2,596 |
5% 11/15/15 | | 6,245 | | 6,958 |
5% 11/15/16 | | 5,410 | | 6,168 |
Municipal Bonds - continued |
| Principal Amount (000s) | | Value (000s) |
Kansas - continued |
Wichita Hosp. Facilities Rev.: - continued | | | | |
Series 2011 IV A: | | | | |
5% 11/15/18 | | $ 2,250 | | $ 2,643 |
5% 11/15/20 | | 2,745 | | 3,258 |
| | 29,175 |
Kentucky - 0.8% |
Ashland Med. Ctr. Rev. (Ashland Hosp. Corp. d/b/a/ King's Daughters Med. Ctr. Proj.) Series 2010 B: | | | | |
4% 2/1/14 | | 750 | | 773 |
4% 2/1/15 | | 1,495 | | 1,573 |
Jefferson County School District Fin. Corp. School Bldg. Rev. Series 2009 A, 5.25% 1/1/13 (FSA Insured) | | 2,170 | | 2,170 |
Kentucky Econ. Dev. Fin. Auth. Hosp. Rev. (Baptist Healthcare Sys. Proj.) Series A, 5% 8/15/15 | | 4,000 | | 4,367 |
Kentucky Econ. Dev. Fin. Auth. Rev. (Ashland Hosp. Corp. d/b/a/ King's Daughters Med. Ctr. Proj.) Series 2010 A, 4% 2/1/13 | | 500 | | 501 |
Kentucky State Property & Buildings Commission Rev. (#82 Proj.) 5.25% 10/1/17 (FSA Insured) | | 2,450 | | 2,915 |
Louisville/Jefferson County Metropolitan Govt. Poll. Cont. Rev. Bonds: | | | | |
(Louisville Gas and Elec. Co. Proj.) Series 2007 B: | | | | |
1.15%, tender 6/1/17 (b) | | 2,600 | | 2,577 |
1.6%, tender 6/1/17 (b) | | 8,000 | | 7,976 |
(Louisville Gas and Electronic Co. Proj.): | | | | |
Series 2003 A, 1.65%, tender 4/3/17 (b) | | 6,000 | | 6,065 |
Series 2005 A, 5.75%, tender 12/2/13 (b) | | 6,000 | | 6,273 |
| | 35,190 |
Louisiana - 0.3% |
Louisiana Pub. Facilities Auth. Rev.: | | | | |
(Christus Health Proj.) Series 2009 A: | | | | |
5% 7/1/13 | | 3,500 | | 3,568 |
5% 7/1/16 | | 2,000 | | 2,216 |
(Entergy Gulf States Louisiana LLC Proj.) Series 2010 B, 2.875% 11/1/15 | | 3,000 | | 3,092 |
New Orleans Gen. Oblig. Series 2012, 5% 12/1/20 | | 2,800 | | 3,302 |
Reg'l. Transit Auth. Louisiana Sales Tax Rev. 4% 12/1/16 (FSA Insured) | | 1,000 | | 1,105 |
| | 13,283 |
Municipal Bonds - continued |
| Principal Amount (000s) | | Value (000s) |
Maryland - 1.4% |
Maryland Gen. Oblig. Second Series B, 5.25% 8/15/16 | | $ 16,100 | | $ 18,772 |
Maryland Health & Higher Edl. Facilities Auth. Rev.: | | | | |
(Univ. of Maryland Med. Sys. Proj.) Series 2008 F: | | | | |
5% 7/1/13 | | 2,400 | | 2,446 |
5% 7/1/14 | | 3,500 | | 3,678 |
Bonds: | | | | |
(Johns Hopkins Health Sys. Obligated Group Proj.) Series 2008 B, 5%, tender 5/15/15 (b) | | 2,225 | | 2,447 |
Series 2012 D, 0.973%, tender 11/15/17 (b) | | 14,000 | | 14,078 |
Montgomery County Gen. Oblig.: | | | | |
(Dept. of Liquor Cont. Proj.) Series 2009 A, 5% 4/1/15 | | 1,725 | | 1,886 |
Series 2011 A, 5% 7/1/20 | | 16,000 | | 19,562 |
| | 62,869 |
Massachusetts - 1.6% |
Braintree Gen. Oblig. Series 2009: | | | | |
5% 5/15/14 | | 1,000 | | 1,063 |
5% 5/15/16 | | 4,400 | | 5,041 |
Massachusetts Bay Trans. Auth. Sales Tax Rev. Series 2006 B, 5.25% 7/1/18 | | 2,300 | | 2,810 |
Massachusetts Dept. of Trans. Metropolitan Hwy. Sys. Rev. Series 2010 B, 5% 1/1/15 | | 12,400 | | 13,348 |
Massachusetts Dev. Fin. Agcy. Rev.: | | | | |
(Boston College Proj.): | | | | |
Series Q1: | | | | |
4% 7/1/15 | | 1,500 | | 1,621 |
4% 7/1/16 | | 1,000 | | 1,108 |
5% 7/1/13 | | 1,000 | | 1,023 |
Series Q2: | | | | |
4% 7/1/15 | | 1,170 | | 1,264 |
4% 7/1/16 | | 1,000 | | 1,108 |
5% 7/1/13 | | 1,100 | | 1,126 |
5% 7/1/14 | | 1,080 | | 1,153 |
5% 7/1/17 | | 1,370 | | 1,606 |
(Tufts Med. Ctr. Proj.) Series I: | | | | |
5% 1/1/14 | | 1,550 | | 1,609 |
5% 1/1/16 | | 1,300 | | 1,425 |
Bonds (Dominion Energy Brayton Point Proj.) Series 2010 A, 2.25%, tender 9/1/16 (b) | | 1,400 | | 1,443 |
Massachusetts Gen. Oblig. Series 2004 B, 5.25% 8/1/20 | | 12,700 | | 16,129 |
Municipal Bonds - continued |
| Principal Amount (000s) | | Value (000s) |
Massachusetts - continued |
Massachusetts Health & Edl. Facilities Auth. Rev. Bonds (Baystate Health Sys. Proj.) Series 2009 K, 5%, tender 7/1/13 (b) | | $ 7,000 | | $ 7,125 |
Massachusetts Spl. Oblig. Rev. (Fed. Hwy. Grant Anticipation Note Prog.) Series 2003 A, 5% 12/15/13 | | 4,325 | | 4,521 |
Medford Gen. Oblig. Series 2011 B, 4% 3/1/19 | | 3,570 | | 4,102 |
| | 68,625 |
Michigan - 3.1% |
Big Rapids Pub. School District: | | | | |
5% 5/1/13 (Assured Guaranty Corp. Insured) | | 1,195 | | 1,213 |
5% 5/1/14 (Assured Guaranty Corp. Insured) | | 1,190 | | 1,257 |
Chelsea School District 5% 5/1/13 (Nat'l. Pub. Fin. Guarantee Corp. Insured) | | 1,750 | | 1,776 |
Detroit School District Series 2012 A: | | | | |
5% 5/1/19 | | 2,000 | | 2,355 |
5% 5/1/20 | | 2,000 | | 2,372 |
5% 5/1/21 | | 1,810 | | 2,165 |
Detroit Swr. Disp. Rev. Series 2006 D, 0.841% 7/1/32 (b) | | 4,070 | | 3,417 |
Grand Rapids Cmnty. College 5% 5/1/13 (FSA Insured) | | 1,305 | | 1,325 |
Grand Valley Michigan State Univ. Rev. Series 2009, 5% 12/1/16 | | 1,320 | | 1,491 |
Kalamazoo Hosp. Fin. Auth. Hosp. Facilities Rev. Series 2003 A, 5.25% 5/15/14 (FSA Insured) | | 2,000 | | 2,118 |
Kalamazoo Pub. Schools 5% 5/1/13 (Assured Guaranty Corp. Insured) | | 2,940 | | 2,985 |
Kent Hosp. Fin. Auth. Hosp. Facilities Rev.: | | | | |
(Spectrum Health Sys. Proj.) Series 2011 A: | | | | |
5% 11/15/18 | | 1,250 | | 1,472 |
5% 11/15/19 | | 1,000 | | 1,188 |
Bonds (Spectrum Health Sys. Proj.) Series 2008 A, 5.25%, tender 1/15/14 (b) | | 2,200 | | 2,301 |
Michigan Fin. Auth. Rev.: | | | | |
Series 2008 B2, 5% 6/1/15 | | 1,090 | | 1,171 |
Series 2012 A: | | | | |
5% 6/1/16 | | 2,290 | | 2,511 |
5% 6/1/17 | | 1,410 | | 1,570 |
5% 6/1/18 | | 2,330 | | 2,632 |
Michigan Hosp. Fin. Auth. Rev.: | | | | |
(McLaren Health Care Corp. Proj.) Series 2008 A, 5.25% 5/15/14 | | 4,160 | | 4,415 |
Municipal Bonds - continued |
| Principal Amount (000s) | | Value (000s) |
Michigan - continued |
Michigan Hosp. Fin. Auth. Rev.: - continued | | | | |
Bonds (Ascension Health Cr. Group Proj.) Series 1999 B3, 2%, tender 8/1/14 (b) | | $ 11,000 | | $ 11,264 |
Michigan Muni. Bond Auth. Rev.: | | | | |
(Clean Wtr. Pooled Proj.) Series 2010: | | | | |
5% 10/1/14 | | 6,045 | | 6,530 |
5% 10/1/15 | | 1,750 | | 1,972 |
5% 10/1/15 | | 3,250 | | 3,662 |
(Local Govt. Ln. Prog.) Series 2009 C: | | | | |
5% 5/1/13 | | 1,645 | | 1,669 |
5% 5/1/14 | | 2,140 | | 2,261 |
5% 5/1/15 | | 1,845 | | 2,003 |
5% 5/1/16 | | 1,865 | | 2,080 |
Royal Oak Hosp. Fin. Auth. Hosp. Rev. (William Beaumont Hosp. Oblig. Group Proj.) Series 2009 W, 5% 8/1/15 | | 2,070 | | 2,208 |
Univ. of Michigan Univ. Rev. Bonds 0.33%, tender 4/1/15 (b) | | 22,900 | | 22,900 |
Wayne County Arpt. Auth. Rev.: | | | | |
(Detroit Metropolitan Wayne County Arpt. Proj.) Series 2012 A, 5% 12/1/14 (e) | | 1,500 | | 1,614 |
Series 2010 A, 5% 12/1/18 (e) | | 1,400 | | 1,623 |
Series 2011 A, 5% 12/1/19 (e) | | 22,700 | | 26,155 |
West Bloomfield School District 5% 5/1/15 (Assured Guaranty Corp. Insured) | | 1,400 | | 1,528 |
Western Michigan Univ. Rev.: | | | | |
5.25% 11/15/14 (Assured Guaranty Corp. Insured) | | 2,135 | | 2,310 |
5.25% 11/15/15 (Assured Guaranty Corp. Insured) | | 3,275 | | 3,659 |
| | 133,172 |
Minnesota - 0.2% |
Minneapolis & Saint Paul Metropolitan Arpts. Commission Arpt. Rev. Series 2008 A, 5% 1/1/13 (e) | | 1,000 | | 1,000 |
Minnesota 911 Rev. (Pub. Safety Radio Communications Sys. Proj.) Series 2009, 5% 6/1/14 (Assured Guaranty Corp. Insured) | | 2,225 | | 2,369 |
Minnesota Agric. & Econ. Dev. Board Rev. (Essentia Health Obligated Group Proj.) Series 2008 C1: | | | | |
5% 2/15/15 (Assured Guaranty Corp. Insured) | | 1,335 | | 1,443 |
5% 2/15/16 (Assured Guaranty Corp. Insured) | | 565 | | 628 |
Municipal Bonds - continued |
| Principal Amount (000s) | | Value (000s) |
Minnesota - continued |
Northern Muni. Pwr. Agcy. Elec. Sys. Rev. Series 2009 A, 5% 1/1/15 (Assured Guaranty Corp. Insured) | | $ 1,000 | | $ 1,087 |
Southern Minnesota Muni. Pwr. Agcy. Pwr. Supply Sys. Rev. Series 2009 A, 5% 1/1/16 | | 1,000 | | 1,123 |
| | 7,650 |
Mississippi - 0.3% |
Mississippi Bus. Fin. Corp. Solid Waste Disp. Rev. Bonds (Gulf Pwr. Co. Proj.) Series 2012, 0.55%, tender 12/12/13 (b)(e) | | 4,900 | | 4,900 |
Mississippi Gen. Oblig. (Cap. Impts. Proj.) Series 2012 D, 0.66% 9/1/17 (b) | | 3,700 | | 3,714 |
Mississippi Hsg. Fin. Corp. Single Family Mtg. Rev. Series 1983, 0% 6/1/15 (Escrowed to Maturity) | | 4,000 | | 3,937 |
| | 12,551 |
Nebraska - 0.2% |
Nebraska Pub. Pwr. District Rev.: | | | | |
Series 2012 C, 5% 1/1/22 | | 1,100 | | 1,279 |
Series C: | | | | |
4% 1/1/15 | | 2,360 | | 2,518 |
4% 1/1/16 | | 2,195 | | 2,404 |
Univ. of Nebraska Facilities Corp. Lease Rental Rev. (UNMC Health Professions Futures Proj.) Series 2009, 5% 8/15/13 | | 4,000 | | 4,117 |
| | 10,318 |
Nevada - 2.1% |
Clark County Arpt. Rev. Series 2008 E: | | | | |
5% 7/1/14 | | 2,905 | | 3,100 |
5% 7/1/15 | | 3,500 | | 3,859 |
Clark County Fuel Tax Series 2008, 5% 6/1/13 (Escrowed to Maturity) | | 5,815 | | 5,928 |
Clark County School District: | | | | |
Series 1998, 5.5% 6/15/13 (FSA Insured) | | 5,000 | | 5,116 |
Series 2005 A, 5% 6/15/16 (Nat'l. Pub. Fin. Guarantee Corp. Insured) | | 21,215 | | 23,534 |
Series 2012 A, 5% 6/15/19 | | 24,610 | | 29,516 |
Nevada Dept. of Bus. & Industry (Waste Mgmt., Inc. Proj.) Series 2001, 2.75% 10/1/14 (e) | | 3,000 | | 3,102 |
Municipal Bonds - continued |
| Principal Amount (000s) | | Value (000s) |
Nevada - continued |
Nevada Gen. Oblig.: | | | | |
Series 2010 C, 5% 6/1/19 | | $ 12,140 | | $ 14,694 |
Series 2012 B, 5% 8/1/20 | | 2,230 | | 2,728 |
| | 91,577 |
New Hampshire - 0.3% |
New Hampshire Health & Ed. Facilities Auth. Rev. Series 2012: | | | | |
4% 7/1/20 | | 2,705 | | 2,988 |
4% 7/1/21 | | 1,520 | | 1,674 |
New Hampshire Tpk. Sys. Rev. Series 2012 B: | | | | |
5% 2/1/17 | | 3,000 | | 3,464 |
5% 2/1/18 | | 2,500 | | 2,953 |
| | 11,079 |
New Jersey - 3.2% |
New Jersey Ctfs. of Prtn.: | | | | |
Series 2008 A, 5% 6/15/15 | | 750 | | 820 |
Series 2009 A: | | | | |
5% 6/15/15 | | 11,285 | | 12,305 |
5% 6/15/16 | | 6,500 | | 7,248 |
New Jersey Econ. Dev. Auth. School Facilities Construction Rev.: | | | | |
Bonds Series 2008 J4, 5%, tender 9/1/14 (FSA Insured) (b) | | 7,000 | | 7,460 |
Series 2001 A, 5.5% 6/15/13 (Escrowed to Maturity) | | 1,090 | | 1,116 |
Series 2005 K, 5.25% 12/15/14 (FGIC Insured) (Nat'l. Pub. Fin. Guarantee Corp. Insured) | | 1,790 | | 1,949 |
Series 2005 O, 5% 3/1/20 (Pre-Refunded to 3/1/15 @ 100) | | 6,350 | | 6,974 |
Series 2008 W, 5% 3/1/15 | | 10,400 | | 11,333 |
Series 2009 BB, 5% 9/1/15 | | 3,390 | | 3,753 |
Series 2011 EE, 5% 9/1/20 | | 5,000 | | 6,092 |
Series 2012 G, 0.71% 2/1/15 (b) | | 7,800 | | 7,807 |
Series 2012 II, 5% 3/1/21 | | 6,800 | | 8,209 |
Series 2012: | | | | |
5% 6/15/13 | | 2,200 | | 2,243 |
5% 6/15/18 | | 10,600 | | 12,133 |
New Jersey Gen. Oblig. Series O, 5.25% 8/1/22 | | 3,930 | | 5,038 |
New Jersey Higher Ed. Student Assistance Auth. Student Ln. Rev. Series 2010 1A, 5% 12/1/15 | | 4,500 | | 4,976 |
New Jersey Tpk. Auth. Tpk. Rev.: | | | | |
Bonds Series 2012 A, 0.88%, tender 12/22/14 (b) | | 15,400 | | 15,449 |
Municipal Bonds - continued |
| Principal Amount (000s) | | Value (000s) |
New Jersey - continued |
New Jersey Tpk. Auth. Tpk. Rev.: - continued | | | | |
Series 1991 C, 6.5% 1/1/16 (Escrowed to Maturity) | | $ 3,315 | | $ 3,644 |
New Jersey Trans. Trust Fund Auth.: | | | | |
Series 2003 A, 5.5% 12/15/16 (FSA Insured) | | 5,000 | | 5,867 |
Series 2003 B. 5.25% 12/15/19 | | 3,000 | | 3,677 |
New Jersey Transit Corp. Ctfs. of Prtn. Series 2003 A, 5.25% 9/15/13 (AMBAC Insured) | | 1,940 | | 2,000 |
Toms River Gen. Oblig. 2% 12/27/13 | | 10,574 | | 10,720 |
| | 140,813 |
New Mexico - 1.1% |
Farmington Poll. Cont. Rev. Bonds (Southern California Edison Co. Four Corners Proj.) Series 2005 B, 2.875%, tender 4/1/15 (b) | | 22,100 | | 22,991 |
New Mexico Edl. Assistance Foundation: | | | | |
Series 2009 B, 4% 9/1/16 | | 7,000 | | 7,634 |
Series 2010 A1: | | | | |
4% 12/1/15 | | 3,700 | | 3,986 |
4% 12/1/16 | | 6,750 | | 7,383 |
Rio Rancho Wtr. & Wastewtr. Sys. Rev. Series 2009, 5% 5/15/17 (FSA Insured) | | 4,480 | | 5,197 |
| | 47,191 |
New York - 11.2% |
Dutchess County Local Dev. Corp. Rev. (Health Quest Systems, Inc. Proj.) Series 2010 A: | | | | |
5% 7/1/18 (Assured Guaranty Corp. Insured) (FSA Insured) | | 1,100 | | 1,262 |
5% 7/1/19 (Assured Guaranty Corp. Insured) (FSA Insured) | | 640 | | 741 |
Long Island Pwr. Auth. Elec. Sys. Rev.: | | | | |
Series 2003 B, 5.25% 6/1/14 | | 2,000 | | 2,123 |
Series 2010 A, 5% 5/1/15 | | 5,000 | | 5,465 |
Metropolitan Trans. Auth. Svc. Contract Rev. Series 2002 A, 5.5% 7/1/17 | | 5,000 | | 5,957 |
New York City Gen. Oblig.: | | | | |
Series 2005 F1, 5% 9/1/15 | | 3,560 | | 3,967 |
Series 2009 C: | | | | |
5% 8/1/13 | | 6,445 | | 6,623 |
5% 8/1/13 (Escrowed to Maturity) | | 555 | | 570 |
Series B, 5% 8/1/14 | | 10,000 | | 10,705 |
Series G, 5.625% 8/1/13 (Nat'l. Pub. Fin. Guarantee Corp. Insured) | | 50 | | 50 |
Municipal Bonds - continued |
| Principal Amount (000s) | | Value (000s) |
New York - continued |
New York City Transitional Fin. Auth. Rev.: | | | | |
Series 2003 B, 5% 2/1/20 | | $ 3,000 | | $ 3,736 |
Series 2010 B: | | | | |
5% 11/1/17 | | 20,305 | | 24,206 |
5% 11/1/17 (Escrowed to Maturity) | | 9,695 | | 11,598 |
5% 11/1/20 | | 5,950 | | 7,454 |
Series 2010 D: | | | | |
5% 11/1/15 (Escrowed to Maturity) | | 890 | | 1,004 |
5% 11/1/17 | | 10,115 | | 12,058 |
Series 2012 A: | | | | |
5% 11/1/17 | | 7,000 | | 8,345 |
5% 11/1/20 | | 4,500 | | 5,662 |
New York Dorm. Auth. Mental Health Svcs. Facilities Impt. Rev.: | | | | |
(State Univ. Proj.) Series 2012 A, 5% 5/15/20 | | 4,000 | | 4,913 |
Series 2012 A, 4% 5/15/20 | | 8,000 | | 9,274 |
New York Dorm. Auth. Personal Income Tax Rev.: | | | | |
(Ed. Proj.) Series 2009 A: | | | | |
5% 3/15/13 | | 3,545 | | 3,579 |
5% 3/15/14 | | 3,745 | | 3,956 |
5% 3/15/15 | | 4,000 | | 4,393 |
Series 2009 D: | | | | |
5% 6/15/14 | | 9,890 | | 10,558 |
5% 6/15/15 | | 16,075 | | 17,820 |
5% 6/15/16 | | 9,330 | | 10,694 |
Series 2010 A, 5% 2/15/14 (Escrowed to Maturity) | | 10 | | 11 |
Series 2012 A, 5% 12/15/20 | | 8,500 | | 10,613 |
Series A: | | | | |
5% 2/15/14 | | 9,840 | | 10,356 |
5% 2/15/15 | | 8,775 | | 9,606 |
5% 2/15/15 (Escrowed to Maturity) | | 5 | | 5 |
New York Dorm. Auth. Revs.: | | | | |
(City Univ. Sys. Consolidation Proj.) Series A: | | | | |
5.75% 7/1/13 | | 955 | | 981 |
5.75% 7/1/13 | | 270 | | 277 |
(Mental Health Svcs. Facilities Proj.): | | | | |
Series 2008 D: | | | | |
5% 2/15/14 | | 7,295 | | 7,668 |
5% 8/15/14 | | 7,755 | | 8,322 |
Series 2009 A1, 5% 2/15/15 | | 9,000 | | 9,801 |
(New York Univ. Hosp. Ctr. Proj.) Series 2011 A, 5% 7/1/18 | | 3,240 | | 3,763 |
Municipal Bonds - continued |
| Principal Amount (000s) | | Value (000s) |
New York - continued |
New York Dorm. Auth. Revs.: - continued | | | | |
(St. Lawrence Univ.) Series 2008, 5% 7/1/14 (Escrowed to Maturity) | | $ 3,700 | | $ 3,959 |
Series 2008 B, 5% 7/1/15 | | 30,000 | | 33,260 |
Series 2008 D, 5.25% 8/15/17 (FSA Insured) | | 7,000 | | 8,314 |
Series 2009 A: | | | | |
5% 7/1/15 | | 12,850 | | 14,202 |
5% 7/1/16 | | 8,390 | | 9,526 |
New York Local Govt. Assistance Corp. Series 2003 A, 5% 4/1/18 | | 12,400 | | 14,997 |
New York Metropolitan Trans. Auth. Dedicated Tax Fund Rev.: | | | | |
Bonds Series 2008 B, 0.36%, tender 11/1/14 (b) | | 6,000 | | 5,989 |
Series B: | | | | |
5% 11/15/14 | | 1,350 | | 1,465 |
5% 11/15/15 | | 2,325 | | 2,611 |
New York Metropolitan Trans. Auth. Rev.: | | | | |
Bonds: | | | | |
Series 2012 G1, 0.563%, tender 11/1/14 (b) | | 6,800 | | 6,796 |
Series 2012 G2, 0.673%, tender 11/1/15 (b) | | 13,300 | | 13,288 |
Series 2003 B: | | | | |
5.25% 11/15/17 (Pre-Refunded to 11/15/13 @ 100) | | 1,040 | | 1,083 |
5.25% 11/15/19 (Nat'l. Pub. Fin. Guarantee Corp. Insured) | | 5,200 | | 6,384 |
Series 2008 B2: | | | | |
5% 11/15/19 | | 6,185 | | 7,493 |
5% 11/15/20 | | 5,500 | | 6,677 |
5% 11/15/21 | | 4,000 | | 4,883 |
Series 2010 B2, 4% 11/15/14 | | 2,830 | | 3,012 |
Series 2012 D, 5% 11/15/18 | | 2,515 | | 3,000 |
Series 2012 E: | | | | |
4% 11/15/19 | | 4,000 | | 4,588 |
5% 11/15/18 | | 2,250 | | 2,683 |
5% 11/15/21 | | 2,435 | | 2,973 |
Series 2012 F, 5% 11/15/19 | | 5,000 | | 6,057 |
New York State Dorm. Auth. Lease Rev. Bonds Series 2003 B, 5.25%, tender 7/1/13 (b) | | 3,000 | | 3,071 |
New York Thruway Auth. Second Gen. Hwy. & Bridge Trust Fund: | | | | |
Series 2008 A, 5% 4/1/13 | | 2,600 | | 2,630 |
Series 2010 A, 5% 4/1/17 | | 1,000 | | 1,165 |
Municipal Bonds - continued |
| Principal Amount (000s) | | Value (000s) |
New York - continued |
New York Thruway Auth. Second Gen. Hwy. & Bridge Trust Fund: - continued | | | | |
Series 2011 A1: | | | | |
5% 4/1/17 | | $ 1,500 | | $ 1,747 |
5% 4/1/18 | | 3,500 | | 4,164 |
New York Urban Dev. Corp. Rev.: | | | | |
Series 2009 C, 5% 12/15/16 | | 17,000 | | 19,812 |
Series 2011 A, 5% 3/15/21 | | 18,425 | | 23,043 |
Tobacco Settlement Fing. Corp. Series 2011, 5% 6/1/16 | | 20,000 | | 22,652 |
Triborough Bridge & Tunnel Auth. Revs. Series Y, 5.5% 1/1/17 (Escrowed to Maturity) | | 6,470 | | 7,043 |
| | 486,683 |
New York & New Jersey - 0.1% |
Port Auth. of New York & New Jersey 124th Series, 5% 8/1/13 (Nat'l. Pub. Fin. Guarantee Corp. Insured) (e) | | 1,200 | | 1,204 |
Port Auth. of New York & New Jersey Spl. Oblig. Rev. (JFK Int'l. Air Term. Spl. Proj.) Series 6, 6.25% 12/1/13 (Nat'l. Pub. Fin. Guarantee Corp. Insured) (e) | | 4,100 | | 4,257 |
| | 5,461 |
North Carolina - 2.0% |
Dare County Ctfs. of Prtn. Series 2012 B: | | | | |
4% 6/1/17 | | 1,000 | | 1,118 |
4% 6/1/18 | | 1,280 | | 1,461 |
4% 6/1/20 | | 1,000 | | 1,159 |
5% 6/1/19 | | 1,305 | | 1,586 |
Mecklenburg County Pub. Facilities Corp. Series 2009: | | | | |
5% 3/1/16 | | 5,870 | | 6,659 |
5% 3/1/18 | | 1,500 | | 1,804 |
Nash Health Care Sys. Health Care Facilities Rev. Series 2003: | | | | |
5% 11/1/13 (FSA Insured) | | 1,500 | | 1,551 |
5% 11/1/15 (FSA Insured) | | 1,600 | | 1,730 |
North Carolina Eastern Muni. Pwr. Agcy. Pwr. Sys. Rev.: | | | | |
Series 2008 A, 5% 1/1/13 | | 2,200 | | 2,200 |
Series 2010 A: | | | | |
5% 1/1/15 | | 4,000 | | 4,339 |
5% 1/1/16 | | 6,035 | | 6,754 |
Series 2012 D, 5% 1/1/14 | | 3,000 | | 3,135 |
North Carolina Grant Anticipation Rev. Series 2009, 5% 3/1/15 | | 1,250 | | 1,369 |
Municipal Bonds - continued |
| Principal Amount (000s) | | Value (000s) |
North Carolina - continued |
North Carolina Med. Care Commission Hosp. Rev. (North Carolina Baptist Hosp. Proj.) Series 2010: | | | | |
5% 6/1/15 | | $ 1,500 | | $ 1,653 |
5% 6/1/16 | | 1,000 | | 1,134 |
5% 6/1/17 | | 3,220 | | 3,738 |
5% 6/1/18 | | 3,820 | | 4,532 |
North Carolina Muni. Pwr. Agcy. #1 Catawba Elec. Rev.: | | | | |
Series 1998 A, 5.5% 1/1/15 (Nat'l. Pub. Fin. Guarantee Corp. Insured) | | 3,675 | | 4,023 |
Series 2008 A, 5.25% 1/1/20 | | 2,000 | | 2,375 |
Series 2012 A, 5% 1/1/18 | | 18,685 | | 21,907 |
Univ. of North Carolina at Chapel Hill Rev. Bonds Series 2012 A, 0.593%, tender 12/1/15 (b) | | 11,500 | | 11,530 |
| | 85,757 |
North Dakota - 0.0% |
Grand Forks Health Care Sys. Rev. (Altru Health Sys. Proj.) Series 2005, 5% 12/1/15 (Assured Guaranty Corp. Insured) | | 1,825 | | 1,998 |
Ohio - 2.3% |
Buckeye Tobacco Settlement Fing. Auth. Series 2007 A1: | | | | |
5% 6/1/16 | | 3,035 | | 3,339 |
5% 6/1/17 | | 3,500 | | 3,941 |
Cincinnati City School District 5.25% 12/1/18 (Nat'l. Pub. Fin. Guarantee Corp. Insured) | | 3,555 | | 4,331 |
Columbus City School District (School Facilities Construction and Impt. Proj.) Series 2009 B, 4% 12/1/16 | | 1,000 | | 1,116 |
Hamilton County Student Hsg. Rev. (Stratford Heights Proj.) Series 2010: | | | | |
5% 6/1/15 (FSA Insured) | | 760 | | 818 |
5% 6/1/16 (FSA Insured) | | 1,105 | | 1,222 |
5% 6/1/17 (FSA Insured) | | 1,160 | | 1,304 |
Ohio Air Quality Dev. Auth. Rev.: | | | | |
Bonds (Ohio Pwr. Co. Proj.) Series 2010 A, 3.25%, tender 6/2/14 (b) | | 5,500 | | 5,657 |
Series 2009 C, 5.625% 6/1/18 | | 1,395 | | 1,629 |
Ohio Bldg. Auth.: | | | | |
(Administrative Bldg. Fund Proj.): | | | | |
Series 2009 B: | | | | |
5% 10/1/14 | | 5,955 | | 6,423 |
5% 10/1/15 | | 6,505 | | 7,275 |
Municipal Bonds - continued |
| Principal Amount (000s) | | Value (000s) |
Ohio - continued |
Ohio Bldg. Auth.: - continued | | | | |
(Administrative Bldg. Fund Proj.): | | | | |
Series 2010 C: | | | | |
4% 10/1/15 | | $ 3,200 | | $ 3,483 |
5% 10/1/16 | | 1,250 | | 1,435 |
(Adult Correctional Bldg. Fund Proj.): | | | | |
Series 2009 B: | | | | |
5% 10/1/14 | | 2,055 | | 2,217 |
5% 10/1/15 | | 4,535 | | 5,071 |
Series 2010 A, 5% 10/1/15 | | 1,185 | | 1,322 |
Ohio Gen. Oblig.: | | | | |
(Common Schools Proj.) Series 2010 A, 5% 9/15/17 | | 2,600 | | 3,073 |
(Higher Ed. Proj.): | | | | |
Series 2005 C, 5% 8/1/13 | | 4,495 | | 4,619 |
Series 2010 A, 5% 8/1/17 | | 3,290 | | 3,875 |
Series 2011 A, 5% 8/1/17 | | 3,070 | | 3,616 |
Series 2012 C, 5% 9/15/21 | | 4,350 | | 5,486 |
Ohio Higher Edl. Facility Commission Rev.: | | | | |
(Cleveland Clinic Foundation Proj.) Series 2008 A, 5% 1/1/15 | | 2,000 | | 2,175 |
(Univ. Hosp. Health Sys. Proj.) Series 2010 A: | | | | |
5% 1/15/15 | | 500 | | 537 |
5% 1/15/17 | | 1,000 | | 1,120 |
Ohio State Univ. Gen. Receipts Series 2010 A: | | | | |
5% 12/1/16 | | 4,720 | | 5,495 |
5% 12/1/16 (Escrowed to Maturity) | | 280 | | 327 |
Ohio Wtr. Dev. Auth. Poll. Cont. Facilities Rev. Bonds: | | | | |
(First Energy Nuclear Generation Corp. Proj.) Series 2005 B, 3.375%, tender 7/1/15 (b) | | 5,000 | | 5,153 |
(FirstEnergy Corp. Proj.) Series 2009 A, 5.875%, tender 6/1/16 (b) | | 10,225 | | 11,434 |
Ross County Hosp. Facilities Rev. (Adena Health Sys. Proj.) Series 2008: | | | | |
5% 12/1/13 | | 875 | | 906 |
5% 12/1/14 | | 2,275 | | 2,434 |
| | 100,833 |
Oklahoma - 0.2% |
Oklahoma Dev. Fin. Auth. (Pub. Svc. Co. of Oklahoma Proj.) Series 2009, 5.25% 6/1/14 | | 2,700 | | 2,850 |
Municipal Bonds - continued |
| Principal Amount (000s) | | Value (000s) |
Oklahoma - continued |
Oklahoma Dev. Fin. Auth. Health Sys. Rev. (Integris Baptist Med. Ctr. Proj.) Series 2008 B, 5% 8/15/14 | | $ 1,660 | | $ 1,770 |
Tulsa County Indl. Auth. Edl. Facilities Lease Rev. (Jenks Pub. Schools Proj.) Series 2009, 5.5% 9/1/18 | | 5,215 | | 6,358 |
| | 10,978 |
Oregon - 0.3% |
Clackamas County Hosp. Facility Auth. Bonds (Legacy Health Sys. Proj.) Series 2009 C, 5%, tender 7/15/14 (b) | | 2,500 | | 2,640 |
Gilliam County Solid Waste Disp. Rev. Bonds (Waste Mgmt., Inc. Proj.) Series 2000 A, 3.5%, tender 5/1/13 (b)(e) | | 5,300 | | 5,352 |
Oregon Facilities Auth. Rev. (Legacy Health Sys. Proj.) Series 2009 A: | | | | |
5% 3/15/13 | | 1,000 | | 1,009 |
5% 3/15/14 | | 595 | | 623 |
5% 3/15/15 | | 2,500 | | 2,709 |
5% 3/15/16 | | 1,750 | | 1,949 |
| | 14,282 |
Pennsylvania - 4.1% |
Allegheny County Arpt. Auth. Rev. Series A: | | | | |
5% 1/1/14 (FSA Insured) (e) | | 1,350 | | 1,390 |
5% 1/1/15 (FSA Insured) (e) | | 1,000 | | 1,066 |
5% 1/1/16 (FSA Insured) (e) | | 1,000 | | 1,091 |
Allegheny County Hosp. Dev. Auth. Rev.: | | | | |
(Pittsburgh Med. Ctr. Proj.) Series 2008 B, 5% 6/15/14 | | 1,385 | | 1,476 |
(Univ. of Pittsburgh Med. Ctr. Proj.) Series 2009 A: | | | | |
4% 8/15/15 | | 1,385 | | 1,502 |
5% 8/15/14 | | 1,955 | | 2,099 |
Beaver County Indl. Dev. Auth. Poll. Cont. Rev. Bonds (FirstEnergy Nuclear Generation Corp. Proj.) Series 2005 A, 3.375%, tender 7/1/15 (b) | | 2,000 | | 2,061 |
Econ. Dev. Fin. Auth. Unemployment Compensation Rev. Series 2012 B: | | | | |
5% 1/1/22 | | 5,000 | | 5,848 |
5% 7/1/22 | | 5,200 | | 5,927 |
5% 1/1/23 | | 3,000 | | 3,365 |
5% 7/1/23 | | 1,650 | | 1,822 |
Municipal Bonds - continued |
| Principal Amount (000s) | | Value (000s) |
Pennsylvania - continued |
Franklin County Indl. Dev. Auth. (The Chambersburg Hosp. Proj.) Series 2010: | | | | |
5% 7/1/16 | | $ 1,000 | | $ 1,098 |
5% 7/1/17 | | 1,255 | | 1,389 |
Montgomery County Indl. Dev. Series 2012 A, 3% 10/1/13 | | 1,650 | | 1,681 |
Montgomery County Higher Ed. & Health Auth. Hosp. Rev. (Abington Memorial Hosp. Proj.) Series 2009 A, 5% 6/1/17 | | 2,200 | | 2,515 |
Pennsylvania Econ. Dev. Auth. Governmental Lease (Forum Place Proj.) Series 2012: | | | | |
5% 3/1/18 | | 2,455 | | 2,830 |
5% 3/1/19 | | 2,310 | | 2,705 |
5% 3/1/20 | | 2,140 | | 2,530 |
Pennsylvania Gen. Oblig. Series 2011, 5% 7/1/21 | | 1,900 | | 2,402 |
Pennsylvania Intergovernmental Coop. Auth. Spl. Tax Rev. (City of Philadelphia Fdg. Prog.) Series 2009, 5% 6/15/15 | | 10,600 | | 11,709 |
Pennsylvania Tpk. Commission Tpk. Rev. Series 2009 B, 5% 12/1/17 | | 12,500 | | 14,731 |
Philadelphia Gas Works Rev. (1998 Gen. Ordinance Proj.) Eighth Series A, 5% 8/1/15 | | 2,100 | | 2,306 |
Philadelphia Gen. Oblig.: | | | | |
Series 2008 A: | | | | |
5% 12/15/14 (FSA Insured) | | 5,370 | | 5,799 |
5% 12/15/15 (FSA Insured) | | 5,000 | | 5,544 |
5% 12/15/16 (FSA Insured) | | 7,275 | | 8,265 |
Series 2011: | | | | |
5.25% 8/1/17 | | 6,165 | | 7,025 |
5.25% 8/1/18 | | 5,515 | | 6,352 |
Philadelphia School District Series 2010 C, 5% 9/1/16 | | 13,610 | | 15,408 |
Philadelphia Wtr. & Wastewtr. Rev. Series 2010 A: | | | | |
5% 6/15/15 | | 15,000 | | 16,501 |
5% 6/15/16 | | 6,000 | | 6,796 |
Pittsburgh & Allegheny County Sports & Exhibition Auth. Series 2010: | | | | |
5% 2/1/15 (FSA Insured) | | 4,580 | | 4,928 |
5% 2/1/16 (FSA Insured) | | 5,620 | | 6,211 |
Pittsburgh School District: | | | | |
Series 2009 A, 3% 9/1/14 (Assured Guaranty Corp. Insured) | | 1,640 | | 1,706 |
Series 2010 A: | | | | |
4% 9/1/15 (FSA Insured) | | 1,450 | | 1,561 |
Municipal Bonds - continued |
| Principal Amount (000s) | | Value (000s) |
Pennsylvania - continued |
Pittsburgh School District: - continued | | | | |
Series 2010 A: | | | | |
5% 9/1/16 (FSA Insured) | | $ 1,685 | | $ 1,904 |
Saint Mary Hosp. Auth. Health Sys. Rev. (Catholic Health East Proj.) Series 2010 B: | | | | |
5% 11/15/13 | | 2,465 | | 2,550 |
5% 11/15/14 | | 4,690 | | 5,026 |
5% 11/15/15 | | 2,420 | | 2,667 |
Southeastern Pennsylvania Trans. Auth. Rev. Series 2011: | | | | |
5% 6/1/18 | | 1,000 | | 1,168 |
5% 6/1/19 | | 200 | | 237 |
State Pub. School Bldg. Auth. Lease Rev. (Philadelphia School District Proj.) Series 2012: | | | | |
5% 4/1/14 | | 1,000 | | 1,052 |
5% 4/1/19 | | 1,305 | | 1,535 |
5% 4/1/20 | | 1,250 | | 1,479 |
5% 4/1/21 | | 1,000 | | 1,186 |
Unionville-Chadds Ford School District Gen. Oblig. Series 2009, 5% 6/1/20 | | 1,190 | | 1,453 |
| | 179,896 |
Puerto Rico - 0.4% |
Puerto Rico Commonwealth Aqueduct & Swr. Auth. Series 2012 A, 5% 7/1/21 | | 6,000 | | 5,984 |
Puerto Rico Infrastructure Fin. Bonds (Port Auth. Proj.) Series 2011 C, 2.75%, tender 6/15/13 (b)(e) | | 9,600 | | 9,636 |
| | 15,620 |
Rhode Island - 0.2% |
Rhode Island Econ. Dev. Corp. Rev. (Dept. of Trans. Proj.) Series 2009 A: | | | | |
5% 6/15/15 (Assured Guaranty Corp. Insured) | | 2,010 | | 2,203 |
5% 6/15/16 (Assured Guaranty Corp. Insured) | | 6,625 | | 7,463 |
| | 9,666 |
South Carolina - 0.5% |
Lexington County Health Svcs. District, Inc. Hosp. Rev. Series 2011, 5% 11/1/19 | | 1,190 | | 1,427 |
South Carolina Pub. Svc. Auth. (Santee Cooper) Rev. Oblig.: | | | | |
Series 2012 B: | | | | |
5% 12/1/17 | | 2,000 | | 2,364 |
5% 12/1/20 | | 1,000 | | 1,242 |
Municipal Bonds - continued |
| Principal Amount (000s) | | Value (000s) |
South Carolina - continued |
South Carolina Pub. Svc. Auth. (Santee Cooper) Rev. Oblig.: - continued | | | | |
Series 2012 C: | | | | |
5% 12/1/13 | | $ 2,400 | | $ 2,501 |
5% 12/1/17 | | 10,535 | | 12,454 |
| | 19,988 |
South Dakota - 0.2% |
South Dakota Health & Edl. Facilities Auth. Rev.: | | | | |
(Reg'l. Health Proj.) Series 2010: | | | | |
5% 9/1/14 | | 625 | | 668 |
5% 9/1/15 | | 680 | | 749 |
5% 9/1/16 | | 500 | | 564 |
5% 9/1/17 | | 490 | | 562 |
Series 2011: | | | | |
5% 9/1/17 | | 1,100 | | 1,261 |
5% 9/1/18 | | 1,200 | | 1,395 |
5% 9/1/19 | | 1,255 | | 1,472 |
| | 6,671 |
Tennessee - 0.5% |
Jackson Hosp. Rev. (Jackson-Madison County Gen. Hosp. Proj.) Series 2008, 5% 4/1/13 | | 1,000 | | 1,010 |
Knox County Health Edl. & Hsg. Facilities Series 2012 A: | | | | |
5% 1/1/19 | | 1,925 | | 2,232 |
5% 1/1/20 | | 2,500 | | 2,918 |
5% 1/1/21 | | 2,500 | | 2,928 |
Memphis Elec. Sys. Rev. 5% 12/1/14 | | 5,000 | | 5,442 |
Memphis-Shelby County Arpt. Auth. Arpt. Rev. Series 2010 B, 5% 7/1/16 (e) | | 1,730 | | 1,945 |
Metropolitan Nashville Arpt. Auth. Rev. Series 2010 A: | | | | |
5% 7/1/16 | | 1,815 | | 2,018 |
5% 7/1/17 | | 1,100 | | 1,248 |
Shelby County Health Edl. & Hsg. Facilities Board Rev. Series 2004 A, 5% 9/1/15 | | 3,125 | | 3,459 |
| | 23,200 |
Texas - 7.7% |
Austin Cmnty. College District Pub. Facilities Lease Rev. (Round Rock Campus Proj.) Series 2008, 5.25% 8/1/15 | | 2,585 | | 2,866 |
Municipal Bonds - continued |
| Principal Amount (000s) | | Value (000s) |
Texas - continued |
Austin Convention Enterprises, Inc. (Convention Ctr. Proj.): | | | | |
Series 2006 A, 6% 1/1/14 | | $ 1,420 | | $ 1,469 |
Series 2006 B, 6% 1/1/13 | | 1,270 | | 1,270 |
Austin Elec. Util. Sys. Rev.: | | | | |
Series A, 5% 11/15/15 | | 1,000 | | 1,126 |
0% 5/15/18 (Nat'l. Pub. Fin. Guarantee Corp. Insured) | | 4,500 | | 4,008 |
Austin Independent School District Series 2004, 5% 8/1/17 | | 1,450 | | 1,716 |
Austin Wtr. & Wastewtr. Sys. Rev. Series 2009 A, 5% 11/15/15 | | 2,250 | | 2,531 |
Brownsville Util. Sys. Rev. Series 2008 A, 5% 9/1/15 (FSA Insured) | | 2,665 | | 2,946 |
Carroll Independent School District Series 2009 C, 5.25% 2/15/19 | | 1,000 | | 1,242 |
Corpus Christi Independent School District 4% 8/15/14 | | 10,140 | | 10,730 |
Dallas Fort Worth Int'l. Arpt. Rev. Series 2009 A: | | | | |
5% 11/1/14 | | 2,500 | | 2,705 |
5% 11/1/15 | | 5,000 | | 5,599 |
Dallas Wtrwks. & Swr. Sys. Rev. Series 2011, 5% 10/1/18 | | 1,600 | | 1,953 |
Fort Worth Independent School District Series 2009, 5% 2/15/16 | | 3,690 | | 4,186 |
Frisco Gen. Oblig. Series 2004, 5.25% 2/15/14 (Nat'l. Pub. Fin. Guarantee Corp. Insured) | | 1,380 | | 1,456 |
Grapevine Gen. Oblig.: | | | | |
Series 2009 A, 5% 2/15/15 | | 2,215 | | 2,418 |
Series 2009, 5% 2/15/16 | | 1,375 | | 1,554 |
Harris County Cultural Ed. Facilities Fin. Corp. Thermal Util. Rev. (TECO Proj.) Series 2009 A: | | | | |
5% 11/15/14 | | 1,000 | | 1,072 |
5% 11/15/16 | | 500 | | 568 |
Harris County Gen. Oblig.: | | | | |
(Road Proj.) Series 2008 B: | | | | |
5% 8/15/13 | | 1,000 | | 1,029 |
5% 8/15/14 | | 1,075 | | 1,155 |
Bonds Series 2012 B, 0.72%, tender 8/15/15 (b) | | 10,470 | | 10,479 |
Series 2012 A, 0.56% 8/15/15 (b) | | 1,300 | | 1,302 |
Houston Arpt. Sys. Rev.: | | | | |
Series 2011 A, 5% 7/1/17 (e) | | 7,380 | | 8,533 |
Series A: | | | | |
5% 7/1/15 | | 2,070 | | 2,293 |
Municipal Bonds - continued |
| Principal Amount (000s) | | Value (000s) |
Texas - continued |
Houston Arpt. Sys. Rev.: - continued | | | | |
Series A: | | | | |
5% 7/1/16 | | $ 1,080 | | $ 1,233 |
Houston Gen. Oblig.: | | | | |
Series 2004 A, 5.25% 3/1/14 (Nat'l. Pub. Fin. Guarantee Corp. Insured) | | 2,855 | | 3,018 |
Series A, 5% 3/1/13 (Nat'l. Pub. Fin. Guarantee Corp. Insured) | | 7,500 | | 7,557 |
Houston Independent School District: | | | | |
Bonds Series 2012: | | | | |
1.5%, tender 6/1/13 (b) | | 8,745 | | 8,785 |
2%, tender 6/1/14 (b) | | 5,850 | | 5,966 |
Series 2005 A, 0% 2/15/16 | | 4,500 | | 4,385 |
Houston Util. Sys. Rev. Bonds Series 2012 C, 0.73%, tender 8/1/16 (b) | | 9,200 | | 9,214 |
Humble Independent School District Series 2009, 4% 2/15/13 | | 400 | | 402 |
Keller Independent School District 5% 2/15/14 | | 3,750 | | 3,944 |
Klein Independent School District Series 2009 A, 5% 8/1/16 | | 2,195 | | 2,523 |
Leander Independent School District Series 2001, 6% 8/15/14 (Escrowed to Maturity) | | 1,850 | | 2,020 |
Lewisville Independent School District Series 2009, 5% 8/15/17 | | 1,170 | | 1,378 |
Lone Star College Sys. Gen. Oblig. Series 2010 A, 5% 8/15/22 | | 2,500 | | 2,508 |
Lower Colorado River Auth. Rev.: | | | | |
Series 2010, 5% 5/15/17 | | 2,805 | | 3,249 |
Series 2012 A, 4% 5/15/14 | | 1,575 | | 1,651 |
5% 5/15/15 | | 2,120 | | 2,334 |
5% 5/15/15 (Escrowed to Maturity) | | 5 | | 6 |
5% 5/15/16 | | 2,355 | | 2,670 |
5% 5/15/16 (Escrowed to Maturity) | | 5 | | 6 |
Lower Colorado River Auth. Transmission Contract Rev. (LCRA Transmission Svcs. Corp. Proj.) Series 2010, 5% 5/15/18 | | 3,140 | | 3,722 |
Lubbock Gen. Oblig. Series 2005, 5% 2/15/13 (Nat'l. Pub. Fin. Guarantee Corp. Insured) | | 1,850 | | 1,860 |
Lubbock Health Facilities Dev. Corp. Rev. (St. Joseph Health Sys. Proj.) Series 2008 B: | | | | |
5% 7/1/17 | | 2,800 | | 3,197 |
5% 7/1/18 | | 3,030 | | 3,523 |
Mansfield Independent School District Series 2009, 4% 2/15/17 | | 1,840 | | 2,067 |
Municipal Bonds - continued |
| Principal Amount (000s) | | Value (000s) |
Texas - continued |
Mission Econ. Dev. Corp. Solid Waste Disp. Rev. Bonds (Republic Svcs., Inc. Proj.) Series 2008 A, 0.45%, tender 1/2/13 (b) | | $ 8,900 | | $ 8,900 |
North Texas Tollway Auth. Rev.: | | | | |
Bonds: | | | | |
Series 2008 H2, 5%, tender 1/1/13 (b) | | 5,000 | | 5,000 |
Series 2012 C, 1.95%, tender 1/1/19 (b) | | 8,500 | | 8,543 |
Series 2010 B1, 3.2% 1/1/13 | | 2,275 | | 2,275 |
Northside Independent School District Bonds: | | | | |
1%, tender 6/1/16 (b) | | 20,000 | | 19,920 |
1.2%, tender 8/1/17 (b) | | 30,000 | | 29,880 |
Sam Rayburn Muni. Pwr. Agcy. Series 2012: | | | | |
5% 10/1/13 | | 4,065 | | 4,193 |
5% 10/1/20 | | 1,000 | | 1,182 |
San Antonio Elec. & Gas Sys. Rev. Bonds Series 2012 A, 2%, tender 12/1/14 (b) | | 8,370 | | 8,594 |
San Antonio Pub. Facilities Corp. and Rfdg. Lease (Convention Ctr. Proj.) Series 2012: | | | | |
5% 9/15/20 | | 1,000 | | 1,223 |
5% 9/15/21 | | 1,000 | | 1,231 |
5% 9/15/22 | | 3,440 | | 4,250 |
San Antonio Wtr. Sys. Rev. Series 2012: | | | | |
4% 5/15/19 | | 1,500 | | 1,757 |
5% 5/15/20 | | 6,000 | | 7,502 |
5% 5/15/21 | | 5,000 | | 6,330 |
San Jacinto Cmnty. College District Series 2009: | | | | |
5% 2/15/15 | | 2,220 | | 2,416 |
5% 2/15/15 (Escrowed to Maturity) | | 280 | | 307 |
5% 2/15/16 | | 2,000 | | 2,247 |
Southwest Higher Ed. Auth. Rev. (Southern Methodist Univ. Proj.) Series 2009, 5% 10/1/16 | | 5,795 | | 6,637 |
Tarrant County Cultural Ed. Facilities Fin. Corp. Rev. (Christus Health Proj.) Series 2008 A, 5.75% 7/1/18 (Assured Guaranty Corp. Insured) | | 4,265 | | 4,591 |
Texas Gen. Oblig. Series B, 0% 10/1/13 | | 6,500 | | 6,485 |
Texas Muni. Pwr. Agy. Rev. Series 2010: | | | | |
4% 9/1/14 | | 1,000 | | 1,049 |
5% 9/1/15 | | 835 | | 919 |
5% 9/1/16 | | 750 | | 847 |
Texas Pub. Fin. Auth. Rev. Series 2010 A, 5% 1/1/16 | | 7,865 | | 8,874 |
Texas Trans. Commission Central Texas Tpk. Sys. Rev. Bonds Series 2012 B, 1.25%, tender 2/15/15 (b) | | 6,300 | | 6,318 |
Municipal Bonds - continued |
| Principal Amount (000s) | | Value (000s) |
Texas - continued |
Texas Trans. Commission State Hwy. Fund Rev. Series 2007, 5% 4/1/25 | | $ 2,200 | | $ 2,553 |
Tomball Independent School District 5% 2/15/17 (Assured Guaranty Corp. Insured) | | 1,105 | | 1,274 |
Trinity River Auth. Reg'l. Wastewtr. Sys. Rev. Series 2008, 5% 8/1/13 | | 6,135 | | 6,304 |
Univ. of North Texas Univ. Rev. Series A, 5% 4/15/14 | | 1,000 | | 1,059 |
Univ. of Texas Board of Regents Sys. Rev.: | | | | |
Series 2003 B, 5% 8/15/33 (Pre-Refunded to 8/15/13 @ 100) | | 15,000 | | 15,438 |
Series 2010 B, 5% 8/15/21 | | 1,800 | | 2,284 |
| | 333,806 |
Utah - 0.1% |
Salt Lake County Wtr. Conservancy District Rev. Series A, 0% 10/1/13 (AMBAC Insured) | | 3,760 | | 3,714 |
Utah Associated Muni. Pwr. Sys. Rev. (Payson Pwr. Proj.) 5% 9/1/17 | | 1,090 | | 1,255 |
| | 4,969 |
Vermont - 0.1% |
Vermont Edl. & Health Bldg. Fin. Agcy. Rev. (Fletcher Allen Health Care Proj.) Series 2004 B, 5% 12/1/15 (FSA Insured) | | 2,225 | | 2,396 |
Virgin Islands - 0.1% |
Virgin Islands Pub. Fin. Auth. Series 2009 B, 5% 10/1/15 | | 5,000 | | 5,366 |
Virginia - 0.4% |
Amelia County Indl. Dev. Auth. Solid Waste Disp. Rev. Bonds (Waste Mgmt., Inc. Proj.) 3.375%, tender 4/1/13 (b)(e) | | 5,900 | | 5,942 |
Chesapeake Econ. Dev. Auth. Poll. Cont. Rev. Bonds (Elec. & Pwr. Co. Proj.) Series 2008 A, 3.6%, tender 2/1/13 (b) | | 1,800 | | 1,804 |
Chesapeake Trans. Sys. Toll Road Rev. Series 2012 A: | | | | |
4% 7/15/20 | | 605 | | 647 |
5% 7/15/21 | | 400 | | 458 |
Municipal Bonds - continued |
| Principal Amount (000s) | | Value (000s) |
Virginia - continued |
Louisa Indl. Dev. Auth. Poll. Cont. Rev. Bonds (Virginia Elec. & Pwr. Co. Proj.) Series 2008 B, 5.375%, tender 12/2/13 (b) | | $ 8,000 | | $ 8,352 |
York County Econ. Dev. Auth. Poll. Cont. Rev. Bonds (Virginia Elec. and Pwr. Co. Proj.) Series 2009 A, 4.05%, tender 5/1/14 (b) | | 1,800 | | 1,876 |
| | 19,079 |
Washington - 1.7% |
Energy Northwest Elec. Rev.: | | | | |
(#3 Proj.) Series 2009 A, 5% 7/1/14 | | 4,000 | | 4,280 |
Series 2012 A, 5% 7/1/19 | | 30,000 | | 36,952 |
Grant County Pub. Util. District #2 Series 2012 A: | | | | |
5% 1/1/20 | | 1,375 | | 1,669 |
5% 1/1/21 | | 1,865 | | 2,286 |
King County Highline School District # 401 Series 2009: | | | | |
5% 12/1/16 | | 6,350 | | 7,379 |
5% 12/1/17 | | 2,950 | | 3,518 |
Port of Seattle Passenger Facilities Charge Rev. Series 2010 B, 5% 12/1/16 (e) | | 2,500 | | 2,845 |
Port of Seattle Rev. Series 2010 C: | | | | |
5% 2/1/16 (e) | | 2,000 | | 2,233 |
5% 2/1/17 (e) | | 2,500 | | 2,848 |
Seattle Muni. Lt. & Pwr. Rev. Series 2010 B, 5% 2/1/17 | | 2,000 | | 2,326 |
Spokane County Wastewtr. Sys. Rev. Series 2009 A, 5% 12/1/15 | | 1,710 | | 1,921 |
Washington Health Care Facilities Auth. Rev. (MultiCare Health Sys. Proj.) Series 2010 A: | | | | |
5% 8/15/13 | | 2,000 | | 2,048 |
5% 8/15/14 | | 2,000 | | 2,118 |
| | 72,423 |
West Virginia - 0.2% |
West Virginia Econ. Dev. Auth. Solid Waste Disp. Facilities Rev. Bonds Series 2011 A, 2.25%, tender 9/1/16 (b)(e) | | 7,000 | | 7,034 |
Wisconsin - 1.1% |
Milwaukee County Arpt. Rev. Series 2010 B, 5% 12/1/15 (e) | | 1,720 | | 1,902 |
Wisconsin Gen. Oblig.: | | | | |
Series 2005 1, 5% 5/1/15 (Nat'l. Pub. Fin. Guarantee Corp. Insured) | | 6,325 | | 6,981 |
Series 2009 C, 4% 5/1/14 | | 3,365 | | 3,527 |
Municipal Bonds - continued |
| Principal Amount (000s) | | Value (000s) |
Wisconsin - continued |
Wisconsin Gen. Oblig.: - continued | | | | |
Series 2010 1: | | | | |
5% 5/1/14 | | $ 5,750 | | $ 6,102 |
5% 5/1/15 | | 8,005 | | 8,835 |
5% 5/1/16 | | 10,000 | | 11,400 |
Wisconsin Health & Edl. Facilities Auth. Rev.: | | | | |
(Agnesian HealthCare, Inc. Proj.) Series 2010, 5% 7/1/16 | | 1,175 | | 1,286 |
(Aurora Health Care, Inc. Proj.) Series 2010 A, 5% 4/15/17 | | 1,500 | | 1,685 |
(Marshfield Clinic Proj.) Series 2006 A, 5% 2/15/13 | | 875 | | 879 |
(Thedacare, Inc. Proj.) Series 2010: | | | | |
4% 12/15/13 | | 1,035 | | 1,064 |
5% 12/15/15 | | 1,105 | | 1,218 |
5% 12/15/16 | | 1,440 | | 1,613 |
5% 12/15/17 | | 1,540 | | 1,751 |
Series 2012, 5% 10/1/21 | | 1,400 | | 1,687 |
| | 49,930 |
TOTAL MUNICIPAL BONDS (Cost $3,719,996) |
3,866,088
|
Municipal Notes - 2.9% |
| | | |
California - 2.3% |
California Cmnty. College Fin. Auth. Trans. TRAN Series 2012 C, 2.5% 6/28/13 | 5,200 | | 5,237 |
California Gen. Oblig. RAN Series A1, 2.5% 5/30/13 | 88,000 | | 88,845 |
California School Cash Reserve Prog. Auth. TRAN Series 2012 X, 2.5% 1/31/13 | 5,055 | | 5,060 |
| | 99,142 |
New Jersey - 0.2% |
Hudson County Gen. Oblig. BAN 1% 12/6/13 | 3,300 | | 3,316 |
Newark Gen. Oblig. BAN Series 2012 D, 2% 12/11/13 | 3,000 | | 3,017 |
| | 6,333 |
New York - 0.4% |
Suffolk County Gen. Oblig. TAN Series 2012 A, 2% 8/14/13 | 18,800 | | 18,968 |
TOTAL MUNICIPAL NOTES (Cost $124,375) |
124,443
|
Money Market Funds - 5.8% |
| Shares | | Value (000s) |
Fidelity Municipal Cash Central Fund, 0.16% (c)(d)
(Cost $249,946) | 249,945,900 | | $ 249,946 |
TOTAL INVESTMENT PORTFOLIO - 97.7% (Cost $4,094,317) | | 4,240,477 |
NET OTHER ASSETS (LIABILITIES) - 2.3% | | 101,948 |
NET ASSETS - 100% | $ 4,342,425 |
Security Type Abbreviations |
BAN | - | BOND ANTICIPATION NOTE |
RAN | - | REVENUE ANTICIPATION NOTE |
TAN | - | TAX ANTICIPATION NOTE |
TRAN | - | TAX AND REVENUE ANTICIPATION N |
Legend |
(a) Security or a portion of the security purchased on a delayed delivery or when-issued basis. |
(b) Coupon rates for floating and adjustable rate securities reflect the rates in effect at period end. |
(c) Information in this report regarding holdings by state and security types does not reflect the holdings of the Fidelity Municipal Cash Central Fund. |
(d) Affiliated fund that is available only to investment companies and other accounts managed by Fidelity Investments. The rate quoted is the annualized seven-day yield of the fund at period end. A complete unaudited listing of the fund's holdings as of its most recent quarter end is available upon request. In addition, each Fidelity Central Fund's financial statements, which are not covered by the Fund's Report of Independent Registered Public Accounting Firm, are available on the SEC's website or upon request. |
(e) Private activity obligations whose interest is subject to the federal alternative minimum tax for individuals. |
Affiliated Central Funds |
Information regarding fiscal year to date income earned by the Fund from investments in Fidelity Central Funds is as follows: |
Fund | Income earned
(Amount in thousands) |
Fidelity Municipal Cash Central Fund | $ 563 |
Other Information |
The following is a summary of the inputs used, as of December 31, 2012, involving the Fund's assets and liabilities carried at fair value. The inputs or methodology used for valuing securities may not be an indication of the risk associated with investing in those securities. For more information on valuation inputs, and their aggregation into the levels used in the table below, please refer to the Investment Valuation section in the accompanying Notes to Financial Statements. |
Valuation Inputs at Reporting Date: |
Description
(Amounts in thousands) | Total | Level 1 | Level 2 | Level 3 |
Investments in Securities: | | | | |
Municipal Securities | $ 3,990,531 | $ - | $ 3,990,531 | $ - |
Money Market Funds | 249,946 | 249,946 | - | - |
Total Investments in Securities: | $ 4,240,477 | $ 249,946 | $ 3,990,531 | $ - |
The distribution of municipal securities by revenue source, as a percentage of total net assets, is as follows (Unaudited): |
General Obligations | 36.4% |
Electric Utilities | 12.7% |
Special Tax | 12.1% |
Health Care | 9.3% |
Transportation | 7.1% |
Water & Sewer | 5.8% |
Others (Individually Less Than 5%) | 8.5% |
Short-Term Investments and Net Other Assets | 8.1% |
| 100.0% |
See accompanying notes which are an integral part of the financial statements.
Annual Report
Statement of Assets and Liabilities
Amounts in thousands (except per-share amounts) | December 31, 2012 |
| | |
Assets | | |
Investment in securities, at value - See accompanying schedule: Unaffiliated issuers (cost $3,844,371) | $ 3,990,531 | |
Fidelity Central Funds (cost $249,946) | 249,946 | |
Total Investments (cost $4,094,317) | | $ 4,240,477 |
Cash | | 85,977 |
Receivable for fund shares sold | | 14,881 |
Interest receivable | | 40,782 |
Distributions receivable from Fidelity Central Funds | | 32 |
Prepaid expenses | | 11 |
Other receivables | | 36 |
Total assets | | 4,382,196 |
| | |
Liabilities | | |
Payable for investments purchased
Regular delivery | $ 3,600 | |
Delayed delivery | 19,792 | |
Payable for fund shares redeemed | 12,315 | |
Distributions payable | 1,647 | |
Accrued management fee | 1,334 | |
Distribution and service plan fees payable | 164 | |
Other affiliated payables | 822 | |
Other payables and accrued expenses | 97 | |
Total liabilities | | 39,771 |
| | |
Net Assets | | $ 4,342,425 |
Net Assets consist of: | | |
Paid in capital | | $ 4,195,346 |
Undistributed net investment income | | 63 |
Accumulated undistributed net realized gain (loss) on investments | | 856 |
Net unrealized appreciation (depreciation) on investments | | 146,160 |
Net Assets | | $ 4,342,425 |
See accompanying notes which are an integral part of the financial statements.
Annual Report
Financial Statements - continued
Statement of Assets and Liabilities - continued
Amounts in thousands (except per-share amounts) | December 31, 2012 |
| | |
Calculation of Maximum Offering Price
Class A:
Net Asset Value and redemption price per share
($394,222 ÷ 36,285.0 shares) | | $ 10.86 |
| | |
Maximum offering price per share (100/97.25 of $10.86) | | $ 11.17 |
Class T:
Net Asset Value and redemption price per share ($24,646 ÷ 2,272.4 shares) | | $ 10.85 |
| | |
Maximum offering price per share (100/97.25 of $10.85) | | $ 11.16 |
Class B:
Net Asset Value and offering price per share ($1,110 ÷ 102.2 shares)A | | $ 10.86 |
| | |
Class C:
Net Asset Value and offering price per share ($92,301 ÷ 8,511.2 shares)A | | $ 10.84 |
| | |
Short-Intermediate Municipal Income:
Net Asset Value, offering price and redemption price per share ($3,624,182 ÷ 334,145.2 shares) | | $ 10.85 |
| | |
Institutional Class:
Net Asset Value, offering price and redemption price per share ($205,964 ÷ 18,979.6 shares) | | $ 10.85 |
A Redemption price per share is equal to net asset value less any applicable contingent deferred sales charge.
See accompanying notes which are an integral part of the financial statements.
Annual Report
Statement of Operations
Amounts in thousands | Year ended December 31, 2012 |
| | |
Investment Income | | |
Interest | | $ 98,389 |
Income from Fidelity Central Funds | | 563 |
Total income | | 98,952 |
| | |
Expenses | | |
Management fee | $ 15,811 | |
Transfer agent fees | 4,209 | |
Distribution and service plan fees | 1,887 | |
Accounting fees and expenses | 631 | |
Custodian fees and expenses | 45 | |
Independent trustees' compensation | 16 | |
Registration fees | 297 | |
Audit | 56 | |
Legal | 12 | |
Miscellaneous | 37 | |
Total expenses before reductions | 23,001 | |
Expense reductions | (265) | 22,736 |
Net investment income (loss) | | 76,216 |
Realized and Unrealized Gain (Loss) Net realized gain (loss) on: | | |
Investment securities: | | |
Unaffiliated issuers | 5,865 | |
Capital gain distributions from Fidelity Central Funds | 3 | |
Total net realized gain (loss) | | 5,868 |
Change in net unrealized appreciation (depreciation) on investment securities | | 9,754 |
Net gain (loss) | | 15,622 |
Net increase (decrease) in net assets resulting from operations | | $ 91,838 |
See accompanying notes which are an integral part of the financial statements.
Annual Report
Financial Statements - continued
Statement of Changes in Net Assets
Amounts in thousands | Year ended
December 31, 2012 | Year ended
December 31, 2011 |
Increase (Decrease) in Net Assets | | |
Operations | | |
Net investment income (loss) | $ 76,216 | $ 80,340 |
Net realized gain (loss) | 5,868 | 2,116 |
Change in net unrealized appreciation (depreciation) | 9,754 | 76,652 |
Net increase (decrease) in net assets resulting
from operations | 91,838 | 159,108 |
Distributions to shareholders from net investment income | (73,237) | (83,163) |
Distributions to shareholders from net realized gain | (4,814) | (2,965) |
Total distributions | (78,051) | (86,128) |
Share transactions - net increase (decrease) | 211,189 | 142,426 |
Redemption fees | 50 | 46 |
Total increase (decrease) in net assets | 225,026 | 215,452 |
| | |
Net Assets | | |
Beginning of period | 4,117,399 | 3,901,947 |
End of period (including undistributed net investment income of $63 and distributions in excess of net investment income of $2,916, respectively) | $ 4,342,425 | $ 4,117,399 |
See accompanying notes which are an integral part of the financial statements.
Annual Report
Financial Highlights - Class A
Years ended December 31, | 2012 | 2011 | 2010 | 2009 | 2008 |
Selected Per-Share Data | | | | | |
Net asset value, beginning of period | $ 10.83 | $ 10.62 | $ 10.64 | $ 10.35 | $ 10.33 |
Income from Investment Operations | | | | | |
Net investment income (loss) C | .164 | .198 | .209 | .254 | .298 |
Net realized and unrealized gain (loss) | .034 | .225 | (.016) | .294 | .021 |
Total from investment operations | .198 | .423 | .193 | .548 | .319 |
Distributions from net investment income | (.156) | (.205) | (.209) | (.258) | (.300) |
Distributions from net realized gain | (.012) | (.008) | (.004) | - | - |
Total distributions | (.168) | (.213) | (.213) | (.258) | (.300) |
Redemption fees added to paid in capital C | - G | - G | - G | - G | .001 |
Net asset value, end of period | $ 10.86 | $ 10.83 | $ 10.62 | $ 10.64 | $ 10.35 |
Total Return A,B | 1.84% | 4.03% | 1.81% | 5.34% | 3.13% |
Ratios to Average Net Assets D,F | | | | | |
Expenses before reductions | .79% | .77% | .78% | .79% | .75% |
Expenses net of fee waivers, if any | .79% | .77% | .78% | .78% | .75% |
Expenses net of all reductions | .78% | .77% | .77% | .78% | .72% |
Net investment income (loss) | 1.51% | 1.85% | 1.95% | 2.41% | 2.90% |
Supplemental Data | | | | | |
Net assets, end of period (in millions) | $ 394 | $ 336 | $ 200 | $ 169 | $ 58 |
Portfolio turnover rate E | 21% | 22% | 15% | 8% | 20% |
A Total returns would have been lower if certain expenses had not been reduced during the applicable periods shown.
B Total returns do not include the effect of the sales charges.
C Calculated based on average shares outstanding during the period.
D Fees and expenses of any underlying Fidelity Central Funds are not included in the Fund's expense ratio. The Fund indirectly bears its proportionate share of the expenses of any underlying Fidelity Central Funds.
E Amount does not include the portfolio activity of any underlying Fidelity Central Funds.
F Expense ratios reflect operating expenses of the class. Expenses before reductions do not reflect amounts reimbursed by the investment adviser or reductions from brokerage service arrangements or reductions from other expense offset arrangements and do not represent the amount paid by the class during periods when reimbursements or reductions occur. Expenses net of fee waivers reflect expenses after reimbursement by the investment adviser but prior to reductions from brokerage service arrangements or other expense offset arrangements. Expenses net of all reductions represent the net expenses paid by the class.
G Amount represents less than $.001 per share.
See accompanying notes which are an integral part of the financial statements.
Annual Report
Financial Highlights - Class T
Years ended December 31, | 2012 | 2011 | 2010 | 2009 | 2008 |
Selected Per-Share Data | | | | | |
Net asset value, beginning of period | $ 10.81 | $ 10.60 | $ 10.63 | $ 10.34 | $ 10.31 |
Income from Investment Operations | | | | | |
Net investment income (loss) C | .166 | .199 | .211 | .255 | .300 |
Net realized and unrealized gain (loss) | .044 | .226 | (.026) | .294 | .029 |
Total from investment operations | .210 | .425 | .185 | .549 | .329 |
Distributions from net investment income | (.158) | (.207) | (.211) | (.259) | (.300) |
Distributions from net realized gain | (.012) | (.008) | (.004) | - | - |
Total distributions | (.170) | (.215) | (.215) | (.259) | (.300) |
Redemption fees added to paid in capital C | - G | - G | - G | - G | .001 |
Net asset value, end of period | $ 10.85 | $ 10.81 | $ 10.60 | $ 10.63 | $ 10.34 |
Total Return A,B | 1.95% | 4.05% | 1.74% | 5.36% | 3.24% |
Ratios to Average Net Assets D,F | | | | | |
Expenses before reductions | .77% | .76% | .76% | .77% | .74% |
Expenses net of fee waivers, if any | .77% | .76% | .76% | .77% | .74% |
Expenses net of all reductions | .76% | .76% | .75% | .77% | .72% |
Net investment income (loss) | 1.52% | 1.86% | 1.97% | 2.42% | 2.90% |
Supplemental Data | | | | | |
Net assets, end of period (in millions) | $ 25 | $ 26 | $ 24 | $ 23 | $ 15 |
Portfolio turnover rate E | 21% | 22% | 15% | 8% | 20% |
A Total returns would have been lower if certain expenses had not been reduced during the applicable periods shown.
B Total returns do not include the effect of the sales charges.
C Calculated based on average shares outstanding during the period.
D Fees and expenses of any underlying Fidelity Central Funds are not included in the Fund's expense ratio. The Fund indirectly bears its proportionate share of the expenses of any underlying Fidelity Central Funds.
E Amount does not include the portfolio activity of any underlying Fidelity Central Funds.
F Expense ratios reflect operating expenses of the class. Expenses before reductions do not reflect amounts reimbursed by the investment adviser or reductions from brokerage service arrangements or reductions from other expense offset arrangements and do not represent the amount paid by the class during periods when reimbursements or reductions occur. Expenses net of fee waivers reflect expenses after reimbursement by the investment adviser but prior to reductions from brokerage service arrangements or other expense offset arrangements. Expenses net of all reductions represent the net expenses paid by the class.
G Amount represents less than $.001 per share.
See accompanying notes which are an integral part of the financial statements.
Annual Report
Financial Highlights - Class B
Years ended December 31, | 2012 | 2011 | 2010 | 2009 | 2008 |
Selected Per-Share Data | | | | | |
Net asset value, beginning of period | $ 10.82 | $ 10.61 | $ 10.64 | $ 10.35 | $ 10.32 |
Income from Investment Operations | | | | | |
Net investment income (loss) C | .093 | .128 | .139 | .186 | .230 |
Net realized and unrealized gain (loss) | .045 | .226 | (.026) | .293 | .029 |
Total from investment operations | .138 | .354 | .113 | .479 | .259 |
Distributions from net investment income | (.086) | (.136) | (.139) | (.189) | (.230) |
Distributions from net realized gain | (.012) | (.008) | (.004) | - | - |
Total distributions | (.098) | (.144) | (.143) | (.189) | (.230) |
Redemption fees added to paid in capital C | - G | - G | - G | - G | .001 |
Net asset value, end of period | $ 10.86 | $ 10.82 | $ 10.61 | $ 10.64 | $ 10.35 |
Total Return A,B | 1.27% | 3.36% | 1.06% | 4.66% | 2.54% |
Ratios to Average Net Assets D,F | | | | | |
Expenses before reductions | 1.44% | 1.43% | 1.44% | 1.46% | 1.43% |
Expenses net of fee waivers, if any | 1.44% | 1.42% | 1.43% | 1.43% | 1.43% |
Expenses net of all reductions | 1.43% | 1.42% | 1.42% | 1.43% | 1.40% |
Net investment income (loss) | .85% | 1.19% | 1.30% | 1.77% | 2.22% |
Supplemental Data | | | | | |
Net assets, end of period (in millions) | $ 1 | $ 2 | $ 2 | $ 3 | $ 2 |
Portfolio turnover rate E | 21% | 22% | 15% | 8% | 20% |
A Total returns would have been lower if certain expenses had not been reduced during the applicable periods shown.
B Total returns do not include the effect of the contingent deferred sales charge.
C Calculated based on average shares outstanding during the period.
D Fees and expenses of any underlying Fidelity Central Funds are not included in the Fund's expense ratio. The Fund indirectly bears its proportionate share of the expenses of any underlying Fidelity Central Funds.
E Amount does not include the portfolio activity of any underlying Fidelity Central Funds.
F Expense ratios reflect operating expenses of the class. Expenses before reductions do not reflect amounts reimbursed by the investment adviser or reductions from brokerage service arrangements or reductions from other expense offset arrangements and do not represent the amount paid by the class during periods when reimbursements or reductions occur. Expenses net of fee waivers reflect expenses after reimbursement by the investment adviser but prior to reductions from brokerage service arrangements or other expense offset arrangements. Expenses net of all reductions represent the net expenses paid by the class.
G Amount represents less than $.001 per share.
See accompanying notes which are an integral part of the financial statements.
Annual Report
Financial Highlights - Class C
Years ended December 31, | 2012 | 2011 | 2010 | 2009 | 2008 |
Selected Per-Share Data | | | | | |
Net asset value, beginning of period | $ 10.81 | $ 10.60 | $ 10.63 | $ 10.33 | $ 10.31 |
Income from Investment Operations | | | | | |
Net investment income (loss) C | .082 | .117 | .129 | .175 | .220 |
Net realized and unrealized gain (loss) | .035 | .226 | (.026) | .303 | .020 |
Total from investment operations | .117 | .343 | .103 | .478 | .240 |
Distributions from net investment income | (.075) | (.125) | (.129) | (.178) | (.221) |
Distributions from net realized gain | (.012) | (.008) | (.004) | - | - |
Total distributions | (.087) | (.133) | (.133) | (.178) | (.221) |
Redemption fees added to paid in capital C | - G | - G | - G | - G | .001 |
Net asset value, end of period | $ 10.84 | $ 10.81 | $ 10.60 | $ 10.63 | $ 10.33 |
Total Return A,B | 1.08% | 3.25% | .96% | 4.66% | 2.35% |
Ratios to Average Net Assets D,F | | | | | |
Expenses before reductions | 1.53% | 1.53% | 1.52% | 1.53% | 1.50% |
Expenses net of fee waivers, if any | 1.53% | 1.53% | 1.52% | 1.53% | 1.50% |
Expenses net of all reductions | 1.53% | 1.52% | 1.52% | 1.53% | 1.48% |
Net investment income (loss) | .76% | 1.09% | 1.20% | 1.67% | 2.14% |
Supplemental Data | | | | | |
Net assets, end of period (in millions) | $ 92 | $ 79 | $ 77 | $ 56 | $ 20 |
Portfolio turnover rate E | 21% | 22% | 15% | 8% | 20% |
A Total returns would have been lower if certain expenses had not been reduced during the applicable periods shown.
B Total returns do not include the effect of the contingent deferred sales charge.
C Calculated based on average shares outstanding during the period.
D Fees and expenses of any underlying Fidelity Central Funds are not included in the Fund's expense ratio. The Fund indirectly bears its proportionate share of the expenses of any underlying Fidelity Central Funds.
E Amount does not include the portfolio activity of any underlying Fidelity Central Funds.
F Expense ratios reflect operating expenses of the class. Expenses before reductions do not reflect amounts reimbursed by the investment adviser or reductions from brokerage service arrangements or reductions from other expense offset arrangements and do not represent the amount paid by the class during periods when reimbursements or reductions occur. Expenses net of fee waivers reflect expenses after reimbursement by the investment adviser but prior to reductions from brokerage service arrangements or other expense offset arrangements. Expenses net of all reductions represent the net expenses paid by the class.
G Amount represents less than $.001 per share.
See accompanying notes which are an integral part of the financial statements.
Annual Report
Financial Highlights - Short-Intermediate Municipal Income
Years ended December 31, | 2012 | 2011 | 2010 | 2009 | 2008 |
Selected Per-Share Data | | | | | |
Net asset value, beginning of period | $ 10.81 | $ 10.60 | $ 10.63 | $ 10.34 | $ 10.31 |
Income from Investment Operations | | | | | |
Net investment income (loss) B | .197 | .228 | .240 | .284 | .326 |
Net realized and unrealized gain (loss) | .045 | .227 | (.026) | .293 | .029 |
Total from investment operations | .242 | .455 | .214 | .577 | .355 |
Distributions from net investment income | (.190) | (.237) | (.240) | (.287) | (.326) |
Distributions from net realized gain | (.012) | (.008) | (.004) | - | - |
Total distributions | (.202) | (.245) | (.244) | (.287) | (.326) |
Redemption fees added to paid in capital B | - F | - F | - F | - F | .001 |
Net asset value, end of period | $ 10.85 | $ 10.81 | $ 10.60 | $ 10.63 | $ 10.34 |
Total Return A | 2.25% | 4.34% | 2.02% | 5.64% | 3.50% |
Ratios to Average Net Assets C,E | | | | | |
Expenses before reductions | .48% | .48% | .48% | .50% | .49% |
Expenses net of fee waivers, if any | .48% | .48% | .48% | .50% | .49% |
Expenses net of all reductions | .47% | .48% | .48% | .50% | .47% |
Net investment income (loss) | 1.81% | 2.14% | 2.24% | 2.69% | 3.15% |
Supplemental Data | | | | | |
Net assets, end of period (in millions) | $ 3,624 | $ 3,523 | $ 3,456 | $ 3,153 | $ 1,870 |
Portfolio turnover rate D | 21% | 22% | 15% | 8% | 20% |
A Total returns would have been lower if certain expenses had not been reduced during the applicable periods shown.
B Calculated based on average shares outstanding during the period.
C Fees and expenses of any underlying Fidelity Central Funds are not included in the Fund's expense ratio. The Fund indirectly bears its proportionate share of the expenses of any underlying Fidelity Central Funds.
D Amount does not include the portfolio activity of any underlying Fidelity Central Funds.
E Expense ratios reflect operating expenses of the class. Expenses before reductions do not reflect amounts reimbursed by the investment adviser or reductions from brokerage service arrangements or reductions from other expense offset arrangements and do not represent the amount paid by the class during periods when reimbursements or reductions occur. Expenses net of fee waivers reflect expenses after reimbursement by the investment adviser but prior to reductions from brokerage service arrangements or other expense offset arrangements. Expenses net of all reductions represent the net expenses paid by the class.
F Amount represents less than $.001 per share.
See accompanying notes which are an integral part of the financial statements.
Annual Report
Financial Highlights - Institutional Class
Years ended December 31, | 2012 | 2011 | 2010 | 2009 | 2008 |
Selected Per-Share Data | | | | | |
Net asset value, beginning of period | $ 10.81 | $ 10.61 | $ 10.63 | $ 10.34 | $ 10.32 |
Income from Investment Operations | | | | | |
Net investment income (loss) B | .191 | .224 | .235 | .281 | .321 |
Net realized and unrealized gain (loss) | .045 | .216 | (.015) | .293 | .022 |
Total from investment operations | .236 | .440 | .220 | .574 | .343 |
Distributions from net investment income | (.184) | (.232) | (.236) | (.284) | (.324) |
Distributions from net realized gain | (.012) | (.008) | (.004) | - | - |
Total distributions | (.196) | (.240) | (.240) | (.284) | (.324) |
Redemption fees added to paid in capital B | - F | - F | - F | - F | .001 |
Net asset value, end of period | $ 10.85 | $ 10.81 | $ 10.61 | $ 10.63 | $ 10.34 |
Total Return A | 2.19% | 4.19% | 2.07% | 5.61% | 3.38% |
Ratios to Average Net Assets C,E | | | | | |
Expenses before reductions | .54% | .52% | .53% | .55% | .51% |
Expenses net of fee waivers, if any | .54% | .52% | .53% | .53% | .51% |
Expenses net of all reductions | .53% | .52% | .52% | .53% | .49% |
Net investment income (loss) | 1.76% | 2.09% | 2.20% | 2.66% | 3.13% |
Supplemental Data | | | | | |
Net assets, end of period (in millions) | $ 206 | $ 152 | $ 142 | $ 92 | $ 32 |
Portfolio turnover rate D | 21% | 22% | 15% | 8% | 20% |
A Total returns would have been lower if certain expenses had not been reduced during the applicable periods shown.
B Calculated based on average shares outstanding during the period.
C Fees and expenses of any underlying Fidelity Central Funds are not included in the Fund's expense ratio. The Fund indirectly bears its proportionate share of the expenses of any underlying Fidelity Central Funds.
D Amount does not include the portfolio activity of any underlying Fidelity Central Funds.
E Expense ratios reflect operating expenses of the class. Expenses before reductions do not reflect amounts reimbursed by the investment adviser or reductions from brokerage service arrangements or reductions from other expense offset arrangements and do not represent the amount paid by the class during periods when reimbursements or reductions occur. Expenses net of fee waivers reflect expenses after reimbursement by the investment adviser but prior to reductions from brokerage service arrangements or other expense offset arrangements. Expenses net of all reductions represent the net expenses paid by the class.
F Amount represents less than $.001 per share.
See accompanying notes which are an integral part of the financial statements.
Annual Report
Notes to Financial Statements
For the period ended December 31, 2012
(Amounts in thousands except percentages)
1. Organization.
Fidelity Short-Intermediate Municipal Income Fund (the Fund) is a fund of Fidelity Municipal Trust (the Trust) and is authorized to issue an unlimited number of shares. The Trust is registered under the Investment Company Act of 1940, as amended (the 1940 Act), as an open-end management investment company organized as a Massachusetts business trust. The Fund offers Class A, Class T, Class C, Short-Intermediate Municipal Income and Institutional Class shares, each of which, along with Class B shares, has equal rights as to assets and voting privileges. Class B shares are closed to new accounts and additional purchases, except for exchanges and reinvestments. Each class has exclusive voting rights with respect to matters that affect that class. Class B shares will automatically convert to Class A shares after a holding period of four years from the initial date of purchase. Investment income, realized and unrealized capital gains and losses, the common expenses of the Fund, and certain fund-level expense reductions, if any, are allocated on a pro-rata basis to each class based on the relative net assets of each class to the total net assets of the Fund. Each class differs with respect to transfer agent and distribution and service plan fees incurred. Certain expense reductions may also differ by class.
2. Investments in Fidelity Central Funds.
The Fund invests in Fidelity Central Funds, which are open-end investment companies available only to other investment companies and accounts managed by Fidelity Management & Research Company (FMR) and its affiliates. The Fund's Schedule of Investments lists each of the Fidelity Central Funds held as of period end, if any, as an investment of the Fund, but does not include the underlying holdings of each Fidelity Central Fund. As an Investing Fund, the Fund indirectly bears its proportionate share of the expenses of the underlying Fidelity Central Funds.
The Money Market Central Funds seek preservation of capital and current income and are managed by Fidelity Investments Money Management, Inc. (FIMM), an affiliate of FMR.
A complete unaudited list of holdings for each Fidelity Central Fund is available upon request or at the Securities and Exchange Commission (the SEC) website at www.sec.gov. In addition, the financial statements of the Fidelity Central Funds, which are not covered by the Fund's Report of Independent Registered Public Accounting Firm, are available on the SEC website or upon request.
Annual Report
3. Significant Accounting Policies.
The financial statements have been prepared in conformity with accounting principles generally accepted in the United States of America (GAAP), which require management to make certain estimates and assumptions at the date of the financial statements. Actual results could differ from those estimates. Subsequent events, if any, through the date that the financial statements were issued have been evaluated in the preparation of the financial statements. The following summarizes the significant accounting policies of the Fund:
Investment Valuation. Investments are valued as of 4:00 p.m. Eastern time on the last calendar day of the period. In accordance with valuation policies and procedures approved by the Board of Trustees (the Board), the Fund attempts to obtain prices from one or more third party pricing vendors or brokers to value its investments. When current market prices, quotations or rates are not readily available or reliable, investments will be fair valued in good faith by the FMR Fair Value Committee (the Committee), in accordance with procedures adopted by the Board. Factors used in determining fair value vary by investment type and may include market or investment specific events, changes in interest rates and credit quality. The frequency with which these procedures are used cannot be predicted and they may be utilized to a significant extent. The Committee oversees the Fund's valuation policies and procedures and is responsible for approving and reporting to the Board all fair value determinations.
The Fund categorizes the inputs to valuation techniques used to value its investments into a disclosure hierarchy consisting of three levels as shown below:
Level 1 - quoted prices in active markets for identical investments
Level 2 - other significant observable inputs (including quoted prices for similar investments, interest rates, prepayment speeds, etc.)
Level 3 - unobservable inputs (including the Fund's own assumptions based on the best information available)
Valuation techniques used to value the Fund's investments by major category are as follows:
Debt securities, including restricted securities, are valued based on evaluated prices received from third party pricing vendors or from brokers who make markets in such securities. For municipal securities, pricing vendors utilize matrix pricing which considers yield or price of bonds of comparable quality, coupon, maturity and type as well as broker-supplied prices and are generally categorized as Level 2 in the hierarchy. When independent prices are unavailable or unreliable, debt securities may be valued utilizing
Annual Report
Notes to Financial Statements - continued
(Amounts in thousands except percentages)
3. Significant Accounting Policies - continued
Investment Valuation - continued
pricing methodologies which consider similar factors that would be used by third party pricing vendors. These are generally categorized as Level 2 in the hierarchy but may be Level 3 depending on the circumstances.
Investments in open-end mutual funds, including the Fidelity Central Funds, are valued at their closing net asset value (NAV) each business day and are categorized as Level 1 in the hierarchy.
Changes in valuation techniques may result in transfers in or out of an assigned level within the disclosure hierarchy. The aggregate value of investments by input level, as of December 31, 2012, is included at the end of the Fund's Schedule of Investments.
Investment Transactions and Income. For financial reporting purposes, the Fund's investment holdings and NAV include trades executed through the end of the last business day of the period. The NAV per share for processing shareholder transactions is calculated as of the close of business of the New York Stock Exchange (NYSE), normally 4:00 p.m. Eastern time and includes trades executed through the end of the prior business day. Gains and losses on securities sold are determined on the basis of identified cost. Interest income and distributions from the Fidelity Central Funds are accrued as earned. Interest income includes coupon interest and amortization of premium and accretion of discount on debt securities.
Expenses. Expenses directly attributable to a fund are charged to that fund. Expenses attributable to more than one fund are allocated among the respective funds on the basis of relative net assets or other appropriate methods. Expense estimates are accrued in the period to which they relate and adjustments are made when actual amounts are known.
Income Tax Information and Distributions to Shareholders. Each year, the Fund intends to qualify as a regulated investment company under Subchapter M of the Internal Revenue Code, including distributing substantially all of its taxable income and realized gains. As a result, no provision for income taxes is required. As of December 31, 2012, the Fund did not have any unrecognized tax benefits in the financial statements; nor is the Fund aware of any tax positions for which it is reasonably possible that the total amounts of unrecognized tax benefits will significantly change in the next twelve months. The Fund files a U.S. federal tax return, in addition to state and local tax returns as required. A fund's federal income tax returns are subject to examination by the Internal Revenue Service (IRS) for a period of three fiscal years after they are filed. State and local tax returns may be subject to examination for an additional fiscal year depending on the jurisdiction.
Annual Report
3. Significant Accounting Policies - continued
Income Tax Information and Distributions to Shareholders - continued
Dividends are declared and recorded daily and paid monthly from net investment income. Distributions from realized gains, if any, are declared and recorded on the ex-dividend date. Income dividends and capital gain distributions are declared separately for each class. Income and capital gain distributions are determined in accordance with income tax regulations, which may differ from GAAP. In addition, the Fund claimed a portion of the payment to redeeming shareholders as a distribution for income tax purposes.
Capital accounts within the financial statements are adjusted for permanent book-tax differences. These adjustments have no impact on net assets or the results of operations. Temporary book-tax differences will reverse in a subsequent period.
Book-tax differences are primarily due to deferred trustees compensation and losses deferred due to wash sales.
The Fund purchases municipal securities whose interest, in the opinion of the issuer, is free from federal income tax. There is no assurance that the IRS will agree with this opinion. In the event the IRS determines that the issuer does not comply with relevant tax requirements, interest payments from a security could become federally taxable, possibly retroactively to the date the security was issued.
The federal tax cost of investment securities and unrealized appreciation (depreciation) as of period end were as follows:
Gross unrealized appreciation | $ 148,500 |
Gross unrealized depreciation | (2,362) |
Net unrealized appreciation (depreciation) on securities and other investments | $ 146,138 |
| |
Tax Cost | $ 4,094,339 |
The tax-based components of distributable earnings as of period end were as follows:
Undistributed tax-exempt income | $ 63 |
Undistributed long-term capital gain | $ 877 |
Net unrealized appreciation (depreciation) | $ 146,138 |
Annual Report
Notes to Financial Statements - continued
(Amounts in thousands except percentages)
3. Significant Accounting Policies - continued
Income Tax Information and Distributions to Shareholders - continued
The tax character of distributions paid was as follows:
| December 31, 2012 | December 31, 2011 |
Tax-exempt Income | $ 73,237 | $ 83,163 |
Long-term Capital Gains | 4,814 | 2,965 |
Total | $ 78,051 | $ 86,128 |
Short-Term Trading (Redemption) Fees. Shares held by investors in the Fund less than 30 days are subject to a redemption fee equal to .50% of the net asset value of shares redeemed. All redemption fees, which reduce the proceeds of the shareholder redemption, are retained by the Fund and accounted for as an addition to paid in capital.
Delayed Delivery Transactions and When-Issued Securities. During the period, the Fund transacted in securities on a delayed delivery or when-issued basis. Payment and delivery may take place after the customary settlement period for that security. The price of the underlying securities and the date when the securities will be delivered and paid for are fixed at the time the transaction is negotiated. The securities purchased on a delayed delivery or when-issued basis are identified as such in the Fund's Schedule of Investments. The Fund may receive compensation for interest forgone in the purchase of a delayed delivery or when-issued security. With respect to purchase commitments, the Fund identifies securities as segregated in its records with a value at least equal to the amount of the commitment. Losses may arise due to changes in the value of the underlying securities or if the counterparty does not perform under the contract's terms, or if the issuer does not issue the securities due to political, economic, or other factors.
4. Purchases and Sales of Investments.
Purchases and sales of securities, other than short-term securities, aggregated $1,167,785 and $784,640, respectively.
5. Fees and Other Transactions with Affiliates.
Management Fee. FMR and its affiliates provide the Fund with investment management related services for which the Fund pays a monthly management fee. The management fee is the sum of an individual fund fee rate that is based on an annual rate of .25% of the Fund's average net assets and an annualized group fee rate that averaged .12% during the period. The group fee rate is based upon the average net assets of all the mutual funds advised by FMR. The group fee rate decreases as assets under management increase and increases as assets under management decrease. For the period, the total annual management fee rate was .37% of the Fund's average net assets.
Annual Report
5. Fees and Other Transactions with Affiliates - continued
Distribution and Service Plan Fees. In accordance with Rule 12b-1 of the 1940 Act, the Fund has adopted separate Distribution and Service Plans for each class of shares. Certain classes pay Fidelity Distributors Corporation (FDC), an affiliate of FMR, separate Distribution and Service Fees, each of which is based on an annual percentage of each class' average net assets. In addition, FDC may pay financial intermediaries for selling shares of the Fund and providing shareholder support services. For the period, the Distribution and Service Fee rates, total fees and amounts retained by FDC were as follows:
| Distribution
Fee | Service
Fee | Total Fees | Retained
by FDC |
Class A | -% | .25% | $ 929 | $ 65 |
Class T | -% | .25% | 67 | 1 |
Class B | .65% | .25% | 13 | 9 |
Class C | .75% | .25% | 878 | 291 |
| | | $ 1,887 | $ 366 |
Sales Load. FDC may receive a front-end sales charge of up to 2.75% for selling Class A shares and Class T shares, some of which is paid to financial intermediaries for selling shares of the Fund. Depending on the holding period, FDC may receive contingent deferred sales charges levied on Class A, Class T, Class B, and Class C redemptions. The deferred sales charges range from 3.00% to 1.00% for Class B shares, 1.00% for Class C shares, .75% or .50% for certain purchases of Class A shares and .25% for certain purchases of Class T shares.
For the period, sales charge amounts retained by FDC were as follows:
| Retained
by FDC |
Class A | $ 28 |
Class T | 9 |
Class B* | 2 |
Class C* | 24 |
| $ 63 |
* When Class B and Class C shares are initially sold, FDC pays commissions from its own resources to financial intermediaries through which the sales are made.
Annual Report
Notes to Financial Statements - continued
(Amounts in thousands except percentages)
5. Fees and Other Transactions with Affiliates - continued
Transfer Agent and Accounting Fees. Citibank, N.A. (Citibank) is the custodian, transfer agent, and servicing agent for the Fund's Class A, Class T, Class B, Class C, Short-Intermediate Municipal Income and Institutional Class shares. Citibank has entered into a sub-arrangement with Fidelity Investments Institutional Operations Company, Inc. (FIIOC), an affiliate of FMR, with respect to all classes of the Fund, to perform the transfer agency, dividend disbursing, and shareholder servicing functions. FIIOC receives account fees and asset-based fees that vary according to the account size and type of account of the shareholders of the respective classes of the Fund. All fees are paid to FIIOC by Citibank, which is reimbursed by each class for such payments. FIIOC pays for typesetting, printing and mailing of shareholder reports, except proxy statements. For the period, transfer agent fees for each class were as follows:
| Amount | % of
Average
Net Assets |
Class A | $ 543 | .15 |
Class T | 34 | .13 |
Class B | 2 | .15 |
Class C | 126 | .14 |
Short-Intermediate Municipal Income | 3,226 | .09 |
Institutional Class | 278 | .15 |
| $ 4,209 | |
Citibank also has a sub-arrangement with Fidelity Service Company, Inc. (FSC), an affiliate of FMR, under which FSC maintains the Fund's accounting records. The fee is paid to Citibank and is based on the level of average net assets for each month.
6. Committed Line of Credit.
The Fund participates with other funds managed by FMR or an affiliate in a $4.25 billion credit facility (the "line of credit") to be utilized for temporary or emergency purposes to fund shareholder redemptions or for other short-term liquidity purposes. The Fund has agreed to pay commitment fees on its pro-rata portion of the line of credit, which amounted to $12 and is reflected in Miscellaneous expenses on the Statement of Operations. During the period, there were no borrowings on this line of credit.
Annual Report
7. Expense Reductions.
Through arrangements with the Fund's custodian, credits realized as a result of uninvested cash balances were used to reduce the Fund's expenses. During the period, these credits reduced the Fund's custody and accounting expenses by $45 and $220, respectively.
8. Distributions to Shareholders.
Distributions to shareholders of each class were as follows:
Years ended December 31, | 2012 | 2011 |
From net investment income | | |
Class A | $ 5,319 | $ 4,211 |
Class T | 388 | 467 |
Class B | 11 | 27 |
Class C | 604 | 838 |
Short-Intermediate Municipal Income | 63,708 | 74,599 |
Institutional Class | 3,207 | 3,021 |
Total | $ 73,237 | $ 83,163 |
From net realized gain | | |
Class A | $ 428 | $ 216 |
Class T | 28 | 19 |
Class B | 1 | 1 |
Class C | 102 | 57 |
Short-Intermediate Municipal Income | 4,021 | 2,565 |
Institutional Class | 234 | 107 |
Total | $ 4,814 | $ 2,965 |
9. Share Transactions.
Transactions for each class of shares were as follows:
| Shares | Dollars |
Years ended December 31, | 2012 | 2011 | 2012 | 2011 |
Class A | | | | |
Shares sold | 25,560 | 22,096 | $ 278,216 | $ 237,519 |
Reinvestment of distributions | 425 | 303 | 4,631 | 3,252 |
Shares redeemed | (20,723) | (10,223) | (225,499) | (109,361) |
Net increase (decrease) | 5,262 | 12,176 | $ 57,348 | $ 131,410 |
Annual Report
Notes to Financial Statements - continued
(Amounts in thousands except percentages)
9. Share Transactions - continued
| Shares | Dollars |
Years ended December 31, | 2012 | 2011 | 2012 | 2011 |
Class T | | | | |
Shares sold | 1,057 | 881 | $ 11,485 | $ 9,442 |
Reinvestment of distributions | 32 | 35 | 347 | 373 |
Shares redeemed | (1,249) | (774) | (13,580) | (8,240) |
Net increase (decrease) | (160) | 142 | $ (1,748) | $ 1,575 |
Class B | | | | |
Shares sold | 19 | 27 | $ 205 | $ 297 |
Reinvestment of distributions | 1 | 2 | 10 | 19 |
Shares redeemed | (67) | (114) | (727) | (1,225) |
Net increase (decrease) | (47) | (85) | $ (512) | $ (909) |
Class C | | | | |
Shares sold | 2,859 | 2,509 | $ 31,055 | $ 26,904 |
Reinvestment of distributions | 51 | 62 | 556 | 661 |
Shares redeemed | (1,674) | (2,549) | (18,183) | (27,188) |
Net increase (decrease) | 1,236 | 22 | $ 13,428 | $ 377 |
Short-Intermediate Municipal Income | | | | |
Shares sold | 93,675 | 106,091 | $ 1,017,592 | $ 1,133,522 |
Reinvestment of distributions | 4,548 | 5,180 | 49,424 | 55,411 |
Shares redeemed | (90,005) | (111,332) | (977,843) | (1,186,447) |
Net increase (decrease) | 8,218 | (61) | $ 89,173 | $ 2,486 |
Institutional Class | | | | |
Shares sold | 13,388 | 8,223 | $ 145,505 | $ 87,964 |
Reinvestment of distributions | 176 | 115 | 1,914 | 1,228 |
Shares redeemed | (8,641) | (7,651) | (93,919) | (81,705) |
Net increase (decrease) | 4,923 | 687 | $ 53,500 | $ 7,487 |
10. Other.
The Fund's organizational documents provide former and current trustees and officers with a limited indemnification against liabilities arising in connection with the performance of their duties to the Fund. In the normal course of business, the Fund may also enter into contracts that provide general indemnifications. The Fund's maximum exposure under these arrangements is unknown as this would be dependent on future claims that may be made against the Fund. The risk of material loss from such claims is considered remote.
Annual Report
To the Trustees of Fidelity Municipal Trust and the Shareholders of Fidelity Short-Intermediate Municipal Income Fund:
In our opinion, the accompanying statement of assets and liabilities, including the schedule of investments, and the related statements of operations and of changes in net assets and the financial highlights present fairly, in all material respects, the financial position of Fidelity Short-Intermediate Municipal Income Fund (a fund of Fidelity Municipal Trust) at December 31, 2012, the results of its operations for the year then ended, the changes in its net assets for each of the two years in the period then ended and the financial highlights for each of the five years in the period then ended, in conformity with accounting principles generally accepted in the United States of America. These financial statements and financial highlights (hereafter referred to as "financial statements") are the responsibility of the Fidelity Short-Intermediate Municipal Income Fund's management. Our responsibility is to express an opinion on these financial statements based on our audits. We conducted our audits of these financial statements in accordance with the standards of the Public Company Accounting Oversight Board (United States). Those standards require that we plan and perform the audit to obtain reasonable assurance about whether the financial statements are free of material misstatement. An audit includes examining, on a test basis, evidence supporting the amounts and disclosures in the financial statements, assessing the accounting principles used and significant estimates made by management, and evaluating the overall financial statement presentation. We believe that our audits, which included confirmation of securities at December 31, 2012 by correspondence with the custodian and brokers, provide a reasonable basis for our opinion.
PricewaterhouseCoopers LLP
Boston, Massachusetts
February 14, 2013
Annual Report
The Trustees and executive officers of the trust and fund, as applicable, are listed below. The Board of Trustees governs the fund and is responsible for protecting the interests of shareholders. The Trustees are experienced executives who meet periodically throughout the year to oversee the fund's activities, review contractual arrangements with companies that provide services to the fund, oversee management of the risks associated with such activities and contractual arrangements, and review the fund's performance. Except for Elizabeth S. Acton and James C. Curvey, each of the Trustees oversees 218 funds advised by FMR or an affiliate. Ms. Acton oversees 200 funds advised by FMR or an affiliate. Mr. Curvey oversees 452 funds advised by FMR or an affiliate.
The Trustees hold office without limit in time except that (a) any Trustee may resign; (b) any Trustee may be removed by written instrument, signed by at least two-thirds of the number of Trustees prior to such removal; (c) any Trustee who requests to be retired or who has become incapacitated by illness or injury may be retired by written instrument signed by a majority of the other Trustees; and (d) any Trustee may be removed at any special meeting of shareholders by a two-thirds vote of the outstanding voting securities of the trust. Each Trustee who is not an interested person (as defined in the 1940 Act) (Independent Trustee), shall retire not later than the last day of the month in which his or her 75th birthday occurs. The Independent Trustees may waive this mandatory retirement age policy with respect to individual Trustees. The executive officers hold office without limit in time, except that any officer may resign or may be removed by a vote of a majority of the Trustees at any regular meeting or any special meeting of the Trustees. Except as indicated, each individual has held the office shown or other offices in the same company for the past five years.
Experience, Skills, Attributes, and Qualifications of the Fund's Trustees. The Governance and Nominating Committee has adopted a statement of policy that describes the experience, qualifications, attributes, and skills that are necessary and desirable for potential Independent Trustee candidates (Statement of Policy). The Board believes that each Trustee satisfied at the time he or she was initially elected or appointed a Trustee, and continues to satisfy, the standards contemplated by the Statement of Policy. The Governance and Nominating Committee also engages professional search firms to help identify potential Independent Trustee candidates who have the experience, qualifications, attributes, and skills consistent with the Statement of Policy. From time to time, additional criteria based on the composition and skills of the current Independent Trustees, as well as experience or skills that may be appropriate in light of future changes to board composition, business conditions, and regulatory or other developments, have also been considered by the professional search firms and the Governance and Nominating Committee. In addition, the Board takes into account the Trustees' commitment and participation in Board and committee meetings, as well as their leadership of standing and ad hoc committees throughout their tenure.
In determining that a particular Trustee was and continues to be qualified to serve as a Trustee, the Board has considered a variety of criteria, none of which, in isolation, was controlling. The Board believes that, collectively, the Trustees have balanced and diverse experience, qualifications, attributes, and skills, which allow the Board to operate effectively in governing the fund and protecting the interests of shareholders. Information about the specific experience, skills, attributes, and qualifications of each Trustee, which in each case led to the Board's conclusion that the Trustee should serve (or continue to serve) as a trustee of the fund, is provided below.
Annual Report
Board Structure and Oversight Function. Abigail P. Johnson is an interested person (as defined in the 1940 Act) and currently serves as Chairman. The Trustees have determined that an interested Chairman is appropriate and benefits shareholders because an interested Chairman has a personal and professional stake in the quality and continuity of services provided to the fund. Independent Trustees exercise their informed business judgment to appoint an individual of their choosing to serve as Chairman, regardless of whether the Trustee happens to be independent or a member of management. The Independent Trustees have determined that they can act independently and effectively without having an Independent Trustee serve as Chairman and that a key structural component for assuring that they are in a position to do so is for the Independent Trustees to constitute a substantial majority for the Board. The Independent Trustees also regularly meet in executive session. Albert R. Gamper, Jr. serves as Chairman of the Independent Trustees and as such (i) acts as a liaison between the Independent Trustees and management with respect to matters important to the Independent Trustees and (ii) with management prepares agendas for Board meetings.
Fidelity funds are overseen by different Boards of Trustees. The fund's Board oversees Fidelity's investment-grade bond, money market, and asset allocation funds and another Board oversees Fidelity's equity and high income funds. The asset allocation funds may invest in Fidelity funds that are overseen by such other Board. The use of separate Boards, each with its own committee structure, allows the Trustees of each group of Fidelity funds to focus on the unique issues of the funds they oversee, including common research, investment, and operational issues. On occasion, the separate Boards establish joint committees to address issues of overlapping consequences for the Fidelity funds overseen by each Board.
The Trustees operate using a system of committees to facilitate the timely and efficient consideration of all matters of importance to the Trustees, the fund, and fund shareholders and to facilitate compliance with legal and regulatory requirements and oversight of the fund's activities and associated risks. The Board, acting through its committees, has charged FMR and its affiliates with (i) identifying events or circumstances the occurrence of which could have demonstrably adverse effects on the fund's business and/or reputation; (ii) implementing processes and controls to lessen the possibility that such events or circumstances occur or to mitigate the effects of such events or circumstances if they do occur; and (iii) creating and maintaining a system designed to evaluate continuously business and market conditions in order to facilitate the identification and implementation processes described in (i) and (ii) above. Because the day-to-day operations and activities of the fund are carried out by or through FMR, its affiliates and other service providers, the fund's exposure to risks is mitigated but not eliminated by the processes overseen by the Trustees. While each of the Board's committees has responsibility for overseeing different aspects of the fund's activities, oversight is exercised primarily through the Operations and Audit Committees. In addition, an ad hoc Board committee of Independent Trustees has worked with FMR to enhance the Board's oversight of investment and financial risks, legal and regulatory risks, technology risks, and operational risks, including the development of additional risk reporting to the Board. Appropriate personnel, including but not limited to the fund's Chief Compliance Officer (CCO), FMR's internal auditor, the independent accountants, the fund's Treasurer and portfolio management personnel, make periodic reports to the Board's committees, as appropriate, including an annual review of FMR's risk management program for the Fidelity funds. The responsibilities of each standing committee, including their oversight responsibilities, are described further under "Standing Committees of the Fund's Trustees."
Annual Report
Trustees and Officers - continued
The fund's Statement of Additional Information (SAI) includes more information about the Trustees. To request a free copy, call Fidelity at 1-800-544-8544.
Interested Trustees*:
Correspondence intended for each Trustee who is an interested person may be sent to Fidelity Investments, 82 Devonshire Street, Boston, Massachusetts 02109.
Name, Age; Principal Occupations and Other Relevant Experience+ |
Abigail P. Johnson (51) |
| Year of Election or Appointment: 2009 Ms. Johnson is Trustee and Chairman of the Board of Trustees of certain Trusts. Ms. Johnson serves as President of Fidelity Financial Services (2012-present) and President of Personal, Workplace and Institutional Services (2005-present). Ms. Johnson is Chairman and Director of FMR Co., Inc. (2011-present), Chairman and Director of FMR (2011-present), and the Vice Chairman and Director (2007-present) of FMR LLC. Previously, Ms. Johnson served as President and a Director of FMR (2001-2005), a Trustee of other investment companies advised by FMR, Fidelity Investments Money Management, Inc., and FMR Co., Inc. (2001-2005), Senior Vice President of the Fidelity funds (2001-2005), and managed a number of Fidelity funds. Ms. Abigail P. Johnson and Mr. Arthur E. Johnson are not related. |
James C. Curvey (77) |
| Year of Election or Appointment: 2007 Mr. Curvey also serves as Trustee (2007-present) of other investment companies advised by FMR. Mr. Curvey is a Director of Fidelity Investments Money Management, Inc. (2009-present), Director of Fidelity Research & Analysis Co. (2009-present) and Director of FMR and FMR Co., Inc. (2007-present). Mr. Curvey is also Vice Chairman (2007-present) and Director of FMR LLC. In addition, Mr. Curvey serves as an Overseer for the Boston Symphony Orchestra and a member of the Trustees of Villanova University. Previously, Mr. Curvey was the Vice Chairman (2006-2007) and Director (2000-2007) of FMR Corp. |
* Trustees have been determined to be "Interested Trustees" by virtue of, among other things, their affiliation with the trust or various entities under common control with FMR.
+ The information above includes each Trustee's principal occupation during the last five years and other information relating to the experience, attributes, and skills relevant to each Trustee's qualifications to serve as a Trustee, which led to the conclusion that each Trustee should serve as a Trustee for the fund.
Independent Trustees:
Correspondence intended for each Independent Trustee (that is, the Trustees other than the Interested Trustees) may be sent to Fidelity Investments, P.O. Box 55235, Boston, Massachusetts 02205-5235.
Name, Age; Principal Occupations and Other Relevant Experience+ |
Elizabeth S. Acton (61) |
| Year of Election or Appointment: 2013 Ms. Acton is Trustee of certain Trusts. Prior to her retirement in April 2012, Ms. Acton was Executive Vice President, Finance (November 2011-April 2012), Executive Vice President, Chief Financial Officer (April 2002-November 2011), and Treasurer (May 2004-May 2005) of Comerica Incorporated (financial services). Prior to joining Comerica, Ms. Acton held a variety of positions at Ford Motor Company (1983-2002), including Vice President and Treasurer (2000-2002) and Executive Vice President and Chief Financial Officer of Ford Motor Credit Company (1998-2000). Ms. Acton currently serves as a member of the Board of Directors and Audit and Finance Committees of Beazer Homes USA, Inc. (homebuilding, 2012-present). |
Albert R. Gamper, Jr. (70) |
| Year of Election or Appointment: 2006 Mr. Gamper is Chairman of the Independent Trustees of the Fixed Income and Asset Allocation Funds (2012-present). Prior to his retirement in December 2004, Mr. Gamper served as Chairman of the Board of CIT Group Inc. (commercial finance). During his tenure with CIT Group Inc. Mr. Gamper served in numerous senior management positions, including Chairman (1987-1989; 1999-2001; 2002-2004), Chief Executive Officer (1987-2004), and President (2002-2003). Mr. Gamper currently serves as a member of the Board of Directors of Public Service Enterprise Group (utilities, 2000-present), a member of the Board of Trustees, Rutgers University (2004-present), and Chairman of the Board of Barnabas Health Care System. Previously, Mr. Gamper served as Vice Chairman of the Independent Trustees of the Fixed Income and Asset Allocation Funds (2011-2012) and as Chairman of the Board of Governors, Rutgers University (2004-2007). |
Robert F. Gartland (61) |
| Year of Election or Appointment: 2010 Mr. Gartland is Chairman and an investor in Gartland and Mellina Group Corp. (consulting, 2009-present). Previously, Mr. Gartland served as a partner and investor of Vietnam Partners LLC (investments and consulting, 2008-2011). Prior to his retirement, Mr. Gartland held a variety of positions at Morgan Stanley (financial services, 1979-2007) including Managing Director (1987-2007). |
Arthur E. Johnson (65) |
| Year of Election or Appointment: 2008 Mr. Johnson serves as a member of the Board of Directors of Eaton Corporation (diversified power management, 2009-present), AGL Resources, Inc. (holding company, 2002-present) and Booz Allen Hamilton (management consulting, 2011-present). Prior to his retirement, Mr. Johnson served as Senior Vice President of Corporate Strategic Development of Lockheed Martin Corporation (defense contractor, 1999-2009). He previously served on the Board of Directors of IKON Office Solutions, Inc. (1999-2008) and Delta Airlines (2005-2007). Mr. Arthur E. Johnson is not related to Ms. Abigail P. Johnson. |
Michael E. Kenneally (58) |
| Year of Election or Appointment: 2009 Previously, Mr. Kenneally served as a Member of the Advisory Board for certain Fidelity Fixed Income and Asset Allocation Funds (2008-2009). Prior to his retirement, Mr. Kenneally served as Chairman and Global Chief Executive Officer of Credit Suisse Asset Management (2003-2005). Mr. Kenneally was a Director of the Credit Suisse Funds (U.S. mutual funds, 2004-2008) and certain other closed-end funds (2004-2005) and was awarded the Chartered Financial Analyst (CFA) designation in 1991. |
James H. Keyes (72) |
| Year of Election or Appointment: 2007 Mr. Keyes serves as a member of the Boards of Navistar International Corporation (manufacture and sale of trucks, buses, and diesel engines, since 2002) and Pitney Bowes, Inc. (integrated mail, messaging, and document management solutions, since 1998). Prior to his retirement, Mr. Keyes served as Chairman and Chief Executive Officer of Johnson Controls (automotive, building, and energy, 1998-2002) and as a member of the Board of LSI Logic Corporation (semiconductor technologies, 1984-2008). |
Marie L. Knowles (66) |
| Year of Election or Appointment: 2001 Ms. Knowles is Vice Chairman of the Independent Trustees of the Fixed Income and Asset Allocation Funds (2012-present). Prior to Ms. Knowles' retirement in June 2000, she served as Executive Vice President and Chief Financial Officer of Atlantic Richfield Company (ARCO) (diversified energy, 1996-2000). From 1993 to 1996, she was a Senior Vice President of ARCO and President of ARCO Transportation Company. She served as a Director of ARCO from 1996 to 1998. Ms. Knowles currently serves as a Director and Chairman of the Audit Committee of McKesson Corporation (healthcare service, since 2002). Ms. Knowles is an Honorary Trustee of the Brookings Institution and a member of the Board of the Catalina Island Conservancy and of the Santa Catalina Island Company (2009-present). She also serves as a member of the Advisory Board for the School of Engineering of the University of Southern California and the Foundation Board of the School of Architecture at the University of Virginia (2007-present). Previously, Ms. Knowles served as a Director of Phelps Dodge Corporation (copper mining and manufacturing, 1994-2007). |
Kenneth L. Wolfe (73) |
| Year of Election or Appointment: 2005 Prior to his retirement, Mr. Wolfe served as Chairman and a Director (2007-2009) and Chairman and Chief Executive Officer (1994-2001) of Hershey Foods Corporation. He also served as a member of the Boards of Adelphia Communications Corporation (telecommunications, 2003-2006), Bausch & Lomb, Inc. (medical/pharmaceutical, 1993-2007), and Revlon, Inc. (personal care products, 2004-2009). Mr. Wolfe previously served as Chairman of the Independent Trustees of the Fixed Income and Asset Allocation Funds (2008-2012). |
+ The information above includes each Trustee's principal occupation during the last five years and other information relating to the experience, attributes, and skills relevant to each Trustee's qualifications to serve as a Trustee, which led to the conclusion that each Trustee should serve as a Trustee for the fund.
Executive Officers:
Correspondence intended for each executive officer may be sent to Fidelity Investments, 82 Devonshire Street, Boston, Massachusetts 02109.
Name, Age; Principal Occupation |
Stephanie J. Dorsey (43) |
| Year of Election or Appointment: 2013 President and Treasurer of Fidelity's Fixed Income and Asset Allocation Funds. Ms. Dorsey also serves as Assistant Treasurer of other Fidelity funds (2010-present) and is an employee of Fidelity Investments (2008-present). Previously, Ms. Dorsey served as Deputy Treasurer of Fidelity's Fixed Income and Asset Allocation Funds (2008-2013), Treasurer (2004-2008) of the JPMorgan Mutual Funds and Vice President (2004-2008) of JPMorgan Chase Bank. |
Charles S. Morrison (52) |
| Year of Election or Appointment: 2012 Vice President of Fidelity's Fixed Income and Asset Allocation Funds. Mr. Morrison also serves as President, Fixed Income and is an employee of Fidelity Investments. Previously, Mr. Morrison served as Vice President of Fidelity's Money Market Funds (2005-2009), President, Money Market Group Leader of FMR (2009), and Senior Vice President, Money Market Group of FMR (2004-2009). Mr. Morrison also served as Vice President of Fidelity's Bond Funds (2002-2005), certain Balanced Funds (2002-2005), and certain Asset Allocation Funds (2002-2007), and as Senior Vice President (2002-2005) of Fidelity's Fixed Income Division. |
Robert P. Brown (49) |
| Year of Election or Appointment: 2012 Vice President of Fidelity's Bond Funds. Mr. Brown also serves as Executive Vice President of Fidelity Investments Money Management, Inc. (2010-present), President, Bond Group of FMR (2011-present), Director and Managing Director, Research of Fidelity Management & Research (U.K.) Inc. (2008-present) and is an employee of Fidelity Investments. Previously, Mr. Brown served as President, Money Market Group of FMR (2010-2011) and Vice President of Fidelity's Money Market Funds (2010-2012). |
Scott C. Goebel (44) |
| Year of Election or Appointment: 2008 Secretary and Chief Legal Officer (CLO) of the Fidelity funds. Mr. Goebel also serves as Secretary of Fidelity Investments Money Management, Inc. (FIMM) (2010-present) and Fidelity Research and Analysis Company (FRAC) (2010-present); Secretary and CLO of The North Carolina Capital Management Trust: Cash and Term Portfolios (2008-present); General Counsel, Secretary, and Senior Vice President of FMR (2008-present) and FMR Co., Inc. (2008-present); employed by FMR LLC or an affiliate (2001-present); Chief Legal Officer of Fidelity Management & Research (Hong Kong) Limited (2008-present) and Assistant Secretary of Fidelity Management & Research (Japan) Inc. (2008-present), and Fidelity Management & Research (U.K.) Inc. (2008-present). Previously, Mr. Goebel served as Assistant Secretary of FIMM (2008-2010), FRAC (2008-2010), and the Funds (2007-2008) and as Vice President and Secretary of Fidelity Distributors Corporation (FDC) (2005-2007). |
Ramon Herrera (38) |
| Year of Election or Appointment: 2012 Assistant Secretary of Fidelity's Fixed Income and Asset Allocation Funds. Mr. Herrera also serves as Vice President, Associate General Counsel (2010-present) and is an employee of Fidelity Investments (2004-present). |
Elizabeth Paige Baumann (44) |
| Year of Election or Appointment: 2012 Anti-Money Laundering (AML) Officer of the Fidelity funds. Ms. Baumann also serves as AML Officer of The North Carolina Capital Management Trust: Cash and Term Portfolios (2012-present), Chief AML Officer of FMR LLC (2012-present), and is an employee of Fidelity Investments. Previously, Ms. Baumann served as Vice President and Deputy Anti-Money Laundering Officer (2007-2012). |
Christine Reynolds (54) |
| Year of Election or Appointment: 2008 Chief Financial Officer of the Fidelity funds. Ms. Reynolds became President of Fidelity Pricing and Cash Management Services (FPCMS) in August 2008. Ms. Reynolds served as Chief Operating Officer of FPCMS (2007-2008). Previously, Ms. Reynolds served as President, Treasurer, and Anti-Money Laundering officer of the Fidelity funds (2004-2007). |
Michael H. Whitaker (45) |
| Year of Election or Appointment: 2008 Chief Compliance Officer of Fidelity's Fixed Income and Asset Allocation Funds. Mr. Whitaker also serves as Chief Compliance Officer of The North Carolina Capital Management Trust: Cash and Term Portfolios (2008-present). Mr. Whitaker is an employee of Fidelity Investments (2007-present). Prior to joining Fidelity Investments, Mr. Whitaker worked at MFS Investment Management where he served as Senior Vice President and Chief Compliance Officer (2004-2006), and Assistant General Counsel. |
Joseph F. Zambello (55) |
| Year of Election or Appointment: 2011 Deputy Treasurer of the Fidelity funds. Mr. Zambello is an employee of Fidelity Investments. Previously, Mr. Zambello served as Vice President of FMR's Program Management Group (2009-2011) and Vice President of the Transfer Agent Oversight Group (2005-2009). |
Stephen Sadoski (41) |
| Year of Election or Appointment: 2013 Deputy Treasurer of Fidelity's Fixed Income and Asset Allocation Funds. Mr. Sadoski also serves as Deputy Treasurer of other Fidelity funds (2012-present) and is an employee of Fidelity Investments (2012-present). Previously, Mr. Sadoski served as Assistant Treasurer of Fidelity's Fixed Income and Asset Allocation Funds (2012-2013), an assistant chief accountant in the Division of Investment Management of the Securities and Exchange Commission (SEC) (2009-2012) and as a senior manager at Deloitte & Touche (1997-2009). |
Adrien E. Deberghes (45) |
| Year of Election or Appointment: 2010 Assistant Treasurer of Fidelity's Fixed Income and Asset Allocation Funds. Mr. Deberghes also serves as Vice President and Assistant Treasurer (2011-present) and Deputy Treasurer (2008-present) of other Fidelity funds, and is an employee of Fidelity Investments (2008-present). Previously, Mr. Deberghes served as Senior Vice President of Mutual Fund Administration at State Street Corporation (2007-2008), Senior Director of Mutual Fund Administration at Investors Bank & Trust (2005-2007), and Director of Finance for Dunkin' Brands (2000-2005). |
Kenneth B. Robins (43) |
| Year of Election or Appointment: 2009 Assistant Treasurer of the Fidelity Fixed Income and Asset Allocation Funds. Mr. Robins also serves as President and Treasurer of other Fidelity funds (2008-present; 2010-present) and is an employee of Fidelity Investments (2004-present). Previously, Mr. Robins served as Deputy Treasurer of the Fidelity funds (2005-2008) and Treasurer and Chief Financial Officer of The North Carolina Capital Management Trust: Cash and Term Portfolios (2006-2008). |
Gary W. Ryan (54) |
| Year of Election or Appointment: 2005 Assistant Treasurer of the Fidelity funds. Mr. Ryan is an employee of Fidelity Investments. Previously, Mr. Ryan served as Vice President of Fund Reporting in Fidelity Pricing and Cash Management Services (FPCMS) (1999-2005). |
Jonathan Davis (44) |
| Year of Election or Appointment: 2010 Assistant Treasurer of the Fidelity funds. Mr. Davis is also Assistant Treasurer of Fidelity Rutland Square Trust II and Fidelity Commonwealth Trust II. Mr. Davis is an employee of Fidelity Investments. Previously, Mr. Davis served as Vice President and Associate General Counsel of FMR LLC (2003-2010). |
Annual Report
The Board of Trustees of Short-Intermediate Municipal Income Fund voted to pay to shareholders of record at the opening of business on record date, the following distributions per share derived from capital gains realized from sales of portfolio securities:
| Pay Date | Record Date | Dividends | Capital Gains |
Short-Intermediate Municipal Income Fund | 02/11/13 | 02/08/13 | $- | $0.003 |
During fiscal year ended 2012, 100% of the fund's income dividends was free from federal income tax, and 6.62% of the fund's income dividends was subject to the federal alternative minimum tax.
The fund hereby designates as a capital gain dividend with respect to the taxable year ended December 31, 2012, $5,764,482, or, if subsequently determined to be different, the net capital gain of such year.
The fund will notify shareholders in January 2013 of amounts for use in preparing 2012 income tax returns.
Annual Report
Board Approval of Investment Advisory Contracts and Management Fees
Fidelity Short-Intermediate Municipal Income Fund
Each year, the Board of Trustees, including the Independent Trustees (together, the Board), votes on the renewal of the management contract and sub-advisory agreements (together, the Advisory Contracts) for the fund. The Board, assisted by the advice of fund counsel and Independent Trustees' counsel, requests and considers a broad range of information relevant to the renewal of the Advisory Contracts throughout the year.
The Board meets regularly and, at each of its meetings, covers an extensive agenda of topics and materials and considers factors that are relevant to its annual consideration of the renewal of the fund's Advisory Contracts, including the services and support provided to the fund and its shareholders. The Board has established three standing committees, Operations, Audit, and Governance and Nominating, each composed of and chaired by Independent Trustees with varying backgrounds, to which the Board has assigned specific subject matter responsibilities in order to enhance effective decision-making by the Board. The Operations Committee, of which all of the Independent Trustees are members, meets regularly throughout the year and, among other matters, considers matters specifically related to the annual consideration of the renewal of the fund's Advisory Contracts. The Board, acting directly and through its Committees, requests and receives information concerning the annual consideration of the renewal of the fund's Advisory Contracts. The Board also meets as needed to consider matters specifically related to the Board's annual consideration of the renewal of Advisory Contracts. Members of the Board may also meet with trustees of other Fidelity funds through ad hoc joint committees to discuss certain matters relevant to the Fidelity funds.
At its September 2012 meeting, the Board of Trustees, including the Independent Trustees, unanimously determined to renew the fund's Advisory Contracts. In reaching its determination, the Board considered all factors it believed relevant, including (i) the nature, extent, and quality of the services to be provided to the fund and its shareholders (including the investment performance of the fund); (ii) the competitiveness of the fund's management fee and total expense ratio relative to peer funds; (iii) the total costs of the services to be provided by and the profits to be realized by Fidelity from its relationship with the fund; (iv) the extent to which economies of scale exist and would be realized as the fund grows; and (v) whether fee levels reflect these economies of scale, if any, for the benefit of fund shareholders.
In considering whether to renew the Advisory Contracts for the fund, the Board reached a determination, with the assistance of fund counsel and Independent Trustees' counsel and through the exercise of its business judgment, that the renewal of the Advisory Contracts is in the best interests of the fund and its shareholders and that the compensation payable under the Advisory Contracts is fair and reasonable. The Board's decision to renew the Advisory Contracts was not based on any single factor, but rather was based on a comprehensive consideration of all the information provided to the Board at its meetings throughout the year. The Board, in reaching its determination to renew the Advisory Contracts, was aware that shareholders in the fund have a broad range of investment choices available to them, including a wide choice among mutual funds offered by Fidelity's competitors, and that the fund's shareholders, who have the opportunity to review and weigh the disclosure provided by the fund in its prospectus and other public disclosures, have chosen to invest in this fund, managed by Fidelity.
Annual Report
Board Approval of Investment Advisory Contracts and
Management Fees - continued
Nature, Extent, and Quality of Services Provided. The Board considered the staffing within the investment adviser, FMR, and the sub-advisers (together, the Investment Advisers), including the backgrounds of the fund's investment personnel, and also considered the fund's investment objective, strategies, and related investment philosophy. The Independent Trustees also had discussions with senior management of Fidelity's investment operations and investment groups. The Board considered the structure of the portfolio manager compensation program and whether this structure provides appropriate incentives to act in the best interests of the fund.
Resources Dedicated to Investment Management and Support Services. The Board reviewed the general qualifications and capabilities of the Investment Advisers' investment staff, including its size, education, experience, and resources, as well as the Investment Advisers' approach to recruiting, managing, and compensating investment personnel. The Board also noted that FMR has continued to increase the resources devoted to non-U.S. offices, including expansion of Fidelity's global investment organization. The Board noted that Fidelity's analysts have extensive resources, tools and capabilities that allow them to conduct sophisticated quantitative and fundamental analysis, as well as credit analysis of issuers, counterparties and guarantors. The Board also believes that Fidelity's investment professionals have sufficient access to global information and data so as to provide competitive investment results over time, and that those professionals also have access to sophisticated tools that permit them to assess portfolio construction and risk and performance attribution characteristics continuously, as well as to transmit new information and research conclusions rapidly around the world. Additionally, in its deliberations, the Board considered the Investment Advisers' trading and risk management capabilities and resources, which are an integral part of the investment management process.
Shareholder and Administrative Services. The Board considered (i) the nature, extent, quality, and cost of advisory, administrative, and shareholder services performed by the Investment Advisers and their affiliates under the Advisory Contracts and under separate agreements covering transfer agency and pricing and bookkeeping services for the fund; (ii) the nature and extent of the supervision of third party service providers, principally custodians and subcustodians; and (iii) the resources devoted to, and the record of compliance with, the fund's compliance policies and procedures.
Annual Report
The Board noted that the growth of fund assets over time across the complex allows Fidelity to reinvest in the development of services designed to enhance the value or convenience of the Fidelity funds as investment vehicles. These services include 24-hour access to account information and market information through telephone representatives and over the Internet, investor education materials and asset allocation tools, and the expanded availability of Fidelity Investor Centers.
Investment in a Large Fund Family. The Board considered the benefits to shareholders of investing in a Fidelity fund, including the benefits of investing in a fund that is part of a large family of funds offering a variety of investment disciplines and providing a large variety of mutual fund investor services. The Board noted that Fidelity had taken, or had made recommendations that resulted in the Fidelity funds taking, a number of actions over the previous year that benefited particular funds, including (i) continuing to dedicate additional resources to investment research and support of the senior management team that oversees asset management; (ii) persisting in efforts to enhance Fidelity's research capabilities, in particular, international research; (iii) launching new funds and making other enhancements to meet client needs for global and income-oriented solutions; (iv) continuing to launch dedicated lower cost underlying funds to meet investment management's portfolio construction needs related to expanding underlying fund options, specifically for the Freedom Fund product lines; (v) adopting a sector neutral investment approach for certain funds and utilizing a team of portfolio managers to manage certain sector-neutral funds; (vi) rationalizing product lines and gaining increased efficiencies through combinations of several funds with other funds; (vii) strengthening the Spartan Index Fund product line by adding new funds and/or new low-cost institutional share classes, restructuring fund expenses to accommodate new classes, and reducing investment minimums for certain classes of shares; (viii) modifying the eligibility criteria for Institutional Class shares to increase their appeal to government entities and charitable investors; and (ix) reducing certain transfer agent fee rates.
Investment Performance. The Board considered whether the fund has operated in accordance with its investment objective, as well as its record of compliance with its investment restrictions. It also reviewed the fund's absolute investment performance for each class, as well as the fund's relative investment performance for each class measured over multiple periods against (i) a broad-based securities market index, and (ii) a peer group of mutual funds deemed appropriate by Fidelity and reviewed by the Board. The following charts considered by the Board show, over the one-, three-, and five-year periods ended December 31, 2011, the cumulative total returns of the retail class and Class C of the fund, the cumulative total returns of a broad-based securities market index ("benchmark"), and a range of cumulative total returns of a peer group of mutual funds identified by Lipper Inc. as having an investment objective similar to that of the fund. The returns of the retail class and Class C show the performance of the highest and lowest performing classes, respectively (based on five-year performance). The box within each chart shows the 25th percentile return (top of box) and the 75th percentile return (bottom of box) of the peer group. Returns shown above the box are in the first quartile and returns shown below the box are in the fourth quartile. The percentage beaten numbers noted below each chart correspond to the percentile box and represent the percentage of funds in the peer group whose performance was equal to or lower than that of the class indicated.
Annual Report
Board Approval of Investment Advisory Contracts and
Management Fees - continued
Fidelity Short-Intermediate Municipal Income Fund

The Board reviewed the fund's relative investment performance against its peer group and noted that the performance of the retail class of the fund was in the third quartile for the one- and three-year periods and the second quartile for the five-year period. The Board also noted that the investment performance of the fund was lower than its benchmark for the three- and five-year periods, although the one-year total return of the retail class compared favorably to its benchmark. The Board considered that the variations in performance among the fund's classes reflect the variations in class expenses, which result in lower performance for higher expense classes. The Board discussed with FMR actions to improve the fund's disappointing performance relative to its peer group. The Board also reviewed the fund's performance since inception as well as performance in the current year. The Board will continue to closely monitor the performance of the fund in the coming year and discuss with FMR other appropriate actions to address the performance of the fund.
Based on its review, the Board concluded that the nature, extent, and quality of services provided to the fund under the Advisory Contracts should benefit the fund's shareholders.
Annual Report
Competitiveness of Management Fee and Total Expense Ratio. The Board considered the fund's management fee and total expense ratio compared to "mapped groups" of competitive funds and classes. Fidelity creates "mapped groups" by combining similar Lipper investment objective categories that have comparable management fee characteristics. Combining Lipper investment objective categories aids the Board's management fee and total expense ratio comparisons by broadening the competitive group used for comparison and by reducing the number of universes to which various Fidelity funds are compared.
Management Fee. The Board considered two proprietary management fee comparisons for the 12-month periods shown in the chart below. The group of Lipper funds used by the Board for management fee comparisons is referred to below as the "Total Mapped Group" and, for the reasons explained above, is broader than the Lipper peer group used by the Board for performance comparisons. The Total Mapped Group comparison focuses on a fund's standing relative to the total universe of comparable funds available to investors in terms of gross management fees before expense reimbursements or caps. "TMG %" represents the percentage of funds in the Total Mapped Group that had management fees that were lower than the fund's. For example, a TMG % of 25% means that 75% of the funds in the Total Mapped Group had higher management fees than the fund. The "Asset-Size Peer Group" (ASPG) comparison focuses on a fund's standing relative to non-Fidelity funds similar in size to the fund within the Total Mapped Group. The ASPG represents at least 15% of the funds in the Total Mapped Group with comparable asset size and management fee characteristics, subject to a minimum of 50 funds (or all funds in the Total Mapped Group if fewer than 50). Additional information, such as the ASPG quartile in which the fund's management fee ranked, is also included in the chart and considered by the Board.
Annual Report
Board Approval of Investment Advisory Contracts and
Management Fees - continued
Fidelity Short-Intermediate Municipal Income Fund

The Board noted that the fund's management fee ranked below the median of its Total Mapped Group and below the median of its ASPG for 2011.
Based on its review, the Board concluded that the fund's management fee is fair and reasonable in light of the services that the fund receives and the other factors considered.
Total Expense Ratio. In its review of each class's total expense ratio, the Board considered the fund's management fee as well as other fund or class expenses, as applicable, such as transfer agent fees, pricing and bookkeeping fees, fund-paid 12b-1 fees, and custodial, legal, and audit fees. The Board also noted the effects of any waivers and reimbursements on fees and expenses. As part of its review, the Board also considered the current and historical total expense ratios of each class of the fund compared to competitive fund median expenses. Each class of the fund is compared to those funds and classes in the Total Mapped Group (used by the Board for management fee comparisons) that have a similar sales load structure.
The Board noted that the total expense ratio of each of Class B and the retail class ranked below its competitive median for 2011 and the total expense ratio of each of Class A, Class T, Class C, and Institutional Class ranked above its competitive median for 2011. The Board considered that various factors, including 12b-1 fees and relatively higher other expenses in the case of small fund size, can affect total expense ratios. The Board considered that Class T is primarily sold load-waived in the retirement plan market, where its 0.50% 12b-1 fee is comparable to the 12b-1 fees of the no-load classes with which it competes in the retirement plan market. The Board noted that the fund offers multiple classes, each of which has a different sales load and 12b-1 fee structure, and that the multiple structures are intended to offer a range of pricing options for the intermediary market. The Board also noted that the total expense ratios of the classes vary primarily by the level of their 12b-1 fees, although differences in transfer agent fees may also cause expenses to vary from class to class.
Annual Report
Fees Charged to Other Fidelity Clients. The Board also considered Fidelity fee structures and other information with respect to clients of FMR and its affiliates, such as other mutual funds advised or subadvised by FMR or its affiliates, pension plan clients, and other institutional clients. The Board noted the findings of the 2010 ad hoc joint committee (created with the board of other Fidelity funds), which reviewed and compared Fidelity's institutional investment advisory business with its business of providing services to the Fidelity funds, including the differences in services provided, fees charged, and costs incurred, as well as competition in their respective marketplaces.
Based on its review of total expense ratios and fees charged to other Fidelity clients, the Board concluded that the total expense ratio of each class of the fund was reasonable, although in some cases above the median of the universe presented for comparison, in light of the services that the fund and its shareholders receive and the other factors considered.
Costs of the Services and Profitability. The Board considered the revenues earned and the expenses incurred by Fidelity in conducting the business of developing, marketing, distributing, managing, administering and servicing the fund and its shareholders. The Board also considered the level of Fidelity's profits in respect of all the Fidelity funds.
On an annual basis, FMR presents to the Board Fidelity's profitability for the fund. Fidelity calculates the profitability for each fund, as well as aggregate profitability for groups of Fidelity funds and all Fidelity funds, using a series of detailed revenue and cost allocation methodologies which originate with the books and records of Fidelity on which Fidelity's audited financial statements are based. The Audit Committee of the Board reviews any significant changes from the prior year's methodologies.
PricewaterhouseCoopers LLP (PwC), independent registered public accounting firm and auditor to Fidelity and certain Fidelity funds, has been engaged annually by the Board as part of the Board's assessment of Fidelity's profitability analysis. PwC's engagement includes the review and assessment of Fidelity's methodologies used in determining the revenues and expenses attributable to Fidelity's mutual fund business, and completion of agreed-upon procedures surrounding the mathematical accuracy of fund profitability and its conformity to allocation methodologies. After considering PwC's reports issued under the engagement and information provided by Fidelity, the Board concluded that while other allocation methods may also be reasonable, Fidelity's profitability methodologies are reasonable in all material respects.
Annual Report
Board Approval of Investment Advisory Contracts and
Management Fees - continued
The Board also reviewed Fidelity's non-fund businesses and fall-out benefits related to the mutual fund business as well as cases where Fidelity's affiliates may benefit from or be related to the fund's business.
The Board considered the costs of the services provided by and the profits realized by Fidelity in connection with the operation of the fund and was satisfied that the profitability was not excessive in the circumstances.
Economies of Scale. The Board considered whether there have been economies of scale in respect of the management of the Fidelity funds, whether the Fidelity funds (including the fund) have appropriately benefited from any such economies of scale, and whether there is potential for realization of any further economies of scale. The Board considered the extent to which the fund will benefit from economies of scale through increased services to the fund, through waivers or reimbursements, or through fee or expense reductions. The Board also noted that in 2009, it and the board of other Fidelity funds created an ad hoc committee (the Economies of Scale Committee) to analyze whether FMR attains economies of scale in respect of the management and servicing of the Fidelity funds, whether the Fidelity funds have appropriately benefited from such economies of scale, and whether there is potential for realization of any further economies of scale.
The Board recognized that the fund's management contract incorporates a "group fee" structure, which provides for lower group fee rates as total fund assets under FMR's management increase, and for higher group fee rates as total fund assets under FMR's management decrease. FMR calculates the group fee rates based on a tiered asset "breakpoint" schedule that varies based on asset class. The Board considered that the group fee is designed to deliver the benefits of economies of scale to fund shareholders when total Fidelity fund assets increase, even if assets of any particular fund are unchanged or have declined, because some portion of Fidelity's costs are attributable to services provided to all Fidelity funds, and all funds benefit if those costs can be allocated among more assets. The Board concluded that, given the group fee structure, fund shareholders will benefit from lower management fees as assets under FMR's management increase at the fund complex level, regardless of whether Fidelity achieves any such economies of scale.
The Board concluded, taking into account the analysis of the Economies of Scale Committee, that economies of scale, if any, are being appropriately shared between fund shareholders and Fidelity.
Additional Information Requested by the Board. In order to develop fully the factual basis for consideration of the Fidelity funds' Advisory Contracts, the Board requested and received additional information on certain topics, including: (i) Fidelity's fund profitability methodology, profitability trends for certain funds, and the impact of certain factors on fund profitability results; (ii) portfolio manager changes that have occurred during the past year and the amount of the investment that each portfolio manager has made in the Fidelity fund(s) that he or she manages; (iii) Fidelity's compensation structure for portfolio managers, research analysts, and other key personnel, including its effects on fund profitability, the rationale for the compensation structure, and the extent to which current market conditions have affected retention and recruitment; (iv) the compensation paid to fund sub-advisers on behalf of the Fidelity funds; (v) Fidelity's fee structures, including the group fee structure, and the rationale for recommending different fees among different categories of funds and classes; (vi) Fidelity's voluntary waiver of its fees to maintain minimum yields for certain money market funds and classes as well as contractual waivers in place for certain funds; (vii) regulatory and industry developments, including those affecting money market funds and target date funds, and the potential impact to Fidelity; (viii) Fidelity's transfer agent fees, expenses, and services, and drivers for determining the transfer agent fee structure of different funds and classes; (ix) management fee rates charged by FMR or Fidelity entities to other Fidelity clients; (x) the allocation of and historical trends in Fidelity's realization of fall-out benefits; and (xi) explanations regarding the relative total expense ratios of certain funds and classes, total expense competitive trends, and actions that might be taken by FMR to reduce total expense ratios for certain funds and classes or to achieve further economies of scale.
Annual Report
Based on its evaluation of all of the conclusions noted above, and after considering all factors it believed relevant, the Board ultimately concluded that the advisory fee structures are fair and reasonable, and that the fund's Advisory Contracts should be renewed.
Annual Report
Investment Adviser
Fidelity Management & Research Company
Boston, MA
Investment Sub-Adviser
Fidelity Investments Money
Management, Inc.
Fidelity Management & Research
(U.K.) Inc.
Fidelity Management & Research
(Hong Kong) Limited
Fidelity Management & Research
(Japan) Inc.
General Distributor
Fidelity Distributors Corporation
Smithfield, RI
Transfer and Service Agents
Citibank, N.A.
New York, NY
Fidelity Investments Institutional
Operations Company, Inc.
Boston, MA
Fidelity Service Company, Inc.
Boston, MA
Custodian
Citibank, N.A.
New York, NY
The Fidelity Telephone Connection
Mutual Fund 24-Hour Service
Exchanges/Redemptions
and Account Assistance 1-800-544-6666
Product Information 1-800-544-6666
Retirement Accounts 1-800-544-4774
(8 a.m. - 9 p.m.)
TDD Service 1-800-544-0118
for the deaf and hearing impaired
(9 a.m. - 9 p.m. Eastern time)
Fidelity Automated Service
Telephone (FAST®)
1-800-544-5555
Automated line for quickest service
(Fidelity Investment logo)(registered trademark)
Corporate Headquarters
82 Devonshire St., Boston, MA 02109
www.fidelity.com
STM-UANN-0213
1.787742.109
(Fidelity Investment logo)(registered trademark)
Fidelity Advisor®
Short-Intermediate
Municipal Income
Fund - Class A, Class T, Class B
and Class C
Annual Report
December 31, 2012
(Fidelity Cover Art)
Class A, Class T, Class B,
and Class C are classes of
Fidelity® Short-Intermediate
Municipal Income Fund
Contents
Performance | (Click Here) | How the fund has done over time. |
Management's Discussion of Fund Performance | (Click Here) | The Portfolio Manager's review of fundperformance and strategy. |
Shareholder Expense Example | (Click Here) | An example of shareholder expenses. |
Investment Changes | (Click Here) | A summary of major shifts in the fund's investments over the past six months. |
Investments | (Click Here) | A complete list of the fund's investments with their market values. |
Financial Statements | (Click Here) | Statements of assets and liabilities, operations, and changes in net assets, as well as financial highlights. |
Notes | (Click Here) | Notes to the financial statements. |
Report of Independent Registered Public Accounting Firm | (Click Here) | |
Trustees and Officers | (Click Here) | |
Distributions | (Click Here) | |
Board Approval of Investment Advisory Contracts and Management Fees | (Click Here) | |
To view a fund's proxy voting guidelines and proxy voting record for the 12-month period ended June 30, visit http://www.fidelity.com/proxyvotingresults or visit the Securities and Exchange Commission's (SEC) web site at http://www.sec.gov. You may also call 1-877-208-0098 to request a free copy of the proxy voting guidelines.
Standard & Poor's, S&P and S&P 500 are registered service marks of The McGraw-Hill Companies, Inc. and have been licensed for use by Fidelity Distributors Corporation.
Other third-party marks appearing herein are the property of their respective owners.
All other marks appearing herein are registered or unregistered trademarks or service marks of FMR LLC or an affiliated company. © 2013 FMR LLC. All rights reserved.
Annual Report
This report and the financial statements contained herein are submitted for the general information of the shareholders of the fund. This report is not authorized for distribution to prospective investors in the fund unless preceded or accompanied by an effective prospectus.
A fund files its complete schedule of portfolio holdings with the SEC for the first and third quarters of each fiscal year on Form N-Q. Forms N-Q are available on the SEC's web site at http://www.sec.gov. A fund's Forms N-Q may be reviewed and copied at the SEC's Public Reference Room in Washington, DC. Information regarding the operation of the SEC's Public Reference Room may be obtained by calling 1-800-SEC-0330. For a complete list of a fund's portfolio holdings, view the most recent holdings listing, semiannual report, or annual report on Fidelity's web site at http://www.fidelity.com, http://www.advisor.fidelity.com, or www.401k.com as applicable.
NOT FDIC INSURED • MAY LOSE VALUE • NO BANK GUARANTEE
Neither the fund nor Fidelity Distributors Corporation is a bank.
Annual Report
Average annual total return reflects the change in the value of an investment, assuming reinvestment of the class' distributions from dividend income and capital gains (the profits earned upon the sale of securities that have grown in value, if any) and assuming a constant rate of performance each year. The $10,000 table and the fund's returns do not reflect the deduction of taxes that a shareholder would pay on fund distributions or the redemption of fund shares. During periods of reimbursement by Fidelity, a fund's total return will be greater than it would be had the reimbursement not occurred. How a fund did yesterday is no guarantee of how it will do tomorrow. Returns reflect the conversion of Class B shares to Class A shares after a maximum of four years.
Average Annual Total Returns
Periods ended December 31, 2012 | Past 1
year | Past 5
years | Past 10
years |
Class A (incl. sales charge) A | -0.96% | 2.65% | 2.58% |
Class T (incl. sales charge) B | -0.85% | 2.69% | 2.54% |
Class B (incl. contingent deferred sales charge) C | -1.73% | 2.68% | 2.55% |
Class C (incl. contingent deferred sales charge) D | 0.08% | 2.45% | 2.08% |
A As of April 1, 2007, Class A shares bear a 0.25% 12b-1 fee. The initial offering of Class A shares took place on July 23, 2003. Returns between July 23, 2003 and April 1, 2007 reflect a 0.15% 12b-1 fee. Returns prior to July 23, 2003 are those of Fidelity® Short-Intermediate Municipal Income Fund, the original class of the fund, which has no 12b-1 fee. Had Class A shares' 12b-1 fee been reflected, returns prior to July 23, 2003 would have been lower.
B Class T shares bear a 0.25% 12b-1 fee. The initial offering of Class T shares took place on July 23, 2003. Returns prior to July 23, 2003 are those of Fidelity Short-Intermediate Municipal Income Fund, the original class of the fund, which has no 12b-1 fee. Had Class T shares' 12b-1 fee been reflected, returns prior to July 23, 2003 would have been lower.
C Class B shares bear a 0.90% 12b-1 fee. The initial offering of Class B shares took place on July 23, 2003. Returns prior to July 23, 2003 are those of Fidelity Short-Intermediate Municipal Income Fund, the original class of the fund, which has no 12b-1 fee. Had Class B shares' 12b-1 fee been reflected, returns prior to July 23, 2003 would have been lower. Class B shares' contingent deferred sales charges included in the past one year, past five years, and past ten years total return figures are 3%, 0%, and 0%, respectively.
D Class C shares bear a 1.00% 12b-1 fee. The initial offering of Class C shares took place on July 23, 2003. Returns prior to July 23, 2003 are those of Fidelity Short-Intermediate Municipal Income Fund, the original class of the fund, which has no 12b-1 fee. Had Class C shares' 12b-1 fee been reflected, returns prior to July 23, 2003 would have been lower. Class C shares' contingent deferred sales charge included in the past one year, past five years, and past ten years total return figures are 1%, 0%, and 0%, respectively.
See accompanying notes which are an integral part of the financial statements.
Annual Report
$10,000 Over 10 Years
Let's say hypothetically that $10,000 was invested in Fidelity Advisor® Short-Intermediate Municipal Income Fund - Class A on December 31, 2002, and the current 2.75% sales charge was paid. The chart shows how the value of your investment would have changed, and also shows how the Barclays® Municipal Bond Index performed over the same period. The initial offering of Class A took place on July 23, 2003. See the previous page for additional information regarding the performance of Class A.
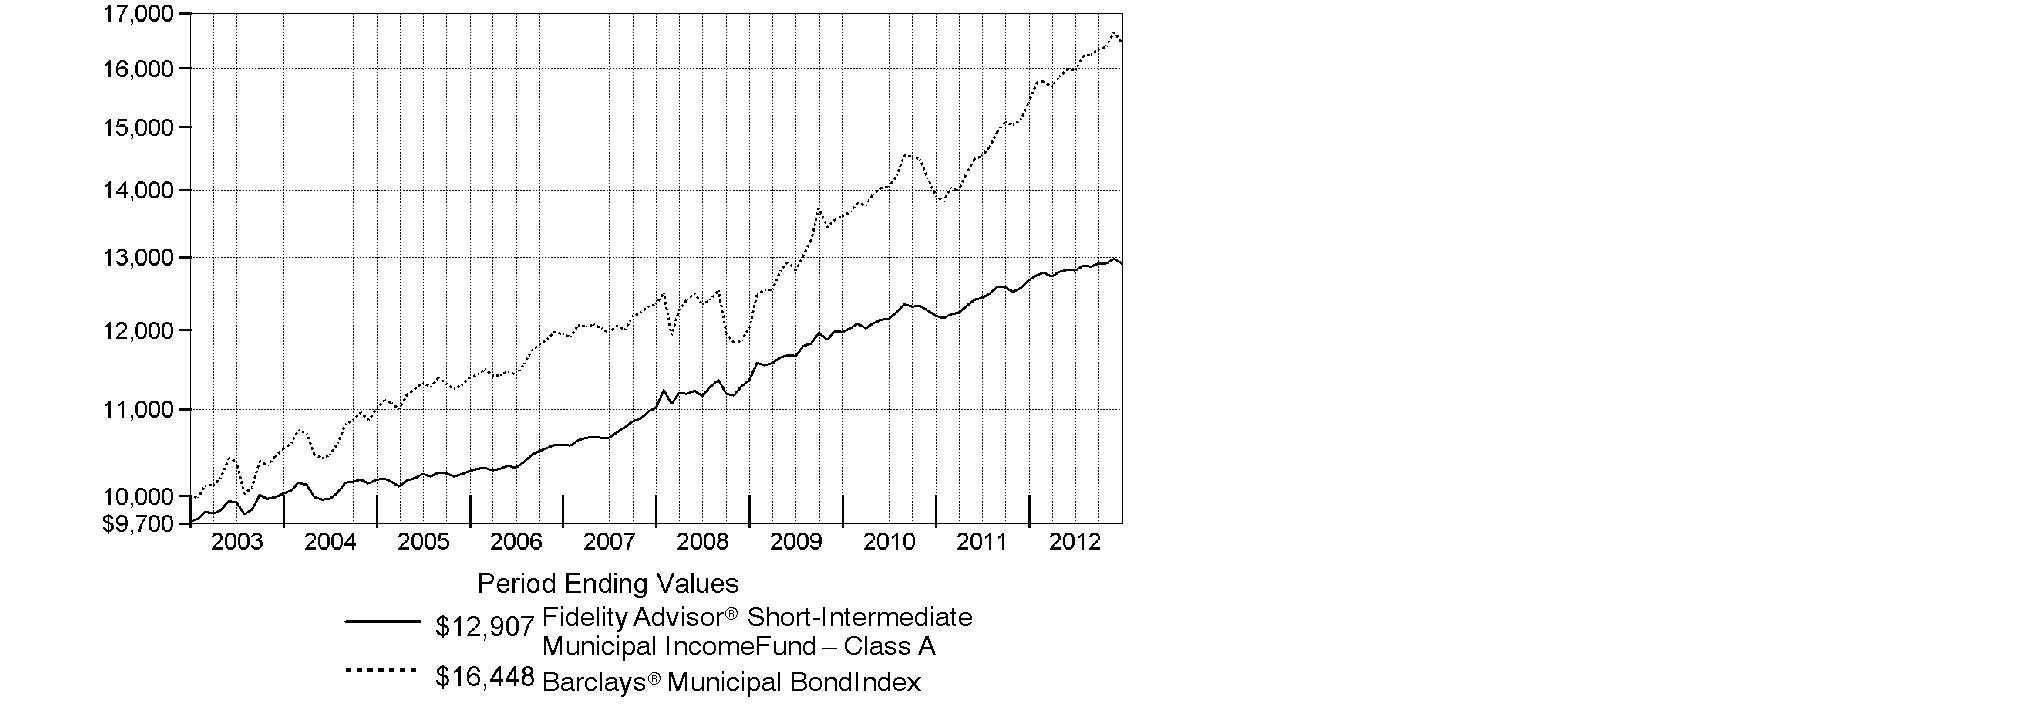
Annual Report
Market Recap: Powered by improving issuer fundamentals and favorable supply and demand, the bull market for municipal bonds rolled on in 2012, with the Barclays® Municipal Bond Index advancing 6.78%. By contrast, taxable investment-grade debt gained 4.21%, as tracked by the Barclays® U.S. Aggregate Bond Index. Muni investors were encouraged by a recovery in tax revenues for many issuers. And despite a handful of well-publicized bankruptcies by local issuers, the overall muni default rate declined and remained low. Even with a surge in refinancings, the overall supply of newly issued muni bonds was muted. As for demand, munis drew heavy interest from investors seeking a yield advantage over U.S. Treasuries, and from those looking for a perceived safe haven amid mixed U.S. economic data and the ongoing financial crisis in Europe. Investors' appetite for tax-advantaged investments in advance of potentially higher federal tax rates in 2013 also fueled demand, particularly in November, while a steady stream of municipal redemptions (calls and maturities), many of which were reinvested in the muni market, competed for limited new supply. The muni market sold off in December due to concern about proposals to limit the federal tax exemption of muni debt, profit-taking in advance of higher capital gains rates, and ratings downgrades of Puerto Rico debt to borderline investment grade.
Comments from Mark Sommer, Lead Portfolio Manager of Fidelity Advisor® Short-Intermediate Municipal Income Fund: For the year, the fund's Class A, Class T, Class B and Class C shares returned 1.84%, 1.95%, 1.27% and 1.08%, respectively (excluding sales charges). Meanwhile, the Barclays 1-6 Year Municipal Bond Index - which tracks the types of securities in which the fund invests - rose 2.00%. The fund's performance was bolstered by our overweighting in both health care and California general obligation bonds (GOs) issued by the state, as well as yield-curve positioning. Health care bonds were a plus, thanks largely to investors' prodigious appetite for higher-yielding tax-free securities. The larger-than-benchmark stake in California state GOs proved advantageous, as these securities rallied strongly. In terms of yield-curve positioning, the fund benefited from its maturity "barbell" approach. The fund's relative performance was hurt by its underweighting in prepaid gas bonds, which recovered in the second half of the year as the credit quality of the underwriters of such securities - including banks, broker-dealers and other financial institutions - improved and in response to heavy investor demand.
The views expressed above reflect those of the portfolio manager(s) only through the end of the period as stated on the cover of this report and do not necessarily represent the views of Fidelity or any other person in the Fidelity organization. Any such views are subject to change at any time based upon market or other conditions and Fidelity disclaims any responsibility to update such views. These views may not be relied on as investment advice and, because investment decisions for a Fidelity fund are based on numerous factors, may not be relied on as an indication of trading intent on behalf of any Fidelity fund.
Annual Report
Shareholder Expense Example
As a shareholder of the Fund, you incur two types of costs: (1) transaction costs, including sales charges (loads) on purchase payments or redemption proceeds, redemption fees and (2) ongoing costs, including management fees, distribution and/or service (12b-1) fees and other Fund expenses. This Example is intended to help you understand your ongoing costs (in dollars) of investing in the Fund and to compare these costs with the ongoing costs of investing in other mutual funds.
The Example is based on an investment of $1,000 invested at the beginning of the period and held for the entire period (July 1, 2012 to December 31, 2012).
Actual Expenses
The first line of the accompanying table for each class of the Fund provides information about actual account values and actual expenses. You may use the information in this line, together with the amount you invested, to estimate the expenses that you paid over the period. Simply divide your account value by $1,000.00 (for example, an $8,600 account value divided by $1,000.00 = 8.6), then multiply the result by the number in the first line for a class of the Fund under the heading entitled "Expenses Paid During Period" to estimate the expenses you paid on your account during this period. A small balance maintenance fee of $12.00 that is charged once a year may apply for certain accounts with a value of less than $2,000. This fee is not included in the table below. If it was, the estimate of expenses you paid during the period would be higher, and your ending account value lower, by this amount. In addition, the Fund, as a shareholder in the underlying Fidelity Central Funds, will indirectly bear its pro-rata share of the fees and expenses incurred by the underlying Fidelity Central Funds. These fees and expenses are not included in the Fund's annualized expense ratio used to calculate the expense estimate in the table below.
Hypothetical Example for Comparison Purposes
The second line of the accompanying table for each class of the Fund provides information about hypothetical account values and hypothetical expenses based on a Class' actual expense ratio and an assumed rate of return of 5% per year before expenses, which is not the Class' actual return. The hypothetical account values and expenses may not be used to estimate the actual ending account balance or expenses you paid for the period. You may use this information to compare the ongoing costs of investing in the Fund and other funds. To do so, compare this 5% hypothetical example with the 5% hypothetical examples that appear in the shareholder reports of the other funds. A small balance maintenance fee of $12.00 that is charged once a year may apply for certain accounts with a value of less than $2,000. This fee is not included in the table below. If it was, the estimate of expenses you paid during the period would be higher, and your ending account value lower, by this amount. In addition, the Fund, as a shareholder in the underlying Fidelity Central Funds, will indirectly bear its pro-rata share of the fees and expenses incurred by the underlying Fidelity Central Funds. These fees and expenses are not included in the Fund's annualized expense ratio used to calculate the expense estimate in the table below.
Please note that the expenses shown in the table are meant to highlight your ongoing costs only and do not reflect any transaction costs. Therefore, the second line of the table is useful in comparing ongoing costs only, and will not help you determine the relative total costs of owning different funds. In addition, if these transactional costs were included, your costs would have been higher.
Annual Report
| Annualized Expense Ratio | Beginning
Account Value
July 1, 2012 | Ending
Account Value
December 31, 2012 | Expenses Paid
During Period*
July 1, 2012 to
December 31, 2012 |
Class A | .78% | | | |
Actual | | $ 1,000.00 | $ 1,007.50 | $ 3.94 |
HypotheticalA | | $ 1,000.00 | $ 1,021.22 | $ 3.96 |
Class T | .76% | | | |
Actual | | $ 1,000.00 | $ 1,008.50 | $ 3.84 |
HypotheticalA | | $ 1,000.00 | $ 1,021.32 | $ 3.86 |
Class B | 1.43% | | | |
Actual | | $ 1,000.00 | $ 1,004.20 | $ 7.20 |
HypotheticalA | | $ 1,000.00 | $ 1,017.95 | $ 7.25 |
Class C | 1.53% | | | |
Actual | | $ 1,000.00 | $ 1,003.70 | $ 7.71 |
HypotheticalA | | $ 1,000.00 | $ 1,017.44 | $ 7.76 |
Short-Intermediate Municipal Income | .48% | | | |
Actual | | $ 1,000.00 | $ 1,009.00 | $ 2.42 |
HypotheticalA | | $ 1,000.00 | $ 1,022.72 | $ 2.44 |
Institutional Class | .54% | | | |
Actual | | $ 1,000.00 | $ 1,008.70 | $ 2.73 |
HypotheticalA | | $ 1,000.00 | $ 1,022.42 | $ 2.75 |
A 5% return per year before expenses
* Expenses are equal to each Class' annualized expense ratio, multiplied by the average account value over the period, multiplied by 184/366 (to reflect the one-half year period).
Annual Report
Investment Changes (Unaudited)
Top Five States as of December 31, 2012 |
| % of fund's
net assets | % of fund's net assets
6 months ago |
California | 14.2 | 11.4 |
New York | 11.6 | 12.6 |
Illinois | 8.5 | 7.4 |
Florida | 8.1 | 8.3 |
Texas | 7.7 | 5.5 |
Top Five Sectors as of December 31, 2012 |
| % of fund's
net assets | % of fund's net assets
6 months ago |
General Obligations | 36.4 | 32.1 |
Electric Utilities | 12.7 | 12.8 |
Special Tax | 12.1 | 11.1 |
Health Care | 9.3 | 8.6 |
Transportation | 7.1 | 5.2 |
Weighted Average Maturity as of December 31, 2012 |
| | 6 months ago |
Years | 3.2 | 3.2 |
This is a weighted average of all the maturities of the securities held in a fund. Weighted Average Maturity (WAM) can be used as a measure of sensitivity to interest rate changes and market changes. Generally, the longer the maturity, the greater the sensitivity to such changes. WAM is based on the dollar-weighted average length of time until principal payments must be paid. Depending on the types of securities held in a fund, certain maturity shortening devices (e.g., demand features, interest rate resets, and call options) may be taken into account when calculating the WAM. |
Duration as of December 31, 2012 |
| | 6 months ago |
Years | 2.9 | 2.8 |
Duration estimates how much a bond fund's price will change with a change in comparable interest rates. If rates rise 1%, for example, a fund with a 5-year duration is likely to lose about 5% of its value. Other factors also can influence a bond fund's performance and share price. Accordingly, a bond fund's actual performance may differ from this example. Duration takes into account any call or put option embedded in the bonds. |
Quality Diversification (% of fund's net assets) |
As of December 31, 2012 | As of June 30, 2012 |
 | AAA 10.6% | | | AAA 8.5% | |
 | AA,A 71.8% | | | AA,A 69.7% | |
 | BBB 5.3% | | | BBB 4.2% | |
 | BB and Below 0.2% | | | BB and Below 0.1% | |
 | Not Rated 4.0% | | | Not Rated 1.6% | |
 | Short-Term
Investments and
Net Other Assets 8.1% | | | Short-Term
Investments and
Net Other Assets 15.9% | |

We have used ratings from Moody's Investors Service, Inc. Where Moody's® ratings are not available, we have used S&P® ratings. All ratings are as of the date indicated and do not reflect subsequent changes. |
Annual Report
Investments December 31, 2012
Showing Percentage of Net Assets
Municipal Bonds - 89.0% |
| Principal Amount (000s) | | Value (000s) |
Alabama - 0.1% |
Mobile Indl. Dev. Board Poll. Cont. Rev. Bonds Series 2007 B, 4.875%, tender 3/19/13 (b) | | $ 2,615 | | $ 2,639 |
Univ. of Alabama at Birmingham Hosp. Rev. Series 2008 A, 5% 9/1/13 | | 1,175 | | 1,207 |
| | 3,846 |
Arizona - 3.3% |
Arizona Ctfs. of Partnership Series 2010 A: | | | | |
5% 10/1/14 (FSA Insured) | | 5,000 | | 5,383 |
5% 10/1/16 (FSA Insured) | | 13,000 | | 14,685 |
Arizona Health Facilities Auth. Rev. (Banner Health Sys. Proj.): | | | | |
Series 2008 A, 5% 1/1/13 | | 2,000 | | 2,000 |
Series 2008 D: | | | | |
5% 1/1/13 | | 3,250 | | 3,250 |
5% 1/1/14 | | 2,255 | | 2,357 |
Arizona School Facilities Board Ctfs. of Prtn.: | | | | |
Series 2004 B, 5.25% 9/1/15 (FSA Insured) | | 6,470 | | 6,943 |
Series 2005 A1, 5% 9/1/14 (Nat'l. Pub. Fin. Guarantee Corp. Insured) | | 2,000 | | 2,138 |
Series 2005 A2, 5% 9/1/16 (Nat'l. Pub. Fin. Guarantee Corp. Insured) | | 11,000 | | 12,081 |
Series 2008: | | | | |
5.5% 9/1/13 | | 18,780 | | 19,413 |
5.5% 9/1/16 | | 1,385 | | 1,593 |
Arizona Wtr. Infrastructure Fin. Auth. Rev.
Series 2009 A: | | | | |
5% 10/1/18 | | 1,000 | | 1,220 |
5% 10/1/20 | | 5,180 | | 6,342 |
Coconino County Poll. Cont. Corp. Rev. Bonds (Arizona Pub. Svc. Co. Navajo Proj.) Series 2009 A, 5.5%, tender 6/1/14 (b) | | 6,000 | | 6,370 |
Maricopa County Poll. Cont. Rev. Bonds (Arizona Pub. Svc. Co. Palo Verde Proj.) Series 2009 A, 6%, tender 5/1/14 (b) | | 4,800 | | 5,110 |
Mesa Hwy. Proj. Advancement Series 2011 A: | | | | |
5% 7/1/17 | | 12,085 | | 13,328 |
5% 7/1/18 | | 5,200 | | 5,736 |
Navajo County Poll. Cont. Corp. Rev. Bonds (Arizona Pub. Svc. Co. Cholla Proj.) Series 2009 A, 1.25%, tender 5/30/14 (b) | | 2,800 | | 2,807 |
Phoenix Civic Impt. Corp. Wtr. Sys. Rev.: | | | | |
Series 2009 A, 5% 7/1/15 | | 5,835 | | 6,477 |
Municipal Bonds - continued |
| Principal Amount (000s) | | Value (000s) |
Arizona - continued |
Phoenix Civic Impt. Corp. Wtr. Sys. Rev.: - continued | | | | |
Series 2009 B, 5% 7/1/16 | | $ 5,090 | | $ 5,828 |
Pima County Swr. Sys. Rev.: | | | | |
Series 2011 B, 5% 7/1/19 | | 3,225 | | 3,905 |
Series 2012 A: | | | | |
5% 7/1/18 | | 825 | | 981 |
5% 7/1/19 | | 1,550 | | 1,877 |
Tucson Gen. Oblig. Series 2005, 5% 7/1/16 (Nat'l. Pub. Fin. Guarantee Corp. Insured) | | 1,250 | | 1,382 |
Tucson Wtr. Rev. Series 2001 A, 5% 7/1/15 (Nat'l. Pub. Fin. Guarantee Corp. Insured) | | 1,645 | | 1,698 |
Univ. Med. Ctr. Corp. Hosp. Rev. Series 2011: | | | | |
5% 7/1/16 | | 3,055 | | 3,388 |
5% 7/1/17 | | 3,315 | | 3,733 |
5% 7/1/18 | | 3,365 | | 3,835 |
| | 143,860 |
California - 11.9% |
California Dept. of Wtr. Resources (Central Valley Proj.) Series AM, 5% 12/1/13 (a) | | 3,000 | | 3,099 |
California Dept. of Wtr. Resources Pwr. Supply Rev.: | | | | |
Series 2010 L, 5% 5/1/17 | | 12,000 | | 14,077 |
Series 2010 M, 5% 5/1/16 | | 8,000 | | 9,123 |
California Econ. Recovery: | | | | |
Bonds Series B, 5%, tender 7/1/14 (b) | | 5,000 | | 5,322 |
Series 2009 A: | | | | |
5% 7/1/15 | | 3,660 | | 3,909 |
5% 7/1/15 (Pre-Refunded to 7/1/14 @ 100) | | 2,540 | | 2,716 |
5.25% 7/1/13 (Escrowed to Maturity) | | 1,185 | | 1,214 |
5.25% 7/1/13 (Nat'l. Pub. Fin. Guarantee Corp. Insured) | | 1,255 | | 1,286 |
5.25% 7/1/14 | | 1,780 | | 1,910 |
5.25% 7/1/14 (Escrowed to Maturity) | | 520 | | 558 |
California Gen. Oblig.: | | | | |
5% 11/1/13 | | 9,060 | | 9,414 |
5% 9/1/18 | | 7,500 | | 9,004 |
5% 9/1/19 | | 20,000 | | 24,391 |
5% 9/1/20 | | 20,000 | | 24,575 |
California Health Facilities Fing. Auth. Rev.: | | | | |
(Catholic Healthcare West Proj.) Series 2008 H, 5.125% 7/1/22 | | 1,945 | | 2,116 |
Municipal Bonds - continued |
| Principal Amount (000s) | | Value (000s) |
California - continued |
California Health Facilities Fing. Auth. Rev.: - continued | | | | |
(Children's Hosp. of Orange County Proj.) Series 2009 A, 5% 11/1/13 | | $ 1,100 | | $ 1,132 |
Bonds: | | | | |
(Catholic Healthcare West Proj.): | | | | |
Series 2009 D, 5%, tender 7/1/14 (b) | | 2,900 | | 3,068 |
Series 2009 F, 5%, tender 7/1/14 (b) | | 3,200 | | 3,386 |
(Children's Hosp. of Orange County Proj.) Series 2012 A, 1.93%, tender 7/1/17 (b) | | 4,000 | | 4,009 |
(St. Joseph Health Sys. Proj.) Series 2009 C, 5%, tender 10/16/14 (b) | | 4,300 | | 4,591 |
California Poll. Cont. Fing. Auth. Ctfs. of Prtn. (San Diego Gas & Elec. Co. Proj.) 5.9% 6/1/14 (Nat'l. Pub. Fin. Guarantee Corp. Insured) | | 34,000 | | 36,493 |
California Poll. Cont. Fing. Auth. Solid Waste Disp. Rev. Bonds: | | | | |
(Republic Svcs., Inc. Proj.) Series 2010 A, 0.6%, tender 2/1/13 (b)(e) | | 16,200 | | 16,201 |
(Waste Mgmt., Inc. Proj.) Series 2003 A, 5%, tender 5/1/13 (b)(e) | | 2,300 | | 2,334 |
California Pub. Works Board Lease Rev.: | | | | |
(Dept. of Corrections & Rehab. Proj.) Series 2011 C, 5% 10/1/18 | | 1,750 | | 2,058 |
(Riverside Campus Proj.) Series 2012 H, 5% 4/1/22 | | 1,000 | | 1,191 |
(Univ. Proj.) Series 2011 B: | | | | |
5% 10/1/18 | | 2,740 | | 3,249 |
5% 10/1/19 | | 1,490 | | 1,791 |
(Various Cap. Proj.) Series 2012 G, 5% 11/1/22 | | 1,250 | | 1,501 |
(Various Cap. Projects) Series 2011 A: | | | | |
5% 10/1/18 | | 6,475 | | 7,616 |
5% 10/1/19 | | 5,000 | | 5,921 |
5% 10/1/20 | | 2,525 | | 3,032 |
(Various Cap. Projs.) Series 2012 A, 5% 4/1/21 | | 1,000 | | 1,195 |
(Various Judicial Council Projects) Series 2011 D, 5% 12/1/19 | | 4,100 | | 4,905 |
Series 2009 J, 5% 11/1/17 | | 2,300 | | 2,684 |
Series 2010 A: | | | | |
5% 3/1/16 | | 2,000 | | 2,236 |
5% 3/1/17 | | 5,405 | | 6,186 |
California State Univ. Rev. Series 2007 C, 5% 11/1/13 (FSA Insured) | | 1,335 | | 1,387 |
Municipal Bonds - continued |
| Principal Amount (000s) | | Value (000s) |
California - continued |
California Statewide Cmntys. Dev. Auth. Rev.: | | | | |
(State of California Proposition 1A Receivables Prog.) Series 2009: | | | | |
4% 6/15/13 | | $ 1,000 | | $ 1,017 |
5% 6/15/13 | | 16,650 | | 17,002 |
Bonds: | | | | |
Series 2002 C, 5%, tender 5/1/17 (b) | | 4,000 | | 4,637 |
Series 2009 E2, 5%, tender 5/1/17 (b) | | 2,000 | | 2,319 |
Contra Costa Trans. Auth. Sales Tax Rev. Bonds Series 2012 A, 0.511%, tender 12/12/15 (b) | | 12,500 | | 12,500 |
East Bay Muni. Util. District Wtr. Sys. Rev. Bonds Series 2011 A2, 0.48%, tender 7/1/14 (b) | | 56,000 | | 56,116 |
Golden State Tobacco Securitization Corp. Tobacco Settlement Rev. Series 2003 B: | | | | |
5.5% 6/1/43 (Pre-Refunded to 6/1/13 @ 100) | | 2,000 | | 2,043 |
5.625% 6/1/38 (Pre-Refunded to 6/1/13 @ 100) | | 3,030 | | 3,097 |
Irvine Reassessment District 12-1 Ltd. Oblig. 2% 9/2/13 | | 1,000 | | 1,008 |
Los Angeles County Metropolitan Trans. Auth. Sales Tax Rev.: | | | | |
Series 2009 A, 5% 7/1/13 | | 4,155 | | 4,253 |
Series 2009 B, 5% 7/1/17 | | 12,905 | | 15,229 |
Series 2013 A: | | | | |
5% 7/1/18 (a) | | 9,750 | | 11,539 |
5% 7/1/19 (a) | | 4,400 | | 5,294 |
Los Angeles County Pub. Works Fing. Auth. Lease Rev. Series 2010 A, 5% 8/1/17 | | 5,000 | | 5,785 |
Los Angeles Gen. Oblig. Series 2011 B, 5% 9/1/18 | | 20,960 | | 25,445 |
Los Angeles Muni. Impt. Corp. Lease Rev. Series 2012 C: | | | | |
4.625% 3/1/18 | | 1,500 | | 1,721 |
5% 3/1/19 | | 2,935 | | 3,459 |
Los Angeles Unified School District Series 2009 KRY, 5% 7/1/13 | | 10,740 | | 10,992 |
Los Angeles Unified School District Ctfs. of Prtn. (Multiple Properties Proj.) Series 2010 A: | | | | |
5% 12/1/16 | | 2,025 | | 2,291 |
5% 12/1/17 | | 9,790 | | 11,221 |
Los Angeles Wastewtr. Sys. Rev. Series 2009 A, 5% 6/1/15 | | 12,240 | | 13,547 |
Monterey County Pub. Impt. Corp. Ctfs. of Prtn. (Refing. Proj.) Series 2009, 5% 8/1/17 (FSA Insured) | | 2,130 | | 2,434 |
Newport Beach Rev. Bonds (Hoag Memorial Hosp. Presbyterian Proj.) Series 2009 E, 5%, tender 2/7/13 (b) | | 2,500 | | 2,511 |
Municipal Bonds - continued |
| Principal Amount (000s) | | Value (000s) |
California - continued |
Northern California Pwr. Agcy. Rev.: | | | | |
(Geothermal #3 Proj.) Series 2009 A: | | | | |
5% 7/1/13 | | $ 1,020 | | $ 1,043 |
5% 7/1/14 | | 1,120 | | 1,193 |
5% 7/1/15 | | 2,170 | | 2,397 |
(Hydroelectric #1 Proj.) Series 2010 A: | | | | |
4% 7/1/15 | | 2,000 | | 2,160 |
5% 7/1/18 | | 2,000 | | 2,385 |
Port of Oakland Rev. Series 2012 P, 5% 5/1/21 (e) | | 2,500 | | 2,982 |
Poway Unified School District Pub. Fing. Auth. Lease Rev. Bonds Series 2008 B, 0%, tender 12/1/14 (FSA Insured) (b) | | 7,115 | | 6,884 |
Riverside County Asset Leasing Rev. (Riverside Cap. Proj.) Series 2012 A: | | | | |
4% 6/1/17 | | 1,750 | | 1,916 |
5% 6/1/17 | | 3,700 | | 4,206 |
5% 6/1/18 | | 6,470 | | 7,464 |
Sacramento Muni. Util. District Elec. Rev. Series 2011 X, 5% 8/15/21 | | 4,000 | | 4,952 |
Sacramento Pwr. Auth. Cogeneration Proj. Rev. Series 2005 A, 5% 7/1/18 (AMBAC Insured) | | 2,890 | | 3,072 |
San Bernardino County Ctfs. of Prtn. (Arrowhead Proj.) Series 2009 A: | | | | |
5% 8/1/16 | | 5,450 | | 5,993 |
5% 8/1/18 | | 8,000 | | 9,035 |
San Diego Cmnty. College District Series 2007, 0% 8/1/16 (FSA Insured) | | 1,160 | | 1,111 |
San Diego Pub. Facilities Fing. Auth. Swr. Rev.: | | | | |
Series 2009 A: | | | | |
5% 5/15/13 | | 5,415 | | 5,509 |
5% 5/15/15 | | 1,845 | | 2,035 |
Series 2009 B, 5% 5/15/14 | | 7,000 | | 7,442 |
Stockton Unified School District Gen. Oblig. 5% 7/1/18 (FSA Insured) | | 1,035 | | 1,193 |
| | 517,312 |
Municipal Bonds - continued |
| Principal Amount (000s) | | Value (000s) |
Colorado - 0.1% |
Colorado Health Facilities Auth. Rev. Bonds (Catholic Health Initiatives Proj.) Series 2008 C4, 4%, tender 11/12/15 (b) | | $ 4,200 | | $ 4,567 |
Univ. of Colorado Enterprise Sys. Rev. Series 2009 A, 5% 6/1/17 | | 500 | | 586 |
| | 5,153 |
Connecticut - 1.6% |
Connecticut Dev. Auth. Poll. Cont. Rev. Bonds Series 2011 A, 1.55%, tender 4/1/15 (b)(e) | | 4,300 | | 4,323 |
Connecticut Gen. Oblig.: | | | | |
(Econ. Recovery Proj.) Series 2009 A, 5% 1/1/15 | | 10,500 | | 11,431 |
Series 2012 C, 5% 6/1/21 | | 23,420 | | 29,305 |
Series 2012 D, 0.42% 9/15/15 (b) | | 6,000 | | 6,005 |
Connecticut Health & Edl. Facilities Auth. Rev.: | | | | |
Bonds (Ascension Health Cr. Group Proj.) Series 1998 B, 1.55%, tender 2/1/17 (b) | | 2,585 | | 2,630 |
Series D, 4% 7/1/14 | | 1,000 | | 1,043 |
Connecticut Spl. Tax Oblig. Trans. Infrastructure Rev.: | | | | |
Series 1998 A, 5.5% 10/1/13 | | 4,300 | | 4,468 |
Series 2009 1, 5% 2/1/14 | | 2,500 | | 2,627 |
Series 2011 A, 5% 12/1/18 | | 5,575 | | 6,737 |
| | 68,569 |
District Of Columbia - 0.5% |
District of Columbia Gen. Oblig. Series 2007 B, 5% 6/1/16 (AMBAC Insured) | | 3,555 | | 4,034 |
District of Columbia Income Tax Rev. Series 2009 C, 5% 12/1/13 | | 5,500 | | 5,741 |
District of Columbia Rev. (Medlantic/Helix Proj.) Series 1998 C, 5% 8/15/15 (FSA Insured) | | 1,500 | | 1,616 |
District of Columbia Univ. Rev. Bonds (Georgetown Univ. Proj.) Series 2001 B, 4.7%, tender 4/1/18 (b) | | 8,500 | | 9,560 |
Washington DC Metropolitan Transit Auth. Rev. Series 2009 A, 5% 7/1/14 | | 1,000 | | 1,062 |
| | 22,013 |
Florida - 8.1% |
Alachua County Health Facilities Auth. Health Facilities Rev. (Shands Teaching Hospitals & Clinics, Inc. Proj.) Series 2010 B: | | | | |
5% 12/1/14 | | 4,000 | | 4,320 |
5% 12/1/15 | | 4,395 | | 4,884 |
Municipal Bonds - continued |
| Principal Amount (000s) | | Value (000s) |
Florida - continued |
Broward County Arpt. Sys. Rev.: | | | | |
Series 2012 P1, 3% 10/1/13 (e) | | $ 4,000 | | $ 4,078 |
Series 2012 Q1, 5% 10/1/21 | | 1,000 | | 1,228 |
Broward County School Board Ctfs. of Prtn.: | | | | |
Series 2008 A, 5% 7/1/15 (FSA Insured) | | 5,495 | | 6,009 |
Series 2012 A: | | | | |
5% 7/1/19 | | 7,000 | | 8,338 |
5% 7/1/20 | | 15,070 | | 18,120 |
Citizens Property Ins. Corp.: | | | | |
Series 2010 A1, 5% 6/1/15 (FSA Insured) | | 14,000 | | 15,291 |
Series 2010 A3, 1.88% 6/1/13 (b) | | 47,300 | | 47,589 |
Clay County Infrastructure Sales Surtax Rev. 5% 10/1/15 (Assured Guaranty Corp. Insured) | | 7,745 | | 8,405 |
Clearwater Wtr. and Swr. Rev.: | | | | |
Series 2009 B, 5% 12/1/14 | | 2,000 | | 2,169 |
Series 2011: | | | | |
4% 12/1/16 | | 1,265 | | 1,394 |
5% 12/1/17 | | 1,685 | | 1,947 |
5% 12/1/18 | | 685 | | 810 |
5% 12/1/19 | | 1,820 | | 2,178 |
5% 12/1/20 | | 1,000 | | 1,205 |
Collier County Indl. Dev. Auth. Healthcare Facilities Rev. (NCH Healthcare Sys. Proj.) Series 2011: | | | | |
5% 10/1/14 | | 1,355 | | 1,438 |
5% 10/1/16 | | 1,530 | | 1,699 |
5% 10/1/17 | | 1,455 | | 1,639 |
Escambia City Health Facilities Auth. Rev. (Ascension Health Cr. Group Proj.) Series 2003 A, 5.25% 11/15/13 | | 4,265 | | 4,442 |
Escambia County Solid Waste Disp. Rev. Bonds (Gulf Pwr. Co. Proj.) Series 2009, 1.35%, tender 6/2/15 (b) | | 1,900 | | 1,905 |
Florida Board of Ed. Series 2005 B, 5% 1/1/18 | | 21,080 | | 23,073 |
Florida Board of Ed. Lottery Rev. Series 2011 A, 5% 7/1/20 | | 8,600 | | 10,541 |
Florida Board of Ed. Pub. Ed. Cap. Outlay: | | | | |
Series 2009 C, 5% 6/1/20 | | 3,625 | | 4,443 |
Series 2009 D, 5.5% 6/1/16 | | 7,910 | | 9,175 |
Florida Dept. of Envir. Protection Rev. Series 2012 A, 5% 7/1/19 | | 15,800 | | 19,111 |
Florida Gen. Oblig. (Dept. of Trans. Right-of-Way and Bridge Construction Proj.) Series 2005 B, 6.375% 7/1/13 | | 8,020 | | 8,264 |
Municipal Bonds - continued |
| Principal Amount (000s) | | Value (000s) |
Florida - continued |
Florida Hurricane Catastrophe Fund Fin. Corp. Rev. Series 2010 A, 5% 7/1/15 | | $ 20,000 | | $ 22,052 |
Florida Muni. Pwr. Agcy. Rev. (Stanton II Proj.) Series 2012 A, 5% 10/1/18 | | 2,850 | | 3,405 |
Gainesville Utils. Sys. Rev. Series 2012 A, 5% 10/1/21 | | 2,110 | | 2,611 |
Greater Orlando Aviation Auth. Arpt. Facilities Rev. Series 2011 C: | | | | |
5% 10/1/19 | | 1,705 | | 2,062 |
5% 10/1/20 | | 1,000 | | 1,220 |
Highlands County Health Facilities Auth. Rev.: | | | | |
(Adventist Health Sys./Sunbelt, Inc. Prog.) Series 2009 E, 5% 11/15/15 | | 2,345 | | 2,628 |
Bonds (Adventist Health Sys./Sunbelt, Inc. Prog.) Series 2008 A, 6.1%, tender 11/14/13 (b) | | 1,000 | | 1,044 |
Hillsborough County Indl. Dev. Auth. Poll. Cont. Rev. Bonds (Tampa Elec. Co. Proj.) Series 2007 B, 5.15%, tender 9/1/13 (b) | | 1,750 | | 1,800 |
Indian River County Wtr. & Swr. Rev.: | | | | |
5% 9/1/15 | | 1,000 | | 1,099 |
5% 9/1/17 | | 1,000 | | 1,155 |
JEA Wtr. & Swr. Sys. Rev. Series 2010 D, 5% 10/1/21 | | 1,945 | | 2,375 |
Kissimmee Util. Auth. Elec. Sys. Rev. Series 2003: | | | | |
5.25% 10/1/14 | | 775 | | 830 |
5.25% 10/1/15 | | 3,525 | | 3,895 |
Miami Beach Health Facilities Auth. Hosp. Rev. (Mount Sinai Med. Ctr. of Florida Proj.) Series 2012: | | | | |
5% 11/15/21 | | 1,000 | | 1,131 |
5% 11/15/22 | | 485 | | 547 |
Miami-Dade County Pub. Facilities Rev. (Jackson Health Sys. Proj.) Series 2005 B: | | | | |
5% 6/1/14 (Nat'l. Pub. Fin. Guarantee Corp. Insured) | | 4,790 | | 5,086 |
5% 6/1/19 (Nat'l. Pub. Fin. Guarantee Corp. Insured) | | 3,875 | | 4,206 |
Miami-Dade County Transit Sales Surtax Rev. Series 2012, 5% 7/1/19 | | 1,250 | | 1,505 |
Miami-Dade County Wtr. & Swr. Rev. Series 2008 A, 5% 10/1/14 (FSA Insured) | | 4,000 | | 4,316 |
Orange County Health Facilities Auth. (Orlando Health, Inc.) Series 2009: | | | | |
5% 10/1/15 | | 2,210 | | 2,421 |
5% 10/1/16 | | 1,000 | | 1,113 |
Orange County Health Facilities Auth. Rev. (Orlando Reg'l. Healthcare Sys. Proj.) Series 2008 A: | | | | |
5% 11/1/13 (FSA Insured) | | 1,000 | | 1,024 |
Municipal Bonds - continued |
| Principal Amount (000s) | | Value (000s) |
Florida - continued |
Orange County Health Facilities Auth. Rev. (Orlando Reg'l. Healthcare Sys. Proj.) Series 2008 A: - continued | | | | |
5% 11/1/15 (FSA Insured) | | $ 1,825 | | $ 1,999 |
Orlando & Orange County Expressway Auth. Rev.: | | | | |
Series 2010 B, 5% 7/1/15 (FSA Insured) | | 1,430 | | 1,578 |
Series 2012, 5% 7/1/19 | | 1,000 | | 1,206 |
Orlando Utils. Commission Util. Sys. Rev.: | | | | |
Series 2009 C, 5% 10/1/17 | | 1,500 | | 1,776 |
Series 2010 C, 5% 10/1/17 | | 1,895 | | 2,243 |
Series 2011 B: | | | | |
5% 10/1/18 | | 2,250 | | 2,724 |
5% 10/1/19 | | 2,325 | | 2,885 |
Pasco County Solid Waste Disp. & Resource Recovery Sys. Rev.: | | | | |
Series 2011: | | | | |
5% 10/1/17 (e) | | 4,465 | | 5,122 |
5% 10/1/19 (e) | | 2,025 | | 2,381 |
5% 10/1/18 (e) | | 2,745 | | 3,194 |
Sarasota County School Board Ctfs. of Prtn. (Master Lease Prog.): | | | | |
5% 7/1/13 | | 3,435 | | 3,512 |
5% 7/1/14 | | 2,000 | | 2,132 |
Tampa Bay Wtr. Reg'l. Wtr. Supply Auth. Util. Sys. Rev.: | | | | |
Series 2011 B, 5% 10/1/18 | | 4,700 | | 5,691 |
Series 2011, 5% 10/1/19 | | 5,590 | | 6,937 |
Tampa Health Sys. Rev. (Baycare Health Sys. Proj.) Series 2010: | | | | |
5% 11/15/16 | | 2,500 | | 2,846 |
5% 11/15/17 | | 1,500 | | 1,743 |
Tampa Solid Waste Sys. Rev. Series 2010: | | | | |
4% 10/1/14 (FSA Insured) (e) | | 3,000 | | 3,160 |
5% 10/1/15 (FSA Insured) (e) | | 2,920 | | 3,226 |
5% 10/1/16 (FSA Insured) (e) | | 6,000 | | 6,782 |
5% 10/1/17 (FSA Insured) (e) | | 5,000 | | 5,753 |
Tampa Tax Allocation (H. Lee Moffitt Cancer Ctr. Proj.) Series 2012 A, 5% 9/1/20 | | 1,800 | | 2,135 |
Titusville Wtr. & Swr. Rev. Series 2010, 5% 10/1/17 (Assured Guaranty Corp. Insured) | | 1,135 | | 1,301 |
| | 351,546 |
Municipal Bonds - continued |
| Principal Amount (000s) | | Value (000s) |
Georgia - 3.5% |
Appling County Dev. Auth. Poll. Cont. Rev. Bonds (Oglethorpe Pwr. Corp. Hatch Proj.) Series 2011 A, 2.5%, tender 3/1/13 (b) | | $ 5,000 | | $ 5,016 |
Atlanta Arpt. Rev. Series 2011 B, 5% 1/1/13 (e) | | 1,000 | | 1,000 |
Burke County Indl. Dev. Auth. Poll. Cont. Rev. Bonds: | | | | |
(Georgia Pwr. Co. Plant Vogtle Proj.): | | | | |
Fifth Series 1994, 2.3%, tender 4/1/14 (b) | | 8,000 | | 8,179 |
Fourth Series 1995: | | | | |
1.2%, tender 4/1/14 (b) | | 3,450 | | 3,480 |
1.2%, tender 4/1/14 (b) | | 4,800 | | 4,842 |
(Oglethorpe Pwr. Corp. Vogtle Proj.) Series 2011 A, 2.5%, tender 3/1/13 (b) | | 3,500 | | 3,511 |
Fulton County Facilities Corp. Ctfs. of Prtn. (Gen. Purp. Proj.) Series 2009: | | | | |
5% 11/1/13 | | 7,550 | | 7,827 |
5% 11/1/14 | | 7,490 | | 7,984 |
Fulton County Wtr. & Swr. Rev. Series 2011: | | | | |
5% 1/1/19 | | 4,000 | | 4,856 |
5% 1/1/20 | | 4,000 | | 4,917 |
Georgia Muni. Elec. Auth. Pwr. Rev.: | | | | |
Series B, 5% 1/1/17 | | 2,750 | | 3,156 |
Series GG: | | | | |
5% 1/1/16 | | 680 | | 760 |
5% 1/1/20 | | 675 | | 826 |
5% 1/1/21 | | 1,670 | | 2,076 |
Georgia Muni. Gas Auth. Rev. (Gas Portfolio III Proj.) Series R, 5% 10/1/21 | | 5,000 | | 6,050 |
Metropolitan Atlanta Rapid Transit Auth. Sales Tax Rev. Bonds Series 2000 A, 0.38%, tender 9/1/14 (b) | | 13,800 | | 13,805 |
Monroe County Dev. Auth. Poll. Cont. Rev. Bonds: | | | | |
(Georgia Pwr. Co. Plant Scherer Proj.) First Series 1995, 0.8%, tender 7/1/14 (b) | | 17,900 | | 17,916 |
(Oglethorpe Pwr. Corp. Scherer Proj.) Series 2011 A, 2.5%, tender 3/1/13 (b) | | 11,500 | | 11,537 |
Muni. Elec. Auth. of Georgia: | | | | |
(Combined Cycle Proj.) Series A, 5% 11/1/18 | | 2,000 | | 2,379 |
(Proj. One): | | | | |
Series 2008 A: | | | | |
5% 1/1/13 | | 2,000 | | 2,000 |
5.25% 1/1/17 (Berkshire Hathaway Assurance Corp. Insured) | | 7,925 | | 9,172 |
Series 2008 D: | | | | |
5.75% 1/1/19 | | 14,890 | | 18,196 |
Municipal Bonds - continued |
| Principal Amount (000s) | | Value (000s) |
Georgia - continued |
Muni. Elec. Auth. of Georgia: - continued | | | | |
(Proj. One): | | | | |
Series 2008 D: | | | | |
5.75% 1/1/20 | | $ 3,555 | | $ 4,338 |
Richmond County Hosp. Auth. (Univ. Health Svcs., Inc. Proj.) Series 2009: | | | | |
5% 1/1/14 | | 1,305 | | 1,354 |
5% 1/1/15 | | 1,040 | | 1,110 |
5% 1/1/16 | | 2,415 | | 2,624 |
5% 1/1/18 | | 1,530 | | 1,708 |
| | 150,619 |
Hawaii - 0.7% |
Hawaii Arpts. Sys. Rev.: | | | | |
Series 2010 B, 5% 7/1/15 (e) | | 3,900 | | 4,290 |
Series 2011, 5% 7/1/19 (e) | | 4,000 | | 4,693 |
Hawaii Gen. Oblig.: | | | | |
Series DR: | | | | |
5% 6/1/16 | | 7,645 | | 8,728 |
5% 6/1/16 (Escrowed to Maturity) | | 2,895 | | 3,320 |
Series DY: | | | | |
5% 2/1/15 | | 3,500 | | 3,825 |
5% 2/1/16 | | 4,000 | | 4,520 |
| | 29,376 |
Illinois - 8.5% |
Chicago Board of Ed. Series 2009 D: | | | | |
5% 12/1/17 (Assured Guaranty Corp. Insured) | | 4,115 | | 4,760 |
5% 12/1/18 (Assured Guaranty Corp. Insured) | | 2,335 | | 2,726 |
Chicago Gen. Oblig.: | | | | |
(City Colleges Proj.): | | | | |
Series 1999: | | | | |
0% 1/1/17 (Nat'l. Pub. Fin. Guarantee Corp. Insured) | | 7,200 | | 6,650 |
0% 1/1/18 (Nat'l. Pub. Fin. Guarantee Corp. Insured) | | 3,000 | | 2,683 |
0% 1/1/19 (Nat'l. Pub. Fin. Guarantee Corp. Insured) | | 9,805 | | 8,439 |
Series1999, 0% 1/1/20 (Nat'l. Pub. Fin. Guarantee Corp. Insured) | | 14,755 | | 12,090 |
Series 2012 B: | | | | |
5.125% 1/1/15 (AMBAC Insured) | | 3,000 | | 3,219 |
5.125% 1/1/15 (Pre-Refunded to 1/1/14 @ 100) | | 995 | | 1,042 |
Series A, 5% 1/1/17 (FSA Insured) | | 3,465 | | 3,839 |
Series B, 5% 1/1/17 (FSA Insured) | | 5,115 | | 5,617 |
Municipal Bonds - continued |
| Principal Amount (000s) | | Value (000s) |
Illinois - continued |
Chicago Midway Arpt. Rev. Bonds Series 2010 B, 5%, tender 1/1/15 (b) | | $ 5,000 | | $ 5,374 |
Chicago O'Hare Int'l. Arpt. Rev.: | | | | |
Series 2008 A, 5% 1/1/13 (FSA Insured) | | 4,000 | | 4,000 |
Series 2010 D, 5.25% 1/1/17 (e) | | 1,000 | | 1,154 |
Series 2010 E: | | | | |
5% 1/1/15 (e) | | 4,000 | | 4,321 |
5% 1/1/16 (e) | | 1,500 | | 1,671 |
Series 2011 B, 5% 1/1/18 | | 6,500 | | 7,553 |
Series 2012 A: | | | | |
5% 1/1/14 (e) | | 3,500 | | 3,652 |
5% 1/1/14 (e) | | 2,000 | | 2,087 |
5% 1/1/21 | | 1,400 | | 1,662 |
Series 2012 B, 5% 1/1/21 (e) | | 4,605 | | 5,373 |
Chicago Sales Tax Rev. Series 1998, 5.5% 1/1/16 (FGIC Insured) (FSA Insured) | | 1,710 | | 1,927 |
Chicago Transit Auth. Cap. Grant Receipts Rev.: | | | | |
(Fed. Transit Administration Section 5309 Proj.) Series 2008 A, 5% 6/1/13 | | 3,765 | | 3,831 |
5% 6/1/19 (Assured Guaranty Corp. Insured) | | 2,085 | | 2,345 |
5% 6/1/19 (Assured Guaranty Corp. Insured) (Pre-Refunded to 12/1/16 @ 100) | | 415 | | 484 |
Cook County Gen. Oblig. Series 2012 C: | | | | |
5% 11/15/19 | | 1,500 | | 1,802 |
5% 11/15/20 | | 2,500 | | 3,029 |
5% 11/15/21 | | 3,000 | | 3,633 |
Cook County Thorton Township High School District #205 5.5% 12/1/16 (Assured Guaranty Corp. Insured) | | 2,500 | | 2,893 |
Illinois Fin. Auth. Gas Supply Rev. Bonds (The Peoples Gas Lt. and Coke Co. Proj.): | | | | |
Series 2010 B, 2.625%, tender 8/1/15 (b) | | 9,500 | | 9,740 |
Series 2010, 2.125%, tender 7/1/14 (b) | | 11,500 | | 11,689 |
Illinois Fin. Auth. Hosp. Rev. (KishHealth Sys. Proj.) Series 2008, 5.25% 10/1/15 | | 2,220 | | 2,407 |
Illinois Fin. Auth. Rev.: | | | | |
(Advocate Health Care Proj.) Series 2010 D, 5% 4/1/15 | | 550 | | 600 |
(Kewanee Hosp. Proj.) Series 2006, 5% 8/15/26 | | 3,865 | | 4,069 |
(Northwest Cmnty. Hosp. Proj.) Series 2008 A: | | | | |
5% 7/1/13 | | 415 | | 423 |
5% 7/1/15 | | 1,000 | | 1,088 |
Municipal Bonds - continued |
| Principal Amount (000s) | | Value (000s) |
Illinois - continued |
Illinois Fin. Auth. Rev.: - continued | | | | |
(Palos Cmnty. Hosp. Proj.) Series 2010 C: | | | | |
5% 5/15/16 | | $ 2,060 | | $ 2,259 |
5% 5/15/17 | | 3,520 | | 3,912 |
(Provena Health Proj.) Series 2010 A: | | | | |
5% 5/1/13 | | 2,000 | | 2,025 |
5% 5/1/14 | | 2,000 | | 2,094 |
5.75% 5/1/19 | | 2,650 | | 3,109 |
(Rush Univ. Med. Ctr. Proj.) Series 2006 B: | | | | |
5% 11/1/15 (Nat'l. Pub. Fin. Guarantee Corp. Insured) | | 3,075 | | 3,408 |
5% 11/1/16 (Nat'l. Pub. Fin. Guarantee Corp. Insured) | | 1,700 | | 1,925 |
Bonds (Advocate Health Care Proj.) Series 2008 C B3, 4.375%, tender 7/1/14 (b) | | 4,000 | | 4,211 |
Series 2012 A, 5% 5/15/23 | | 1,300 | | 1,490 |
Series 2012: | | | | |
5% 9/1/19 | | 1,115 | | 1,282 |
5% 9/1/20 | | 1,470 | | 1,698 |
5% 9/1/21 | | 1,645 | | 1,916 |
5% 9/1/22 | | 2,165 | | 2,518 |
Illinois Gen. Oblig.: | | | | |
Series 2002, 5.5% 8/1/15 (Nat'l. Pub. Fin. Guarantee Corp. Insured) | | 1,495 | | 1,656 |
Series 2003 A, 5.25% 10/1/13 (FSA Insured) | | 3,755 | | 3,894 |
Series 2004 B, 5% 3/1/14 | | 15,500 | | 16,199 |
Series 2004, 5% 11/1/16 | | 11,000 | | 12,439 |
Series 2005: | | | | |
5% 4/1/13 (AMBAC Insured) | | 5,000 | | 5,055 |
5% 4/1/17 (AMBAC Insured) | | 8,050 | | 8,669 |
Series 2007 A, 5.5% 6/1/15 | | 1,000 | | 1,101 |
Series 2007 B, 5% 1/1/17 | | 9,835 | | 11,143 |
Series 2009 A, 3.5% 9/1/13 (Escrowed to Maturity) | | 3,000 | | 3,064 |
Series 2010: | | | | |
4% 1/1/13 | | 3,695 | | 3,695 |
5% 1/1/15 (FSA Insured) | | 20,000 | | 21,512 |
Series 2012: | | | | |
2% 2/1/13 | | 9,500 | | 9,511 |
3% 8/1/13 | | 4,800 | | 4,869 |
3% 9/1/13 | | 2,000 | | 2,033 |
4% 3/1/14 | | 5,000 | | 5,168 |
5% 3/1/13 | | 5,000 | | 5,036 |
Municipal Bonds - continued |
| Principal Amount (000s) | | Value (000s) |
Illinois - continued |
Illinois Gen. Oblig.: - continued | | | | |
Series 2012: | | | | |
5% 3/1/19 | | $ 5,500 | | $ 6,331 |
5% 8/1/22 | | 5,700 | | 6,525 |
Illinois Health Facilities Auth. Rev.: | | | | |
(Delnor-Cmnty. Hosp. Proj.) Series 2003 A: | | | | |
5% 5/15/15 (FSA Insured) | | 2,250 | | 2,440 |
5% 5/15/16 (FSA Insured) | | 2,325 | | 2,582 |
Series 2003 A, 5% 5/15/17 (FSA Insured) | | 2,150 | | 2,443 |
Illinois Sales Tax Rev.: | | | | |
Series 2009 B: | | | | |
4.5% 6/15/16 | | 5,000 | | 5,583 |
4.5% 6/15/17 | | 6,075 | | 6,893 |
Series 2010, 5% 6/15/15 | | 8,800 | | 9,698 |
Series 2011, 4% 6/15/13 | | 2,600 | | 2,643 |
Illinois Unemployment Ins. Fund Bldg. Receipts Series 2012 A: | | | | |
1.5% 6/15/21 | | 5,500 | | 5,504 |
4% 6/15/20 | | 1,000 | | 1,047 |
5% 6/15/20 | | 6,000 | | 6,496 |
Kane County Forest Preserve District Series 2012, 4% 12/15/14 | | 3,200 | | 3,419 |
Lake County Cmnty. Consolidated School District #73 Gen. Oblig.: | | | | |
0% 12/1/15 (Escrowed to Maturity) | | 580 | | 568 |
0% 12/1/15 (Nat'l. Pub. Fin. Guarantee Corp. Insured) | | 1,520 | | 1,451 |
Metropolitan Pier & Exposition: | | | | |
(McCormick Place Expansion Proj.) Series 1996 A, 0% 12/15/13 (Nat'l. Pub. Fin. Guarantee Corp. Insured) | | 2,725 | | 2,682 |
Series A, 0% 6/15/14 (Escrowed to Maturity) | | 8,625 | | 8,553 |
0% 6/15/14 (Nat'l. Pub. Fin. Guarantee Corp. Insured) | | 700 | | 680 |
Univ. of Illinois Rev. 0% 4/1/14 | | 2,350 | | 2,318 |
Will County Cmnty. Unit School District #365-U: | | | | |
0% 11/1/14 (Escrowed to Maturity) | | 1,025 | | 1,011 |
0% 11/1/14 (FSA Insured) | | 875 | | 857 |
0% 11/1/16 (Escrowed to Maturity) | | 740 | | 711 |
0% 11/1/16 (FSA Insured) | | 2,235 | | 2,093 |
| | 367,291 |
Municipal Bonds - continued |
| Principal Amount (000s) | | Value (000s) |
Indiana - 2.0% |
Indiana Fin. Auth. Health Sys. Rev. (Sisters of Saint Francis Health Svcs., Inc. Obligated Group Proj.) Series 2008 C, 5% 11/1/13 | | $ 3,000 | | $ 3,108 |
Indiana Fin. Auth. Hosp. Rev. (Parkview Health Sys. Oblig. Group Proj.) Series 2009 A: | | | | |
5% 5/1/14 | | 3,500 | | 3,685 |
5% 5/1/15 | | 6,420 | | 6,985 |
Indiana Fin. Auth. Rev.: | | | | |
(Trinity Health Cr. Group Proj.) Series 2009 A: | | | | |
5% 12/1/14 | | 1,250 | | 1,352 |
5% 12/1/15 | | 2,135 | | 2,384 |
(Wabash Valley Correctional Facilities Proj.) Series 2009 A, 5% 7/1/15 | | 8,025 | | 8,846 |
(Wabash Valley Correctional Facility Proj.) Series 2009 A, 5% 7/1/14 | | 2,500 | | 2,663 |
Series 2010 A, 5% 2/1/17 | | 2,800 | | 3,258 |
Series 2012: | | | | |
5% 3/1/20 | | 650 | | 757 |
5% 3/1/21 | | 1,225 | | 1,422 |
Indiana Health & Edl. Facilities Fing. Auth. Rev. Bonds (Ascension Health Sr. Cr. Group Proj.) Series 2006 B1, 4.1%, tender 11/3/16 (b) | | 4,000 | | 4,468 |
Indiana Health Facility Fing. Auth. Rev. Bonds (Ascension Health Cr. Group Proj.): | | | | |
Series 2001 A1, 1.5%, tender 8/1/14 (b) | | 3,400 | | 3,451 |
Series 2001 A2, 1.6%, tender 2/1/17 (b) | | 2,200 | | 2,243 |
Indiana Muni. Pwr. Agcy. Pwr. Supply Sys. Rev. Series 2011 A: | | | | |
5% 1/1/19 | | 1,470 | | 1,767 |
5% 1/1/20 | | 1,250 | | 1,517 |
Indiana State Fin. Auth. Wastewtr. (CWA Auth. Proj.) Series 2012 A: | | | | |
5% 10/1/20 | | 825 | | 1,023 |
5% 10/1/22 | | 1,600 | | 2,008 |
Indianapolis Local Pub. Impt. Bond Bank (Wtrwks. Proj.) Series F, 5% 7/1/15 (Nat'l. Pub. Fin. Guarantee Corp. Insured) | | 515 | | 567 |
Indianapolis Thermal Energy Sys. Series 2010 B: | | | | |
5% 10/1/16 | | 5,000 | | 5,598 |
5% 10/1/17 | | 5,000 | | 5,709 |
Jasper County Indl. Poll. Ctl. Rev. (Northern Indiana Pub. Svc. Co. Proj.) Series 1988 B, 5.2% 6/1/13 (Nat'l. Pub. Fin. Guarantee Corp. Insured) | | 3,000 | | 3,050 |
Municipal Bonds - continued |
| Principal Amount (000s) | | Value (000s) |
Indiana - continued |
Lake Central Multi-District School Bldg. Corp. Series 2012 B: | | | | |
4% 1/15/19 | | $ 1,000 | | $ 1,139 |
4% 1/15/20 | | 1,345 | | 1,539 |
4% 1/15/21 | | 1,250 | | 1,434 |
5% 7/15/19 | | 1,680 | | 2,035 |
5% 7/15/20 | | 1,170 | | 1,432 |
5% 7/15/21 | | 1,000 | | 1,233 |
Purdue Univ. Rev.: | | | | |
(Student Facilities Sys. Proj.) Series 2009 B: | | | | |
4% 7/1/17 | | 500 | | 567 |
5% 7/1/15 | | 315 | | 350 |
5% 7/1/16 | | 500 | | 573 |
Series Z-1: | | | | |
5% 7/1/16 | | 1,215 | | 1,394 |
5% 7/1/17 | | 1,000 | | 1,179 |
5% 7/1/18 | | 1,500 | | 1,812 |
Univ. of Southern Indiana Rev. Series J: | | | | |
5% 10/1/14 (Assured Guaranty Corp. Insured) | | 1,985 | | 2,121 |
5% 10/1/15 (Assured Guaranty Corp. Insured) | | 1,000 | | 1,102 |
5% 10/1/16 (Assured Guaranty Corp. Insured) | | 1,165 | | 1,319 |
| | 85,090 |
Iowa - 0.0% |
Iowa Fin. Auth. Health Facilities Rev. Series 2005 A, 5% 2/15/16 (Assured Guaranty Corp. Insured) | | 1,700 | | 1,884 |
Kansas - 0.7% |
Kansas Dev. Fin. Agcy. (Adventist Health Sys./Sunbelt Obligated Group Proj.) Series 2009 D: | | | | |
5% 11/15/14 | | 575 | | 616 |
5% 11/15/15 | | 625 | | 691 |
5% 11/15/16 | | 875 | | 991 |
Overland Park Sales Tax Spl. Oblig. Rev. Series 2012, 4.375% 12/15/23 | | 3,100 | | 3,095 |
Wichita Hosp. Facilities Rev.: | | | | |
(Via Christi Health Sys., Inc. Proj.) Series 2009 X, 5% 11/15/14 | | 2,000 | | 2,159 |
(Via Christi Health Sys., Inc. Proj.) Series 2009 III A: | | | | |
5% 11/15/14 | | 2,405 | | 2,596 |
5% 11/15/15 | | 6,245 | | 6,958 |
5% 11/15/16 | | 5,410 | | 6,168 |
Municipal Bonds - continued |
| Principal Amount (000s) | | Value (000s) |
Kansas - continued |
Wichita Hosp. Facilities Rev.: - continued | | | | |
Series 2011 IV A: | | | | |
5% 11/15/18 | | $ 2,250 | | $ 2,643 |
5% 11/15/20 | | 2,745 | | 3,258 |
| | 29,175 |
Kentucky - 0.8% |
Ashland Med. Ctr. Rev. (Ashland Hosp. Corp. d/b/a/ King's Daughters Med. Ctr. Proj.) Series 2010 B: | | | | |
4% 2/1/14 | | 750 | | 773 |
4% 2/1/15 | | 1,495 | | 1,573 |
Jefferson County School District Fin. Corp. School Bldg. Rev. Series 2009 A, 5.25% 1/1/13 (FSA Insured) | | 2,170 | | 2,170 |
Kentucky Econ. Dev. Fin. Auth. Hosp. Rev. (Baptist Healthcare Sys. Proj.) Series A, 5% 8/15/15 | | 4,000 | | 4,367 |
Kentucky Econ. Dev. Fin. Auth. Rev. (Ashland Hosp. Corp. d/b/a/ King's Daughters Med. Ctr. Proj.) Series 2010 A, 4% 2/1/13 | | 500 | | 501 |
Kentucky State Property & Buildings Commission Rev. (#82 Proj.) 5.25% 10/1/17 (FSA Insured) | | 2,450 | | 2,915 |
Louisville/Jefferson County Metropolitan Govt. Poll. Cont. Rev. Bonds: | | | | |
(Louisville Gas and Elec. Co. Proj.) Series 2007 B: | | | | |
1.15%, tender 6/1/17 (b) | | 2,600 | | 2,577 |
1.6%, tender 6/1/17 (b) | | 8,000 | | 7,976 |
(Louisville Gas and Electronic Co. Proj.): | | | | |
Series 2003 A, 1.65%, tender 4/3/17 (b) | | 6,000 | | 6,065 |
Series 2005 A, 5.75%, tender 12/2/13 (b) | | 6,000 | | 6,273 |
| | 35,190 |
Louisiana - 0.3% |
Louisiana Pub. Facilities Auth. Rev.: | | | | |
(Christus Health Proj.) Series 2009 A: | | | | |
5% 7/1/13 | | 3,500 | | 3,568 |
5% 7/1/16 | | 2,000 | | 2,216 |
(Entergy Gulf States Louisiana LLC Proj.) Series 2010 B, 2.875% 11/1/15 | | 3,000 | | 3,092 |
New Orleans Gen. Oblig. Series 2012, 5% 12/1/20 | | 2,800 | | 3,302 |
Reg'l. Transit Auth. Louisiana Sales Tax Rev. 4% 12/1/16 (FSA Insured) | | 1,000 | | 1,105 |
| | 13,283 |
Municipal Bonds - continued |
| Principal Amount (000s) | | Value (000s) |
Maryland - 1.4% |
Maryland Gen. Oblig. Second Series B, 5.25% 8/15/16 | | $ 16,100 | | $ 18,772 |
Maryland Health & Higher Edl. Facilities Auth. Rev.: | | | | |
(Univ. of Maryland Med. Sys. Proj.) Series 2008 F: | | | | |
5% 7/1/13 | | 2,400 | | 2,446 |
5% 7/1/14 | | 3,500 | | 3,678 |
Bonds: | | | | |
(Johns Hopkins Health Sys. Obligated Group Proj.) Series 2008 B, 5%, tender 5/15/15 (b) | | 2,225 | | 2,447 |
Series 2012 D, 0.973%, tender 11/15/17 (b) | | 14,000 | | 14,078 |
Montgomery County Gen. Oblig.: | | | | |
(Dept. of Liquor Cont. Proj.) Series 2009 A, 5% 4/1/15 | | 1,725 | | 1,886 |
Series 2011 A, 5% 7/1/20 | | 16,000 | | 19,562 |
| | 62,869 |
Massachusetts - 1.6% |
Braintree Gen. Oblig. Series 2009: | | | | |
5% 5/15/14 | | 1,000 | | 1,063 |
5% 5/15/16 | | 4,400 | | 5,041 |
Massachusetts Bay Trans. Auth. Sales Tax Rev. Series 2006 B, 5.25% 7/1/18 | | 2,300 | | 2,810 |
Massachusetts Dept. of Trans. Metropolitan Hwy. Sys. Rev. Series 2010 B, 5% 1/1/15 | | 12,400 | | 13,348 |
Massachusetts Dev. Fin. Agcy. Rev.: | | | | |
(Boston College Proj.): | | | | |
Series Q1: | | | | |
4% 7/1/15 | | 1,500 | | 1,621 |
4% 7/1/16 | | 1,000 | | 1,108 |
5% 7/1/13 | | 1,000 | | 1,023 |
Series Q2: | | | | |
4% 7/1/15 | | 1,170 | | 1,264 |
4% 7/1/16 | | 1,000 | | 1,108 |
5% 7/1/13 | | 1,100 | | 1,126 |
5% 7/1/14 | | 1,080 | | 1,153 |
5% 7/1/17 | | 1,370 | | 1,606 |
(Tufts Med. Ctr. Proj.) Series I: | | | | |
5% 1/1/14 | | 1,550 | | 1,609 |
5% 1/1/16 | | 1,300 | | 1,425 |
Bonds (Dominion Energy Brayton Point Proj.) Series 2010 A, 2.25%, tender 9/1/16 (b) | | 1,400 | | 1,443 |
Massachusetts Gen. Oblig. Series 2004 B, 5.25% 8/1/20 | | 12,700 | | 16,129 |
Municipal Bonds - continued |
| Principal Amount (000s) | | Value (000s) |
Massachusetts - continued |
Massachusetts Health & Edl. Facilities Auth. Rev. Bonds (Baystate Health Sys. Proj.) Series 2009 K, 5%, tender 7/1/13 (b) | | $ 7,000 | | $ 7,125 |
Massachusetts Spl. Oblig. Rev. (Fed. Hwy. Grant Anticipation Note Prog.) Series 2003 A, 5% 12/15/13 | | 4,325 | | 4,521 |
Medford Gen. Oblig. Series 2011 B, 4% 3/1/19 | | 3,570 | | 4,102 |
| | 68,625 |
Michigan - 3.1% |
Big Rapids Pub. School District: | | | | |
5% 5/1/13 (Assured Guaranty Corp. Insured) | | 1,195 | | 1,213 |
5% 5/1/14 (Assured Guaranty Corp. Insured) | | 1,190 | | 1,257 |
Chelsea School District 5% 5/1/13 (Nat'l. Pub. Fin. Guarantee Corp. Insured) | | 1,750 | | 1,776 |
Detroit School District Series 2012 A: | | | | |
5% 5/1/19 | | 2,000 | | 2,355 |
5% 5/1/20 | | 2,000 | | 2,372 |
5% 5/1/21 | | 1,810 | | 2,165 |
Detroit Swr. Disp. Rev. Series 2006 D, 0.841% 7/1/32 (b) | | 4,070 | | 3,417 |
Grand Rapids Cmnty. College 5% 5/1/13 (FSA Insured) | | 1,305 | | 1,325 |
Grand Valley Michigan State Univ. Rev. Series 2009, 5% 12/1/16 | | 1,320 | | 1,491 |
Kalamazoo Hosp. Fin. Auth. Hosp. Facilities Rev. Series 2003 A, 5.25% 5/15/14 (FSA Insured) | | 2,000 | | 2,118 |
Kalamazoo Pub. Schools 5% 5/1/13 (Assured Guaranty Corp. Insured) | | 2,940 | | 2,985 |
Kent Hosp. Fin. Auth. Hosp. Facilities Rev.: | | | | |
(Spectrum Health Sys. Proj.) Series 2011 A: | | | | |
5% 11/15/18 | | 1,250 | | 1,472 |
5% 11/15/19 | | 1,000 | | 1,188 |
Bonds (Spectrum Health Sys. Proj.) Series 2008 A, 5.25%, tender 1/15/14 (b) | | 2,200 | | 2,301 |
Michigan Fin. Auth. Rev.: | | | | |
Series 2008 B2, 5% 6/1/15 | | 1,090 | | 1,171 |
Series 2012 A: | | | | |
5% 6/1/16 | | 2,290 | | 2,511 |
5% 6/1/17 | | 1,410 | | 1,570 |
5% 6/1/18 | | 2,330 | | 2,632 |
Michigan Hosp. Fin. Auth. Rev.: | | | | |
(McLaren Health Care Corp. Proj.) Series 2008 A, 5.25% 5/15/14 | | 4,160 | | 4,415 |
Municipal Bonds - continued |
| Principal Amount (000s) | | Value (000s) |
Michigan - continued |
Michigan Hosp. Fin. Auth. Rev.: - continued | | | | |
Bonds (Ascension Health Cr. Group Proj.) Series 1999 B3, 2%, tender 8/1/14 (b) | | $ 11,000 | | $ 11,264 |
Michigan Muni. Bond Auth. Rev.: | | | | |
(Clean Wtr. Pooled Proj.) Series 2010: | | | | |
5% 10/1/14 | | 6,045 | | 6,530 |
5% 10/1/15 | | 1,750 | | 1,972 |
5% 10/1/15 | | 3,250 | | 3,662 |
(Local Govt. Ln. Prog.) Series 2009 C: | | | | |
5% 5/1/13 | | 1,645 | | 1,669 |
5% 5/1/14 | | 2,140 | | 2,261 |
5% 5/1/15 | | 1,845 | | 2,003 |
5% 5/1/16 | | 1,865 | | 2,080 |
Royal Oak Hosp. Fin. Auth. Hosp. Rev. (William Beaumont Hosp. Oblig. Group Proj.) Series 2009 W, 5% 8/1/15 | | 2,070 | | 2,208 |
Univ. of Michigan Univ. Rev. Bonds 0.33%, tender 4/1/15 (b) | | 22,900 | | 22,900 |
Wayne County Arpt. Auth. Rev.: | | | | |
(Detroit Metropolitan Wayne County Arpt. Proj.) Series 2012 A, 5% 12/1/14 (e) | | 1,500 | | 1,614 |
Series 2010 A, 5% 12/1/18 (e) | | 1,400 | | 1,623 |
Series 2011 A, 5% 12/1/19 (e) | | 22,700 | | 26,155 |
West Bloomfield School District 5% 5/1/15 (Assured Guaranty Corp. Insured) | | 1,400 | | 1,528 |
Western Michigan Univ. Rev.: | | | | |
5.25% 11/15/14 (Assured Guaranty Corp. Insured) | | 2,135 | | 2,310 |
5.25% 11/15/15 (Assured Guaranty Corp. Insured) | | 3,275 | | 3,659 |
| | 133,172 |
Minnesota - 0.2% |
Minneapolis & Saint Paul Metropolitan Arpts. Commission Arpt. Rev. Series 2008 A, 5% 1/1/13 (e) | | 1,000 | | 1,000 |
Minnesota 911 Rev. (Pub. Safety Radio Communications Sys. Proj.) Series 2009, 5% 6/1/14 (Assured Guaranty Corp. Insured) | | 2,225 | | 2,369 |
Minnesota Agric. & Econ. Dev. Board Rev. (Essentia Health Obligated Group Proj.) Series 2008 C1: | | | | |
5% 2/15/15 (Assured Guaranty Corp. Insured) | | 1,335 | | 1,443 |
5% 2/15/16 (Assured Guaranty Corp. Insured) | | 565 | | 628 |
Municipal Bonds - continued |
| Principal Amount (000s) | | Value (000s) |
Minnesota - continued |
Northern Muni. Pwr. Agcy. Elec. Sys. Rev. Series 2009 A, 5% 1/1/15 (Assured Guaranty Corp. Insured) | | $ 1,000 | | $ 1,087 |
Southern Minnesota Muni. Pwr. Agcy. Pwr. Supply Sys. Rev. Series 2009 A, 5% 1/1/16 | | 1,000 | | 1,123 |
| | 7,650 |
Mississippi - 0.3% |
Mississippi Bus. Fin. Corp. Solid Waste Disp. Rev. Bonds (Gulf Pwr. Co. Proj.) Series 2012, 0.55%, tender 12/12/13 (b)(e) | | 4,900 | | 4,900 |
Mississippi Gen. Oblig. (Cap. Impts. Proj.) Series 2012 D, 0.66% 9/1/17 (b) | | 3,700 | | 3,714 |
Mississippi Hsg. Fin. Corp. Single Family Mtg. Rev. Series 1983, 0% 6/1/15 (Escrowed to Maturity) | | 4,000 | | 3,937 |
| | 12,551 |
Nebraska - 0.2% |
Nebraska Pub. Pwr. District Rev.: | | | | |
Series 2012 C, 5% 1/1/22 | | 1,100 | | 1,279 |
Series C: | | | | |
4% 1/1/15 | | 2,360 | | 2,518 |
4% 1/1/16 | | 2,195 | | 2,404 |
Univ. of Nebraska Facilities Corp. Lease Rental Rev. (UNMC Health Professions Futures Proj.) Series 2009, 5% 8/15/13 | | 4,000 | | 4,117 |
| | 10,318 |
Nevada - 2.1% |
Clark County Arpt. Rev. Series 2008 E: | | | | |
5% 7/1/14 | | 2,905 | | 3,100 |
5% 7/1/15 | | 3,500 | | 3,859 |
Clark County Fuel Tax Series 2008, 5% 6/1/13 (Escrowed to Maturity) | | 5,815 | | 5,928 |
Clark County School District: | | | | |
Series 1998, 5.5% 6/15/13 (FSA Insured) | | 5,000 | | 5,116 |
Series 2005 A, 5% 6/15/16 (Nat'l. Pub. Fin. Guarantee Corp. Insured) | | 21,215 | | 23,534 |
Series 2012 A, 5% 6/15/19 | | 24,610 | | 29,516 |
Nevada Dept. of Bus. & Industry (Waste Mgmt., Inc. Proj.) Series 2001, 2.75% 10/1/14 (e) | | 3,000 | | 3,102 |
Municipal Bonds - continued |
| Principal Amount (000s) | | Value (000s) |
Nevada - continued |
Nevada Gen. Oblig.: | | | | |
Series 2010 C, 5% 6/1/19 | | $ 12,140 | | $ 14,694 |
Series 2012 B, 5% 8/1/20 | | 2,230 | | 2,728 |
| | 91,577 |
New Hampshire - 0.3% |
New Hampshire Health & Ed. Facilities Auth. Rev. Series 2012: | | | | |
4% 7/1/20 | | 2,705 | | 2,988 |
4% 7/1/21 | | 1,520 | | 1,674 |
New Hampshire Tpk. Sys. Rev. Series 2012 B: | | | | |
5% 2/1/17 | | 3,000 | | 3,464 |
5% 2/1/18 | | 2,500 | | 2,953 |
| | 11,079 |
New Jersey - 3.2% |
New Jersey Ctfs. of Prtn.: | | | | |
Series 2008 A, 5% 6/15/15 | | 750 | | 820 |
Series 2009 A: | | | | |
5% 6/15/15 | | 11,285 | | 12,305 |
5% 6/15/16 | | 6,500 | | 7,248 |
New Jersey Econ. Dev. Auth. School Facilities Construction Rev.: | | | | |
Bonds Series 2008 J4, 5%, tender 9/1/14 (FSA Insured) (b) | | 7,000 | | 7,460 |
Series 2001 A, 5.5% 6/15/13 (Escrowed to Maturity) | | 1,090 | | 1,116 |
Series 2005 K, 5.25% 12/15/14 (FGIC Insured) (Nat'l. Pub. Fin. Guarantee Corp. Insured) | | 1,790 | | 1,949 |
Series 2005 O, 5% 3/1/20 (Pre-Refunded to 3/1/15 @ 100) | | 6,350 | | 6,974 |
Series 2008 W, 5% 3/1/15 | | 10,400 | | 11,333 |
Series 2009 BB, 5% 9/1/15 | | 3,390 | | 3,753 |
Series 2011 EE, 5% 9/1/20 | | 5,000 | | 6,092 |
Series 2012 G, 0.71% 2/1/15 (b) | | 7,800 | | 7,807 |
Series 2012 II, 5% 3/1/21 | | 6,800 | | 8,209 |
Series 2012: | | | | |
5% 6/15/13 | | 2,200 | | 2,243 |
5% 6/15/18 | | 10,600 | | 12,133 |
New Jersey Gen. Oblig. Series O, 5.25% 8/1/22 | | 3,930 | | 5,038 |
New Jersey Higher Ed. Student Assistance Auth. Student Ln. Rev. Series 2010 1A, 5% 12/1/15 | | 4,500 | | 4,976 |
New Jersey Tpk. Auth. Tpk. Rev.: | | | | |
Bonds Series 2012 A, 0.88%, tender 12/22/14 (b) | | 15,400 | | 15,449 |
Municipal Bonds - continued |
| Principal Amount (000s) | | Value (000s) |
New Jersey - continued |
New Jersey Tpk. Auth. Tpk. Rev.: - continued | | | | |
Series 1991 C, 6.5% 1/1/16 (Escrowed to Maturity) | | $ 3,315 | | $ 3,644 |
New Jersey Trans. Trust Fund Auth.: | | | | |
Series 2003 A, 5.5% 12/15/16 (FSA Insured) | | 5,000 | | 5,867 |
Series 2003 B. 5.25% 12/15/19 | | 3,000 | | 3,677 |
New Jersey Transit Corp. Ctfs. of Prtn. Series 2003 A, 5.25% 9/15/13 (AMBAC Insured) | | 1,940 | | 2,000 |
Toms River Gen. Oblig. 2% 12/27/13 | | 10,574 | | 10,720 |
| | 140,813 |
New Mexico - 1.1% |
Farmington Poll. Cont. Rev. Bonds (Southern California Edison Co. Four Corners Proj.) Series 2005 B, 2.875%, tender 4/1/15 (b) | | 22,100 | | 22,991 |
New Mexico Edl. Assistance Foundation: | | | | |
Series 2009 B, 4% 9/1/16 | | 7,000 | | 7,634 |
Series 2010 A1: | | | | |
4% 12/1/15 | | 3,700 | | 3,986 |
4% 12/1/16 | | 6,750 | | 7,383 |
Rio Rancho Wtr. & Wastewtr. Sys. Rev. Series 2009, 5% 5/15/17 (FSA Insured) | | 4,480 | | 5,197 |
| | 47,191 |
New York - 11.2% |
Dutchess County Local Dev. Corp. Rev. (Health Quest Systems, Inc. Proj.) Series 2010 A: | | | | |
5% 7/1/18 (Assured Guaranty Corp. Insured) (FSA Insured) | | 1,100 | | 1,262 |
5% 7/1/19 (Assured Guaranty Corp. Insured) (FSA Insured) | | 640 | | 741 |
Long Island Pwr. Auth. Elec. Sys. Rev.: | | | | |
Series 2003 B, 5.25% 6/1/14 | | 2,000 | | 2,123 |
Series 2010 A, 5% 5/1/15 | | 5,000 | | 5,465 |
Metropolitan Trans. Auth. Svc. Contract Rev. Series 2002 A, 5.5% 7/1/17 | | 5,000 | | 5,957 |
New York City Gen. Oblig.: | | | | |
Series 2005 F1, 5% 9/1/15 | | 3,560 | | 3,967 |
Series 2009 C: | | | | |
5% 8/1/13 | | 6,445 | | 6,623 |
5% 8/1/13 (Escrowed to Maturity) | | 555 | | 570 |
Series B, 5% 8/1/14 | | 10,000 | | 10,705 |
Series G, 5.625% 8/1/13 (Nat'l. Pub. Fin. Guarantee Corp. Insured) | | 50 | | 50 |
Municipal Bonds - continued |
| Principal Amount (000s) | | Value (000s) |
New York - continued |
New York City Transitional Fin. Auth. Rev.: | | | | |
Series 2003 B, 5% 2/1/20 | | $ 3,000 | | $ 3,736 |
Series 2010 B: | | | | |
5% 11/1/17 | | 20,305 | | 24,206 |
5% 11/1/17 (Escrowed to Maturity) | | 9,695 | | 11,598 |
5% 11/1/20 | | 5,950 | | 7,454 |
Series 2010 D: | | | | |
5% 11/1/15 (Escrowed to Maturity) | | 890 | | 1,004 |
5% 11/1/17 | | 10,115 | | 12,058 |
Series 2012 A: | | | | |
5% 11/1/17 | | 7,000 | | 8,345 |
5% 11/1/20 | | 4,500 | | 5,662 |
New York Dorm. Auth. Mental Health Svcs. Facilities Impt. Rev.: | | | | |
(State Univ. Proj.) Series 2012 A, 5% 5/15/20 | | 4,000 | | 4,913 |
Series 2012 A, 4% 5/15/20 | | 8,000 | | 9,274 |
New York Dorm. Auth. Personal Income Tax Rev.: | | | | |
(Ed. Proj.) Series 2009 A: | | | | |
5% 3/15/13 | | 3,545 | | 3,579 |
5% 3/15/14 | | 3,745 | | 3,956 |
5% 3/15/15 | | 4,000 | | 4,393 |
Series 2009 D: | | | | |
5% 6/15/14 | | 9,890 | | 10,558 |
5% 6/15/15 | | 16,075 | | 17,820 |
5% 6/15/16 | | 9,330 | | 10,694 |
Series 2010 A, 5% 2/15/14 (Escrowed to Maturity) | | 10 | | 11 |
Series 2012 A, 5% 12/15/20 | | 8,500 | | 10,613 |
Series A: | | | | |
5% 2/15/14 | | 9,840 | | 10,356 |
5% 2/15/15 | | 8,775 | | 9,606 |
5% 2/15/15 (Escrowed to Maturity) | | 5 | | 5 |
New York Dorm. Auth. Revs.: | | | | |
(City Univ. Sys. Consolidation Proj.) Series A: | | | | |
5.75% 7/1/13 | | 955 | | 981 |
5.75% 7/1/13 | | 270 | | 277 |
(Mental Health Svcs. Facilities Proj.): | | | | |
Series 2008 D: | | | | |
5% 2/15/14 | | 7,295 | | 7,668 |
5% 8/15/14 | | 7,755 | | 8,322 |
Series 2009 A1, 5% 2/15/15 | | 9,000 | | 9,801 |
(New York Univ. Hosp. Ctr. Proj.) Series 2011 A, 5% 7/1/18 | | 3,240 | | 3,763 |
Municipal Bonds - continued |
| Principal Amount (000s) | | Value (000s) |
New York - continued |
New York Dorm. Auth. Revs.: - continued | | | | |
(St. Lawrence Univ.) Series 2008, 5% 7/1/14 (Escrowed to Maturity) | | $ 3,700 | | $ 3,959 |
Series 2008 B, 5% 7/1/15 | | 30,000 | | 33,260 |
Series 2008 D, 5.25% 8/15/17 (FSA Insured) | | 7,000 | | 8,314 |
Series 2009 A: | | | | |
5% 7/1/15 | | 12,850 | | 14,202 |
5% 7/1/16 | | 8,390 | | 9,526 |
New York Local Govt. Assistance Corp. Series 2003 A, 5% 4/1/18 | | 12,400 | | 14,997 |
New York Metropolitan Trans. Auth. Dedicated Tax Fund Rev.: | | | | |
Bonds Series 2008 B, 0.36%, tender 11/1/14 (b) | | 6,000 | | 5,989 |
Series B: | | | | |
5% 11/15/14 | | 1,350 | | 1,465 |
5% 11/15/15 | | 2,325 | | 2,611 |
New York Metropolitan Trans. Auth. Rev.: | | | | |
Bonds: | | | | |
Series 2012 G1, 0.563%, tender 11/1/14 (b) | | 6,800 | | 6,796 |
Series 2012 G2, 0.673%, tender 11/1/15 (b) | | 13,300 | | 13,288 |
Series 2003 B: | | | | |
5.25% 11/15/17 (Pre-Refunded to 11/15/13 @ 100) | | 1,040 | | 1,083 |
5.25% 11/15/19 (Nat'l. Pub. Fin. Guarantee Corp. Insured) | | 5,200 | | 6,384 |
Series 2008 B2: | | | | |
5% 11/15/19 | | 6,185 | | 7,493 |
5% 11/15/20 | | 5,500 | | 6,677 |
5% 11/15/21 | | 4,000 | | 4,883 |
Series 2010 B2, 4% 11/15/14 | | 2,830 | | 3,012 |
Series 2012 D, 5% 11/15/18 | | 2,515 | | 3,000 |
Series 2012 E: | | | | |
4% 11/15/19 | | 4,000 | | 4,588 |
5% 11/15/18 | | 2,250 | | 2,683 |
5% 11/15/21 | | 2,435 | | 2,973 |
Series 2012 F, 5% 11/15/19 | | 5,000 | | 6,057 |
New York State Dorm. Auth. Lease Rev. Bonds Series 2003 B, 5.25%, tender 7/1/13 (b) | | 3,000 | | 3,071 |
New York Thruway Auth. Second Gen. Hwy. & Bridge Trust Fund: | | | | |
Series 2008 A, 5% 4/1/13 | | 2,600 | | 2,630 |
Series 2010 A, 5% 4/1/17 | | 1,000 | | 1,165 |
Municipal Bonds - continued |
| Principal Amount (000s) | | Value (000s) |
New York - continued |
New York Thruway Auth. Second Gen. Hwy. & Bridge Trust Fund: - continued | | | | |
Series 2011 A1: | | | | |
5% 4/1/17 | | $ 1,500 | | $ 1,747 |
5% 4/1/18 | | 3,500 | | 4,164 |
New York Urban Dev. Corp. Rev.: | | | | |
Series 2009 C, 5% 12/15/16 | | 17,000 | | 19,812 |
Series 2011 A, 5% 3/15/21 | | 18,425 | | 23,043 |
Tobacco Settlement Fing. Corp. Series 2011, 5% 6/1/16 | | 20,000 | | 22,652 |
Triborough Bridge & Tunnel Auth. Revs. Series Y, 5.5% 1/1/17 (Escrowed to Maturity) | | 6,470 | | 7,043 |
| | 486,683 |
New York & New Jersey - 0.1% |
Port Auth. of New York & New Jersey 124th Series, 5% 8/1/13 (Nat'l. Pub. Fin. Guarantee Corp. Insured) (e) | | 1,200 | | 1,204 |
Port Auth. of New York & New Jersey Spl. Oblig. Rev. (JFK Int'l. Air Term. Spl. Proj.) Series 6, 6.25% 12/1/13 (Nat'l. Pub. Fin. Guarantee Corp. Insured) (e) | | 4,100 | | 4,257 |
| | 5,461 |
North Carolina - 2.0% |
Dare County Ctfs. of Prtn. Series 2012 B: | | | | |
4% 6/1/17 | | 1,000 | | 1,118 |
4% 6/1/18 | | 1,280 | | 1,461 |
4% 6/1/20 | | 1,000 | | 1,159 |
5% 6/1/19 | | 1,305 | | 1,586 |
Mecklenburg County Pub. Facilities Corp. Series 2009: | | | | |
5% 3/1/16 | | 5,870 | | 6,659 |
5% 3/1/18 | | 1,500 | | 1,804 |
Nash Health Care Sys. Health Care Facilities Rev. Series 2003: | | | | |
5% 11/1/13 (FSA Insured) | | 1,500 | | 1,551 |
5% 11/1/15 (FSA Insured) | | 1,600 | | 1,730 |
North Carolina Eastern Muni. Pwr. Agcy. Pwr. Sys. Rev.: | | | | |
Series 2008 A, 5% 1/1/13 | | 2,200 | | 2,200 |
Series 2010 A: | | | | |
5% 1/1/15 | | 4,000 | | 4,339 |
5% 1/1/16 | | 6,035 | | 6,754 |
Series 2012 D, 5% 1/1/14 | | 3,000 | | 3,135 |
North Carolina Grant Anticipation Rev. Series 2009, 5% 3/1/15 | | 1,250 | | 1,369 |
Municipal Bonds - continued |
| Principal Amount (000s) | | Value (000s) |
North Carolina - continued |
North Carolina Med. Care Commission Hosp. Rev. (North Carolina Baptist Hosp. Proj.) Series 2010: | | | | |
5% 6/1/15 | | $ 1,500 | | $ 1,653 |
5% 6/1/16 | | 1,000 | | 1,134 |
5% 6/1/17 | | 3,220 | | 3,738 |
5% 6/1/18 | | 3,820 | | 4,532 |
North Carolina Muni. Pwr. Agcy. #1 Catawba Elec. Rev.: | | | | |
Series 1998 A, 5.5% 1/1/15 (Nat'l. Pub. Fin. Guarantee Corp. Insured) | | 3,675 | | 4,023 |
Series 2008 A, 5.25% 1/1/20 | | 2,000 | | 2,375 |
Series 2012 A, 5% 1/1/18 | | 18,685 | | 21,907 |
Univ. of North Carolina at Chapel Hill Rev. Bonds Series 2012 A, 0.593%, tender 12/1/15 (b) | | 11,500 | | 11,530 |
| | 85,757 |
North Dakota - 0.0% |
Grand Forks Health Care Sys. Rev. (Altru Health Sys. Proj.) Series 2005, 5% 12/1/15 (Assured Guaranty Corp. Insured) | | 1,825 | | 1,998 |
Ohio - 2.3% |
Buckeye Tobacco Settlement Fing. Auth. Series 2007 A1: | | | | |
5% 6/1/16 | | 3,035 | | 3,339 |
5% 6/1/17 | | 3,500 | | 3,941 |
Cincinnati City School District 5.25% 12/1/18 (Nat'l. Pub. Fin. Guarantee Corp. Insured) | | 3,555 | | 4,331 |
Columbus City School District (School Facilities Construction and Impt. Proj.) Series 2009 B, 4% 12/1/16 | | 1,000 | | 1,116 |
Hamilton County Student Hsg. Rev. (Stratford Heights Proj.) Series 2010: | | | | |
5% 6/1/15 (FSA Insured) | | 760 | | 818 |
5% 6/1/16 (FSA Insured) | | 1,105 | | 1,222 |
5% 6/1/17 (FSA Insured) | | 1,160 | | 1,304 |
Ohio Air Quality Dev. Auth. Rev.: | | | | |
Bonds (Ohio Pwr. Co. Proj.) Series 2010 A, 3.25%, tender 6/2/14 (b) | | 5,500 | | 5,657 |
Series 2009 C, 5.625% 6/1/18 | | 1,395 | | 1,629 |
Ohio Bldg. Auth.: | | | | |
(Administrative Bldg. Fund Proj.): | | | | |
Series 2009 B: | | | | |
5% 10/1/14 | | 5,955 | | 6,423 |
5% 10/1/15 | | 6,505 | | 7,275 |
Municipal Bonds - continued |
| Principal Amount (000s) | | Value (000s) |
Ohio - continued |
Ohio Bldg. Auth.: - continued | | | | |
(Administrative Bldg. Fund Proj.): | | | | |
Series 2010 C: | | | | |
4% 10/1/15 | | $ 3,200 | | $ 3,483 |
5% 10/1/16 | | 1,250 | | 1,435 |
(Adult Correctional Bldg. Fund Proj.): | | | | |
Series 2009 B: | | | | |
5% 10/1/14 | | 2,055 | | 2,217 |
5% 10/1/15 | | 4,535 | | 5,071 |
Series 2010 A, 5% 10/1/15 | | 1,185 | | 1,322 |
Ohio Gen. Oblig.: | | | | |
(Common Schools Proj.) Series 2010 A, 5% 9/15/17 | | 2,600 | | 3,073 |
(Higher Ed. Proj.): | | | | |
Series 2005 C, 5% 8/1/13 | | 4,495 | | 4,619 |
Series 2010 A, 5% 8/1/17 | | 3,290 | | 3,875 |
Series 2011 A, 5% 8/1/17 | | 3,070 | | 3,616 |
Series 2012 C, 5% 9/15/21 | | 4,350 | | 5,486 |
Ohio Higher Edl. Facility Commission Rev.: | | | | |
(Cleveland Clinic Foundation Proj.) Series 2008 A, 5% 1/1/15 | | 2,000 | | 2,175 |
(Univ. Hosp. Health Sys. Proj.) Series 2010 A: | | | | |
5% 1/15/15 | | 500 | | 537 |
5% 1/15/17 | | 1,000 | | 1,120 |
Ohio State Univ. Gen. Receipts Series 2010 A: | | | | |
5% 12/1/16 | | 4,720 | | 5,495 |
5% 12/1/16 (Escrowed to Maturity) | | 280 | | 327 |
Ohio Wtr. Dev. Auth. Poll. Cont. Facilities Rev. Bonds: | | | | |
(First Energy Nuclear Generation Corp. Proj.) Series 2005 B, 3.375%, tender 7/1/15 (b) | | 5,000 | | 5,153 |
(FirstEnergy Corp. Proj.) Series 2009 A, 5.875%, tender 6/1/16 (b) | | 10,225 | | 11,434 |
Ross County Hosp. Facilities Rev. (Adena Health Sys. Proj.) Series 2008: | | | | |
5% 12/1/13 | | 875 | | 906 |
5% 12/1/14 | | 2,275 | | 2,434 |
| | 100,833 |
Oklahoma - 0.2% |
Oklahoma Dev. Fin. Auth. (Pub. Svc. Co. of Oklahoma Proj.) Series 2009, 5.25% 6/1/14 | | 2,700 | | 2,850 |
Municipal Bonds - continued |
| Principal Amount (000s) | | Value (000s) |
Oklahoma - continued |
Oklahoma Dev. Fin. Auth. Health Sys. Rev. (Integris Baptist Med. Ctr. Proj.) Series 2008 B, 5% 8/15/14 | | $ 1,660 | | $ 1,770 |
Tulsa County Indl. Auth. Edl. Facilities Lease Rev. (Jenks Pub. Schools Proj.) Series 2009, 5.5% 9/1/18 | | 5,215 | | 6,358 |
| | 10,978 |
Oregon - 0.3% |
Clackamas County Hosp. Facility Auth. Bonds (Legacy Health Sys. Proj.) Series 2009 C, 5%, tender 7/15/14 (b) | | 2,500 | | 2,640 |
Gilliam County Solid Waste Disp. Rev. Bonds (Waste Mgmt., Inc. Proj.) Series 2000 A, 3.5%, tender 5/1/13 (b)(e) | | 5,300 | | 5,352 |
Oregon Facilities Auth. Rev. (Legacy Health Sys. Proj.) Series 2009 A: | | | | |
5% 3/15/13 | | 1,000 | | 1,009 |
5% 3/15/14 | | 595 | | 623 |
5% 3/15/15 | | 2,500 | | 2,709 |
5% 3/15/16 | | 1,750 | | 1,949 |
| | 14,282 |
Pennsylvania - 4.1% |
Allegheny County Arpt. Auth. Rev. Series A: | | | | |
5% 1/1/14 (FSA Insured) (e) | | 1,350 | | 1,390 |
5% 1/1/15 (FSA Insured) (e) | | 1,000 | | 1,066 |
5% 1/1/16 (FSA Insured) (e) | | 1,000 | | 1,091 |
Allegheny County Hosp. Dev. Auth. Rev.: | | | | |
(Pittsburgh Med. Ctr. Proj.) Series 2008 B, 5% 6/15/14 | | 1,385 | | 1,476 |
(Univ. of Pittsburgh Med. Ctr. Proj.) Series 2009 A: | | | | |
4% 8/15/15 | | 1,385 | | 1,502 |
5% 8/15/14 | | 1,955 | | 2,099 |
Beaver County Indl. Dev. Auth. Poll. Cont. Rev. Bonds (FirstEnergy Nuclear Generation Corp. Proj.) Series 2005 A, 3.375%, tender 7/1/15 (b) | | 2,000 | | 2,061 |
Econ. Dev. Fin. Auth. Unemployment Compensation Rev. Series 2012 B: | | | | |
5% 1/1/22 | | 5,000 | | 5,848 |
5% 7/1/22 | | 5,200 | | 5,927 |
5% 1/1/23 | | 3,000 | | 3,365 |
5% 7/1/23 | | 1,650 | | 1,822 |
Municipal Bonds - continued |
| Principal Amount (000s) | | Value (000s) |
Pennsylvania - continued |
Franklin County Indl. Dev. Auth. (The Chambersburg Hosp. Proj.) Series 2010: | | | | |
5% 7/1/16 | | $ 1,000 | | $ 1,098 |
5% 7/1/17 | | 1,255 | | 1,389 |
Montgomery County Indl. Dev. Series 2012 A, 3% 10/1/13 | | 1,650 | | 1,681 |
Montgomery County Higher Ed. & Health Auth. Hosp. Rev. (Abington Memorial Hosp. Proj.) Series 2009 A, 5% 6/1/17 | | 2,200 | | 2,515 |
Pennsylvania Econ. Dev. Auth. Governmental Lease (Forum Place Proj.) Series 2012: | | | | |
5% 3/1/18 | | 2,455 | | 2,830 |
5% 3/1/19 | | 2,310 | | 2,705 |
5% 3/1/20 | | 2,140 | | 2,530 |
Pennsylvania Gen. Oblig. Series 2011, 5% 7/1/21 | | 1,900 | | 2,402 |
Pennsylvania Intergovernmental Coop. Auth. Spl. Tax Rev. (City of Philadelphia Fdg. Prog.) Series 2009, 5% 6/15/15 | | 10,600 | | 11,709 |
Pennsylvania Tpk. Commission Tpk. Rev. Series 2009 B, 5% 12/1/17 | | 12,500 | | 14,731 |
Philadelphia Gas Works Rev. (1998 Gen. Ordinance Proj.) Eighth Series A, 5% 8/1/15 | | 2,100 | | 2,306 |
Philadelphia Gen. Oblig.: | | | | |
Series 2008 A: | | | | |
5% 12/15/14 (FSA Insured) | | 5,370 | | 5,799 |
5% 12/15/15 (FSA Insured) | | 5,000 | | 5,544 |
5% 12/15/16 (FSA Insured) | | 7,275 | | 8,265 |
Series 2011: | | | | |
5.25% 8/1/17 | | 6,165 | | 7,025 |
5.25% 8/1/18 | | 5,515 | | 6,352 |
Philadelphia School District Series 2010 C, 5% 9/1/16 | | 13,610 | | 15,408 |
Philadelphia Wtr. & Wastewtr. Rev. Series 2010 A: | | | | |
5% 6/15/15 | | 15,000 | | 16,501 |
5% 6/15/16 | | 6,000 | | 6,796 |
Pittsburgh & Allegheny County Sports & Exhibition Auth. Series 2010: | | | | |
5% 2/1/15 (FSA Insured) | | 4,580 | | 4,928 |
5% 2/1/16 (FSA Insured) | | 5,620 | | 6,211 |
Pittsburgh School District: | | | | |
Series 2009 A, 3% 9/1/14 (Assured Guaranty Corp. Insured) | | 1,640 | | 1,706 |
Series 2010 A: | | | | |
4% 9/1/15 (FSA Insured) | | 1,450 | | 1,561 |
Municipal Bonds - continued |
| Principal Amount (000s) | | Value (000s) |
Pennsylvania - continued |
Pittsburgh School District: - continued | | | | |
Series 2010 A: | | | | |
5% 9/1/16 (FSA Insured) | | $ 1,685 | | $ 1,904 |
Saint Mary Hosp. Auth. Health Sys. Rev. (Catholic Health East Proj.) Series 2010 B: | | | | |
5% 11/15/13 | | 2,465 | | 2,550 |
5% 11/15/14 | | 4,690 | | 5,026 |
5% 11/15/15 | | 2,420 | | 2,667 |
Southeastern Pennsylvania Trans. Auth. Rev. Series 2011: | | | | |
5% 6/1/18 | | 1,000 | | 1,168 |
5% 6/1/19 | | 200 | | 237 |
State Pub. School Bldg. Auth. Lease Rev. (Philadelphia School District Proj.) Series 2012: | | | | |
5% 4/1/14 | | 1,000 | | 1,052 |
5% 4/1/19 | | 1,305 | | 1,535 |
5% 4/1/20 | | 1,250 | | 1,479 |
5% 4/1/21 | | 1,000 | | 1,186 |
Unionville-Chadds Ford School District Gen. Oblig. Series 2009, 5% 6/1/20 | | 1,190 | | 1,453 |
| | 179,896 |
Puerto Rico - 0.4% |
Puerto Rico Commonwealth Aqueduct & Swr. Auth. Series 2012 A, 5% 7/1/21 | | 6,000 | | 5,984 |
Puerto Rico Infrastructure Fin. Bonds (Port Auth. Proj.) Series 2011 C, 2.75%, tender 6/15/13 (b)(e) | | 9,600 | | 9,636 |
| | 15,620 |
Rhode Island - 0.2% |
Rhode Island Econ. Dev. Corp. Rev. (Dept. of Trans. Proj.) Series 2009 A: | | | | |
5% 6/15/15 (Assured Guaranty Corp. Insured) | | 2,010 | | 2,203 |
5% 6/15/16 (Assured Guaranty Corp. Insured) | | 6,625 | | 7,463 |
| | 9,666 |
South Carolina - 0.5% |
Lexington County Health Svcs. District, Inc. Hosp. Rev. Series 2011, 5% 11/1/19 | | 1,190 | | 1,427 |
South Carolina Pub. Svc. Auth. (Santee Cooper) Rev. Oblig.: | | | | |
Series 2012 B: | | | | |
5% 12/1/17 | | 2,000 | | 2,364 |
5% 12/1/20 | | 1,000 | | 1,242 |
Municipal Bonds - continued |
| Principal Amount (000s) | | Value (000s) |
South Carolina - continued |
South Carolina Pub. Svc. Auth. (Santee Cooper) Rev. Oblig.: - continued | | | | |
Series 2012 C: | | | | |
5% 12/1/13 | | $ 2,400 | | $ 2,501 |
5% 12/1/17 | | 10,535 | | 12,454 |
| | 19,988 |
South Dakota - 0.2% |
South Dakota Health & Edl. Facilities Auth. Rev.: | | | | |
(Reg'l. Health Proj.) Series 2010: | | | | |
5% 9/1/14 | | 625 | | 668 |
5% 9/1/15 | | 680 | | 749 |
5% 9/1/16 | | 500 | | 564 |
5% 9/1/17 | | 490 | | 562 |
Series 2011: | | | | |
5% 9/1/17 | | 1,100 | | 1,261 |
5% 9/1/18 | | 1,200 | | 1,395 |
5% 9/1/19 | | 1,255 | | 1,472 |
| | 6,671 |
Tennessee - 0.5% |
Jackson Hosp. Rev. (Jackson-Madison County Gen. Hosp. Proj.) Series 2008, 5% 4/1/13 | | 1,000 | | 1,010 |
Knox County Health Edl. & Hsg. Facilities Series 2012 A: | | | | |
5% 1/1/19 | | 1,925 | | 2,232 |
5% 1/1/20 | | 2,500 | | 2,918 |
5% 1/1/21 | | 2,500 | | 2,928 |
Memphis Elec. Sys. Rev. 5% 12/1/14 | | 5,000 | | 5,442 |
Memphis-Shelby County Arpt. Auth. Arpt. Rev. Series 2010 B, 5% 7/1/16 (e) | | 1,730 | | 1,945 |
Metropolitan Nashville Arpt. Auth. Rev. Series 2010 A: | | | | |
5% 7/1/16 | | 1,815 | | 2,018 |
5% 7/1/17 | | 1,100 | | 1,248 |
Shelby County Health Edl. & Hsg. Facilities Board Rev. Series 2004 A, 5% 9/1/15 | | 3,125 | | 3,459 |
| | 23,200 |
Texas - 7.7% |
Austin Cmnty. College District Pub. Facilities Lease Rev. (Round Rock Campus Proj.) Series 2008, 5.25% 8/1/15 | | 2,585 | | 2,866 |
Municipal Bonds - continued |
| Principal Amount (000s) | | Value (000s) |
Texas - continued |
Austin Convention Enterprises, Inc. (Convention Ctr. Proj.): | | | | |
Series 2006 A, 6% 1/1/14 | | $ 1,420 | | $ 1,469 |
Series 2006 B, 6% 1/1/13 | | 1,270 | | 1,270 |
Austin Elec. Util. Sys. Rev.: | | | | |
Series A, 5% 11/15/15 | | 1,000 | | 1,126 |
0% 5/15/18 (Nat'l. Pub. Fin. Guarantee Corp. Insured) | | 4,500 | | 4,008 |
Austin Independent School District Series 2004, 5% 8/1/17 | | 1,450 | | 1,716 |
Austin Wtr. & Wastewtr. Sys. Rev. Series 2009 A, 5% 11/15/15 | | 2,250 | | 2,531 |
Brownsville Util. Sys. Rev. Series 2008 A, 5% 9/1/15 (FSA Insured) | | 2,665 | | 2,946 |
Carroll Independent School District Series 2009 C, 5.25% 2/15/19 | | 1,000 | | 1,242 |
Corpus Christi Independent School District 4% 8/15/14 | | 10,140 | | 10,730 |
Dallas Fort Worth Int'l. Arpt. Rev. Series 2009 A: | | | | |
5% 11/1/14 | | 2,500 | | 2,705 |
5% 11/1/15 | | 5,000 | | 5,599 |
Dallas Wtrwks. & Swr. Sys. Rev. Series 2011, 5% 10/1/18 | | 1,600 | | 1,953 |
Fort Worth Independent School District Series 2009, 5% 2/15/16 | | 3,690 | | 4,186 |
Frisco Gen. Oblig. Series 2004, 5.25% 2/15/14 (Nat'l. Pub. Fin. Guarantee Corp. Insured) | | 1,380 | | 1,456 |
Grapevine Gen. Oblig.: | | | | |
Series 2009 A, 5% 2/15/15 | | 2,215 | | 2,418 |
Series 2009, 5% 2/15/16 | | 1,375 | | 1,554 |
Harris County Cultural Ed. Facilities Fin. Corp. Thermal Util. Rev. (TECO Proj.) Series 2009 A: | | | | |
5% 11/15/14 | | 1,000 | | 1,072 |
5% 11/15/16 | | 500 | | 568 |
Harris County Gen. Oblig.: | | | | |
(Road Proj.) Series 2008 B: | | | | |
5% 8/15/13 | | 1,000 | | 1,029 |
5% 8/15/14 | | 1,075 | | 1,155 |
Bonds Series 2012 B, 0.72%, tender 8/15/15 (b) | | 10,470 | | 10,479 |
Series 2012 A, 0.56% 8/15/15 (b) | | 1,300 | | 1,302 |
Houston Arpt. Sys. Rev.: | | | | |
Series 2011 A, 5% 7/1/17 (e) | | 7,380 | | 8,533 |
Series A: | | | | |
5% 7/1/15 | | 2,070 | | 2,293 |
Municipal Bonds - continued |
| Principal Amount (000s) | | Value (000s) |
Texas - continued |
Houston Arpt. Sys. Rev.: - continued | | | | |
Series A: | | | | |
5% 7/1/16 | | $ 1,080 | | $ 1,233 |
Houston Gen. Oblig.: | | | | |
Series 2004 A, 5.25% 3/1/14 (Nat'l. Pub. Fin. Guarantee Corp. Insured) | | 2,855 | | 3,018 |
Series A, 5% 3/1/13 (Nat'l. Pub. Fin. Guarantee Corp. Insured) | | 7,500 | | 7,557 |
Houston Independent School District: | | | | |
Bonds Series 2012: | | | | |
1.5%, tender 6/1/13 (b) | | 8,745 | | 8,785 |
2%, tender 6/1/14 (b) | | 5,850 | | 5,966 |
Series 2005 A, 0% 2/15/16 | | 4,500 | | 4,385 |
Houston Util. Sys. Rev. Bonds Series 2012 C, 0.73%, tender 8/1/16 (b) | | 9,200 | | 9,214 |
Humble Independent School District Series 2009, 4% 2/15/13 | | 400 | | 402 |
Keller Independent School District 5% 2/15/14 | | 3,750 | | 3,944 |
Klein Independent School District Series 2009 A, 5% 8/1/16 | | 2,195 | | 2,523 |
Leander Independent School District Series 2001, 6% 8/15/14 (Escrowed to Maturity) | | 1,850 | | 2,020 |
Lewisville Independent School District Series 2009, 5% 8/15/17 | | 1,170 | | 1,378 |
Lone Star College Sys. Gen. Oblig. Series 2010 A, 5% 8/15/22 | | 2,500 | | 2,508 |
Lower Colorado River Auth. Rev.: | | | | |
Series 2010, 5% 5/15/17 | | 2,805 | | 3,249 |
Series 2012 A, 4% 5/15/14 | | 1,575 | | 1,651 |
5% 5/15/15 | | 2,120 | | 2,334 |
5% 5/15/15 (Escrowed to Maturity) | | 5 | | 6 |
5% 5/15/16 | | 2,355 | | 2,670 |
5% 5/15/16 (Escrowed to Maturity) | | 5 | | 6 |
Lower Colorado River Auth. Transmission Contract Rev. (LCRA Transmission Svcs. Corp. Proj.) Series 2010, 5% 5/15/18 | | 3,140 | | 3,722 |
Lubbock Gen. Oblig. Series 2005, 5% 2/15/13 (Nat'l. Pub. Fin. Guarantee Corp. Insured) | | 1,850 | | 1,860 |
Lubbock Health Facilities Dev. Corp. Rev. (St. Joseph Health Sys. Proj.) Series 2008 B: | | | | |
5% 7/1/17 | | 2,800 | | 3,197 |
5% 7/1/18 | | 3,030 | | 3,523 |
Mansfield Independent School District Series 2009, 4% 2/15/17 | | 1,840 | | 2,067 |
Municipal Bonds - continued |
| Principal Amount (000s) | | Value (000s) |
Texas - continued |
Mission Econ. Dev. Corp. Solid Waste Disp. Rev. Bonds (Republic Svcs., Inc. Proj.) Series 2008 A, 0.45%, tender 1/2/13 (b) | | $ 8,900 | | $ 8,900 |
North Texas Tollway Auth. Rev.: | | | | |
Bonds: | | | | |
Series 2008 H2, 5%, tender 1/1/13 (b) | | 5,000 | | 5,000 |
Series 2012 C, 1.95%, tender 1/1/19 (b) | | 8,500 | | 8,543 |
Series 2010 B1, 3.2% 1/1/13 | | 2,275 | | 2,275 |
Northside Independent School District Bonds: | | | | |
1%, tender 6/1/16 (b) | | 20,000 | | 19,920 |
1.2%, tender 8/1/17 (b) | | 30,000 | | 29,880 |
Sam Rayburn Muni. Pwr. Agcy. Series 2012: | | | | |
5% 10/1/13 | | 4,065 | | 4,193 |
5% 10/1/20 | | 1,000 | | 1,182 |
San Antonio Elec. & Gas Sys. Rev. Bonds Series 2012 A, 2%, tender 12/1/14 (b) | | 8,370 | | 8,594 |
San Antonio Pub. Facilities Corp. and Rfdg. Lease (Convention Ctr. Proj.) Series 2012: | | | | |
5% 9/15/20 | | 1,000 | | 1,223 |
5% 9/15/21 | | 1,000 | | 1,231 |
5% 9/15/22 | | 3,440 | | 4,250 |
San Antonio Wtr. Sys. Rev. Series 2012: | | | | |
4% 5/15/19 | | 1,500 | | 1,757 |
5% 5/15/20 | | 6,000 | | 7,502 |
5% 5/15/21 | | 5,000 | | 6,330 |
San Jacinto Cmnty. College District Series 2009: | | | | |
5% 2/15/15 | | 2,220 | | 2,416 |
5% 2/15/15 (Escrowed to Maturity) | | 280 | | 307 |
5% 2/15/16 | | 2,000 | | 2,247 |
Southwest Higher Ed. Auth. Rev. (Southern Methodist Univ. Proj.) Series 2009, 5% 10/1/16 | | 5,795 | | 6,637 |
Tarrant County Cultural Ed. Facilities Fin. Corp. Rev. (Christus Health Proj.) Series 2008 A, 5.75% 7/1/18 (Assured Guaranty Corp. Insured) | | 4,265 | | 4,591 |
Texas Gen. Oblig. Series B, 0% 10/1/13 | | 6,500 | | 6,485 |
Texas Muni. Pwr. Agy. Rev. Series 2010: | | | | |
4% 9/1/14 | | 1,000 | | 1,049 |
5% 9/1/15 | | 835 | | 919 |
5% 9/1/16 | | 750 | | 847 |
Texas Pub. Fin. Auth. Rev. Series 2010 A, 5% 1/1/16 | | 7,865 | | 8,874 |
Texas Trans. Commission Central Texas Tpk. Sys. Rev. Bonds Series 2012 B, 1.25%, tender 2/15/15 (b) | | 6,300 | | 6,318 |
Municipal Bonds - continued |
| Principal Amount (000s) | | Value (000s) |
Texas - continued |
Texas Trans. Commission State Hwy. Fund Rev. Series 2007, 5% 4/1/25 | | $ 2,200 | | $ 2,553 |
Tomball Independent School District 5% 2/15/17 (Assured Guaranty Corp. Insured) | | 1,105 | | 1,274 |
Trinity River Auth. Reg'l. Wastewtr. Sys. Rev. Series 2008, 5% 8/1/13 | | 6,135 | | 6,304 |
Univ. of North Texas Univ. Rev. Series A, 5% 4/15/14 | | 1,000 | | 1,059 |
Univ. of Texas Board of Regents Sys. Rev.: | | | | |
Series 2003 B, 5% 8/15/33 (Pre-Refunded to 8/15/13 @ 100) | | 15,000 | | 15,438 |
Series 2010 B, 5% 8/15/21 | | 1,800 | | 2,284 |
| | 333,806 |
Utah - 0.1% |
Salt Lake County Wtr. Conservancy District Rev. Series A, 0% 10/1/13 (AMBAC Insured) | | 3,760 | | 3,714 |
Utah Associated Muni. Pwr. Sys. Rev. (Payson Pwr. Proj.) 5% 9/1/17 | | 1,090 | | 1,255 |
| | 4,969 |
Vermont - 0.1% |
Vermont Edl. & Health Bldg. Fin. Agcy. Rev. (Fletcher Allen Health Care Proj.) Series 2004 B, 5% 12/1/15 (FSA Insured) | | 2,225 | | 2,396 |
Virgin Islands - 0.1% |
Virgin Islands Pub. Fin. Auth. Series 2009 B, 5% 10/1/15 | | 5,000 | | 5,366 |
Virginia - 0.4% |
Amelia County Indl. Dev. Auth. Solid Waste Disp. Rev. Bonds (Waste Mgmt., Inc. Proj.) 3.375%, tender 4/1/13 (b)(e) | | 5,900 | | 5,942 |
Chesapeake Econ. Dev. Auth. Poll. Cont. Rev. Bonds (Elec. & Pwr. Co. Proj.) Series 2008 A, 3.6%, tender 2/1/13 (b) | | 1,800 | | 1,804 |
Chesapeake Trans. Sys. Toll Road Rev. Series 2012 A: | | | | |
4% 7/15/20 | | 605 | | 647 |
5% 7/15/21 | | 400 | | 458 |
Municipal Bonds - continued |
| Principal Amount (000s) | | Value (000s) |
Virginia - continued |
Louisa Indl. Dev. Auth. Poll. Cont. Rev. Bonds (Virginia Elec. & Pwr. Co. Proj.) Series 2008 B, 5.375%, tender 12/2/13 (b) | | $ 8,000 | | $ 8,352 |
York County Econ. Dev. Auth. Poll. Cont. Rev. Bonds (Virginia Elec. and Pwr. Co. Proj.) Series 2009 A, 4.05%, tender 5/1/14 (b) | | 1,800 | | 1,876 |
| | 19,079 |
Washington - 1.7% |
Energy Northwest Elec. Rev.: | | | | |
(#3 Proj.) Series 2009 A, 5% 7/1/14 | | 4,000 | | 4,280 |
Series 2012 A, 5% 7/1/19 | | 30,000 | | 36,952 |
Grant County Pub. Util. District #2 Series 2012 A: | | | | |
5% 1/1/20 | | 1,375 | | 1,669 |
5% 1/1/21 | | 1,865 | | 2,286 |
King County Highline School District # 401 Series 2009: | | | | |
5% 12/1/16 | | 6,350 | | 7,379 |
5% 12/1/17 | | 2,950 | | 3,518 |
Port of Seattle Passenger Facilities Charge Rev. Series 2010 B, 5% 12/1/16 (e) | | 2,500 | | 2,845 |
Port of Seattle Rev. Series 2010 C: | | | | |
5% 2/1/16 (e) | | 2,000 | | 2,233 |
5% 2/1/17 (e) | | 2,500 | | 2,848 |
Seattle Muni. Lt. & Pwr. Rev. Series 2010 B, 5% 2/1/17 | | 2,000 | | 2,326 |
Spokane County Wastewtr. Sys. Rev. Series 2009 A, 5% 12/1/15 | | 1,710 | | 1,921 |
Washington Health Care Facilities Auth. Rev. (MultiCare Health Sys. Proj.) Series 2010 A: | | | | |
5% 8/15/13 | | 2,000 | | 2,048 |
5% 8/15/14 | | 2,000 | | 2,118 |
| | 72,423 |
West Virginia - 0.2% |
West Virginia Econ. Dev. Auth. Solid Waste Disp. Facilities Rev. Bonds Series 2011 A, 2.25%, tender 9/1/16 (b)(e) | | 7,000 | | 7,034 |
Wisconsin - 1.1% |
Milwaukee County Arpt. Rev. Series 2010 B, 5% 12/1/15 (e) | | 1,720 | | 1,902 |
Wisconsin Gen. Oblig.: | | | | |
Series 2005 1, 5% 5/1/15 (Nat'l. Pub. Fin. Guarantee Corp. Insured) | | 6,325 | | 6,981 |
Series 2009 C, 4% 5/1/14 | | 3,365 | | 3,527 |
Municipal Bonds - continued |
| Principal Amount (000s) | | Value (000s) |
Wisconsin - continued |
Wisconsin Gen. Oblig.: - continued | | | | |
Series 2010 1: | | | | |
5% 5/1/14 | | $ 5,750 | | $ 6,102 |
5% 5/1/15 | | 8,005 | | 8,835 |
5% 5/1/16 | | 10,000 | | 11,400 |
Wisconsin Health & Edl. Facilities Auth. Rev.: | | | | |
(Agnesian HealthCare, Inc. Proj.) Series 2010, 5% 7/1/16 | | 1,175 | | 1,286 |
(Aurora Health Care, Inc. Proj.) Series 2010 A, 5% 4/15/17 | | 1,500 | | 1,685 |
(Marshfield Clinic Proj.) Series 2006 A, 5% 2/15/13 | | 875 | | 879 |
(Thedacare, Inc. Proj.) Series 2010: | | | | |
4% 12/15/13 | | 1,035 | | 1,064 |
5% 12/15/15 | | 1,105 | | 1,218 |
5% 12/15/16 | | 1,440 | | 1,613 |
5% 12/15/17 | | 1,540 | | 1,751 |
Series 2012, 5% 10/1/21 | | 1,400 | | 1,687 |
| | 49,930 |
TOTAL MUNICIPAL BONDS (Cost $3,719,996) |
3,866,088
|
Municipal Notes - 2.9% |
| | | |
California - 2.3% |
California Cmnty. College Fin. Auth. Trans. TRAN Series 2012 C, 2.5% 6/28/13 | 5,200 | | 5,237 |
California Gen. Oblig. RAN Series A1, 2.5% 5/30/13 | 88,000 | | 88,845 |
California School Cash Reserve Prog. Auth. TRAN Series 2012 X, 2.5% 1/31/13 | 5,055 | | 5,060 |
| | 99,142 |
New Jersey - 0.2% |
Hudson County Gen. Oblig. BAN 1% 12/6/13 | 3,300 | | 3,316 |
Newark Gen. Oblig. BAN Series 2012 D, 2% 12/11/13 | 3,000 | | 3,017 |
| | 6,333 |
New York - 0.4% |
Suffolk County Gen. Oblig. TAN Series 2012 A, 2% 8/14/13 | 18,800 | | 18,968 |
TOTAL MUNICIPAL NOTES (Cost $124,375) |
124,443
|
Money Market Funds - 5.8% |
| Shares | | Value (000s) |
Fidelity Municipal Cash Central Fund, 0.16% (c)(d)
(Cost $249,946) | 249,945,900 | | $ 249,946 |
TOTAL INVESTMENT PORTFOLIO - 97.7% (Cost $4,094,317) | | 4,240,477 |
NET OTHER ASSETS (LIABILITIES) - 2.3% | | 101,948 |
NET ASSETS - 100% | $ 4,342,425 |
Security Type Abbreviations |
BAN | - | BOND ANTICIPATION NOTE |
RAN | - | REVENUE ANTICIPATION NOTE |
TAN | - | TAX ANTICIPATION NOTE |
TRAN | - | TAX AND REVENUE ANTICIPATION N |
Legend |
(a) Security or a portion of the security purchased on a delayed delivery or when-issued basis. |
(b) Coupon rates for floating and adjustable rate securities reflect the rates in effect at period end. |
(c) Information in this report regarding holdings by state and security types does not reflect the holdings of the Fidelity Municipal Cash Central Fund. |
(d) Affiliated fund that is available only to investment companies and other accounts managed by Fidelity Investments. The rate quoted is the annualized seven-day yield of the fund at period end. A complete unaudited listing of the fund's holdings as of its most recent quarter end is available upon request. In addition, each Fidelity Central Fund's financial statements, which are not covered by the Fund's Report of Independent Registered Public Accounting Firm, are available on the SEC's website or upon request. |
(e) Private activity obligations whose interest is subject to the federal alternative minimum tax for individuals. |
Affiliated Central Funds |
Information regarding fiscal year to date income earned by the Fund from investments in Fidelity Central Funds is as follows: |
Fund | Income earned
(Amount in thousands) |
Fidelity Municipal Cash Central Fund | $ 563 |
Other Information |
The following is a summary of the inputs used, as of December 31, 2012, involving the Fund's assets and liabilities carried at fair value. The inputs or methodology used for valuing securities may not be an indication of the risk associated with investing in those securities. For more information on valuation inputs, and their aggregation into the levels used in the table below, please refer to the Investment Valuation section in the accompanying Notes to Financial Statements. |
Valuation Inputs at Reporting Date: |
Description
(Amounts in thousands) | Total | Level 1 | Level 2 | Level 3 |
Investments in Securities: | | | | |
Municipal Securities | $ 3,990,531 | $ - | $ 3,990,531 | $ - |
Money Market Funds | 249,946 | 249,946 | - | - |
Total Investments in Securities: | $ 4,240,477 | $ 249,946 | $ 3,990,531 | $ - |
The distribution of municipal securities by revenue source, as a percentage of total net assets, is as follows (Unaudited): |
General Obligations | 36.4% |
Electric Utilities | 12.7% |
Special Tax | 12.1% |
Health Care | 9.3% |
Transportation | 7.1% |
Water & Sewer | 5.8% |
Others (Individually Less Than 5%) | 8.5% |
Short-Term Investments and Net Other Assets | 8.1% |
| 100.0% |
See accompanying notes which are an integral part of the financial statements.
Annual Report
Statement of Assets and Liabilities
Amounts in thousands (except per-share amounts) | December 31, 2012 |
| | |
Assets | | |
Investment in securities, at value - See accompanying schedule: Unaffiliated issuers (cost $3,844,371) | $ 3,990,531 | |
Fidelity Central Funds (cost $249,946) | 249,946 | |
Total Investments (cost $4,094,317) | | $ 4,240,477 |
Cash | | 85,977 |
Receivable for fund shares sold | | 14,881 |
Interest receivable | | 40,782 |
Distributions receivable from Fidelity Central Funds | | 32 |
Prepaid expenses | | 11 |
Other receivables | | 36 |
Total assets | | 4,382,196 |
| | |
Liabilities | | |
Payable for investments purchased
Regular delivery | $ 3,600 | |
Delayed delivery | 19,792 | |
Payable for fund shares redeemed | 12,315 | |
Distributions payable | 1,647 | |
Accrued management fee | 1,334 | |
Distribution and service plan fees payable | 164 | |
Other affiliated payables | 822 | |
Other payables and accrued expenses | 97 | |
Total liabilities | | 39,771 |
| | |
Net Assets | | $ 4,342,425 |
Net Assets consist of: | | |
Paid in capital | | $ 4,195,346 |
Undistributed net investment income | | 63 |
Accumulated undistributed net realized gain (loss) on investments | | 856 |
Net unrealized appreciation (depreciation) on investments | | 146,160 |
Net Assets | | $ 4,342,425 |
See accompanying notes which are an integral part of the financial statements.
Annual Report
Statement of Assets and Liabilities - continued
Amounts in thousands (except per-share amounts) | December 31, 2012 |
| | |
Calculation of Maximum Offering Price
Class A:
Net Asset Value and redemption price per share
($394,222 ÷ 36,285.0 shares) | | $ 10.86 |
| | |
Maximum offering price per share (100/97.25 of $10.86) | | $ 11.17 |
Class T:
Net Asset Value and redemption price per share ($24,646 ÷ 2,272.4 shares) | | $ 10.85 |
| | |
Maximum offering price per share (100/97.25 of $10.85) | | $ 11.16 |
Class B:
Net Asset Value and offering price per share ($1,110 ÷ 102.2 shares)A | | $ 10.86 |
| | |
Class C:
Net Asset Value and offering price per share ($92,301 ÷ 8,511.2 shares)A | | $ 10.84 |
| | |
Short-Intermediate Municipal Income:
Net Asset Value, offering price and redemption price per share ($3,624,182 ÷ 334,145.2 shares) | | $ 10.85 |
| | |
Institutional Class:
Net Asset Value, offering price and redemption price per share ($205,964 ÷ 18,979.6 shares) | | $ 10.85 |
A Redemption price per share is equal to net asset value less any applicable contingent deferred sales charge.
See accompanying notes which are an integral part of the financial statements.
Annual Report
Financial Statements - continued
Statement of Operations
Amounts in thousands | Year ended December 31, 2012 |
| | |
Investment Income | | |
Interest | | $ 98,389 |
Income from Fidelity Central Funds | | 563 |
Total income | | 98,952 |
| | |
Expenses | | |
Management fee | $ 15,811 | |
Transfer agent fees | 4,209 | |
Distribution and service plan fees | 1,887 | |
Accounting fees and expenses | 631 | |
Custodian fees and expenses | 45 | |
Independent trustees' compensation | 16 | |
Registration fees | 297 | |
Audit | 56 | |
Legal | 12 | |
Miscellaneous | 37 | |
Total expenses before reductions | 23,001 | |
Expense reductions | (265) | 22,736 |
Net investment income (loss) | | 76,216 |
Realized and Unrealized Gain (Loss) Net realized gain (loss) on: | | |
Investment securities: | | |
Unaffiliated issuers | 5,865 | |
Capital gain distributions from Fidelity Central Funds | 3 | |
Total net realized gain (loss) | | 5,868 |
Change in net unrealized appreciation (depreciation) on investment securities | | 9,754 |
Net gain (loss) | | 15,622 |
Net increase (decrease) in net assets resulting from operations | | $ 91,838 |
See accompanying notes which are an integral part of the financial statements.
Annual Report
Statement of Changes in Net Assets
Amounts in thousands | Year ended
December 31, 2012 | Year ended
December 31, 2011 |
Increase (Decrease) in Net Assets | | |
Operations | | |
Net investment income (loss) | $ 76,216 | $ 80,340 |
Net realized gain (loss) | 5,868 | 2,116 |
Change in net unrealized appreciation (depreciation) | 9,754 | 76,652 |
Net increase (decrease) in net assets resulting
from operations | 91,838 | 159,108 |
Distributions to shareholders from net investment income | (73,237) | (83,163) |
Distributions to shareholders from net realized gain | (4,814) | (2,965) |
Total distributions | (78,051) | (86,128) |
Share transactions - net increase (decrease) | 211,189 | 142,426 |
Redemption fees | 50 | 46 |
Total increase (decrease) in net assets | 225,026 | 215,452 |
| | |
Net Assets | | |
Beginning of period | 4,117,399 | 3,901,947 |
End of period (including undistributed net investment income of $63 and distributions in excess of net investment income of $2,916, respectively) | $ 4,342,425 | $ 4,117,399 |
See accompanying notes which are an integral part of the financial statements.
Annual Report
Financial Highlights - Class A
Years ended December 31, | 2012 | 2011 | 2010 | 2009 | 2008 |
Selected Per-Share Data | | | | | |
Net asset value, beginning of period | $ 10.83 | $ 10.62 | $ 10.64 | $ 10.35 | $ 10.33 |
Income from Investment Operations | | | | | |
Net investment income (loss) C | .164 | .198 | .209 | .254 | .298 |
Net realized and unrealized gain (loss) | .034 | .225 | (.016) | .294 | .021 |
Total from investment operations | .198 | .423 | .193 | .548 | .319 |
Distributions from net investment income | (.156) | (.205) | (.209) | (.258) | (.300) |
Distributions from net realized gain | (.012) | (.008) | (.004) | - | - |
Total distributions | (.168) | (.213) | (.213) | (.258) | (.300) |
Redemption fees added to paid in capital C | - G | - G | - G | - G | .001 |
Net asset value, end of period | $ 10.86 | $ 10.83 | $ 10.62 | $ 10.64 | $ 10.35 |
Total Return A,B | 1.84% | 4.03% | 1.81% | 5.34% | 3.13% |
Ratios to Average Net Assets D,F | | | | | |
Expenses before reductions | .79% | .77% | .78% | .79% | .75% |
Expenses net of fee waivers, if any | .79% | .77% | .78% | .78% | .75% |
Expenses net of all reductions | .78% | .77% | .77% | .78% | .72% |
Net investment income (loss) | 1.51% | 1.85% | 1.95% | 2.41% | 2.90% |
Supplemental Data | | | | | |
Net assets, end of period (in millions) | $ 394 | $ 336 | $ 200 | $ 169 | $ 58 |
Portfolio turnover rate E | 21% | 22% | 15% | 8% | 20% |
A Total returns would have been lower if certain expenses had not been reduced during the applicable periods shown.
B Total returns do not include the effect of the sales charges.
C Calculated based on average shares outstanding during the period.
D Fees and expenses of any underlying Fidelity Central Funds are not included in the Fund's expense ratio. The Fund indirectly bears its proportionate share of the expenses of any underlying Fidelity Central Funds.
E Amount does not include the portfolio activity of any underlying Fidelity Central Funds.
F Expense ratios reflect operating expenses of the class. Expenses before reductions do not reflect amounts reimbursed by the investment adviser or reductions from brokerage service arrangements or reductions from other expense offset arrangements and do not represent the amount paid by the class during periods when reimbursements or reductions occur. Expenses net of fee waivers reflect expenses after reimbursement by the investment adviser but prior to reductions from brokerage service arrangements or other expense offset arrangements. Expenses net of all reductions represent the net expenses paid by the class.
G Amount represents less than $.001 per share.
See accompanying notes which are an integral part of the financial statements.
Annual Report
Financial Highlights - Class T
Years ended December 31, | 2012 | 2011 | 2010 | 2009 | 2008 |
Selected Per-Share Data | | | | | |
Net asset value, beginning of period | $ 10.81 | $ 10.60 | $ 10.63 | $ 10.34 | $ 10.31 |
Income from Investment Operations | | | | | |
Net investment income (loss) C | .166 | .199 | .211 | .255 | .300 |
Net realized and unrealized gain (loss) | .044 | .226 | (.026) | .294 | .029 |
Total from investment operations | .210 | .425 | .185 | .549 | .329 |
Distributions from net investment income | (.158) | (.207) | (.211) | (.259) | (.300) |
Distributions from net realized gain | (.012) | (.008) | (.004) | - | - |
Total distributions | (.170) | (.215) | (.215) | (.259) | (.300) |
Redemption fees added to paid in capital C | - G | - G | - G | - G | .001 |
Net asset value, end of period | $ 10.85 | $ 10.81 | $ 10.60 | $ 10.63 | $ 10.34 |
Total Return A,B | 1.95% | 4.05% | 1.74% | 5.36% | 3.24% |
Ratios to Average Net Assets D,F | | | | | |
Expenses before reductions | .77% | .76% | .76% | .77% | .74% |
Expenses net of fee waivers, if any | .77% | .76% | .76% | .77% | .74% |
Expenses net of all reductions | .76% | .76% | .75% | .77% | .72% |
Net investment income (loss) | 1.52% | 1.86% | 1.97% | 2.42% | 2.90% |
Supplemental Data | | | | | |
Net assets, end of period (in millions) | $ 25 | $ 26 | $ 24 | $ 23 | $ 15 |
Portfolio turnover rate E | 21% | 22% | 15% | 8% | 20% |
A Total returns would have been lower if certain expenses had not been reduced during the applicable periods shown.
B Total returns do not include the effect of the sales charges.
C Calculated based on average shares outstanding during the period.
D Fees and expenses of any underlying Fidelity Central Funds are not included in the Fund's expense ratio. The Fund indirectly bears its proportionate share of the expenses of any underlying Fidelity Central Funds.
E Amount does not include the portfolio activity of any underlying Fidelity Central Funds.
F Expense ratios reflect operating expenses of the class. Expenses before reductions do not reflect amounts reimbursed by the investment adviser or reductions from brokerage service arrangements or reductions from other expense offset arrangements and do not represent the amount paid by the class during periods when reimbursements or reductions occur. Expenses net of fee waivers reflect expenses after reimbursement by the investment adviser but prior to reductions from brokerage service arrangements or other expense offset arrangements. Expenses net of all reductions represent the net expenses paid by the class.
G Amount represents less than $.001 per share.
See accompanying notes which are an integral part of the financial statements.
Annual Report
Financial Highlights - Class B
Years ended December 31, | 2012 | 2011 | 2010 | 2009 | 2008 |
Selected Per-Share Data | | | | | |
Net asset value, beginning of period | $ 10.82 | $ 10.61 | $ 10.64 | $ 10.35 | $ 10.32 |
Income from Investment Operations | | | | | |
Net investment income (loss) C | .093 | .128 | .139 | .186 | .230 |
Net realized and unrealized gain (loss) | .045 | .226 | (.026) | .293 | .029 |
Total from investment operations | .138 | .354 | .113 | .479 | .259 |
Distributions from net investment income | (.086) | (.136) | (.139) | (.189) | (.230) |
Distributions from net realized gain | (.012) | (.008) | (.004) | - | - |
Total distributions | (.098) | (.144) | (.143) | (.189) | (.230) |
Redemption fees added to paid in capital C | - G | - G | - G | - G | .001 |
Net asset value, end of period | $ 10.86 | $ 10.82 | $ 10.61 | $ 10.64 | $ 10.35 |
Total Return A,B | 1.27% | 3.36% | 1.06% | 4.66% | 2.54% |
Ratios to Average Net Assets D,F | | | | | |
Expenses before reductions | 1.44% | 1.43% | 1.44% | 1.46% | 1.43% |
Expenses net of fee waivers, if any | 1.44% | 1.42% | 1.43% | 1.43% | 1.43% |
Expenses net of all reductions | 1.43% | 1.42% | 1.42% | 1.43% | 1.40% |
Net investment income (loss) | .85% | 1.19% | 1.30% | 1.77% | 2.22% |
Supplemental Data | | | | | |
Net assets, end of period (in millions) | $ 1 | $ 2 | $ 2 | $ 3 | $ 2 |
Portfolio turnover rate E | 21% | 22% | 15% | 8% | 20% |
A Total returns would have been lower if certain expenses had not been reduced during the applicable periods shown.
B Total returns do not include the effect of the contingent deferred sales charge.
C Calculated based on average shares outstanding during the period.
D Fees and expenses of any underlying Fidelity Central Funds are not included in the Fund's expense ratio. The Fund indirectly bears its proportionate share of the expenses of any underlying Fidelity Central Funds.
E Amount does not include the portfolio activity of any underlying Fidelity Central Funds.
F Expense ratios reflect operating expenses of the class. Expenses before reductions do not reflect amounts reimbursed by the investment adviser or reductions from brokerage service arrangements or reductions from other expense offset arrangements and do not represent the amount paid by the class during periods when reimbursements or reductions occur. Expenses net of fee waivers reflect expenses after reimbursement by the investment adviser but prior to reductions from brokerage service arrangements or other expense offset arrangements. Expenses net of all reductions represent the net expenses paid by the class.
G Amount represents less than $.001 per share.
See accompanying notes which are an integral part of the financial statements.
Annual Report
Financial Highlights - Class C
Years ended December 31, | 2012 | 2011 | 2010 | 2009 | 2008 |
Selected Per-Share Data | | | | | |
Net asset value, beginning of period | $ 10.81 | $ 10.60 | $ 10.63 | $ 10.33 | $ 10.31 |
Income from Investment Operations | | | | | |
Net investment income (loss) C | .082 | .117 | .129 | .175 | .220 |
Net realized and unrealized gain (loss) | .035 | .226 | (.026) | .303 | .020 |
Total from investment operations | .117 | .343 | .103 | .478 | .240 |
Distributions from net investment income | (.075) | (.125) | (.129) | (.178) | (.221) |
Distributions from net realized gain | (.012) | (.008) | (.004) | - | - |
Total distributions | (.087) | (.133) | (.133) | (.178) | (.221) |
Redemption fees added to paid in capital C | - G | - G | - G | - G | .001 |
Net asset value, end of period | $ 10.84 | $ 10.81 | $ 10.60 | $ 10.63 | $ 10.33 |
Total Return A,B | 1.08% | 3.25% | .96% | 4.66% | 2.35% |
Ratios to Average Net Assets D,F | | | | | |
Expenses before reductions | 1.53% | 1.53% | 1.52% | 1.53% | 1.50% |
Expenses net of fee waivers, if any | 1.53% | 1.53% | 1.52% | 1.53% | 1.50% |
Expenses net of all reductions | 1.53% | 1.52% | 1.52% | 1.53% | 1.48% |
Net investment income (loss) | .76% | 1.09% | 1.20% | 1.67% | 2.14% |
Supplemental Data | | | | | |
Net assets, end of period (in millions) | $ 92 | $ 79 | $ 77 | $ 56 | $ 20 |
Portfolio turnover rate E | 21% | 22% | 15% | 8% | 20% |
A Total returns would have been lower if certain expenses had not been reduced during the applicable periods shown.
B Total returns do not include the effect of the contingent deferred sales charge.
C Calculated based on average shares outstanding during the period.
D Fees and expenses of any underlying Fidelity Central Funds are not included in the Fund's expense ratio. The Fund indirectly bears its proportionate share of the expenses of any underlying Fidelity Central Funds.
E Amount does not include the portfolio activity of any underlying Fidelity Central Funds.
F Expense ratios reflect operating expenses of the class. Expenses before reductions do not reflect amounts reimbursed by the investment adviser or reductions from brokerage service arrangements or reductions from other expense offset arrangements and do not represent the amount paid by the class during periods when reimbursements or reductions occur. Expenses net of fee waivers reflect expenses after reimbursement by the investment adviser but prior to reductions from brokerage service arrangements or other expense offset arrangements. Expenses net of all reductions represent the net expenses paid by the class.
G Amount represents less than $.001 per share.
See accompanying notes which are an integral part of the financial statements.
Annual Report
Financial Highlights - Short-Intermediate Municipal Income
Years ended December 31, | 2012 | 2011 | 2010 | 2009 | 2008 |
Selected Per-Share Data | | | | | |
Net asset value, beginning of period | $ 10.81 | $ 10.60 | $ 10.63 | $ 10.34 | $ 10.31 |
Income from Investment Operations | | | | | |
Net investment income (loss) B | .197 | .228 | .240 | .284 | .326 |
Net realized and unrealized gain (loss) | .045 | .227 | (.026) | .293 | .029 |
Total from investment operations | .242 | .455 | .214 | .577 | .355 |
Distributions from net investment income | (.190) | (.237) | (.240) | (.287) | (.326) |
Distributions from net realized gain | (.012) | (.008) | (.004) | - | - |
Total distributions | (.202) | (.245) | (.244) | (.287) | (.326) |
Redemption fees added to paid in capital B | - F | - F | - F | - F | .001 |
Net asset value, end of period | $ 10.85 | $ 10.81 | $ 10.60 | $ 10.63 | $ 10.34 |
Total Return A | 2.25% | 4.34% | 2.02% | 5.64% | 3.50% |
Ratios to Average Net Assets C,E | | | | | |
Expenses before reductions | .48% | .48% | .48% | .50% | .49% |
Expenses net of fee waivers, if any | .48% | .48% | .48% | .50% | .49% |
Expenses net of all reductions | .47% | .48% | .48% | .50% | .47% |
Net investment income (loss) | 1.81% | 2.14% | 2.24% | 2.69% | 3.15% |
Supplemental Data | | | | | |
Net assets, end of period (in millions) | $ 3,624 | $ 3,523 | $ 3,456 | $ 3,153 | $ 1,870 |
Portfolio turnover rate D | 21% | 22% | 15% | 8% | 20% |
A Total returns would have been lower if certain expenses had not been reduced during the applicable periods shown.
B Calculated based on average shares outstanding during the period.
C Fees and expenses of any underlying Fidelity Central Funds are not included in the Fund's expense ratio. The Fund indirectly bears its proportionate share of the expenses of any underlying Fidelity Central Funds.
D Amount does not include the portfolio activity of any underlying Fidelity Central Funds.
E Expense ratios reflect operating expenses of the class. Expenses before reductions do not reflect amounts reimbursed by the investment adviser or reductions from brokerage service arrangements or reductions from other expense offset arrangements and do not represent the amount paid by the class during periods when reimbursements or reductions occur. Expenses net of fee waivers reflect expenses after reimbursement by the investment adviser but prior to reductions from brokerage service arrangements or other expense offset arrangements. Expenses net of all reductions represent the net expenses paid by the class.
F Amount represents less than $.001 per share.
See accompanying notes which are an integral part of the financial statements.
Annual Report
Financial Highlights - Institutional Class
Years ended December 31, | 2012 | 2011 | 2010 | 2009 | 2008 |
Selected Per-Share Data | | | | | |
Net asset value, beginning of period | $ 10.81 | $ 10.61 | $ 10.63 | $ 10.34 | $ 10.32 |
Income from Investment Operations | | | | | |
Net investment income (loss) B | .191 | .224 | .235 | .281 | .321 |
Net realized and unrealized gain (loss) | .045 | .216 | (.015) | .293 | .022 |
Total from investment operations | .236 | .440 | .220 | .574 | .343 |
Distributions from net investment income | (.184) | (.232) | (.236) | (.284) | (.324) |
Distributions from net realized gain | (.012) | (.008) | (.004) | - | - |
Total distributions | (.196) | (.240) | (.240) | (.284) | (.324) |
Redemption fees added to paid in capital B | - F | - F | - F | - F | .001 |
Net asset value, end of period | $ 10.85 | $ 10.81 | $ 10.61 | $ 10.63 | $ 10.34 |
Total Return A | 2.19% | 4.19% | 2.07% | 5.61% | 3.38% |
Ratios to Average Net Assets C,E | | | | | |
Expenses before reductions | .54% | .52% | .53% | .55% | .51% |
Expenses net of fee waivers, if any | .54% | .52% | .53% | .53% | .51% |
Expenses net of all reductions | .53% | .52% | .52% | .53% | .49% |
Net investment income (loss) | 1.76% | 2.09% | 2.20% | 2.66% | 3.13% |
Supplemental Data | | | | | |
Net assets, end of period (in millions) | $ 206 | $ 152 | $ 142 | $ 92 | $ 32 |
Portfolio turnover rate D | 21% | 22% | 15% | 8% | 20% |
A Total returns would have been lower if certain expenses had not been reduced during the applicable periods shown.
B Calculated based on average shares outstanding during the period.
C Fees and expenses of any underlying Fidelity Central Funds are not included in the Fund's expense ratio. The Fund indirectly bears its proportionate share of the expenses of any underlying Fidelity Central Funds.
D Amount does not include the portfolio activity of any underlying Fidelity Central Funds.
E Expense ratios reflect operating expenses of the class. Expenses before reductions do not reflect amounts reimbursed by the investment adviser or reductions from brokerage service arrangements or reductions from other expense offset arrangements and do not represent the amount paid by the class during periods when reimbursements or reductions occur. Expenses net of fee waivers reflect expenses after reimbursement by the investment adviser but prior to reductions from brokerage service arrangements or other expense offset arrangements. Expenses net of all reductions represent the net expenses paid by the class.
F Amount represents less than $.001 per share.
See accompanying notes which are an integral part of the financial statements.
Annual Report
Notes to Financial Statements
For the period ended December 31, 2012
(Amounts in thousands except percentages)
1. Organization.
Fidelity Short-Intermediate Municipal Income Fund (the Fund) is a fund of Fidelity Municipal Trust (the Trust) and is authorized to issue an unlimited number of shares. The Trust is registered under the Investment Company Act of 1940, as amended (the 1940 Act), as an open-end management investment company organized as a Massachusetts business trust. The Fund offers Class A, Class T, Class C, Short-Intermediate Municipal Income and Institutional Class shares, each of which, along with Class B shares, has equal rights as to assets and voting privileges. Class B shares are closed to new accounts and additional purchases, except for exchanges and reinvestments. Each class has exclusive voting rights with respect to matters that affect that class. Class B shares will automatically convert to Class A shares after a holding period of four years from the initial date of purchase. Investment income, realized and unrealized capital gains and losses, the common expenses of the Fund, and certain fund-level expense reductions, if any, are allocated on a pro-rata basis to each class based on the relative net assets of each class to the total net assets of the Fund. Each class differs with respect to transfer agent and distribution and service plan fees incurred. Certain expense reductions may also differ by class.
2. Investments in Fidelity Central Funds.
The Fund invests in Fidelity Central Funds, which are open-end investment companies available only to other investment companies and accounts managed by Fidelity Management & Research Company (FMR) and its affiliates. The Fund's Schedule of Investments lists each of the Fidelity Central Funds held as of period end, if any, as an investment of the Fund, but does not include the underlying holdings of each Fidelity Central Fund. As an Investing Fund, the Fund indirectly bears its proportionate share of the expenses of the underlying Fidelity Central Funds.
The Money Market Central Funds seek preservation of capital and current income and are managed by Fidelity Investments Money Management, Inc. (FIMM), an affiliate of FMR.
A complete unaudited list of holdings for each Fidelity Central Fund is available upon request or at the Securities and Exchange Commission (the SEC) website at www.sec.gov. In addition, the financial statements of the Fidelity Central Funds, which are not covered by the Fund's Report of Independent Registered Public Accounting Firm, are available on the SEC website or upon request.
Annual Report
3. Significant Accounting Policies.
The financial statements have been prepared in conformity with accounting principles generally accepted in the United States of America (GAAP), which require management to make certain estimates and assumptions at the date of the financial statements. Actual results could differ from those estimates. Subsequent events, if any, through the date that the financial statements were issued have been evaluated in the preparation of the financial statements. The following summarizes the significant accounting policies of the Fund:
Investment Valuation. Investments are valued as of 4:00 p.m. Eastern time on the last calendar day of the period. In accordance with valuation policies and procedures approved by the Board of Trustees (the Board), the Fund attempts to obtain prices from one or more third party pricing vendors or brokers to value its investments. When current market prices, quotations or rates are not readily available or reliable, investments will be fair valued in good faith by the FMR Fair Value Committee (the Committee), in accordance with procedures adopted by the Board. Factors used in determining fair value vary by investment type and may include market or investment specific events, changes in interest rates and credit quality. The frequency with which these procedures are used cannot be predicted and they may be utilized to a significant extent. The Committee oversees the Fund's valuation policies and procedures and is responsible for approving and reporting to the Board all fair value determinations.
The Fund categorizes the inputs to valuation techniques used to value its investments into a disclosure hierarchy consisting of three levels as shown below:
Level 1 - quoted prices in active markets for identical investments
Level 2 - other significant observable inputs (including quoted prices for similar investments, interest rates, prepayment speeds, etc.)
Level 3 - unobservable inputs (including the Fund's own assumptions based on the best information available)
Valuation techniques used to value the Fund's investments by major category are as follows:
Debt securities, including restricted securities, are valued based on evaluated prices received from third party pricing vendors or from brokers who make markets in such securities. For municipal securities, pricing vendors utilize matrix pricing which considers yield or price of bonds of comparable quality, coupon, maturity and type as well as broker-supplied prices and are generally categorized as Level 2 in the hierarchy. When independent prices are unavailable or unreliable, debt securities may be valued utilizing
Annual Report
Notes to Financial Statements - continued
(Amounts in thousands except percentages)
3. Significant Accounting Policies - continued
Investment Valuation - continued
pricing methodologies which consider similar factors that would be used by third party pricing vendors. These are generally categorized as Level 2 in the hierarchy but may be Level 3 depending on the circumstances.
Investments in open-end mutual funds, including the Fidelity Central Funds, are valued at their closing net asset value (NAV) each business day and are categorized as Level 1 in the hierarchy.
Changes in valuation techniques may result in transfers in or out of an assigned level within the disclosure hierarchy. The aggregate value of investments by input level, as of December 31, 2012, is included at the end of the Fund's Schedule of Investments.
Investment Transactions and Income. For financial reporting purposes, the Fund's investment holdings and NAV include trades executed through the end of the last business day of the period. The NAV per share for processing shareholder transactions is calculated as of the close of business of the New York Stock Exchange (NYSE), normally 4:00 p.m. Eastern time and includes trades executed through the end of the prior business day. Gains and losses on securities sold are determined on the basis of identified cost. Interest income and distributions from the Fidelity Central Funds are accrued as earned. Interest income includes coupon interest and amortization of premium and accretion of discount on debt securities.
Expenses. Expenses directly attributable to a fund are charged to that fund. Expenses attributable to more than one fund are allocated among the respective funds on the basis of relative net assets or other appropriate methods. Expense estimates are accrued in the period to which they relate and adjustments are made when actual amounts are known.
Income Tax Information and Distributions to Shareholders. Each year, the Fund intends to qualify as a regulated investment company under Subchapter M of the Internal Revenue Code, including distributing substantially all of its taxable income and realized gains. As a result, no provision for income taxes is required. As of December 31, 2012, the Fund did not have any unrecognized tax benefits in the financial statements; nor is the Fund aware of any tax positions for which it is reasonably possible that the total amounts of unrecognized tax benefits will significantly change in the next twelve months. The Fund files a U.S. federal tax return, in addition to state and local tax returns as required. A fund's federal income tax returns are subject to examination by the Internal Revenue Service (IRS) for a period of three fiscal years after they are filed. State and local tax returns may be subject to examination for an additional fiscal year depending on the jurisdiction.
Annual Report
3. Significant Accounting Policies - continued
Income Tax Information and Distributions to Shareholders - continued
Dividends are declared and recorded daily and paid monthly from net investment income. Distributions from realized gains, if any, are declared and recorded on the ex-dividend date. Income dividends and capital gain distributions are declared separately for each class. Income and capital gain distributions are determined in accordance with income tax regulations, which may differ from GAAP. In addition, the Fund claimed a portion of the payment to redeeming shareholders as a distribution for income tax purposes.
Capital accounts within the financial statements are adjusted for permanent book-tax differences. These adjustments have no impact on net assets or the results of operations. Temporary book-tax differences will reverse in a subsequent period.
Book-tax differences are primarily due to deferred trustees compensation and losses deferred due to wash sales.
The Fund purchases municipal securities whose interest, in the opinion of the issuer, is free from federal income tax. There is no assurance that the IRS will agree with this opinion. In the event the IRS determines that the issuer does not comply with relevant tax requirements, interest payments from a security could become federally taxable, possibly retroactively to the date the security was issued.
The federal tax cost of investment securities and unrealized appreciation (depreciation) as of period end were as follows:
Gross unrealized appreciation | $ 148,500 |
Gross unrealized depreciation | (2,362) |
Net unrealized appreciation (depreciation) on securities and other investments | $ 146,138 |
| |
Tax Cost | $ 4,094,339 |
The tax-based components of distributable earnings as of period end were as follows:
Undistributed tax-exempt income | $ 63 |
Undistributed long-term capital gain | $ 877 |
Net unrealized appreciation (depreciation) | $ 146,138 |
Annual Report
Notes to Financial Statements - continued
(Amounts in thousands except percentages)
3. Significant Accounting Policies - continued
Income Tax Information and Distributions to Shareholders - continued
The tax character of distributions paid was as follows:
| December 31, 2012 | December 31, 2011 |
Tax-exempt Income | $ 73,237 | $ 83,163 |
Long-term Capital Gains | 4,814 | 2,965 |
Total | $ 78,051 | $ 86,128 |
Short-Term Trading (Redemption) Fees. Shares held by investors in the Fund less than 30 days are subject to a redemption fee equal to .50% of the net asset value of shares redeemed. All redemption fees, which reduce the proceeds of the shareholder redemption, are retained by the Fund and accounted for as an addition to paid in capital.
Delayed Delivery Transactions and When-Issued Securities. During the period, the Fund transacted in securities on a delayed delivery or when-issued basis. Payment and delivery may take place after the customary settlement period for that security. The price of the underlying securities and the date when the securities will be delivered and paid for are fixed at the time the transaction is negotiated. The securities purchased on a delayed delivery or when-issued basis are identified as such in the Fund's Schedule of Investments. The Fund may receive compensation for interest forgone in the purchase of a delayed delivery or when-issued security. With respect to purchase commitments, the Fund identifies securities as segregated in its records with a value at least equal to the amount of the commitment. Losses may arise due to changes in the value of the underlying securities or if the counterparty does not perform under the contract's terms, or if the issuer does not issue the securities due to political, economic, or other factors.
4. Purchases and Sales of Investments.
Purchases and sales of securities, other than short-term securities, aggregated $1,167,785 and $784,640, respectively.
5. Fees and Other Transactions with Affiliates.
Management Fee. FMR and its affiliates provide the Fund with investment management related services for which the Fund pays a monthly management fee. The management fee is the sum of an individual fund fee rate that is based on an annual rate of .25% of the Fund's average net assets and an annualized group fee rate that averaged .12% during the period. The group fee rate is based upon the average net assets of all the mutual funds advised by FMR. The group fee rate decreases as assets under management increase and increases as assets under management decrease. For the period, the total annual management fee rate was .37% of the Fund's average net assets.
Annual Report
5. Fees and Other Transactions with Affiliates - continued
Distribution and Service Plan Fees. In accordance with Rule 12b-1 of the 1940 Act, the Fund has adopted separate Distribution and Service Plans for each class of shares. Certain classes pay Fidelity Distributors Corporation (FDC), an affiliate of FMR, separate Distribution and Service Fees, each of which is based on an annual percentage of each class' average net assets. In addition, FDC may pay financial intermediaries for selling shares of the Fund and providing shareholder support services. For the period, the Distribution and Service Fee rates, total fees and amounts retained by FDC were as follows:
| Distribution
Fee | Service
Fee | Total Fees | Retained
by FDC |
Class A | -% | .25% | $ 929 | $ 65 |
Class T | -% | .25% | 67 | 1 |
Class B | .65% | .25% | 13 | 9 |
Class C | .75% | .25% | 878 | 291 |
| | | $ 1,887 | $ 366 |
Sales Load. FDC may receive a front-end sales charge of up to 2.75% for selling Class A shares and Class T shares, some of which is paid to financial intermediaries for selling shares of the Fund. Depending on the holding period, FDC may receive contingent deferred sales charges levied on Class A, Class T, Class B, and Class C redemptions. The deferred sales charges range from 3.00% to 1.00% for Class B shares, 1.00% for Class C shares, .75% or .50% for certain purchases of Class A shares and .25% for certain purchases of Class T shares.
For the period, sales charge amounts retained by FDC were as follows:
| Retained
by FDC |
Class A | $ 28 |
Class T | 9 |
Class B* | 2 |
Class C* | 24 |
| $ 63 |
* When Class B and Class C shares are initially sold, FDC pays commissions from its own resources to financial intermediaries through which the sales are made.
Annual Report
Notes to Financial Statements - continued
(Amounts in thousands except percentages)
5. Fees and Other Transactions with Affiliates - continued
Transfer Agent and Accounting Fees. Citibank, N.A. (Citibank) is the custodian, transfer agent, and servicing agent for the Fund's Class A, Class T, Class B, Class C, Short-Intermediate Municipal Income and Institutional Class shares. Citibank has entered into a sub-arrangement with Fidelity Investments Institutional Operations Company, Inc. (FIIOC), an affiliate of FMR, with respect to all classes of the Fund, to perform the transfer agency, dividend disbursing, and shareholder servicing functions. FIIOC receives account fees and asset-based fees that vary according to the account size and type of account of the shareholders of the respective classes of the Fund. All fees are paid to FIIOC by Citibank, which is reimbursed by each class for such payments. FIIOC pays for typesetting, printing and mailing of shareholder reports, except proxy statements. For the period, transfer agent fees for each class were as follows:
| Amount | % of
Average
Net Assets |
Class A | $ 543 | .15 |
Class T | 34 | .13 |
Class B | 2 | .15 |
Class C | 126 | .14 |
Short-Intermediate Municipal Income | 3,226 | .09 |
Institutional Class | 278 | .15 |
| $ 4,209 | |
Citibank also has a sub-arrangement with Fidelity Service Company, Inc. (FSC), an affiliate of FMR, under which FSC maintains the Fund's accounting records. The fee is paid to Citibank and is based on the level of average net assets for each month.
6. Committed Line of Credit.
The Fund participates with other funds managed by FMR or an affiliate in a $4.25 billion credit facility (the "line of credit") to be utilized for temporary or emergency purposes to fund shareholder redemptions or for other short-term liquidity purposes. The Fund has agreed to pay commitment fees on its pro-rata portion of the line of credit, which amounted to $12 and is reflected in Miscellaneous expenses on the Statement of Operations. During the period, there were no borrowings on this line of credit.
Annual Report
7. Expense Reductions.
Through arrangements with the Fund's custodian, credits realized as a result of uninvested cash balances were used to reduce the Fund's expenses. During the period, these credits reduced the Fund's custody and accounting expenses by $45 and $220, respectively.
8. Distributions to Shareholders.
Distributions to shareholders of each class were as follows:
Years ended December 31, | 2012 | 2011 |
From net investment income | | |
Class A | $ 5,319 | $ 4,211 |
Class T | 388 | 467 |
Class B | 11 | 27 |
Class C | 604 | 838 |
Short-Intermediate Municipal Income | 63,708 | 74,599 |
Institutional Class | 3,207 | 3,021 |
Total | $ 73,237 | $ 83,163 |
From net realized gain | | |
Class A | $ 428 | $ 216 |
Class T | 28 | 19 |
Class B | 1 | 1 |
Class C | 102 | 57 |
Short-Intermediate Municipal Income | 4,021 | 2,565 |
Institutional Class | 234 | 107 |
Total | $ 4,814 | $ 2,965 |
9. Share Transactions.
Transactions for each class of shares were as follows:
| Shares | Dollars |
Years ended December 31, | 2012 | 2011 | 2012 | 2011 |
Class A | | | | |
Shares sold | 25,560 | 22,096 | $ 278,216 | $ 237,519 |
Reinvestment of distributions | 425 | 303 | 4,631 | 3,252 |
Shares redeemed | (20,723) | (10,223) | (225,499) | (109,361) |
Net increase (decrease) | 5,262 | 12,176 | $ 57,348 | $ 131,410 |
Annual Report
Notes to Financial Statements - continued
(Amounts in thousands except percentages)
9. Share Transactions - continued
| Shares | Dollars |
Years ended December 31, | 2012 | 2011 | 2012 | 2011 |
Class T | | | | |
Shares sold | 1,057 | 881 | $ 11,485 | $ 9,442 |
Reinvestment of distributions | 32 | 35 | 347 | 373 |
Shares redeemed | (1,249) | (774) | (13,580) | (8,240) |
Net increase (decrease) | (160) | 142 | $ (1,748) | $ 1,575 |
Class B | | | | |
Shares sold | 19 | 27 | $ 205 | $ 297 |
Reinvestment of distributions | 1 | 2 | 10 | 19 |
Shares redeemed | (67) | (114) | (727) | (1,225) |
Net increase (decrease) | (47) | (85) | $ (512) | $ (909) |
Class C | | | | |
Shares sold | 2,859 | 2,509 | $ 31,055 | $ 26,904 |
Reinvestment of distributions | 51 | 62 | 556 | 661 |
Shares redeemed | (1,674) | (2,549) | (18,183) | (27,188) |
Net increase (decrease) | 1,236 | 22 | $ 13,428 | $ 377 |
Short-Intermediate Municipal Income | | | | |
Shares sold | 93,675 | 106,091 | $ 1,017,592 | $ 1,133,522 |
Reinvestment of distributions | 4,548 | 5,180 | 49,424 | 55,411 |
Shares redeemed | (90,005) | (111,332) | (977,843) | (1,186,447) |
Net increase (decrease) | 8,218 | (61) | $ 89,173 | $ 2,486 |
Institutional Class | | | | |
Shares sold | 13,388 | 8,223 | $ 145,505 | $ 87,964 |
Reinvestment of distributions | 176 | 115 | 1,914 | 1,228 |
Shares redeemed | (8,641) | (7,651) | (93,919) | (81,705) |
Net increase (decrease) | 4,923 | 687 | $ 53,500 | $ 7,487 |
10. Other.
The Fund's organizational documents provide former and current trustees and officers with a limited indemnification against liabilities arising in connection with the performance of their duties to the Fund. In the normal course of business, the Fund may also enter into contracts that provide general indemnifications. The Fund's maximum exposure under these arrangements is unknown as this would be dependent on future claims that may be made against the Fund. The risk of material loss from such claims is considered remote.
Annual Report
To the Trustees of Fidelity Municipal Trust and the Shareholders of Fidelity Short-Intermediate Municipal Income Fund:
In our opinion, the accompanying statement of assets and liabilities, including the schedule of investments, and the related statements of operations and of changes in net assets and the financial highlights present fairly, in all material respects, the financial position of Fidelity Short-Intermediate Municipal Income Fund (a fund of Fidelity Municipal Trust) at December 31, 2012, the results of its operations for the year then ended, the changes in its net assets for each of the two years in the period then ended and the financial highlights for each of the five years in the period then ended, in conformity with accounting principles generally accepted in the United States of America. These financial statements and financial highlights (hereafter referred to as "financial statements") are the responsibility of the Fidelity Short-Intermediate Municipal Income Fund's management. Our responsibility is to express an opinion on these financial statements based on our audits. We conducted our audits of these financial statements in accordance with the standards of the Public Company Accounting Oversight Board (United States). Those standards require that we plan and perform the audit to obtain reasonable assurance about whether the financial statements are free of material misstatement. An audit includes examining, on a test basis, evidence supporting the amounts and disclosures in the financial statements, assessing the accounting principles used and significant estimates made by management, and evaluating the overall financial statement presentation. We believe that our audits, which included confirmation of securities at December 31, 2012 by correspondence with the custodian and brokers, provide a reasonable basis for our opinion.
PricewaterhouseCoopers LLP
Boston, Massachusetts
February 14, 2013
Annual Report
The Trustees and executive officers of the trust and fund, as applicable, are listed below. The Board of Trustees governs the fund and is responsible for protecting the interests of shareholders. The Trustees are experienced executives who meet periodically throughout the year to oversee the fund's activities, review contractual arrangements with companies that provide services to the fund, oversee management of the risks associated with such activities and contractual arrangements, and review the fund's performance. Except for Elizabeth S. Acton and James C. Curvey, each of the Trustees oversees 218 funds advised by FMR or an affiliate. Ms. Acton oversees 200 funds advised by FMR or an affiliate. Mr. Curvey oversees 452 funds advised by FMR or an affiliate.
The Trustees hold office without limit in time except that (a) any Trustee may resign; (b) any Trustee may be removed by written instrument, signed by at least two-thirds of the number of Trustees prior to such removal; (c) any Trustee who requests to be retired or who has become incapacitated by illness or injury may be retired by written instrument signed by a majority of the other Trustees; and (d) any Trustee may be removed at any special meeting of shareholders by a two-thirds vote of the outstanding voting securities of the trust. Each Trustee who is not an interested person (as defined in the 1940 Act) (Independent Trustee), shall retire not later than the last day of the month in which his or her 75th birthday occurs. The Independent Trustees may waive this mandatory retirement age policy with respect to individual Trustees. The executive officers hold office without limit in time, except that any officer may resign or may be removed by a vote of a majority of the Trustees at any regular meeting or any special meeting of the Trustees. Except as indicated, each individual has held the office shown or other offices in the same company for the past five years.
Experience, Skills, Attributes, and Qualifications of the Fund's Trustees. The Governance and Nominating Committee has adopted a statement of policy that describes the experience, qualifications, attributes, and skills that are necessary and desirable for potential Independent Trustee candidates (Statement of Policy). The Board believes that each Trustee satisfied at the time he or she was initially elected or appointed a Trustee, and continues to satisfy, the standards contemplated by the Statement of Policy. The Governance and Nominating Committee also engages professional search firms to help identify potential Independent Trustee candidates who have the experience, qualifications, attributes, and skills consistent with the Statement of Policy. From time to time, additional criteria based on the composition and skills of the current Independent Trustees, as well as experience or skills that may be appropriate in light of future changes to board composition, business conditions, and regulatory or other developments, have also been considered by the professional search firms and the Governance and Nominating Committee. In addition, the Board takes into account the Trustees' commitment and participation in Board and committee meetings, as well as their leadership of standing and ad hoc committees throughout their tenure.
In determining that a particular Trustee was and continues to be qualified to serve as a Trustee, the Board has considered a variety of criteria, none of which, in isolation, was controlling. The Board believes that, collectively, the Trustees have balanced and diverse experience, qualifications, attributes, and skills, which allow the Board to operate effectively in governing the fund and protecting the interests of shareholders. Information about the specific experience, skills, attributes, and qualifications of each Trustee, which in each case led to the Board's conclusion that the Trustee should serve (or continue to serve) as a trustee of the fund, is provided below.
Annual Report
Board Structure and Oversight Function. Abigail P. Johnson is an interested person (as defined in the 1940 Act) and currently serves as Chairman. The Trustees have determined that an interested Chairman is appropriate and benefits shareholders because an interested Chairman has a personal and professional stake in the quality and continuity of services provided to the fund. Independent Trustees exercise their informed business judgment to appoint an individual of their choosing to serve as Chairman, regardless of whether the Trustee happens to be independent or a member of management. The Independent Trustees have determined that they can act independently and effectively without having an Independent Trustee serve as Chairman and that a key structural component for assuring that they are in a position to do so is for the Independent Trustees to constitute a substantial majority for the Board. The Independent Trustees also regularly meet in executive session. Albert R. Gamper, Jr. serves as Chairman of the Independent Trustees and as such (i) acts as a liaison between the Independent Trustees and management with respect to matters important to the Independent Trustees and (ii) with management prepares agendas for Board meetings.
Fidelity funds are overseen by different Boards of Trustees. The fund's Board oversees Fidelity's investment-grade bond, money market, and asset allocation funds and another Board oversees Fidelity's equity and high income funds. The asset allocation funds may invest in Fidelity funds that are overseen by such other Board. The use of separate Boards, each with its own committee structure, allows the Trustees of each group of Fidelity funds to focus on the unique issues of the funds they oversee, including common research, investment, and operational issues. On occasion, the separate Boards establish joint committees to address issues of overlapping consequences for the Fidelity funds overseen by each Board.
The Trustees operate using a system of committees to facilitate the timely and efficient consideration of all matters of importance to the Trustees, the fund, and fund shareholders and to facilitate compliance with legal and regulatory requirements and oversight of the fund's activities and associated risks. The Board, acting through its committees, has charged FMR and its affiliates with (i) identifying events or circumstances the occurrence of which could have demonstrably adverse effects on the fund's business and/or reputation; (ii) implementing processes and controls to lessen the possibility that such events or circumstances occur or to mitigate the effects of such events or circumstances if they do occur; and (iii) creating and maintaining a system designed to evaluate continuously business and market conditions in order to facilitate the identification and implementation processes described in (i) and (ii) above. Because the day-to-day operations and activities of the fund are carried out by or through FMR, its affiliates and other service providers, the fund's exposure to risks is mitigated but not eliminated by the processes overseen by the Trustees. While each of the Board's committees has responsibility for overseeing different aspects of the fund's activities, oversight is exercised primarily through the Operations and Audit Committees. In addition, an ad hoc Board committee of Independent Trustees has worked with FMR to enhance the Board's oversight of investment and financial risks, legal and regulatory risks, technology risks, and operational risks, including the development of additional risk reporting to the Board. Appropriate personnel, including but not limited to the fund's Chief Compliance Officer (CCO), FMR's internal auditor, the independent accountants, the fund's Treasurer and portfolio management personnel, make periodic reports to the Board's committees, as appropriate, including an annual review of FMR's risk management program for the Fidelity funds. The responsibilities of each standing committee, including their oversight responsibilities, are described further under "Standing Committees of the Fund's Trustees."
Annual Report
Trustees and Officers - continued
The fund's Statement of Additional Information (SAI) includes more information about the Trustees. To request a free copy, call Fidelity at 1-877-208-0098.
Interested Trustees*:
Correspondence intended for each Trustee who is an interested person may be sent to Fidelity Investments, 82 Devonshire Street, Boston, Massachusetts 02109.
Name, Age; Principal Occupations and Other Relevant Experience+ |
Abigail P. Johnson (51) |
| Year of Election or Appointment: 2009 Ms. Johnson is Trustee and Chairman of the Board of Trustees of certain Trusts. Ms. Johnson serves as President of Fidelity Financial Services (2012-present) and President of Personal, Workplace and Institutional Services (2005-present). Ms. Johnson is Chairman and Director of FMR Co., Inc. (2011-present), Chairman and Director of FMR (2011-present), and the Vice Chairman and Director (2007-present) of FMR LLC. Previously, Ms. Johnson served as President and a Director of FMR (2001-2005), a Trustee of other investment companies advised by FMR, Fidelity Investments Money Management, Inc., and FMR Co., Inc. (2001-2005), Senior Vice President of the Fidelity funds (2001-2005), and managed a number of Fidelity funds. Ms. Abigail P. Johnson and Mr. Arthur E. Johnson are not related. |
James C. Curvey (77) |
| Year of Election or Appointment: 2007 Mr. Curvey also serves as Trustee (2007-present) of other investment companies advised by FMR. Mr. Curvey is a Director of Fidelity Investments Money Management, Inc. (2009-present), Director of Fidelity Research & Analysis Co. (2009-present) and Director of FMR and FMR Co., Inc. (2007-present). Mr. Curvey is also Vice Chairman (2007-present) and Director of FMR LLC. In addition, Mr. Curvey serves as an Overseer for the Boston Symphony Orchestra and a member of the Trustees of Villanova University. Previously, Mr. Curvey was the Vice Chairman (2006-2007) and Director (2000-2007) of FMR Corp. |
* Trustees have been determined to be "Interested Trustees" by virtue of, among other things, their affiliation with the trust or various entities under common control with FMR.
+ The information above includes each Trustee's principal occupation during the last five years and other information relating to the experience, attributes, and skills relevant to each Trustee's qualifications to serve as a Trustee, which led to the conclusion that each Trustee should serve as a Trustee for the fund.
Independent Trustees:
Correspondence intended for each Independent Trustee (that is, the Trustees other than the Interested Trustees) may be sent to Fidelity Investments, P.O. Box 55235, Boston, Massachusetts 02205-5235.
Name, Age; Principal Occupations and Other Relevant Experience+ |
Elizabeth S. Acton (61) |
| Year of Election or Appointment: 2013 Ms. Acton is Trustee of certain Trusts. Prior to her retirement in April 2012, Ms. Acton was Executive Vice President, Finance (November 2011-April 2012), Executive Vice President, Chief Financial Officer (April 2002-November 2011), and Treasurer (May 2004-May 2005) of Comerica Incorporated (financial services). Prior to joining Comerica, Ms. Acton held a variety of positions at Ford Motor Company (1983-2002), including Vice President and Treasurer (2000-2002) and Executive Vice President and Chief Financial Officer of Ford Motor Credit Company (1998-2000). Ms. Acton currently serves as a member of the Board of Directors and Audit and Finance Committees of Beazer Homes USA, Inc. (homebuilding, 2012-present). |
Albert R. Gamper, Jr. (70) |
| Year of Election or Appointment: 2006 Mr. Gamper is Chairman of the Independent Trustees of the Fixed Income and Asset Allocation Funds (2012-present). Prior to his retirement in December 2004, Mr. Gamper served as Chairman of the Board of CIT Group Inc. (commercial finance). During his tenure with CIT Group Inc. Mr. Gamper served in numerous senior management positions, including Chairman (1987-1989; 1999-2001; 2002-2004), Chief Executive Officer (1987-2004), and President (2002-2003). Mr. Gamper currently serves as a member of the Board of Directors of Public Service Enterprise Group (utilities, 2000-present), a member of the Board of Trustees, Rutgers University (2004-present), and Chairman of the Board of Barnabas Health Care System. Previously, Mr. Gamper served as Vice Chairman of the Independent Trustees of the Fixed Income and Asset Allocation Funds (2011-2012) and as Chairman of the Board of Governors, Rutgers University (2004-2007). |
Robert F. Gartland (61) |
| Year of Election or Appointment: 2010 Mr. Gartland is Chairman and an investor in Gartland and Mellina Group Corp. (consulting, 2009-present). Previously, Mr. Gartland served as a partner and investor of Vietnam Partners LLC (investments and consulting, 2008-2011). Prior to his retirement, Mr. Gartland held a variety of positions at Morgan Stanley (financial services, 1979-2007) including Managing Director (1987-2007). |
Arthur E. Johnson (65) |
| Year of Election or Appointment: 2008 Mr. Johnson serves as a member of the Board of Directors of Eaton Corporation (diversified power management, 2009-present), AGL Resources, Inc. (holding company, 2002-present) and Booz Allen Hamilton (management consulting, 2011-present). Prior to his retirement, Mr. Johnson served as Senior Vice President of Corporate Strategic Development of Lockheed Martin Corporation (defense contractor, 1999-2009). He previously served on the Board of Directors of IKON Office Solutions, Inc. (1999-2008) and Delta Airlines (2005-2007). Mr. Arthur E. Johnson is not related to Ms. Abigail P. Johnson. |
Michael E. Kenneally (58) |
| Year of Election or Appointment: 2009 Previously, Mr. Kenneally served as a Member of the Advisory Board for certain Fidelity Fixed Income and Asset Allocation Funds (2008-2009). Prior to his retirement, Mr. Kenneally served as Chairman and Global Chief Executive Officer of Credit Suisse Asset Management (2003-2005). Mr. Kenneally was a Director of the Credit Suisse Funds (U.S. mutual funds, 2004-2008) and certain other closed-end funds (2004-2005) and was awarded the Chartered Financial Analyst (CFA) designation in 1991. |
James H. Keyes (72) |
| Year of Election or Appointment: 2007 Mr. Keyes serves as a member of the Boards of Navistar International Corporation (manufacture and sale of trucks, buses, and diesel engines, since 2002) and Pitney Bowes, Inc. (integrated mail, messaging, and document management solutions, since 1998). Prior to his retirement, Mr. Keyes served as Chairman and Chief Executive Officer of Johnson Controls (automotive, building, and energy, 1998-2002) and as a member of the Board of LSI Logic Corporation (semiconductor technologies, 1984-2008). |
Marie L. Knowles (66) |
| Year of Election or Appointment: 2001 Ms. Knowles is Vice Chairman of the Independent Trustees of the Fixed Income and Asset Allocation Funds (2012-present). Prior to Ms. Knowles' retirement in June 2000, she served as Executive Vice President and Chief Financial Officer of Atlantic Richfield Company (ARCO) (diversified energy, 1996-2000). From 1993 to 1996, she was a Senior Vice President of ARCO and President of ARCO Transportation Company. She served as a Director of ARCO from 1996 to 1998. Ms. Knowles currently serves as a Director and Chairman of the Audit Committee of McKesson Corporation (healthcare service, since 2002). Ms. Knowles is an Honorary Trustee of the Brookings Institution and a member of the Board of the Catalina Island Conservancy and of the Santa Catalina Island Company (2009-present). She also serves as a member of the Advisory Board for the School of Engineering of the University of Southern California and the Foundation Board of the School of Architecture at the University of Virginia (2007-present). Previously, Ms. Knowles served as a Director of Phelps Dodge Corporation (copper mining and manufacturing, 1994-2007). |
Kenneth L. Wolfe (73) |
| Year of Election or Appointment: 2005 Prior to his retirement, Mr. Wolfe served as Chairman and a Director (2007-2009) and Chairman and Chief Executive Officer (1994-2001) of Hershey Foods Corporation. He also served as a member of the Boards of Adelphia Communications Corporation (telecommunications, 2003-2006), Bausch & Lomb, Inc. (medical/pharmaceutical, 1993-2007), and Revlon, Inc. (personal care products, 2004-2009). Mr. Wolfe previously served as Chairman of the Independent Trustees of the Fixed Income and Asset Allocation Funds (2008-2012). |
+ The information above includes each Trustee's principal occupation during the last five years and other information relating to the experience, attributes, and skills relevant to each Trustee's qualifications to serve as a Trustee, which led to the conclusion that each Trustee should serve as a Trustee for the fund.
Executive Officers:
Correspondence intended for each executive officer may be sent to Fidelity Investments, 82 Devonshire Street, Boston, Massachusetts 02109.
Name, Age; Principal Occupation |
Stephanie J. Dorsey (43) |
| Year of Election or Appointment: 2013 President and Treasurer of Fidelity's Fixed Income and Asset Allocation Funds. Ms. Dorsey also serves as Assistant Treasurer of other Fidelity funds (2010-present) and is an employee of Fidelity Investments (2008-present). Previously, Ms. Dorsey served as Deputy Treasurer of Fidelity's Fixed Income and Asset Allocation Funds (2008-2013), Treasurer (2004-2008) of the JPMorgan Mutual Funds and Vice President (2004-2008) of JPMorgan Chase Bank. |
Charles S. Morrison (52) |
| Year of Election or Appointment: 2012 Vice President of Fidelity's Fixed Income and Asset Allocation Funds. Mr. Morrison also serves as President, Fixed Income and is an employee of Fidelity Investments. Previously, Mr. Morrison served as Vice President of Fidelity's Money Market Funds (2005-2009), President, Money Market Group Leader of FMR (2009), and Senior Vice President, Money Market Group of FMR (2004-2009). Mr. Morrison also served as Vice President of Fidelity's Bond Funds (2002-2005), certain Balanced Funds (2002-2005), and certain Asset Allocation Funds (2002-2007), and as Senior Vice President (2002-2005) of Fidelity's Fixed Income Division. |
Robert P. Brown (49) |
| Year of Election or Appointment: 2012 Vice President of Fidelity's Bond Funds. Mr. Brown also serves as Executive Vice President of Fidelity Investments Money Management, Inc. (2010-present), President, Bond Group of FMR (2011-present), Director and Managing Director, Research of Fidelity Management & Research (U.K.) Inc. (2008-present) and is an employee of Fidelity Investments. Previously, Mr. Brown served as President, Money Market Group of FMR (2010-2011) and Vice President of Fidelity's Money Market Funds (2010-2012). |
Scott C. Goebel (44) |
| Year of Election or Appointment: 2008 Secretary and Chief Legal Officer (CLO) of the Fidelity funds. Mr. Goebel also serves as Secretary of Fidelity Investments Money Management, Inc. (FIMM) (2010-present) and Fidelity Research and Analysis Company (FRAC) (2010-present); Secretary and CLO of The North Carolina Capital Management Trust: Cash and Term Portfolios (2008-present); General Counsel, Secretary, and Senior Vice President of FMR (2008-present) and FMR Co., Inc. (2008-present); employed by FMR LLC or an affiliate (2001-present); Chief Legal Officer of Fidelity Management & Research (Hong Kong) Limited (2008-present) and Assistant Secretary of Fidelity Management & Research (Japan) Inc. (2008-present), and Fidelity Management & Research (U.K.) Inc. (2008-present). Previously, Mr. Goebel served as Assistant Secretary of FIMM (2008-2010), FRAC (2008-2010), and the Funds (2007-2008) and as Vice President and Secretary of Fidelity Distributors Corporation (FDC) (2005-2007). |
Ramon Herrera (38) |
| Year of Election or Appointment: 2012 Assistant Secretary of Fidelity's Fixed Income and Asset Allocation Funds. Mr. Herrera also serves as Vice President, Associate General Counsel (2010-present) and is an employee of Fidelity Investments (2004-present). |
Elizabeth Paige Baumann (44) |
| Year of Election or Appointment: 2012 Anti-Money Laundering (AML) Officer of the Fidelity funds. Ms. Baumann also serves as AML Officer of The North Carolina Capital Management Trust: Cash and Term Portfolios (2012-present), Chief AML Officer of FMR LLC (2012-present), and is an employee of Fidelity Investments. Previously, Ms. Baumann served as Vice President and Deputy Anti-Money Laundering Officer (2007-2012). |
Christine Reynolds (54) |
| Year of Election or Appointment: 2008 Chief Financial Officer of the Fidelity funds. Ms. Reynolds became President of Fidelity Pricing and Cash Management Services (FPCMS) in August 2008. Ms. Reynolds served as Chief Operating Officer of FPCMS (2007-2008). Previously, Ms. Reynolds served as President, Treasurer, and Anti-Money Laundering officer of the Fidelity funds (2004-2007). |
Michael H. Whitaker (45) |
| Year of Election or Appointment: 2008 Chief Compliance Officer of Fidelity's Fixed Income and Asset Allocation Funds. Mr. Whitaker also serves as Chief Compliance Officer of The North Carolina Capital Management Trust: Cash and Term Portfolios (2008-present). Mr. Whitaker is an employee of Fidelity Investments (2007-present). Prior to joining Fidelity Investments, Mr. Whitaker worked at MFS Investment Management where he served as Senior Vice President and Chief Compliance Officer (2004-2006), and Assistant General Counsel. |
Joseph F. Zambello (55) |
| Year of Election or Appointment: 2011 Deputy Treasurer of the Fidelity funds. Mr. Zambello is an employee of Fidelity Investments. Previously, Mr. Zambello served as Vice President of FMR's Program Management Group (2009-2011) and Vice President of the Transfer Agent Oversight Group (2005-2009). |
Stephen Sadoski (41) |
| Year of Election or Appointment: 2013 Deputy Treasurer of Fidelity's Fixed Income and Asset Allocation Funds. Mr. Sadoski also serves as Deputy Treasurer of other Fidelity funds (2012-present) and is an employee of Fidelity Investments (2012-present). Previously, Mr. Sadoski served as Assistant Treasurer of Fidelity's Fixed Income and Asset Allocation Funds (2012-2013), an assistant chief accountant in the Division of Investment Management of the Securities and Exchange Commission (SEC) (2009-2012) and as a senior manager at Deloitte & Touche (1997-2009). |
Adrien E. Deberghes (45) |
| Year of Election or Appointment: 2010 Assistant Treasurer of Fidelity's Fixed Income and Asset Allocation Funds. Mr. Deberghes also serves as Vice President and Assistant Treasurer (2011-present) and Deputy Treasurer (2008-present) of other Fidelity funds, and is an employee of Fidelity Investments (2008-present). Previously, Mr. Deberghes served as Senior Vice President of Mutual Fund Administration at State Street Corporation (2007-2008), Senior Director of Mutual Fund Administration at Investors Bank & Trust (2005-2007), and Director of Finance for Dunkin' Brands (2000-2005). |
Kenneth B. Robins (43) |
| Year of Election or Appointment: 2009 Assistant Treasurer of the Fidelity Fixed Income and Asset Allocation Funds. Mr. Robins also serves as President and Treasurer of other Fidelity funds (2008-present; 2010-present) and is an employee of Fidelity Investments (2004-present). Previously, Mr. Robins served as Deputy Treasurer of the Fidelity funds (2005-2008) and Treasurer and Chief Financial Officer of The North Carolina Capital Management Trust: Cash and Term Portfolios (2006-2008). |
Gary W. Ryan (54) |
| Year of Election or Appointment: 2005 Assistant Treasurer of the Fidelity funds. Mr. Ryan is an employee of Fidelity Investments. Previously, Mr. Ryan served as Vice President of Fund Reporting in Fidelity Pricing and Cash Management Services (FPCMS) (1999-2005). |
Jonathan Davis (44) |
| Year of Election or Appointment: 2010 Assistant Treasurer of the Fidelity funds. Mr. Davis is also Assistant Treasurer of Fidelity Rutland Square Trust II and Fidelity Commonwealth Trust II. Mr. Davis is an employee of Fidelity Investments. Previously, Mr. Davis served as Vice President and Associate General Counsel of FMR LLC (2003-2010). |
Annual Report
The Board of Trustees of Advisor Short-Intermediate Municipal Income Fund voted to pay to shareholders of record at the opening of business on record date, the following distributions per share derived from capital gains realized from sales of portfolio securities:
| Pay Date | Record Date | Dividends | Capital Gains |
Class A | 02/11/13 | 02/08/13 | $- | $0.003 |
Class T | 02/11/13 | 02/08/13 | $- | $0.003 |
Class B | 02/11/13 | 02/08/13 | $- | $0.003 |
Class C | 02/11/13 | 02/08/13 | $- | $0.003 |
During fiscal year ended 2012, 100% of the fund's income dividends was free from federal income tax, and 6.62% of the fund's income dividends was subject to the federal alternative minimum tax.
The fund hereby designates as a capital gain dividend with respect to the taxable year ended December 31, 2012, $5,764,482, or, if subsequently determined to be different, the net capital gain of such year.
The fund will notify shareholders in January 2013 of amounts for use in preparing 2012 income tax returns.
Annual Report
Board Approval of Investment Advisory Contracts and Management Fees
Fidelity Short-Intermediate Municipal Income Fund
Each year, the Board of Trustees, including the Independent Trustees (together, the Board), votes on the renewal of the management contract and sub-advisory agreements (together, the Advisory Contracts) for the fund. The Board, assisted by the advice of fund counsel and Independent Trustees' counsel, requests and considers a broad range of information relevant to the renewal of the Advisory Contracts throughout the year.
The Board meets regularly and, at each of its meetings, covers an extensive agenda of topics and materials and considers factors that are relevant to its annual consideration of the renewal of the fund's Advisory Contracts, including the services and support provided to the fund and its shareholders. The Board has established three standing committees, Operations, Audit, and Governance and Nominating, each composed of and chaired by Independent Trustees with varying backgrounds, to which the Board has assigned specific subject matter responsibilities in order to enhance effective decision-making by the Board. The Operations Committee, of which all of the Independent Trustees are members, meets regularly throughout the year and, among other matters, considers matters specifically related to the annual consideration of the renewal of the fund's Advisory Contracts. The Board, acting directly and through its Committees, requests and receives information concerning the annual consideration of the renewal of the fund's Advisory Contracts. The Board also meets as needed to consider matters specifically related to the Board's annual consideration of the renewal of Advisory Contracts. Members of the Board may also meet with trustees of other Fidelity funds through ad hoc joint committees to discuss certain matters relevant to the Fidelity funds.
At its September 2012 meeting, the Board of Trustees, including the Independent Trustees, unanimously determined to renew the fund's Advisory Contracts. In reaching its determination, the Board considered all factors it believed relevant, including (i) the nature, extent, and quality of the services to be provided to the fund and its shareholders (including the investment performance of the fund); (ii) the competitiveness of the fund's management fee and total expense ratio relative to peer funds; (iii) the total costs of the services to be provided by and the profits to be realized by Fidelity from its relationship with the fund; (iv) the extent to which economies of scale exist and would be realized as the fund grows; and (v) whether fee levels reflect these economies of scale, if any, for the benefit of fund shareholders.
In considering whether to renew the Advisory Contracts for the fund, the Board reached a determination, with the assistance of fund counsel and Independent Trustees' counsel and through the exercise of its business judgment, that the renewal of the Advisory Contracts is in the best interests of the fund and its shareholders and that the compensation payable under the Advisory Contracts is fair and reasonable. The Board's decision to renew the Advisory Contracts was not based on any single factor, but rather was based on a comprehensive consideration of all the information provided to the Board at its meetings throughout the year. The Board, in reaching its determination to renew the Advisory Contracts, was aware that shareholders in the fund have a broad range of investment choices available to them, including a wide choice among mutual funds offered by Fidelity's competitors, and that the fund's shareholders, who have the opportunity to review and weigh the disclosure provided by the fund in its prospectus and other public disclosures, have chosen to invest in this fund, managed by Fidelity.
Annual Report
Board Approval of Investment Advisory Contracts and
Management Fees - continued
Nature, Extent, and Quality of Services Provided. The Board considered the staffing within the investment adviser, FMR, and the sub-advisers (together, the Investment Advisers), including the backgrounds of the fund's investment personnel, and also considered the fund's investment objective, strategies, and related investment philosophy. The Independent Trustees also had discussions with senior management of Fidelity's investment operations and investment groups. The Board considered the structure of the portfolio manager compensation program and whether this structure provides appropriate incentives to act in the best interests of the fund.
Resources Dedicated to Investment Management and Support Services. The Board reviewed the general qualifications and capabilities of the Investment Advisers' investment staff, including its size, education, experience, and resources, as well as the Investment Advisers' approach to recruiting, managing, and compensating investment personnel. The Board also noted that FMR has continued to increase the resources devoted to non-U.S. offices, including expansion of Fidelity's global investment organization. The Board noted that Fidelity's analysts have extensive resources, tools and capabilities that allow them to conduct sophisticated quantitative and fundamental analysis, as well as credit analysis of issuers, counterparties and guarantors. The Board also believes that Fidelity's investment professionals have sufficient access to global information and data so as to provide competitive investment results over time, and that those professionals also have access to sophisticated tools that permit them to assess portfolio construction and risk and performance attribution characteristics continuously, as well as to transmit new information and research conclusions rapidly around the world. Additionally, in its deliberations, the Board considered the Investment Advisers' trading and risk management capabilities and resources, which are an integral part of the investment management process.
Shareholder and Administrative Services. The Board considered (i) the nature, extent, quality, and cost of advisory, administrative, and shareholder services performed by the Investment Advisers and their affiliates under the Advisory Contracts and under separate agreements covering transfer agency and pricing and bookkeeping services for the fund; (ii) the nature and extent of the supervision of third party service providers, principally custodians and subcustodians; and (iii) the resources devoted to, and the record of compliance with, the fund's compliance policies and procedures.
Annual Report
The Board noted that the growth of fund assets over time across the complex allows Fidelity to reinvest in the development of services designed to enhance the value or convenience of the Fidelity funds as investment vehicles. These services include 24-hour access to account information and market information through telephone representatives and over the Internet, investor education materials and asset allocation tools, and the expanded availability of Fidelity Investor Centers.
Investment in a Large Fund Family. The Board considered the benefits to shareholders of investing in a Fidelity fund, including the benefits of investing in a fund that is part of a large family of funds offering a variety of investment disciplines and providing a large variety of mutual fund investor services. The Board noted that Fidelity had taken, or had made recommendations that resulted in the Fidelity funds taking, a number of actions over the previous year that benefited particular funds, including (i) continuing to dedicate additional resources to investment research and support of the senior management team that oversees asset management; (ii) persisting in efforts to enhance Fidelity's research capabilities, in particular, international research; (iii) launching new funds and making other enhancements to meet client needs for global and income-oriented solutions; (iv) continuing to launch dedicated lower cost underlying funds to meet investment management's portfolio construction needs related to expanding underlying fund options, specifically for the Freedom Fund product lines; (v) adopting a sector neutral investment approach for certain funds and utilizing a team of portfolio managers to manage certain sector-neutral funds; (vi) rationalizing product lines and gaining increased efficiencies through combinations of several funds with other funds; (vii) strengthening the Spartan Index Fund product line by adding new funds and/or new low-cost institutional share classes, restructuring fund expenses to accommodate new classes, and reducing investment minimums for certain classes of shares; (viii) modifying the eligibility criteria for Institutional Class shares to increase their appeal to government entities and charitable investors; and (ix) reducing certain transfer agent fee rates.
Investment Performance. The Board considered whether the fund has operated in accordance with its investment objective, as well as its record of compliance with its investment restrictions. It also reviewed the fund's absolute investment performance for each class, as well as the fund's relative investment performance for each class measured over multiple periods against (i) a broad-based securities market index, and (ii) a peer group of mutual funds deemed appropriate by Fidelity and reviewed by the Board. The following charts considered by the Board show, over the one-, three-, and five-year periods ended December 31, 2011, the cumulative total returns of the retail class and Class C of the fund, the cumulative total returns of a broad-based securities market index ("benchmark"), and a range of cumulative total returns of a peer group of mutual funds identified by Lipper Inc. as having an investment objective similar to that of the fund. The returns of the retail class and Class C show the performance of the highest and lowest performing classes, respectively (based on five-year performance). The box within each chart shows the 25th percentile return (top of box) and the 75th percentile return (bottom of box) of the peer group. Returns shown above the box are in the first quartile and returns shown below the box are in the fourth quartile. The percentage beaten numbers noted below each chart correspond to the percentile box and represent the percentage of funds in the peer group whose performance was equal to or lower than that of the class indicated.
Annual Report
Board Approval of Investment Advisory Contracts and
Management Fees - continued
Fidelity Short-Intermediate Municipal Income Fund

The Board reviewed the fund's relative investment performance against its peer group and noted that the performance of the retail class of the fund was in the third quartile for the one- and three-year periods and the second quartile for the five-year period. The Board also noted that the investment performance of the fund was lower than its benchmark for the three- and five-year periods, although the one-year total return of the retail class compared favorably to its benchmark. The Board considered that the variations in performance among the fund's classes reflect the variations in class expenses, which result in lower performance for higher expense classes. The Board discussed with FMR actions to improve the fund's disappointing performance relative to its peer group. The Board also reviewed the fund's performance since inception as well as performance in the current year. The Board will continue to closely monitor the performance of the fund in the coming year and discuss with FMR other appropriate actions to address the performance of the fund.
Based on its review, the Board concluded that the nature, extent, and quality of services provided to the fund under the Advisory Contracts should benefit the fund's shareholders.
Annual Report
Competitiveness of Management Fee and Total Expense Ratio. The Board considered the fund's management fee and total expense ratio compared to "mapped groups" of competitive funds and classes. Fidelity creates "mapped groups" by combining similar Lipper investment objective categories that have comparable management fee characteristics. Combining Lipper investment objective categories aids the Board's management fee and total expense ratio comparisons by broadening the competitive group used for comparison and by reducing the number of universes to which various Fidelity funds are compared.
Management Fee. The Board considered two proprietary management fee comparisons for the 12-month periods shown in the chart below. The group of Lipper funds used by the Board for management fee comparisons is referred to below as the "Total Mapped Group" and, for the reasons explained above, is broader than the Lipper peer group used by the Board for performance comparisons. The Total Mapped Group comparison focuses on a fund's standing relative to the total universe of comparable funds available to investors in terms of gross management fees before expense reimbursements or caps. "TMG %" represents the percentage of funds in the Total Mapped Group that had management fees that were lower than the fund's. For example, a TMG % of 25% means that 75% of the funds in the Total Mapped Group had higher management fees than the fund. The "Asset-Size Peer Group" (ASPG) comparison focuses on a fund's standing relative to non-Fidelity funds similar in size to the fund within the Total Mapped Group. The ASPG represents at least 15% of the funds in the Total Mapped Group with comparable asset size and management fee characteristics, subject to a minimum of 50 funds (or all funds in the Total Mapped Group if fewer than 50). Additional information, such as the ASPG quartile in which the fund's management fee ranked, is also included in the chart and considered by the Board.
Annual Report
Board Approval of Investment Advisory Contracts and
Management Fees - continued
Fidelity Short-Intermediate Municipal Income Fund
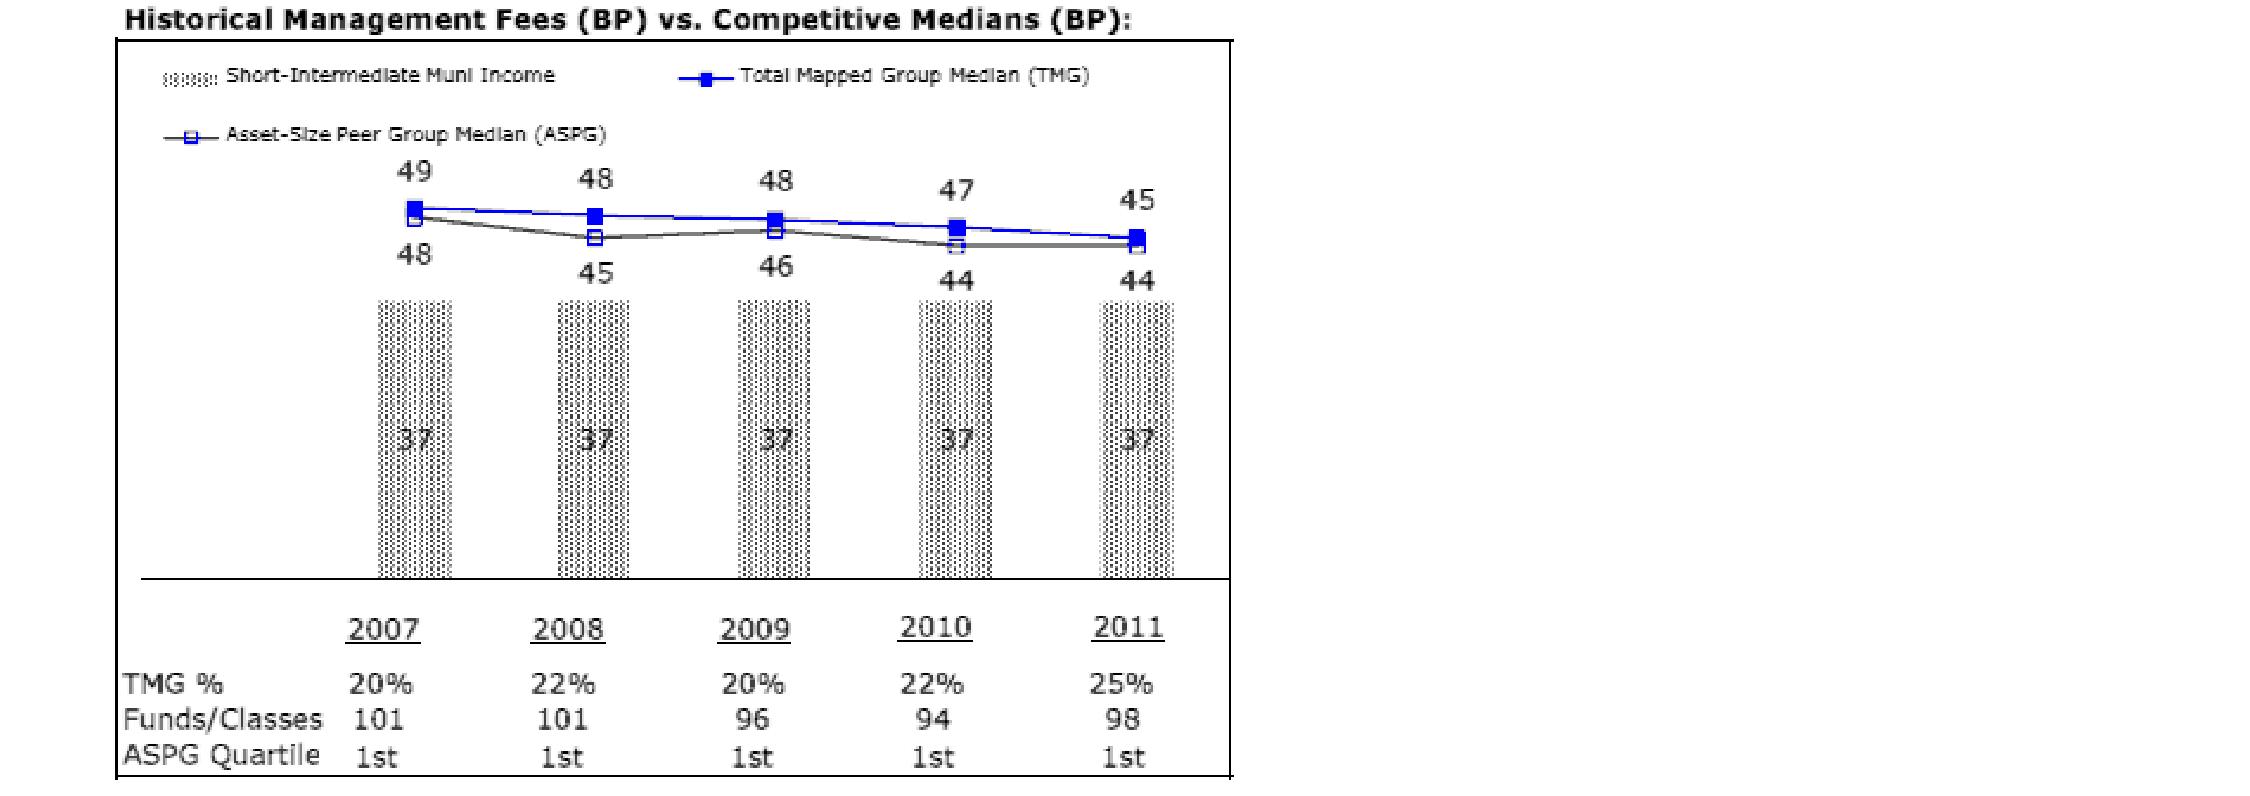
The Board noted that the fund's management fee ranked below the median of its Total Mapped Group and below the median of its ASPG for 2011.
Based on its review, the Board concluded that the fund's management fee is fair and reasonable in light of the services that the fund receives and the other factors considered.
Total Expense Ratio. In its review of each class's total expense ratio, the Board considered the fund's management fee as well as other fund or class expenses, as applicable, such as transfer agent fees, pricing and bookkeeping fees, fund-paid 12b-1 fees, and custodial, legal, and audit fees. The Board also noted the effects of any waivers and reimbursements on fees and expenses. As part of its review, the Board also considered the current and historical total expense ratios of each class of the fund compared to competitive fund median expenses. Each class of the fund is compared to those funds and classes in the Total Mapped Group (used by the Board for management fee comparisons) that have a similar sales load structure.
The Board noted that the total expense ratio of each of Class B and the retail class ranked below its competitive median for 2011 and the total expense ratio of each of Class A, Class T, Class C, and Institutional Class ranked above its competitive median for 2011. The Board considered that various factors, including 12b-1 fees and relatively higher other expenses in the case of small fund size, can affect total expense ratios. The Board considered that Class T is primarily sold load-waived in the retirement plan market, where its 0.50% 12b-1 fee is comparable to the 12b-1 fees of the no-load classes with which it competes in the retirement plan market. The Board noted that the fund offers multiple classes, each of which has a different sales load and 12b-1 fee structure, and that the multiple structures are intended to offer a range of pricing options for the intermediary market. The Board also noted that the total expense ratios of the classes vary primarily by the level of their 12b-1 fees, although differences in transfer agent fees may also cause expenses to vary from class to class.
Annual Report
Fees Charged to Other Fidelity Clients. The Board also considered Fidelity fee structures and other information with respect to clients of FMR and its affiliates, such as other mutual funds advised or subadvised by FMR or its affiliates, pension plan clients, and other institutional clients. The Board noted the findings of the 2010 ad hoc joint committee (created with the board of other Fidelity funds), which reviewed and compared Fidelity's institutional investment advisory business with its business of providing services to the Fidelity funds, including the differences in services provided, fees charged, and costs incurred, as well as competition in their respective marketplaces.
Based on its review of total expense ratios and fees charged to other Fidelity clients, the Board concluded that the total expense ratio of each class of the fund was reasonable, although in some cases above the median of the universe presented for comparison, in light of the services that the fund and its shareholders receive and the other factors considered.
Costs of the Services and Profitability. The Board considered the revenues earned and the expenses incurred by Fidelity in conducting the business of developing, marketing, distributing, managing, administering and servicing the fund and its shareholders. The Board also considered the level of Fidelity's profits in respect of all the Fidelity funds.
On an annual basis, FMR presents to the Board Fidelity's profitability for the fund. Fidelity calculates the profitability for each fund, as well as aggregate profitability for groups of Fidelity funds and all Fidelity funds, using a series of detailed revenue and cost allocation methodologies which originate with the books and records of Fidelity on which Fidelity's audited financial statements are based. The Audit Committee of the Board reviews any significant changes from the prior year's methodologies.
PricewaterhouseCoopers LLP (PwC), independent registered public accounting firm and auditor to Fidelity and certain Fidelity funds, has been engaged annually by the Board as part of the Board's assessment of Fidelity's profitability analysis. PwC's engagement includes the review and assessment of Fidelity's methodologies used in determining the revenues and expenses attributable to Fidelity's mutual fund business, and completion of agreed-upon procedures surrounding the mathematical accuracy of fund profitability and its conformity to allocation methodologies. After considering PwC's reports issued under the engagement and information provided by Fidelity, the Board concluded that while other allocation methods may also be reasonable, Fidelity's profitability methodologies are reasonable in all material respects.
Annual Report
Board Approval of Investment Advisory Contracts and
Management Fees - continued
The Board also reviewed Fidelity's non-fund businesses and fall-out benefits related to the mutual fund business as well as cases where Fidelity's affiliates may benefit from or be related to the fund's business.
The Board considered the costs of the services provided by and the profits realized by Fidelity in connection with the operation of the fund and was satisfied that the profitability was not excessive in the circumstances.
Economies of Scale. The Board considered whether there have been economies of scale in respect of the management of the Fidelity funds, whether the Fidelity funds (including the fund) have appropriately benefited from any such economies of scale, and whether there is potential for realization of any further economies of scale. The Board considered the extent to which the fund will benefit from economies of scale through increased services to the fund, through waivers or reimbursements, or through fee or expense reductions. The Board also noted that in 2009, it and the board of other Fidelity funds created an ad hoc committee (the Economies of Scale Committee) to analyze whether FMR attains economies of scale in respect of the management and servicing of the Fidelity funds, whether the Fidelity funds have appropriately benefited from such economies of scale, and whether there is potential for realization of any further economies of scale.
The Board recognized that the fund's management contract incorporates a "group fee" structure, which provides for lower group fee rates as total fund assets under FMR's management increase, and for higher group fee rates as total fund assets under FMR's management decrease. FMR calculates the group fee rates based on a tiered asset "breakpoint" schedule that varies based on asset class. The Board considered that the group fee is designed to deliver the benefits of economies of scale to fund shareholders when total Fidelity fund assets increase, even if assets of any particular fund are unchanged or have declined, because some portion of Fidelity's costs are attributable to services provided to all Fidelity funds, and all funds benefit if those costs can be allocated among more assets. The Board concluded that, given the group fee structure, fund shareholders will benefit from lower management fees as assets under FMR's management increase at the fund complex level, regardless of whether Fidelity achieves any such economies of scale.
The Board concluded, taking into account the analysis of the Economies of Scale Committee, that economies of scale, if any, are being appropriately shared between fund shareholders and Fidelity.
Additional Information Requested by the Board. In order to develop fully the factual basis for consideration of the Fidelity funds' Advisory Contracts, the Board requested and received additional information on certain topics, including: (i) Fidelity's fund profitability methodology, profitability trends for certain funds, and the impact of certain factors on fund profitability results; (ii) portfolio manager changes that have occurred during the past year and the amount of the investment that each portfolio manager has made in the Fidelity fund(s) that he or she manages; (iii) Fidelity's compensation structure for portfolio managers, research analysts, and other key personnel, including its effects on fund profitability, the rationale for the compensation structure, and the extent to which current market conditions have affected retention and recruitment; (iv) the compensation paid to fund sub-advisers on behalf of the Fidelity funds; (v) Fidelity's fee structures, including the group fee structure, and the rationale for recommending different fees among different categories of funds and classes; (vi) Fidelity's voluntary waiver of its fees to maintain minimum yields for certain money market funds and classes as well as contractual waivers in place for certain funds; (vii) regulatory and industry developments, including those affecting money market funds and target date funds, and the potential impact to Fidelity; (viii) Fidelity's transfer agent fees, expenses, and services, and drivers for determining the transfer agent fee structure of different funds and classes; (ix) management fee rates charged by FMR or Fidelity entities to other Fidelity clients; (x) the allocation of and historical trends in Fidelity's realization of fall-out benefits; and (xi) explanations regarding the relative total expense ratios of certain funds and classes, total expense competitive trends, and actions that might be taken by FMR to reduce total expense ratios for certain funds and classes or to achieve further economies of scale.
Annual Report
Based on its evaluation of all of the conclusions noted above, and after considering all factors it believed relevant, the Board ultimately concluded that the advisory fee structures are fair and reasonable, and that the fund's Advisory Contracts should be renewed.
Annual Report
Investment Adviser
Fidelity Management & Research Company
Boston, MA
Investment Sub-Advisers
Fidelity Investments Money
Management, Inc.
Fidelity Management & Research
(U.K.) Inc.
Fidelity Management & Research
(Hong Kong) Limited
Fidelity Management & Research
(Japan) Inc.
General Distributor
Fidelity Distributors Corporation
Smithfield, RI
Transfer and Service Agents
Citibank, N.A.
New York, NY
Fidelity Investments Institutional
Operations Company, Inc.
Boston, MA
Fidelity Service Company, Inc.
Boston, MA
Custodian
Citibank, N.A.
New York, NY
(Fidelity Investment logo)(registered trademark)
ASTM-UANN-0213
1.796655.109
(Fidelity Investment logo)(registered trademark)
Fidelity Advisor®
Short-Intermediate
Municipal Income
Fund - Institutional Class
Annual Report
December 31, 2012
(Fidelity Cover Art)
Institutional Class is a class of
Fidelity® Short-Intermediate
Municipal Income Fund
Contents
Performance | (Click Here) | How the fund has done over time. |
Management's Discussion of Fund Performance | (Click Here) | The Portfolio Manager's review of fundperformance and strategy. |
Shareholder Expense Example | (Click Here) | An example of shareholder expenses. |
Investment Changes | (Click Here) | A summary of major shifts in the fund's investments over the past six months. |
Investments | (Click Here) | A complete list of the fund's investments with their market values. |
Financial Statements | (Click Here) | Statements of assets and liabilities, operations, and changes in net assets, as well as financial highlights. |
Notes | (Click Here) | Notes to the financial statements. |
Report of Independent Registered Public Accounting Firm | (Click Here) | |
Trustees and Officers | (Click Here) | |
Distributions | (Click Here) | |
Board Approval of Investment Advisory Contracts and Management Fees | (Click Here) | |
To view a fund's proxy voting guidelines and proxy voting record for the 12-month period ended June 30, visit http://www.fidelity.com/proxyvotingresults or visit the Securities and Exchange Commission's (SEC) web site at http://www.sec.gov. You may also call 1-877-208-0098 to request a free copy of the proxy voting guidelines.
Standard & Poor's, S&P and S&P 500 are registered service marks of The McGraw-Hill Companies, Inc. and have been licensed for use by Fidelity Distributors Corporation.
Other third-party marks appearing herein are the property of their respective owners.
All other marks appearing herein are registered or unregistered trademarks or service marks of FMR LLC or an affiliated company. © 2013 FMR LLC. All rights reserved.
Annual Report
This report and the financial statements contained herein are submitted for the general information of the shareholders of the fund. This report is not authorized for distribution to prospective investors in the fund unless preceded or accompanied by an effective prospectus.
A fund files its complete schedule of portfolio holdings with the SEC for the first and third quarters of each fiscal year on Form N-Q. Forms N-Q are available on the SEC's web site at http://www.sec.gov. A fund's Forms N-Q may be reviewed and copied at the SEC's Public Reference Room in Washington, DC. Information regarding the operation of the SEC's Public Reference Room may be obtained by calling 1-800-SEC-0330. For a complete list of a fund's portfolio holdings, view the most recent holdings listing, semiannual report, or annual report on Fidelity's web site at http://www.fidelity.com, http://www.advisor.fidelity.com, or http://www.401k.com as applicable.
NOT FDIC INSURED • MAY LOSE VALUE • NO BANK GUARANTEE
Neither the fund nor Fidelity Distributors Corporation is a bank.
Annual Report
Average annual total return reflects the change in the value of an investment, assuming reinvestment of the class' distributions from dividend income and capital gains (the profits earned upon the sale of securities that have grown in value, if any) and assuming a constant rate of performance each year. The $10,000 table and the fund's returns do not reflect the deduction of taxes that a shareholder would pay on fund distributions or the redemption of fund shares. During periods of reimbursement by Fidelity, a fund's total return will be greater than it would be had the reimbursement not occurred. How a fund did yesterday is no guarantee of how it will do tomorrow.
Average Annual Total Returns
Periods ended December 31, 2012 | Past 1
year | Past 5
years | Past 10
years |
Institutional Class A | 2.19% | 3.48% | 3.07% |
A The initial offering of Institutional Class shares took place on July 23, 2003. Returns prior to July 23, 2003 are those of Fidelity® Short-Intermediate Municipal Income Fund, the original class of the fund.
$10,000 Over 10 Years
Let's say hypothetically that $10,000 was invested in Fidelity Advisor® Short-Intermediate Municipal Income Fund - Institutional Class on December 31, 2002. The chart shows how the value of your investment would have changed, and also shows how the Barclays® Municipal Bond Index performed over the same period. The initial offering of Institutional Class took place on July 23, 2003. See above for additional information regarding the performance of Institutional Class.
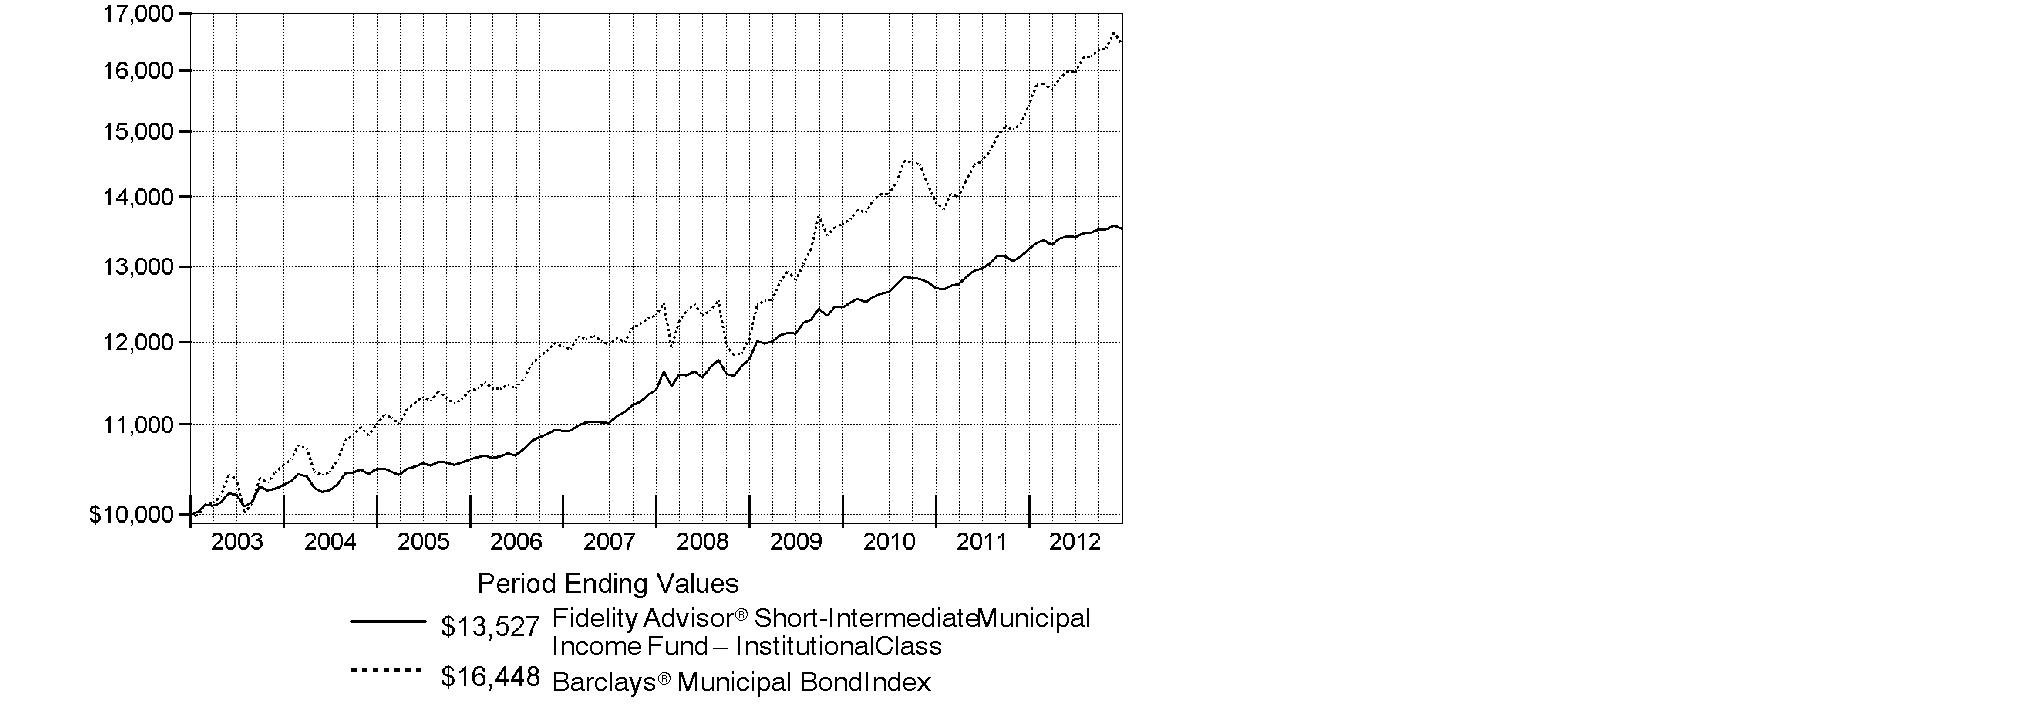
See accompanying notes which are an integral part of the financial statements.
Annual Report
Market Recap: Powered by improving issuer fundamentals and favorable supply and demand, the bull market for municipal bonds rolled on in 2012, with the Barclays® Municipal Bond Index advancing 6.78%. By contrast, taxable investment-grade debt gained 4.21%, as tracked by the Barclays® U.S. Aggregate Bond Index. Muni investors were encouraged by a recovery in tax revenues for many issuers. And despite a handful of well-publicized bankruptcies by local issuers, the overall muni default rate declined and remained low. Even with a surge in refinancings, the overall supply of newly issued muni bonds was muted. As for demand, munis drew heavy interest from investors seeking a yield advantage over U.S. Treasuries, and from those looking for a perceived safe haven amid mixed U.S. economic data and the ongoing financial crisis in Europe. Investors' appetite for tax-advantaged investments in advance of potentially higher federal tax rates in 2013 also fueled demand, particularly in November, while a steady stream of municipal redemptions (calls and maturities), many of which were reinvested in the muni market, competed for limited new supply. The muni market sold off in December due to concern about proposals to limit the federal tax exemption of muni debt, profit-taking in advance of higher capital gains rates, and ratings downgrades of Puerto Rico debt to borderline investment grade.
Comments from Mark Sommer, Lead Portfolio Manager of Fidelity Advisor® Short-Intermediate Municipal Income Fund: For the year, the fund's Institutional Class shares returned 2.19%, while the Barclays 1-6 Year Municipal Bond Index - which tracks the types of securities in which the fund invests - rose 2.00%. The fund's performance was bolstered by our overweighting in both health care and California general obligation bonds (GOs) issued by the state, as well as yield-curve positioning. Health care were a plus, thanks largely to investors' prodigious appetite for higher-yielding tax-free securities. The larger-than-benchmark stake in California state GOs proved advantageous, as these securities rallied strongly. In terms of yield-curve positioning, the fund benefited from its maturity "barbell" approach. The fund's relative performance was hurt by its underweighting in prepaid gas bonds, which recovered in the second half of the year as the credit quality of the underwriters of such securities - including banks, broker-dealers and other financial institutions - improved and in response to heavy investor demand.
The views expressed above reflect those of the portfolio manager(s) only through the end of the period as stated on the cover of this report and do not necessarily represent the views of Fidelity or any other person in the Fidelity organization. Any such views are subject to change at any time based upon market or other conditions and Fidelity disclaims any responsibility to update such views. These views may not be relied on as investment advice and, because investment decisions for a Fidelity fund are based on numerous factors, may not be relied on as an indication of trading intent on behalf of any Fidelity fund.
Annual Report
Shareholder Expense Example
As a shareholder of the Fund, you incur two types of costs: (1) transaction costs, including sales charges (loads) on purchase payments or redemption proceeds, redemption fees and (2) ongoing costs, including management fees, distribution and/or service (12b-1) fees and other Fund expenses. This Example is intended to help you understand your ongoing costs (in dollars) of investing in the Fund and to compare these costs with the ongoing costs of investing in other mutual funds.
The Example is based on an investment of $1,000 invested at the beginning of the period and held for the entire period (July 1, 2012 to December 31, 2012).
Actual Expenses
The first line of the accompanying table for each class of the Fund provides information about actual account values and actual expenses. You may use the information in this line, together with the amount you invested, to estimate the expenses that you paid over the period. Simply divide your account value by $1,000.00 (for example, an $8,600 account value divided by $1,000.00 = 8.6), then multiply the result by the number in the first line for a class of the Fund under the heading entitled "Expenses Paid During Period" to estimate the expenses you paid on your account during this period. A small balance maintenance fee of $12.00 that is charged once a year may apply for certain accounts with a value of less than $2,000. This fee is not included in the table below. If it was, the estimate of expenses you paid during the period would be higher, and your ending account value lower, by this amount. In addition, the Fund, as a shareholder in the underlying Fidelity Central Funds, will indirectly bear its pro-rata share of the fees and expenses incurred by the underlying Fidelity Central Funds. These fees and expenses are not included in the Fund's annualized expense ratio used to calculate the expense estimate in the table below.
Hypothetical Example for Comparison Purposes
The second line of the accompanying table for each class of the Fund provides information about hypothetical account values and hypothetical expenses based on a Class' actual expense ratio and an assumed rate of return of 5% per year before expenses, which is not the Class' actual return. The hypothetical account values and expenses may not be used to estimate the actual ending account balance or expenses you paid for the period. You may use this information to compare the ongoing costs of investing in the Fund and other funds. To do so, compare this 5% hypothetical example with the 5% hypothetical examples that appear in the shareholder reports of the other funds. A small balance maintenance fee of $12.00 that is charged once a year may apply for certain accounts with a value of less than $2,000. This fee is not included in the table below. If it was, the estimate of expenses you paid during the period would be higher, and your ending account value lower, by this amount. In addition, the Fund, as a shareholder in the underlying Fidelity Central Funds, will indirectly bear its pro-rata share of the fees and expenses incurred by the underlying Fidelity Central Funds. These fees and expenses are not included in the Fund's annualized expense ratio used to calculate the expense estimate in the table below.
Please note that the expenses shown in the table are meant to highlight your ongoing costs only and do not reflect any transaction costs. Therefore, the second line of the table is useful in comparing ongoing costs only, and will not help you determine the relative total costs of owning different funds. In addition, if these transactional costs were included, your costs would have been higher.
Annual Report
| Annualized Expense Ratio | Beginning
Account Value
July 1, 2012 | Ending
Account Value
December 31, 2012 | Expenses Paid
During Period*
July 1, 2012 to
December 31, 2012 |
Class A | .78% | | | |
Actual | | $ 1,000.00 | $ 1,007.50 | $ 3.94 |
HypotheticalA | | $ 1,000.00 | $ 1,021.22 | $ 3.96 |
Class T | .76% | | | |
Actual | | $ 1,000.00 | $ 1,008.50 | $ 3.84 |
HypotheticalA | | $ 1,000.00 | $ 1,021.32 | $ 3.86 |
Class B | 1.43% | | | |
Actual | | $ 1,000.00 | $ 1,004.20 | $ 7.20 |
HypotheticalA | | $ 1,000.00 | $ 1,017.95 | $ 7.25 |
Class C | 1.53% | | | |
Actual | | $ 1,000.00 | $ 1,003.70 | $ 7.71 |
HypotheticalA | | $ 1,000.00 | $ 1,017.44 | $ 7.76 |
Short-Intermediate Municipal Income | .48% | | | |
Actual | | $ 1,000.00 | $ 1,009.00 | $ 2.42 |
HypotheticalA | | $ 1,000.00 | $ 1,022.72 | $ 2.44 |
Institutional Class | .54% | | | |
Actual | | $ 1,000.00 | $ 1,008.70 | $ 2.73 |
HypotheticalA | | $ 1,000.00 | $ 1,022.42 | $ 2.75 |
A 5% return per year before expenses
* Expenses are equal to each Class' annualized expense ratio, multiplied by the average account value over the period, multiplied by 184/366 (to reflect the one-half year period).
Annual Report
Investment Changes (Unaudited)
Top Five States as of December 31, 2012 |
| % of fund's
net assets | % of fund's net assets
6 months ago |
California | 14.2 | 11.4 |
New York | 11.6 | 12.6 |
Illinois | 8.5 | 7.4 |
Florida | 8.1 | 8.3 |
Texas | 7.7 | 5.5 |
Top Five Sectors as of December 31, 2012 |
| % of fund's
net assets | % of fund's net assets
6 months ago |
General Obligations | 36.4 | 32.1 |
Electric Utilities | 12.7 | 12.8 |
Special Tax | 12.1 | 11.1 |
Health Care | 9.3 | 8.6 |
Transportation | 7.1 | 5.2 |
Weighted Average Maturity as of December 31, 2012 |
| | 6 months ago |
Years | 3.2 | 3.2 |
This is a weighted average of all the maturities of the securities held in a fund. Weighted Average Maturity (WAM) can be used as a measure of sensitivity to interest rate changes and market changes. Generally, the longer the maturity, the greater the sensitivity to such changes. WAM is based on the dollar-weighted average length of time until principal payments must be paid. Depending on the types of securities held in a fund, certain maturity shortening devices (e.g., demand features, interest rate resets, and call options) may be taken into account when calculating the WAM. |
Duration as of December 31, 2012 |
| | 6 months ago |
Years | 2.9 | 2.8 |
Duration estimates how much a bond fund's price will change with a change in comparable interest rates. If rates rise 1%, for example, a fund with a 5-year duration is likely to lose about 5% of its value. Other factors also can influence a bond fund's performance and share price. Accordingly, a bond fund's actual performance may differ from this example. Duration takes into account any call or put option embedded in the bonds. |
Quality Diversification (% of fund's net assets) |
As of December 31, 2012 | As of June 30, 2012 |
 | AAA 10.6% | | | AAA 8.5% | |
 | AA,A 71.8% | | | AA,A 69.7% | |
 | BBB 5.3% | | | BBB 4.2% | |
 | BB and Below 0.2% | | | BB and Below 0.1% | |
 | Not Rated 4.0% | | | Not Rated 1.6% | |
 | Short-Term
Investments and
Net Other Assets 8.1% | | | Short-Term
Investments and
Net Other Assets 15.9% | |

We have used ratings from Moody's Investors Service, Inc. Where Moody's® ratings are not available, we have used S&P® ratings. All ratings are as of the date indicated and do not reflect subsequent changes. |
Annual Report
Investments December 31, 2012
Showing Percentage of Net Assets
Municipal Bonds - 89.0% |
| Principal Amount (000s) | | Value (000s) |
Alabama - 0.1% |
Mobile Indl. Dev. Board Poll. Cont. Rev. Bonds Series 2007 B, 4.875%, tender 3/19/13 (b) | | $ 2,615 | | $ 2,639 |
Univ. of Alabama at Birmingham Hosp. Rev. Series 2008 A, 5% 9/1/13 | | 1,175 | | 1,207 |
| | 3,846 |
Arizona - 3.3% |
Arizona Ctfs. of Partnership Series 2010 A: | | | | |
5% 10/1/14 (FSA Insured) | | 5,000 | | 5,383 |
5% 10/1/16 (FSA Insured) | | 13,000 | | 14,685 |
Arizona Health Facilities Auth. Rev. (Banner Health Sys. Proj.): | | | | |
Series 2008 A, 5% 1/1/13 | | 2,000 | | 2,000 |
Series 2008 D: | | | | |
5% 1/1/13 | | 3,250 | | 3,250 |
5% 1/1/14 | | 2,255 | | 2,357 |
Arizona School Facilities Board Ctfs. of Prtn.: | | | | |
Series 2004 B, 5.25% 9/1/15 (FSA Insured) | | 6,470 | | 6,943 |
Series 2005 A1, 5% 9/1/14 (Nat'l. Pub. Fin. Guarantee Corp. Insured) | | 2,000 | | 2,138 |
Series 2005 A2, 5% 9/1/16 (Nat'l. Pub. Fin. Guarantee Corp. Insured) | | 11,000 | | 12,081 |
Series 2008: | | | | |
5.5% 9/1/13 | | 18,780 | | 19,413 |
5.5% 9/1/16 | | 1,385 | | 1,593 |
Arizona Wtr. Infrastructure Fin. Auth. Rev.
Series 2009 A: | | | | |
5% 10/1/18 | | 1,000 | | 1,220 |
5% 10/1/20 | | 5,180 | | 6,342 |
Coconino County Poll. Cont. Corp. Rev. Bonds (Arizona Pub. Svc. Co. Navajo Proj.) Series 2009 A, 5.5%, tender 6/1/14 (b) | | 6,000 | | 6,370 |
Maricopa County Poll. Cont. Rev. Bonds (Arizona Pub. Svc. Co. Palo Verde Proj.) Series 2009 A, 6%, tender 5/1/14 (b) | | 4,800 | | 5,110 |
Mesa Hwy. Proj. Advancement Series 2011 A: | | | | |
5% 7/1/17 | | 12,085 | | 13,328 |
5% 7/1/18 | | 5,200 | | 5,736 |
Navajo County Poll. Cont. Corp. Rev. Bonds (Arizona Pub. Svc. Co. Cholla Proj.) Series 2009 A, 1.25%, tender 5/30/14 (b) | | 2,800 | | 2,807 |
Phoenix Civic Impt. Corp. Wtr. Sys. Rev.: | | | | |
Series 2009 A, 5% 7/1/15 | | 5,835 | | 6,477 |
Municipal Bonds - continued |
| Principal Amount (000s) | | Value (000s) |
Arizona - continued |
Phoenix Civic Impt. Corp. Wtr. Sys. Rev.: - continued | | | | |
Series 2009 B, 5% 7/1/16 | | $ 5,090 | | $ 5,828 |
Pima County Swr. Sys. Rev.: | | | | |
Series 2011 B, 5% 7/1/19 | | 3,225 | | 3,905 |
Series 2012 A: | | | | |
5% 7/1/18 | | 825 | | 981 |
5% 7/1/19 | | 1,550 | | 1,877 |
Tucson Gen. Oblig. Series 2005, 5% 7/1/16 (Nat'l. Pub. Fin. Guarantee Corp. Insured) | | 1,250 | | 1,382 |
Tucson Wtr. Rev. Series 2001 A, 5% 7/1/15 (Nat'l. Pub. Fin. Guarantee Corp. Insured) | | 1,645 | | 1,698 |
Univ. Med. Ctr. Corp. Hosp. Rev. Series 2011: | | | | |
5% 7/1/16 | | 3,055 | | 3,388 |
5% 7/1/17 | | 3,315 | | 3,733 |
5% 7/1/18 | | 3,365 | | 3,835 |
| | 143,860 |
California - 11.9% |
California Dept. of Wtr. Resources (Central Valley Proj.) Series AM, 5% 12/1/13 (a) | | 3,000 | | 3,099 |
California Dept. of Wtr. Resources Pwr. Supply Rev.: | | | | |
Series 2010 L, 5% 5/1/17 | | 12,000 | | 14,077 |
Series 2010 M, 5% 5/1/16 | | 8,000 | | 9,123 |
California Econ. Recovery: | | | | |
Bonds Series B, 5%, tender 7/1/14 (b) | | 5,000 | | 5,322 |
Series 2009 A: | | | | |
5% 7/1/15 | | 3,660 | | 3,909 |
5% 7/1/15 (Pre-Refunded to 7/1/14 @ 100) | | 2,540 | | 2,716 |
5.25% 7/1/13 (Escrowed to Maturity) | | 1,185 | | 1,214 |
5.25% 7/1/13 (Nat'l. Pub. Fin. Guarantee Corp. Insured) | | 1,255 | | 1,286 |
5.25% 7/1/14 | | 1,780 | | 1,910 |
5.25% 7/1/14 (Escrowed to Maturity) | | 520 | | 558 |
California Gen. Oblig.: | | | | |
5% 11/1/13 | | 9,060 | | 9,414 |
5% 9/1/18 | | 7,500 | | 9,004 |
5% 9/1/19 | | 20,000 | | 24,391 |
5% 9/1/20 | | 20,000 | | 24,575 |
California Health Facilities Fing. Auth. Rev.: | | | | |
(Catholic Healthcare West Proj.) Series 2008 H, 5.125% 7/1/22 | | 1,945 | | 2,116 |
Municipal Bonds - continued |
| Principal Amount (000s) | | Value (000s) |
California - continued |
California Health Facilities Fing. Auth. Rev.: - continued | | | | |
(Children's Hosp. of Orange County Proj.) Series 2009 A, 5% 11/1/13 | | $ 1,100 | | $ 1,132 |
Bonds: | | | | |
(Catholic Healthcare West Proj.): | | | | |
Series 2009 D, 5%, tender 7/1/14 (b) | | 2,900 | | 3,068 |
Series 2009 F, 5%, tender 7/1/14 (b) | | 3,200 | | 3,386 |
(Children's Hosp. of Orange County Proj.) Series 2012 A, 1.93%, tender 7/1/17 (b) | | 4,000 | | 4,009 |
(St. Joseph Health Sys. Proj.) Series 2009 C, 5%, tender 10/16/14 (b) | | 4,300 | | 4,591 |
California Poll. Cont. Fing. Auth. Ctfs. of Prtn. (San Diego Gas & Elec. Co. Proj.) 5.9% 6/1/14 (Nat'l. Pub. Fin. Guarantee Corp. Insured) | | 34,000 | | 36,493 |
California Poll. Cont. Fing. Auth. Solid Waste Disp. Rev. Bonds: | | | | |
(Republic Svcs., Inc. Proj.) Series 2010 A, 0.6%, tender 2/1/13 (b)(e) | | 16,200 | | 16,201 |
(Waste Mgmt., Inc. Proj.) Series 2003 A, 5%, tender 5/1/13 (b)(e) | | 2,300 | | 2,334 |
California Pub. Works Board Lease Rev.: | | | | |
(Dept. of Corrections & Rehab. Proj.) Series 2011 C, 5% 10/1/18 | | 1,750 | | 2,058 |
(Riverside Campus Proj.) Series 2012 H, 5% 4/1/22 | | 1,000 | | 1,191 |
(Univ. Proj.) Series 2011 B: | | | | |
5% 10/1/18 | | 2,740 | | 3,249 |
5% 10/1/19 | | 1,490 | | 1,791 |
(Various Cap. Proj.) Series 2012 G, 5% 11/1/22 | | 1,250 | | 1,501 |
(Various Cap. Projects) Series 2011 A: | | | | |
5% 10/1/18 | | 6,475 | | 7,616 |
5% 10/1/19 | | 5,000 | | 5,921 |
5% 10/1/20 | | 2,525 | | 3,032 |
(Various Cap. Projs.) Series 2012 A, 5% 4/1/21 | | 1,000 | | 1,195 |
(Various Judicial Council Projects) Series 2011 D, 5% 12/1/19 | | 4,100 | | 4,905 |
Series 2009 J, 5% 11/1/17 | | 2,300 | | 2,684 |
Series 2010 A: | | | | |
5% 3/1/16 | | 2,000 | | 2,236 |
5% 3/1/17 | | 5,405 | | 6,186 |
California State Univ. Rev. Series 2007 C, 5% 11/1/13 (FSA Insured) | | 1,335 | | 1,387 |
Municipal Bonds - continued |
| Principal Amount (000s) | | Value (000s) |
California - continued |
California Statewide Cmntys. Dev. Auth. Rev.: | | | | |
(State of California Proposition 1A Receivables Prog.) Series 2009: | | | | |
4% 6/15/13 | | $ 1,000 | | $ 1,017 |
5% 6/15/13 | | 16,650 | | 17,002 |
Bonds: | | | | |
Series 2002 C, 5%, tender 5/1/17 (b) | | 4,000 | | 4,637 |
Series 2009 E2, 5%, tender 5/1/17 (b) | | 2,000 | | 2,319 |
Contra Costa Trans. Auth. Sales Tax Rev. Bonds Series 2012 A, 0.511%, tender 12/12/15 (b) | | 12,500 | | 12,500 |
East Bay Muni. Util. District Wtr. Sys. Rev. Bonds Series 2011 A2, 0.48%, tender 7/1/14 (b) | | 56,000 | | 56,116 |
Golden State Tobacco Securitization Corp. Tobacco Settlement Rev. Series 2003 B: | | | | |
5.5% 6/1/43 (Pre-Refunded to 6/1/13 @ 100) | | 2,000 | | 2,043 |
5.625% 6/1/38 (Pre-Refunded to 6/1/13 @ 100) | | 3,030 | | 3,097 |
Irvine Reassessment District 12-1 Ltd. Oblig. 2% 9/2/13 | | 1,000 | | 1,008 |
Los Angeles County Metropolitan Trans. Auth. Sales Tax Rev.: | | | | |
Series 2009 A, 5% 7/1/13 | | 4,155 | | 4,253 |
Series 2009 B, 5% 7/1/17 | | 12,905 | | 15,229 |
Series 2013 A: | | | | |
5% 7/1/18 (a) | | 9,750 | | 11,539 |
5% 7/1/19 (a) | | 4,400 | | 5,294 |
Los Angeles County Pub. Works Fing. Auth. Lease Rev. Series 2010 A, 5% 8/1/17 | | 5,000 | | 5,785 |
Los Angeles Gen. Oblig. Series 2011 B, 5% 9/1/18 | | 20,960 | | 25,445 |
Los Angeles Muni. Impt. Corp. Lease Rev. Series 2012 C: | | | | |
4.625% 3/1/18 | | 1,500 | | 1,721 |
5% 3/1/19 | | 2,935 | | 3,459 |
Los Angeles Unified School District Series 2009 KRY, 5% 7/1/13 | | 10,740 | | 10,992 |
Los Angeles Unified School District Ctfs. of Prtn. (Multiple Properties Proj.) Series 2010 A: | | | | |
5% 12/1/16 | | 2,025 | | 2,291 |
5% 12/1/17 | | 9,790 | | 11,221 |
Los Angeles Wastewtr. Sys. Rev. Series 2009 A, 5% 6/1/15 | | 12,240 | | 13,547 |
Monterey County Pub. Impt. Corp. Ctfs. of Prtn. (Refing. Proj.) Series 2009, 5% 8/1/17 (FSA Insured) | | 2,130 | | 2,434 |
Newport Beach Rev. Bonds (Hoag Memorial Hosp. Presbyterian Proj.) Series 2009 E, 5%, tender 2/7/13 (b) | | 2,500 | | 2,511 |
Municipal Bonds - continued |
| Principal Amount (000s) | | Value (000s) |
California - continued |
Northern California Pwr. Agcy. Rev.: | | | | |
(Geothermal #3 Proj.) Series 2009 A: | | | | |
5% 7/1/13 | | $ 1,020 | | $ 1,043 |
5% 7/1/14 | | 1,120 | | 1,193 |
5% 7/1/15 | | 2,170 | | 2,397 |
(Hydroelectric #1 Proj.) Series 2010 A: | | | | |
4% 7/1/15 | | 2,000 | | 2,160 |
5% 7/1/18 | | 2,000 | | 2,385 |
Port of Oakland Rev. Series 2012 P, 5% 5/1/21 (e) | | 2,500 | | 2,982 |
Poway Unified School District Pub. Fing. Auth. Lease Rev. Bonds Series 2008 B, 0%, tender 12/1/14 (FSA Insured) (b) | | 7,115 | | 6,884 |
Riverside County Asset Leasing Rev. (Riverside Cap. Proj.) Series 2012 A: | | | | |
4% 6/1/17 | | 1,750 | | 1,916 |
5% 6/1/17 | | 3,700 | | 4,206 |
5% 6/1/18 | | 6,470 | | 7,464 |
Sacramento Muni. Util. District Elec. Rev. Series 2011 X, 5% 8/15/21 | | 4,000 | | 4,952 |
Sacramento Pwr. Auth. Cogeneration Proj. Rev. Series 2005 A, 5% 7/1/18 (AMBAC Insured) | | 2,890 | | 3,072 |
San Bernardino County Ctfs. of Prtn. (Arrowhead Proj.) Series 2009 A: | | | | |
5% 8/1/16 | | 5,450 | | 5,993 |
5% 8/1/18 | | 8,000 | | 9,035 |
San Diego Cmnty. College District Series 2007, 0% 8/1/16 (FSA Insured) | | 1,160 | | 1,111 |
San Diego Pub. Facilities Fing. Auth. Swr. Rev.: | | | | |
Series 2009 A: | | | | |
5% 5/15/13 | | 5,415 | | 5,509 |
5% 5/15/15 | | 1,845 | | 2,035 |
Series 2009 B, 5% 5/15/14 | | 7,000 | | 7,442 |
Stockton Unified School District Gen. Oblig. 5% 7/1/18 (FSA Insured) | | 1,035 | | 1,193 |
| | 517,312 |
Municipal Bonds - continued |
| Principal Amount (000s) | | Value (000s) |
Colorado - 0.1% |
Colorado Health Facilities Auth. Rev. Bonds (Catholic Health Initiatives Proj.) Series 2008 C4, 4%, tender 11/12/15 (b) | | $ 4,200 | | $ 4,567 |
Univ. of Colorado Enterprise Sys. Rev. Series 2009 A, 5% 6/1/17 | | 500 | | 586 |
| | 5,153 |
Connecticut - 1.6% |
Connecticut Dev. Auth. Poll. Cont. Rev. Bonds Series 2011 A, 1.55%, tender 4/1/15 (b)(e) | | 4,300 | | 4,323 |
Connecticut Gen. Oblig.: | | | | |
(Econ. Recovery Proj.) Series 2009 A, 5% 1/1/15 | | 10,500 | | 11,431 |
Series 2012 C, 5% 6/1/21 | | 23,420 | | 29,305 |
Series 2012 D, 0.42% 9/15/15 (b) | | 6,000 | | 6,005 |
Connecticut Health & Edl. Facilities Auth. Rev.: | | | | |
Bonds (Ascension Health Cr. Group Proj.) Series 1998 B, 1.55%, tender 2/1/17 (b) | | 2,585 | | 2,630 |
Series D, 4% 7/1/14 | | 1,000 | | 1,043 |
Connecticut Spl. Tax Oblig. Trans. Infrastructure Rev.: | | | | |
Series 1998 A, 5.5% 10/1/13 | | 4,300 | | 4,468 |
Series 2009 1, 5% 2/1/14 | | 2,500 | | 2,627 |
Series 2011 A, 5% 12/1/18 | | 5,575 | | 6,737 |
| | 68,569 |
District Of Columbia - 0.5% |
District of Columbia Gen. Oblig. Series 2007 B, 5% 6/1/16 (AMBAC Insured) | | 3,555 | | 4,034 |
District of Columbia Income Tax Rev. Series 2009 C, 5% 12/1/13 | | 5,500 | | 5,741 |
District of Columbia Rev. (Medlantic/Helix Proj.) Series 1998 C, 5% 8/15/15 (FSA Insured) | | 1,500 | | 1,616 |
District of Columbia Univ. Rev. Bonds (Georgetown Univ. Proj.) Series 2001 B, 4.7%, tender 4/1/18 (b) | | 8,500 | | 9,560 |
Washington DC Metropolitan Transit Auth. Rev. Series 2009 A, 5% 7/1/14 | | 1,000 | | 1,062 |
| | 22,013 |
Florida - 8.1% |
Alachua County Health Facilities Auth. Health Facilities Rev. (Shands Teaching Hospitals & Clinics, Inc. Proj.) Series 2010 B: | | | | |
5% 12/1/14 | | 4,000 | | 4,320 |
5% 12/1/15 | | 4,395 | | 4,884 |
Municipal Bonds - continued |
| Principal Amount (000s) | | Value (000s) |
Florida - continued |
Broward County Arpt. Sys. Rev.: | | | | |
Series 2012 P1, 3% 10/1/13 (e) | | $ 4,000 | | $ 4,078 |
Series 2012 Q1, 5% 10/1/21 | | 1,000 | | 1,228 |
Broward County School Board Ctfs. of Prtn.: | | | | |
Series 2008 A, 5% 7/1/15 (FSA Insured) | | 5,495 | | 6,009 |
Series 2012 A: | | | | |
5% 7/1/19 | | 7,000 | | 8,338 |
5% 7/1/20 | | 15,070 | | 18,120 |
Citizens Property Ins. Corp.: | | | | |
Series 2010 A1, 5% 6/1/15 (FSA Insured) | | 14,000 | | 15,291 |
Series 2010 A3, 1.88% 6/1/13 (b) | | 47,300 | | 47,589 |
Clay County Infrastructure Sales Surtax Rev. 5% 10/1/15 (Assured Guaranty Corp. Insured) | | 7,745 | | 8,405 |
Clearwater Wtr. and Swr. Rev.: | | | | |
Series 2009 B, 5% 12/1/14 | | 2,000 | | 2,169 |
Series 2011: | | | | |
4% 12/1/16 | | 1,265 | | 1,394 |
5% 12/1/17 | | 1,685 | | 1,947 |
5% 12/1/18 | | 685 | | 810 |
5% 12/1/19 | | 1,820 | | 2,178 |
5% 12/1/20 | | 1,000 | | 1,205 |
Collier County Indl. Dev. Auth. Healthcare Facilities Rev. (NCH Healthcare Sys. Proj.) Series 2011: | | | | |
5% 10/1/14 | | 1,355 | | 1,438 |
5% 10/1/16 | | 1,530 | | 1,699 |
5% 10/1/17 | | 1,455 | | 1,639 |
Escambia City Health Facilities Auth. Rev. (Ascension Health Cr. Group Proj.) Series 2003 A, 5.25% 11/15/13 | | 4,265 | | 4,442 |
Escambia County Solid Waste Disp. Rev. Bonds (Gulf Pwr. Co. Proj.) Series 2009, 1.35%, tender 6/2/15 (b) | | 1,900 | | 1,905 |
Florida Board of Ed. Series 2005 B, 5% 1/1/18 | | 21,080 | | 23,073 |
Florida Board of Ed. Lottery Rev. Series 2011 A, 5% 7/1/20 | | 8,600 | | 10,541 |
Florida Board of Ed. Pub. Ed. Cap. Outlay: | | | | |
Series 2009 C, 5% 6/1/20 | | 3,625 | | 4,443 |
Series 2009 D, 5.5% 6/1/16 | | 7,910 | | 9,175 |
Florida Dept. of Envir. Protection Rev. Series 2012 A, 5% 7/1/19 | | 15,800 | | 19,111 |
Florida Gen. Oblig. (Dept. of Trans. Right-of-Way and Bridge Construction Proj.) Series 2005 B, 6.375% 7/1/13 | | 8,020 | | 8,264 |
Municipal Bonds - continued |
| Principal Amount (000s) | | Value (000s) |
Florida - continued |
Florida Hurricane Catastrophe Fund Fin. Corp. Rev. Series 2010 A, 5% 7/1/15 | | $ 20,000 | | $ 22,052 |
Florida Muni. Pwr. Agcy. Rev. (Stanton II Proj.) Series 2012 A, 5% 10/1/18 | | 2,850 | | 3,405 |
Gainesville Utils. Sys. Rev. Series 2012 A, 5% 10/1/21 | | 2,110 | | 2,611 |
Greater Orlando Aviation Auth. Arpt. Facilities Rev. Series 2011 C: | | | | |
5% 10/1/19 | | 1,705 | | 2,062 |
5% 10/1/20 | | 1,000 | | 1,220 |
Highlands County Health Facilities Auth. Rev.: | | | | |
(Adventist Health Sys./Sunbelt, Inc. Prog.) Series 2009 E, 5% 11/15/15 | | 2,345 | | 2,628 |
Bonds (Adventist Health Sys./Sunbelt, Inc. Prog.) Series 2008 A, 6.1%, tender 11/14/13 (b) | | 1,000 | | 1,044 |
Hillsborough County Indl. Dev. Auth. Poll. Cont. Rev. Bonds (Tampa Elec. Co. Proj.) Series 2007 B, 5.15%, tender 9/1/13 (b) | | 1,750 | | 1,800 |
Indian River County Wtr. & Swr. Rev.: | | | | |
5% 9/1/15 | | 1,000 | | 1,099 |
5% 9/1/17 | | 1,000 | | 1,155 |
JEA Wtr. & Swr. Sys. Rev. Series 2010 D, 5% 10/1/21 | | 1,945 | | 2,375 |
Kissimmee Util. Auth. Elec. Sys. Rev. Series 2003: | | | | |
5.25% 10/1/14 | | 775 | | 830 |
5.25% 10/1/15 | | 3,525 | | 3,895 |
Miami Beach Health Facilities Auth. Hosp. Rev. (Mount Sinai Med. Ctr. of Florida Proj.) Series 2012: | | | | |
5% 11/15/21 | | 1,000 | | 1,131 |
5% 11/15/22 | | 485 | | 547 |
Miami-Dade County Pub. Facilities Rev. (Jackson Health Sys. Proj.) Series 2005 B: | | | | |
5% 6/1/14 (Nat'l. Pub. Fin. Guarantee Corp. Insured) | | 4,790 | | 5,086 |
5% 6/1/19 (Nat'l. Pub. Fin. Guarantee Corp. Insured) | | 3,875 | | 4,206 |
Miami-Dade County Transit Sales Surtax Rev. Series 2012, 5% 7/1/19 | | 1,250 | | 1,505 |
Miami-Dade County Wtr. & Swr. Rev. Series 2008 A, 5% 10/1/14 (FSA Insured) | | 4,000 | | 4,316 |
Orange County Health Facilities Auth. (Orlando Health, Inc.) Series 2009: | | | | |
5% 10/1/15 | | 2,210 | | 2,421 |
5% 10/1/16 | | 1,000 | | 1,113 |
Orange County Health Facilities Auth. Rev. (Orlando Reg'l. Healthcare Sys. Proj.) Series 2008 A: | | | | |
5% 11/1/13 (FSA Insured) | | 1,000 | | 1,024 |
Municipal Bonds - continued |
| Principal Amount (000s) | | Value (000s) |
Florida - continued |
Orange County Health Facilities Auth. Rev. (Orlando Reg'l. Healthcare Sys. Proj.) Series 2008 A: - continued | | | | |
5% 11/1/15 (FSA Insured) | | $ 1,825 | | $ 1,999 |
Orlando & Orange County Expressway Auth. Rev.: | | | | |
Series 2010 B, 5% 7/1/15 (FSA Insured) | | 1,430 | | 1,578 |
Series 2012, 5% 7/1/19 | | 1,000 | | 1,206 |
Orlando Utils. Commission Util. Sys. Rev.: | | | | |
Series 2009 C, 5% 10/1/17 | | 1,500 | | 1,776 |
Series 2010 C, 5% 10/1/17 | | 1,895 | | 2,243 |
Series 2011 B: | | | | |
5% 10/1/18 | | 2,250 | | 2,724 |
5% 10/1/19 | | 2,325 | | 2,885 |
Pasco County Solid Waste Disp. & Resource Recovery Sys. Rev.: | | | | |
Series 2011: | | | | |
5% 10/1/17 (e) | | 4,465 | | 5,122 |
5% 10/1/19 (e) | | 2,025 | | 2,381 |
5% 10/1/18 (e) | | 2,745 | | 3,194 |
Sarasota County School Board Ctfs. of Prtn. (Master Lease Prog.): | | | | |
5% 7/1/13 | | 3,435 | | 3,512 |
5% 7/1/14 | | 2,000 | | 2,132 |
Tampa Bay Wtr. Reg'l. Wtr. Supply Auth. Util. Sys. Rev.: | | | | |
Series 2011 B, 5% 10/1/18 | | 4,700 | | 5,691 |
Series 2011, 5% 10/1/19 | | 5,590 | | 6,937 |
Tampa Health Sys. Rev. (Baycare Health Sys. Proj.) Series 2010: | | | | |
5% 11/15/16 | | 2,500 | | 2,846 |
5% 11/15/17 | | 1,500 | | 1,743 |
Tampa Solid Waste Sys. Rev. Series 2010: | | | | |
4% 10/1/14 (FSA Insured) (e) | | 3,000 | | 3,160 |
5% 10/1/15 (FSA Insured) (e) | | 2,920 | | 3,226 |
5% 10/1/16 (FSA Insured) (e) | | 6,000 | | 6,782 |
5% 10/1/17 (FSA Insured) (e) | | 5,000 | | 5,753 |
Tampa Tax Allocation (H. Lee Moffitt Cancer Ctr. Proj.) Series 2012 A, 5% 9/1/20 | | 1,800 | | 2,135 |
Titusville Wtr. & Swr. Rev. Series 2010, 5% 10/1/17 (Assured Guaranty Corp. Insured) | | 1,135 | | 1,301 |
| | 351,546 |
Municipal Bonds - continued |
| Principal Amount (000s) | | Value (000s) |
Georgia - 3.5% |
Appling County Dev. Auth. Poll. Cont. Rev. Bonds (Oglethorpe Pwr. Corp. Hatch Proj.) Series 2011 A, 2.5%, tender 3/1/13 (b) | | $ 5,000 | | $ 5,016 |
Atlanta Arpt. Rev. Series 2011 B, 5% 1/1/13 (e) | | 1,000 | | 1,000 |
Burke County Indl. Dev. Auth. Poll. Cont. Rev. Bonds: | | | | |
(Georgia Pwr. Co. Plant Vogtle Proj.): | | | | |
Fifth Series 1994, 2.3%, tender 4/1/14 (b) | | 8,000 | | 8,179 |
Fourth Series 1995: | | | | |
1.2%, tender 4/1/14 (b) | | 3,450 | | 3,480 |
1.2%, tender 4/1/14 (b) | | 4,800 | | 4,842 |
(Oglethorpe Pwr. Corp. Vogtle Proj.) Series 2011 A, 2.5%, tender 3/1/13 (b) | | 3,500 | | 3,511 |
Fulton County Facilities Corp. Ctfs. of Prtn. (Gen. Purp. Proj.) Series 2009: | | | | |
5% 11/1/13 | | 7,550 | | 7,827 |
5% 11/1/14 | | 7,490 | | 7,984 |
Fulton County Wtr. & Swr. Rev. Series 2011: | | | | |
5% 1/1/19 | | 4,000 | | 4,856 |
5% 1/1/20 | | 4,000 | | 4,917 |
Georgia Muni. Elec. Auth. Pwr. Rev.: | | | | |
Series B, 5% 1/1/17 | | 2,750 | | 3,156 |
Series GG: | | | | |
5% 1/1/16 | | 680 | | 760 |
5% 1/1/20 | | 675 | | 826 |
5% 1/1/21 | | 1,670 | | 2,076 |
Georgia Muni. Gas Auth. Rev. (Gas Portfolio III Proj.) Series R, 5% 10/1/21 | | 5,000 | | 6,050 |
Metropolitan Atlanta Rapid Transit Auth. Sales Tax Rev. Bonds Series 2000 A, 0.38%, tender 9/1/14 (b) | | 13,800 | | 13,805 |
Monroe County Dev. Auth. Poll. Cont. Rev. Bonds: | | | | |
(Georgia Pwr. Co. Plant Scherer Proj.) First Series 1995, 0.8%, tender 7/1/14 (b) | | 17,900 | | 17,916 |
(Oglethorpe Pwr. Corp. Scherer Proj.) Series 2011 A, 2.5%, tender 3/1/13 (b) | | 11,500 | | 11,537 |
Muni. Elec. Auth. of Georgia: | | | | |
(Combined Cycle Proj.) Series A, 5% 11/1/18 | | 2,000 | | 2,379 |
(Proj. One): | | | | |
Series 2008 A: | | | | |
5% 1/1/13 | | 2,000 | | 2,000 |
5.25% 1/1/17 (Berkshire Hathaway Assurance Corp. Insured) | | 7,925 | | 9,172 |
Series 2008 D: | | | | |
5.75% 1/1/19 | | 14,890 | | 18,196 |
Municipal Bonds - continued |
| Principal Amount (000s) | | Value (000s) |
Georgia - continued |
Muni. Elec. Auth. of Georgia: - continued | | | | |
(Proj. One): | | | | |
Series 2008 D: | | | | |
5.75% 1/1/20 | | $ 3,555 | | $ 4,338 |
Richmond County Hosp. Auth. (Univ. Health Svcs., Inc. Proj.) Series 2009: | | | | |
5% 1/1/14 | | 1,305 | | 1,354 |
5% 1/1/15 | | 1,040 | | 1,110 |
5% 1/1/16 | | 2,415 | | 2,624 |
5% 1/1/18 | | 1,530 | | 1,708 |
| | 150,619 |
Hawaii - 0.7% |
Hawaii Arpts. Sys. Rev.: | | | | |
Series 2010 B, 5% 7/1/15 (e) | | 3,900 | | 4,290 |
Series 2011, 5% 7/1/19 (e) | | 4,000 | | 4,693 |
Hawaii Gen. Oblig.: | | | | |
Series DR: | | | | |
5% 6/1/16 | | 7,645 | | 8,728 |
5% 6/1/16 (Escrowed to Maturity) | | 2,895 | | 3,320 |
Series DY: | | | | |
5% 2/1/15 | | 3,500 | | 3,825 |
5% 2/1/16 | | 4,000 | | 4,520 |
| | 29,376 |
Illinois - 8.5% |
Chicago Board of Ed. Series 2009 D: | | | | |
5% 12/1/17 (Assured Guaranty Corp. Insured) | | 4,115 | | 4,760 |
5% 12/1/18 (Assured Guaranty Corp. Insured) | | 2,335 | | 2,726 |
Chicago Gen. Oblig.: | | | | |
(City Colleges Proj.): | | | | |
Series 1999: | | | | |
0% 1/1/17 (Nat'l. Pub. Fin. Guarantee Corp. Insured) | | 7,200 | | 6,650 |
0% 1/1/18 (Nat'l. Pub. Fin. Guarantee Corp. Insured) | | 3,000 | | 2,683 |
0% 1/1/19 (Nat'l. Pub. Fin. Guarantee Corp. Insured) | | 9,805 | | 8,439 |
Series1999, 0% 1/1/20 (Nat'l. Pub. Fin. Guarantee Corp. Insured) | | 14,755 | | 12,090 |
Series 2012 B: | | | | |
5.125% 1/1/15 (AMBAC Insured) | | 3,000 | | 3,219 |
5.125% 1/1/15 (Pre-Refunded to 1/1/14 @ 100) | | 995 | | 1,042 |
Series A, 5% 1/1/17 (FSA Insured) | | 3,465 | | 3,839 |
Series B, 5% 1/1/17 (FSA Insured) | | 5,115 | | 5,617 |
Municipal Bonds - continued |
| Principal Amount (000s) | | Value (000s) |
Illinois - continued |
Chicago Midway Arpt. Rev. Bonds Series 2010 B, 5%, tender 1/1/15 (b) | | $ 5,000 | | $ 5,374 |
Chicago O'Hare Int'l. Arpt. Rev.: | | | | |
Series 2008 A, 5% 1/1/13 (FSA Insured) | | 4,000 | | 4,000 |
Series 2010 D, 5.25% 1/1/17 (e) | | 1,000 | | 1,154 |
Series 2010 E: | | | | |
5% 1/1/15 (e) | | 4,000 | | 4,321 |
5% 1/1/16 (e) | | 1,500 | | 1,671 |
Series 2011 B, 5% 1/1/18 | | 6,500 | | 7,553 |
Series 2012 A: | | | | |
5% 1/1/14 (e) | | 3,500 | | 3,652 |
5% 1/1/14 (e) | | 2,000 | | 2,087 |
5% 1/1/21 | | 1,400 | | 1,662 |
Series 2012 B, 5% 1/1/21 (e) | | 4,605 | | 5,373 |
Chicago Sales Tax Rev. Series 1998, 5.5% 1/1/16 (FGIC Insured) (FSA Insured) | | 1,710 | | 1,927 |
Chicago Transit Auth. Cap. Grant Receipts Rev.: | | | | |
(Fed. Transit Administration Section 5309 Proj.) Series 2008 A, 5% 6/1/13 | | 3,765 | | 3,831 |
5% 6/1/19 (Assured Guaranty Corp. Insured) | | 2,085 | | 2,345 |
5% 6/1/19 (Assured Guaranty Corp. Insured) (Pre-Refunded to 12/1/16 @ 100) | | 415 | | 484 |
Cook County Gen. Oblig. Series 2012 C: | | | | |
5% 11/15/19 | | 1,500 | | 1,802 |
5% 11/15/20 | | 2,500 | | 3,029 |
5% 11/15/21 | | 3,000 | | 3,633 |
Cook County Thorton Township High School District #205 5.5% 12/1/16 (Assured Guaranty Corp. Insured) | | 2,500 | | 2,893 |
Illinois Fin. Auth. Gas Supply Rev. Bonds (The Peoples Gas Lt. and Coke Co. Proj.): | | | | |
Series 2010 B, 2.625%, tender 8/1/15 (b) | | 9,500 | | 9,740 |
Series 2010, 2.125%, tender 7/1/14 (b) | | 11,500 | | 11,689 |
Illinois Fin. Auth. Hosp. Rev. (KishHealth Sys. Proj.) Series 2008, 5.25% 10/1/15 | | 2,220 | | 2,407 |
Illinois Fin. Auth. Rev.: | | | | |
(Advocate Health Care Proj.) Series 2010 D, 5% 4/1/15 | | 550 | | 600 |
(Kewanee Hosp. Proj.) Series 2006, 5% 8/15/26 | | 3,865 | | 4,069 |
(Northwest Cmnty. Hosp. Proj.) Series 2008 A: | | | | |
5% 7/1/13 | | 415 | | 423 |
5% 7/1/15 | | 1,000 | | 1,088 |
Municipal Bonds - continued |
| Principal Amount (000s) | | Value (000s) |
Illinois - continued |
Illinois Fin. Auth. Rev.: - continued | | | | |
(Palos Cmnty. Hosp. Proj.) Series 2010 C: | | | | |
5% 5/15/16 | | $ 2,060 | | $ 2,259 |
5% 5/15/17 | | 3,520 | | 3,912 |
(Provena Health Proj.) Series 2010 A: | | | | |
5% 5/1/13 | | 2,000 | | 2,025 |
5% 5/1/14 | | 2,000 | | 2,094 |
5.75% 5/1/19 | | 2,650 | | 3,109 |
(Rush Univ. Med. Ctr. Proj.) Series 2006 B: | | | | |
5% 11/1/15 (Nat'l. Pub. Fin. Guarantee Corp. Insured) | | 3,075 | | 3,408 |
5% 11/1/16 (Nat'l. Pub. Fin. Guarantee Corp. Insured) | | 1,700 | | 1,925 |
Bonds (Advocate Health Care Proj.) Series 2008 C B3, 4.375%, tender 7/1/14 (b) | | 4,000 | | 4,211 |
Series 2012 A, 5% 5/15/23 | | 1,300 | | 1,490 |
Series 2012: | | | | |
5% 9/1/19 | | 1,115 | | 1,282 |
5% 9/1/20 | | 1,470 | | 1,698 |
5% 9/1/21 | | 1,645 | | 1,916 |
5% 9/1/22 | | 2,165 | | 2,518 |
Illinois Gen. Oblig.: | | | | |
Series 2002, 5.5% 8/1/15 (Nat'l. Pub. Fin. Guarantee Corp. Insured) | | 1,495 | | 1,656 |
Series 2003 A, 5.25% 10/1/13 (FSA Insured) | | 3,755 | | 3,894 |
Series 2004 B, 5% 3/1/14 | | 15,500 | | 16,199 |
Series 2004, 5% 11/1/16 | | 11,000 | | 12,439 |
Series 2005: | | | | |
5% 4/1/13 (AMBAC Insured) | | 5,000 | | 5,055 |
5% 4/1/17 (AMBAC Insured) | | 8,050 | | 8,669 |
Series 2007 A, 5.5% 6/1/15 | | 1,000 | | 1,101 |
Series 2007 B, 5% 1/1/17 | | 9,835 | | 11,143 |
Series 2009 A, 3.5% 9/1/13 (Escrowed to Maturity) | | 3,000 | | 3,064 |
Series 2010: | | | | |
4% 1/1/13 | | 3,695 | | 3,695 |
5% 1/1/15 (FSA Insured) | | 20,000 | | 21,512 |
Series 2012: | | | | |
2% 2/1/13 | | 9,500 | | 9,511 |
3% 8/1/13 | | 4,800 | | 4,869 |
3% 9/1/13 | | 2,000 | | 2,033 |
4% 3/1/14 | | 5,000 | | 5,168 |
5% 3/1/13 | | 5,000 | | 5,036 |
Municipal Bonds - continued |
| Principal Amount (000s) | | Value (000s) |
Illinois - continued |
Illinois Gen. Oblig.: - continued | | | | |
Series 2012: | | | | |
5% 3/1/19 | | $ 5,500 | | $ 6,331 |
5% 8/1/22 | | 5,700 | | 6,525 |
Illinois Health Facilities Auth. Rev.: | | | | |
(Delnor-Cmnty. Hosp. Proj.) Series 2003 A: | | | | |
5% 5/15/15 (FSA Insured) | | 2,250 | | 2,440 |
5% 5/15/16 (FSA Insured) | | 2,325 | | 2,582 |
Series 2003 A, 5% 5/15/17 (FSA Insured) | | 2,150 | | 2,443 |
Illinois Sales Tax Rev.: | | | | |
Series 2009 B: | | | | |
4.5% 6/15/16 | | 5,000 | | 5,583 |
4.5% 6/15/17 | | 6,075 | | 6,893 |
Series 2010, 5% 6/15/15 | | 8,800 | | 9,698 |
Series 2011, 4% 6/15/13 | | 2,600 | | 2,643 |
Illinois Unemployment Ins. Fund Bldg. Receipts Series 2012 A: | | | | |
1.5% 6/15/21 | | 5,500 | | 5,504 |
4% 6/15/20 | | 1,000 | | 1,047 |
5% 6/15/20 | | 6,000 | | 6,496 |
Kane County Forest Preserve District Series 2012, 4% 12/15/14 | | 3,200 | | 3,419 |
Lake County Cmnty. Consolidated School District #73 Gen. Oblig.: | | | | |
0% 12/1/15 (Escrowed to Maturity) | | 580 | | 568 |
0% 12/1/15 (Nat'l. Pub. Fin. Guarantee Corp. Insured) | | 1,520 | | 1,451 |
Metropolitan Pier & Exposition: | | | | |
(McCormick Place Expansion Proj.) Series 1996 A, 0% 12/15/13 (Nat'l. Pub. Fin. Guarantee Corp. Insured) | | 2,725 | | 2,682 |
Series A, 0% 6/15/14 (Escrowed to Maturity) | | 8,625 | | 8,553 |
0% 6/15/14 (Nat'l. Pub. Fin. Guarantee Corp. Insured) | | 700 | | 680 |
Univ. of Illinois Rev. 0% 4/1/14 | | 2,350 | | 2,318 |
Will County Cmnty. Unit School District #365-U: | | | | |
0% 11/1/14 (Escrowed to Maturity) | | 1,025 | | 1,011 |
0% 11/1/14 (FSA Insured) | | 875 | | 857 |
0% 11/1/16 (Escrowed to Maturity) | | 740 | | 711 |
0% 11/1/16 (FSA Insured) | | 2,235 | | 2,093 |
| | 367,291 |
Municipal Bonds - continued |
| Principal Amount (000s) | | Value (000s) |
Indiana - 2.0% |
Indiana Fin. Auth. Health Sys. Rev. (Sisters of Saint Francis Health Svcs., Inc. Obligated Group Proj.) Series 2008 C, 5% 11/1/13 | | $ 3,000 | | $ 3,108 |
Indiana Fin. Auth. Hosp. Rev. (Parkview Health Sys. Oblig. Group Proj.) Series 2009 A: | | | | |
5% 5/1/14 | | 3,500 | | 3,685 |
5% 5/1/15 | | 6,420 | | 6,985 |
Indiana Fin. Auth. Rev.: | | | | |
(Trinity Health Cr. Group Proj.) Series 2009 A: | | | | |
5% 12/1/14 | | 1,250 | | 1,352 |
5% 12/1/15 | | 2,135 | | 2,384 |
(Wabash Valley Correctional Facilities Proj.) Series 2009 A, 5% 7/1/15 | | 8,025 | | 8,846 |
(Wabash Valley Correctional Facility Proj.) Series 2009 A, 5% 7/1/14 | | 2,500 | | 2,663 |
Series 2010 A, 5% 2/1/17 | | 2,800 | | 3,258 |
Series 2012: | | | | |
5% 3/1/20 | | 650 | | 757 |
5% 3/1/21 | | 1,225 | | 1,422 |
Indiana Health & Edl. Facilities Fing. Auth. Rev. Bonds (Ascension Health Sr. Cr. Group Proj.) Series 2006 B1, 4.1%, tender 11/3/16 (b) | | 4,000 | | 4,468 |
Indiana Health Facility Fing. Auth. Rev. Bonds (Ascension Health Cr. Group Proj.): | | | | |
Series 2001 A1, 1.5%, tender 8/1/14 (b) | | 3,400 | | 3,451 |
Series 2001 A2, 1.6%, tender 2/1/17 (b) | | 2,200 | | 2,243 |
Indiana Muni. Pwr. Agcy. Pwr. Supply Sys. Rev. Series 2011 A: | | | | |
5% 1/1/19 | | 1,470 | | 1,767 |
5% 1/1/20 | | 1,250 | | 1,517 |
Indiana State Fin. Auth. Wastewtr. (CWA Auth. Proj.) Series 2012 A: | | | | |
5% 10/1/20 | | 825 | | 1,023 |
5% 10/1/22 | | 1,600 | | 2,008 |
Indianapolis Local Pub. Impt. Bond Bank (Wtrwks. Proj.) Series F, 5% 7/1/15 (Nat'l. Pub. Fin. Guarantee Corp. Insured) | | 515 | | 567 |
Indianapolis Thermal Energy Sys. Series 2010 B: | | | | |
5% 10/1/16 | | 5,000 | | 5,598 |
5% 10/1/17 | | 5,000 | | 5,709 |
Jasper County Indl. Poll. Ctl. Rev. (Northern Indiana Pub. Svc. Co. Proj.) Series 1988 B, 5.2% 6/1/13 (Nat'l. Pub. Fin. Guarantee Corp. Insured) | | 3,000 | | 3,050 |
Municipal Bonds - continued |
| Principal Amount (000s) | | Value (000s) |
Indiana - continued |
Lake Central Multi-District School Bldg. Corp. Series 2012 B: | | | | |
4% 1/15/19 | | $ 1,000 | | $ 1,139 |
4% 1/15/20 | | 1,345 | | 1,539 |
4% 1/15/21 | | 1,250 | | 1,434 |
5% 7/15/19 | | 1,680 | | 2,035 |
5% 7/15/20 | | 1,170 | | 1,432 |
5% 7/15/21 | | 1,000 | | 1,233 |
Purdue Univ. Rev.: | | | | |
(Student Facilities Sys. Proj.) Series 2009 B: | | | | |
4% 7/1/17 | | 500 | | 567 |
5% 7/1/15 | | 315 | | 350 |
5% 7/1/16 | | 500 | | 573 |
Series Z-1: | | | | |
5% 7/1/16 | | 1,215 | | 1,394 |
5% 7/1/17 | | 1,000 | | 1,179 |
5% 7/1/18 | | 1,500 | | 1,812 |
Univ. of Southern Indiana Rev. Series J: | | | | |
5% 10/1/14 (Assured Guaranty Corp. Insured) | | 1,985 | | 2,121 |
5% 10/1/15 (Assured Guaranty Corp. Insured) | | 1,000 | | 1,102 |
5% 10/1/16 (Assured Guaranty Corp. Insured) | | 1,165 | | 1,319 |
| | 85,090 |
Iowa - 0.0% |
Iowa Fin. Auth. Health Facilities Rev. Series 2005 A, 5% 2/15/16 (Assured Guaranty Corp. Insured) | | 1,700 | | 1,884 |
Kansas - 0.7% |
Kansas Dev. Fin. Agcy. (Adventist Health Sys./Sunbelt Obligated Group Proj.) Series 2009 D: | | | | |
5% 11/15/14 | | 575 | | 616 |
5% 11/15/15 | | 625 | | 691 |
5% 11/15/16 | | 875 | | 991 |
Overland Park Sales Tax Spl. Oblig. Rev. Series 2012, 4.375% 12/15/23 | | 3,100 | | 3,095 |
Wichita Hosp. Facilities Rev.: | | | | |
(Via Christi Health Sys., Inc. Proj.) Series 2009 X, 5% 11/15/14 | | 2,000 | | 2,159 |
(Via Christi Health Sys., Inc. Proj.) Series 2009 III A: | | | | |
5% 11/15/14 | | 2,405 | | 2,596 |
5% 11/15/15 | | 6,245 | | 6,958 |
5% 11/15/16 | | 5,410 | | 6,168 |
Municipal Bonds - continued |
| Principal Amount (000s) | | Value (000s) |
Kansas - continued |
Wichita Hosp. Facilities Rev.: - continued | | | | |
Series 2011 IV A: | | | | |
5% 11/15/18 | | $ 2,250 | | $ 2,643 |
5% 11/15/20 | | 2,745 | | 3,258 |
| | 29,175 |
Kentucky - 0.8% |
Ashland Med. Ctr. Rev. (Ashland Hosp. Corp. d/b/a/ King's Daughters Med. Ctr. Proj.) Series 2010 B: | | | | |
4% 2/1/14 | | 750 | | 773 |
4% 2/1/15 | | 1,495 | | 1,573 |
Jefferson County School District Fin. Corp. School Bldg. Rev. Series 2009 A, 5.25% 1/1/13 (FSA Insured) | | 2,170 | | 2,170 |
Kentucky Econ. Dev. Fin. Auth. Hosp. Rev. (Baptist Healthcare Sys. Proj.) Series A, 5% 8/15/15 | | 4,000 | | 4,367 |
Kentucky Econ. Dev. Fin. Auth. Rev. (Ashland Hosp. Corp. d/b/a/ King's Daughters Med. Ctr. Proj.) Series 2010 A, 4% 2/1/13 | | 500 | | 501 |
Kentucky State Property & Buildings Commission Rev. (#82 Proj.) 5.25% 10/1/17 (FSA Insured) | | 2,450 | | 2,915 |
Louisville/Jefferson County Metropolitan Govt. Poll. Cont. Rev. Bonds: | | | | |
(Louisville Gas and Elec. Co. Proj.) Series 2007 B: | | | | |
1.15%, tender 6/1/17 (b) | | 2,600 | | 2,577 |
1.6%, tender 6/1/17 (b) | | 8,000 | | 7,976 |
(Louisville Gas and Electronic Co. Proj.): | | | | |
Series 2003 A, 1.65%, tender 4/3/17 (b) | | 6,000 | | 6,065 |
Series 2005 A, 5.75%, tender 12/2/13 (b) | | 6,000 | | 6,273 |
| | 35,190 |
Louisiana - 0.3% |
Louisiana Pub. Facilities Auth. Rev.: | | | | |
(Christus Health Proj.) Series 2009 A: | | | | |
5% 7/1/13 | | 3,500 | | 3,568 |
5% 7/1/16 | | 2,000 | | 2,216 |
(Entergy Gulf States Louisiana LLC Proj.) Series 2010 B, 2.875% 11/1/15 | | 3,000 | | 3,092 |
New Orleans Gen. Oblig. Series 2012, 5% 12/1/20 | | 2,800 | | 3,302 |
Reg'l. Transit Auth. Louisiana Sales Tax Rev. 4% 12/1/16 (FSA Insured) | | 1,000 | | 1,105 |
| | 13,283 |
Municipal Bonds - continued |
| Principal Amount (000s) | | Value (000s) |
Maryland - 1.4% |
Maryland Gen. Oblig. Second Series B, 5.25% 8/15/16 | | $ 16,100 | | $ 18,772 |
Maryland Health & Higher Edl. Facilities Auth. Rev.: | | | | |
(Univ. of Maryland Med. Sys. Proj.) Series 2008 F: | | | | |
5% 7/1/13 | | 2,400 | | 2,446 |
5% 7/1/14 | | 3,500 | | 3,678 |
Bonds: | | | | |
(Johns Hopkins Health Sys. Obligated Group Proj.) Series 2008 B, 5%, tender 5/15/15 (b) | | 2,225 | | 2,447 |
Series 2012 D, 0.973%, tender 11/15/17 (b) | | 14,000 | | 14,078 |
Montgomery County Gen. Oblig.: | | | | |
(Dept. of Liquor Cont. Proj.) Series 2009 A, 5% 4/1/15 | | 1,725 | | 1,886 |
Series 2011 A, 5% 7/1/20 | | 16,000 | | 19,562 |
| | 62,869 |
Massachusetts - 1.6% |
Braintree Gen. Oblig. Series 2009: | | | | |
5% 5/15/14 | | 1,000 | | 1,063 |
5% 5/15/16 | | 4,400 | | 5,041 |
Massachusetts Bay Trans. Auth. Sales Tax Rev. Series 2006 B, 5.25% 7/1/18 | | 2,300 | | 2,810 |
Massachusetts Dept. of Trans. Metropolitan Hwy. Sys. Rev. Series 2010 B, 5% 1/1/15 | | 12,400 | | 13,348 |
Massachusetts Dev. Fin. Agcy. Rev.: | | | | |
(Boston College Proj.): | | | | |
Series Q1: | | | | |
4% 7/1/15 | | 1,500 | | 1,621 |
4% 7/1/16 | | 1,000 | | 1,108 |
5% 7/1/13 | | 1,000 | | 1,023 |
Series Q2: | | | | |
4% 7/1/15 | | 1,170 | | 1,264 |
4% 7/1/16 | | 1,000 | | 1,108 |
5% 7/1/13 | | 1,100 | | 1,126 |
5% 7/1/14 | | 1,080 | | 1,153 |
5% 7/1/17 | | 1,370 | | 1,606 |
(Tufts Med. Ctr. Proj.) Series I: | | | | |
5% 1/1/14 | | 1,550 | | 1,609 |
5% 1/1/16 | | 1,300 | | 1,425 |
Bonds (Dominion Energy Brayton Point Proj.) Series 2010 A, 2.25%, tender 9/1/16 (b) | | 1,400 | | 1,443 |
Massachusetts Gen. Oblig. Series 2004 B, 5.25% 8/1/20 | | 12,700 | | 16,129 |
Municipal Bonds - continued |
| Principal Amount (000s) | | Value (000s) |
Massachusetts - continued |
Massachusetts Health & Edl. Facilities Auth. Rev. Bonds (Baystate Health Sys. Proj.) Series 2009 K, 5%, tender 7/1/13 (b) | | $ 7,000 | | $ 7,125 |
Massachusetts Spl. Oblig. Rev. (Fed. Hwy. Grant Anticipation Note Prog.) Series 2003 A, 5% 12/15/13 | | 4,325 | | 4,521 |
Medford Gen. Oblig. Series 2011 B, 4% 3/1/19 | | 3,570 | | 4,102 |
| | 68,625 |
Michigan - 3.1% |
Big Rapids Pub. School District: | | | | |
5% 5/1/13 (Assured Guaranty Corp. Insured) | | 1,195 | | 1,213 |
5% 5/1/14 (Assured Guaranty Corp. Insured) | | 1,190 | | 1,257 |
Chelsea School District 5% 5/1/13 (Nat'l. Pub. Fin. Guarantee Corp. Insured) | | 1,750 | | 1,776 |
Detroit School District Series 2012 A: | | | | |
5% 5/1/19 | | 2,000 | | 2,355 |
5% 5/1/20 | | 2,000 | | 2,372 |
5% 5/1/21 | | 1,810 | | 2,165 |
Detroit Swr. Disp. Rev. Series 2006 D, 0.841% 7/1/32 (b) | | 4,070 | | 3,417 |
Grand Rapids Cmnty. College 5% 5/1/13 (FSA Insured) | | 1,305 | | 1,325 |
Grand Valley Michigan State Univ. Rev. Series 2009, 5% 12/1/16 | | 1,320 | | 1,491 |
Kalamazoo Hosp. Fin. Auth. Hosp. Facilities Rev. Series 2003 A, 5.25% 5/15/14 (FSA Insured) | | 2,000 | | 2,118 |
Kalamazoo Pub. Schools 5% 5/1/13 (Assured Guaranty Corp. Insured) | | 2,940 | | 2,985 |
Kent Hosp. Fin. Auth. Hosp. Facilities Rev.: | | | | |
(Spectrum Health Sys. Proj.) Series 2011 A: | | | | |
5% 11/15/18 | | 1,250 | | 1,472 |
5% 11/15/19 | | 1,000 | | 1,188 |
Bonds (Spectrum Health Sys. Proj.) Series 2008 A, 5.25%, tender 1/15/14 (b) | | 2,200 | | 2,301 |
Michigan Fin. Auth. Rev.: | | | | |
Series 2008 B2, 5% 6/1/15 | | 1,090 | | 1,171 |
Series 2012 A: | | | | |
5% 6/1/16 | | 2,290 | | 2,511 |
5% 6/1/17 | | 1,410 | | 1,570 |
5% 6/1/18 | | 2,330 | | 2,632 |
Michigan Hosp. Fin. Auth. Rev.: | | | | |
(McLaren Health Care Corp. Proj.) Series 2008 A, 5.25% 5/15/14 | | 4,160 | | 4,415 |
Municipal Bonds - continued |
| Principal Amount (000s) | | Value (000s) |
Michigan - continued |
Michigan Hosp. Fin. Auth. Rev.: - continued | | | | |
Bonds (Ascension Health Cr. Group Proj.) Series 1999 B3, 2%, tender 8/1/14 (b) | | $ 11,000 | | $ 11,264 |
Michigan Muni. Bond Auth. Rev.: | | | | |
(Clean Wtr. Pooled Proj.) Series 2010: | | | | |
5% 10/1/14 | | 6,045 | | 6,530 |
5% 10/1/15 | | 1,750 | | 1,972 |
5% 10/1/15 | | 3,250 | | 3,662 |
(Local Govt. Ln. Prog.) Series 2009 C: | | | | |
5% 5/1/13 | | 1,645 | | 1,669 |
5% 5/1/14 | | 2,140 | | 2,261 |
5% 5/1/15 | | 1,845 | | 2,003 |
5% 5/1/16 | | 1,865 | | 2,080 |
Royal Oak Hosp. Fin. Auth. Hosp. Rev. (William Beaumont Hosp. Oblig. Group Proj.) Series 2009 W, 5% 8/1/15 | | 2,070 | | 2,208 |
Univ. of Michigan Univ. Rev. Bonds 0.33%, tender 4/1/15 (b) | | 22,900 | | 22,900 |
Wayne County Arpt. Auth. Rev.: | | | | |
(Detroit Metropolitan Wayne County Arpt. Proj.) Series 2012 A, 5% 12/1/14 (e) | | 1,500 | | 1,614 |
Series 2010 A, 5% 12/1/18 (e) | | 1,400 | | 1,623 |
Series 2011 A, 5% 12/1/19 (e) | | 22,700 | | 26,155 |
West Bloomfield School District 5% 5/1/15 (Assured Guaranty Corp. Insured) | | 1,400 | | 1,528 |
Western Michigan Univ. Rev.: | | | | |
5.25% 11/15/14 (Assured Guaranty Corp. Insured) | | 2,135 | | 2,310 |
5.25% 11/15/15 (Assured Guaranty Corp. Insured) | | 3,275 | | 3,659 |
| | 133,172 |
Minnesota - 0.2% |
Minneapolis & Saint Paul Metropolitan Arpts. Commission Arpt. Rev. Series 2008 A, 5% 1/1/13 (e) | | 1,000 | | 1,000 |
Minnesota 911 Rev. (Pub. Safety Radio Communications Sys. Proj.) Series 2009, 5% 6/1/14 (Assured Guaranty Corp. Insured) | | 2,225 | | 2,369 |
Minnesota Agric. & Econ. Dev. Board Rev. (Essentia Health Obligated Group Proj.) Series 2008 C1: | | | | |
5% 2/15/15 (Assured Guaranty Corp. Insured) | | 1,335 | | 1,443 |
5% 2/15/16 (Assured Guaranty Corp. Insured) | | 565 | | 628 |
Municipal Bonds - continued |
| Principal Amount (000s) | | Value (000s) |
Minnesota - continued |
Northern Muni. Pwr. Agcy. Elec. Sys. Rev. Series 2009 A, 5% 1/1/15 (Assured Guaranty Corp. Insured) | | $ 1,000 | | $ 1,087 |
Southern Minnesota Muni. Pwr. Agcy. Pwr. Supply Sys. Rev. Series 2009 A, 5% 1/1/16 | | 1,000 | | 1,123 |
| | 7,650 |
Mississippi - 0.3% |
Mississippi Bus. Fin. Corp. Solid Waste Disp. Rev. Bonds (Gulf Pwr. Co. Proj.) Series 2012, 0.55%, tender 12/12/13 (b)(e) | | 4,900 | | 4,900 |
Mississippi Gen. Oblig. (Cap. Impts. Proj.) Series 2012 D, 0.66% 9/1/17 (b) | | 3,700 | | 3,714 |
Mississippi Hsg. Fin. Corp. Single Family Mtg. Rev. Series 1983, 0% 6/1/15 (Escrowed to Maturity) | | 4,000 | | 3,937 |
| | 12,551 |
Nebraska - 0.2% |
Nebraska Pub. Pwr. District Rev.: | | | | |
Series 2012 C, 5% 1/1/22 | | 1,100 | | 1,279 |
Series C: | | | | |
4% 1/1/15 | | 2,360 | | 2,518 |
4% 1/1/16 | | 2,195 | | 2,404 |
Univ. of Nebraska Facilities Corp. Lease Rental Rev. (UNMC Health Professions Futures Proj.) Series 2009, 5% 8/15/13 | | 4,000 | | 4,117 |
| | 10,318 |
Nevada - 2.1% |
Clark County Arpt. Rev. Series 2008 E: | | | | |
5% 7/1/14 | | 2,905 | | 3,100 |
5% 7/1/15 | | 3,500 | | 3,859 |
Clark County Fuel Tax Series 2008, 5% 6/1/13 (Escrowed to Maturity) | | 5,815 | | 5,928 |
Clark County School District: | | | | |
Series 1998, 5.5% 6/15/13 (FSA Insured) | | 5,000 | | 5,116 |
Series 2005 A, 5% 6/15/16 (Nat'l. Pub. Fin. Guarantee Corp. Insured) | | 21,215 | | 23,534 |
Series 2012 A, 5% 6/15/19 | | 24,610 | | 29,516 |
Nevada Dept. of Bus. & Industry (Waste Mgmt., Inc. Proj.) Series 2001, 2.75% 10/1/14 (e) | | 3,000 | | 3,102 |
Municipal Bonds - continued |
| Principal Amount (000s) | | Value (000s) |
Nevada - continued |
Nevada Gen. Oblig.: | | | | |
Series 2010 C, 5% 6/1/19 | | $ 12,140 | | $ 14,694 |
Series 2012 B, 5% 8/1/20 | | 2,230 | | 2,728 |
| | 91,577 |
New Hampshire - 0.3% |
New Hampshire Health & Ed. Facilities Auth. Rev. Series 2012: | | | | |
4% 7/1/20 | | 2,705 | | 2,988 |
4% 7/1/21 | | 1,520 | | 1,674 |
New Hampshire Tpk. Sys. Rev. Series 2012 B: | | | | |
5% 2/1/17 | | 3,000 | | 3,464 |
5% 2/1/18 | | 2,500 | | 2,953 |
| | 11,079 |
New Jersey - 3.2% |
New Jersey Ctfs. of Prtn.: | | | | |
Series 2008 A, 5% 6/15/15 | | 750 | | 820 |
Series 2009 A: | | | | |
5% 6/15/15 | | 11,285 | | 12,305 |
5% 6/15/16 | | 6,500 | | 7,248 |
New Jersey Econ. Dev. Auth. School Facilities Construction Rev.: | | | | |
Bonds Series 2008 J4, 5%, tender 9/1/14 (FSA Insured) (b) | | 7,000 | | 7,460 |
Series 2001 A, 5.5% 6/15/13 (Escrowed to Maturity) | | 1,090 | | 1,116 |
Series 2005 K, 5.25% 12/15/14 (FGIC Insured) (Nat'l. Pub. Fin. Guarantee Corp. Insured) | | 1,790 | | 1,949 |
Series 2005 O, 5% 3/1/20 (Pre-Refunded to 3/1/15 @ 100) | | 6,350 | | 6,974 |
Series 2008 W, 5% 3/1/15 | | 10,400 | | 11,333 |
Series 2009 BB, 5% 9/1/15 | | 3,390 | | 3,753 |
Series 2011 EE, 5% 9/1/20 | | 5,000 | | 6,092 |
Series 2012 G, 0.71% 2/1/15 (b) | | 7,800 | | 7,807 |
Series 2012 II, 5% 3/1/21 | | 6,800 | | 8,209 |
Series 2012: | | | | |
5% 6/15/13 | | 2,200 | | 2,243 |
5% 6/15/18 | | 10,600 | | 12,133 |
New Jersey Gen. Oblig. Series O, 5.25% 8/1/22 | | 3,930 | | 5,038 |
New Jersey Higher Ed. Student Assistance Auth. Student Ln. Rev. Series 2010 1A, 5% 12/1/15 | | 4,500 | | 4,976 |
New Jersey Tpk. Auth. Tpk. Rev.: | | | | |
Bonds Series 2012 A, 0.88%, tender 12/22/14 (b) | | 15,400 | | 15,449 |
Municipal Bonds - continued |
| Principal Amount (000s) | | Value (000s) |
New Jersey - continued |
New Jersey Tpk. Auth. Tpk. Rev.: - continued | | | | |
Series 1991 C, 6.5% 1/1/16 (Escrowed to Maturity) | | $ 3,315 | | $ 3,644 |
New Jersey Trans. Trust Fund Auth.: | | | | |
Series 2003 A, 5.5% 12/15/16 (FSA Insured) | | 5,000 | | 5,867 |
Series 2003 B. 5.25% 12/15/19 | | 3,000 | | 3,677 |
New Jersey Transit Corp. Ctfs. of Prtn. Series 2003 A, 5.25% 9/15/13 (AMBAC Insured) | | 1,940 | | 2,000 |
Toms River Gen. Oblig. 2% 12/27/13 | | 10,574 | | 10,720 |
| | 140,813 |
New Mexico - 1.1% |
Farmington Poll. Cont. Rev. Bonds (Southern California Edison Co. Four Corners Proj.) Series 2005 B, 2.875%, tender 4/1/15 (b) | | 22,100 | | 22,991 |
New Mexico Edl. Assistance Foundation: | | | | |
Series 2009 B, 4% 9/1/16 | | 7,000 | | 7,634 |
Series 2010 A1: | | | | |
4% 12/1/15 | | 3,700 | | 3,986 |
4% 12/1/16 | | 6,750 | | 7,383 |
Rio Rancho Wtr. & Wastewtr. Sys. Rev. Series 2009, 5% 5/15/17 (FSA Insured) | | 4,480 | | 5,197 |
| | 47,191 |
New York - 11.2% |
Dutchess County Local Dev. Corp. Rev. (Health Quest Systems, Inc. Proj.) Series 2010 A: | | | | |
5% 7/1/18 (Assured Guaranty Corp. Insured) (FSA Insured) | | 1,100 | | 1,262 |
5% 7/1/19 (Assured Guaranty Corp. Insured) (FSA Insured) | | 640 | | 741 |
Long Island Pwr. Auth. Elec. Sys. Rev.: | | | | |
Series 2003 B, 5.25% 6/1/14 | | 2,000 | | 2,123 |
Series 2010 A, 5% 5/1/15 | | 5,000 | | 5,465 |
Metropolitan Trans. Auth. Svc. Contract Rev. Series 2002 A, 5.5% 7/1/17 | | 5,000 | | 5,957 |
New York City Gen. Oblig.: | | | | |
Series 2005 F1, 5% 9/1/15 | | 3,560 | | 3,967 |
Series 2009 C: | | | | |
5% 8/1/13 | | 6,445 | | 6,623 |
5% 8/1/13 (Escrowed to Maturity) | | 555 | | 570 |
Series B, 5% 8/1/14 | | 10,000 | | 10,705 |
Series G, 5.625% 8/1/13 (Nat'l. Pub. Fin. Guarantee Corp. Insured) | | 50 | | 50 |
Municipal Bonds - continued |
| Principal Amount (000s) | | Value (000s) |
New York - continued |
New York City Transitional Fin. Auth. Rev.: | | | | |
Series 2003 B, 5% 2/1/20 | | $ 3,000 | | $ 3,736 |
Series 2010 B: | | | | |
5% 11/1/17 | | 20,305 | | 24,206 |
5% 11/1/17 (Escrowed to Maturity) | | 9,695 | | 11,598 |
5% 11/1/20 | | 5,950 | | 7,454 |
Series 2010 D: | | | | |
5% 11/1/15 (Escrowed to Maturity) | | 890 | | 1,004 |
5% 11/1/17 | | 10,115 | | 12,058 |
Series 2012 A: | | | | |
5% 11/1/17 | | 7,000 | | 8,345 |
5% 11/1/20 | | 4,500 | | 5,662 |
New York Dorm. Auth. Mental Health Svcs. Facilities Impt. Rev.: | | | | |
(State Univ. Proj.) Series 2012 A, 5% 5/15/20 | | 4,000 | | 4,913 |
Series 2012 A, 4% 5/15/20 | | 8,000 | | 9,274 |
New York Dorm. Auth. Personal Income Tax Rev.: | | | | |
(Ed. Proj.) Series 2009 A: | | | | |
5% 3/15/13 | | 3,545 | | 3,579 |
5% 3/15/14 | | 3,745 | | 3,956 |
5% 3/15/15 | | 4,000 | | 4,393 |
Series 2009 D: | | | | |
5% 6/15/14 | | 9,890 | | 10,558 |
5% 6/15/15 | | 16,075 | | 17,820 |
5% 6/15/16 | | 9,330 | | 10,694 |
Series 2010 A, 5% 2/15/14 (Escrowed to Maturity) | | 10 | | 11 |
Series 2012 A, 5% 12/15/20 | | 8,500 | | 10,613 |
Series A: | | | | |
5% 2/15/14 | | 9,840 | | 10,356 |
5% 2/15/15 | | 8,775 | | 9,606 |
5% 2/15/15 (Escrowed to Maturity) | | 5 | | 5 |
New York Dorm. Auth. Revs.: | | | | |
(City Univ. Sys. Consolidation Proj.) Series A: | | | | |
5.75% 7/1/13 | | 955 | | 981 |
5.75% 7/1/13 | | 270 | | 277 |
(Mental Health Svcs. Facilities Proj.): | | | | |
Series 2008 D: | | | | |
5% 2/15/14 | | 7,295 | | 7,668 |
5% 8/15/14 | | 7,755 | | 8,322 |
Series 2009 A1, 5% 2/15/15 | | 9,000 | | 9,801 |
(New York Univ. Hosp. Ctr. Proj.) Series 2011 A, 5% 7/1/18 | | 3,240 | | 3,763 |
Municipal Bonds - continued |
| Principal Amount (000s) | | Value (000s) |
New York - continued |
New York Dorm. Auth. Revs.: - continued | | | | |
(St. Lawrence Univ.) Series 2008, 5% 7/1/14 (Escrowed to Maturity) | | $ 3,700 | | $ 3,959 |
Series 2008 B, 5% 7/1/15 | | 30,000 | | 33,260 |
Series 2008 D, 5.25% 8/15/17 (FSA Insured) | | 7,000 | | 8,314 |
Series 2009 A: | | | | |
5% 7/1/15 | | 12,850 | | 14,202 |
5% 7/1/16 | | 8,390 | | 9,526 |
New York Local Govt. Assistance Corp. Series 2003 A, 5% 4/1/18 | | 12,400 | | 14,997 |
New York Metropolitan Trans. Auth. Dedicated Tax Fund Rev.: | | | | |
Bonds Series 2008 B, 0.36%, tender 11/1/14 (b) | | 6,000 | | 5,989 |
Series B: | | | | |
5% 11/15/14 | | 1,350 | | 1,465 |
5% 11/15/15 | | 2,325 | | 2,611 |
New York Metropolitan Trans. Auth. Rev.: | | | | |
Bonds: | | | | |
Series 2012 G1, 0.563%, tender 11/1/14 (b) | | 6,800 | | 6,796 |
Series 2012 G2, 0.673%, tender 11/1/15 (b) | | 13,300 | | 13,288 |
Series 2003 B: | | | | |
5.25% 11/15/17 (Pre-Refunded to 11/15/13 @ 100) | | 1,040 | | 1,083 |
5.25% 11/15/19 (Nat'l. Pub. Fin. Guarantee Corp. Insured) | | 5,200 | | 6,384 |
Series 2008 B2: | | | | |
5% 11/15/19 | | 6,185 | | 7,493 |
5% 11/15/20 | | 5,500 | | 6,677 |
5% 11/15/21 | | 4,000 | | 4,883 |
Series 2010 B2, 4% 11/15/14 | | 2,830 | | 3,012 |
Series 2012 D, 5% 11/15/18 | | 2,515 | | 3,000 |
Series 2012 E: | | | | |
4% 11/15/19 | | 4,000 | | 4,588 |
5% 11/15/18 | | 2,250 | | 2,683 |
5% 11/15/21 | | 2,435 | | 2,973 |
Series 2012 F, 5% 11/15/19 | | 5,000 | | 6,057 |
New York State Dorm. Auth. Lease Rev. Bonds Series 2003 B, 5.25%, tender 7/1/13 (b) | | 3,000 | | 3,071 |
New York Thruway Auth. Second Gen. Hwy. & Bridge Trust Fund: | | | | |
Series 2008 A, 5% 4/1/13 | | 2,600 | | 2,630 |
Series 2010 A, 5% 4/1/17 | | 1,000 | | 1,165 |
Municipal Bonds - continued |
| Principal Amount (000s) | | Value (000s) |
New York - continued |
New York Thruway Auth. Second Gen. Hwy. & Bridge Trust Fund: - continued | | | | |
Series 2011 A1: | | | | |
5% 4/1/17 | | $ 1,500 | | $ 1,747 |
5% 4/1/18 | | 3,500 | | 4,164 |
New York Urban Dev. Corp. Rev.: | | | | |
Series 2009 C, 5% 12/15/16 | | 17,000 | | 19,812 |
Series 2011 A, 5% 3/15/21 | | 18,425 | | 23,043 |
Tobacco Settlement Fing. Corp. Series 2011, 5% 6/1/16 | | 20,000 | | 22,652 |
Triborough Bridge & Tunnel Auth. Revs. Series Y, 5.5% 1/1/17 (Escrowed to Maturity) | | 6,470 | | 7,043 |
| | 486,683 |
New York & New Jersey - 0.1% |
Port Auth. of New York & New Jersey 124th Series, 5% 8/1/13 (Nat'l. Pub. Fin. Guarantee Corp. Insured) (e) | | 1,200 | | 1,204 |
Port Auth. of New York & New Jersey Spl. Oblig. Rev. (JFK Int'l. Air Term. Spl. Proj.) Series 6, 6.25% 12/1/13 (Nat'l. Pub. Fin. Guarantee Corp. Insured) (e) | | 4,100 | | 4,257 |
| | 5,461 |
North Carolina - 2.0% |
Dare County Ctfs. of Prtn. Series 2012 B: | | | | |
4% 6/1/17 | | 1,000 | | 1,118 |
4% 6/1/18 | | 1,280 | | 1,461 |
4% 6/1/20 | | 1,000 | | 1,159 |
5% 6/1/19 | | 1,305 | | 1,586 |
Mecklenburg County Pub. Facilities Corp. Series 2009: | | | | |
5% 3/1/16 | | 5,870 | | 6,659 |
5% 3/1/18 | | 1,500 | | 1,804 |
Nash Health Care Sys. Health Care Facilities Rev. Series 2003: | | | | |
5% 11/1/13 (FSA Insured) | | 1,500 | | 1,551 |
5% 11/1/15 (FSA Insured) | | 1,600 | | 1,730 |
North Carolina Eastern Muni. Pwr. Agcy. Pwr. Sys. Rev.: | | | | |
Series 2008 A, 5% 1/1/13 | | 2,200 | | 2,200 |
Series 2010 A: | | | | |
5% 1/1/15 | | 4,000 | | 4,339 |
5% 1/1/16 | | 6,035 | | 6,754 |
Series 2012 D, 5% 1/1/14 | | 3,000 | | 3,135 |
North Carolina Grant Anticipation Rev. Series 2009, 5% 3/1/15 | | 1,250 | | 1,369 |
Municipal Bonds - continued |
| Principal Amount (000s) | | Value (000s) |
North Carolina - continued |
North Carolina Med. Care Commission Hosp. Rev. (North Carolina Baptist Hosp. Proj.) Series 2010: | | | | |
5% 6/1/15 | | $ 1,500 | | $ 1,653 |
5% 6/1/16 | | 1,000 | | 1,134 |
5% 6/1/17 | | 3,220 | | 3,738 |
5% 6/1/18 | | 3,820 | | 4,532 |
North Carolina Muni. Pwr. Agcy. #1 Catawba Elec. Rev.: | | | | |
Series 1998 A, 5.5% 1/1/15 (Nat'l. Pub. Fin. Guarantee Corp. Insured) | | 3,675 | | 4,023 |
Series 2008 A, 5.25% 1/1/20 | | 2,000 | | 2,375 |
Series 2012 A, 5% 1/1/18 | | 18,685 | | 21,907 |
Univ. of North Carolina at Chapel Hill Rev. Bonds Series 2012 A, 0.593%, tender 12/1/15 (b) | | 11,500 | | 11,530 |
| | 85,757 |
North Dakota - 0.0% |
Grand Forks Health Care Sys. Rev. (Altru Health Sys. Proj.) Series 2005, 5% 12/1/15 (Assured Guaranty Corp. Insured) | | 1,825 | | 1,998 |
Ohio - 2.3% |
Buckeye Tobacco Settlement Fing. Auth. Series 2007 A1: | | | | |
5% 6/1/16 | | 3,035 | | 3,339 |
5% 6/1/17 | | 3,500 | | 3,941 |
Cincinnati City School District 5.25% 12/1/18 (Nat'l. Pub. Fin. Guarantee Corp. Insured) | | 3,555 | | 4,331 |
Columbus City School District (School Facilities Construction and Impt. Proj.) Series 2009 B, 4% 12/1/16 | | 1,000 | | 1,116 |
Hamilton County Student Hsg. Rev. (Stratford Heights Proj.) Series 2010: | | | | |
5% 6/1/15 (FSA Insured) | | 760 | | 818 |
5% 6/1/16 (FSA Insured) | | 1,105 | | 1,222 |
5% 6/1/17 (FSA Insured) | | 1,160 | | 1,304 |
Ohio Air Quality Dev. Auth. Rev.: | | | | |
Bonds (Ohio Pwr. Co. Proj.) Series 2010 A, 3.25%, tender 6/2/14 (b) | | 5,500 | | 5,657 |
Series 2009 C, 5.625% 6/1/18 | | 1,395 | | 1,629 |
Ohio Bldg. Auth.: | | | | |
(Administrative Bldg. Fund Proj.): | | | | |
Series 2009 B: | | | | |
5% 10/1/14 | | 5,955 | | 6,423 |
5% 10/1/15 | | 6,505 | | 7,275 |
Municipal Bonds - continued |
| Principal Amount (000s) | | Value (000s) |
Ohio - continued |
Ohio Bldg. Auth.: - continued | | | | |
(Administrative Bldg. Fund Proj.): | | | | |
Series 2010 C: | | | | |
4% 10/1/15 | | $ 3,200 | | $ 3,483 |
5% 10/1/16 | | 1,250 | | 1,435 |
(Adult Correctional Bldg. Fund Proj.): | | | | |
Series 2009 B: | | | | |
5% 10/1/14 | | 2,055 | | 2,217 |
5% 10/1/15 | | 4,535 | | 5,071 |
Series 2010 A, 5% 10/1/15 | | 1,185 | | 1,322 |
Ohio Gen. Oblig.: | | | | |
(Common Schools Proj.) Series 2010 A, 5% 9/15/17 | | 2,600 | | 3,073 |
(Higher Ed. Proj.): | | | | |
Series 2005 C, 5% 8/1/13 | | 4,495 | | 4,619 |
Series 2010 A, 5% 8/1/17 | | 3,290 | | 3,875 |
Series 2011 A, 5% 8/1/17 | | 3,070 | | 3,616 |
Series 2012 C, 5% 9/15/21 | | 4,350 | | 5,486 |
Ohio Higher Edl. Facility Commission Rev.: | | | | |
(Cleveland Clinic Foundation Proj.) Series 2008 A, 5% 1/1/15 | | 2,000 | | 2,175 |
(Univ. Hosp. Health Sys. Proj.) Series 2010 A: | | | | |
5% 1/15/15 | | 500 | | 537 |
5% 1/15/17 | | 1,000 | | 1,120 |
Ohio State Univ. Gen. Receipts Series 2010 A: | | | | |
5% 12/1/16 | | 4,720 | | 5,495 |
5% 12/1/16 (Escrowed to Maturity) | | 280 | | 327 |
Ohio Wtr. Dev. Auth. Poll. Cont. Facilities Rev. Bonds: | | | | |
(First Energy Nuclear Generation Corp. Proj.) Series 2005 B, 3.375%, tender 7/1/15 (b) | | 5,000 | | 5,153 |
(FirstEnergy Corp. Proj.) Series 2009 A, 5.875%, tender 6/1/16 (b) | | 10,225 | | 11,434 |
Ross County Hosp. Facilities Rev. (Adena Health Sys. Proj.) Series 2008: | | | | |
5% 12/1/13 | | 875 | | 906 |
5% 12/1/14 | | 2,275 | | 2,434 |
| | 100,833 |
Oklahoma - 0.2% |
Oklahoma Dev. Fin. Auth. (Pub. Svc. Co. of Oklahoma Proj.) Series 2009, 5.25% 6/1/14 | | 2,700 | | 2,850 |
Municipal Bonds - continued |
| Principal Amount (000s) | | Value (000s) |
Oklahoma - continued |
Oklahoma Dev. Fin. Auth. Health Sys. Rev. (Integris Baptist Med. Ctr. Proj.) Series 2008 B, 5% 8/15/14 | | $ 1,660 | | $ 1,770 |
Tulsa County Indl. Auth. Edl. Facilities Lease Rev. (Jenks Pub. Schools Proj.) Series 2009, 5.5% 9/1/18 | | 5,215 | | 6,358 |
| | 10,978 |
Oregon - 0.3% |
Clackamas County Hosp. Facility Auth. Bonds (Legacy Health Sys. Proj.) Series 2009 C, 5%, tender 7/15/14 (b) | | 2,500 | | 2,640 |
Gilliam County Solid Waste Disp. Rev. Bonds (Waste Mgmt., Inc. Proj.) Series 2000 A, 3.5%, tender 5/1/13 (b)(e) | | 5,300 | | 5,352 |
Oregon Facilities Auth. Rev. (Legacy Health Sys. Proj.) Series 2009 A: | | | | |
5% 3/15/13 | | 1,000 | | 1,009 |
5% 3/15/14 | | 595 | | 623 |
5% 3/15/15 | | 2,500 | | 2,709 |
5% 3/15/16 | | 1,750 | | 1,949 |
| | 14,282 |
Pennsylvania - 4.1% |
Allegheny County Arpt. Auth. Rev. Series A: | | | | |
5% 1/1/14 (FSA Insured) (e) | | 1,350 | | 1,390 |
5% 1/1/15 (FSA Insured) (e) | | 1,000 | | 1,066 |
5% 1/1/16 (FSA Insured) (e) | | 1,000 | | 1,091 |
Allegheny County Hosp. Dev. Auth. Rev.: | | | | |
(Pittsburgh Med. Ctr. Proj.) Series 2008 B, 5% 6/15/14 | | 1,385 | | 1,476 |
(Univ. of Pittsburgh Med. Ctr. Proj.) Series 2009 A: | | | | |
4% 8/15/15 | | 1,385 | | 1,502 |
5% 8/15/14 | | 1,955 | | 2,099 |
Beaver County Indl. Dev. Auth. Poll. Cont. Rev. Bonds (FirstEnergy Nuclear Generation Corp. Proj.) Series 2005 A, 3.375%, tender 7/1/15 (b) | | 2,000 | | 2,061 |
Econ. Dev. Fin. Auth. Unemployment Compensation Rev. Series 2012 B: | | | | |
5% 1/1/22 | | 5,000 | | 5,848 |
5% 7/1/22 | | 5,200 | | 5,927 |
5% 1/1/23 | | 3,000 | | 3,365 |
5% 7/1/23 | | 1,650 | | 1,822 |
Municipal Bonds - continued |
| Principal Amount (000s) | | Value (000s) |
Pennsylvania - continued |
Franklin County Indl. Dev. Auth. (The Chambersburg Hosp. Proj.) Series 2010: | | | | |
5% 7/1/16 | | $ 1,000 | | $ 1,098 |
5% 7/1/17 | | 1,255 | | 1,389 |
Montgomery County Indl. Dev. Series 2012 A, 3% 10/1/13 | | 1,650 | | 1,681 |
Montgomery County Higher Ed. & Health Auth. Hosp. Rev. (Abington Memorial Hosp. Proj.) Series 2009 A, 5% 6/1/17 | | 2,200 | | 2,515 |
Pennsylvania Econ. Dev. Auth. Governmental Lease (Forum Place Proj.) Series 2012: | | | | |
5% 3/1/18 | | 2,455 | | 2,830 |
5% 3/1/19 | | 2,310 | | 2,705 |
5% 3/1/20 | | 2,140 | | 2,530 |
Pennsylvania Gen. Oblig. Series 2011, 5% 7/1/21 | | 1,900 | | 2,402 |
Pennsylvania Intergovernmental Coop. Auth. Spl. Tax Rev. (City of Philadelphia Fdg. Prog.) Series 2009, 5% 6/15/15 | | 10,600 | | 11,709 |
Pennsylvania Tpk. Commission Tpk. Rev. Series 2009 B, 5% 12/1/17 | | 12,500 | | 14,731 |
Philadelphia Gas Works Rev. (1998 Gen. Ordinance Proj.) Eighth Series A, 5% 8/1/15 | | 2,100 | | 2,306 |
Philadelphia Gen. Oblig.: | | | | |
Series 2008 A: | | | | |
5% 12/15/14 (FSA Insured) | | 5,370 | | 5,799 |
5% 12/15/15 (FSA Insured) | | 5,000 | | 5,544 |
5% 12/15/16 (FSA Insured) | | 7,275 | | 8,265 |
Series 2011: | | | | |
5.25% 8/1/17 | | 6,165 | | 7,025 |
5.25% 8/1/18 | | 5,515 | | 6,352 |
Philadelphia School District Series 2010 C, 5% 9/1/16 | | 13,610 | | 15,408 |
Philadelphia Wtr. & Wastewtr. Rev. Series 2010 A: | | | | |
5% 6/15/15 | | 15,000 | | 16,501 |
5% 6/15/16 | | 6,000 | | 6,796 |
Pittsburgh & Allegheny County Sports & Exhibition Auth. Series 2010: | | | | |
5% 2/1/15 (FSA Insured) | | 4,580 | | 4,928 |
5% 2/1/16 (FSA Insured) | | 5,620 | | 6,211 |
Pittsburgh School District: | | | | |
Series 2009 A, 3% 9/1/14 (Assured Guaranty Corp. Insured) | | 1,640 | | 1,706 |
Series 2010 A: | | | | |
4% 9/1/15 (FSA Insured) | | 1,450 | | 1,561 |
Municipal Bonds - continued |
| Principal Amount (000s) | | Value (000s) |
Pennsylvania - continued |
Pittsburgh School District: - continued | | | | |
Series 2010 A: | | | | |
5% 9/1/16 (FSA Insured) | | $ 1,685 | | $ 1,904 |
Saint Mary Hosp. Auth. Health Sys. Rev. (Catholic Health East Proj.) Series 2010 B: | | | | |
5% 11/15/13 | | 2,465 | | 2,550 |
5% 11/15/14 | | 4,690 | | 5,026 |
5% 11/15/15 | | 2,420 | | 2,667 |
Southeastern Pennsylvania Trans. Auth. Rev. Series 2011: | | | | |
5% 6/1/18 | | 1,000 | | 1,168 |
5% 6/1/19 | | 200 | | 237 |
State Pub. School Bldg. Auth. Lease Rev. (Philadelphia School District Proj.) Series 2012: | | | | |
5% 4/1/14 | | 1,000 | | 1,052 |
5% 4/1/19 | | 1,305 | | 1,535 |
5% 4/1/20 | | 1,250 | | 1,479 |
5% 4/1/21 | | 1,000 | | 1,186 |
Unionville-Chadds Ford School District Gen. Oblig. Series 2009, 5% 6/1/20 | | 1,190 | | 1,453 |
| | 179,896 |
Puerto Rico - 0.4% |
Puerto Rico Commonwealth Aqueduct & Swr. Auth. Series 2012 A, 5% 7/1/21 | | 6,000 | | 5,984 |
Puerto Rico Infrastructure Fin. Bonds (Port Auth. Proj.) Series 2011 C, 2.75%, tender 6/15/13 (b)(e) | | 9,600 | | 9,636 |
| | 15,620 |
Rhode Island - 0.2% |
Rhode Island Econ. Dev. Corp. Rev. (Dept. of Trans. Proj.) Series 2009 A: | | | | |
5% 6/15/15 (Assured Guaranty Corp. Insured) | | 2,010 | | 2,203 |
5% 6/15/16 (Assured Guaranty Corp. Insured) | | 6,625 | | 7,463 |
| | 9,666 |
South Carolina - 0.5% |
Lexington County Health Svcs. District, Inc. Hosp. Rev. Series 2011, 5% 11/1/19 | | 1,190 | | 1,427 |
South Carolina Pub. Svc. Auth. (Santee Cooper) Rev. Oblig.: | | | | |
Series 2012 B: | | | | |
5% 12/1/17 | | 2,000 | | 2,364 |
5% 12/1/20 | | 1,000 | | 1,242 |
Municipal Bonds - continued |
| Principal Amount (000s) | | Value (000s) |
South Carolina - continued |
South Carolina Pub. Svc. Auth. (Santee Cooper) Rev. Oblig.: - continued | | | | |
Series 2012 C: | | | | |
5% 12/1/13 | | $ 2,400 | | $ 2,501 |
5% 12/1/17 | | 10,535 | | 12,454 |
| | 19,988 |
South Dakota - 0.2% |
South Dakota Health & Edl. Facilities Auth. Rev.: | | | | |
(Reg'l. Health Proj.) Series 2010: | | | | |
5% 9/1/14 | | 625 | | 668 |
5% 9/1/15 | | 680 | | 749 |
5% 9/1/16 | | 500 | | 564 |
5% 9/1/17 | | 490 | | 562 |
Series 2011: | | | | |
5% 9/1/17 | | 1,100 | | 1,261 |
5% 9/1/18 | | 1,200 | | 1,395 |
5% 9/1/19 | | 1,255 | | 1,472 |
| | 6,671 |
Tennessee - 0.5% |
Jackson Hosp. Rev. (Jackson-Madison County Gen. Hosp. Proj.) Series 2008, 5% 4/1/13 | | 1,000 | | 1,010 |
Knox County Health Edl. & Hsg. Facilities Series 2012 A: | | | | |
5% 1/1/19 | | 1,925 | | 2,232 |
5% 1/1/20 | | 2,500 | | 2,918 |
5% 1/1/21 | | 2,500 | | 2,928 |
Memphis Elec. Sys. Rev. 5% 12/1/14 | | 5,000 | | 5,442 |
Memphis-Shelby County Arpt. Auth. Arpt. Rev. Series 2010 B, 5% 7/1/16 (e) | | 1,730 | | 1,945 |
Metropolitan Nashville Arpt. Auth. Rev. Series 2010 A: | | | | |
5% 7/1/16 | | 1,815 | | 2,018 |
5% 7/1/17 | | 1,100 | | 1,248 |
Shelby County Health Edl. & Hsg. Facilities Board Rev. Series 2004 A, 5% 9/1/15 | | 3,125 | | 3,459 |
| | 23,200 |
Texas - 7.7% |
Austin Cmnty. College District Pub. Facilities Lease Rev. (Round Rock Campus Proj.) Series 2008, 5.25% 8/1/15 | | 2,585 | | 2,866 |
Municipal Bonds - continued |
| Principal Amount (000s) | | Value (000s) |
Texas - continued |
Austin Convention Enterprises, Inc. (Convention Ctr. Proj.): | | | | |
Series 2006 A, 6% 1/1/14 | | $ 1,420 | | $ 1,469 |
Series 2006 B, 6% 1/1/13 | | 1,270 | | 1,270 |
Austin Elec. Util. Sys. Rev.: | | | | |
Series A, 5% 11/15/15 | | 1,000 | | 1,126 |
0% 5/15/18 (Nat'l. Pub. Fin. Guarantee Corp. Insured) | | 4,500 | | 4,008 |
Austin Independent School District Series 2004, 5% 8/1/17 | | 1,450 | | 1,716 |
Austin Wtr. & Wastewtr. Sys. Rev. Series 2009 A, 5% 11/15/15 | | 2,250 | | 2,531 |
Brownsville Util. Sys. Rev. Series 2008 A, 5% 9/1/15 (FSA Insured) | | 2,665 | | 2,946 |
Carroll Independent School District Series 2009 C, 5.25% 2/15/19 | | 1,000 | | 1,242 |
Corpus Christi Independent School District 4% 8/15/14 | | 10,140 | | 10,730 |
Dallas Fort Worth Int'l. Arpt. Rev. Series 2009 A: | | | | |
5% 11/1/14 | | 2,500 | | 2,705 |
5% 11/1/15 | | 5,000 | | 5,599 |
Dallas Wtrwks. & Swr. Sys. Rev. Series 2011, 5% 10/1/18 | | 1,600 | | 1,953 |
Fort Worth Independent School District Series 2009, 5% 2/15/16 | | 3,690 | | 4,186 |
Frisco Gen. Oblig. Series 2004, 5.25% 2/15/14 (Nat'l. Pub. Fin. Guarantee Corp. Insured) | | 1,380 | | 1,456 |
Grapevine Gen. Oblig.: | | | | |
Series 2009 A, 5% 2/15/15 | | 2,215 | | 2,418 |
Series 2009, 5% 2/15/16 | | 1,375 | | 1,554 |
Harris County Cultural Ed. Facilities Fin. Corp. Thermal Util. Rev. (TECO Proj.) Series 2009 A: | | | | |
5% 11/15/14 | | 1,000 | | 1,072 |
5% 11/15/16 | | 500 | | 568 |
Harris County Gen. Oblig.: | | | | |
(Road Proj.) Series 2008 B: | | | | |
5% 8/15/13 | | 1,000 | | 1,029 |
5% 8/15/14 | | 1,075 | | 1,155 |
Bonds Series 2012 B, 0.72%, tender 8/15/15 (b) | | 10,470 | | 10,479 |
Series 2012 A, 0.56% 8/15/15 (b) | | 1,300 | | 1,302 |
Houston Arpt. Sys. Rev.: | | | | |
Series 2011 A, 5% 7/1/17 (e) | | 7,380 | | 8,533 |
Series A: | | | | |
5% 7/1/15 | | 2,070 | | 2,293 |
Municipal Bonds - continued |
| Principal Amount (000s) | | Value (000s) |
Texas - continued |
Houston Arpt. Sys. Rev.: - continued | | | | |
Series A: | | | | |
5% 7/1/16 | | $ 1,080 | | $ 1,233 |
Houston Gen. Oblig.: | | | | |
Series 2004 A, 5.25% 3/1/14 (Nat'l. Pub. Fin. Guarantee Corp. Insured) | | 2,855 | | 3,018 |
Series A, 5% 3/1/13 (Nat'l. Pub. Fin. Guarantee Corp. Insured) | | 7,500 | | 7,557 |
Houston Independent School District: | | | | |
Bonds Series 2012: | | | | |
1.5%, tender 6/1/13 (b) | | 8,745 | | 8,785 |
2%, tender 6/1/14 (b) | | 5,850 | | 5,966 |
Series 2005 A, 0% 2/15/16 | | 4,500 | | 4,385 |
Houston Util. Sys. Rev. Bonds Series 2012 C, 0.73%, tender 8/1/16 (b) | | 9,200 | | 9,214 |
Humble Independent School District Series 2009, 4% 2/15/13 | | 400 | | 402 |
Keller Independent School District 5% 2/15/14 | | 3,750 | | 3,944 |
Klein Independent School District Series 2009 A, 5% 8/1/16 | | 2,195 | | 2,523 |
Leander Independent School District Series 2001, 6% 8/15/14 (Escrowed to Maturity) | | 1,850 | | 2,020 |
Lewisville Independent School District Series 2009, 5% 8/15/17 | | 1,170 | | 1,378 |
Lone Star College Sys. Gen. Oblig. Series 2010 A, 5% 8/15/22 | | 2,500 | | 2,508 |
Lower Colorado River Auth. Rev.: | | | | |
Series 2010, 5% 5/15/17 | | 2,805 | | 3,249 |
Series 2012 A, 4% 5/15/14 | | 1,575 | | 1,651 |
5% 5/15/15 | | 2,120 | | 2,334 |
5% 5/15/15 (Escrowed to Maturity) | | 5 | | 6 |
5% 5/15/16 | | 2,355 | | 2,670 |
5% 5/15/16 (Escrowed to Maturity) | | 5 | | 6 |
Lower Colorado River Auth. Transmission Contract Rev. (LCRA Transmission Svcs. Corp. Proj.) Series 2010, 5% 5/15/18 | | 3,140 | | 3,722 |
Lubbock Gen. Oblig. Series 2005, 5% 2/15/13 (Nat'l. Pub. Fin. Guarantee Corp. Insured) | | 1,850 | | 1,860 |
Lubbock Health Facilities Dev. Corp. Rev. (St. Joseph Health Sys. Proj.) Series 2008 B: | | | | |
5% 7/1/17 | | 2,800 | | 3,197 |
5% 7/1/18 | | 3,030 | | 3,523 |
Mansfield Independent School District Series 2009, 4% 2/15/17 | | 1,840 | | 2,067 |
Municipal Bonds - continued |
| Principal Amount (000s) | | Value (000s) |
Texas - continued |
Mission Econ. Dev. Corp. Solid Waste Disp. Rev. Bonds (Republic Svcs., Inc. Proj.) Series 2008 A, 0.45%, tender 1/2/13 (b) | | $ 8,900 | | $ 8,900 |
North Texas Tollway Auth. Rev.: | | | | |
Bonds: | | | | |
Series 2008 H2, 5%, tender 1/1/13 (b) | | 5,000 | | 5,000 |
Series 2012 C, 1.95%, tender 1/1/19 (b) | | 8,500 | | 8,543 |
Series 2010 B1, 3.2% 1/1/13 | | 2,275 | | 2,275 |
Northside Independent School District Bonds: | | | | |
1%, tender 6/1/16 (b) | | 20,000 | | 19,920 |
1.2%, tender 8/1/17 (b) | | 30,000 | | 29,880 |
Sam Rayburn Muni. Pwr. Agcy. Series 2012: | | | | |
5% 10/1/13 | | 4,065 | | 4,193 |
5% 10/1/20 | | 1,000 | | 1,182 |
San Antonio Elec. & Gas Sys. Rev. Bonds Series 2012 A, 2%, tender 12/1/14 (b) | | 8,370 | | 8,594 |
San Antonio Pub. Facilities Corp. and Rfdg. Lease (Convention Ctr. Proj.) Series 2012: | | | | |
5% 9/15/20 | | 1,000 | | 1,223 |
5% 9/15/21 | | 1,000 | | 1,231 |
5% 9/15/22 | | 3,440 | | 4,250 |
San Antonio Wtr. Sys. Rev. Series 2012: | | | | |
4% 5/15/19 | | 1,500 | | 1,757 |
5% 5/15/20 | | 6,000 | | 7,502 |
5% 5/15/21 | | 5,000 | | 6,330 |
San Jacinto Cmnty. College District Series 2009: | | | | |
5% 2/15/15 | | 2,220 | | 2,416 |
5% 2/15/15 (Escrowed to Maturity) | | 280 | | 307 |
5% 2/15/16 | | 2,000 | | 2,247 |
Southwest Higher Ed. Auth. Rev. (Southern Methodist Univ. Proj.) Series 2009, 5% 10/1/16 | | 5,795 | | 6,637 |
Tarrant County Cultural Ed. Facilities Fin. Corp. Rev. (Christus Health Proj.) Series 2008 A, 5.75% 7/1/18 (Assured Guaranty Corp. Insured) | | 4,265 | | 4,591 |
Texas Gen. Oblig. Series B, 0% 10/1/13 | | 6,500 | | 6,485 |
Texas Muni. Pwr. Agy. Rev. Series 2010: | | | | |
4% 9/1/14 | | 1,000 | | 1,049 |
5% 9/1/15 | | 835 | | 919 |
5% 9/1/16 | | 750 | | 847 |
Texas Pub. Fin. Auth. Rev. Series 2010 A, 5% 1/1/16 | | 7,865 | | 8,874 |
Texas Trans. Commission Central Texas Tpk. Sys. Rev. Bonds Series 2012 B, 1.25%, tender 2/15/15 (b) | | 6,300 | | 6,318 |
Municipal Bonds - continued |
| Principal Amount (000s) | | Value (000s) |
Texas - continued |
Texas Trans. Commission State Hwy. Fund Rev. Series 2007, 5% 4/1/25 | | $ 2,200 | | $ 2,553 |
Tomball Independent School District 5% 2/15/17 (Assured Guaranty Corp. Insured) | | 1,105 | | 1,274 |
Trinity River Auth. Reg'l. Wastewtr. Sys. Rev. Series 2008, 5% 8/1/13 | | 6,135 | | 6,304 |
Univ. of North Texas Univ. Rev. Series A, 5% 4/15/14 | | 1,000 | | 1,059 |
Univ. of Texas Board of Regents Sys. Rev.: | | | | |
Series 2003 B, 5% 8/15/33 (Pre-Refunded to 8/15/13 @ 100) | | 15,000 | | 15,438 |
Series 2010 B, 5% 8/15/21 | | 1,800 | | 2,284 |
| | 333,806 |
Utah - 0.1% |
Salt Lake County Wtr. Conservancy District Rev. Series A, 0% 10/1/13 (AMBAC Insured) | | 3,760 | | 3,714 |
Utah Associated Muni. Pwr. Sys. Rev. (Payson Pwr. Proj.) 5% 9/1/17 | | 1,090 | | 1,255 |
| | 4,969 |
Vermont - 0.1% |
Vermont Edl. & Health Bldg. Fin. Agcy. Rev. (Fletcher Allen Health Care Proj.) Series 2004 B, 5% 12/1/15 (FSA Insured) | | 2,225 | | 2,396 |
Virgin Islands - 0.1% |
Virgin Islands Pub. Fin. Auth. Series 2009 B, 5% 10/1/15 | | 5,000 | | 5,366 |
Virginia - 0.4% |
Amelia County Indl. Dev. Auth. Solid Waste Disp. Rev. Bonds (Waste Mgmt., Inc. Proj.) 3.375%, tender 4/1/13 (b)(e) | | 5,900 | | 5,942 |
Chesapeake Econ. Dev. Auth. Poll. Cont. Rev. Bonds (Elec. & Pwr. Co. Proj.) Series 2008 A, 3.6%, tender 2/1/13 (b) | | 1,800 | | 1,804 |
Chesapeake Trans. Sys. Toll Road Rev. Series 2012 A: | | | | |
4% 7/15/20 | | 605 | | 647 |
5% 7/15/21 | | 400 | | 458 |
Municipal Bonds - continued |
| Principal Amount (000s) | | Value (000s) |
Virginia - continued |
Louisa Indl. Dev. Auth. Poll. Cont. Rev. Bonds (Virginia Elec. & Pwr. Co. Proj.) Series 2008 B, 5.375%, tender 12/2/13 (b) | | $ 8,000 | | $ 8,352 |
York County Econ. Dev. Auth. Poll. Cont. Rev. Bonds (Virginia Elec. and Pwr. Co. Proj.) Series 2009 A, 4.05%, tender 5/1/14 (b) | | 1,800 | | 1,876 |
| | 19,079 |
Washington - 1.7% |
Energy Northwest Elec. Rev.: | | | | |
(#3 Proj.) Series 2009 A, 5% 7/1/14 | | 4,000 | | 4,280 |
Series 2012 A, 5% 7/1/19 | | 30,000 | | 36,952 |
Grant County Pub. Util. District #2 Series 2012 A: | | | | |
5% 1/1/20 | | 1,375 | | 1,669 |
5% 1/1/21 | | 1,865 | | 2,286 |
King County Highline School District # 401 Series 2009: | | | | |
5% 12/1/16 | | 6,350 | | 7,379 |
5% 12/1/17 | | 2,950 | | 3,518 |
Port of Seattle Passenger Facilities Charge Rev. Series 2010 B, 5% 12/1/16 (e) | | 2,500 | | 2,845 |
Port of Seattle Rev. Series 2010 C: | | | | |
5% 2/1/16 (e) | | 2,000 | | 2,233 |
5% 2/1/17 (e) | | 2,500 | | 2,848 |
Seattle Muni. Lt. & Pwr. Rev. Series 2010 B, 5% 2/1/17 | | 2,000 | | 2,326 |
Spokane County Wastewtr. Sys. Rev. Series 2009 A, 5% 12/1/15 | | 1,710 | | 1,921 |
Washington Health Care Facilities Auth. Rev. (MultiCare Health Sys. Proj.) Series 2010 A: | | | | |
5% 8/15/13 | | 2,000 | | 2,048 |
5% 8/15/14 | | 2,000 | | 2,118 |
| | 72,423 |
West Virginia - 0.2% |
West Virginia Econ. Dev. Auth. Solid Waste Disp. Facilities Rev. Bonds Series 2011 A, 2.25%, tender 9/1/16 (b)(e) | | 7,000 | | 7,034 |
Wisconsin - 1.1% |
Milwaukee County Arpt. Rev. Series 2010 B, 5% 12/1/15 (e) | | 1,720 | | 1,902 |
Wisconsin Gen. Oblig.: | | | | |
Series 2005 1, 5% 5/1/15 (Nat'l. Pub. Fin. Guarantee Corp. Insured) | | 6,325 | | 6,981 |
Series 2009 C, 4% 5/1/14 | | 3,365 | | 3,527 |
Municipal Bonds - continued |
| Principal Amount (000s) | | Value (000s) |
Wisconsin - continued |
Wisconsin Gen. Oblig.: - continued | | | | |
Series 2010 1: | | | | |
5% 5/1/14 | | $ 5,750 | | $ 6,102 |
5% 5/1/15 | | 8,005 | | 8,835 |
5% 5/1/16 | | 10,000 | | 11,400 |
Wisconsin Health & Edl. Facilities Auth. Rev.: | | | | |
(Agnesian HealthCare, Inc. Proj.) Series 2010, 5% 7/1/16 | | 1,175 | | 1,286 |
(Aurora Health Care, Inc. Proj.) Series 2010 A, 5% 4/15/17 | | 1,500 | | 1,685 |
(Marshfield Clinic Proj.) Series 2006 A, 5% 2/15/13 | | 875 | | 879 |
(Thedacare, Inc. Proj.) Series 2010: | | | | |
4% 12/15/13 | | 1,035 | | 1,064 |
5% 12/15/15 | | 1,105 | | 1,218 |
5% 12/15/16 | | 1,440 | | 1,613 |
5% 12/15/17 | | 1,540 | | 1,751 |
Series 2012, 5% 10/1/21 | | 1,400 | | 1,687 |
| | 49,930 |
TOTAL MUNICIPAL BONDS (Cost $3,719,996) |
3,866,088
|
Municipal Notes - 2.9% |
| | | |
California - 2.3% |
California Cmnty. College Fin. Auth. Trans. TRAN Series 2012 C, 2.5% 6/28/13 | 5,200 | | 5,237 |
California Gen. Oblig. RAN Series A1, 2.5% 5/30/13 | 88,000 | | 88,845 |
California School Cash Reserve Prog. Auth. TRAN Series 2012 X, 2.5% 1/31/13 | 5,055 | | 5,060 |
| | 99,142 |
New Jersey - 0.2% |
Hudson County Gen. Oblig. BAN 1% 12/6/13 | 3,300 | | 3,316 |
Newark Gen. Oblig. BAN Series 2012 D, 2% 12/11/13 | 3,000 | | 3,017 |
| | 6,333 |
New York - 0.4% |
Suffolk County Gen. Oblig. TAN Series 2012 A, 2% 8/14/13 | 18,800 | | 18,968 |
TOTAL MUNICIPAL NOTES (Cost $124,375) |
124,443
|
Money Market Funds - 5.8% |
| Shares | | Value (000s) |
Fidelity Municipal Cash Central Fund, 0.16% (c)(d)
(Cost $249,946) | 249,945,900 | | $ 249,946 |
TOTAL INVESTMENT PORTFOLIO - 97.7% (Cost $4,094,317) | | 4,240,477 |
NET OTHER ASSETS (LIABILITIES) - 2.3% | | 101,948 |
NET ASSETS - 100% | $ 4,342,425 |
Security Type Abbreviations |
BAN | - | BOND ANTICIPATION NOTE |
RAN | - | REVENUE ANTICIPATION NOTE |
TAN | - | TAX ANTICIPATION NOTE |
TRAN | - | TAX AND REVENUE ANTICIPATION N |
Legend |
(a) Security or a portion of the security purchased on a delayed delivery or when-issued basis. |
(b) Coupon rates for floating and adjustable rate securities reflect the rates in effect at period end. |
(c) Information in this report regarding holdings by state and security types does not reflect the holdings of the Fidelity Municipal Cash Central Fund. |
(d) Affiliated fund that is available only to investment companies and other accounts managed by Fidelity Investments. The rate quoted is the annualized seven-day yield of the fund at period end. A complete unaudited listing of the fund's holdings as of its most recent quarter end is available upon request. In addition, each Fidelity Central Fund's financial statements, which are not covered by the Fund's Report of Independent Registered Public Accounting Firm, are available on the SEC's website or upon request. |
(e) Private activity obligations whose interest is subject to the federal alternative minimum tax for individuals. |
Affiliated Central Funds |
Information regarding fiscal year to date income earned by the Fund from investments in Fidelity Central Funds is as follows: |
Fund | Income earned
(Amount in thousands) |
Fidelity Municipal Cash Central Fund | $ 563 |
Other Information |
The following is a summary of the inputs used, as of December 31, 2012, involving the Fund's assets and liabilities carried at fair value. The inputs or methodology used for valuing securities may not be an indication of the risk associated with investing in those securities. For more information on valuation inputs, and their aggregation into the levels used in the table below, please refer to the Investment Valuation section in the accompanying Notes to Financial Statements. |
Valuation Inputs at Reporting Date: |
Description
(Amounts in thousands) | Total | Level 1 | Level 2 | Level 3 |
Investments in Securities: | | | | |
Municipal Securities | $ 3,990,531 | $ - | $ 3,990,531 | $ - |
Money Market Funds | 249,946 | 249,946 | - | - |
Total Investments in Securities: | $ 4,240,477 | $ 249,946 | $ 3,990,531 | $ - |
The distribution of municipal securities by revenue source, as a percentage of total net assets, is as follows (Unaudited): |
General Obligations | 36.4% |
Electric Utilities | 12.7% |
Special Tax | 12.1% |
Health Care | 9.3% |
Transportation | 7.1% |
Water & Sewer | 5.8% |
Others (Individually Less Than 5%) | 8.5% |
Short-Term Investments and Net Other Assets | 8.1% |
| 100.0% |
See accompanying notes which are an integral part of the financial statements.
Annual Report
Statement of Assets and Liabilities
Amounts in thousands (except per-share amounts) | December 31, 2012 |
| | |
Assets | | |
Investment in securities, at value - See accompanying schedule: Unaffiliated issuers (cost $3,844,371) | $ 3,990,531 | |
Fidelity Central Funds (cost $249,946) | 249,946 | |
Total Investments (cost $4,094,317) | | $ 4,240,477 |
Cash | | 85,977 |
Receivable for fund shares sold | | 14,881 |
Interest receivable | | 40,782 |
Distributions receivable from Fidelity Central Funds | | 32 |
Prepaid expenses | | 11 |
Other receivables | | 36 |
Total assets | | 4,382,196 |
| | |
Liabilities | | |
Payable for investments purchased
Regular delivery | $ 3,600 | |
Delayed delivery | 19,792 | |
Payable for fund shares redeemed | 12,315 | |
Distributions payable | 1,647 | |
Accrued management fee | 1,334 | |
Distribution and service plan fees payable | 164 | |
Other affiliated payables | 822 | |
Other payables and accrued expenses | 97 | |
Total liabilities | | 39,771 |
| | |
Net Assets | | $ 4,342,425 |
Net Assets consist of: | | |
Paid in capital | | $ 4,195,346 |
Undistributed net investment income | | 63 |
Accumulated undistributed net realized gain (loss) on investments | | 856 |
Net unrealized appreciation (depreciation) on investments | | 146,160 |
Net Assets | | $ 4,342,425 |
See accompanying notes which are an integral part of the financial statements.
Annual Report
Statement of Assets and Liabilities - continued
Amounts in thousands (except per-share amounts) | December 31, 2012 |
| | |
Calculation of Maximum Offering Price
Class A:
Net Asset Value and redemption price per share
($394,222 ÷ 36,285.0 shares) | | $ 10.86 |
| | |
Maximum offering price per share (100/97.25 of $10.86) | | $ 11.17 |
Class T:
Net Asset Value and redemption price per share ($24,646 ÷ 2,272.4 shares) | | $ 10.85 |
| | |
Maximum offering price per share (100/97.25 of $10.85) | | $ 11.16 |
Class B:
Net Asset Value and offering price per share ($1,110 ÷ 102.2 shares)A | | $ 10.86 |
| | |
Class C:
Net Asset Value and offering price per share ($92,301 ÷ 8,511.2 shares)A | | $ 10.84 |
| | |
Short-Intermediate Municipal Income:
Net Asset Value, offering price and redemption price per share ($3,624,182 ÷ 334,145.2 shares) | | $ 10.85 |
| | |
Institutional Class:
Net Asset Value, offering price and redemption price per share ($205,964 ÷ 18,979.6 shares) | | $ 10.85 |
A Redemption price per share is equal to net asset value less any applicable contingent deferred sales charge.
See accompanying notes which are an integral part of the financial statements.
Annual Report
Financial Statements - continued
Statement of Operations
Amounts in thousands | Year ended December 31, 2012 |
| | |
Investment Income | | |
Interest | | $ 98,389 |
Income from Fidelity Central Funds | | 563 |
Total income | | 98,952 |
| | |
Expenses | | |
Management fee | $ 15,811 | |
Transfer agent fees | 4,209 | |
Distribution and service plan fees | 1,887 | |
Accounting fees and expenses | 631 | |
Custodian fees and expenses | 45 | |
Independent trustees' compensation | 16 | |
Registration fees | 297 | |
Audit | 56 | |
Legal | 12 | |
Miscellaneous | 37 | |
Total expenses before reductions | 23,001 | |
Expense reductions | (265) | 22,736 |
Net investment income (loss) | | 76,216 |
Realized and Unrealized Gain (Loss) Net realized gain (loss) on: | | |
Investment securities: | | |
Unaffiliated issuers | 5,865 | |
Capital gain distributions from Fidelity Central Funds | 3 | |
Total net realized gain (loss) | | 5,868 |
Change in net unrealized appreciation (depreciation) on investment securities | | 9,754 |
Net gain (loss) | | 15,622 |
Net increase (decrease) in net assets resulting from operations | | $ 91,838 |
See accompanying notes which are an integral part of the financial statements.
Annual Report
Statement of Changes in Net Assets
Amounts in thousands | Year ended
December 31, 2012 | Year ended
December 31, 2011 |
Increase (Decrease) in Net Assets | | |
Operations | | |
Net investment income (loss) | $ 76,216 | $ 80,340 |
Net realized gain (loss) | 5,868 | 2,116 |
Change in net unrealized appreciation (depreciation) | 9,754 | 76,652 |
Net increase (decrease) in net assets resulting
from operations | 91,838 | 159,108 |
Distributions to shareholders from net investment income | (73,237) | (83,163) |
Distributions to shareholders from net realized gain | (4,814) | (2,965) |
Total distributions | (78,051) | (86,128) |
Share transactions - net increase (decrease) | 211,189 | 142,426 |
Redemption fees | 50 | 46 |
Total increase (decrease) in net assets | 225,026 | 215,452 |
| | |
Net Assets | | |
Beginning of period | 4,117,399 | 3,901,947 |
End of period (including undistributed net investment income of $63 and distributions in excess of net investment income of $2,916, respectively) | $ 4,342,425 | $ 4,117,399 |
See accompanying notes which are an integral part of the financial statements.
Annual Report
Financial Highlights - Class A
Years ended December 31, | 2012 | 2011 | 2010 | 2009 | 2008 |
Selected Per-Share Data | | | | | |
Net asset value, beginning of period | $ 10.83 | $ 10.62 | $ 10.64 | $ 10.35 | $ 10.33 |
Income from Investment Operations | | | | | |
Net investment income (loss) C | .164 | .198 | .209 | .254 | .298 |
Net realized and unrealized gain (loss) | .034 | .225 | (.016) | .294 | .021 |
Total from investment operations | .198 | .423 | .193 | .548 | .319 |
Distributions from net investment income | (.156) | (.205) | (.209) | (.258) | (.300) |
Distributions from net realized gain | (.012) | (.008) | (.004) | - | - |
Total distributions | (.168) | (.213) | (.213) | (.258) | (.300) |
Redemption fees added to paid in capital C | - G | - G | - G | - G | .001 |
Net asset value, end of period | $ 10.86 | $ 10.83 | $ 10.62 | $ 10.64 | $ 10.35 |
Total Return A,B | 1.84% | 4.03% | 1.81% | 5.34% | 3.13% |
Ratios to Average Net Assets D,F | | | | | |
Expenses before reductions | .79% | .77% | .78% | .79% | .75% |
Expenses net of fee waivers, if any | .79% | .77% | .78% | .78% | .75% |
Expenses net of all reductions | .78% | .77% | .77% | .78% | .72% |
Net investment income (loss) | 1.51% | 1.85% | 1.95% | 2.41% | 2.90% |
Supplemental Data | | | | | |
Net assets, end of period (in millions) | $ 394 | $ 336 | $ 200 | $ 169 | $ 58 |
Portfolio turnover rate E | 21% | 22% | 15% | 8% | 20% |
A Total returns would have been lower if certain expenses had not been reduced during the applicable periods shown.
B Total returns do not include the effect of the sales charges.
C Calculated based on average shares outstanding during the period.
D Fees and expenses of any underlying Fidelity Central Funds are not included in the Fund's expense ratio. The Fund indirectly bears its proportionate share of the expenses of any underlying Fidelity Central Funds.
E Amount does not include the portfolio activity of any underlying Fidelity Central Funds.
F Expense ratios reflect operating expenses of the class. Expenses before reductions do not reflect amounts reimbursed by the investment adviser or reductions from brokerage service arrangements or reductions from other expense offset arrangements and do not represent the amount paid by the class during periods when reimbursements or reductions occur. Expenses net of fee waivers reflect expenses after reimbursement by the investment adviser but prior to reductions from brokerage service arrangements or other expense offset arrangements. Expenses net of all reductions represent the net expenses paid by the class.
G Amount represents less than $.001 per share.
See accompanying notes which are an integral part of the financial statements.
Annual Report
Financial Highlights - Class T
Years ended December 31, | 2012 | 2011 | 2010 | 2009 | 2008 |
Selected Per-Share Data | | | | | |
Net asset value, beginning of period | $ 10.81 | $ 10.60 | $ 10.63 | $ 10.34 | $ 10.31 |
Income from Investment Operations | | | | | |
Net investment income (loss) C | .166 | .199 | .211 | .255 | .300 |
Net realized and unrealized gain (loss) | .044 | .226 | (.026) | .294 | .029 |
Total from investment operations | .210 | .425 | .185 | .549 | .329 |
Distributions from net investment income | (.158) | (.207) | (.211) | (.259) | (.300) |
Distributions from net realized gain | (.012) | (.008) | (.004) | - | - |
Total distributions | (.170) | (.215) | (.215) | (.259) | (.300) |
Redemption fees added to paid in capital C | - G | - G | - G | - G | �� .001 |
Net asset value, end of period | $ 10.85 | $ 10.81 | $ 10.60 | $ 10.63 | $ 10.34 |
Total Return A,B | 1.95% | 4.05% | 1.74% | 5.36% | 3.24% |
Ratios to Average Net Assets D,F | | | | | |
Expenses before reductions | .77% | .76% | .76% | .77% | .74% |
Expenses net of fee waivers, if any | .77% | .76% | .76% | .77% | .74% |
Expenses net of all reductions | .76% | .76% | .75% | .77% | .72% |
Net investment income (loss) | 1.52% | 1.86% | 1.97% | 2.42% | 2.90% |
Supplemental Data | | | | | |
Net assets, end of period (in millions) | $ 25 | $ 26 | $ 24 | $ 23 | $ 15 |
Portfolio turnover rate E | 21% | 22% | 15% | 8% | 20% |
A Total returns would have been lower if certain expenses had not been reduced during the applicable periods shown.
B Total returns do not include the effect of the sales charges.
C Calculated based on average shares outstanding during the period.
D Fees and expenses of any underlying Fidelity Central Funds are not included in the Fund's expense ratio. The Fund indirectly bears its proportionate share of the expenses of any underlying Fidelity Central Funds.
E Amount does not include the portfolio activity of any underlying Fidelity Central Funds.
F Expense ratios reflect operating expenses of the class. Expenses before reductions do not reflect amounts reimbursed by the investment adviser or reductions from brokerage service arrangements or reductions from other expense offset arrangements and do not represent the amount paid by the class during periods when reimbursements or reductions occur. Expenses net of fee waivers reflect expenses after reimbursement by the investment adviser but prior to reductions from brokerage service arrangements or other expense offset arrangements. Expenses net of all reductions represent the net expenses paid by the class.
G Amount represents less than $.001 per share.
See accompanying notes which are an integral part of the financial statements.
Annual Report
Financial Highlights - Class B
Years ended December 31, | 2012 | 2011 | 2010 | 2009 | 2008 |
Selected Per-Share Data | | | | | |
Net asset value, beginning of period | $ 10.82 | $ 10.61 | $ 10.64 | $ 10.35 | $ 10.32 |
Income from Investment Operations | | | | | |
Net investment income (loss) C | .093 | .128 | .139 | .186 | .230 |
Net realized and unrealized gain (loss) | .045 | .226 | (.026) | .293 | .029 |
Total from investment operations | .138 | .354 | .113 | .479 | .259 |
Distributions from net investment income | (.086) | (.136) | (.139) | (.189) | (.230) |
Distributions from net realized gain | (.012) | (.008) | (.004) | - | - |
Total distributions | (.098) | (.144) | (.143) | (.189) | (.230) |
Redemption fees added to paid in capital C | - G | - G | - G | - G | .001 |
Net asset value, end of period | $ 10.86 | $ 10.82 | $ 10.61 | $ 10.64 | $ 10.35 |
Total Return A,B | 1.27% | 3.36% | 1.06% | 4.66% | 2.54% |
Ratios to Average Net Assets D,F | | | | | |
Expenses before reductions | 1.44% | 1.43% | 1.44% | 1.46% | 1.43% |
Expenses net of fee waivers, if any | 1.44% | 1.42% | 1.43% | 1.43% | 1.43% |
Expenses net of all reductions | 1.43% | 1.42% | 1.42% | 1.43% | 1.40% |
Net investment income (loss) | .85% | 1.19% | 1.30% | 1.77% | 2.22% |
Supplemental Data | | | | | |
Net assets, end of period (in millions) | $ 1 | $ 2 | $ 2 | $ 3 | $ 2 |
Portfolio turnover rate E | 21% | 22% | 15% | 8% | 20% |
A Total returns would have been lower if certain expenses had not been reduced during the applicable periods shown.
B Total returns do not include the effect of the contingent deferred sales charge.
C Calculated based on average shares outstanding during the period.
D Fees and expenses of any underlying Fidelity Central Funds are not included in the Fund's expense ratio. The Fund indirectly bears its proportionate share of the expenses of any underlying Fidelity Central Funds.
E Amount does not include the portfolio activity of any underlying Fidelity Central Funds.
F Expense ratios reflect operating expenses of the class. Expenses before reductions do not reflect amounts reimbursed by the investment adviser or reductions from brokerage service arrangements or reductions from other expense offset arrangements and do not represent the amount paid by the class during periods when reimbursements or reductions occur. Expenses net of fee waivers reflect expenses after reimbursement by the investment adviser but prior to reductions from brokerage service arrangements or other expense offset arrangements. Expenses net of all reductions represent the net expenses paid by the class.
G Amount represents less than $.001 per share.
See accompanying notes which are an integral part of the financial statements.
Annual Report
Financial Highlights - Class C
Years ended December 31, | 2012 | 2011 | 2010 | 2009 | 2008 |
Selected Per-Share Data | | | | | |
Net asset value, beginning of period | $ 10.81 | $ 10.60 | $ 10.63 | $ 10.33 | $ 10.31 |
Income from Investment Operations | | | | | |
Net investment income (loss) C | .082 | .117 | .129 | .175 | .220 |
Net realized and unrealized gain (loss) | .035 | .226 | (.026) | .303 | .020 |
Total from investment operations | .117 | .343 | .103 | .478 | .240 |
Distributions from net investment income | (.075) | (.125) | (.129) | (.178) | (.221) |
Distributions from net realized gain | (.012) | (.008) | (.004) | - | - |
Total distributions | (.087) | (.133) | (.133) | (.178) | (.221) |
Redemption fees added to paid in capital C | - G | - G | - G | - G | .001 |
Net asset value, end of period | $ 10.84 | $ 10.81 | $ 10.60 | $ 10.63 | $ 10.33 |
Total Return A,B | 1.08% | 3.25% | .96% | 4.66% | 2.35% |
Ratios to Average Net Assets D,F | | | | | |
Expenses before reductions | 1.53% | 1.53% | 1.52% | 1.53% | 1.50% |
Expenses net of fee waivers, if any | 1.53% | 1.53% | 1.52% | 1.53% | 1.50% |
Expenses net of all reductions | 1.53% | 1.52% | 1.52% | 1.53% | 1.48% |
Net investment income (loss) | .76% | 1.09% | 1.20% | 1.67% | 2.14% |
Supplemental Data | | | | | |
Net assets, end of period (in millions) | $ 92 | $ 79 | $ 77 | $ 56 | $ 20 |
Portfolio turnover rate E | 21% | 22% | 15% | 8% | 20% |
A Total returns would have been lower if certain expenses had not been reduced during the applicable periods shown.
B Total returns do not include the effect of the contingent deferred sales charge.
C Calculated based on average shares outstanding during the period.
D Fees and expenses of any underlying Fidelity Central Funds are not included in the Fund's expense ratio. The Fund indirectly bears its proportionate share of the expenses of any underlying Fidelity Central Funds.
E Amount does not include the portfolio activity of any underlying Fidelity Central Funds.
F Expense ratios reflect operating expenses of the class. Expenses before reductions do not reflect amounts reimbursed by the investment adviser or reductions from brokerage service arrangements or reductions from other expense offset arrangements and do not represent the amount paid by the class during periods when reimbursements or reductions occur. Expenses net of fee waivers reflect expenses after reimbursement by the investment adviser but prior to reductions from brokerage service arrangements or other expense offset arrangements. Expenses net of all reductions represent the net expenses paid by the class.
G Amount represents less than $.001 per share.
See accompanying notes which are an integral part of the financial statements.
Annual Report
Financial Highlights - Short-Intermediate Municipal Income
Years ended December 31, | 2012 | 2011 | 2010 | 2009 | 2008 |
Selected Per-Share Data | | | | | |
Net asset value, beginning of period | $ 10.81 | $ 10.60 | $ 10.63 | $ 10.34 | $ 10.31 |
Income from Investment Operations | | | | | |
Net investment income (loss) B | .197 | .228 | .240 | .284 | .326 |
Net realized and unrealized gain (loss) | .045 | .227 | (.026) | .293 | .029 |
Total from investment operations | .242 | .455 | .214 | .577 | .355 |
Distributions from net investment income | (.190) | (.237) | (.240) | (.287) | (.326) |
Distributions from net realized gain | (.012) | (.008) | (.004) | - | - |
Total distributions | (.202) | (.245) | (.244) | (.287) | (.326) |
Redemption fees added to paid in capital B | - F | - F | - F | - F | .001 |
Net asset value, end of period | $ 10.85 | $ 10.81 | $ 10.60 | $ 10.63 | $ 10.34 |
Total Return A | 2.25% | 4.34% | 2.02% | 5.64% | 3.50% |
Ratios to Average Net Assets C,E | | | | | |
Expenses before reductions | .48% | .48% | .48% | .50% | .49% |
Expenses net of fee waivers, if any | .48% | .48% | .48% | .50% | .49% |
Expenses net of all reductions | .47% | .48% | .48% | .50% | .47% |
Net investment income (loss) | 1.81% | 2.14% | 2.24% | 2.69% | 3.15% |
Supplemental Data | | | | | |
Net assets, end of period (in millions) | $ 3,624 | $ 3,523 | $ 3,456 | $ 3,153 | $ 1,870 |
Portfolio turnover rate D | 21% | 22% | 15% | 8% | 20% |
A Total returns would have been lower if certain expenses had not been reduced during the applicable periods shown.
B Calculated based on average shares outstanding during the period.
C Fees and expenses of any underlying Fidelity Central Funds are not included in the Fund's expense ratio. The Fund indirectly bears its proportionate share of the expenses of any underlying Fidelity Central Funds.
D Amount does not include the portfolio activity of any underlying Fidelity Central Funds.
E Expense ratios reflect operating expenses of the class. Expenses before reductions do not reflect amounts reimbursed by the investment adviser or reductions from brokerage service arrangements or reductions from other expense offset arrangements and do not represent the amount paid by the class during periods when reimbursements or reductions occur. Expenses net of fee waivers reflect expenses after reimbursement by the investment adviser but prior to reductions from brokerage service arrangements or other expense offset arrangements. Expenses net of all reductions represent the net expenses paid by the class.
F Amount represents less than $.001 per share.
See accompanying notes which are an integral part of the financial statements.
Annual Report
Financial Highlights - Institutional Class
Years ended December 31, | 2012 | 2011 | 2010 | 2009 | 2008 |
Selected Per-Share Data | | | | | |
Net asset value, beginning of period | $ 10.81 | $ 10.61 | $ 10.63 | $ 10.34 | $ 10.32 |
Income from Investment Operations | | | | | |
Net investment income (loss) B | .191 | .224 | .235 | .281 | .321 |
Net realized and unrealized gain (loss) | .045 | .216 | (.015) | .293 | .022 |
Total from investment operations | .236 | .440 | .220 | .574 | .343 |
Distributions from net investment income | (.184) | (.232) | (.236) | (.284) | (.324) |
Distributions from net realized gain | (.012) | (.008) | (.004) | - | - |
Total distributions | (.196) | (.240) | (.240) | (.284) | (.324) |
Redemption fees added to paid in capital B | - F | - F | - F | - F | .001 |
Net asset value, end of period | $ 10.85 | $ 10.81 | $ 10.61 | $ 10.63 | $ 10.34 |
Total Return A | 2.19% | 4.19% | 2.07% | 5.61% | 3.38% |
Ratios to Average Net Assets C,E | | | | | |
Expenses before reductions | .54% | .52% | .53% | .55% | .51% |
Expenses net of fee waivers, if any | .54% | .52% | .53% | .53% | .51% |
Expenses net of all reductions | .53% | .52% | .52% | .53% | .49% |
Net investment income (loss) | 1.76% | 2.09% | 2.20% | 2.66% | 3.13% |
Supplemental Data | | | | | |
Net assets, end of period (in millions) | $ 206 | $ 152 | $ 142 | $ 92 | $ 32 |
Portfolio turnover rate D | 21% | 22% | 15% | 8% | 20% |
A Total returns would have been lower if certain expenses had not been reduced during the applicable periods shown.
B Calculated based on average shares outstanding during the period.
C Fees and expenses of any underlying Fidelity Central Funds are not included in the Fund's expense ratio. The Fund indirectly bears its proportionate share of the expenses of any underlying Fidelity Central Funds.
D Amount does not include the portfolio activity of any underlying Fidelity Central Funds.
E Expense ratios reflect operating expenses of the class. Expenses before reductions do not reflect amounts reimbursed by the investment adviser or reductions from brokerage service arrangements or reductions from other expense offset arrangements and do not represent the amount paid by the class during periods when reimbursements or reductions occur. Expenses net of fee waivers reflect expenses after reimbursement by the investment adviser but prior to reductions from brokerage service arrangements or other expense offset arrangements. Expenses net of all reductions represent the net expenses paid by the class.
F Amount represents less than $.001 per share.
See accompanying notes which are an integral part of the financial statements.
Annual Report
Notes to Financial Statements
For the period ended December 31, 2012
(Amounts in thousands except percentages)
1. Organization.
Fidelity Short-Intermediate Municipal Income Fund (the Fund) is a fund of Fidelity Municipal Trust (the Trust) and is authorized to issue an unlimited number of shares. The Trust is registered under the Investment Company Act of 1940, as amended (the 1940 Act), as an open-end management investment company organized as a Massachusetts business trust. The Fund offers Class A, Class T, Class C, Short-Intermediate Municipal Income and Institutional Class shares, each of which, along with Class B shares, has equal rights as to assets and voting privileges. Class B shares are closed to new accounts and additional purchases, except for exchanges and reinvestments. Each class has exclusive voting rights with respect to matters that affect that class. Class B shares will automatically convert to Class A shares after a holding period of four years from the initial date of purchase. Investment income, realized and unrealized capital gains and losses, the common expenses of the Fund, and certain fund-level expense reductions, if any, are allocated on a pro-rata basis to each class based on the relative net assets of each class to the total net assets of the Fund. Each class differs with respect to transfer agent and distribution and service plan fees incurred. Certain expense reductions may also differ by class.
2. Investments in Fidelity Central Funds.
The Fund invests in Fidelity Central Funds, which are open-end investment companies available only to other investment companies and accounts managed by Fidelity Management & Research Company (FMR) and its affiliates. The Fund's Schedule of Investments lists each of the Fidelity Central Funds held as of period end, if any, as an investment of the Fund, but does not include the underlying holdings of each Fidelity Central Fund. As an Investing Fund, the Fund indirectly bears its proportionate share of the expenses of the underlying Fidelity Central Funds.
The Money Market Central Funds seek preservation of capital and current income and are managed by Fidelity Investments Money Management, Inc. (FIMM), an affiliate of FMR.
A complete unaudited list of holdings for each Fidelity Central Fund is available upon request or at the Securities and Exchange Commission (the SEC) website at www.sec.gov. In addition, the financial statements of the Fidelity Central Funds, which are not covered by the Fund's Report of Independent Registered Public Accounting Firm, are available on the SEC website or upon request.
Annual Report
3. Significant Accounting Policies.
The financial statements have been prepared in conformity with accounting principles generally accepted in the United States of America (GAAP), which require management to make certain estimates and assumptions at the date of the financial statements. Actual results could differ from those estimates. Subsequent events, if any, through the date that the financial statements were issued have been evaluated in the preparation of the financial statements. The following summarizes the significant accounting policies of the Fund:
Investment Valuation. Investments are valued as of 4:00 p.m. Eastern time on the last calendar day of the period. In accordance with valuation policies and procedures approved by the Board of Trustees (the Board), the Fund attempts to obtain prices from one or more third party pricing vendors or brokers to value its investments. When current market prices, quotations or rates are not readily available or reliable, investments will be fair valued in good faith by the FMR Fair Value Committee (the Committee), in accordance with procedures adopted by the Board. Factors used in determining fair value vary by investment type and may include market or investment specific events, changes in interest rates and credit quality. The frequency with which these procedures are used cannot be predicted and they may be utilized to a significant extent. The Committee oversees the Fund's valuation policies and procedures and is responsible for approving and reporting to the Board all fair value determinations.
The Fund categorizes the inputs to valuation techniques used to value its investments into a disclosure hierarchy consisting of three levels as shown below:
Level 1 - quoted prices in active markets for identical investments
Level 2 - other significant observable inputs (including quoted prices for similar investments, interest rates, prepayment speeds, etc.)
Level 3 - unobservable inputs (including the Fund's own assumptions based on the best information available)
Valuation techniques used to value the Fund's investments by major category are as follows:
Debt securities, including restricted securities, are valued based on evaluated prices received from third party pricing vendors or from brokers who make markets in such securities. For municipal securities, pricing vendors utilize matrix pricing which considers yield or price of bonds of comparable quality, coupon, maturity and type as well as broker-supplied prices and are generally categorized as Level 2 in the hierarchy. When independent prices are unavailable or unreliable, debt securities may be valued utilizing
Annual Report
Notes to Financial Statements - continued
(Amounts in thousands except percentages)
3. Significant Accounting Policies - continued
Investment Valuation - continued
pricing methodologies which consider similar factors that would be used by third party pricing vendors. These are generally categorized as Level 2 in the hierarchy but may be Level 3 depending on the circumstances.
Investments in open-end mutual funds, including the Fidelity Central Funds, are valued at their closing net asset value (NAV) each business day and are categorized as Level 1 in the hierarchy.
Changes in valuation techniques may result in transfers in or out of an assigned level within the disclosure hierarchy. The aggregate value of investments by input level, as of December 31, 2012, is included at the end of the Fund's Schedule of Investments.
Investment Transactions and Income. For financial reporting purposes, the Fund's investment holdings and NAV include trades executed through the end of the last business day of the period. The NAV per share for processing shareholder transactions is calculated as of the close of business of the New York Stock Exchange (NYSE), normally 4:00 p.m. Eastern time and includes trades executed through the end of the prior business day. Gains and losses on securities sold are determined on the basis of identified cost. Interest income and distributions from the Fidelity Central Funds are accrued as earned. Interest income includes coupon interest and amortization of premium and accretion of discount on debt securities.
Expenses. Expenses directly attributable to a fund are charged to that fund. Expenses attributable to more than one fund are allocated among the respective funds on the basis of relative net assets or other appropriate methods. Expense estimates are accrued in the period to which they relate and adjustments are made when actual amounts are known.
Income Tax Information and Distributions to Shareholders. Each year, the Fund intends to qualify as a regulated investment company under Subchapter M of the Internal Revenue Code, including distributing substantially all of its taxable income and realized gains. As a result, no provision for income taxes is required. As of December 31, 2012, the Fund did not have any unrecognized tax benefits in the financial statements; nor is the Fund aware of any tax positions for which it is reasonably possible that the total amounts of unrecognized tax benefits will significantly change in the next twelve months. The Fund files a U.S. federal tax return, in addition to state and local tax returns as required. A fund's federal income tax returns are subject to examination by the Internal Revenue Service (IRS) for a period of three fiscal years after they are filed. State and local tax returns may be subject to examination for an additional fiscal year depending on the jurisdiction.
Annual Report
3. Significant Accounting Policies - continued
Income Tax Information and Distributions to Shareholders - continued
Dividends are declared and recorded daily and paid monthly from net investment income. Distributions from realized gains, if any, are declared and recorded on the ex-dividend date. Income dividends and capital gain distributions are declared separately for each class. Income and capital gain distributions are determined in accordance with income tax regulations, which may differ from GAAP. In addition, the Fund claimed a portion of the payment to redeeming shareholders as a distribution for income tax purposes.
Capital accounts within the financial statements are adjusted for permanent book-tax differences. These adjustments have no impact on net assets or the results of operations. Temporary book-tax differences will reverse in a subsequent period.
Book-tax differences are primarily due to deferred trustees compensation and losses deferred due to wash sales.
The Fund purchases municipal securities whose interest, in the opinion of the issuer, is free from federal income tax. There is no assurance that the IRS will agree with this opinion. In the event the IRS determines that the issuer does not comply with relevant tax requirements, interest payments from a security could become federally taxable, possibly retroactively to the date the security was issued.
The federal tax cost of investment securities and unrealized appreciation (depreciation) as of period end were as follows:
Gross unrealized appreciation | $ 148,500 |
Gross unrealized depreciation | (2,362) |
Net unrealized appreciation (depreciation) on securities and other investments | $ 146,138 |
| |
Tax Cost | $ 4,094,339 |
The tax-based components of distributable earnings as of period end were as follows:
Undistributed tax-exempt income | $ 63 |
Undistributed long-term capital gain | $ 877 |
Net unrealized appreciation (depreciation) | $ 146,138 |
Annual Report
Notes to Financial Statements - continued
(Amounts in thousands except percentages)
3. Significant Accounting Policies - continued
Income Tax Information and Distributions to Shareholders - continued
The tax character of distributions paid was as follows:
| December 31, 2012 | December 31, 2011 |
Tax-exempt Income | $ 73,237 | $ 83,163 |
Long-term Capital Gains | 4,814 | 2,965 |
Total | $ 78,051 | $ 86,128 |
Short-Term Trading (Redemption) Fees. Shares held by investors in the Fund less than 30 days are subject to a redemption fee equal to .50% of the net asset value of shares redeemed. All redemption fees, which reduce the proceeds of the shareholder redemption, are retained by the Fund and accounted for as an addition to paid in capital.
Delayed Delivery Transactions and When-Issued Securities. During the period, the Fund transacted in securities on a delayed delivery or when-issued basis. Payment and delivery may take place after the customary settlement period for that security. The price of the underlying securities and the date when the securities will be delivered and paid for are fixed at the time the transaction is negotiated. The securities purchased on a delayed delivery or when-issued basis are identified as such in the Fund's Schedule of Investments. The Fund may receive compensation for interest forgone in the purchase of a delayed delivery or when-issued security. With respect to purchase commitments, the Fund identifies securities as segregated in its records with a value at least equal to the amount of the commitment. Losses may arise due to changes in the value of the underlying securities or if the counterparty does not perform under the contract's terms, or if the issuer does not issue the securities due to political, economic, or other factors.
4. Purchases and Sales of Investments.
Purchases and sales of securities, other than short-term securities, aggregated $1,167,785 and $784,640, respectively.
5. Fees and Other Transactions with Affiliates.
Management Fee. FMR and its affiliates provide the Fund with investment management related services for which the Fund pays a monthly management fee. The management fee is the sum of an individual fund fee rate that is based on an annual rate of .25% of the Fund's average net assets and an annualized group fee rate that averaged .12% during the period. The group fee rate is based upon the average net assets of all the mutual funds advised by FMR. The group fee rate decreases as assets under management increase and increases as assets under management decrease. For the period, the total annual management fee rate was .37% of the Fund's average net assets.
Annual Report
5. Fees and Other Transactions with Affiliates - continued
Distribution and Service Plan Fees. In accordance with Rule 12b-1 of the 1940 Act, the Fund has adopted separate Distribution and Service Plans for each class of shares. Certain classes pay Fidelity Distributors Corporation (FDC), an affiliate of FMR, separate Distribution and Service Fees, each of which is based on an annual percentage of each class' average net assets. In addition, FDC may pay financial intermediaries for selling shares of the Fund and providing shareholder support services. For the period, the Distribution and Service Fee rates, total fees and amounts retained by FDC were as follows:
| Distribution
Fee | Service
Fee | Total Fees | Retained
by FDC |
Class A | -% | .25% | $ 929 | $ 65 |
Class T | -% | .25% | 67 | 1 |
Class B | .65% | .25% | 13 | 9 |
Class C | .75% | .25% | 878 | 291 |
| | | $ 1,887 | $ 366 |
Sales Load. FDC may receive a front-end sales charge of up to 2.75% for selling Class A shares and Class T shares, some of which is paid to financial intermediaries for selling shares of the Fund. Depending on the holding period, FDC may receive contingent deferred sales charges levied on Class A, Class T, Class B, and Class C redemptions. The deferred sales charges range from 3.00% to 1.00% for Class B shares, 1.00% for Class C shares, .75% or .50% for certain purchases of Class A shares and .25% for certain purchases of Class T shares.
For the period, sales charge amounts retained by FDC were as follows:
| Retained
by FDC |
Class A | $ 28 |
Class T | 9 |
Class B* | 2 |
Class C* | 24 |
| $ 63 |
* When Class B and Class C shares are initially sold, FDC pays commissions from its own resources to financial intermediaries through which the sales are made.
Annual Report
Notes to Financial Statements - continued
(Amounts in thousands except percentages)
5. Fees and Other Transactions with Affiliates - continued
Transfer Agent and Accounting Fees. Citibank, N.A. (Citibank) is the custodian, transfer agent, and servicing agent for the Fund's Class A, Class T, Class B, Class C, Short-Intermediate Municipal Income and Institutional Class shares. Citibank has entered into a sub-arrangement with Fidelity Investments Institutional Operations Company, Inc. (FIIOC), an affiliate of FMR, with respect to all classes of the Fund, to perform the transfer agency, dividend disbursing, and shareholder servicing functions. FIIOC receives account fees and asset-based fees that vary according to the account size and type of account of the shareholders of the respective classes of the Fund. All fees are paid to FIIOC by Citibank, which is reimbursed by each class for such payments. FIIOC pays for typesetting, printing and mailing of shareholder reports, except proxy statements. For the period, transfer agent fees for each class were as follows:
| Amount | % of
Average
Net Assets |
Class A | $ 543 | .15 |
Class T | 34 | .13 |
Class B | 2 | .15 |
Class C | 126 | .14 |
Short-Intermediate Municipal Income | 3,226 | .09 |
Institutional Class | 278 | .15 |
| $ 4,209 | |
Citibank also has a sub-arrangement with Fidelity Service Company, Inc. (FSC), an affiliate of FMR, under which FSC maintains the Fund's accounting records. The fee is paid to Citibank and is based on the level of average net assets for each month.
6. Committed Line of Credit.
The Fund participates with other funds managed by FMR or an affiliate in a $4.25 billion credit facility (the "line of credit") to be utilized for temporary or emergency purposes to fund shareholder redemptions or for other short-term liquidity purposes. The Fund has agreed to pay commitment fees on its pro-rata portion of the line of credit, which amounted to $12 and is reflected in Miscellaneous expenses on the Statement of Operations. During the period, there were no borrowings on this line of credit.
Annual Report
7. Expense Reductions.
Through arrangements with the Fund's custodian, credits realized as a result of uninvested cash balances were used to reduce the Fund's expenses. During the period, these credits reduced the Fund's custody and accounting expenses by $45 and $220, respectively.
8. Distributions to Shareholders.
Distributions to shareholders of each class were as follows:
Years ended December 31, | 2012 | 2011 |
From net investment income | | |
Class A | $ 5,319 | $ 4,211 |
Class T | 388 | 467 |
Class B | 11 | 27 |
Class C | 604 | 838 |
Short-Intermediate Municipal Income | 63,708 | 74,599 |
Institutional Class | 3,207 | 3,021 |
Total | $ 73,237 | $ 83,163 |
From net realized gain | | |
Class A | $ 428 | $ 216 |
Class T | 28 | 19 |
Class B | 1 | 1 |
Class C | 102 | 57 |
Short-Intermediate Municipal Income | 4,021 | 2,565 |
Institutional Class | 234 | 107 |
Total | $ 4,814 | $ 2,965 |
9. Share Transactions.
Transactions for each class of shares were as follows:
| Shares | Dollars |
Years ended December 31, | 2012 | 2011 | 2012 | 2011 |
Class A | | | | |
Shares sold | 25,560 | 22,096 | $ 278,216 | $ 237,519 |
Reinvestment of distributions | 425 | 303 | 4,631 | 3,252 |
Shares redeemed | (20,723) | (10,223) | (225,499) | (109,361) |
Net increase (decrease) | 5,262 | 12,176 | $ 57,348 | $ 131,410 |
Annual Report
Notes to Financial Statements - continued
(Amounts in thousands except percentages)
9. Share Transactions - continued
| Shares | Dollars |
Years ended December 31, | 2012 | 2011 | 2012 | 2011 |
Class T | | | | |
Shares sold | 1,057 | 881 | $ 11,485 | $ 9,442 |
Reinvestment of distributions | 32 | 35 | 347 | 373 |
Shares redeemed | (1,249) | (774) | (13,580) | (8,240) |
Net increase (decrease) | (160) | 142 | $ (1,748) | $ 1,575 |
Class B | | | | |
Shares sold | 19 | 27 | $ 205 | $ 297 |
Reinvestment of distributions | 1 | 2 | 10 | 19 |
Shares redeemed | (67) | (114) | (727) | (1,225) |
Net increase (decrease) | (47) | (85) | $ (512) | $ (909) |
Class C | | | | |
Shares sold | 2,859 | 2,509 | $ 31,055 | $ 26,904 |
Reinvestment of distributions | 51 | 62 | 556 | 661 |
Shares redeemed | (1,674) | (2,549) | (18,183) | (27,188) |
Net increase (decrease) | 1,236 | 22 | $ 13,428 | $ 377 |
Short-Intermediate Municipal Income | | | | |
Shares sold | 93,675 | 106,091 | $ 1,017,592 | $ 1,133,522 |
Reinvestment of distributions | 4,548 | 5,180 | 49,424 | 55,411 |
Shares redeemed | (90,005) | (111,332) | (977,843) | (1,186,447) |
Net increase (decrease) | 8,218 | (61) | $ 89,173 | $ 2,486 |
Institutional Class | | | | |
Shares sold | 13,388 | 8,223 | $ 145,505 | $ 87,964 |
Reinvestment of distributions | 176 | 115 | 1,914 | 1,228 |
Shares redeemed | (8,641) | (7,651) | (93,919) | (81,705) |
Net increase (decrease) | 4,923 | 687 | $ 53,500 | $ 7,487 |
10. Other.
The Fund's organizational documents provide former and current trustees and officers with a limited indemnification against liabilities arising in connection with the performance of their duties to the Fund. In the normal course of business, the Fund may also enter into contracts that provide general indemnifications. The Fund's maximum exposure under these arrangements is unknown as this would be dependent on future claims that may be made against the Fund. The risk of material loss from such claims is considered remote.
Annual Report
To the Trustees of Fidelity Municipal Trust and the Shareholders of Fidelity Short-Intermediate Municipal Income Fund:
In our opinion, the accompanying statement of assets and liabilities, including the schedule of investments, and the related statements of operations and of changes in net assets and the financial highlights present fairly, in all material respects, the financial position of Fidelity Short-Intermediate Municipal Income Fund (a fund of Fidelity Municipal Trust) at December 31, 2012, the results of its operations for the year then ended, the changes in its net assets for each of the two years in the period then ended and the financial highlights for each of the five years in the period then ended, in conformity with accounting principles generally accepted in the United States of America. These financial statements and financial highlights (hereafter referred to as "financial statements") are the responsibility of the Fidelity Short-Intermediate Municipal Income Fund's management. Our responsibility is to express an opinion on these financial statements based on our audits. We conducted our audits of these financial statements in accordance with the standards of the Public Company Accounting Oversight Board (United States). Those standards require that we plan and perform the audit to obtain reasonable assurance about whether the financial statements are free of material misstatement. An audit includes examining, on a test basis, evidence supporting the amounts and disclosures in the financial statements, assessing the accounting principles used and significant estimates made by management, and evaluating the overall financial statement presentation. We believe that our audits, which included confirmation of securities at December 31, 2012 by correspondence with the custodian and brokers, provide a reasonable basis for our opinion.
PricewaterhouseCoopers LLP
Boston, Massachusetts
February 14, 2013
Annual Report
The Trustees and executive officers of the trust and fund, as applicable, are listed below. The Board of Trustees governs the fund and is responsible for protecting the interests of shareholders. The Trustees are experienced executives who meet periodically throughout the year to oversee the fund's activities, review contractual arrangements with companies that provide services to the fund, oversee management of the risks associated with such activities and contractual arrangements, and review the fund's performance. Except for Elizabeth S. Acton and James C. Curvey, each of the Trustees oversees 218 funds advised by FMR or an affiliate. Ms. Acton oversees 200 funds advised by FMR or an affiliate. Mr. Curvey oversees 452 funds advised by FMR or an affiliate.
The Trustees hold office without limit in time except that (a) any Trustee may resign; (b) any Trustee may be removed by written instrument, signed by at least two-thirds of the number of Trustees prior to such removal; (c) any Trustee who requests to be retired or who has become incapacitated by illness or injury may be retired by written instrument signed by a majority of the other Trustees; and (d) any Trustee may be removed at any special meeting of shareholders by a two-thirds vote of the outstanding voting securities of the trust. Each Trustee who is not an interested person (as defined in the 1940 Act) (Independent Trustee), shall retire not later than the last day of the month in which his or her 75th birthday occurs. The Independent Trustees may waive this mandatory retirement age policy with respect to individual Trustees. The executive officers hold office without limit in time, except that any officer may resign or may be removed by a vote of a majority of the Trustees at any regular meeting or any special meeting of the Trustees. Except as indicated, each individual has held the office shown or other offices in the same company for the past five years.
Experience, Skills, Attributes, and Qualifications of the Fund's Trustees. The Governance and Nominating Committee has adopted a statement of policy that describes the experience, qualifications, attributes, and skills that are necessary and desirable for potential Independent Trustee candidates (Statement of Policy). The Board believes that each Trustee satisfied at the time he or she was initially elected or appointed a Trustee, and continues to satisfy, the standards contemplated by the Statement of Policy. The Governance and Nominating Committee also engages professional search firms to help identify potential Independent Trustee candidates who have the experience, qualifications, attributes, and skills consistent with the Statement of Policy. From time to time, additional criteria based on the composition and skills of the current Independent Trustees, as well as experience or skills that may be appropriate in light of future changes to board composition, business conditions, and regulatory or other developments, have also been considered by the professional search firms and the Governance and Nominating Committee. In addition, the Board takes into account the Trustees' commitment and participation in Board and committee meetings, as well as their leadership of standing and ad hoc committees throughout their tenure.
In determining that a particular Trustee was and continues to be qualified to serve as a Trustee, the Board has considered a variety of criteria, none of which, in isolation, was controlling. The Board believes that, collectively, the Trustees have balanced and diverse experience, qualifications, attributes, and skills, which allow the Board to operate effectively in governing the fund and protecting the interests of shareholders. Information about the specific experience, skills, attributes, and qualifications of each Trustee, which in each case led to the Board's conclusion that the Trustee should serve (or continue to serve) as a trustee of the fund, is provided below.
Annual Report
Board Structure and Oversight Function. Abigail P. Johnson is an interested person (as defined in the 1940 Act) and currently serves as Chairman. The Trustees have determined that an interested Chairman is appropriate and benefits shareholders because an interested Chairman has a personal and professional stake in the quality and continuity of services provided to the fund. Independent Trustees exercise their informed business judgment to appoint an individual of their choosing to serve as Chairman, regardless of whether the Trustee happens to be independent or a member of management. The Independent Trustees have determined that they can act independently and effectively without having an Independent Trustee serve as Chairman and that a key structural component for assuring that they are in a position to do so is for the Independent Trustees to constitute a substantial majority for the Board. The Independent Trustees also regularly meet in executive session. Albert R. Gamper, Jr. serves as Chairman of the Independent Trustees and as such (i) acts as a liaison between the Independent Trustees and management with respect to matters important to the Independent Trustees and (ii) with management prepares agendas for Board meetings.
Fidelity funds are overseen by different Boards of Trustees. The fund's Board oversees Fidelity's investment-grade bond, money market, and asset allocation funds and another Board oversees Fidelity's equity and high income funds. The asset allocation funds may invest in Fidelity funds that are overseen by such other Board. The use of separate Boards, each with its own committee structure, allows the Trustees of each group of Fidelity funds to focus on the unique issues of the funds they oversee, including common research, investment, and operational issues. On occasion, the separate Boards establish joint committees to address issues of overlapping consequences for the Fidelity funds overseen by each Board.
The Trustees operate using a system of committees to facilitate the timely and efficient consideration of all matters of importance to the Trustees, the fund, and fund shareholders and to facilitate compliance with legal and regulatory requirements and oversight of the fund's activities and associated risks. The Board, acting through its committees, has charged FMR and its affiliates with (i) identifying events or circumstances the occurrence of which could have demonstrably adverse effects on the fund's business and/or reputation; (ii) implementing processes and controls to lessen the possibility that such events or circumstances occur or to mitigate the effects of such events or circumstances if they do occur; and (iii) creating and maintaining a system designed to evaluate continuously business and market conditions in order to facilitate the identification and implementation processes described in (i) and (ii) above. Because the day-to-day operations and activities of the fund are carried out by or through FMR, its affiliates and other service providers, the fund's exposure to risks is mitigated but not eliminated by the processes overseen by the Trustees. While each of the Board's committees has responsibility for overseeing different aspects of the fund's activities, oversight is exercised primarily through the Operations and Audit Committees. In addition, an ad hoc Board committee of Independent Trustees has worked with FMR to enhance the Board's oversight of investment and financial risks, legal and regulatory risks, technology risks, and operational risks, including the development of additional risk reporting to the Board. Appropriate personnel, including but not limited to the fund's Chief Compliance Officer (CCO), FMR's internal auditor, the independent accountants, the fund's Treasurer and portfolio management personnel, make periodic reports to the Board's committees, as appropriate, including an annual review of FMR's risk management program for the Fidelity funds. The responsibilities of each standing committee, including their oversight responsibilities, are described further under "Standing Committees of the Fund's Trustees."
Annual Report
Trustees and Officers - continued
The fund's Statement of Additional Information (SAI) includes more information about the Trustees. To request a free copy, call Fidelity at 1-877-208-0098.
Interested Trustees*:
Correspondence intended for each Trustee who is an interested person may be sent to Fidelity Investments, 82 Devonshire Street, Boston, Massachusetts 02109.
Name, Age; Principal Occupations and Other Relevant Experience+ |
Abigail P. Johnson (51) |
| Year of Election or Appointment: 2009 Ms. Johnson is Trustee and Chairman of the Board of Trustees of certain Trusts. Ms. Johnson serves as President of Fidelity Financial Services (2012-present) and President of Personal, Workplace and Institutional Services (2005-present). Ms. Johnson is Chairman and Director of FMR Co., Inc. (2011-present), Chairman and Director of FMR (2011-present), and the Vice Chairman and Director (2007-present) of FMR LLC. Previously, Ms. Johnson served as President and a Director of FMR (2001-2005), a Trustee of other investment companies advised by FMR, Fidelity Investments Money Management, Inc., and FMR Co., Inc. (2001-2005), Senior Vice President of the Fidelity funds (2001-2005), and managed a number of Fidelity funds. Ms. Abigail P. Johnson and Mr. Arthur E. Johnson are not related. |
James C. Curvey (77) |
| Year of Election or Appointment: 2007 Mr. Curvey also serves as Trustee (2007-present) of other investment companies advised by FMR. Mr. Curvey is a Director of Fidelity Investments Money Management, Inc. (2009-present), Director of Fidelity Research & Analysis Co. (2009-present) and Director of FMR and FMR Co., Inc. (2007-present). Mr. Curvey is also Vice Chairman (2007-present) and Director of FMR LLC. In addition, Mr. Curvey serves as an Overseer for the Boston Symphony Orchestra and a member of the Trustees of Villanova University. Previously, Mr. Curvey was the Vice Chairman (2006-2007) and Director (2000-2007) of FMR Corp. |
* Trustees have been determined to be "Interested Trustees" by virtue of, among other things, their affiliation with the trust or various entities under common control with FMR.
+ The information above includes each Trustee's principal occupation during the last five years and other information relating to the experience, attributes, and skills relevant to each Trustee's qualifications to serve as a Trustee, which led to the conclusion that each Trustee should serve as a Trustee for the fund.
Independent Trustees:
Correspondence intended for each Independent Trustee (that is, the Trustees other than the Interested Trustees) may be sent to Fidelity Investments, P.O. Box 55235, Boston, Massachusetts 02205-5235.
Name, Age; Principal Occupations and Other Relevant Experience+ |
Elizabeth S. Acton (61) |
| Year of Election or Appointment: 2013 Ms. Acton is Trustee of certain Trusts. Prior to her retirement in April 2012, Ms. Acton was Executive Vice President, Finance (November 2011-April 2012), Executive Vice President, Chief Financial Officer (April 2002-November 2011), and Treasurer (May 2004-May 2005) of Comerica Incorporated (financial services). Prior to joining Comerica, Ms. Acton held a variety of positions at Ford Motor Company (1983-2002), including Vice President and Treasurer (2000-2002) and Executive Vice President and Chief Financial Officer of Ford Motor Credit Company (1998-2000). Ms. Acton currently serves as a member of the Board of Directors and Audit and Finance Committees of Beazer Homes USA, Inc. (homebuilding, 2012-present). |
Albert R. Gamper, Jr. (70) |
| Year of Election or Appointment: 2006 Mr. Gamper is Chairman of the Independent Trustees of the Fixed Income and Asset Allocation Funds (2012-present). Prior to his retirement in December 2004, Mr. Gamper served as Chairman of the Board of CIT Group Inc. (commercial finance). During his tenure with CIT Group Inc. Mr. Gamper served in numerous senior management positions, including Chairman (1987-1989; 1999-2001; 2002-2004), Chief Executive Officer (1987-2004), and President (2002-2003). Mr. Gamper currently serves as a member of the Board of Directors of Public Service Enterprise Group (utilities, 2000-present), a member of the Board of Trustees, Rutgers University (2004-present), and Chairman of the Board of Barnabas Health Care System. Previously, Mr. Gamper served as Vice Chairman of the Independent Trustees of the Fixed Income and Asset Allocation Funds (2011-2012) and as Chairman of the Board of Governors, Rutgers University (2004-2007). |
Robert F. Gartland (61) |
| Year of Election or Appointment: 2010 Mr. Gartland is Chairman and an investor in Gartland and Mellina Group Corp. (consulting, 2009-present). Previously, Mr. Gartland served as a partner and investor of Vietnam Partners LLC (investments and consulting, 2008-2011). Prior to his retirement, Mr. Gartland held a variety of positions at Morgan Stanley (financial services, 1979-2007) including Managing Director (1987-2007). |
Arthur E. Johnson (65) |
| Year of Election or Appointment: 2008 Mr. Johnson serves as a member of the Board of Directors of Eaton Corporation (diversified power management, 2009-present), AGL Resources, Inc. (holding company, 2002-present) and Booz Allen Hamilton (management consulting, 2011-present). Prior to his retirement, Mr. Johnson served as Senior Vice President of Corporate Strategic Development of Lockheed Martin Corporation (defense contractor, 1999-2009). He previously served on the Board of Directors of IKON Office Solutions, Inc. (1999-2008) and Delta Airlines (2005-2007). Mr. Arthur E. Johnson is not related to Ms. Abigail P. Johnson. |
Michael E. Kenneally (58) |
| Year of Election or Appointment: 2009 Previously, Mr. Kenneally served as a Member of the Advisory Board for certain Fidelity Fixed Income and Asset Allocation Funds (2008-2009). Prior to his retirement, Mr. Kenneally served as Chairman and Global Chief Executive Officer of Credit Suisse Asset Management (2003-2005). Mr. Kenneally was a Director of the Credit Suisse Funds (U.S. mutual funds, 2004-2008) and certain other closed-end funds (2004-2005) and was awarded the Chartered Financial Analyst (CFA) designation in 1991. |
James H. Keyes (72) |
| Year of Election or Appointment: 2007 Mr. Keyes serves as a member of the Boards of Navistar International Corporation (manufacture and sale of trucks, buses, and diesel engines, since 2002) and Pitney Bowes, Inc. (integrated mail, messaging, and document management solutions, since 1998). Prior to his retirement, Mr. Keyes served as Chairman and Chief Executive Officer of Johnson Controls (automotive, building, and energy, 1998-2002) and as a member of the Board of LSI Logic Corporation (semiconductor technologies, 1984-2008). |
Marie L. Knowles (66) |
| Year of Election or Appointment: 2001 Ms. Knowles is Vice Chairman of the Independent Trustees of the Fixed Income and Asset Allocation Funds (2012-present). Prior to Ms. Knowles' retirement in June 2000, she served as Executive Vice President and Chief Financial Officer of Atlantic Richfield Company (ARCO) (diversified energy, 1996-2000). From 1993 to 1996, she was a Senior Vice President of ARCO and President of ARCO Transportation Company. She served as a Director of ARCO from 1996 to 1998. Ms. Knowles currently serves as a Director and Chairman of the Audit Committee of McKesson Corporation (healthcare service, since 2002). Ms. Knowles is an Honorary Trustee of the Brookings Institution and a member of the Board of the Catalina Island Conservancy and of the Santa Catalina Island Company (2009-present). She also serves as a member of the Advisory Board for the School of Engineering of the University of Southern California and the Foundation Board of the School of Architecture at the University of Virginia (2007-present). Previously, Ms. Knowles served as a Director of Phelps Dodge Corporation (copper mining and manufacturing, 1994-2007). |
Kenneth L. Wolfe (73) |
| Year of Election or Appointment: 2005 Prior to his retirement, Mr. Wolfe served as Chairman and a Director (2007-2009) and Chairman and Chief Executive Officer (1994-2001) of Hershey Foods Corporation. He also served as a member of the Boards of Adelphia Communications Corporation (telecommunications, 2003-2006), Bausch & Lomb, Inc. (medical/pharmaceutical, 1993-2007), and Revlon, Inc. (personal care products, 2004-2009). Mr. Wolfe previously served as Chairman of the Independent Trustees of the Fixed Income and Asset Allocation Funds (2008-2012). |
+ The information above includes each Trustee's principal occupation during the last five years and other information relating to the experience, attributes, and skills relevant to each Trustee's qualifications to serve as a Trustee, which led to the conclusion that each Trustee should serve as a Trustee for the fund.
Executive Officers:
Correspondence intended for each executive officer may be sent to Fidelity Investments, 82 Devonshire Street, Boston, Massachusetts 02109.
Name, Age; Principal Occupation |
Stephanie J. Dorsey (43) |
| Year of Election or Appointment: 2013 President and Treasurer of Fidelity's Fixed Income and Asset Allocation Funds. Ms. Dorsey also serves as Assistant Treasurer of other Fidelity funds (2010-present) and is an employee of Fidelity Investments (2008-present). Previously, Ms. Dorsey served as Deputy Treasurer of Fidelity's Fixed Income and Asset Allocation Funds (2008-2013), Treasurer (2004-2008) of the JPMorgan Mutual Funds and Vice President (2004-2008) of JPMorgan Chase Bank. |
Charles S. Morrison (52) |
| Year of Election or Appointment: 2012 Vice President of Fidelity's Fixed Income and Asset Allocation Funds. Mr. Morrison also serves as President, Fixed Income and is an employee of Fidelity Investments. Previously, Mr. Morrison served as Vice President of Fidelity's Money Market Funds (2005-2009), President, Money Market Group Leader of FMR (2009), and Senior Vice President, Money Market Group of FMR (2004-2009). Mr. Morrison also served as Vice President of Fidelity's Bond Funds (2002-2005), certain Balanced Funds (2002-2005), and certain Asset Allocation Funds (2002-2007), and as Senior Vice President (2002-2005) of Fidelity's Fixed Income Division. |
Robert P. Brown (49) |
| Year of Election or Appointment: 2012 Vice President of Fidelity's Bond Funds. Mr. Brown also serves as Executive Vice President of Fidelity Investments Money Management, Inc. (2010-present), President, Bond Group of FMR (2011-present), Director and Managing Director, Research of Fidelity Management & Research (U.K.) Inc. (2008-present) and is an employee of Fidelity Investments. Previously, Mr. Brown served as President, Money Market Group of FMR (2010-2011) and Vice President of Fidelity's Money Market Funds (2010-2012). |
Scott C. Goebel (44) |
| Year of Election or Appointment: 2008 Secretary and Chief Legal Officer (CLO) of the Fidelity funds. Mr. Goebel also serves as Secretary of Fidelity Investments Money Management, Inc. (FIMM) (2010-present) and Fidelity Research and Analysis Company (FRAC) (2010-present); Secretary and CLO of The North Carolina Capital Management Trust: Cash and Term Portfolios (2008-present); General Counsel, Secretary, and Senior Vice President of FMR (2008-present) and FMR Co., Inc. (2008-present); employed by FMR LLC or an affiliate (2001-present); Chief Legal Officer of Fidelity Management & Research (Hong Kong) Limited (2008-present) and Assistant Secretary of Fidelity Management & Research (Japan) Inc. (2008-present), and Fidelity Management & Research (U.K.) Inc. (2008-present). Previously, Mr. Goebel served as Assistant Secretary of FIMM (2008-2010), FRAC (2008-2010), and the Funds (2007-2008) and as Vice President and Secretary of Fidelity Distributors Corporation (FDC) (2005-2007). |
Ramon Herrera (38) |
| Year of Election or Appointment: 2012 Assistant Secretary of Fidelity's Fixed Income and Asset Allocation Funds. Mr. Herrera also serves as Vice President, Associate General Counsel (2010-present) and is an employee of Fidelity Investments (2004-present). |
Elizabeth Paige Baumann (44) |
| Year of Election or Appointment: 2012 Anti-Money Laundering (AML) Officer of the Fidelity funds. Ms. Baumann also serves as AML Officer of The North Carolina Capital Management Trust: Cash and Term Portfolios (2012-present), Chief AML Officer of FMR LLC (2012-present), and is an employee of Fidelity Investments. Previously, Ms. Baumann served as Vice President and Deputy Anti-Money Laundering Officer (2007-2012). |
Christine Reynolds (54) |
| Year of Election or Appointment: 2008 Chief Financial Officer of the Fidelity funds. Ms. Reynolds became President of Fidelity Pricing and Cash Management Services (FPCMS) in August 2008. Ms. Reynolds served as Chief Operating Officer of FPCMS (2007-2008). Previously, Ms. Reynolds served as President, Treasurer, and Anti-Money Laundering officer of the Fidelity funds (2004-2007). |
Michael H. Whitaker (45) |
| Year of Election or Appointment: 2008 Chief Compliance Officer of Fidelity's Fixed Income and Asset Allocation Funds. Mr. Whitaker also serves as Chief Compliance Officer of The North Carolina Capital Management Trust: Cash and Term Portfolios (2008-present). Mr. Whitaker is an employee of Fidelity Investments (2007-present). Prior to joining Fidelity Investments, Mr. Whitaker worked at MFS Investment Management where he served as Senior Vice President and Chief Compliance Officer (2004-2006), and Assistant General Counsel. |
Joseph F. Zambello (55) |
| Year of Election or Appointment: 2011 Deputy Treasurer of the Fidelity funds. Mr. Zambello is an employee of Fidelity Investments. Previously, Mr. Zambello served as Vice President of FMR's Program Management Group (2009-2011) and Vice President of the Transfer Agent Oversight Group (2005-2009). |
Stephen Sadoski (41) |
| Year of Election or Appointment: 2013 Deputy Treasurer of Fidelity's Fixed Income and Asset Allocation Funds. Mr. Sadoski also serves as Deputy Treasurer of other Fidelity funds (2012-present) and is an employee of Fidelity Investments (2012-present). Previously, Mr. Sadoski served as Assistant Treasurer of Fidelity's Fixed Income and Asset Allocation Funds (2012-2013), an assistant chief accountant in the Division of Investment Management of the Securities and Exchange Commission (SEC) (2009-2012) and as a senior manager at Deloitte & Touche (1997-2009). |
Adrien E. Deberghes (45) |
| Year of Election or Appointment: 2010 Assistant Treasurer of Fidelity's Fixed Income and Asset Allocation Funds. Mr. Deberghes also serves as Vice President and Assistant Treasurer (2011-present) and Deputy Treasurer (2008-present) of other Fidelity funds, and is an employee of Fidelity Investments (2008-present). Previously, Mr. Deberghes served as Senior Vice President of Mutual Fund Administration at State Street Corporation (2007-2008), Senior Director of Mutual Fund Administration at Investors Bank & Trust (2005-2007), and Director of Finance for Dunkin' Brands (2000-2005). |
Kenneth B. Robins (43) |
| Year of Election or Appointment: 2009 Assistant Treasurer of the Fidelity Fixed Income and Asset Allocation Funds. Mr. Robins also serves as President and Treasurer of other Fidelity funds (2008-present; 2010-present) and is an employee of Fidelity Investments (2004-present). Previously, Mr. Robins served as Deputy Treasurer of the Fidelity funds (2005-2008) and Treasurer and Chief Financial Officer of The North Carolina Capital Management Trust: Cash and Term Portfolios (2006-2008). |
Gary W. Ryan (54) |
| Year of Election or Appointment: 2005 Assistant Treasurer of the Fidelity funds. Mr. Ryan is an employee of Fidelity Investments. Previously, Mr. Ryan served as Vice President of Fund Reporting in Fidelity Pricing and Cash Management Services (FPCMS) (1999-2005). |
Jonathan Davis (44) |
| Year of Election or Appointment: 2010 Assistant Treasurer of the Fidelity funds. Mr. Davis is also Assistant Treasurer of Fidelity Rutland Square Trust II and Fidelity Commonwealth Trust II. Mr. Davis is an employee of Fidelity Investments. Previously, Mr. Davis served as Vice President and Associate General Counsel of FMR LLC (2003-2010). |
Annual Report
The Board of Trustees of Advisor Short-Intermediate Municipal Income Fund voted to pay to shareholders of record at the opening of business on record date, the following distributions per share derived from capital gains realized from sales of portfolio securities:
| Pay Date | Record Date | Dividends | Capital Gains |
Institutional Class | 02/11/13 | 02/08/13 | $- | $0.003 |
During fiscal year ended 2012, 100% of the fund's income dividends was free from federal income tax, and 6.62% of the fund's income dividends was subject to the federal alternative minimum tax.
The fund hereby designates as a capital gain dividend with respect to the taxable year ended December 31, 2012, $5,764,482, or, if subsequently determined to be different, the net capital gain of such year.
The fund will notify shareholders in January 2013 of amounts for use in preparing 2012 income tax returns.
Annual Report
Board Approval of Investment Advisory Contracts and Management Fees
Fidelity Short-Intermediate Municipal Income Fund
Each year, the Board of Trustees, including the Independent Trustees (together, the Board), votes on the renewal of the management contract and sub-advisory agreements (together, the Advisory Contracts) for the fund. The Board, assisted by the advice of fund counsel and Independent Trustees' counsel, requests and considers a broad range of information relevant to the renewal of the Advisory Contracts throughout the year.
The Board meets regularly and, at each of its meetings, covers an extensive agenda of topics and materials and considers factors that are relevant to its annual consideration of the renewal of the fund's Advisory Contracts, including the services and support provided to the fund and its shareholders. The Board has established three standing committees, Operations, Audit, and Governance and Nominating, each composed of and chaired by Independent Trustees with varying backgrounds, to which the Board has assigned specific subject matter responsibilities in order to enhance effective decision-making by the Board. The Operations Committee, of which all of the Independent Trustees are members, meets regularly throughout the year and, among other matters, considers matters specifically related to the annual consideration of the renewal of the fund's Advisory Contracts. The Board, acting directly and through its Committees, requests and receives information concerning the annual consideration of the renewal of the fund's Advisory Contracts. The Board also meets as needed to consider matters specifically related to the Board's annual consideration of the renewal of Advisory Contracts. Members of the Board may also meet with trustees of other Fidelity funds through ad hoc joint committees to discuss certain matters relevant to the Fidelity funds.
At its September 2012 meeting, the Board of Trustees, including the Independent Trustees, unanimously determined to renew the fund's Advisory Contracts. In reaching its determination, the Board considered all factors it believed relevant, including (i) the nature, extent, and quality of the services to be provided to the fund and its shareholders (including the investment performance of the fund); (ii) the competitiveness of the fund's management fee and total expense ratio relative to peer funds; (iii) the total costs of the services to be provided by and the profits to be realized by Fidelity from its relationship with the fund; (iv) the extent to which economies of scale exist and would be realized as the fund grows; and (v) whether fee levels reflect these economies of scale, if any, for the benefit of fund shareholders.
In considering whether to renew the Advisory Contracts for the fund, the Board reached a determination, with the assistance of fund counsel and Independent Trustees' counsel and through the exercise of its business judgment, that the renewal of the Advisory Contracts is in the best interests of the fund and its shareholders and that the compensation payable under the Advisory Contracts is fair and reasonable. The Board's decision to renew the Advisory Contracts was not based on any single factor, but rather was based on a comprehensive consideration of all the information provided to the Board at its meetings throughout the year. The Board, in reaching its determination to renew the Advisory Contracts, was aware that shareholders in the fund have a broad range of investment choices available to them, including a wide choice among mutual funds offered by Fidelity's competitors, and that the fund's shareholders, who have the opportunity to review and weigh the disclosure provided by the fund in its prospectus and other public disclosures, have chosen to invest in this fund, managed by Fidelity.
Annual Report
Board Approval of Investment Advisory Contracts and
Management Fees - continued
Nature, Extent, and Quality of Services Provided. The Board considered the staffing within the investment adviser, FMR, and the sub-advisers (together, the Investment Advisers), including the backgrounds of the fund's investment personnel, and also considered the fund's investment objective, strategies, and related investment philosophy. The Independent Trustees also had discussions with senior management of Fidelity's investment operations and investment groups. The Board considered the structure of the portfolio manager compensation program and whether this structure provides appropriate incentives to act in the best interests of the fund.
Resources Dedicated to Investment Management and Support Services. The Board reviewed the general qualifications and capabilities of the Investment Advisers' investment staff, including its size, education, experience, and resources, as well as the Investment Advisers' approach to recruiting, managing, and compensating investment personnel. The Board also noted that FMR has continued to increase the resources devoted to non-U.S. offices, including expansion of Fidelity's global investment organization. The Board noted that Fidelity's analysts have extensive resources, tools and capabilities that allow them to conduct sophisticated quantitative and fundamental analysis, as well as credit analysis of issuers, counterparties and guarantors. The Board also believes that Fidelity's investment professionals have sufficient access to global information and data so as to provide competitive investment results over time, and that those professionals also have access to sophisticated tools that permit them to assess portfolio construction and risk and performance attribution characteristics continuously, as well as to transmit new information and research conclusions rapidly around the world. Additionally, in its deliberations, the Board considered the Investment Advisers' trading and risk management capabilities and resources, which are an integral part of the investment management process.
Shareholder and Administrative Services. The Board considered (i) the nature, extent, quality, and cost of advisory, administrative, and shareholder services performed by the Investment Advisers and their affiliates under the Advisory Contracts and under separate agreements covering transfer agency and pricing and bookkeeping services for the fund; (ii) the nature and extent of the supervision of third party service providers, principally custodians and subcustodians; and (iii) the resources devoted to, and the record of compliance with, the fund's compliance policies and procedures.
Annual Report
The Board noted that the growth of fund assets over time across the complex allows Fidelity to reinvest in the development of services designed to enhance the value or convenience of the Fidelity funds as investment vehicles. These services include 24-hour access to account information and market information through telephone representatives and over the Internet, investor education materials and asset allocation tools, and the expanded availability of Fidelity Investor Centers.
Investment in a Large Fund Family. The Board considered the benefits to shareholders of investing in a Fidelity fund, including the benefits of investing in a fund that is part of a large family of funds offering a variety of investment disciplines and providing a large variety of mutual fund investor services. The Board noted that Fidelity had taken, or had made recommendations that resulted in the Fidelity funds taking, a number of actions over the previous year that benefited particular funds, including (i) continuing to dedicate additional resources to investment research and support of the senior management team that oversees asset management; (ii) persisting in efforts to enhance Fidelity's research capabilities, in particular, international research; (iii) launching new funds and making other enhancements to meet client needs for global and income-oriented solutions; (iv) continuing to launch dedicated lower cost underlying funds to meet investment management's portfolio construction needs related to expanding underlying fund options, specifically for the Freedom Fund product lines; (v) adopting a sector neutral investment approach for certain funds and utilizing a team of portfolio managers to manage certain sector-neutral funds; (vi) rationalizing product lines and gaining increased efficiencies through combinations of several funds with other funds; (vii) strengthening the Spartan Index Fund product line by adding new funds and/or new low-cost institutional share classes, restructuring fund expenses to accommodate new classes, and reducing investment minimums for certain classes of shares; (viii) modifying the eligibility criteria for Institutional Class shares to increase their appeal to government entities and charitable investors; and (ix) reducing certain transfer agent fee rates.
Investment Performance. The Board considered whether the fund has operated in accordance with its investment objective, as well as its record of compliance with its investment restrictions. It also reviewed the fund's absolute investment performance for each class, as well as the fund's relative investment performance for each class measured over multiple periods against (i) a broad-based securities market index, and (ii) a peer group of mutual funds deemed appropriate by Fidelity and reviewed by the Board. The following charts considered by the Board show, over the one-, three-, and five-year periods ended December 31, 2011, the cumulative total returns of the retail class and Class C of the fund, the cumulative total returns of a broad-based securities market index ("benchmark"), and a range of cumulative total returns of a peer group of mutual funds identified by Lipper Inc. as having an investment objective similar to that of the fund. The returns of the retail class and Class C show the performance of the highest and lowest performing classes, respectively (based on five-year performance). The box within each chart shows the 25th percentile return (top of box) and the 75th percentile return (bottom of box) of the peer group. Returns shown above the box are in the first quartile and returns shown below the box are in the fourth quartile. The percentage beaten numbers noted below each chart correspond to the percentile box and represent the percentage of funds in the peer group whose performance was equal to or lower than that of the class indicated.
Annual Report
Board Approval of Investment Advisory Contracts and
Management Fees - continued
Fidelity Short-Intermediate Municipal Income Fund
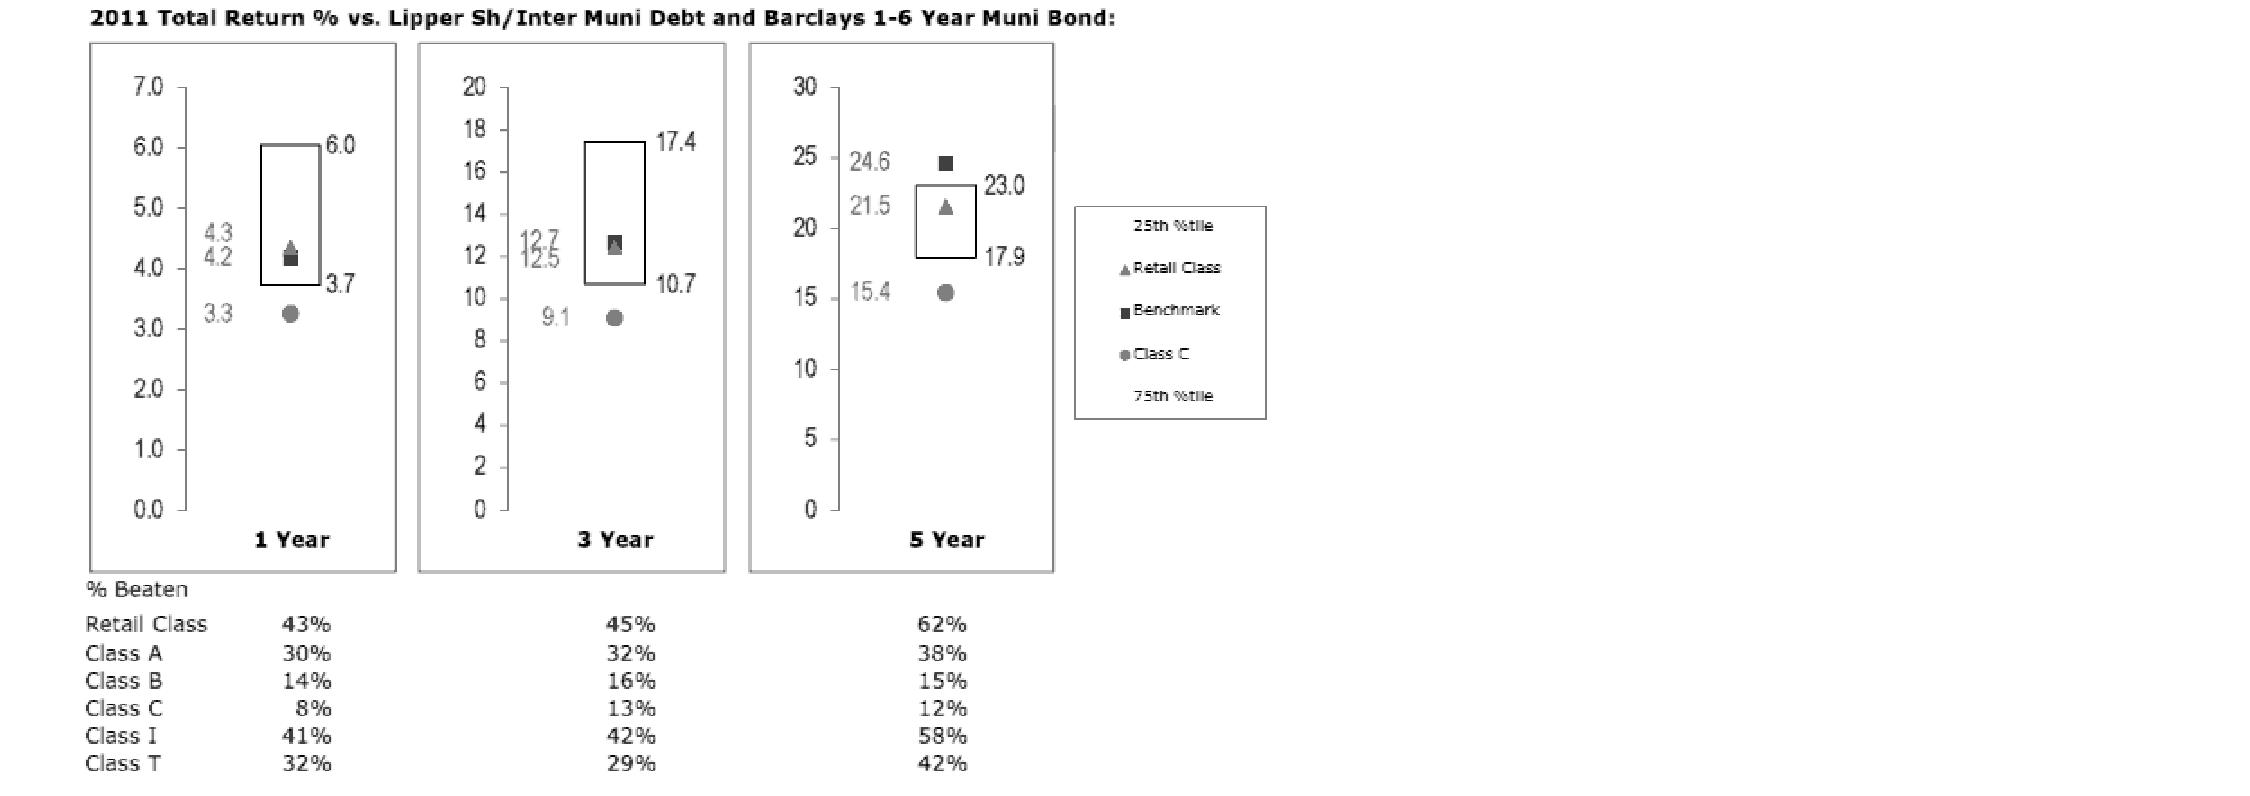
The Board reviewed the fund's relative investment performance against its peer group and noted that the performance of the retail class of the fund was in the third quartile for the one- and three-year periods and the second quartile for the five-year period. The Board also noted that the investment performance of the fund was lower than its benchmark for the three- and five-year periods, although the one-year total return of the retail class compared favorably to its benchmark. The Board considered that the variations in performance among the fund's classes reflect the variations in class expenses, which result in lower performance for higher expense classes. The Board discussed with FMR actions to improve the fund's disappointing performance relative to its peer group. The Board also reviewed the fund's performance since inception as well as performance in the current year. The Board will continue to closely monitor the performance of the fund in the coming year and discuss with FMR other appropriate actions to address the performance of the fund.
Based on its review, the Board concluded that the nature, extent, and quality of services provided to the fund under the Advisory Contracts should benefit the fund's shareholders.
Annual Report
Competitiveness of Management Fee and Total Expense Ratio. The Board considered the fund's management fee and total expense ratio compared to "mapped groups" of competitive funds and classes. Fidelity creates "mapped groups" by combining similar Lipper investment objective categories that have comparable management fee characteristics. Combining Lipper investment objective categories aids the Board's management fee and total expense ratio comparisons by broadening the competitive group used for comparison and by reducing the number of universes to which various Fidelity funds are compared.
Management Fee. The Board considered two proprietary management fee comparisons for the 12-month periods shown in the chart below. The group of Lipper funds used by the Board for management fee comparisons is referred to below as the "Total Mapped Group" and, for the reasons explained above, is broader than the Lipper peer group used by the Board for performance comparisons. The Total Mapped Group comparison focuses on a fund's standing relative to the total universe of comparable funds available to investors in terms of gross management fees before expense reimbursements or caps. "TMG %" represents the percentage of funds in the Total Mapped Group that had management fees that were lower than the fund's. For example, a TMG % of 25% means that 75% of the funds in the Total Mapped Group had higher management fees than the fund. The "Asset-Size Peer Group" (ASPG) comparison focuses on a fund's standing relative to non-Fidelity funds similar in size to the fund within the Total Mapped Group. The ASPG represents at least 15% of the funds in the Total Mapped Group with comparable asset size and management fee characteristics, subject to a minimum of 50 funds (or all funds in the Total Mapped Group if fewer than 50). Additional information, such as the ASPG quartile in which the fund's management fee ranked, is also included in the chart and considered by the Board.
Annual Report
Board Approval of Investment Advisory Contracts and
Management Fees - continued
Fidelity Short-Intermediate Municipal Income Fund

The Board noted that the fund's management fee ranked below the median of its Total Mapped Group and below the median of its ASPG for 2011.
Based on its review, the Board concluded that the fund's management fee is fair and reasonable in light of the services that the fund receives and the other factors considered.
Total Expense Ratio. In its review of each class's total expense ratio, the Board considered the fund's management fee as well as other fund or class expenses, as applicable, such as transfer agent fees, pricing and bookkeeping fees, fund-paid 12b-1 fees, and custodial, legal, and audit fees. The Board also noted the effects of any waivers and reimbursements on fees and expenses. As part of its review, the Board also considered the current and historical total expense ratios of each class of the fund compared to competitive fund median expenses. Each class of the fund is compared to those funds and classes in the Total Mapped Group (used by the Board for management fee comparisons) that have a similar sales load structure.
The Board noted that the total expense ratio of each of Class B and the retail class ranked below its competitive median for 2011 and the total expense ratio of each of Class A, Class T, Class C, and Institutional Class ranked above its competitive median for 2011. The Board considered that various factors, including 12b-1 fees and relatively higher other expenses in the case of small fund size, can affect total expense ratios. The Board considered that Class T is primarily sold load-waived in the retirement plan market, where its 0.50% 12b-1 fee is comparable to the 12b-1 fees of the no-load classes with which it competes in the retirement plan market. The Board noted that the fund offers multiple classes, each of which has a different sales load and 12b-1 fee structure, and that the multiple structures are intended to offer a range of pricing options for the intermediary market. The Board also noted that the total expense ratios of the classes vary primarily by the level of their 12b-1 fees, although differences in transfer agent fees may also cause expenses to vary from class to class.
Annual Report
Fees Charged to Other Fidelity Clients. The Board also considered Fidelity fee structures and other information with respect to clients of FMR and its affiliates, such as other mutual funds advised or subadvised by FMR or its affiliates, pension plan clients, and other institutional clients. The Board noted the findings of the 2010 ad hoc joint committee (created with the board of other Fidelity funds), which reviewed and compared Fidelity's institutional investment advisory business with its business of providing services to the Fidelity funds, including the differences in services provided, fees charged, and costs incurred, as well as competition in their respective marketplaces.
Based on its review of total expense ratios and fees charged to other Fidelity clients, the Board concluded that the total expense ratio of each class of the fund was reasonable, although in some cases above the median of the universe presented for comparison, in light of the services that the fund and its shareholders receive and the other factors considered.
Costs of the Services and Profitability. The Board considered the revenues earned and the expenses incurred by Fidelity in conducting the business of developing, marketing, distributing, managing, administering and servicing the fund and its shareholders. The Board also considered the level of Fidelity's profits in respect of all the Fidelity funds.
On an annual basis, FMR presents to the Board Fidelity's profitability for the fund. Fidelity calculates the profitability for each fund, as well as aggregate profitability for groups of Fidelity funds and all Fidelity funds, using a series of detailed revenue and cost allocation methodologies which originate with the books and records of Fidelity on which Fidelity's audited financial statements are based. The Audit Committee of the Board reviews any significant changes from the prior year's methodologies.
PricewaterhouseCoopers LLP (PwC), independent registered public accounting firm and auditor to Fidelity and certain Fidelity funds, has been engaged annually by the Board as part of the Board's assessment of Fidelity's profitability analysis. PwC's engagement includes the review and assessment of Fidelity's methodologies used in determining the revenues and expenses attributable to Fidelity's mutual fund business, and completion of agreed-upon procedures surrounding the mathematical accuracy of fund profitability and its conformity to allocation methodologies. After considering PwC's reports issued under the engagement and information provided by Fidelity, the Board concluded that while other allocation methods may also be reasonable, Fidelity's profitability methodologies are reasonable in all material respects.
Annual Report
Board Approval of Investment Advisory Contracts and
Management Fees - continued
The Board also reviewed Fidelity's non-fund businesses and fall-out benefits related to the mutual fund business as well as cases where Fidelity's affiliates may benefit from or be related to the fund's business.
The Board considered the costs of the services provided by and the profits realized by Fidelity in connection with the operation of the fund and was satisfied that the profitability was not excessive in the circumstances.
Economies of Scale. The Board considered whether there have been economies of scale in respect of the management of the Fidelity funds, whether the Fidelity funds (including the fund) have appropriately benefited from any such economies of scale, and whether there is potential for realization of any further economies of scale. The Board considered the extent to which the fund will benefit from economies of scale through increased services to the fund, through waivers or reimbursements, or through fee or expense reductions. The Board also noted that in 2009, it and the board of other Fidelity funds created an ad hoc committee (the Economies of Scale Committee) to analyze whether FMR attains economies of scale in respect of the management and servicing of the Fidelity funds, whether the Fidelity funds have appropriately benefited from such economies of scale, and whether there is potential for realization of any further economies of scale.
The Board recognized that the fund's management contract incorporates a "group fee" structure, which provides for lower group fee rates as total fund assets under FMR's management increase, and for higher group fee rates as total fund assets under FMR's management decrease. FMR calculates the group fee rates based on a tiered asset "breakpoint" schedule that varies based on asset class. The Board considered that the group fee is designed to deliver the benefits of economies of scale to fund shareholders when total Fidelity fund assets increase, even if assets of any particular fund are unchanged or have declined, because some portion of Fidelity's costs are attributable to services provided to all Fidelity funds, and all funds benefit if those costs can be allocated among more assets. The Board concluded that, given the group fee structure, fund shareholders will benefit from lower management fees as assets under FMR's management increase at the fund complex level, regardless of whether Fidelity achieves any such economies of scale.
The Board concluded, taking into account the analysis of the Economies of Scale Committee, that economies of scale, if any, are being appropriately shared between fund shareholders and Fidelity.
Additional Information Requested by the Board. In order to develop fully the factual basis for consideration of the Fidelity funds' Advisory Contracts, the Board requested and received additional information on certain topics, including: (i) Fidelity's fund profitability methodology, profitability trends for certain funds, and the impact of certain factors on fund profitability results; (ii) portfolio manager changes that have occurred during the past year and the amount of the investment that each portfolio manager has made in the Fidelity fund(s) that he or she manages; (iii) Fidelity's compensation structure for portfolio managers, research analysts, and other key personnel, including its effects on fund profitability, the rationale for the compensation structure, and the extent to which current market conditions have affected retention and recruitment; (iv) the compensation paid to fund sub-advisers on behalf of the Fidelity funds; (v) Fidelity's fee structures, including the group fee structure, and the rationale for recommending different fees among different categories of funds and classes; (vi) Fidelity's voluntary waiver of its fees to maintain minimum yields for certain money market funds and classes as well as contractual waivers in place for certain funds; (vii) regulatory and industry developments, including those affecting money market funds and target date funds, and the potential impact to Fidelity; (viii) Fidelity's transfer agent fees, expenses, and services, and drivers for determining the transfer agent fee structure of different funds and classes; (ix) management fee rates charged by FMR or Fidelity entities to other Fidelity clients; (x) the allocation of and historical trends in Fidelity's realization of fall-out benefits; and (xi) explanations regarding the relative total expense ratios of certain funds and classes, total expense competitive trends, and actions that might be taken by FMR to reduce total expense ratios for certain funds and classes or to achieve further economies of scale.
Annual Report
Based on its evaluation of all of the conclusions noted above, and after considering all factors it believed relevant, the Board ultimately concluded that the advisory fee structures are fair and reasonable, and that the fund's Advisory Contracts should be renewed.
Annual Report
Investment Adviser
Fidelity Management & Research Company
Boston, MA
Investment Sub-Advisers
Fidelity Investments Money
Management, Inc.
Fidelity Management & Research
(U.K.) Inc.
Fidelity Management & Research
(Hong Kong) Limited
Fidelity Management & Research
(Japan) Inc.
General Distributor
Fidelity Distributors Corporation
Smithfield, RI
Transfer and Service Agents
Citibank, N.A.
New York, NY
Fidelity Investments Institutional
Operations Company, Inc.
Boston, MA
Fidelity Service Company, Inc.
Boston, MA
Custodian
Citibank, N.A.
New York, NY
(Fidelity Investment logo)(registered trademark)
ASTMI-UANN-0213
1.796657.109
Item 2. Code of Ethics
As of the end of the period, December 31, 2012, Fidelity Municipal Trust (the trust) has adopted a code of ethics, as defined in Item 2 of Form N-CSR, that applies to its President and Treasurer and its Chief Financial Officer. A copy of the code of ethics is filed as an exhibit to this Form N-CSR.
Item 3. Audit Committee Financial Expert
The Board of Trustees of the trust has determined that James H. Keyes is an audit committee financial expert, as defined in Item 3 of Form N-CSR. Mr. Keyes is independent for purposes of Item 3 of Form N-CSR.
Item 4. Principal Accountant Fees and Services
Fees and Services
The following table presents fees billed by PricewaterhouseCoopers LLP ("PwC") in each of the last two fiscal years for services rendered to Fidelity Michigan Municipal Income Fund, Fidelity Minnesota Municipal Income Fund, Fidelity Municipal Income Fund, Fidelity Ohio Municipal Income Fund, Fidelity Pennsylvania Municipal Income Fund and Fidelity Short-Intermediate Municipal Income Fund (the "Funds"):
Services Billed by PwC
December 31, 2012 FeesA
| Audit Fees | Audit-Related Fees | Tax Fees | All Other Fees |
Fidelity Michigan Municipal Income Fund | $45,000 | $- | $2,200 | $1,800 |
Fidelity Minnesota Municipal Income Fund | $45,000 | $- | $2,200 | $1,700 |
Fidelity Municipal Income Fund | $66,000 | $- | $2,200 | $4,100 |
Fidelity Ohio Municipal Income Fund | $45,000 | $- | $2,200 | $1,800 |
Fidelity Pennsylvania Municipal Income Fund | $45,000 | $- | $2,200 | $1,700 |
Fidelity Short-Intermediate Municipal Income Fund | $49,000 | $- | $2,200 | $3,300 |
December 31, 2011 FeesA
| Audit Fees | Audit-Related Fees | Tax Fees | All Other Fees |
Fidelity Michigan Municipal Income Fund | $44,000 | $- | $2,200 | $1,800 |
Fidelity Minnesota Municipal Income Fund | $44,000 | $- | $2,200 | $1,800 |
Fidelity Municipal Income Fund | $64,000 | $- | $2,200 | $4,000 |
Fidelity Ohio Municipal Income Fund | $44,000 | $- | $2,200 | $1,800 |
Fidelity Pennsylvania Municipal Income Fund | $44,000 | $- | $2,200 | $1,800 |
Fidelity Short-Intermediate Municipal Income Fund | $47,000 | $- | $2,200 | $3,200 |
A Amounts may reflect rounding.
The following table presents fees billed by PwC that were required to be approved by the Audit Committee for services that relate directly to the operations and financial reporting of the Funds and that are rendered on behalf of Fidelity Management & Research Company ("FMR") and entities controlling, controlled by, or under common control with FMR (not including any sub-adviser whose role is primarily portfolio management and is subcontracted with or overseen by another investment adviser) that provide ongoing services to the Funds ("Fund Service Providers"):
Services Billed by PwC
| December 31, 2012A | December 31, 2011A |
Audit-Related Fees | $4,805,000 | $3,845,000 |
Tax Fees | $- | $- |
All Other Fees | $- | $- |
A Amounts may reflect rounding.
"Audit-Related Fees" represent fees billed for assurance and related services that are reasonably related to the performance of the fund audit or the review of the fund's financial statements and that are not reported under Audit Fees.
"Tax Fees" represent fees billed for tax compliance, tax advice or tax planning that relate directly to the operations and financial reporting of the fund.
"All Other Fees" represent fees billed for services provided to the fund or Fund Service Provider, a significant portion of which are assurance related, that relate directly to the operations and financial reporting of the fund, excluding those services that are reported under Audit Fees, Audit-Related Fees or Tax Fees.
Assurance services must be performed by an independent public accountant.
* * *
The aggregate non-audit fees billed by PwC for services rendered to the Funds, FMR (not including any sub-adviser whose role is primarily portfolio management and is subcontracted with or overseen by another investment adviser), and any Fund Service Provider for each of the last two fiscal years of the Funds are as follows:
Billed By | December 31, 2012 A | December 31, 2011 A |
PwC | $5,640,000 | $5,080,000 |
A Amounts may reflect rounding.
The trust's Audit Committee has considered non-audit services that were not pre-approved that were provided by PwC to Fund Service Providers to be compatible with maintaining the independence of PwC in its audit of the Funds, taking into account representations from PwC, in accordance with Public Company Accounting Oversight Board rules, regarding its independence from the Funds and their related entities and FMR's review of the appropriateness and permissibility under applicable law of such non-audit services prior to their provision to the Fund Service Providers.
Audit Committee Pre-Approval Policies and Procedures
The trust's Audit Committee must pre-approve all audit and non-audit services provided by a fund's independent registered public accounting firm relating to the operations or financial reporting of the fund. Prior to the commencement of any audit or non-audit services to a fund, the Audit Committee reviews the services to determine whether they are appropriate and permissible under applicable law.
The Audit Committee has adopted policies and procedures to, among other purposes, provide a framework for the Committee's consideration of non-audit services by the audit firms that audit the Fidelity funds. The policies and procedures require that any non-audit service provided by a fund audit firm to a Fidelity fund and any non-audit service provided by a fund auditor to a Fund Service Provider that relates directly to the operations and financial reporting of a Fidelity fund ("Covered Service") are subject to approval by the Audit Committee before such service is provided.
All Covered Services must be approved in advance of provision of the service either: (i) by formal resolution of the Audit Committee, or (ii) by oral or written approval of the service by the Chair of the Audit Committee (or if the Chair is unavailable, such other member of the Audit Committee as may be designated by the Chair to act in the Chair's absence). The approval contemplated by (ii) above is permitted where the Treasurer determines that action on such an engagement is necessary before the next meeting of the Audit Committee.
Non-audit services provided by a fund audit firm to a Fund Service Provider that do not relate directly to the operations and financial reporting of a Fidelity fund are reported to the Audit Committee on a periodic basis.
Non-Audit Services Approved Pursuant to Rule 2-01(c)(7)(i)(C) and (ii) of Regulation S-X ("De Minimis Exception")
There were no non-audit services approved or required to be approved by the Audit Committee pursuant to the De Minimis Exception during the Funds' last two fiscal years relating to services provided to (i) the Funds or (ii) any Fund Service Provider that relate directly to the operations and financial reporting of the Funds.
Item 5. Audit Committee of Listed Registrants
Not applicable.
Item 6. Investments
(a) Not applicable.
(b) Not applicable
Item 7. Disclosure of Proxy Voting Policies and Procedures for Closed-End Management Investment Companies
Not applicable.
Item 8. Portfolio Managers of Closed-End Management Investment Companies
Not applicable.
Item 9. Purchase of Equity Securities by Closed-End Management Investment Company and Affiliated Purchasers
Not applicable.
Item 10. Submission of Matters to a Vote of Security Holders
There were no material changes to the procedures by which shareholders may recommend nominees to the trust's Board of Trustees.
Item 11. Controls and Procedures
(a)(i) The President and Treasurer and the Chief Financial Officer have concluded that the trust's disclosure controls and procedures (as defined in Rule 30a-3(c) under the Investment Company Act) provide reasonable assurances that material information relating to the trust is made known to them by the appropriate persons, based on their evaluation of these controls and procedures as of a date within 90 days of the filing date of this report.
(a)(ii) There was no change in the trust's internal control over financial reporting (as defined in Rule 30a-3(d) under the Investment Company Act) that occurred during the second fiscal quarter of the period covered by this report that has materially affected, or is reasonably likely to materially affect, the trust's internal control over financial reporting.
Item 12. Exhibits
(a) | (1) | Code of Ethics pursuant to Item 2 of Form N-CSR is filed and attached hereto as EX-99.CODE ETH. |
(a) | (2) | Certification pursuant to Rule 30a-2(a) under the Investment Company Act of 1940 (17 CFR 270.30a-2(a)) is filed and attached hereto as Exhibit 99.CERT. |
(a) | (3) | Not applicable. |
(b) | | Certification pursuant to Rule 30a-2(b) under the Investment Company Act of 1940 (17 CFR 270.30a-2(b)) is furnished and attached hereto as Exhibit 99.906CERT. |
SIGNATURES
Pursuant to the requirements of the Securities Exchange Act of 1934 and the Investment Company Act of 1940, the registrant has duly caused this report to be signed on its behalf by the undersigned, thereunto duly authorized.
Fidelity Municipal Trust
By: | /s/Stephanie J. Dorsey |
| Stephanie J. Dorsey |
| President and Treasurer |
| |
Date: | February 27, 2013 |
Pursuant to the requirements of the Securities Exchange Act of 1934 and the Investment Company Act of 1940, this report has been signed below by the following persons on behalf of the registrant and in the capacities and on the dates indicated.
By: | /s/Stephanie J. Dorsey |
| Stephanie J. Dorsey |
| President and Treasurer |
| |
Date: | February 27, 2013 |
By: | /s/Christine Reynolds |
| Christine Reynolds |
| Chief Financial Officer |
| |
Date: | February 27, 2013 |