Strong Large Cap Growth Fund (STRFX) Inactive
Filed: 3 Sep 04, 12:00am
OMB APPROVAL | ||
OMB Number: | 3235-0570 | |
Expires: | Nov. 30, 2005 | |
Estimated average burden | ||
hours per response: | 5.0 | |
UNITED STATES
SECURITIES AND EXCHANGE COMMISSION
Washington, D.C. 20549
FORM N-CSR
CERTIFIED SHAREHOLDER REPORT OF REGISTERED MANAGEMENT
INVESTMENT COMPANIES
Investment Company Act file number: 811-3254
Strong Large Cap Growth Fund, Inc., on behalf of Strong Large Cap Growth Fund
(Exact name of registrant as specified in charter)
| P.O. Box 2936 Milwaukee, WI | 53201 | |
| (Address of principal executive offices) | (Zip code) |
Richard Smirl, Strong Capital Management, Inc.
P.O. Box 2936 Milwaukee, WI 53201
(Name and address of agent for service)
Registrant’s telephone number, including area code: (414) 359-3400
Date of fiscal year end: December 31
Date of reporting period: June 30, 2004
Form N-CSR is to be used by management investment companies to file reports with the Commission not later than 10 days after the transmission to stockholders of any report that is required to be transmitted to stockholders under Rule 30e-1 under the Investment Company Act of 1940 (17 CFR 270.30e-1). The Commission may use the information provided on Form N-CSR in its regulatory, disclosure review, inspection, and policymaking roles.
A registrant is required to disclose the information specified by Form N-CSR, and the Commission will make this information public. A registrant is not required to respond to the collection of information contained in Form N-CSR unless the Form displays a currently valid Office of Management and Budget (“OMB”) control number. Please direct comments concerning the accuracy of the information collection burden estimate and any suggestions for reducing the burden to Secretary, Securities and Exchange Commission, 450 Fifth Street, NW, Washington, DC 20549-0609. The OMB has reviewed this collection of information under the clearance requirements of 44 U.S.C. (S) 3507.
Item 1. Reports to Shareholders
Semiannual Report | June 30, 2004
Strong
Growth
Funds

| Strong Blue Chip Fund | ||
| Strong Discovery Fund | ||
| Strong Endeavor Fund | ||
Strong Large Cap Growth Fund | ||
Strong U.S. Emerging Growth Fund | ||
Strong Enterprise Fund | ||
Strong Growth 20 Fund | ||
Strong Growth Fund | ||
Strong Large Company Growth Fund |

| SEMIANNUAL REPORT | June 30, 2004 |
Strong
Growth
Funds
Investment Reviews | ||
| 2 | ||
| 4 | ||
| 6 | ||
| 8 | ||
| 10 | ||
| 12 | ||
| 14 | ||
| 16 | ||
| 18 | ||
Financial Information | ||
Schedules of Investments in Securities | ||
| 20 | ||
| 20 | ||
| 22 | ||
| 23 | ||
| 25 | ||
| 27 | ||
| 28 | ||
| 29 | ||
| 31 | ||
| 34 | ||
| 41 | ||
| 44 | ||
| 47 | ||
| 56 | ||
| 71 | ||
Market Update From Dick Weiss January 1, 2004, to June 30, 2004 | ||
 | ||
Uncertainty is the Enemy
In our last report back in January, the overall U.S. economy displayed definite signs of strengthening — job growth was gaining momentum, and consumer confidence was on the rise. There was some muffled muttering about deflation, but it lacked enough conviction to cause alarm. All in all, it looked like a relatively promising picture.
Six months out, things seem not quite so sanguine. Fears of inflation have replaced the whispers of deflation, and the Federal Reserve has begun what doubtless will be a series of rate hikes well into 2005. While the overall economy has exceeded expectations, the good news on that front has not been sufficient to overshadow a host of uncertainties in the military and political worlds.
Before we address those uncertainties, let’s devote a moment to the topic of inflation. In the history of markets, there seems to be a point at which a rising rate of inflation causes the market’s price-to-earnings ratios to contract. Historically, that point would be around seven percent. While it seems highly unlikely that the inflation rate is going to get anywhere near that mark in the foreseeable future, there is some suggestion that nowadays, because of the way the Consumer Price Index is calculated, that number could be closer to five percent. If that is indeed a more realistic calculation, it’s possible that we could hit five percent inflation and a negative impact on stock valuations.
In my estimation though, the prospect for serious inflation pales in comparison to other uncertainties currently plaguing the market (e.g., the outcome of the U.S. presidential race this fall and the continuing political fallout surrounding Iraq).
With regard to the War on Terrorism and the issue of Iraq, investors are faced every day with news that can give them pause. While the war seems to be on track, the outcome in Iraq is dependent on how rapidly that nation can defeat the insurgents and restore the rule of law now that the Iraqis themselves have taken charge. We believe that expectations may be too low in that regard.
On the political front, the market seemed to peak around the moment when Democratic candidate Senator John Kerry pulled even with President George W. Bush in the polls. Nothing makes the prospects for economic prosperity harder to decipher than a presidential race featuring two candidates with widely differing views on virtually every issue domestically and internationally. For the stock market, that spells uncertainty with a capital U.
We believe stock valuations today are neither cheap, nor particularly overvalued based upon earnings projections for 2005. They are, rather, sort of stuck somewhere in the middle. In order for stocks to start moving in a positive direction, the market needs an injection of confidence. So the relevant question becomes, in short: What needs to happen in order to inspire that sense of confidence?
The answer? In a word — clarity.
On the inflation front, we anticipate clarity will not come for some time. We expect the Federal Reserve will continue to raise rates until it gets ahead of the inflation curve. It’s unclear just how many hikes and of what magnitude will accomplish that. Nonetheless, if inflationary fears were the single biggest element of uncertainty out there today, we would feel confident that the problem could be contained.
The fate of Iraq and the outcome of the presidential election loom larger and seem far more complicated. If the public perceives that progress is being made in Iraq and democracy will indeed triumph, the market will likely anticipate the reelection of President Bush. If the daily diagnosis on Iraq is less favorable, the political uncertainty weighing on the market will continue for the next several months.
Notwithstanding all the ambiguity, we are beginning to see corners of the market where good values are emerging. Energy has been one of the more promising areas and should continue to benefit from strong fundamentals. Even in the areas of the technology sector, where we believe stocks have been chronically overvalued, values have begun to return to earth. There are even some computer software companies that look attractive to us.
In order for stocks to start moving in a positive direction, the market needs an injection of confidence.
In stock-picker parlance, what we have today is a market of individual stocks rather than — as we saw in 2003 — a rising stock market. In the former, money is a lot harder to make; in the latter, the rising tide seems to lift all issues almost indiscriminately.
We believe the market should continue this year’s trend, which is a much more value- and fundamentals-oriented market. Make no mistake: this is not a “story” market where people dream about distant possibilities and, on the strength of those illusions, stocks soar to 100 times earnings. This is a market where, if you do your homework and stick to what is real rather than imagined, we think you can discover common stocks worth owning.
Given all the uncertainty that exists in the world, there are practical limits to just how high the market can go. But with an economy that continues to show strength and interest rates still on the low side, there are also practical limits to how low the market can go. That environment should favor professional investors who exhibit good discipline in both their buy and sell decisions.
One final piece of practical advice: when uncertainty is the order of the day, resist doing anything dramatic with your money. Sometimes the “muddle-through” approach proves best.
... if you do your homework and stick to what is real rather than imagined, we think you can uncover common stocks worth owning.

Richard T. Weiss |
Vice Chairman |
Strong Financial Corporation |
After a strong 2003, equity markets cooled somewhat in the first half of 2004, though economic growth continued. Against this backdrop, the Strong Blue Chip Fund posted a return of 3.96% for the six months ended June 30, 2004. This placed it slightly ahead of its broad-based benchmark, the S&P 500 Index, which returned 3.44% for the same period.
Stocks moved in a narrow range
While equity markets have at times been volatile during the first half of 2004, for the most part the S&P 500 has been caught in a trading range, with stocks fluctuating within a relatively narrow band. While it is not unusual for stocks to take a breather following the type of large gains they saw last year, other factors have played a role in muting equity returns. These factors included the continuing situation in Iraq, impending Federal Reserve interest-rate hikes, high energy prices, and worries about the impact of slowing Chinese growth on the Asian regional and global economies.
April was a particularly challenging month for the markets and the Fund. At that point, a sharp improvement in employment data sparked fears that the economic recovery would spark a new round of inflation and lead to substantially higher interest rates. These concerns were aggravated by the fact that it was not clear when, and to what extent, the Federal Reserve might raise rates. This turn in market sentiment was exaggerated, in our view, driven more by emotion than by any true need for concern. Because the Fund had significant positions in stocks most likely to be negatively affected by such concerns, our performance suffered during this time.
Investor sentiment began to improve somewhat near the end of May, as the market once again focused its attention on the good news regarding strong corporate profits and new job creation. Equities in the portfolio that had been hurt by investors’ concerns in April had largely stabilized and recovered by the end of the period.
Stocks that helped performance
Two of the Fund’s stronger performers came from the Internet sector: Yahoo! and eBay. Yahoo! benefited from continued gains in market share for its Internet search feature, as well as growth in its online advertising. eBay benefited from good growth in its core business, online auction listings. Although they have already performed quite well, we believed the strong fundamentals of these companies justified continuing to own them in the Fund.
Holdings in the energy sector also made a positive contribution to the Fund’s performance. Within this arena, we made our largest investments in large, integrated oil companies, which benefited from higher demand for oil, strong margins on refining operations, and low debt levels that helped to mute the impact of rising interest rates. In our assessment, these companies remain reasonably priced. Many projections of their earnings — and thus estimates of appropriate valuations — are based on an assumption that oil prices may decline significantly in coming months; we are not convinced that prices will in fact drop soon. Should they stay at more elevated levels, these companies’ earnings could rise further. We are confident that even at these higher levels, oil prices are not so high as to put a severe crimp in economic growth. Energy consumption per unit of Gross Domestic Product (GDP) is dramatically lower than it was in the 1970s, indicating a level of efficiency that allows the economy to absorb higher prices.
Our investment outlook
We anticipate that investor sentiment should continue to improve in coming months, in keeping with the generally positive economic environment we see. GDP has been growing steadily for ten consecutive quarters, and we believe there is plenty of reason to expect the recovery to be sustained for some time to come. Corporate earnings are also strong. Including the fourth quarter of 2003, the S&P 500 companies have experienced two consecutive quarters of year-over-year earnings growth well in excess of 20%, with another similar gain expected for the second quarter of 2004.
We anticipate that the positive data surrounding corporate profits, job creation, and economic activity should in time be sufficient to help the equity markets break out of their trading range.
Thank you for your investment in the Strong Blue Chip Fund.
| Karen E. McGrath |
| Portfolio Manager |
2
Fund Highlights
Average Annual Total Returns
As of 6-30-04
Investor Class | |||
1-year | 22.07 | % | |
5-year | –6.87 | % | |
Since Fund Inception (6-30-97) | 3.06 | % |
Performance is historical and does not guarantee future results. Investment returns and principal value will fluctuate, and you may have a gain or loss when you sell shares. Current performance may be lower or higher than the quoted performance. Call us or visit www.Strong.com for the most recent month-end performance.
Risks: Stock funds should only be considered for long-term goals as values fluctuate in response to the activities of individual companies and general market and economic conditions.
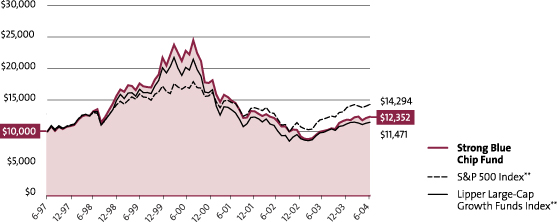
Growth of an Assumed $10,000 Investment†
from 6-30-97 to 6-30-04
Mention of specific securities in this report is not indicative of whether the Fund may make additional purchases of, sell all or a portion of, or continue to hold those securities.
| * | The Morningstar Style Box™ reveals a fund’s investment strategy. For equity funds, the vertical axis shows the market capitalization of the stocks owned and the horizontal axis shows investment style (value, blend, or growth). |
| † | This graph, provided in accordance with SEC regulations, compares a $10,000 investment in the Fund, made at its inception, with the performance of the S&P 500 Index and the Lipper Large-Cap Growth Funds Index. Results include the reinvestment of all dividends and capital gains distributions. The graph and the Average Annual Total Returns table do not reflect the deduction of taxes, if any, that a shareholder would pay on Fund distributions or the redemption of Fund shares. |
Fee Waivers: From time to time, the Fund’s advisor and/or administrator has waived fees and/or absorbed Fund expenses, which has resulted in higher returns. As of 6-30-04, there are waivers and/or absorptions in effect.
Percentage Restrictions: The Fund’s prospectus and statement of additional information may describe restrictions on the percentage of a particular type or quality of security in which the Fund may invest (“Percentage Restrictions”). Percentage Restrictions apply at the time the Fund purchases a security. Circumstances subsequent to the purchase of the security, such as a change in: (1) the Fund’s assets (e.g., due to cash inflows and redemptions); (2) the market value of the security; or (3) the pricing, liquidity, or rating of the security, may cause the Fund to exceed or fall short of the Percentage Restriction. If this happens, the Fund’s continued holding of the security will not constitute a violation of the Percentage Restriction.
Definitions: **The S&P 500 Index consists of 500 stocks chosen for market size, liquidity, and industry group representation. It is a market value weighted index (stock price times number of shares outstanding), with each stock’s weight in the Index proportionate to its market value. The Lipper Large-Cap Growth Funds Index is the average of the 30 largest funds in the Lipper Large-Cap Growth Funds Category. Source of the S&P Index data is Standard & Poor’s Micropal. Source of the Lipper Index data is Lipper.
It is not possible to invest directly in an index.
3
During the first half of 2004, the Strong Discovery Fund gained 5.47%. This return fell short of the Fund’s broad-based benchmark, the Russell 2000 Index, which rose 6.76% during the same time frame.
The underperformance can be partly attributed to disappointing results from Select Medical Corporation, a health-care equipment company. The stock fell after the government proposed some changes to how health-care providers would be reimbursed for Medicare claims. In response to the decline, we sold our position in Select Medical during the period — though, unfortunately, not soon enough to avoid a negative impact on the portfolio. A tendency of growth investments to lag their value counterparts during the past six months also hurt relative performance. These negative influences were counterbalanced by positive performance from the Fund’s consumer discretionary and telecommunications holdings.
Concern about interest rates and inflation
Continued growth in corporate profits and operating margins helped support further increases in stock prices during the first six months of 2004, although these gains were much less robust than those realized in 2003. As the stock recovery continued to take hold, investors began to look ahead to the potential for higher interest rates, more inflation, and continued high energy prices — all factors that could limit equity returns in the future. Interest rates were a particular concern; the threat of further rate hikes from the Federal Reserve Board kept a ceiling on corporate valuations, even as the companies reported solid first-quarter profits.
Supporting our investment thesis
Our approach to portfolio management relies on the careful selection of individual securities through collaborative research. We strive to “surround” each company that we consider for investment. In other words, our team of portfolio managers and analysts interviews not only the companies’ management, but also their competitors, suppliers, and customers. We want to acquire unique insights to support — or reject, in the cases of companies that fail to meet our strict requirements — our investment thesis for each individual stock.
Applying this research approach, the Fund held a position in PETsMART, the country’s largest retailer of pet supplies and services. We believed that PETsMART, with more than 650 stores in 59 of the nation’s top 60 markets and with new sales initiatives underway, would continue to produce strong revenue growth. We were attracted to PETsMART’s strategy to further expand revenue by offering grooming, training, and veterinary services at more of its retail locations. These services are highly profitable for the company and have been increasing revenues at an annual pace of 25%. Furthermore, these services have been well received by customers and have helped generate more store visits. Thanks in part to PETsMART’s impressive revenue growth during the period, the company’s stock contributed positively to the Fund’s performance.
Another important holding for the Fund was Crown Castle International, which owns and leases towers and transmission networks for wireless communications systems. Our industry research revealed that wireless carriers have two top priorities: 1) improving the voice quality on their communications networks; and 2) rolling out next-generation networks to enable subscribers to access online services at high speeds. Competition between carriers has become increasingly fierce, however, and as the companies acquire ever more customers, they must continue to upgrade and expand their networks to meet the increased demand. We believed that Crown Castle was in a strong position to capitalize on these trends. As the nation’s second largest wireless tower operator, the company has a presence in nearly three-quarters of the 100 largest markets in the United States. During the period, Crown Castle’s strong competitive position led to impressive growth in the company’s free-cash flow (cash flow after expenses).
A market shift ahead?
Although corporate earnings and profitability are expected to continue to rise, we believe that stock valuations are already reflecting these likely trends. Thus, we are looking for gains from this point to be produced by a select group of high-quality stocks with predictable earnings. Against this backdrop, we plan to focus on companies with promising opportunities to reinvest in their core business to generate stable revenue and profit growth, and the ability to keep prices high in a competitive business environment. We believe the Fund is well positioned for an environment that rewards quality, as the Fund generally invests in high-quality, small- and mid-cap names.
Thank you for your investment in the Strong Discovery Fund. We appreciate the trust you have placed in our team.
| Thomas J. Pence | James M. Leach | |
Portfolio Co-Manager | Portfolio Co-Manager |
4
Fund Highlights
Average Annual Total Returns
As of 6-30-04
Investor Class | |||
1-year | 29.56 | % | |
5-year | 9.00 | % | |
10-year | 9.65 | % | |
Since Fund Inception (12-31-87) | 12.53 | % |
Performance is historical and does not guarantee future results. Investment returns and principal value will fluctuate, and you may have a gain or loss when you sell shares. Current performance may be lower or higher than the quoted performance. Call us or visit www.Strong.com for the most recent month-end performance.
Risks: Stock funds should only be considered for long-term goals as values fluctuate in response to the activities of individual companies and general market and economic conditions.
Because smaller companies often have narrower markets and limited financial resources, investments in these stocks present more risk than investments in those of larger, more established companies.
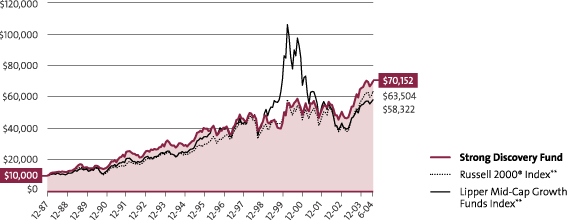
Growth of an Assumed $10,000 Investment†
from 12-31-87 to 6-30-04
Mention of specific securities in this report is not indicative of whether the Fund may make additional purchases of, sell all or a portion of, or continue to hold those securities.
| * | The Morningstar Style Box™ reveals a fund’s investment strategy. For equity funds, the vertical axis shows the market capitalization of the stocks owned and the horizontal axis shows investment style (value, blend, or growth). |
| † | This graph, provided in accordance with SEC regulations, compares a $10,000 investment in the Fund, made at its inception, with the performance of the Russell 2000® Index and the Lipper Mid-Cap Growth Funds Index. Results include the reinvestment of all dividends and capital gains distributions. The graph and the Average Annual Total Returns table do not reflect the deduction of taxes, if any, that a shareholder would pay on Fund distributions or the redemption of Fund shares. |
Fee Waivers: From time to time, the Fund’s advisor and/or administrator has waived fees and/or absorbed Fund expenses, which has resulted in higher returns. As of 6-30-04, there are waivers and/or absorptions in effect.
Percentage Restrictions: The Fund’s prospectus and statement of additional information may describe restrictions on the percentage of a particular type or quality of security in which the Fund may invest (“Percentage Restrictions”). Percentage Restrictions apply at the time the Fund purchases a security. Circumstances subsequent to the purchase of the security, such as a change in: (1) the Fund’s assets (e.g., due to cash inflows and redemptions); (2) the market value of the security; or (3) the pricing, liquidity, or rating of the security, may cause the Fund to exceed or fall short of the Percentage Restriction. If this happens, the Fund’s continued holding of the security will not constitute a violation of the Percentage Restriction.
Definitions: **The Russell 2000® Index measures the performance of the 2,000 smallest companies in the Russell 3000® Index, which represents approximately 8% of the total market capitalization of the Russell 3000® Index. The Lipper Mid-Cap Growth Funds Index is the average of the 30 largest funds in the Lipper Mid-Cap Growth Funds Category. Source of the Russell Index data is Standard & Poor’s Micropal. Source of the Lipper Index data is Lipper. It is not possible to invest directly in an index.
5
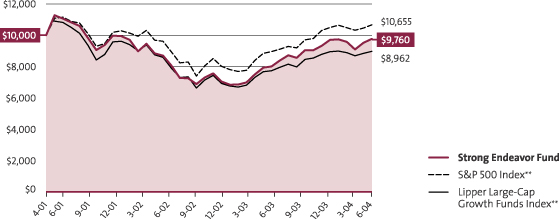
During the first half of 2004, the Strong Endeavor Fund gained 4.72%, outpacing its broad-based benchmark, the S&P 500 Index, which rose 3.44%. During the year, the Endeavor Fund was positioned in companies that were poised to deliver strong profit growth relative to the broad market. Specifically, the Fund’s strong returns were driven by holdings in the industrial, health care, and information technology sectors.
“Surrounding” our investments
Our approach to portfolio management relies on the careful selection of individual securities through collaborative research. We strive to “surround” each company that we consider for investment. In other words, our team of portfolio managers and analysts interviews not only the company’s management, but also its competitors, suppliers, and customers. We want to acquire unique insights to support — or reject, in the cases of companies that do not meet our strict requirements — our investment thesis for each individual stock.
Our investment process also emphasizes financial analysis, including a careful review of corporate income statements as well as the assets on corporate balance sheets. We believe that a company’s balance sheet provides the best way to forecast that business’s future results. We are especially interested in determining the sources of revenue and earnings. We also pay close attention to cash flow and how much investment will be required to generate future cash flow and earnings growth.
Opportunities in Teva and Tyco
Applying our approach, we reviewed a number of potential investment opportunities in the health care sector during the period. As our research progressed, we became concerned about the lack of new products forthcoming by many large-cap pharmaceutical companies, as well as the considerable number of drugs due to lose their patent protection in the near future. Accordingly, we maintained little exposure to these “name-brand” pharmaceutical businesses. Instead we built a position in Teva Pharmaceutical, the world’s leading developer and manufacturer of generic drugs as well as a supplier of a growing line of branded drugs.
We believed Teva had an outstanding competitive position, as the company dominated the generic drug market in the United States. In addition, Teva’s management team has shown a consistent ability to execute its business strategy, made evident by the company’s track record of stable and diversified earnings. Furthermore, Teva has an impressive pipeline of upcoming products, with over 80 applications for new drugs pending regulatory approval in the U.S. alone. The company also has shown success with its branded drug offerings, such as Copaxone, well on its way to becoming the leading treatment for multiple sclerosis in the United States. Thanks to these strong business trends, Teva has been able to produce solid revenue and earnings growth, and the stock was a significant contributor to the Fund’s performance during the past six months.
We used a similarly careful analysis to increase our position in Tyco International, a company recently beset by a number of questions about its accounting and corporate governance practices. We started evaluating Tyco after the company installed a new senior management team. Soon, we began to see evidence of a significant cultural and financial transformation. Thanks to its new leadership, Tyco has moved from a struggling organization into a company that is increasingly recognized for its impressive cash-flow-generation potential. We grew confident in Tyco’s ability to generate growth through its market-leading positions in health care, fire and security products, and electronics. During the past six months, our position in this stock provided a strong contribution to the Fund’s returns.
Market shift ahead?
We are looking for the second half of 2004 to be a more challenging environment for the market than the first half was. As corporate profits continue to grow, the rate of growth will eventually slow down as companies find it more difficult to surpass prior results. Also, the expectation for further increases in interest rates will place a cap on equity valuations — leaving only limited additional upside potential, in our view. In this environment, we expect the market to begin to reward higher-quality companies with highly predictable earnings and recurring revenues.
Thank you for your investment in the Strong Endeavor Fund. We sincerely appreciate the trust you have placed in us.
Thomas J. Pence
Portfolio Manager
6
Fund Highlights
Average Annual Total Returns
As of 6-30-04
Investor Class | |||
1-year | 22.00 | % | |
Since Fund Inception (4-6-01) | –0.75 | % |
Performance is historical and does not guarantee future results. Investment returns and principal value will fluctuate, and you may have a gain or loss when you sell shares. Current performance may be lower or higher than the quoted performance. Call us or visit www.Strong.com for the most recent month-end performance.
Risks: Stock funds should only be considered for long-term goals as values fluctuate in response to the activities of individual companies and general market and economic conditions.
Growth of an Assumed $10,000 Investment†
from 4-6-01 to 6-30-04
Mention of specific securities in this report is not indicative of whether the Fund may make additional purchases of, sell all or a portion of, or continue to hold those securities.
| * | The Morningstar Style BoxTM reveals a fund’s investment strategy. For equity funds, the vertical axis shows the market capitalization of the stocks owned and the horizontal axis shows investment style (value, blend, or growth). |
| † | This graph, provided in accordance with SEC regulations, compares a $10,000 investment in the Fund, made at its inception, with a similar investment in the S&P 500 Index and the Lipper Large-Cap Growth Funds Index. Results include the reinvestment of all dividends and capital gains distributions. The graph and the Average Annual Total Returns table do not reflect the deduction of taxes, if any, that a shareholder would pay on Fund distributions or the redemption of Fund shares. To equalize time periods, the indices’ performances were prorated for the month of April 2001. |
Fee Waivers: From time to time, the Fund’s advisor and/or administrator has waived fees and/or absorbed Fund expenses, which has resulted in higher returns. As of 6-30-04, there are waivers and/or absorptions in effect.
Percentage Restrictions: The Fund’s prospectus and statement of additional information may describe restrictions on the percentage of a particular type or quality of security in which the Fund may invest (“Percentage Restrictions”). Percentage Restrictions apply at the time the Fund purchases a security. Circumstances subsequent to the purchase of the security, such as a change in: (1) the Fund’s assets (e.g., due to cash inflows and redemptions); (2) the market value of the security; or (3) the pricing, liquidity, or rating of the security, may cause the Fund to exceed or fall short of the Percentage Restriction. If this happens, the Fund’s continued holding of the security will not constitute a violation of the Percentage Restriction.
Definitions: **The S&P 500 Index consists of 500 stocks chosen for market size, liquidity, and industry group representation. It is a market value weighted index (stock price times number of shares outstanding), with each stock’s weight in the Index proportionate to its market value. The Lipper Large-Cap Growth Funds Index is the average of the 30 largest funds in the Lipper Large-Cap Growth Funds Category. Source of the S&P Index data is Standard & Poor’s Micropal. Source of the Lipper Index data is Lipper.
It is not possible to invest directly in an index.
7
The first half of 2004 ended on a positive note for investors in the Strong Large Cap Growth Fund. The Fund performed in line with its broad-based benchmark, the S&P 500 Index. For the six months ended June 30, 2004, the Fund posted a return of 3.34%, while the Index returned 3.44%.
Gains were moderate
Larger cap stocks traded in a narrow range over the past six months as the market digested its healthy gains from 2003. Concerns about higher interest rates, rising energy prices, and the Iraqi conflict have kept a lid on stock returns this year, despite the positive backdrop of rising corporate profits and the continued strength of the U.S. economy.
Large-capitalization growth stocks, which have lagged other segments of the market for the past few years, started to show some relative performance improvement versus smaller and more value-oriented stocks in the last few months of the period, though smaller stocks still outperformed for the period overall.
Investment criteria focus on fundamentals
Our investment philosophy in managing the Fund is to focus on large-capitalization growth companies that are dominant or gaining share in their respective industries, are in a sector where business conditions are strong, and have the management talent to sustain their earnings growth for the foreseeable future. We research these companies through traditional fundamental analysis of corporate financial statements and industry statistics, as well as with face-to-face meetings with management. On a similar note, decisions to sell a stock are usually based on indications of deteriorating business fundamentals, changes in management, or both.
We believe dynamic and visionary CEOs are critical to the success of large companies. Without them, it is too easy for bureaucracy and the “law of large numbers” to create significant growth barriers for organizations as they can be hampered by their sheer size. We also try to invest in those areas of the economy that have the benefit of broad, secular tailwinds that can help companies to grow their earnings at faster rates than the overall economy. Four companies from very different industries — Internet leader Yahoo!, retailer Target, consumer products giant Procter and Gamble, and orthopedic products maker Zimmer Holdings — all exemplify the attributes that we seek. These dominant, well-managed growth companies were among the Fund’s stronger-performing stocks for the first half of 2004.
A positive economic backdrop
We anticipate that, in the coming months, the U. S. economy will be able to maintain its ocean liner-like momentum. Although interest rates and inflation are rising, they should remain moderately low by historical standards. We also believe employment figures should continue to improve, as companies gain further confidence in the sustainability of the current economic expansion and add more workers to their payrolls.
Against that backdrop, we would expect that stock performance should be in line with earnings-growth rates. We continue to favor those companies that can benefit most from economic expansion, particularly those in the technology, industrial, and consumer discretionary sectors. We also have a modest emphasis on energy-related companies that we believe can show strong earnings growth due to higher oil and gas prices.
As always, we will continue to stay true to our investment process and discipline. Thank you for the trust and confidence you have placed in the Strong Large Cap Growth Fund.
Bruce C. Olson
Portfolio Manager
8
Fund Highlights
Average Annual Total Returns
As of 6-30-04
Investor Class | |||
1-year | 15.35 | % | |
5-year | –5.73 | % | |
10-year | 7.82 | % | |
Since Fund Inception (12-30-81) | 11.71 | % |
Performance is historical and does not guarantee future results. Investment returns and principal value will fluctuate, and you may have a gain or loss when you sell shares. Current performance may be lower or higher than the quoted performance. Call us or visit www.Strong.com for the most recent month-end performance.
Risks: Stock funds should only be considered for long-term goals as values fluctuate in response to the activities of individual companies and general market and economic conditions.
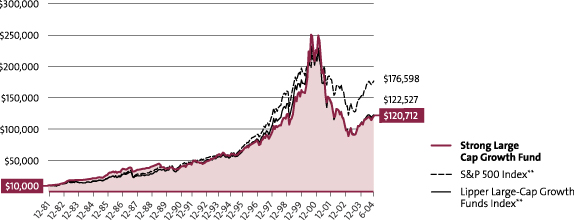
Growth of an Assumed $10,000 Investment†
from 12-30-81 to 6-30-04
Mention of specific securities in this report is not indicative of whether the Fund may make additional purchases of, sell all or a portion of, or continue to hold those securities.
| * | The Morningstar Style BoxTM reveals a fund’s investment strategy. For equity funds, the vertical axis shows the market capitalization of the stocks owned and the horizontal axis shows investment style (value, blend, or growth). |
| † | This graph, provided in accordance with SEC regulations, compares a $10,000 investment in the Fund, made at its inception, with the performance of the S&P 500 Index and the Lipper Large-Cap Growth Funds Index. Results include the reinvestment of all dividends and capital gains distributions. The graph and the Average Annual Total Returns table do not reflect the deduction of taxes, if any, that a shareholder would pay on Fund distributions or the redemption of Fund shares. |
Fee Waivers: From time to time, the Fund’s advisor and/or administrator has waived fees and/or absorbed Fund expenses, which has resulted in higher returns. As of 6-30-04, there are waivers and/or absorptions in effect.
Percentage Restrictions: The Fund’s prospectus and statement of additional information may describe restrictions on the percentage of a particular type or quality of security in which the Fund may invest (“Percentage Restrictions”). Percentage Restrictions apply at the time the Fund purchases a security. Circumstances subsequent to the purchase of the security, such as a change in: (1) the Fund’s assets (e.g., due to cash inflows and redemptions); (2) the market value of the security; or (3) the pricing, liquidity, or rating of the security, may cause the Fund to exceed or fall short of the Percentage Restriction. If this happens, the Fund’s continued holding of the security will not constitute a violation of the Percentage Restriction.
Definitions: **The S&P 500 Index consists of 500 stocks chosen for market size, liquidity, and industry group representation. It is a market value weighted index (stock price times number of shares outstanding), with each stock’s weight in the Index proportionate to its market value. The Lipper Large-Cap Growth Funds Index is the average of the 30 largest funds in the Lipper Large-Cap Growth Funds Category. Source of the S&P Index data is Standard & Poor’s Micropal. Source of the Lipper Index data is Lipper.
It is not possible to invest directly in an index.
9
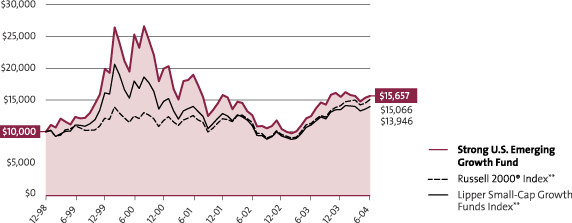
Strong U.S. Emerging Growth Fund
After a very strong year for the Fund in 2003, the first half of 2004 was more difficult. For the six months ended June 30, 2004, the Strong U.S. Emerging Growth Fund returned 1.01%, placing it behind its broad-based benchmark, the Russell 2000 Index, which returned 6.76% for the same period. The Fund’s underperformance occurred primarily in the year’s first quarter. During the second quarter, the Fund’s performance was more closely in line with the benchmark’s.
Factors in our performance
There were two primary factors driving the Fund’s under-performance. The first reason was tied to the overall state of the economy. There was a general contraction of stock valuations that took place in January and February, as weak economic data caused many investors to question the strength of the recovery and thus, to lose some confidence in stocks’ growth prospects. Then, in the second quarter, the economy began to pick up steam. In response, the Federal Reserve signaled that it was ready to raise short-term interest rates to help keep the economy from overheating and to help keep inflation in check. Higher interest rates have traditionally hurt the fastest-growing companies — the type we favor for this portfolio — the most.
The other reason for the Fund’s underperformance was a result of certain stock selections we made with respect to our investment in the hospice services area, which accounted for two of our largest positions. One company that provided tremendous returns last year, Odyssey HealthCare, unexpectedly lowered its guidance on its fourth-quarter earnings. This event hurt not only this company’s stock price, but also those of other companies in the industry. The cost to our overall returns was almost two full percentage points. We have subsequently sold both of our holdings in this area, as the outlook remains uncertain.
On a broader note, the highest-growth areas of the market, such as technology, significantly underperformed more defensive sectors, such as energy. On the whole, value style stocks outperformed growth stocks.
Positioned for a stronger economy
Entering 2004, we did not make any substantial changes to our overall positioning from 2003; the portfolio remained poised to benefit from an improving business environment and increasing consumer confidence. This positioning appears to still be appropriate, as we are now seeing an American economy that continues to gain strength. Despite sluggish job growth early in 2004, recent data indicated the economy added more than 300,000 jobs in March alone. This continued into the second quarter.

Manufacturing orders and retail spending have also been strong so far this year. The vast majority of companies with which we spoke expressed solid optimism about their businesses. Although the potential for further interest-rate increases during the year remains, we believe this trend presents limited risk to the companies in the portfolio. This is because we look for companies with little debt, and we have also significantly underweighted stocks from the financial sector compared to the Russell 2000 index, which could face the most volatility from rising rates. In the short term, it is true that some stocks may fluctuate in value due to interest-rate concerns. In the longer view, however, we believe profit growth ultimately drives stock performance, and that this Fund’s portfolio of high-quality, fast-growing companies should be able to do well in this environment.
Our outlook for the second half
Now that the Federal Reserve has raised short-term rates, we think the worst of the resulting volatility is behind us. Normally, small-cap growth stocks appreciate in value after one or two Federal Reserve rate hikes — and we think that is all it will take to cool down the economy. We expect to see strong corporate earnings in the upcoming quarters as well. Given that we believe many stocks have been taken down to reasonable valuations, such earnings improvements could help to drive their prices higher, which may help the small-cap growth sector to perform well in the second half of the year.
Thank you for your investment in the Strong U.S. Emerging Growth Fund.
| Thomas L. Press |
| Portfolio Co-Manager |
| Donald M. Longlet |
| Portfolio Co-Manager |
| Robert E. Scott |
| Portfolio Co-Manager |
10
Fund Highlights
Average Annual Total Returns
As of 6-30-04
Investor Class | |||
1-year | 25.63 | % | |
5-year | 4.89 | % | |
Since Fund Inception (12-31-98) | 8.50 | % |
Performance is historical and does not guarantee future results. Investment returns and principal value will fluctuate, and you may have a gain or loss when you sell shares. Current performance may be lower or higher than the quoted performance. Call us or visit www.Strong.com for the most recent month-end performance.
Risks: Stock funds should only be considered for long-term goals as values fluctuate in response to the activities of individual companies and general market and economic conditions.
Because smaller companies often have narrower markets and limited financial resources, investments in these stocks present more risk than investments in those of larger, more established companies.
Growth of an Assumed $10,000 Investment†
from 12-31-98 to 6-30-04
Mention of specific securities in this report is not indicative of whether the Fund may make additional purchases of, sell all or a portion of, or continue to hold those securities.
| * | The Morningstar Style Box™ reveals a fund’s investment strategy. For equity funds, the vertical axis shows the market capitalization of the stocks owned and the horizontal axis shows investment style (value, blend, or growth). |
| † | This graph, provided in accordance with SEC regulations, compares a $10,000 investment in the Fund, made at its inception, with the performance of the Russell 2000® Index and the Lipper Small-Cap Growth Funds Index. Results include the reinvestment of all dividends and capital gains distributions. The graph and the Average Annual Total Returns table do not reflect the deduction of taxes, if any, that a shareholder would pay on Fund distributions or the redemption of Fund shares. |
Performance Information: From time to time, the Fund’s performance was significantly enhanced through investments in initial public offerings (IPOs). In addition, the effect of IPOs purchased when the Fund’s asset base was small may have been magnified. Given these circumstances, you should not expect that such enhanced returns can be consistently achieved. Please consider this before investing.
Fee Waivers: From time to time, the Fund’s advisor and/or administrator has waived fees and/or absorbed Fund expenses, which has resulted in higher returns. As of 6-30-04, there are waivers and/or absorptions in effect.
Percentage Restrictions: The Fund’s prospectus and statement of additional information may describe restrictions on the percentage of a particular type or quality of security in which the Fund may invest (“Percentage Restrictions”). Percentage Restrictions apply at the time the Fund purchases a security. Circumstances subsequent to the purchase of the security, such as a change in: (1) the Fund’s assets (e.g., due to cash inflows and redemptions); (2) the market value of the security; or (3) the pricing, liquidity, or rating of the security, may cause the Fund to exceed or fall short of the Percentage Restriction. If this happens, the Fund’s continued holding of the security will not constitute a violation of the Percentage Restriction.
Definitions: **The Russell 2000® Index measures the performance of the 2,000 smallest companies in the Russell 3000® Index, which represents approximately 8% of the total market capitalization of the Russell 3000® Index. The Lipper Small-Cap Growth Funds Index is the average of the 30 largest funds in the Lipper Small-Cap Growth Funds Category. Source of the Russell Index data is Standard & Poor’s Micropal. Source of the Lipper Index data is Lipper. It is not possible to invest directly in an index.
11
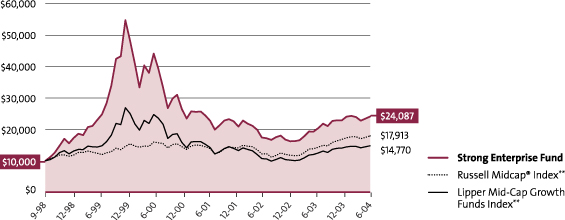
During the first half of 2004, the Strong Enterprise Fund Investor Class gained 5.28%. This return fell short of the Fund’s broad-based benchmark, the Russell Midcap Index, which advanced 6.67% during the same time frame.
The underperformance can be partly attributed to disappointing results from Select Medical, a health-care equipment company. The stock fell after the government proposed some changes to how health-care providers would be reimbursed for Medicare claims. In response to the decline, we sold our position in Select Medical during the period — though, unfortunately, not soon enough to avoid a negative impact on the portfolio. This negative influence was counterbalanced by positive performance from the Fund’s consumer discretionary holdings, which benefited from continued strength in consumer spending.
Reduced gains in 2004
Continued growth in corporate profits and operating margins helped support further increases in stock prices during the first six months of 2004, although these gains were much less robust than those realized in 2003. As the stock recovery continued to take hold, investors began to look ahead to the potential for higher interest rates, more inflation, and continued high energy prices — all factors that could limit equity returns in the future. Interest rates were a particular concern; the threat of further rate hikes from the Federal Reserve Board kept a ceiling on corporate valuations, even as the companies reported solid first-quarter profits.
Thorough company research
Our approach to portfolio management relies on the careful selection of individual securities through collaborative research. We strive to “surround” each company that we consider for investment. In other words, our team of portfolio managers and analysts interviews not only the companies’ management, but also their competitors, suppliers, and customers. We want to acquire unique insights to support — or reject, in the cases of companies that fail to meet our strict requirements — our investment thesis for each individual stock.
Applying this approach, the Fund continued to benefit from a position in Harman International, which develops high-fidelity audio products and electronic systems for consumers and businesses. Our research led us to Harman almost two years ago, as the company was delivering multimedia and “infotainment” systems to BMW and other auto manufacturers. In recent years, automakers have responded to consumer demand by incorporating an increasing number of multimedia applications in vehicles. Since our original identification of Harman as a solid growth business, the company has continued to expand its product lineup and serve a growing roster of impressive clients — including Mercedes, BMW, Audi, Porsche, and Chrysler — with highly profitable infotainment systems.
Another important holding for the Fund was Crown Castle International, which owns and leases towers and transmission networks for wireless communications systems. Our industry research revealed that wireless carriers have two top priorities: 1) improving the voice quality on their communications networks; and 2) rolling out next-generation networks to enable subscribers to access online services at high speeds. Competition between carriers has become increasingly fierce, however, and as the companies acquire more customers, they must continue to upgrade and expand their networks to meet the increased demand. We believed that Crown Castle was in a strong position to capitalize on these trends. As the nation’s second largest wireless tower operator, the company has a presence in nearly three-quarters of the 100 largest markets in the United States. During the period, Crown Castle’s strong competitive position led to impressive growth in the company’s free-cash flow (cash flow after expenses).
Future challenges
Although corporate earnings and profitability are expected to continue to rise, we believe that stock valuations are already reflecting these likely trends. Thus, we are looking for gains from this point to be produced by a select group of high-quality stocks with predictable earnings. Against this backdrop, we plan to focus on companies with opportunities to reinvest in their core business, which will drive stable revenue and profit growth, and show the ability to keep prices high in a competitive business environment.
Thank you for your investment in the Strong Enterprise Fund. We appreciate the trust you have placed in our team.
Thomas J. Pence |
Portfolio Manager |
12
Fund Highlights
Average Annual Total Returns
As of 6-30-04
Investor Class | |||
1-year | 25.03 | % | |
5-year | 3.05 | % | |
Since Fund Inception (9-30-98) | 16.53 | % | |
Institutional Class1 | |||
1-year | 26.12 | % | |
5-year | 3.22 | % | |
Since Fund Inception (9-30-98) | 16.70 | % | |
Advisor Class2 | |||
1-year | 25.38 | % | |
5-year | 3.04 | % | |
Since Fund Inception (9-30-98) | 16.47 | % | |
Class K3 | |||
1-year | 25.80 | % | |
5-year | 3.30 | % | |
Since Fund Inception (9-30-98) | 16.77 | % | |
Performance is historical and does not guarantee future results. Investment returns and principal value will fluctuate, and you may have a gain or loss when you sell shares. Current performance may be lower or higher than the quoted performance. Call us or visit www.Strong.com for the most recent month-end performance.
Risks: Stock funds should only be considered for long-term goals as values fluctuate in response to the activities of individual companies and general market and economic conditions.
Because smaller companies often have narrower markets and limited financial resources, investments in these stocks present more risk than investments in those of larger, more established companies.
Growth of an Assumed $10,000 Investment
from 9-30-98 to 6-30-04
Mention of specific securities in this report is not indicative of whether the Fund may make additional purchases of, sell all or a portion of, or continue to hold those securities.
| * | The Morningstar Style Box™ reveals a fund’s investment strategy. For equity funds, the vertical axis shows the market capitalization of the stocks owned and the horizontal axis shows investment style (value, blend, or growth). |
| † | This graph, provided in accordance with SEC regulations, compares a $10,000 investment in the Fund, made at its inception, with the performance of the Russell Midcap® Index and the Lipper Mid-Cap Growth Funds Index. Results include the reinvestment of all dividends and capital gains distributions. The graph and the Average Annual Total Returns table do not reflect the deduction of taxes, if any, that a shareholder would pay on Fund distributions or the redemption of Fund shares. This graph is based on Investor Class shares only; performance for other classes will vary due to differences in fee structures. |
Performance Information: 1The performance of the Institutional Class shares prior to 6-30-03 is based on the Fund’s Investor Class shares’ performance.
2The performance of the Advisor Class shares prior to 2-24-00 is based on the Fund’s Investor Class shares’ performance, restated for the higher expense ratio of the Advisor Class shares.
3The performance of the Class K shares prior to 8-30-02 is based on the Fund’s Investor Class shares’ performance, and has not been restated for the lower expense ratio of the Class K shares.
Please consult a prospectus for information about all share classes.
Fee Waivers: From time to time, the Fund’s advisor and/or administrator has waived fees and/or absorbed Fund expenses, which has resulted in higher returns. As of 6-30-04, there are waivers and/or absorptions in effect.
Percentage Restrictions: The Fund’s prospectus and statement of additional information may describe restrictions on the percentage of a particular type or quality of security in which the Fund may invest (“Percentage Restrictions”). Percentage Restrictions apply at the time the Fund purchases a security. Circumstances subsequent to the purchase of the security, such as a change in: (1) the Fund’s assets (e.g., due to cash inflows and redemptions); (2) the market value of the security; or (3) the pricing, liquidity, or rating of the security, may cause the Fund to exceed or fall short of the Percentage Restriction. If this happens, the Fund’s continued holding of the security will not constitute a violation of the Percentage Restriction.
Definitions: **The Russell Midcap® Index measures the performance of the 800 smallest companies in the Russell 1000® Index, which represent approximately 26% of the total market capitalization of the Russell 1000® Index. The Lipper Mid-Cap Growth Funds Index is the average of the 30 largest funds in the Lipper Mid-Cap Growth Funds Category. Source of the Russell Index data is Standard & Poor’s Micropal. Source of the Lipper Index data is Lipper. It is not possible to invest directly in an index.
13
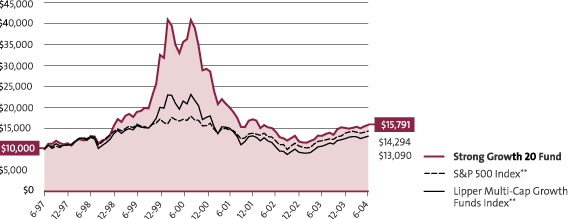
The Strong Growth 20 Fund recorded positive performance for the first half of 2004, outperforming its broad-based benchmark, the S&P 500 Index. For the six months ended June 30, 2004, the Fund’s Investor Class shares returned 4.86%, while the S&P 500 Index returned 3.44% for the same period. The Fund was able to achieve this performance even though the value style of investing slightly outperformed the Fund’s growth style over the six months.
Internet and energy played a large role
The outperformance of the Strong Growth 20 Fund was driven primarily by its exposure to Internet-related companies, which represent one of the fastest-growing segments of the economy. During the period, the Fund held positions in such high-quality, fast-growing Internet-related stocks including eBay, Yahoo!, and Ask Jeeves.
Energy stocks also made a meaningful, positive contribution to the Fund’s performance. Such holdings as Ultra Petroleum and BJ Services Company were positioned to benefit from the high energy prices we saw during the first half of 2004. Ultra Petroleum, an exploration and production company, also benefited from its industry-leading natural gas production growth rate. Importantly, we expect their powerful volume growth to continue for several more quarters, driven by the strength of its drilling prospects and management’s solid track record of execution.
Among the areas of investment that were weaker for the Fund for the six months were homebuilding, generic drugs, software, and communications.
Studying companies closely
We believe that earnings and revenue growth are key factors in determining stock prices. We, therefore, focus a great deal of our stock-selection process on finding stocks that are experiencing — or have solid potential to experience — above-average growth in revenue and earnings. While identifying stocks that are experiencing this growth is essential, what matters even more in our investment strategy is determining which companies have growth trends that are sustainable, and which will only be short-lived.
To sort out the long-term winners from the disappointments, we employ thorough, hands-on research. We specifically focus on a company’s history of success in executing its strategy and the potential profitability of its business model. We also carefully consider whether the company’s strategy and operations mesh well with our overall economic view, and if it is being helped or hurt by any broader secular trends.
When we decide to sell a stock, our decision-making criteria are essentially the opposite of our buying criteria. We may sell a stock when we see deterioration in its fundamental qualities that may threaten the sustainability of a company’s existing or prospective growth. Conditions that could give us grounds for concern may include, but are not limited to, changes we see in the economy, a new competitive threat, or a change in management personnel or direction.
Our approach to the second half
Our outlook for the next few months remains upbeat. We anticipate that interest rates and inflation will both remain relatively low, and that growth in jobs and corporate earnings are likely to remain at healthy levels. We expect to carefully monitor these factors. The outcome of the presidential election in November could have important investment implications, so we anticipate closely watching developments on that front. In the meantime, we intend to continue to seek out the fastest-growing companies we can identify that we believe fit within the framework of our investment process.
We thank you for your continued investment in the Strong Growth 20 Fund.
Brandon M. Nelson |
Portfolio Manager |
14
Fund Highlights
Average Annual Total Returns
As of 6-30-04
Investor Class | |||
1-year | 19.95 | % | |
5-year | –3.52 | % | |
Since Fund Inception (6-30-97) | 6.74 | % | |
Advisor Class1 | |||
1-year | 20.28 | % | |
5-year | – 3.48 | % | |
Since Fund Inception (6-30-97) | 6.70 | % | |
Performance is historical and does not guarantee future results. Investment returns and principal value will fluctuate, and you may have a gain or loss when you sell shares. Current performance may be lower or higher than the quoted performance. Call us or visit www.Strong.com for the most recent month-end performance.
Risks: Stock funds should only be considered for long-term goals as values fluctuate in response to the activities of individual companies and general market and economic conditions.
The Fund is nondiversified, meaning it may concentrate its assets in fewer individual holdings than a diversified fund. Therefore, the Fund is more exposed to individual stock volatility and market pressure than a fully diversified fund.
Growth of an Assumed $10,000 Investment†
from 6-30-97 to 6-30-04
Mention of specific securities in this report is not indicative of whether the Fund may make additional purchases of, sell all or a portion of, or continue to hold those securities.
| * | The Morningstar Style BoxTM reveals a fund’s investment strategy. For equity funds, the vertical axis shows the market capitalization of the stocks owned and the horizontal axis shows investment style (value, blend, or growth). |
| † | This graph, provided in accordance with SEC regulations, compares a $10,000 investment in the Fund, made at its inception, with the performance of the S&P 500 Index and the Lipper Multi-Cap Growth Funds Index. Results include the reinvestment of all dividends and capital gains distributions. The graph and the Average Annual Total Returns table do not reflect the deduction of taxes, if any, that a shareholder would pay on Fund distributions or the redemption of Fund shares. This graph is based on Investor Class shares only; performance for other classes will vary, due to differences in fee structures. |
Performance Information: 1The performance of the Advisor Class shares prior to 2-24-00 is based on the Fund’s Investor Class shares’ performance, restated for the higher expense ratio of the Advisor Class shares.
Please consult a prospectus for information about all share classes.
From time to time, the Fund’s performance was significantly enhanced through investments in initial public offerings (IPOs). In addition, the effect of IPOs purchased when the Fund’s asset base was small may have been magnified. Given these circumstances, you should not expect that such enhanced returns can be consistently achieved. Please consider this before investing.
Fee Waivers: From time to time, the Fund’s advisor and/or administrator has waived fees and/or absorbed Fund expenses, which has resulted in higher returns. As of 6-30-04, there are waivers and/or absorptions in effect.
Percentage Restrictions: The Fund’s prospectus and statement of additional information may describe restrictions on the percentage of a particular type or quality of security in which the Fund may invest (“Percentage Restrictions”). Percentage Restrictions apply at the time the Fund purchases a security. Circumstances subsequent to the purchase of the security, such as a change in: (1) the Fund’s assets (e.g., due to cash inflows and redemptions); (2) the market value of the security; or (3) the pricing, liquidity, or rating of the security, may cause the Fund to exceed or fall short of the Percentage Restriction. If this happens, the Fund’s continued holding of the security will not constitute a violation of the Percentage Restriction.
Definitions: **The S&P 500 Index consists of 500 stocks chosen for market size, liquidity, and industry group representation. It is a market value weighted index (stock price times number of shares outstanding), with each stock’s weight in the Index proportionate to its market value. The Lipper Multi-Cap Growth Funds Index is the average of the 30 largest funds in the Lipper Multi-Cap Growth Funds Category. Source of the S&P Index data is Standard & Poor’s Micropal. Source of the Lipper Index data is Lipper. It is not possible to invest directly in an index.
15
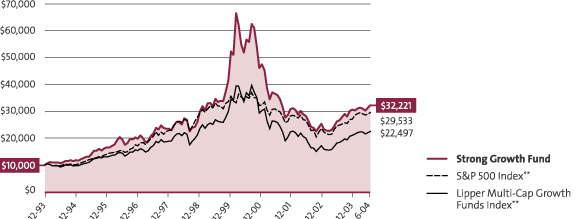
The Strong Growth Fund had a good start to the year, with the Investor Class shares posting a return of 6.40% for the six months ended June 30, 2004. For the same period, its broad-based benchmark, the S&P 500 Index, returned 3.44%.
Taking advantage of a dynamic market
The strongest impact on the market during the first half of the period was continued greater than anticipated corporate earnings growth. Fortunately, the Fund was positioned to benefit from this occurrence. The other main variable influencing the market during the first half was the anticipation of the Federal Reserve’s reversal of its current accommodative short-term, interest-rate stance. We feel the portfolio was positioned for this occurrence.
The Fund continued to have strong allocations in economically sensitive sectors such as technology and in specific long-term growth opportunities tied to the consumer. We continued to research and explore opportunities in the health care sector, but have found many of the larger capitalization stocks to have lackluster growth prospects.
While value styles did outperform growth in the period, we were able to benefit from opportunistic investments in equities of high-quality, fast-growing growth stocks.
Research nets Yahoo!
Stock specific proprietary research continues to be at the heart of our portfolio process. We devote many hours to screening for the fastest growing public companies in the economy that also provide for the best chances for sustained growth. Once we identify these companies on paper, we hit the phones and the road to accumulate data from meetings and conversations with the companies themselves, their customers, their suppliers, and their competitors.
Sometimes a better investment idea comes from this confirmatory research than the original stock idea that generated the analysis. Once a stock makes it into the portfolio this process doesn’t halt, it is dynamic. We constantly research to recheck our theses, while taking into account the opportunity cost of not owning other growth stocks. We do not ignore the macros as they can provide strong headwinds or tailwinds to company-specific growth. We also monitor our portfolio risk on many levels, including sector allocations.
Yahoo! is a good example of the fruits of this process. It addresses a growth area in the economy. It is taking market share within its industry. Moreover, its growth prospects have been continually underestimated. While doing research on Yahoo!’s growth opportunities and the duration of that growth, we have found other exciting growth stocks to add to the portfolio.
Looking ahead to the second half
Our near-term outlook can be described as opportunistically optimistic. While we expect short-term interest rates to rise to a more historic level, we are encouraged that the yield curve remains steep, signaling the market’s expectations for continued economic growth. Within this pretext there are plenty of exciting opportunities to invest in growth stocks. We thank you for your continued support and investment.
Thomas C. Ognar
Portfolio Manager
16
Fund Highlights
Average Annual Total Returns
As of 6-30-04
Investor Class | |||
1-year | 20.89 | % | |
5-year | –1.43 | % | |
10-year | 11.72 | % | |
Since Fund Inception (12-31-93) | 11.79 | % | |
Institutional Class1 | |||
1-year | 21.56 | % | |
5-year | – 0.87 | % | |
10-year | 12.04 | % | |
Since Fund Inception (12-31-93) | 12.10 | % | |
Advisor Class2 | |||
1-year | 20.73 | % | |
5-year | –1.59 | % | |
10-year | 11.46 | % | |
Since Fund Inception (12-31-93) | 11.53 | % | |
Class C3 | |||
1-year | 18.64 | % | |
5-year | –2.46 | % | |
10-year | 10.47 | % | |
Since Fund Inception (12-31-93) | 10.53 | % | |
Class K4 | |||
1-year | 21.41 | % | |
5-year | –1.16 | % | |
10-year | 11.87 | % | |
Since Fund Inception (12-31-93) | 11.94 | % | |
Performance is historical and does not guarantee future results. Investment returns and principal value will fluctuate, and you may have a gain or loss when you sell shares. Current performance may be lower or higher than the quoted performance. Call us or visit www.Strong.com for the most recent month-end performance.
Risks: Stock funds should only be considered for long-term goals as values fluctuate in response to the activities of individual companies and general market and economic conditions.
Growth of an Assumed $10,000 Investment†
from 12-31-93 to 6-30-04
Mention of specific securities in this report is not indicative of whether the Fund may make additional purchases of, sell all or a portion of, or continue to hold those securities.
| * | The Morningstar Style BoxTM reveals a fund’s investment strategy. For equity funds, the vertical axis shows the market capitalization of the stocks owned and the horizontal axis shows investment style (value, blend, or growth). |
| † | This graph, provided in accordance with SEC regulations, compares a $10,000 investment in the Fund, made at its inception, with the performance of the S&P 500 Index and the Lipper Multi-Cap Growth Funds Index. Results include the reinvestment of all dividends and capital gains distributions. The graph and the Average Annual Total Returns table do not reflect the deduction of taxes, if any, that a shareholder would pay on Fund distributions or the redemption of Fund shares. This graph is based on Investor Class shares only; performance for other classes will vary due to differences in fee structures. |
Performance Information: 1The performance of the Institutional Class shares prior to 2-24-00 is based on the Fund’s Investor Class shares’ performance, and has not been restated for the lower expense ratio of the Institutional Class shares.
2The performance of the Advisor Class shares prior to 2-24-00 is based on the Fund’s Investor Class shares’ performance, restated for the higher expense ratio of the Advisor Class shares.
3The performance of Class C shares prior to 12-26-02 is based on the Fund’s Investor Class shares’ performance, restated for the higher expense ratio of the Class C shares. Average annual total returns include a 1.00% contingent deferred sales charge imposed on redemptions made within 12 months of purchase.
4The performance of the Class K shares prior to 8-30-02 is based on the Fund’s Investor Class shares’ performance and has not been restated for the lower expense ratio of the Class K shares.
Please consult a prospectus for information about all share classes.
Fee Waivers: From time to time, the Fund’s advisor and/or administrator has waived fees and/or absorbed Fund expenses, which has resulted in higher returns. As of 6-30-04, there are waivers and/or absorptions in effect.
Percentage Restrictions: The Fund’s prospectus and statement of additional information may describe restrictions on the percentage of a particular type or quality of security in which the Fund may invest (“Percentage Restrictions”). Percentage Restrictions apply at the time the Fund purchases a security. Circumstances subsequent to the purchase of the security, such as a change in: (1) the Fund’s assets (e.g., due to cash inflows and redemptions); (2) the market value of the security; or (3) the pricing, liquidity, or rating of the security, may cause the Fund to exceed or fall short of the Percentage Restriction. If this happens, the Fund’s continued holding of the security will not constitute a violation of the Percentage Restriction.
Definitions: **The S&P 500 Index consists of 500 stocks chosen for market size, liquidity, and industry group representation. It is a market value weighted index (stock price times number of shares outstanding), with each stock’s weight in the Index proportionate to its market value. The Lipper Multi-Cap Growth Funds Index is the average of the 30 largest funds in the Lipper Multi-Cap Growth Funds Category. Source of the S&P Index data is Standard & Poor’s Micropal. Source of the Lipper Index data is Lipper.
It is not possible to invest directly in an index.
17
Strong Large Company Growth Fund
During the first half of 2004, the Strong Large Company Growth Fund gained 7.19%, decisively outpacing the Fund’s broad-based benchmark, the S&P 500 Index, which rose 3.44%. The Fund was invested in companies poised to deliver stronger earnings and cash flow growth than the broad stock market. The Fund’s returns were driven by strong stock selection within health care and information technology.
Uncovering investment opportunities
Our approach to portfolio management relies on the careful selection of individual securities through collaborative research. We strive to “surround” each company that we consider for investment. In other words, our team of portfolio managers and analysts interviews not only the company’s management, but also their competitors, suppliers, and customers. We want to acquire unique insights to support — or reject, in the cases of companies that fail to meet our strict requirements — our investment thesis for each individual stock.
Opportunities in Teva and Yahoo!
Applying our approach, we reviewed a number of potential investment opportunities in the health care sector during the period. As our research progressed, we became concerned about the lack of new products forthcoming by many large-cap pharmaceutical companies, as well as the considerable number of drugs due to lose their patent protection in the near future. Accordingly, we maintained little exposure to these “name-brand” pharmaceutical businesses. Instead we built a position in Teva Pharmaceutical, the world’s leading developer and manufacturer of generic drugs as well as a supplier of a growing line of branded drugs.
We believe Teva has an outstanding competitive position, as the company dominates the generic drug market in the United States. In addition, Teva’s management team has shown a consistent ability to execute its business strategy, made evident by the company’s track record of stable and diversified earnings. Furthermore, Teva has an impressive pipeline of upcoming products, with over 80 applications for new drugs pending regulatory approval in the U.S. alone. The company also has shown success with its branded drug offerings, such as Copaxone, well on its way to becoming the nation’s leading treatment for multiple sclerosis. Thanks to these strong business trends, Teva has been able to produce solid revenue and earnings growth, and the stock was a significant contributor to the Fund’s performance during the past six months.
We also built a position in Yahoo!, a provider of Internet consumer and business services. Yahoo!’s business strength is driven by branded advertising. Our research led us to conclude that many companies plan to increase advertising spending in the near future. In addition, corporations appear to be particularly attracted to Internet advertising, especially since consumers now view 15% of their media content online. More and more advertisers, in fact, have been looking to the Internet as an effective alternative to traditional television advertising, which has been hurt by declining ratings and the proliferation of digital video recorders.
At the time of our research, we saw Yahoo! as very well positioned to take advantage of this shift in advertising spending. With 40% of Internet users using Yahoo!’s search function, the company enjoys strong brand recognition and a large user base. Yahoo! also is beginning to realize the benefit of offering a full suite of advertising products, including increasingly lucrative “paid search” advertising. Finally, we believed Yahoo! could continue to benefit from growth opportunities overseas; the company has been investing heavily to enter and take market share from less-sophisticated, regional Internet portals.
High-quality companies may benefit
For the rest of 2004, we expect corporate profits to continue to grow, but at a slower pace than investors have been experiencing in recent quarters. We believe the expectation for higher interest rates is likely to put a cap on stock valuations. One potentially positive factor for continued earnings growth would be a return to high levels of business spending, which lagged far behind consumer spending during the recent economic downturn. Should growth overseas outpace that in the United States, and if foreign currencies continue to outpace the U.S. dollar, domestic companies with significant international sales should benefit. Against the current economic and market backdrop, we expect stock investors to begin to reward higher-quality companies with relatively predictable earnings and recurring revenues.
Thank you for your investment in the Strong Large Company Growth Fund. We sincerely appreciate the trust you have placed in us.
Thomas J. Pence
Portfolio Manager
18
Fund Highlights
Average Annual Total Returns
As of 6-30-04
Investor Class1 | |||
1-year | 19.73 | % | |
5-year | 5.81 | % | |
Since Inception (11-3-97) | 9.50 | % | |
Class K2 | |||
1-year | 20.32 | % | |
5-year | 5.91 | % | |
Since Inception (11-3-97) | 9.58 | % | |
Performance is historical and does not guarantee future results. Investment returns and principal value will fluctuate, and you may have a gain or loss when you sell shares. Current performance may be lower or higher than the quoted performance. Call us or visit www.Strong.com for the most recent month-end performance.
Risks: Stock funds should only be considered for long-term goals as values fluctuate in response to the activities of individual companies and general market and economic conditions.
Growth of an Assumed $10,000 Investment†
from 11-3-97 to 6-30-04
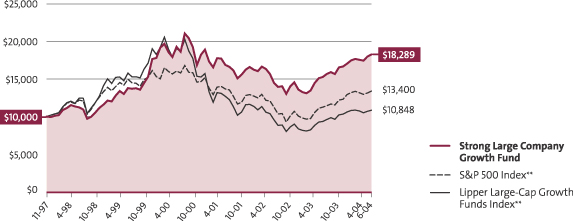
The Fund’s Investor Class has a redemption fee of 1.00% against shares that are held 360 calendar days or fewer after purchase. Performance data does not reflect the deduction of this fee, which, if reflected, would reduce performance.
Mention of specific securities in this report is not indicative of whether the Fund may make additional purchases of, sell all or a portion of, or continue to hold those securities.
| * | The Morningstar Style BoxTM reveals a fund’s investment strategy. For equity funds, the vertical axis shows the market capitalization of the stocks owned and the horizontal axis shows investment style (value, blend, or growth). |
| † | This graph, provided in accordance with SEC regulations, compares a $10,000 investment in the Fund, made at its inception, with the performance of the S&P 500 Index and the Lipper Large-Cap Growth Funds Index. Results include the reinvestment of all dividends and capital gains distributions. The graph and the Average Annual Total Returns table do not reflect the deduction of taxes, if any, that a shareholder would pay on Fund distributions or the redemption of Fund shares. This graph is based on the Investor Class shares only; performance for other classes will vary, due to differences in fee structures. To equalize time periods, the indices’ performances were prorated for the month of November 1997. |
Performance Information: 1The performance of the Investor Class prior to 9-16-02 is based on the performance of the Rockhaven Premier Dividend Fund (the predecessor Fund), and does not reflect the Fund’s maximum sales charge of 5.75%, which was charged from 9-17-99 through 9-13-02.
2The performance of the Class K shares prior to 6-30-03 is based on the performance of the Fund’s Investor Class or the Fund’s predecessor, the Rockhaven Premier Dividend Fund. The prior performance has not been restated for the lower expense ratio of the Class K shares and does not reflect the Fund’s maximum sales charge of 5.75% (charged from 9-17-99 through 9-13-02) or the Investor Class redemption fee.
The predecessor Fund’s investment strategy emphasized investments in convertible securities.
Please consult a prospectus for information about all share classes.
Fee Waivers: From time to time, the Fund’s advisor and/or administrator has waived fees and/or absorbed Fund expenses, which has resulted in higher returns. As of 6-30-04, there are waivers and/or absorptions in effect.
We have contractually agreed to waive fees and/or absorb expenses for an indefinite period of time to keep Total Annual Operating Expenses of the Large Company Growth Fund at no more than 1.50% for the Investor Class shares and 0.99% for the Class K shares. This contract may only be terminated by the Board of Directors of the Fund, but not before May 1, 2005.
Percentage Restrictions: The Fund’s prospectus and statement of additional information may describe restrictions on the percentage of a particular type or quality of security in which the Fund may invest (“Percentage Restrictions”). Percentage Restrictions apply at the time the Fund purchases a security. Circumstances subsequent to the purchase of the security, such as a change in: (1) the Fund’s assets (e.g., due to cash inflows and redemptions); (2) the market value of the security; or (3) the pricing, liquidity, or rating of the security, may cause the Fund to exceed or fall short of the Percentage Restriction. If this happens, the Fund’s continued holding of the security will not constitute a violation of the Percentage Restriction.
Definitions: **The S&P 500 Index consists of 500 stocks chosen for market size, liquidity, and industry group representation. It is a market value weighted index (stock price times number of shares outstanding), with each stock’s weight in the Index proportionate to its market value. The Lipper Large-Cap Growth Funds Index is the average of the 30 largest funds in the Lipper Large-Cap Growth Funds Category. Source of the S&P 500 Index data is Standard & Poor’s Micropal. Source of the Lipper Index data is Lipper.
It is not possible to invest directly in an index.
19
| SCHEDULES OF INVESTMENTS IN SECURITIES | June 30, 2004 (Unaudited) |
Shares or Amount | Value (Note 2) | |||||
Common Stocks 97.7% | ||||||
Aerospace - Defense 3.0% | ||||||
General Dynamics Corporation | 45,200 | $ | 4,488,360 | |||
Apparel - Shoes & Related Manufacturing 2.1% | ||||||
NIKE, Inc. Class B | 42,700 | 3,234,525 | ||||
Auto Manufacturer 2.1% | ||||||
Toyota Motor Corporation Sponsored ADR | 38,400 | 3,134,208 | ||||
Banks - Money Center 4.5% | �� | |||||
Bank of America Corporation | 53,800 | 4,552,556 | ||||
Citigroup, Inc. | 49,100 | 2,283,150 | ||||
| 6,835,706 | ||||||
Building - Resident/Commercial 10.9% | ||||||
Centex Corporation | 66,300 | 3,033,225 | ||||
D.R. Horton, Inc. | 160,550 | 4,559,620 | ||||
Lennar Corporation Class A | 68,600 | 3,067,792 | ||||
Pulte Homes, Inc. | 114,100 | 5,936,623 | ||||
| 16,597,260 | ||||||
Computer - Local Networks 3.2% | ||||||
Cisco Systems, Inc. (b) | 203,900 | 4,832,430 | ||||
Computer Software - Desktop 3.0% | ||||||
Microsoft Corporation | 161,100 | 4,601,016 | ||||
Cosmetics - Personal Care 6.1% | ||||||
Avon Products, Inc. | 70,000 | 3,229,800 | ||||
LIFE TIME FITNESS, Inc. (b) | 300 | 6,300 | ||||
The Procter & Gamble Company | 109,600 | 5,966,624 | ||||
| 9,202,724 | ||||||
Diversified Operations 10.4% | ||||||
General Electric Company | 152,000 | 4,924,800 | ||||
3M Co. | 46,300 | 4,167,463 | ||||
Tyco International, Ltd. | 200,700 | 6,651,198 | ||||
| 15,743,461 | ||||||
Electronics - Semiconductor | ||||||
Manufacturing 2.9% | ||||||
Analog Devices, Inc. | 94,700 | 4,458,476 | ||||
Finance - Investment Brokers 2.8% | ||||||
The Goldman Sachs Group, Inc. | 45,500 | 4,284,280 | ||||
Food - Miscellaneous Preparation 2.2% | ||||||
PepsiCo, Inc. | 60,800 | 3,275,904 | ||||
Internet - E*Commerce 5.1% | ||||||
eBay, Inc. (b) | 84,700 | 7,788,165 | ||||
Internet - Internet Content 5.1% | ||||||
Yahoo! Inc. (b) | 213,800 | 7,767,354 | ||||
Medical - Biomedical/Biotechnology 2.3% | ||||||
Biogen Idec, Inc. (b) | 54,000 | 3,415,500 | ||||
Medical - Ethical Drugs 3.2% | ||||||
Pfizer, Inc. | 142,200 | 4,874,616 | ||||
Medical - Products 4.2% | ||||||
St. Jude Medical, Inc. (b) | 40,400 | 3,056,260 | ||||
Stryker Corporation | 59,000 | 3,245,000 | ||||
| 6,301,260 | ||||||
Medical/Dental - Supplies 2.2% | ||||||
Becton, Dickinson & Company | 63,700 | 3,299,660 | ||||
Metal Ores - Miscellaneous 2.2% | ||||||
Phelps Dodge Corporation (b) | 43,400 | 3,363,934 | ||||
Oil & Gas - International Integrated 4.1% | ||||||
ConocoPhillips | 81,900 | 6,248,151 | ||||
Oil & Gas - Refining/Marketing 3.4% | ||||||
Valero Energy Corporation | 69,300 | 5,111,568 | ||||
Oil & Gas - United States Exploration & | ||||||
Production 3.0% | ||||||
Burlington Resources, Inc. | 126,000 | 4,558,680 | ||||
Retail - Drug Stores 2.2% | ||||||
Walgreen Company | 93,000 | 3,367,530 | ||||
Retail - Home Furnishings 0.0% | ||||||
Design Within Reach, Inc. (b) | 300 | 4,929 | ||||
Retail/Wholesale - Building Products 1.8% | ||||||
Lowe’s Companies, Inc. | 53,000 | 2,785,150 | ||||
Telecommunications - Wireless | ||||||
Equipment 3.2% | ||||||
QUALCOMM, Inc. | 65,700 | 4,794,786 | ||||
Telecommunications - Wireless | ||||||
Services 2.5% | ||||||
Mobile Telesystems Sponsored ADR | 31,000 | 3,782,000 | ||||
Total Common Stocks (Cost $ 125,243,723) | 148,151,633 | |||||
Short-Term Investments (a) 0.6% | ||||||
Repurchase Agreements (c) | ||||||
State Street Bank (Dated 6/30/04), 0.75%, Due 7/01/04 (Repurchase proceeds $952,820); Collateralized by: United States Government & Agency Issues | $ | 952,800 | 952,800 | |||
Total Short-Term Investments (Cost $ 952,800) | 952,800 | |||||
Total Investments in Securities (Cost $126,196,523) 98.3% | 149,104,433 | |||||
Other Assets and Liabilities, Net 1.7% | 2,509,841 | |||||
Net Assets 100.0% | $ | 151,614,274 | ||||
| Shares or Principal Amount | Value (Note 2) | ||||
Common Stocks 95.4% | |||||
Apparel - Shoes & Related Manufacturing 1.2% | |||||
Genesco, Inc. (b) (d) | 85,800 | $ | 2,027,454 | ||
Auto/Truck - Original Equipment 0.9% | |||||
Eaton Corporation | 25,040 | 1,621,090 | |||
Building - Mobile/Manufacturers & RV 0.0% | |||||
Champion Enterprises, Inc. (b) (d) | 40 | 367 | |||
Commercial Services - Market Research 1.2% | |||||
Corporate Executive Board Company | 37,470 | 2,165,391 | |||
20
STRONG DISCOVERY FUND (continued)
| Shares or Principal Amount | Value (Note 2) | ||||
Commercial Services - Schools 2.2% | |||||
Career Education Corporation (b) | 13,440 | $ | 612,326 | ||
Corinthian Colleges, Inc. (b) | 76,600 | 1,895,084 | |||
Strayer Education, Inc. | 11,930 | 1,331,030 | |||
| 3,838,440 | |||||
Commercial Services - Security/Safety 0.6% | |||||
Armor Holdings, Inc. (b) (d) | 33,600 | 1,142,400 | |||
Commercial Services - Staffing 1.1% | |||||
Kforce.com, Inc. (b) | 206,842 | 1,952,589 | |||
Computer - Local Networks 2.3% | |||||
Polycom, Inc. (b) | 177,170 | 3,970,380 | |||
Computer - Manufacturers 1.7% | |||||
Apple Computer, Inc. (b) | 92,400 | 3,006,696 | |||
Computer Software - | |||||
Education/Entertainment 1.9% | |||||
Activision, Inc. (b) | 204,873 | 3,257,481 | |||
Computer Software - Enterprise 5.2% | |||||
Hyperion Solutions Corporation (b) | 40,900 | 1,788,148 | |||
Mercury Interactive Corporation (b) | 81,500 | 4,061,145 | |||
TIBCO Software, Inc. (b) (d) | 386,600 | 3,266,770 | |||
| 9,116,063 | |||||
Computer Software - Financial 0.8% | |||||
DST Systems, Inc. (b) | 27,600 | 1,327,284 | |||
Electronics - Semiconductor | |||||
Manufacturing 5.7% | |||||
Broadcom Corporation Class A (b) | 57,500 | 2,689,275 | |||
KLA - Tencor Corporation (b) | 29,400 | 1,451,772 | |||
Marvell Technology Group, Ltd. (b) | 138,200 | 3,689,940 | |||
Silicon Laboratories, Inc. (b) (d) | 45,000 | 2,085,750 | |||
| 9,916,737 | |||||
Financial Services - Miscellaneous 0.7% | |||||
Euronet Services, Inc. (b) (d) | 56,200 | 1,299,906 | |||
Household - Consumer Electronics 2.8% | |||||
Harman International Industries, Inc. | 53,870 | 4,902,170 | |||
Insurance - Property/Casualty/Title 2.6% | |||||
Endurance Specialty Holdings, Ltd. (d) | 77,900 | 2,710,920 | |||
ProAssurance Corporation (b) (d) | 52,030 | 1,774,743 | |||
| 4,485,663 | |||||
Internet-E*Commerce 2.4% | |||||
Getty Images, Inc. (b) | 21,800 | 1,308,000 | |||
Netflix, Inc. (b) (d) | 81,800 | 2,940,710 | |||
| 4,248,710 | |||||
Internet - Software 1.0% | |||||
OpenTV Corporation (b) (e) | 72,105 | 149,978 | |||
ValueClick, Inc. (b) | 133,100 | 1,594,538 | |||
| 1,744,516 | |||||
Leisure - Movies & Related 3.4% | |||||
Lions Gate Entertainment Corporation (b) | 852,270 | 5,948,845 | |||
Leisure - Products 1.9% | |||||
Multimedia Games, Inc. (b) (d) | 122,511 | 3,285,745 | |||
Leisure - Toys/Games/Hobby 2.0% | |||||
Marvel Enterprises, Inc. (b) (d) | 181,764 | 3,548,033 | |||
Media - Radio/TV 1.1% | |||||
The E.W. Scripps Company Class A | 19,125 | 2,008,125 | |||
Medical - Biomedical/Biotechnology 4.4% | |||||
Digene Corporation (b) | 84,523 | 3,087,625 | |||
Genzyme Corporation (b) | 39,600 | 1,874,268 | |||
Northfield Laboratories, Inc. (b) | 94,900 | 1,353,274 | |||
Sepracor, Inc. (b) (d) | 25,400 | 1,343,660 | |||
| 7,658,827 | |||||
Medical - Ethical Drugs 3.0% | |||||
Inspire Pharmaceuticals, Inc. (b) (d) | 160,190 | 2,678,377 | |||
Medicis Pharmaceutical Corporation Class A (d) | 65,600 | 2,620,720 | |||
| 5,299,097 | |||||
Medical - Genetics 0.6% | |||||
Millennium Pharmaceuticals, Inc. (b) | 78,490 | 1,083,162 | |||
Medical - Hospitals 1.5% | |||||
Community Health Systems, Inc. (b) | 96,890 | 2,593,745 | |||
Medical - Products 4.1% | |||||
American Medical Systems Holdings, Inc. (b) (d) | 80,500 | 2,712,850 | |||
Cyberonics, Inc. (b) (d) | 37,430 | 1,248,665 | |||
EPIX Medical, Inc. (b) | 50,800 | 1,071,880 | |||
Zimmer Holdings, Inc. (b) | 24,940 | 2,199,708 | |||
| 7,233,103 | |||||
Medical - Systems/Equipment 3.0% | |||||
Fisher Scientific International, Inc. (b) (d) | 65,300 | 3,771,075 | |||
Varian Medical Systems, Inc. (b) | 18,450 | 1,464,008 | |||
| 5,235,083 | |||||
Medical - Wholesale Drugs/Sundries 0.9% | |||||
McKesson Corporation | 48,800 | 1,675,304 | |||
Medical/Dental - Services 1.7% | |||||
Caremark Rx, Inc. (b) | 28,600 | 942,084 | |||
LabOne, Inc. (b) (d) | 66,800 | 2,122,904 | |||
| 3,064,988 | |||||
Medical/Dental - Supplies 0.8% | |||||
Dentsply International, Inc. | 25,730 | 1,340,533 | |||
Metal Ores - Miscellaneous 1.2% | |||||
Phelps Dodge Corporation (b) (d) | 26,700 | 2,069,517 | |||
Mining - Gems 1.2% | |||||
Pan American Silver Corporation (b) (d) | 166,700 | 2,192,105 | |||
Oil & Gas - Canadian Exploration & | |||||
Production 0.4% | |||||
Canadian Natural Resources, Ltd. | 25,400 | 759,460 | |||
Oil & Gas - Drilling 2.2% | |||||
ENSCO International, Inc. | 66,700 | 1,940,970 | |||
Nabors Industries, Ltd. (b) | 41,970 | 1,897,883 | |||
| 3,838,853 | |||||
Oil & Gas - Field Services 0.5% | |||||
BJ Services Company (b) | 19,030 | 872,335 | |||
Oil & Gas - Machinery/Equipment 2.5% | |||||
Grant Prideco, Inc. (b) | 137,800 | 2,543,788 | |||
Smith International, Inc. (b) | 32,900 | 1,834,504 | |||
| 4,378,292 | |||||
Oil & Gas - Production/Pipeline 0.8% | |||||
The Williams Companies, Inc. | 112,100 | 1,333,990 | |||
21
| SCHEDULES OF INVESTMENTS IN SECURITIES (continued) | June 30, 2004 (Unaudited) |
STRONG DISCOVERY FUND (continued)
Shares or Principal Amount | Value (Note 2) | ||||||
Oil & Gas - United States Exploration & Production 2.3% | |||||||
Chesapeake Energy Corporation (d) | 176,500 | $ | 2,598,080 | ||||
XTO Energy, Inc. (d) | 46,100 | 1,373,319 | |||||
| 3,971,399 | |||||||
Pollution Control - Services 1.5% | |||||||
Stericycle, Inc. (b) | 51,470 | 2,663,058 | |||||
Retail - Clothing/Shoe 1.7% | |||||||
Coach, Inc. (b) | 36,750 | 1,660,733 | |||||
Urban Outfitters, Inc. (b) (d) | 22,010 | 1,340,629 | |||||
| 3,001,362 | |||||||
Retail - Home Furnishings 2.1% | |||||||
Select Comfort Corporation (b) | 129,050 | 3,665,020 | |||||
Retail - Miscellaneous 1.7% | |||||||
PETsMART, Inc. | 92,639 | 3,006,136 | |||||
Retail - Restaurants 0.8% | |||||||
Panera Bread Company Class A (b) (d) | 41,675 | 1,495,299 | |||||
Steel - Specialty Alloys 0.7% | |||||||
GrafTech International, Ltd. (b) | 110,340 | 1,154,156 | |||||
Telecommunications - Equipment 1.3% | |||||||
American Tower Corporation Class A (b) | 58,900 | 895,280 | |||||
Avaya, Inc. (b) | 84,510 | 1,334,413 | |||||
| 2,229,693 | |||||||
Telecommunications - Wireless Equipment 3.3% | |||||||
Research in Motion, Ltd. (b) | 84,200 | 5,762,648 | |||||
Telecommunications - Wireless Services 6.6% | |||||||
Crown Castle International Corporation (b) | 271,240 | 4,000,790 | |||||
NII Holdings, Inc. Class B (b) (d) | 133,202 | 4,487,575 | |||||
Nextel Partners, Inc. (b) (d) | 198,400 | 3,158,528 | |||||
| 11,646,893 | |||||||
Transportation - Airline 1.9% | |||||||
AirTran Holdings, Inc. (b) (d) | 231,290 | 3,270,441 | |||||
Total Common Stocks (Cost $ 135,244,271) | 167,308,584 | ||||||
Short - Term Investments (a) 14.0% | |||||||
Collateral Received for Securities Lending 9.6% | |||||||
Navigator Prime Portfolio | 16,953,906 | 16,953,906 | |||||
Repurchase Agreements (c) 4.4% | |||||||
ABN AMRO Inc. (Dated 6/30/04), 1.40%, Due 7/01/04 (Repurchase proceeds $5,600,218); Collateralized by: | |||||||
United States Government & Agency Issues | $ | 5,600,000 | 5,600,000 | ||||
State Street Bank (Dated 6/30/04), 0.75%, Due 7/01/04 (Repurchase proceeds $2,050,143); Collateralized by: | |||||||
United States Government & Agency Issues | 2,050,100 | 2,050,100 | |||||
| 7,650,100 | |||||||
Total Short-Term Investments (Cost $ 24,604,006) | 24,604,006 | ||||||
Total Investments in Securities (Cost $ 159,848,277) 109.4% | 191,912,590 | ||||||
Other Assets and Liabilities, Net (9.4%) | (16,606,810 | ) | |||||
Net Assets 100.0% | $ | 175,305,780 | |||||
| Shares or Principal Amount | Value (Note 2) | ||||
Common Stocks 98.1% | |||||
Apparel - Shoes & Related Manufacturing 1.0% | |||||
NIKE, Inc. Class B | 3,290 | $ | 249,218 | ||
Beverages - Alcoholic 2.0% | |||||
Anheuser-Busch Companies, Inc. | 9,190 | 496,260 | |||
Commercial Services - Schools 1.6% | |||||
Corinthian Colleges, Inc. (b) | 15,810 | 391,139 | |||
Computer - Data Storage 2.9% | |||||
EMC Corporation (b) | 64,100 | 730,740 | |||
Computer - Local Networks 2.8% | |||||
Cisco Systems, Inc. (b) | 21,565 | 511,090 | |||
Polycom, Inc. (b) | 8,996 | 201,600 | |||
| 712,690 | |||||
Computer - Manufacturers 4.7% | |||||
Apple Computer, Inc. (b) | 7,490 | 243,725 | |||
Dell, Inc. (b) | 26,250 | 940,275 | |||
| 1,184,000 | |||||
Computer Software - Desktop 1.5% | |||||
Microsoft Corporation | 13,510 | 385,846 | |||
Computer Software - Enterprise 4.0% | |||||
Mercury Interactive Corporation (b) | 4,970 | 247,655 | |||
SAP AG Sponsored ADR | 18,425 | 770,349 | |||
| 1,018,004 | |||||
Computer Software - Financial 0.8% | |||||
DST Systems, Inc. (b) | 3,940 | 189,475 | |||
Diversified Operations 10.8% | |||||
General Electric Company | 32,000 | 1,036,800 | |||
Honeywell International, Inc. | 14,250 | 521,978 | |||
Tyco International, Ltd. | 35,145 | 1,164,705 | |||
| 2,723,483 | |||||
Electronics - Semiconductor Manufacturing 2.9% | |||||
Intel Corporation | 26,270 | 725,052 | |||
Finance - Mortgage & Related Services 1.8% | |||||
Countrywide Financial Corporation | 6,334 | 444,963 | |||
Household - Consumer Electronics 1.8% | |||||
Harman International Industries, Inc. | 4,980 | 453,180 | |||
Insurance - Diversified 0.6% | |||||
American International Group, Inc. | 2,170 | 154,678 | |||
Insurance - Property/Casualty/Title 3.1% | |||||
The Allstate Corporation | 16,480 | 767,144 | |||
Internet - E*Commerce 0.7% | |||||
eBay, Inc. (b) | 1,960 | 180,222 | |||
Internet - Internet Content 5.3% | |||||
Yahoo! Inc. (b) | 36,880 | 1,339,850 | |||
Leisure - Toys/Games/Hobby 2.4% | |||||
Marvel Enterprises, Inc. (b) | 31,530 | 615,466 | |||
22
STRONG ENDEAVOR FUND (continued)
| Shares or Principal Amount | Value (Note 2) | |||||
Machinery - Farm 1.0% | ||||||
Deere & Company | 3,480 | $ | 244,087 | |||
Media - Cable TV 0.7% | ||||||
EchoStar Communications Corporation Class A (b) | 5,910 | 181,732 | ||||
Medical - Biomedical/Biotechnology 1.1% | ||||||
Genzyme Corporation (b) | 5,770 | 273,094 | ||||
Medical - Ethical Drugs 3.0% | ||||||
Medicis Pharmaceutical Corporation Class A | 6,460 | 258,077 | ||||
Pfizer, Inc. | 14,704 | 504,053 | ||||
| 762,130 | ||||||
Medical - Generic Drugs 3.9% | ||||||
Teva Pharmaceutical Industries, Ltd. ADR | 14,740 | 991,855 | ||||
Medical - Health Maintenance Organizations 3.2% | ||||||
Anthem, Inc. (b) | 9,010 | 806,936 | ||||
Medical - Products 6.7% | ||||||
Alcon, Inc. | 4,800 | 377,520 | ||||
Boston Scientific Corporation (b) | 10,560 | 451,968 | ||||
Medtronic, Inc. | 9,400 | 457,968 | ||||
Zimmer Holdings, Inc. (b) | 4,400 | 388,080 | ||||
| 1,675,536 | ||||||
Medical - Systems/Equipment 2.1% | ||||||
Fisher Scientific International, Inc. (b) | 9,290 | 536,497 | ||||
Medical - Wholesale Drugs/Sundries 2.0% | ||||||
McKesson Corporation | 14,290 | 490,576 | ||||
Metal Ores - Gold/Silver 1.7% | ||||||
Newmont Mining Corporation Holding Company | 10,880 | 421,709 | ||||
Metal Ores - Miscellaneous 2.2% | ||||||
Phelps Dodge Corporation (b) | 7,310 | 566,598 | ||||
Oil & Gas - Canadian Exploration & Production 0.4% | ||||||
Canadian Natural Resources, Ltd. | 3,610 | 107,939 | ||||
Oil & Gas - Canadian Integrated 1.3% | ||||||
Suncor Energy, Inc. | 12,720 | 325,759 | ||||
Oil & Gas - Drilling 1.0% | ||||||
Nabors Industries, Ltd. (b) | 5,470 | 247,353 | ||||
Oil & Gas - Field Services 2.1% | ||||||
Schlumberger, Ltd. | 8,330 | 529,038 | ||||
Oil & Gas - Production/Pipeline 1.0% | ||||||
The Williams Companies, Inc. | 21,710 | 258,349 | ||||
Oil & Gas - United States Exploration & Production 1.5% | ||||||
Anadarko Petroleum Corporation | 6,550 | 383,830 | ||||
Retail - Drug Stores 1.0% | ||||||
CVS Corporation | 5,980 | 251,280 | ||||
Retail - Major Discount Chains 1.9% | ||||||
Target Corporation | 5,375 | 228,276 | ||||
Wal-Mart Stores, Inc. | 4,710 | 248,500 | ||||
| 476,776 | ||||||
Retail/Wholesale - Office Supplies 1.5% | ||||||
Staples, Inc. | 13,070 | 383,082 | ||||
Telecommunications - Fiber Optics 2.2% | ||||||
Corning, Inc. (b) | 41,700 | 544,602 | ||||
Telecommunications - Wireless Equipment 3.6% | ||||||
Research in Motion, Ltd. (b) | 13,230 | 905,461 | ||||
Telecommunications - Wireless Services 2.3% | ||||||
Crown Castle International Corporation (b) | 21,860 | 322,435 | ||||
NII Holdings, Inc. Class B (b) | 7,710 | 259,750 | ||||
| 582,185 | ||||||
Total Common Stocks (Cost $ 22,772,495) | 24,707,814 | |||||
Short-Term Investments (a) 1.6% | ||||||
Repurchase Agreements (c) | ||||||
ABN AMRO Inc. (Dated 6/30/04), 1.40%, Due 7/01/04 (Repurchase proceeds $300,012); Collateralized by: United States Government & Agency Issues | $ | 300,000 | 300,000 | |||
State Street Bank (Dated 6/30/04), 0.75%, Due 7/01/04 (Repurchase proceeds $117,202); Collateralized by: United States Government & Agency Issues | 117,200 | 117,200 | ||||
Total Short-Term Investments (Cost $ 417,200) | 417,200 | |||||
Total Investments in Securities (Cost $ 23,189,695) 99.7% | 25,125,014 | |||||
Other Assets and Liabilities, Net 0.3% | 68,027 | |||||
Net Assets 100.0% | $ | 25,193,041 | ||||
| Shares or Principal Amount | Value (Note 2) | ||||
Common Stocks 97.6% | |||||
Aerospace - Defense 1.0% | |||||
Northrop Grumman Corporation | 100,000 | $ | 5,370,000 | ||
Banks - Money Center 0.5% | |||||
Citigroup, Inc. | 60,000 | 2,790,000 | |||
Beverages - Alcoholic 0.5% | |||||
Anheuser-Busch Companies, Inc. | 50,000 | 2,700,000 | |||
Chemicals - Specialty 0.6% | |||||
Praxair, Inc. | 90,000 | 3,591,900 | |||
Commercial Services - Advertising 0.8% | |||||
Omnicom Group, Inc. | 60,000 | 4,553,400 | |||
Commercial Services - Miscellaneous 0.7% | |||||
Paychex, Inc. | 115,000 | 3,896,200 | |||
23
| SCHEDULES OF INVESTMENTS IN SECURITIES (continued) | June 30, 2004 (Unaudited) |
STRONG LARGE CAP GROWTH FUND (continued)
| Shares or Principal Amount | Value (Note 2) | ||||
Commercial Services - Schools 1.6% | |||||
Apollo Group, Inc. Class A (b) | 105,000 | $ | 9,270,450 | ||
Commercial Services - Staffing 1.3% | |||||
Manpower, Inc. | 145,000 | 7,361,650 | |||
Computer - Local Networks 5.8% | |||||
Cisco Systems, Inc. (b) | 720,000 | 17,064,000 | |||
Juniper Networks, Inc. (b) | 485,000 | 11,916,450 | |||
Polycom, Inc. (b) | 150,000 | 3,361,500 | |||
| 32,341,950 | |||||
Computer - Manufacturers 2.9% | |||||
Dell, Inc. (b) | 450,000 | 16,119,000 | |||
Computer Software - | |||||
Education/Entertainment 1.5% | |||||
Electronic Arts, Inc. (b) | 150,000 | 8,182,500 | |||
Computer Software - Enterprise 2.1% | |||||
Mercury Interactive Corporation (b) | 130,000 | 6,477,900 | |||
SAP AG Sponsored ADR | 125,000 | 5,226,250 | |||
| 11,704,150 | |||||
Computer Software - Security 1.1% | |||||
Symantec Corporation (b) | 140,000 | 6,129,200 | |||
Cosmetics - Personal Care 4.3% | |||||
Colgate Palmolive Company | 100,000 | 5,845,000 | |||
Kimberly-Clark Corporation | 85,000 | 5,599,800 | |||
LIFE TIME FITNESS, Inc. (b) | 1,000 | 21,000 | |||
The Procter & Gamble Company | 230,000 | 12,521,200 | |||
| 23,987,000 | |||||
Diversified Operations 2.7% | |||||
General Electric Company | 470,000 | 15,228,000 | |||
Electronics - Contract Manufacturing 1.2% | |||||
Flextronics International, Ltd. (b) | 435,000 | 6,938,250 | |||
Electronics - Scientific Measuring 1.8% | |||||
Danaher Corporation | 190,000 | 9,851,500 | |||
Electronics - Semiconductor | |||||
Manufacturing 10.3% | |||||
Analog Devices, Inc. | 185,000 | 8,709,800 | |||
Broadcom Corporation Class A (b) (d) | 120,000 | 5,612,400 | |||
Intel Corporation | 725,000 | 20,010,000 | |||
KLA-Tencor Corporation (b) | 50,000 | 2,469,000 | |||
Marvell Technology Group, Ltd. (b) | 130,000 | 3,471,000 | |||
Maxim Integrated Products, Inc. | 130,000 | 6,814,600 | |||
Microchip Technology, Inc. | 175,000 | 5,519,500 | |||
Xilinx, Inc. | 145,000 | 4,829,950 | |||
| 57,436,250 | |||||
Finance - Consumer/Commercial Loans 1.0% | |||||
SLM Corporation | 140,000 | 5,663,000 | |||
Finance - Investment Brokers 1.0% | |||||
The Goldman Sachs Group, Inc. | 60,000 | 5,649,600 | |||
Finance - Mortgage & Related Services 1.5% | |||||
Countrywide Financial Corporation | 120,000 | 8,430,000 | |||
Food - Flour & Grain 1.0% | |||||
Archer Daniels Midland Company | 340,000 | 5,705,200 | |||
Food - Miscellaneous Preparation 1.6% | |||||
PepsiCo, Inc. | 170,000 | 9,159,600 | |||
Household - Consumer Electronics 1.0% | |||||
Harman International Industries, Inc. | 60,000 | 5,460,000 | |||
Insurance - Diversified 2.2% | |||||
American International Group, Inc. | 175,000 | 12,474,000 | |||
Insurance - Property/Casualty/Title 0.9% | |||||
The PMI Group, Inc. | 120,000 | 5,222,400 | |||
Internet - E*Commerce 2.4% | |||||
Amazon.com, Inc. (b) | 100,000 | 5,440,000 | |||
eBay, Inc. (b) | 90,000 | 8,275,500 | |||
| 13,715,500 | |||||
Internet - Internet Content 2.1% | |||||
Yahoo! Inc. (b) | 330,000 | 11,988,900 | |||
Leisure - Gaming/Equipment 2.1% | |||||
International Game Technology | 185,000 | 7,141,000 | |||
Wynn Resorts, Ltd. (b) | 113,200 | 4,372,916 | |||
| 11,513,916 | |||||
Media - Radio/TV 3.2% | |||||
News Corporation, Ltd. Sponsored ADR (d) | 200,000 | 7,084,000 | |||
Univision Communications, Inc. Class A (b) | 130,000 | 4,150,900 | |||
XM Satellite Radio Holdings, Inc. Class A (b) | 240,000 | 6,549,600 | |||
| 17,784,500 | |||||
Medical - Biomedical/Biotechnology 4.4% | |||||
Amgen, Inc. (b) | 80,000 | 4,365,600 | |||
Biogen Idec, Inc. (b) | 80,000 | 5,060,000 | |||
Genzyme Corporation (b) | 85,000 | 4,023,050 | |||
Gilead Sciences, Inc. (b) | 115,000 | 7,705,000 | |||
Medimmune, Inc. (b) | 160,000 | 3,744,000 | |||
| 24,897,650 | |||||
Medical - Ethical Drugs 2.6% | |||||
Eli Lilly & Company | 85,000 | 5,942,350 | |||
Pfizer, Inc. | 250,000 | 8,570,000 | |||
| 14,512,350 | |||||
Medical - Generic Drugs 1.3% | |||||
Teva Pharmaceutical Industries, Ltd. ADR | 110,000 | 7,401,900 | |||
Medical - Genetics 0.9% | |||||
Genentech, Inc. (b) | 90,000 | 5,058,000 | |||
Medical - Health Maintenance | |||||
Organizations 1.0% | |||||
Anthem, Inc. (b) (d) | 65,000 | 5,821,400 | |||
Medical - Hospitals 0.6% | |||||
HCA, Inc. | 75,000 | 3,119,250 | |||
Medical - Products 4.1% | |||||
Boston Scientific Corporation (b) | 65,000 | 2,782,000 | |||
Guidant Corporation | 30,000 | 1,676,400 | |||
Medtronic, Inc. | 60,000 | 2,923,200 | |||
St. Jude Medical, Inc. (b) | 75,000 | 5,673,750 | |||
Zimmer Holdings, Inc. (b) | 115,000 | 10,143,000 | |||
| 23,198,350 | |||||
Medical/Dental - Supplies 0.5% | |||||
Kinetic Concepts, Inc. (b) | 57,600 | 2,874,240 | |||
Oil & Gas - Field Services 0.9% | |||||
BJ Services Company (b) | 110,000 | 5,042,400 | |||
24
STRONG LARGE CAP GROWTH FUND (continued)
| Shares or Principal Amount | Value (Note 2) | ||||||
Oil & Gas - International Integrated 1.1% | |||||||
Exxon Mobil Corporation | 135,000 | $ | 5,995,350 | ||||
Oil & Gas - Machinery/Equipment 1.5% | |||||||
Smith International, Inc. (b) | 150,000 | 8,364,000 | |||||
Oil & Gas - United States Exploration & Production 2.5% | |||||||
Apache Corporation | 125,000 | 5,443,750 | |||||
Occidental Petroleum Corporation | 115,000 | 5,567,150 | |||||
XTO Energy, Inc. (d) | 100,000 | 2,979,000 | |||||
| 13,989,900 | |||||||
Retail - Consumer Electronics 0.5% | |||||||
Best Buy Company, Inc. | 55,000 | 2,790,700 | |||||
Retail - Department Stores 0.6% | |||||||
Kohl’s Corporation (b) | 75,000 | 3,171,000 | |||||
Retail - Discount & Variety 1.3% | |||||||
Dollar Tree Stores, Inc. (b) | 275,000 | 7,543,250 | |||||
Retail - Drug Stores 1.1% | |||||||
Walgreen Company | 165,000 | 5,974,650 | |||||
Retail - Home Furnishings 0.0% | |||||||
Design Within Reach, Inc. (b) | 1,000 | 16,430 | |||||
Retail - Major Discount Chains 2.3% | |||||||
Target Corporation | 300,000 | 12,741,000 | |||||
Retail - Miscellaneous 1.0% | |||||||
Cabela’s, Inc. (b) | 62,400 | 1,681,680 | |||||
PETCO Animal Supplies, Inc. (b) | 120,000 | 3,865,200 | |||||
| 5,546,880 | |||||||
Retail - Restaurants 0.7% | |||||||
Starbucks Corporation (b) | 90,000 | 3,913,200 | |||||
Retail - Super/Mini Markets 1.0% | |||||||
Whole Foods Marketing, Inc. (d) | 60,000 | 5,727,000 | |||||
Retail/Wholesale - Building Products 2.7% | |||||||
The Home Depot, Inc. | 280,000 | 9,856,000 | |||||
Lowe’s Companies, Inc. | 105,000 | 5,517,750 | |||||
| 15,373,750 | |||||||
Retail/Wholesale - Office Supplies 0.8% | |||||||
Staples, Inc. | 150,000 | 4,396,500 | |||||
Telecommunications - Fiber Optics 1.2% | |||||||
Corning, Inc. (b) | 500,000 | 6,530,000 | |||||
Telecommunications - Wireless Equipment 1.8% | |||||||
QUALCOMM, Inc. | 135,000 | 9,852,300 | |||||
Telecommunications - Wireless | |||||||
Services 0.5% | |||||||
Nextel Communications, Inc. Class A (b) | 100,000 | 2,666,000 | |||||
Total Common Stocks (Cost $ 429,678,211) | 546,735,466 | ||||||
Short-Term Investments (a) 3.4% | |||||||
Collateral Received for Securities Lending 1.2% | |||||||
Navigator Prime Portfolio | 6,651,057 | 6,651,057 | |||||
Repurchase Agreements (c) 2.2% | |||||||
ABN AMRO Inc. (Dated 6/30/04), 1.40%, Due 7/01/04 (Repurchase proceeds $8,300,323); Collateralized by: United States Government & Agency Issues | $ | 8,300,000 | 8,300,000 | ||||
State Street Bank (Dated 6/30/04), 0.75%, Due 7/01/04 (Repurchase proceeds $4,159,287); Collateralized by: United States Government & Agency Issues | 4,159,200 | 4,159,200 | |||||
| 12,459,200 | |||||||
Total Short-Term Investments (Cost $ 19,110,257) | 19,110,257 | ||||||
Total Investments in Securities (Cost $448,788,468) 101.0% | 565,845,723 | ||||||
Other Assets and Liabilities, Net (1.0%) | (5,755,342 | ) | |||||
Net Assets 100.0% | $ | 560,090,381 | |||||
STRONG U.S. EMERGING GROWTH FUND
| Shares or Principal Amount | Value (Note 2) | ||||
Common Stocks 98.2% | |||||
Commercial Services - Advertising 1.4% | |||||
aQuantive, Inc. (b) | 125,250 | $ | 1,237,470 | ||
Commercial Services - Market Research 3.0% | |||||
Corporate Executive Board Company | 17,445 | 1,008,147 | |||
CoStar Group, Inc. (b) | 35,155 | 1,614,669 | |||
| 2,622,816 | |||||
Commercial Services - Schools 3.5% | |||||
Career Education Corporation (b) | 15,285 | 696,385 | |||
Corinthian Colleges, Inc. (b) | 95,740 | 2,368,608 | |||
| 3,064,993 | |||||
Commercial Services - Staffing 1.6% | |||||
Gevity HR, Inc. | 52,235 | 1,368,035 | |||
Computer - IT Services 1.7% | |||||
Cognizant Technology Solutions Corporation (b) | 57,150 | 1,452,181 | |||
Computer Software - Desktop 1.2% | |||||
Sonic Solutions (b) | 49,200 | 1,045,500 | |||
Computer Software - Medical 4.1% | |||||
eResearch Technology, Inc. (b) | 126,217 | 3,534,076 | |||
Electronics - Semiconductor Manufacturing 15.3% | |||||
Cree, Inc. (b) | 52,660 | 1,225,925 | |||
Cymer, Inc. (b) | 23,945 | 896,501 | |||
DSP Group, Inc. (b) | 48,945 | 1,333,262 | |||
Genesis Microchip, Inc. (b) | 80,205 | 1,104,423 | |||
Integrated Silicon Solution, Inc. (b) | 131,150 | 1,601,341 | |||
OmniVision Technologies, Inc. (b) | 78,445 | 1,251,198 | |||
Rudolph Technologies, Inc. (b) | 48,120 | 875,303 | |||
Silicon Laboratories, Inc. (b) | 46,390 | 2,150,176 | |||
25
| SCHEDULES OF INVESTMENTS IN SECURITIES (continued) | June 30, 2004 (Unaudited) |
STRONG U.S. EMERGING GROWTH FUND (continued)
| Shares or Principal Amount | Value (Note 2) | |||||
Trident Microsystems, Inc. (b) | 164,417 | $ | 1,843,115 | |||
Varian Semiconductor Equipment Associates, Inc. (b) | 23,335 | 899,798 | ||||
| 13,181,042 | ||||||
Finance - Consumer/Commercial Loans 2.2% | ||||||
WFS Financial, Inc. (b) | 38,005 | 1,881,627 | ||||
Financial Services - Miscellaneous 3.8% | ||||||
Investors Financial Services Corporation | 56,660 | 2,469,243 | ||||
iPayment, Inc. (b) | 20,095 | 823,895 | ||||
| 3,293,138 | ||||||
Insurance - Property/Casualty/Title 0.9% | ||||||
ProAssurance Corporation (b) | 22,285 | 760,141 | ||||
Internet - E*Commerce 4.3% | ||||||
Getty Images, Inc. (b) | 17,450 | 1,047,000 | ||||
Netflix, Inc. (b) | 38,835 | 1,396,118 | ||||
University of Phoenix Online (b) | 14,095 | 1,234,581 | ||||
| 3,677,699 | ||||||
Internet - Internet Content 1.3% | ||||||
Ask Jeeves, Inc. (b) | 28,995 | 1,131,675 | ||||
Internet - Internet Service Provider 2.1% | ||||||
United Online, Inc. (b) | 100,790 | 1,774,912 | ||||
Internet - Network Security/Solutions 2.0% | ||||||
Akamai Technologies, Inc. (b) | 67,270 | 1,207,496 | ||||
Blue Coat Systems, Inc. (b) | 16,140 | 540,529 | ||||
| 1,748,025 | ||||||
Leisure - Gaming/Equipment 1.5% | ||||||
Shuffle Master, Inc. (b) | 35,290 | 1,281,380 | ||||
Machinery - Construction/Mining 3.4% | ||||||
JLG Industries, Inc. | 113,700 | 1,579,293 | ||||
Joy Global, Inc. | 46,335 | 1,387,270 | ||||
| 2,966,563 | ||||||
Medical - Biomedical/Biotechnology 2.8% | ||||||
Immunicon Corporation (b) | 89,950 | 707,007 | ||||
Martek Biosciences Corporation (b) | 30,225 | 1,697,738 | ||||
| 2,404,745 | ||||||
Medical - Ethical Drugs 2.2% | ||||||
Salix Pharmaceuticals, Ltd. (b) | 56,775 | 1,870,736 | ||||
Medical - Generic Drugs 1.9% | ||||||
American Pharmaceutical Partners, Inc. (b) | 20,307 | 616,927 | ||||
Andrx Group (b) | 35,895 | 1,002,547 | ||||
| 1,619,474 | ||||||
Medical - Outpatient/Home Care 1.1% | ||||||
AmSurg Corporation (b) | 38,332 | 963,283 | ||||
Medical - Systems/Equipment 2.1% | ||||||
Kyphon, Inc. (b) | 63,100 | 1,778,158 | ||||
Medical/Dental - Services 2.7% | ||||||
American Healthways, Inc. (b) | 86,230 | 2,295,443 | ||||
Oil & Gas - Field Services 1.0% | ||||||
Oceaneering International, Inc. (b) | 24,320 | 832,960 | ||||
Oil & Gas - United States Exploration & Production 5.6% | ||||||
KCS Energy, Inc. (b) | 65,980 | 878,854 | ||||
Quicksilver Resources, Inc. (b) | 23,665 | 1,587,211 | ||||
Range Resources Corporation | 66,035 | 964,111 | ||||
Ultra Petroleum Corporation (b) | 37,665 | 1,406,034 | ||||
| 4,836,210 | ||||||
Retail - Clothing/Shoe 5.1% | ||||||
Chicos FAS, Inc. (b) | 31,384 | 1,417,301 | ||||
Hot Topic, Inc. (b) | 39,455 | 808,433 | ||||
Urban Outfitters, Inc. (b) | 35,955 | 2,190,019 | ||||
| 4,415,753 | ||||||
Retail - Home Furnishings 1.3% | ||||||
Design Within Reach, Inc. (b) | 7,705 | 126,593 | ||||
Select Comfort Corporation (b) | 33,905 | 962,902 | ||||
| 1,089,495 | ||||||
Retail - Miscellaneous 3.6% | ||||||
Gander Mountain Company (b) | 56,193 | 1,289,629 | ||||
Sharper Image Corporation (b) | 58,120 | 1,824,387 | ||||
| 3,114,016 | ||||||
Retail - Restaurants 3.3% | ||||||
The Cheesecake Factory, Inc. (b) | 29,915 | 1,190,318 | ||||
P.F. Chang’s China Bistro, Inc. (b) | 39,395 | 1,621,104 | ||||
| 2,811,422 | ||||||
Telecommunications - Wireless Services 4.9% | ||||||
@Road, Inc. (b) | 107,995 | 826,162 | ||||
Alamosa Holdings, Inc. (b) | 187,340 | 1,376,949 | ||||
LCC International, Inc. Class A (b) | 180,775 | 885,797 | ||||
Nextel Partners, Inc. (b) | 74,205 | 1,181,344 | ||||
| 4,270,252 | ||||||
Transportation - Services 1.8% | ||||||
C.H. Robinson Worldwide, Inc. | 33,365 | 1,529,452 | ||||
Transportation - Truck 5.5% | ||||||
J.B. Hunt Transport Services, Inc. | 73,195 | 2,823,863 | ||||
Knight Transportation, Inc. (b) | 33,990 | 976,533 | ||||
Landstar Systems, Inc. (b) | 17,375 | 918,616 | ||||
| 4,719,012 | ||||||
Total Common Stocks (Cost $ 61,757,158) | 84,571,684 | |||||
Short-Term Investments (a) 1.5% | ||||||
Repurchase Agreements (c) | ||||||
State Street Bank (Dated 6/30/04), 0.75%, Due 7/01/04 (Repurchase proceeds $1,253,226); Collateralized by: United States Government & Agency Issues | $ | 1,253,200 | 1,253,200 | |||
Total Short-Term Investments (Cost $ 1,253,200) | 1,253,200 | |||||
Total Investments in Securities (Cost $63,010,358) 99.7% | 85,824,884 | |||||
Other Assets and Liabilities, Net 0.3% | 264,839 | |||||
Net Assets 100.0% | $ | 86,089,723 | ||||
26
| Shares or Principal Amount | Value (Note 2) | ||||
Common Stocks 99.5% | |||||
Auto/Truck - Original Equipment 0.9% | |||||
Eaton Corporation | 42,140 | $ | 2,728,144 | ||
Commercial Services - Market Research 1.2% | |||||
Corporate Executive Board Company | 62,130 | 3,590,493 | |||
Commercial Services - Schools 1.0% | |||||
Career Education Corporation (b) | 22,750 | 1,036,490 | |||
Corinthian Colleges, Inc. (b) (d) | 78,690 | 1,946,791 | |||
| 2,983,281 | |||||
Commercial Services - Security/Safety 0.7% | |||||
Armor Holdings, Inc. (b) (d) | 55,700 | 1,893,800 | |||
Computer - Local Networks 3.4% | |||||
Juniper Networks, Inc. (b) | 135,290 | 3,324,075 | |||
Polycom, Inc. (b) | 287,410 | 6,440,858 | |||
| 9,764,933 | |||||
Computer - Manufacturers 1.7% | |||||
Apple Computer, Inc. (b) | 152,270 | 4,954,866 | |||
Computer Software - Education/Entertainment 3.1% | |||||
Activision, Inc. (b) | 270,166 | 4,295,639 | |||
Electronic Arts, Inc. (b) | 83,760 | 4,569,108 | |||
| 8,864,747 | |||||
Computer Software - Enterprise 4.6% | |||||
Hyperion Solutions Corporation (b) | 33,600 | 1,468,992 | |||
Mercury Interactive Corporation (b) | 128,210 | 6,388,704 | |||
TIBCO Software, Inc. (b) (d) | 635,530 | 5,370,228 | |||
| 13,227,924 | |||||
Computer Software - Financial 0.8% | |||||
DST Systems, Inc. (b) | 45,300 | 2,178,477 | |||
Computer Software - Security 0.5% | |||||
Symantec Corporation (b) | 35,100 | 1,536,678 | |||
Electronics - Semiconductor Manufacturing 7.3% | |||||
Broadcom Corporation Class A (b) | 126,000 | 5,893,020 | |||
KLA-Tencor Corporation (b) | 46,660 | 2,304,071 | |||
Linear Technology Corporation | 52,840 | 2,085,595 | |||
Marvell Technology Group, Ltd. (b) | 198,800 | 5,307,960 | |||
Maxim Integrated Products, Inc. | 41,000 | 2,149,220 | |||
Silicon Laboratories, Inc. (b) (d) | 74,400 | 3,448,440 | |||
| 21,188,306 | |||||
Finance - Mortgage & Related Services 1.8% | |||||
Countrywide Financial Corporation | 74,000 | 5,198,500 | |||
Financial Services - Miscellaneous 0.7% | |||||
Euronet Services, Inc. (b) (d) | 92,500 | 2,139,525 | |||
Household - Consumer Electronics 2.7% | |||||
Harman International Industries, Inc. | 85,390 | 7,770,490 | |||
Insurance - Property/Casualty/Title 1.6% | |||||
Endurance Specialty Holdings, Ltd. (d) | 129,570 | 4,509,036 | |||
Internet - E*Commerce 2.4% | |||||
Getty Images, Inc. (b) | 35,800 | 2,148,000 | |||
Netflix, Inc. (b) (d) | 132,300 | 4,756,185 | |||
| 6,904,185 | |||||
Internet - Software 0.9% | |||||
ValueClick, Inc. (b) | 218,300 | 2,615,234 | |||
Leisure - Products 1.9% | |||||
Multimedia Games, Inc. (b) (d) | 200,716 | 5,383,203 | |||
Leisure - Toys/Games/Hobby 1.8% | |||||
Marvel Enterprises, Inc. (b) (d) | 268,957 | 5,250,041 | |||
Media - Radio/TV 1.4% | |||||
The E.W. Scripps Company Class A | 37,225 | 3,908,625 | |||
Medical - Biomedical/Biotechnology 3.8% | |||||
Digene Corporation (b) | 138,449 | 5,057,542 | |||
Genzyme Corporation (b) | 80,555 | 3,812,668 | |||
Sepracor, Inc. (b) (d) | 41,600 | 2,200,640 | |||
| 11,070,850 | |||||
Medical - Ethical Drugs 1.5% | |||||
Medicis Pharmaceutical Corporation Class A | 105,250 | 4,204,737 | |||
Medical - Generic Drugs 2.1% | |||||
Teva Pharmaceutical Industries, Ltd. ADR (d) | 89,500 | 6,022,455 | |||
Medical - Health Maintenance Organizations 1.5% | |||||
Anthem, Inc. (b) (d) | 49,705 | 4,451,580 | |||
Medical - Hospitals 1.5% | |||||
Community Health Systems, Inc. (b) | 160,050 | 4,284,539 | |||
Medical - Products 3.0% | |||||
American Medical Systems Holdings, Inc. (b) (d) | 119,200 | 4,017,040 | |||
Zimmer Holdings, Inc. (b) | 53,965 | 4,759,713 | |||
| 8,776,753 | |||||
Medical - Systems/Equipment 3.1% | |||||
Fisher Scientific International, Inc. (b) (d) | 100,070 | 5,779,042 | |||
Varian Medical Systems, Inc. (b) | 41,165 | 3,266,443 | |||
| 9,045,485 | |||||
Medical - Wholesale Drugs/Sundries 2.1% | |||||
McKesson Corporation | 179,300 | 6,155,369 | |||
Medical/Dental - Services 1.0% | |||||
Quest Diagnostics, Inc. | 32,400 | 2,752,380 | |||
Medical/Dental - Supplies 0.8% | |||||
Dentsply International, Inc. | 44,070 | 2,296,047 | |||
Metal Ores - Gold/Silver 1.9% | |||||
Placer Dome, Inc. | 335,590 | 5,584,218 | |||
Metal Ores - Miscellaneous 1.9% | |||||
Phelps Dodge Corporation (b) (d) | 70,400 | 5,456,704 | |||
Oil & Gas - Canadian Exploration & Production 0.4% | |||||
Canadian Natural Resources, Ltd. | 41,800 | 1,249,820 | |||
Oil & Gas - Canadian Integrated 1.5% | |||||
Suncor Energy, Inc. | 164,210 | 4,205,418 | |||
Oil & Gas - Drilling 1.5% | |||||
ENSCO International, Inc. (d) | 89,890 | 2,615,799 | |||
Nabors Industries, Ltd. (b) | 34,805 | 1,573,882 | |||
| 4,189,681 | |||||
27
| SCHEDULES OF INVESTMENTS IN SECURITIES (continued) | June 30, 2004 (Unaudited) |
STRONG ENTERPRISE FUND (continued)
| Shares or Principal Amount | Value (Note 2) | ||||||
Oil & Gas - Machinery/Equipment 2.6% | |||||||
Grant Prideco, Inc. (b) (d) | 256,000 | $ | 4,725,760 | ||||
Smith International, Inc. (b) | 51,570 | 2,875,543 | |||||
| 7,601,303 | |||||||
Oil & Gas - Production/Pipeline 1.0% | |||||||
The Williams Companies, Inc. (d) | 238,800 | 2,841,720 | |||||
Oil & Gas - United States Exploration & Production 4.0% | |||||||
Anadarko Petroleum Corporation (d) | 75,500 | 4,424,300 | |||||
Chesapeake Energy Corporation (d) | 264,810 | 3,898,003 | |||||
Devon Energy Corporation | 49,920 | 3,294,720 | |||||
| 11,617,023 | |||||||
Pollution Control - Services 1.5% | |||||||
Stericycle, Inc. (b) | 84,390 | 4,366,339 | |||||
Retail - Clothing/Shoe 1.9% | |||||||
Coach, Inc. (b) | 72,720 | 3,286,217 | |||||
Urban Outfitters, Inc. (b) (d) | 36,260 | 2,208,597 | |||||
| 5,494,814 | |||||||
Retail - Home Furnishings 2.0% | |||||||
Select Comfort Corporation (b) | 204,510 | 5,808,084 | |||||
Retail - Miscellaneous 1.8% | |||||||
PETsMART, Inc. | 155,562 | 5,047,987 | |||||
Retail - Restaurants 0.8% | |||||||
Panera Bread Company Class A (b) (d) | 68,080 | 2,442,710 | |||||
Retail/Wholesale - Office Supplies 1.3% | |||||||
Staples, Inc. | 123,600 | 3,622,716 | |||||
Telecommunications - Equipment 1.3% | |||||||
American Tower Corporation Class A (b) | 96,400 | 1,465,280 | |||||
Avaya, Inc. (b) | 141,930 | 2,241,075 | |||||
| 3,706,355 | |||||||
Telecommunications - Fiber Optics 2.3% | |||||||
Corning, Inc. (b) | 518,390 | 6,770,173 | |||||
Telecommunications - Wireless Equipment 3.2% | |||||||
Research in Motion, Ltd. (b) | 133,440 | 9,132,634 | |||||
Telecommunications - Wireless Services 5.8% | |||||||
Crown Castle International Corporation (b) (d) | 449,800 | 6,634,550 | |||||
NII Holdings, Inc. Class B (b) (d) | 170,980 | 5,760,316 | |||||
Nextel Partners, Inc. (b) (d) | 278,660 | 4,436,267 | |||||
| 16,831,133 | |||||||
Transportation - Airline 2.0% | |||||||
AirTran Holdings, Inc. (b) (d) | 397,450 | 5,619,943 | |||||
Total Common Stocks (Cost $ 233,942,195) | 287,239,458 | ||||||
Short-Term Investments (a) 11.4% | |||||||
Collateral Received for Securities Lending 10.7% | |||||||
Navigator Prime Portfolio | 30,900,750 | $ | 30,900,750 | ||||
Repurchase Agreements (c) 0.7% | |||||||
ABN AMRO Inc. (Dated 6/30/04), 1.40%, Due 7/01/04 (Repurchase proceeds $100,004); Collateralized by: United States Government & Agency Issues | $ | 100,000 | 100,000 | ||||
State Street Bank (Dated 6/30/04), 0.75%, Due 7/01/04 (Repurchase proceeds $1,962,441); Collateralized by: United States Government & Agency Issues | 1,962,400 | 1,962,400 | |||||
| 2,062,400 | |||||||
Total Short-Term Investments (Cost $ 32,963,150) | 32,963,150 | ||||||
Total Investments in Securities (Cost $266,905,345) 110.9% | 320,202,608 | ||||||
Other Assets and Liabilities, Net (10.9%) | (31,511,690 | ) | |||||
Net Assets 100.0% | $ | 288,690,918 | |||||
| Shares or Principal Amount | Value (Note 2) | ||||
Common Stocks 97.4% | |||||
Building - Resident/Commercial 1.9% | |||||
Centex Corporation | 65,000 | $ | 2,973,750 | ||
Commercial Services - Miscellaneous 1.3% | |||||
Jackson Hewitt Tax Service, Inc. (b) | 115,500 | 2,021,250 | |||
Commercial Services - Schools 4.7% | |||||
Apollo Group, Inc. Class A (b) | 45,000 | 3,973,050 | |||
Career Education Corporation (b) | 75,000 | 3,417,000 | |||
| 7,390,050 | |||||
Computer - Local Networks 5.3% | |||||
Cisco Systems, Inc. (b) | 195,000 | 4,621,500 | |||
Polycom, Inc. (b) | 168,000 | 3,764,880 | |||
| 8,386,380 | |||||
Computer - Peripheral Equipment 1.9% | |||||
Zebra Technologies Corporation (b) | 35,000 | 3,045,000 | |||
Computer Software - Education/Entertainment 2.1% | |||||
Electronic Arts, Inc. (b) | 60,000 | 3,273,000 | |||
Computer Software - Medical 2.8% | |||||
eResearch Technology, Inc. (b) | 155,000 | 4,340,000 | |||
Cosmetics - Personal Care 0.0% | |||||
LIFE TIME FITNESS, Inc. (b) | 300 | 6,300 | |||
Diversified Operations 1.9% | |||||
General Electric Company | 95,000 | 3,078,000 | |||
Electronics - Scientific Measuring 4.3% | |||||
Danaher Corporation | 130,000 | 6,740,500 | |||
28
STRONG GROWTH 20 FUND (continued)
| Shares or Principal Amount | Value (Note 2) | ||||||
Electronics - Semiconductor Manufacturing 3.3% | |||||||
Marvell Technology Group, Ltd. (b) | 197,600 | $ | 5,275,920 | ||||
Energy - Other 2.8% | |||||||
Massey Energy Company | 155,000 | 4,372,550 | |||||
Finance - Mortgage & Related Services 4.5% | |||||||
Doral Financial Corporation | 205,000 | 7,072,500 | |||||
Finance - Savings & Loan 2.6% | |||||||
Westcorp | 90,000 | 4,090,500 | |||||
Household - Consumer Electronics 3.5% | |||||||
Harman International Industries, Inc. | 60,000 | 5,460,000 | |||||
Insurance - Diversified 2.0% | |||||||
American International Group, Inc. | 45,000 | 3,207,600 | |||||
Internet - E*Commerce 5.0% | |||||||
eBay, Inc. (b) | 85,000 | 7,815,750 | |||||
Internet - Internet Content 9.9% | |||||||
Ask Jeeves, Inc. (b) | 130,000 | 5,073,900 | |||||
Yahoo! Inc. (b) | 290,000 | 10,535,700 | |||||
| 15,609,600 | |||||||
Internet - Network Security/Solutions 0.8% | |||||||
Digital River, Inc. (b) | 40,000 | 1,305,200 | |||||
Leisure - Gaming/Equipment 5.5% | |||||||
International Game Technology | 110,000 | 4,246,000 | |||||
Station Casinos, Inc. | 90,000 | 4,356,000 | |||||
| 8,602,000 | |||||||
Medical - Generic Drugs 6.2% | |||||||
Teva Pharmaceutical Industries, Ltd. ADR | 145,000 | 9,757,050 | |||||
Medical - Genetics 4.1% | |||||||
Genentech, Inc. (b) | 115,000 | 6,463,000 | |||||
Medical - Products 2.6% | |||||||
Boston Scientific Corporation (b) | 95,000 | 4,066,000 | |||||
Oil & Gas - Field Services 3.9% | |||||||
BJ Services Company (b) | 135,000 | 6,188,400 | |||||
Oil & Gas - United States Exploration & Production 6.5% | |||||||
Ultra Petroleum Corporation (b) | 275,000 | 10,265,750 | |||||
Retail - Clothing/Shoe 4.4% | |||||||
Coach, Inc. (b) | 155,000 | 7,004,450 | |||||
Retail - Home Furnishings 0.0% | |||||||
Design Within Reach, Inc. (b) | 300 | 4,929 | |||||
Telecommunications - Fiber Optics 3.6% | |||||||
Corning, Inc. (b) | 435,000 | 5,681,100 | |||||
Total Common Stocks (Cost $ 117,308,520) | 153,496,529 | ||||||
Short-Term Investments (a) 4.3% | |||||||
Repurchase Agreements (c) | |||||||
ABN AMRO Inc. (Dated 6/30/04), 1.40%, Due 7/01/04 (Repurchase proceeds $5,100,198); Collateralized by: United States Government & Agency Issues | $ | 5,100,000 | 5,100,000 | ||||
State Street Bank (Dated 6/30/04), 0.75%, Due 7/01/04 (Repurchase proceeds $1,612,734); Collateralized by: United States Government & Agency Issues | 1,612,700 | 1,612,700 | |||||
Total Short-Term Investments (Cost $ 6,712,700) | 6,712,700 | ||||||
Total Investments in Securities (Cost $ 124,021,220) 101.7% | 160,209,229 | ||||||
Other Assets and Liabilities, Net (1.7%) | (2,685,414 | ) | |||||
Net Assets 100.0% | $ | 157,523,815 | |||||
| Shares or Principal Amount | Value (Note 2) | ||||
Common Stocks 99.5% | |||||
Auto/Truck - Original Equipment 0.4% | |||||
Eaton Corporation | 105,000 | $ | 6,797,700 | ||
Banks - Midwest 0.5% | |||||
TCF Financial Corporation | 145,000 | 8,417,250 | |||
Banks - Super Regional 1.1% | |||||
Wells Fargo & Company | 310,000 | 17,741,300 | |||
Beverages - Soft Drinks 0.6% | |||||
Cott Corporation (b) | 325,000 | 10,530,000 | |||
Chemicals - Specialty 0.8% | |||||
Praxair, Inc. | 335,000 | 13,369,850 | |||
Commercial Services - Market Research 0.1% | |||||
Corporate Executive Board Company | 32,300 | 1,866,617 | |||
Commercial Services - Miscellaneous 1.7% | |||||
Jackson Hewitt Tax Service, Inc. (b) | 209,000 | 3,657,500 | |||
Paychex, Inc. | 725,000 | 24,563,000 | |||
| 28,220,500 | |||||
Commercial Services - Schools 4.7% | |||||
Apollo Group, Inc. Class A (b) | 395,000 | 34,874,550 | |||
Corinthian Colleges, Inc. (b) | 900,000 | 22,266,000 | |||
Strayer Education, Inc. | 175,000 | 19,524,750 | |||
| 76,665,300 | |||||
Computer - Data Storage 0.6% | |||||
EMC Corporation (b) | 500,000 | 5,700,000 | |||
Xyratex, Ltd. (b) | 322,600 | 4,129,280 | |||
| 9,829,280 | |||||
Computer - IT Services 1.6% | |||||
Accenture, Ltd. Class A (b) | 75,000 | 2,061,000 | |||
Cognizant Technology Solutions Corporation (b) | 965,000 | 24,520,650 | |||
| 26,581,650 | |||||
29
SCHEDULES OF INVESTMENTS IN SECURITIES (continued) | June 30, 2004 (Unaudited) |
STRONG GROWTH FUND (continued)
| Shares or Principal Amount | Value (Note 2) | ||||
Computer - Local Networks 4.9% | |||||
Cisco Systems, Inc. (b) | 1,560,000 | $ | 36,972,000 | ||
Juniper Networks, Inc. (b) | 945,000 | 23,218,650 | |||
Polycom, Inc. (b) | 897,000 | 20,101,770 | |||
| 80,292,420 | |||||
Computer - Manufacturers 3.2% | |||||
Dell, Inc. (b) | 1,450,000 | 51,939,000 | |||
Computer Software - Desktop 2.2% | |||||
Microsoft Corporation | 1,110,000 | 31,701,600 | |||
Red Hat, Inc. (b) | 160,000 | 3,675,200 | |||
| 35,376,800 | |||||
Computer Software - Education/Entertainment 1.6% | |||||
Blackboard, Inc. (b) | 15,500 | 310,775 | |||
Electronic Arts, Inc. (b) | 460,000 | 25,093,000 | |||
| 25,403,775 | |||||
Computer Software - Enterprise 3.3% | |||||
Cognos, Inc. (b) | 470,000 | 16,995,200 | |||
Mercury Interactive Corporation (b) | 650,000 | 32,389,500 | |||
Oracle Systems Corporation (b) | 375,000 | 4,473,750 | |||
| 53,858,450 | |||||
Computer Software - Medical 0.1% | |||||
Cerner Corporation (b) | 55,000 | 2,451,900 | |||
Computer Software - Security 0.1% | |||||
Symantec Corporation (b) | 55,000 | 2,407,900 | |||
Cosmetics - Personal Care 1.4% | |||||
Colgate Palmolive Company | 170,000 | 9,936,500 | |||
LIFE TIME FITNESS, Inc. (b) | 3,200 | 67,200 | |||
The Procter & Gamble Company | 225,000 | 12,249,000 | |||
| 22,252,700 | |||||
Diversified Operations 3.1% | |||||
Agilent Technologies, Inc. (b) | 160,000 | 4,684,800 | |||
General Electric Company | 1,275,000 | 41,310,000 | |||
ITT Industries, Inc. | 50,000 | 4,150,000 | |||
| 50,144,800 | |||||
Electronics - Contract Manufacturing 1.9% | |||||
Flextronics International, Ltd. (b) | 2,000,000 | 31,900,000 | |||
Electronics - Scientific Measuring 0.5% | |||||
PerkinElmer, Inc. | 445,000 | 8,917,800 | |||
Electronics - Semiconductor Manufacturing 7.5% | |||||
Altera Corporation (b) | 355,000 | 7,888,100 | |||
Analog Devices, Inc. | 425,000 | 20,009,000 | |||
Intel Corporation | 635,000 | 17,526,000 | |||
Linear Technology Corporation | 285,000 | 11,248,950 | |||
Marvell Technology Group, Ltd. (b) (d) | 140,000 | 3,738,000 | |||
Maxim Integrated Products, Inc. | 135,000 | 7,076,700 | |||
Microchip Technology, Inc. | 1,050,000 | 33,117,000 | |||
SiRF Technology Holdings, Inc. (b) | 370,000 | 4,835,900 | |||
Xilinx, Inc. | 505,000 | 16,821,550 | |||
| 122,261,200 | |||||
Finance - Consumer/Commercial Loans 1.1% | |||||
SLM Corporation | 450,000 | 18,202,500 | |||
Finance - Investment Brokers 0.8% | |||||
Ameritrade Holding Corporation (b) | 175,000 | 1,986,250 | |||
The Goldman Sachs Group, Inc. | 115,000 | 10,828,400 | |||
| 12,814,650 | |||||
Finance - Mortgage & Related Services 1.5% | |||||
Countrywide Financial Corporation (d) | 250,000 | 17,562,500 | |||
FNMA | 95,000 | 6,779,200 | |||
| 24,341,700 | |||||
Financial Services - Miscellaneous 3.5% | |||||
Alliance Data Systems Corporation (b) | 600,000 | 25,350,000 | |||
American Express Company | 155,000 | 7,963,900 | |||
First Marblehead Corporation (b) | 596,800 | 24,027,168 | |||
| 57,341,068 | |||||
Food - Miscellaneous Preparation 0.6% | |||||
PepsiCo, Inc. | 190,000 | 10,237,200 | |||
Household - Consumer Electronics 1.1% | |||||
Harman International Industries, Inc. | 200,000 | 18,200,000 | |||
Insurance - Diversified 1.4% | |||||
American International Group, Inc. | 315,000 | 22,453,200 | |||
Insurance - Property/Casualty/Title 0.4% | |||||
RenaissanceRe Holdings, Ltd. | 135,000 | 7,283,250 | |||
Internet - E*Commerce 5.1% | |||||
Amazon.com, Inc. (b) | 460,000 | 25,024,000 | |||
eBay, Inc. (b) | 455,000 | 41,837,250 | |||
eCollege.com (b) | 500,000 | 8,000,000 | |||
University of Phoenix Online (b) | 105,000 | 9,196,950 | |||
| 84,058,200 | |||||
Internet - Internet Content 2.4% | |||||
FindWhat.com (b) | 300,000 | 6,942,000 | |||
Yahoo! Inc. (b) | 890,000 | 32,333,700 | |||
| 39,275,700 | |||||
Internet - Network Security/Solutions 0.8% | |||||
Digital River, Inc. (b) | 425,000 | 13,867,750 | |||
Internet - Software 0.3% | |||||
ValueClick, Inc. (b) | 377,300 | 4,520,054 | |||
Leisure - Gaming/Equipment 0.4% | |||||
International Game Technology | 170,000 | 6,562,000 | |||
Machinery - General Industrial 0.6% | |||||
Dover Corporation | 250,000 | 10,525,000 | |||
Media - Radio/TV 2.0% | |||||
News Corporation, Ltd. Sponsored ADR (d) | 225,000 | 7,969,500 | |||
Univision Communications, Inc. Class A (b) | 525,000 | 16,763,250 | |||
XM Satellite Radio Holdings, Inc. Class A (b) | 320,000 | 8,732,800 | |||
| 33,465,550 | |||||
Medical - Biomedical/Biotechnology 3.8% | |||||
Amylin Pharmaceuticals, Inc. (b) | 195,000 | 4,446,000 | |||
Biogen Idec, Inc. (b) | 40,000 | 2,530,000 | |||
Digene Corporation (b) | 555,000 | 20,274,150 | |||
Gilead Sciences, Inc. (b) | 515,000 | 34,505,000 | |||
| 61,755,150 | |||||
Medical - Drug/Diversified 0.5% | |||||
Bone Care International, Inc. (b) | 200,000 | 4,684,000 | |||
MGI Pharma, Inc. (b) | 110,000 | 2,971,100 | |||
| 7,655,100 | |||||
Medical - Ethical Drugs 3.8% | |||||
Allergan, Inc. | 45,000 | 4,028,400 | |||
Eli Lilly & Company | 205,000 | 14,331,550 | |||
Pfizer, Inc. | 1,260,000 | 43,192,800 | |||
| 61,552,750 | |||||
30
STRONG GROWTH FUND (continued)
| Shares or Principal Amount | Value (Note 2) | ||||||
Medical - Generic Drugs 0.7% | |||||||
Teva Pharmaceutical Industries, Ltd. ADR (d) | 175,000 | $ | 11,775,750 | ||||
Medical - Health Maintenance Organizations 0.8% | |||||||
Molina Healthcare, Inc. (b) | 355,000 | 13,553,900 | |||||
Medical - Outpatient/Home Care 0.7% | |||||||
Psychiatric Solutions, Inc. (b) | 455,000 | 11,343,150 | |||||
Medical - Products 4.7% | |||||||
Advanced Neuromodulation Systems, Inc. (b) | 115,000 | 3,772,000 | |||||
Boston Scientific Corporation (b) | 365,000 | 15,622,000 | |||||
Charles River Laboratories International, Inc. (b) | 170,000 | 8,307,900 | |||||
Guidant Corporation | 50,000 | 2,794,000 | |||||
INAMED Corporation (b) | 220,000 | 13,827,000 | |||||
Medtronic, Inc. | 50,000 | 2,436,000 | |||||
Respironics, Inc. (b) | 140,000 | 8,225,000 | |||||
St. Jude Medical, Inc. (b) | 180,000 | 13,617,000 | |||||
Zimmer Holdings, Inc. (b) | 90,000 | 7,938,000 | |||||
| 76,538,900 | |||||||
Medical - Systems/Equipment 0.2% | |||||||
Kyphon, Inc. (b) | 100,000 | 2,818,000 | |||||
Medical/Dental - Services 1.4% | |||||||
Covance, Inc. (b) | 305,000 | 11,766,900 | |||||
VCA Antech, Inc. (b) | 250,000 | 11,205,000 | |||||
| 22,971,900 | |||||||
Medical/Dental - Supplies 1.3% | |||||||
Kinetic Concepts, Inc. (b) | 300,000 | 14,970,000 | |||||
Mentor Corporation | 170,000 | 5,829,300 | |||||
| 20,799,300 | |||||||
Oil & Gas - Drilling 0.2% | |||||||
ENSCO International, Inc. | 135,000 | 3,928,500 | |||||
Oil & Gas - Field Services 0.2% | |||||||
BJ Services Company (b) | 70,000 | 3,208,800 | |||||
Oil & Gas - Machinery/Equipment 1.4% | |||||||
Smith International, Inc. (b) (d) | 420,000 | 23,419,200 | |||||
Oil & Gas - United States Exploration & Production 1.0% | |||||||
XTO Energy, Inc. (d) | 560,000 | 16,682,400 | |||||
Retail - Clothing/Shoe 1.9% | |||||||
Chicos FAS, Inc. (b) | 200,000 | 9,032,000 | |||||
Coach, Inc. (b) | 175,000 | 7,908,250 | |||||
Ross Stores, Inc. | 525,000 | 14,049,000 | |||||
| 30,989,250 | |||||||
Retail - Home Furnishings 0.6% | |||||||
Design Within Reach, Inc. (b) | 3,200 | 52,576 | |||||
Select Comfort Corporation (b) | 350,000 | 9,940,000 | |||||
| 9,992,576 | |||||||
Retail - Leisure Product 2.2% | |||||||
Dick’s Sporting Goods, Inc. (b) | 750,000 | 25,012,500 | |||||
Guitar Center, Inc. (b) | 235,000 | 10,450,450 | |||||
| 35,462,950 | |||||||
Retail - Miscellaneous 4.4% | |||||||
Cabela’s, Inc. (b) | 7,300 | 196,735 | |||||
PETCO Animal Supplies, Inc. (b) | 885,000 | 28,505,850 | |||||
PETsMART, Inc. | 1,325,000 | 42,996,250 | |||||
| 71,698,835 | |||||||
Retail - Restaurants 0.9% | |||||||
P.F. Chang’s China Bistro, Inc. (b) | 155,000 | 6,378,250 | |||||
Red Robin Gourmet Burgers, Inc. (b) | 333,500 | 9,127,895 | |||||
| 15,506,145 | |||||||
Retail - Super/Mini Markets 1.5% | |||||||
Whole Foods Marketing, Inc. (d) | 265,000 | 25,294,250 | |||||
Retail/Wholesale - Building Products 1.9% | |||||||
Fastenal Company | 75,000 | 4,262,250 | |||||
The Home Depot, Inc. | 180,000 | 6,336,000 | |||||
Hughes Supply, Inc. | 215,000 | 12,669,950 | |||||
Lowe’s Companies, Inc. | 150,000 | 7,882,500 | |||||
| 31,150,700 | |||||||
Telecommunications - Fiber Optics 0.5% | |||||||
Corning, Inc. (b) | 600,000 | 7,836,000 | |||||
Transportation - Airline 0.3% | |||||||
JetBlue Airways Corporation (b) | 170,000 | 4,994,600 | |||||
Transportation - Services 0.7% | |||||||
Expeditors International of Washington, Inc. | 225,000 | 11,117,250 | |||||
Total Common Stocks (Cost $ 1,223,631,692) | 1,632,419,370 | ||||||
Short-Term Investments (a) 1.6% | |||||||
Collateral Received for Securities Lending 1.1% | |||||||
Navigator Prime Portfolio | 18,012,000 | 18,012,000 | |||||
Repurchase Agreements (c) 0.5% | |||||||
ABN AMRO Inc. (Dated 6/30/04), 1.40%, Due 7/01/04 (Repurchase proceeds $4,900,191); Collateralized by: United States Government & Agency Issues | $ | 4,900,000 | 4,900,000 | ||||
State Street Bank (Dated 6/30/04), 0.75%, Due 7/01/04 (Repurchase proceeds $2,598,254); Collateralized by: United States Government & Agency Issues | 2,598,200 | 2,598,200 | |||||
| 7,498,200 | |||||||
Total Short-Term Investments (Cost $ 25,510,200) | 25,510,200 | ||||||
Total Investments in Securities (Cost $1,249,141,892) 101.1% | 1,657,929,570 | ||||||
Other Assets and Liabilities, Net (1.1%) | (17,792,793 | ) | |||||
Net Assets 100.0% | $ | 1,640,136,777 | |||||
STRONG LARGE COMPANY GROWTH FUND
| Shares or Principal Amount | Value (Note 2) | ||||
Common Stocks 96.6% | |||||
Apparel - Shoes & Related Manufacturing 1.4% | |||||
NIKE, Inc. Class B | 13,790 | $ | 1,044,592 | ||
Beverages - Alcoholic 2.0% | |||||
Anheuser-Busch Companies, Inc. | 27,590 | 1,489,860 | |||
Commercial Services - Schools 1.6% | |||||
Corinthian Colleges, Inc. (b) | 46,200 | 1,142,988 | |||
Computer - Data Storage 3.0% | |||||
EMC Corporation (b) | 192,900 | 2,199,060 | |||
31
SCHEDULES OF INVESTMENTS IN SECURITIES (continued) | June 30, 2004 (Unaudited) |
STRONG LARGE COMPANY GROWTH FUND (continued)
| Shares or Principal Amount | Value (Note 2) | ||||
Computer - Local Networks 3.2% | |||||
Cisco Systems, Inc. (b) | 64,850 | $ | 1,536,945 | ||
Polycom, Inc. (b) | 36,750 | 823,567 | |||
| 2,360,512 | |||||
Computer - Manufacturers 3.2% | |||||
Dell, Inc. (b) | 66,190 | 2,370,926 | |||
Computer Software - Desktop 1.5% | |||||
Microsoft Corporation | 38,300 | 1,093,848 | |||
Computer Software - Enterprise 3.0% | |||||
SAP AG Sponsored ADR | 53,260 | 2,226,801 | |||
Computer Software - Financial 0.8% | |||||
DST Systems, Inc. (b) | 11,550 | 555,439 | |||
Cosmetics - Personal Care 1.3% | |||||
The Procter & Gamble Company | 17,840 | 971,210 | |||
Diversified Operations 10.7% | |||||
General Electric Company | 88,850 | 2,878,740 | |||
Honeywell International, Inc. | 41,600 | 1,523,808 | |||
Tyco International, Ltd. | 105,350 | 3,491,299 | |||
| 7,893,847 | |||||
Electronics - Semiconductor Manufacturing 3.7% | |||||
Intel Corporation | 98,030 | 2,705,628 | |||
Finance - Mortgage & Related Services 2.1% | |||||
Countrywide Financial Corporation | 22,000 | 1,545,500 | |||
Food - Miscellaneous Preparation 1.4% | |||||
PepsiCo, Inc. | 19,620 | 1,057,126 | |||
Household - Consumer Electronics 1.7% | |||||
Harman International Industries, Inc. | 13,400 | 1,219,400 | |||
Insurance - Diversified 0.7% | |||||
American International Group, Inc. | 6,700 | 477,576 | |||
Insurance - Property/Casualty/Title 3.4% | |||||
The Allstate Corporation | 53,250 | 2,478,787 | |||
Internet - E*Commerce 0.8% | |||||
eBay, Inc. (b) | 6,250 | 574,687 | |||
Internet - Internet Content 2.1% | |||||
Yahoo! Inc. (b) | 43,300 | 1,573,089 | |||
Leisure - Toys/Games/Hobby 2.3% | |||||
Marvel Enterprises, Inc. (b) | 85,350 | 1,666,032 | |||
Machinery - Farm 1.0% | |||||
Deere & Company | 10,750 | 754,005 | |||
Media - Cable TV 0.2% | |||||
EchoStar Communications Corporation Class A (b) | 5,500 | 169,125 | |||
Medical - Biomedical/Biotechnology 1.1% | |||||
Genzyme Corporation (b) | 17,000 | 804,610 | |||
Medical - Ethical Drugs 2.9% | |||||
Medicis Pharmaceutical Corporation Class A | 17,350 | 693,132 | |||
Pfizer, Inc. | 43,000 | 1,474,040 | |||
| 2,167,172 | |||||
Medical - Generic Drugs 3.9% | |||||
Teva Pharmaceutical Industries, Ltd. ADR | 42,950 | 2,890,106 | |||
Medical - Health Maintenance Organizations 3.0% | |||||
Anthem, Inc. (b) | 24,150 | 2,162,874 | |||
Medical - Products 7.5% | |||||
Alcon, Inc. | 22,560 | 1,774,344 | |||
Boston Scientific Corporation (b) | 30,900 | 1,322,520 | |||
Medtronic, Inc. | 26,850 | 1,308,132 | |||
Zimmer Holdings, Inc. (b) | 12,600 | 1,111,320 | |||
| 5,516,316 | |||||
Medical - Systems/Equipment 2.1% | |||||
Fisher Scientific International, Inc. (b) | 27,100 | 1,565,025 | |||
Medical - Wholesale Drugs/Sundries 2.0% | |||||
McKesson Corporation | 42,700 | 1,465,891 | |||
Metal Ores - Gold/Silver 1.7% | |||||
Newmont Mining Corporation Holding Company | 31,450 | 1,219,002 | |||
Metal Ores - Miscellaneous 2.3% | |||||
Phelps Dodge Corporation (b) | 21,400 | 1,658,714 | |||
Oil & Gas - Canadian Exploration & Production 0.4% | |||||
Canadian Natural Resources, Ltd. | 10,550 | 315,445 | |||
Oil & Gas - Canadian Integrated 1.3% | |||||
Suncor Energy, Inc. | 38,500 | 985,985 | |||
Oil & Gas - Drilling 1.0% | |||||
Nabors Industries, Ltd. (b) | 16,000 | 723,520 | |||
Oil & Gas - Field Services 2.0% | |||||
Schlumberger, Ltd. | 23,400 | 1,486,134 | |||
Oil & Gas - Production/Pipeline 1.0% | |||||
The Williams Companies, Inc. | 62,600 | 744,940 | |||
Oil & Gas - United States Exploration & Production 1.6% | |||||
Anadarko Petroleum Corporation | 19,800 | 1,160,280 | |||
Retail - Drug Stores 0.7% | |||||
CVS Corporation | 12,950 | 544,159 | |||
Retail - Major Discount Chains 1.9% | |||||
Wal-Mart Stores, Inc. | 26,400 | 1,392,864 | |||
Retail/Wholesale - Office Supplies 1.5% | |||||
Staples, Inc. | 37,000 | 1,084,470 | |||
Telecommunications - Fiber Optics 2.0% | |||||
Corning, Inc. (b) | 115,300 | 1,505,818 | |||
32
STRONG LARGE COMPANY GROWTH FUND (continued)
| Shares or Principal Amount | Value (Note 2) | |||||
Telecommunications - Wireless Equipment 3.6% | ||||||
Research in Motion, Ltd. (b) | 38,750 | $ | 2,652,050 | |||
Telecommunications - Wireless Services 2.0% | ||||||
Crown Castle International Corporation (b) | 63,950 | 943,263 | ||||
NII Holdings, Inc. Class B (b) | 15,450 | 520,511 | ||||
| 1,463,774 | ||||||
Total Common Stocks (Cost $ 63,662,078) | 71,079,187 | |||||
Short-Term Investments (a) 2.4% | ||||||
Repurchase Agreements (c) | ||||||
State Street Bank (Dated 6/30/04), 0.75%, Due 7/01/04 (Repurchase proceeds $1,726,036); Collateralized by: United States Government & Agency Issues | $ | 1,726,000 | 1,726,000 | |||
Total Short-Term Investments (Cost $1,726,000) | 1,726,000 | |||||
Total Investments in Securities (Cost $65,388,078) 99.0% | 72,805,187 | |||||
Other Assets and Liabilities, Net 1.0% | 742,083 | |||||
Net Assets 100.0% | $ | 73,547,270 | ||||
LEGEND
| (a) | Short-term investments include any security which has a remaining maturity of less than one year and investments in money market funds. |
| (b) | Non-income producing security. |
| (c) | See Note 2(J) of Notes to Financial Statements. |
| (d) | All or a portion of security is on loan. See Note 2(K) of Notes to Financial Statements. |
| (e) | Restricted security. |
Percentages are stated as a percent of net assets.
See Notes to Financial Statements.
33
STATEMENTS OF ASSETS AND LIABILITIES
June 30, 2004 (Unaudited)
(In Thousands, Except Per Share Amounts) | ||||||||||||
Strong Blue Chip | Strong Discovery Fund | Strong Endeavor Fund | ||||||||||
Assets: | ||||||||||||
Investments in Securities, at Value (Cost of $126,197, $159,848 and $23,190, respectively) | $ | 149,104 | $ | 191,913 | $ | 25,125 | ||||||
Receivable for Securities Sold | 4,960 | 3,176 | 483 | |||||||||
Receivable for Fund Shares Sold | — | 53 | — | |||||||||
Dividends and Interest Receivable | 64 | 15 | 17 | |||||||||
Other Assets | 68 | 40 | 11 | |||||||||
Total Assets | 154,196 | 195,197 | 25,636 | |||||||||
Liabilities: | ||||||||||||
Payable for Securities Purchased | 2,372 | 2,819 | 426 | |||||||||
Payable for Fund Shares Redeemed | 73 | 57 | — | |||||||||
Payable Upon Return of Securities on Loan | — | 16,954 | — | |||||||||
Accrued Operating Expenses and Other Liabilities | 137 | 61 | 17 | |||||||||
Total Liabilities | 2,582 | 19,891 | 443 | |||||||||
Net Assets | $ | 151,614 | $ | 175,306 | $ | 25,193 | ||||||
Net Assets Consist of: | ||||||||||||
Capital Stock (Par Value and Paid-in Capital) | $ | 297,681 | $ | 138,447 | $ | 25,933 | ||||||
Undistributed Net Investment Income (Loss) | (577 | ) | (1,042 | ) | (140 | ) | ||||||
Undistributed Net Realized Gain (Loss) | (168,398 | ) | 5,837 | (2,535 | ) | |||||||
Net Unrealized Appreciation (Depreciation) | 22,908 | 32,064 | 1,935 | |||||||||
Net Assets | $ | 151,614 | $ | 175,306 | $ | 25,193 | ||||||
Capital Shares Outstanding (Unlimited Number Authorized) | 13,114 | 8,423 | 2,582 | |||||||||
Net Asset Value Per Share | $ | 11.56 | $ | 20.81 | $ | 9.76 | ||||||
See Notes to Financial Statements.
34
STATEMENTS OF ASSETS AND LIABILITIES (continued)
June 30, 2004 (Unaudited)
(In Thousands, Except Per Share Amounts) | ||||||||
Strong Large Cap | Strong U.S. Emerging Growth Fund | |||||||
Assets: | ||||||||
Investments in Securities, at Value (Cost of $448,788 and $63,010, respectively) | $ | 565,846 | $ | 85,825 | ||||
Receivable for Securities Sold | 2,586 | 386 | ||||||
Receivable for Fund Shares Sold | 20 | — | ||||||
Dividends and Interest Receivable | 238 | 4 | ||||||
Other Assets | 74 | 20 | ||||||
Total Assets | 568,764 | 86,235 | ||||||
Liabilities: | ||||||||
Payable for Securities Purchased | 1,730 | 92 | ||||||
Payable for Fund Shares Redeemed | 111 | 18 | ||||||
Payable Upon Return of Securities on Loan | 6,651 | — | ||||||
Accrued Operating Expenses and Other Liabilities | 182 | 35 | ||||||
Total Liabilities | 8,674 | 145 | ||||||
Net Assets | $ | 560,090 | $ | 86,090 | ||||
Net Assets Consist of: | ||||||||
Capital Stock (Par Value and Paid-in Capital) | $ | 957,857 | $ | 113,273 | ||||
Undistributed Net Investment Income (Loss) | (1,380 | ) | (704 | ) | ||||
Undistributed Net Realized Gain (Loss) | (513,444 | ) | (49,294 | ) | ||||
Net Unrealized Appreciation (Depreciation) | 117,057 | 22,815 | ||||||
Net Assets | $ | 560,090 | $ | 86,090 | ||||
Capital Shares Outstanding (Unlimited Number Authorized) | 25,883 | 5,719 | ||||||
Net Asset Value Per Share | $ | 21.64 | $ | 15.05 | ||||
See Notes to Financial Statements.
35
STATEMENTS OF ASSETS AND LIABILITIES (continued)
June 30, 2004 (Unaudited)
| (In Thousands, Except As Noted) | ||||
Strong Fund | ||||
Assets: | ||||
Investments in Securities, at Value (Cost of $ 266,905) | $ | 320,203 | ||
Receivable for Securities Sold | 4,547 | |||
Receivable for Fund Shares Sold | 62 | |||
Dividends and Interest Receivable | 28 | |||
Other Assets | 61 | |||
Total Assets | 324,901 | |||
Liabilities: | ||||
Payable for Securities Purchased | 5,064 | |||
Payable for Fund Shares Redeemed | 41 | |||
Payable Upon Return of Securities on Loan | 30,901 | |||
Accrued Operating Expenses and Other Liabilities | 204 | |||
Total Liabilities | 36,210 | |||
Net Assets | $ | 288,691 | ||
Net Assets Consist of: | ||||
Capital Stock (Par Value and Paid-in Capital) | $ | 557,517 | ||
Undistributed Net Investment Income (Loss) | (2,218 | ) | ||
Undistributed Net Realized Gain (Loss) | (319,905 | ) | ||
Net Unrealized Appreciation (Depreciation) | 53,297 | |||
Net Assets | $ | 288,691 | ||
Investor Class ($ and shares in full) | ||||
Net Assets | $ | 268,028,226 | ||
Capital Shares Outstanding (Unlimited Number Authorized) | 11,689,875 | |||
Net Asset Value Per Share | $ | 22.93 | ||
Institutional Class ($ and shares in full) | ||||
Net Assets | $ | 3,983,445 | ||
Capital Shares Outstanding (Unlimited Number Authorized) | 172,256 | |||
Net Asset Value Per Share | $ | 23.13 | ||
Advisor Class ($ and shares in full) | ||||
Net Assets | $ | 1,744,120 | ||
Capital Shares Outstanding (Unlimited Number Authorized) | 75,937 | |||
Net Asset Value Per Share | $ | 22.97 | ||
Class K ($ and shares in full) | ||||
Net Assets | $ | 14,935,127 | ||
Capital Shares Outstanding (Unlimited Number Authorized) | 643,436 | |||
Net Asset Value Per Share | $ | 23.21 | ||
See Notes to Financial Statements.
36
STATEMENTS OF ASSETS AND LIABILITIES (continued)
June 30, 2004 (Unaudited)
| (In Thousands, Except As Noted) | ||||
Strong Growth 20 Fund | ||||
Assets: | ||||
Investments in Securities, at Value (Cost of $ 124,021) | $ | 160,209 | ||
Receivable for Securities Sold | 1,486 | |||
Dividends and Interest Receivable | 43 | |||
Other Assets | 31 | |||
Total Assets | 161,769 | |||
Liabilities: | ||||
Payable for Securities Purchased | 4,010 | |||
Payable for Fund Shares Redeemed | 58 | |||
Accrued Operating Expenses and Other Liabilities | 177 | |||
Total Liabilities | 4,245 | |||
Net Assets | $ | 157,524 | ||
Net Assets Consist of: | ||||
Capital Stock (Par Value and Paid-in Capital) | $ | 487,788 | ||
Undistributed Net Investment Income (Loss) | (1,462 | ) | ||
Undistributed Net Realized Gain (Loss) | (364,990 | ) | ||
Net Unrealized Appreciation (Depreciation) | 36,188 | |||
Net Assets | $ | 157,524 | ||
Investor Class ($ and shares in full) | ||||
Net Assets | $ | 152,974,567 | ||
Capital Shares Outstanding (Unlimited Number Authorized) | 11,254,513 | |||
Net Asset Value Per Share | $ | 13.59 | ||
Advisor Class ($ and shares in full) | ||||
Net Assets | $ | 4,549,248 | ||
Capital Shares Outstanding (Unlimited Number Authorized) | 333,615 | |||
Net Asset Value Per Share | $ | 13.64 | ||
See Notes to Financial Statements.
37
STATEMENTS OF ASSETS AND LIABILITIES (continued)
June 30, 2004 (Unaudited)
| (In Thousands) | ||||
Strong Growth Fund | ||||
Assets: | ||||
Investments in Securities, at Value (Cost of $1,249,142) | $ | 1,657,930 | ||
Receivable for Securities Sold | 12,060 | |||
Receivable for Fund Shares Sold | 25 | |||
Dividends and Interest Receivable | 368 | |||
Other Assets | 218 | |||
Total Assets | 1,670,601 | |||
Liabilities: | ||||
Payable for Securities Purchased | 11,556 | |||
Payable for Fund Shares Redeemed | 330 | |||
Payable Upon Return of Securities on Loan | 18,012 | |||
Accrued Operating Expenses and Other Liabilities | 566 | |||
Total Liabilities | 30,464 | |||
Net Assets | $ | 1,640,137 | ||
Net Assets Consist of: | ||||
Capital Stock (Par Value and Paid-in Capital) | $ | 2,047,073 | ||
Undistributed Net Investment Income (Loss) | (7,258 | ) | ||
Undistributed Net Realized Gain (Loss) | (808,466 | ) | ||
Net Unrealized Appreciation (Depreciation) | 408,788 | |||
Net Assets | $ | 1,640,137 | ||
See Notes to Financial Statements.
38
STATEMENTS OF ASSETS AND LIABILITIES (continued)
June 30, 2004 (Unaudited)
Strong Growth Fund | |||
Investor Class | |||
Net Assets | $ | 1,266,735,212 | |
Capital Shares Outstanding (Unlimited Number Authorized) | 69,271,173 | ||
Net Asset Value Per Share | $ | 18.29 | |
Institutional Class | |||
Net Assets | $ | 300,397,151 | |
Capital Shares Outstanding (Unlimited Number Authorized) | 15,953,861 | ||
Net Asset Value Per Share | $ | 18.83 | |
Advisor Class | |||
Net Assets | $ | 7,804,959 | |
Capital Shares Outstanding (Unlimited Number Authorized) | 429,555 | ||
Net Asset Value Per Share | $ | 18.17 | |
Class C | |||
Net Assets | $ | 429,329 | |
Capital Shares Outstanding (Unlimited Number Authorized) | 23,808 | ||
Net Asset Value Per Share | $ | 18.03 | |
Class K | |||
Net Assets | $ | 64,770,126 | |
Capital Shares Outstanding (Unlimited Number Authorized) | 3,493,624 | ||
Net Asset Value Per Share | $ | 18.54 | |
See Notes to Financial Statements.
39
STATEMENTS OF ASSETS AND LIABILITIES (continued)
June 30, 2004 (Unaudited)
| (In Thousands, Except As Noted) | ||||
| Strong Large Company Growth Fund | ||||
Assets: | ||||
Investments in Securities, at Value (Cost of $ 65,388) | $ | 72,805 | ||
Receivable for Securities Sold | 1,476 | |||
Receivable for Fund Shares Sold | 96 | |||
Dividends and Interest Receivable | 53 | |||
Other Assets | 23 | |||
Total Assets | 74,453 | |||
Liabilities: | ||||
Payable for Securities Purchased | 851 | |||
Payable for Fund Shares Redeemed | 18 | |||
Accrued Operating Expenses and Other Liabilities | 37 | |||
Total Liabilities | 906 | |||
Net Assets | $ | 73,547 | ||
Net Assets Consist of: | ||||
Capital Stock (Par Value and Paid-in Capital) | $ | 69,578 | ||
Undistributed Net Investment Income (Loss) | (216 | ) | ||
Undistributed Net Realized Gain (Loss) | (3,232 | ) | ||
Net Unrealized Appreciation (Depreciation) | 7,417 | |||
Net Assets | $ | 73,547 | ||
Investor Class ($ and shares in full) | ||||
Net Assets | $ | 69,510,634 | ||
Capital Shares Outstanding (Unlimited Number Authorized) | 4,854,920 | |||
Net Asset Value Per Share | $ | 14.32 | ||
Class K ($ and shares in full) | ||||
Net Assets | $ | 4,036,636 | ||
Capital Shares Outstanding (Unlimited Number Authorized) | 280,433 | |||
Net Asset Value Per Share | $ | 14.39 | ||
See Notes to Financial Statements.
40
For the Six Months Ended June 30, 2004 (Unaudited)
| (In Thousands) | ||||||||||||
| Strong Blue Chip Fund | Strong Discovery Fund | Strong Endeavor Fund | ||||||||||
Income: | ||||||||||||
Dividends (net of foreign withholding taxes of $2, $2 and $2, respectively) | $ | 685 | $ | 139 | $ | 66 | ||||||
Interest | 20 | 31 | 3 | |||||||||
Total Income | 705 | 170 | 69 | |||||||||
Expenses: | ||||||||||||
Investment Advisory Fees | 390 | 649 | 79 | |||||||||
Administrative Fees | 234 | 216 | 32 | |||||||||
Custodian Fees | 7 | 12 | 3 | |||||||||
Shareholder Servicing Costs | 516 | 264 | 66 | |||||||||
Reports to Shareholders | 113 | 56 | 2 | |||||||||
12b-1 Fees | — | — | 26 | |||||||||
Other | 43 | 47 | 16 | |||||||||
Total Expenses before Expense Offsets | 1,303 | 1,244 | 224 | |||||||||
Expense Offsets (Note 4) | (21 | ) | (32 | ) | (15 | ) | ||||||
Expenses, Net | 1,282 | 1,212 | 209 | |||||||||
Net Investment Income (Loss) | (577 | ) | (1,042 | ) | (140 | ) | ||||||
Realized and Unrealized Gain (Loss): | ||||||||||||
Net Realized Gain (Loss) on Investments | 23,595 | 6,959 | (672 | ) | ||||||||
Net Change in Unrealized Appreciation/Depreciation on Investments | (16,948 | ) | 2,718 | 1,162 | ||||||||
Net Gain (Loss) on Investments | 6,647 | 9,677 | 490 | |||||||||
Net Increase (Decrease) in Net Assets Resulting from Operations | $ | 6,070 | $ | 8,635 | $ | 350 | ||||||
See Notes to Financial Statements.
41
STATEMENTS OF OPERATIONS (continued)
For the Six Months Ended June 30, 2004 (Unaudited)
| (In Thousands) | ||||||||
Strong Large Cap Growth Fund | Strong Emerging | |||||||
Income: | ||||||||
Dividends (net of foreign withholding taxes of $7 and $0, respectively) | $ | 2,179 | $ | 28 | ||||
Interest | 30 | 6 | ||||||
Total Income | 2,209 | 34 | ||||||
Expenses: | ||||||||
Investment Advisory Fees | 1,632 | 349 | ||||||
Administrative Fees | 887 | 139 | ||||||
Custodian Fees | 19 | 7 | ||||||
Shareholder Servicing Costs | 865 | 192 | ||||||
Reports to Shareholders | 152 | 37 | ||||||
12b-1 Fees | — | — | ||||||
Other | 124 | 31 | ||||||
Total Expenses before Expense Offsets | 3,679 | 755 | ||||||
Expense Offsets (Note 4) | (90 | ) | (17 | ) | ||||
Expenses, Net | 3,589 | 738 | ||||||
Net Investment Income (Loss) | (1,380 | ) | (704 | ) | ||||
Realized and Unrealized Gain (Loss): | ||||||||
Net Realized Gain (Loss) on Investments | 38,192 | 12,923 | ||||||
Net Change in Unrealized Appreciation/Depreciation on Investments | (17,700 | ) | (11,448 | ) | ||||
Net Gain (Loss) on Investments | 20,492 | 1,475 | ||||||
Net Increase (Decrease) in Net Assets Resulting from Operations | $ | 19,112 | $ | 771 | ||||
See Notes to Financial Statements.
42
STATEMENTS OF OPERATIONS (continued)
For the Six Months Ended June 30, 2004 (Unaudited)
| (In Thousands) | ||||||||||||||||
| Strong Enterprise Fund | Strong Fund | Strong Growth Fund | Strong Large Company Growth Fund | |||||||||||||
Income: | ||||||||||||||||
Dividends (net of foreign withholding taxes of $7, $15, $24 and $7, respectively) | $ | 338 | $ | 273 | $ | 3,921 | $ | 311 | ||||||||
Interest | 38 | 30 | 89 | 27 | ||||||||||||
Total Income | 376 | 303 | 4,010 | 338 | ||||||||||||
Expenses (Note 4): | ||||||||||||||||
Investment Advisory Fees | 1,079 | 720 | 6,180 | 284 | ||||||||||||
Administrative Fees | 422 | 289 | 2,037 | 113 | ||||||||||||
Custodian Fees | 16 | 11 | 65 | 8 | ||||||||||||
Shareholder Servicing Costs | 850 | 589 | 2,372 | 125 | ||||||||||||
Reports to Shareholders | 201 | 121 | 612 | 19 | ||||||||||||
12b-1 Fees | 2 | 6 | 13 | 92 | ||||||||||||
Other | 86 | 66 | 312 | 37 | ||||||||||||
Total Expenses before Expense Offsets | 2,656 | 1,802 | 11,591 | 678 | ||||||||||||
Expense Offsets | (62 | ) | (37 | ) | (323 | ) | (124 | ) | ||||||||
Expenses, Net | 2,594 | 1,765 | 11,268 | 554 | ||||||||||||
Net Investment Income (Loss) | (2,218 | ) | (1,462 | ) | (7,258 | ) | (216 | ) | ||||||||
Realized and Unrealized Gain (Loss): | ||||||||||||||||
Net Realized Gain (Loss) on: | ||||||||||||||||
Investments | 11,937 | 24,035 | 152,682 | 6,268 | ||||||||||||
Futures Contracts | — | 298 | — | 1 | ||||||||||||
Net Realized Gain (Loss) | 11,937 | 24,333 | 152,682 | 6,269 | ||||||||||||
Net Change in Unrealized Appreciation/Depreciation on Investments | 6,671 | (14,712 | ) | (40,158 | ) | (1,001 | ) | |||||||||
Net Gain (Loss) on Investments | 18,608 | 9,621 | 112,524 | 5,268 | ||||||||||||
Net Increase (Decrease) in Net Assets Resulting from Operations | $ | 16,390 | $ | 8,159 | $ | 105,266 | $ | 5,052 | ||||||||
See Notes to Financial Statements.
43
STATEMENTS OF CHANGES IN NET ASSETS
| (In Thousands) | ||||||||||||||||
| Strong Blue Chip Fund | Strong Discovery Fund | |||||||||||||||
| Six Months Ended June 30, 2004 | Year Ended Dec. 31, 2003 | Six Months Ended June 30, 2004 | Year Ended Dec. 31, 2003 | |||||||||||||
| (Unaudited) | (Unaudited) | |||||||||||||||
Operations: | ||||||||||||||||
Net Investment Income (Loss) | $ | (577 | ) | $ | (1,371 | ) | $ | (1,042 | ) | $ | (1,012 | ) | ||||
Net Realized Gain (Loss) | 23,595 | (20,202 | ) | 6,959 | 19,126 | |||||||||||
Net Change in Unrealized Appreciation/Depreciation | (16,948 | ) | 67,883 | 2,718 | 30,925 | |||||||||||
Net Increase (Decrease) in Net Assets Resulting | ||||||||||||||||
from Operations | 6,070 | 46,310 | 8,635 | 49,039 | ||||||||||||
Distributions: | ||||||||||||||||
From Net Investment Income | — | — | — | (7 | ) | |||||||||||
From Net Realized Gains | — | — | — | (1,805 | ) | |||||||||||
Total Distributions | — | — | — | (1,812 | ) | |||||||||||
Capital Share Transactions (Note 8): | ||||||||||||||||
Net Increase (Decrease) in Net Assets from Capital Share Transactions | (30,766 | ) | (73,292 | ) | (122 | ) | (13,795 | ) | ||||||||
Total Increase (Decrease) in Net Assets | (24,696 | ) | (26,982 | ) | 8,513 | 33,432 | ||||||||||
Net Assets: | ||||||||||||||||
Beginning of Period | 176,310 | 203,292 | 166,793 | 133,361 | ||||||||||||
End of Period | $ | 151,614 | $ | 176,310 | $ | 175,306 | $ | 166,793 | ||||||||
Undistributed Net Investment Income (Loss) | $ | (577 | ) | $ | — | $ | (1,042 | ) | $ | — | ||||||
| Strong Endeavor Fund | Strong Large Cap Growth Fund | |||||||||||||||
| Six Months Ended June 30, 2004 | Year Ended Dec. 31, 2003 | Six Months Ended June 30, 2004 | Year Ended Dec. 31, 2003 | |||||||||||||
| (Unaudited) | (Unaudited) | |||||||||||||||
Operations: | ||||||||||||||||
Net Investment Income (Loss) | $ | (140 | ) | $ | (50 | ) | $ | (1,380 | ) | $ | (3,032 | ) | ||||
Net Realized Gain (Loss) | (672 | ) | 521 | 38,192 | 36,332 | |||||||||||
Net Change in Unrealized Appreciation/Depreciation | 1,162 | 801 | (17,700 | ) | 117,845 | |||||||||||
Net Increase (Decrease) in Net Assets Resulting from Operations | 350 | 1,272 | 19,112 | 151,145 | ||||||||||||
Distributions From Net Investment Income | — | — | — | — | ||||||||||||
Capital Share Transactions (Note 8): | ||||||||||||||||
Net Increase (Decrease) in Net Assets from | ||||||||||||||||
Capital Share Transactions | 20,343 | (447 | ) | (103,153 | ) | (95,908 | ) | |||||||||
Total Increase (Decrease) in Net Assets | 20,693 | 825 | (84,041 | ) | 55,237 | |||||||||||
Net Assets: | ||||||||||||||||
Beginning of Period | 4,500 | 3,675 | 644,131 | 588,894 | ||||||||||||
End of Period | $ | 25,193 | $ | 4,500 | $ | 560,090 | $ | 644,131 | ||||||||
Undistributed Net Investment Income (Loss) | $ | (140 | ) | $ | — | $ | (1,380 | ) | $ | — | ||||||
See Notes to Financial Statements.
44
STATEMENTS OF CHANGES IN NET ASSETS (continued)
| (In Thousands) | ||||||||||||||||
Strong U.S. Emerging Growth Fund | Strong Enterprise Fund | |||||||||||||||
| Six Months Ended June 30, 2004 | Year Ended Dec. 31, 2003 | Six Months Ended June 30, 2004 | Year Ended Dec. 31, 2003 | |||||||||||||
| (Unaudited) | (Unaudited) | |||||||||||||||
Operations: | ||||||||||||||||
Net Investment Income (Loss) | $ | (704 | ) | $ | (1,325 | ) | $ | (2,218 | ) | $ | (3,606 | ) | ||||
Net Realized Gain (Loss) | 12,923 | 7,047 | 11,937 | 41,662 | ||||||||||||
Net Change in Unrealized Appreciation/Depreciation | (11,448 | ) | 26,088 | 6,671 | 43,963 | |||||||||||
Net Increase (Decrease) in Net Assets Resulting from Operations | 771 | 31,810 | 16,390 | 82,019 | ||||||||||||
Distributions From Net Investment Income | — | — | — | — | ||||||||||||
Capital Share Transactions (Note 8): | ||||||||||||||||
Net Increase (Decrease) in Net Assets from Capital Share Transactions | (14,796 | ) | 9,891 | (14,927 | ) | (24,147 | ) | |||||||||
Total Increase (Decrease) in Net Assets | (14,025 | ) | 41,701 | 1,463 | 57,872 | |||||||||||
Net Assets: | ||||||||||||||||
Beginning of Period | 100,115 | 58,414 | 287,228 | 229,356 | ||||||||||||
End of Period | $ | 86,090 | $ | 100,115 | $ | 288,691 | $ | 287,228 | ||||||||
Undistributed Net Investment Income (Loss) | $ | (704 | ) | $ | — | $ | (2,218 | ) | $ | — | ||||||
| Strong Growth 20 Fund | Strong Growth Fund | |||||||||||||||
| Six Months Ended June 30, 2004 | Year Ended Dec. 31, 2003 | Six Months Ended June 30, 2004 | Year Ended Dec. 31, 2003 | |||||||||||||
| (Unaudited) | (Unaudited) | |||||||||||||||
Operations: | ||||||||||||||||
Net Investment Income (Loss) | $ | (1,462 | ) | $ | (3,998 | ) | $ | (7,258 | ) | $ | (16,286 | ) | ||||
Net Realized Gain (Loss) | 24,333 | 24,865 | 152,682 | 145,925 | ||||||||||||
Net Change in Unrealized Appreciation/Depreciation | (14,712 | ) | 43,224 | (40,158 | ) | 320,600 | ||||||||||
Net Increase (Decrease) in Net Assets Resulting from Operations | 8,159 | 64,091 | 105,266 | 450,239 | ||||||||||||
Distributions From Net Investment Income | — | — | — | — | ||||||||||||
Capital Share Transactions (Note 8): | ||||||||||||||||
Net Increase (Decrease) in Net Assets from Capital Share Transactions | (109,527 | ) | 4,591 | (208,044 | ) | (181,638 | ) | |||||||||
Total Increase (Decrease) in Net Assets | (101,368 | ) | 68,682 | (102,778 | ) | 268,601 | ||||||||||
Net Assets: | ||||||||||||||||
Beginning of Period | 258,892 | 190,210 | 1,742,915 | 1,474,314 | ||||||||||||
End of Period | $ | 157,524 | $ | 258,892 | $ | 1,640,137 | $ | 1,742,915 | ||||||||
Undistributed Net Investment Income (Loss) | $ | (1,462 | ) | $ | — | $ | (7,258 | ) | $ | — | ||||||
See Notes to Financial Statements.
45
STATEMENTS OF CHANGES IN NET ASSETS (continued)
| (In Thousands) | ||||||||
| Strong Large Company Growth Fund | ||||||||
| Six Months Ended June 30, 2004 | Year Ended Dec. 31, 2003 | |||||||
| (Unaudited) | ||||||||
Operations: | ||||||||
Net Investment Income (Loss) | $ | (216 | ) | $ | (202 | ) | ||
Net Realized Gain (Loss) | 6,269 | 1,276 | ||||||
Net Change in Unrealized Appreciation/Depreciation | (1,001 | ) | 8,628 | |||||
Net Increase (Decrease) in Net Assets Resulting from Operations | 5,052 | 9,702 | ||||||
Distributions: | ||||||||
From Net Investment Income | ||||||||
Investor Class | — | (14 | ) | |||||
Capital Share Transactions (Note 8): | ||||||||
Net Increase (Decrease) in Net Assets from Capital Share Transactions | (3,280 | ) | 40,712 | |||||
Total Increase (Decrease) in Net Assets | 1,772 | 50,400 | ||||||
Net Assets: | ||||||||
Beginning of Period | 71,775 | 21,375 | ||||||
End of Period | $ | 73,547 | $ | 71,775 | ||||
Undistributed Net Investment Income (Loss) | $ | (216 | ) | $ | — | |||
See Notes to Financial Statements.
46
STRONG BLUE CHIP FUND
| Period Ended | ||||||||||||||||||||||||||||
| June 30, 2004(b) | Dec. 31, 2003 | Dec. 31, 2002 | Dec. 31, 2001 | Dec. 31, 2000(c) | Oct. 31, 2000 | Oct. 31, 1999 | ||||||||||||||||||||||
Selected Per-Share Data(a) | ||||||||||||||||||||||||||||
Net Asset Value, Beginning of Period | $ | 11.12 | $ | 8.62 | $ | 12.36 | $ | 16.56 | $ | 20.99 | $ | 18.10 | $ | 13.24 | ||||||||||||||
Income From Investment Operations: | ||||||||||||||||||||||||||||
Net Investment Income (Loss) | (0.04 | ) | (0.09 | ) | (0.08 | ) | (0.06 | ) | (0.01 | ) | (0.09 | ) | (0.04 | ) | ||||||||||||||
Net Realized and Unrealized Gains (Losses) on Investments | 0.48 | 2.59 | (3.66 | ) | (4.14 | ) | (3.42 | ) | 2.98 | 4.90 | ||||||||||||||||||
Total from Investment Operations | 0.44 | 2.50 | (3.74 | ) | (4.20 | ) | (3.43 | ) | 2.89 | 4.86 | ||||||||||||||||||
Less Distributions: | ||||||||||||||||||||||||||||
From Net Investment Income | — | — | — | — | — | — | (0.00 | )(d) | ||||||||||||||||||||
From Net Realized Gains | — | — | — | — | (1.00 | ) | — | — | ||||||||||||||||||||
Total Distributions | — | — | — | — | (1.00 | ) | — | (0.00 | )(d) | |||||||||||||||||||
Net Asset Value, End of Period | $ | 11.56 | $ | 11.12 | $ | 8.62 | $ | 12.36 | $ | 16.56 | $ | 20.99 | $ | 18.10 | ||||||||||||||
Ratios and Supplemental Data | ||||||||||||||||||||||||||||
Total Return | +3.96 | % | +29.00 | % | –30.26 | % | –25.36 | % | –16.43 | % | +15.97 | % | +36.71 | % | ||||||||||||||
Net Assets, End of Period (In Millions) | $ | 152 | $ | 176 | $ | 203 | $ | 339 | $ | 499 | $ | 616 | $ | 485 | ||||||||||||||
Ratio of Expenses to Average Net Assets before Expense Offsets | 1.7 | %* | 1.7 | % | 1.6 | % | 1.4 | % | 1.1 | %* | 1.1 | % | 1.2 | % | ||||||||||||||
Ratio of Expenses to Average Net Assets | 1.6 | %* | 1.7 | % | 1.6 | % | 1.4 | % | 1.1 | %* | 1.1 | % | 1.2 | % | ||||||||||||||
Ratio of Net Investment Income (Loss) to Average Net Assets | (0.7 | )%* | (0.8 | )% | (0.7 | )% | (0.4 | )% | (0.2 | )%* | (0.5 | )% | (0.3 | )% | ||||||||||||||
Portfolio Turnover Rate | 127.8 | % | 268.5 | % | 214.0 | % | 203.9 | % | 21.2 | % | 67.9 | % | 75.4 | % | ||||||||||||||
STRONG DISCOVERY FUND
| Period Ended | ||||||||||||||||||||||||
| June 30, 2004(b) | Dec. 31 2003 | Dec. 31, 2002 | Dec. 31, 2001 | Dec. 31, 2000 | Dec. 31, 1999 | |||||||||||||||||||
Selected Per-Share Data(a) | ||||||||||||||||||||||||
Net Asset Value, Beginning of Period | $ | 19.73 | $ | 14.42 | $ | 16.84 | $ | 16.39 | $ | 18.64 | $ | 17.95 | ||||||||||||
Income From Investment Operations: | ||||||||||||||||||||||||
Net Investment Income (Loss) | (0.12 | ) | (0.12 | ) | (0.06 | ) | (0.08 | ) | 0.06 | (0.17 | ) | |||||||||||||
Net Realized and Unrealized Gains (Losses) on Investments | 1.20 | 5.64 | (1.91 | ) | 0.76 | 0.51 | 1.08 | |||||||||||||||||
Total from Investment Operations | 1.08 | 5.52 | (1.97 | ) | 0.68 | 0.57 | 0.91 | |||||||||||||||||
Less Distributions: | ||||||||||||||||||||||||
From Net Investment Income | — | (0.00 | )(d) | — | — | (0.04 | ) | — | ||||||||||||||||
From Net Realized Gains | — | (0.21 | ) | (0.45 | ) | (0.23 | ) | (2.78 | ) | (0.22 | ) | |||||||||||||
Total Distributions | — | (0.21 | ) | (0.45 | ) | (0.23 | ) | (2.82 | ) | (0.22 | ) | |||||||||||||
Net Asset Value, End of Period | $ | 20.81 | $ | 19.73 | $ | 14.42 | $ | 16.84 | $ | 16.39 | $ | 18.64 | ||||||||||||
Ratios and Supplemental Data | ||||||||||||||||||||||||
Total Return | +5.47 | % | +38.34 | % | –12.12 | % | +4.17 | % | +3.97 | % | +5.28 | % | ||||||||||||
Net Assets, End of Period (In Millions) | $ | 175 | $ | 167 | $ | 133 | $ | 158 | $ | 165 | $ | 187 | ||||||||||||
Ratio of Expenses to Average Net Assets before Expense Offsets | 1.4 | %* | 1.5 | % | 1.5 | % | 1.5 | % | 1.5 | % | 1.4 | % | ||||||||||||
Ratio of Expenses to Average Net Assets | 1.4 | %* | 1.4 | % | 1.5 | % | 1.5 | % | 1.5 | % | 1.4 | % | ||||||||||||
Ratio of Net Investment Income (Loss) to Average Net Assets | (1.2 | )%* | (0.7 | )% | (0.4 | )% | (0.5 | )% | 0.3 | % | (0.7 | )% | ||||||||||||
Portfolio Turnover Rate | 69.4 | % | 302.2 | % | 420.0 | % | 501.7 | % | 481.8 | % | 214.0 | % | ||||||||||||
| * | Calculated on an annualized basis |
| (a) | Information presented relates to a share of capital stock of the Fund outstanding for the entire period. |
| (b) | For the six months ended June 30, 2004 (Unaudited). |
| (c) | In 2000, the Fund changed its fiscal year-end from October to December. |
| (d) | Amount calculated is less than $0.005. |
See Notes to Financial Statements.
47
FINANCIAL HIGHLIGHTS (continued)
STRONG ENDEAVOR FUND
| Period Ended | ||||||||||||||||
| June 30, 2004(b) | Dec. 31, 2003 | Dec. 31, 2002 | Dec. 31, 2001(c) | |||||||||||||
Selected Per-Share Data(a) | ||||||||||||||||
Net Asset Value, Beginning of Period | $ | 9.32 | $ | 7.03 | $ | 9.94 | $ | 10.00 | ||||||||
Income From Investment Operations: | ||||||||||||||||
Net Investment Income (Loss) | (0.05 | ) | (0.10 | ) | (0.11 | ) | (0.06 | )(d) | ||||||||
Net Realized and Unrealized Gains (Losses) on Investments | 0.49 | 2.39 | (2.80 | ) | 0.00 | (e) | ||||||||||
Total from Investment Operations | 0.44 | 2.29 | (2.91 | ) | (0.06 | ) | ||||||||||
Less Distributions: | ||||||||||||||||
From Net Investment Income | — | — | — | — | ||||||||||||
Total Distributions | — | — | — | — | ||||||||||||
Net Asset Value, End of Period | $ | 9.76 | $ | 9.32 | $ | 7.03 | $ | 9.94 | ||||||||
Ratios and Supplemental Data | ||||||||||||||||
Total Return | +4.72 | % | +32.57 | % | –29.28 | % | –0.60 | % | ||||||||
Net Assets, End of Period (In Millions) | $ | 25 | $ | 5 | $ | 4 | $ | 6 | ||||||||
Ratio of Expenses to Average Net Assets before Expense Offsets | 2.1 | %* | 2.8 | % | 2.7 | % | 3.1 | %* | ||||||||
Ratio of Expenses to Average Net Assets | 2.0 | %* | 1.9 | % | 1.9 | % | 2.2 | %* | ||||||||
Ratio of Net Investment Income (Loss) to Average Net Assets | (1.3 | )%* | (1.1 | )% | (1.2 | )% | (1.2 | )%* | ||||||||
Portfolio Turnover Rate | 93.2 | % | 243.0 | % | 416.8 | % | 391.8 | % | ||||||||
STRONG LARGE CAP GROWTH FUND
| Period Ended | ||||||||||||||||||||||||||||
| June 30, 2004(b) | Dec. 31, 2003 | Dec. 31, 2002 | Dec. 31, 2001 | Dec. 31, 2000(f) | Oct. 31, 2000 | Oct. 31, 1999 | ||||||||||||||||||||||
Selected Per-Share Data(a) | ||||||||||||||||||||||||||||
Net Asset Value, Beginning of Period | $ | 20.94 | $ | 16.51 | $ | 23.55 | $ | 34.77 | $ | 45.49 | $ | 41.52 | $ | 29.10 | ||||||||||||||
Income From Investment Operations: | ||||||||||||||||||||||||||||
Net Investment Income (Loss) | (0.05 | ) | (0.10 | ) | (0.08 | ) | (0.02 | ) | 0.01 | (0.16 | ) | (0.03 | ) | |||||||||||||||
Net Realized and Unrealized Gains (Losses) on Investments | 0.75 | 4.53 | (6.96 | ) | (11.20 | ) | (4.81 | ) | 12.01 | 12.84 | ||||||||||||||||||
Total from Investment Operations | 0.70 | 4.43 | (7.04 | ) | (11.22 | ) | (4.80 | ) | 11.85 | 12.81 | ||||||||||||||||||
Less Distributions: | ||||||||||||||||||||||||||||
From Net Investment Income | — | — | — | (0.00 | )(e) | — | — | (0.01 | ) | |||||||||||||||||||
From Net Realized Gains | — | — | — | — | (5.92 | ) | (7.88 | ) | (0.38 | ) | ||||||||||||||||||
Total Distributions | — | — | — | (0.00 | )(e) | (5.92 | ) | (7.88 | ) | (0.39 | ) | |||||||||||||||||
Net Asset Value, End of Period | $ | 21.64 | $ | 20.94 | $ | 16.51 | $ | 23.55 | $ | 34.77 | $ | 45.49 | $ | 41.52 | ||||||||||||||
Ratios and Supplemental Data | ||||||||||||||||||||||||||||
Total Return | +3.34 | % | +26.83 | % | –29.89 | % | –32.27 | % | –10.34 | % | +28.12 | % | +44.26 | % | ||||||||||||||
Net Assets, End of Period (In Millions) | $ | 560 | $ | 644 | $ | 589 | $ | 976 | $ | 1,574 | $ | 1,769 | $ | 1,253 | ||||||||||||||
Ratio of Expenses to Average Net Assets before Expense Offsets | 1.2 | %* | 1.3 | % | 1.2 | % | 1.1 | % | 1.0 | %* | 1.0 | % | 1.0 | % | ||||||||||||||
Ratio of Expenses to Average Net Assets | 1.2 | %* | 1.3 | % | 1.2 | % | 1.1 | % | 1.0 | %* | 1.0 | % | 1.0 | % | ||||||||||||||
Ratio of Net Investment Income (Loss) to Average Net Assets | (0.5 | )%* | (0.5 | )% | (0.4 | )% | (0.1 | )% | 0.1 | %* | (0.4 | )% | (0.1 | )% | ||||||||||||||
Portfolio Turnover Rate | 41.5 | % | 253.4 | % | 443.2 | % | 468.7 | % | 68.6 | % | 455.0 | % | 402.3 | % | ||||||||||||||
| * | Calculated on an annualized basis |
| (a) | Information presented relates to a share of capital stock of the Fund outstanding for the entire period. (b) For the six months ended June 30, 2004 (Unaudited). |
| (c) | For the period from April 6, 2001 (inception date) to December 31, 2001. |
| (d) | Net investment loss per share represents net investment loss divided by the average shares outstanding throughout the period. |
| (e) | Amount calculated is less than $0.005. |
| (f) | In 2000, the Fund changed its fiscal year-end from October to December. |
See Notes to Financial Statements.
48
FINANCIAL HIGHLIGHTS (continued)
STRONG U.S. EMERGING GROWTH FUND
| Period Ended | ||||||||||||||||||||||||
| June 30, 2004(b) | Dec. 31, 2003 | Dec. 31, 2002 | Dec. 31, 2001 | Dec. 31, 2000 | Dec. 31, 1999 | |||||||||||||||||||
Selected Per-Share Data(a) | ||||||||||||||||||||||||
Net Asset Value, Beginning of Period | $ | 14.90 | $ | 10.02 | $ | 15.17 | $ | 19.17 | $ | 19.59 | $ | 10.00 | ||||||||||||
Income From Investment Operations: | ||||||||||||||||||||||||
Net Investment Income (Loss) | (0.12 | ) | (0.20 | ) | (0.24 | ) | (0.23 | ) | (0.19 | ) | (0.11 | ) | ||||||||||||
Net Realized and Unrealized Gains (Losses) on Investments | 0.27 | 5.08 | (4.91 | ) | (3.77 | ) | 0.22 | 9.99 | ||||||||||||||||
Total from Investment Operations | 0.15 | 4.88 | (5.15 | ) | (4.00 | ) | 0.03 | 9.88 | ||||||||||||||||
Less Distributions: | ||||||||||||||||||||||||
From Net Realized Gains | — | — | — | — | (0.45 | ) | (0.29 | ) | ||||||||||||||||
Total Distributions | — | — | — | — | (0.45 | ) | (0.29 | ) | ||||||||||||||||
Net Asset Value, End of Period | $ | 15.05 | $ | 14.90 | $ | 10.02 | $ | 15.17 | $ | 19.17 | $ | 19.59 | ||||||||||||
Ratios and Supplemental Data | ||||||||||||||||||||||||
Total Return | +1.01 | % | +48.70 | % | –33.95 | % | –20.87 | % | +0.29 | % | +98.86 | % | ||||||||||||
Net Assets, End of Period (In Millions) | $ | 86 | $ | 100 | $ | 58 | $ | 86 | $ | 112 | $ | 36 | ||||||||||||
Ratio of Expenses to Average Net Assets before Expense Offsets | 1.6 | %* | 1.8 | % | 1.9 | % | 1.6 | % | 1.4 | % | 1.9 | % | ||||||||||||
Ratio of Expenses to Average Net Assets | 1.6 | %* | 1.7 | % | 1.9 | % | 1.6 | % | 1.4 | % | 1.8 | % | ||||||||||||
Ratio of Net Investment Income (Loss) to Average Net Assets | (1.5 | )%* | (1.6 | )% | (1.8 | )% | (1.5 | )% | (1.2 | )% | (1.5 | )% | ||||||||||||
Portfolio Turnover Rate | 56.3 | % | 100.3 | % | 171.5 | % | 168.2 | % | 186.8 | % | 281.1 | % | ||||||||||||
STRONG ENTERPRISE FUND — INVESTOR CLASS
| Period Ended | ||||||||||||||||||||||||
| June 30, 2004(b) | Dec. 31, 2003 | Dec. 31, 2002 | Dec. 31, 2001 | Dec. 31, 2000 | Dec. 31, 1999 | |||||||||||||||||||
Selected Per-Share Data(a) | ||||||||||||||||||||||||
Net Asset Value, Beginning of Period | $ | 21.78 | $ | 15.90 | $ | 22.14 | $ | 28.37 | $ | 41.24 | $ | 14.74 | ||||||||||||
Income From Investment Operations: | ||||||||||||||||||||||||
Net Investment Income (Loss) | (0.18 | )(c) | (0.30 | ) | (0.28 | )(c) | (0.31 | ) | (0.28 | ) | (0.09 | ) | ||||||||||||
Net Realized and Unrealized Gains (Losses) on Investments | 1.33 | 6.18 | (5.96 | ) | (5.92 | ) | (12.04 | ) | 27.43 | |||||||||||||||
Total from Investment Operations | 1.15 | 5.88 | (6.24 | ) | (6.23 | ) | (12.32 | ) | 27.34 | |||||||||||||||
Less Distributions: | ||||||||||||||||||||||||
From Net Realized Gains | — | — | — | — | (0.55 | ) | (0.84 | ) | ||||||||||||||||
Total Distributions | — | — | — | — | (0.55 | ) | (0.84 | ) | ||||||||||||||||
Net Asset Value, End of Period | $ | 22.93 | $ | 21.78 | $ | 15.90 | $ | 22.14 | $ | 28.37 | $ | 41.24 | ||||||||||||
Ratios and Supplemental Data | ||||||||||||||||||||||||
Total Return | +5.28 | % | +36.98 | % | –28.18 | % | –21.96 | % | –29.77 | % | +187.83 | % | ||||||||||||
Net Assets, End of Period (In Millions) | $ | 268 | $ | 249 | $ | 224 | $ | 372 | $ | 575 | $ | 571 | ||||||||||||
Ratio of Expenses to Average Net Assets before Expense Offsets | 1.9 | %* | 2.0 | % | 2.0 | % | 1.8 | % | 1.4 | % | 1.4 | % | ||||||||||||
Ratio of Expenses to Average Net Assets | 1.9 | %* | 1.8 | % | 2.0 | % | 1.8 | % | 1.4 | % | 1.4 | % | ||||||||||||
Ratio of Net Investment Income (Loss) to Average Net Assets | (1.6 | )%* | (1.4 | )% | (1.5 | )% | (1.2 | )% | (0.7 | )% | (1.0 | )% | ||||||||||||
Portfolio Turnover Rate(d) | 82.6 | % | 261.2 | % | 376.8 | % | 629.8 | % | 473.7 | % | 178.1 | % | ||||||||||||
| * | Calculated on an annualized basis. |
| (a) | Information presented relates to a share of capital stock of the Fund outstanding for the entire period. |
| (b) | For the six months ended June 30, 2004 (Unaudited). |
| (c) | Net investment income (loss) per share represents net investment income (loss) divided by the average shares outstanding throughout the period. |
| (d) | Calculated on the basis of the Fund as a whole without distinguishing between classes of shares issued. |
See Notes to Financial Statements.
49
FINANCIAL HIGHLIGHTS (continued)
STRONG ENTERPRISE FUND — INSTITUTIONAL CLASS
| Period Ended | ||||||||
| June 30, 2004(b) | Dec. 31, 2003(c) | |||||||
Selected Per-Share Data(a) | ||||||||
Net Asset Value, Beginning of Period | $ | 21.87 | $ | 18.34 | ||||
Income From Investment Operations: | ||||||||
Net Investment Income (Loss) | (0.07 | )(f) | (0.06 | ) | ||||
Net Realized and Unrealized Gains (Losses) on Investments | 1.33 | 3.59 | ||||||
Total from Investment Operations | 1.26 | 3.53 | ||||||
Less Distributions: | ||||||||
From Net Investment Income | — | — | ||||||
Total Distributions | — | — | ||||||
Net Asset Value, End of Period | $ | 23.13 | $ | 21.87 | ||||
Ratios and Supplemental Data | ||||||||
Total Return | +5.76 | % | +19.25 | % | ||||
Net Assets, End of Period (In Millions) | $ | 4 | $ | 2 | ||||
Ratio of Expenses to Average Net Assets before Expense Offsets | 1.0 | %* | 1.2 | %* | ||||
Ratio of Expenses to Average Net Assets | 0.9 | %* | 1.0 | %* | ||||
Ratio of Net Investment Income (Loss) to Average Net Assets | (0.7 | )* | (0.7 | )%* | ||||
Portfolio Turnover Rate(d) | 82.6 | % | 261.2 | % | ||||
STRONG ENTERPRISE FUND — ADVISOR CLASS
| Period Ended | ||||||||||||||||||||
| June 30, 2004(b) | Dec. 31, 2003 | Dec. 31, 2002 | Dec. 31, 2001 | Dec. 31, 2000(e) | ||||||||||||||||
Selected Per-Share Data(a) | ||||||||||||||||||||
Net Asset Value, Beginning of Period | $ | 21.79 | $ | 15.86 | $ | 22.04 | $ | 28.31 | $ | 51.32 | ||||||||||
Income From Investment Operations: | ||||||||||||||||||||
Net Investment Income (Loss) | (0.15 | )(f) | (0.23 | ) | (0.24 | )(f) | (0.21 | ) | (0.03 | ) | ||||||||||
Net Realized and Unrealized Gains (Losses) on Investments | 1.33 | 6.16 | (5.94 | ) | (6.06 | ) | (22.43 | ) | ||||||||||||
Total from Investment Operations | 1.18 | 5.93 | (6.18 | ) | (6.27 | ) | (22.46 | ) | ||||||||||||
Less Distributions: | ||||||||||||||||||||
From Net Realized Gains | — | — | — | — | (0.55 | ) | ||||||||||||||
Total Distributions | — | — | — | — | (0.55 | ) | ||||||||||||||
Net Asset Value, End of Period | $ | 22.97 | $ | 21.79 | $ | 15.86 | $ | 22.04 | $ | 28.31 | ||||||||||
Ratios and Supplemental Data | ||||||||||||||||||||
Total Return | +5.42 | % | +37.39 | % | –28.04 | % | –22.15 | % | –43.68 | % | ||||||||||
Net Assets, End of Period (In Millions) | $ | 2 | $ | 2 | $ | 1 | $ | 1 | $ | 0 | (g) | |||||||||
Ratio of Expenses to Average Net Assets before Expense Offsets | 1.7 | %* | 1.5 | % | 1.8 | % | 2.1 | % | 2.0 | %* | ||||||||||
Ratio of Expenses to Average Net Assets | 1.6 | %* | 1.5 | % | 1.8 | % | 2.1 | % | 1.9 | %* | ||||||||||
Ratio of Net Investment Income (Loss) to Average Net Assets | (1.3 | )%* | (1.1 | )% | (1.3 | )% | (1.6 | )% | (1.2 | )%* | ||||||||||
Portfolio Turnover Rate(d) | 82.6 | % | 261.2 | % | 376.8 | % | 629.8 | % | 473.7 | % | ||||||||||
| * | Calculated on an annualized basis. |
| (a) | Information presented relates to a share of capital stock of the Fund outstanding for the entire period. |
| (b) | For the six months ended June 30, 2004 (Unaudited). |
| (c) | For the period from June 30, 2003 (commencement of class) to December 31, 2003. |
| (d) | Calculated on the basis of the Fund as a whole without distinguishing between classes of shares issued. |
| (e) | For the period from February 24, 2000 (commencement of class) to December 31, 2000. |
| (f) | Net investment income (loss) per share represents net investment income (loss) divided by the average shares outstanding throughout the period. |
| (g) | Amount is less than $500,000. |
See Notes to Financial Statements.
50
FINANCIAL HIGHLIGHTS (continued)
STRONG ENTERPRISE FUND — CLASS K
| Period Ended | ||||||||||||
| June 30, 2004(b) | Dec. 31, 2003 | Dec. 31, 2002(c) | ||||||||||
Selected Per-Share Data(a) | ||||||||||||
Net Asset Value, Beginning of Period | $ | 21.98 | $ | 15.94 | $ | 16.32 | ||||||
Income From Investment Operations: | ||||||||||||
Net Investment Income (Loss) | (0.11 | )(d) | (0.10 | ) | (0.04 | )(d) | ||||||
Net Realized and Unrealized Gains (Losses) on Investments | 1.34 | 6.14 | (0.34 | ) | ||||||||
Total from Investment Operations | 1.23 | 6.04 | (0.38 | ) | ||||||||
Less Distributions: | ||||||||||||
From Net Investment Income | — | — | — | |||||||||
Total Distributions | — | — | — | |||||||||
Net Asset Value, End of Period | $ | 23.21 | $ | 21.98 | $ | 15.94 | ||||||
Ratios and Supplemental Data | ||||||||||||
Total Return | +5.60 | % | +37.89 | % | –2.33 | % | ||||||
Net Assets, End of Period (In Millions) | $ | 15 | $ | 34 | $ | 4 | ||||||
Ratio of Expenses to Average Net Assets before Expense Offsets | 1.3 | %* | 1.3 | % | 1.3 | %* | ||||||
Ratio of Expenses to Average Net Assets | 1.2 | %* | 1.2 | % | 1.1 | %* | ||||||
Ratio of Net Investment Income (Loss) to Average Net Assets | (0.9 | )%* | (0.8 | )% | (0.6 | )%* | ||||||
Portfolio Turnover Rate(e) | 82.6 | % | 261.2 | % | 376.8 | % | ||||||
STRONG GROWTH 20 FUND — INVESTOR CLASS
| Period Ended | ||||||||||||||||||||||||
| June 30, 2004(b) | Dec. 31, 2003 | Dec. 31, 2002 | Dec. 31, 2001 | Dec. 31, 2000 | Dec. 31, 1999 | |||||||||||||||||||
Selected Per-Share Data(a) | ||||||||||||||||||||||||
Net Asset Value, Beginning of Period | $ | 12.96 | $ | 10.19 | $ | 14.74 | $ | 25.13 | $ | 30.63 | $ | 15.44 | ||||||||||||
Income From Investment Operations: | ||||||||||||||||||||||||
Net Investment Income (Loss) | (0.13 | ) | (0.17 | )(d) | (0.21 | ) | (0.15 | ) | (0.10 | ) | (0.08 | ) | ||||||||||||
Net Realized and Unrealized Gains (Losses) on Investments | 0.76 | 2.94 | (4.34 | ) | (10.24 | ) | (3.05 | ) | 16.60 | |||||||||||||||
Total from Investment Operations | 0.63 | 2.77 | (4.55 | ) | (10.39 | ) | (3.15 | ) | 16.52 | |||||||||||||||
Less Distributions: | ||||||||||||||||||||||||
From Net Realized Gains | — | — | — | — | (2.35 | ) | (1.33 | ) | ||||||||||||||||
Total Distributions | — | — | — | — | (2.35 | ) | (1.33 | ) | ||||||||||||||||
Net Asset Value, End of Period | $ | 13.59 | $ | 12.96 | $ | 10.19 | $ | 14.74 | $ | 25.13 | $ | 30.63 | ||||||||||||
Ratios and Supplemental Data | ||||||||||||||||||||||||
Total Return | +4.86 | % | +27.18 | % | –30.87 | % | –41.35 | % | –10.33 | % | +109.48 | % | ||||||||||||
Net Assets, End of Period (In Millions) | $ | 153 | $ | 253 | $ | 184 | $ | 361 | $ | 766 | $ | 466 | ||||||||||||
Ratio of Expenses to Average Net Assets before Expense Offsets | 1.9 | %* | 1.8 | % | 1.9 | % | 1.5 | % | 1.3 | % | 1.4 | % | ||||||||||||
Ratio of Expenses to Average Net Assets | 1.8 | %* | 1.7 | % | 1.9 | % | 1.5 | % | 1.3 | % | 1.4 | % | ||||||||||||
Ratio of Net Investment Income (Loss) to Average Net Assets | (1.5 | )%* | (1.5 | )% | (1.5 | )% | (0.8 | )% | (0.4 | )% | (0.6 | )% | ||||||||||||
Portfolio Turnover Rate(e) | 101.0 | % | 318.1 | % | 460.8 | % | 658.7 | % | 521.0 | % | 432.3 | % | ||||||||||||
| * | Calculated on an annualized basis. |
| (a) | Information presented relates to a share of capital stock of the Fund outstanding for the entire period. |
| (b) | For the six months ended June 30, 2004 (Unaudited). |
| (c) | For the period from August 30, 2002 (commencement of class) to December 31, 2002. |
| (d) | Net investment income (loss) per share represents net investment income (loss) divided by the average shares outstanding throughout the period. |
| (e) | Calculated on the basis of the Fund as a whole without distinguishing between classes of shares issued. |
See Notes to Financial Statements.
51
FINANCIAL HIGHLIGHTS (continued)
STRONG GROWTH 20 FUND — ADVISOR CLASS
| Period Ended | ||||||||||||||||||||
| June 30, 2004(b) | Dec. 31, 2003 | Dec. 31, 2002 | Dec. 31, 2001 | Dec. 31, 2000(c) | ||||||||||||||||
Selected Per-Share Data(a) | ||||||||||||||||||||
Net Asset Value, Beginning of Period | $ | 12.99 | $ | 10.19 | $ | 14.69 | $ | 25.06 | $ | 36.61 | ||||||||||
Income From Investment Operations: | ||||||||||||||||||||
Net Investment Income (Loss) | (0.09 | ) | (0.15 | )(d) | (0.15 | ) | (0.12 | ) | (0.02 | ) | ||||||||||
Net Realized and Unrealized Gains (Losses) on Investments | 0.74 | 2.95 | (4.35 | ) | (10.25 | ) | (9.18 | ) | ||||||||||||
Total from Investment Operations | 0.65 | 2.80 | (4.50 | ) | (10.37 | ) | (9.20 | ) | ||||||||||||
Less Distributions: | ||||||||||||||||||||
From Net Realized Gains | — | — | — | — | (2.35 | ) | ||||||||||||||
Total Distributions | — | — | — | — | (2.35 | ) | ||||||||||||||
Net Asset Value, End of Period | $ | 13.64 | $ | 12.99 | $ | 10.19 | $ | 14.69 | $ | 25.06 | ||||||||||
Ratios and Supplemental Data | ||||||||||||||||||||
Total Return | +5.00 | % | +27.48 | % | –30.63 | % | –41.38 | % | –25.17 | % | ||||||||||
Net Assets, End of Period (In Millions) | $ | 5 | $ | 6 | $ | 7 | $ | 10 | $ | 5 | ||||||||||
Ratio of Expenses to Average Net Assets before Expense Offsets | 1.7 | %* | 1.6 | % | 1.6 | % | 1.6 | % | 2.0 | %* | ||||||||||
Ratio of Expenses to Average Net Assets | 1.6 | %* | 1.5 | % | 1.6 | % | 1.6 | % | 1.9 | %* | ||||||||||
Ratio of Net Investment Income (Loss) to Average Net Assets | (1.3 | )%* | (1.3 | )% | (1.2 | )% | (0.9 | )% | (1.0 | )%* | ||||||||||
Portfolio Turnover Rate(e) | 101.0 | % | 318.1 | % | 460.8 | % | 658.7 | % | 521.0 | % | ||||||||||
STRONG GROWTH FUND — INVESTOR CLASS
| Period Ended | ||||||||||||||||||||||||
| June 30, 2004(b) | Dec. 31, 2003 | Dec. 31, 2002 | Dec. 31, 2001 | Dec. 31, 2000 | Dec. 31, 1999 | |||||||||||||||||||
Selected Per-Share Data(a) | ||||||||||||||||||||||||
Net Asset Value, Beginning of Period | $ | 17.19 | $ | 13.21 | $ | 17.68 | $ | 27.05 | $ | 35.66 | $ | 23.25 | ||||||||||||
Income From Investment Operations: | ||||||||||||||||||||||||
Net Investment Income (Loss) | (0.09 | ) | (0.16 | )(d) | (0.18 | )(d) | (0.15 | ) | (0.17 | ) | (0.18 | ) | ||||||||||||
Net Realized and Unrealized Gains (Losses) on Investments | 1.19 | 4.14 | (4.29 | ) | (9.15 | ) | (3.21 | ) | 17.08 | |||||||||||||||
Total from Investment Operations | 1.10 | 3.98 | (4.47 | ) | (9.30 | ) | (3.38 | ) | 16.90 | |||||||||||||||
Less Distributions: | ||||||||||||||||||||||||
From Net Realized Gains | — | — | — | (0.07 | ) | (5.23 | ) | (4.49 | ) | |||||||||||||||
Total Distributions | — | — | — | (0.07 | ) | (5.23 | ) | (4.49 | ) | |||||||||||||||
Net Asset Value, End of Period | $ | 18.29 | $ | 17.19 | $ | 13.21 | $ | 17.68 | $ | 27.05 | $ | 35.66 | ||||||||||||
Ratios and Supplemental Data | ||||||||||||||||||||||||
Total Return | +6.40 | % | +30.13 | % | –25.28 | % | –34.39 | % | –9.23 | % | +75.06 | % | ||||||||||||
Net Assets, End of Period (In Millions) | $ | 1,267 | $ | 1,366 | $ | 1,256 | $ | 2,022 | $ | 3,411 | $ | 3,354 | ||||||||||||
Ratio of Expenses to Average Net Assets before Expense Offsets | 1.5 | %* | 1.5 | % | 1.6 | % | 1.4 | % | 1.2 | % | 1.2 | % | ||||||||||||
Ratio of Expenses to Average Net Assets | 1.5 | %* | 1.5 | % | 1.6 | % | 1.4 | % | 1.2 | % | 1.2 | % | ||||||||||||
Ratio of Net Investment Income (Loss) to Average Net Assets | (1.0 | )%* | (1.1 | )% | (1.2 | )% | (0.7 | )% | (0.6 | )% | (0.8 | )% | ||||||||||||
Portfolio Turnover Rate(e) | 43.0 | % | 138.8 | % | 248.5 | % | 399.8 | % | 366.3 | % | 324.0 | % | ||||||||||||
| * | Calculated on an annualized basis. |
| (a) | Information presented relates to a share of capital stock of the Fund outstanding for the entire period. |
| (b) | For the six months ended June 30, 2004 (Unaudited). |
| (c) | For the period from February 24, 2000 (commencement of class) to December 31, 2000. |
| (d) | Net investment income (loss) per share represents net investment income (loss) divided by average shares outstanding throughout the year. |
| (e) | Calculated on the basis of the Fund as a whole without distinguishing between the classes of shares issued. |
See Notes to Financial Statements.
52
FINANCIAL HIGHLIGHTS (continued)
STRONG GROWTH FUND — INSTITUTIONAL CLASS
Period Ended | ||||||||||||||||||||
| June 30, 2004(b) | Dec. 31, 2003 | Dec. 31, 2002 | Dec. 31, 2001 | Dec. 31, 2000(c) | ||||||||||||||||
Selected Per-Share Data(a) | ||||||||||||||||||||
Net Asset Value, Beginning of Period | $ | 17.65 | $ | 13.48 | $ | 17.91 | $ | 27.17 | $ | 43.74 | ||||||||||
Income From Investment Operations: | ||||||||||||||||||||
Net Investment Income (Loss) | (0.04 | ) | (0.07 | )(d) | (0.08 | )(d) | (0.02 | ) | (0.01 | ) | ||||||||||
Net Realized and Unrealized Gains (Losses) on Investments | 1.22 | 4.24 | (4.35 | ) | (9.17 | ) | (11.33 | ) | ||||||||||||
Total from Investment Operations | 1.18 | 4.17 | (4.43 | ) | (9.19 | ) | (11.34 | ) | ||||||||||||
Less Distributions: | ||||||||||||||||||||
From Net Realized Gains | — | — | — | (0.07 | ) | (5.23 | ) | |||||||||||||
Total Distributions | — | — | — | (0.07 | ) | (5.23 | ) | |||||||||||||
Net Asset Value, End of Period | $ | 18.83 | $ | 17.65 | $ | 13.48 | $ | 17.91 | $ | 27.17 | ||||||||||
Ratios and Supplemental Data | ||||||||||||||||||||
Total Return | +6.69 | % | +30.93 | % | –24.73 | % | –33.84 | % | –25.72 | % | ||||||||||
Net Assets, End of Period (In Millions) | $ | 300 | $ | 311 | $ | 195 | $ | 73 | $ | 18 | ||||||||||
Ratio of Expenses to Average Net Assets before Expense Offsets | 0.9 | %* | 0.9 | % | 0.9 | % | 0.9 | % | 0.8 | %* | ||||||||||
Ratio of Expenses to Average Net Assets | 0.9 | %* | 0.9 | % | 0.9 | % | 0.9 | % | 0.8 | %* | ||||||||||
Ratio of Net Investment Income (Loss) to Average Net Assets | (0.4 | )%* | (0.5 | )% | (0.5 | )% | (0.3 | )% | (0.1 | )%* | ||||||||||
Portfolio Turnover Rate(e) | 43.0 | % | 138.8 | % | 248.5 | % | 399.8 | % | 366.3 | % | ||||||||||
STRONG GROWTH FUND — ADVISOR CLASS
Period Ended | ||||||||||||||||||||
| June 30, 2004(b) | Dec. 31, 2003 | Dec. 31, 2002 | Dec. 31, 2001 | Dec. 31, 2000(c) | ||||||||||||||||
Selected Per-Share Data(a) | ||||||||||||||||||||
Net Asset Value, Beginning of Period | $ | 17.09 | $ | 13.14 | $ | 17.58 | $ | 26.96 | $ | 43.74 | ||||||||||
Income From Investment Operations: | ||||||||||||||||||||
Net Investment Income (Loss) | (0.11 | ) | (0.16 | )(d) | (0.17 | )(d) | (0.15 | ) | (0.02 | ) | ||||||||||
Net Realized and Unrealized Gains (Losses) on Investments | 1.19 | 4.11 | (4.27 | ) | (9.16 | ) | (11.53 | ) | ||||||||||||
Total from Investment Operations | 1.08 | 3.95 | (4.44 | ) | (9.31 | ) | (11.55 | ) | ||||||||||||
Less Distributions: | ||||||||||||||||||||
From Net Realized Gains | — | — | — | (0.07 | ) | (5.23 | ) | |||||||||||||
Total Distributions | — | — | — | (0.07 | ) | (5.23 | ) | |||||||||||||
Net Asset Value, End of Period | $ | 18.17 | $ | 17.09 | $ | 13.14 | $ | 17.58 | $ | 26.96 | ||||||||||
Ratios and Supplemental Data | ||||||||||||||||||||
Total Return | +6.32 | % | +30.06 | % | –25.26 | % | –34.54 | % | –26.21 | % | ||||||||||
Net Assets, End of Period (In Millions) | $ | 8 | $ | 9 | $ | 10 | $ | 14 | $ | 4 | ||||||||||
Ratio of Expenses to Average Net Assets before Expense Offsets | 1.6 | %* | 1.6 | % | 1.6 | % | 1.6 | % | 2.0 | %* | ||||||||||
Ratio of Expenses to Average Net Assets | 1.6 | %* | 1.6 | % | 1.6 | % | 1.6 | % | 1.9 | %* | ||||||||||
Ratio of Net Investment Income (Loss) to Average Net Assets | (1.1 | )%* | (1.1 | )% | (1.2 | )% | (1.0 | )% | (0.9 | )%* | ||||||||||
Portfolio Turnover Rate(e) | 43.0 | % | 138.8 | % | 248.5 | % | 399.8 | % | 366.3 | % | ||||||||||
| * | Calculated on an annualized basis. |
| (a) | Information presented relates to a share of capital stock of the Fund outstanding for the entire period. |
| (b) | For the six months ended June 30, 2004 (Unaudited). |
| (c) | For the period from February 24, 2000 (commencement of class) to December 31, 2000. |
| (d) | Net investment income (loss) per share represents net investment income (loss) divided by average shares outstanding throughout the year. |
| (e) | Calculated on the basis of the Fund as a whole without distinguishing between the classes of shares issued. |
See Notes to Financial Statements.
53
FINANCIAL HIGHLIGHTS (continued)
STRONG GROWTH FUND — CLASS C
| Period Ended | ||||||||||||
| June 30, 2004(b) | Dec. 31, 2003 | Dec. 31, 2002(c) | ||||||||||
Selected Per-Share Data(a) | ||||||||||||
Net Asset Value, Beginning of Period | $ | 17.03 | $ | 13.21 | $ | 13.44 | ||||||
Income From Investment Operations: | ||||||||||||
Net Investment Income (Loss) | (0.20 | ) | (0.32 | )(d) | 0.00 | (d)(e) | ||||||
Net Realized and Unrealized Gains (Losses) on Investments | 1.20 | 4.14 | (0.23 | ) | ||||||||
Total from Investment Operations | 1.00 | 3.82 | (0.23 | ) | ||||||||
Less Distributions: | ||||||||||||
From Net Investment Income | — | — | — | |||||||||
Total Distributions | — | — | — | |||||||||
Net Asset Value, End of Period | $ | 18.03 | $ | 17.03 | $ | 13.21 | ||||||
Ratios and Supplemental Data | ||||||||||||
Total Return | +5.87 | % | +28.92 | % | –1.71 | % | ||||||
Net Assets, End of Period (In Millions) | $ | 0 | (f) | $ | 1 | $ | 0 | (f) | ||||
Ratio of Expenses to Average Net Assets before Expense Offsets | 3.6 | %* | 4.3 | % | 2.3 | %* | ||||||
Ratio of Expenses to Average Net Assets | 2.5 | %* | 2.5 | % | 2.3 | %* | ||||||
Ratio of Net Investment Income (Loss) to Average Net Assets | (2.0 | )%* | (2.0 | )% | 0.0 | %*(e) | ||||||
Portfolio Turnover Rate(g) | 43.0 | % | 138.8 | % | 248.5 | % | ||||||
STRONG GROWTH FUND — CLASS K
| Period Ended | ||||||||||||
| June 30, 2004(b) | Dec. 31, 2003 | Dec. 31, 2002(h) | ||||||||||
Selected Per-Share Data(a) | ||||||||||||
Net Asset Value, Beginning of Period | $ | 17.38 | $ | 13.29 | $ | 13.53 | ||||||
Income From Investment Operations: | ||||||||||||
Net Investment Income (Loss) | (0.04 | ) | (0.08 | )(d) | (0.01 | )(d) | ||||||
Net Realized and Unrealized Gains (Losses) on Investments | 1.20 | 4.17 | (0.23 | ) | ||||||||
Total from Investment Operations | 1.16 | 4.09 | (0.24 | ) | ||||||||
Less Distributions: | ||||||||||||
From Net Investment Income | — | — | — | |||||||||
Total Distributions | — | — | — | |||||||||
Net Asset Value, End of Period | $ | 18.54 | $ | 17.38 | $ | 13.29 | ||||||
Ratios and Supplemental Data | ||||||||||||
Total Return | +6.67 | % | +30.78 | % | –1.77 | % | ||||||
Net Assets, End of Period (In Millions) | $ | 65 | $ | 56 | $ | 13 | ||||||
Ratio of Expenses to Average Net Assets before Expense Offsets | 1.3 | %* | 1.2 | % | 1.3 | %* | ||||||
Ratio of Expenses to Average Net Assets | 1.0 | %* | 1.0 | % | 1.0 | %* | ||||||
Ratio of Net Investment Income (Loss) to Average Net Assets | (0.5 | )%* | (0.5 | )% | (0.7 | )%* | ||||||
Portfolio Turnover Rate(g) | 43.0 | % | 138.8 | % | 248.5 | % | ||||||
| * | Calculated on an annualized basis. |
| (a) | Information presented relates to a share of capital stock of the Fund outstanding for the entire period. |
| (b) | For the six months ended June 30, 2004 (Unaudited). |
| (c) | For the period from December 26, 2002 (commencement of class) to December 31, 2002. |
| (d) | Net investment income (loss) per share represents net investment income (loss) divided by average shares outstanding throughout the year. |
| (e) | Amount calculated is less than $0.005 or 0.05%. |
| (f) | Amount is less than $500,000. |
| (g) | Calculated on the basis of the Fund as a whole without distinguishing between the classes of shares issued. |
| (h) | For the period from August 30, 2002 (commencement of class) to December 31, 2002. |
See Notes to Financial Statements.
54
FINANCIAL HIGHLIGHTS (continued)
STRONG LARGE COMPANY GROWTH FUND — INVESTOR CLASS
| Period Ended | ||||||||||||||||||||||||||||
| June 30, 2004(b) | Dec. 31, 2003 | Dec. 31, 2002(c) | Sept. 30, 2002(d) | Sept. 30, 2001 | Sept. 30, 2000 | Sept. 30, 1999 | ||||||||||||||||||||||
Selected Per-Share Data(a) | ||||||||||||||||||||||||||||
Net Asset Value, Beginning of Period | $ | 13.36 | $ | 10.66 | $ | 10.25 | $ | 12.17 | $ | 19.15 | $ | 13.12 | $ | 9.80 | ||||||||||||||
Income From Investment Operations: | ||||||||||||||||||||||||||||
Net Investment Income | (0.04 | ) | (0.04 | ) | (0.00 | )(e) | 0.31 | 0.32 | 0.29 | 0.18 | ||||||||||||||||||
Net Realized and Unrealized Gains (Losses) on Investments | 1.00 | (f) | 2.75 | (f) | 0.45 | (1.93 | ) | (5.09 | ) | 6.26 | 3.33 | |||||||||||||||||
Total from Investment Operations | 0.96 | 2.71 | 0.45 | (1.62 | ) | (4.77 | ) | 6.55 | 3.51 | |||||||||||||||||||
Less Distributions: | ||||||||||||||||||||||||||||
From Net Investment Income | — | (0.01 | ) | (0.04 | ) | (0.27 | ) | (0.32 | ) | (0.27 | ) | (0.19 | ) | |||||||||||||||
From Net Realized Gains | — | — | — | (0.03 | ) | (1.89 | ) | (0.25 | ) | — | ||||||||||||||||||
Total Distributions | — | (0.01 | ) | (0.04 | ) | (0.30 | ) | (2.21 | ) | (0.52 | ) | (0.19 | ) | |||||||||||||||
Net Asset Value, End of Period | $ | 14.32 | $ | 13.36 | $ | 10.66 | $ | 10.25 | $ | 12.17 | $ | 19.15 | $ | 13.12 | ||||||||||||||
Ratios and Supplemental Data | ||||||||||||||||||||||||||||
Total Return | +7.19 | % | +25.41 | % | +4.38 | % | –13.69 | % | –26.22 | % | +50.67 | % | +35.98 | % | ||||||||||||||
Net Assets, End of Period | $ | 70 | $ | 71 | $ | 21 | $ | 18 | $ | 33 | $ | 37 | $ | 9 | ||||||||||||||
Ratio of Expenses to Average Net Assets before Expense Offsets | 1.8 | %* | 1.8 | % | 1.9 | %* | 1.7 | % | 1.6 | % | 1.6 | % | 3.1 | % | ||||||||||||||
Ratio of Expenses to Average Net Assets | 1.5 | %* | 1.5 | % | 1.3 | %* | 1.5 | % | 1.5 | % | 1.5 | % | 1.5 | % | ||||||||||||||
Ratio of Net Investment Income (Loss) to Average Net Assets | (0.6 | )%* | (0.5 | )% | 0.2 | %* | 2.3 | % | 2.2 | % | 1.8 | % | 1.5 | % | ||||||||||||||
Portfolio Turnover Rate(g) | 151.0 | % | 229.0 | % | 71.8 | % | 311.3 | % | 285.3 | % | 180.8 | % | 120.2 | % | ||||||||||||||
STRONG LARGE COMPANY GROWTH FUND — CLASS K
| Period Ended | ||||||||
| June 30, 2004(b) | Dec. 31, 2003(h) | |||||||
Selected Per-Share Data(a) | ||||||||
Net Asset Value, Beginning of Period | $ | 13.40 | $ | 11.96 | ||||
Income From Investment Operations: | ||||||||
Net Investment Income | (0.00 | )(e) | (0.00 | )(e) | ||||
Net Realized and Unrealized Gains (Losses) on Investments | 0.99 | (f) | 1.44 | (i) | ||||
Total from Investment Operations | 0.99 | 1.44 | ||||||
Less Distributions: | ||||||||
From Net Investment Income | — | — | ||||||
Total Distributions | — | — | ||||||
Net Asset Value, End of Period | $ | 14.39 | $ | 13.40 | ||||
Ratios and Supplemental Data | ||||||||
Total Return | +7.39 | % | +12.04 | % | ||||
Net Assets, End of Period (In Millions) | $ | 4 | $ | 1 | ||||
Ratio of Expenses to Average Net Assets before Expense Offsets | 1.4 | %* | 2.1 | %* | ||||
Ratio of Expenses to Average Net Assets | 1.0 | %* | 0.9 | %* | ||||
Ratio of Net Investment Income (Loss) to Average Net Assets | (0.2 | )%* | (0.0 | )%*(e) | ||||
Portfolio Turnover Rate(g) | 151.0 | % | 229.0 | % | ||||
| * | Calculated on an annualized basis. |
| (a) | Information presented relates to a share of capital stock of the Fund outstanding for the entire period. |
| (b) | For the six months ended June 30, 2004 (Unaudited). |
| (c) | In 2002, the Fund changed its fiscal year-end from September to December. |
| (d) | Effective September 5, 2002, Strong Capital Management, Inc. assumed the investment advisory responsibilities from Rockhaven Asset Management, LLC. |
| (e) | Amount calculated is less than $0.005 or 0.05%. |
| (f) | Includes $0.01 in redemption fees (Note 2R). |
| (g) | Calculated on the basis of the Fund as a whole without distinguishing between the classes of shares issued. |
| (h) | For the period from June 30, 2003 (commencement of class) through December 31, 2003. |
| (i) | Includes $0.02 in redemption fees (Note 2R). |
See Notes to Financial Statements.
55
June 30, 2004 (Unaudited)
| 1. | Organization |
The accompanying financial statements represent the following Strong Growth Funds (the “Funds”), each with its own investment objectives and policies:
| • | Strong Blue Chip Fund(1) (a series fund of Strong Conservative Equity Funds, Inc.) |
| • | Strong Discovery Fund(1) (a series fund of Strong Discovery Fund, Inc.) |
| • | Strong Endeavor Fund(1) (a series fund of Strong Opportunity Fund, Inc.) |
| • | Strong Large Cap Growth Fund(1) (a series fund of Strong Large Cap Growth Fund, Inc.) |
| • | Strong U.S. Emerging Growth Fund(1) (a series fund of Strong Equity Funds, Inc.) |
| • | Strong Enterprise Fund(1) (a series fund of Strong Equity Funds, Inc.) |
| • | Strong Growth 20 Fund(2) (a series fund of Strong Equity Funds, Inc.) |
| • | Strong Large Company Growth Fund(1) (a series fund of Strong Equity Funds, Inc.) |
| (1) | Diversified Fund. |
| (2) | Non-diversified Fund. |
Each Fund is an open-end management investment company registered under the Investment Company Act of 1940, as amended (“1940 Act”).
Strong Blue Chip Fund, Strong Discovery Fund, Strong Endeavor Fund, Strong Large Cap Growth Fund, and Strong U.S. Emerging Growth Fund offer Investor Class shares. Strong Enterprise Fund offers Investor Class, Institutional Class, Advisor Class, and Class K shares. Strong Growth 20 Fund offers Investor Class and Advisor Class shares. Strong Growth Fund offers Investor Class, Institutional Class, Advisor Class, Class C, and Class K shares. Strong Large Company Growth Fund offers Investor Class and Class K shares. All classes of shares differ principally in their respective administration, transfer agent, and distribution expenses and sales charges, if any. All classes of shares have identical rights to earnings, assets, and voting privileges, except for class-specific expenses and exclusive rights to vote on matters affecting only individual classes.
Investor Class shares are available to the general public, Institutional Class shares are generally available to investors that meet certain higher initial investment minimums, Advisor Class shares and Class C shares are available only through financial professionals, and Class K shares are primarily available through retirement plans.
Effective June 30, 2003 (public launch July 1, 2003), Strong Enterprise Fund issued an additional class of shares: Institutional Class shares.
Effective June 30, 2003 (public launch July 1, 2003), Strong Large Company Growth Fund issued an additional class of shares: Class K shares.
| 2. | Significant Accounting Policies |
The following is a summary of significant accounting policies followed by the Funds in the preparation of their financial statements.
| (A) | Security Valuation — Securities of the Funds traded on a national securities exchange are valued each business day at the last sales price. Securities traded on the NASDAQ Stock Market are valued each business day using the NASDAQ Official Closing Price (“NOCP”). Exchange-traded securities for which there were no transactions and NASDAQ-traded securities for which there is no NOCP are valued at the mean of the bid and ask prices. Securities for which market quotations are not readily available are fair valued as determined in good faith under the general supervision of the Board of Directors. Occasionally, events affecting the value of foreign investments and exchange rates occur between the time at which those items are determined and the close of trading on the New York Stock Exchange. Such events would not normally be reflected in a calculation of the Funds’ net asset values on that day. If events that materially affect the value of the Funds’ foreign investments or the foreign currency exchange rates occur during such period, the investments will be fair valued as determined in good faith under the general supervision of the Board of Directors. Securities that are purchased within 60 days of their stated maturity are valued at amortized cost, which approximates fair value. |
The Funds may own certain securities that are restricted as to resale. Restricted securities include Section 4(2) commercial paper, securities issued in a private placement, or securities eligible for resale pursuant to Rule 144A under the Securities Act of 1933. Restricted securities may be determined to be liquid or illiquid. Securities are deemed illiquid based upon guidelines established by the Funds’ Board of Directors. Illiquid securities are valued after giving due consideration to pertinent factors, such as recent private sales, market conditions, and the issuer’s financial performance. The Funds held no restricted and illiquid securities at June 30, 2004.
56
| (B) | Federal Income and Excise Taxes and Distributions to Shareholders — The Funds intend to comply with the requirements of the Internal Revenue Code of 1986, as amended, applicable to regulated investment companies and to distribute substantially all of their taxable income to their shareholders in a manner which results in no tax cost to the Funds. Therefore, no federal income or excise tax provision is recorded. |
Undistributed income or net realized gains for financial statement purposes may differ from what is determined for federal income tax purposes due to differences in the timing, recognition, and characterization of income, expense, and capital gain items for financial statement and tax purposes. Where appropriate, reclassifications between net asset accounts are made for such differences that are permanent in nature. The Funds may utilize earnings and profits distributed to shareholders on redemptions of shares as part of the dividends paid deduction.
Strong Discovery Fund, Strong Endeavor Fund, Strong Large Cap Growth Fund, Strong U.S. Emerging Growth Fund, Strong Enterprise Fund, Strong Growth 20 Fund, Strong Growth Fund, and Strong Large Company Growth Fund generally pay dividends from net investment income and distribute net realized capital gains, if any, at least annually. Strong Blue Chip Fund generally pays dividends from net investment income quarterly and distributes net realized capital gains, if any, at least annually.
| (C) | Realized Gains and Losses on Investment Transactions — Investment security transactions are recorded as of the trade date. Gains or losses realized on investment transactions are determined by comparing the identified cost of the security lot sold with the net sales proceeds. |
| (D) | Certain Investment Risks — The Funds may utilize derivative instruments including options, futures, and other instruments with similar characteristics to the extent that they are consistent with the Funds’ investment objectives and limitations. The Funds intend to use such derivative instruments primarily to hedge or protect itself from adverse movements in securities’ prices, foreign currencies, or interest rates. The use of these instruments involves certain risks, including the possibility that the future value of the underlying assets or indices fluctuate (in the case of futures and options), the derivative becomes illiquid, an imperfect correlation arises between the value of the derivative and the underlying assets or indices, or that the counterparty fails to perform its obligations when due. |
Investments in foreign-denominated assets or forward foreign currency contracts may involve greater risks than domestic investments such as foreign-related risks created by currency rate fluctuations, foreign political and economic instability, foreign financial reporting standards and taxes, and foreign securities markets and issuer regulation. Foreign securities may be less liquid than domestic securities.
| (E) | Futures — Upon entering into a futures contract, the Funds segregate cash and/or other liquid investments equal to the minimum “initial margin” requirements of the exchange and the futures commission merchant or broker. Each Fund designates liquid securities as collateral on open futures contracts. During the term of the futures contract, the Funds also receive credit from, or pay to, the futures commission merchant or broker an amount of cash or liquid assets equal to the daily fluctuation in the value of the futures contract. Such receipts or payments are known as “variation margin” and are recorded as unrealized gains or losses by the Funds. When the futures contract is closed, a realized gain or loss is recorded equal to the difference between the value of the futures contract at the time it was opened and the value at the time it was closed. |
| (F) | Written Options — The Funds may write put or call options. Premiums received by the Funds upon writing put or call options are recorded as an asset with a corresponding liability that is subsequently adjusted daily to the current market value of the option. Changes between the initial premiums received and the current market value of the options are recorded as unrealized gains or losses by the Funds. When a written option is closed, expired, or exercised, the Funds realize a gain or loss and the liability is eliminated. The Funds continue to bear the risk of adverse movements in the price of the underlying asset during the period of the written option, although any potential loss during the period would be reduced by the amount of the option premium received by the Funds. Each Fund designates liquid securities or cash on its books to cover its financial exposure on open written options contracts. |
| (G) | Foreign Currency Conversion — Securities and other assets and liabilities initially expressed in foreign currencies are converted daily into U.S. dollars based upon current exchange rates. Purchases and sales of foreign securities and foreign income are converted into U.S. dollars based upon currency exchange rates prevailing on the respective dates of such transactions. The effect of changes in foreign exchange rates on realized and unrealized security gains or losses is reflected as a component of such gains or losses. |
| (H) | Forward Foreign Currency Exchange Contracts — Forward foreign currency exchange contracts are valued at the forward rate and are marked-to-market daily. The change in market value is recorded as an unrealized gain or loss. When the contract is closed, the Funds record an exchange gain or loss equal to the difference between the value of the contract at the time it was opened and the value at the time it was closed. |
57
NOTES TO FINANCIAL STATEMENTS (continued)
June 30, 2004 (Unaudited)
| (I) | Short Positions — The Funds may engage in short sale transactions. For financial statement purposes, an amount equal to the settlement amount is included in the Statements of Assets and Liabilities as an asset and an equivalent liability. The amount of the liability is subsequently marked-to-market to reflect the current value of the short position. Changes between the amount of the liability and the current market value of the short positions are recorded as unrealized gains or losses. The Funds are liable to the buyer for any dividends payable on securities while those securities are in a short position. These dividends are an expense of the Fund and are included in Other Expenses in the Statement of Operations. If the Funds sell securities short while also holding the long position in the security, they may protect unrealized gains, but will lose the opportunity to profit on such securities if the price rises. If the Funds sell securities short when not holding the long position in the security, they will experience a loss if the market price of the security increases between the date of the short sale and the date the security is replaced. |
| (J) | Repurchase Agreements — The Funds may enter into repurchase agreements with institutions that the Funds’ investment advisor, Strong Capital Management, Inc. (the “Advisor”), has determined are creditworthy. Each repurchase transaction is recorded at cost, which approximates fair value. The Funds require that the collateral, represented by cash and/or securities (primarily U.S. government securities), in a repurchase transaction be maintained in a segregated account under the control of the Funds’ custodial bank in a manner sufficient to enable the Funds to liquidate those securities in the event of a default of the counterparty. On a daily basis, the Funds’ custodial bank monitors the value of the collateral, including accrued interest, to ensure it is at least equal to the amounts owed to the Funds under each repurchase agreement. |
| (K) | Securities Lending — The Funds have entered into a Securities Lending Agreement (the “Agreement”) with Deutsche Bank, which was subsequently assumed by State Street Bank and Trust Company. Under the terms of the Agreement, the Funds may lend portfolio securities to qualified institutional borrowers in order to earn additional income. The Agreement requires that loans are collateralized at all times by cash and cash equivalents equal to at least 102% of the market value of the aggregate loaned securities, plus accrued interest, and the collateral is marked-to-market daily. Cash collateral received is invested in repurchase agreements, investment funds, government obligations, and/or bank obligations. |
At June 30, 2004, Strong Discovery Fund, Strong Large Cap Growth Fund, Strong Enterprise Fund, and Strong Growth Fund had securities with a market value of $16,398,623, $6,442,867, $29,817,784, and $17,480,782, respectively, on loan and had received $16,953,906, $6,651,057, $30,900,750, and $18,012,000, respectively, in collateral (both are included within Investments in the Statements of Assets and Liabilities). Amounts earned as interest on investments of cash collateral, net of rebates and other securities lending expenses, are included in Interest Income in the Statements of Operations. For the six months ended June 30, 2004, the securities lending income totaled $12,951, $6,022, $17,254, and $12,085 for Strong Discovery Fund, Strong Large Cap Growth Fund, Strong Enterprise Fund, and Strong Growth Fund, respectively.
The three primary risks associated with securities lending are: a borrower defaulting on its obligation to return the securities loaned resulting in a shortfall on the posted collateral; a principal loss arising from the lending agent’s investment of cash collateral; and the inability of the lending Fund to recall a security in time to exercise valuable voting rights or sell the security. In each case, the lending agent has indemnified the Funds for these types of losses.
| (L) | Directed Brokerage — The Funds direct certain portfolio trades to brokers who, in turn, pay a portion of the Funds’ expenses not attributable to the Advisor or its affiliates. Such amounts are included in Expense Offsets reported in the Funds’ Statements of Operations and in Note 4. |
| (M) | Earnings Credit Arrangements — Credits are earned on positive cash balances maintained in custodian accounts. These credits serve to reduce the custodian’s fees incurred by certain Funds and are included in Expense Offsets reported in the Funds’ Statements of Operations and in Note 4. |
| (N) | Expenses — The Funds and other affiliated Strong Funds contract for certain services on a collective basis. The majority of the expenses are directly identifiable to an individual Fund. Expenses that are not readily identifiable to a specific Fund will be allocated in such a manner as deemed equitable, taking into consideration, among other things, the nature and type of expense and the relative sizes of the Strong Funds. |
| (O) | Use of Estimates — The preparation of financial statements in conformity with accounting principles generally accepted in the United States of America requires management to make estimates and assumptions that affect the reported amounts in these financial statements. Actual results could differ from those estimates. |
| (P) | Guarantees and Indemnifications — In the normal course of business, the Funds enter into contracts with service providers that contain general indemnification clauses. The Funds’ maximum exposure under these arrangements is unknown, as this would involve future claims that may be made against the Funds that have not yet occurred. However, based on experience, the Funds expect the risk of loss to be remote. |
58
| (Q) | Other — Dividend income and distributions to shareholders are recorded on the ex-dividend date. Interest income is recorded on the accrual basis and includes amortization of premiums and discounts on the interest method. Income, expenses (other than expenses attributable to a specific class), and realized and unrealized gains or losses on investments are allocated to each class of shares based on its relative shares outstanding. |
| (R) | Redemption Fees — Investor Class shares of Strong Large Company Growth Fund held for 360 calendar days or less after purchase are subject to a redemption fee of 1.00%, based on the redeemed share’s market value. Redemption fees are paid directly to the Fund. The amount collected for the period is included in Capital Stock reported in the Statements of Assets and Liabilities and in Note 8. |
| 3. | Related Party Transactions |
The Advisor provides investment advisory and related services to the Funds. Strong Investor Services, Inc. (the “Administrator”), an affiliate of the Advisor, provides administrative, transfer agent, and related services to the Funds. Certain officers and, until December 2, 2003, certain directors of the Funds are or were affiliated with the Advisor and the Administrator. Investment advisory and administration fees, which are established by terms of the advisory and administration agreements, are based on the following annualized rates of the average daily net assets of the respective Fund:
| Administrative Fees | ||||||||||||||||||
| Advisory Fees | Investor Class | Institutional Class | Advisor Class | Class C | Class K | |||||||||||||
Strong Blue Chip Fund | 0.50 | % | 0.30 | % | * | * | * | * | ||||||||||
Strong Discovery Fund | 0.75 | % | 0.25 | % | * | * | * | * | ||||||||||
Strong Endeavor Fund | 0.75 | %(1) | 0.30 | % | * | * | * | * | ||||||||||
Strong Large Cap Growth Fund | 0.60 | %(2) | 0.30 | % | * | * | * | * | ||||||||||
Strong U.S. Emerging Growth Fund | 0.75 | %(1) | 0.30 | % | * | * | * | * | ||||||||||
Strong Enterprise Fund | 0.75 | %(1) | 0.30 | % | 0.02 | % | 0.30 | % | * | 0.25 | % | |||||||
Strong Growth 20 Fund | 0.75 | %(1) | 0.30 | % | * | 0.30 | % | * | * | |||||||||
Strong Growth Fund | 0.75 | %(1) | 0.30 | % | 0.02 | % | 0.30 | % | 0.30 | % | 0.25 | % | ||||||
Strong Large Company Growth Fund | 0.75 | %(1) | 0.30 | % | * | * | * | 0.25 | % | |||||||||
| * | Does not offer share class. |
| (1) | The investment advisory fees are 0.75% for assets under $4 billion, 0.725% for the next $2 billion assets, and 0.70% for assets $6 billion and above. |
| (2) | The investment advisory fees are 0.60% for first $35 million assets and 0.55% for assets over $35 million. |
The Funds’ Advisor and/or Administrator may voluntarily waive or absorb certain expenses at their discretion. The Advisor and/or Administrator has contractually agreed to waive its fees and/or absorb expenses for the Investor Class shares of the Strong Large Company Growth Fund to keep Net Annual Operating Expenses at no more than 1.50%. This agreement may only be terminated by the Board of Directors of the Funds, but not before May 1, 2005. The Advisor and/or Administrator has contractually agreed to waive and/or absorb expenses until May 1, 2005, to keep Net Annual Operating Expenses of the Investor Class of Strong Endeavor Fund and Strong Enterprise Fund at no more than 2.00%, Class C of Strong Growth Fund at no more than 2.50%, Class K of Strong Enterprise Fund at no more than 1.20% and Class K of Strong Growth Fund and Strong Large Company Growth Fund at no more than 0.99%.
Transfer agent and related service fees for the Investor Class shares are paid at an annual rate of $27.00 for each open shareholder account and $4.20 for each closed shareholder account. Transfer agent and related service fees for the Institutional Class, Advisor Class, Class C, and Class K shares are paid at an annual rate of 0.015%, 0.20%, 0.20%, and 0.20%, respectively, of the average daily net assets of each respective class. Transfer agent fees are recorded in Shareholder Servicing Costs in the Funds’ Statements of Operations. The Administrator also allocates to each Fund certain charges or credits resulting from transfer agency banking activities based on each Class’ level of subscription and redemption activity. Transfer Agency Banking Charges allocated to the Funds by the Administrator, if any, are included in Other Expenses in the Funds’ Statements of Operations. Transfer Agency Banking Credits allocated by the Administrator, if any, serve to reduce the transfer agent expenses incurred by the Funds and are included in Expense Offsets in the Funds’ Statements of Operations and in Note 4. The Administrator is also compensated for certain other out-of-pocket expenses related to transfer agent services.
Strong Endeavor Fund, Strong Large Company Growth Fund, Strong Enterprise Fund, Strong Growth 20 Fund, and Strong Growth Fund have adopted a Rule 12b-1 distribution and service plan under the 1940 Act on behalf of the Investor Class shares of Strong Endeavor Fund and Strong Large Company Growth Fund, the Advisor Class shares of Strong Enterprise Fund, Strong Growth 20 Fund, and Strong Growth Fund and the Class C shares of Strong Growth Fund. Under the plan, Strong Investments, Inc. (the “Distributor,” and an affiliate of the Advisor) is paid an annual rate of 0.25% of the average daily net assets of the
59
NOTES TO FINANCIAL STATEMENTS (continued)
June 30, 2004 (Unaudited)
Investor Class shares and the Advisor Class shares and 1.00% for Class C shares as compensation for services provided and expenses incurred, including amounts paid to brokers or dealers, in connection with the sale of each Class’ shares. See Note 4.
Strong Growth Fund’s Class C shares have a maximum 1.00% contingent deferred sales charge if shares are sold within one year of their original purchase date. For the six months ended June 30, 2004, the Distributor received no aggregate contingent deferred sales charges from the redemption of Class C shares for Strong Growth Fund. Sales charges are not an expense of the Funds and are not reflected in the financial statements of the Funds. Sales charges may be waived in limited circumstances.
Next Century Growth Investors, LLC (“Next Century Growth”), an affiliate of the Advisor, manages the investments of Strong U.S. Emerging Growth Fund under a subadvisory agreement with the Advisor. Next Century Growth is compensated by the Advisor (not the Fund) and bears all of its own expenses in providing subadvisory services.
The Funds may invest cash in money market funds managed by the Advisor, subject to certain limitations set by the Fund’s Board of Directors and applicable law.
Certain information regarding related party transactions, excluding the effects of waivers and absorptions, for the six months ended June 30, 2004, is as follows:
| Payable to/ (Receivable From) Advisor or Administrator at June 30, 2004 | Shareholder Servicing and Other Related Expenses Paid to Administrator | Transfer Agency Banking Charges/(Credits) | Unaffiliated Directors’ and Independent Officers’ Fees | |||||||||
Strong Blue Chip Fund | $ | 91,790 | $ | 517,270 | $ | 4,895 | $ | 4,716 | ||||
Strong Discovery Fund | 37,817 | 265,135 | 1,652 | 4,404 | ||||||||
Strong Endeavor Fund | 12,589 | 66,067 | 258 | 585 | ||||||||
Strong Large Cap Growth Fund | 145,798 | 866,304 | 8,180 | 17,266 | ||||||||
Strong U.S. Emerging Growth Fund | 28,829 | 193,371 | 1,670 | 3,122 | ||||||||
Strong Enterprise Fund | 101,700 | 852,361 | 8,503 | 7,533 | ||||||||
Strong Growth 20 Fund | 115,145 | 590,918 | 5,025 | 6,650 | ||||||||
Strong Growth Fund | 364,592 | 2,377,947 | 24,934 | 46,582 | ||||||||
Strong Large Company Growth Fund | 22,934 | 125,640 | 2,691 | 1,607 | ||||||||
| 4. | Expenses and Expense Offsets |
For the six months ended June 30, 2004, the class specific expenses are as follows:
| Administrative Fees | Shareholder Servicing Costs | Reports to Shareholders | 12b-1 Fees | Other | |||||||||||
Strong Enterprise Fund | |||||||||||||||
Investor Class | $ | 389,678 | $ | 824,831 | $ | 193,928 | $ | — | $ | 9,372 | |||||
Institutional Class | 283 | 216 | 1,782 | — | 1 | ||||||||||
Advisor Class | 2,570 | 1,761 | 759 | 2,142 | 28 | ||||||||||
Class K | 29,360 | 23,502 | 4,456 | — | 1,153 | ||||||||||
Strong Growth 20 Fund | |||||||||||||||
Investor Class | 282,051 | 583,829 | 119,505 | — | 6,786 | ||||||||||
Advisor Class | 7,329 | 4,901 | 1,518 | 6,108 | 427 | ||||||||||
Strong Growth Fund | |||||||||||||||
Investor Class | 1,924,924 | 2,285,560 | 464,557 | — | 15,696 | ||||||||||
Institutional Class | 30,081 | 22,669 | 127,046 | — | 14,428 | ||||||||||
Advisor Class | 12,725 | 8,551 | 2,163 | 10,605 | 80 | ||||||||||
Class C | 714 | 492 | 2,947 | 2,374 | 17 | ||||||||||
Class K | 68,849 | 55,079 | 14,821 | — | 309 | ||||||||||
Strong Large Company Growth Fund | |||||||||||||||
Investor Class | 110,926 | 122,984 | 18,043 | 92,438 | 3,521 | ||||||||||
Class K | 2,128 | 1,710 | 982 | — | 115 | ||||||||||
60
For the six months ended June 30, 2004, the expense offsets are as follows:
| Expense Waivers and Absorptions | Transfer Agency Banking Credits | Directed Brokerage Credits | Earnings Credits | ||||||||||||
Strong Blue Chip Fund | $ | (20,946 | ) | $ | — | $ | — | $ | (24 | ) | |||||
Strong Discovery Fund | (21,245 | ) | — | (10,263 | ) | (68 | ) | ||||||||
Strong Endeavor Fund | (13,358 | ) | — | (1,886 | ) | (32 | ) | ||||||||
Strong Large Cap Growth Fund | (67,289 | ) | — | (22,121 | ) | (355 | ) | ||||||||
Strong U.S. Emerging Growth Fund | (12,152 | ) | — | (4,791 | ) | (86 | ) | ||||||||
Strong Enterprise Fund | |||||||||||||||
Investor Class | (14,749 | ) | — | — | — | ||||||||||
Institutional Class | (367 | ) | — | — | — | ||||||||||
Advisor Class | (170 | ) | — | — | — | ||||||||||
Class K | (10,875 | ) | — | — | — | ||||||||||
Fund Level | (26,647 | ) | — | (8,987 | ) | (98 | ) | ||||||||
Strong Growth 20 Fund | |||||||||||||||
Investor Class | (12,540 | ) | — | — | — | ||||||||||
Advisor Class | (566 | ) | — | — | — | ||||||||||
Fund Level | (16,515 | ) | — | (6,924 | ) | (116 | ) | ||||||||
Strong Growth Fund | |||||||||||||||
Investor Class | (45,067 | ) | — | — | — | ||||||||||
Institutional Class | (1,063 | ) | — | — | — | ||||||||||
Advisor Class | (710 | ) | — | — | — | ||||||||||
Class C | (2,462 | ) | — | — | — | ||||||||||
Class K | (79,810 | ) | — | — | — | ||||||||||
Fund Level | (150,035 | ) | — | (43,487 | ) | (355 | ) | ||||||||
Strong Large Company Growth Fund | |||||||||||||||
Investor Class | (106,538 | ) | — | — | — | ||||||||||
Class K | (3,383 | ) | — | — | — | ||||||||||
Fund Level | (7,059 | ) | — | (7,296 | ) | (17 | ) | ||||||||
| 5. | Line of Credit |
The Strong Funds have established a line of credit agreement (“LOC”) with certain financial institutions, which expires October 8, 2004, to be used for temporary or emergency purposes. Combined borrowings among all participating Strong Funds are subject to a $350 million cap on the total LOC. For an individual Fund, borrowings under the LOC are limited to either the lesser of 15% of the market value of the Fund’s total assets or any explicit borrowing limits in the Fund’s registration statement. The principal amount of each borrowing under the LOC is due not more than 45 days after the date of the borrowing. Borrowings under the LOC bear interest based on prevailing market rates as defined in the LOC. A commitment fee of 0.09% per annum is incurred on the unused portion of the LOC and is allocated to all participating Strong Funds based on their net asset values. Strong Blue Chip Fund, Strong Discovery Fund, Strong Endeavor Fund, Strong Large Cap Growth Fund, Strong Enterprise Fund, Strong Growth 20 Fund, Strong Growth Fund, and Strong Large Company Growth Fund had no borrowings under the LOC during the period. Strong U.S. Emerging Growth Fund had minimal borrowings during the period. At June 30, 2004, there were no outstanding borrowings by the Funds under the LOC.
| 6. | Investment Transactions |
The aggregate purchases and sales of long-term securities during the six months ended June 30, 2004, are as follows:
| Purchases | Sales | |||||
Strong Blue Chip Fund | $ | 196,841,301 | $ | 230,589,990 | ||
Strong Discovery Fund | 117,513,808 | 125,092,588 | ||||
Strong Endeavor Fund | 37,444,555 | 17,686,551 | ||||
Strong Large Cap Growth Fund | 244,715,739 | 359,326,903 | ||||
Strong U.S. Emerging Growth Fund | 52,422,443 | 69,312,983 | ||||
Strong Enterprise Fund | 237,099,076 | 248,552,235 | ||||
Strong Growth 20 Fund | 191,725,213 | 302,937,635 | ||||
Strong Growth Fund | 707,643,429 | 901,766,077 | ||||
Strong Large Company Growth Fund | 111,943,187 | 117,463,976 | ||||
There were no purchases or sales of long-term U.S. government securities during the six months ended June 30, 2004.
61
NOTES TO FINANCIAL STATEMENTS (continued)
June 30, 2004 (Unaudited)
| 7. | Income Tax Information |
The following information for the Funds is presented on an income tax basis as of June 20, 2004:
| Cost of Investments | Gross Unrealized Appreciation | Gross Unrealized (Depreciation) | Net Unrealized Appreciation/ (Depreciation) on Investments | ||||||||||
Strong Blue Chip Fund | $ | 126,226,140 | $ | 23,500,380 | $ | (622,087 | ) | $ | 22,878,293 | ||||
Strong Discovery Fund | 160,522,961 | 32,431,064 | (1,041,435 | ) | 31,389,629 | ||||||||
Strong Endeavor Fund | 23,236,986 | 2,196,594 | (308,566 | ) | 1,888,028 | ||||||||
Strong Large Cap Growth Fund | 474,118,923 | 93,651,302 | (1,924,502 | ) | 91,726,800 | ||||||||
Strong U.S. Emerging Growth Fund | 63,526,651 | 24,067,602 | (1,769,369 | ) | 22,298,233 | ||||||||
Strong Enterprise Fund | 268,459,392 | 52,456,800 | (713,584 | ) | 51,743,216 | ||||||||
Strong Growth 20 Fund | 125,263,317 | 37,387,072 | (2,441,160 | ) | 34,945,912 | ||||||||
Strong Growth Fund | 1,284,615,657 | 380,777,575 | (7,463,662 | ) | 373,313,913 | ||||||||
Strong Large Company Growth Fund | 66,066,089 | 7,161,836 | (422,738 | ) | 6,739,098 | ||||||||
The difference between cost amounts for financial statement and federal income tax purposes is due primarily to timing differences in recognizing certain gains and losses on security transactions.
The capital loss carryovers (expiring in varying amounts through 2011) as of December 31, 2003, and tax basis post-October losses as of December 31, 2003, which are not recognized for tax purposes until the first day of the following fiscal year, are:
| Net Capital Loss Carryovers | Post-October Losses | |||||
Strong Blue Chip Fund | $ | 191,484,823 | $ | — | ||
Strong Discovery Fund | — | 682,734 | ||||
Strong Endeavor Fund | 1,843,685 | 1,311 | ||||
Strong Large Cap Growth Fund | 523,964,290 | 5,676,937 | ||||
Strong U.S. Emerging Growth Fund | 61,877,628 | — | ||||
Strong Enterprise Fund | 329,347,329 | 398,910 | ||||
Strong Growth 20 Fund | 386,580,002 | — | ||||
Strong Growth Fund | 911,084,232 | — | ||||
Strong Large Company Growth Fund | 7,696,647 | — | ||||
| 8. | Capital Share Transactions |
| Strong Blue Chip Fund | Strong Discovery Fund | |||||||||||||||
| Six Months Ended June 30, 2004 | Year Ended Dec. 31, 2003 | Six Months Ended June 30, 2004 | Year Ended Dec. 31, 2003 | |||||||||||||
| (Unaudited) | (Unaudited) | |||||||||||||||
Capital Share Transactions of Each of the Funds Were as Follows: | ||||||||||||||||
Proceeds from Shares Sold | $ | 8,614,606 | $ | 38,554,582 | $ | 38,251,608 | $ | 72,860,267 | ||||||||
Proceeds from Reinvestment of Distributions | — | — | — | 1,765,655 | ||||||||||||
Payment for Shares Redeemed | (39,380,407 | ) | (111,846,495 | ) | (38,373,846 | ) | (88,420,497 | ) | ||||||||
Net Increase (Decrease) in Net Assets from Capital Share Transactions | $ | (30,765,801 | ) | $ | (73,291,913 | ) | $ | (122,238 | ) | $ | (13,794,575 | ) | ||||
Transactions in Shares of Each of the Funds Were as Follows: | ||||||||||||||||
Sold | 762,352 | 4,237,712 | 1,857,501 | 4,453,708 | ||||||||||||
Issued in Reinvestment of Distributions | — | — | — | 93,470 | ||||||||||||
Redeemed | (3,510,607 | ) | (11,971,115 | ) | (1,886,469 | ) | (5,340,622 | ) | ||||||||
Net Increase (Decrease) in Shares | (2,748,255 | ) | (7,733,403 | ) | (28,968 | ) | (793,444 | ) | ||||||||
62
| Strong Endeavor Fund | Strong Large Cap Growth Fund | |||||||||||||||
| Six Months Ended June 30, 2004 | Year Ended Dec. 31, 2003 | Six Months Ended June 30, 2004 | Year Ended Dec. 31, 2003 | |||||||||||||
| (Unaudited) | (Unaudited) | |||||||||||||||
Capital Share Transactions of Each of the Funds Were as Follows: | ||||||||||||||||
Proceeds from Shares Sold | $ | 24,035,440 | $ | 2,761,167 | $ | 14,509,132 | $ | 119,300,083 | ||||||||
Proceeds from Reinvestment of Distributions | — | — | — | — | ||||||||||||
Payment for Shares Redeemed | (3,692,167 | ) | (3,208,236 | ) | (117,661,765 | ) | (215,208,135 | ) | ||||||||
Net Increase (Decrease) in Net Assets from Capital Share Transactions | $ | 20,343,273 | $ | (447,069 | ) | $ | (103,152,633 | ) | $ | (95,908,052 | ) | |||||
Transactions in Shares of Each of the Funds Were as Follows: | ||||||||||||||||
Sold | 2,484,197 | 352,819 | 683,207 | 6,748,415 | ||||||||||||
Issued in Reinvestment of Distributions | — | — | — | — | ||||||||||||
Redeemed | (385,018 | ) | (392,692 | ) | (5,559,338 | ) | (11,659,100 | ) | ||||||||
Net Increase (Decrease) in Shares of the Fund | 2,099,179 | (39,873 | ) | (4,876,131 | ) | (4,910,685 | ) | |||||||||
| Strong U.S. Emerging Growth Fund | ||||||||
| Six Months Ended June 30, 2004 | Year Ended Dec. 31, 2003 | |||||||
| (Unaudited) | ||||||||
Capital Share Transactions of the Fund Were as Follows: | ||||||||
Proceeds from Shares Sold | $ | 23,807,206 | $ | 80,614,500 | ||||
Proceeds from Reinvestment of Distributions | — | — | ||||||
Payment for Shares Redeemed | (38,602,972 | ) | (70,723,291 | ) | ||||
Net Increase (Decrease) in Net Assets from Capital Share Transactions | $ | (14,795,766 | ) | $ | 9,891,209 | |||
Transactions in Shares of the Fund Were as Follows: | ||||||||
Sold | 1,548,817 | 6,579,270 | ||||||
Issued in Reinvestment of Distributions | — | — | ||||||
Redeemed | (2,550,536 | ) | (5,686,579 | ) | ||||
Net Increase (Decrease) in Shares of the Fund | (1,001,719 | ) | 892,691 | |||||
63
NOTES TO FINANCIAL STATEMENTS (continued)
June 30, 2004 (Unaudited)
| Strong Enterprise Fund | ||||||||
| Six Months Ended June 30, 2004 | Year Ended Dec. 31, 2003 | |||||||
| (Unaudited) | (Note 1) | |||||||
Capital Share Transactions of Each Class of Shares of the Fund Were as Follows: | ||||||||
INVESTOR CLASS | ||||||||
Proceeds from Shares Sold | $ | 45,462,458 | $ | 57,913,922 | ||||
Proceeds from Reinvestment of Distributions | — | — | ||||||
Payment for Shares Redeemed | (40,911,038 | ) | (108,083,036 | ) | ||||
Net Increase (Decrease) in Net Assets from Capital Share Transactions | 4,551,420 | (50,169,114 | ) | |||||
INSTITUTIONAL CLASS | ||||||||
Proceeds from Shares Sold | 2,169,214 | 2,440,911 | ||||||
Proceeds from Reinvestment of Distributions | — | — | ||||||
Payment for Shares Redeemed | (469,348 | ) | (571,699 | ) | ||||
Net Increase (Decrease) in Net Assets from Capital Share Transactions | 1,699,866 | 1,869,212 | ||||||
ADVISOR CLASS | ||||||||
Proceeds from Shares Sold | 276,543 | 794,357 | ||||||
Proceeds from Reinvestment of Distributions | — | — | ||||||
Payment for Shares Redeemed | (305,963 | ) | (860,789 | ) | ||||
Net Increase (Decrease) in Net Assets from Capital Share Transactions | (29,420 | ) | (66,432 | ) | ||||
CLASS K | ||||||||
Proceeds from Shares Sold | 4,719,061 | 27,685,600 | ||||||
Proceeds from Reinvestment of Distributions | — | — | ||||||
Payment for Shares Redeemed | (25,868,345 | ) | (3,466,148 | ) | ||||
Net Increase (Decrease) in Net Assets from Capital Share Transactions | (21,149,284 | ) | 24,219,452 | |||||
Net Increase (Decrease) in Net Assets from Capital Share Transactions | $ | (14,927,418 | ) | $ | (24,146,882 | ) | ||
64
| Strong Enterprise Fund | ||||||
| Six Months Ended June 30, 2004 | Year Ended Dec. 31, 2003 | |||||
| (Unaudited) | (Note 1) | |||||
Transactions in Shares of Each Class of the Fund Were as Follows: | ||||||
INVESTOR CLASS | ||||||
Sold | 2,063,831 | 3,153,308 | ||||
Issued in Reinvestment of Distributions | — | — | ||||
Redeemed | (1,814,990 | ) | (5,809,732 | ) | ||
Net Increase (Decrease) in Shares | 248,841 | (2,656,424 | ) | |||
INSTITUTIONAL CLASS | ||||||
Sold | 95,826 | 124,525 | ||||
Issued in Reinvestment of Distributions | — | — | ||||
Redeemed | (20,227 | ) | (27,868 | ) | ||
Net Increase (Decrease) in Shares | 75,599 | 96,657 | ||||
ADVISOR CLASS | ||||||
Sold | 12,048 | 41,765 | ||||
Issued in Reinvestment of Distributions | — | — | ||||
Redeemed | (13,639 | ) | (42,658 | ) | ||
Net Increase (Decrease) in Shares | (1,591 | ) | (893 | ) | ||
CLASS K | ||||||
Sold | 205,342 | 1,484,422 | ||||
Issued in Reinvestment of Distributions | — | — | ||||
Redeemed | (1,118,121 | ) | (174,720 | ) | ||
Net Increase (Decrease) in Shares | (912,779 | ) | 1,309,702 | |||
65
NOTES TO FINANCIAL STATEMENTS (continued)
June 30, 2004 (Unaudited)
| Strong Growth 20 Fund | ||||||||
| Six Months Ended June 30, 2004 | Year Ended Dec. 31, 2003 | |||||||
| (Unaudited) | ||||||||
Capital Share Transactions of Each Class of Shares of the Fund Were as Follows: | ||||||||
INVESTOR CLASS | ||||||||
Proceeds from Shares Sold | $ | 10,835,009 | $ | 215,730,444 | ||||
Proceeds from Reinvestment of Distributions | — | — | ||||||
Payment for Shares Redeemed | (118,943,301 | ) | (208,651,373 | ) | ||||
Net Increase (Decrease) in Net Assets from Capital Share Transactions | (108,108,292 | ) | 7,079,071 | |||||
ADVISOR CLASS | ||||||||
Proceeds from Shares Sold | 328,416 | 1,330,952 | ||||||
Proceeds from Reinvestment of Distributions | — | — | ||||||
Payment for Shares Redeemed | (1,746,979 | ) | (3,819,394 | ) | ||||
Net Increase (Decrease) in Net Assets from Capital Share Transactions | (1,418,563 | ) | (2,488,442 | ) | ||||
Net Increase (Decrease) in Net Assets from Capital Share Transactions | $ | (109,526,855 | ) | $ | 4,590,629 | |||
Transactions in Shares of Each Class of the Fund Were as Follows: | ||||||||
INVESTOR CLASS | ||||||||
Sold | 822,774 | 20,382,621 | ||||||
Issued in Reinvestment of Distributions | — | — | ||||||
Redeemed | (9,101,501 | ) | (18,867,469 | ) | ||||
Net Increase (Decrease) in Shares | (8,278,727 | ) | 1,515,152 | |||||
ADVISOR CLASS | ||||||||
Sold | 24,919 | 116,482 | ||||||
Issued in Reinvestment of Distributions | — | — | ||||||
Redeemed | (133,541 | ) | (323,340 | ) | ||||
Net Increase (Decrease) in Shares | (108,622 | ) | (206,858 | ) | ||||
66
| Strong Growth Fund | ||||||||
| Six Months Ended June 30, 2004 | Year Ended Dec. 31, 2003 | |||||||
| (Unaudited) | ||||||||
Capital Share Transactions of Each Class of Shares of the Fund Were as Follows: | ||||||||
INVESTOR CLASS | ||||||||
Proceeds from Shares Sold | $ | 56,742,109 | $ | 195,543,770 | ||||
Proceeds from Reinvestment of Distributions | — | — | ||||||
Payment for Shares Redeemed | (236,525,549 | ) | (449,810,001 | ) | ||||
Net Increase (Decrease) in Net Assets from Capital Share Transactions | (179,783,440 | ) | (254,266,231 | ) | ||||
INSTITUTIONAL CLASS | ||||||||
Proceeds from Shares Sold | 22,091,129 | 97,951,922 | ||||||
Proceeds from Reinvestment of Distributions | — | — | ||||||
Payment for Shares Redeemed | (53,111,151 | ) | (53,916,690 | ) | ||||
Net Increase (Decrease) in Net Assets from Capital Share Transactions | (31,020,022 | ) | 44,035,232 | |||||
ADVISOR CLASS | ||||||||
Proceeds from Shares Sold | 733,051 | 4,568,184 | ||||||
Proceeds from Reinvestment of Distributions | — | — | ||||||
Payment for Shares Redeemed | (2,759,747 | ) | (7,899,492 | ) | ||||
Net Increase (Decrease) in Net Assets from Capital Share Transactions | (2,026,696 | ) | (3,331,308 | ) | ||||
CLASS C | ||||||||
Proceeds from Shares Sold | 450 | 385,777 | ||||||
Proceeds from Reinvestment of Distributions | — | — | ||||||
Payment for Shares Redeemed | (108,600 | ) | (48,846 | ) | ||||
Net Increase (Decrease) in Net Assets from Capital Share Transactions | (108,150 | ) | 336,931 | |||||
CLASS K | ||||||||
Proceeds from Shares Sold | 19,376,390 | 51,582,602 | ||||||
Proceeds from Reinvestment of Distributions | — | — | ||||||
Payment for Shares Redeemed | (14,481,619 | ) | (19,995,565 | ) | ||||
Net Increase (Decrease) in Net Assets from Capital Share Transactions | 4,894,771 | 31,587,037 | ||||||
Net Increase (Decrease) in Net Assets from Capital Share Transactions | $ | (208,043,537 | ) | $ | (181,638,339 | ) | ||
67
NOTES TO FINANCIAL STATEMENTS (continued)
June 30, 2004 (Unaudited)
| Strong Growth Fund | ||||||
| Six Months Ended June 30, 2004 | Year Ended Dec. 31, 2003 | |||||
| (Unaudited) | ||||||
Transactions in Shares of Each Class of the Fund Were as Follows: | ||||||
INVESTOR CLASS | ||||||
Sold | 3,212,000 | 13,337,882 | ||||
Issued in Reinvestment of Distributions | — | — | ||||
Redeemed | (13,402,364 | ) | (28,947,288 | ) | ||
Net Increase (Decrease) in Shares | (10,190,364 | ) | (15,609,406 | ) | ||
INSTITUTIONAL CLASS | ||||||
Sold | 1,216,818 | 6,457,458 | ||||
Issued in Reinvestment of Distributions | — | — | ||||
Redeemed | (2,902,941 | ) | (3,285,692 | ) | ||
Net Increase (Decrease) in Shares | (1,686,123 | ) | 3,171,766 | |||
ADVISOR CLASS | ||||||
Sold | 41,717 | 304,356 | ||||
Issue | — | — | ||||
Redeemed | (156,144 | ) | (503,466 | ) | ||
Net Increase (Decrease) in Shares | (114,427 | ) | (199,110 | ) | ||
CLASS C | ||||||
Sold | 26 | 25,570 | ||||
Issue | — | — | ||||
Redeemed | (6,270 | ) | (2,959 | ) | ||
Net Increase (Decrease) in Shares | (6,244 | ) | 22,611 | |||
CLASS K | ||||||
Sold | 1,085,486 | 3,430,845 | ||||
Issue | — | — | ||||
Redeemed | (804,689 | ) | (1,204,449 | ) | ||
Net Increase (Decrease) in Shares | 280,797 | 2,226,396 | ||||
68
Strong Large Company Growth Fund | ||||||||
| Six Months Ended June 30, 2004 | Year Ended Dec. 31, 2003 | |||||||
| (Unaudited) | (Note 1) | |||||||
Capital Share Transactions of Each Class of Shares of the Fund Were as Follows: | ||||||||
INVESTOR CLASS | ||||||||
Proceeds from Shares Sold | $ | 25,746,097 | $ | 71,224,694 | ||||
Proceeds from Reinvestment of Distributions | — | 12,085 | ||||||
Proceeds from Redemption Fees | 34,733 | 30,740 | ||||||
Payment for Shares Redeemed | (31,943,658 | ) | (31,528,112 | ) | ||||
Net Increase (Decrease) in Net Assets from Capital Share Transactions | (6,162,828 | ) | 39,739,407 | |||||
CLASS K | ||||||||
Proceeds from Shares Sold | 3,111,092 | 1,000,551 | ||||||
Proceeds from Reinvestment of Distributions | — | — | ||||||
Proceeds from Redemption Fees | 847 | 626 | ||||||
Payment for Shares Redeemed | (229,016 | ) | (28,718 | ) | ||||
Net Increase (Decrease) in Net Assets from Capital Share Transactions | 2,882,923 | 972,459 | ||||||
Net Increase (Decrease) in Net Assets from Capital Share Transactions | $ | (3,279,905 | ) | $ | 40,711,866 | |||
Transactions in Shares of Each Class of the Fund Were as Follows: | ||||||||
INVESTOR CLASS | ||||||||
Sold | 1,865,814 | 5,804,010 | ||||||
Issued in Reinvestment of Distributions | — | 1,118 | ||||||
Redeemed | (2,307,476 | ) | (2,514,076 | ) | ||||
Net Increase (Decrease) in Shares of the Fund | (441,662 | ) | 3,291,052 | |||||
CLASS K | ||||||||
Sold | 220,452 | 78,792 | ||||||
Issued in Reinvestment of Distributions | — | — | ||||||
Redeemed | (16,621 | ) | (2,190 | ) | ||||
Net Increase (Decrease) in Shares of the Fund | 203,831 | 76,602 | ||||||
| 9. | Legal and Regulatory Matters |
On or about May 20, 2004, the Advisor, the Administrator, and the Distributor (collectively, “Strong”), former chairman Richard S. Strong, and two employees of Strong entered into agreements with the Securities and Exchange Commission (“SEC”), the New York Attorney General (“NYAG”), the State of Wisconsin Department of Justice (the Wisconsin Attorney General), and the Wisconsin Department of Financial Institutions representing a settlement of all the market-timing investigations of Strong and certain affiliates by these agencies. In the settlements, Strong, without admitting or denying the findings in any of the orders, consented to entries of cease and desist orders and injunctive relief relating to breaches of their fiduciary duties and violations of state and federal securities laws, including anti-fraud provisions. The settlements require the Advisor to pay $40 million in investor restoration and $40 million in civil penalties. The settlements require Mr. Strong to pay $30 million in investor restoration and $30 million in civil penalties. The NYAG settlement also requires Strong to reduce fees for all Funds (except money market funds and certain very short-term income funds) by an aggregate of at least $7 million a year for five years. Separately, the Board of Directors of the Strong Funds and the Advisor have agreed that the Advisor may
69
NOTES TO FINANCIAL STATEMENTS (continued)
June 30, 2004 (Unaudited)
allocate such fee and/or expense reductions in a manner it deems reasonable, provided that (i) each applicable Fund shall participate in such fee reduction, (ii) each Fund that was impacted by market timing related to the settlements shall receive a fee reduction of at least 0.025% each year, (iii) such fee reduction shall be taken after giving effect to all waivers and reimbursements currently in effect, and (iv) fees and expenses shall not subsequently be increased without prior Board approval. Additionally, the settlements require, among other things: 1) retention of an independent consultant to develop a payment plan for the amount of investor restoration; 2) the services of an independent compliance consultant to conduct a periodic review of Strong’s compliance policies and procedures; and 3) enhanced corporate governance policies for the Strong Funds. The NYAG settlement also requires: 1) the retention of a senior officer to assist the Board in monitoring compliance and reviewing fee arrangements; and 2) additional fee disclosure to investors in the Funds. Strong and Mr. Strong, and not the investors in any Strong Fund, will bear all the costs of complying with the settlements, including restoration, civil penalties, and associated legal fees stemming from these regulatory proceedings. Strong has not yet determined if the investor restoration or civil penalties will create any financial benefit to the Strong Funds.
Strong has received one or more subpoenas or requests for information from the West Virginia Attorney General and other regulatory agencies requesting documents, if any, related to market timing and late trading practices. Strong is aware of multiple outstanding class and derivative actions (“Actions”) filed since September 4, 2003, against Strong, Strong Funds, Strong Financial Corporation, Strong Investments, Inc., Strong affiliates, and certain of their officers and directors as defendants in certain federal and state courts with respect to factual matters referenced in the NYAG settlement.
On February 20, 2004 and June 15, 2004, the United States Judicial Panel for Multi District Litigation (“MDL”) ordered the transfer of all but one of the Actions to the District of Maryland so those cases involving Strong could be coordinated and consolidated into one or two actions covered by a single complaint (“MDL Consolidated Actions”). A single Wisconsin state court Action involving Strong was not removed to the District of Maryland court. The District of Maryland court has since appointed co-chairs/chief administrative counsel for the plaintiffs in the actions involving all of the fund families before it. It has also appointed a lead plaintiff and lead plaintiff’s counsel for the actions involving each individual fund family, including Strong. The Actions generally allege, among other things, that the defendants violated their fiduciary duty to fund shareholders and certain retirement plan participants, and made false and misleading statements in the funds’ prospectuses in violation of federal and state securities laws. The Actions generally seek one or more of the following: compensatory damages, punitive damages, special damages, exemplary damages, rescission, restitution, payment of plaintiffs’ attorneys’ fees and experts’ fees, and/or replacement of the Board of Directors of the Strong Funds. Strong expects that the MDL Consolidated Actions will allege the same types of violations of law and seek the same forms of damages and remedies as did the numerous prior Actions. Certain state Actions will not be consolidated into the MDL Consolidated Actions and proceedings in these state court Actions may be stayed or proceed independently of the MDL Consolidated Actions.
The Strong Funds will not bear any costs incurred in connection with these Actions. Based on currently available information, Strong believes that the Actions will not have a material adverse financial impact on the Strong Funds, and are not likely to materially affect Strong’s ability to provide investment management services to its clients, including the Strong Funds. The Funds may experience increased redemptions or a decrease in new sales of shares as a result of the regulatory settlements and the ongoing Actions, which could result in increased transaction costs and operating expenses, or otherwise negatively impact the Strong Funds.
| 10. | Pending Acquisition |
On May 26, 2004, Strong Financial Corporation (“SFC”) announced that it reached a definitive agreement with Wells Fargo & Company (“Wells Fargo”) to acquire assets of SFC and certain of its affiliates, including the Advisor. As part of the proposed transaction, SFC will be seeking approval from the Board of Directors of the Strong Funds (“Board”) on various matters including appointing Wells Fargo Funds Management, LLC, a wholly owned subsidiary of Wells Fargo, as a new investment advisor for the Strong Funds and a merger of those funds into the Wells Fargo Funds family of mutual funds.
The mergers, which are anticipated to close in the first quarter of 2005, are subject to a number of conditions, including approval by the Board and shareholders of the Strong Funds.
70
Each officer and director holds the same position with the 27 registered open-end management investment companies consisting of 71 mutual funds (“Strong Funds”).
Willie D. Davis (DOB 7-24-34), Director of the Strong Funds since July 1994.
Mr. Davis has been President and Chief Executive Officer of All Pro Broadcasting, Inc., since 1977; Director of Wisconsin Energy Corporation (formerly WICOR, Inc., a utility company) since 1990, Metro-Goldwyn-Mayer, Inc. (an entertainment company) since 1998, Bassett Furniture Industries, Inc. since 1997, Checker’s Drive-In Restaurants, Inc. (formerly Rally’s Hamburgers, Inc.) since 1994, Johnson Controls, Inc. (an automotive systems and facility management company) since 1992, MGM Mirage (formerly MGM Grand, Inc., an entertainment/hotel company) since 1990, Dow Chemical Company since 1988, Sara Lee Corporation (a food/consumer products company) since 1983, Alliance Bank since 1980, Manpower, Inc. (a worldwide provider of staffing services) since 2001, and Kmart Corporation (a discount consumer products company) from 1985 to 2003; and Trustee of the University of Chicago since 1980 and Marquette University since 1988.
Gordon B. Greer (DOB 2-17-32), Director of the Strong Funds since March 2002.
Mr. Greer was Of Counsel for Bingham McCutchen LLP (a law firm previously known as Bingham Dana LLP) from 1997 to February 2002 and Partner of Bingham McCutchen LLP from 1967 to 1997. On behalf of Bingham McCutchen LLP, Mr. Greer provided representation to the disinterested directors of the Strong Funds from 1991 to February 2002. Bingham McCutchen LLP has provided representation to the Independent Directors of the Strong Funds since 1991.
Stanley Kritzik (DOB 1-9-30), Director of the Strong Funds since January 1995 and Chairman of the Audit Committee of the Strong Funds since July 2000.
Mr. Kritzik has been Partner of Metropolitan Associates (a real estate firm) since 1962; Director of Wisconsin Health Information Network since November 1997, Health Network Ventures, Inc. from 1992 to April 2000, and Aurora Health Care from September 1987 to September 2002; and Member of the Board of Governors of Snowmass Village Resort Association from October 1999 to October 2002.
Neal Malicky (DOB 9-14-34), Director of the Strong Funds since December 1999.
Mr. Malicky has been President Emeritus of Baldwin-Wallace College since July 2000; Chancellor of Baldwin-Wallace College from July 1999 to June 2000; President of Baldwin-Wallace College from July 1981 to June 1999; Director of Aspire Learning Corporation since June 2000; Trustee of Southwest Community Health Systems, Cleveland Scholarship Program, and The National Conference for Community and Justice until 2001; President of the National Association of Schools and Colleges of the United Methodist Church, Chairperson of the Association of Independent Colleges and Universities of Ohio, and Secretary of the National Association of Independent Colleges and Universities until 2001.
William F. Vogt (DOB 7-19-47), Director and Chairman of the Independent Directors Committee of the Strong Funds since January 1995.
Mr. Vogt has been Senior Vice President of IDX Systems Corporation (a management consulting firm) since June 2001; President of Vogt Management Consulting, Inc. from July 1990 to June 2001; and former Fellow of the American College of Medical Practice Executives.
71
DIRECTORS AND OFFICERS (continued)
Ane K. Ohm (DOB 10-16-69), Anti-Money Laundering Compliance Officer of the Strong Funds since November 2002.
Ms. Ohm has been Anti-Money Laundering Compliance Officer of Strong Financial Corporation since February 2003; Assistant Executive Vice President of Strong Financial Corporation since November 2003; Assistant Executive Vice President of Strong Capital Management, Inc. (the “Advisor”) since December 2001; Director of Mutual Fund Administration of Strong Investor Services, Inc. since April 2001; Vice President of Strong Investor Services, Inc. since December 2001; and Marketing Services Manager of Strong Investments, Inc. (the “Distributor”) from November 1998 to April 2001.
Phillip O. Peterson (DOB 12-5-44), Independent President of the Strong Funds since January 2004.
Mr. Peterson was a mutual fund industry consultant from August 1999 to December 2003; Partner of KPMG LLP from 1981 to July 1999; Director of The Hartford Group of Mutual Funds (71 funds) since 2002; and Director of the Fortis Mutual Fund Group (38 funds) from 2000 to 2002.
Richard W. Smirl (DOB 4-18-67), Vice President of the Strong Funds since February 2002 and Secretary of the Strong Funds since November 2001.
Mr. Smirl has been Senior Counsel of Strong Financial Corporation since December 2001; Assistant Secretary of Strong Financial Corporation from December 2001 to February 2003; Secretary of Strong Financial Corporation since February 2003; Assistant Executive Vice President of the Advisor since December 2001; Chief Legal Officer of the Advisor since February 2003; Secretary of the Advisor since November 2002; Assistant Secretary of the Advisor from December 2001 to November 2002; Senior Counsel of the Advisor from July 2000 to December 2001; General Counsel of the Distributor since November 2001; Secretary of the Distributor since July 2000; Vice President and Chief Compliance Officer of the Distributor from July 2000 to December 2003; Lead Counsel of the Distributor from July 2000 to November 2001; Vice President of Strong Investor Services, Inc. since December 2001; Assistant Secretary of Strong Investor Services, Inc. from December 2001 to May 2003; Secretary of Strong Investor Services, Inc. since May 2003; Partner at Keesal, Young & Logan LLP (a law firm) from September 1999 to July 2000; and Associate at Keesal, Young & Logan LLP from September 1992 to September 1999.
Gilbert L. Southwell III (DOB 4-13-54), Assistant Secretary of the Strong Funds since July 2001.
Mr. Southwell has been Associate Counsel of Strong Financial Corporation since December 2001; Assistant Secretary of the Advisor since December 2002; Associate Counsel of the Advisor from April 2001 to December 2001; Partner at Michael, Best & Friedrich, LLP (a law firm) from October 1999 to March 2001; and Assistant General Counsel of U.S. Bank, National Association (formerly Firstar Bank, N.A.) and/or certain of its subsidiaries from November 1984 to September 1999.
John W. Widmer (DOB 1-19-65), Treasurer of the Strong Funds since April 1999.
Mr. Widmer has been Treasurer of the Advisor since April 1999; Assistant Treasurer of Strong Financial Corporation since December 2001; Assistant Secretary of Strong Financial Corporation from December 2001 to January 2003; Treasurer of Strong Service Corporation since April 1999; Treasurer and Assistant Secretary of Strong Investor Services, Inc. since July 2001; and Manager of the Financial Management and Sales Reporting Systems department of the Advisor from May 1997 to April 1999.
Thomas M. Zoeller (DOB 2-21-64), Vice President of the Strong Funds since October 1999.
Mr. Zoeller has been Executive Vice President of the Advisor since April 2001; Chief Financial Officer of the Advisor since February 1998; Secretary of the Advisor from December 2001 to November 2002; Member of the Office of the Chief Executive of Strong Financial Corporation since May 2001; Chief Financial Officer and Treasurer of Strong Investments, Inc. since October 1993; Executive Vice President of Strong Investor Services, Inc. since July 2001; Secretary of Strong Investor Services, Inc. from July 2001 to May 2003; Executive Vice President, Chief Financial Officer, and Secretary of Strong Service Corporation since December 2001; Treasurer of Strong Service Corporation from September 1996 to April 1999; Vice President of Strong Service Corporation from April 1999 to December 2001; Member of the Office of the Chief Executive of the Advisor from November 1998 until May 2001; and Senior Vice President of the Advisor from February 1998 to April 2001.
Except for Messrs. Davis, Kritzik, Malicky, and Vogt, the address of all of the Directors and Officers is P.O. Box 2936, Milwaukee, WI 53201. Mr. Davis’s address is 161 North La Brea, Inglewood, CA 90301. Mr. Kritzik’s address is 1123 North Astor Street, Milwaukee, WI 53202. Mr. Malicky’s address is 4608 Turnberry Drive, Lawrence, KS 66047. Mr. Vogt’s address is P.O. Box 7657, Avon, CO 81620.
The statement of additional information contains additional information about fund directors and officers and is available without charge, upon request, by calling 1-800-368-3863.
72
NOTES
73
NOTES
74
Directors
Willie D. Davis
Gordon B. Greer
Stanley Kritzik
Neal Malicky
William F. Vogt
Officers
Phillip O. Peterson, Independent President
Thomas M. Zoeller, Vice President
Richard W. Smirl, Vice President and Secretary
Gilbert L. Southwell III, Assistant Secretary
John W. Widmer, Treasurer
Ane K. Ohm, Anti-Money Laundering Compliance Officer
Investment Advisor
Strong Capital Management, Inc.
P.O. Box 2936, Milwaukee,Wisconsin 53201
Distributor
Strong Investments, Inc.
P.O. Box 2936, Milwaukee,Wisconsin 53201
Custodian
State Street Bank and Trust Company
801 Pennsylvania Avenue, Kansas City, Missouri 64105
Transfer Agent and Dividend-Disbursing Agent
Strong Investor Services, Inc.
P.O. Box 2936, Milwaukee,Wisconsin 53201
Independent Accountants
PricewaterhouseCoopers LLP
100 East Wisconsin Avenue, Milwaukee,Wisconsin 53202
Legal Counsel
Godfrey & Kahn, S.C.
780 North Water Street, Milwaukee,Wisconsin 53202
Strong Investments
P.O. Box 2936 | Milwaukee, WI 53201
To learn more about our funds, discuss an existing
account, or conduct a transaction, call 1-800-368-3863
or visit www.Strong.com.
Please carefully consider a fund’s investment objectives,
risks, charges, and expenses before investing. For this
and other information, call us or visit our web site for
a free prospectus. Please read it carefully before you
invest or send money.
To receive a free copy of the policies and procedures
the funds use to determine how to vote proxies relating
to portfolio securities, or to receive a free copy of a fund’s
proxy voting record for the most recent 12-month period
ending on June 30, call 1-800-368-3863, or visit the
Securities and Exchange Commission’s web site
at www.sec.gov.
If you are a Financial Professional, call 1-800-368-1683.
This report does not constitute an offer for the sale of securities. Strong Funds are offered for sale by prospectus only. Securities are offered through Strong Investments, Inc. RT45366 08-04
SGRO/WH2150 06-04
| Item 2. | Code of Ethics |
Not applicable for filing of Semiannual Reports to Shareholders.
| Item 3. | Audit Committee Financial Expert |
Not applicable for filing of Semiannual Reports to Shareholders.
| Item 4. | Principal Accountant Fees and Services |
Not applicable for filing of Semiannual Reports to Shareholders.
| Item 5. | Audit Committee of Listed Registrants |
Not applicable for filing of Semiannual Reports to Shareholders.
| Item 6. | Schedule of Investments |
Not applicable; full Schedule of Investments included in Item 1.
| Item 7. | Disclosure of Proxy Voting Policies and Procedures for Closed-End Management Investment Companies |
Not applicable to this Registrant, insofar as the Registrant is not a closed-end management investment company.
| Item 8. | Purchases of Equity Securities by Closed-End Management Investment Company and Affiliated Purchases |
Not applicable to this Registrant, insofar as the Registrant is not a closed-end management investment company.
| Item 9. | Submission of Matters to a Vote of Security Holders |
There were no material changes to the procedures by which shareholders may recommend nominees to the Funds’ Board of Directors.
| Item 10. | Controls and Procedures |
(a) An evaluation was performed within 90 days from the date hereof under the supervision of the Registrant’s management, including the principal executive officer and treasurer, regarding the effectiveness of the registrant’s disclosure controls and procedures. Based on that evaluation, it was determined that such disclosure controls and procedures provide reasonable assurance that the material information required to be disclosed by the Registrant in the reports it files or submits on Form N-CSR (1) is accumulated and communicated to the Registrant’s management, including its principal executive officer and treasurer, to allow timely decisions regarding required disclosure, and (2) is recorded, processed, summarized, and reported within the time periods specified in the Commission’s rules and forms.
(b) There were no significant changes in the Registrant’s internal control over financial reporting that occurred during the Registrant’s most recent fiscal half-year that has materially affected, or is reasonably likely to materially affect, the Registrant’s internal control over financial reporting.
| Item 11. | Exhibits |
The following exhibits are attached to this Form N-CSR:
| 11(a)(1) | Code of Ethics—Not applicable for filing of Semiannual Reports to Shareholders. | |
| 11(a)(2)(i) | Certification of Principal Executive Officer Required by Section 302 of the Sarbanes-Oxley Act of 2002 | |
| 11(a)(2)(ii) | Certification of Principal Financial Officer Required by Section 302 of the Sarbanes-Oxley Act of 2002 | |
| 11(b) | Certification of Chief Executive Officer and Chief Financial Officer Required by Section 906 of the Sarbanes-Oxley Act of 2002 | |
Signatures
Pursuant to the requirements of the Securities Exchange Act of 1934 and the Investment Company Act of 1940, the Registrant has duly caused this report to be signed on its behalf by the undersigned, thereunto duly authorized.
Strong Large Cap Growth Fund, Inc., on behalf of Strong Large Cap Growth Fund
| By: | /s/ Richard W. Smirl | |
| Richard W. Smirl, Vice President and Secretary | ||
Date: September 3, 2004 | ||
Pursuant to the requirements of the Securities Exchange Act of 1934 and the Investment Company Act of 1940, this report has been signed below by the following persons on behalf of the registrant and in the capacities and on the dates indicated.
| By: | /s/ Thomas M. Zoeller | |
| Thomas M. Zoeller, Principal Executive Officer | ||
Date: September 3, 2004 | ||
| By: | /s/ John W. Widmer | |
| John W. Widmer, Treasurer (Principal Financial Officer) | ||
Date: September 3, 2004 | ||