UNITED STATES
SECURITIES AND EXCHANGE COMMISSION
Washington, D.C. 20549
FORM 10-Q
(Mark One)
| x | QUARTERLY REPORT PURSUANT TO SECTION 13 OR 15(d) OF THE SECURITIES EXCHANGE ACT OF 1934 |
For the quarterly period ended April 30, 2014
OR
| ¨ | TRANSITION REPORT PURSUANT TO SECTION 13 OR 15(d) OF THE SECURITIES EXCHANGE ACT OF 1934 |
For the transition period from to
Commission file number: 000-10761
XCERRA CORPORATION
(Exact name of registrant as specified in its charter)
| | |
| Massachusetts | | 04-2594045 |
(State or other jurisdiction of incorporation or organization) | | (I.R.S. Employer Identification No.) |
| |
825 University Ave Norwood, Massachusetts | | 02062 |
| (Address of principal executive offices) | | (Zip Code) |
(781) 461-1000
(Registrant’s telephone number, including area code)
LTX-Credence Corporation
(Former name, former address and former fiscal year, if changed since last report)
Indicate by check mark whether the registrant: (1) has filed all reports required to be filed by Section 13 or 15(d) of the Securities Exchange Act of 1934 during the preceding 12 months (or for such shorter period that the registrant was required to file such reports), and (2) has been subject to such filing requirements for the past 90 days. Yes x No ¨
Indicate by check mark whether the registrant has submitted electronically and posted on its corporate Web site, if any, every Interactive Data File required to be submitted and posted pursuant to Rule 405 of Regulation S-T (§232.405 of this chapter) during the preceding 12 months (or for such shorter period that the registrant was required to submit and post such files). Yes x No ¨
Indicate by check mark whether the registrant is a large accelerated filer, an accelerated filer, a non-accelerated filer, or a smaller reporting company. See the definitions of “large accelerated filer”, “accelerated filer” and “smaller reporting company” in Rule 12b-2 of the Exchange Act.
| | | | | | |
| Large accelerated filer | | ¨ | | Accelerated filer | | x |
| | | |
| Non-accelerated filer | | ¨ (Do not check if a smaller reporting company) | | Smaller reporting company | | ¨ |
Indicate by check mark whether the registrant is a shell company (as defined in Rule 12b-2 of the Exchange Act). Yes ¨ No x
Indicate the number of shares outstanding of each of the issuer’s classes of common stock, as of the latest practicable date.
| | |
Class | | Outstanding at June 3, 2014 |
| Common Stock, $0.05 par value per share | | 48,384,723 shares |
XCERRA CORPORATION
Index
2
XCERRA CORPORATION
CONSOLIDATED BALANCE SHEETS
(In thousands)
| | | | | | | | |
| | | April 30,
2014 | | | July 31,
2013 | |
| | | (Unaudited) | | | | |
ASSETS | | | | | | | | |
Current assets: | | | | | | | | |
Cash and cash equivalents | | $ | 55,114 | | | $ | 28,235 | |
Marketable securities | | | 41,582 | | | | 96,159 | |
Accounts receivable—trade, net of allowances of $0 and $0, respectively | | | 77,321 | | | | 28,102 | |
Accounts receivable—other | | | 205 | | | | 963 | |
Inventories | | | 69,941 | | | | 29,139 | |
Prepaid expenses and other current assets | | | 4,963 | | | | 2,497 | |
| | | | | | | | |
Total current assets | | | 249,126 | | | | 185,095 | |
| | |
Property and equipment, net | | | 34,941 | | | | 16,647 | |
Intangible assets, net | | | 9,514 | | | | 1,571 | |
Goodwill | | | 43,030 | | | | 43,030 | |
Other assets | | | 3,970 | | | | 1,258 | |
| | | | | | | | |
Total assets | | $ | 340,581 | | | $ | 247,601 | |
| | | | | | | | |
LIABILITIES AND STOCKHOLDERS’ EQUITY | | | | | | | | |
Current liabilities: | | | | | | | | |
Current portion of long-term debt | | $ | 3,125 | | | $ | — | |
Accounts payable | | | 30,605 | | | | 13,266 | |
Accrued expenses | | | 35,637 | | | | 19,352 | |
Deferred revenue and customer advances | | | 4,267 | | | | 5,084 | |
| | | | | | | | |
Total current liabilities | | | 73,634 | | | | 37,702 | |
| | |
Term loan | | | 45,625 | | | | — | |
Subordinated debt | | | 18,000 | | | | — | |
Other long-term liabilities | | | 13,245 | | | | 11,402 | |
Commitments and contingencies (Note 6) | | | | | | | | |
Stockholders’ equity: | | | | | | | | |
Common stock | | | 2,419 | | | | 2,384 | |
Additional paid-in capital | | | 749,326 | | | | 746,020 | |
Accumulated other comprehensive income (loss) | | | 856 | | | | (64) | |
Accumulated deficit | | | (562,524) | | | | (549,843) | |
| | | | | | | | |
Total stockholders’ equity | | | 190,077 | | | | 198,497 | |
| | | | | | | | |
Total liabilities and stockholders’ equity | | $ | 340,581 | | | $ | 247,601 | |
| | | | | | | | |
See accompanying Notes to Consolidated Financial Statements.
3
XCERRA CORPORATION
CONSOLIDATED STATEMENTS OF OPERATIONS AND COMPREHENSIVE INCOME (LOSS)
(Unaudited)
(In thousands, except per share data)
| | | | | | | | | | | | | | | | |
| | | Three Months Ended
April 30, | | | Nine Months Ended
April 30, | |
| | | 2014 | | | 2013 | | | 2014 | | | 2013 | |
Net product sales | | $ | 97,122 | | | $ | 28,092 | | | $ | 181,466 | | | $ | 88,521 | |
Net service sales | | | 8,302 | | | | 8,165 | | | | 25,081 | | | | 25,940 | |
| | | | | | | | | | | | | | | | |
Net sales | | | 105,424 | | | | 36,257 | | | | 206,547 | | | | 114,461 | |
Cost of sales | | | 61,869 | | | | 17,558 | | | | 119,050 | | | | 53,699 | |
| | | | | | | | | | | | | | | | |
Gross profit | | | 43,555 | | | | 18,699 | | | | 87,497 | | | | 60,762 | |
| | | | |
Engineering and product development expenses | | | 17,579 | | | | 13,407 | | | | 46,258 | | | | 39,003 | |
Selling, general and administrative expenses | | | 23,295 | | | | 9,213 | | | | 52,133 | | | | 28,401 | |
Amortization of purchased intangible assets | | | 540 | | | | 395 | | | | 1,157 | | | | 1,187 | |
Restructuring | | | 1,422 | | | | 356 | | | | 3,581 | | | | 655 | |
| | | | | | | | | | | | | | | | |
Income (loss) from operations | | | 719 | | | | (4,672) | | | | (15,632) | | | | (8,484) | |
| | | | |
Other income (expense): | | | | | | | | | | | | | | | | |
Interest expense | | | (800) | | | | (60) | | | | (1,361) | | | | (167) | |
Interest income | | | 78 | | | | 200 | | | | 221 | | | | 685 | |
Bargain purchase gain | | | — | | | | — | | | | 4,644 | | | | — | |
Other (expense) income, net | | | (46) | | | | (177) | | | | 477 | | | | (65) | |
| | | | | | | | | | | | | | | | |
Loss before (provision for) benefit from income taxes | | | (49) | | | | (4,709) | | | | (11,651) | | | | (8,031) | |
(Provision for) benefit from income taxes | | | (151) | | | | (35) | | | | (1,030) | | | | 560 | |
| | | | | | | | | | | | | | | | |
Net loss | | $ | (200) | | | $ | (4,744) | | | $ | (12,681) | | | $ | (7,471) | |
| | | | | | | | | | | | | | | | |
| | | | |
Net loss per share: | | | | | | | | | | | | | | | | |
Basic and diluted | | $ | (0.00) | | | $ | (0.10) | | | $ | (0.26) | | | $ | (0.16) | |
Weighted-average common and common equivalent shares used in computing net loss per share: | | | | | | | | | | | | | | | | |
Basic and diluted | | | 48,356 | | | | 47,547 | | | | 48,156 | | | | 47,761 | |
Comprehensive income (loss): | | | | | | | | | | | | | | | | |
Net loss | | $ | (200) | | | $ | (4,744) | | | $ | (12,681) | | | $ | (7,471) | |
| | | | |
Unrealized gain (loss) on marketable securities | | | 7 | | | | 18 | | | | 98 | | | | (56) | |
Unrealized gain on currency translation | | | 446 | | | | — | | | | 822 | | | | — | |
| | | | | | | | | | | | | | | | |
Comprehensive income (loss) | | $ | 253 | | | $ | (4,726) | | | $ | (11,761) | | | $ | (7,527) | |
| | | | | | | | | | | | | | | | |
See accompanying Notes to Consolidated Financial Statements.
4
XCERRA CORPORATION
CONSOLIDATED STATEMENTS OF CASH FLOWS
(Unaudited)
(In thousands)
| | | | | | | | |
| | | Nine Months Ended
April 30, | |
| | | 2014 | | | 2013 | |
CASH FLOWS FROM OPERATING ACTIVITIES: | | | | | | | | |
Net loss | | $ | (12,681) | | | $ | (7,471) | |
Add non-cash items: | | | | | | | | |
Stock-based compensation | | | 3,725 | | | | 3,502 | |
Bargain purchase gain | | | (4,644) | | | | — | |
Depreciation and amortization | | | 6,116 | | | | 6,188 | |
Restructuring | | | 3,581 | | | | 655 | |
Other | | | 2,185 | | | | (417) | |
Changes in operating assets and liabilities, net of effect of acquisition: | | | | | | | | |
Accounts receivable | | | 3,070 | | | | 6,489 | |
Inventories | | | 604 | | | | (5,140) | |
Prepaid expenses and other assets | | | 628 | | | | 1,243 | |
Accounts payable | | | 3,860 | | | | 614 | |
Accrued expenses | | | (10,003) | | | | (2,573) | |
Deferred revenue and customer advances | | | (816) | | | | (193) | |
| | | | | | | | |
Net cash (used in) provided by operating activities | | | (4,375) | | | | 2,897 | |
| | | | | | | | |
CASH FLOWS FROM INVESTING ACTIVITIES: | | | | | | | | |
Proceeds from sales and maturities of available-for-sale securities | | | 103,890 | | | | 53,494 | |
Proceeds from sales and maturities of held-to-maturity securities | | | - | | | | 4,900 | |
Purchases of available-for-sale securities | | | (50,049) | | | | (45,519) | |
Purchases of held-to-maturity securities | | | - | | | | (4,842) | |
Cash paid for acquired businesses, net of cash acquired | | | (66,928) | | | | — | |
Purchases of property and equipment | | | (2,871) | | | | (2,197) | |
| | | | | | | | |
Net cash (used in) provided by investing activities | | | (15,958) | | | | 5,836 | |
| | | | | | | | |
CASH FLOWS FROM FINANCING ACTIVITIES: | | | | | | | | |
Repurchases of common stock | | | — | | | | (9,208) | |
Proceeds from borrowing of bank term loan, net of fees | | | 48,735 | | | | — | |
Principal payments on bank term loan | | | (1,250) | | | | — | |
Payments of tax withholdings for vested RSUs, net of proceeds from stock option exercises | | | (793) | | | | (1,009) | |
Proceeds from shares issued from employees’ stock purchase plan | | | 412 | | | | 389 | |
| | | | | | | | |
Net cash provided by (used in) financing activities | | | 47,104 | | | | (9,828) | |
| | | | | | | | |
Effect of exchange rate changes on cash and cash equivalents | | | 108 | | | | 146 | |
| | | | | | | | |
Net increase (decrease) in cash and cash equivalents | | | 26,879 | | | | (949) | |
| | | | | | | | |
Cash and cash equivalents at beginning of period | | | 28,235 | | | | 29,446 | |
| | | | | | | | |
Cash and cash equivalents at end of period | | $ | 55,114 | | | $ | 28,497 | |
| | | | | | | | |
See accompanying Notes to Consolidated Financial Statements.
5
XCERRA CORPORATION
NOTES TO CONSOLIDATED FINANCIAL STATEMENTS
(Unaudited)
1. THE COMPANY
Xcerra Corporation (“Xcerra” or the “Company”), formerly known as LTX-Credence Corporation, is a global provider of test and handling capital equipment, interface products, test fixtures, and services to the semiconductor, industrial, and electronics manufacturing industries. The Company designs, manufacturers, markets and services systems and products that address the broad, divergent requirements of the mobility, industrial, medical, automotive and consumer end markets, offering a comprehensive portfolio of solutions and technologies, and a global network of strategically deployed applications and support resources. Xcerra operates in the semiconductor and electronics manufacturing test markets and is the parent company to the atg-Luther & Maelzer, Everett Charles Technologies, LTX-Credence and Multitest businesses. The Company has a broad spectrum of semiconductor and printed circuit board (“PCB”) test expertise which enables it to drive innovative new products and services and deliver to customers fully integrated semiconductor test solutions.
Semiconductor designers and manufacturers worldwide use the Company’s test and handling equipment and interface products to test their devices during the manufacturing process. The Company’s interface products include the design, manufacture and marketing of load boards, contactors, and pins used in various types of test equipment, as well as in a wide variety of commercial and consumer applications. After testing, these semiconductor devices are incorporated into a wide range of products, including personal and tablet computers, mobile internet equipment such as wireless access points and interfaces, broadband access products such as cable modems and set top boxes, personal communication and entertainment products such as mobile phones and personal digital music players, consumer products such as televisions, videogame systems and digital cameras, automobile electronics and power management devices used in portable and automotive electronics. The Company also designs, manufactures and markets PCB test systems used in the testing of pre-assembly PCBs. These testers are used to verify the quality of the PCB prior to the installation of components. The types of PCBs that are tested using the Company’s systems include a diverse set of electronic products including network servers, personal computers, tablet computers and mobile phones. The Company’s test fixture products include the design, manufacture, and marketing of in-circuit and functional-circuit test fixtures for testing assembled PCBs. The Company also sells hardware and software support and maintenance services for its products.
Unless otherwise noted, the historical financial results in this quarterly report on Form 10-Q do not give effect to the completion of the Company’s purchase of assets (the “Dover Acquisition”) from Dover Printing & Identification, Inc. (“Dover”) and its specified affiliates used exclusively or primarily in connection with Dover’s Everett Charles Technologies (including atg L&M) and Multitest businesses on December 1, 2013 (collectively, the “Acquired Businesses”). See Note 3 for additional information related to the Dover Acquisition.
2. SUMMARY OF SIGNIFICANT ACCOUNTING POLICIES
Basis of Presentation
The accompanying unaudited consolidated financial statements have been prepared in accordance with generally accepted accounting principles in the United States (“GAAP”). These footnotes condense or omit information and disclosures which substantially duplicate information provided in the Company’s latest audited financial statements. These unaudited consolidated financial statements should be read in conjunction with the financial statements and notes included in the Company’s Annual Report on Form 10-K for the fiscal year ended July 31, 2013. In the opinion of management, these unaudited consolidated financial statements reflect all adjustments, including normal recurring accruals, necessary for a fair presentation of the results for the interim periods presented. The operating results for the three and nine months ended April 30, 2014 are not necessarily indicative of future trends or the Company’s results of operations for the entire fiscal year ending July 31, 2014.
These unaudited consolidated financial statements include the accounts of the Company and its wholly owned subsidiaries. All significant inter-company transactions and balances have been eliminated in consolidation.
Revenue Recognition
The Company recognizes revenue based on guidance provided in Topic 605,Revenue Recognition, to the Financial Accounting Standards Board Codification (“FASB ASC”) and Accounting Standards Update 2009-13,Multiple-Deliverable Revenue Arrangements(“ASU 2009-13”). The Company recognizes revenue when persuasive evidence of an arrangement exists, delivery has occurred or services have been rendered, the seller’s price is fixed or determinable and collectability is reasonably assured.
6
Revenue related to product sales is recognized when: (a) the Company has a written sales agreement; (b) delivery has occurred or service has been rendered; (c) the price is fixed or determinable; (d) collectability is reasonably assured; (e) the product delivered is a standard product with historically demonstrated acceptance; and (f) there is no unique customer acceptance provision or payment tied to acceptance or an undelivered element significant to the functionality of the system. Generally, payment terms are time based after product shipment. When sales to a customer involve multiple elements, revenue is recognized of the delivered element provided that (1) the undelivered element is a proven technology, (2) there is a history of acceptance on the product with the customer, (3) the undelivered element is not essential to the customer’s application, (4) the delivered item(s) has value to the customer on a stand-alone basis, and (5) if the arrangement includes a general right of return relative to the delivered item(s), delivery or performance of the undelivered item(s) is considered probable and substantially in the control of the Company. The arrangement consideration, or the amount of revenue to be recognized on each separate unit of accounting, is allocated at the inception of the arrangement to all deliverables on the basis of their relative selling price.
Revenue related to spare parts is recognized on shipment.
Revenue related to maintenance and service contracts is recognized ratably over the duration of the contracts. Net service sales as presented in the Company’s Consolidated Statement of Operations and Comprehensive Income (Loss) includes revenue associated with LTX-Credence maintenance and service contracts only.
Inventories
Inventories are stated at the lower of cost or market, determined on the first-in, first-out (“FIFO”) method, and include materials, labor and manufacturing overhead. The components of inventories are as follows:
| | | | | | | | |
| | | April 30,
2014 | | | July 31,
2013 | |
| | | (in thousands) | |
Material and purchased components | | $ | 23,378 | | | $ | 15,379 | |
Work-in-process | | | 24,986 | | | | 2,887 | |
Finished equipment, including inventory consigned to customers | | | 21,577 | | | | 10,873 | |
| | | | | | | | |
Total inventories | | $ | 69,941 | | | $ | 29,139 | |
| | | | | | | | |
The Company establishes inventory reserves when conditions exist that indicate inventory may be in excess of anticipated demand or is obsolete based upon assumptions about future demand for the Company’s products or market conditions. The Company regularly evaluates the ability to realize the value of inventory based on a combination of factors including forecasted sales or usage, estimated product end of life dates, estimated current and future market value, and new product introductions.
Purchasing and usage alternatives are also explored to mitigate inventory exposure. When recorded, reserves are intended to reduce the carrying value of inventory to its net realizable value. As of April 30, 2014 and July 31, 2013, inventory was stated net of inventory reserves of $43.9 million and $41.8 million, respectively. If actual demand for products deteriorates or market conditions are less favorable than projected, additional inventory reserves may be required. Such reserves are not reversed until the related inventory is sold or otherwise disposed of.
Goodwill and Other Intangibles
The Company performs its annual goodwill impairment test as required under the provisions of Topic 350-10,Intangibles—Goodwill and Other to the FASB ASC on July 31 of each fiscal year unless interim indicators of impairment exist. Goodwill is considered to be impaired when the net book value of a reporting unit exceeds its estimated fair value. The Company’s goodwill represents the excess of acquisition costs over estimated fair value of net assets acquired from StepTech, Inc on June 10, 2003, and from the Company’s merger with Credence Systems Corporation (“Credence”) on August 29, 2008. There was no goodwill associated with the acquisition of the ECT and Multitest businesses on December 1, 2013. As a result of the recent Dover Acquisition, the Company is still evaluating the impact on the structure of the reporting units of the combined company. During the three months ended April 30, 2014, the Company did not identify any triggering events that would result in an interim test of goodwill.
7
Amortizable intangible assets which relate to the acquisition of the ECT and Multitest businesses and the Credence merger, consist of the following, and are included in intangibles asset, net on the Company’s Consolidated Balance Sheets:
| | | | | | | | | | | | | | | | | | | | |
| | | | | | As of April 30, 2014 | |
Description | | Estimated
Useful Life | | | Gross Carrying
Amount | | | Accumulated Amortization | | | Net Amount | |
| | | (in years) | | | (in thousands) | | | | | (in thousands) | | | | | (in thousands) | |
Developed technology—ASL | | | 6.0 | | | $ | 16,000 | | | | | $ | (15,934) | | | | | $ | 66 | |
Developed technology—Diamond | | | 9.0 | | | | 9,400 | | | | | | (9,082) | | | | | | 318 | |
Maintenance agreements—Credence | | | 7.0 | | | | 1,900 | | | | | | (1,290) | | | | | | 610 | |
Developed technology — Multitest | | | 10.0 | | | | 1,300 | | | | | | (171) | | | | | | 1,129 | |
Developed technology — Everett Charles Technologies | | | 10.0 | | | | 600 | | | | | | (81) | | | | | | 519 | |
Developed technology — atg L&M | | | 10.0 | | | | 1,800 | | | | | | (218) | | | | | | 1,582 | |
Customer relationships | | | 7.0 | | | | 400 | | | | | | (110) | | | | | | 290 | |
| | | | | | | | | | | | | | | | | | | | |
Total intangible assets | | | | | | $ | 31,400 | | | | | $ | (26,886) | | | | | $ | 4,514 | |
| | | | | | | | | | | | | | | | | | | | |
| | | | | | | | | | | | | | | | |
| | | Estimated
Useful Life | | | As of July 31, 2013 | |
Description | | | Gross Carrying
Amount | | | Accumulated
Amortization | | | Net Amount | |
| | | (in years) | | | (in thousands) | | | (in thousands) | | | (in thousands) | |
Developed technology—ASL | | | 6.0 | | | | 16,000 | | | | (15,737) | | | | 263 | |
Developed technology—Diamond | | | 9.0 | | | | 9,400 | | | | (8,906) | | | | 494 | |
Maintenance agreements—Credence | | | 7.0 | | | | 1,900 | | | | (1,086) | | | | 814 | |
| | | | | | | | | | | | | | | | |
Total intangible assets | | | | | | $ | 27,300 | | | $ | (25,729) | | | $ | 1,571 | |
| | | | | | | | | | | | | | | | |
Intangible assets, other than trademarks owned by the Company, are amortized based upon the pattern of estimated economic use over their estimated useful lives. The weighted average estimated remaining useful life over which these intangible assets will be amortized is 2.5 years.
The Company expects amortization for these intangible assets to be:
| | | | |
Year ending July 31, | | Amount
(in thousands) | |
Remainder of 2014 | | $ | 540 | |
2015 | | | 1,429 | |
2016 | | | 982 | |
2017 | | | 564 | |
2018 | | | 362 | |
Thereafter | | | 637 | |
| | | | |
Total | | $ | 4,514 | |
| | | | |
Also included in intangible assets, net on the Company’s Consolidated Balance Sheets at April 30, 2014 is $5.0 million of trademarks which were acquired in the Dover Acquisition. These assets have indefinite lives and are therefore not subject to amortization by the Company.
Impairment of Long-Lived Assets Other Than Goodwill and Indefinite Lived Intangibles
On an ongoing basis, management reviews the value of and period of amortization or depreciation of the Company’s long-lived assets. In accordance with Topic 360,Property, Plant and Equipment, to the FASB ASC, the Company reviews whether impairment losses exist on its long-lived assets other than goodwill when indicators of impairment are present. During this review, the Company assesses future cash flows and re-evaluates the significant assumptions used in determining the original cost of long-lived assets other than goodwill. Although the assumptions may vary, they generally include revenue growth, operating results, cash flows and other
8
indicators of value. Management then determines whether there has been a permanent impairment of the value of long-lived assets based upon events or circumstances that have occurred since acquisition. The impairment amount recognized is based upon a determination of the impaired asset’s fair value compared to its carrying value. As of April 30, 2014 and July 31, 2013 there were no indicators that required the Company to conduct a recoverability test as of those dates.
Foreign Currency Remeasurement
The financial statements of the Company’s foreign subsidiaries are remeasured in accordance with Topic 830,Foreign Currency Matters, to the FASB ASC. The Company’s functional currency is the U.S. dollar. Accordingly, the Company’s foreign subsidiaries remeasure monetary assets and liabilities at month-end exchange rates while long-term non-monetary items are remeasured at historical rates. Income and expense accounts are remeasured at the average rates in effect during the month. Net gains or losses resulting from foreign currency remeasurement and transaction gains or losses are included in the consolidated results of operations as a component of other expense, net, and were not significant for the three and nine months ended April 30, 2014 and 2013. The functional currency of each of the Acquired Businesses was historically the local currency and net gains or losses resulting from foreign currency remeasurement and translation gains or losses are recorded in stockholders’ equity as accumulated other comprehensive income (loss). The Company recorded $0.8 million of net foreign currency translation gain for the period December 1, 2013 to April 30, 2014. The Company is in the process of reevaluating its functional currency.
Product Warranty Costs
Certain of the Company’s products are sold with warranty provisions that require it to remedy deficiencies in quality or performance of products over a specified period of time at no cost to its customers. The Company generally offers a warranty for most of its products, the standard terms and conditions of which are based on the product sold and the customer. For all products sold, subject to warranty, the Company accrues a liability for the estimated cost of standard warranty at the time of product shipment. Factors that impact the expected product warranty liability include the number of installed products, historical and anticipated product failure rates, material usage and service labor costs. The Company periodically assesses the adequacy of its recorded product warranty liability and adjusts it as necessary.
The following table shows the change in the Company’s product warranty liability, as required by Topic 460,Guarantees, to the FASB ASC for the nine months ended April 30, 2014 and 2013:
| | | | | | | | |
| | | Nine Months Ended
April 30, | |
Product Warranty Activity | | 2014 | | | 2013 | |
| | | (in thousands) | |
Balance at beginning of period | | $ | 1,217 | | | $ | 1,672 | |
Warranty reserve acquired from ECT and Multitest | | | 1,970 | | | | — | |
Warranty expenditures for current period | | | (3,094) | | | | (2,834) | |
Changes in liability related to pre-existing warranties | | | (96) | | | | (86) | |
Provision for warranty costs in the period | | | 2,997 | | | | 2,543 | |
| | | | | | | | |
Balance at end of period | | $ | 2,994 | | | $ | 1,295 | |
| | | | | | | | |
Engineering and Product Development Expenses
The Company expenses all engineering, research and development expenses as incurred.
Shipping and Handling Costs
Shipping and handling costs are included in cost of sales in the Company’s Consolidated Statement of Operations and Comprehensive Income (Loss ). Shipping and handling costs were insignificant for the three and nine months ended April 30, 2014 and 2013.
Income Taxes
Provision for income taxes relates principally to operating results of foreign entities in jurisdictions primarily in Asia and Europe and the release of reserves due to statute of limitation expirations.
9
As of April 30, 2014 and July 31, 2013, the Company’s total liability for unrecognized income tax benefits was $6.6 million and $6.8 million, respectively (of which $3.0 million and $3.2 million, if recognized, would impact the Company’s income tax rate). The Company recognizes interest and penalties related to uncertain tax positions as a component of provision for income taxes. As of April 30, 2014 and July 31, 2013, the Company had accrued approximately $0.9 million for potential payment of accrued interest and penalties.
The Company conducts business globally and, as a result, the Company and its subsidiaries or branches file income tax returns in the U.S. federal jurisdiction and various U.S. state and foreign jurisdictions. In the normal course of business the Company is subject to examination by taxing authorities throughout the world, including such major jurisdictions as the United States, Singapore, Malaysia, China, France and Germany. With few exceptions, the Company is no longer subject to U.S. federal, state and local or non-U.S. income tax examinations for the years prior to 1998.
As a result of completion of the Company’s merger with Credence Systems Corporation (“Credence”) on August 29, 2008, a greater than 50% cumulative ownership change in both entities triggered a significant limitation in net operating loss carryforward utilization. The Company’s ability to use operating and acquired U.S. net operating loss and credit carryforwards is subject to annual limitation as defined in sections 382 and 383 of the Internal Revenue Code. The Company currently estimates that the annual limitation on its use of net operating losses generated through August 29, 2008 will be approximately $10.1 million which, based on currently enacted federal carryforward periods, limits the amount of net operating losses able to be used to approximately $202.0 million. The Company currently has a full valuation allowance against the U.S. net operating loss and credit carryforwards, and will continue to assess the realizability of these carryforwards in subsequent periods.
Accounting for Stock-Based Compensation
The Company has equity awards outstanding under various stock-based compensation plans, including the Company’s 2010 Stock Plan, as amended on November 26, 2010 (“2010 Plan”), the Company’s 2004 Stock Plan, the Company’s 2001 Stock Plan, the Company’s 1999 Stock Plan, and the Company’s 1993 Stock Plan. In addition, the Company assumed and has made awards that remain outstanding under the StepTech, Inc. Stock Option Plan as part of its acquisition of StepTech, Inc. (“StepTech”) in 2003 and the Credence 2005 Stock Incentive Plan in connection with the Credence merger. The Company can only grant new awards under the 2010 Plan.
The Company recognizes stock-based compensation expense for its equity awards in accordance with the provisions of Topic 718,Compensation—Stock Compensationto the FASB ASC (“Topic 718”). Under Topic 718, the Company is required to recognize as expense the estimated fair value as of the grant date of all share-based payments to employees. In accordance with this standard, the Company has elected to recognize the compensation cost of each service-based award on a straight-line basis over the vesting period of such award. The Company recorded stock-based compensation expense of approximately $1.3 million and $3.7 million for the three and nine months ended April 30, 2014, in connection with its share-based payments.
On February 27, 2014, the Company’s Board of Directors and Compensation Committee granted 300,000 restricted stock unit awards to certain employees, all of which are service-based. Of these awards, 96,000 vest 25% in each of the next four years. The remaining 204,000 awards vest 50% on December 1, 2014 and 50% on December 1, 2015. The Company will recognize the stock-based compensation expense related to these awards over their vesting periods.
10
Net loss per share
Basic net loss per share is computed by dividing net loss available to common stockholders by the weighted average number of common shares outstanding for the period. Because the Company was in a net loss position for all periods presented, diluted loss per share equals basic loss per share. The Company’s net loss and diluted loss per share for the three and nine months ended April 30, 2014 and 2013 is as follows:
| | | | | | | | | | | | | | | | |
| | | Three Months Ended
April 30, | | | Nine Months Ended
April 30, | |
| | | 2014 | | | 2013 | | | 2014 | | | 2013 | |
| | | (in thousands, except per share data) | |
Net loss | | $ | (200) | | | $ | (4,744) | | | $ | (12,681) | | | $ | (7,471) | |
Basic and diluted earnings per share: | | | | | | | | | | | | | | | | |
Weighted average shares outstanding- basic and diluted | | | 48,356 | | | | 47,547 | | | | 48,156 | | | | 47,761 | |
Basic and diluted loss per share | | $ | (0.00) | | | $ | (0.10) | | | $ | (0.26) | | | $ | (0.16) | |
For the three and nine months ended April 30, 2014 and 2013, options to purchase approximately 0.5 million shares and 1.0 million shares, respectively, of common stock were not included in the calculation of diluted net loss per share because their inclusion would have been anti-dilutive. These options could be dilutive in the future. The calculation of diluted net loss per share also excludes 2.2 million and 2.0 million restricted stock units, respectively, for the periods ended April 30, 2014 and 2013 in accordance with the contingently issuable shares guidance of Topic 260,Earnings Per Share, to the FASB ASC.
Cash and Cash Equivalents and Marketable Securities
The Company considers all highly liquid investments that are readily convertible to cash and that have original maturity dates of three months or less to be cash equivalents. Cash and cash equivalents consist primarily of operating cash. Marketable securities consist primarily of debt securities that are classified as available-for-sale and held-to-maturity, in accordance with Topic 320,Investments—Debt and Equity Securities, to the FASB ASC. The Company also holds certain investments in commercial paper or certificates of deposit that it considers to be held-to-maturity, based on their maturity dates. Securities available-for-sale includes corporate, asset-backed, mortgage-backed, and governmental obligations with various contractual maturity dates, some of which are greater than one year. The Company considers the securities to be liquid and convertible to cash within 30 days. The Company has the ability and intent to liquidate any security that the Company holds to fund operations over the next twelve months if necessary and as such has classified these securities as short-term. Governmental obligations include U.S. Government, State, Municipal and Federal Agency securities. The Company has an overnight sweep investment arrangement with its bank for certain accounts to allow the Company to enter into diversified overnight investments via a money market mutual fund which generally provides a higher investment yield than a regular operating account.
Gross unrealized gains and losses on investments held by the Company for the three and nine months ended April 30, 2014 and 2013 were not significant. Unrealized gains and losses on investments held by the Company are reflected as a separate component of comprehensive income (loss) and are included in Stockholders’ Equity. Realized gains, losses and interest on investments held by the Company are included in interest income in the Consolidated Statements of Operations and Comprehensive Income (Loss). The Company analyzes its investments for impairment on a quarterly basis or upon occurrence of indicators of possible impairment. There were no other temporary impairment losses in the three and nine months ended April 30, 2014 or 2013.
11
Property and Equipment
Property and equipment acquired is recorded at cost. The Company provides for depreciation and amortization on the straight-line method. Charges are made to operating expenses in amounts that are sufficient to amortize the cost of the assets over their estimated useful lives. Equipment spares used for service and internally manufactured systems used for testing components and engineering projects are recorded at cost and depreciated over three to seven years. Repair and maintenance costs that do not extend the lives of property and equipment are expensed as incurred. The Company’s property and equipment as of April 30, 2014 and July 31, 2013 are summarized as follows:
| | | | | | | | | | |
| | | April 30,
2014 | | | July 31,
2013 | | | Estimated
Useful Lives |
| | | (in thousands) | | | (in years) |
Equipment spares | | $ | 49,901 | | | $ | 58,461 | | | 5 or 7 |
Machinery, equipment and internally manufactured systems | | | 46,139 | | | | 34,587 | | | 3-7 |
Land | | | 6,147 | | | | 2,524 | | | indefinite |
Building | | | 6,264 | | | | — | | | 10-40 |
Office furniture and equipment | | | 3,394 | | | | 2,014 | | | 3-8 |
Purchased software | | | 486 | | | | 488 | | | 3 |
Leasehold improvements | | | 6,969 | | | | 6,983 | | | Lesser of lease term or useful life, not to exceed 10 years |
| | | | | | | | | | |
Property and equipment, gross | | | 119,300 | | | | 105,057 | | | |
Less: accumulated depreciation and amortization | | | (84,359) | | | | (88,410) | | | |
| | | | | | | | | | |
Property and equipment, net | | $ | 34,941 | | | $ | 16,647 | | | |
| | | | | | | | | | |
3. BUSINESS COMBINATION
Acquisition of Everett Charles Technologies LLC and Multitest
On September 6, 2013, in connection with the Dover Acquisition, the Company entered into a Master Sale and Purchase Agreement (the “Purchase Agreement”) with Dover and, solely for the limited purposes set forth in the Purchase Agreement, Dover Corporation (“Dover Parent”). Pursuant to the Purchase Agreement, the Company agreed to purchase from Dover or its specified affiliates (collectively, the “Sellers”) all assets of the Sellers used exclusively or primarily in connection with the research and development, design, manufacture, assembly, production, marketing, distribution, sale and repair of probes, assembled board and bare board test equipment, and fixturing products and the provision of services related thereto (the “ECT Business,” and such assets and intellectual property, the “ECT Assets”) and all assets of the Sellers used exclusively or primarily in connection with the research and development, design, manufacture, assembly, production, marketing, distribution, sale and repair of semiconductor test handlers, semiconductor test contactors and sockets and semiconductor test load boards, and the provision of services related thereto (the “MT Business,” and such assets and intellectual property, the “MT Assets”). The Company also agreed to assume certain specified liabilities of the Sellers related primarily or exclusively to the Acquired Businesses or the Acquired Assets (as defined below). Under the Purchase Agreement, the Company also agreed to acquire all of the issued and outstanding capital stock and other equity interests of specified indirect subsidiaries of Dover Parent and its affiliates engaged in the Acquired Businesses, including Everett Charles Technologies LLC (such capital stock and other equity interests, the “Acquired Shares”). The ECT Assets, the MT Assets and the Acquired Shares are collectively referred to as the “Acquired Assets.”
On December 1, 2013, the Company completed the Dover Acquisition pursuant to the Purchase Agreement. Pursuant to the Purchase Agreement, in connection with the closing of the Dover Acquisition (the “Closing”), the Company paid the Sellers an aggregate purchase price of $93.5 million, of which $73.5 million was paid in cash through a combination of existing cash-on-hand and bank debt and $20.0 million was paid by the issuance of promissory notes by the Company to certain Sellers in the original aggregate principal amount of $20.0 million. Pursuant to the Purchase Agreement, the cash purchase price was increased by $11.5 million, an amount equal to specified cash balances held by the Acquired Businesses as of the Closing and decreased by an amount equal to any acquired indebtedness and the amount of certain transaction costs and employee related liabilities of the Acquired Businesses as of the Closing. The cash purchase price was also increased by $3.2 million for a working capital adjustment as specified in the Purchase Agreement.
Subject to certain conditions, the original principal amount of the promissory notes are subject to reduction upon written certification from the Company to Dover prior to January 1, 2015 of certain specified events related to the Company’s relocation from or refurbishment of certain properties of the Acquired Businesses, or the prepayment of the promissory notes in full prior to such date. In January 2014, the Company executed leases for two new facilities, and in February 2014, the Company provided Dover with written certification of a planned relocation from certain properties of the Acquired Businesses. Consequently, the original principal amount of the promissory note issued to Dover was reduced by $2.0 million. The promissory notes accrue interest on the unpaid balance for each day that they remain outstanding after December 1, 2014 at a per annum rate equal to the London Interbank Offered Rate plus 10%, and may be prepaid by the Company at any time without penalty prior to May 1, 2019.
12
After giving effect to the post-Closing purchase price adjustments described above, and including the principal amount reduction of the promissory note to Dover, the aggregate purchase price paid to the Sellers as of the date of this report is $106.0 million.
The Company, Dover, and certain of their affiliates, also entered into a transition services agreement, an intellectual property termination agreement and a license agreement which govern certain ongoing relationships between the Company and Dover and their respective affiliates following the Closing.
In accordance with Topic 805,Business Combinations, to the FASB ASC and based on the terms of the Dover Acquisition, the Company is the accounting acquirer.
During the three and nine months ended April 30, 2014, the Company generated revenues of $105.4 million and $206.5 million, respectively. Of this amount, approximately $60.3 million and $100.2 million in revenues included in net product sales in the Company’s Consolidated Statement of Operations and Comprehensive Income (Loss) for the three and nine months ended April 30, 2014, respectively, is attributable to atg L&M, ECT and Multitest businesses. The Acquired Businesses also generated $1.2 million and $4.0 million of net income for the three and nine months ended April 30, 2014, which is included in the Company’s Consolidated Statement of Operations and Comprehensive Income (Loss) for the three and nine months ended April 30, 2014, respectively.
During the three and nine months ended April 30, 2014, the Company incurred $1.4 million and $3.6 million, respectively, of restructuring charges associated with workforce reductions and facility consolidation. The Company anticipates incurring additional restructuring charges of approximately $0.6 million through October 31, 2014. In accordance with the provisions of FASB ASC 805, these costs are expensed as incurred and are not allocated to the purchase price. Upon completion of the fair value assessment after the Dover Acquisition, the Company anticipates that the final purchase price allocation may differ from the preliminary assessment outlined below. Any changes to the initial estimates of the fair value of the assets and liabilities will be recorded as adjustments to those assets and liabilities and residual amounts will be allocated to the gain on bargain purchase. The fair value estimates for the assets acquired and liabilities assumed were based upon preliminary calculations and valuations, and the Company’s estimates and assumptions regarding the Dover Acquisition are subject to change as the Company obtains additional information during the measurement period (up to one year from the respective acquisition dates). The primary areas of preliminary estimates that were not yet finalized related to certain asset and liabilities acquired.
In accordance with the provisions of ASC 805, during the three months ended April 30, 2014, the Company retroactively recorded a change in estimate of Acquired Assets of $1.4 million related to the period ended January 31, 2014. Of this amount, approximately $0.6 million related to the working capital adjustment and therefore resulted in an increase to the purchase price. The remaining $0.8m was a change in estimate of assumed liabilities and had no impact to on the consideration paid the seller. The net impact of these adjustments resulted in a $1.4 million decrease to the bargain purchase gain.
The following is a summary of the estimated purchase price for the Acquired Assets:
| | | | |
| | | (in thousands) | |
Cash paid for Acquired Assets | | $ | 88,274 | |
Seller financing – Dover promissory note | | | 18,000 | |
| | | | |
Estimated purchase price | | $ | 106,274 | |
| | | | |
The following table summarizes the preliminary amounts recognized for the Acquired Assets and liabilities assumed as of the date of Closing. The allocation of purchase price is still preliminary as the Company is in the process of finalizing its valuation analysis. Any post-Closing true-up adjustments will have a corresponding purchase price adjustment.
The estimated purchase price has been allocated based on the fair value of net assets acquired as follows:
| | | | |
| Allocation of purchase consideration | | (in thousands) | |
Fair value of assets acquired as of December 1, 2013: | | | | |
Cash | | $ | 18,024 | |
Accounts receivable | | | 51,440 | |
Inventory | | | 42,567 | |
Property, plant and equipment | | | 20,664 | |
Identifiable intangible assets | | | 9,100 | |
Other assets | | | 1,062 | |
| | | | |
Assets acquired: | | $ | 142,857 | |
Fair value of liabilities acquired: | | | | |
Liabilities | | | (29,332) | |
Deferred taxes | | | (2,607) | |
| | | | |
Adjusted net assets acquired | | $ | 110,918 | |
Estimated purchase price | | | (106,274) | |
| | | | |
Bargain purchase gain | | $ | 4,644 | |
| | | | |
13
The overall fair value of the net assets acquired by the Company exceeded the amount paid, which resulted in the recognition of a bargain purchase gain by the Company during the three months ended January 31, 2014. This bargain purchase gain was recorded as a component of other (expense) income, net on the Company’s Consolidated Statement of Operations and Comprehensive Income (Loss). The Company believes it was able to acquire ECT and Multitest for less than the fair value of their net assets since ECT and Multitest had been held as discontinued operations by Dover Parent for more than one year.
Valuation of Intangible Assets and Goodwill
The overall fair value of the Multitest and ECT businesses of Dover has been allocated to tangible assets acquired, assumed liabilities, and identifiable intangible assets, based upon a detailed valuation that uses information and assumptions provided by management, as further described below.
Identifiable Intangible Assets
As part of the preliminary purchase price allocation, identifiable intangible assets of the Acquired Businesses include developed technology, customer relationships and trademarks.
The consolidated financial statements include estimated identifiable intangible assets with a fair value aggregating $9.1 million, which will be amortized based on the pattern and period over which the economic benefits of the intangible assets are realized. The current estimated weighted average period is 10.9 years. The Company engaged independent valuation advisors to assist the Company in estimating the identifiable intangible asset value. The estimated identifiable intangible asset value is primarily based on information and assumptions developed by the Company’s management, certain publicly available information, and discussions with management of the Acquired Businesses. These estimates will be adjusted based upon the completion of the Company’s final valuation. The final valuation is expected to be completed within 12 months after the Closing of the Dover Acquisition.
The Company primarily used the income approach to value the developed technology and other acquired identifiable intangible assets of the Acquired Businesses. This approach calculates fair value by estimating future cash flows attributable to each intangible asset and discounting the future cash flows to present value using a risk adjusted discount rate.
In estimating the useful life of the acquired intangible assets of the Acquired Businesses, the Company considered paragraph 11 of FASB ASC 350, which lists the pertinent factors to be considered when estimating the useful life of an intangible asset. These factors include a review of the expected use by the combined company of the assets acquired, the expected useful life of another asset (or group of assets) related to the acquired assets, legal, regulatory or other contractual provisions that may limit the useful life of an acquired asset or may enable the extension of the useful life of an acquired asset without substantial cost, the effects of obsolescence, demand, competition and other economic factors, and the level of maintenance expenditures required to obtain the expected future cash flows from the asset. The Company is amortizing these intangible assets over their estimated useful lives using a method that is based on estimated future cash flows as the Company believes this amortization methodology approximates the pattern in which the economic benefits of the intangible assets will be derived.
In accordance with the provisions of FASB ASC 350, the Company has identified trademarks, having a fair value of $5 million, acquired in the Dover Acquisition as having indefinite useful lives; therefore these assets are not subject to amortization. The Company will test these assets for impairment at least annually, or, if a triggering event occurs, more frequently.
Supplemental Pro Forma Information
The following unaudited pro forma information presents the consolidated results of operations of the Company, and the Acquired Businesses, as if the Dover Acquisition had occurred at the beginning of the three and nine months ended April 30, 2014, with pro forma adjustments to give effect to amortization of intangible assets and certain other adjustments (in thousands):
| | | | | | | | | | | | | | | | |
| | | Three Months Ended
April 30, | | | Nine Months Ended
April 30, | |
| | | 2014 | | | 2013 | | | 2014 | | | 2013 | |
Net sales | | $ | 105,424 | | | $ | 99,201 | | | $ | 297,221 | | | $ | 305,420 | |
Net loss | | $ | (200) | | | $ | (4,361) | | | $ | (16,935) | | | $ | (8,928) | |
Net loss per share—basic and diluted | | $ | (0.00) | | | $ | (0.09) | | | $ | (0.35) | | | $ | (0.19) | |
14
The pro forma net loss for the nine months ended April 30, 2014 includes $3.6 million of charges related to the Acquisition for restructuring costs and approximately $0.6 million of acquisition costs, which were incurred after December 1, 2013. The unaudited pro forma results are not necessarily indicative of the results that the Company would have attained had the Acquisition occurred at the beginning of the periods presented.
4. SEGMENT REPORTING AND GEOGRAPHIC INFORMATION
Segment Reporting
The Company currently operates as a single segment. As a result of the Dover Acquisition on December 1, 2013, the Company is currently assessing its reporting segments in accordance with the provisions of Topic 280,Segment Reporting to the FASB ASC.
Geographic Information
The Company’s net sales to geographic area for the three and nine months ended April 30, 2014 and 2013, along with its long-lived assets at April 30, 2014 and July 31, 2013, are summarized as follows:
| | | | | | | | | | | | | | | | |
| | | Three Months Ended April 30, | | | Nine Months Ended April 30, | |
| | | 2014 | | | 2013 | | | 2014 | | | 2013 | |
| | | (in thousands) | |
Net sales: | | | | | | | | | | | | | | | | |
United States | | $ | 27,541 | | | $ | 5,640 | | | $ | 49,055 | | | $ | 21,343 | |
Taiwan | | | 14,220 | | | | 9,408 | | | | 38,606 | | | | 29,743 | |
Philippines | | | 11,119 | | | | 5,867 | | | | 16,708 | | | | 17,714 | |
Malaysia | | | 8,542 | | | | 4,140 | | | | 13,856 | | | | 12,395 | |
Thailand | | | 8,301 | | | | 2,658 | | | | 11,735 | | | | 3,194 | |
Hong Kong/China | | | 8,215 | | | | 3,588 | | | | 17,287 | | | | 9,875 | |
Germany | | | 7,686 | | | | 1,642 | | | | 14,248 | | | | 5,621 | |
Singapore | | | 7,676 | | | | 731 | | | | 19,925 | | | | 4,586 | |
All other countries | | | 12,124 | | | | 2,583 | | | | 25,127 | | | | 9,990 | |
| | | | | | | | | | | | | | | | |
Total Net Sales | | $ | 105,424 | | | $ | 36,257 | | | $ | 206,547 | | | $ | 114,461 | |
| | | | | | | | | | | | | | | | |
Long-lived assets consist of property and equipment:
| | | | | | | | | | | | |
| | | April 30,
2014 | | July 31,
2013 |
| | | (in thousands) | | | |
Long-lived assets: | | | | | | | | | | | | |
United States | | $ | 23,166 | | | | | $ | 14,844 | | | |
Malaysia | | | 352 | | | | | | 3 | | | |
Germany | | | 434 | | | | | | 140 | | | |
China | | | 3,979 | | | | | | — | | | |
Japan | | | 3,870 | | | | | | 311 | | | |
Philippines | | | 716 | | | | | | 517 | | | |
Singapore | | | 663 | | | | | | 311 | | | |
Taiwan | | | 1,231 | | | | | | — | | | |
All other countries | | | 530 | | | | | | 521 | | | |
| | | | | | | | | | | | |
Total long-lived assets | | $ | 34,941 | | | | | $ | 16,647 | | | |
| | | | | | | | | | | | |
Transfer prices on products sold to foreign subsidiaries are intended to produce profit margins that correspond to the subsidiary’s sales and support efforts.
5. RESTRUCTURING
In accordance with the provisions of Topic 420,Exit or Disposal Cost Obligation, to the FASB ASC, the Company recognizes certain costs associated with headcount reductions, office vacancies and other costs to move or relocate operations or employees as restructuring costs in the period in which such actions are initiated and approved by management or the obligations are incurred, as applicable.
15
On January 30, 2014, the Company announced a strategic restructuring plan in connection with ongoing efforts to reduce costs and maximize efficiencies in connection with the Dover Acquisition. The Company recorded restructuring expense of $3.2 million during the nine months ended April 30, 2014 related to headcount reductions in connection with the implementation of the restructuring plan. The Company expects to incur an additional $0.6 million of restructuring expense associated with employees with deferred end dates, as well as facility consolidations, during the remainder of calendar year 2014.
On April 30, 2014, the Company ceased use of its Beaverton, Oregon facility. All operations that had occurred at that location have been transferred to other locations in North America. During the three months ended April 30, 2014, the Company recorded $0.4 million as restructuring expense related to remaining lease payments on the Beaverton, Oregon facility.
The following table sets forth the Company’s restructuring accrual activity for the nine months ended April 30, 2014 and April 30, 2013:
| | | | | | | | | | | | |
| | | Severance
Costs | | | Facility
Leases | | | Total | |
| | | | | | (in thousands) | | | | |
Balance July 31, 2013 | | $ | 2 | | | $ | 2,772 | | | $ | 2,774 | |
Balance assumed from the Dover Acquisition | | | 447 | | | | — | | | | 447 | |
Additions to expense | | | 3,176 | | | | 405 | | | | 3,581 | |
Accretion | | | — | | | | 197 | | | | 197 | |
Cash paid | | | (2,524) | | | | (912) | | | | (3,436) | |
| | | | | | | | | | | | |
Balance April 30, 2014 | | $ | 1,101 | | | $ | 2,462 | | | $ | 3,563 | |
| | | | | | | | | | | | |
Included in the Company’s Consolidated
Balance Sheet: | | | | | | | | | | | | |
Accrued expenses | | $ | 792 | | | $ | 1,153 | | | $ | 1,945 | |
Other long-term liabilities | | | 309 | | | | 1,309 | | | | 1,618 | |
| | | | | | | | | | | | |
Balance April 30, 2014 | | $ | 1,101 | | | $ | 2,462 | | | $ | 3,563 | |
| | | | | | | | | | | | |
| | | Severance | | | Facility | | | | |
| | | Costs | | | Leases | | | Total | |
| | | | | | (in thousands) | | | | |
Balance July 31, 2012 | | $ | 364 | | | $ | 3,697 | | | $ | 4,061 | |
Additions to expense | | | 231 | | | | 424 | | | | 655 | |
Accretion | | | — | | | | 167 | | | | 167 | |
Stock-based compensation | | | (48) | | | | — | | | | (48) | |
Cash paid | | | (425) | | | | (1,134) | | | | (1,559) | |
| | | | | | | | | | | | |
Balance April 30, 2013 | | $ | 122 | | | $ | 3,154 | | | $ | 3,276 | |
| | | | | | | | | | | | |
Included in the Company’s Consolidated
Balance Sheet: | | | | | | | | | | | | |
Accrued expenses | | $ | 122 | | | $ | 1,088 | | | $ | 1,210 | |
Other long-term liabilities | | | 0 | | | | 2,066 | | | | 2,066 | |
| | | | | | | | | | | | |
Balance April 30, 2013 | | $ | 122 | | | $ | 3,154 | | | $ | 3,276 | |
| | | | | | | | | | | | |
The balance assumed in the Dover Acquisition relates to liabilities that were assumed by the Company from actions that existed prior to the Closing.
6. COMMITMENTS AND CONTINGENCIES
From time to time, the Company is subject to certain legal proceedings and other contingencies, the outcomes of which are subject to significant uncertainty. The Company accrues for estimated losses if it is probable that an asset has been impaired or a liability has been incurred and the amount of the loss can be reasonably estimated. The Company uses judgment and evaluates, with the assistance of legal counsel, whether a loss contingency arising from litigation should be disclosed or recorded. The outcome of legal proceedings and other contingencies is inherently uncertain and often difficult to estimate. Accordingly, if the outcome of legal proceedings and other contingencies is different than is anticipated by the Company, the Company would record the difference between any previously recorded amount and the full amount at which the matter was resolved, in earnings in the period resolved, which could negatively impact the Company’s results of operations and financial position for the period.
16
The Company is a defendant in a litigation matter incidental to the business that is related to customer expectations of test system performance for product that was shipped in 2006 by Credence. The Company does not believe the plaintiff’s claims have merit and is vigorously defending its position. An estimate of any potential loss cannot be made; the Company does not believe a loss is probable, and accordingly the Company has not accrued any amounts related to this matter.
17
In the ordinary course of business, the Company agrees from time to time to indemnify certain customers against certain third party claims for property damage, bodily injury, personal injury or intellectual property infringement arising from the operation or use of the Company’s products. Also, from time to time in agreements with suppliers, licensors, and other business partners, the Company agrees to indemnify these partners against certain liabilities arising out of the sale or use of the Company’s products. The maximum potential amount of future payments the Company could be required to make under these indemnification obligations in the aggregate is theoretically unlimited; however, the Company has general and umbrella insurance policies that enable it to recover a portion of any amounts paid, and many of its agreements contain a limit on the maximum amount, as well as limits on the types of damages recoverable. Based on the Company’s experience with such indemnification claims, it believes the estimated fair value of these obligations is minimal. Accordingly, the Company has no liabilities recorded for these agreements as of April 30, 2014 or July 31, 2013.
Subject to certain limitations, the Company indemnifies its current and former officers and directors in certain circumstances in connection with their services as directors and officers of the Company. Although the maximum potential amount of future payments the Company could be required to make under these agreements is theoretically unlimited, as there were no known or pending claims, the Company has not accrued a liability for these agreements as of April 30, 2014 or July 31, 2013.
The Company had approximately $30.3 million and $14.8 million of non-cancelable inventory commitments as of April 30, 2014 and July 31, 2013, respectively. The Company expects to consume the inventory through normal operating activity.
As a result of restructuring actions taken by the Company during the nine months ended April 30, 2014, the Company has approximately $1.1 million in accrued severance at April 30, 2014 related to headcount reductions. The Company expects to pay these obligations through the fourth quarter of fiscal 2015.
The Company has operating lease commitments for certain facilities and equipment that expire at various dates through 2021. Minimum lease payment obligations under non-cancelable leases are as follows:
Lease Commitments:
| | | | |
For the fiscal year ending July 31, | | Amount | |
| | | (in thousands) | |
Remainder of 2014 | | $ | 2,277 | |
2015 | | | 6,612 | |
2016 | | | 5,583 | |
2017 | | | 3,953 | |
2018 | | | 1,642 | |
Thereafter | | | 5,089 | |
| | | | |
Total minimum lease payments | | $ | 25,156 | |
| | | | |
7. ACCRUED EXPENSES
Accrued expenses consisted of the following at April 30, 2014 and July 31, 2013:
| | | | | | | | |
| | | (in thousands) | |
| | | April 30,
2014 | | | July 31,
2013 | |
Accrued compensation | | $ | 14,802 | | | $ | 7,538 | |
Warranty reserve | | | 2,994 | | | | 1,217 | |
Accrued restructuring | | | 1,945 | | | | 1,037 | |
Accrued commissions | | | 1,880 | | | | 912 | |
Accrued vendor liability | | | 1,535 | | | | 2,153 | |
Accrued income and other taxes | | | 1,858 | | | | 1,115 | |
Accrued professional fees | | | 1,057 | | | | 2,043 | |
Other accrued expenses | | | 9,566 | | | | 3,337 | |
| | | | | | | | |
Total accrued expenses | | $ | 35,637 | | | $ | 19,352 | |
| | | | | | | | |
18
8. LONG-TERM DEBT
Long-term debt consists of the following:
| | | | | | | | |
| | | April 30,
2014 | | | July 31,
2013 | |
| | | (in thousands | ) | | | | |
Bank Term Loan under Credit Agreement | | $ | 48,750 | | | $ | — | |
Seller Financing- Promissory Notes | | | 18,000 | | | | — | |
| | | | | | | | |
Total debt | | | 66,750 | | | | — | |
Less: current portion | | | 3,125 | | | | — | |
| | | | | | | | |
Total long-term debt | | $ | 63,625 | | | $ | — | |
| | | | | | | | |
The debt principal payments for the next five years and thereafter are as follows:
| | | | |
Payments due by fiscal year | | Debt Principal
Payments | |
| | | (in thousands) | |
Remainder of 2014 | | $ | 625 | |
2015 | | | 4,688 | |
2016 | | | 7,187 | |
2017 | | | 8,437 | |
2018 | | | 9,688 | |
Thereafter | | | 36,125 | |
| | | | |
Total | | $ | 66,750 | |
| | | | |
Credit Agreement
On November 27, 2013, in anticipation of the completion of the Dover Acquisition and to fund a portion of the purchase price therefore the Company entered into a credit agreement (the “Credit Agreement”) with Everett Charles Technologies LLC (together with the Company, the “Borrowers”), Silicon Valley Bank, as lender, administrative agent and issuing lender (“SVB”), and the several lenders from time to time party thereto (the “Lenders”). The Credit Agreement provides for a senior secured credit facility in the aggregate principal amount of up to $55 million (the “Facility”).
The Facility consists of a term loan facility for $50 million that was advanced to the Company on November 27, 2013 (the “Term Loan”) and a revolving credit facility (including a letter of credit facility) for up to $5 million (the “Revolving Loan” and, together with the Term Loan, the “Loans”) that is available from time to time for five years after November 27, 2013 (the “Closing Date”). Under the terms of the Credit Agreement, not more than one time during the period commencing on the Closing Date until the close of business on the date that is one day prior to the 42-month anniversary of the Closing Date, the Facility may be increased by an aggregate amount not to exceed $20 million through an additional facility on apari passu basis with the Term Loan, subject to specified conditions and the agreement of one or more Lenders to participate therein. At April 30, 2014, approximately $1.1 million was outstanding in the form of standby letters of credit. The standby letters of credit have various expiration dates, of which the last to expire is November 2014.
All obligations under the Facility are secured by a first priority security interest in substantially all of the Borrowers’ existing and future assets, including a pledge of the stock or other equity interests of the Borrowers’ domestic subsidiaries and of any first tier foreign subsidiaries, provided that not more than 66% of the voting stock of any such foreign subsidiaries shall be required to be pledged.
The Credit Agreement requires that the Term Loan be repaid in quarterly installments, with 5% of the principal due the first year, 7.5% of principal due the second year, 10% of principal due the third year, 12.5% of principal due the fourth year, 15% of principal due the fifth year, and a final payment of $25 million due on the fifth anniversary of the Closing Date (the “Maturity Date”). All outstanding Loans under the Facility mature on the Maturity Date unless earlier payment is required under the terms of the Credit Agreement. The Term Loan is subject to optional and mandatory prepayment in whole and part as described in the Credit Agreement, subject to certain criteria. Loans outstanding under the Facilities may, at the Borrowers’ option, be prepaid at any time in whole or in part without premium or penalty, other than customary breakage costs, if any, subject to the terms and conditions of the Credit Agreement.
19
Borrowings under the Facility bear interest, at a base rate plus a margin of up to 2.50% per annum, or at the London Interbank Offered Rate (“LIBOR”) plus a margin of up to 3.50% per annum, in either case based on the Company’s ratio of consolidated senior debt to consolidated earnings before interest, taxes, depreciation and amortization (EBITDA) (the “Leverage Ratio”), or at a LIBOR rate plus a margin (such margin not to exceed a per annum rate of 3.50%) based on the Leverage Ratio. The selection of the interest rate formula is at the Company’s discretion. The interest rate otherwise payable under the Facility will be subject to increase by 2.0% per annum during the continuance of a payment default and may be subject to increase by 2.0% per annum during the continuance of any other event of default under the Credit Agreement. Certain customary fees and expenses are also payable in connection with the Facility. At April 30, 2014, the interest rate in effect on the Facility was 2.74%.
The obligations of the Company under the Facility may be accelerated upon the occurrence of an event of default under the Credit Agreement, which includes customary events of default, including payment defaults, the inaccuracy of representations or warranties, the failure to comply with covenants, ERISA defaults, judgment defaults, bankruptcy and insolvency defaults and cross defaults to material indebtedness.
Covenants
The Credit Agreement contains customary affirmative and negative covenants, subject in certain cases to baskets and exceptions, including negative covenants with respect to indebtedness, liens, fundamental changes, dispositions, restricted payments, investments, ERISA matters, matters relating to subordinated debt, affiliate transactions, sale and leaseback transactions, swap agreements, accounting changes, negative pledge clauses, clauses restricting subsidiary distributions, lines of business, amendments to certain documents and use of proceeds. The Credit Agreement also contains customary reporting and other affirmative covenants. The Credit Agreement contains a consolidated fixed charge coverage ratio, consolidated leverage ratio and liquidity requirements. The Credit Agreement required the Company to maintain a consolidated leverage ratio of less than 3.00 to 1.00 as of the end of four consecutive fiscal quarters ending January 31, 2014. At January 31, 2014, the Company’s consolidated leverage ratio exceeded this ratio threshold, resulting in an event of default under the Credit Agreement. On April 15, 2014, the Company executed a First Amendment to Credit Agreement and Waiver (the “Credit Agreement Amendment and Waiver”) pursuant to which the parties thereto agreed, among other things, to waive the occurrence of the event of default resulting from the Company’s failure to meet the above described financial covenant in the Credit Agreement provided, that the Company’s consolidated leverage ratio for the four fiscal quarters ending on January 31, 2014 did not exceed 3.66 to 1.00. Pursuant to the Credit Agreement Amendment and Waiver, the parties also agreed to modify the definition of “consolidated net income” to include, in the calculation of consolidated net income for periods following the closing of the Dover Acquisition, net income (or loss) attributable to the Acquired Businesses for specified periods prior to the closing of the Dover Acquisition.
As of April 30, 2014, the Company was in compliance with all covenants under the Credit Agreement and Credit Agreement Amendment and Waiver, including the consolidated leverage ratio.
Seller Financing – Promissory Notes
As described in Note 3 above, pursuant to the Purchase Agreement, in connection with the closing of the Dover Acquisition, the Company issued promissory notes having an aggregate principal amount of $20.0 million to certain of the Sellers.
Subject to certain conditions, the original principal amount of the promissory notes are subject to reduction upon written certification from the Company to Dover prior to January 1, 2015 of certain specified events related to the Company’s relocation from or refurbishment of certain properties of the Acquired Businesses, or the prepayment of the promissory notes in full prior to such date. In January 2014, the Company executed leases for two new facilities, and in February 2014, the Company provided written certification to Dover of a planned relocation from certain properties of the Acquired Businesses. Accordingly, the Company was released from $2.0 million of the promissory note obligations. As of the date of this report, the aggregate principal amount of the promissory notes is $18.0 million.
The promissory notes accrue interest on the unpaid balance for each day that they remain outstanding after December 1, 2014 at a per annum rate equal to the LIBOR plus 10%, and may be prepaid by the Company at any time without penalty prior to May 1, 2019. The promissory notes are subject to repayments of $1.3 million on December 1 and June 1 of each year starting in June 2015, until the notes are paid in full.
20
9. FAIR VALUE MEASUREMENTS
The Company determines its fair value measurements for assets and liabilities based upon the provisions of Topic 820,Fair Value Measurements and Disclosures to the FASB ASC.
The Company holds short-term money market investments and certain other financial instruments which are carried at fair value. The Company determines fair value based upon quoted prices, when available, or through the use of alternative approaches when market quotes are not readily accessible or available.
Valuation techniques for fair value are based upon observable and unobservable inputs. Observable inputs reflect market data obtained from independent sources, while unobservable inputs reflect the Company’s best estimate, considering all relevant information. These valuation techniques involve some level of management estimation and judgment. The valuation process to determine fair value also includes making appropriate adjustments to the valuation model outputs to consider risk factors.
The fair value hierarchy of the Company’s inputs used in the determination of fair value for assets and liabilities during the current period consists of three levels. Level 1 inputs are composed of unadjusted, quoted prices in active markets for identical assets or liabilities at the measurement date. Level 2 inputs include quoted prices for similar instruments in active markets, quoted prices for identical or similar instruments in markets that are not active, inputs other than quoted prices that are observable for the asset or liability, and inputs that are derived principally from or corroborated by observable market data by correlation or other means. Level 3 inputs incorporate the Company’s own best estimate of what market participants would use in pricing the asset or liability at the measurement date where consideration is given to the risk inherent in the valuation technique and the risk inherent in the inputs to the model. If inputs used to measure an asset or liability fall within different levels of the hierarchy, the categorization is based on the lowest level input that is significant to the fair value measurement of the asset or liability. The Company’s assessment of the significance of a particular input to the fair value measurement in its entirety requires judgment and consideration of factors specific to the asset or liability.
The following table presents financial assets and liabilities measured at fair value and their related valuation inputs as of April 30, 2014 and July 31, 2013:
| | | | | | | | | | | | | | | | |
| | | | | | Fair Value Measurements at Reporting Date Using
(in thousands) | |
April 30, 2014 | | Total Fair Value of Asset
or Liability | | | Quoted Prices in Active
Markets for Identical
Assets (Level 1) | | | Significant Other
Observable Inputs
(Level 2) | | | Significant
Unobservable Inputs
(Level 3) | |
Cash and cash equivalents (1) | | $ | 55,114 | | | $ | 55,114 | | | $ | — | | | $ | — | |
Marketable securities (2) | | | 41,582 | | | | 5,448 | | | | 36,134 | | | | — | |
| | | | | | | | | | | | | | | | |
Total assets | | $ | 96,696 | | | $ | 60,562 | | | $ | 36,134 | | | $ | — | |
| | | | | | | | | | | | | | | | |
| | | | |
July 31, 2013 | | Total Fair Value of Asset
or Liability | | | Quoted Prices in Active
Markets for Identical
Assets (Level 1) | | | Significant Other
Observable Inputs
(Level 2) | | | Significant
Unobservable Inputs
(Level 3) | |
Cash and cash equivalents (1) | | $ | 28,235 | | | $ | 28,235 | | | $ | — | | | $ | — | |
Marketable securities (2) | | | 93,306 | | | | 8,553 | | | | 84,753 | | | | — | |
| | | | | | | | | | | | | | | | |
Total assets | | $ | 121,541 | | | $ | 36,788 | | | $ | 84,753 | | | $ | — | |
| | | | | | | | | | | | | | | | |
| (1) | Cash and cash equivalents as of April 30, 2014 and July 31, 2013 included cash held in operating accounts of approximately $53.8 million and $25.9 million, respectively that were not subject to fair value measurements. |
| (2) | Marketable securities as of April 30, 2014 and July 31, 2013 excluded approximately $0 million and $2.8 million, respectively, of commercial paper which was held-to-maturity and not subject to fair value measurement. |
21
The carrying value of accounts receivable, prepaid expenses and accounts payable approximate fair value due to their short-term nature.
There were no assets or liabilities recorded at fair value on a non-recurring basis requiring valuation disclosures as of April 30, 2014 or July 31, 2013.
10. STOCKHOLDERS’ EQUITY
Stock Repurchases
On September 15, 2011, the Company announced that its Board of Directors had authorized a stock repurchase program for up to $25 million of shares of the Company’s common stock. Under this program, the Company is authorized to repurchase shares of its common stock from time to time in open market transactions. The Company will determine the timing and amount of the transactions based on its evaluation of market conditions and other factors. The repurchase program may be suspended or discontinued at any time and has no expiration date. During the three and nine months ended April 30, 2014, the Company did not repurchase any shares under this program. Cumulatively, as of April 30, 2014, the Company has repurchased 3,294,666 shares of common stock for a total purchase price of $18.7 million since the inception of the program.
11. RECENT ACCOUNTING PRONOUNCEMENTS
In July 2013, the FASB issued ASU No. 2013-11,Presentation of an Unrecognized Tax Benefit When a Net Operating Loss Carryforward, a Similar Tax Loss, or a Tax Loss, or a Tax Credit Carryforward Exists. Topic 740,Income Taxes, to the FASB ASC does not include explicit guidance on the financial statement presentation of an unrecognized tax benefit when a net operating loss carryforward, a similar tax loss, or a tax credit carryforward exists. There is diversity in practice in the presentation of unrecognized tax benefits in those instances and the amendments in this update are intended to eliminate that diversity in practice. The amendments are effective for fiscal years, and interim periods within those years, beginning after December 15, 2013. The amendments should be applied prospectively to all unrecognized tax benefits that exist at the effective date. Early adoption is permitted. The Company is currently evaluating the impact of adoption of this amended standard.
12. SUBSEQUENT EVENTS
On May 16, 2014, LTX-Credence Corporation held a Special Meeting of Stockholders to approve an amendment to its Articles of Organization, to change the name of the Company from “LTX-Credence Corporation” to “Xcerra Corporation.” The proposal was approved by the Company’s stockholders, with the results of the voting as follows: 44,273,002 shares of the Company’s common stock outstanding were represented at the meeting, with 43,411,016 voted in favor, 283,279 shares voted against and 578,707 shares abstaining. The amendment to the Company’s Articles of Organization was filed with the Secretary of the Commonwealth of Massachusetts on May 20, 2014 and the Company began operating under its new name and its Common Stock began trading on the Nasdaq Global Market under the ticker symbol “XCRA” on May 22, 2014.
Item 2. MANAGEMENT’S DISCUSSION AND ANALYSIS OF FINANCIAL CONDITION AND RESULTS OF OPERATIONS
The following discussion should be read together with the Consolidated Financial Statements and Notes thereto appearing in Part I, Item 1 in this Quarterly Report on Form 10-Q. Certain statements in “Management’s Discussion and Analysis of Financial Condition and Results of Operations” are forward-looking statements that involve risks and uncertainties. Words such as may, will, could, should, would, anticipates, expects, intends, plans, predicts, projects, believes, seeks, estimates and similar expressions identify such forward-looking statements. The forward-looking statements contained herein are based on current expectations and entail various risks and uncertainties that could cause actual results to differ materially and adversely from those expressed in such forward-looking statements. Factors that might cause such a difference include, among other things, those set forth under “Risk Factors” in our Annual Report onForm 10-K for the fiscal year ended July 31, 2013 filed with the Securities and Exchange Commission on October 11, 2013 as updated by Item 1A. Risk Factors and those appearing elsewhere in this Quarterly Report on Form 10-Q. Readers are cautioned not to place undue reliance on these forward-looking statements, which speak only as of the date hereof and reflect management’s estimates and analysis only as of the date hereof. We assume no obligations to update these forward-looking statements to reflect actual results or changes in factors or assumptions affecting forward-looking statements.
22
Overview
Xcerra Corporation (“Xcerra” or the “Company”), formerly known as LTX-Credence Corporation, is a global provider of test and handling capital equipment, interface products, test fixtures, and services to the semiconductor, industrial, and electronics manufacturing industries. We design, manufacture, market and service systems and products that address the broad, divergent requirements of the mobility, industrial, medical, automotive and consumer end markets, offering a comprehensive portfolio of solutions and technologies, and a global network of strategically deployed applications and support resources. We operate in the semiconductor and electronics manufacturing test markets and are the parent company to the atg-Luther & Maelzer, Everett Charles Technologies, LTX-Credence and Multitest businesses. We have a broad spectrum of semiconductor and printed circuit board (“PCB”) test expertise that drives innovative new products and services, and the ability to deliver to customers fully integrated semiconductor test solutions.
Semiconductor designers and manufacturers worldwide use our test and handling equipment and interface products to test their devices during the manufacturing process. Our interface products include the design, manufacturing and marketing of load boards, contactors, and pins used in various types of test equipment, and as well as a wide variety of commercial and consumer applications. After testing, these devices are incorporated into a wide range of products, including personal and tablet computers, mobile internet equipment such as wireless access points and interfaces, broadband access products such as cable modems and set top boxes, personal communication and entertainment products such as mobile phones and personal digital music players, consumer products such as televisions, videogame systems, digital cameras, automobile electronics and power management devices used in portable and automotive electronics. We also design, manufacture and market PCB test systems used in the testing of preassembly PCBs. These testers are used to verify the quality of the PCB prior to the installation of components. The types of PCBs that are tested using these systems include a diverse set of electronic products including network servers, personal computers, tablet computers and mobile phones. Our text fixture products include the design, manufacturing and marketing of in-circuit and functional-circuit fixture design and fabrication services for testing assembled PCBs. We also sell hardware and software support and maintenance services for our products.
The chart below displays our semiconductor and PCB manufacturing processes and identifies the product and service offerings at the various steps where our systems or products are used.
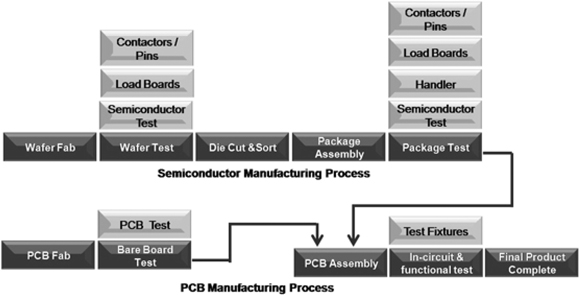
For our semiconductor test related businesses we focus our marketing and sales efforts on integrated device manufacturers (IDMs), outsourced semiconductor assembly and test providers, (OSATs), which perform assembly and testing services for the semiconductor industry, and fabless semiconductor companies, which design integrated circuits but have no manufacturing capability. We offer our customers a comprehensive portfolio of semiconductor test systems, handlers and interface products and provide a global network of strategically deployed applications and support resources. For our PCB test systems and PCBA test fixtures and design services, our marketing and sales efforts are focused on the manufacturers’ of PCBs, as well as the companies whose products the PCBs are incorporated.
23
The Dover Acquisition
On September 6, 2013, we entered into a Master Sale and Purchase Agreement (Purchase Agreement) with Dover and, solely for the limited purposes set forth in the Purchase Agreement, Dover Corporation (Dover Parent). Pursuant to the Purchase Agreement, we agreed to purchase from Dover or its specified affiliates (collectively, the Sellers) all assets of the Sellers used exclusively or primarily in connection with the research and development, design, manufacture, assembly, production, marketing, distribution, sale and repair of probes, assembled board and bare board test equipment, and fixturing products and the provision of services related thereto (the ECT Business, and such assets and intellectual property, the ECT Assets) and all assets of the Sellers used exclusively or primarily in connection with the research and development, design, manufacture, assembly, production, marketing, distribution, sale and repair of semiconductor test handlers, semiconductor test contactors and sockets and semiconductor test load boards, and the provision of services related thereto (the MT Business, and such assets and intellectual property, the MT Assets). We also agreed to assume certain specified liabilities of the Sellers related primarily or exclusively to the Acquired Businesses or the Acquired Assets (as defined below). Under the Purchase Agreement, we would also acquire all of the issued and outstanding capital stock and other equity interests of specified indirect subsidiaries of Dover Parent and its affiliates that are engaged in the Acquired Businesses, including Everett Charles Technologies LLC (such capital stock and other equity interests, the Acquired Shares). The ECT Business and the MT Business are collectively referred to as the Acquired Businesses and the ECT Assets, the MT Assets and the Acquired Shares are collectively referred to as the Acquired Assets. The asset and share purchase transactions effected pursuant to the Purchase Agreement are collectively referred to as the “Dover Acquisition.” On December 1, 2013, the Company completed the Dover Acquisition pursuant to the Purchase Agreement.
On November 27, 2013, in anticipation of the completion of the Dover Acquisition and to fund the purchase price therefore we entered into a credit agreement (Credit Agreement) with Everett Charles Technologies LLC (ECT and together with us, the Borrowers), Silicon Valley Bank, as lender, administrative agent and issuing lender (SVB), and the several lenders from time to time party thereto (the Lenders). The Credit Agreement provides for a senior secured credit facility in favor of the Borrowers in the aggregate principal amount of up to $55.0 million (the Facility). See theLiquidity and Capital Resources for more information regarding our obligations and expected impact to our liquidity from the Credit Agreement. See Note 3 to the Consolidated Financial Statements included in this Quarterly Report on Form 10-Q for a more complete description of the Business Combination.
Pursuant to the Purchase Agreement, in connection with the closing of the Dover Acquisition, we paid the Sellers an aggregate purchase price of $93.5 million, of which $73.5 million was paid in cash through a combination of existing cash-on-hand and bank debt and $20.0 million was paid by the issuance of promissory notes by us to the certain Sellers in the original principal amount of $20.0 million. Pursuant to the Purchase Agreement, the cash purchase price was increased by $11.5 million, an amount equal to specified cash balances held by the Acquired Businesses as of the Closing and decreased by an amount equal to any acquired indebtedness and the amount of certain transaction costs and employee related liabilities of the Acquired Businesses as of the Closing. The cash purchase price was also increased by $3.2 million for a working capital adjustment as specified in the Purchase Agreement. After giving effect to the Post-Closing purchase price adjustments described above, and including the reduction in the promissory note, the aggregate purchase price paid to the Sellers as of the date of this report is $106.0 million.
Subject to certain conditions, the original principal amount of the promissory notes are also subject to reduction upon written certification from us to Dover prior to January 1, 2015 of certain specified events related our relocation from or refurbishment of certain properties of the Acquired Businesses, or the prepayment of the promissory note in full prior to such date. In January 2014, we executed leases for two new facilities, and in February 2014, we provided Dover with written certification of a planned relocation from certain properties of the Acquired Businesses. Consequently, the original principal amount of the promissory note issued to Dover was reduced by $2.0 million. The promissory notes may be reduced further by $1.75 million subject to certification from us to Dover of other specified events that have not yet occurred. The promissory notes accrue interest on the unpaid balance for each day that they remain outstanding after December 1, 2014 at a per annum rate equal to the London Interbank Offered Rate plus 10%, and may be prepaid by us at any time without penalty prior to May 1, 2019. On or prior to December 1, 2013, we and Dover, or their affiliates, respectively, also entered into a transition services agreement, an intellectual property termination agreement and a license agreement which govern certain ongoing relationships between us and Dover and their respective affiliates following the closing. Pursuant to the Purchase Agreement, we have also agreed to assume certain liabilities related to the Acquired Businesses. See theLiquidity and Capital Resources section for more information regarding our obligations and expected impact to our liquidity pursuant to the Purchase Agreement.
Since the Dover Acquisition closed prior to January 31, 2014, the Acquired Assets and liabilities assumed are included in our unaudited Consolidated Balance Sheet as of April 30, 2014. Through April 30, 2014, we incurred an aggregate of approximately $3.8 million in expenses in connection with the Acquisition, all of which are recognized in selling, general and administrative expenses in our Consolidated Statement of Operations and Comprehensive Income (Loss). We expect to incur additional expenses relating to the integration of the Acquired Businesses into our operations.
24
Industry Conditions and Outlook
We sell capital equipment, consumables and services to companies that design, manufacture, assemble, or test semiconductor devices and PCBs. The electronics manufacturing industry, of which semiconductors and PCBs are key components, is highly cyclical, causing a cyclical impact on our financial results. Approximately 50% of our revenues are derived from selling capital equipment. As a result, our revenue is driven by the capital expenditure budgets and spending patterns of our customers, who often delay or accelerate purchases in reaction to variations in their business. The level of capital expenditures by these companies depends on the current and anticipated market demand for semiconductor devices and PCBs and the products that incorporate them. Therefore, demand for our capital equipment and other products and services are dependent on growth in the electronics industry. In particular, three primary characteristics of the industry in which we operate drive the demand for our products and services:
| | • | | increases in unit production of semiconductor devices and PCBs; |
| | • | | increases in the complexity of semiconductor devices and PCBs used in electronic products; and |
| | • | | the emergence of next generation electronic products requiring new semiconductor or PCB technologies. |
The following graph shows the cyclicality in semiconductor test and handling equipment orders and shipments from fiscal 2007 through April 2014 (using the three month moving average), as calculated by SEMI, an industry trade organization:
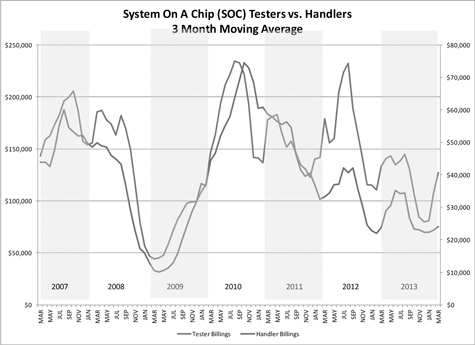
Consistent with our business strategy, we have continued to invest significant amounts in engineering and product development to develop and enhance our products during industry slowdowns. During these slowdown periods, we implement cost reduction measures, such as the strict oversight of expenditures and reduction in discretionary travel and other variable overhead expenses. We believe that these reductions in operating expenses preserve our ability to fund critical product research and development efforts and continue to provide our customers with the levels of responsiveness and service they require. We believe that our competitive advantages in the semiconductor test and PCB test industries are primarily driven by the ability of our products to meet or exceed the cost and technical specifications required for the testing of advanced semiconductor devices and PCBs. Our current investment in engineering and product development is focused on enhancements and additions to our product offerings with new options, instruments, and performance enhancements designed for specific market segments. We believe this will continue to differentiate our products from the product offerings of our competitors.
We are also exposed to the risks associated with the volatility of the U.S. and global economies. The lack of visibility regarding whether or when there will be sustained growth periods for the sale of electronic goods and information technology equipment, and uncertainty regarding the amount of sales, underscores the need for caution in predicting growth in the semiconductor test equipment industry in general and in our revenues and profits specifically. Slow or negative growth in the U.S. economy may materially and adversely affect our business, financial condition, and results of operations for the foreseeable future. Our results of operations would
25
be further adversely affected if we were to experience lower than anticipated order levels, cancellations of orders in backlog, extended customer delivery requirements, pricing pressure as a result of a slowdown, or other competitive pressures. At lower levels of revenue, there is a higher likelihood that these types of changes in our customers’ requirements would have a more significant adverse effect on our results of operations because in any particular quarter a limited number of transactions would account for an even greater portion of sales for the quarter.
Critical Accounting Policies and the Use of Estimates
The preparation of financial statements in conformity with generally accepted accounting principles requires management to make estimates and assumptions that affect the reported amount of assets, liabilities, revenues, and expenses, and related disclosure of contingent assets and liabilities. We base these estimates and assumptions on historical experience and evaluate them on an on-going basis to ensure they remain reasonable under current conditions. Actual results could differ from those estimates. We believe that our most critical accounting policies upon which our financial reporting depends and which involve the most complex and subjective decisions or assessments are as follows: revenue recognition, inventory reserves, income taxes, warranty, goodwill and other intangibles, impairment of long-lived assets, and allowances for doubtful accounts.
A summary of those accounting policies and estimates that we believe to be most critical to fully understand and evaluate our financial results is set forth below. The summary should be read in conjunction with our Consolidated Financial Statements and Notes and related disclosures in Part I, Item 1 in this Quarterly Report on Form 10-Q.
Revenue Recognition
Our revenue recognition policy is described in Note 2, Summary of Significant Accounting Policies, contained in the Notes to Consolidated Financial Statements included in Part 1, Item 1 of this Quarterly Report on Form 10-Q. We recognize revenue when persuasive evidence of an arrangement exists, delivery or customer acceptance (if required) has occurred or services have been rendered, the price is fixed or determinable and collectability is reasonably assured.
Inventory Reserves
We are exposed to a number of economic and industry factors that could result in portions of our inventory becoming either obsolete or in excess of anticipated customer demand. These factors include changes in our customers’ capital expenditures, technological changes in our markets, our ability to meet changing customer requirements, competitive pressures in products and prices, and the availability of key components from our suppliers. Our policy is to establish inventory reserves when conditions exist that suggest our inventory may be in excess of anticipated demand or is obsolete based upon our assumptions about future demand for our products or market conditions. We regularly evaluate the ability to realize the value of our inventory based on a combination of factors including the following: historical usage rates, forecasted sales or usage, estimated product end of life dates, estimated current and future market values, and new product introductions. Purchasing and alternative usage options are also explored to mitigate inventory exposure. When recorded, our reserves are intended to reduce the carrying value of our inventory to its net realizable value. These reserves are not reversed until the related inventory is sold or otherwise disposed. Our inventory reserves policy is described in Note 2, Summary of Significant Accounting Policies, contained in the Notes to the Consolidated Financial Statements included in Part 1, Item 1 of this Quarterly Report on Form 10-Q.
Income Taxes
In accordance with Topic 740,Income Taxes to the FASB ASC (“Topic 740”), we recognize deferred income taxes based on the expected future tax consequences of differences between the financial statement basis and the tax basis of assets and liabilities calculated using enacted tax rates for the year in which the differences are expected to be reflected in the tax return. Valuation allowances are established when necessary to reduce deferred taxes to the amount expected to be realized.
We have deferred tax assets resulting from tax credit carryforwards, net operating losses and other deductible temporary differences, which will reduce taxable income in future periods. Topic 740 requires that a valuation allowance be established when it is “more likely than not” that all or a portion of deferred tax assets will not be realized. A review of all available positive and negative evidence needs to be considered, including a company’s performance, the market environment in which it operates, the length of carryback and carryforward periods, existing sales backlog and future sales projections. Where there are cumulative losses in recent years, Topic 740 creates a strong presumption that a valuation allowance is needed. This presumption can be overcome in very limited circumstances. As a result of our cumulative loss position in recent years and the increased uncertainty relative to the timing of profitability in future periods, we continue to maintain a valuation allowance for our entire U.S. net deferred tax assets, and full valuation allowance against the net deferred tax assets of foreign jurisdictions without a history of profitability. The valuation allowance for deferred tax assets increased from $200.1 million at July 31, 2012, to $204.5 million at July 31, 2013. The increase in our valuation allowance compared to the prior year was primarily due to an increase in deferred tax assets associated with the current year taxable loss generated in various jurisdictions.
26
We expect to record a full valuation allowance on future U.S. tax benefits and in foreign tax jurisdictions without a history of sustained profitability. We will continue to monitor the recoverability of our deferred tax assets on a periodic basis. As a result of the merger with Credence in 2008 and Internal Revenue Service Code Section 382 guidance, the future utilization of our net operating loss deductions will be significantly limited. The acquisition of the atg L&M, ECT and Multitest businesses from Dover did not result in a change in the valuation allowance against our deferred tax assets. A valuation allowance of $77,490 was recorded in purchase accounting against acquired deferred tax assets.
Valuation of Goodwill and Indefinite Lived Assets
We perform our annual goodwill impairment test as required under the provisions of Topic 350-10,Intangibles—Goodwill and Other to the FASB ASC (“Topic 350”) on July 31 of each fiscal year unless interim indicators of impairment exist. Goodwill is considered to be impaired when the net book value of a reporting unit exceeds its estimated fair value. Our goodwill represents the excess of acquisition costs over estimated fair value of net assets acquired from StepTech, Inc on June 10, 2003, and from our merger with Credence Systems Corporation (“Credence”) on August 29, 2008. There was no goodwill associated with the acquisition of the ECT and Multitest businesses in the Dover Acquisition on December 1, 2013. As a result of the Dover Acquisition, we are still evaluating the impact on the structure of the reporting units of the combined company. During the nine months ended April 30, 2014, we did not identify any triggering events that would result in an interim test of goodwill.
Valuation of Identifiable Intangible Assets
Our identifiable intangible assets include developed technology, distributor and key customer relationships, and trademarks.
We primarily use the income approach to value the existing technology and other intangible assets as of the date of acquisition. This approach calculates fair value by estimating future cash flows attributable to each intangible asset and discounting them to present value at a risk-adjusted discount rate.
In estimating the useful life of the acquired intangible assets, we considered paragraph 11 of Topic 350, which lists the pertinent factors to be considered when estimating the useful life of an intangible asset. These factors include a review of the expected use by the combined company of the assets acquired, the expected useful life of another asset (or group of assets) related to the acquired assets, legal, regulatory or other contractual provisions that may limit the useful life of an acquired asset or may enable the extension of the useful life of an acquired asset without substantial cost, the effects of obsolescence, demand, competition and other economic factors, and the level of maintenance expenditures required to obtain the expected future cash flows from the asset. We have amortized these intangible assets over their estimated useful lives using a method that is based on estimated future cash flows as we believe this amortization methodology approximates the pattern in which the economic benefits of the intangible assets will be derived.
Impairment of Long-Lived Assets Other Than Goodwill
On an on-going basis, our management reviews the carrying value and period of amortization or depreciation of long-lived assets. In accordance with Topic 360,Property, Plant and Equipment, to the FASB ASC, we review whether impairment losses exist on long-lived assets when indicators of impairment are present. During this review, we re-evaluate the significant assumptions used in determining the original cost and estimated useful life of long-lived assets. Although the assumptions may vary, they generally include revenue growth, operating results, cash flows and other indicators of value. Management then determines whether there has been a permanent impairment of the value of long-lived assets based upon events or circumstances that have occurred since acquisition. The extent of the impairment amount recognized is based upon the difference of the impaired asset’s estimated fair value and its carrying value. As of April 30, 2014 and July 31, 2013, there were no indicators that required us to conduct a recoverability test as of these dates.
Product Warranty Costs
We provide standard warranty coverage on our systems, providing labor and parts necessary to repair the systems during the warranty period. We account for the estimated warranty cost as a charge to cost of sales when the revenue is recognized. Our product warranty cost policy is described in Note 2, Summary of Significant Accounting Policies, contained in the Notes to Consolidated Financial Statements included in Part 1, Item 1 of this Quarterly Report on Form 10-Q.
27
Trade Accounts Receivable and Allowance for Doubtful Accounts
Trade accounts receivable are recorded at the invoiced amount, do not bear interest, and typically have a contractual maturity of ninety days or less. A majority of our trade receivables are derived from sales to large multinational semiconductor manufacturers throughout the world. The volatility of the industries that we serve can cause certain of our customers to experience shortages of cash, which can impact their ability to make required payments. In order to monitor potential credit losses, we perform ongoing credit evaluations of our customers’ financial condition. An allowance for doubtful accounts is maintained for potential credit losses based upon our assessment of the expected collectability of all accounts receivable. The allowance for doubtful accounts is reviewed periodically to assess the adequacy of the allowances. In any circumstances in which we are aware of a customer’s inability to meet its financial obligations, we provide an allowance, which is based on the age of the receivables, the circumstances surrounding the customer’s financial situation and our historical experience. If circumstances change, and the financial condition of our customers were adversely affected resulting in their inability to meet their financial obligations to us, we may need to record additional allowances. Account balances are charged off against the allowance when it is determined the receivable will not be recovered.
Recent Accounting Pronouncements
Our recent accounting pronouncements are described in Note 11, Recent Accounting Pronouncements, contained in the Notes to the Consolidated Financial Statements included in Part 1, Item 1 of Quarterly Report on Form 10-Q.
Results of Operations
The following table sets forth for the periods indicated the principal items included in the Consolidated Statements of Operations and Comprehensive Income (Loss) in thousands, except for percent changes and per share data:
| | | | | | | | | | | | | | | | | | | | | | | | |
| | | Statement of Operations | |
| | | | |
| | | Three Months Ended April 30, | | | | | | Nine Months Ended April 30, | | | | |
| | | 2014 | | | 2013 | | | %
Change | | | 2014 | | | 2013 | | | %
Change | |
Net product sales | | $ | 97,122 | | | $ | 28,092 | | | | 245.7 | | | $ | 181,466 | | | $ | 88,521 | | | | 105.0 | |
Net service sales | | | 8,302 | | | | 8,165 | | | | 1.7 | | | | 25,081 | | | | 25,940 | | | | (3.3) | |
| | | | | | | | | | | | | | | | | | | | | | | | |
Net sales | | | 105,424 | | | | 36,257 | | | | 190.8 | | | | 206,547 | | | | 114,461 | | | | 80.5 | |
Cost of sales | | | 61,869 | | | | 17,558 | | | | 252.4 | | | | 119,050 | | | | 53,699 | | | | 121.7 | |
| | | | | | | | | | | | | | | | | | | | | | | | |
Gross profit | | | 43,555 | | | | 18,699 | | | | 132.9 | | | | 87,497 | | | | 60,762 | | | | 44.0 | |
| | | | | | |
Engineering and product development expenses | | | 17,579 | | | | 13,407 | | | | 31.1 | | | | 46,258 | | | | 39,003 | | | | 18.6 | |
Selling, general and administrative expenses | | | 23,295 | | | | 9,213 | | | | 152.8 | | | | 52,133 | | | | 28,401 | | | | 83.6 | |
Amortization of purchased intangible assets | | | 540 | | | | 395 | | | | 36.7 | | | | 1,157 | | | | 1,187 | | | | (2.5) | |
Restructuring | | | 1,422 | | | | 356 | | | | 299.4 | | | | 3,581 | | | | 655 | | | | 446.7 | |
| | | | | | | | | | | | | | | | | | | | | | | | |
Income (loss) from operations | | | 719 | | | | (4,672) | | | | (115.4) | | | | (15,632) | | | | (8,484) | | | | 84.3 | |
| | | | | | |
Other income (expense): | | | | | | | | | | | | | | | | | | | | | | | | |
Interest expense | | | (800) | | | | (60) | | | | 123.3 | | | | (1,361) | | | | (167) | | | | 715.0 | |
Interest income | | | 78 | | | | 200 | | | | (61.0) | | | | 221 | | | | 685 | | | | (67.7) | |
Bargain purchase gain | | | — | | | | ��� | | | | | | | | 4,644 | | | | — | | | | 100.0 | |
Other (expense) income, net | | | (46) | | | | (177) | | | | 74.0 | | | | 477 | | | | (65) | | | | (833.8 | ) |
| | | | | | | | | | | | | | | | | | | | | | | | |
Loss before (provision for) benefit from income taxes | | | (49) | | | | (4,709) | | | | (98.9) | | | | (11,651) | | | | (8,031) | | | | 45.1 | |
(Provision for) benefit from income taxes | | | (151) | | | | (35) | | | | 331.4 | | | | (1,030) | | | | 560 | | | | (283.9) | |
| | | | | | | | | | | | | | | | | | | | | | | | |
Net loss | | $ | (200) | | | $ | (4,744) | | | | (95.8) | | | $ | (12,681) | | | $ | (7,471) | | | | 69.7 | |
| | | | | | | | | | | | | | | | | | | | | | | | |
Net loss per share: | | | | | | | | | | | | | | | | | | | | | | | | |
Basic and diluted | | $ | (0.00) | | | $ | (0.10) | | | | | | | $ | (0.26) | | | $ | (0.16) | | | | | |
28
The following table sets forth for the periods indicated the principal items included in the Consolidated Statements of Operations and Comprehensive Income (Loss) expressed in each case as a percentage of net sales:
| | | | | | | | | | | | | | | | |
| | | Percentage of Net Sales | |
| | | Three Months
Ended
April 30, | | | Nine Months
Ended
April 30, | |
| | | 2014 | | | 2013 | | | 2014 | | | 2013 | |
Net sales | | | 100.0% | | | | 100.0% | | | | 100.0% | | | | 100.0% | |
Cost of sales | | | 58.7 | | | | 48.4 | | | | 57.6 | | | | 46.9 | |
| | | | | | | | | | | | | | | | |
Gross profit | | | 41.3 | | | | 51.6 | | | | 42.4 | | | | 53.1 | |
| | | | |
Engineering and product development expenses | | | 16.7 | | | | 37.0 | | | | 22.4 | | | | 34.1 | |
Selling, general and administrative expenses | | | 22.1 | | | | 25.4 | | | | 25.2 | | | | 24.8 | |
Amortization of purchased intangible assets | | | 0.5 | | | | 1.1 | | | | 0.6 | | | | 1.0 | |
Restructuring | | | 1.3 | | | | 1.0 | | | | 1.7 | | | | 0.6 | |
| | | | | | | | | | | | | | | | |
Income (loss) from operations | | | 0.7 | | | | (12.9) | | | | (7.5) | | | | (7.4) | |
| | | | |
Other income (expense): | | | | | | | | | | | | | | | | |
Interest expense | | | (0.8) | | | | (0.0) | | | | (0.7) | | | | (0.1) | |
Interest income | | | 0.0 | | | | 0.6 | | | | 0.1 | | | | 0.6 | |
Bargain purchase gain | | | — | | | | — | | | | 2.2 | | | | — | |
Other (expense) income, net | | | (0.0) | | | | (0.5) | | | | 0.2 | | | | (0.0) | |
| | | | | | | | | | | | | | | | |
Loss before (provision for) benefit from income taxes | | | (0.0) | | | | (13.0) | | | | (5.6) | | | | (7.0) | |
(Provision for) benefit from income taxes | | | (0.1) | | | | (0.1) | | | | (0.5) | | | | 0.5 | |
| | | | | | | | | | | | | | | | |
Net loss | | | (0.2)% | | | | (13.1)% | | | | (6.1)% | | | | (6.5)% | |
| | | | | | | | | | | | | | | | |
Three and Nine Months Ended April 30, 2014 Compared to the Three and Nine Months Ended April 30, 2013
Net sales. The increase in net sales for the three months ended April 30, 2014 compared to the prior year period was due principally to the completion of the Dover Acquisition in December 2013. During the three months ended April 30, 2014, $45.1 million of net sales were generated by the former LTX-Credence business and $60.3 million of net sales resulted from the operations of the atg newly acquired businesses, for total net sales of $105.4 million. Excluding net sales from the newly acquired businesses, our net sales revenue of $45.1 million for the three months ended April 30, 2014 increased 24% as compared to net sales of $36.3 million for the three months ended April 30, 2013, driven by increased net sales in all product lines due to higher customer demand for our test equipment resulting from higher demand in our customers’ end markets.
During the nine months ended April 30, 2014, $106.3 million of net sales were generated by the former LTX-Credence business and $100.2 million of net sales resulted from the operations of the newly acquired businesses, for total net sales of $206.5 million. Excluding net sales from the newly acquired businesses, our net sales of $106.3 million for the nine months ended April 30, 2014 decreased 7% as compared to net sales of $114.5 million for the nine months ended April 30, 2013. This decrease was driven by lower customer demand for our test equipment resulting from lower demand in our customers’ end markets.
Gross profit. The increase in gross profit for the three months ended April 30, 2014 compared to the prior year period was due principally to the completion of the Dover Acquisition in December 2013. During the three months ended April 30, 2014, gross profit for the former LTX-Credence business was $25.2 million and $18.4 million resulted from the operations of the newly acquired businesses, for a total gross profit of $43.6 million. Excluding the gross profit of the newly acquired businesses, our gross profit of $25.2 million for the three months ended April 30, 2014 increased 35% as compared to gross profit of $18.7 million for the three months ended April 30, 2013. This increase was driven by higher net sales from the former LTX-Credence business of $45.1 million for the three months ended April 30, 2014 as compared to net sales of $36.3 million for the three months ended April 30, 2013. The higher net sales of the former LTX-Credence business year over year led to higher absorption of fixed costs of sales.
The total increase in gross profit for the nine months ended April 30, 2014 as compared to the nine months ended April 30, 2013 was driven primarily by gross profit from the newly acquired businesses of $31.2 million. During the nine months ended April 30, 2014, gross profit for the former LTX-Credence business was $56.3 million and $31.2 million resulted from the operations of the newly acquired businesses, for a total gross profit of $87.5 million. Excluding the gross profit of the newly acquired businesses, our gross profit of $56.3 million for the nine months ended April 30, 2014 decreased 7% as compared to gross profit of $60.8 million for the nine months ended April 30, 2013. This decrease in the LTX-Credence gross profit was driven by lower net sales from the former LTX-Credence business of $106.3 million for the nine months ended April 30, 2014 as compared to net sales of $114.5 million for the nine months ended April 30, 2013. The lower net sales of the former LTX-Credence business year over year led to lower absorption of fixed cost of sales and consequently lower gross profit.
Engineering and product development expenses. The increase in engineering and product development expenses for the periods presented was due primarily to product development expenses incurred by the Acquired Businesses from December 1, 2013 to April 30, 2014. Excluding expenses associated with the Acquired Businesses, engineering and product development expenses for LTX-Credence were $12.6 million and $38.0 million for the three and nine months ended April 30, 2014, respectively, compared to the prior year periods. This decrease was due to lower personnel related expenses in the comparable periods resulting from headcount reductions completed at the end of January 2014.
Selling, general and administrative expenses.The increase in selling, general and administrative expenses for the three months ended April 30, 2014 compared to the prior year period was due principally to the completion of the Dover Acquisition in December 2013. During the three months ended April 30, 2014, the former LTX-Credence business had selling, general and administrative expenses of $10.2 million and the newly acquired businesses had selling, general and administrative expenses of $13.1 million, for total selling, general and administrative expenses of $23.3 million. During the nine months ended April 30, 2014, the former LTX-Credence business had selling, general and administrative expenses of $30.9 million and the newly acquired businesses had selling, general and administrative expenses of $21.2 million, for total selling, general and administrative expenses of $52.1 million. Excluding the selling, general and administrative expenses of the newly acquired businesses, our selling, general and administrative expenses of $10.2 million and $30.9 million for the three and nine months ended April 30, 2014 increased 11% and 9% as compared to selling, general and administrative expense of $9.2 million and $28.4 million for the three and nine months ended April 30, 2013. This increase in LTX-Credence selling, general and administrative expenses was due to Dover Acquisition-related professional fees of $0.4 million and $2.5 million, respectively, recognized in the three and nine months ended April 30, 2014, as well as higher variable commissions on higher revenue, higher insurance premiums and other corporate-related expenses associated with the Acquired Businesses.
29
Amortization of purchased intangible assets. The increase in amortization for the periods shown is a result of the addition of intangible assets from the Dover Acquisition, which will be amortized over their expected useful lives.
Restructuring. The restructuring expense recorded in the three months ended April 30, 2014 included $1.0 million of estimated severance and post-employment obligations related to headcount reductions during the period that were part of the plan announced January 31, 2014. For the nine months ended April 30, 2014, the total expense associated with these headcount reductions was $3.2 million, and we expect to incur an additional $0.6 million of severance and post-employment benefits for employees with delayed departure dates through October 31, 2014. The remainder of the expense for the three months ended April 30, 2014, or $0.4 million, was associated with costs to vacate our Beaverton, Oregon facility as well as remaining lease obligations on the vacated facility.
Interest expense. The increase in interest expense for the periods presented was driven by interest incurred on the bank term loan and the seller financing promissory notes, which closed in the three months ended January 31, 2014, proceeds of which were used to fund the Dover Acquisition.
Interest income. Interest income decreased in the periods presented due to a decrease in marketable securities held within our portfolio. We used approximately $35.0 million of marketable securities to fund a portion of the purchase price for the Dover Acquisition.
Bargain purchase gain. During the nine months ended April 30, 2014, we recorded a bargain purchase gain of $4.6 million associated with the Dover Acquisition, which represents the excess of the fair value of the net assets acquired as compared to the acquisition price.
Other (expense) income, net. Other (expense) income, net primarily includes the impact of changes in foreign exchange gains and losses.
(Provision for) benefit from income taxes. We recorded an income tax provision of $0.2 million in the three months ended April 30, 2014 which was primarily due to foreign tax on earnings generated in foreign jurisdictions and the release of reserves due to statute of limitation expirations.
As of April 30, 2014 and July 31, 2013 our liability for unrecognized income tax benefits was $6.6 million and $6.8 million, respectively (of which $3.0 million and $3.2 million, if recognized, would impact our income tax rate).
We expect to maintain a full valuation allowance on United States deferred tax assets until we can sustain an appropriate level of profitability to ensure utilization of existing assets. Until such time, we would not expect to recognize any significant tax benefits in our results of operations.
Liquidity and Capital Resources
The following is a summary of significant items impacting our liquidity and capital resources for the nine months ended April 30, 2014 (in millions):
| | | | |
Cash, cash equivalents and marketable securities at July 31, 2013 | | $ | 124.4 | |
Proceeds from bank term loan, net of fees | | | 48.7 | |
Cash paid for Acquired Businesses, net of cash acquired | | | (66.9) | |
Capital expenditures | | | (2.9) | |
Payments of acquisition related expenses | | | (3.4) | |
Principal payments of bank term loan | | | (1.3) | |
Other cash used, net | | | (1.9) | |
| | | | |
Cash and cash equivalents and marketable securities at April 30, 2014 | | $ | 96.7 | |
| | | | |
As of April 30, 2014, we had net working capital of $175.5 million, as compared to net working capital of $147.4 million at July 31, 2013. Capital expenditures totaled approximately $2.9 million and $2.2 million for the nine months ended April 30, 2014 and 2013, respectively. Capital expenditures for the nine months ended April 30, 2014 and April 30, 2013, were composed primarily of capital related to certain engineering projects and spare parts to support our installed base of equipment.
We had $4.4 million in net cash used in operating activities for the nine months ended April 30, 2014, as compared to net cash provided by operating activities of $2.9 million for the same period of the prior year. The net cash used in operating activities for the
30
nine months ended April 30, 2014 was primarily related to our net loss of $12.7 million adjusted for non-cash items including depreciation and amortization and stock based compensation of approximately $11.0 million. The net cash used in operating activities was also related to an increase in working capital of $2.7 million. The net cash provided by operating activities for the nine months ended April 30, 2013 was primarily related to our net loss of $7.5 million, adjusted for non-cash items including depreciation and amortization and stock based compensation, of approximately $9.9 million, and a decrease in working capital of $0.5 million.
We had $16.0 million in net cash used in investing activities for the nine months ended April 30, 2014 as compared to net cash provided by investing activities of $5.8 million for the nine months ended April 30, 2013. The net cash used in investing activities for the nine months ended April 30, 2014 was primarily related to $66.9 million of cash paid for the Acquired businesses, net of cash received from the Dover Acquisition, $50.0 million of purchases of available-for-sale securities, and $2.9 million of purchases of property and equipment. This cash use was offset by $103.9 million from sales and maturities of marketable securities. The net cash provided by investing activities for the nine months ended April 30, 2013 was primarily related to $53.4 million of proceeds from sales and maturities of available-for-sale securities and $4.9 million in proceeds from sales of held-to-maturity securities, offset in part by $45.5 million of purchases of available-for-sale securities, $4.8 million in purchases of held-to-maturity securities, and $2.2 million of purchases of property and equipment.
We had $47.1 million in net cash provided by financing activities for the nine months ended April 30, 2014 as compared to net cash used in financing activities of $9.8 million for the nine months ended April 30, 2013. The net cash provided by financing activities for the nine months ended April 30, 2014 was related to $48.7 million of net proceeds from a bank term loan, offset in part by principal payments of the bank term loan of $1.3 million, as well as payments of tax withholdings for vested restricted stock units, net of proceeds from stock option exercises. The net cash used in financing activities for the nine months ended April 30, 2013 was primarily related to repurchases of common stock of $9.2 million as well as payments of tax withholdings for vested restricted stock units.
Credit Agreement
On November 27, 2013, in anticipation of the completion of the Dover Acquisition and to fund the purchase price therefore, we entered into the Credit Agreement with ECT, SVB, as lender, administrative agent and issuing lender, and the Lenders from time to time party thereto. The Credit Agreement provides for a senior secured credit facility in the aggregate principal amount of up to $55.0 million (the Facility).
The Facility consists of a term loan facility for $50.0 million that was advanced to us on November 27, 2013 (the Term Loan) and a revolving credit facility (including a letter of credit facility) for up to $5.0 million (the Revolving Loan and, together with the Term Loan, the Loans) that is available from time to time for five years after November 27, 2013 (the Closing Date). Under the terms of the Credit Agreement, not more than one time during the period commencing on the Closing Date until the close of business on the date that is one day prior to the 42-month anniversary of the Closing Date, the Facility may be increased by an aggregate amount not to exceed $20.0 million through an additional facility on apari passu basis with the Term Loan, subject to specified conditions and the agreement of one or more Lenders to participate therein. At April 30, 2014, approximately $1.2 million was outstanding in the form of standby letters of credit. The standby letters of credit have various expiration dates, of which the last to expire is November 2014.
All obligations under the Facility are secured by a first priority security interest in substantially all of the Borrowers’ existing and future assets, including a pledge of the stock or other equity interests of the Borrowers’ domestic subsidiaries and of any first tier foreign subsidiaries, provided that not more than 66% of the voting stock of any such foreign subsidiaries shall be required to be pledged.
The Credit Agreement requires that the Term Loan be repaid in quarterly installments, with 5% of the principal due the first year, 7.5% of principal due the second year, 10% of principal due the third year, 12.5% of principal due the fourth year, 15% of principal due the fifth year, and a final payment of $25.0 million due on the fifth anniversary of the Closing Date (the Maturity Date). All outstanding Loans under the Facility mature on the Maturity Date unless earlier payment is required under the terms of the Credit Agreement. The Term Loan is subject to optional and mandatory prepayment in whole and part as described in the Credit Agreement subject to certain criteria. Loans outstanding under the Facilities may, at the Borrowers’ option, be prepaid at any time in whole or in part without premium or penalty, other than customary breakage costs, if any, subject to the terms and conditions of the Credit Agreement.
Borrowings under the Facility bear interest, at a base rate plus a margin of up to 2.50% per annum, or at LIBOR plus a margin of up to 3.50% per annum, in either case based on our ratio of consolidated senior debt to consolidated earnings before interest, taxes, depreciation and amortization (EBITDA) (the Leverage Ratio. The interest rate otherwise payable under the Facility will be subject to increase by 2.0% per annum during the continuance of a payment default and may be subject to increase by 2.0% per annum during the continuance of any other event of default under the Credit Agreement. Certain customary fees and expenses are also payable in connection with the Facility.
31
The proceeds of the Term Loan were primarily used to fund the purchase price with respect to the Dover Acquisition.
The Credit Agreement contains customary affirmative and negative covenants, subject in certain cases to baskets and exceptions, including negative covenants with respect to indebtedness, liens, fundamental changes, dispositions, restricted payments, investments, ERISA matters, matters relating to subordinated debt, affiliate transactions, sale and leaseback transactions, swap agreements, accounting changes, negative pledge clauses, clauses restricting subsidiary distributions, lines of business, amendments to certain documents and use of proceeds. The Credit Agreement also contains customary reporting and other affirmative covenants. The Credit Agreement contains a consolidated fixed charge coverage ratio, consolidated leverage ratio and liquidity requirements including the covenant that we maintain approximately $50 million in domestic cash and cash equivalents to meet the minimum level of liquidity covenant. The Credit Agreement required that we maintain a consolidated leverage ratio of less than 3.00 to 1.00 as of the end of four consecutive fiscal quarters ending January 31, 2014. At January 31, 2014, our consolidated leverage ratio exceeded this ratio threshold, resulting in an event of default under the Credit Agreement. On April 15, 2014, we executed a First Amendment to Credit Agreement and Waiver (Credit Agreement Amendment and Waiver) pursuant to which the parties thereto agreed, among other things, to waive the occurrence of the event of default resulting from our failure to meet the above described financial covenant in the Credit Agreement provided, that our consolidated leverage ratio for the four fiscal quarters ending on January 31, 2014 did not exceed 3.66 to 1.00. Pursuant to the Credit Agreement Amendment and Waiver, the parties also agreed to modify the definition of “consolidated net income” to include, in the calculation of consolidated net income for periods following the closing of the Dover Acquisition, net income (or loss) attributable to the Acquired Businesses for specified periods prior to the closing of the Dover Acquisition. As of April 30, 2014 we were in compliance with all covenants under the Credit Agreement and Credit Agreement Amendment and Waiver including the consolidated leverage ratio.
Our obligations under the Facility may be accelerated upon the occurrence of an event of default under the Credit Agreement, which includes customary events of default, including payment defaults, the inaccuracy of representations or warranties, the failure to comply with covenants, ERISA defaults, judgment defaults, bankruptcy and insolvency defaults and cross defaults to material indebtedness.
Pursuant to the Purchase Agreement, in connection with the closing of the Dover Acquisition, we paid the Sellers an aggregate purchase price of $93.5 million, of which $73.5 million was paid in cash through a combination of existing cash-on-hand and bank debt and $20.0 million was paid by the issuance of promissory notes by us to the certain Sellers in the original principal amount of $20.0 million. Pursuant to the Purchase Agreement, the cash purchase price was increased by $11.5 million, an amount equal to specified cash balances held by the Acquired Businesses as of the Closing and decreased by an amount equal to any acquired indebtedness and the amount of certain transaction costs and employee related liabilities of the Acquired Businesses as of the Closing. The cash purchase price was also increased by $3.2 million for a working capital adjustment as specified in the Purchase Agreement. After giving effect to the Post-Closing purchase price adjustments described above, and including the reduction in the promissory note, the aggregate purchase price paid to the Sellers as of the date of this report is $106.0 million.
Subject to certain conditions, the original principal amount of the promissory notes are also subject to reduction upon written certification from us to Dover prior to January 1, 2015 of certain specified events related our relocation from or refurbishment of certain properties of the Acquired Businesses, or the prepayment of the promissory note in full prior to such date. In January 2014, we executed leases for two new facilities, and in February 2014, we provided Dover with written certification of our planned relocation from certain properties of the Acquired Businesses. Consequently, the original principal amount of the promissory note issued to Dover was reduced by $2.0 million. The promissory notes may be reduced further by $1.75 million subject to certification from us to Dover of other specified events that have not yet occurred. The promissory notes accrue interest on the unpaid balance for each day that they remain outstanding after December 1, 2014 at a per annum rate equal to the LIBOR plus 10%, and may be prepaid by us at any time without penalty prior to May 1, 2019. The promissory notes are subject to payments of $1.3 million due on December 1 and June 1 of each year, until the notes are paid in full.
On or prior to December 1, 2013, we and Dover, or their affiliates, respectively, also entered into a transition services agreement, an intellectual property termination agreement and a license agreement which govern certain ongoing relationships between us and Dover and their respective affiliates following the closing. Pursuant to the Purchase Agreement, we have also agreed to assume certain liabilities related to the Acquired Businesses.
We expect the debt obligations resulting from the Acquisition in accordance with the Purchase Agreement and Credit Agreement to have a material impact on our liquidity and capital resources in the near future. We are currently evaluating the impact to our liquidity of post-Acquisition synergy activities.
Commitments and Contingencies
As of April 30, 2014, our major outstanding contractual obligations are related to our rental properties, other operating leases, Bank Term Loan principal and interest, inventory purchase commitments, and severance obligations.
In the ordinary course of business, we agree from time to time to indemnify certain customers against certain third party claims for property damage, bodily injury, personal injury or intellectual property infringement arising from the operation or use of our products. Also, from time to time in agreements with suppliers, licensors and other business partners, we agree to indemnify these partners against certain liabilities arising out of the sale or use of our products. The maximum potential amount of future payments we could be required to make under these indemnification obligations is theoretically unlimited; however, we have general and umbrella insurance policies that enable it to recover a portion of any amounts paid and many of its agreements contain a limit on the maximum amount, as well as limits on the types of damages recoverable. Based on our experience with such indemnification claims, we believe the estimated fair value of these obligations is minimal. Accordingly, we have no liabilities recorded for these agreements as of April 30, 2014 or July 31, 2013.
32
We are a defendant in a litigation matter incidental to the business that is related to customer expectations of test system performance for product that was shipped in 2006 by Credence. We do not believe the plaintiff’s claims have merit and we are vigorously defending our position. An estimate of any potential loss cannot be made; we do not believe a loss is probable, and accordingly we have not accrued any amounts related to this matter.
Subject to certain limitations, we indemnify our current and former officers and directors for liability or costs they may incur upon certain events or occurrences encountered in the course of performing their duties to us. Although the maximum potential amount of future payments we could be required to make under these agreements is theoretically unlimited, as there were no known or pending claims, we have not accrued a liability for these agreements as of April 30, 2014 or July 31, 2013.
The aggregate outstanding amount of our contractual obligations was $134.1 million as of April 30, 2014. These obligations and commitments represent maximum payments based on current operating forecasts. Certain of the commitments could be reduced if changes to our operating forecasts occur in the future.
The following summarizes our contractual obligations as of April 30, 2014 and the effect such obligations are expected to have on our liquidity and cash flow in future periods:
| | | | | | | | | | | | | | | | | | | | |
| | | Total | | | 2014 | | | 2015-2016 | | | 2017-2018 | | | Thereafter | |
| | | (in thousands) | |
Contractual Obligations: | | | | | | | | | | | | | | | | | | | | |
Operating leases | | $ | 25,156 | | | $ | 2,277 | | | $ | 12,195 | | | $ | 5,595 | | | $ | 5,089 | |
Inventory commitments | | | 30,276 | | | | 21,574 | | | | 8,678 | | | | 24 | | | | — | |
Severance | | | 1,101 | | | | 792 | | | | 309 | | | | — | | | | — | |
Bank Term Loan- principal and interest | | | 53,707 | | | | 966 | | | | 10,625 | | | | 15,053 | | | | 27,063 | |
Promissory Notes- principal and interest | | | 23,825 | | | | — | | | | 6,324 | | | | 7,557 | | | | 9,944 | |
| | | | | | | | | | | | | | | | | | | | |
Total Contractual Obligations | | $ | 134,065 | | | $ | 25,609 | | | $ | 38,131 | | | $ | 28,229 | | | $ | 42,096 | |
| | | | | | | | | | | | | | | | | | | | |
The promissory notes accrue interest on the unpaid balance for each day that they remain outstanding after December 1, 2014 at a per annum rate equal to the London Interbank Offered Rate plus 10%, and may be prepaid by us at any time without penalty prior to May 1, 2019.
Facility Purchases and Build-outs
In June 2014, we expect to enter into a purchase and sale agreement for land and a building in Rosenheim, Germany, which is the site of our facility in that location. The total purchase price is 3.3 million EUR, and we expect to fund the cost through debt and cash on hand. We expect to borrow 2.9 million EUR in the form of a 10-year bank loan, with an annual interest rate of 2.35%. We expect to fund the remaining $0.4 million through operating cash. We expect this transaction to be completed during our fourth fiscal quarter ending July 31, 2014.
Starting in Q4 14, we expect to pay approximately 1 million EUR for renovation costs for the Rosenheim facility. We expect to pay for these costs using operating cash. We expect to capitalize these renovation costs as leasehold improvements in our Consolidated Balance Sheet.
Also in Q4 14, we expect to pay approximately $1 million for renovation costs associated with one of our California facilities. We will be moving from our current location in Pomona, California to a new facility in Fontana, California during August, 2014, and in anticipation of that move we will be incurring build-out costs that we expect to capitalize as leasehold improvements in our Consolidated Balance Sheet.
Off-Balance Sheet Arrangements
As of April 30, 2014 we did not have any off-balance sheet arrangements.
| Item 3. | Quantitative and Qualitative Disclosures about Market Risk |
There has been no material change in our quantitative and qualitative disclosures about market risk exposure since the filing of our Annual Report on Form 10-K for the fiscal year ended July 31, 2013.
| Item 4. | Controls and Procedures |
Evaluation of Disclosure Controls and Procedures. Our management, with the participation of our Chief Executive Officer and Chief Financial Officer, evaluated the effectiveness of our disclosure controls and procedures as of April 30, 2014. The term “disclosure controls and procedures,” as defined in Rules 13a-15(e) and 15d-15(e)) under the Securities Exchange Act of 1934, as amended (the “Exchange Act”), means controls and other procedures of a company that are designed to ensure that information required to be disclosed by a company in the reports that it files or submits under the Exchange Act is recorded, processed, summarized and reported, within the time period specified in the SEC’s rules and forms. Disclosure controls and procedures include, without limitation, controls and procedures designed to ensure that information required to be disclosed by a company in the reports that it files or submits under the Exchange Act is accumulated and communicated to our management, including its principal executive and principal financial officers, as appropriate to allow timely decisions regarding required disclosure. Management recognizes that any controls and procedures, no matter how well designed and operated, can provide only reasonable assurance of achieving their objectives and management necessarily applies its judgment in evaluating the cost-benefit relationship of possible controls and
33
procedures. Based on the evaluation of our disclosure controls and procedures as of April 30, 2014, our Chief Executive Officer and Chief Financial Officer concluded that, as of such date, our disclosure controls and procedures were effective at the reasonable assurance levels.
Changes in Internal Controls. There was no change in our internal control over financial reporting (as defined in Rules 13a-15(f) and 15d-15(f)) under the Exchange Act) during the three months ended April 30, 2014 that has materially affected, or is reasonably likely to materially affect our internal control over financial reporting.
34
Limitations on the Effectiveness of Controls
Our management, including our Chief Executive Officer and Chief Financial Officer, does not expect that our disclosure controls and procedures or our internal controls over financial reporting can prevent all error and all fraud. A control system, no matter how well conceived and operated, can provide only reasonable, not absolute, assurance that the objectives of the control system are met. Further, the design of a control system must reflect the fact that there are resource constraints, and the benefits of controls must be considered relative to their costs. The inherent limitations in all control systems include the realities that judgments in decision-making can be faulty and that breakdowns can occur because of simple error or mistake. Additionally, controls can be circumvented by the individual acts of some persons or by collusion of two or more people. Because of the inherent limitations in a cost-effective control system, misstatements due to error or fraud may occur and not be detected.
PART II—OTHER INFORMATION
From time to time we are party to legal proceedings in the course of our business. We do not, however, expect any such pending legal proceedings to have a material adverse effect on our business, financial condition or results of operations.
This Quarterly Report includes or incorporates forward-looking statements that involve substantial risks and uncertainties and fall within the meaning of Section 27A of the Securities Act of 1933 and Section 21E of the Exchange Act. You can identify these forward-looking statements by our use of the words “believes,” “anticipates,” “plans,” “expects,” “may,” “will,” “would,” “should,” “intends,” “estimates,” “seeks” or similar expressions, whether in the negative or affirmative. We cannot guarantee that we actually will achieve these plans, intentions or expectations. Actual results or events could differ materially from the plans, intentions and expectations disclosed in the forward-looking statements we make. We have included below important factors that we believe could cause our actual results to differ materially from the forward-looking statements that we make. If any of these risks were to occur, our business, financial condition, results of operations or prospects, could be materially and adversely affected. These risks and uncertainties may be interrelated or co-related, and as a result, the occurrence of one risk might directly affect other risks described below, make them more likely to occur or magnify their impact. Moreover, the risks and uncertainties described below are not the only ones we face. Additional risks and uncertainties not presently known to us or that we currently deem immaterial may also affect our business. We do not assume any obligation to update any forward-looking statement we make.
The risk factors set forth below with an asterisk (*) next to the title are new risk factors or risk factors containing changes from the risk factors previously disclosed in our Annual Report.
*Our mergers and acquisitions may be costly, difficult to integrate, disrupt our business, dilute stockholder value, and divert management attention, which may limit our ability to realize the anticipated benefits of such transactions.
On December 1, 2013, we completed our acquisition of the Acquired Assets from Dover and its specified affiliates pursuant to the Purchase Agreement.
The Dover Acquisition is substantial in size, scope, and complexity, and entails many changes, including the integration of the Acquired Businesses, Dover personnel and Dover systems with our operations. These transition activities are complex and we have incurred and will continue to incur significant costs related to the Dover Acquisition. The commercial and financial success of the Dover Acquisition is subject to many risks including those set forth below:
| | • | | We might not be successful in integrating employees, products and technology with our existing business, and such integration may divert significant management attention from our existing business; |
| | • | | We may realize greater expenses than we anticipated from the Dover Acquisition; |
| | • | | We may fail to realize synergies that we anticipated from the Dover Acquisition; |
| | • | | We may fail to retain key executives and employees, which could reduce the likelihood of success of the Dover Acquisition; |
| | • | | We may encounter difficulties in the assimilation of employees and corporate cultures; |
35
| | • | | The combination of the companies may not deliver to our customers the benefits that we have anticipated, which may result in customers reducing their aggregate spending with the Acquired Businesses and/or with our existing businesses; |
| | • | | We may have difficulty in developing, manufacturing and marketing the products of the Acquired Businesses in a manner that enhances the performance of our combined businesses or product lines and allows us to realize value from expected synergies; |
| | • | | We may have assumed unforeseen legal, regulatory, intellectual property or other liabilities; and |
| | • | | We will have less cash available for other purposes, including acquisitions of technologies or businesses. |
If any of these or other factors impair our ability to integrate our operations successfully or on a timely basis, we may not be able to realize the anticipated synergies, business opportunities, revenue, net income, and growth prospects from combining the businesses. In addition, we may be required to spend additional time or money on integration that otherwise would be spent on the development and expansion of our business.
In addition, the market price of our common stock may decline if the integration of the Acquired Businesses is unsuccessful, takes longer than expected or fails to achieve financial benefits to the extent anticipated by financial analysts or investors, or if the effect of the business combination on the financial results of the combined company is otherwise not consistent with the expectations of financial analysts or investors.
We have in the past, and may in the future, seek to acquire or invest in additional businesses, products, technologies or engineers which could put a strain on our resources, result in one-time charges (such as acquisition-related expenses, write-offs or restructuring charges) or in the future, impairment of goodwill, cause ownership dilution to our stockholders and adversely affect our financial results. Additionally, we may fund future acquisitions by utilizing our cash, raising debt, issuing shares of our common stock, or by other means, which could subject us to the risk described below in “We may need financing, which could be difficult to obtain.” We have also incurred and may continue to incur certain liabilities or other expenses in connection with acquisitions, which could materially adversely affect our business, financial condition and results of operations.
Mergers and acquisitions of high-technology companies are inherently risky, and future mergers or acquisitions may not be successful and could materially adversely affect our business, operating results or financial condition. Integrating newly acquired businesses, products or technologies into our company could put a strain on our resources, could be expensive and time consuming, may cause delays in product delivery and might not be successful. Future acquisitions and investments could divert management’s attention from other business concerns and expose our business to unforeseen liabilities (including liabilities related to acquired intellectual property and other assets), unanticipated costs associated with transactions, and risks associated with entering new markets. In addition, we might lose key employees while integrating new organizations. We might not be successful in integrating any acquired businesses, products and product development projects, technologies, personnel, operations, or systems, and might not achieve anticipated revenues and cost benefits. Investments that we make may not result in a return consistent with our projections upon which such investments are made, or may require additional investment that we did not originally anticipate. In addition, future acquisitions could result in customer dissatisfaction, performance problems with an acquired company, potentially dilutive issuances of equity securities or the incurrence of debt, contingent liabilities, possible impairment charges related to goodwill or other intangible assets or other unanticipated events or circumstances, any of which could harm our business, financial condition, results of operations, and could cause the price of our common stock to decline.
* One of our markets is the highly cyclical semiconductor industry, which causes a cyclical impact on our financial results.
We sell capital equipment and peripheral connectivity products to companies that design, manufacture, assemble, and test semiconductor devices. The semiconductor industry is highly cyclical, causing a cyclical impact on our financial results. Although industry order rates increased in portions of fiscal 2011, industry conditions weakened as we entered fiscal 2012 and continued to weaken through fiscal 2013 and into the first half of fiscal 2014. Industry conditions appear to be improving in the second half of fiscal 2014. The ability to forecast the business outlook for our industry is typically limited to three months. Regardless of our outlook and forecasts, any failure to expand in cycle upturns to meet customer demand and delivery requirements or contract in cycle downturns at a pace consistent with the industry could have an adverse effect on our business.
Any significant downturn in the markets for our customers’ semiconductor devices or in general economic conditions would likely result in a reduction in demand for our products and would negatively impact our business. Downturns in the semiconductor equipment and electronics manufacturing industries have been characterized by diminished product demand, excess production capacity, accelerated erosion of selling prices, and excessive inventory levels. We believe the markets for newer generations of semiconductor devices and electronics products will also experience similar characteristics. Our market is also characterized by rapid technological change and changes in customer demand. In the past, we have experienced delays in purchase commitments, delays in collecting accounts receivable and significant declines in demand for our products during these downturns, and we may not be able to maintain or exceed our current level of sales.
36
Additionally, as a capital equipment provider, our revenue is driven by the capital expenditure budgets and spending patterns of our customers who often delay or accelerate purchases in reaction to variations in their businesses. Because a high portion of our costs are fixed, we are limited in our ability to reduce expenses and inventory purchases quickly in response to decreases in orders and revenues. In an economic contraction, we may not be able to reduce our significant fixed costs, such as continued investment in research and development, capital equipment requirements and materials purchased from our suppliers.
The market for capital equipment is highly concentrated, and we have limited opportunities to sell our products.
The semiconductor and electronics manufacturing industries is highly concentrated, and a small number of semiconductor device manufacturers, contract assemblers, and electronics manufacturers account for a substantial portion of the purchases of capital equipment generally, including our equipment. Our top customers in fiscal 2013 were Spirox and Texas Instruments, which accounted for 27% and 12% of our net sales, respectively. In fiscal 2012, our top customers were Spirox and Texas Instruments, which accounted for 22% and 21% of our net sales, respectively. In fiscal 2011, our top customers were Texas Instruments, Spirox, and Atmel, which accounted for 23%, 14%, and 13% of our net sales, respectively. Sales to the top ten customers were 70%, 68%, and 80%, of our net sales in fiscal 2013, 2012, and 2011, respectively. Our customers may cancel orders with few or no penalties. If a major customer reduces orders for any reason, our revenues, operating results, and financial condition may be negatively affected.
Our ability to increase our sales will depend, in part, on our ability to obtain orders from new customers. Semiconductor and electronics manufacturers typically select a particular vendor’s product for testing and handling its new generations of a device and make substantial investments to develop related test program applications and interfaces. Once a manufacturer has selected a test and/or handling system vendor for a new generation device, that manufacturer is more likely to purchase systems from that vendor for that generation of the device, and, possibly, subsequent generations of that device as well. Therefore, the opportunities to obtain orders from new customers may be limited, which may impair our ability to grow our revenue.
* Our substantial debt and financial obligations could adversely affect our financial condition and ability to operate our business, we may not be able to pay our debt and other obligations, and we may incur additional debt.
As of April 30, 2014, our indebtedness was approximately $67.9 million and we may incur substantial additional indebtedness in the future. Our substantial indebtedness could have important consequences, including:
| | • | | making it more difficult for us to satisfy our obligations under our debt agreements, including financial and operational restrictions; |
| | • | | making it difficult for us to obtain any necessary future financing for working capital, capital expenditures, debt service requirements or other purposes; |
| | • | | limiting our future ability to refinance our indebtedness on terms acceptable to us or at all; |
| | • | | requiring us to dedicate of a substantial portion of any cash flow from operations to pay principal and interest on our indebtedness, thereby reducing the amount of cash flow available for other purposes, including capital expenditures; |
| | • | | limiting our flexibility in planning for, or reacting to changes in, our business and the industries in which we compete; |
| | • | | placing us at a possible competitive disadvantage with respect to less leveraged competitors and competitors that have better access to capital resource; and |
| | • | | making us more vulnerable in the event of a downturn in our business. |
Our debt level and the terms of our financing arrangements could adversely affect our financial condition and limit our ability to successfully implement our growth strategy.
We may not be able to meet our debt service obligations, including our obligations under the Credit Agreement with SVB. If we are unable to maintain certain financial covenants, we would be in default under the Facility, which could permit the Lenders to accelerate the maturity of the Facility. Any such default could have material adverse effect on our business, prospects, financial position and operating results, and could force us to refinance all or part of our existing debt, sell our assets, borrow more money or raise equity. There is no guarantee that we would be able to take any of these actions on a timely basis, on terms satisfactory to us, or at all. In addition, we may not be able to repay amounts due in respect of our obligations, if payment of those obligations were to be accelerated following the occurrence of any other event of default as defined in the instruments creating those obligations.
37
*We may need additional financing, which could be difficult to obtain or limit our operational flexibility.
In the event we need to raise additional funds, we may not be able to obtain such financing on favorable terms, if at all. Further, if we issue additional equity or equity-linked securities to obtain financing, stockholders may experience dilution. If we incur substantial additional indebtedness in the future, the risks described above under “Our substantial debt and financial obligations could adversely affect our financial condition and ability to operate our business, we may not be able to pay our debt and other obligations, and we may incur additional debt” would intensify.
*Our sales and operating results have fluctuated significantly from period to period, including from one quarter to another, and they may continue to do so.
Our quarterly and annual operating results are affected by a wide variety of factors that have had and could continue to have material and adverse effects on our financial condition and stock price or lead to significant variability in our operating results or our stock price, including the following:
| | • | | the fact that sales of a limited number of test systems or handlers may account for a substantial portion of our net sales in any particular fiscal quarter; |
| | • | | order cancellations by customers; |
| | • | | lower gross margins in any particular period due to changes in: |
| | • | | the configurations of systems sold; |
| | • | | the customers to whom we sell our systems; or |
| | • | | a long sales cycle due to the significant investment made by our customers in installing our systems and the time required to incorporate our systems into our customers’ design or manufacturing process; and |
| | • | | changes in the timing of product orders due to: |
| | • | | unexpected delays in the introduction of products by our customers; |
| | • | | excess production capacity our customers; |
| | • | | shorter than expected lifecycles of our customers’ products; |
| | • | | uncertain market acceptance of products developed by our customers; or |
| | • | | our own research and development. |
We cannot predict the impact of these and other factors on our sales and operating results in any future period. Results of operations in any period, therefore, should not be considered indicative of the results to be expected for any future period. Because of this difficulty in predicting future performance, our operating results may fall below expectations of securities analysts or investors in some future quarter or quarters. Our failure to meet these expectations would likely adversely affect the market price of our common stock.
A substantial amount of the shipments of our systems for a particular quarter may occur late in the quarter. Our shipment pattern may expose us to significant risks of not meeting our expected financial results for each quarter in the event of problems during the complex process of final test and acceptance prior to revenue recognition. If we were to experience problems of this type late in our quarter, shipments could be delayed and our operating results could fall below expectations.
38
*Our dependence on subcontractors and sole source suppliers may prevent us from delivering an acceptable product on a timely basis.
We rely on one subcontractor to manufacture our test systems and multiple other subcontractors for the manufacture of the components and subassemblies used to produce our test systems. Certain of the suppliers for certain components and subassemblies are sole source suppliers. We have no long term supply agreements with our test system contract manufacturers and purchase products through individual purchase orders. For all of our products, we may be required to qualify new or additional subcontractors and suppliers due to capacity constraints, competitive or quality concerns or other risks that may arise, including as a result of a change in control of, or deterioration in the financial condition of, a supplier or subcontractor. The process of qualifying subcontractors and suppliers is lengthy. Our reliance on subcontractors gives us less control over the manufacturing process and exposes us to significant risks, especially inadequate capacity, late delivery, substandard quality, and high costs. In addition, the manufacture of certain of these components and subassemblies is an extremely complex process. If a supplier became unable to provide parts in the volumes needed, at the required standards of quality or at an acceptable price, we would have to identify and qualify acceptable replacement parts from alternative sources of supply or manufacture such components or subassemblies internally. The failure to qualify acceptable replacement subcontractors or suppliers quickly would delay the manufacturing and delivery of our products, which could cause us to lose revenues and customers.
We also may be unable to engage alternative sources for the production of our products on a timely basis or upon terms favorable to us, if at all. If we are required for any reason to seek a new manufacturer of our products, an alternate manufacturer may not be available and, in any event, transitioning to a new manufacturer would require a significant lead time of nine months or more and would involve substantial expense and disruption of our business. Our systems are highly sophisticated and complex capital equipment, with many custom components, and final assembly requires specific technical know-how and expertise. These factors could make it more difficult for us to find a new manufacturer of our systems if our relationship with our outsource suppliers is terminated for any reason, which would cause us to lose revenues and customers.
We are dependent on certain semiconductor device manufacturers as sole source suppliers of certain sub-assemblies and components used in our systems which are manufactured in accordance with our proprietary design and specifications. We have no written supply agreement with these sole source suppliers and purchase our custom components through individual purchase orders. If one of our sole source suppliers were to fail to produce or provide the parts they agreed to build for us at the specifications, price, or volume required, we would face a significant delay in the final production of our products because we do not have redundant capacity available, and our revenue and results of operations would be materially and adversely affected.
Compliance with current and future environmental regulations may be costly and disruptive to our operations.
We may be subject to environmental and other regulations due to our production and marketing of products in certain states and countries that limit or restrict the amount of hazardous material in certain electronic components such as PCBs. One such regulation is Directive 2002/95/EC of the European Parliament and of the Council of 27 January 2003 that restricts the use of certain hazardous substances in electrical and electronic equipment. “RoHS” is short for restriction of hazardous substances. The RoHS Directive banned the placing on the EU market of new electrical and electronic equipment containing more than agreed levels of lead, cadmium, mercury, hexavalent chromium, polybrominated biphenyl (PBB), and polybrominated diphenyl ether (PBDE), except where exemptions apply, from July 1, 2006. Manufacturers are required to ensure that their products, including their constituent materials and components, do not contain more than the minimum levels of the nine restricted materials in order to be allowed to export goods into the Single Market (i.e. of the European Community’s 28 Member States). Any interruption in supply due to the unavailability of restriction free products could have a significant impact on the manufacturing and delivery of our products. If a supplier became unable to provide parts in the volumes needed or at an acceptable price, we would have to identify and qualify acceptable replacements from alternative sources of supply or manufacture such components internally. As previously discussed, the failure to qualify acceptable replacements quickly would delay the manufacturing and delivery of our products, which could cause us to lose revenues and customers.
New regulations related to conflict minerals may adversely affect us.
The SEC recently adopted disclosure rules for companies that use conflict minerals in their products, with substantial supply chain verification requirements in the event that the materials come from, or could have come from, the Democratic Republic of the Congo or adjoining countries. These new rules and verification requirements, which applied to our activities in calendar 2013 and will apply to our activities going forward, will impose additional costs on us and on our suppliers, and may limit the sources or increase the prices of materials used in our products. Further, if we are unable to certify that our products are conflict free, we may face challenges with our customers, which could place us at a competitive disadvantage, and our reputation may be harmed.
39
*We may not be able to deliver custom hardware options and related applications to satisfy specific customer needs in a timely manner.
The success of our business relies in substantial part on our ability to develop and deliver customized hardware and applications to meet our customers’ specific requirements. Our equipment may fail to meet our customers’ technical or cost requirements and may be replaced by competitive equipment or an alternative technology solution. Our inability to provide a system that meets requested performance criteria when required by a device manufacturer would severely damage our reputation with that customer. This loss of reputation together with the risks discussed above under, “The market for capital equipment is highly concentrated, and we have limited opportunities to sell our products” may make it substantially more difficult for us to sell systems to that manufacturer for a number of years. We have, in the past, experienced delays in introducing some of our products and enhancements.
*Our dependence on international sales and non-U.S. suppliers involves significant risk.
International sales have constituted a significant portion of our revenues in recent years, and we expect that to continue. International sales accounted for 83% of our revenues for fiscal 2013, 77% of our revenues for fiscal 2012, and 85% of our revenues for fiscal 2011. In addition, we rely on non-U.S. suppliers for several components of the equipment we sell. As a result, a major part of our revenues and the ability to manufacture our products are subject to the risks associated with international commerce. These international relationships make us particularly sensitive to economic, political, regulatory and environmental changes in the countries from which we derive sales and obtain supplies. Our sole source final assembly manufacturing supplier for test systems in Malaysia increases our exposure to these types of international risks. International sales and our relationships with suppliers may be hurt by many factors, including:
| | • | | changes in law or policy resulting in burdensome government controls, tariffs, restrictions, embargoes or export license requirements; |
| | • | | political and economic instability in our target international markets; |
| | • | | longer payment cycles common in foreign markets; |
| | • | | difficulties of staffing and managing our international operations; |
| | • | | less favorable foreign intellectual property laws making it harder to protect our technology from appropriation by competitors; |
| | • | | difficulties collecting our accounts receivable; |
| | • | | the impact of the Foreign Corrupt Practices Act of 1977 and similar laws; and |
| | • | | adverse weather and climate events. |
In the past, we have incurred expenses to meet new regulatory requirements in Europe, experienced periodic difficulties in obtaining timely payment from non-U.S. customers, and been affected by economic conditions in several Asian countries. Our foreign sales are typically invoiced and collected in U.S. dollars. A strengthening in the U.S. dollar relative to the currencies of those countries where we do business would increase the prices of our products as stated in those currencies and could hurt our sales in those countries. Significant fluctuations in the exchange rates between the U.S. dollar and foreign currencies could cause us to lower our prices and thus reduce our profitability. These fluctuations could also cause prospective customers to push out or delay orders because of the increased relative cost of our products. In the past, there have been significant fluctuations in the exchange rates between the U.S. dollar and the currencies of countries in which we do business. From time to time we may enter into foreign currency hedging arrangements.
*Our market is highly competitive, and we have limited resources to compete.
The semiconductor equipment and electronics manufacturing industries are highly competitive in all areas of the world. There are other domestic and foreign companies that participate in the markets for each of our products. Our main competitors are Advantest Corporation, Teradyne Inc, Johnstech, MicroCraft, Cohu, SPEA, Shenzhen Mason Electronics Co., Ltd., Bojay, QXQ, Sanmina, IDI, QA Technology, and Ingun. Many of these competitors have substantially greater financial resources and more extensive engineering, manufacturing, marketing, and customer support capabilities than we have.
We expect our competitors to enhance their current products and to introduce new products that may have comparable or better price and performance. The introduction of competing products could hurt sales of our current and future products. In addition, new competitors, including semiconductor and electronics manufacturers themselves, may offer new technologies, which may in turn reduce the value of our products. Increased competition could lead to intensified price-based competition, which would hurt our business and results of operations. Unless we are able to invest significant financial resources in developing products and maintaining customer support centers worldwide, we may not be able to compete effectively.
40
We are exposed to the risks associated with the volatility of the U.S. and global economies.
Slow or negative growth in the domestic or global economies may continue to materially and adversely affect our business, financial condition, and results of operations for the foreseeable future. The strength of the domestic and global economies impact business capital spending and the sale of electronic goods and information technology equipment, which impacts our sales, revenues, and profits. The lack of visibility regarding whether there will be sustained growth in domestic and global economies creates uncertainty regarding the amount of our sales, and underscores the need for caution in predicting growth in the semiconductor test equipment industry in general and in our revenues and profits specifically. Our results of operations would be further adversely affected if we were to experience lower than anticipated order levels, cancellations of orders in backlog, extended customer delivery requirements, or pricing pressure as a result of a slowdown. At lower levels of revenue, there is a higher likelihood that these types of changes in our customers’ requirements would adversely affect our results of operations because in any particular quarter a limited number of transactions accounts for an even greater portion of sales for the quarter.
*Development of our products requires significant lead-time and expenditures, and we may fail to correctly anticipate the technical needs of our customers.
Our systems are used by our customers to develop, test and manufacture their new semiconductor and electronics devices. We therefore must anticipate industry trends and develop products in advance of the commercialization of our customers’ semiconductor and electronics devices, requiring us to make significant capital investments to develop new equipment for our customers well before their devices are introduced. If our customers fail to introduce their devices in a timely manner or the market does not accept their devices, we may not recover our capital investment, in whole or in part. In addition, even if we are able to successfully develop enhancements or new generations of our products, these enhancements or new generations of products may not generate revenue in excess of the costs of development, and they may be quickly rendered obsolete by changing customer preferences or the introduction of products embodying new technologies or features by our competitors. Furthermore, if we were to make announcements of product delays, or if our competitors were to make announcements of new systems, these announcements could cause our customers to defer or forego purchases of our systems, which would also hurt our business.
We may not be able to recover capital expenditures.
We continue to make capital expenditures in the ordinary course of our business. We may not be able to recover the expenditures for capital projects within the assumed timeframe, or at all, which may have an adverse impact on our profitability.
We have significant guarantees, indemnification, and customer confidentiality obligations.
From time to time, we make guarantees to customers regarding the delivery and performance of our products and guarantee certain indebtedness, performance obligations or lease commitments of our subsidiary and affiliate companies. We also have agreed to provide indemnification to our officers, directors, employees and agents, to the extent permitted by law, arising from certain events or occurrences while the officer, director, employee or agent, is or was serving at our request in such capacity. Additionally, we have confidentiality obligations to certain customers. If we become liable under any of these obligations, it could materially and adversely affect our business, financial condition or operating results.
Our success depends on attracting and retaining key personnel.
Our success depends substantially upon the continued service of our executive officers and key personnel, none of whom is bound by an employment or non-competition agreement. Our success also depends on our ability to attract and retain highly qualified managers and technical, engineering, marketing, sales and support personnel. Competition for such specialized personnel is intense, and it may become more difficult for us to hire or retain them. Our volatile business cycles only aggravate this problem. If we implement layoffs during an industry downturn, our ability to hire or retain qualified personnel may be diminished. Our business, financial condition, and results of operations could be materially adversely affected by the loss of any of our key employees, by the failure of any key employee to perform in his or her current position, or by our inability to attract additional skilled employees.
We may not be able to protect our intellectual property rights.
Our success depends in part on our ability to obtain intellectual property rights and licenses and to preserve other intellectual property rights covering our products and development and testing tools. To that end, we have obtained certain domestic and international patents and may continue to seek patents on our inventions when appropriate. We have also obtained certain trademark registrations. The process of seeking intellectual property protection can be time consuming and expensive. We cannot ensure that:
| | • | | patents will issue from currently pending or future applications; |
| | • | | our existing patents or any new patents will be sufficient in scope or strength to provide meaningful protection or any commercial advantage to us; |
41
| | • | | foreign intellectual property laws will protect our intellectual property rights; or |
| | • | | others will not independently develop similar products, duplicate our products or design around our technology. |
If we do not successfully enforce our intellectual property rights, our competitive position could suffer, which could harm our operating results. We also rely on trade secrets, proprietary know-how, and confidentiality provisions in agreements with employees and consultants to protect our intellectual property. Other parties may not comply with the terms of their agreements with us, and we may not be able to adequately enforce our rights against these parties.
Third parties may claim we are infringing their intellectual property, and we could incur significant litigation costs and licensing expenses or be prevented from selling our products.
Intellectual property rights are uncertain and involve complex legal and factual questions. We may be unknowingly infringing on the intellectual property rights of others and may be liable for that infringement, which could result in a significant liability for us. If we do infringe the intellectual property rights of others, we could be forced to either seek a license to intellectual property rights of others or alter our products so that they no longer infringe the intellectual property rights of others. A license could be very expensive to obtain or may not be available at all. Similarly, changing our products or processes to avoid infringing the rights of others may be costly or impractical.
If we were to become involved in a dispute regarding intellectual property, whether ours or that of another company, we may have to participate in legal proceedings. These types of proceedings may be costly and time consuming for us, even if we eventually prevail. If we do not prevail, we might be forced to pay significant damages, obtain licenses, modify our products or processes, stop making products, or stop using processes.
In the future we may be subject to litigation that could have an adverse effect on our business
From time to time, we may be subject to litigation or other administrative and governmental proceedings that could require significant management time and resources and cause us to incur expenses and, in the event of an adverse decision, pay damages in an amount that could have a material adverse effect on our financial position or results of operations.
Product defects and any damages stemming from product liability could harm our reputation among existing and potential customers and could have a material adverse effect upon our business results and financial condition
We cannot guarantee that there are no defects in the products we manufacture or that our product liability insurance will sufficiently cover the ultimate amount of any damages caused by such defects. Large scale accidents due to product defects or any discovery of defects in our products could harm our reputation, result in claims for damages, and have a material adverse effect upon our business results and financial condition.
Our operations and the operations of our customers and suppliers are subject to risks of natural catastrophic events, widespread health epidemics, acts of war, and the threat of domestic and international terrorist attacks, any one of which could result in cancellation of orders, delays in deliveries or other business activities, or loss of customers and could negatively affect our business and results of operations.
Our operations and those of our customers and suppliers are subject to disruption for a variety of reasons, including work stoppages, acts of war, terrorism, health epidemics, fires, earthquakes, hurricanes, volcanic eruptions, energy shortages, telecommunication failures, tsunamis, flooding, or other natural disasters. Such disruption could materially increase our costs and expenses as well as cause delays in, among other things, shipments of products to our customers, our ability to perform services requested by our customers, or the installation and acceptance of our products at customer sites. Any of these conditions could have a material adverse effect on our business, financial conditions, or results of operations.
Damage, interference, or interruption to our information technology networks and systems could hinder business continuity and lead to substantial costs or harm to our reputation
We rely on various information technology networks and systems, some of which are managed by third parties, to process, transmit and store electronic information, including confidential data, and to carry out and support a variety of business activities, including manufacturing, research and development, supply chain management, sales, and accounting. Attacks by hackers or computer viruses, wrongful use of the information security system, careless use, accidents or disasters could undermine the defenses we have established for these systems and disrupt business continuity, which could not only risk leakage or tampering of information but could also result in a legal claim, litigation, damages liability or an obligation to pay fines. If this were to occur, our reputation could be harmed, we could incur substantial costs, and it may have a material adverse effect upon our financial condition and results of operation.
42
*Our stock price is volatile.
In the twelve-month period ended on April 30, 2014, our stock price ranged from a low of $4.05 to a high of $10.54. The price of our common stock has been and likely will continue to be subject to wide fluctuations in response to a number of events and factors, such as:
| | • | | quarterly variations in operating results; |
| | • | | variances of our quarterly results of operations from securities analysts’ estimates; |
| | • | | changes in financial estimates and recommendations by securities analysts; |
| | • | | announcements of technological innovations, new products, acquisitions or strategic alliances; and |
| | • | | news reports relating to trends in our markets. |
In addition, the stock market in general, and the market prices for semiconductor-related and electronics manufacturing companies in particular, have experienced significant price and volume fluctuations that often have been unrelated to the operating performance of the companies affected by these fluctuations. These broad market fluctuations may adversely affect the market price of our common stock, regardless of our operating performance.
We may record impairment charges, which would adversely impact our results of operations.
We review our goodwill, intangible assets, and long-lived assets for impairment at least annually, or whenever events or changes in circumstances indicate that the carrying amounts of these assets may not be recoverable, in accordance with Topic 350,Intangibles—Goodwill and Other, to the FASB ASC.
One potential indicator of goodwill impairment is whether our fair value, as measured by our market capitalization, has remained below our net book value for a significant period of time. Whether our market capitalization triggers an impairment charge in any future period will depend on the underlying reasons for the decline in stock price, the significance of the decline, and the length of time the stock price has been trading at such prices.
In the event that we determine in a future period that impairment exists for any reason, we would record an impairment charge, which would reduce the underlying asset’s value in the period such determination is made, which would adversely impact our financial position and results of operations.
Internal control deficiencies or weaknesses that are not yet identified could emerge.
Over time we may identify and correct deficiencies or weaknesses in our internal controls and, where and when appropriate, report on the identification and correction of these deficiencies or weaknesses. However, our internal control procedures can provide only reasonable, and not absolute, assurance that deficiencies or weaknesses are identified. Deficiencies or weaknesses that have not been identified by us could emerge and the identification and correction of these deficiencies or weaknesses could have a material impact on our results of operations. If our internal control over financial reporting are not considered adequate, we may experience a loss of public confidence, which could have an adverse effect on our business and stock price.
43
| Item 2. | Unregistered Sales of Equity Securities and Use of Proceeds |
The table below provides information regarding repurchases of common stock made by us from the inception of our stock repurchase program on September 15, 2011 through April 30, 2014. There were no repurchases of common stock in the three and nine months ended April 30, 2014.
| | | | | | | | | | | | | | | | | | |
Period | | | | Total
Number
of
Shares
Purchased | | | Average
Price
Paid
per
Share | | | Total
Number of
Shares
Purchased
as
Part of
Publicly
Announced
Plans or
Programs
(1) | | | Remaining Dollar
Value that
May Yet
Be Purchased
Under
the Plans or
Programs (excluding
commissions) | |
Inception of program | | | | | — | | | $ | — | | | | — | | | $ | 25,000,000 | |
Fiscal year ended 7/31/2012 | | | | | 1,652,394 | | | $ | 5.84 | | | | 1,652,394 | | | $ | 15,474,033 | |
Fiscal year ended 7/31/2013 | | | | | 1,642,272 | | | $ | 5.50 | | | | 1,642,272 | | | $ | 6,265,866 | |
Three months ended 10/31/2013 | | | | | — | | | $ | — | | | | — | | | $ | 6,265,866 | |
Three months ended 1/31/2014 | | | | | — | | | $ | — | | | | — | | | $ | 6,265,866 | |
Three months ended 4/30/2014 | | | | | — | | | $ | — | | | | — | | | $ | 6,265,866 | |
| | | | | | | | | | | | | | | | | | |
Total | | | | | 3,294,666 | | | $ | 5.67 | | | | 3,294,666 | | | | | |
| | | | | | | | | | | | | | | | | | |
| (1) | On September 15, 2011, the board of directors authorized a stock repurchase program, pursuant to which we are authorized to repurchase up to $25 million of our common stock from time to time in open market transactions. The repurchase program may be suspended or discontinued at any time and has no expiration date. |
The exhibits filed as part of this Quarterly Report on Form 10-Q are set forth on the Exhibit Index immediately preceding such exhibits, and are incorporated herein by reference.
44
SIGNATURE
Pursuant to the requirements of the Securities Exchange Act of 1934, the registrant has duly caused this report to be signed on its behalf by the undersigned thereunto duly authorized.
| | | | |
| | Xcerra Corporation |
| | |
| Date: June 9, 2014 | | By: | | /s/ MARK J. GALLENBERGER |
| | | | Mark J. Gallenberger |
| | | | Senior Vice President, Chief Operating Officer, |
| | | | Chief Financial Officer and Treasurer |
| | | | (Principal Financial Officer) |
45
EXHIBIT INDEX
| | |
Exhibit Number | | Description |
| |
| 10.1 | | First Amendment to Credit Agreement and Waiver, dated April 15, 2014, among the Registrant, Everett Charles Technologies, LLC, the Several Lenders from time to time party thereto and Silicon Valley Bank as Administrative Agent, Issuing Bank and Lender. |
| |
| 10.2 | | Executive Employment Agreement, dated April 29, 2014, between the Company and David G. Tacelli (Incorporated by reference to Exhibit 10.1 to the Registrant’s Current Report on Form 8-K filed with the SEC on May 2, 2014). |
| |
| 10.3 | | Executive Employment Agreement, dated April 29, 2014, between the Company and Mark J. Gallenberger (Incorporated by reference to Exhibit 10.2 to the Registrant’s Current Report on Form 8-K filed with the SEC on May 2, 2014). |
| |
| 10.4 | | Addendum to Employment Agreement, dated April 29, 2014, between the Company and Pascal Ronde (Incorporated by reference to Exhibit 10.3 to the Registrant’s Current Report on Form 8-K filed with the SEC on May 2, 2014). |
| 31.1 * | | Certification of the Chief Executive Officer pursuant to Rule 13a-14(a) of the Exchange Act |
| |
| 31.2 * | | Certification of the Chief Financial Officer pursuant to Rule 13a-14(a) of the Exchange Act |
| |
| 32 * | | Certification of the Chief Executive Officer and Chief Financial Officer pursuant to Rule 13a-14(b) of the Exchange Act and 18 U.S.C. Section 1350 |
| |
| 101.INS | | XBRL Instance Document |
| |
| 101.SCH | | XBRL Taxonomy Extension Schema Document |
| |
| 101.CAL | | XBRL Taxonomy Extension Calculation Linkbase Document |
| |
| 101.DEF | | XBRL Taxonomy Extension Definition Linkbase |
| |
| 101.LAB | | XBRL Taxonomy Extension Label Linkbase Document |
| |
| 101.PRE | | XBRL Taxonomy Extension Presentation Linkbase Document |
* Filed herewith
46