UNITED STATES
SECURITIES AND EXCHANGE COMMISSION
Washington, D.C. 20549
_______________________________________________________________________
FORM 10-K
__________________________________________________________________________
| | | | | |
| ☒ | Annual Report Pursuant to Section 13 or 15(d) of the Securities Exchange Act of 1934 |
For the fiscal year ended December 31, 2024
or
| | | | | |
| ☐ | Transition Report Pursuant to Section 13 or 15(d) of the Securities Exchange Act of 1934 |
For the transition period from _______ to _______
Commission File Number 1-2376
__________________________________________________________________________
FMC CORPORATION
(Exact name of registrant as specified in its charter)
__________________________________________________________________________ | | | | | | | | | | | |
| Delaware | | 94-0479804 |
(State or other jurisdiction of incorporation or organization) | | (I.R.S. Employer Identification No.) |
| | |
| 2929 Walnut Street | Philadelphia | Pennsylvania | 19104 |
| (Address of principal executive offices) | | | (Zip Code) |
Registrant’s telephone number, including area code: 215-299-6000
__________________________________________________________________________
Securities registered pursuant to Section 12(b) of the Act: | | | | | | | | | | | | | | |
| Title of each class | | Trading Symbol | | Name of each exchange on which registered |
| Common Stock, par value $0.10 per share | | FMC | | New York Stock Exchange |
Securities registered pursuant to Section 12(g) of the Act:
None
Indicate by check mark if the registrant is a well-known seasoned issuer, as defined in Rule 405 of the Securities Act. Yes x No ¨
Indicate by check mark if the registrant is not required to file reports pursuant to Section 13 or Section 15(d) of the Act. Yes ¨ No x
Indicate by check mark whether the registrant (1) has filed all reports required to be filed by Section 13 or 15(d) of the Securities Exchange Act of 1934 during the preceding 12 months (or for such shorter period that the registrant was required to file such reports), and (2) has been subject to such filing requirements for the past 90 days. Yes x No ¨
Indicate by check mark whether the registrant has submitted electronically every Interactive Data File required to be submitted pursuant to Rule 405 of Regulation S-T (§ 232.405 of this chapter) during the preceding 12 months (or for such shorter period that the registrant was required to submit such files). Yes x No ¨
Indicate by check mark whether the registrant is a large accelerated filer, an accelerated filer, a non-accelerated filer, a smaller reporting company, or an emerging growth company. See the definitions of "large accelerated filer," "accelerated filer," "smaller reporting company," and "emerging growth company" in Rule 12b-2 of the Exchange Act.
| | | | | | | | | | | | | | | | | | | | |
| Large accelerated filer | | ☒ | | Accelerated filer | | ☐ |
| | | | | | |
| Non-accelerated filer | | ☐ | | Smaller reporting company | | ☐ |
| | | | | | |
| | | | Emerging growth company | | ☐ |
| | | | | | |
| If an emerging growth company, indicate by check mark if the registrant has elected not to use the extended transition period for complying with any new or revised financial accounting standards provided pursuant to Section 13(a) of the Exchange Act. | | |
| ☐ |
Indicate by check mark whether the registrant has filed a report on and attestation to its management’s assessment of the effectiveness of its internal control over financial reporting under Section 404(b) of the Sarbanes-Oxley Act (15 U.S.C. 7262(b)) by the registered public accounting firm that prepared or issued its audit report. ☒
| | | | | | | | |
| If securities are registered pursuant to Section 12(b) of the Act, indicate by check mark whether the financial statements of the registrant included in the filing reflect the correction of an error to previously issued financial statements. | | ☐ |
| | |
| Indicate by check mark whether any of those error corrections are restatements that required a recovery analysis of incentive-based compensation received by any of the registrant’s executive officers during the relevant recovery period pursuant to §240.10D-1(b). | | ☐ |
Indicate by check mark whether the registrant is a shell company (as defined in Rule 12b-2 of the Exchange Act) Yes ☐ No ☒
The aggregate market value of voting stock held by non-affiliates of the registrant as of June 30, 2024, the last day of the registrant’s second fiscal quarter, was $7,145,820,070. The market value of voting stock held by non-affiliates excludes the value of those shares held by executive officers and directors of the registrant.
Indicate the number of shares outstanding of each of the issuer’s classes of common stock, as of the latest practicable date:
As of December 31, 2024, there were 124,840,902 of the registrant's common shares outstanding.
DOCUMENTS INCORPORATED BY REFERENCE
| | | | | | | | |
| DOCUMENT | | FORM 10-K REFERENCE |
| Portions of Proxy Statement for 2025 Annual Meeting of Stockholders | | Part III |
FMC Corporation
2024 Form 10-K
Table of Contents
PART I
FMC Corporation was incorporated in 1928 under Delaware law and has its principal executive offices at 2929 Walnut Street, Philadelphia, Pennsylvania 19104. Throughout this annual report on Form 10-K, except where otherwise stated or indicated by the context, "FMC", the "Company", "We," "Us," or "Our" means FMC Corporation and its consolidated subsidiaries and their predecessors. Copies of the annual, quarterly and current reports we file with the Securities and Exchange Commission ("SEC"), and any amendments to those reports, are available on our website at www.fmc.com as soon as practicable after we furnish such materials to the SEC.
ITEM 1. BUSINESS
General
FMC Corporation is a global agricultural sciences company dedicated to providing farmers innovative solutions that increase the productivity and resilience of their land. From our industry-leading development pipeline to novel biologicals and precision technologies, we are passionate about the power of science to solve agriculture’s biggest challenges. FMC’s innovative crop protection solutions help growers produce food, feed, fiber and fuel for an expanding world population while adapting to a changing environment. FMC is committed to discovering new insecticide, herbicide and fungicide active ingredients, product formulations and pioneering technologies that are consistently better for the planet.
FMC Strategy
We are a tier-one leader and the fifth largest global innovator in the agrochemicals/crop protection market. Our strong competitive position is driven by our technology and innovation, as well as our geographic balance and crop diversity.
FMC is guided by our strategic plan which aims to transform our relationship with growers to become a trusted source for technical expertise and innovative solutions, to deliver superior growth and returns to our stakeholders, and to lead the crop protection industry in safety, talent, sustainability, and innovation. FMC expects to deliver on its growth ambitions by accelerating development and commercialization of our pipeline, driving profitability and competitiveness of our diamides brands and core synthetic portfolio, and growing the leading plant health business driven by our pheromones platform. To enable our growth and help achieve our ambitions, FMC is implementing strategies to be a trusted advisor to the grower through dedicated technical personnel and events, expanded precision technologies, and other digital and communication tools. We believe that expanded business development activities will capture local market innovation in new and existing geographies and further accelerate FMC’s growth.
FMC’s strategy also includes a focus on increasing operating leverage, optimizing functional costs, and driving a fit-for-purpose and resilient supply network. In 2024, FMC’s restructuring efforts generated $165 million in cost benefits and helped shape an FMC that is focused, efficient, and strong in the near-term, and structured to deliver sustained growth and superior results in the long-term. Our supply network is rigorously maintained to balance risk, cost, and quality to enable FMC to generate the greatest possible competitive advantage and profitability from our portfolio.
FMC remains committed to leading the industry in safety, inclusion, and sustainability. We are collectively committed to working safely every day to ensure the safety of our people and products. We also strive to create an environment that fosters a culture of belonging across our team of 5,700 global employees. Additionally, we are committed to delivering products that improve agricultural productivity while protecting the environment for future generations. Our focus on sustainability covers both the impacts of climate change on our business as well as our business on the climate. These values of safety, inclusion, and sustainability define FMC and guide how we do business.
Acquisitions and Divestitures
Through FMC Ventures, our venture capital arm, we have made strategic investments in start-ups and early-stage companies that are developing and applying emerging technologies in the agricultural industry. On November 1, 2024, we completed the sale of the non-core Global Specialty Solutions ("GSS") business to Environmental Science US, LLC d/b/a Envu ("Envu"). We received proceeds, net of the preliminary working capital adjustment, of approximately $340 million in connection with the completion of the sale. The GSS business did not qualify for discontinued operations during 2024.
Financial Information About Our Business
(Financial Information in Millions)
The following table shows the principal products produced by our business, its raw materials and uses:
| | | | | | | | |
| Product | Raw Materials | Uses |
| Insecticides | Synthetic chemical intermediates | Protection of crops, including soybean, corn, fruits and vegetables, cotton, sugarcane, rice, and cereals, from insects and for non-agricultural applications including pest control for home, garden and other specialty markets |
| Herbicides | Synthetic chemical intermediates | Protection of crops, including cotton, sugarcane, rice, corn, soybeans, cereals, fruits and vegetables from weed growth and for non-agricultural applications including turf and roadsides |
| Fungicides | Synthetic chemical intermediates | Protection of crops, including cereals, fruits and vegetables from fungal disease |
| Plant Health | Biological intermediates | Protection of crops, including soybean, corn, fruits and vegetables, cotton, sugarcane, rice, and cereals, from insects and diseases and enhancement of yields |
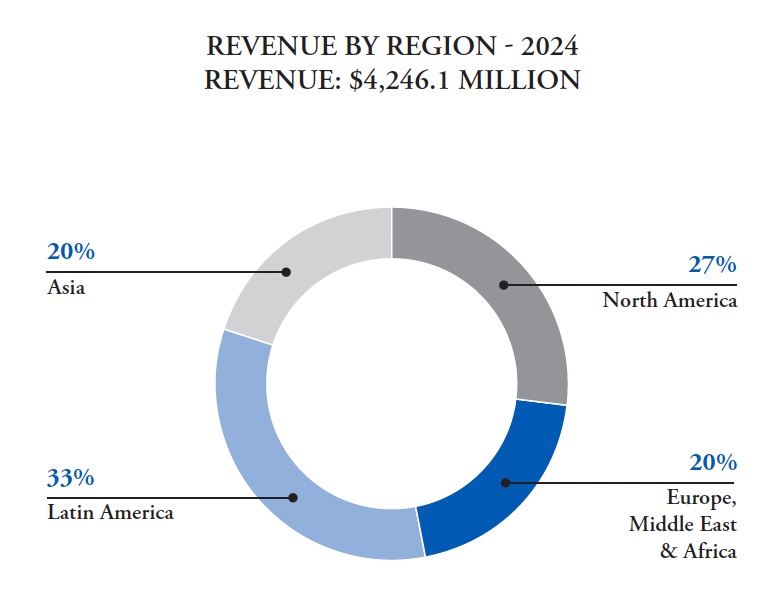
The following charts detail our sales by major geographic region and major product category.
The following table provides our long-lived assets by major geographical region:
| | | | | | | | | | | |
| (in Millions) | December 31, |
| 2024 | | 2023 |
Long-lived assets (1) | | | |
| North America | $ | 956.0 | | | $ | 1,063.4 | |
| Latin America | 278.8 | | | 714.8 | |
Europe, Middle East, and Africa (2) | 3,685.4 | | | 1,718.2 | |
| Asia | 251.0 | | | 1,964.1 | |
| Total | $ | 5,171.2 | | | $ | 5,460.5 | |
________________
(1)Geographic long-lived assets exclude long-term deferred income taxes.
(2)In connection with our plans to establish a global technology and innovation center in Switzerland, we completed intra-entity transfers of certain intellectual property to one of the Company's Swiss subsidiaries during 2024.
Products and Markets
Our portfolio is comprised of three major pesticide categories: insecticides, herbicides and fungicides. The majority of our product lines consist of insecticides and herbicides, and we have a growing portfolio of fungicides mainly used in high value crop segments. Our insecticides are used to control a wide spectrum of pests, while our herbicide portfolio primarily targets a large variety of difficult-to-control weeds. In addition, we are also investing substantially in our Plant Health program which includes biologicals, crop nutrition, and seed treatment products. Biological technologies offer excellent sustainability profiles and serve as strong complements to our synthetic products. Our biologicals feature attributes that exceed the competition, such as high stability, long shelf life, low use rates and compatibility with other chemistries.
We have our own sales and marketing organizations and access the market through a combination of distributors, retailers and co-ops in all four regions. In addition, we sell directly to large growers in select countries such as Brazil. Through these and other alliances, along with our own targeted marketing efforts, access to novel technologies and our innovation initiatives, we expect to maintain and enhance our access in key agricultural and non-crop markets and develop new products that will help us continue to compete effectively.
Industry Overview
The three principal categories of agricultural and non-crop chemicals are: herbicides, insecticides, and fungicides, representing approximately 41 percent, 29 percent and 27 percent of global agricultural crop protection market value, respectively.
The agrochemicals industry is more consolidated following several mergers of the leading crop protection companies, which now include FMC, ChemChina (owner of Syngenta Group, which includes the former Syngenta and Adama), Bayer AG (acquired Monsanto in 2018), BASF AG and Corteva Agriscience. These five innovation companies currently represent approximately 72 percent of the crop protection industry’s global sales. The next group of agrochemical producers include UPL Ltd., Sumitomo Chemical Company Ltd., and Nufarm Ltd. FMC employs various differentiated strategies and competes with unique technologies focusing on certain crops, markets and geographies, while also being supported by a low-cost manufacturing model.
Growth
We are among the leading agrochemical producers in the world. Several products from our portfolio are based on proprietary active ingredients with a range of intellectual property protections which should position us to grow well above market patterns. Our complementary technologies combine improved formulation capabilities and a broader innovation pipeline, resulting in new and differentiated products. We continue to take advantage of enhanced market access positions and an expanded portfolio to deliver near-term growth.
We have a growth strategy driven by obtaining new and improved uses for existing product lines and developing, acquiring, accessing, marketing, distributing and/or selling complementary chemistries, biologicals, and related technologies to strengthen our product portfolio and our capabilities to effectively service our target markets and customers.
Our growth efforts focus on developing environmentally compatible and sustainable solutions that can effectively increase farmers’ yields and provide alternatives to products which may be prone to resistance. We are committed to providing unique, differentiated products to our customers by acquiring and further developing technologies as well as investing in innovation to extend product life cycles, introduce new modes of action, and enter new market segments. Our external growth efforts include product acquisitions, in-licensing of chemistries and technologies and alliances that bolster our market access, complement our existing product portfolio or provide entry into adjacent spaces. We have entered into a range of development and distribution agreements with other companies that provide access to new technologies and products which we can subsequently commercialize.
In FMC Precision Agriculture, we are broadening our award-winning Arc™ farm intelligence platform, a proprietary mobile solution that helps farmers better understand and manage pest pressure through predictive modeling based on real-time and historical data, entomological models, hyper-local weather information and in-field sensors. Arc™ farm intelligence, which is now available in over 25 countries across 20 million acres, allows growers to address pest pressure more efficiently, manage infestations before they escalate and target applications in a more sustainable manner.
Our venture capital arm, FMC Ventures, continued to build its portfolio in 2024 with new collaborations and strategic investments in start-ups and early-stage companies working on new or disruptive technologies. These engagements, which support or augment our internal capabilities, span several important technology segments, including robotics, drone technology, Ag-FinTech, pathogen detection, soil health, peptides and pheromones.
Core Portfolio Strategy
Our core portfolio includes one of our two diamide-class molecules – Rynaxypyr® (chlorantraniliprole) active, the world’s leading insect control technology – with annual revenues of approximately $1.0 billion in 2024. The core portfolio also includes our long standing synthetic herbicides and insecticides which continue to deliver strong performance across a variety of crops around the world. Our current diamide pipeline contains approximately eleven new products containing Rynaxypyr® active to be launched this decade and we expect Rynaxypyr® active to continue a steady growth trajectory notwithstanding the expiration of composition of matter patents covering Rynaxypyr® active in certain countries which started in late 2022. Our growth strategy for Rynaxypyr® active includes the introduction of novel formulations and mixture products as well as lower cost solo formulations. The first of these Rynaxypyr® active containing products, under the trademarks Elevest®, Vantacor®, and Altacor® eVo, were launched in the US and other countries, including Canada and Australia, starting in late 2020 and will be launched in additional countries in 2025 onward. In 2023, Premio® Star insect control formulation was launched in Brazil and launches in other Latin American countries starting in 2025. The implementation of our lower cost diamide manufacturing strategy will also support our ability to compete with expected generic competitors.
Growth Portfolio Strategy
FMC’s growth portfolio includes products under patent or data protection in important markets and/or providing novel modes of action. We believe that FMC has one of the most productive crop protection pipelines in agriculture. The pipeline is highly valuable because it is biased toward new modes of action. The current R&D pipeline features over 20 new active areas in discovery and 18 new active ingredients in development.
The growth portfolio includes our second diamide-class molecule, Cyazypyr® active (cyantraniliprole), which supports a portfolio of products that generated revenues of approximately $0.5 billion in 2024. The Cyazypyr® product portfolio continues to be protected by patents and data protection for key global markets. Cyazypyr® active-containing brands, under the trademarks Verimark®, Benevia®, and Exirel® were launched in certain southern European countries starting in 2023. Our current diamide pipeline contains approximately nine new products containing Cyazypyr® active expected to be launched this decade and we continue to explore further innovations based on this diamide chemistry. We anticipate strong growth of Cyazypyr® active due to its patent portfolio, complex manufacturing profile and regulatory data protection in key markets. Additionally, we are developing novel formulations containing Cyazypyr® active which are intended to expand the spectrum of pest control and provide growers with lower cost in use. We also expect that implementation of our lower cost diamide manufacturing strategy will allow for continued competitiveness of Cyazypyr® active as generic entry begins following patent and data protection expiry.
Our growth portfolio also includes herbicide pipeline products featuring three molecules - Dodhylex™ active, Isoflex™ active and rimisoxafen. Isoflex™ active offers a new mode of action against weeds in cereals. We have launched herbicide brands powered by Isoflex™ active for cereals in Australia, Argentina, China, India and Pakistan. In Brazil, we have launched for use in cotton and rice and will expand into wheat. We anticipate launching other herbicide brands powered by Isoflex™ active in Chile and Uruguay during 2025 and we expect to significantly expand sales of these products to other parts of our EMEA and NA regions over the next five years.
Dodhylex™ active is the first active ingredient in the HRAC/ WSSA Group 28 and the first new herbicide with a novel mode of action in the industry in over three decades. This new mode of action herbicide was discovered at the FMC Stine Research Center and is a testament to FMC's commitment to innovation and our disciplined approach to advancing the most promising new molecules. FMC is working towards registering Dodhylex™ active for use in all major rice-growing countries across the globe and other additional crops. Dodhylex™ active is not currently registered and is not available for sale in any country. We have, however, received a conditional registration for Dodhylex™ active in the Philippines and anticipate first sales later in 2025. The registration dossier for Dodhylex™ active and products containing Dodhylex™ active were submitted for review in India, Brazil, the United States, Colombia, South Korea, Peru, Taiwan, Japan, and Malaysia.
Rimisoxafen is a new dual mode of action herbicide for resistant broadleaf weeds including Palmer amaranth, a fast growing and harmful weed that has developed resistance to most herbicides on the market. Rimisoxafen provides excellent control of key Amaranthus species (Palmer, waterhemp, redroot pigweed) with outstanding residual performance. Rimisoxafen is in the development phase of our pipeline and we are conducting regulatory studies at this time.
Our fungicide pipeline portfolio includes fluindapyr. Fluindapyr controls a variety of key diseases in row and specialty crops around the world. Fluindapyr formulations are registered in the U.S., Brazil, Paraguay, Mexico and Argentina. Key crops include soybeans, corn, cotton, cereals, oilseed rape, fruits & vegetables, tree nuts and peanuts. Onsuva™ fungicide is available in Argentina and Brazil to prevent and control diseases affecting soybean, corn and peanut crops. Adastrio™ fungicide is registered in the U.S. for use in corn, grain sorghum, wheat, triticale and barley against anthracnose leaf blight, common rust, gray leaf spot, Northern corn leaf blight and Southern rust.
Pipeline Growth Strategy
As an agricultural sciences company, FMC believes in innovation and in protecting that innovation through intellectual property rights. We own and license a significant number of U.S. and foreign patents, trademarks, trade secrets and other intellectual property that are cumulatively important to our business. In addition, we seek to license our proprietary technologies through partnering arrangements that effectively allow us to capitalize from our intellectual property. The FMC intellectual property estate provides us with a significant competitive advantage which we seek to expand and renew on a continual basis. We manage our technology investment to discover and develop new active ingredients and biological products, as well as to continue to improve manufacturing processes and existing active ingredients through new formulations, mixtures or other concepts. FMC’s technology innovation processes capture those innovations and protect them through the most appropriate form of intellectual property rights. We also in-license certain active ingredients and other technologies under patents held by third parties, and have granted licenses to certain of our patents to third parties.
Our patents cover many aspects of our business, including our chemical and biological active ingredients, intermediate chemicals, manufacturing processes to produce such active ingredients or intermediates, formulations, and product uses, as well as many aspects of our research and development activities that support the FMC new product pipeline. Patents are granted by individual jurisdictions and the duration of our patents depends on their respective jurisdictions and payment of annuities.
As of December 31, 2024, the Company owned a total of approximately 170 active granted U.S. patents and 2,531 active granted foreign patents (includes Supplemental Patent Certificates); we also have approximately 1,863 patent applications pending globally.
More details regarding our granted patent estate are set forth in the tables below:
Diamides
| | | | | | | | | | | |
| Numbers of active Granted Patents by type, as of December 31, 2024: |
| United States | | Foreign |
| Active Ingredients | — | | | 100 | |
| Intermediates/ Method of Manufacturing | 17 | | | 283 | |
| Formulations/ Mixtures/ Applications | 7 | | | 308 | |
| Total | 24 | | | 691 | |
| | | | | | | | | | | |
| Remaining life of Granted Patents, as of December 31, 2024: |
| United States | | Foreign |
| Through December 31, 2029 (i.e., 2025-2029) | 14 | | | 527 | |
| 2030 - 2034 | 6 | | | 52 | |
| 2035 - 2039 | 2 | | | 23 | |
| 2040 - 2044 | 2 | | | 89 | |
| Total | 24 | | | 691 | |
Pipeline
| | | | | | | | | | | |
| Numbers of active Granted Patents by type, as of December 31, 2024: |
| United States | | Foreign |
| Active Ingredients | 8 | | | 187 | |
| Intermediates/ Method of Manufacturing | 11 | | | 134 | |
| Formulations/ Mixtures/ Applications | 10 | | | 242 | |
| Total | 29 | | | 563 | |
| | | | | | | | | | | |
| Remaining life of Granted Patents, as of December 31, 2024: |
| United States | | Foreign |
| Through December 31, 2029 (i.e., 2025-2029) | — | | | — | |
| 2030 - 2034 | 10 | | | 269 | |
| 2035 - 2039 | 19 | | | 289 | |
| 2040 - 2044 | — | | | 5 | |
| Total | 29 | | | 563 | |
We also own many trademarks that are well recognized by customers or product end-users. Unlike patents, ownership rights in trademarks can be continued indefinitely so long as the trademarks are properly used, and renewal fees are paid.
We actively monitor and manage our patents and trademarks to maintain our rights in these assets and we strategically act when we believe our intellectual property rights are being infringed. Since 2022, continuing through 2024, we initiated proceedings to enforce several of our patents and trademarks against generic producers and infringers, resulting in multiple favorable judgments and settlements in several countries, including in the United States, India, and China. Patent challenges in response to enforcement efforts are expected as an ordinary defense tactic in patent enforcement cases and have been raised in several of our enforcement cases to date; we intend to defend vigorously any patents that are challenged. While we believe that the invalidity or loss of any particular patent, trademark or licenses after appeal would be an unlikely possibility, our patent and trademark estate related to our diamide insect control products based on Rynaxypyr® and Cyazypyr® active ingredients in the aggregate are of material importance to our operations. The composition of matter patent that covers chlorantraniliprole (also known as Rynaxypyr® active) expired in a number of countries in August 2022; this patent protection for composition will end in 2027 across all geographies. The composition of matter patent that covers cyantraniliprole (also known as Cyazypyr® active) expired in a number of countries starting in January 2024; this patent will continue to remain in force in other countries throughout the world, expiring on a country-by-country basis at various dates through January 2029.
Generic competitors have, in some countries, registered and launched generic versions of our Rynaxypyr® -based products. We continue to deploy a multi-pronged strategy to defend that business after active ingredient patent expiration, including enforcement of our patents in many countries which continue to cover chemical intermediates and manufacturing processes that are essential in the production of chlorantraniliprole.
In June 2024, FMC initiated a lawsuit against Sharda USA LLC in the U.S. District Court for the Eastern District of Pennsylvania (Philadelphia) for infringing two US Patents directed to insecticidal compositions containing the combination of bifenthrin and zeta-cypermethrin. FMC requested a preliminary injunction be granted preventing Sharda from selling its generic WINNER product in the US and causing damage to the market for FMC’s HERO® insecticide. In August 2024, FMC successfully obtained a preliminary injunction in the form of a Temporary Restraining Order (TRO). The TRO is currently being appealed.
FMC filed a patent infringement case against Albaugh in the US District Court (Iowa), based on public information disclosed in Albaugh’s EPA dossier. In the lawsuit, FMC alleged that Albaugh imported, made, or used products containing chlorantraniliprole made in violation of FMC’s U.S. patent rights protecting FMC’s processes for manufacturing chlorantraniliprole. In November 2024, FMC and Albaugh reached an agreement to resolve the case. As part of that agreement, Albaugh has agreed to pay FMC for a license to FMC’s patented technology used in the manufacture of chlorantraniliprole for agricultural uses in the United States. The specific terms of the agreement are confidential.
In December 2024, Atticus LLC filed a declaratory judgment case against FMC in the US District Court for the Western District of North Carolina. Atticus requested the Court declare that Atticus’s contemplated formulated products containing chlorantraniliprole do not infringe FMC’s patents directed to certain chlorantraniliprole product formulations. As of the date of the lawsuit, Atticus has not received EPA approval for the products at issue but Atticus nevertheless alleged that approval was expected in the coming months. Atticus has not requested declaratory relief with respect to any of FMC’s patents covering processes to manufacture chlorantraniliprole. In early February 2025, FMC filed a motion to dismiss Atticus' complaint for failure to state a case or controversy.
Patents involve complex factual and legal issues and thus each case is being litigated on the merits; we often seek preliminary injunctive relief to stop sales of products which we believe to be infringing – since equitable relief at the early stage of a litigation is subject to a higher standard of proof than decisions made after a trial on the merits, we may have difficulty prevailing in all cases at that preliminary stage, and in a number of cases in India and China, we have not obtained that requested relief, allowing products to be launched while the underlying cases on the merits continue. Even in situations in which we are not able to prevail on interim relief, we intend to continue litigating in such cases and seek permanent injunctive relief and recovery of damages after a full trial. Patent challenges in response to enforcement efforts are expected as an ordinary defense tactic in patent enforcement cases; we intend to defend vigorously any diamide patents that are challenged.
In early 2022, we received notice that certain third parties were seeking to invalidate our Chinese patents on a certain intermediate involved in producing chlorantraniliprole and a process to produce chlorantraniliprole and cyantraniliprole. During the third quarter of 2022, the China Patent Review Board ("Review Board") issued rulings which held that the two challenged patents were not valid in China. In 2023, we appealed the Review Board's decision to the Beijing IP Court. The Beijing IP Court upheld the decisions of the Review Board. We believe that the Beijing IP Court’s decisions were seriously flawed both on procedural and substantive grounds and we have appealed the Review Board's decision to the People’s Supreme Court of China. Under Chinese law, the patents remain valid but are not enforceable pending appeal. As of the date of this Form 10-K, we are awaiting a decision from the People’s Supreme Court of China. Given the unique and specific Chinese patent law issues involved, we do not believe the decisions of the lower courts in China would materially adversely impact our enforcement of similar patents in other countries.
In several of our pending India patent enforcement cases, defendant infringers have sought to invalidate the asserted FMC patent(s), but as of the date of this Form 10- K no such infringer has prevailed in an invalidation claim.
Seasonality
The seasonal nature of the crop protection market and the geographic spread of our business can result in significant variations in quarterly earnings among geographic locations. Our products sold in the northern hemisphere (North America, Europe and parts of Asia) serve seasonal agricultural markets from March through September, generally resulting in significant earnings in the first and second quarters, and to a lesser extent in the fourth quarter. Markets in the southern hemisphere (Latin America and parts of the Asia Pacific region, including Australia) are served from July through February, generally resulting in earnings in the third, fourth and first quarters.
Competition
We encounter substantial competition in our business. We market our products through our own sales organization and through alliance partners, independent distributors and sales representatives. The number of our principal competitors varies from market to market. In general, we compete by providing advanced technology, high product quality, reliability, quality customer and technical service, and by operating in a cost-efficient manner.
Our business competes primarily in the global crop protection market for insecticides, herbicides and fungicides. Industry products include crop protection chemicals and biologicals, for certain major competitors, genetically engineered (crop biotechnology) products. Competition from generic agrochemical producers is significant as a number of key product patents have expired in the last two decades. In general, we compete as an innovator by focusing on product development, including novel formulations, proprietary mixes, and advanced delivery systems and by acquiring or licensing (mostly) proprietary chemistries or technologies that complement our product and geographic focus. We also differentiate ourselves by our global cost-competitiveness through our manufacturing strategies, establishing effective product stewardship programs and developing strategic alliances that strengthen market access in key countries and regions.
Research and Development Expense
The R&D efforts in our business focus on discovering and developing environmentally sound solutions — both new active ingredients and new product formulations — that meet the needs of farmers to maximize yields and control pests. We are focused on maintaining the site infrastructure at our FMC Stine Research Center in Newark, Delaware, and continuously investing in high-quality equipment.
Environmental Laws and Regulations
A discussion of environmental related factors can be found in Item 7 "Management’s Discussion and Analysis of Financial Condition and Results of Operations" and in Note 10 "Environmental Obligations" in the notes to our consolidated financial statements included in this Form 10-K.
Human Capital
At FMC, employees are guided by our purpose: Innovation for agriculture; Solutions for the planet. We provide farmers innovative solutions that increase the productivity and resilience of their land. From our industry-leading discovery pipeline to novel biologicals and precision technologies, we are passionate about the power of science to solve agriculture's biggest challenges. Our employees’ belief in this purpose and commitment to our core values are key to the Company’s success.
Employees
We employ approximately 5,700 people, which is split across our major geographical regions with 21 percent in North America, 12 percent in Latin America, 26 percent in Europe, Middle East & Africa, and 41 percent in Asia as of December 31, 2024.
We have one collective-bargaining agreement in the US and several collective-bargaining agreements or equivalent agreements in foreign-based locations. None of these agreements are considered material to our operations or financial position. Employees subject to these agreements do not represent a material portion of our overall employee headcount. Over the years, we have successfully renegotiated contracts without any material work stoppages. We cannot predict, however, the outcome of future contract negotiations.
Talent Development and Retention
Developing our talent is critical to FMC’s ability to attract and retain a highly skilled and engaged workforce who can lead competitively, innovate change, improve business performance, and successfully maintain a competitive advantage. We are committed to investing in our employees’ professional development through a range of programs and initiatives, including individual development plans, stretch projects and rotational assignments. We provide all employees with access to a best-in-class on-demand learning platform featuring a vast library of courses, empowering employees to learn on their own schedule, fostering a culture of continuous learning and skill development. We also offer leadership development programs and executive coaching tailored for our leaders to equip them with the skills needed to effectively manage teams, drive performance and inspire innovation.
FMC continually strives to meet the needs of our employees, shareholders, and customers through competitive rewards, policies, and practices designed to attract, retain and motivate exceptional employees and drive both individual and Company performance. Performance-based direct pay programs include competitive base pay, short-term incentives, and long-term incentives. In addition, comprehensive global benefit packages are offered to support the health and well-being of employees and their families enabling FMC to offer a comprehensive total reward package designed for employees throughout their career.
FMC Culture
An important element of our Company’s strategy is our commitment to creating a culture of belonging where every employee can bring their full, authentic selves to work and thrive. We strive to maintain a workforce that mirrors the makeup of our growers by fostering an inclusive environment where we embrace diversity. Our goal is for everyone to feel they have a voice, and their contributions are valued at FMC. As an example of our efforts, we conduct an all-employee engagement survey designed to capture the voice of our employees and provide actionable insights to sustain an inclusive environment and support employees to perform at their best.
Safety
Safety is a core value of FMC. We strive for an injury-free workplace, where every person returns home the same way they arrived. We encourage a culture of open reporting, to learn from our mistakes and work towards continuous improvement in behaviors and processes. As a result of our firm commitment to safety, our Total Recordable Incident Rate of 0.0995 continues to be among the lowest in the industry globally and in the top decile of peer companies in North America, placing our Company among the safest organizations in the chemical industry. This level of performance underscores our collective commitment to work safely every day. We empower our people to always put safety first at work and at home.
Sustainability
We are committed to delivering products that improve agricultural productivity while protecting the environment for future generations. We recognize that sustainability goes beyond reducing emissions, it also encompasses human rights, the importance of nature, including biodiversity and how we utilize scarce resources such as water. FMC is aligned with the UN Sustainable Development Goals #2 (Zero Hunger), #8 (Decent Work and Economic Growth), #13 (Climate Action) and #15 (Life on Land). To reflect this commitment, we have established 2025 and 2035 sustainability goals. Our 2025 goals include: 100 percent research and development spend on sustainably advantaged products, a total recordable incident rate of less than 0.1, and a score of 100 on the Community Engagement Index. Our 2035 goals, include: 100 percent implementation of sustainable water practices at all operating sites, 100 percent waste to beneficial reuse, and net-zero greenhouse gas (“GHG”) emissions across the value chain (Scopes 1, 2 and 3). FMC has worked with to the Science Based Target initiative ("SBTi"), Net-Zero Standard, in line with keeping the global temperature at 1.5°C above pre-industrial time in alignment with the Paris Agreement. FMC received validation on its near-term and net-zero targets in March 2023. We are targeting a 42% reduction in Scopes 1 and 2, and 25% reduction in Scope 3 by 2030, with a net-zero target across the value chain by 2035. FMC continues to make progress towards achieving our 2025 and 2035 environmental goals and our progress is reported annually in our sustainability report.
At FMC, we embed sustainability and stewardship at each stage of the product life cycle, and stewardship priorities are built into the core of research and development, portfolio and marketing strategies. FMC developed and utilizes its Product Sustainability Assessment Tool to evaluate the sustainability attributes of new active ingredients and formulated products in the research and development pipeline. This assessment, along with other product stewardship processes and tools, promotes the introduction and use of sustainably advantaged agricultural solutions. We continue to strive for open and transparent communications about our product stewardship successes and challenges. FMC is continuing to phase out Highly Hazardous Pesticides (“HHPs”) from our product portfolio. In 2024, HHPs accounted for approximately 0.1 percent of our total sales. This reduction of HHPs in our portfolio can be attributed to our internal processes which include continuous evaluation, close monitoring and subsequent phase out along with strong stewardship actions.
SEC Filings
SEC filings are available free of charge on our website, www.fmc.com. Our annual report on Form 10-K, quarterly reports on Form 10-Q, current reports on Form 8-K and amendments to those reports are posted as soon as practicable after we furnish such materials to the SEC.
REGULATION FD DISCLOSURES
The Company’s investor relations website, located at https://investors.fmc.com, should be considered as a recognized channel of distribution, and the Company may periodically post important information to the web site for investors, including information that the Company may wish to disclose publicly for purposes of complying with the federal securities laws and our disclosure obligations under the SEC's Regulation FD. We encourage investors and others interested in the Company to monitor our investor relations website for material disclosures. Our website address is included in this Form 10-K as a textual reference only and the information on the website is not incorporated by reference into this Form 10-K.
ITEM 1A. RISK FACTORS
Among the factors that could have an impact on our ability to achieve operating results and meet our other goals are:
Industry Risks:
Pricing and volumes in our markets are sensitive to a number of industry specific and global issues and events including:
•Competition and new agricultural technologies – Our business faces competition, which could affect our ability to maintain or raise prices, successfully enter certain markets or retain our market position. Competition for our business includes not only generic suppliers of the same pesticidal active ingredients but also alternative proprietary pesticide chemistries and crop protection technologies that are bred into or applied onto seeds. Increased generic presence in agricultural chemical markets has been driven by the number of significant product patents and product data protections that have expired in the last decade, and this trend is expected to continue. Also, there are changing competitive dynamics in the agrochemical industry as some of our competitors have consolidated, resulting in them having greater scale and diversity, as well as market reach. These competitive differences may not be overcome and may erode our business. Agriculture in many countries is changing and new technologies (e.g., precision pest prediction or application, data management) continue to emerge. At this time, the scope and potential impact of these technologies are largely unknown but could have the potential to disrupt our business.
•Climate conditions – Our markets are affected by climatic conditions, both chronic and acute, which could adversely impact crop yields, pricing and pest infestations. For example, drought may reduce the need for fungicides, which could result in fewer sales and greater unsold inventories in the market, whereas excessive rain could lead to increased plant disease or weed growth requiring growers to purchase and use more pesticides. Drought and/or increased temperatures may change insect pest pressures, requiring growers to use more, less, or different insecticides. Natural disasters can impact production at our facilities in various parts of the world. The nature of these events makes them difficult to predict.
•Geographic cyclicality – While our business is well balanced geographically, in any given calendar quarter a certain geography(ies) may predominate the demand for our products in light of seasonal variations typically associated with the crop protection market and the geographic regions in which we operate. Unexpected market conditions in any such predominating geography, such as adverse weather, pest pressures, or other risks described herein, may impact our business if occurring during a calendar quarter in which such geography is predominating.
•Changing regulatory environment and public perception – Changes in the regulatory environment, particularly in the U.S., Brazil, China, India, Argentina and the European Union, could adversely impact our ability to continue producing and/or selling certain products in our domestic and foreign markets or could increase the cost of doing so. We are sensitive to regulatory risk given the need to obtain and maintain pesticide registrations in every country in which we sell our products. Moreover, we are required to comply with protocols or applicable regulatory requirements of biological products. Protocols and regulations may change, or regulatory agencies may determine that a biological product is not approvable. There is a risk that future regulatory requirements may lead to delays in development of biologicals or limit growth from biologicals. Many countries require re-registration of pesticides to meet new and more challenging requirements; while we defend our products vigorously, these re-registration processes may result in significant additional data costs, reduced number of permitted product uses, or potential product cancellation. Compliance with changing laws and regulations may involve significant costs or capital expenditures or require changes in business practice that could result in reduced profitability. In the European Union, the regulatory risk specifically includes the chemicals regulation known as REACH (Registration, Evaluation, and Authorization of Chemicals), which requires manufacturers to verify through a special registration system that their chemicals can be marketed safely. Changes to the regulatory environment may be influenced by non-government public pressure as a result of negative perception regarding the use of our crop protection products. Products reviewed by regulators and
labeled safe for use may still be challenged by others which could lead to negative public perception or regulatory action. Competing products labeled safe for use were subject to lawsuits or claims, and a similar situation for our products could result in negative impacts. In addition, climate change may result in changes to the governmental policy around greenhouse gases, including emission caps, trade regulations and other mechanisms to promote reduction of carbon emissions. Depending on their nature and scope, this could subject our manufacturing operations and suppliers to significant additional costs or limits on operations and affect the sources and supply of energy. In addition, corporate Environmental, Social and Governance (“ESG”) commitments and shifting market pressures in response to climate regulation and consumer expectations may influence demand of crop protection products.
•Geographic presence outside of U.S. – We have a strong presence in Latin America, Europe and Asia, as well as in the U.S. We have continued to grow our geographic footprint particularly in Europe and key Asian countries such as India, which means that developments outside the U.S. will generally have a more significant effect on our operations than in the past. Our operations outside the U.S. are subject to special risks and restrictions, including: fluctuations in currency values; exchange control regulations; changes in local political or economic conditions; governmental pricing directives; import and trade restrictions or tariffs; import or export licensing requirements and trade policy; restrictions on the ability to repatriate funds; and other potentially detrimental domestic and foreign governmental practices or policies affecting U.S. companies doing business abroad.
•Climate change and land use impacts – Climate change may impact markets in which we sell our products, where, for example, a prolonged drought may result in decreased demand for our products. The more gradual effects of persistent temperature change in geographies with significant agricultural lands may result in changes in lands suitable for agriculture or changes in the mix of crops suitable for cultivation and the pests that may be present in such geographies. These shifts in pests may become more rapid and persistent with rising temperatures and increasing GHG levels. For example, prolonged increase in average temperature may make northern lands suitable for growing crops not grown historically in such climates, leading growers to shift crop type. It may also result in new or different weed, plant disease or insect pressures and such changes could impact the mix of crop protection products growers would purchase and, depending on the local market and our product offering, may be adverse for us. Growers may need to implement regenerative practices and shift to more climate-adaptive products as climate change impacts global crop yields and shifts harvestable regions and pest pressures.
•Fluctuations in commodity prices – Our operating results could be significantly affected by the cost of commodities such as chemical raw material commodities, energy commodities, and harvested crop commodities. We may not be able to raise prices or improve productivity sufficiently to offset future increases in chemical raw material or energy commodity pricing. Accordingly, increases in such commodity prices may negatively affect our financial results. We use hedging strategies, where available on reasonable terms, to address energy and material commodity price risks. However, we are unable to avoid the risk of medium- and long-term increases. Additionally, fluctuations in harvested crop commodity prices could negatively impact our customers' ability to sell their products at previously forecasted prices resulting in reduced customer liquidity. Inadequate customer liquidity could affect our customers’ abilities to pay for our products and, therefore, affect existing and future sales or our ability to collect on customer receivables.
•Supply arrangements – Certain raw materials are critical to our production processes and our purchasing strategy and supply chain design are complex. Our supply chain and business operations could be disrupted from the temporary closure of third-party supplier and manufacturer facilities, interruptions in product supply or restrictions on the export or shipment of our products. We closely monitor raw material and supply chain costs. We source critical intermediates and finished products from a number of suppliers, largely outside of the U.S. and principally in China and India. There is considerable uncertainty surrounding the trade relationship between the U.S. and trading partners — e.g., the recently announced 10% tariff on goods coming into the U.S. from China, the recent announcement of reciprocal tariffs on goods imported into the U.S. to match tariffs imposed by other nations on goods imported from the U.S., and China’s recently announced tariffs on imports of certain U.S. goods. Such changes may adversely impact our business. Further, while we have made supply arrangements to meet planned operating requirements, an inability to obtain the critical raw materials or operate under contract manufacturing arrangements would adversely impact our ability to produce certain products and could lead to operational disruption and increase uncertainties around business performance. An inability to obtain these products or execute under contract sourcing arrangements would adversely impact our ability to sell products. Any disruption of our suppliers and contract manufacturers could impact our sales and operating results. In recent years, we have seen some logistics challenges, pointed supply chain shortages, and increased cost of goods due to disruptions in energy markets (such as that caused by the Russian war on Ukraine), inflation and tariffs (such as those discussed above).
Operational Risks:
•Global catastrophic events – A global catastrophic event (e.g., nuclear incident, pandemic, natural disaster) could endanger the lives and safety of our employees, limit market access, constrain supply and would require high levels of cross-functional coordination to maintain business continuity. If not properly managed, FMC could suffer substantial
financial losses should the event negatively impact our operations or those of our customers. Global catastrophic events could also result in social, economic, and labor instability in the countries in which we or our customers and suppliers operate. These uncertainties could have a material adverse effect on our business and our results of operation and financial condition. A widespread health crisis could adversely affect the global economy, resulting in an economic downturn that could impact demand for our products.
•Business disruptions – We produce products through a combination of owned facilities and contract manufacturers. We own and operate large-scale active ingredient manufacturing facilities in the U.S. (Mobile), Puerto Rico (Manati), China (Jinshan), Denmark (Ronland), and India (Panoli). Our operating results are dependent in part on the continued operation of these production facilities. Interruptions at these facilities may materially reduce the productivity of a particular manufacturing facility, or the profitability of our business as a whole. Although we take precautions to enhance the safety of our operations and minimize the risk of disruptions, our operations and those of our contract manufacturers are subject to hazards inherent in chemical manufacturing and the related storage and transportation of raw materials, products and waste. These potential hazards include explosions, fires, mechanical failure, unscheduled downtimes, supplier disruptions, labor shortages or other labor difficulties, information technology systems outages, disruption in our supply chain or manufacturing and distribution operations, transportation interruptions, chemical spills, discharges or releases of toxic or hazardous substances or gases, shipment of contaminated or off-specification product to customers, storage tank leaks, other environmental risks, cyberattacks, or other sudden disruption in business operations beyond our control as a result of events such as acts of sabotage, terrorism or war, civil or political unrest, severe weather and natural disasters, large scale power outages and public health epidemics and pandemics. Some of these hazards may cause severe damage to or destruction of property and equipment or personal injury and loss of life and may result in suspension of operations or the shutdown of affected facilities.
•Climate change and physical risk to operation sites – The acute and chronic effects of climate change such as rising sea levels, drought, flooding, hurricanes, excessive heat and general volatility in seasonal temperatures could adversely affect our operations globally. Extreme weather events attributable to climate change may result in, among other things, physical damage to our property and equipment, increased resource scarcity, including water, and interruptions to our supply chain. All of these items may have significant costs or capital expenditures.
•Litigation and environmental risks – Current reserves relating to our ongoing litigation and environmental liabilities may ultimately prove to be inadequate, which may have a material adverse impact on our results of operations. Products reviewed by regulators and labeled safe for use may still be challenged by others which could result in lawsuits or claims.
•Hazardous materials – We manufacture and transport certain materials that are inherently hazardous due to their toxic or volatile nature. While we take precautions to handle and transport these materials in a safe manner, if they are mishandled or released into the environment, they could cause property damage or result in personal injury claims against us.
•Environmental compliance – We are subject to extensive federal, state, local, and foreign environmental and safety laws, regulations, directives, rules and ordinances concerning, among other things, emissions in the air, discharges to land and water, and the generation, handling, treatment, disposal and remediation of hazardous waste and other materials. Governmental agencies may change requirements related to the production, use, emission, disposal or remediation of chemicals or products, including chemicals or products which we may have produced or used in our discontinued operations. We may face liability arising out of the normal course of business or now discontinued operations, including alleged personal injury or property damage due to exposure to chemicals or other hazardous substances at our current or former facilities or chemicals that we manufacture, handle or own. We take our environmental responsibilities very seriously, but there is a risk of environmental impact inherent in our manufacturing operations and transportation of chemicals. Any substantial liability for environmental damage could have a material adverse effect on our financial condition, results of operations and cash flows.
Portfolio Management Risks:
•Portfolio management risks – We continuously review our portfolio which includes the evaluation of potential business acquisitions that may strategically fit our business and strategic growth initiatives. If we are unable to successfully integrate and develop our acquired businesses, we could fail to achieve anticipated synergies including expected cost savings and revenue growth. Failure to achieve these anticipated synergies could materially and adversely affect our financial results. In addition to strategic acquisitions we evaluate the diversity of our portfolio in light of our objectives and alignment with our growth strategy, which may result in divestiture of underperforming or non-strategic assets. In implementing this strategy, we may not be successful and the gains or losses on the divestiture of, or lost operating income from, such assets may affect the Company’s earnings and debt levels. Moreover, we may incur asset impairment charges related to acquisitions or divestitures that negatively impact earnings and our financial position.
•Technological and new product discovery/development – Our ability to compete successfully depends in part upon our ability to maintain a superior technological capability and to continue to identify, develop and commercialize new and
innovative, high value-added products for existing and future customers. Our investment in the discovery and development of new pesticidal active ingredients relies on discovery of new chemical molecules, biological strains or formulations. Such discovery processes depend on our scientists being able to find new molecules, strains and formulations, which are novel and outside of patents held by others, and such molecules/strains/formulations being efficacious against target pests. Our process also depends on our ability to develop those molecules, strains and formulations into new products without creating an undue risk to human health and the environment as well as meeting applicable regulatory criteria. The timeline from active ingredient discovery through full development and product launch averages 8-10 years depending on local regulatory requirements; the complexity and duration of developing new products create risks that product concepts may fail during development or, when launched, may not meet then-current market needs or competitive conditions.
•Innovation and intellectual property – Our innovation efforts are protected by patents, trade secrets and other intellectual property rights that cover many of our current products, manufacturing processes, and product uses, as well as many aspects of our research and development activities supporting our new product pipeline. Trademarks protect valuable brands associated with our products. Patents and trademarks are granted by individual jurisdictions and the duration of our patents depends on their respective jurisdictions and payment of annuities. Our future performance will depend on our ability to address expiration of active ingredient composition of matter patents. We address patent expirations through effective enforcement of our patents that continue to cover key chemical intermediates and process patents, as well as portfolio life cycle management, particularly for our high value diamide insecticides for which our composition of matter patents on the active ingredient itself have expired in most countries and our process manufacturing and chemical intermediate patents only a limited remaining duration. (see "Patents, Trademarks and Licenses" in Item 1 for more details). Patent and trademark enforcement is subject to the risks inherent in litigation, and our product portfolio life cycle management efforts may not be effective in maintaining our products’ market position or profitability. If our innovation efforts fail to result in process improvements to reduce costs, such conditions could impede our competitive position. Some of our competitors may secure patents on production methods or uses of products that may limit our ability to compete cost-effectively.
•Enforcement of intellectual property rights – The composition of matter patents on our Rynaxypyr® and Cyazypyr® active ingredients have expired in all major markets. We have additional patents regarding the production of these diamide active ingredients and chemical intermediates involved in such production, which are expiring in many major markets in December 2025. For these diamide products, we also hold patents on certain formulations (including mixtures), trademark and data exclusivity protection in certain countries which have longer duration. Likewise, for other products in our commercial and development portfolios, we have a broad estate of intellectual property including patents, trademark and data protection. We intend to strategically and vigorously enforce our patents and other forms of intellectual property against suspected infringers and have done so already against several third parties. Other third parties may seek to enter markets with infringing products or may find alternative production methods that avoid infringement. We may not be successful in litigating to enforce our patents due to the risks inherent in any litigation. Patents involve complex factual and legal issues and, thus, the scope, validity or enforceability of any patent claims we have or may obtain cannot be clearly predicted. Patents may be challenged in the courts, as well as in various administrative proceedings before U.S. or foreign patent offices, and may be deemed unenforceable, invalidated or circumvented. We are currently and may in the future be a party to various lawsuits or administrative proceedings involving our patents. (See "Patents, Trademarks and Licenses" in Item 1). Such challenges can result in some or all of the claims of the asserted patent being invalidated or deemed unenforceable. As noted in Item 1 "Business," two such patents have been ruled invalid in China and are currently on appeal. In such circumstances, an adverse patent enforcement decision could lead to the entry of competing products in relevant markets and may result in a material adverse impact our financial results.
•ERP governance – We operate on a single global instance of SAP. Unmanaged or poorly managed system and hardware changes across the enterprise may disrupt operations, introduce vulnerabilities, and result in increased maintenance.
•Potential tax implications of FMC Lithium separation – We received an opinion from outside counsel to the effect that the spin-off of FMC Lithium as a distribution to our stockholders, completed in March 2019, qualified as a non-taxable transaction for U.S. federal income tax purposes. The opinion is based on certain assumptions and representations as to factual matters from both FMC and FMC Lithium, as well as certain covenants by those parties. The opinion cannot be relied upon if any of the assumptions, representations or covenants is incorrect, incomplete or inaccurate or is violated in any material respect. The opinion of counsel is not binding upon the IRS or the courts and there is no assurance that the IRS or a court will not take a contrary position. It is possible that the IRS or a state or local taxing authority could take the position that the aforementioned transaction results in the recognition of significant taxable gain by FMC, in which case FMC may be subject to material tax liabilities.
Financial Risks:
•Foreign exchange rate risks – We are an international company operating in many countries around the world, and thus face foreign exchange rate risks in the normal course of business. We are particularly sensitive to the movements of the Brazilian real, Chinese yuan, Indian rupee, Euro, Mexican peso and Argentine peso. While we engage in hedging and other strategies to mitigate these risks, unexpected severe changes in foreign exchange may create risks that could materially and adversely affect our expected performance.
•Income tax audits and uncertain tax rates – Our future effective tax rates may be materially impacted by numerous items such as: a future change in the composition of earnings from foreign and domestic tax jurisdictions, as earnings in foreign jurisdictions are typically taxed at different statutory rates than the U.S. federal statutory rate; accounting for uncertain tax positions; business combinations; expiration of statute of limitations or settlement of tax audits; changes in valuation allowance; changes in tax law; currency gains and losses; and decisions to repatriate certain future foreign earnings on which U.S. or foreign withholding taxes have not been previously accrued. Additionally, further administrative guidance or other changes to the Global Anti-Base Erosion (GLOBE) rules that cause changes in tax legislation issued by the Organization for Economic Cooperation and Development (“OECD”) could potentially impact certain tax benefits previously received. There is no guarantee that administrative guidance or rules will remain unchanged or that the US government will adopt the global tax rules in accordance with the OECD approach, either of which could impact the value of the incentives granted to us and which could potentially lead to significant future international tax disputes.
•Uncertain recoverability of investments in long-lived assets – We have significant investments in long-lived assets and continually review the carrying value of these assets for recoverability in light of changing market conditions and alternative product sourcing opportunities. We may recognize future impairments of long-lived assets, which could adversely affect our results of operations.
•Pension and postretirement plans – Our U.S. Qualified Plan has been fully funded for the last several years and as such, the primary investment strategy is a liability hedging approach with an objective of maintaining the funded status of the plan such that the funded status volatility is minimized and the likelihood that we will be required to make significant contributions to the plan is limited. The portfolio is comprised of 100 percent fixed income securities and cash. Our plan assets and obligation under our U.S. Qualified Plan is in excess of $1 billion. Additionally, obligations related to our pension and postretirement plans reflect certain assumptions. To the extent actual experience differs from these assumptions, our costs and funding obligations could increase or decrease significantly. While we provide other defined benefit, defined contribution and postretirement benefits to our employees and retirees, our risk is focused on our U.S. Qualified Plan given its size to our consolidated financial position.
General Risk Factors:
•Market access risk – Our results may be affected by changes in distribution channels, which could impact our ability to access the market. Consolidation of the value chain may limit FMC’s access in certain markets. Acquisition of retailers and wholesalers, particularly by competitors, could restrict FMC’s distribution footprint. Failure to adapt to similar trends in business to business and business to consumer could place FMC at a competitive disadvantage.
•Compliance with laws and regulations – The global regulatory environment is becoming increasingly complex and requires more resources to effectively manage, which may increase the potential for misunderstanding or misapplication of regulatory standards.
•Talent engagement and ethics/culture – The inability to recruit and retain key personnel, the unexpected loss of key personnel, or other external and internal factors and events could culminate in employee attrition and may adversely affect our operations. In addition, our future success depends in part on our ability to identify and develop talent to succeed senior management and other key members of the organization. We operate in markets where business ethics and local customs may differ from our company standards, increasing the risk of impropriety and regulatory enforcement. Significant effort will likely be required to ensure that the right mix of resources are trained, engaged and focused on achieving business objectives while adhering to our core values of safety, ethics and compliance.
•Economic and geopolitical change - Our business has been and could continue to be adversely affected by economic and political changes in the markets where we compete including: trade restrictions, tariff increases or potential new tariffs, foreign ownership restrictions and economic embargoes imposed by the U.S. or any of the foreign countries in which we do business; changes in laws, taxation, and regulations and the interpretation and application of these laws, taxes, and regulations; restrictions imposed by the U.S. government or foreign governments through exchange controls or taxation policy; nationalization or expropriation of property, undeveloped property rights, and legal systems or political instability; other governmental actions; inflation rates and inflationary pressures leading to higher input costs, recessions; and other external factors over which we have no control. While inflationary pressures have recently eased, a resurgence of these conditions may negatively impact our revenue, gross and operating margins, and net income. Economic and political conditions within the U.S. and foreign jurisdictions or strained relations between countries could result in fluctuations in demand, price volatility, loss of property, state sponsored cyberattacks, supply
disruptions, or other disruptions. An open conflict or war across any region significant to our business could result in plant closures, employee displacement, and an inability to obtain key supplies and materials. Current U.S. tariff policies may increase the costs of goods being imported into the U.S., and other nations may impose new or different tariffs or other trade sanctions that increase the cost of our importing into those other nations, which we may not be able to mitigate or avoid, leading to increased costs of materials and/or other trade disruptions. The current military conflict between Russia and Ukraine could disrupt or otherwise adversely impact our operations in Ukraine; and related sanctions, export controls or other actions that may be initiated by nations including the U.S., the European Union or Russia (e.g., potential cyberattacks, disruption of energy flows, etc.) could adversely affect our business and/or our supply chain, business partners or customers in other countries beyond Ukraine. In Argentina, continued inflation and foreign exchange controls could adversely affect our business. Losses may be incurred as a result of various government actions in the country such as the devaluation of the Argentine peso, changes in tax policies, and changes in capital controls/policies. Realignment of change in regional economic arrangements could have an operational impact on our businesses. Our enforcement of intellectual property rights in jurisdictions outside of the United States may be impacted by geopolitical tensions between the United States and those other countries. In China, unpredictable enforcement of environmental regulations could result in unanticipated shutdowns in broad geographic areas, impacting our contract manufacturers and raw material suppliers.
•Information technology security and data privacy risks – As with all enterprise information systems, our information technology systems and systems operated by our vendors and third parties could be penetrated by outside parties’ intent on observing or gathering information, extracting information, corrupting information, deploying ransomware, or disrupting business processes. Remote and other work arrangements may leave the Company more vulnerable to a cyberattack. Our systems and those of our vendors and third parties have in the past been, and will likely be in the future, subject to unauthorized access attempts. Implementing system updates or security patches in an untimely manner could leave our company exposed to security breaches. Unauthorized access to our networks or systems could disrupt our business operations and potentially result in failures or interruptions in our information systems, lockouts due to ransomware, or in the loss of assets and could have a material adverse effect on our business, financial condition or results of operations. We engage in response planning, simulations, trainings, tabletop exercises, and other efforts to mitigate risks associated with cybersecurity. Breaches of our security measures or the accidental loss, inadvertent disclosure, or unapproved dissemination of proprietary, sensitive, confidential or personal information about the Company, our employees, our vendors, or our customers, could result in litigation, violations of applicable data privacy regulations, and liability for the Company. We have not experienced a significant or material impact from these events to date and we may need to expend significant resources to maintain or continue to mature our protective and preventative measures to stay abreast of the ever-changing cybersecurity threat landscape. We maintain a multifaceted cybersecurity program designed to identify, protect, detect, respond, and recover from a cybersecurity event. We ensure that the program is aligned with the National Institute of Standards and Technology ("NIST") Cybersecurity Framework. While we have taken measures to assess the requirements of, and to comply with the rapidly growing cybersecurity and data privacy regulations in multiple jurisdictions, these measures may be challenged by authorities that regulate cybersecurity and privacy-related compliance. We could incur significant expense in facilitating and responding to investigations and if the measures we have taken prove to be inadequate, we could face fines or penalties. This could damage our reputation, or otherwise harm our business, financial condition, or results of operations.
•Access to debt and capital markets – We rely on cash generated from operations and external financing to fund our growth and working capital needs. Limitations on access to external financing could adversely affect our operating results. Moreover, interest payments, dividends and the expansion of our business or other business opportunities may require significant amounts of capital. We believe that our cash from operations and available borrowings under our revolving credit facility will be sufficient to meet these needs in the foreseeable future. However, if we need external financing, our access to credit markets and pricing of our capital will be dependent upon maintaining sufficient credit ratings from credit rating agencies and the state of the capital markets generally. There can be no assurances that we would be able to obtain equity or debt financing on terms we deem acceptable, and it is possible that the cost of any financings could increase significantly, thereby increasing our expenses and decreasing our net income. If we are unable to generate sufficient cash flow or raise adequate external financing, including as a result of significant disruptions in the global credit markets, we could be forced to restrict our operations and growth opportunities, which could adversely affect our operating results.
•Credit default risks – We may use our existing revolving credit facility, to the extent available, to meet our cash needs. In the event of a default in this credit facility or any of our senior notes, we could be required to immediately repay all outstanding borrowings and make cash deposits as collateral for all obligations the facility supports, which we may not be able to do. Any default under any of our credit arrangements could cause a default under many of our other credit agreements and debt instruments. Without waivers from lenders party to those agreements, any such default could have a material adverse effect on our ability to continue to operate.
•Exposure to global economic conditions – Deterioration in the global economy and worldwide credit and foreign exchange markets could adversely affect our business. A worsening of global or regional economic conditions or financial markets could adversely affect both our own and our customers' ability to meet the terms of sale or our suppliers' ability to perform all their commitments to us. A slowdown in economic growth in our international markets, or a deterioration of credit or foreign exchange markets could adversely affect customers, suppliers and our overall business there. Customers in weakened economies may be unable to purchase our products, or it could become more expensive for them to purchase imported products in their local currency, or sell their commodities at prevailing international prices, and we may be unable to collect receivables from such customers.
•Restructuring – In 2023, we implemented a global restructuring plan, which is referred to as “Project Focus,” designed to right-size our cost base and optimize our footprint and organizational structure with a focus on driving significant cost improvement and productivity in light of the precipitous drop in demand across the crop protection industry in 2023. While we have realized substantially all the expected synergies from the program, we may need to implement additional activities under the restructuring program to offset market headwinds and other risks should they negatively impact our results of operations. In addition, our failure to effectively manage organizational changes as part of the restructuring program may lead to increased attrition and harm our ability to attract and retain key talent.
•Channel inventory behavior – The Company relies in many countries and in varying degrees on distribution channels to access the market and reach farmers or other end use customers. An abrupt and widespread shift in purchasing behaviors (e.g., the current inventory destocking phenomenon) by channel partners and end use customers has and may continue to negatively and materially impact the Company’s volumes across important markets, which has adversely affected and may continue to adversely affect our results of operations. Such adverse effects could include but not be limited to materially reduced volumes purchased by customers, resulting in not only reduced sales, but also the Company bearing higher volumes of unsold product inventory, excess raw materials, and correspondingly increased carrying costs.
ITEM 1B. UNRESOLVED STAFF COMMENTS
None.
ITEM 1C. CYBERSECURITY
Cybersecurity Processes
As noted in Item 1A. Risk Factors, FMC recognizes that the threat of cybersecurity breaches may create significant risks for the Company. Accordingly, we are committed to an ongoing and comprehensive program to protect all company data, as well as data in our supply chain, from these threats. Our cybersecurity program includes governance defined by IT policies and standards and a robust IT risk management program. FMC uses several tools and controls to manage IT risk including, but not limited to, controls for the management of privileged access, anti-malware tools, required trainings for employees including an annual training module, simulated email phishing attacks, and other email security tools to detect and prevent intrusions as well as monitor threats. FMC employees have access to formal IT policies that define and clarify expected behaviors with respect to IT resources in various areas. The Company has a Cyber Incident Response Plan, which establishes procedures to prepare for and respond to a variety of cyber incidents, and engages in response planning, simulations, trainings, tabletop exercises, and other efforts to mitigate risk and prepare for a rapid response to any incidents should they occur. FMC performs a thorough security review prior to onboarding critical third-party providers, which includes review of third-party independent assessments in the form of SOC reports prior to contracting. SOC reports are also reviewed on an annual basis once the third-party is engaged. Additionally, our contracts with third-party providers require those organizations to notify FMC of any cyber incident that occurs when our information has been impacted.
Periodically, the Company has its cybersecurity programs audited by independent third parties using the NIST Cybersecurity Framework, which provides guidance to organizations on how to identify, prevent, detect, respond, and recover from cybersecurity threats.
Management Oversight in Cybersecurity Governance
FMC’s senior management Executive Committee and Leadership Team, which includes the Chief Executive Officer and all Company vice presidents, is responsible for review and oversight of the Company’s cybersecurity programs and risk assessment as well as the strategic direction of the program to address evolving risks. Specifically, Jas Sidhu, Senior Director - Core IT, serves as management’s expert in cybersecurity management. He has held various positions within the Company's IT department, has an educational background in Information Systems, and contributes technical expertise to the Company’s leadership team. He serves as a member of the Chemical Information Technology Center’s CIO organization and the SAP Chemicals Advisory Board. Mr. Sidhu also belongs to various business associations, including industry and government associations, to ensure timely receipt of critical threat information as well as access resources useful in developing cost-effective security solutions to protect the Company's personnel and information. Additionally, Andrew Sandifer, Executive Vice President and Chief Financial Officer, has completed continuing professional education courses covering the role of management and the board of directors in cybersecurity governance. Members of the management team are encouraged to engage in education opportunities related to cybersecurity.
FMC has established a process to assess the nature, scope and timing of a cyber incident and communicate the facts of the incident to management and the board of directors and, if needed, investors. In the event of a cybersecurity incident, the incident response team, which is managed by IT personnel, is responsible for ensuring the Chief Executive Officer and other members of the Executive Committee and Leadership Team are notified in a timely manner. For any cybersecurity incident, there will be a cross-functional review, including the IT, legal, and finance teams, to evaluate qualitative and quantitative factors related to the incident to determine if the impact of the event is material. Individuals from other departments may be involved in this review depending on the facts and circumstances of the incident. These individuals will be responsible for responding to the event and monitoring the impacts on the Company’s operations, financial position, and results of operations. This team will also evaluate cyber incidents in the aggregate if related events occur. During the response and recovery related to a cyber incident, this team will meet daily or weekly depending on the severity of the event and continuously evaluate the nature, scope, and timing of the event. Members of the senior management, including the Chief Financial Officer, Chief Accounting Officer, and General Counsel, as well as the Senior Director - Core IT will be briefed as to the facts and circumstances of a cyber incident and determine if the event is considered material to the business. If such determination is made, the matter will be escalated to Board of Directors. For material incidents, the Company will provide information regarding the nature and scope of the incident to investors in compliance with SEC regulations. Throughout this process and the recovery following an incident, the Company is focused on considering the ever-changing facts and circumstances of the event and remaining as transparent with the investment community as possible.
During 2024, FMC did not directly experience a cybersecurity breach in any FMC system. During 2024, we did receive notification of cybersecurity breaches affecting third-party vendors, but none were material in nature for FMC.
Board of Directors Oversight in Cybersecurity Governance
FMC’s Board of Directors oversees the Company’s cybersecurity program primarily through its Audit Committee, which is comprised of independent directors whose prior work experience provides them with insights as to potential cybersecurity risks and mitigation strategies. Company executives along with external and internal cybersecurity experts update the Audit Committee at least quarterly on risks related to cybersecurity and the steps taken to monitor and control risk exposure. Additionally, the results of periodic audits performed on the Company’s cybersecurity programs, described above, are communicated to the Audit Committee upon completion.
In addition to the routine updates provided to the Audit Committee, FMC has an established policy for communication of cybersecurity incidents with the Board of Directors and, if material, the investor community. Refer to the discussion above for further details of this policy.
ITEM 2. PROPERTIES
FMC leases executive offices in Philadelphia, Pennsylvania and operates 21 manufacturing facilities in 15 countries. Our major research and development facilities are in Newark, Delaware; Shanghai, China and Copenhagen, Denmark.
We believe our facilities are in good operating condition. The number and location of our owned or leased production properties for continuing operations are as follows:
| | | | | | | | | | | | | | | | | | | | | | | | | | | | | |
| North America | | Latin America | | Europe, Middle East and Africa | | Asia | | Total |
| | | | | | | | | |
| | | | | | | | | |
| Total | 5 | | 1 | | 6 | | 9 | | 21 |
ITEM 3. LEGAL PROCEEDINGS
As of December 31, 2024, there were approximately 11,683 premises and product asbestos claims pending against FMC in several jurisdictions. Since the 1980s, approximately 123,000 asbestos claims against FMC have been discharged, the overwhelming majority of which have been dismissed without any payment to the claimant. Since the 1980s, settlements with claimants have totaled approximately $230 million. For a description of pending asbestos cases as well as our other material pending legal proceedings, please see Note 1 "Principal Accounting Policies and Related Financial Information" - Environmental obligations, Note 10 "Environmental Obligations" and Note 19 "Guarantees, Commitments and Contingencies" in the notes to our consolidated financial statements included in this Form 10-K, the content of which are incorporated by reference to this Item 3.
ITEM 4. MINE SAFETY DISCLOSURES
Not Applicable.
ITEM 4A. INFORMATION ABOUT OUR EXECUTIVE OFFICERS
The executive officers of FMC Corporation, the offices they currently hold, their previous business experience and their ages as of December 31, 2024, are as follows.
| | | | | | | | | | | | | | |
| Name | | Age | | Office and year of election |
| Pierre R. Brondeau | | 67 | | Chief Executive Officer (24-present, 10-20); Chairman of the Board (10-present); Executive Chairman of the Board (20-21); President (10-18); President and Chief Executive Officer of Dow Advanced Materials, a specialty materials company (08-09); President and Chief Operating Officer of Rohm and Haas Company, a predecessor of Dow Advanced Materials (07-08); Board Member, T.E. Connectivity Electronics (07-21); Board Member, American Chemistry Council (17-22); Board Trustee, Franklin Institute (17-20), Board Member, Livent Corporation (18-24) |
| Ronaldo Pereira | | 52 | | President (24-present); Executive Vice President and President, FMC Americas (21-24); President, FMC Americas (19-21); Vice President, FMC LATAM (17-19); General Director, Brazil (16); Regional Head Brazil, Rotam (14-15); various Director positions, FMC Corporation (06-14) |
| Andrew D. Sandifer | | 55 | | Executive Vice President and Chief Financial Officer (18-present); Vice President and Treasurer (16-18); Vice President, Corporate Transformation (14-16); Vice President, Strategic Development (10–14); Board Member, Philabundance (14-22); Board Trustee, Germantown Academy (17-present); Board Member, Koppers Holdings Inc. (23-present) |
| Brian P. Angeli | | 48 | | Executive Vice President and Chief Marketing Officer (24-Present), Vice President, Corporate Strategy and Precision Agriculture (20-24); Vice President, Corporate Strategy and Treasurer (18-20); Vice President, Corporate Strategy and Transformation Officer (17-18); Vice President, Investor Relations (15-17); Vice President, Corporate Development (14-15) |
| Thaisa Hugenneyer | | 45 | | Executive Vice President, Integrated Supply Chain (24-present); Chief Sustainability Officer (25-present); Vice President, Procurement, Logistics and Global Facilities (21-24); Board Member, Philadelphia Chamber of Commerce (24-present) |
| Michael F. Reilly | | 61 | | Executive Vice President, General Counsel, Chief Compliance Officer and Secretary (19-present); Vice President, Associate General Counsel and Chief Compliance Officer (16-19); Associate General Counsel (13-16) |
| Vsevolod Rostovtsev | | 50 | | Executive Vice President, Chief Technology Officer (24-present); Vice President, Chief Technology Officer (23-24); Director of Discovery Chemistry for Agricultural Solutions (17-23); Various research and technical leadership roles at DuPont (12-17) |
| Jacqueline Scanlan | | 52 | | Executive Vice President, Chief Human Resources Officer (23-present); Senior Vice President, CHRO, Axalta (21-23); Senior Vice President, CHRO, Haemonetics (17-21); Corporate Vice President, Novo Nordisk (14-16); Vice President, Campbell Soup Company (07-14) |
All officers are elected to hold office for one year or until their successors are elected and qualified. No family relationships exist among any of the above-listed officers, and there are no arrangements or understandings between any of the above-listed officers and any other person pursuant to which they serve as an officer. The above-listed officers have not been involved in any legal proceedings during the past ten years of a nature for which the SEC requires disclosure that are material to an evaluation of the ability or integrity of any such officer.
PART II
ITEM 5. MARKET FOR THE REGISTRANT'S COMMON EQUITY, RELATED STOCKHOLDERS MATTERS AND ISSUER PURCHASES OF EQUITY SECURITIES
FMC common stock of $0.10 par value is traded on the New York Stock Exchange (Symbol: FMC). There were 2,028 registered common stockholders as of December 31, 2024.
FMC’s annual meeting of stockholders will be held at 2:00 p.m. on Tuesday, April 29, 2025 via live webcast at https://www.virtualshareholdermeeting.com/FMC2025. Notice of the meeting, together with instructions on how to access proxy materials, will be mailed approximately six weeks prior to the meeting to stockholders of record as of February 28, 2025.
Transfer Agent and Registrar of Stock:
| | | | | | | | |
| EQ Shareowner Services | | |
| 1110 Centre Pointe Curve, Suite 101 | or | P.O. Box 64874 |
| Mendota Heights, MN 55120-4100 | St. Paul, MN 55164-0874 |
| | |
| Phone: 1-800-468-9716 | | |
| (651-450-4064 local and outside the U.S.) | | |
| https://equiniti.com/us/ |
Stockholder Return Performance Presentation
The graph that follows shall not be deemed to be incorporated by reference into any filing made by FMC under the Securities Act of 1933 or the Securities Exchange Act of 1934.
The following Stockholder Performance Graph compares the five-year cumulative total return on FMC’s Common Stock with the S&P 500 Index and the S&P 500 Chemicals Index. The comparison assumes $100 was invested on December 31, 2019, in FMC’s Common Stock and in both of the indices, and the reinvestment of all dividends.
| | | | | | | | | | | | | | | | | | | | | | | | | | | | | | | | | | | |
| 2019 | | 2020 | | 2021 | | 2022 | | 2023 | | 2024 |
| FMC Corporation | $ | 100.00 | | | $ | 116.90 | | | $ | 113.73 | | | $ | 131.35 | | | $ | 68.80 | | | $ | 55.58 | |
| S&P 500 Index | 100.00 | | | 118.08 | | | 151.74 | | | 124.39 | | | 156.83 | | | 195.84 | |
| S&P 500 Chemicals Index | 100.00 | | | 117.58 | | | 147.78 | | | 131.41 | | | 145.76 | | | 145.72 | |
The following table summarizes information with respect to the purchase of our common stock during the three months ended December 31, 2024:
ISSUER PURCHASES OF EQUITY SECURITIES
| | | | | | | | | | | | | | | | | | | | | | | | | | | | | |
| | | | | | Publicly Announced Program |
| Period | Total Number of Shares Purchased (1) | | Average Price Paid Per Share | | Total Number of Shares Purchased | | Total Dollar Amount Purchased | | Maximum Dollar Value of Shares that May Yet be Purchased |
| October | 635 | | | $ | 62.33 | | | — | | | $ | — | | | $ | 825,000,142 | |
| November | 1,401 | | | 56.65 | | | — | | | — | | | 825,000,142 | |
| December | 935 | | | 49.96 | | | — | | | — | | | 825,000,142 | |
| Total | 2,971 | | | $ | 55.76 | | | — | | | $ | — | | | |
___________________
(1) Includes shares purchased in open market transactions by the independent trustee of the FMC Corporation Non-Qualified Savings and Investment Plan ("NQSP").
In February 2022, the Board of Directors authorized the repurchase of up to $1 billion of the Company's common stock. In connection with an amendment to the Company's credit agreement in November 2023, the Company agreed that it will not repurchase shares, with the exception of share repurchases under our equity compensation plans. Therefore, there were no share repurchases under the publicly announced repurchase program during the twelve months ended December 31, 2024. As part of the amendments entered into in February 2025 and described in Note 12 to the consolidated financial statements, the Company agreed that it will not repurchase shares until December 31, 2027. At December 31, 2024, approximately $825 million remained unused under our Board-authorized repurchase program. This repurchase program does not include a specific timetable or price targets and may be suspended or terminated at any time. Shares may be purchased through open market or privately negotiated transactions at the discretion of management based on its evaluation of market conditions and other factors. We also reacquire shares from time to time from employees in connection with the vesting, exercise and forfeiture of awards under our equity compensation plans. In addition, the independent trustee of our non-qualified deferred compensation plan reacquires shares from time to time through open-market purchases relating to investments by employees in our common stock, one of the investment options available under the Plan.
ITEM 6. [RESERVED]
ITEM 7. MANAGEMENT'S DISCUSSION AND ANALYSIS OF FINANCIAL CONDITION AND RESULTS OF OPERATIONS
Overview
FMC Corporation is a global agricultural sciences company dedicated to helping growers produce food, feed, fiber and fuel for an expanding world population while adapting to a changing environment. We operate in a single distinct business segment. We develop, market and sell all three major classes of crop protection chemicals (insecticides, herbicides and fungicides) as well as biologicals, crop nutrition, and seed treatment products, which we group as plant health. FMC’s innovative crop protection solutions enable growers, crop advisers and turf and pest management professionals to address their toughest challenges economically without compromising safety or the environment. FMC is committed to discovering new insecticide, herbicide, and fungicide active ingredients, product formulations and pioneering technologies that are consistently better for the planet.
FORWARD-LOOKING INFORMATION
Statement under the Safe Harbor Provisions of the Private Securities Litigation Reform Act of 1995: FMC and its representatives may from time to time make written or oral statements that are "forward-looking" and provide other than historical information, including statements contained herein, in FMC’s other filings with the SEC, and in reports or letters to FMC stockholders.
In some cases, FMC has identified forward-looking statements by such words or phrases as "will likely result," "is confident that," "expect," "expects," "should," "could," "may," "will continue to," "believe," "believes," "anticipates," "predicts," "forecasts," "estimates," "projects," "potential," "intends" or similar expressions identifying "forward-looking statements" within the meaning of the Private Securities Litigation Reform Act of 1995, including the negative of those words and phrases. Such forward-looking statements are based on management’s current views and assumptions regarding future events, future business conditions and the outlook for the company based on currently available information. These statements involve known and unknown risks, uncertainties and other factors that may cause actual results to be materially different from any results, levels of activity, performance or achievements expressed or implied by any forward-looking statement. Additional factors include, among other things, the risk factors and other cautionary statements filed with the SEC included within this Form 10-K as well as other SEC filings and public communications. FMC cautions readers not to place undue reliance on any such forward-looking statements, which speak only as of the date made. Forward-looking statements are qualified in their entirety by the above cautionary statement. FMC undertakes no obligation, and specifically disclaims any duty, to update or revise any forward-looking statements to reflect events or circumstances arising after the date of such statements or to reflect the occurrence of anticipated events, except as otherwise required by law.
2024 Highlights
The following are the more significant developments in our businesses during the year ended December 31, 2024:
•In response to the unprecedented downturn in the global crop protection market during 2023, we initiated a global restructuring plan, referred to as "Project Focus," in November 2023 designed to right-size our cost base and optimize our footprint and organizational structure with a focus on driving significant cost improvement and productivity. Refer to the section titled "Results of Operations" for further discussion of the program. •Revenue of $4,246.1 million in 2024 decreased $240.7 million or approximately 5 percent versus last year. Demand began to improve during the second quarter of 2024 resulting in improved sales volumes year over year. Price and foreign currency headwinds more than offset volume improvement during the year. On a regional basis, sales in Latin America decreased by 1 percent, sales in North America decreased 3 percent, sales in Europe, Middle East and Africa decreased by 7 percent, and sales in Asia decreased 14 percent. A more detailed review of revenues is included under the section entitled "Results of Operations". •Our gross margin of $1,648.9 million decreased versus the prior year gross margin of $1,831.0 million. The decrease in gross margin of $182.1 million or approximately 10 percent was primarily the result of lower pricing in all regions partially offset by favorable cost and volume improvement. Gross margin as a percent of revenue of 38.8 percent decreased compared to gross margin of 40.8 percent in the prior year period driven by higher unabsorbed fixed costs during the period as well as registration removals.
•Selling, general and administrative expenses decreased from $734.3 million to $644.6 million, or approximately 12 percent. Research and development expenses of $278.0 million decreased $50.8 million or 15 percent. The decreases in both selling, general and administrative expenses and research and development costs are primarily due to cost reduction measures implemented in connection with our Project Focus initiative. Reductions in research and development spending were done without sacrificing investments in areas such as Plant Health and our new active ingredient pipeline.
•Net income (loss) attributable to FMC stockholders of $341.1 million decreased $980.4 million from $1,321.5 million in the prior year period. As discussed further under the section titled "Results of Operations", the change in the provision (benefit) for income taxes was the primary driver of the decrease in net income (loss) attributable to FMC stockholders. Prior year results include the recognition of significant one-time tax benefits related to tax incentives granted to the Company's Swiss subsidiaries as well as the release of our FMC Brazil valuation allowance due to new tax laws enacted in the country. We also recorded higher valuation allowances on the tax benefits associated with our Swiss subsidiaries during the fourth quarter of 2024. Additionally, lower gross margin, as discussed above, negatively impacted our results for the period. During the period, we realized savings associated with the cost reduction measures implemented in connection with our Project Focus initiative contributing to a decrease in selling, general and administrative expenses and research and development costs as discussed above. Adjusted after-tax earnings from continuing operations attributable to FMC stockholders of $436.3 million decreased $38.2 million or approximately 8 percent. See the disclosure of our adjusted earnings Non-GAAP financial measurement under the section titled "Results of Operations".
2025 Outlook
We expect 2025 revenue will be in the range of approximately $4.15 billion to $4.35 billion, essentially flat at the midpoint versus 2024 and an increase of 3 percent excluding the impact of approximately $110 million in sales from the prior year due to the divestiture of the GSS business. Volume is expected to improve as increases in growth platforms are expected to more than offset weaker demand in the channel as customers in many countries prioritize holding lower than historical inventory. Price is expected to decline in the mid-single digits almost entirely driven by certain contract adjustments to diamide partners to account for lower manufacturing costs. Foreign currency impacts are expected to be a low-single digit headwind. We expect adjusted EBITDA(1) of $870 million to $950 million, an increase of 1 percent at the midpoint versus 2024 results and up 4 percent after excluding the impact of the loss of approximately $25 million in EBITDA from the prior year due to the divestiture of the GSS business. Favorable costs and a modest volume gain are expected to be mostly offset lower price, foreign currency headwinds, and increases in selling costs as the Company invests in new routes to market. 2025 adjusted earnings are expected to be in the range of $3.26 to $3.70 per diluted share(1), essentially flat at the midpoint versus 2024. The estimate for adjusted earnings excludes any impact from potential share repurchases in 2025. For cash flow outlook, refer to the liquidity and capital resources section below.
(1)Although we provide forecasts for adjusted earnings per diluted share and adjusted EBITDA (Non-GAAP financial measures), we are not able to forecast the most directly comparable measures calculated and presented in accordance with U.S. GAAP. Certain elements of the composition of the U.S. GAAP amounts are not predictable, making it impractical for us to forecast. Such elements include, but are not limited to, restructuring, acquisition charges, and discontinued operations. As a result, no U.S. GAAP outlook is provided.
Results of Operations — 2024, 2023 and 2022
Overview
The following charts provide a reconciliation of adjusted EBITDA, adjusted earnings, organic revenue growth and return on invested capital ("ROIC"), all of which are Non-GAAP financial measures, from the most directly comparable GAAP measure. Adjusted EBITDA and organic revenue are provided to assist the readers of our financial statements with useful information regarding our operating results. Our operating results are presented based on how we assess operating performance and internally report financial information. For management purposes, we report operating performance based on earnings before interest, income taxes, depreciation and amortization, discontinued operations, and corporate special charges. Our adjusted earnings measure excludes corporate special charges, net of income taxes, discontinued operations attributable to FMC stockholders, net of income taxes, and certain Non-GAAP tax adjustments. These are excluded by us in the measure we use to evaluate business performance and determine certain performance-based compensation. Organic revenue growth excludes the impacts of foreign currency changes, which we believe is a meaningful metric to evaluate our revenue changes. These items are discussed in detail within the "Other Results of Operations" section that follows. In addition to providing useful information about our operating results to investors, we also believe that excluding the effect of corporate special charges, net of income taxes, and certain Non-GAAP tax adjustments from operating results and discontinued operations allows management and investors to compare more easily the financial performance of our underlying business from period to period. These measures should not be considered as substitutes for net income (loss) or other measures of performance or liquidity reported in accordance with U.S. GAAP.
| | | | | | | | | | | | | | | | | |
| (in Millions) | Year Ended December 31, |
| 2024 | | 2023 | | 2022 |
| Revenue | $ | 4,246.1 | | | $ | 4,486.8 | | | $ | 5,802.3 | |
| Costs and Expenses | | | | | |
| Costs of sales and services | 2,597.2 | | | 2,655.8 | | | 3,475.5 | |
| Gross Margin | $ | 1,648.9 | | | $ | 1,831.0 | | | $ | 2,326.8 | |
| Selling, general and administrative expenses | 644.6 | | | 734.3 | | | 775.2 | |
| Research and development expenses | 278.0 | | | 328.8 | | | 314.2 | |
| Restructuring and other charges (income) | 219.8 | | | 212.3 | | | 93.1 | |
| | | | | |
| Total costs and expenses | $ | 3,739.6 | | | $ | 3,931.2 | | | $ | 4,658.0 | |
Income from continuing operations before non-operating pension and postretirement charges (income), interest expense, net and income taxes (1) | $ | 506.5 | | | $ | 555.6 | | | $ | 1,144.3 | |
| | | | | |
| Non-operating pension and postretirement charges (income) | 18.2 | | | 18.2 | | | 8.6 | |
| | | | | |
| Interest expense, net | 235.8 | | | 237.2 | | | 151.8 | |
| Income (loss) from continuing operations before income taxes | $ | 252.5 | | | $ | 300.2 | | | $ | 983.9 | |
| Provision (benefit) for income taxes | (150.9) | | | (1,119.3) | | | 145.2 | |
| Income (loss) from continuing operations | $ | 403.4 | | | $ | 1,419.5 | | | $ | 838.7 | |
| Discontinued operations, net of income taxes | (61.8) | | | (98.5) | | | (97.2) | |
| Net income (loss) (GAAP) | $ | 341.6 | | | $ | 1,321.0 | | | $ | 741.5 | |
| Adjustments to arrive at Adjusted EBITDA (Non-GAAP): | | | | | |
| Corporate special charges (income): | | | | | |
Restructuring and other charges (income) (3) | $ | 219.8 | | | $ | 238.1 | | | $ | 93.1 | |
Non-operating pension and postretirement charges (income) (4) | 18.2 | | | 18.2 | | | 8.6 | |
| | | | | |
| Discontinued operations, net of income taxes | 61.8 | | | 98.5 | | | 97.2 | |
| Interest expense, net | 235.8 | | | 237.2 | | | 151.8 | |
| Depreciation and amortization | 176.3 | | | 184.3 | | | 169.4 | |
| Provision (benefit) for income taxes | (150.9) | | | (1,119.3) | | | 145.2 | |
Adjusted EBITDA (Non-GAAP) (2) | $ | 902.6 | | | $ | 978.0 | | | $ | 1,406.8 | |
____________________
(1)Referred to as operating profit.
(2)Adjusted EBITDA is defined as operating profit excluding corporate special charges (income) and depreciation and amortization expense.
(3)See Note 7 to the consolidated financial statements included within this Form 10-K for details of restructuring and other charges (income).
(4)Our non-operating pension and postretirement charges (income) are defined as those costs (benefits) related to interest, expected return on plan assets, amortized actuarial gains and losses and the impacts of any plan curtailments or settlements. These are excluded from our operating results and are primarily related to changes in pension plan assets and liabilities which are tied to financial market performance and we consider these costs to be outside our operational performance. We continue to include the service cost and amortization of prior service cost in our operating results noted above. These elements reflect the current year operating costs to our business for the employment benefits provided to active employees.
ADJUSTED EARNINGS RECONCILIATION
| | | | | | | | | | | | | | | | | |
| (in Millions, except per share amounts) | Year Ended December 31, |
| 2024 | | 2023 | | 2022 |
| Net income (loss) attributable to FMC stockholders (GAAP) | $ | 341.1 | | | $ | 1,321.5 | | | $ | 736.5 | |
Corporate special charges (income), pre-tax (1) | 238.0 | | | 256.3 | | | 101.7 | |
Income tax expense (benefit) on Corporate special charges (income) (2) | (37.1) | | | (32.8) | | | 1.5 | |
| Corporate special charges (income), net of income taxes | $ | 200.9 | | | $ | 223.5 | | | $ | 103.2 | |
| Adjustment for noncontrolling interest, net of tax on Corporate special charges (income) | — | | | (1.6) | | | 6.8 | |
| Discontinued operations attributable to FMC Stockholders, net of income taxes | 61.8 | | | 98.5 | | | 97.2 | |
Non-GAAP tax adjustments (3) | (167.5) | | | (1,167.4) | | | (5.3) | |
| Adjusted after-tax earnings from continuing operations attributable to FMC stockholders (Non-GAAP) | $ | 436.3 | | | $ | 474.5 | | | $ | 938.4 | |
| | | | | |
| Diluted earnings per common share (GAAP) | $ | 2.72 | | | $ | 10.53 | | | $ | 5.81 | |
| Corporate special charges (income), pre-tax per diluted share | 1.90 | | | 2.05 | | | 0.81 | |
| Income tax expense (benefit) on Corporate special charges (income) per diluted share | (0.30) | | | (0.26) | | | 0.01 | |
| Corporate special charges (income), net of income taxes per diluted share | $ | 4.32 | | | $ | 12.32 | | | $ | 6.63 | |
| Adjustment for noncontrolling interest, net of tax on Corporate special charges (income) per diluted share | — | | | (0.02) | | | 0.05 | |
| Discontinued operations attributable to FMC stockholders, net of income taxes per diluted share | 0.49 | | | 0.78 | | | 0.77 | |
| Tax adjustments per diluted share | (1.33) | | | (9.30) | | | (0.04) | |
| Adjusted after-tax earnings from continuing operations attributable to FMC stockholders per diluted share (Non-GAAP) | $ | 3.48 | | | $ | 3.78 | | | $ | 7.41 | |
| | | | | |
| Average number of shares outstanding used in the adjusted after-tax earnings from continuing operations per diluted share computations | 125.4 | | 125.5 | | 126.7 |
____________________
(1)Represents restructuring and other charges (income), and non-operating pension and postretirement charges (income).
(2)The income tax expense (benefit) on Corporate special charges (income) is determined using the applicable rates in the taxing jurisdictions in which the Corporate special charge or income occurred and includes both current and deferred income tax expense (benefit) based on the nature of the Non-GAAP performance measure.
(3)We exclude the GAAP tax provision, including discrete items, from the Non-GAAP measure of income, and instead include a Non-GAAP tax provision based upon the annual Non-GAAP effective tax rate. The GAAP tax provision includes, and the Non-GAAP tax provision excludes, certain discrete tax items including, but not limited to: income tax expenses or benefits that are not related to current year ongoing business operations; tax adjustments associated with fluctuations in foreign currency remeasurement of certain foreign operations; certain changes in estimates of tax matters related to prior fiscal years; certain changes in the realizability of deferred tax assets; and changes in tax law. Management believes excluding these discrete tax items assists investors and securities analysts in understanding the tax provision and the effective tax rate related to ongoing operations thereby providing investors with useful supplemental information about FMC's operational performance. Refer to the explanation below on the provision for income taxes for further detail of the non-GAAP tax adjustments for the twelve months ended December 31, 2024.
ORGANIC REVENUE GROWTH RECONCILIATION
| | | | | |
| Twelve Months Ended December 31, 2024 vs. 2023 |
| Total Revenue Change (GAAP) | (5) | % |
| Less: Foreign Currency Impact | (2) | % |
| Organic Revenue Change (Non-GAAP) | (3) | % |
| |
RECONCILIATION OF NET INCOME (LOSS) ATTRIBUTABLE TO
FMC STOCKHOLDERS (GAAP) TO RETURN ON INVESTED CAPITAL ("ROIC")
NUMERATOR (NON-GAAP) AND ADJUSTED ROIC (USING NON-GAAP NUMERATOR)
We believe Adjusted ROIC provides management and investors with useful supplemental information regarding our utilization of capital provided by both equity and debt as well as our working capital and free cash flow management. Additionally, vesting of certain restricted stock awards granted to officers is connected to Adjusted ROIC as a performance metric.
| | | | | | | | | | | |
| Twelve Months Ended | | |
| December 31, 2024 | | |
Net income (loss) attributable to FMC stockholders (GAAP) | $ | 341.1 | | | |
| Interest expense, net, net of income taxes | 210.1 | | | |
| Corporate special charges (income) | 238.0 | | | |
| Income tax expense (benefit) on Corporate special charges (income) | (37.1) | | | |
| Discontinued operations attributable to FMC stockholders, net of income taxes | 61.8 | | | |
| Tax adjustments | (167.5) | | | |
| ROIC numerator (Non-GAAP) | $ | 646.4 | | | |
| | | |
| December 31, 2024 | | December 31, 2023 |
| Total debt | $ | 3,365.3 | | | $ | 3,957.6 | |
| Total FMC stockholders’ equity | 4,487.5 | | | 4,410.9 | |
Total debt and FMC stockholders' equity (GAAP) | $ | 7,852.8 | | | $ | 8,368.5 | |
| ROIC denominator (2 yr average total debt and FMC stockholders' equity) | $ | 8,110.7 | | | |
ROIC (using Net income (loss) attributable to FMC stockholders (GAAP) as numerator) | 4.21 | % | | |
| Adjusted ROIC (using Non-GAAP numerator) | 7.97 | % | | |
Results of Operations
In the discussion below, all comparisons are between the periods unless otherwise noted.
Revenue
2024 vs. 2023
Revenue of $4,246.1 million decreased $240.7 million, or approximately 5 percent versus the prior year period. Volume improved as the year progressed and resulted in a 3 percent increase in revenue year over year. Price and foreign currency impacts were headwinds during the period of 6 percent and 2 percent, respectively. Higher volume was driven by the Company’s growth portfolio, and particularly the new active ingredients Isoflex™ and fluindapyr.
2023 vs. 2022
Revenue of $4,486.8 million decreased $1,315.5 million, or approximately 23 percent versus the prior year period. The decrease was primarily driven by a 22 percent decrease from volumes, which were down across all four regions due to the channel destocking by growers and the distribution channel. The decrease in revenues was also due to an unfavorable foreign currency impact of approximately 1 percent.
See below for a discussion of revenue by region.
| | | | | | | | | | | | | | | | | |
| Total Revenue by Region |
| Year Ended December 31, |
| (in Millions) | 2024 | | 2023 | | 2022 |
| North America | $ | 1,173.4 | | | $ | 1,204.8 | | | $ | 1,435.8 | |
| Latin America | 1,389.5 | | | 1,401.1 | | | 2,088.2 | |
| Europe, Middle East and Africa (EMEA) | 834.8 | | | 899.2 | | | 1,039.7 | |
| Asia | 848.4 | | | 981.7 | | | 1,238.6 | |
| Total Revenue | $ | 4,246.1 | | | $ | 4,486.8 | | | $ | 5,802.3 | |
2024 vs. 2023
North America: Revenue decreased approximately 3 percent in the year ended December 31, 2024 due to a significant decline in volumes during the first quarter as a result of continued pressure from channel destocking behavior. Volume recovery as a result of improved inventory levels in the channel during the following quarters partially offset the decrease in the first quarter. Unfavorable pricing actions also contributed to the decrease in the revenue during the period. Strong growth in fungicides, particularly from flutriafol and fluindapyr products, positively impacted sales in the region.
Latin America: Revenue decreased approximately 1 percent for the year ended December 31, 2024 compared to the prior year period. Organically, revenue increased approximately 5 percent driven by volume growth primarily related to branded diamides and Onsuva®, a fluindapyr-based fungicide. The volume growth was partially offset by unfavorable impacts from pricing actions, primarily in Brazil, during the period, which were caused by competitive pressure as demand returned as well as one-time customer incentives, offered primarily during the second quarter, aimed at addressing high cost inventory in the channel.
EMEA: Revenue decreased approximately 7 percent, or approximately 4 percent organically, versus the prior year period. Branded Cyazypyr® products contributed to volume growth in the region that partially offset the impact of registration removals and the rationalization of some lower margin products.
Asia: Revenue decreased approximately 14 percent, or approximately 12 percent organically, versus the prior year period caused by lower volumes, primarily due to ongoing destocking behavior, specifically in India. Pricing pressure caused by competitive pressure was an additional headwind in the region.
For 2025, full-year revenue is expected to be in the range of approximately $4.15 billion to $4.35 billion, which is essentially flat at the midpoint versus 2024 and an increase of 3 percent excluding the impact of approximately $110 million in sales from the prior year due to the divestiture of the GSS business.
2023 vs. 2022
North America: Revenue decreased approximately 16 percent in the year ended December 31, 2023. The significant decrease in volumes period over period was due to the channel destocking by growers and the distribution channel. The decrease in volumes was partially offset by improved product mix in the region due to new branded products launched within the last five years as well as positive pricing actions.
Latin America: Revenue decreased approximately 33 percent, or approximately 35 percent organically, for the year ended December 31, 2023 compared to the prior year period driven primarily by the pressure on volumes due to channel destocking as well as drought conditions in Brazil. Additionally, pricing actions were a headwind during the period. The decreases in volumes and pricing were partially offset by positive FX movements during the period. During the fourth quarter, we successfully launched Premio® Star insecticide in Brazil contributing to branded diamide sales in Latin America.
EMEA: Revenue decreased approximately 14 percent, or approximately 10 percent organically, versus the prior year period as a result of the decline in volumes due to a channel destocking as well as adverse weather conditions in the region partially offset by positive pricing actions and strong diamides sales in the region.
Asia: Revenue decreased approximately 21 percent, or approximately 16 percent organically, versus the prior year period caused by channel destocking during the period resulting in a decline in volumes during the period. FX continued to be a headwind in the region.
Gross margin
2024 vs. 2023
Gross margin of $1,648.9 million decreased by $182.1 million, or approximately 10 percent versus the prior year period resulting from a 13 percent decrease due to lower pricing in all regions due to competitive pressure as demand returned. The decrease in price was partially offset by a 2 percent increase due to positive input cost improvement and a 1 percent increase from volume growth. Gross margin percent of approximately 38.8 percent slightly decreased from approximately 40.8 percent in the prior year period driven by higher unabsorbed fixed costs as well as registration removals during the period.
2023 vs. 2022
Gross margin of $1,831.0 million decreased by $495.8 million, or approximately 21 percent versus the prior year period resulting from a 29 percent decrease in volumes caused by a significant channel destocking partially offset by a 10 percent increase due to positive input cost improvement. Unfavorable foreign currency impacts of 2 percent also contributed to the decline in gross margin during the period. Gross margin percent of approximately 40.8 percent remained consistent with gross margin percent of 40.1 percent in the prior year period.
Selling, general and administrative expenses
2024 vs. 2023
Selling, general and administrative expenses of $644.6 million decreased by $89.7 million, or approximately 12 percent versus the prior year period. The decrease in selling, general and administrative expenses is primarily due to cost reduction measures implemented in connection with our Project Focus initiative as well as operating cost mitigation actions in effect since last year due to lower business performance.
2023 vs. 2022
Selling, general and administrative expenses of $734.3 million decreased by $40.9 million, or approximately 5 percent versus the prior year period. The decrease in selling, general and administrative expenses is a result of the operating cost mitigation actions we undertook beginning in the latter half second quarter in response to the volume pressures.
Research and development expenses
2024 vs. 2023
Research and development expenses of $278.0 million decreased by $50.8 million, or approximately 15 percent versus the prior year period. The decrease in research and development costs is a result of cost reduction efforts related to Project Focus. Reductions in research and development spending were done without sacrificing investments in areas such as Plant Health and our new active ingredient pipeline.
2023 vs. 2022
Research and development expenses of $328.8 million increased by $14.6 million, or approximately 5 percent versus the prior year period. The increase in research and development expenditures is related to continued investment in our new active ingredient pipeline, including our recently acquired pheromones business, as well as inflation and labor cost increases. However, inflation conditions improved in the second half of the year indicating the peak of inflationary headwinds.
Other Results of Operations
Depreciation and amortization
2024 vs. 2023
Depreciation and amortization of $176.3 million decreased $8.0 million, or approximately 4 percent, as compared to 2023 of $184.3 million. The decrease was the result of the write off of certain amortizable assets in the first half of 2024 as part of our Project Focus restructuring initiative.
2023 vs. 2022
Depreciation and amortization of $184.3 million increased $14.9 million, or approximately 9 percent, as compared to 2022 of $169.4 million. The increase was driven by additional assets placed into service during 2023 and accelerated depreciation associated with certain assets at one of our research facilities.
Interest expense, net
2024 vs. 2023
Interest expense, net of $235.8 million decreased by $1.4 million, or approximately 1 percent, compared to $237.2 million in 2023 primarily driven by lower debt balances and rates. Specifically, lower foreign balances and rates resulted in a decrease in interest expense of approximately $6.5 million. The decrease in interest expense was partially offset by an increase of approximately $5.1 million due to higher domestic short-term interest rates.
2023 vs. 2022
Interest expense, net of $237.2 million increased by $85.4 million, or approximately 56 percent, compared to $151.8 million in 2022. The increase was primarily driven by higher interest rates and, to a lesser extent, higher debt balances. Specifically, higher domestic interest rates increased interest expense by approximately $63 million and higher domestic short-term balances increased interest expense by approximately $18 million during the period. Higher foreign interest rates and debt balances also contributed to the increase by approximately $7 million.
Corporate special charges (income)
Restructuring and other charges (income)
Our restructuring and other charges (income) are comprised of restructuring, assets disposals and other charges (income) as described below: | | | | | | | | | | | | | | | | | |
| | Year Ended December 31, |
| (in Millions) | 2024 | | 2023 | | 2022 |
| Restructuring charges | $ | 303.0 | | | $ | 48.4 | | | $ | (26.1) | |
| Other charges (income), net | (83.2) | | | 163.9 | | | 119.2 | |
Total restructuring and other charges (income) (1) | $ | 219.8 | | | $ | 212.3 | | | $ | 93.1 | |
_______________
(1) See Note 7 to the consolidated financial statements included in this Form 10-K for more information.
2024
Restructuring and other charges (income) primarily includes restructuring charges incurred in connection with the Project Focus initiative. For the year ended December 31, 2024, we incurred $132.1 million of contract abandonment charges as a result of the continued evaluation of our supply chain footprint during the fourth quarter of 2024 and $53.3 million of non-cash asset write off charges resulting from the contract cessation with one of our third-party manufacturers during the second quarter of 2024. The decision to exit these agreements was driven in part by our ability to source these materials from lower cost locations. Charges incurred in connection with Project Focus also consist of $55.8 million in severance and employee separation charges, including costs associated with the CEO transition, $31.0 million of professional service provider costs and other miscellaneous charges associated with the project, accelerated depreciation of $20.5 million on assets identified for disposal in connection with the restructuring initiative, and $13.2 million of asset impairment charges.
In connection with Project Focus, the Company expects to incur pre-tax restructuring charges in the range of approximately $375 million to $425 million, inclusive of charges incurred during 2024 as well as $45.5 million of charges incurred in 2023. The estimate for total Project Focus charges, which is subject to future changes, includes severance and related benefit costs in the range of $90 to $100 million, asset write-off and contract abandonment charges of approximately $250 to $270 million, and other costs of $35 to $55 million. We have implemented substantially all the activities associated with the plan and expect the plan to be complete by the end of 2025. However, we may incur additional asset write-off charges and other exit and disposal costs should additional activities be implemented under the restructuring program. The remaining amounts will be reflected in our consolidated results of operations as they become probable and estimable or a triggering event is identified in accordance with the relevant accounting guidance.
During the year ended December 31, 2024, we also recognized income of $2.9 million related to previously implemented restructuring initiatives including a $3.1 million gain recognized on the disposition of a previously closed manufacturing site.
Other charges (income) of $(83.2) million is comprised of a gain, net of full year incurred transaction costs, of $174.4 million from the sale of our GSS business, which was completed on November 1, 2024. The divestiture of GSS, which includes a line of products that serve a diverse mix of non-crop markets such as golf courses, professional sports stadiums and pest control, is a key step in FMC's strategic plan to focus solely on innovating products and services for the global crop protection market. The gain from the GSS sale was partially offset by $74.7 million of charges associated with our environmental sites and $16.5 million of other miscellaneous charges.
2023
Restructuring and other charges (income) includes $40.1 million of severance and employee separation costs and $5.4 million of provider costs associated with the Project Focus restructuring initiative. Other restructuring costs of $8.7 million relate to employee separation and asset impairment costs incurred as part of various ongoing initiatives. These restructuring charges were offset by a $5.8 million gain recognized on the disposition of land related to a previously closed manufacturing facility.
Other charges (income) of $163.9 million is comprised of $75.2 million in currency related charges driven by significant devaluation actions taken by the Argentine Government during the fourth quarter of 2023 as well as similar devaluation actions in Pakistan and Argentina during previous quarts of 2023. Other charges (income) also includes $13.0 million in charges primarily resulting from the third quarter acquisition of in-process research and development assets that do not meet the criteria for capitalization. We also incurred $66.9 million in environmental charges associated with remediation and other miscellaneous charges of $8.8 million.
2022
Restructuring and other charges (income) is primarily comprised of a gain of $50.5 million recognized on the disposition of land related to a closed manufacturing facility. Restructuring and other charges (income) is also comprised of charges of $5.9 million of severance and employee separation costs, $11.2 million related to fixed asset charges, and $7.3 million of other restructuring related charges incurred as part of various restructuring initiatives disclosed in previous periods.
Other charges (income) is primarily comprised of $76.8 million in exit charges related to our decision to cease operations and business in Russia. Additional charges of $42.4 million relate primarily to environmental charges, which were impacted by higher inflation rates.
Non-operating pension and postretirement charges (income)
2024 vs. 2023
Charges for each of the years ended December 31, 2024 and 2023 were $18.2 million.
2023 vs. 2022
The charge for 2023 was $18.2 million compared to $8.6 million in 2022. Higher interest rates during the period resulted in an increase to interest costs for pension and other postretirement benefits.
Provision (benefit) for income taxes
In 2024, we recognized an income tax benefit of $150.9 million, which resulted in an effective tax rate of negative 59.8 percent. For the year ended December 31, 2023, we recorded an income tax benefit of $1,119.3 million resulting in an effective tax rate of negative 372.9 percent. Income tax provision for 2022 was $145.2 million resulting in an effective tax rate of 14.8 percent. Note 11 to the consolidated financial statements included in this Form 10-K includes more details on the drivers of the GAAP effective rate and year-over-year changes.
We believe showing the reconciliation below of our GAAP to Non-GAAP effective tax rate provides investors with useful supplemental information about our tax rate on the core underlying business.
| | | | | | | | | | | | | | | | | | | | | | | | | | | | | | | | | | | |
| | Year Ended December 31, |
| 2024 | | 2023 | | 2022 |
| (in Millions) | Income (Expense) | Tax Provision (Benefit) | Effective Tax Rate | | Income (Expense) | Tax Provision (Benefit) | Effective Tax Rate | | Income (Expense) | Tax Provision (Benefit) | Effective Tax Rate |
| GAAP - Continuing operations | $ | 252.5 | | $ | (150.9) | | (59.8) | % | | $ | 300.2 | | $ | (1,119.3) | | (372.9) | % | | $ | 983.9 | | $ | 145.2 | | 14.8 | % |
| Corporate special charges (income) | 238.0 | | 37.1 | | | | 256.3 | | 32.8 | | | | 101.7 | | (1.5) | | |
Revisions to valuation allowances of historical deferred tax assets (1) | — | | 1.6 | | | | — | | 223.5 | | | | — | | — | | |
Net impact of Switzerland tax incentives (1) | — | | 153.9 | | | | — | | 830.8 | | | | — | | — | | |
Foreign currency and other discrete items (1) | — | | 12.0 | | | | — | | 113.1 | | | | — | | 5.3 | | |
| Non-GAAP - Continuing operations | $ | 490.5 | | $ | 53.7 | | 10.9 | % | | $ | 556.5 | | $ | 80.9 | | 14.5 | % | | $ | 1,085.6 | | $ | 149.0 | | 13.7 | % |
_______________
(1)Refer to note 3 of the Adjusted Earnings Reconciliation table within this section of this Form 10-K for an explanation of tax adjustments.
The primary drivers for the fluctuations in the effective tax rate for each period are provided in the table above.
During the three months ended December 31, 2023, the Company’s Swiss subsidiaries were granted ten-year tax incentives effective for 2023 and retroactively for 2021 and 2022. The tax incentives were awarded for the Company’s commitment to invest in additional headcount and transfer significant intellectual property as well as establishing a new global technology and innovation center in Switzerland. Deferred tax benefits of $1,149 million and related valuation allowances of $318 million were recorded during the three months ended December 31, 2023 to reflect the net estimated future reductions in tax of $831 million associated with the incentives.
In connection with our plans to establish a global technology and innovation center in Switzerland, we initiated changes to our corporate entity structure, including intra-entity transfers of certain intellectual property, during the second quarter of 2024. As a result, we recorded a net tax benefit of approximately $300 million. This benefit, net of valuation allowance, was primarily a result of the recognition of a step-up in tax basis to the fair value of the transferred intellectual property by one of the Company’s Swiss subsidiaries. In addition, local tax impacts associated with the disposition of the transferred intellectual property were recorded as well as an increase in our valuation allowance associated with Swiss nonrefundable tax credits as a result of indirect effects of the transferred intellectual property. During the fourth quarter of 2024, the Company recorded additional valuation allowances of approximately $120 million as a result of updated projections of future earnings associated with the 2023 deferred tax benefits noted above.
Historically, FMC’s Brazil valuation allowance position was based on long-standing local transfer pricing rules, as well as certain material favorable permanent statutory tax deductions available to FMC Brazil as part of local tax law. During the three months ended December 31, 2023, the Company released its FMC Brazil valuation allowance and recorded a tax benefit of approximately $223 million as a result of the Brazilian Government enacting a new tax law that significantly limits FMC Brazil’s ability to benefit in the future from the material favorable permanent statutory tax deductions previously available as part of local tax law.
Excluding the items in the table above, changes in the non-GAAP effective tax rate were primarily due to the impact of geographic mix of earnings among our global subsidiaries. See Note 11 to the consolidated financial statements included within this Form 10-K for additional details related to the provisions for income taxes on continuing operations, as well as items that significantly impact our effective tax rate.
Discontinued operations, net of income taxes
Our discontinued operations primarily reflect adjustments to retained liabilities from previously discontinued operations and include environmental liabilities, other postretirement benefit liabilities, self-insurance, long-term obligations related to legal proceedings and historical restructuring activities. See Note 9 to the consolidated financial statements included within this Form 10-K for additional details on our discontinued operations.
2024 vs. 2023
Discontinued operations, net of income taxes represented a loss of $61.8 million in 2024 compared to a loss of $98.5 million in 2023. The loss during both periods was primarily due to adjustments related to the retained liabilities from our previously discontinued operations. The twelve months ended December 31, 2024 includes an offsetting gain of $18.0 million recognized as the result of an insurance settlement for retained legal reserves.
2023 vs. 2022
Discontinued operations, net of income taxes represented a loss of $98.5 million in 2023 compared to a loss of $97.2 million in 2022. The loss during both periods was primarily due to adjustments related to the retained liabilities from our previously discontinued operations.
Net income (loss)
2024 vs. 2023
Net income decreased to $341.6 million from $1,321.0 million primarily as a result of a decrease of $968.4 million to our benefit for income taxes. We recorded significant one-time tax benefits in the prior year related to tax incentives granted to our Swiss subsidiaries as discussed above. In the fourth quarter of 2024, we recorded higher valuation allowances on these tax benefits. In 2024, we also recorded a $300 million income tax benefit in connection with the changes to our corporate entity structure made as part of establishing our global technology and innovation center in Switzerland. Additionally, lower gross margin, as discussed above, negatively impacted our results for the period. The change in our gross margin and benefit for income taxes was partially offset by a gain of $18.0 million in discontinued operations during the second quarter as the result of an insurance settlement for retained legal reserves. Our research and development expenses and our selling, general, and administrative expenses were also lower as a result of cost containment.
The only difference between Net income (loss) and Net income (loss) attributable to FMC stockholders is noncontrolling interest.
2023 vs. 2022
Net income increased to $1,321.0 million from $741.5 million. Results in the current year period were higher than the prior year period primarily as a result of a decrease to our provision for income taxes of $1,264.5 million resulting in an income tax benefit for the year. During the fourth quarter, we recognized significant one-time tax benefits related to new tax incentives granted to the Company's Swiss subsidiaries. In addition, we released our FMC Brazil valuation allowance as a result of new tax laws enacted in the country, resulting in the recognition of additional tax benefit. The increase in the benefit for income taxes was partially offset by the unprecedented decline in volumes as the distribution channel focused on channel destocking significantly decreasing our revenues and gross margin as discussed above. Additionally, an increase in interest expense of $85.4 million, primarily driven by higher interest rates, also offset the increase in net income as well as higher restructuring and other charges.
Adjusted EBITDA (Non-GAAP)
2024 vs. 2023
Adjusted EBITDA of $902.6 million decreased $75.4 million, or approximately 8 percent versus the prior year period. Cost as well as volume improvement of approximately 14 percent and 1 percent, respectively, were fully offset by unfavorable pricing impacts of approximately 25 percent. Favorable foreign currency impacts of approximately 2 percent also increased adjusted EBITDA.
2023 vs. 2022
Adjusted EBITDA of $978.0 million decreased $428.8 million, or approximately 30 percent versus the prior year period. The decrease was due to lower volumes impacting adjusted EBITDA by 48 percent as well as unfavorable foreign currency impacts of approximately 2 percent. The decrease was partially offset by cost and price movements, which both increased adjusted EBITDA by approximately 18 percent and 2 percent, respectively.
Liquidity and Capital Resources
As a global agricultural sciences company, we require cash primarily for seasonal working capital needs, capital expenditures, and return of capital to shareholders. We plan to meet these liquidity needs through available cash, cash generated from operations, commercial paper issuances and borrowings under our committed revolving credit facility as well as other liquidity facilities, and in certain instances access to debt capital markets. We believe our solid financial standing and credit ratings will ensure adequate access to the debt capital markets on favorable conditions. Information involving our material cash requirements is detailed below.
Cash
Cash and cash equivalents at December 31, 2024 and 2023, were $357.3 million and $302.4 million, respectively. Of the cash and cash equivalents balance at December 31, 2024, $348.9 million was held by our foreign subsidiaries. We have established plans to repatriate cash from certain foreign subsidiaries with minimal tax on a go forward basis. Other cash held by foreign subsidiaries is generally used to finance subsidiaries’ operating activities and future foreign investments. See Note 11 to the consolidated financial statements included within this Form 10-K for more information on our indefinite reinvestment assertion.
Outstanding debt
At December 31, 2024, we had total debt of $3,365.3 million as compared to $3,957.6 million at December 31, 2023. Total debt included $3,027.9 million and $3,023.6 million of long-term debt (excluding current portions of $76.1 million and $96.5 million) at December 31, 2024 and 2023, respectively. Our short-term debt consists of foreign borrowings and borrowings under our commercial paper program. Foreign borrowings increased from $98.0 million at December 31, 2023 to $135.7 million at December 31, 2024 while outstanding commercial paper decreased from $739.5 million at December 31, 2023 to $125.6 million at December 31, 2024. We provide parent-company guarantees to lending institutions providing credit to our foreign subsidiaries.
As of December 31, 2024, we were in compliance with all of our debt covenants. In February 2025, we entered into new amendments to our Revolving Credit Facility to amend the maximum leverage and minimum interest coverage ratios and to extend the maturity date of the facility to 2028. See Note 12 to the consolidated financial statements included within this Form 10-K for further details. We remain committed to solid investment grade credit metrics.
Our total debt maturities, excluding discounts, is $3,387.4 million at December 31, 2024, with $337.4 million payable in the next 12 months. As of December 31, 2024, we had contractual interest obligations of $1,872.3 million outstanding, with $144.9 million payable in the next 12 months. Contractual interest is the interest we are contracted to pay on our long-term debt obligations. We do not have any long-term debt subject to variable interest rates at December 31, 2024.
Access to credit and future liquidity and funding needs
At December 31, 2024, our remaining borrowing capacity under our credit facility was $1,664.3 million. Our commercial paper program allows us to borrow at rates generally more favorable than those available under our credit facility. At December 31, 2024, we had $125.6 million borrowings outstanding under the commercial paper program at an average borrowing rate of 5 percent. Our commercial paper balances fluctuate from year to year depending on working capital needs. Based on cash generated from operations, our existing liquidity facilities, which includes the revolving credit agreement with the option to increase capacity up to $2.75 billion, and our continued access to debt capital markets, we have adequate liquidity to meet any of the Company's debt obligations in the near term including any current portion of long-term debt.
Working Capital Initiatives
We offer to a select group of suppliers a voluntary supply chain finance program as part of our continued efforts to improve our working capital efficiency. We do not believe that changes in the availability of the supply chain finance program would have a significant impact on our liquidity. See Note 2 for more information on the key terms and balances of the program.
From time to time, the Company may sell receivables on a non-recourse basis to third-party financial institutions. These sales are normally driven by specific market conditions, including, but not limited to, foreign exchange environments, customer credit management, as well as other factors where the receivables may lay. See Note 8 for more information on receivables factoring.
Commitments
We provide guarantees to financial institutions on behalf of certain customers, principally customers in Brazil for their seasonal borrowing. The total of these guarantees was $157.9 million at December 31, 2024. These guarantees arise during the ordinary course of business from relationships with customers and nonconsolidated affiliates. Non-performance by the guaranteed party triggers the obligation requiring us to make payments to the beneficiary of the guarantee. Based on our experience these types of guarantees have not had a material effect on our consolidated financial position or on our liquidity. Our expectation is that future payment or performance related to the non-performance of others is considered unlikely.
In connection with certain of our property and asset sales and divestitures, we have agreed to indemnify the buyer for certain liabilities, including environmental contamination and taxes that occurred prior to the date of sale. Our indemnification obligations with respect to these liabilities may be indefinite as to duration and may or may not be subject to a deductible, minimum claim amount or cap. In cases where it is not possible for us to predict the likelihood that a claim will be made or to make a reasonable estimate of the maximum potential loss or range of loss, no specific liability has been recorded. If triggered, we may be able to recover certain of the indemnity payments from third parties. In cases where it is possible, we have recorded a specific liability within our Reserve for Discontinued Operations. Refer to Note 9 to the consolidated financial statements included within this Form 10-K for further details.
Taxes, Pension, Environmental, and Other Discontinued Liabilities
As of December 31, 2024, the liability for uncertain tax positions was $58.3 million. Our consolidated balance sheets contain accrued pension and other postretirement benefits, our environmental liabilities, and our other discontinued liabilities for which we are unable to make a reasonably reliable estimate of the amount and periods in which these liabilities might be paid beyond 2025. We believe any liability arising from potential environmental obligations is not likely to have a material adverse effect on our liquidity or financial condition as it may be satisfied over many years. See our discussion under 2025 Cash Flow Outlook in the Free Cash Flow section within this Form 10-K for information on these liabilities and the related expected payments in 2025.
Derivatives
At times we can be in a derivative liability position that can require future cash obligations. However, as of December 31, 2024, we had no such obligations.
Leases
We have lease arrangements for equipment and facilities, including office spaces, IT equipment, transportation equipment, and machinery equipment. As of December 31, 2024, we had fixed lease payment obligations of $152.7 million, with $29.8 million payable within 12 months.
Purchase obligations
Purchase obligations consist of agreements to purchase goods and services that are enforceable and legally binding and specify all significant terms, including fixed or minimum quantities to be purchased, price provisions and timing of the transaction. We have entered into a number of purchase obligations for the sourcing of materials and energy where take-or-pay arrangements apply. As of December 31, 2024, our purchase obligations were $288.1 million, with $90.1 million payable in the first 12 months. The majority of the minimum obligations under these contracts are take-or-pay commitments over the life of the contract and not a year by year take-or-pay, and as such, the obligations related to these types of contacts are presented in the earliest period in which the minimum obligation could be payable under these types of contracts.
Statement of Cash Flows
Cash provided (required) by operating activities was $736.7 million, $(300.3) million and $660.0 million for 2024, 2023 and 2022, respectively.
The table below presents the components of net cash provided (required) by operating activities of continuing operations.
| | | | | | | | | | | | | | | | | |
| (in Millions) | Year ended December 31, |
| 2024 | | 2023 | | 2022 |
Income from continuing operations before non-operating pension and postretirement charges (income), interest expense, net and income taxes (GAAP) | $ | 506.5 | | | $ | 555.6 | | | $ | 1,144.3 | |
| Restructuring and other charges (income), transaction-related charges and depreciation and amortization | 396.1 | | | 396.6 | | | 262.5 | |
Change in trade receivables, net (1) | (348.8) | | | 192.4 | | | (443.9) | |
| Change in guarantees of vendor financing | 15.9 | | | (72.4) | | | (64.2) | |
Change in advance payments from customers (2) | (26.5) | | | (199.1) | | | 52.1 | |
Change in accrued customer rebates (3) | 30.7 | | | 16.0 | | | 69.6 | |
Change in inventories (4) | 475.8 | | | (72.8) | | | (182.3) | |
Change in accounts payable (5) | 171.7 | | | (626.0) | | | 165.3 | |
Change in all other operating assets and liabilities (6) | 74.7 | | | (13.7) | | | (10.3) | |
| | | | | |
Restructuring and other spending (7) | (130.0) | | | (30.3) | | | (35.2) | |
Environmental spending, continuing, net of recoveries (8) | (35.4) | | | (34.5) | | | (26.9) | |
Pension and other postretirement benefit contributions (9) | (5.5) | | | (2.4) | | | (4.5) | |
Net interest payments (10) | (232.2) | | | (229.6) | | | (144.0) | |
Tax payments, net of refunds (11) | (156.3) | | | (180.1) | | | (122.0) | |
| | | | | |
| | | | | |
Transaction and integration costs (12) | — | | | — | | | (0.5) | |
| Cash provided (required) by operating activities of continuing operations (GAAP) | $ | 736.7 | | | $ | (300.3) | | | $ | 660.0 | |
| | | | | |
| | | | | |
| | | | | |
| | | | | |
| | | | | |
| | | | | |
| | | | | |
| | | | | |
| | | | | |
| | | | | |
| | | | | |
| | | | | |
| | | | | |
| | | | | |
____________________
(1)The change in trade receivables in all periods include the impacts of seasonality and the receivable build intrinsic in our business. The change in cash flows related to trade receivables in 2024 was driven by timing of collections, due in part, to sales growth during the second half of the year compared to the same period in 2023. Collection timing is more pronounced in certain countries such as Brazil where there may be terms significantly longer than the rest of our business. Additionally, timing of collection is impacted as amounts for all periods include carry-over balances remaining to be collected in Latin America, where collection periods are measured in months rather than weeks. During 2024, we collected approximately $474.8 million of receivables in Brazil.
(2)Advance payments are typically received in the fourth quarter of each year, primarily in our North America operations as revenue associated with advance payments is recognized, generally in the first half of each year following the seasonality of that business, as shipments are made and title, ownership and risk of loss pass to the customer. The change in 2024 was driven by higher advance payments received during 2024 compared to the same period in 2023 offset by the higher application of those advances against current period sales. The change in 2023 was related to lower advance payments received during the year compared to the prior year. The change in 2022 was related to higher overall payments received primarily due to strong North America seasons in both years.
(3)These rebates are primarily associated within North America, and to a lesser extent Brazil, and in North America generally settle in the fourth quarter of each year given the end of the respective crop cycle. The changes year over year are mostly associated with the mix in sales eligible for rebates and incentives as well as timing of certain rebate payments.
(4)The changes in inventory during 2024 reflect the lower inventory build required following the lower sales volume in 2023 resulting from the channel destocking. Higher sales during the second half of 2024 contributed to the decrease in inventories. The change in cash flows during 2023 is the result of lower than expected sales volume during the period. The change in cash flows during 2022 reflects the inventory build required to meet forecasted business demand.
(5)The change in cash flows related to accounts payable in 2024 was driven by the timing of payments to suppliers and vendors following a period of reducing spending in the prior period. The change in cash flows related to accounts payable in 2023 is primarily due to lower raw material inventory purchases due to the decline in demand and, to a lesser extent, the timing of payments made to suppliers and vendors. The change in accounts payable in 2022 is primarily due to timing of payments made to suppliers and vendors as well as the impact of cost inflation. As of December 31, 2024, approximately 99 percent of our accounts payable balance was considered current, which we define as outstanding less than 30 days past the invoice due date. In accordance with our standard terms, invoices are held for payment when there is an open dispute with the vendor. The remaining balance of accounts payable primarily consists of invoices that meet this criteria.
(6)Changes in all periods presented primarily represent timing of payments associated with all other operating assets and liabilities. Additionally, the 2022 period includes the effects of the unfavorable contracts amortization of approximately $82 million. The contract expired during the fourth quarter of 2022.
(7)See Note 7 to the consolidated financial statements included within this Form 10-K for further details.
(8)In addition to the environmental cash spend presented in the table above, our results for each of the years presented also include environmental charges for environmental remediation of $74.7 million, $66.9 million and $34.7 million, respectively. The amounts represent environmental remediation spending which were recorded against pre-existing reserves, net of recoveries. Environmental obligations for continuing operations primarily represent obligations at shut down or abandoned facilities within businesses that do not meet the criteria for presentation as discontinued operations. The amounts recorded against pre-existing reserves in 2024 will be spent in future years.
(9)There were no voluntary contributions to our U.S. qualified defined benefit plan, which is slightly over funded, in 2024, 2023 and 2022.
(10)Interest payments were consistent in 2024 as compared to 2023. Interest payments were higher during 2023 compared to 2022 largely due to the timing of interest payments as well as higher commercial paper rates.
(11)Amounts shown in the chart represent net tax payments of our continuing operations across various jurisdictions.
(12)Represents payments for legal and professional fees associated with integrating the DuPont Crop Protection Business. The integration is complete and the 2022 payments are associated with settlement of final amounts payable.
Cash provided (required) by operating activities of discontinued operations was $(65.6) million, $(86.1) million and $(77.6) million for 2024, 2023 and 2022, respectively.
Cash required by operating activities of discontinued operations in 2024 is directly related to environmental spending of $52.1 million as well as $13.5 million for other postretirement benefit liabilities, self-insurance, long-term obligations related to legal proceedings, collectively. 2023 and 2022 spending were of a similar nature. Discontinued operations for 2024 also includes cash proceeds, net of fees of $18.0 million received as the result of an insurance settlement for retained legal reserves. Additionally, during 2023, we paid $16.5 million for a portion of settlement amount related to one of our discontinued foreign environmental remediation sites and the remaining payment of $11.3 million was paid in 2024.
Cash provided (required) by investing activities of continuing operations was $263.6 million, $(154.4) million and $(266.4) million for 2024, 2023 and 2022, respectively.
Cash provided by investing activities of continuing operations for 2024 is primarily the result of the sale of our GSS business, which was completed on November 1, 2024. We received proceeds, net of the preliminary working capital adjustment, of approximately $340 million in connection with the completion of the sale. The proceeds from the GSS sale were partially offset by capital expenditures, which were lower than the prior year as we continue to constrain investment to only the most critical, high-return projects.
Cash required for 2023 is primarily due to capital expenditures for increased capacity, and to a lesser extent, acquisition related spending associated with the acquired IPR&D assets completed during the third quarter of 2023.
Cash required for 2022 is primarily related to capital expenditures needed for increased capacity, as well the consideration paid for the BioPhero acquisition. Capital expenditures in 2022 increased due to spending directed towards capacity expansion. This usage of cash was offset by the proceeds received on the disposition of land on a previously shutdown manufacturing facility.
Cash provided (required) by financing activities was $(870.1) million, $331.5 million and $(237.4) million in 2024, 2023 and 2022, respectively.
The change in cash provided by financing activities in 2024 is primarily due to lower commercial paper borrowings during the period as well as the absence of the net impact of the 2023 bond issuance and repayment of the 2021 term loan. The proceeds from the GSS sale were used to pay down outstanding debt. There were no share repurchases during 2024 under the publicly announced program.
The change in cash provided by financing activities in 2023 is primarily due to higher commercial paper balances and an increase in short term foreign borrowings as well as the proceeds from the Senior Notes. This increase was partially offset by the repayment of the $800 million term loan, and $75 million in repurchases of common stock under the publicly announced program.
The change in cash required by financing activities in 2022 is primarily driven by lower share repurchases under our publicly announced program as well as lower repayments on long term debt.
Free Cash Flow
We define free cash flow, a Non-GAAP financial measure, as all cash inflows and outflows excluding those related to financing activities (such as debt repayments, dividends, and share repurchases) and acquisition related investing activities. Additionally, in 2024, free cash flow excludes the proceeds, net of transaction costs, from the sale of our GSS business. Therefore, our calculation of free cash flow will almost always result in a lower amount than cash from operating activities from continuing operations, the most directly comparable U.S. GAAP measure. However, the free cash flow measure is consistent with management's assessment of operating cash flow performance and we believe it provides a useful basis for investors and securities analysts about the cash generated by routine business operations, including capital expenditures, in addition to assessing our ability to repay debt, fund acquisitions including cost and equity method investments, and return capital to shareholders through share repurchases and dividends.
Our use of free cash flow has limitations as an analytical tool and should not be considered in isolation or as a substitute for an analysis of our results under U.S. GAAP. First, free cash flow is not a substitute for cash provided (required) by operating activities of continuing operations, as it is not a measure of cash available for discretionary expenditures since we have non-discretionary obligations, primarily debt service, that are not deducted from the measure. Second, other companies may calculate free cash flow or similarly titled Non-GAAP financial measures differently or may use other measures to evaluate their performance, all of which could reduce the usefulness of free cash flow as a tool for comparison. Additionally, the utility of free cash flow is further limited as it does not reflect our future contractual commitments and does not represent the total increase or decrease in our cash balance for a given period. Because of these and other limitations, free cash flow should be considered along with cash provided (required) by operating activities of continuing operations and other comparable financial measures prepared and presented in accordance with U.S. GAAP.
The table below presents a reconciliation of free cash flow from the most directly comparable U.S. GAAP measure.
FREE CASH FLOW RECONCILIATION | | | | | | | | | | | | | | | | | |
| (in Millions) | Year ended December 31, |
| 2024 | | 2023 | | 2022 |
Cash provided (required) by operating activities of continuing operations (GAAP) (1) | $ | 736.7 | | | $ | (300.3) | | | $ | 660.0 | |
| | | | | |
| | | | | |
Capital expenditures (2) | (67.9) | | | (133.9) | | | (142.3) | |
Other investing activities (2)(3) | (3.7) | | | (9.8) | | | 23.6 | |
Proceeds from land disposition (4) | — | | | 5.8 | | | 50.5 | |
| Capital additions and other investing activities | $ | (71.6) | | | $ | (137.9) | | | $ | (68.2) | |
| | | | | |
Cash provided (required) by operating activities of discontinued operations (5) | (65.6) | | | (86.1) | | | (77.6) | |
| | | | | |
Divestiture transaction costs (6) | 14.0 | | | — | | | — | |
Free cash flow (Non-GAAP) (7) | $ | 613.5 | | | $ | (524.3) | | | $ | 514.2 | |
___________________
(1)Includes cash payments made in connection with our Project Focus transformation program of $106.2 million for the year ended December 31, 2024. For additional detail on Project Focus, see Note 7.
(2)Components of cash provided (required) by investing activities of continuing operations. Refer to the below discussion for further details.
(3)Included in the amounts is cash spending associated with contract manufacturers of $2.7 million, $2.9 million and $6.8 million for the years ended December 31, 2024, 2023 and 2022, respectively.
(4)During December 2022, we finalized a land transfer agreement with the Shanghai Municipal People's Government. We received cash proceeds of $50.5 million for the land transfer. During 2023, we received the final payment of $5.8 million related to the agreement.
(5)Refer to the above discussion for further details.
(6)Represents transactional-related costs such as legal and professional third-party fees associated with the sale of our GSS business. Proceeds from the sale of our GSS business are excluded from free cash flow; therefore, we have also excluded the related transaction costs from free cash flow.
(7)Free cash flow is defined as cash provided (required) by operating activities of continuing operations (GAAP) adjusted for spending for capital additions and other investing activities as well as divestiture transaction costs associated with the sale of our GSS business. We believe that this Non-GAAP financial measure provides a useful basis for investors and securities analysts about the cash generated by routine business operations, including capital expenditures, in addition to assessing our ability to repay debt, fund acquisitions and return capital to shareholders through share repurchases and dividends. Our use of free cash flow has limitations as an analytical tool and should not be considered in isolation or as a substitute for an analysis of our results under U.S. GAAP.
2025 Cash Flow Outlook
Our cash needs for 2025 include operating cash requirements (particularly working capital as well as environmental, asset retirement obligation, and restructuring spending), and capital expenditures as well as mandatory payments of debt, dividend payments and, if applicable, share repurchases. We plan to meet our liquidity needs through available cash, cash generated from operations, commercial paper issuances and borrowings under our committed revolving credit facility. At December 31, 2024 our remaining borrowing capacity under our credit facility was $1,664.3 million.
We expect 2025 cash provided (required) by operating activities of continuing operations to be in the range of approximately $400 million to $570 million. We expect 2025 free cash flow (Non-GAAP) to fall within a range of approximately $200 million and $400 million. The expected decrease in both measures at the midpoint is primarily the result of our expectation of a normalization of working capital after the pronounced correction in 2024.
Key cash requirements included in cash provided by operating activities of continuing operations
Pension
We do not expect to make any voluntary cash contributions to our U.S. qualified defined benefit pension plan in 2025. The plan is slightly overfunded and our portfolio is comprised of 100 percent fixed income securities and cash. Our investment strategy is a liability hedging approach with an objective of maintaining the funded status of the plan such that the funded status volatility is minimized and the likelihood that we will be required to make significant contributions to the plan is limited.
Environmental
Projected 2025 spending, net of recoveries includes approximately $35 million to $45 million of net environmental remediation spending for our sites accounted for within continuing operations. Environmental obligations for continuing operations primarily represent obligations at shut down or abandoned facilities within businesses that do not meet the criteria for presentation as discontinued operations.
Projected 2025 spending, net of recoveries includes approximately $50 million to $60 million of net environmental remediation spending for our discontinued sites. These projections include spending as a result of a settlement reached in 2019 at our Middleport, New York site of $10 million maximum per year, on average, until the remediation is complete.
Total projected 2025 environmental spending, inclusive of sites accounted for within both continuing operations and discontinued sites, is expected to be in the range of $85 million to $105 million.
Restructuring and asset retirement obligations
We expect to make payments of approximately $70 million to $90 million in 2025, which primarily relates to Project Focus activities. As previously noted in the section titled "Results of Operations," we expect to incur approximately $375 million to $425 million of pre-tax restructuring charges in total over the life of the program, which includes $90 to $100 million of non-cash asset write-off charges. We expect cash payments of approximately $150 million to be paid over the next several years associated with contract abandonment activities executed under the program. The first of these annual payments are due in 2025 and have been included in the restructuring range disclosed above. The estimate also includes, but is not limited to, costs needed to transition various activities to Switzerland in order to realize the benefits associated with recently awarded tax incentives, employee severance and related benefit costs, and consulting and other professional service fees. We have implemented substantially all the activities associated with the plan and expect the plan to be complete by the end of 2025. However, we may incur additional asset write-off charges and other exit and disposal costs should additional activities be implemented under the restructuring program. The Company achieved $165 million in cost benefits in 2024 and the targeted annual run-rate savings is more than $225 million by the end of 2025 from the program once fully implemented, which is expected by the end of 2025.
Capital additions and other investing activities
Projected 2025 capital expenditures and expenditures related to contract manufacturers are expected to be in the range of approximately $105 million to $115 million. The spending is mainly driven by investments for our new products. Expenditures related to contract manufacturers are included within "other investing activities".
Share repurchases
Except for purchases associated with our equity compensation plans, we do not anticipate any share repurchases during 2025 in compliance with the amendment to the Company's credit agreement. See Item 5. Market for the Registrant's Common Equity, Related Stockholders Matters and Issuer Purchases of Equity Securities for additional information regarding the Company's publicly announced repurchased program authorized in February 2022.
Dividends
On January 16, 2025, we paid dividends aggregating $72.6 million to our shareholders of record as of December 31, 2024. This amount is included in "Accrued and other liabilities" on the consolidated balance sheet as of December 31, 2024. For the years ended December 31, 2024, 2023 and 2022, we paid $290.6 million, $290.5 million and $267.5 million in dividends, respectively. We expect to continue to make quarterly dividend payments. Future cash dividends, as always, will depend on a variety of factors, including earnings, capital requirements, financial condition, general economic conditions and other factors considered relevant by us and is subject to final determination by our Board of Directors.
Contingencies
See Note 19 to our consolidated financial statements included within this Form 10-K.
Climate Change
We are concerned about the consequences of climate change and will take prudent and cost-effective actions that reduce our GHG emissions to the atmosphere.
FMC is committed to continuing to do our part to address climate change and its impacts on nature and communities and has established goals related to waste, water, and net-zero emissions by 2035. FMC published our first sustainability report in 2011 and in 2024, published our first Climate Transition Plan. This details the business risks and opportunities we have due to climate change and outlines our plan to reach our net-zero goal. Additionally, FMC has been reporting its GHG emissions, water use, and sustainability strategy to CDP since 2016 and has been recognized as a leader in climate disclosures.
Even as we take action to minimize the release of GHG emissions, additional warming is anticipated. Long-term, higher average global temperatures could result in induced changes in natural resources, growing seasons, precipitation patterns, weather patterns, species distributions, water availability, sea levels, and biodiversity. These impacts could cause changes in supplies of raw materials used to maintain FMC’s production capacity and could lead to possible increased sourcing costs. Extreme weather events attributable to climate change may result in, among other things, physical damage to our property and equipment, and interruptions to our supply chain. In addition, depending on how pervasive the climate impacts are in the different geographic locations, FMC’s customers could be impacted by chronic or acute climate events. Demand for FMC’s products is dependent upon growers’ livelihood and ability to adapt to the impacts of climate change.
Though the nature of these events makes them difficult to predict, to respond to the uncertainty and better understand our risks and opportunities, we have conducted climate related scenario analyses consistent with the recommendations provided by the Taskforce for Climate-Related Financial Disclosures (“TCFD”). As part of the TCFD scenario analysis, we have evaluated both physical and transitional risks and opportunities across multiple time horizons. In accordance with the TCFD guidance, we leveraged scenarios published by the International Energy Agency (“IEA”) and the United Nations’ Intergovernmental Panel on Climate Change (IPCC), including a scenario below 2°C. Results of this analysis are integrated in our Climate Transition Plan including our enterprise risk management process, long-term business strategy, and are used to evaluate where strategic capital could be deployed to address risks and opportunities. Risks identified in Item 1A in this Form 10-K are aligned with the TCFD requirements. Additionally, the Taskforce for Nature-Related Financial Disclosures (“TNFD”) has outlined recommendations for companies to identify and disclose nature-related impacts and dependencies. FMC is an early adopter of TNFD and appropriate updates will be included in our annual sustainability report and CDP submissions.
In our product portfolio, we see transition market opportunities for our products to enable customers to address climate change impacts. For example, FMC’s product solutions can help growers adapt to climate change and protect biodiversity by maximizing yield and utilizing resources more efficiently. This may minimize the potential land use change and associated impacts to meet the needs of a growing population. Our solutions can also help growers adapt to more unpredictable growing conditions and the effects these types of threats have on crops. FMC has committed to investing 100 percent of our research and development pipeline budget to developing sustainably advantaged products and solutions.
We are improving existing products and developing new platforms and technologies that help mitigate impacts of climate change. These opportunities could lead to new products and services for our existing and potential customers. Beyond our products and operations, FMC recognizes that energy consumption and dependencies on nature throughout our supply chain can impact climate change and product costs. FMC has a SBTi-validated target of net-zero GHG emissions, which includes reductions across our entire supply chain. Therefore, we will actively work with our entire value chain – suppliers, contractors, and customers – with a goal to reduce their GHG emissions and to mitigate their potential impacts on climate change.
We continue to follow legislative and regulatory developments regarding climate change, including climate-related financial disclosures, supply chain due diligence and green taxes. The regulation of GHGs, depending on their nature and scope, could subject some of our manufacturing operations to additional costs or limits on operations and transport of our products. Future GHG regulatory requirements may result in increased costs of energy, additional capital costs for emissions control or new equipment, and/or costs associated with cap and trade or carbon taxes. For instance, FMC is subject to climate change regulation such as the EU Emissions Trading Scheme and subsequent Carbon Border Adjustment Mechanism. Additional green taxes, extended producer responsibility requirements, and mandated sustainability disclosures may continue to impact FMC as a part of the EU Green Deal and other global regulations. Many countries FMC does business in are in the process of establishing mandates for non-financial disclosures by aligning with International Sustainability Standards Board (ISSB) or other directives such as the EU Corporate Sustainability Reporting Directive, California SB 253 and 261 and the SEC climate proposal. FMC is closely following regulatory developments, and the cost of complying with global regulations, including reporting requirements and green taxes, is difficult to estimate at this time.
See Item IA. Risk Factors within this Form 10-K for additional considerations related to risks of climate change and sustainability.
Recently Adopted and Issued Accounting Pronouncements and Regulatory Items
See Note 2 "Recently Issued and Adopted Accounting Pronouncements and Regulatory Items" to our consolidated financial statements included within this Form 10-K.
Fair Value Measurements
See Note 18 to our consolidated financial statements included in this Form 10-K for additional discussion surrounding our fair value measurements.
Critical Accounting Policies and Estimates
Our consolidated financial statements are prepared in conformity with U.S. generally accepted accounting principles ("U.S. GAAP"). The preparation of these financial statements requires us to make estimates and judgments that affect the reported amounts of assets, liabilities, revenues and expenses. We have described our accounting policies in Note 1 "Principal Accounting Policies and Related Financial Information" to our consolidated financial statements included in this Form 10-K. We have reviewed these accounting policies, identifying those that we believe to be critical to the preparation and understanding of our consolidated financial statements. We have reviewed these critical accounting policies with the Audit Committee of the Board of Directors. Critical accounting policies are central to our presentation of results of operations and financial condition in accordance with U.S. GAAP and require management to make estimates and judgments on certain matters. We base our estimates and judgments on historical experience, current conditions and other reasonable factors. Our most critical accounting estimates and assumptions, which are those that involve a significant level of estimation uncertainty and have had, or are reasonably likely to have, a material impact on our financial condition or results of operations, include: Impairments and valuation of long-lived and indefinite-lived assets, Pension and other postretirement benefits, valuation allowance on deferred tax assets and the Allowance for credit losses on our trade receivables. Additional critical accounting policies are included within the list below:
Revenue recognition and trade receivables
We recognize revenue when (or as) we satisfy our performance obligation which is when the customer obtains control of the good or service. Rebates due to customers are accrued as a reduction of revenue in the same period that the related sales are recorded based on the contract terms. Refer to Note 3 to our consolidated financial statements included in this Form 10-K for more information.
We record amounts billed for shipping and handling fees as revenue. Costs incurred for shipping and handling are recorded as costs of sales and services. Amounts billed for sales and use taxes, value-added taxes, and certain excise and other specific transactional taxes imposed on revenue-producing transactions are presented on a net basis and excluded from revenue on the consolidated statements of income (loss). We record a liability until remitted to the respective taxing authority.
We periodically enter into prepayment arrangements with customers and receive advance payments for product to be delivered in future periods. These advance payments are recorded as deferred revenue and classified as "Advance payments from customers" on the consolidated balance sheet. Revenue associated with advance payments is recognized as shipments are made and transfer of control to the customer takes place.
Trade receivables consist of amounts owed to us from customer sales and are recorded when revenue is recognized. The allowance for trade receivables represents our best estimate of the probable losses associated with potential customer defaults. In developing our allowance for trade receivables, we use a two-stage process which includes calculating a general formula to develop an allowance to appropriately address the uncertainty surrounding collection risk of our entire portfolio and specific allowances for customers where the risk of collection has been reasonably identified either due to liquidity constraints or disputes over contractual terms and conditions.
Our method of calculating the general formula consists of estimating the recoverability of trade receivables based on historical experience, current collection trends, and external business factors such as economic factors, including regional bankruptcy rates, and political factors. Our analysis of trade receivable collection risk is performed quarterly, and the allowance is adjusted accordingly.
We also hold long-term receivables that represent long-term customer receivable balances related to past-due accounts which are not expected to be collected within the current year. Our policy for the review of the allowance for these receivables is consistent with the discussion in the preceding paragraph above on trade receivables. Therefore, on an ongoing basis, we continue to evaluate the credit quality of our long-term receivables utilizing aging of receivables, collection experience and write-offs, as well as existing economic conditions, to determine if an additional allowance is necessary.
We believe our allowance for credit losses is a critical accounting estimate because the underlying assumptions used for the reserve can change from time to time and potentially have a material impact on our results of operations. Based on a combination of historical trends as well as current economic factors, we apply judgment to reserve for expected credit losses in the period in which the sale is recorded. A substantial change in the operating environments in any of our key locations (driven by weather conditions, industry specific events, and macroeconomic conditions) may result in actual adjustments that differ from our original assumptions.
Environmental obligations and related recoveries
We provide for environmental-related obligations when they are probable and amounts can be reasonably estimated. Where the available information is sufficient to estimate the amount of liability, that estimate has been used. Where the information is only sufficient to establish a range of probable liability and no point within the range is more likely than any other, the lower end of the range has been used.
Estimated obligations to remediate sites that involve oversight by the United States Environmental Protection Agency ("EPA"), or similar government agencies, are generally accrued no later than when a Record of Decision ("ROD"), or equivalent, is issued, or upon completion of a Remedial Investigation/Feasibility Study ("RI/FS"), or equivalent, that is submitted by us to the appropriate government agency or agencies. Estimates are reviewed quarterly by our environmental remediation management, as well as by financial and legal management and, if necessary, adjusted as additional information becomes available. The estimates can change substantially as additional information becomes available regarding the nature or extent of site contamination, required remediation methods, and other actions by or against governmental agencies or private parties.
Our environmental liabilities for continuing and discontinued operations are principally for costs associated with the remediation and/or study of sites at which we are alleged to have released hazardous substances into the environment. Such costs principally include, among other items, RI/FS, site remediation, costs of operation and maintenance of the remediation plan, management costs, fees to outside law firms and consultants for work related to the environmental effort, and future monitoring costs. Estimated site liabilities are determined based upon existing remediation laws and technologies, specific site consultants’ engineering studies or by extrapolating experience with environmental issues at comparable sites.
Included in our environmental liabilities are costs for the operation, maintenance and monitoring of site remediation plans ("OM&M"). Such reserves are based on our best estimates for these OM&M plans. Over time we may incur OM&M costs in excess of these reserves. However, we are unable to reasonably estimate an amount in excess of our recorded reserves because we cannot reasonably estimate the period for which such OM&M plans will need to be in place or the future annual cost of such remediation, as conditions at these environmental sites change over time. Such additional OM&M costs could be significant in total but would be incurred over an extended period of years.
Included in the environmental reserve balance, other assets balance and disclosure of reasonably possible loss contingencies are amounts from third-party insurance policies, which we believe are probable of recovery.
Provisions for environmental costs are reflected in income, net of probable and estimable recoveries from named Potentially Responsible Parties ("PRPs") or other third parties. See Note 10 to the consolidated financial statements included within this Form 10-K for further information. All other environmental provisions incorporate inflation and are not discounted to their present value.
In calculating and evaluating the adequacy of our environmental reserves, we have taken into account the joint and several liability imposed by Comprehensive Environmental Response, Compensation and Liability Act ("CERCLA") and the analogous state laws on all PRPs and have considered the identity and financial condition of the other PRPs at each site to the extent possible. We have also considered the identity and financial condition of other third parties from whom recovery is anticipated, as well as the status of our claims against such parties. Although we are unable to forecast the ultimate contributions of PRPs and other third parties with absolute certainty, the degree of uncertainty with respect to each party is taken into account when determining the environmental reserve by adjusting the reserve to reflect the facts and circumstances on a site-by-site basis. Our liability includes our best estimate of the costs expected to be paid before the consideration of any potential recoveries from third parties. We believe that any recorded recoveries related to PRPs are realizable in all material respects. Recoveries are recorded as either an offset in "Environmental liabilities, continuing and discontinued" or as "Other assets" in our consolidated balance sheets in accordance with U.S. accounting literature.
See Note 10 to our consolidated financial statements included within this Form 10-K for changes in estimates associated with our environmental obligations.
Impairments and valuation of long-lived and indefinite-lived assets
Our long-lived assets primarily include property, plant and equipment, goodwill and intangible assets. The assets and liabilities of acquired businesses are measured at their estimated fair values at the dates of acquisition. The excess of the purchase price over the estimated fair value of the net assets acquired, including identified intangibles, is recorded as goodwill. The determination and allocation of fair value to the assets acquired and liabilities assumed is based on various assumptions and valuation methodologies requiring considerable management judgment, including estimates based on historical information, current market data and future expectations. Although the estimates were deemed reasonable by management based on information available at the dates of acquisition, those estimates are inherently uncertain.
We test for impairment whenever events or circumstances indicate that the net book value of our property, plant and equipment may not be recoverable from the estimated undiscounted expected future cash flows expected to result from their use and eventual disposition. In cases where the estimated undiscounted expected future cash flows are less than net book value, an impairment loss is recognized equal to the amount by which the net book value exceeds the estimated fair value of assets, which is based on discounted cash flows at the lowest level determinable. The estimated cash flows reflect our assumptions about selling prices, volumes, costs and market conditions over a reasonable period of time.
We perform an annual impairment test of goodwill and indefinite-lived intangible assets in the third quarter of each year, or more frequently whenever an event or change in circumstances occurs that would require reassessment of the recoverability of those assets. Our fiscal year 2024 annual goodwill and indefinite life impairment test was performed during the third quarter ended September 30, 2024. We determined no goodwill impairment or indefinite-lived asset impairment existed. On February 4, 2025, we released our results for the year ended December 31, 2024 as well as guidance for the first quarter of 2025 and full year 2025 and, our stock price declined significantly. We are evaluating whether this decline, if sustained, represents a triggering event and if an impairment test is required in connection with the preparation of the consolidated financial statements for the first quarter of 2025.
In performing our evaluation, we assess qualitative factors such as overall financial performance of our reporting units, anticipated changes in industry and market structure, competitive environments, planned capacity and cost factors such as raw material prices. We estimate the fair value of the reporting unit using a discounted cash flow model as part of the income approach. We assess the appropriateness of projected financial information by comparing projected revenue growth rates, profit margins and tax rates to historical performance, industry data and selected guideline companies, where applicable. Our key assumptions include future cash flow projections, tax rates, terminal growth rates and discount rates.
We employ the relief from royalty method of the income approach to value our brand portfolios (indefinite-lived intangible assets). The principle behind this method is that the value of the intangible asset is equal to the present value of the after-tax royalty savings attributable to owning the intangible asset. Primary inputs and key assumptions include revenue forecasts attributable to each portfolio, royalty rates (considering both external market data and internal arrangements), tax rates, terminal growth rates and discount rates.
Estimating the fair value requires significant judgment and actual results may differ due to changes in the overall market conditions. We believe we have applied reasonable assumptions which considers both internal and external factors.
We believe that an accounting estimate relating to asset impairment is a critical accounting estimate because of the inherent uncertainty within the underlying assumptions. An adverse change in any of these assumptions could result in an impairment charge which would potentially have a material impact on our results of operations.
Based on the annual assessment, we concluded the fair value of the reporting unit substantially exceeded the carrying value. Additionally, the fair value of each indefinite-lived intangible asset exceeded its carrying value.
See Note 7 to our consolidated financial statements included within this Form 10-K for charges associated with long-lived asset disposal costs and the activity associated with the restructuring reserves.
Pension and other postretirement benefits
We provide qualified and nonqualified defined benefit and defined contribution pension plans, as well as postretirement health care and life insurance benefit plans to our employees and retirees. The costs (benefits) and obligations related to these benefits reflect key assumptions related to general economic conditions, including interest (discount) rates, healthcare cost trend rates, expected rates of return on plan assets and the rates of compensation increase for employees. The costs (benefits) and obligations for these benefit programs are also affected by other assumptions, such as average retirement age, mortality, employee turnover, and plan participation. To the extent our plans’ actual experience, as influenced by changing economic and financial market conditions or by changes to our own plans’ demographics, differs from these assumptions, the costs and obligations for providing these benefits, as well as the plans’ funding requirements, could increase or decrease. When actual results differ from our assumptions, the difference is typically recognized over future periods. In addition, the unrealized gains and losses related to our pension and postretirement benefit obligations may also affect periodic benefit costs (benefits) in future periods.
We use several assumptions and statistical methods to determine the asset values used to calculate both the expected rate of return on assets component of pension cost and to calculate our plans’ funding requirements. As previously disclosed, we changed our method of accounting to the fair value approach for our liability-hedging asset class, which does not involve deferring the impact of excess plan asset gains or losses in the determination of these two components of net periodic benefit cost. This class of assets is comprised solely of fixed income securities and therefore, provides a natural hedge (liability-hedging assets) against the changes in the recorded amount of net periodic benefit cost. We use an actuarial value of assets to determine our plans’ funding requirements. The actuarial value of assets must be within a certain range, high or low, of the actual market value of assets, and is adjusted accordingly.
We select the discount rate used to calculate pension and other postretirement obligations based on a review of available yields on high-quality corporate bonds as of the measurement date. In selecting a discount rate as of December 31, 2024, we placed particular emphasis on a discount rate yield-curve provided by our actuary. This yield-curve, when populated with projected cash flows that represent the expected timing and amount of our plans' benefit payments, produced an effective discount rate of 5.60 percent for our U.S. qualified plan, 5.31 percent for our U.S. nonqualified, and 5.40 percent for our U.S. other postretirement benefit plans.
The discount rates used to determine projected benefit obligation at our December 31, 2024 and 2023 measurement dates for the U.S. qualified plan were 5.60 percent and 4.97 percent, respectively. The effect of the change in the discount rate from 4.97 percent to 5.60 percent at December 31, 2024 resulted in a $52.1 million decrease to our U.S. qualified pension benefit obligations. The effect of the change in the discount rate used to determine net annual benefit cost (income) from 5.16 percent at December 31, 2023 to 4.97 percent at December 31, 2024 resulted in a $0.3 million increase to the 2024 U.S. qualified pension expense.
The change in discount rate from 4.97 percent at December 31, 2023 to 5.60 percent at December 31, 2024 was attributable to an increase in yields on high quality corporate bonds with cash flows matching the timing and amount of our expected future benefit payments between the 2023 and 2024 measurement dates. Using the December 31, 2024 and 2023 yield curves, our U.S. qualified plan cash flows produced a single weighted-average discount rate of approximately 5.60 percent and 4.97 percent, respectively.
In developing the assumption for the long-term rate of return on assets for our U.S. Plan, we take into consideration the technical analysis performed by our outside actuaries, including historical market returns, information on the assumption for long-term real returns by asset class, inflation assumptions, and expectations for standard deviation related to these best estimates. Our long-term rate of return for the fiscal year ended December 31, 2024, 2023 and 2022 was 4.50 percent, 4.75 percent and 2.50 percent, respectively.
For the sensitivity of our pension costs to incremental changes in assumptions see our discussion below.
Sensitivity analysis related to key pension and postretirement benefit assumptions.
A one-half percent increase in the assumed discount rate would have decreased pension and other postretirement benefit obligations by $36.4 million and $42.4 million at December 31, 2024 and 2023, respectively, and increased pension and other postretirement benefit costs by $0.3 million, $0.5 million and $0.1 million for 2024, 2023 and 2022, respectively. A one-half percent decrease in the assumed discount rate would have increased pension and other postretirement benefit obligations by $39.1 million and $46.1 million at December 31, 2024 and 2023, respectively, and decreased pension and other postretirement benefit costs by $0.2 million in 2024, $0.1 million in 2023, and zero in 2022.
A one-half percent increase in the assumed expected long-term rate of return on plan assets would have decreased pension costs by $5.0 million, $5.0 million and $6.6 million for 2024, 2023 and 2022, respectively. A one-half percent decrease in the assumed long-term rate of return on plan assets would have increased pension costs by $5.0 million, $5.0 million and $6.6 million for 2024, 2023 and 2022, respectively.
Further details on our pension and other postretirement benefit obligations and net periodic benefit costs (benefits) are found in Note 13 to our consolidated financial statements in this Form 10-K.
Income taxes
We have recorded a valuation allowance to reduce deferred tax assets in certain jurisdictions to the amount that we believe is more likely than not to be realized. In assessing the need for this allowance, we have considered a number of factors including future taxable income, the jurisdictions in which such income is earned and our ongoing tax planning strategies. In the event that we determine that we would not be able to realize all or part of our net deferred tax assets in the future, an adjustment to the deferred tax assets would be charged to income in the period such determination was made. Similarly, should we conclude that we would be able to realize certain deferred tax assets in the future in excess of the net recorded amount, an adjustment to the deferred tax assets would increase income in the period such determination was made.
Additionally, we file income tax returns in the U.S. federal jurisdiction and various state and foreign jurisdictions. Certain income tax returns for FMC entities taxable in the U.S. and significant foreign jurisdictions are open for examination and adjustment. We assess our income tax positions and record a liability for all years open to examination based upon our evaluation of the facts, circumstances and information available at the reporting date. For those tax positions where it is more likely than not that a tax benefit will be sustained, we have recorded the largest amount of tax benefit with a greater than 50 percent likelihood of being realized upon ultimate settlement with a taxing authority that has full knowledge of all relevant information. We adjust these liabilities, if necessary, upon the completion of tax audits or changes in tax law.
See Note 11 to our consolidated financial statements included within this Form 10-K for additional discussion surrounding income taxes.
ITEM 7A. QUANTITATIVE AND QUALITATIVE DISCLOSURES ABOUT MARKET RISK
Our earnings, cash flows and financial position are exposed to market risks relating to fluctuations in commodity prices, interest rates and foreign currency exchange rates. Our policy is to minimize exposure to our cash flow over time caused by changes in commodity, interest and currency exchange rates. To accomplish this, we have implemented a controlled program of risk management consisting of appropriate derivative contracts entered into with major financial institutions.
The analysis below presents the sensitivity of the market value of our financial instruments to selected changes in market rates and prices. The range of changes chosen reflects our view of changes that are reasonably possible over a one-year period. Market value estimates are based on the present value of projected future cash flows considering the market rates and prices chosen.
At December 31, 2024, our net financial instrument position was a net asset of $34.1 million compared to a net liability of $11.4 million at December 31, 2023. The change in the net financial instrument position was primarily due to fluctuations in our foreign exchange portfolios.
Since our risk management programs are generally highly effective, the potential loss in value for each risk management portfolio described below would be largely offset by changes in the value of the underlying exposure.
Foreign Currency Exchange Rate Risk
The primary currencies for which we have exchange rate exposure are the U.S. dollar versus the Brazilian real, Chinese yuan, Indian rupee, euro, Mexican peso and Argentine peso. Foreign currency debt and foreign exchange forward contracts are used in countries where we do business, thereby reducing our net asset exposure. Foreign exchange forward contracts are also used to hedge firm and highly anticipated foreign currency cash flows.
To analyze the effects of changing foreign currency rates, we have performed a sensitivity analysis in which we assume an instantaneous 10 percent change in the foreign currency exchange rates from their levels at December 31, 2024 and 2023, with all other variables (including interest rates) held constant.
| | | | | | | | | | | | | | | | | |
| | | Hedged Currency vs. Functional Currency |
| (in Millions) | Net Asset / (Liability) Position on Consolidated Balance Sheets | | Net Asset / (Liability) Position with 10% Strengthening | | Net Asset / (Liability) Position with 10% Weakening |
| Net asset/(liability) position at December 31, 2024 | $ | 34.1 | | | $ | 50.8 | | | $ | (8.2) | |
| | | | | |
| Net asset/(liability) position at December 31, 2023 | (11.4) | | | 34.4 | | | (56.2) | |
Interest Rate Risk
One of the strategies that we can use to manage interest rate exposure is to enter into interest rate swap agreements. In these agreements, we agree to exchange, at specified intervals, the difference between fixed and variable interest amounts calculated on an agreed-upon notional principal amount. As of December 31, 2024 and 2023, we had no outstanding interest rate swap contracts, and as a result, there was no sensitivity analysis performed over interest rate risk for the periods presented.
Our debt portfolio at December 31, 2024 is composed of 92 percent fixed-rate debt and 8 percent variable-rate debt. The variable-rate component of our debt portfolio principally consists of borrowings under our Credit Facility, commercial paper program, and amounts outstanding under foreign subsidiary credit lines. Changes in interest rates affect different portions of our variable-rate debt portfolio in different ways.
Based on the variable-rate debt in our debt portfolio at December 31, 2024, a one percentage point increase in interest rates would have increased gross interest expense by $2.6 million and a one percentage point decrease in interest rates would have decreased gross interest expense by $2.6 million for the year ended December 31, 2024.
ITEM 8. FINANCIAL STATEMENTS AND SUPPLEMENTARY DATA
FMC CORPORATION
CONSOLIDATED STATEMENTS OF INCOME (LOSS)
| | | | | | | | | | | | | | | | | |
| (in Millions, Except Per Share Data) | Year Ended December 31, |
| 2024 | | 2023 | | 2022 |
| Revenue | $ | 4,246.1 | | | $ | 4,486.8 | | | $ | 5,802.3 | |
| Costs and expenses | | | | | |
| Costs of sales and services | 2,597.2 | | | 2,655.8 | | | 3,475.5 | |
| Gross margin | $ | 1,648.9 | | | $ | 1,831.0 | | | $ | 2,326.8 | |
| Selling, general and administrative expenses | 644.6 | | | 734.3 | | | 775.2 | |
| Research and development expenses | 278.0 | | | 328.8 | | | 314.2 | |
| Restructuring and other charges (income) | 219.8 | | | 212.3 | | | 93.1 | |
| | | | | |
| Total costs and expenses | $ | 3,739.6 | | | $ | 3,931.2 | | | $ | 4,658.0 | |
| Income from continuing operations before non-operating pension and postretirement charges (income), interest expense, net and income taxes | $ | 506.5 | | | $ | 555.6 | | | $ | 1,144.3 | |
| | | | | |
| Non-operating pension and postretirement charges (income) | 18.2 | | | 18.2 | | | 8.6 | |
| | | | | |
| | | | | |
| Interest expense, net | 235.8 | | | 237.2 | | | 151.8 | |
| Income (loss) from continuing operations before income taxes | $ | 252.5 | | | $ | 300.2 | | | $ | 983.9 | |
| Provision (benefit) for income taxes | (150.9) | | | (1,119.3) | | | 145.2 | |
| Income (loss) from continuing operations | $ | 403.4 | | | $ | 1,419.5 | | | $ | 838.7 | |
| Discontinued operations, net of income taxes | (61.8) | | | (98.5) | | | (97.2) | |
| Net income (loss) | $ | 341.6 | | | $ | 1,321.0 | | | $ | 741.5 | |
| Less: Net income (loss) attributable to noncontrolling interests | 0.5 | | | (0.5) | | | 5.0 | |
| Net income (loss) attributable to FMC stockholders | $ | 341.1 | | | $ | 1,321.5 | | | $ | 736.5 | |
| Amounts attributable to FMC stockholders: | | | | | |
| Continuing operations, net of income taxes | $ | 402.9 | | | $ | 1,420.0 | | | $ | 833.7 | |
| Discontinued operations, net of income taxes | (61.8) | | | (98.5) | | | (97.2) | |
| Net income (loss) attributable to FMC stockholders | $ | 341.1 | | | $ | 1,321.5 | | | $ | 736.5 | |
| Basic earnings (loss) per common share attributable to FMC stockholders: | | | | | |
| Continuing operations | $ | 3.22 | | | $ | 11.34 | | | $ | 6.60 | |
| Discontinued operations | (0.49) | | | (0.79) | | | (0.77) | |
| Net income (loss) attributable to FMC stockholders | $ | 2.73 | | | $ | 10.55 | | | $ | 5.83 | |
| Diluted earnings (loss) per common share attributable to FMC stockholders: | | | | | |
| Continuing operations | $ | 3.21 | | | $ | 11.31 | | | $ | 6.58 | |
| Discontinued operations | (0.49) | | | (0.78) | | | (0.77) | |
| Net income (loss) attributable to FMC stockholders | $ | 2.72 | | | $ | 10.53 | | | $ | 5.81 | |
The accompanying Notes are an integral part of these consolidated financial statements.
FMC CORPORATION
CONSOLIDATED STATEMENTS OF COMPREHENSIVE INCOME (LOSS)
| | | | | | | | | | | | | | | | | |
| (in Millions) | Year Ended December 31, |
| 2024 | | 2023 | | 2022 |
| Net income (loss) | $ | 341.6 | | | $ | 1,321.0 | | | $ | 741.5 | |
| Other comprehensive income (loss), net of tax: | | | | | |
| Foreign currency adjustments: | | | | | |
| Foreign currency translation gain (loss) arising during the period | $ | (53.6) | | | $ | 29.7 | | | $ | (103.1) | |
| | | | | |
| Reclassification of foreign currency translation (gains) losses | $ | — | | | $ | — | | | $ | 4.2 | |
Total foreign currency adjustments (1) | $ | (53.6) | | | $ | 29.7 | | | $ | (98.9) | |
| Derivative instruments: | | | | | |
| Unrealized hedging gains (losses) and other, net of tax expense (benefit) of $7.8 in 2024, $(29.1) in 2023 and $(17.2) in 2022 | $ | 33.2 | | | $ | (72.4) | | | $ | (65.4) | |
Reclassification of deferred hedging (gains) losses and other, included in net income (loss), net of tax (expense) benefit of $(0.6) in 2024, $31.7 in 2023 and $19.1 in 2022 (3) | (0.5) | | | 73.9 | | | 35.9 | |
| Total derivative instruments, net of tax expense (benefit) of $7.2 in 2024, $2.6 in 2023 and $1.9 in 2022 | $ | 32.7 | | | $ | 1.5 | | | $ | (29.5) | |
| Pension and other postretirement benefits: | | | | | |
Unrealized actuarial gains (losses) and prior service (costs) credits, net of tax expense (benefit) of $1.2 in 2024, $2.9 in 2023 and $(4.3) in 2022 (2) | $ | 4.9 | | | $ | 11.4 | | | $ | (15.7) | |
Reclassification of net actuarial and other (gain) loss, amortization of prior service costs and settlement charges, included in net income, net of tax (expense) benefit of $2.8 in 2024, $2.9 in 2023 and $2.4 in 2022 (3) | 10.9 | | | 11.0 | | | 9.1 | |
| Total pension and other postretirement benefits, net of tax expense (benefit) of $4.0 in 2024, $5.8 in 2023 and $(1.9) in 2022 | $ | 15.8 | | | $ | 22.4 | | | $ | (6.6) | |
| | | | | |
| Other comprehensive income (loss), net of tax | $ | (5.1) | | | $ | 53.6 | | | $ | (135.0) | |
| Comprehensive income (loss) | $ | 336.5 | | | $ | 1,374.6 | | | $ | 606.5 | |
| Less: Comprehensive income (loss) attributable to the noncontrolling interest | (0.5) | | | — | | | 4.1 | |
| Comprehensive income (loss) attributable to FMC stockholders | $ | 337.0 | | | $ | 1,374.6 | | | $ | 602.4 | |
____________________
(1)Income taxes are not provided for foreign currency translation because the related investments are essentially permanent in duration.
(2)At December 31 of each year, we remeasure our pension and postretirement plan obligations at which time we record any actuarial gains (losses) and prior service (costs) credits to other comprehensive income. See Note 13 to the consolidated financial statements included within this Form 10-K for further details.
(3)For more detail on the components of these reclassifications and the affected line item on the consolidated statements of income (loss), see Note 15 to the consolidated financial statements included within this Form 10-K for further details.
The accompanying Notes are an integral part of these consolidated financial statements.
FMC CORPORATION
CONSOLIDATED BALANCE SHEETS | | | | | | | | | | | |
| December 31, |
| (in Millions, Except Share and Par Value Data) | 2024 | | 2023 |
| ASSETS | | | |
| Current assets | | | |
| Cash and cash equivalents | $ | 357.3 | | | $ | 302.4 | |
| Trade receivables, net of allowance of $39.4 in 2024 and $29.1 in 2023 | 2,903.2 | | | 2,703.2 | |
| Inventories | 1,201.6 | | | 1,724.6 | |
| Prepaid and other current assets | 496.2 | | | 398.9 | |
| | | |
| | | |
| Total current assets | $ | 4,958.3 | | | $ | 5,129.1 | |
| Investments | 25.6 | | | 19.8 | |
| Property, plant and equipment, net | 849.7 | | | 892.5 | |
| Goodwill | 1,507.0 | | | 1,593.6 | |
| Other intangibles, net | 2,360.7 | | | 2,465.1 | |
| Other assets including long-term receivables, net | 428.2 | | | 489.5 | |
| Deferred income taxes | 1,523.8 | | | 1,336.6 | |
| | | |
| Total assets | $ | 11,653.3 | | | $ | 11,926.2 | |
| LIABILITIES AND EQUITY | | | |
| Current liabilities | | | |
| Short-term debt and current portion of long-term debt | $ | 337.4 | | | $ | 934.0 | |
| Accounts payable, trade and other | 768.5 | | | 602.4 | |
| Advance payments from customers | 453.8 | | | 482.1 | |
| Accrued and other liabilities | 755.2 | | | 684.8 | |
| Accrued customer rebates | 489.9 | | | 480.9 | |
| Guarantees of vendor financing | 85.5 | | | 69.6 | |
| Accrued pension and other postretirement benefits, current | 6.4 | | | 6.4 | |
| Income taxes | 122.5 | | | 124.4 | |
| | | |
| Total current liabilities | $ | 3,019.2 | | | $ | 3,384.6 | |
| Long-term debt, less current portion | 3,027.9 | | | 3,023.6 | |
| Accrued pension and other postretirement benefits, long-term | 19.4 | | | 24.4 | |
| Environmental liabilities, continuing and discontinued | 521.3 | | | 494.7 | |
| Deferred income taxes | 86.0 | | | 158.1 | |
| | | |
| Other long-term liabilities | 470.7 | | | 407.4 | |
| Commitments and contingent liabilities (Note 19) | | | |
| Equity | | | |
| Preferred stock, no par value, authorized 5,000,000 shares; no shares issued in 2024 or 2023 | $ | — | | | $ | — | |
| Common stock, $0.10 par value, authorized 260,000,000 shares in 2024 and 2023; 185,983,792 shares issued in 2024 and 2023 | 18.6 | | | 18.6 | |
| Capital in excess of par value of common stock | 966.5 | | | 935.6 | |
| Retained earnings | 6,637.5 | | | 6,587.1 | |
| Accumulated other comprehensive income (loss) | (410.6) | | | (406.5) | |
| Treasury stock, common, at cost - 2024: 61,142,890 shares, 2023: 61,223,032 shares | (2,724.5) | | | (2,723.9) | |
| Total FMC stockholders’ equity | $ | 4,487.5 | | | $ | 4,410.9 | |
| Noncontrolling interests | 21.3 | | | 22.5 | |
| Total equity | $ | 4,508.8 | | | $ | 4,433.4 | |
| Total liabilities and equity | $ | 11,653.3 | | | $ | 11,926.2 | |
The accompanying Notes are an integral part of these consolidated financial statements.
FMC CORPORATION
CONSOLIDATED STATEMENTS OF CASH FLOWS
| | | | | | | | | | | | | | | | | |
| (in Millions) | Year Ended December 31, |
| 2024 | | 2023 | | 2022 |
| Cash provided (required) by operating activities of continuing operations: | | | | | |
| Net income (loss) | $ | 341.6 | | | $ | 1,321.0 | | | $ | 741.5 | |
| Discontinued operations, net of income taxes | 61.8 | | | 98.5 | | | 97.2 | |
| Income (loss) from continuing operations | $ | 403.4 | | | $ | 1,419.5 | | | $ | 838.7 | |
| Adjustments from income (loss) from continuing operations to cash provided (required) by operating activities of continuing operations: | | | | | |
| Depreciation and amortization | $ | 176.3 | | | $ | 184.3 | | | $ | 169.4 | |
| Restructuring and other charges (income) | 219.8 | | | 212.3 | | | 93.1 | |
| Deferred income taxes | (340.3) | | | (1,292.8) | | | (52.7) | |
| Pension and other postretirement benefits | 20.0 | | | 20.9 | | | 12.5 | |
| Share-based compensation | 23.8 | | | 25.9 | | | 24.2 | |
| | | | | |
| Changes in operating assets and liabilities, net of effect of acquisitions and divestitures: | | | | | |
| Trade receivables, net | $ | (348.8) | | | $ | 192.4 | | | $ | (443.9) | |
| Guarantees of vendor financing | 15.9 | | | (72.4) | | | (64.2) | |
| Advance payments from customers | (26.5) | | | (199.1) | | | 52.1 | |
| Accrued customer rebates | 30.7 | | | 16.0 | | | 69.6 | |
| Inventories | 475.8 | | | (72.8) | | | (182.3) | |
| Accounts payable, trade and other | 171.7 | | | (626.0) | | | 165.3 | |
| Income taxes | (5.4) | | | (62.8) | | | 19.1 | |
| Pension and other postretirement benefit contributions | (5.5) | | | (2.4) | | | (4.5) | |
| Environmental spending, continuing, net of recoveries | (35.4) | | | (34.5) | | | (26.9) | |
Restructuring and other spending (1) | (130.0) | | | (30.3) | | | (35.2) | |
| Transaction and integration costs | — | | | — | | | (0.5) | |
Change in other operating assets and liabilities, net (2) | 91.2 | | | 21.5 | | | 26.2 | |
| Cash provided (required) by operating activities of continuing operations | $ | 736.7 | | | $ | (300.3) | | | $ | 660.0 | |
| Cash provided (required) by operating activities of discontinued operations: | | | | | |
| Environmental spending, discontinued, net of recoveries | $ | (52.1) | | | $ | (54.5) | | | $ | (47.0) | |
| | | | | |
| Other discontinued spending | (13.5) | | | (31.6) | | | (30.6) | |
| Cash provided (required) by operating activities of discontinued operations | $ | (65.6) | | | $ | (86.1) | | | $ | (77.6) | |
____________________
(1)In addition to cash payments shown in our roll forward of restructuring reserves in Note 7 to our consolidated financial statements included within this Form 10-K, the restructuring and other spending amount above for the year ended December 31, 2024 includes spending of $14.0 million in divestiture transaction costs related to the GSS sale and $6.9 million related to the Furadan® asset retirement obligations. The years ended 2023 and 2022 include spending of $9.7 million and $10.0 million related to the Furadan® asset retirement obligations and $1.1 million and $3.2 million related to certain historical India indirect tax matters. For additional detail on restructuring and other charges activities, see Note 7 to our consolidated financial statements included within this Form 10-K.
(2)Changes in all periods represent timing of payments associated with all other operating assets and liabilities.
The accompanying Notes are an integral part of these consolidated financial statements.
FMC CORPORATION
CONSOLIDATED STATEMENTS OF CASH FLOWS (CONTINUED)
| | | | | | | | | | | | | | | | | |
| (in Millions) | Year Ended December 31, |
| 2024 | | 2023 | | 2022 |
| Cash provided (required) by investing activities of continuing operations: | | | | | |
| Capital expenditures | $ | (67.9) | | | $ | (133.9) | | | $ | (142.3) | |
| | | | | |
| | | | | |
Acquisitions, including cost and equity method, net (3) | (4.8) | | | (16.5) | | | (198.2) | |
| Proceeds from the sale of the Global Specialty Solutions ("GSS") business | 340.0 | | | — | | | — | |
Proceeds from land disposition (4) | — | | | 5.8 | | | 50.5 | |
Other investing activities (5) | (3.7) | | | (9.8) | | | 23.6 | |
| Cash provided (required) by investing activities of continuing operations | $ | 263.6 | | | $ | (154.4) | | | $ | (266.4) | |
| | | | | |
| | | | | |
| | | | | |
| | | | | |
| Cash provided (required) by financing activities of continuing operations: | | | | | |
| | | | | |
| Increase (decrease) in short-term debt | $ | (576.7) | | | $ | 400.7 | | | $ | 115.2 | |
| Proceeds from borrowing of long-term debt | — | | | 1,498.6 | | | — | |
| Financing fees and interest rate swap settlements | — | | | (0.8) | | | 16.3 | |
| Repayments of long-term debt | — | | | (1,200.0) | | | (1.4) | |
| | | | | |
| | | | | |
| Distributions to noncontrolling interests | (0.7) | | | (0.6) | | | (0.5) | |
Dividends paid (6) | (290.6) | | | (290.5) | | | (267.5) | |
| Issuances of common stock, net | 0.2 | | | 5.3 | | | 9.4 | |
| | | | | |
| Repurchases of common stock under publicly announced program | — | | | (75.0) | | | (100.0) | |
| Other repurchases of common stock | (2.3) | | | (6.2) | | | (8.9) | |
| | | | | |
| Cash provided (required) by financing activities of continuing operations | $ | (870.1) | | | $ | 331.5 | | | $ | (237.4) | |
| | | | | |
| | | | | |
| | | | | |
| | | | | |
| | | | | |
| Effect of exchange rate changes on cash and cash equivalents | (9.7) | | | (60.3) | | | (23.4) | |
| Increase (decrease) in cash and cash equivalents | $ | 54.9 | | | $ | (269.6) | | | $ | 55.2 | |
| | | | | |
| | | | | |
| | | | | |
| Cash and cash equivalents, beginning of period | 302.4 | | | 572.0 | | | 516.8 | |
| | | | | |
| Cash and cash equivalents, end of period | $ | 357.3 | | | $ | 302.4 | | | $ | 572.0 | |
____________________
(3)The acquisitions, including cost and equity method, net amount in 2023 includes an $11.9 million payment related to the in-process research and development assets acquired. The 2022 activity includes the purchase price of Biophero of approximately $193 million.
(4)During December 2022, we finalized a land transfer agreement with the Shanghai Municipal People's Government. In the years ended December 31, 2023 and 2022, we received cash proceeds of $5.8 million and $50.5 million, respectively, for the land transfer.
(5)Included in the above is cash spending associated with contract manufacturers was $2.7 million, $2.9 million and $6.8 million for the years ended December 31, 2024, 2023 and 2022, respectively.
(6)See Note 15 to the consolidated financial statements included within this Form 10-K regarding our quarterly cash dividend.
Supplemental disclosure of cash flow information: Cash paid for interest, net of capitalized interest was $232.2 million, $229.6 million and $144.0 million, and income taxes paid, net of refunds was $156.3 million, $180.1 million and $122.0 million in December 31, 2024, 2023 and 2022, respectively. Non-cash additions to property, plant and equipment and other assets at December 31, 2024, 2023 and 2022 were $26.1 million, $18.6 million and $40.4 million, respectively. Non-cash investing activities include investments of $16.4 million, zero, and $19.3 million investment representing the deferred purchase price in a trade receivables securitization program for the years ended December 31, 2024, 2023 and 2022, respectively.
The accompanying Notes are an integral part of these consolidated financial statements.
FMC CORPORATION
CONSOLIDATED STATEMENTS OF CHANGES IN EQUITY | | | | | | | | | | | | | | | | | | | | | | | | | | | | | | | | | | | | | | | | | |
| | FMC Stockholders’ Equity | | | | |
| (in Millions, Except Per Share Data) | Common Stock, $0.10 Par Value | | Capital In Excess of Par | | Retained Earnings | | Accumulated Other Comprehensive Income (Loss) | | Treasury Stock | | Non-controlling
Interest | | Total Equity |
| Balance December 31, 2021 | $ | 18.6 | | | $ | 880.4 | | | $ | 5,092.9 | | | $ | (325.5) | | | $ | (2,542.1) | | | $ | 19.4 | | | $ | 3,143.7 | |
| | | | | | | | | | | | | |
| | | | | | | | | | | | | |
| Net income (loss) | — | | | — | | | 736.5 | | | — | | | — | | | 5.0 | | | 741.5 | |
| Stock compensation plans | — | | | 28.8 | | | — | | | — | | | 4.7 | | | — | | | 33.5 | |
| Shares for benefit plan trust | — | | | — | | | — | | | — | | | 0.1 | | | — | | | 0.1 | |
| Net pension and other benefit actuarial gains (losses) and prior service cost, net of income tax | — | | | — | | | — | | | (6.6) | | | — | | | — | | | (6.6) | |
| Net hedging gains (losses) and other, net of income tax | — | | | — | | | — | | | (29.5) | | | — | | | — | | | (29.5) | |
| Foreign currency translation adjustments | — | | | — | | | — | | | (98.0) | | | — | | | (0.9) | | | (98.9) | |
| Dividends ($2.17 per share) | — | | | — | | | (273.5) | | | — | | | — | | | — | | | (273.5) | |
| Repurchases of common stock | — | | | — | | | — | | | — | | | (108.9) | | | — | | | (108.9) | |
| | | | | | | | | | | | | |
| | | | | | | | | | | | | |
| Distributions to noncontrolling interests | — | | | — | | | — | | | — | | | — | | | (0.5) | | | (0.5) | |
| Balance December 31, 2022 | $ | 18.6 | | | $ | 909.2 | | | $ | 5,555.9 | | | $ | (459.6) | | | $ | (2,646.2) | | | $ | 23.0 | | | $ | 3,400.9 | |
| | | | | | | | | | | | | |
| Net income (loss) | — | | | — | | | 1,321.5 | | | — | | | — | | | (0.5) | | | 1,321.0 | |
| Stock compensation plans | — | | | 26.4 | | | — | | | — | | | 5.2 | | | — | | | 31.6 | |
| Shares for benefit plan trust | — | | | — | | | — | | | — | | | (1.7) | | | — | | | (1.7) | |
| Net pension and other benefit actuarial gains (losses) and prior service cost, net of income tax | — | | | — | | | — | | | 22.4 | | | — | | | — | | | 22.4 | |
| Net hedging gains (losses) and other, net of income tax | — | | | — | | | — | | | 1.5 | | | — | | | — | | | 1.5 | |
| Foreign currency translation adjustments | — | | | — | | | — | | | 29.2 | | | — | | | 0.5 | | | 29.7 | |
| Dividends ($2.32 per share) | — | | | — | | | (290.3) | | | — | | | — | | | — | | | (290.3) | |
| Repurchases of common stock | — | | | — | | | — | | | — | | | (81.2) | | | — | | | (81.2) | |
| | | | | | | | | | | | | |
| | | | | | | | | | | | | |
| | | | | | | | | | | | | |
| Distributions to noncontrolling interests | — | | | — | | | — | | | — | | | — | | | (0.5) | | | (0.5) | |
| Balance December 31, 2023 | $ | 18.6 | | | $ | 935.6 | | | $ | 6,587.1 | | | $ | (406.5) | | | $ | (2,723.9) | | | $ | 22.5 | | | $ | 4,433.4 | |
| | | | | | | | | | | | | |
| Net income (loss) | — | | | — | | | 341.1 | | | — | | | — | | | 0.5 | | | 341.6 | |
| Stock compensation plans | — | | | 30.9 | | | — | | | — | | | 1.8 | | | — | | | 32.7 | |
| Shares for benefit plan trust | — | | | — | | | — | | | — | | | (0.1) | | | — | | | (0.1) | |
| Net pension and other benefit actuarial gains (losses) and prior service cost, net of income tax | — | | | — | | | — | | | 15.8 | | | — | | | — | | | 15.8 | |
| Net hedging gains (losses) and other, net of income tax | — | | | — | | | — | | | 32.7 | | | — | | | — | | | 32.7 | |
| Foreign currency translation adjustments | — | | | — | | | — | | | (52.6) | | | — | | | (1.0) | | | (53.6) | |
| Dividends ($2.32 per share) | — | | | — | | | (290.7) | | | — | | | — | | | — | | | (290.7) | |
| Repurchases of common stock | — | | | — | | | — | | | — | | | (2.3) | | | — | | | (2.3) | |
| Distributions of noncontrolling interests | — | | | — | | | — | | | — | | | — | | | (0.7) | | | (0.7) | |
| | | | | | | | | | | | | |
| | | | | | | | | | | | | |
| | | | | | | | | | | | | |
| Balance December 31, 2024 | $ | 18.6 | | | $ | 966.5 | | | $ | 6,637.5 | | | $ | (410.6) | | | $ | (2,724.5) | | | $ | 21.3 | | | $ | 4,508.8 | |
| | | | | | | | | | | | | |
The accompanying Notes are an integral part of these consolidated financial statements.
FMC CORPORATION
Notes to Consolidated Financial Statements
Note 1: Principal Accounting Policies and Related Financial Information
Nature of operations. We are a global agricultural sciences company dedicated to helping growers produce food, feed, fiber and fuel for an expanding world population while adapting to a changing environment. We operate in a single distinct business segment and develop, market and sell all three major classes of crop protection chemicals: insecticides, herbicides and fungicides, as well as biologicals, crop nutrition, and seed treatment products, which we group as plant health, and digital and precision agriculture. These products are used in agriculture to enhance crop yield and quality by controlling a broad spectrum of insects, weeds and disease, as well as in non-agricultural markets for pest control.
Basis of consolidation and basis of presentation. The accompanying consolidated financial statements of FMC Corporation and its subsidiaries were prepared in accordance with accounting principles generally accepted in the United States of America ("U.S. GAAP"). Our consolidated financial statements include the accounts of FMC and all entities that we directly or indirectly control. All significant intercompany accounts and transactions are eliminated in consolidation.
Estimates and assumptions. In preparing the financial statements in conformity with U.S. GAAP we are required to make estimates and assumptions that affect the reported amounts of assets and liabilities and disclosures of contingent assets and liabilities at the date of the financial statements and the reported amounts of revenue and expenses during the reporting period. Actual results are likely to differ from those estimates, but we do not believe such differences will materially affect our financial position, results of operations or cash flows.
Cash equivalents. We consider investments in all liquid debt instruments with original maturities of 3 months or less to be cash equivalents.
Trade receivables, net of allowance. Trade receivables consist of amounts owed to us from customer sales and are recorded when revenue is recognized. The allowance for trade receivables represents our best estimate of the probable losses associated with potential customer defaults. In developing our allowance for trade receivables, we use a two-stage process which includes calculating a general formula to develop an allowance to appropriately address the uncertainty surrounding collection risk of our entire portfolio and specific allowances for customers where the risk of collection has been reasonably identified either due to liquidity constraints or disputes over contractual terms and conditions. Our methodology considers current economic conditions as well as forward-looking expectations about expected credit loss.
Our method of calculating the general formula consists of estimating the recoverability of trade receivables based on historical experience, current collection trends, and external business factors such as economic factors, including regional bankruptcy rates, and political factors. Our analysis of trade receivable collection risk is performed quarterly, and the allowance is adjusted accordingly.
We also hold long-term receivables that represent long-term customer receivable balances related to past-due accounts which are not expected to be collected within the current year. Our policy for the review of the allowance for these receivables is consistent with the discussion in the preceding paragraph above on trade receivables. Therefore, on an ongoing basis, we continue to evaluate the credit quality of our long-term receivables utilizing aging of receivables, collection experience and write-offs, as well as existing economic conditions, to determine if an additional allowance is necessary.
The allowance for trade receivables was $39.4 million and $29.1 million as of December 31, 2024 and 2023, respectively. The allowance for long-term receivables was $21.3 million and $27.1 million at December 31, 2024 and 2023, respectively. The provision to the allowance for receivables charged against operations was $10.4 million, $6.3 million and $(0.5) million for the years ended December 31, 2024, 2023 and 2022, respectively. See Note 8 to the consolidated financial statements included within this Form 10-K for more information.
FMC CORPORATION
Notes to Consolidated Financial Statements — (Continued)
Investments. Investments in companies in which our ownership interest is 50 percent or less and in which we exercise significant influence over operating and financial policies are accounted for using the equity method. Under the equity method, original investments are recorded at cost and adjusted by our share of undistributed earnings and losses of these investments. Majority owned investments in which our control is restricted are also accounted for using the equity method. As of December 31, 2024 and 2023, we do not own any equity method investments. All other investments are carried at their fair values or at cost, as appropriate and are not material to our consolidated financial statements. FMC Ventures, which was established in 2020, is our venture capital arm targeting strategic investments in start-ups and early-stage companies that are developing and applying emerging technologies in the agricultural industry. The accounting guidance requires these nonmarketable equity securities to be recorded at cost and adjusted to fair value each reporting period. However, the guidance allows for a measurement alternative, which is to record the investment at cost, less impairment, if any, and subsequently adjust for observable price changes. Each reporting period, we review the portfolio for any observable price changes or potential indicators of impairment. At December 31, 2024, our investments made through FMC Ventures individually and in the aggregate are not significant to our financial results.
Inventories. Inventories are stated at the lower of cost or net realizable value. Inventory costs include those costs directly attributable to products before sale, including all manufacturing overhead but excluding distribution costs. All inventories are determined on a first-in, first-out ("FIFO") basis.
Property, plant and equipment. We record property, plant and equipment, including capitalized interest, at cost. We recognize acquired property, plant and equipment, from acquisitions at its estimated fair value. Depreciation is provided principally on the straight-line basis over the estimated useful lives of the assets (land improvements — 20 years, buildings and building equipment — 15 to 40 years, and machinery and equipment — 3 to 18 years). Gains and losses are reflected in income upon sale or retirement of assets. Expenditures that extend the useful lives of property, plant and equipment or increase productivity are capitalized. Ordinary repairs and maintenance are expensed as incurred through operating expense.
Capitalized interest. We capitalized interest costs of $9.6 million, $9.3 million, and $5.6 million in 2024, 2023, and 2022, respectively. These costs were primarily associated with the construction of certain long-lived assets and have been capitalized as part of the cost of those assets. We amortize capitalized interest over the assets’ estimated useful lives.
Impairments of long-lived assets. We review the recovery of the net book value of long-lived assets whenever events and circumstances indicate that the net book value of an asset may not be recoverable from the estimated undiscounted future cash flows expected to result from its use and eventual disposition. In cases where undiscounted expected future cash flows are less than the net book value, we recognize an impairment loss equal to an amount by which the net book value exceeds the fair value of the asset. Long-lived assets to be disposed of are reported at the lower of carrying amount or fair value less cost to sell.
Asset retirement obligations. We record asset retirement obligations ("AROs") at fair value at the time the liability is incurred if we can reasonably estimate the settlement date. The associated AROs are capitalized as part of the carrying amount of related long-lived assets. In future periods, the liability is accreted to its present value and the capitalized cost is depreciated over the useful life of the related asset. We also adjust the liability for changes resulting from the passage of time and/or revisions to the timing or the amount of the original estimate. Upon retirement of the long-lived asset, we either settle the obligation for its recorded amount or incur a gain or loss.
The carrying amounts for the AROs for the years ended December 31, 2024 and 2023 are $10.3 million and $6.4 million, respectively. These amounts are included in "Accrued and other liabilities" and "Other long-term liabilities" on the consolidated balance sheet.
Restructuring and other charges. We continually perform strategic reviews and assess the return on our business. This sometimes results in a plan to restructure the operations of our business. We record an accrual for severance and other exit costs under the provisions of the relevant accounting guidance.
See Note 7 to the consolidated financial statements included within this Form 10-K for more information on Project Focus, the global restructuring program announced in December 2023.
Additionally, as part of these restructuring plans, write-downs of long-lived assets may occur. Two types of assets are impacted: assets to be disposed of by sale and assets to be abandoned. Assets to be disposed of by sale are measured at the lower of carrying amount or estimated net proceeds from the sale. Assets to be abandoned with no remaining future service potential are written down to amounts expected to be recovered. The useful life of assets to be abandoned that have a remaining future service potential are adjusted and depreciation is recorded over the adjusted useful life.
FMC CORPORATION
Notes to Consolidated Financial Statements — (Continued)
Capitalized software. We capitalize the costs of internal use software in accordance with accounting literature which generally requires the capitalization of certain costs incurred to develop or obtain internal use software. We assess the recoverability of capitalized software costs on an ongoing basis and record write-downs to fair value as necessary. We amortize capitalized software costs over expected useful lives ranging from 3 to 10 years. See Note 21 to the consolidated financial statements included within this Form 10-K for the net unamortized computer software balances.
Goodwill and intangible assets. Goodwill and other indefinite life intangible assets are not subject to amortization. Instead, they are subject to at least an annual assessment for impairment by applying a fair value-based test.
We test goodwill and indefinite life intangibles for impairment annually using the criteria prescribed by U.S. GAAP accounting guidance for goodwill and other intangible assets. Based upon our annual impairment assessments conducted in 2024, 2023 and 2022, we did not record any goodwill or intangible asset impairments. During each of these annual assessments, we performed a quantitative assessment using a discounted cash flow model.
Finite-lived intangible assets consist of primarily customer relationships as well as patents, brands, registration rights, industry licenses, and other intangibles and are generally being amortized over periods of approximately 3 to 20 years. See Note 4 to the consolidated financial statements included within this Form 10-K for additional information on goodwill and intangible assets.
Revenue recognition. We recognize revenue when (or as) we satisfy our performance obligation which is when the customer obtains control of the good or service. Rebates due to customers are accrued as a reduction of revenue in the same period that the related sales are recorded based on the contract terms. Refer to Note 3 to the consolidated financial statements included within this Form 10-K for further details.
We record amounts billed for shipping and handling fees as revenue. Costs incurred for shipping and handling are recorded as costs of sales and services. Amounts billed for sales and use taxes, value-added taxes, and certain excise and other specific transactional taxes imposed on revenue-producing transactions are presented on a net basis and excluded from revenue on the consolidated statements of income (loss). We record a liability until remitted to the respective taxing authority.
We periodically enter into prepayment arrangements with customers and receive advance payments for product to be delivered in future periods. These advance payments are recorded as deferred revenue and classified as "Advance payments from customers" on the consolidated balance sheet. Revenue associated with advance payments is recognized as shipments are made and transfer of control to the customer takes place.
Research and development. Research and development costs are expensed as incurred. In-process research and development acquired as part of asset acquisitions, which include license and development agreements, are expensed as incurred and included as a component of "Restructuring and other charges (income)" on the consolidated statements of income (loss).
Income and other taxes. We provide current income taxes on income reported for financial statement purposes adjusted for transactions that do not enter into the computation of income taxes payable. We recognize deferred tax liabilities and assets for the expected future tax consequences of temporary differences between the carrying amounts and the tax basis of assets and liabilities. We have not provided income taxes for other outside basis differences inherent in our investments in subsidiaries because the investments and related unremitted earnings are essentially permanent in duration or we have concluded that no additional tax liability will arise upon disposal or remittance.
Foreign currency. We translate the assets and liabilities of our foreign operations at exchange rates in effect at the balance sheet date. For foreign operations where the functional currency is not the U.S. dollar we record translation gains and losses as a component of accumulated other comprehensive income (loss) in equity. The foreign operations' income statements are translated at the monthly exchange rates for the period.
We record remeasurement gains and losses on monetary assets and liabilities, such as accounts receivables and payables, which are not in the functional currency of the operation. These remeasurement gains and losses are recorded in income as they occur. We generally enter into foreign currency contracts to mitigate the financial risk associated with these transactions. See "Derivative financial instruments" within this Note and Note 18 to the consolidated financial statements included within this Form 10-K.
FMC CORPORATION
Notes to Consolidated Financial Statements — (Continued)
Derivative financial instruments. We mitigate certain financial exposures, including currency risk, interest rate risk and to a lesser extent commodity price exposures, through a controlled program of risk management that includes the use of derivative financial instruments when applicable. We enter into foreign exchange contracts, including forward and purchased option contracts, to reduce the effects of fluctuating foreign currency exchange rates.
We recognize all derivatives on the balance sheet at fair value. On the date the derivative instrument is entered into, we generally designate the derivative as either a hedge of the variability of cash flows to be received or paid related to a forecasted transaction (cash flow hedge) or a hedge of the fair value of a recognized asset or liability or of an unrecognized firm commitment (fair value hedge). We record in accumulated other comprehensive income (loss) changes in the fair value of derivatives that are designated as, and meet all the required criteria for, a cash flow hedge. We then reclassify these amounts into earnings as the underlying hedged item affects earnings. We record immediately in earnings changes in the fair value of derivatives that are not designated as cash flow hedges.
We formally document all relationships between hedging instruments and hedged items, as well as the risk management objective and strategy for undertaking various hedge transactions. This process includes relating derivatives that are designated as fair value or cash flow hedges to specific assets and liabilities on the balance sheet or to specific firm commitments or forecasted transactions. We also formally assess, both at the inception of the hedge and throughout its term, whether each derivative is highly effective in offsetting changes in fair value or cash flows of the hedged item. If we determine that a derivative is not highly effective as a hedge, or if a derivative ceases to be a highly effective hedge, we discontinue hedge accounting with respect to that derivative prospectively.
Treasury stock. We record shares of common stock repurchased at cost as treasury stock, resulting in a reduction of stockholders’ equity on the consolidated balance sheets. When the treasury shares are contributed under our employee benefit plans or issued for option exercises, we use a FIFO method for determining cost. The difference between the cost of the shares and the market price at the time of contribution to an employee benefit plan is added to or deducted from the related capital in excess of par value of common stock.
Segment information. We operate as a single business segment providing innovative solutions to growers around the world. The business is supported by global corporate staff functions. The determination of a single segment is consistent with the financial information regularly reviewed by the chief executive officer, who serves as the Chief Operating Decision Maker (the “CODM”), for purposes of evaluating performance, allocating resources, setting incentive compensation targets and both planning and forecasting future periods. For further details on the information reviewed by the CODM in assessing performance and allocating resources, refer to Note 20 to the consolidated financial statements within this Form 10-K.
As supplemental information, the Company discloses revenue at the geographical and product category level. Refer to Note 3 to the consolidated financial statements included within this Form 10-K for this revenue detail.
Geographic long-lived assets include goodwill and other intangibles, net, property, plant and equipment, net and other non-current assets. Refer to Note 20 to the consolidated financial statements included within this Form 10-K for further details.
Stock compensation plans. We recognize compensation expense in the financial statements for all share options and other equity-based arrangements. Share-based compensation cost is measured at the date of grant, based on the fair value of the award, and is recognized over the employee’s requisite service period. See Note 14 to the consolidated financial statements included within this Form 10-K for further discussion on our share-based compensation.
Environmental obligations. We provide for environmental-related obligations when they are probable and amounts can be reasonably estimated. Where the available information is sufficient to estimate the amount of liability, that estimate has been used. Where the information is only sufficient to establish a range of probable liability and no point within the range is more likely than any other, the lower end of the range has been used.
Estimated obligations to remediate sites that involve oversight by the United States Environmental Protection Agency ("EPA"), or similar government agencies, are generally accrued no later than when a Record of Decision ("ROD"), or equivalent, is issued, or upon completion of a Remedial Investigation/Feasibility Study ("RI/FS"), or equivalent, that is submitted by us and the appropriate government agency or agencies. Estimates are reviewed quarterly and, if necessary, adjusted as additional information becomes available. The estimates can change substantially as additional information becomes available regarding the nature or extent of site contamination, required remediation methods, and other actions by or against governmental agencies or private parties.
FMC CORPORATION
Notes to Consolidated Financial Statements — (Continued)
Our environmental liabilities for continuing and discontinued operations are principally for costs associated with the remediation and/or study of sites at which we are alleged to have released hazardous substances into the environment. Such costs principally include, among other items, RI/FS, site remediation, costs of operation and maintenance of the remediation plan, management costs, fees to outside law firms and consultants for work related to the environmental effort, and future monitoring costs. Estimated site liabilities are determined based upon existing remediation laws and technologies, specific site consultants’ engineering studies or by extrapolating experience with environmental issues at comparable sites.
Included in our environmental liabilities are costs for the operation, maintenance and monitoring ("OM&M") of site remediation plans. Such reserves are based on our best estimates for these OM&M plans. Over time we may incur OM&M costs in excess of these reserves. However, we are unable to reasonably estimate an amount in excess of our recorded reserves because we cannot reasonably estimate the period for which such OM&M plans will need to be in place or the future annual cost of such remediation, as conditions at these environmental sites change over time. Such additional OM&M costs could be significant in total but would be incurred over an extended period of years.
Included in the environmental reserve balance, other assets balance and disclosure of reasonably possible loss contingencies are amounts from third-party insurance policies which we believe are probable of recovery.
Provisions for environmental costs are reflected in income, net of probable and estimable recoveries from named Potentially Responsible Parties ("PRPs") or other third parties. All of our environmental provisions incorporate inflation and are not discounted to their present value, other than our reserve for our Pocatello Tribal Matter. We remeasure this discounted liability balance according to current interest rates. See Note 10 to the consolidated financial statements included within this Form 10-K for further information.
In calculating and evaluating the adequacy of our environmental reserves, we have taken into account the joint and several liability imposed by Comprehensive Environmental Remediation, Compensation and Liability Act ("CERCLA") and the analogous state laws on all PRPs and have considered the identity and financial condition of the other PRPs at each site to the extent possible. We have also considered the identity and financial condition of other third parties from whom recovery is anticipated, as well as the status of our claims against such parties. Although we are unable to forecast the ultimate contributions of PRPs and other third parties with absolute certainty, the degree of uncertainty with respect to each party is taken into account when determining the environmental reserve on a site-by-site basis. Our liability includes our best estimate of the costs expected to be paid before the consideration of any potential recoveries from third parties. We believe that any recorded recoveries related to PRPs are realizable in all material respects. Recoveries are recorded as either an offset in "Environmental liabilities, continuing and discontinued" or as "Other assets including long-term receivables, net" in our consolidated balance sheets in accordance with U.S. accounting literature.
Pension and other postretirement benefits. We provide qualified and nonqualified defined benefit and defined contribution pension plans, as well as postretirement health care and life insurance benefit plans to our employees and retirees. The costs (or benefits) and obligations related to these benefits reflect key assumptions related to general economic conditions, including interest (discount) rates, healthcare cost trend rates, expected rates of return on plan assets and the rates of compensation increase for employees. The costs (or benefits) and obligations for these benefit programs are also affected by other assumptions, such as average retirement age, mortality, employee turnover, and plan participation. To the extent our plans’ actual experience, as influenced by changing economic and financial market conditions or by changes to our own plans’ demographics, differs from these assumptions, the costs and obligations for providing these benefits, as well as the plans’ funding requirements, could increase or decrease. When actual results differ from our assumptions, the difference is typically recognized over future periods. In addition, the unrealized gains and losses related to our pension and postretirement benefit obligations may also affect periodic benefit costs (or benefits) in future periods. See Note 13 to the consolidated financial statements included within this Form 10-K for additional information relating to pension and other postretirement benefits.
FMC CORPORATION
Notes to Consolidated Financial Statements — (Continued)
GSS Divestiture. On July 11, 2024, we signed a definitive agreement to sell our GSS business to Environmental Science US, LLC d/b/a Envu ("Envu"). On November 1, 2024, we received proceeds, net of the preliminary working capital adjustment, of approximately $340.0 million in connection with the completion of the sale. At the time of the sale, $52 million in trade receivables, $20 million in inventories and accrued rebates of $11 million related to the GSS business were transferred to Envu. An allocated portion of goodwill totaling $71 million was also written off in connection with the sale. Certain assets, which are not material, will be transferred to Envu at a later date due to various local timing constraints; however, we received consideration for these assets at closing of the sale and no additional consideration will be received at the date of transfer. We recorded a gain, net of divestiture transaction costs, within "Restructuring and other charges (income)" on the consolidated statements of income (loss) of $174.4 million during the year ended December 31, 2024. The GSS business did not qualify for discontinued operations during 2024 and, therefore, its results prior to the sale closing are included in income (loss) from continuing operations for all periods presented.
Note 2: Recently Issued and Adopted Accounting Pronouncements and Regulatory Items
New accounting guidance and regulatory items
On November 4, 2024, the FASB issued ASU 2024-03, Income Statement - Reporting Comprehensive Income (Topic 220): Expense Disaggregation Disclosures, to require disaggregation of certain expense captions into specified categories in disclosures within the notes of the financial statements. The standard is effective for FMC beginning with the Form 10-K for the year ended December 31, 2027 and early adoption is permitted. The guidance is required to be applied prospectively and amendments in the ASU may be applied prospectively or retrospectively. We are currently evaluating the impacts this standard will have on our disclosures.
On March 6, 2024, the SEC adopted the final rule under SEC Release No. 33-11275, The Enhancement and Standardization of Climate-Related Disclosures for Investors, which will require registrants to provide certain climate-related information in their registration statements and periodic reports. The required disclosures will include, but are not limited to, specific disclosures about climate-related risks and their actual or likely material impacts on the registrant’s business, strategy, and outlook; the governance of climate-related risks and relevant risk management processes; Scope 1 and 2 greenhouse gas (GHG) emissions, if material or included in announced emission targets; certain climate-related financial statement metrics and related disclosures in a note to the audited financial statements; and information about climate-related targets and goals. The rules are effective on a rolling basis for various fiscal years, beginning for the Company with annual reports for the year ending December 31, 2025. However, in response to various legal challenges, the SEC voluntarily stayed the rules on April 4, 2024, which may impact the ultimate effective date of the rules. We will continue to monitor any developments on these rules and expected timing for compliance.
On December 14, 2023, the FASB issued ASU 2023-09, Income Taxes (Topic 740): Changes to the Disclosure Requirements for Income Taxes, to improve the transparency and decision usefulness of income tax disclosures. The standard requires companies to disclose a tabular effective rate reconciliation with certain reconciling items broken out by nature and/or jurisdiction as well as more robust disclosures of income taxes paid, specifically broken out between federal, state and foreign. The standard can be applied prospectively or retrospectively and early adoption is permitted. The ASU is effective for FMC beginning with the Form 10-K for the year ended December 31, 2025. We are currently evaluating the impacts this standard will have on our income tax disclosures.
Recently adopted accounting guidance
On November 27, 2023, the FASB issued ASU 2023-07, Segment Reporting (Topic 280): Improvements to Reportable Segment Disclosures, to improve the disclosures about a public entity's reportable segments and expenses. The standard requires disclosure of the chief operating decision maker's (the "CODM") title and position as well as the measures of segment profit and loss reviewed by the CODM. Companies with multiple reportable segments as well as companies with a single reportable segment are required to adopt the standard and it should be applied retrospectively to all periods presented. The ASU is effective for FMC beginning with the Form 10-K for the year ended December 31, 2024 and, as such, we have adopted the new disclosure requirements in this Form 10-K. See Note 20 to the consolidated financial statements for the required disclosures.
On December 20, 2021, the Organization for Economic Co-operation and Development (the "OECD") released Pillar Two Model Rules defining the global minimum tax, which calls for the taxation of large corporations at a minimum rate of 15%. The OECD continues to release additional guidance on the two-pillar framework. Pillar Two legislation has been enacted in certain jurisdictions in which the Company operates, which became effective for the Company’s financial year beginning January 1, 2024. The 2024 impacts of Pillar Two legislation were not material. We are continuing to evaluate the potential impact on future periods of the Pillar Two Framework, pending legislative adoption by individual countries.
FMC CORPORATION
Notes to Consolidated Financial Statements — (Continued)
In September 2022, the FASB issued ASU No. 2022-04, Liabilities—Supplier Finance Programs (Subtopic 405-50): Disclosure of Supplier Finance Program Obligations. In accordance with the new disclosure requirements, which we have adopted beginning January 1, 2023, we have included information regarding our key program terms and the amount outstanding that remains unpaid at period end as further described below. The roll forward disclosure requirement became effective beginning with this Form 10-K and the required disclosure is included below.
We work with suppliers to optimize payment terms and conditions on accounts payable to improve working capital and cash flows. We offer to a select group of suppliers a voluntary Supply Chain Finance (“SCF”) program with a global financial institution. The suppliers, at their sole discretion, may sell their receivables to the financial institution based on terms negotiated between them. Our obligations to our suppliers are not impacted by our suppliers’ decisions to sell under these arrangements. Obligations outstanding under this program are recorded within "Accounts payable, trade and other" in our condensed consolidated balance sheets and the associated payments are included in operating activities within our condensed consolidated statements of cash flows.
Our payment terms with our suppliers are consistent, regardless of whether a supplier participates in the program. We deem these terms to be commercially reasonable and consistent with the range of industry standards within their respective regions. Under the terms of the agreement, we do not pledge assets as security or make any other forms of guarantees.
FMC's outstanding obligations confirmed as valid under the SCF was $227.4 million and $71.9 million as of December 31, 2024 and 2023, respectively.
| | | | | | | | | | | |
| December 31, |
| (in Millions) | 2024 | | 2023 |
| Confirmed obligations outstanding at the beginning of the year | $ | 71.9 | | | $ | 307.5 | |
| Invoices confirmed during the year | 406.4 | | | 490.6 | |
| Confirmed invoices paid during the year | (250.9) | | | (726.2) | |
| Confirmed obligations at the end of the year | $ | 227.4 | | | $ | 71.9 | |
Note 3: Revenue Recognition
Disaggregation of revenue
We disaggregate revenue from contracts with customers by geographical areas and major product categories. We have three major agricultural product categories: insecticides, herbicides, and fungicides. Plant health, which includes biological products, is also included in the table below.
The following table provides information about disaggregated revenue by major geographical region:
| | | | | | | | | | | | | | | | | |
| Year Ended December 31, |
| (in Millions) | 2024 | | 2023 | | 2022 |
North America (1) | $ | 1,173.4 | | | $ | 1,204.8 | | | $ | 1,435.8 | |
Latin America (1) | 1,389.5 | | | 1,401.1 | | | 2,088.2 | |
| Europe, Middle East & Africa | 834.8 | | | 899.2 | | | 1,039.7 | |
| Asia | 848.4 | | | 981.7 | | | 1,238.6 | |
| Total Revenue | $ | 4,246.1 | | | $ | 4,486.8 | | | $ | 5,802.3 | |
____________________
(1)Countries with sales in excess of 10 percent of consolidated revenue consisted of the U.S. and Brazil. Sales for the years ended December 31, 2024, 2023, and 2022 for the U.S. totaled $1,003.1 million, $978.1 million and $1,288.8 million, respectively, and for Brazil totaled $1,081.1 million, $1,017.3 million and $1,621.1 million, respectively.
FMC CORPORATION
Notes to Consolidated Financial Statements — (Continued)
The following table provides information about disaggregated revenue by major product category: | | | | | | | | | | | | | | | | | |
| Year Ended December 31, |
| (in Millions) | 2024 | | 2023 | | 2022 |
| Insecticides | $ | 2,377.9 | | | $ | 2,639.4 | | | $ | 3,346.6 | |
| Herbicides | 1,280.5 | | | 1,278.4 | | | 1,651.6 | |
| Fungicides | 352.5 | | | 317.6 | | | 383.9 | |
| Plant Health | 200.5 | | | 186.9 | | | 234.1 | |
| Other | 34.7 | | | 64.5 | | | 186.1 | |
| Total Revenue | $ | 4,246.1 | | | $ | 4,486.8 | | | $ | 5,802.3 | |
We earn revenue from the sale of a wide range of products to a diversified base of customers around the world. We develop, market and sell all three major classes of crop protection chemicals (insecticides, herbicides and fungicides) as well as biologicals, crop nutrition, and seed treatment products, which we group as plant health. These products are used in agriculture to enhance crop yield and quality by controlling a broad spectrum of insects, weeds and disease, as well as in non-agricultural markets for pest control. The majority of our product lines consist of insecticides and herbicides, with a smaller portfolio of fungicides mainly used in high value crop segments. We are investing in plant health, which includes our growing biological products. Our insecticides are used to control a wide spectrum of pests, while our herbicide portfolio primarily targets a large variety of difficult-to-control weeds. Products in the other category include various agricultural products such as smaller classes of pesticides, growth promoters, and other miscellaneous revenue sources.
Sale of Goods
Revenue from product sales is recognized when (or as) we satisfy a performance obligation by transferring the promised goods to a customer, that is, when control of the good transfers to the customer. The customer is then invoiced at the agreed-upon price with payment terms generally ranging from 30 to 90 days, with some regions providing terms longer than 90 days. We do not typically give payment terms that exceed 360 days; however, in certain geographical regions such as Latin America, these terms may be given in limited circumstances. Additionally, a timing difference of over one year can exist between when products are delivered to the customer and when payment is received from the customer in these regions; however, the effect of these sales is not material to the financial statements as a whole. Furthermore, we have assessed the circumstances and arrangements in these regions and determined that the contracts with these customers do not contain a significant financing component.
In determining when the control of goods is transferred, we typically assess, among other things, the transfer of risk and title and the shipping terms of the contract. The transfer of title and risk typically occurs either upon shipment to the customer or upon receipt by the customer. As such, we typically recognize revenue when goods are shipped based on the relevant Incoterm for the product order, or in some regions, when delivery to the customer’s requested destination has occurred. When we perform shipping and handling activities after the transfer of control to the customer (e.g., when control transfers prior to delivery), they are considered as fulfillment activities, and accordingly, the costs are accrued for when the related revenue is recognized. For FOB shipping point terms, revenue is recognized at the time of shipment since the customer gains control at this point in time.
Sales Incentives and Other Variable Considerations
As a part of our customary business practice, we offer a number of sales incentives to our customers including volume discounts, retailer incentives, and prepayment options. The variable considerations given can differ by products, support levels and other eligibility criteria. For all such contracts that include any variable consideration, we estimate the amount of variable consideration that should be included in the transaction price utilizing either the expected value method or the most likely amount method depending on the nature of the variable consideration. Variable consideration is included in the transaction price if, in our judgment, it is probable that a significant future reversal of cumulative revenue under the contract will not occur. Although determining the transaction price for these considerations requires significant judgment, we have significant historical experience with incentives provided to customers and estimate the expected consideration considering historical patterns of incentive payouts. These estimates are reassessed each reporting period as required.
FMC CORPORATION
Notes to Consolidated Financial Statements — (Continued)
In addition to the variable considerations described above, in certain instances, we may require our customers to meet certain volume thresholds within their contract term. We estimate what amount of variable consideration should be included in the transaction price at contract inception and continually reassess this estimation each reporting period to determine situations when the minimum volume thresholds will not be met.
Right of Return
We extend an assurance warranty offering customers a right of refund or exchange in case delivered product does not conform to specifications. Additionally, in certain regions and arrangements, we may offer a right of return for a specified period. Both instances are accounted for as a right of return and transaction price is adjusted for an estimate of expected returns. Replacement products are accounted for under the warranty guidance if the customer exchanges one product for another of the same kind, quality, and price. We have significant experience with historical return patterns and use this experience to include returns in the estimate of transaction price.
Contract Asset and Contract Liability Balances
We satisfy our obligations by transferring goods and services in exchange for consideration from customers. The timing of performance sometimes differs from the timing the associated consideration is received from the customer, thus resulting in the recognition of a contract asset or contract liability. We recognize a contract liability if the customer's payment of consideration is received prior to completion of our related performance obligation.
The following table presents the opening and closing balances of our receivables, net of allowances and contract liabilities from contracts with customers:
| | | | | | | | | | | | | | | | | |
| (in Millions) | Balance as of December 31, 2024 | | Balance as of December 31, 2023 | | Increase (Decrease) |
| Receivables from contracts with customers, net of allowances | $ | 2,942.9 | | | $ | 2,722.7 | | | $ | 220.2 | |
| Contract liabilities: Advance payments from customers | 453.8 | | | 482.1 | | | (28.3) | |
The amount of revenue recognized in the year ended December 31, 2024 that was included in the opening contract liability balance was $482.1 million.
The balance of receivables from contracts with customers listed in the table above include both current trade receivables and long-term receivables, net of allowance for doubtful accounts. The change in allowance for doubtful accounts for both current trade receivables and long-term receivables for any period is representative of the impairment or the write-off of receivables. Refer to Note 8 to the consolidated financial statements included within this Form 10-K for further information.
We periodically enter into prepayment arrangements with customers and receive advance payments for product to be delivered in future periods. Prepayment terms are extended to customers/distributors in order to capitalize on surplus cash with growers. Growers receive bulk payments for their produce, which they leverage to buy our products from distributors through prepayment options. This in turn creates opportunity for distributors to make large prepayments to us for securing the future supply of products to be sold to growers. Prepayments are typically received in the fourth quarter of the fiscal year, and are for the following marketing year indicating that the time difference between prepayment and performance of corresponding performance obligations does not exceed one year.
We recognize these prepayments as a liability under "Advance payments from customers" on the consolidated balance sheets when they are received. Revenue associated with advance payments is recognized as shipments are made and transfer of control to the customer takes place.
Performance Obligations
At contract inception, we assess the goods and services promised in our contracts with customers and identify a performance obligation for each promise to transfer a good or service (or bundle of goods or services) that is distinct. To identify the performance obligations, we consider all the goods or services promised in the contract, whether explicitly stated or implied based on customary business practices. Based on our evaluation, we have determined that our current contracts do not contain more than one performance obligation. Revenue is recognized when (or as) the performance obligation is satisfied, which is when the customer obtains control of the good or service.
FMC CORPORATION
Notes to Consolidated Financial Statements — (Continued)
Periodically, we may enter into contracts with customers which require them to submit a forecast of non-binding purchase obligations to us. These forecasts are typically provided by the customer to us in good faith, and there are no penalties or obligations if the forecasts are not met. Accordingly, we have determined that these are optional purchases and do not represent material rights and are not considered as unsatisfied (or partially satisfied) performance obligations.
In separate and less common circumstances, we may have contracts with customers which have binding purchase requirements for just one quarter of their annual forecasts. Additionally, as noted in the Contract Liabilities section above, we periodically enter into agricultural prepayment arrangements with customers, and receive advance payments for product to be delivered in future periods within one year.
Other Arrangements
Data Licensing
We sometimes grant to third parties a license and right to rely upon pesticide regulatory data filed with government agencies. Such licenses allow a licensee to cite and rely upon our data in connection with the licensee’s application for pesticide registrations as required by law; these licenses can be granted through contract or through a mandatory statutory license, depending on circumstances. In the most common occurrence, when a license is embedded in a contract for supply of pesticide active ingredient from us to the licensee, the license grant is not considered as distinct from other promised goods or services. Accordingly, all promises are treated as a single performance obligation and revenue is recognized at a point when the control of the pesticide products is transferred to the licensee-customer. In the less frequent occurrence, when the license and right to use data is granted without a supply contract, we account for the revenue attributable to the data license as a performance obligation satisfied at a single point in time and recognize revenue on the effective date of such contract. Finally, in those circumstance of mandatory data licensing by statute, such as under U.S. pesticide law, we recognize the data compensation upon the effective date of the data compensation settlement agreement. Payment terms for these arrangements may vary by contract.
Service Arrangements
In limited cases, we engage in providing certain tolling services, such as filling and packing services using raw and packing materials supplied by the customer. Depending on the nature of the tolling services, we determine the appropriate method of satisfaction of the performance obligation, which may be the input or output method. Compared to other goods and services provided by us, service arrangements do not represent a significant portion of sales each year. Payment terms for service arrangements may vary by contract; however, payment is typically due within 30 days of the invoice date.
Practical Expedients and Exemptions
We have elected the following practical expedients under ASC 606:
a.Costs of obtaining a contract: FMC incurs certain costs such as sales commissions which are incremental to obtaining the contract. We have taken the practical expedient of expensing such costs to obtain a contract, as and when they are incurred, as their expected amortization period is one year or less.
b.Significant financing component: We elected not to adjust the promised amount of consideration for the effects of a significant financing component if FMC expects, at contract inception, that the period between the transfer of a promised good or service to a customer and when the customer pays for that good or service will be one year or less.
c.Remaining performance obligations: We elected not to disclose the aggregate amount of the transaction price allocated to remaining performance obligations for its contracts that are one year or less, as the revenue is expected to be recognized within one year. Additionally, we have elected not to disclose information about variable considerations for remaining, wholly unsatisfied performance obligations for which the criteria in paragraph 606-10-32-40 have been met.
d.Shipping and handling costs: We elected to account for shipping and handling activities that occur after the customer has obtained control of a good as fulfillment activities (i.e., an expense) rather than as a promised service.
e.Measurement of transaction price: We have elected to exclude from the measurement of transaction price all taxes assessed by a governmental authority that are both imposed on and concurrent with a specific revenue-producing transaction and collected by us from a customer.
FMC CORPORATION
Notes to Consolidated Financial Statements — (Continued)
Note 4: Goodwill and Intangible Assets
The changes in the carrying amount of goodwill for the years ended December 31, 2024 and 2023 are presented in the table below:
| | | | | | | | | |
| (in Millions) | | | | | Total |
| Balance, December 31, 2022 | | | | | $ | 1,589.3 | |
| | | | | |
| Foreign currency and other adjustments | | | | | 4.3 | |
| | | | | |
| Balance, December 31, 2023 | | | | | $ | 1,593.6 | |
| | | | | |
| | | | | |
| GSS divestiture allocation (See Note 1) | | | | | (71.1) | |
| Foreign currency and other adjustments | | | | | (15.5) | |
| Balance, December 31, 2024 | | | | | $ | 1,507.0 | |
Our fiscal year 2024 annual goodwill and indefinite life impairment test was performed during the third quarter ended September 30, 2024. We determined no goodwill impairment existed and that the fair value was in excess of the carrying value. Additionally, no indefinite-lived asset impairment existed and the estimated fair values also exceeded the carrying value for each of our indefinite-lived intangible assets.
Subsequent to December 31, 2024, the Company has experienced a significant decline in our stock price that, if sustained, could trigger an impairment test of our goodwill. We are evaluating whether this decline represents a triggering event and if an impairment test is required in connection with the preparation of the consolidated financial statements for the first quarter of 2025.
Our intangible assets, other than goodwill, consist of the following:
| | | | | | | | | | | | | | | | | | | | | | | | | | | | | | | | | | | | | | |
| | December 31, 2024 | | December 31, 2023 |
| (in Millions) | Weighted avg. useful life remaining at December 31, 2024 | Gross | | Accumulated Amortization | | Net | | Gross | | Accumulated Amortization | | Net |
| Intangible assets subject to amortization (finite life) | | | | | | | | | | | | |
| Customer relationships | 12 years | $ | 1,117.5 | | | $ | (458.9) | | | $ | 658.6 | | | $ | 1,136.7 | | | $ | (414.2) | | | $ | 722.5 | |
| Patents | 8 years | 1.7 | | | (1.7) | | | — | | | 1.8 | | | (1.6) | | | 0.2 | |
Brands (1) | 8 years | 48.3 | | | (19.2) | | | 29.1 | | | 49.3 | | | (12.9) | | | 36.4 | |
| Purchased and licensed technologies | 12 years | 125.5 | | | (48.2) | | | 77.3 | | | 131.1 | | | (46.2) | | | 84.9 | |
| Other intangibles | 7 years | 2.3 | | | (1.8) | | | 0.5 | | | 2.3 | | | (1.8) | | | 0.5 | |
| | $ | 1,295.3 | | | $ | (529.8) | | | $ | 765.5 | | | $ | 1,321.2 | | | $ | (476.7) | | | $ | 844.5 | |
| | | | | | | | | | | | | | | | | | | | | | | | | | | | | | | | | | | | | | |
| Intangible assets not subject to amortization (indefinite life) | | | | | | | | | | | | |
Crop Protection Brands (2) | | $ | 1,259.0 | | | | | $ | 1,259.0 | | | $ | 1,259.0 | | | | | $ | 1,259.0 | |
Brands (1) | | 325.6 | | | | | 325.6 | | | 350.3 | | | | | 350.3 | |
| In-process research and development | | 10.6 | | | | | 10.6 | | | 11.3 | | | | | 11.3 | |
| | $ | 1,595.2 | | | | | $ | 1,595.2 | | | $ | 1,620.6 | | | | | $ | 1,620.6 | |
| Total intangible assets | $ | 2,890.5 | | | $ | (529.8) | | | $ | 2,360.7 | | | $ | 2,941.8 | | | $ | (476.7) | | | $ | 2,465.1 | |
____________________
(1) Represents trademarks, trade names and know-how.
(2) Represents proprietary brand portfolios, consisting of trademarks, trade names and know-how, of our crop protection brands.
FMC CORPORATION
Notes to Consolidated Financial Statements — (Continued)
| | | | | | | | | | | | | | | | | |
| Year Ended December 31, |
| (in Millions) | 2024 | | 2023 | | 2022 |
| Amortization expense | $ | 65.5 | | | $ | 64.3 | | | $ | 60.6 | |
The estimated pre-tax amortization expense for each of the five years ending December 31, 2025 to 2029 is $70.3 million, $71.5 million, $71.2 million, $71.7 million, and $70.9 million, respectively.
Note 5: Inventories
Inventories consisted of the following: | | | | | | | | | | | |
| December 31, |
| (in Millions) | 2024 | | 2023 |
| Finished goods | $ | 433.5 | | | $ | 643.8 | |
| Work in process | 548.6 | | | 732.2 | |
| Raw materials, supplies and other | 219.5 | | | 348.6 | |
| Net inventories | $ | 1,201.6 | | | $ | 1,724.6 | |
Note 6: Property, Plant and Equipment
Property, plant and equipment consisted of the following: | | | | | | | | | | | |
| December 31, |
| (in Millions) | 2024 | | 2023 |
| Land and land improvements | $ | 96.3 | | | $ | 98.1 | |
| | | |
| Buildings and building equipment | 537.2 | | | 540.0 | |
| Machinery and equipment | 757.7 | | | 717.2 | |
| Construction in progress | 206.7 | | | 204.5 | |
| Total cost | $ | 1,597.9 | | | $ | 1,559.8 | |
| Accumulated depreciation | (748.2) | | | (667.3) | |
| Property, plant and equipment, net | $ | 849.7 | | | $ | 892.5 | |
_________________________
Depreciation expense was $68.7 million, $73.5 million, and $71.1 million in 2024, 2023 and 2022, respectively.
Note 7: Restructuring and Other Charges (Income)
The following table shows total restructuring and other charges (income) included in the respective line items of the consolidated statements of income (loss):
| | | | | | | | | | | | | | | | | |
| | Year Ended December 31, |
| (in Millions) | 2024 | | 2023 | | 2022 |
| Restructuring charges (income) | $ | 303.0 | | | $ | 48.4 | | | $ | (26.1) | |
| Other charges (income), net | (83.2) | | | 163.9 | | | 119.2 | |
| Total restructuring and other charges (income) | $ | 219.8 | | | $ | 212.3 | | | $ | 93.1 | |
FMC CORPORATION
Notes to Consolidated Financial Statements — (Continued)
Restructuring charges (income) | | | | | | | | | | | | | | | | | | | | | | | |
| | | | | |
| (in Millions) | Severance and Employee Benefits | | Other Charges (Income) (1) | | Asset Disposal Charges (2) | | Total |
| | | | | | | |
| Project Focus | $ | 55.8 | | | $ | 163.1 | | | $ | 87.0 | | | $ | 305.9 | |
| | | | | | | |
| | | | | | | |
| Other items | — | | | (2.9) | | | — | | | (2.9) | |
| Year ended December 31, 2024 | $ | 55.8 | | | $ | 160.2 | | | $ | 87.0 | | | $ | 303.0 | |
| | | | | | | |
| Project Focus | $ | 40.1 | | | $ | 5.4 | | | $ | — | | | $ | 45.5 | |
| DuPont Crop restructuring | — | | | (8.1) | | | 2.8 | | | (5.3) | |
| Other items | 6.9 | | | 1.3 | | | — | | | 8.2 | |
| Year ended December 31, 2023 | $ | 47.0 | | | $ | (1.4) | | | $ | 2.8 | | | $ | 48.4 | |
| | | | | | | |
| DuPont Crop restructuring | $ | — | | | $ | (49.9) | | | $ | 1.2 | | | $ | (48.7) | |
| Regional realignment | 3.8 | | | 4.1 | | | — | | | 7.9 | |
| Other items | 2.1 | | | 2.6 | | | 10.0 | | | 14.7 | |
| Year ended December 31, 2022 | $ | 5.9 | | | $ | (43.2) | | | $ | 11.2 | | | $ | (26.1) | |
____________________
(1)Other charges, primarily represents third-party costs associated with various restructuring activities. The year ended December 31, 2024, includes $132.1 million related to contract abandonment charges. Other income, if applicable, primarily represents favorable developments on previously recorded exit costs and recoveries associated with restructuring. The year ended December 31, 2024 includes a $3.1 million gain recognized on the disposition of a previously closed manufacturing site. The years ended December 31, 2023 and 2022 include the recognition of gains of $5.8 million and $50.5 million, respectively, in connection with an agreement for land disposition of a previously closed manufacturing site.
(2)Primarily represents asset write-offs (recoveries), and accelerated depreciation and impairment charges on long-lived assets, which were or are to be abandoned. To the extent incurred, the acceleration effect of re-estimating settlement dates and revised cost estimates associated with asset retirement obligations due to facility shutdowns, are also included within the asset disposal charges.
Project Focus
In 2023, we implemented a global restructuring plan, referred to as "Project Focus," designed to right-size our cost base and optimize our footprint and organizational structure with a focus on driving significant cost improvement and productivity in light of the precipitous drop in demand across the crop protection industry in 2023.
For the year ended December 31, 2024, we incurred $132.1 million of contract abandonment charges as a result of the continued evaluation of our supply chain footprint during the fourth quarter of 2024 and $53.3 million of non-cash asset write off charges resulting from the contract cessation with one of our third-party manufacturers during the second quarter of 2024. The decision to exit these agreements was driven in part by our ability to source these materials from lower cost locations. Charges incurred in connection with Project Focus also consist of $55.8 million in severance and employee separation charges, including costs associated with the CEO transition, $31.0 million of professional service provider costs and other miscellaneous charges associated with the project, accelerated depreciation of $20.5 million on assets identified for disposal in connection with the restructuring initiative, and $13.2 million of asset impairment charges. The charges incurred during 2024, as well as $45.5 million of charges incurred in 2023, are included in the total estimated range for Project Focus. The remaining amounts will be reflected in our consolidated results of operations as they become probable and estimable or a triggering event is identified in accordance with the relevant accounting guidance.
During the year ended December 31, 2024, we also recognized income of $2.9 million related to previously implemented restructuring initiatives including a gain recognized on the disposition of a previously closed manufacturing site.
FMC CORPORATION
Notes to Consolidated Financial Statements — (Continued)
Roll forward of restructuring reserves
The following table shows a roll forward of restructuring reserves that will result in cash spending. These amounts exclude asset retirement obligations:
| | | | | | | | | | | | | | | | | | | | | | | | | | | | | | | | | | | | | | | | | | | | | | | | | | | | | |
| (in Millions) | Balance at 12/31/22 | | Change in reserves (4) | | Cash
payments | | Other (5) | | Balance at 12/31/23 (6) | | Change in reserves (4) | | Cash
payments | | Other (5) | | Balance at 12/31/24 (6) |
Project Focus (1) | $ | — | | | $ | 45.5 | | | $ | (2.4) | | | $ | — | | | $ | 43.1 | | | $ | 210.1 | | | $ | (106.2) | | | $ | (0.1) | | | $ | 146.9 | |
DuPont Crop restructuring (2) | 5.0 | | | — | | | (1.0) | | | (0.1) | | | 3.9 | | | — | | | (0.9) | | | — | | | 3.0 | |
| | | | | | | | | | | | | | | | | |
Other workforce related and facility shutdowns (3) | 5.6 | | | 9.9 | | | (12.5) | | | 0.4 | | | 3.4 | | | 0.3 | | | (2.1) | | | (0.4) | | | 1.2 | |
| | | | | | | | | | | | | | | | | |
| Total | $ | 10.6 | | | $ | 55.4 | | | $ | (15.9) | | | $ | 0.3 | | | $ | 50.4 | | | $ | 210.4 | | | $ | (109.2) | | | $ | (0.5) | | | $ | 151.1 | |
____________________
(1)Relates to the global restructuring plan initiated in 2023 and primarily consists of contract abandonment charges resulting from the evaluation of our supply chain footprint as well as severance charges related to workforce reduction actions across all regions.
(2)Represents remaining cash spending on facility separation costs associated with DuPont Crop restructuring activities.
(3)Includes exit costs related to workforce reductions and facility shutdowns on previously implemented restructuring initiatives.
(4)Primarily consists of severance and employee separation costs, third-party provider fees and, in 2024, contract abandonment charges. The accelerated depreciation and asset impairment charges associated with these restructurings that have impacted our property, plant and equipment, intangible balances or other asset balances are not included in this table.
(5)Primarily comprised of foreign currency translation and other non-cash adjustments.
(6)Included in "Accrued and other liabilities" and "Other long-term liabilities" on the consolidated balance sheets.
Other charges (income), net
| | | | | | | | | | | | | | | | | |
| | Year Ended December 31, |
| (in Millions) | 2024 | | 2023 | | 2022 |
| Environmental charges, net | $ | 74.7 | | | $ | 66.9 | | | $ | 34.7 | |
| Gain on sale of GSS | (174.4) | | | — | | | — | |
| | | | | |
| Exit from Russian Operations | — | | | — | | | 76.8 | |
| Currency related matters | — | | | 75.2 | | | — | |
| IPR&D asset acquisition charges | — | | | 13.0 | | | — | |
| Other items, net | 16.5 | | | 8.8 | | | 7.7 | |
| Other charges (income), net | $ | (83.2) | | | $ | 163.9 | | | $ | 119.2 | |
Environmental charges, net
Environmental charges represent the net charges associated with environmental remediation at continuing operating sites, which primarily represent obligations at shut down or abandoned facilities but do not meet the criteria for presentation as discontinued operations.
Sale of the GSS business
On November 1, 2024, we completed the sale of our GSS business to Envu. For the year ended December 31, 2024, we recognized a gain on sale, net of full year incurred transaction costs, of $174.4 million. Refer to Note 1 to the consolidated financial statements included within this Form 10-K for additional information on the transaction.
Exit from Russian Operations
As the Russia-Ukraine war continues, our values as a company as well as the sanctions imposed on, and cross-sanctions imposed and announced by, the Russian Federation led us to cease operations and business in Russia. This decision was made in mid-April of 2022 when we concluded that it was not sustainable to continue operations. As a result of this decision, we recorded a charge of approximately $76.8 million during the twelve months ended December 31, 2022. The charge primarily consists of noncash asset write offs, mainly working capital as well as the value of a packaging and formulation facility. This charge included approximately $7 million of cash that was stranded and not accessible to us.
FMC CORPORATION
Notes to Consolidated Financial Statements — (Continued)
Currency related matters
During the twelve months ended December 31, 2023, we incurred $75.2 million in currency related charges driven by significant devaluation actions taken by the Argentine Government during the fourth quarter of 2023 as well as similar devaluation actions in Pakistan and Argentina during previous quarters of 2023.
IPR&D asset acquisition charges
During 2023, we finalized a development agreement which will bring to market a new herbicide active ingredient used to control weeds in rice. As part of the agreement, FMC acquired a data set that includes studies and technical research that will be used to support the development of formulations and product registrations. Acquired in-process research and development assets are expensed as incurred and included as a component of "Restructuring and other charges (income)" on the consolidated statements of income (loss).
Note 8: Receivables
The following table displays a roll forward of the allowance for doubtful trade receivables. | | | | | |
| (in Millions) | |
| Balance, December 31, 2022 | $ | 33.9 | |
| Additions — charged (credited) to expense | 4.7 | |
| Transfer from (to) allowance for credit losses (see below) | (1.5) | |
| Net recoveries, write-offs and other | (8.0) | |
| Balance, December 31, 2023 | $ | 29.1 | |
| Additions — charged (credited) to expense | 12.2 | |
| Transfer from (to) allowance for credit losses (see below) | (3.6) | |
| Net recoveries, write-offs and other | 1.7 | |
| Balance, December 31, 2024 | $ | 39.4 | |
We have non-current receivables that represent long-term customer receivable balances related to past due accounts which are not expected to be collected within the current year. The net long-term customer receivables were $39.7 million as of December 31, 2024. These long-term customer receivable balances and the corresponding allowance are included in "Other assets including long-term receivables, net" on the consolidated balance sheets.
A portion of these long-term receivables have payment contracts. We have no reason to believe payments will not be made based upon the credit quality of these customers. Additionally, we also hold significant collateral against these customers including rights to property or other assets as a form of credit guarantee. If the customer does not pay or gives indication that they will not pay, these guarantees allow us to start legal action to block the sale of the customer’s harvest.
The following table displays a roll forward of the allowance for credit losses related to long-term customer receivables.
| | | | | |
(in Millions) | |
| Balance, December 31, 2022 | $ | 44.5 | |
| Additions — charged (credited) to expense | 1.6 | |
| Transfer from (to) allowance for doubtful accounts (see above) | 1.5 | |
| Foreign currency adjustments | 0.8 | |
| Net recoveries, write-offs and other | (21.3) | |
| Balance, December 31, 2023 | $ | 27.1 | |
| Additions — charged (credited) to expense | (1.8) | |
| Transfer from (to) allowance for doubtful accounts (see above) | 3.6 | |
| Foreign currency adjustments | (3.4) | |
| Net recoveries, write-offs and other | (4.2) | |
| Balance, December 31, 2024 | $ | 21.3 | |
FMC CORPORATION
Notes to Consolidated Financial Statements — (Continued)
Receivables Securitization Facility:
FMC participates in certain trade receivables securitization programs, primarily impacting our Brazilian operations. On a revolving basis, FMC may sell certain trade receivables into the facilities in exchange for cash. A portion of the total receivables sold are deferred as an asset within "Other assets including long-term receivables, net" as presented on our consolidated balance sheets representing FMC’s beneficial interest in the securitization funds.
In all instances, the transferred financial assets are sold on a non-recourse basis and have met the true sale criteria under ASC Topic 860. FMC has surrendered control of the receivables and as a result they will no longer be recognized on the consolidated balance sheets. FMC may be engaged to serve as a special servicer for any delinquent receivables. In that capacity, we are entitled to market rate compensation for those services.
Cash receipts from the sale of trade receivables under the securitization arrangement, received at the time of sale, are classified as cash flows from operating activities.
There were $193.0 million in receivables sold under the securitization programs during the period ended December 31, 2024. A $18.2 million charge associated with the transfer of these financial assets is included as a component within Selling, general and administrative" expense during the period ended December 31, 2024. There were $148.3 million in receivables sold under the securitization program during the period ended December 31, 2023. A $11.9 million charge associated with the transfer of these financial assets is included as a component within "Selling, general and administrative expenses" during the period ended December 31, 2023.
As part of funding for all outstanding arrangements under the securitization programs, approximately $35.7 million of the sales have been retained by the investment fund and will be returned to FMC, including interest, at the maturity of the securitization. This asset is recorded within "Other assets including long-term receivables, net" on the consolidated balance sheets.
Other Receivable Factoring:
In addition to the above, we may sell trade receivables on a non-recourse basis to third-party financial institutions. These sales are normally driven by specific market conditions, including, but not limited to, foreign exchange environments, customer credit management, as well as other factors where the receivables originate.
We account for these transactions as true sales and as a result they will no longer be recognized on the consolidated balance sheets because the agreements transfer effective control and risk related to the receivables to the buyers. The net cash proceeds received are presented within cash provided by operating activities within our consolidated statements of cash flows. The cost of factoring these accounts receivables is recorded within "Selling, general and administrative expenses" on the consolidated statements of income (loss) and has been immaterial during each reporting period. Non-recourse factoring during the years ended December 31, 2024 and 2023 was $122.9 million and $155.0 million, respectively.
FMC CORPORATION
Notes to Consolidated Financial Statements — (Continued)
Note 9: Discontinued Operations
Our discontinued operations in our financial statements include adjustments to retained liabilities from previous discontinued operations. The primary liabilities retained include environmental liabilities, other postretirement benefit liabilities, self-insurance liabilities, long-term obligations related to legal proceedings and historical restructuring activities.
Our discontinued operations comprised the following: | | | | | | | | | | | | | | | | | |
| (in Millions) | Year Ended December 31, |
| 2024 | | 2023 | | 2022 |
| Adjustment for workers’ compensation, product liability, and other postretirement benefits and other, net of income tax benefit (expense) of $(2.5) in 2024, $(0.9) in 2023 and $(2.5) in 2022 | $ | (5.2) | | | $ | (3.0) | | | $ | (3.9) | |
Provision for environmental liabilities, net of recoveries, net of income tax benefit (expense) of $8.7 in 2024, $18.0 in 2023, and $13.8 in 2022 (1)(2) | (32.8) | | | (65.6) | | | (53.8) | |
Provision for legal reserves and expenses, net of recoveries, net of income tax benefit (expense) of $6.3 in 2024, $7.9 in 2023, and $10.5 in 2022 (3) | (23.8) | | | (29.9) | | | (39.5) | |
| Discontinued operations, net of income taxes | $ | (61.8) | | | $ | (98.5) | | | $ | (97.2) | |
___________________________
(1)The provision for the year ended December 31, 2023 includes a $11.7 million charge resulting from a settlement agreement related to one of our foreign environmental remediation sites. The charge recorded adjusts the reserve to the anticipated payment amount. The agreement removes any future remediation obligations for the site.
(2)See a roll forward of our environmental reserves as well as discussion on significant environmental issues that occurred during the year in Note 10 to the consolidated financial statements included within this Form 10-K.
(3)Discontinued operations for the twelve months ended December 31, 2024 includes a gain of $18.0 million recognized as the result of an insurance settlement for retained legal reserves.
Reserves for Discontinued Operations, other than Environmental at December 31, 2024 and 2023
| | | | | | | | | | | |
| (in Millions) | December 31, |
| 2024 | | 2023 |
| Workers’ compensation, product liability, and indemnification reserves | $ | 7.1 | | | $ | 7.3 | |
| Postretirement medical and life insurance benefits reserve, net | 3.1 | | | 4.4 | |
| Reserves for legal proceedings | 144.0 | | | 123.9 | |
Reserve for discontinued operations (1) | $ | 154.2 | | | $ | 135.6 | |
___________________________
(1)Included in "Other long-term liabilities" on the consolidated balance sheets. See Note 10 to the consolidated financial statements included within this Form 10-K on discontinued environmental reserves.
The discontinued postretirement medical and life insurance benefits liability equals the accumulated postretirement benefit obligation. Associated with this liability is a net pre-tax actuarial gain and prior service credit of $3.0 million ($1.7 million after-tax) and $2.2 million ($1.0 million after-tax) at December 31, 2024 and 2023, respectively.
Net spending in 2024, 2023 and 2022 was $6.5 million, $3.1 million and $2.4 million, respectively, for workers’ compensation, product liability and other claims; $0.2 million, $0.2 million and $0.3 million, respectively, for other postretirement benefits; and $6.8 million, $28.3 million and $27.9 million, respectively, related to reserves for legal proceedings associated with discontinued operations.
FMC CORPORATION
Notes to Consolidated Financial Statements — (Continued)
Note 10: Environmental Obligations
We are subject to various federal, state, supranational, local and foreign environmental laws and regulations that govern emissions of air pollutants, discharges of water pollutants, the manufacture, generation, storage, handling and disposal of hazardous substances, hazardous wastes and other toxic materials, and remediation of contaminated sites. We are also subject to liabilities arising under the federal CERCLA and similar or analogous state laws that impose responsibility on persons who arranged for the disposal of hazardous substances, and on current and previous owners and operators of a facility for the clean-up of hazardous substances released from the facility into the environment. We are also subject to liabilities under the federal Resource Conservation and Recovery Act ("RCRA") and similar or analogous state laws that require owners and operators of facilities that have treated, stored or disposed of hazardous waste pursuant to a RCRA permit to follow certain waste management practices and to investigate and clean up releases of hazardous substances into the environment associated with past or present practices. In addition, when deemed appropriate, we enter certain sites with potential liability into voluntary remediation compliance programs, which are also subject to guidelines that require owners and operators, current and previous, to clean up releases of hazardous substances into the environment associated with those sites.
Environmental liabilities include obligations relating to waste handling and the remediation and/or study of sites at which we are alleged to have released or disposed of hazardous substances. These sites include current operations, previously operated sites, sites associated with discontinued operations, or sites where we are alleged to have arranged for the disposal of hazardous substances. We have accrued reserves for potential environmental obligations that we consider probable and for which a reasonable estimate of the obligation can be made. Accordingly, total reserves before recoveries of $623.2 million and $601.8 million existed at December 31, 2024 and 2023, respectively.
The estimated reasonably possible environmental loss contingencies, net of expected recoveries, exceed amounts accrued by approximately $290.0 million at December 31, 2024. This reasonably possible estimate is based upon information available as of the date of the filing but the actual future losses may be higher given the uncertainties regarding the status of laws, regulations, enforcement policies, the impact of potentially responsible parties, technology and information related to individual sites.
Additionally, although potential environmental remediation expenditures in excess of the reserves and estimated loss contingencies could be significant, the impact on our future consolidated financial results is not subject to reasonable estimation due to numerous uncertainties concerning the nature and scope of possible contamination at many sites, identification of remediation alternatives under constantly changing requirements, selection of new and diverse clean-up technologies to meet compliance standards, the timing of potential expenditures and the allocation of costs among potentially responsible parties ("PRPs") as well as other third parties. The liabilities arising from potential environmental obligations that have not been reserved for at this time may be material to any one quarter's or year's results of operations in the future.
FMC CORPORATION
Notes to Consolidated Financial Statements — (Continued)
The table below is a roll forward of our total environmental reserves, continuing and discontinued, from December 31, 2021 to December 31, 2024.
| | | | | |
| (in Millions) | Operating and Discontinued Sites Total |
| Total environmental reserves, net of recoveries at December 31, 2021 | $ | 503.2 | |
| 2022 Activity | |
| Provision | 104.8 | |
| Spending, net of recoveries | (74.5) | |
| |
| Foreign currency translation adjustments | (4.3) | |
| Net change | $ | 26.0 | |
| Total environmental reserves, net of recoveries at December 31, 2022 | $ | 529.2 | |
| 2023 Activity | |
| Provision | 152.3 | |
| Spending, net of recoveries | (92.6) | |
| |
| Foreign currency translation adjustments and other adjustments | 3.2 | |
| Net change | $ | 62.9 | |
| Total environmental reserves, net of recoveries at December 31, 2023 | $ | 592.1 | |
| 2024 Activity | |
| Provision | 116.0 | |
| Spending, net of recoveries | (88.5) | |
| |
| Foreign currency translation adjustments | (6.5) | |
| Net change | $ | 21.0 | |
| Total environmental reserves, net of recoveries at December 31, 2024 | $ | 613.1 | |
To ensure we are held responsible only for our equitable share of site remediation costs, we have initiated, and will continue to initiate, legal proceedings for contributions from other PRPs. At December 31, 2024 and 2023, we have recorded recoveries representing probable realization of claims against U.S. government agencies, insurance carriers and other third parties. Recoveries are recorded as either an offset to the "Environmental liabilities, continuing and discontinued" or as "Other assets including long-term receivables, net" on the consolidated balance sheets.
The table below is a roll forward of our total recorded recoveries from December 31, 2022 to December 31, 2024: | | | | | | | | | | | | | | | | | | | | | | | | | | | | | | | | | | | | | | | | | | | | | |
| (in Millions) | December 31, 2022 | | Increase (Decrease) in Recoveries | | Cash Received | | | | December 31, 2023 | | Increase (Decrease) in Recoveries | | Cash Received | | | | December 31, 2024 |
| Environmental liabilities, continuing and discontinued | $ | 13.9 | | | $ | (3.1) | | | $ | (1.1) | | | | | $ | 9.7 | | | $ | 0.5 | | | $ | (0.1) | | | | | $ | 10.1 | |
Other assets (1) | 6.4 | | | 2.1 | | | (3.6) | | | | | 4.9 | | | (0.1) | | | (1.0) | | | | | 3.8 | |
| Total | $ | 20.3 | | | $ | (1.0) | | | $ | (4.7) | | | | | $ | 14.6 | | | $ | 0.4 | | | $ | (1.1) | | | | | $ | 13.9 | |
______________
(1) The amounts are included within "Prepaid and other current assets" and "Other assets including long-term receivables, net" on the consolidated balance sheets. See Note 21 to the consolidated financial statements included within this Form 10-K for more details.
FMC CORPORATION
Notes to Consolidated Financial Statements — (Continued)
The table below provides detail of current and long-term environmental reserves, continuing and discontinued. | | | | | | | | | | | |
| December 31, |
| (in Millions) | 2024 | | 2023 |
Environmental reserves, current, net of recoveries (1) | $ | 91.8 | | | $ | 97.4 | |
Environmental reserves, long-term continuing and discontinued, net of recoveries (2) | 521.3 | | | 494.7 | |
| Total environmental reserves, net of recoveries | $ | 613.1 | | | $ | 592.1 | |
___________________________
(1)These amounts are included within "Accrued and other liabilities" on the consolidated balance sheets.
(2)These amounts are included in "Environmental liabilities, continuing and discontinued" on the consolidated balance sheets.
Our net environmental provisions relate to costs for the continued remediation of both operating sites and for certain discontinued manufacturing operations from previous years. The net provisions are comprised as follows:
| | | | | | | | | | | | | | | | | |
| Year Ended December 31, |
| (in Millions) | 2024 | | 2023 | | 2022 |
Continuing operations (1) | $ | 74.7 | | | $ | 66.9 | | | $ | 34.7 | |
Discontinued operations (2) | 41.5 | | | 83.6 | | | 67.6 | |
| Net environmental provision | $ | 116.2 | | | $ | 150.5 | | | $ | 102.3 | |
___________________________
(1)Recorded as a component of "Restructuring and other charges (income)" on our consolidated statements of income. See Note 7 to the consolidated financial statements included within this Form 10-K. Environmental obligations for continuing operations primarily represent obligations at shut down or abandoned facilities within businesses that do not meet the criteria for presentation as discontinued operations.
(2)Recorded as a component of "Discontinued operations, net of income taxes" on our consolidated statements of income (loss). The year ended December 31, 2023 includes a $11.7 million charge resulting from a settlement agreement with the other party involved at one of our foreign environmental remediation sites. See Note 9 to the consolidated financial statements included within this Form 10-K for further details.
On our consolidated balance sheets, the net environmental provisions affect assets and liabilities as follows:
| | | | | | | | | | | | | | | | | |
| Year Ended December 31, |
| (in Millions) | 2024 | | 2023 | | 2022 |
Environmental reserves (1) | $ | 116.0 | | | $ | 152.3 | | | $ | 104.8 | |
Other assets (2) | 0.2 | | | (1.8) | | | (2.5) | |
| Net environmental provision | $ | 116.2 | | | $ | 150.5 | | | $ | 102.3 | |
___________________________
(1)See above roll forward of our total environmental reserves as presented on our consolidated balance sheets.
(2)Represents certain environmental recoveries. See Note 21 to the consolidated financial statements included within this Form 10-K for details of "Other assets including long-term receivables, net" as presented on our consolidated balance sheets.
FMC CORPORATION
Notes to Consolidated Financial Statements — (Continued)
Significant Environmental Sites
Pocatello
From 1949 until 2001, we operated the world's largest elemental phosphorus plant in Power County, Idaho, just outside the city of Pocatello. Since the plant's closure, FMC has worked with the EPA, the State of Idaho, and the Shoshone-Bannock Tribes ("Tribes") to develop a proposed cleanup plan for the property. In September 2012, the EPA issued an Interim Record of Decision ("IROD") that is environmentally protective and that is also protective of the health and safety of both workers and the general public. Since the plant's closure, we have successfully decommissioned our Pocatello plant, completed closure of the RCRA ponds and formally requested that the EPA acknowledge completion of work under a June 1999 RCRA Consent Decree. Future remediation costs include completion of the IROD that addresses groundwater contamination and existing waste disposal areas on the Pocatello plant portion of the Eastern Michaud Flats Superfund Site. In June 2013, the EPA issued a Unilateral Administrative Order to us under which we are continuing to implement the IROD remedy. Our current reserves factor in the estimated costs associated with implementing the IROD. In addition to implementing the IROD, we continue to conduct work pursuant to CERCLA unilateral administrative orders to address air emissions from beneath the cap of several of the closed RCRA ponds. Actions also involve impacts of the Tribal Litigation discussed below.
The amount of the reserve for this site was $115.9 million and $82.9 million at December 31, 2024 and 2023, respectively. The increase to the reserve was primarily a result of our submission of a Post-Closure Care Plan to the EPA outlining the scope and schedule for operations, monitoring, and maintenance of the closed RCRA Ponds. The reserve includes $28.0 million at December 31, 2024 for the Pocatello Tribal Litigation as described below.
Annual Tribal Waste Permit Fee
After prolonged litigation with the Tribes concerning an annual $1.5 million waste permit fee, we were ordered to pay this annual fee for the duration of time that waste material remains buried on site. Given that on-site waste burial is the approved remedy, this fee is presumptively without end.
Our reserves reflect this annual waste permit fee. In calculating the net present value of these future annual permit fees, we used a discount rate of 4.86%, which represents the appropriate risk-free rate. We believe that the application of this rate produces a result which approximates the amount that would hypothetically satisfy our liability in an arms-length transaction. Estimates for expenditures for 2024 and beyond are $1.5 million in annual fees payable each year thereafter. The expected aggregate undiscounted amount related to this matter is $75.0 million of which $28.0 million, on a discounted basis, has been recognized in environmental liabilities on the balance sheet.
Middleport
Our Middleport, NY facility is currently a formulation and packaging plant that formerly manufactured arsenic-based and other products. Releases of hazardous substances have occurred at the site that have affected soil, sediment, surface water and groundwater at the facility's property and also in adjacent off-site areas. These impacts were the subject of an Administrative Order on Consent entered into with the USEPA and New York State Department of Environmental Conservation ("NYSDEC", and collectively with USEPA, the "Agencies") in 1991, which was replaced by a New Order on Consent and Administrative Settlement with the NYSDEC, effective June 6, 2019 ("2019 Order"). Like the prior order, the 2019 Order requires us to (1) define the nature and extent of contamination related to our historical plant operations, (2) take interim corrective measures and (3) evaluate Corrective Measure Alternatives ("CMA") for discrete areas, known as operable units ("OUs") of which there are 11.
We have defined the nature and extent of the environmental impacts in certain areas, have constructed an engineered cover, taken certain closure actions regarding RCRA regulated surface water impoundments and are collecting and treating both surface water runoff and ground water. To date, we have evaluated and proposed CMAs for six of the 11 identified OUs.
Middleport Reserves
Our total reserve for the Middleport site is $128.5 million and $130.8 million at December 31, 2024 and 2023, respectively. FMC is in various stages of evaluating the remaining operable units. The reserve represents the estimated remediation costs for OUs 2,4 and 5 as well as our best estimate for remediation costs associated with the operable unit that comprises the southern portion of the tributary ("OU 6") plus the impact of inflation.
FMC CORPORATION
Notes to Consolidated Financial Statements — (Continued)
In 2024 and 2023, the Middleport site resulted in cash outflows of $10.0 million and $12.5 million, respectively. In accordance with the 2019 Order, cash outflows will not exceed an average of $10 million per year until the remediation is complete for activities associated with the 2019 Order.
Portland Harbor
FMC is listed as a PRP in the Portland Harbor Superfund Site ("Portland Harbor"), that consists of the river sediment and upland area of a 10 mile section of the Lower Willamette River in Portland, Oregon that runs through an industrialized area. Portland Harbor is listed on the CERCLA National Priorities List ("NPL"). FMC formerly owned and operated a manufacturing site adjacent to this section of the river and has since sold its interest in this discontinued business.
FMC and several other parties have been sued by the Confederated Bands and Tribes of the Yakama Nation for reimbursement of cleanup costs and the costs of performing a natural resource damages assessment. Based on the information known to date, we are unable to develop a reasonable estimate of our potential exposure of loss at this time. We intend to defend this matter. In addition, the Portland Harbor Natural Resource Trustee Council ("Trustee Council"), composed of federal, state and tribal trustees, was formed in 2002 to develop and coordinate an assessment of injury to natural resources associated with the Portland Harbor Superfund Site, to implement the restoration of injured natural resources associated with Portland Harbor, and to pursue the recovery of natural resources damages associated with Portland Harbor. The Trustee Council has advised the Company that it intends to pursue litigation for the recovery of natural resources damages and of the costs of assessment. To date, the Company has not been served in connection with such a lawsuit.
On January 6, 2017, the EPA issued its ROD for Portland Harbor. On December 30, 2019, FMC and EPA entered into an Administrative Settlement Agreement and Order on Consent to perform the remedial design for the area at and around FMC's former operations. The cost of performing predesign investigation work and preparing the basis of design report is included in our reserves. Based on the current information available in the ROD as well as the large number of responsible parties for Portland Harbor, we are unable to develop a reasonable estimate of our potential exposure of loss for Portland Harbor at this time.
Currently, FMC and approximately 100 other parties are involved in a non-judicial allocation process to determine each party’s respective share of the cleanup costs. The allocation process has been ongoing since November 2021 and a final report is expected to be issued in late 2025 or early 2026 under the current schedule.
In November 2024, FMC was served by the EPA with a Special Notice Letter ("SNL") inviting FMC and approximately sixty other recipients to participate in formal negotiations to reach a settlement to conduct or finance the response action at Portland Harbor. The EPA advises in the SNL that it seeks to complete the negotiations for a site-wide consent decree in the fall of 2026, but no later than March 2027. The SNL recipients sought and received certain clarifications from the EPA with respect to the SNL. Our response to the SNL is currently due in March 2025. In the meantime, parties in the allocation group are continuing to negotiate with the EPA.
We intend to continue defending this matter vigorously. Because of this uncertainty related to the cost of the remedy and the potential share allocable to FMC, we cannot say whether the ultimate resolution of our potential obligations at Portland Harbor will have a material adverse effect on our consolidated financial position, liquidity or results of operations. However, adverse results in the outcome of the allocation could have a material adverse effect on our consolidated financial position, results of operations in any one reporting period, or liquidity.
Other Potentially Responsible Party ("PRP") Sites
In addition to Portland Harbor, we have been named a PRP at 28 sites on the NPL, at which our potential liability has not yet been settled. We have received notice from the EPA or other regulatory agencies that we may be a PRP, or PRP equivalent, at other sites, including 45 sites at which we have determined that it is probable that we have an environmental liability for which we have recorded an estimate of our potential liability on the consolidated financial statements. At other sites, such as at a former phosphorus facility in Carteret, NJ, we are performing remedial investigation work under state regulatory programs but have not established reserves due to the inability to reasonably estimate potential liability at this time.
In cooperation with appropriate government agencies, we are currently participating in, or have participated in, an RI/FS, or equivalent, at most of the identified sites, with the status of each investigation varying from site to site. At certain sites, a RI/FS has only recently begun, providing limited information, if any, relating to cost estimates, timing, or the involvement of other PRPs; whereas, at other sites, the studies are complete, remedial action plans have been chosen, or a ROD has been issued.
FMC CORPORATION
Notes to Consolidated Financial Statements — (Continued)
Note 11: Income Taxes
Domestic and foreign components of income (loss) from continuing operations before income taxes are shown below:
| | | | | | | | | | | | | | | | | |
| | Year Ended December 31, |
| (in Millions) | 2024 | | 2023 | | 2022 |
| Domestic | $ | (271.6) | | | $ | (312.7) | | | $ | (89.6) | |
| Foreign | 524.1 | | | 612.9 | | | 1,073.5 | |
| Total | $ | 252.5 | | | $ | 300.2 | | | $ | 983.9 | |
The provision (benefit) for income taxes attributable to income (loss) from continuing operations consisted of:
| | | | | | | | | | | | | | | | | |
| | Year Ended December 31, |
| (in Millions) | 2024 | | 2023 | | 2022 |
| Current: | | | | | |
| Federal | $ | 28.2 | | | $ | 58.5 | | | $ | 45.7 | |
| Foreign | 160.2 | | | 113.9 | | | 152.1 | |
| State | 1.0 | | | 1.1 | | | 0.1 | |
| Total current | $ | 189.4 | | | $ | 173.5 | | | $ | 197.9 | |
| Deferred: | | | | | |
| Federal | $ | (66.0) | | | $ | (82.7) | | | $ | (28.6) | |
| Foreign | (271.9) | | | (1,212.0) | | | (27.4) | |
| State | (2.4) | | | 1.9 | | | 3.3 | |
| Total deferred | $ | (340.3) | | | $ | (1,292.8) | | | $ | (52.7) | |
| Total | $ | (150.9) | | | $ | (1,119.3) | | | $ | 145.2 | |
The effective income tax rate applicable to income from continuing operations before income taxes was different from the statutory U.S. federal income tax rate due to the factors listed in the following table:
| | | | | | | | | | | | | | | | | | | | | |
| | Year Ended December 31, | | | | |
| (in Millions) | 2024 | | 2023 | | 2022 | | | | |
| U.S. Federal statutory rate | $ | 53.0 | | | $ | 63.0 | | | $ | 206.6 | | | | | |
| | | | | | | | | |
Foreign earnings subject to different tax rates (1) | (137.3) | | | (130.7) | | | (152.7) | | | | | |
| | | | | | | | | |
| State and local income taxes, less federal income tax benefit | (7.7) | | | 2.5 | | | 5.5 | | | | | |
| Research and development and miscellaneous tax credits | (5.7) | | | (5.4) | | | (5.7) | | | | | |
Tax on dividends, deemed dividends, and GILTI (2) | 41.9 | | | 37.0 | | | 24.6 | | | | | |
| Changes to unrecognized tax benefits | 9.6 | | | 10.5 | | | 10.5 | | | | | |
| Nondeductible expenses | 9.3 | | | 9.3 | | | 19.6 | | | | | |
Change in valuation allowance (3) | 639.7 | | | 172.5 | | | 71.3 | | | | | |
Exchange gains and losses (4) | 30.3 | | | (18.4) | | | (12.0) | | | | | |
| | | | | | | | | |
Impact of Switzerland tax incentives (5) | (645.0) | | | (1,149.2) | | | — | | | | | |
Other (6) | (139.0) | | | (110.4) | | | (22.5) | | | | | |
| Total Tax Provision | $ | (150.9) | | | $ | (1,119.3) | | | $ | 145.2 | | | | | |
___________________________
(1)A significant amount of our earnings is generated by our foreign subsidiaries (e.g., Switzerland, Singapore, Hong Kong), which tax earnings at lower statutory rates than the United States federal statutory rate. Our future effective tax rates may be materially impacted by a future change in the composition of earnings from foreign and domestic tax jurisdictions.
(2)The years ended December 31, 2024, 2023, and 2022 includes tax expense of $18.1 million, $25.5 million, and $17.8 million, respectively, associated with the global intangible low-taxed income (GILTI) provisions.
FMC CORPORATION
Notes to Consolidated Financial Statements — (Continued)
(3)The year ended December 31, 2024 is primarily related to the estimated portion of nonrefundable tax credits within our Swiss operations that are not expected to be utilized, the impact of the step-up in tax basis to the fair value of the transferred intellectual property by the Company’s Swiss subsidiary, and net operating losses within our full valuation allowance Luxembourg operations. The year ended December 31, 2023 is primarily related to the estimated portion of nonrefundable tax credits within our Swiss operations that are not expected to be utilized and net operating losses and other deferred tax assets within our Argentina operations, partially offset by the release of the valuation allowance within our Brazil operations, as described further below. The year ended December 31, 2022 is primarily related to net operating losses and other deferred tax assets within our Brazil and Argentina operations.
(4)Includes the impact of transaction gains or losses on net monetary assets for which no corresponding tax expense or benefit is realized and the tax provision for statutory taxable gains or losses in foreign jurisdictions for which there is no corresponding amount in income before taxes.
(5)The year ended December 31, 2024 represents the recognition of a step-up in tax basis to the fair value of the transferred intellectual property by the Company's Swiss subsidiary. The year ended December 31, 2023 is related to ten-year nonrefundable tax credits granted to the Company's Swiss subsidiaries, as discussed above.
(6)The year ended December 31, 2024 includes a U.S. capital loss in the amount of $38.6 million and additional amounts materially attributable to internal restructuring in our full valuation allowance Luxembourg entities. The year ended December 31, 2023 includes a net decrease of approximately $120 million related to adjustments of deferred tax balances in Singapore, Puerto Rico, and Switzerland. The year ended December 31, 2022 included a $39.7 million decrease related to certain deferred tax liabilities as a result of the extension of our incentive tax rate in Puerto Rico.
During the year ended December 31, 2023, the Company’s Swiss subsidiaries were granted ten-year tax incentives effective for 2023 and retroactively for 2021 and 2022. The tax incentives were awarded for the Company’s commitment to invest in additional headcount and transfer significant intellectual property as well as commitment to establish a new global technology and innovation center in Switzerland. Net deferred tax benefits of $1,149 million and related valuation allowances of $318 million were recorded during the three months ended December 31, 2023 to reflect the estimated net future reductions in tax of $831 million associated with the incentives.
In connection with our plans to establish a global technology and innovation center in Switzerland, we initiated changes to our corporate entity structure, including intra-entity transfers of certain intellectual property, during the second quarter of 2024. As a result, we recorded a net tax benefit of approximately $300 million. This benefit, net of valuation allowance, was primarily a result of the recognition of a step-up in tax basis to the fair value of the transferred intellectual property by one of the Company’s Swiss subsidiaries. In addition, local tax impacts associated with the disposition of the transferred intellectual property were recorded as well as an increase in our valuation allowance associated with Swiss nonrefundable tax credits as a result of indirect effects of the transferred intellectual property. During the fourth quarter of 2024, the Company recorded additional valuation allowances of approximately $120 million as a result of updated projections of future earnings associated with the 2023 deferred tax benefits noted above.
Historically, FMC’s Brazil valuation allowance position was based on long-standing local transfer pricing rules, as well as certain material favorable permanent statutory tax deductions available to FMC Brazil as part of local tax law. During the three months ended December 31, 2023, the Company released its FMC Brazil valuation allowance and recorded a tax benefit of approximately $223 million as a result of the Brazilian Government enacting a new tax law that significantly limits FMC Brazil’s ability to benefit in the future from the material favorable permanent statutory tax deductions previously available as part of local tax law.
Subsequent Event - 2025
In January of 2025, the Organization for Economic Co-operation and Development ("OECD") issued administrative guidance on the Global Anti-Base Erosion Model (GLOBE) rules that clarify how certain rules are to be interpreted. This administrative guidance includes changes to certain tax credits and other tax benefits that arose from governmental arrangements granted after November 2021. It has been concluded that this new administrative guidance is part of Swiss tax law when issued and is retro-active. FMC’s non-refundable tax credits which were granted in 2023 to our Swiss subsidiaries are impacted by this new guidance. The tax credits were previously grandfathered in for full use under the GLOBE rules. FMC is currently evaluating the impacts of this on its financial statements.
FMC CORPORATION
Notes to Consolidated Financial Statements — (Continued)
Significant components of our deferred tax assets and liabilities were attributable to:
| | | | | | | | | | | |
| | December 31, |
| (in Millions) | 2024 | | 2023 |
| Reserves for discontinued operations, environmental and restructuring | $ | 190.1 | | | $ | 144.7 | |
| Accrued pension and other postretirement benefits | 5.3 | | | 9.8 | |
| | | |
| Capital loss, foreign tax and other credit carryforwards | 1,128.1 | | | 1,136.0 | |
| Net operating loss carryforwards | 564.1 | | | 411.2 | |
| Deferred expenditures capitalized for tax | 108.6 | | | 94.5 | |
| Intangibles, Property, plant and equipment, and Investments, net | 387.9 | | | — | |
| Other accruals and reserves | 267.5 | | | 234.0 | |
| Deferred tax assets | $ | 2,651.6 | | | $ | 2,030.2 | |
| Valuation allowance, net | (1,213.8) | | | (588.4) | |
| Deferred tax assets, net of valuation allowance | $ | 1,437.8 | | | $ | 1,441.8 | |
| Intangibles, Property, plant and equipment, and Investments, net | — | | | 263.3 | |
| Deferred tax liabilities | $ | — | | | $ | 263.3 | |
| Net deferred tax assets (liabilities) | $ | 1,437.8 | | | $ | 1,178.5 | |
We evaluate our deferred income taxes quarterly to determine if valuation allowances are required or should be adjusted. GAAP accounting guidance requires companies to assess whether valuation allowances should be established against deferred tax assets based on all available evidence, both positive and negative, using a "more likely than not" standard. In assessing the need for a valuation allowance, appropriate consideration is given to all positive and negative evidence related to the realization of deferred tax assets. This assessment considers, among other matters, the nature and severity of current and cumulative losses, forecasts of future profitability, the duration of statutory carryforward periods, and tax planning alternatives. We operate and derive income across multiple jurisdictions. As our business experiences changes in operating results across its geographic footprint, we may encounter losses in jurisdictions that have been historically profitable, and as a result might require additional valuation allowances to be recorded. We are committed to implementing tax planning actions, when deemed appropriate, in jurisdictions that experience losses in order to realize deferred tax assets prior to their expiration.
At December 31, 2024, we had net operating loss and tax credit carryforwards as follows: U.S. state net operating loss carryforwards of $19.8 million (tax-effected) expiring in future tax years through 2042, foreign net operating loss carryforwards of $544.3 million (tax-effected) expiring in various future years, and other tax credit carryforwards of $1,128.1 million expiring in various future years through 2034.
Uncertain Income Tax Positions
U.S. GAAP accounting guidance for uncertainty in income taxes prescribes a model for the recognition and measurement of a tax position taken or expected to be taken in a tax return, and provides guidance on derecognition, classification, interest and penalties, disclosure and transition.
We file income tax returns in the U.S. federal jurisdiction, and various states and foreign jurisdictions. The income tax returns for FMC entities taxable in the U.S. and significant foreign jurisdictions are open for examination and adjustment. As of December 31, 2024, the U.S. federal and state income tax returns are open for examination and adjustment for the years 2017 — 2024 and 2004 — 2024, respectively. Our significant foreign jurisdictions, which total 11, are open for examination and adjustment during varying periods from 2014 — 2024.
As of December 31, 2024, we had total unrecognized tax benefits of $53.1 million, of which $41.5 million would favorably impact the effective tax rate from continuing operations if recognized. As of December 31, 2023, we had total unrecognized tax benefits of $51.2 million, of which $37.1 million would favorably impact the effective tax rate if recognized. Interest and penalties related to unrecognized tax benefits are reported as a component of income tax expense. For the years ended December 31, 2024, 2023 and 2022, we had interest and penalties for a net expense (benefit) of $2.3 million, $4.3 million, and $2.6 million, respectively, on the consolidated statements of income (loss). As of December 31, 2024 and 2023, we have accrued interest and penalties on the consolidated balance sheets of $18.6 million and $16.3 million, respectively.
Due to the potential for resolution of federal, state, or foreign examinations, and the expiration of various jurisdictional statutes of limitation, it is reasonably possible that our liability for unrecognized tax benefits will decrease within the next 12 months by a range of $3.6 million to $23.9 million.
FMC CORPORATION
Notes to Consolidated Financial Statements — (Continued)
A reconciliation of the beginning and ending amount of unrecognized tax benefits is as follows:
| | | | | | | | | | | | | | | | | |
| December 31, |
| (in Millions) | 2024 | | 2023 | | 2022 |
| Balance at beginning of year | $ | 51.2 | | | $ | 46.1 | | | $ | 41.9 | |
| Increases related to positions taken in the current year | 8.6 | | | 2.4 | | | 4.8 | |
| | | | | |
| Increases and decreases related to positions taken in prior years | (1.2) | | | 3.5 | | | 2.9 | |
| Decreases related to lapse of statutes of limitations | (5.5) | | | (0.8) | | | (3.5) | |
| Settlements during the current year | — | | | — | | | — | |
| Decreases for tax positions on dispositions | — | | | — | | | — | |
Balance at end of year (1) | $ | 53.1 | | | $ | 51.2 | | | $ | 46.1 | |
___________________________
(1)At December 31, 2024, 2023, and 2022 we recognized an offsetting non-current asset of $10.5 million, $12.9 million, and $12.8 million respectively, relating to the indirect income tax benefits associated with specific uncertain tax positions presented above.
Note 12: Debt
Debt maturing within one year:
Debt maturing within one year consists of the following: | | | | | | | | | | | |
| December 31, |
| (in Millions) | 2024 | | 2023 |
Short-term foreign debt (1) | $ | 135.7 | | | $ | 98.0 | |
Commercial paper (2) | 125.6 | | | 739.5 | |
| Total short-term debt | $ | 261.3 | | | $ | 837.5 | |
| Current portion of long-term debt | 76.1 | | | 96.5 | |
Total short-term debt and current portion of long-term debt (3) | $ | 337.4 | | | $ | 934.0 | |
___________________________
(1)At December 31, 2024, the average effective interest rate on the borrowings was 10.6 percent.
(2)At December 31, 2024, the average effective interest rate on the borrowings was 5.0 percent.
(3)Based on cash generated from operations, our existing liquidity facilities, which includes the revolving credit agreement with the option to increase capacity up to $2.75 billion, and our continued access to debt capital markets, we have adequate liquidity to meet any of the Company's debt obligations in the near term including any current portion of long-term debt.
Long-term debt:
Long-term debt consists of the following:
| | | | | | | | | | | | | | | | | | | | | | | |
| (in Millions) | December 31, 2024 | | December 31, |
Interest Rate Percentage | | Maturity Date | | 2024 | | 2023 |
| Pollution control and industrial revenue bonds (less unamortized discounts of $0.1 and $0.1, respectively) | 6.45% | | 2032 | | $ | 49.9 | | | $ | 49.9 | |
| Senior notes (less unamortized discounts of $1.6 and $1.8, respectively) | 3.2% - 6.4% | | 2026 - 2053 | | 2,998.4 | | | 2,998.2 | |
| | | | | | | |
| | | | | | | |
| | | | | | | |
Revolving Credit Facility (1) | 7.1% | | 2027 | | — | | | — | |
| | | | | | | |
| Foreign debt | 12.2% - 12.6% | | 2025 | | 76.1 | | | 96.5 | |
| Debt issuance cost | | | | | (20.4) | | | (24.5) | |
| Total long-term debt | | | | | $ | 3,104.0 | | | $ | 3,120.1 | |
| Less: debt maturing within one year | | | | | 76.1 | | | 96.5 | |
| Total long-term debt, less current portion | | | | | $ | 3,027.9 | | | $ | 3,023.6 | |
___________________________
(1)Letters of credit outstanding under the Revolving Credit Facility totaled $210.1 million and available funds under this facility were $1,664.3 million at December 31, 2024.
FMC CORPORATION
Notes to Consolidated Financial Statements — (Continued)
Maturities of long-term debt
Maturities of long-term debt outstanding, excluding discounts, at December 31, 2024, are $76.1 million in 2025, $1,000.0 million in 2026, zero in 2027, zero in 2028, $500.0 million in 2029 and $1,550.0 million thereafter.
Covenants
Among other restrictions, the Fifth Amended and Restated Credit Agreement, dated as of June 17, 2022 (the "Revolving Credit Facility") contains financial covenants applicable to FMC and its consolidated subsidiaries related to leverage (measured as the ratio of debt to adjusted earnings) and interest coverage (measured as the ratio of adjusted earnings to interest expense). Our actual leverage for the four consecutive quarters ended December 31, 2024 was 3.72, which is below the maximum leverage of 5.00. Our actual interest coverage for the four consecutive quarters ended December 31, 2024 was 3.90, which is above the minimum interest coverage of 3.00. We were in compliance with all covenants at December 31, 2024.
Revolving Credit Facility Amendments
On February 3, 2025, we entered into Amendment No. 3 to our Revolving Credit Facility to amend the maximum leverage ratio and minimum interest coverage ratio to provide additional financial flexibility given current market challenges. As defined in the amendment, the maximum leverage ratio is increased to 5.25 through the period ending September 30, 2025 and will incrementally step down during the covenant relief period ending at 3.75 for the quarter ended December 31, 2027. The amendment also maintains the minimum interest coverage ratio at 3.00 through the quarter ended December 31, 2025. The minimum interest coverage ratio will return to 3.50 beginning with the quarter ended March 31, 2026. On February 11, 2025, we entered into Amendment No. 4 to our Revolving Credit Facility. As defined in the amendment, the maturity date of the facility was extended to June 17, 2028. Financing fees associated with both amendments, which were not material, have been deferred and will be recognized as interest expense over the life of the agreement.
Note 13: Pension and Other Postretirement Benefits
The funded status of our U.S. qualified and nonqualified defined benefit pension plans, our Germany, France, and Belgium defined benefit pension plans, plus our U.S. other postretirement healthcare and life insurance benefit plans for continuing operations, together with the associated balances and net periodic benefit cost recognized in our consolidated financial statements as of December 31, are shown in the tables below.
We are required to recognize in our consolidated balance sheets the overfunded and underfunded status of our defined benefit postretirement plans. The overfunded or underfunded status is defined as the difference between the fair value of plan assets and the projected benefit obligation. We are also required to recognize as a component of other comprehensive income the actuarial gains and losses and the prior service costs and credits that arise during the period.
The following table summarizes the weighted-average assumptions used to determine the benefit obligations at December 31 for the U.S. Plans:
| | | | | | | | | | | |
| Pensions and Other Benefits |
| December 31, |
| 2024 | | 2023 |
| Discount rate qualified | 5.60 | % | | 4.97 | % |
| Discount rate nonqualified plan | 5.31 | % | | 4.78 | % |
| Discount rate other benefits | 5.40 | % | | 4.83 | % |
| Rate of compensation increase | 3.10 | % | | 3.10 | % |
FMC CORPORATION
Notes to Consolidated Financial Statements — (Continued)
The following table summarizes the components of our defined benefit postretirement plans and reflect a measurement date of December 31:
| | | | | | | | | | | | | | | | | | | | | | | | | | |
| | | | Pensions | | Other Benefits (1) |
| | | | December 31, |
| (in Millions) | | | | 2024 | | 2023 | | 2024 | | 2023 |
| Change in projected benefit obligation | | | | | | | | | | |
| Projected benefit obligation at January 1 | | | | $ | 1,032.2 | | | $ | 1,044.3 | | | $ | 9.2 | | | $ | 11.2 | |
| Service cost | | | | 1.8 | | | 2.6 | | | — | | | — | |
| Interest cost | | | | 48.2 | | | 50.4 | | | 0.4 | | | 0.5 | |
Actuarial loss (gain) (2) | | | | (45.2) | | | 19.0 | | | (1.4) | | | (1.4) | |
| | | | | | | | | | |
| | | | | | | | | | |
| Foreign currency exchange rate changes and other | | | | (0.4) | | | — | | | — | | | — | |
| Plan participants’ contributions | | | | — | | | — | | | 0.3 | | | 0.3 | |
| | | | | | | | | | |
| Settlements | | | | (3.1) | | | (1.0) | | | — | | | — | |
| | | | | | | | | | |
| | | | | | | | | | |
| Benefits paid | | | | (83.6) | | | (83.1) | | | (1.3) | | | (1.4) | |
| Projected benefit obligation at December 31 | | | | $ | 949.9 | | | $ | 1,032.2 | | | $ | 7.2 | | | $ | 9.2 | |
| Change in plan assets | | | | | | | | | | |
| Fair value of plan assets at January 1 | | | | $ | 1,041.3 | | | $ | 1,044.1 | | | $ | — | | | $ | (0.1) | |
| Actual return on plan assets | | | | 3.6 | | | 79.2 | | | — | | | — | |
| Foreign currency exchange rate changes | | | | 0.2 | | | 0.3 | | | — | | | — | |
| Company contributions | | | | 4.6 | | | 1.2 | | | 0.9 | | | 1.2 | |
| Plan participants’ contributions | | | | — | | | — | | | 0.4 | | | 0.3 | |
| | | | | | | | | | |
| Settlements | | | | (3.1) | | | (0.4) | | | — | | | — | |
| | | | | | | | | | |
| Benefits paid | | | | (83.6) | | | (83.1) | | | (1.3) | | | (1.4) | |
| Fair value of plan assets at December 31 | | | | $ | 963.0 | | | $ | 1,041.3 | | | $ | — | | | $ | — | |
| Funded Status | | | | | | | | | | |
| U.S. plans with assets | | | | $ | 31.7 | | | $ | 30.7 | | | $ | — | | | $ | — | |
| U.S. plans without assets | | | | (12.3) | | | (14.7) | | | (7.2) | | | (9.2) | |
| Non-U.S. plans with assets | | | | (1.0) | | | (1.6) | | | — | | | — | |
| All other plans | | | | (5.3) | | | (5.3) | | | — | | | — | |
| Net funded status of the plan (liability) | | | | $ | 13.1 | | | $ | 9.1 | | | $ | (7.2) | | | $ | (9.2) | |
| Amount recognized on the consolidated balance sheets: | | | | | | | | | | |
Pension asset (3) | | | | $ | 31.7 | | | $ | 30.7 | | | $ | — | | | $ | — | |
Accrued benefit liability (4) | | | | (18.6) | | | (21.6) | | | (7.2) | | | (9.2) | |
| Total | | | | $ | 13.1 | | | $ | 9.1 | | | $ | (7.2) | | | $ | (9.2) | |
___________________________
(1)Refer to Note 9 to the consolidated financial statements included within this Form 10-K for information on our discontinued postretirement benefit plans.
(2)The actuarial gain in 2024 and loss in 2023 were primarily driven by the change in discount rate on the U.S. qualified plan.
(3)Recorded as "Other assets including long-term receivables, net" on the consolidated balance sheets.
(4)Recorded as "Accrued pension and other postretirement benefits, current" and "Accrued pension and other postretirement benefits, long-term" on the consolidated balance sheets.
FMC CORPORATION
Notes to Consolidated Financial Statements — (Continued)
The amounts in accumulated other comprehensive income (loss) that have not yet been recognized as components of net periodic benefit cost are as follows:
| | | | | | | | | | | | | | | | | | | | | | | |
| | Pensions | | Other Benefits (1) |
| | December 31, |
| (in Millions) | 2024 | | 2023 | | 2024 | | 2023 |
| | | | | | | |
| | | | | | | |
| Prior service (cost) credit | $ | (0.1) | | | $ | (0.1) | | | $ | — | | | $ | — | |
| Net actuarial (loss) gain | (291.3) | | | (309.9) | | | 5.6 | | | 5.3 | |
| Accumulated other comprehensive income (loss) – pretax | $ | (291.4) | | | $ | (310.0) | | | $ | 5.6 | | | $ | 5.3 | |
| Accumulated other comprehensive income (loss) – net of tax | $ | (215.1) | | | $ | (229.9) | | | $ | 4.2 | | | $ | 3.9 | |
___________________________
(1) Refer to Note 9 to the consolidated financial statements included within this Form 10-K for information on our discontinued postretirement benefit plans.
The accumulated benefit obligation for all pension plans was $946.2 million and $1,027.0 million at December 31, 2024 and 2023, respectively. The following table presents the information for pension plans with projected benefit obligation and accumulated benefit obligation in excess of plan assets as of December 31, 2024 and 2023.
| | | | | | | | | | | |
| (in Millions) | December 31 |
| 2024 | | 2023 |
| Projected benefit obligations | $ | 22.5 | | | $ | 25.2 | |
| Accumulated benefit obligations | 23.1 | | | 26.1 | |
| Fair value of plan assets | 3.9 | | | 3.6 | |
Other changes in plan assets and benefit obligations for continuing operations recognized in other comprehensive loss (income) are as follows:
| | | | | | | | | | | | | | | | | | | | | | | |
| | Pensions | | Other Benefits (1) |
| | Year Ended December 31, |
| (in Millions) | 2024 | | 2023 | | 2024 | | 2023 |
| Current year net actuarial loss (gain) | $ | (3.8) | | | $ | (12.2) | | | $ | (1.4) | | | $ | (1.4) | |
| | | | | | | |
| Amortization of net actuarial (loss) gain | (14.2) | | | (15.5) | | | 1.1 | | | 1.0 | |
| Amortization of prior service (cost) credit | — | | | (0.1) | | | — | | | — | |
| | | | | | | |
| | | | | | | |
| | | | | | | |
| | | | | | | |
| | | | | | | |
| Settlement loss | (0.6) | | | (0.1) | | | — | | | — | |
| | | | | | | |
| Total recognized in other comprehensive (income) loss, before taxes | $ | (18.6) | | | $ | (27.9) | | | $ | (0.3) | | | $ | (0.4) | |
| Total recognized in other comprehensive (income) loss, after taxes | $ | (14.8) | | | $ | (22.8) | | | $ | (0.3) | | | $ | (0.3) | |
___________________________
(1) Refer to Note 9 to the consolidated financial statements included within this Form 10-K for information on our discontinued postretirement benefit plans.
FMC CORPORATION
Notes to Consolidated Financial Statements — (Continued)
The following table summarizes the weighted-average assumptions used for and the components of net annual benefit cost (income):
| | | | | | | | | | | | | | | | | | | | | | | | | | | | | | | | | | | |
| | Year Ended December 31, |
| | Pensions | | Other Benefits (1) |
| (in Millions, except for percentages) | 2024 | | 2023 | | 2022 | | 2024 | | 2023 | | 2022 |
| Discount rate | 4.97 | % | | 5.16 | % | | 2.84 | % | | 5.40 | % | | 5.03 | % | | 2.39 | % |
| Expected return on plan assets | 4.50 | % | | 4.75 | % | | 2.50 | % | | — | | | — | | | — | |
| Rate of compensation increase | 3.10 | % | | 3.10 | % | | 3.10 | % | | — | | | — | | | — | |
| Components of net annual benefit cost: | | | | | | | | | | | |
| Service cost | $ | 1.8 | | $ | 2.6 | | $ | 3.6 | | $ | — | | $ | — | | $ | — |
| Interest cost | 48.2 | | 50.4 | | 29.3 | | 0.4 | | 0.5 | | 0.3 |
| Expected return on plan assets | (44.5) | | (47.5) | | (33.1) | | — | | — | | — |
| | | | | | | | | | | |
| Amortization of prior service cost | — | | 0.1 | | 0.2 | | — | | — | | — |
| Amortization of net actuarial and other (gain) loss | 14.2 | | 15.3 | | 12.4 | | (1.1) | | (0.9) | | (0.8) |
| | | | | | | | | | | |
Recognized (gain) loss due to curtailments, settlements, and other (2) | 1.0 | | 0.4 | | 0.5 | | | | | | |
| Net annual benefit cost (income) | $ | 20.7 | | $ | 21.3 | | $ | 12.9 | | $ | (0.7) | | $ | (0.4) | | $ | (0.5) |
___________________________
(1) Refer to Note 9 to the consolidated financial statements included within this Form 10-K for information on our discontinued postretirement benefit plans.
(2) During the year ended December 31, 2023, as a result of restructuring activities planned in connection with Project Focus, we triggered a curtailment of our U.S. pension plans. The associated curtailment expense is recorded within "Non-operating pension and postretirement charges (income)" on the consolidated statements of income (loss).
Our U.S. qualified defined benefit pension plan ("U.S. Plan") holds the majority of our pension plan assets. The expected long-term rate of return on these plan assets was 4.50 percent for the year ended December 31, 2024, 4.75 percent for the year ended December 31, 2023, and 2.50 percent for the year ended December 31, 2022. The expected long-term rate of return on these plan assets decreased by 0.25 percent in 2024 compared to 2023 primarily due to fluctuating yields on corporate bonds. In developing the assumption for the long-term rate of return on assets for our U.S. Plan, we take into consideration the technical analysis performed by our outside actuaries, including historical market returns, information on the assumption for long-term real returns by asset class, inflation assumptions and expectations for standard deviation related to these best estimates. Given an actively managed investment portfolio, the expected annual rates of return by asset class for our portfolio, assuming an estimated inflation rate of approximately 2.30 percent, is in line with our assumption for the rate of return on assets. The target asset allocation at December 31, 2024 by asset category continues to be 100 percent fixed income investments.
Our U.S. Plan is fully funded and, effective July 1, 2007, all newly hired and rehired salaried and nonunion hourly employees are not eligible for the U.S. Plan. As such, the primary investment strategy is a liability hedging approach with an objective of maintaining the funded status of the plan such that the volatility is minimized and the likelihood that we will be required to make significant contributions to the plan is also limited. The portfolio is comprised of 100 percent fixed income securities and cash. Investment performance and related risks are measured and monitored on an ongoing basis through monthly liability measurements, periodic asset liability studies, and quarterly investment portfolio reviews. We use the fair value approach for our liability-hedging asset class. This class of assets is comprised solely of fixed income securities and therefore, provides a natural hedge (liability-hedging assets) against the changes in the recorded amount of net periodic benefit cost.
FMC CORPORATION
Notes to Consolidated Financial Statements — (Continued)
The following tables present our fair value hierarchy for our major categories of pension plan assets by asset class. See Note 18 to the consolidated financial statements included within this Form 10-K for the definition of fair value and the descriptions of Level 1, 2 and 3 in the fair value hierarchy.
| | | | | | | | | | | | | | | | | | | | | | | |
| (in Millions) | December 31, 2024 | | Quoted Prices in Active Markets for Identical Assets (Level 1) | | Significant Other Observable Inputs (Level 2) | | Significant Unobservable Inputs (Level 3) |
| Cash and short-term investments | $ | 43.5 | | | $ | 43.5 | | | $ | — | | | $ | — | |
| | | | | | | |
| | | | | | | |
| | | | | | | |
| | | | | | | |
| Fixed income investments: | | | | | | | |
| Investment contracts | 108.6 | | | — | | | 108.6 | | | — | |
| U.S. Government Securities | 138.8 | | | 138.8 | | | — | | | — | |
| Mutual funds | 13.7 | | | 13.7 | | | — | | | — | |
| Corporate debt instruments | 658.4 | | | — | | | 658.4 | | | — | |
| | | | | | | |
| | | | | | | |
| | | | | | | |
| | | | | | | |
| | | | | | | |
| | | | | | | |
| Total assets | $ | 963.0 | | | $ | 196.0 | | | $ | 767.0 | | | $ | — | |
| | | | | | | | | | | | | | | | | | | | | | | |
| (in Millions) | December 31, 2023 | | Quoted Prices
in Active
Markets for
Identical
Assets
(Level 1) | | Significant
Other
Observable
Inputs
(Level 2) | | Significant
Unobservable
Inputs
(Level 3) |
| Cash and short-term investments | $ | 3.0 | | | $ | 3.0 | | | $ | — | | | $ | — | |
| | | | | | | |
| | | | | | | |
| | | | | | | |
| | | | | | | |
| Fixed income investments: | | | | | | | |
| Investment contracts | 114.9 | | | — | | | 114.9 | | | — | |
| U.S. Government Securities | 204.6 | | | 204.6 | | | — | | | — | |
| Mutual funds | 13.1 | | | 13.1 | | | — | | | — | |
| Corporate debt instruments | 705.7 | | | — | | | 705.7 | | | — | |
| | | | | | | |
| | | | | | | |
| | | | | | | |
| | | | | | | |
| | | | | | | |
| | | | | | | |
| Total assets | $ | 1,041.3 | | | $ | 220.7 | | | $ | 820.6 | | | $ | — | |
We made the following contributions to our pension and other postretirement benefit plans:
| | | | | | | | | | | |
| Year Ended December 31, |
| (in Millions) | 2024 | | 2023 |
| U.S. qualified pension plan | $ | — | | | $ | — | |
| U.S. nonqualified pension plan | 4.3 | | | 1.1 | |
| Non-U.S. plans | 0.3 | | | 0.1 | |
| Other postretirement benefits | 0.9 | | | 1.2 | |
| Total | $ | 5.5 | | | $ | 2.4 | |
The following table reflects the estimated future benefit payments for our pension and other postretirement benefit plans. These estimates take into consideration expected future service, as appropriate:
| | | | | | | | | | | | | | | | | | | | | | | | | | | | | | | | | | | |
| Estimated Net Future Benefit Payments |
| (in Millions) | 2025 | | 2026 | | 2027 | | 2028 | | 2029 | | 2030 - 2034 |
| Pension Benefits | $ | 85.9 | | | $ | 85.8 | | | $ | 83.5 | | | $ | 82.6 | | | $ | 80.3 | | | $ | 375.3 | |
| Other Benefits | 0.9 | | | 1.0 | | | 0.9 | | | 0.9 | | | 0.8 | | | 3.0 | |
FMC CORPORATION
Notes to Consolidated Financial Statements — (Continued)
FMC Corporation Savings and Investment Plan. The FMC Corporation Savings and Investment Plan is a qualified salary-reduction plan under Section 401(k) of the Internal Revenue Code in which substantially all of our U.S. employees may participate by contributing a portion of their compensation. For eligible employees participating in the Plan, except for those employees covered by certain collective bargaining agreements, the Company makes matching contributions of 80 percent of the portion of those contributions up to 5 percent of the employee’s compensation. Eligible employees participating in the Plan that do not participate in the U.S. qualified pension plan are entitled to receive an employer contribution of 5 percent of the employee’s eligible compensation. Charges against income for all contributions were $14.6 million in 2024, $19.1 million in 2023, and $17.5 million in 2022.
Note 14: Share-based Compensation
Stock Compensation Plans
We have a share-based compensation plan, which has been approved by the stockholders, for certain employees, officers and directors. This plan is described below.
FMC Corporation Incentive Compensation and Stock Plan
The FMC Corporation 2023 Incentive Stock Plan (the "Plan") was approved on April 27, 2023, and provides for the grant of a variety of cash and equity awards to officers, directors, employees and consultants, including stock options, restricted stock, performance units (including restricted stock units), stock appreciation rights, and multi-year management incentive awards payable partly in cash and partly in common stock. The Compensation and Organization Committee of the Board of Directors (the "Committee"), subject to the provisions of the Plan, approves financial targets, award grants, and the times and conditions for payment of awards to employees. The Plan replaced the FMC Corporation Incentive Compensation and Stock Plan (the "2017 Plan"), as amended and restated on April 25, 2017. The maximum number of shares of our common stock that may be issued under the Plan is based on the sum of: (i) 5.0 million shares, (ii) the number of shares remaining available for grant under the 2017 Plan (1.6 million shares), and (iii) the number of shares underlying the 2017 Plan awards that were outstanding as of April 27, 2023, to the extent those shares are recycled into the Plan (in connection with the forfeiture, termination, cancellation or expiration). Historically, forfeitures of awards have been immaterial and this population is not expected to have a significant impact on the total approved share balance. Approximately 4.6 million shares of common stock are available for future grants of share based awards under the Plan as of December 31, 2024. The FMC Corporation Non-Employee Directors’ Compensation Policy, administered by the Nominating and Corporate Governance Committee of the Board of Directors, sets forth the compensation to be paid to the directors, including stock options, stock appreciation rights, restricted stock, restricted stock units, performance-based restricted stock units, and cash awards to be made to directors under the Plan.
Stock options granted under the Plan may be incentive or nonqualified stock options. The exercise price for stock options may not be less than the fair market value of the stock at the date of grant. Awards granted under the Plan vest or become exercisable or payable at the time designated by the Committee, which has generally been three years from the date of grant. Incentive and nonqualified options granted under the Plan expire no later than 10 years from the grant date.
Under the Plan, awards of restricted stock and restricted stock units may be made to selected employees. The awards vest over periods designated by the Committee, which has generally been three years, with vesting conditional upon continued employment. Compensation cost is recognized over the vesting periods based on the market value of the stock on the date of the award. Restricted stock units granted to directors under the Plan vest immediately if granted as part of, or in lieu of, the annual retainer; other restricted stock units granted to directors vest at the Annual Meeting of Shareholders in the calendar year following the May 1 annual grant date (but are subject to forfeiture on a pro rata basis if the director does not serve the full year except under certain circumstances).
At December 31, 2024 and 2023, there were restricted stock units representing an aggregate of 207,515 shares and 173,487 shares of common stock, respectively, credited to the directors’ accounts.
FMC CORPORATION
Notes to Consolidated Financial Statements — (Continued)
Stock Compensation
We recognized the following stock compensation expense: | | | | | | | | | | | | | | | | | |
| Year Ended December 31, |
| (in Millions) | 2024 | | 2023 | | 2022 |
Stock option expense, net of taxes of $1.6 in 2024, $1.5 in 2023 and $1.3 in 2022 (1) | $ | 6.1 | | | $ | 5.9 | | | $ | 4.9 | |
Restricted stock expense, net of taxes of $2.6 in 2024, $2.4 in 2023 and $2.3 in 2022 (2) | 9.8 | | | 9.0 | | | 8.5 | |
| Performance based expense, net of taxes of $0.8 in 2024, $1.5 in 2023 and $1.5 in 2022 | 2.9 | | | 5.6 | | | 5.7 | |
| | | | | |
Total stock compensation expense, net of taxes of $5.0 in 2024, $5.4 in 2023 and $5.1 in 2022 (3) | $ | 18.8 | | | $ | 20.5 | | | $ | 19.1 | |
___________________________
(1)We applied an estimated forfeiture rate of 4.0% per stock option grant in the calculation of the expense.
(2)We applied an estimated forfeiture rate of 2.0% of outstanding restricted stock grants in the calculation of the expense.
(3)This expense is classified as "Selling, general and administrative expenses" in our consolidated statements of income (loss).
We received $0.2 million, $5.3 million and $9.4 million in cash related to stock option exercises for the years ended December 31, 2024, 2023 and 2022, respectively. The shares used for the exercise of stock options occurring during the years ended December 31, 2024, 2023 and 2022 came from treasury shares.
Stock Options
The grant-date fair values of the stock options we granted in the years ended December 31, 2024, 2023 and 2022 were estimated using the Black-Scholes option valuation model, the key assumptions for which are listed in the table below. The dividend yield assumption reflects anticipated dividends on our common stock. The expected volatility assumption is based on the actual historical experience of our common stock. The expected life represents the period of time that options granted are expected to be outstanding. The risk-free interest rate is based on U.S. Treasury securities with terms equal to the expected timing of stock option exercises as of the grant date. Employee stock options generally vest after a three year period and expire ten years from the date of grant.
Black Scholes valuation assumptions for stock option grants:
| | | | | | | | | | | | | | | | | | | | | | | | | | |
| 2024 | | 2023 | | | 2022 | |
| Expected dividend yield | 4.43 | | % | | 1.80 | | % | | 1.85 | | % |
| Expected volatility | 34.08 | | % | | 31.99 | | % | | 33.18 | | % |
| Expected life (in years) | 6.4 | | | 6.5 | | | 6.5 | |
| Risk-free interest rate | 4.26 | | % | | 4.00 | | % | | 1.91 | | % |
The weighted-average grant-date fair value of options granted during the years ended December 31, 2024, 2023 and 2022 was $13.04, $42.08 and $33.53 per share, respectively.
FMC CORPORATION
Notes to Consolidated Financial Statements — (Continued)
The following summary shows stock option activity for employees under the Plan for the three years ended December 31, 2024:
| | | | | | | | | | | | | | | | | | | | | | | |
| (Shares in Thousands) | Number of Options Granted But Not Exercised | | Weighted-Average Remaining Contractual Life | | Weighted-Average Exercise Price Per Share | | Aggregate Intrinsic Value (in Millions) |
| December 31, 2021 (605 shares exercisable and 622 shares expected to vest or be exercised) | 1,254 | | | 6.2 years | | $ | 78.95 | | | $ | 38.8 | |
| Granted | 248 | | | | | 114.90 | | | |
| | | | | | | |
| Exercised | (166) | | | | | 62.74 | | | 9.6 | |
| Forfeited | (31) | | | | | 102.32 | | | |
| December 31, 2022 (672 shares exercisable and 607 shares expected to vest or be exercised) | 1,305 | | | 6.1 years | | $ | 87.35 | | | $ | 48.9 | |
| Granted | 222 | | | | | 128.92 | | | |
| Exercised | (88) | | | | | 62.42 | | | 4.6 | |
| Forfeited | (43) | | | | | 114.15 | | | |
| December 31, 2023 (824 shares exercisable and 551 shares expected to vest or be exercised) | 1,396 | | | 5.6 years | | $ | 94.73 | | | $ | 1.6 | |
| Granted | 1,181 | | | | | 52.50 | | | |
| | | | | | | |
| Exercised | (5) | | | | | 36.85 | | | — | |
| Forfeited | (101) | | | | | 79.32 | | | |
| December 31, 2024 (1,299 shares exercisable and 1,098 shares expected to vest or be exercised) | 2,471 | | | 6.3 years | | $ | 75.28 | | | $ | 0.5 | |
The number of stock options indicated in the above table as being exercisable as of December 31, 2024, had an intrinsic value of $0.5 million, a weighted-average remaining contractual term of 4.0 years, and a weighted-average exercise price of $83.03.
As of December 31, 2024, we had total remaining unrecognized compensation cost related to unvested stock options of $9.8 million which will be amortized over the weighted-average remaining requisite service period of approximately 1.7 years.
Restricted and Performance Based Equity Awards
The grant-date fair value of restricted stock awards and stock units under the Plan is based on the market price per share of our common stock on the date of grant. The related compensation cost is amortized to expense on a straight-line basis over the vesting period during which the employees perform related services, which is typically three years except for those eligible for retirement prior to the stated vesting period as well as non-employee directors.
We grant performance based share awards which represent a target number of shares of common stock to be awarded upon settlement based on the achievement of certain performance metrics. The primary performance metric is based on a total shareholder return ("TSR") relative to peer companies over a three year period. The secondary performance metric is based on a three year cumulative operating cash flow metric. Beginning in 2024, the secondary performance metric for new grants is based on the average return on invested capital for each of the three years in the measurement period. The fair value of the equity classified performance-based share awards is determined based on the number of shares of common stock expected to be awarded and a Monte Carlo valuation model.
FMC CORPORATION
Notes to Consolidated Financial Statements — (Continued)
The following table shows our employee restricted award activity for the three years ended December 31, 2024:
| | | | | | | | | | | | | | | | | | | | | | | |
| Restricted Equity | | Performance Based Equity |
| (Number of Awards in Thousands) | Number of awards | | Weighted-Average Grant Date Fair Value Per Share | | Number of
awards | | Weighted-Average Grant Date Fair Value Per Share |
| Nonvested at December 31, 2021 | 270 | | | $ | 89.56 | | | 195 | | | $ | 96.18 | |
| Granted | 103 | | | 114.50 | | | 45 | | | 140.32 | |
| | | | | | | |
| Vested | (102) | | | 77.80 | | | (102) | | | 83.74 | |
| Forfeited | (14) | | | 102.64 | | | (2) | | | 125.60 | |
| Nonvested at December 31, 2022 | 257 | | | $ | 104.54 | | | 136 | | | $ | 120.47 | |
| Granted | 118 | | | 110.71 | | | 81 | | | 137.18 | |
| Vested | (78) | | | 93.32 | | (58) | | | 108.57 |
| Forfeited | (15) | | | 114.88 | | | (6) | | | 136.25 | |
| Nonvested at December 31, 2023 | 282 | | | $ | 109.67 | | | 153 | | | $ | 131.60 | |
| Granted | 297 | | | 53.41 | | | 105 | | | 50.01 | |
| | | | | | | |
| Vested | (99) | | | 100.69 | | | (15) | | | 100.63 | |
| Forfeited | (22) | | | 86.19 | | | (7) | | | 62.06 | |
| Nonvested at December 31, 2024 | 458 | | | $ | 76.34 | | | 236 | | | $ | 85.65 | |
As of December 31, 2024, we had total remaining unrecognized compensation cost related to unvested restricted awards of $16.9 million which will be amortized over the weighted-average remaining requisite service period of approximately 1.7 years.
Note 15: Equity
The following is a summary of our capital stock activity over the past three years: | | | | | | | | | | | |
| Common Stock Shares | | Treasury Stock Shares |
| December 31, 2021 | 185,983,792 | | | 60,284,313 | |
| Stock options and awards | — | | | (286,805) | |
| Repurchases of common stock, net | — | | | 875,480 | |
| December 31, 2022 | 185,983,792 | | | 60,872,988 | |
| Stock options and awards | — | | | (301,008) | |
| Repurchases of common stock, net | — | | | 651,052 | |
| December 31, 2023 | 185,983,792 | | | 61,223,032 | |
| Stock options and awards | — | | | (122,288) | |
| Repurchases of common stock, net | — | | | 42,146 | |
| December 31, 2024 | 185,983,792 | | | 61,142,890 | |
FMC CORPORATION
Notes to Consolidated Financial Statements — (Continued)
Accumulated other comprehensive income (loss)
Summarized below is the roll forward of accumulated other comprehensive income (loss), net of tax. | | | | | | | | | | | | | | | | | | | | | | | |
| (in Millions) | Foreign currency adjustments | | Derivative Instruments (1) | | Pension and other postretirement benefits (2) | | Total |
| | | | | | | |
| | | | | | | |
| Accumulated other comprehensive income (loss), net of tax at December 31, 2021 | $ | (62.5) | | 5.2 | $ | (22.2) | | | $ | (240.8) | | | $ | (325.5) | |
| 2022 Activity | | | | | | | |
| Other comprehensive income (loss) before reclassifications | $ | (102.2) | | | $ | (65.4) | | | $ | (15.7) | | | $ | (183.3) | |
| Amounts reclassified from accumulated other comprehensive income (loss) | 4.2 | | | 35.9 | | | 9.1 | | | 49.2 | |
| | | | | | | |
| | | | | | | |
| | | | | | | |
| | | | | | | |
| Accumulated other comprehensive income (loss), net of tax at December 31, 2022 | $ | (160.5) | | | $ | (51.7) | | | $ | (247.4) | | | $ | (459.6) | |
| 2023 Activity | | | | | | | |
| Other comprehensive income (loss) before reclassifications | $ | 29.2 | | | $ | (72.4) | | | $ | 11.4 | | | $ | (31.8) | |
| Amounts reclassified from accumulated other comprehensive income (loss) | — | | | 73.9 | | | 11.0 | | | 84.9 | |
| | | | | | | |
| | | | | | | |
| | | | | | | |
| Accumulated other comprehensive income (loss), net of tax at December 31, 2023 | $ | (131.3) | | | $ | (50.2) | | | $ | (225.0) | | | $ | (406.5) | |
| 2024 Activity | | | | | | | |
| Other comprehensive income (loss) before reclassifications | $ | (52.6) | | | $ | 33.2 | | | $ | 4.9 | | | $ | (14.5) | |
| Amounts reclassified from accumulated other comprehensive income (loss) | — | | | (0.5) | | | 10.9 | | | 10.4 | |
| | | | | | | |
| Accumulated other comprehensive income (loss), net of tax at December 31, 2024 | $ | (183.9) | | | $ | (17.5) | | | $ | (209.2) | | | $ | (410.6) | |
___________________________
(1)See Note 18 to the consolidated financial statements included within this Form 10-K for more information.
(2)See Note 13 to the consolidated financial statements included within this Form 10-K for more information.
FMC CORPORATION
Notes to Consolidated Financial Statements — (Continued)
Reclassifications of accumulated other comprehensive income (loss)
The table below provides details about the reclassifications from accumulated other comprehensive income (loss) and the affected line items on the consolidated statements of income (loss) for each of the periods presented.
| | | | | | | | | | | | | | | | | | | | | | | | | | |
| Details about Accumulated Other Comprehensive Income (Loss) Components | | Amounts Reclassified from Accumulated Other Comprehensive Income (Loss) (1) | | Affected Line Item on the Consolidated Statements of Income (Loss) |
| | Year Ended December 31, | | |
| (in Millions) | | 2024 | | 2023 | | 2022 | | |
| Foreign currency translation adjustments: | | | | | | | | |
Exit from Russian Operations (2) | | $ | — | | | $ | — | | | $ | (4.2) | | | Restructuring and other charges (income) |
| Derivative instruments: | | | | | | | | |
| Gain (loss) on foreign currency contracts | | $ | 3.0 | | | $ | (110.5) | | | $ | (57.5) | | | Costs of sales and services |
| | | | | | | | |
| Gain (loss) on foreign currency contracts | | — | | | 7.3 | | | 6.5 | | | Selling, general and administrative expenses |
| Gain (loss) on interest rate contracts | | (1.9) | | | (2.4) | | | (4.0) | | | Interest expense, net |
| Total before tax | | $ | 1.1 | | | $ | (105.6) | | | $ | (55.0) | | | |
| | (0.6) | | | 31.7 | | | 19.1 | | | Provision for income taxes |
| Amount included in net income | | $ | 0.5 | | | $ | (73.9) | | | $ | (35.9) | | | |
Pension and other postretirement benefits (3): | | | | | | | | |
| Amortization of prior service costs | | $ | — | | | $ | (0.1) | | | $ | (0.1) | | | Selling, general and administrative expenses |
| Amortization of unrecognized net actuarial and other gains (losses) | | (12.7) | | | (13.8) | | | (10.9) | | | Non-operating pension and postretirement charges (income) |
| Recognized loss due to curtailment and settlement | | (1.0) | | | — | | | (0.5) | | | Non-operating pension and postretirement charges (income); Discontinued operations, net of income taxes |
| Total before tax | | $ | (13.7) | | | $ | (13.9) | | | $ | (11.5) | | | |
| | 2.8 | | | 2.9 | | | 2.4 | | | Provision for income taxes; Discontinued operations, net of income taxes |
| Amount included in net income | | $ | (10.9) | | | $ | (11.0) | | | $ | (9.1) | | | |
| Total reclassifications for the period | | $ | (10.4) | | | $ | (84.9) | | | $ | (49.2) | | | Amount included in net income |
___________________________
(1)Amounts in parentheses indicate charges to the consolidated statements of income (loss).
(2)The reclassification of historical cumulative translation adjustments was the result of the exit from our Russian operations. See Note 7 within these consolidated financial statements for more information.
(3)Pension and other postretirement benefits amounts include the impact from both continuing and discontinued operations. For detail on the continuing operations components of pension and other postretirement benefits, see Note 13 to the consolidated financial statements included within this Form 10-K.
Dividends and Share Repurchases
On January 16, 2025, we paid dividends totaling $72.6 million to our shareholders of record as of December 31, 2024. This amount is included in "Accrued and other liabilities" on the consolidated balance sheets as of December 31, 2024. For the years ended December 31, 2024, 2023 and 2022, we paid $290.6 million, $290.5 million and $267.5 million in dividends, respectively.
FMC CORPORATION
Notes to Consolidated Financial Statements — (Continued)
In February 2022, the Board of Directors authorized the repurchase of up to $1 billion of the Company's common stock. In connection with an amendment to the Company's credit agreement in November 2023, the Company agreed that it will not repurchase shares, with the exception of share repurchases under our equity compensation plans. Therefore, there were no share repurchases under the publicly announced repurchase program during 2024. As part of the amendments entered into in February 2025 and described in Note 12 to the consolidated financial statements, the Company agreed that it will not repurchase shares until December 31, 2027. At December 31, 2024, approximately $825 million remained unused under our Board-authorized repurchase program. This repurchase program does not include a specific timetable or price targets and may be suspended or terminated at any time. Shares may be purchased through open market or privately negotiated transactions at the discretion of management based on its evaluation of market conditions and other factors. We also reacquire shares from time to time from employees in connection with the vesting, exercise and forfeiture of awards under our equity compensation plans. Share repurchases in excess of issuances are subject to a 1% excise tax imposed by the 2022 Inflation Reduction Act. This tax is included as part of the cost basis of the shares acquired.
Note 16: Leases
We lease office space, vehicles and other equipment under non-cancellable leases with initial terms typically ranging from 1 to 20 years, with some leases having terms greater than 20 years. Our lease portfolio includes agreements with renewal options, purchase options and clauses for early termination based on the terms specific to the agreement.
At contract inception, we review the facts and circumstances of the arrangement to determine if the contract is a lease. We follow the guidance in ASC 842-10-15 and consider the following: whether the contract has an identified asset; if we have the right to obtain substantially all economic benefits from the asset; and if we have the right to direct the use of the underlying asset. All leased assets are classified as operating or finance under ASC 842.
To determine the present value of future minimum lease payments, we use the implicit rate when readily determinable or our incremental borrowing rate at the lease commencement date. When determining our incremental borrowing rate, we consider our centralized treasury function and our current credit profile. We then make adjustments to this rate for securitization, the length of the lease term, and leases denominated in foreign currencies. Minimum lease payments are expensed over the term of the lease on a straight-line basis. Some leases may require additional contingent or variable lease payments based on factors specific to the individual agreement. Variable lease payments for which we are typically responsible include payment of vehicle insurance, real estate taxes, and maintenance expenses.
Most leases within our portfolio are classified as operating leases under the new standard. Operating leases are included in "Other assets including long-term receivables, net", "Accrued and other liabilities", and "Other long-term liabilities" in our consolidated balance sheet. Operating lease right-of-use ("ROU") assets are subsequently measured throughout the lease term at the carrying amount of the lease liability, plus initial direct costs, plus (minus) any prepaid (accrued) lease payments, less the unamortized balance of any lease incentives received. Lease expense for lease payments is recognized on a straight-line basis over the lease term.
Operating leases relate to office spaces, IT equipment, transportation equipment, machinery equipment, furniture and fixtures, and plant and facilities under non-cancellable lease agreements. Leases primarily have fixed rental periods, with many of the real estate leases requiring additional payments for property taxes and occupancy-related costs. Leases for real estate typically have initial terms ranging from 1 to 20 years, with some leases having terms greater than 20 years. Leases for non-real estate (transportation, IT) typically have initial terms ranging from 1 to 10 years. We have elected not to record short-term leases on the balance sheet whose term is 12 months or less and does not include a purchase option or extension that is reasonably certain to be exercised.
We rent or sublease a small number of assets including equipment and office space to third-party companies. These third-party arrangements include a small number of transition service arrangements from recent acquisitions. Rental income from all subleases is not material to our business.
FMC CORPORATION
Notes to Consolidated Financial Statements — (Continued)
The ROU asset and lease liability balances as of December 31, 2024 and 2023 were as follows:
| | | | | | | | | | | | | | | | | | |
| (in Millions) | | Classification | | December 31, 2024 | | December 31, 2023 |
| Assets | | | | | | |
| | | | | | |
| Operating lease ROU assets | | Other assets including long-term receivables, net | | $ | 110.4 | | | $ | 121.8 | |
| | | | | | |
| Liabilities | | | | | | |
| | | | | | |
| Operating lease current liabilities | | Accrued and other liabilities | | $ | 24.5 | | | $ | 24.4 | |
| | | | | | |
| | | | | | |
| | | | | | |
| Operating lease noncurrent liabilities | | Other long-term liabilities | | 106.1 | | | 123.2 | |
| | | | | | |
| | | | | | |
The components of lease expense for the year ended December 31, 2024, 2023, and 2022 were as follows:
| | | | | | | | | | | | | | | | | |
| (in Millions) | Lease Cost Classification | | 2024 | | 2023 | | 2022 |
| Lease Cost | | | | | | | |
| Operating lease cost | Costs of sales and services / Selling, general and administrative expenses | | $ | 36.1 | | | $ | 33.2 | | | $ | 32.9 | |
| | | | | | | |
| | | | | | | |
| | | | | | | |
| | | | | | | |
| Variable lease cost | Costs of sales and services / Selling, general and administrative expenses | | 12.6 | | | 13.3 | | | 6.3 | |
| | | | | | | |
| Total lease cost | | | $ | 48.7 | | | $ | 46.5 | | | $ | 39.2 | |
| | | | | | | | | | |
| | December 31, 2024 | | |
| Operating Lease Term and Discount Rate | | | | |
| Weighted-average remaining lease term (years) | | 6.5 | | |
| | | | |
| | | | |
| Weighted-average discount rate | | 4.8 | % | | |
| | | | |
| | | | |
| | | | | | | | |
| (in Millions) | Year ended December 31, 2024 | Year ended December 31, 2023 |
| Other Information | | |
| | |
| Cash paid for amounts included in the measurement of lease liabilities: | | |
| Operating cash flows from operating leases | $ | (41.2) | | $ | (35.9) | |
| | |
| | |
| Supplemental non-cash information on lease liabilities arising from obtaining right-of-use assets: | | |
| Right-of-use assets obtained in exchange for new operating lease liabilities | $ | 14.2 | | $ | 21.4 | |
| | |
The following table represents our future minimum operating lease payments as of, and subsequent to, December 31, 2024 under ASC 842:
| | | | | | | | | |
| (in Millions) | | | | | Operating Leases Total |
| Maturity of Lease Liabilities | | | | | |
| 2025 | | | | | $ | 29.8 | |
| 2026 | | | | | 25.3 | |
| 2027 | | | | | 22.3 | |
| 2028 | | | | | 18.6 | |
| 2029 | | | | | 17.0 | |
| Thereafter | | | | | 39.7 | |
| Total undiscounted lease payments | | | | | $ | 152.7 | |
| Less: Present value adjustment | | | | | (22.1) | |
| Present value of lease liabilities | | | | | $ | 130.6 | |
FMC CORPORATION
Notes to Consolidated Financial Statements — (Continued)
Note 17: Earnings Per Share
Earnings per common share ("EPS") is computed by dividing net income by the weighted average number of common shares outstanding during the period on a basic and diluted basis.
Our potentially dilutive securities include potential common shares related to our stock options, restricted stock and restricted stock units. Diluted earnings per share ("Diluted EPS") considers the impact of potentially dilutive securities except in periods in which there is a loss because the inclusion of the potential common shares would have an antidilutive effect. Diluted EPS excludes the impact of potential common shares related to our stock options in periods in which the option exercise price is greater than the average market price of our common stock for the period. For the years ended December 31, 2024, 2023 and 2022 there were 2.1 million, 0.7 million and 0.4 million potential common shares excluded from Diluted EPS, respectively.
Our non-vested restricted stock awards contain rights to receive non-forfeitable dividends, and thus, are participating securities requiring the two-class method of computing EPS. The two-class method determines EPS by dividing the sum of distributed earnings to common stockholders and undistributed earnings allocated to common stockholders by the weighted average number of shares of common stock outstanding for the period. In calculating the two-class method, undistributed earnings are allocated to both common shares and participating securities based on the weighted average shares outstanding during the period.
Earnings applicable to common stock and common stock shares used in the calculation of basic and diluted earnings per share are as follows:
| | | | | | | | | | | | | | | | | |
| (in Millions, Except Share and Per Share Data) | Year Ended December 31, |
| 2024 | | 2023 | | 2022 |
| Earnings (loss) attributable to FMC stockholders: | | | | | |
| Continuing operations, net of income taxes | $ | 402.9 | | | $ | 1,420.0 | | | $ | 833.7 | |
| Discontinued operations, net of income taxes | (61.8) | | | (98.5) | | | (97.2) | |
| Net income (loss) attributable to FMC stockholders | $ | 341.1 | | | $ | 1,321.5 | | | $ | 736.5 | |
| Less: Distributed and undistributed earnings allocable to restricted award holders | (1.2) | | | (2.7) | | | (1.7) | |
| Net income (loss) allocable to common stockholders | $ | 339.9 | | | $ | 1,318.8 | | | $ | 734.8 | |
| Basic earnings (loss) per common share attributable to FMC stockholders: | | | | | |
| Continuing operations | $ | 3.22 | | | $ | 11.34 | | | $ | 6.60 | |
| Discontinued operations | (0.49) | | | (0.79) | | | (0.77) | |
| Net income (loss) | $ | 2.73 | | | $ | 10.55 | | | $ | 5.83 | |
| Diluted earnings (loss) per common share attributable to FMC stockholders: | | | | | |
| Continuing operations | $ | 3.21 | | | $ | 11.31 | | | $ | 6.58 | |
| Discontinued operations | (0.49) | | | (0.78) | | | (0.77) | |
| Net income (loss) | $ | 2.72 | | | $ | 10.53 | | | $ | 5.81 | |
| Shares (in thousands): | | | | | |
| Weighted average number of shares of common stock outstanding - Basic | 125,004 | | | 125,060 | | | 125,975 | |
| Weighted average additional shares assuming conversion of potential common shares | 354 | | | 473 | | | 732 | |
| Shares – diluted basis | 125,358 | | | 125,533 | | | 126,707 | |
FMC CORPORATION
Notes to Consolidated Financial Statements — (Continued)
Note 18: Financial Instruments, Risk Management and Fair Value Measurements
Our financial instruments include cash and cash equivalents, trade receivables, other current assets, certain receivables classified as other long-term assets, accounts payable, and amounts included in investments and certain accruals. The carrying value of these financial instruments approximates their fair value. Our other financial instruments include the following:
| | | | | | | | |
| Financial Instrument | | Valuation Method |
| | |
| Foreign exchange forward contracts | | Estimated amounts that would be received or paid to terminate the contracts at the reporting date based on current market prices for applicable currencies. |
| | |
| Commodity forward and option contracts | | Estimated amounts that would be received or paid to terminate the contracts at the reporting date based on quoted market prices for applicable commodities. |
| | |
| Debt | | Our estimates and information obtained from independent third parties using market data, such as bid/ask spreads for the last business day of the reporting period. |
The estimated fair value of the financial instruments in the above table have been determined using standard pricing models which take into account the present value of expected future cash flows discounted to the balance sheet date. These standard pricing models utilize inputs derived from, or corroborated by, observable market data such as interest rate yield curves and currency and commodity spot and forward rates. In addition, we test a subset of our valuations against valuations received from the transaction's counterparty to validate the accuracy of our standard pricing models. Accordingly, the estimates presented may not be indicative of the amounts that we would realize in a market exchange at settlement date and do not represent potential gains or losses on these agreements. The estimated fair values of foreign exchange forward contracts, commodity forward and option contracts, and interest rate contracts are included in the tables within this Note. The estimated fair value of debt is $3,223.6 million and $3,988.2 million and the carrying amount is $3,365.3 million and $3,957.6 million as of December 31, 2024 and 2023, respectively.
Use of Derivative Financial Instruments to Manage Risk
We mitigate certain financial exposures, including currency risk, commodity purchase exposures and interest rate risk through a program of risk management that includes the use of derivative financial instruments. We enter into foreign exchange contracts, including forward and purchased option contracts, to reduce the effects of fluctuating foreign currency exchange rates.
Foreign Currency Exchange Risk Management
We conduct business in many foreign countries, exposing earnings, cash flows, and our financial position to foreign currency risks. The majority of these risks arise as a result of foreign currency transactions. Our policy is to minimize exposure to adverse changes in currency exchange rates. This is accomplished through a controlled program of risk management that includes the use of foreign currency debt and forward foreign exchange contracts. We also use forward foreign exchange contracts to hedge firm and highly anticipated foreign currency cash flows, with an objective of balancing currency risk to provide adequate protection from significant fluctuations in the currency markets.
The primary currencies for which we have exchange rate exposure are the U.S. dollar versus the Brazilian real, Chinese yuan, Indian rupee, euro, Mexican peso and Argentine peso.
Commodity Price Risk
We are exposed to risks in energy costs due to fluctuations in energy prices, including natural gas, electricity, and other commodities. We attempt to mitigate our exposure to increasing energy costs by entering into physical and financial derivative contracts to hedge the cost of future deliveries of our commodities.
Interest Rate Risk
We use various strategies to manage our interest rate exposure, including entering into interest rate swap agreements to achieve a targeted mix of fixed and variable-rate debt. In the agreements we exchange, at specified intervals, the difference between fixed and variable-interest amounts calculated on an agreed-upon notional principal amount.
FMC CORPORATION
Notes to Consolidated Financial Statements — (Continued)
Concentration of Credit Risk
Our counterparties to derivative contracts are primarily major financial institutions. We limit the dollar amount of contracts entered into with any one financial institution and monitor counterparties’ credit ratings. We also enter into master netting agreements with each financial institution, where possible, which helps mitigate the credit risk associated with our financial instruments. While we may be exposed to credit losses due to the nonperformance of counterparties, we consider this risk remote.
Financial Guarantees and Letter-of-Credit Commitments
We enter into various financial instruments with off-balance sheet risk as part of the normal course of business. These off-balance sheet instruments include financial guarantees and contractual commitments to extend financial guarantees under letters of credit and other assistance to customers. See Notes 1 and 19 to the consolidated financial statements included within this Form 10-K for more information. Decisions to extend financial guarantees to customers, and the amount of collateral required under these guarantees, is based on our evaluation of creditworthiness on a case-by-case basis.
Accounting for Derivative Instruments and Hedging Activities
Cash Flow Hedges
As of December 31, 2024, we had open foreign currency forward contracts in AOCI in a net after-tax gain position of $12.1 million designated as cash flow hedges of underlying forecasted sales and purchases. Current open contracts hedge forecasted transactions until December 31, 2025. At December 31, 2024, we had open forward contracts with various expiration dates to buy, sell or exchange foreign currencies with a U.S. dollar equivalent of approximately $654.2 million.
At December 31, 2024 we had no interest rate swap contracts.
In prior periods, we settled on various interest rate swap agreements related to several debt issuances and recorded gains (losses) in other comprehensive income, which is also being amortized over the life of those debt instruments. As of December 31, 2024, there was a remaining net after-tax loss of $26.2 million in AOCI related to these settlements.
As of December 31, 2024, we had no open commodity contracts in AOCI designated as cash flow hedges of underlying forecasted purchases. At December 31, 2024, we had no mmBTUs (millions of British Thermal Units) in aggregate notional volume of outstanding natural gas commodity forward contracts.
Approximately $12.1 million of net after-tax gains, representing open foreign currency exchange contracts will be realized in earnings during the twelve months ending December 31, 2025 if spot rates in the future are consistent with forward rates as of December 31, 2024. The actual effect on earnings will be dependent on the actual spot rates when the forecasted transactions occur. We recognize derivative gains and losses in the "Costs of sales and services" line on the consolidated statements of income (loss).
Derivatives Not Designated As Hedging Instruments
We hold certain forward contracts that have not been designated as cash flow hedging instruments for accounting purposes. Contracts used to hedge the exposure to foreign currency fluctuations associated with certain monetary assets and liabilities are not designated as cash flow hedging instruments, and changes in the fair value of these items are recorded in earnings.
We had open forward contracts not designated as cash flow hedging instruments for accounting purposes with various expiration dates to buy, sell or exchange foreign currencies with a U.S. dollar equivalent of approximately $3,195.0 million at December 31, 2024.
FMC CORPORATION
Notes to Consolidated Financial Statements — (Continued)
Fair Value of Derivative Instruments
The following tables provide the gross fair value and net balance sheet presentation of our derivative instruments as of December 31, 2024 and 2023:
| | | | | | | | | | | | | | | | | | | | | | | | | | | | | |
| December 31, 2024 |
| Gross Amount of Derivatives | | | | | | |
| (in Millions) | Designated as Cash Flow Hedges | | Not Designated as Hedging Instruments | | Total Gross Amounts | | Gross Amounts Subject to Master Netting Arrangements | | Net Amounts |
| Derivatives | | | | | | | | | |
| Foreign exchange contracts | $ | 25.0 | | | $ | 22.0 | | | $ | 47.0 | | | $ | (12.9) | | | $ | 34.1 | |
| | | | | | | | | |
| | | | | | | | | |
| | | | | | | | | |
| | | | | | | | | |
Total derivative assets (1) | $ | 25.0 | | | $ | 22.0 | | | $ | 47.0 | | | $ | (12.9) | | | $ | 34.1 | |
| | | | | | | | | |
| Foreign exchange contracts | $ | (8.3) | | | $ | (4.6) | | | $ | (12.9) | | | $ | 12.9 | | | $ | — | |
| | | | | | | | | |
| | | | | | | | | |
| | | | | | | | | |
Total derivative liabilities (2) | $ | (8.3) | | | $ | (4.6) | | | $ | (12.9) | | | $ | 12.9 | | | $ | — | |
| | | | | | | | | |
| Net derivative assets (liabilities) | $ | 16.7 | | | $ | 17.4 | | | $ | 34.1 | | | $ | — | | | $ | 34.1 | |
| | | | | | | | | | | | | | | | | | | | | | | | | | | | | |
| December 31, 2023 |
| Gross Amount of Derivatives | | |
| (in Millions) | Designated as Cash Flow Hedges | | Not Designated as Hedging Instruments | | Total Gross Amounts | | Gross Amounts Subject to Master Netting Arrangements | | Net Amounts |
| Derivatives | | | | | | | | | |
| Foreign exchange contracts | $ | 2.7 | | | $ | 3.0 | | | $ | 5.7 | | | $ | (5.5) | | | $ | 0.2 | |
| | | | | | | | | |
| | | | | | | | | |
| | | | | | | | | |
Total derivative assets (1) | $ | 2.7 | | | $ | 3.0 | | | $ | 5.7 | | | $ | (5.5) | | | $ | 0.2 | |
| | | | | | | | | |
| Foreign exchange contracts | $ | (9.7) | | | $ | (7.4) | | | $ | (17.1) | | | $ | 5.5 | | | $ | (11.6) | |
| | | | | | | | | |
| | | | | | | | | |
| | | | | | | | | |
Total derivative liabilities (2) | $ | (9.7) | | | $ | (7.4) | | | $ | (17.1) | | | $ | 5.5 | | | $ | (11.6) | |
| | | | | | | | | |
| Net derivative assets (liabilities) | $ | (7.0) | | | $ | (4.4) | | | $ | (11.4) | | | $ | — | | | $ | (11.4) | |
____________________
(1) Balance is included in "Prepaid and other current assets" on the consolidated balance sheets.
(2) Balance is included in "Accrued and other liabilities" on the consolidated balance sheets.
FMC CORPORATION
Notes to Consolidated Financial Statements — (Continued)
The following tables summarize the gains or losses related to our cash flow hedges and derivatives not designated as hedging instruments:
Derivatives in Cash Flow Hedging Relationships | | | | | | | | | | | | | | | |
| Contracts | | | | |
| (in Millions) | Foreign exchange | | Interest rate | Total | | | |
| Accumulated other comprehensive income (loss), net of tax at December 31, 2021 | $ | 31.1 | | | $ | (53.3) | | $ | (22.2) | | | | |
| 2022 Activity | | | | | | | |
| Unrealized hedging gains (losses) and other, net of tax | $ | (86.3) | | | $ | 20.9 | | $ | (65.4) | | | | |
Reclassification of deferred hedging (gains) losses, net of tax (1) | 32.8 | | | 3.1 | | 35.9 | | | | |
| Total derivative instrument impact on comprehensive income, net of tax | $ | (53.5) | | | $ | 24.0 | | $ | (29.5) | | | | |
| | | | | | | |
| | | | | | | |
| Accumulated other comprehensive income (loss), net of tax at December 31, 2022 | $ | (22.4) | | | $ | (29.3) | | $ | (51.7) | | | | |
| 2023 Activity | | | | | | | |
| Unrealized hedging gains (losses) and other, net of tax | $ | (72.0) | | | $ | (0.4) | | $ | (72.4) | | | | |
Reclassification of deferred hedging (gains) losses, net of tax (1) | 72.0 | | | 1.9 | | 73.9 | | | | |
| Total derivative instrument impact on comprehensive income, net of tax | $ | — | | | $ | 1.5 | | $ | 1.5 | | | | |
| | | | | | | |
| Accumulated other comprehensive income (loss), net of tax at December 31, 2023 | $ | (22.4) | | | $ | (27.8) | | $ | (50.2) | | | | |
| 2024 Activity | | | | | | | |
| Unrealized hedging gains (losses) and other, net of tax | $ | 33.2 | | | $ | — | | $ | 33.2 | | | | |
Reclassification of deferred hedging (gains) losses, net of tax (1) | (2.1) | | | 1.6 | | (0.5) | | | | |
| Total derivative instrument impact on comprehensive income, net of tax | $ | 31.1 | | | $ | 1.6 | | $ | 32.7 | | | | |
| | | | | | | |
| Accumulated other comprehensive income (loss), net of tax at December 31, 2024 | $ | 8.7 | | | $ | (26.2) | | $ | (17.5) | | | | |
___________________________
(1)Amounts are included in "Costs of sales and services", "Selling, general and administrative expenses", and "Interest expense" on the consolidated statements of income (loss).
Derivatives Not Designated as Hedging Instruments | | | | | | | | | | | | | | | | | |
| Amount of Pre-tax Gain (Loss) Recognized in Income on Derivatives (1) |
| Year Ended December 31, |
| (in Millions) | 2024 | | 2023 | | 2022 |
| Foreign exchange contracts | $ | (6.1) | | | $ | (33.7) | | | $ | (37.2) | |
| | | | | |
| Total | $ | (6.1) | | | $ | (33.7) | | | $ | (37.2) | |
___________________________
(1)Amounts in the columns represent the gain or loss on the derivative instrument offset by the gain or loss on the hedged item. These amounts are included in "Costs of sales and services" and to a lesser extent "Selling, general, and administrative expenses" on the consolidated statements of income (loss).
Fair Value Measurements
Fair value is the price that would be received to sell an asset or paid to transfer a liability in an orderly transaction between market participants at the measurement date. Market participants are defined as buyers or sellers in the principle or most advantageous market for the asset or liability that are independent of the reporting entity, knowledgeable and able and willing to transact for the asset or liability.
Fair Value Hierarchy
We have categorized our assets and liabilities that are recorded at fair value, based on the priority of the inputs to the valuation technique, into a three-level fair value hierarchy. The fair value hierarchy gives the highest priority to quoted prices in active markets for identical assets or liabilities (Level 1) and the lowest priority to unobservable inputs (Level 3). If the inputs used to measure the assets and liabilities fall within different levels of the hierarchy, the categorization is based on the lowest level input that is significant to the fair value measurement of the instrument.
FMC CORPORATION
Notes to Consolidated Financial Statements — (Continued)
Recurring Fair Value Measurements
The following tables present our fair value hierarchy for those assets and liabilities measured at fair value on a recurring basis in our consolidated balance sheets:
| | | | | | | | | | | | | | | | | | | | | | | |
| (in Millions) | December 31, 2024 | | Quoted Prices in Active Markets for Identical Assets (Level 1) | | Significant Other Observable Inputs (Level 2) | | Significant Unobservable Inputs (Level 3) |
| Assets | | | | | | | |
| | | | | | | |
| | | | | | | |
| | | | | | | |
Derivatives – Foreign exchange (1) | $ | 34.1 | | | $ | — | | | $ | 34.1 | | | $ | — | |
Derivatives - Interest Rate (1) | — | | | — | | | — | | | — | |
Other (2) (3) (4) | 120.1 | | | 84.1 | | | — | | | 36.0 | |
| Total Assets | $ | 154.2 | | | $ | 84.1 | | | $ | 34.1 | | | $ | 36.0 | |
| | | | | | | |
| Liabilities | | | | | | | |
| | | | | | | |
| | | | | | | |
Derivatives – Foreign exchange (1) | $ | — | | | $ | — | | | $ | — | | | $ | — | |
Derivatives - Interest Rate (1) | — | | | — | | | — | | | — | |
Other (2) | 23.2 | | | 23.2 | | | — | | | — | |
| Total Liabilities | $ | 23.2 | | | $ | 23.2 | | | $ | — | | | $ | — | |
| | | | | | | | | | | | | | | | | | | | | | | |
| (in Millions) | December 31, 2023 | | Quoted Prices in Active Markets for Identical Assets (Level 1) | | Significant Other Observable Inputs (Level 2) | | Significant Unobservable Inputs (Level 3) |
| Assets | | | | | | | |
| | | | | | | |
| | | | | | | |
Derivatives – Foreign exchange (1) | $ | 0.2 | | | $ | — | | | $ | 0.2 | | | $ | — | |
Derivatives - Interest Rate (1) | — | | | — | | | — | | | — | |
Other (2) (3) | 47.1 | | | 23.8 | | | — | | | 23.3 | |
| Total Assets | $ | 47.3 | | | $ | 23.8 | | | $ | 0.2 | | | $ | 23.3 | |
| | | | | | | |
| Liabilities | | | | | | | |
| | | | | | | |
| | | | | | | |
Derivatives – Foreign exchange (1) | $ | 11.6 | | | $ | — | | | $ | 11.6 | | | $ | — | |
Derivatives - Interest Rate (1) | — | | | — | | | — | | | — | |
Other (2) | 24.4 | | | 24.4 | | | — | | | — | |
| Total Liabilities | $ | 36.0 | | | $ | 24.4 | | | $ | 11.6 | | | $ | — | |
____________________
(1)See the Fair Value of Derivative Instruments table within this Note for classifications on our consolidated balance sheets.
(2)Includes a deferred compensation arrangement, through which we hold various investment securities, recognized on our balance sheet. Both the asset and liability are recorded at fair value. Asset amounts included in "Other assets including long-term receivables, net" on the consolidated balance sheets. Liability amounts are included in "Other long-term liabilities" on the consolidated balance sheets.
(3)FMC maintains a beneficial interest in a trade receivables securitization fund. The fair value of the beneficial interest is determined by calculating the expected amount of cash to be received on the fund’s outstanding credit notes. As part of this evaluation, we rely on unobservable inputs, including estimating the anticipated credit losses. We consider historical information, current conditions and other reasonable factors as part of this assessment. Asset amounts are included in "Other assets including long-term receivables, net" on the consolidated balance sheets.
(4)Includes money market funds, which consist of highly liquid investments valued at quoted market prices, recognized as "Cash and cash equivalents" on our consolidated balance sheets.
Nonrecurring Fair Value Measurements
There were no non-recurring fair value measurements on the consolidated balance sheets during the periods presented.
FMC CORPORATION
Notes to Consolidated Financial Statements — (Continued)
Note 19: Guarantees, Commitments and Contingencies
We continue to monitor the conditions that are subject to guarantees and indemnifications to identify whether a liability must be recognized in our financial statements.
The following table provides the estimated undiscounted amount of potential future payments for each major group of guarantees at December 31, 2024. These guarantees arise during the ordinary course of business from relationships with customers and nonconsolidated affiliates. Non-performance by the guaranteed party triggers the obligation requiring us to make payments to the beneficiary of the guarantee. Based on our experience these types of guarantees have not had a material effect on our consolidated financial position or on our liquidity. Our expectation is that future payment or performance related to the non-performance of others is considered unlikely.
| | | | | |
| (in Millions) | |
| Guarantees: | |
Guarantees of vendor financing - short term (1) | $ | 85.5 | |
| |
Other debt guarantees (2) | 72.4 | |
| Total | $ | 157.9 | |
____________________
(1)Represents guarantees to financial institutions on behalf of certain customers for their seasonal borrowing. The short-term amount is recorded as "Guarantees of vendor financing" on the consolidated balance sheets.
(2)These guarantees represent the outstanding commitment provided to third-party banks for credit extended to various direct and indirect customers and nonconsolidated affiliates. The liability for the guarantees is recorded at an amount that approximates fair value (i.e. representing the stand-ready obligation) based on our historical collection experience and a current assessment of credit exposure. Historically, the fair value of these guarantees has been and continues to be in the current reporting period, immaterial and the majority of these guarantees have had an expiration date of less than one year.
Excluded from the chart above are parent-company guarantees we provide to lending institutions that extend credit to our foreign subsidiaries. Since these guarantees are provided for consolidated subsidiaries, the consolidated financial position is not affected by the issuance of these guarantees. Also excluded from the chart, in connection with our property and asset sales and divestitures, we have agreed to indemnify the buyer for certain liabilities, including environmental contamination and taxes that occurred prior to the date of sale or provided guarantees to third parties relating to certain contracts assumed by the buyer. Our indemnification or guarantee obligations with respect to certain liabilities may be indefinite as to duration and may or may not be subject to a deductible, minimum claim amount or cap. As such, it is not possible for us to predict the likelihood that a claim will be made or to make a reasonable estimate of the maximum potential loss or range of loss. Therefore, we have not recorded any specific liabilities for these guarantees. If triggered, we may be able to recover some of the indemnity payments from third parties. For certain obligations related to our divestitures for which we can make a reasonable estimate of the maximum potential loss or range of loss and is probable, a liability in those instances has been recorded.
Commitments
Purchase Obligations
Our minimum commitments under our take-or-pay purchase obligations associated with the sourcing of materials and energy total approximately $288.1 million as of December 31, 2024. Since the majority of our minimum obligations under these contracts are over the life of the contract on a year-by-year basis, we are unable to determine the periods in which these obligations could be payable under these contracts. However, we intend to fulfill the obligations associated with these contracts through our purchases associated with the normal course of business.
FMC CORPORATION
Notes to Consolidated Financial Statements — (Continued)
Contingencies
Securities Litigation. Beginning on November 9, 2023, several purported FMC shareholders filed putative class action complaints in the U.S. District Court for the Eastern District of Pennsylvania (the “E.D.P.A”) and named as defendants FMC and certain of its current and former executives, asserting claims under the federal securities laws. The various actions were consolidated in an action captioned, In re FMC Corporation Securities Litigation, No. 2:23-cv-04398-KNS (E.D.P.A.) (the “Consolidated Securities Class Action”). On July 17, 2024, the Lead Plaintiff filed an amended consolidated complaint, alleging that the defendants in the Consolidated Securities Class Action made certain material misstatements and omissions regarding FMC’s business, operations, and prospects, including with respect to, among other things: (1) the alleged diminishment of patent protection for flagship products in certain markets, including India, China, and Brazil; (2) the status of proceedings related to FMC’s patent protection efforts; (3) the alleged extent of generic competition with FMC’s products; (4) allegedly overstocked inventory channels; and (5) the alleged extent of industry consolidation among retailers and distributors and the impact thereof on FMC’s business. The complaint alleges violations of Section 10(b) of the Securities Exchange Act of 1934 (“Exchange Act”) and Rule 10b-5 promulgated thereunder, as well as Section 20(a) of the Exchange Act. The complaint seeks unspecified damages and other relief on behalf of all persons and entities who purchased or otherwise acquired FMC stock during the putative class period, between February 9, 2022 and October 30, 2023. Defendants in the Consolidated Securities Class Action moved to dismiss the complaint on September 17, 2024, and the motion remains pending.
On February 13, 2025 and February 14, 2025, two other purported FMC shareholders filed putative class action complaints in the E.D.P.A. against FMC and certain of its former and current executives, respectively captioned Mohammed v. FMC Corporation, et al. and Macomb County Employees’ Retirement System and Macomb County Retirement Health Care Fund v. FMC Corporation, et al. (the “Mohammed and Macomb County Actions”). The complaints generally allege that FMC made misrepresentations regarding its business, operations, and prospects, including allegations that the defendants failed to disclose: (1) that channel inventory management initiatives were not progressing as anticipated; (2) challenges arising from product pricing; and/or (3) the financial impact of cost-plus pricing arrangements with distributors. The complaints allege violations of Section 10(b) of the Exchange Act and Rule 10b-5 promulgated thereunder, as well as Section 20(a) of the Exchange Act, and seek unspecified damages and other relief on behalf of all persons and entities who purchased or otherwise acquired FMC stock during the period from November 16, 2023 to February 4, 2025.
Derivative Litigation. On January 23, 2025, a purported FMC shareholder filed a derivative action on behalf of FMC in the E.D.P.A. captioned Menke v. FMC Corporation, et al., 2:25-cv-404 (E.D.P.A) (the “Derivative Action”). The derivative complaint alleges, among other things, that certain current and former FMC officers and directors breached their fiduciary duties to FMC, and engaged in other purported misconduct, based on the same purported misstatements and omissions alleged in the Consolidated Securities Class Action.
Defendants in the Consolidated Securities Class Action, the Mohammed and Macomb County Actions, and the Derivative Action believe the claims against them are without merit and intend to defend themselves vigorously.
Asbestos claims. Like hundreds of other industrial companies, we have been named as one of many defendants in asbestos-related personal injury litigation. Most of these cases allege personal injury or death resulting from exposure to asbestos in premises of FMC or to asbestos-containing components installed in machinery or equipment manufactured or sold by discontinued operations.
We intend to continue managing these asbestos-related cases in accordance with our historical experience. We have established a reserve for this litigation within our discontinued operations and believe that any exposure of a loss in excess of the established reserve cannot be reasonably estimated. Our experience has been that the overall trends in asbestos litigation have changed over time. Over the last several years, we have seen changes in the jurisdictions where claims against FMC are being filed and changes in the mix of products named in the various claims. Because these claim trends have yet to form a predictable pattern, we are presently unable to reasonably estimate our asbestos liability with respect to claims that may be filed in the future.
Paraquat cases. Along with Chevron USA and Syngenta AG, FMC has been named in approximately 1,100 cases pending in the Philadelphia Court of Common Pleas Mass Tort Program. In general, plaintiffs allege they were exposed to paraquat, and as a result of this exposure, they developed disease or other health conditions. Chevron and Syngenta (or their predecessors) were registrants of paraquat products in the United States. FMC is not aware of ever having registered any paraquat product in the United States. FMC believes the Company has meritorious defenses and intends to defend itself vigorously. The Court in Philadelphia has set a series of bellwether trial dates throughout 2025. FMC has been dismissed from the first trial case.
FMC CORPORATION
Notes to Consolidated Financial Statements — (Continued)
Currenta explosion. On July 27, 2021, an explosion occurred at a waste incineration plant located in Leverkusen, Germany that is owned and operated by Currenta GmbH & Co. OHG (“Currenta”). The cause of the explosion remains under investigation. On July 29, 2024, FMC was served with a US District Court of Delaware Complaint regarding the Currenta (Germany) site explosion. The Complaint was filed by HDI Global SE, XL Insurance Company SE, Direktion für Deutschland, SwissRe International SE, Starr Europe Insurance limited, Vienna Insurance Group and QBE Re (Europe Ltd.) (“Currenta’s Insurers”) and named FMC Corporation as a defendant. The Complaint alleged that it was FMC’s negligence which led to the explosion. Currenta’s Insurers claim that they have paid Currenta over 200 million EUR, which they are seeking to recover. On September 27, 2024, FMC filed a Motion to Dismiss the Complaint. Rather than opposing FMC’s Motion, Currenta’s Insurers voluntarily dismissed the action on October 15, 2024.
On November 29, 2024, Currenta’s Insurers served a Statement of Claim to FMC’s Ronland manufacturing facility, filed in Germany, against FMC Agricultural Solutions A/S (a/k/a Cheminova A/S) (“FMC A/S”), seeking to recover the amounts allegedly paid to Currenta. The allegations are similar to those filed in the Delaware action. On December 10, 2024, FMC A/S was served with a Statement of Claim, filed in Germany, brought by Currenta. Currenta alleges 146 million EUR in damages arising from the Currenta site explosion. Subsequently, AVG Abfall-Verwertungs-Gesellschaft mbH (“AVG”), a waste management company retained by FMC A/S to assist with disposing the waste at issue, has been named as an additional defendant in both actions. FMC believes the Company has meritorious defenses in both cases and intends to defend itself vigorously.
Other contingent liabilities. In addition to the matters disclosed above, we have certain other contingent liabilities arising from litigation, claims, products we have sold, guarantees or warranties we have made, contracts we have entered into, indemnities we have provided, and other commitments or obligations incident to the ordinary course of business.
In Brazil, we are subject to claims from various governmental agencies regarding alleged additional indirect (non-income) taxes or duties as well as product liability matters and labor cases related to our operations. These disputes take many years to resolve as the matters move through administrative or judicial courts. We have provided reserves for such Brazilian matters that we consider probable and for which a reasonable estimate of the obligation can be made in the amount of $2.3 million and $5.8 million as of December 31, 2024 and 2023, respectively. The aggregate estimated reasonably possible loss contingencies related to such Brazilian matters exceed amounts accrued by approximately $74.6 million at December 31, 2024. We defend these cases vigorously through to final judgment at the final level of adjudication. This reasonably possible estimate is based upon information available as of the date of the filing and the actual future losses may be higher given the uncertainties regarding the ultimate decision by administrative or judicial authorities in Brazil.
In India, we are subject to audits or other proceedings by tax authorities regarding certain alleged additional indirect taxes related to our operations. Indian tax authorities have begun auditing or investigating many companies, including our FMC subsidiary in India, on the goods and service tax ("GST") indirect tax law which came into force in 2017. Such proceedings and potential future litigations, in which the tax authorities are challenging the technical tax position taken by the Company, take many years to resolve as the matters are heard and decided upon by tax authorities or courts. We have provided reserves for such historical Indian tax matters that we consider probable and a reasonable estimate of the obligation as of December 31, 2024 was approximately $12.2 million. The timing and amount of the remaining obligations will vary based on final negotiations and the reserve will be reduced as these payments are made.
Regarding other contingencies arising from operations, some of these contingencies are known - for example pending product liability litigation or claims - but are so preliminary that the merits cannot be determined, or if more advanced, are not deemed material based on current knowledge. Some contingencies are unknown - for example, claims with respect to which we have no notice or claims which may arise in the future, resulting from products we have sold, guarantees or warranties we have made, or indemnities we have provided. Therefore, we are unable to develop a reasonable estimate of our potential exposure of loss for these contingencies, either individually or in the aggregate, at this time. Based on information currently available and established reserves, we have no reason to believe that the ultimate resolution of our known contingencies, including the matters described in this Note, will have a material adverse effect on our consolidated financial position, liquidity or results of operations. However, there can be no assurance that the outcome of these contingencies will be favorable, and adverse results in certain of these contingencies could have a material adverse effect on our consolidated financial position, results of operations in any one reporting period, or liquidity.
See Note 10 to the consolidated financial statements included within this Form 10-K for the Portland Harbor site for legal proceedings associated with our environmental contingencies.
FMC CORPORATION
Notes to Consolidated Financial Statements — (Continued)
Note 20: Segment Information
As discussed in Note 1 to the consolidated financial statements included within this Form 10-K, we operate as a single business segment providing innovative solutions to growers around the world with a robust product portfolio fueled by a market-driven discovery and development pipeline in crop protection and plant health.
We have determined that the Chief Executive Officer (the “CEO”) serves as the Chief Operating Decision Maker ("CODM") for the Company. The determination of a single segment is consistent with the financial information regularly reviewed by the CEO for purposes of evaluating performance, allocating resources, setting incentive compensation targets and both planning and forecasting future periods. The CEO reviews consolidated net income (loss) as a key performance measure of profit (loss) for the Company’s single segment and reviews significant expenses, if relevant, on a consolidated basis consistent with the presentation on the consolidated statements of income (loss).
The CEO’s review is focused on consolidated results for the Company. However, the CEO may receive supplemental information as part of his review, which includes revenue by geographic region as well as by major product category. For the presentation of disaggregated revenue, refer to Note 3 to the consolidated financial statements included within this Form 10-K.
The following table provides our long-lived assets by major geographical region:
| | | | | | | | | | | |
| (in Millions) | December 31, |
| 2024 | | 2023 |
Long-lived assets (1) | | | |
North America (2) | $ | 956.0 | | | $ | 1,063.4 | |
| Latin America | 278.8 | | | 714.8 | |
Europe, Middle East, and Africa (2) | 3,685.4 | | | 1,718.2 | |
Asia (2) | 251.0 | | | 1,964.1 | |
| Total | $ | 5,171.2 | | | $ | 5,460.5 | |
___________________________
(1)Geographic long-lived assets exclude long-term deferred income taxes.
(2)The countries with long-lived assets in excess of 10 percent of consolidated long-lived assets at December 31, 2024 and 2023 are Singapore, which totaled $5.0 million and $1,699.6 million, the U.S., which totaled $941.6 million and $1,036.7 million and Denmark, which totaled $1,280.1 million and $1,334.0 million, respectively. In connection with our plans to establish a global technology and innovation center in Switzerland, we completed intra-entity transfers of certain intellectual property to one of the Company's Swiss subsidiaries during 2024. At December 31, 2024, Switzerland had long-lived assets in excess of 10 percent of consolidated long-lived assets totaling $2,050.8 million.
FMC CORPORATION
Notes to Consolidated Financial Statements — (Continued)
Note 21: Supplemental Information
The following tables present details of prepaid and other current assets, other assets including long-term receivables, net, accrued and other liabilities and other long-term liabilities as presented on the consolidated balance sheets:
| | | | | | | | | | | |
| (in Millions) | December 31, |
| 2024 | | 2023 |
| Prepaid and other current assets | | | |
| Prepaid insurance | $ | 12.7 | | | $ | 15.3 | |
| Tax related items including value added tax receivables | 262.3 | | | 241.9 | |
Refund asset (1) | 113.1 | | | 59.5 | |
| Environmental obligation recoveries (Note 10) | 1.0 | | | 1.5 | |
| Derivative assets (Note 18) | 47.0 | | | 5.7 | |
| Other prepaid and current assets | 60.1 | | | 75.0 | |
| Total | $ | 496.2 | | | $ | 398.9 | |
| | | | | | | | | | | |
| (in Millions) | December 31, |
| 2024 | | 2023 |
| Other assets including long-term receivables, net | | | |
| Non-current receivables (Note 8) | $ | 39.7 | | | $ | 19.5 | |
| Advance to contract manufacturers | 17.4 | | | 97.1 | |
| Capitalized software, net | 112.1 | | | 123.3 | |
| Environmental obligation recoveries (Note 10) | 2.8 | | | 3.4 | |
| Beneficial interest in trade receivables securitization (Note 18) | 36.0 | | | 23.3 | |
| Income taxes indirect benefits | 35.2 | | | 19.7 | |
| Operating lease ROU asset (Note 16) | 110.4 | | | 121.8 | |
| Deferred compensation arrangements (Note 18) | 22.3 | | | 23.8 | |
| Pension and other postretirement benefits (Note 13) | 31.7 | | | 30.7 | |
| Other long-term assets | 20.6 | | | 26.9 | |
| Total | $ | 428.2 | | | $ | 489.5 | |
___________________________
(1)In accordance with revenue standard requirements, a sales return liability is recognized for the consideration paid by a customer to which FMC does not expect to be entitled, together with a corresponding refund asset to recover the product from the customer. See (1) below.
FMC CORPORATION
Notes to Consolidated Financial Statements — (Continued)
| | | | | | | | | | | |
| (in Millions) | December 31, |
| 2024 | | 2023 |
| Accrued and other liabilities | | | |
| Restructuring reserves (Note 7) | $ | 58.3 | | | $ | 47.4 | |
| Dividend payable (Note 15) | 72.6 | | | 72.5 | |
| Accrued payroll | 62.2 | | | 55.5 | |
| Environmental reserves, current, net of recoveries (Note 10) | 91.8 | | | 97.4 | |
| Derivative liabilities (Note 18) | 12.9 | | | 17.1 | |
Furadan® product exit asset retirement obligations (Note 1) | 4.0 | | | 5.0 | |
| Operating lease current liabilities (Note 16) | 24.5 | | | 24.4 | |
Other accrued and other liabilities (1) | 428.9 | | | 365.5 | |
| Total | $ | 755.2 | | | $ | 684.8 | |
| | | |
| | | |
| | | | | | | | | | | |
| (in Millions) | December 31, |
| 2024 | | 2023 |
| Other long-term liabilities | | | |
| Restructuring reserves (Note 7) | $ | 92.8 | | | $ | 3.0 | |
Furadan® product exit asset retirement obligations (Note 1) | 3.5 | | | 1.4 | |
Transition tax related to Tax Cuts and Jobs Act (2) | — | | | 23.3 | |
| Contingencies related to uncertain tax positions | 58.3 | | | 62.4 | |
| Deferred compensation arrangements (Note 18) | 23.2 | | | 24.4 | |
| Self-insurance reserves (primarily workers' compensation) | 2.6 | | | 2.3 | |
| Lease obligations (Note 16) | 106.1 | | | 123.2 | |
| Reserve for discontinued operations (Note 9) | 154.2 | | | 135.6 | |
| Unfavorable contracts | 5.5 | | | 5.6 | |
| Other long-term liabilities | 24.5 | | | 26.2 | |
| Total | $ | 470.7 | | | $ | 407.4 | |
___________________________
(1)Other accrued and other liabilities includes our estimated liability for sales returns.
(2)Represents the final noncurrent portion of overall transition tax in 2023.
FMC CORPORATION
Notes to Consolidated Financial Statements — (Continued)
Note 22: Quarterly Financial Information (Unaudited) | | | | | | | | | | | | | | | | | | | | | | | | | | | | | | | | | | | | | | | | | | | | | | | |
| (in Millions, Except Share and Per Share Data) | 2024 | | 2023 |
| 1Q | | 2Q | | 3Q | | 4Q | | 1Q | | 2Q | | 3Q | | 4Q |
| Revenue | $ | 918.0 | | | $ | 1,038.4 | | | $ | 1,065.4 | | | $ | 1,224.3 | | | $ | 1,344.3 | | | $ | 1,014.5 | | | $ | 981.9 | | | $ | 1,146.1 | |
| Gross margin | 339.7 | | | 398.1 | | | 386.4 | | | 524.7 | | | 581.3 | | | 432.8 | | | 381.2 | | | 435.7 | |
| Income (loss) from continuing operations before equity in (earnings) loss of affiliates, non-operating pension and postretirement charges (income), interest expense, net and income taxes | 74.0 | | | 62.3 | | | 135.6 | | | 234.6 | | | 304.5 | | | 132.2 | | | 100.8 | | | 18.1 | |
| Income (loss) from continuing operations | 9.4 | | | 298.0 | | | 66.5 | | | 29.5 | | | 207.4 | | | 53.9 | | | 4.6 | | | 1,153.6 | |
| Discontinued operations, net of income taxes | (12.5) | | | (2.8) | | | (0.9) | | | (45.6) | | | (11.5) | | | (21.5) | | | (8.3) | | | (57.2) | |
| Net income (loss) | $ | (3.1) | | | $ | 295.2 | | | $ | 65.6 | | | $ | (16.1) | | | $ | 195.9 | | | $ | 32.4 | | | $ | (3.7) | | | $ | 1,096.4 | |
| Less: Net income (loss) attributable to noncontrolling interests | (0.4) | | | 0.1 | | | 0.6 | | | 0.2 | | | (0.1) | | | 1.9 | | | (0.2) | | | (2.1) | |
| Net income (loss) attributable to FMC stockholders | $ | (2.7) | | | $ | 295.1 | | | $ | 65.0 | | | $ | (16.3) | | | $ | 196.0 | | | $ | 30.5 | | | $ | (3.5) | | | $ | 1,098.5 | |
| Amounts attributable to FMC stockholders: | | | | | | | | | | | | | | | |
| Continuing operations, net of income taxes | $ | 9.8 | | | $ | 297.9 | | | $ | 65.9 | | | $ | 29.3 | | | $ | 207.5 | | | $ | 52.0 | | | $ | 4.8 | | | $ | 1,155.7 | |
| Discontinued operations, net of income taxes | (12.5) | | | (2.8) | | | (0.9) | | | (45.6) | | | (11.5) | | | (21.5) | | | (8.3) | | | (57.2) | |
| Net income (loss) | $ | (2.7) | | | $ | 295.1 | | | $ | 65.0 | | | $ | (16.3) | | | $ | 196.0 | | | $ | 30.5 | | | $ | (3.5) | | | $ | 1,098.5 | |
Basic earnings (loss) per common share attributable to FMC stockholders (1): | | | | | | | | | | | | | | | |
| Continuing operations | $ | 0.08 | | | $ | 2.37 | | | $ | 0.53 | | | $ | 0.23 | | | $ | 1.65 | | | $ | 0.41 | | | $ | 0.04 | | | $ | 9.23 | |
| Discontinued operations | (0.10) | | | (0.02) | | | (0.01) | | | (0.36) | | | (0.09) | | | (0.17) | | | (0.07) | | | (0.46) | |
| Basic net income (loss) per common share | $ | (0.02) | | | $ | 2.35 | | | $ | 0.52 | | | $ | (0.13) | | | $ | 1.56 | | | $ | 0.24 | | | $ | (0.03) | | | $ | 8.77 | |
Diluted earnings (loss) per common share attributable to FMC stockholders (1): | | | | | | | | | | | | | | | |
| Continuing operations | $ | 0.08 | | | $ | 2.37 | | | $ | 0.53 | | | $ | 0.23 | | | $ | 1.64 | | | $ | 0.41 | | | $ | 0.04 | | | $ | 9.23 | |
| Discontinued operations | (0.10) | | | (0.02) | | | (0.01) | | | (0.36) | | | (0.09) | | | (0.17) | | | (0.07) | | | (0.46) | |
| Diluted net income (loss) per common share | $ | (0.02) | | | $ | 2.35 | | | $ | 0.52 | | | $ | (0.13) | | | $ | 1.55 | | | $ | 0.24 | | | $ | (0.03) | | | $ | 8.77 | |
| Weighted average shares outstanding: | | | | | | | | | | | | | | | |
| Basic | 124.9 | | | 125.0 | | | 125.0 | | | 125.0 | | | 125.3 | | | 125.1 | | | 124.9 | | | 124.9 | |
| Diluted | 125.2 | | | 125.4 | | | 125.5 | | | 125.5 | | | 126.1 | | | 125.7 | | | 125.3 | | | 125.2 | |
___________________________ (1)The sum of quarterly earnings per common share may differ from the full-year amount.
Report of Independent Registered Public Accounting Firm
To the Stockholders and Board of Directors
FMC Corporation:
Opinion on the Consolidated Financial Statements
We have audited the accompanying consolidated balance sheets of FMC Corporation and subsidiaries (the Company) as of December 31, 2024 and 2023, the related consolidated statements of income (loss), comprehensive income (loss), changes in equity, and cash flows for each of the years in the three-year period ended December 31, 2024, and the related notes and schedule II – valuation and qualifying accounts and reserves (collectively, the consolidated financial statements). In our opinion, the consolidated financial statements present fairly, in all material respects, the financial position of the Company as of December 31, 2024 and 2023, and the results of its operations and its cash flows for each of the years in the three-year period ended December 31, 2024, in conformity with U.S. generally accepted accounting principles.
We also have audited, in accordance with the standards of the Public Company Accounting Oversight Board (United States) (PCAOB), the Company’s internal control over financial reporting as of December 31, 2024, based on criteria established in Internal Control – Integrated Framework (2013) issued by the Committee of Sponsoring Organizations of the Treadway Commission, and our report dated February 28, 2025 expressed an unqualified opinion on the effectiveness of the Company’s internal control over financial reporting.
Basis for Opinion
These consolidated financial statements are the responsibility of the Company’s management. Our responsibility is to express an opinion on these consolidated financial statements based on our audits. We are a public accounting firm registered with the PCAOB and are required to be independent with respect to the Company in accordance with the U.S. federal securities laws and the applicable rules and regulations of the Securities and Exchange Commission and the PCAOB.
We conducted our audits in accordance with the standards of the PCAOB. Those standards require that we plan and perform the audit to obtain reasonable assurance about whether the consolidated financial statements are free of material misstatement, whether due to error or fraud. Our audits included performing procedures to assess the risks of material misstatement of the consolidated financial statements, whether due to error or fraud, and performing procedures that respond to those risks. Such procedures included examining, on a test basis, evidence regarding the amounts and disclosures in the consolidated financial statements. Our audits also included evaluating the accounting principles used and significant estimates made by management, as well as evaluating the overall presentation of the consolidated financial statements. We believe that our audits provide a reasonable basis for our opinion.
Critical Audit Matter
The critical audit matter communicated below is a matter arising from the current period audit of the consolidated financial statements that was communicated or required to be communicated to the audit committee and that: (1) relates to accounts or disclosures that are material to the consolidated financial statements and (2) involved our especially challenging, subjective, or complex judgments. The communication of a critical audit matter does not alter in any way our opinion on the consolidated financial statements, taken as a whole, and we are not, by communicating the critical audit matter below, providing a separate opinion on the critical audit matter or on the accounts or disclosures to which it relates.
Evaluation of unrecognized tax benefits
As discussed in Note 11, the Company has $53.1 million of unrecognized tax benefits as of December 31, 2024. The Company recognizes the largest amount of tax benefit that it believes is more than 50 percent likely to be sustained. A significant amount of the Company’s earnings are generated by certain foreign subsidiaries whose earnings are taxed at lower rates than the United States federal statutory rate.
We identified the evaluation of the Company’s unrecognized tax benefits related to the earnings of certain foreign subsidiaries as a critical audit matter. Complex auditor judgment was required in evaluating the Company’s interpretation of tax law, the transfer pricing structure, and its analysis of the recognition of its tax benefits.
The following are the primary procedures we performed to address this critical audit matter. We evaluated the design and tested the operating effectiveness of certain internal controls over the unrecognized tax benefits process, including controls related to the transfer pricing structure which affects the determination of earnings of certain foreign subsidiaries. We also involved tax and transfer pricing professionals with specialized skills and knowledge, who assisted in:
•Examining the Company’s tax positions, including the methodology for evaluating unrecognized tax benefits;
•Assessing transfer pricing studies alignment with applicable laws and regulations;
•Evaluating the Company’s interpretation of tax laws and income tax consequences of intercompany transactions;
•Considering applicable settlements with taxing authorities; and
•Evaluating the Company’s determination of unrecognized tax benefits.
/s/ KPMG LLP
We have served as the Company's auditor since 1928.
Philadelphia, Pennsylvania
February 28, 2025
MANAGEMENT’S ANNUAL REPORT ON INTERNAL CONTROL OVER FINANCIAL REPORTING
Management is responsible for establishing and maintaining adequate internal control over financial reporting as defined in Exchange Act Rule 13a-15(f). FMC’s internal control over financial reporting is a process designed to provide reasonable assurance regarding the reliability of financial reporting and the preparation of financial statements for external purposes in accordance with U.S. generally accepted accounting principles. Internal control over financial reporting includes those written policies and procedures that:
•pertain to the maintenance of records that, in reasonable detail, accurately and fairly reflect the transactions and dispositions of the assets of FMC;
•provide reasonable assurance that transactions are recorded as necessary to permit preparation of financial statements in accordance with U.S. generally accepted accounting principles;
•provide reasonable assurance that receipts and expenditures of FMC are being made only in accordance with authorization of management and directors of FMC; and
•provide reasonable assurance regarding prevention or timely detection of unauthorized acquisition, use or disposition of assets that could have a material effect on the consolidated financial statements.
Internal control over financial reporting includes the controls themselves, monitoring and internal auditing practices and actions taken to correct deficiencies as identified.
Because of its inherent limitations, internal control over financial reporting may not prevent or detect misstatements. Also, projections of any evaluation of effectiveness to future periods are subject to the risk that controls may become inadequate because of changes in conditions, or that the degree of compliance with the policies or procedures may deteriorate.
We assessed the effectiveness of our internal control over financial reporting as of December 31, 2024. We based this assessment on criteria for effective internal control over financial reporting described in "Internal Control—Integrated Framework (COSO 2013)" issued by the Committee of Sponsoring Organizations of the Treadway Commission. Management’s assessment included an evaluation of the design of our internal control over financial reporting and testing of the operational effectiveness of our internal control over financial reporting. We reviewed the results of our assessment with the Audit Committee of our Board of Directors.
Based on this assessment, we determined that, as of December 31, 2024, FMC has effective internal control over financial reporting.
KPMG LLP, our independent registered public accounting firm, has issued an attestation report on the effectiveness of internal control over financial reporting as of December 31, 2024, which appears on the following page.
Report of Independent Registered Public Accounting Firm
To the Stockholders and Board of Directors
FMC Corporation:
Opinion on Internal Control Over Financial Reporting
We have audited FMC Corporation and subsidiaries' (the Company) internal control over financial reporting as of December 31, 2024, based on criteria established in Internal Control – Integrated Framework (2013) issued by the Committee of Sponsoring Organizations of the Treadway Commission. In our opinion, the Company maintained, in all material respects, effective internal control over financial reporting as of December 31, 2024, based on criteria established in Internal Control – Integrated Framework (2013) issued by the Committee of Sponsoring Organizations of the Treadway Commission.
We also have audited, in accordance with the standards of the Public Company Accounting Oversight Board (United States) (PCAOB), the consolidated balance sheets of the Company as of December 31, 2024 and 2023, the related consolidated statements of income (loss), comprehensive income (loss), changes in equity, and cash flows for each of the years in the three-year period ended December 31, 2024, and the related notes and schedule II – valuation and qualifying accounts and reserves (collectively, the consolidated financial statements), and our report dated February 28, 2025 expressed an unqualified opinion on those consolidated financial statements.
Basis for Opinion
The Company’s management is responsible for maintaining effective internal control over financial reporting and for its assessment of the effectiveness of internal control over financial reporting, included in the accompanying Management's Annual Report on Internal Control Over Financial Reporting. Our responsibility is to express an opinion on the Company’s internal control over financial reporting based on our audit. We are a public accounting firm registered with the PCAOB and are required to be independent with respect to the Company in accordance with the U.S. federal securities laws and the applicable rules and regulations of the Securities and Exchange Commission and the PCAOB.
We conducted our audit in accordance with the standards of the PCAOB. Those standards require that we plan and perform the audit to obtain reasonable assurance about whether effective internal control over financial reporting was maintained in all material respects. Our audit of internal control over financial reporting included obtaining an understanding of internal control over financial reporting, assessing the risk that a material weakness exists, and testing and evaluating the design and operating effectiveness of internal control based on the assessed risk. Our audit also included performing such other procedures as we considered necessary in the circumstances. We believe that our audit provides a reasonable basis for our opinion.
Definition and Limitations of Internal Control Over Financial Reporting
A company’s internal control over financial reporting is a process designed to provide reasonable assurance regarding the reliability of financial reporting and the preparation of financial statements for external purposes in accordance with generally accepted accounting principles. A company’s internal control over financial reporting includes those policies and procedures that (1) pertain to the maintenance of records that, in reasonable detail, accurately and fairly reflect the transactions and dispositions of the assets of the company; (2) provide reasonable assurance that transactions are recorded as necessary to permit preparation of financial statements in accordance with generally accepted accounting principles, and that receipts and expenditures of the company are being made only in accordance with authorizations of management and directors of the company; and (3) provide reasonable assurance regarding prevention or timely detection of unauthorized acquisition, use, or disposition of the company’s assets that could have a material effect on the financial statements.
Because of its inherent limitations, internal control over financial reporting may not prevent or detect misstatements. Also, projections of any evaluation of effectiveness to future periods are subject to the risk that controls may become inadequate because of changes in conditions, or that the degree of compliance with the policies or procedures may deteriorate.
/s/ KPMG LLP
Philadelphia, Pennsylvania
February 28, 2025
FMC CORPORATION
SCHEDULE II - VALUATION AND QUALIFYING ACCOUNTS AND RESERVES
| | | | | | | | | | | | | | | | | | | | | | | | | | | | | |
| | | Provision (Benefit) | | | | |
| (in Millions) | Balance, Beginning of Year | | Charged to Costs and Expenses | | Charged to Other Comprehensive Income | | Net recoveries, write-offs and other (1) | | Balance, End of Year |
| December 31, 2024 | | | | | | | | | |
Reserve for doubtful accounts (2) | $ | 56.2 | | | 10.4 | | | — | | | (5.9) | | | $ | 60.7 | |
| Deferred tax valuation allowance | 588.4 | | | 625.7 | | | (0.3) | | | — | | | 1,213.8 | |
| December 31, 2023 | | | | | | | | | |
Reserve for doubtful accounts (2) | $ | 78.4 | | | 6.3 | | | — | | | (28.5) | | | $ | 56.2 | |
| Deferred tax valuation allowance | 457.6 | | | 130.5 | | | 0.3 | | | — | | | 588.4 | |
| December 31, 2022 | | | | | | | | | |
Reserve for doubtful accounts (2) | $ | 65.1 | | | (0.5) | | | — | | | 13.8 | | | $ | 78.4 | |
| Deferred tax valuation allowance | 398.7 | | | 61.5 | | | (2.6) | | | — | | | 457.6 | |
____________________
(1)Write-offs are net of recoveries.
(2)Includes short-term and long-term portion.
ITEM 9. CHANGES IN AND DISAGREEMENTS WITH ACCOUNTANTS ON ACCOUNTING AND FINANCIAL DISCLOSURE
None.
ITEM 9A. CONTROLS AND PROCEDURES
(a) Evaluation of disclosure controls and procedures. Based on management’s evaluation (with the participation of the Company’s Chief Executive Officer and Chief Financial Officer), the Chief Executive Officer and Chief Financial Officer have concluded that, as of the end of the period covered by this report, the Company’s disclosure controls and procedures (as defined in Rules 13a-15(e) and 15d-15(e) under the Securities Exchange Act of 1934) are effective to provide reasonable assurance that information required to be disclosed by the Company in reports filed or submitted under the Securities Exchange Act of 1934 is recorded, processed, summarized and reported within the time periods specified in the SEC’s rules and forms and is accumulated and communicated to management, including our principal executive officer and principal financial officer, as appropriate to allow timely decisions regarding required disclosure.
Management’s annual report on internal control over financial reporting. Refer to Management’s Annual Report on Internal Control Over Financial Reporting which is included in Item 8 of Part II of this Annual Report on Form 10-K and is incorporated by reference to this Item 9A.
Audit report of the independent registered public accounting firm. Refer to Report of Independent Registered Public Accounting Firm which is included in Item 8 of Part II of this Annual Report on Form 10-K and is incorporated by reference to this Item 9A.
(b) Change in Internal Controls. There have been no changes in internal control over financial reporting that occurred during the quarter ended December 31, 2024 that materially affected or are reasonably likely to materially affect our internal control over financing reporting.
ITEM 9B. OTHER INFORMATION
Securities Trading Plans of Directors and Officers
During the three months ended December 31, 2024, none of the directors or officers, as defined in Rule 16a-1(f) of the Securities Exchange Act of 1934, of the Company adopted or terminated (i) a Rule 10b5-1 trading arrangement, as defined in Item 408(a) under Regulation S-K of the Securities Act of 1933, or (ii) a non-Rule 10b5-1 trading arrangement, as defined in Item 408(c) under Regulation S-K of the Securities Act of 1933.
ITEM 9C. DISCLOSURE REGARDING FOREIGN JURISDICTIONS THAT PREVENT INSPECTIONS
Not Applicable.
PART III
ITEM 10. DIRECTORS, EXECUTIVE OFFICERS AND CORPORATE GOVERNANCE
Information concerning directors, appearing under the caption "III. Board of Directors" in our Proxy Statement to be filed with the SEC in connection with the Annual Meeting of Stockholders scheduled to be held on April 29, 2025 (the "Proxy Statement"), information concerning executive officers, appearing under the caption "Item 4A. Information about our Executive Officers" in Part I of this Annual Report on Form 10-K, information concerning the Audit Committee, appearing under the caption "IV. Information About the Board of Directors and Corporate Governance - Committees and Independence of Directors - Audit Committee" in the Proxy Statement, information concerning the Code of Ethics, appearing under the caption "IV. Information About the Board of Directors and Corporate Governance - Corporate Governance - Code of Ethics and Business Conduct Policy" in the Proxy Statement, and information concerning the insider trading policy, appearing under the caption "IV. Information About the Board of Directors and Corporate Governance - Corporate Governance - Policy Concerning Insider Trading " in the Proxy Statement, is incorporated herein by reference in response to this Item 10.
ITEM 11. EXECUTIVE COMPENSATION
The information contained in the Proxy Statement appearing under the captions "VI. Executive Compensation" with respect to executive compensation, "IV. Information About the Board of Directors and Corporate Governance—Director Compensation" and "IV. Information About the Board of Directors and Corporate Governance—Corporate Governance—Compensation and Human Capital Committee Interlocks and Insider Participation" is incorporated herein by reference in response to this Item 11.
ITEM 12. SECURITY OWNERSHIP OF CERTAIN BENEFICIAL OWNERS AND MANAGEMENT AND RELATED STOCKHOLDER MATTERS
The information contained in the section titled "V. Security Ownership of FMC Corporation" in the Proxy Statement, with respect to security ownership of certain beneficial owners and management, is incorporated herein by reference in response to this Item 12.
Equity Compensation Plan Information
The table below sets forth information with respect to compensation plans under which equity securities of FMC are authorized for issuance as of December 31, 2024. All of the equity compensation plans pursuant to which we are currently granting equity awards have been approved by stockholders.
| | | | | | | | | | | | | | | | | | | | |
| (Shares in thousands) | | Number of Securities to be issued upon exercise of outstanding options and restricted stock awards (A) (2) | | Weighted-average exercise price of outstanding options awards (B) (1) | | Number of Securities remaining available for future issuance under equity compensation plans (excluding securities reflected in column (A)) (C) |
| Equity Compensation Plans approved by stockholders | | 3,373 | | | $ | 75.28 | | | 4,600 | |
| | | | | | |
| | | | | | |
____________________
(1)Taking into account all outstanding awards included in this table, the weighted-average exercise price of such stock options is $75.28 and the weighted-average term-to-expiration is 6.3 years.
(2)Includes 2,471 thousand stock options and 694 thousand restricted stock awards granted to employees and 208 thousand restricted stock units held by directors.
ITEM 13. CERTAIN RELATIONSHIPS AND RELATED TRANSACTIONS, AND DIRECTOR INDEPENDENCE
The information contained in the Proxy Statement concerning our independent directors and related party transactions under the caption "IV. Information About the Board of Directors and Corporate Governance—Committees and Independence of Directors," and the information contained in the Proxy Statement concerning our related party transactions policy, appearing under the caption "IV. Information About the Board of Directors and Corporate Governance—Corporate Governance—Related Party Transactions Policy," is incorporated herein by reference in response to this Item 13.
ITEM 14. PRINCIPAL ACCOUNTANT FEES AND SERVICES
The information contained in the Proxy Statement in the section titled "II. The Proposals to be Voted On—Ratification of Appointment of Independent Registered Public Accounting Firm" is incorporated herein by reference in response to this Item 14.
Our independent registered public accounting firm is KPMG LLP, Philadelphia, PA. Auditor Firm ID: PCAOB ID 185
PART IV
ITEM 15. EXHIBITS AND FINANCIAL STATEMENT SCHEDULES
Documents filed with this Report
1. Consolidated financial statements of FMC Corporation and its subsidiaries are incorporated under Item 8 of this Form 10-K.
2. The following supplementary financial information is filed in this Form 10-K: | | | | | |
| | Page |
| Financial Statements Schedule II – Valuation and qualifying accounts and reserves for the years ended December 31, 2024, 2023, and 2022 | |
The schedules not included herein are omitted because they are not applicable or the required information is presented in the financial statements or related notes.
3. Exhibits – The following exhibits are filed as a part of, or incorporated by reference into, this Form 10-K:
(a)Exhibits | | | | | | |
| Exhibit No. | Exhibit Description | |
| (2) | | Plan of acquisition, reorganization, arrangement, liquidation or succession | |
| | |
| *2.1a | | |
| | |
| *2.1b | | |
| | |
| (3) | | Articles of Incorporation and By-Laws | |
| | |
| *3.1 | | |
| | |
| *3.2 | | |
| | |
| (4) | | Instruments defining the rights of security holders, including indentures. FMC Corporation undertakes to furnish to the SEC upon request, a copy of any instrument defining the rights of holders of long-term debt of FMC Corporation and its consolidated subsidiaries and for any of its unconsolidated subsidiaries for which financial statements are required to be filed. | |
| | |
| *4.1 | | |
| | |
| *4.2 | | |
| | |
| *4.3 | | |
| | |
| *4.4 | | |
| | |
| *4.5 | | |
| | |
| *4.6 | | |
| | |
| *4.7 | | |
| | |
| | | | | | |
| (10) | | Material contracts | |
| | |
| *10.1a | | |
| | |
| *10.1b | Amendment No. 1, dated as of April 22, 2020, to the Third Amended and Restated Credit Agreement, dated as of May 17, 2019, among FMC Corporation, certain subsidiaries of FMC Corporation party thereto, the lenders and issuing banks party thereto, and Citibank, N.A., as Administrative Agent for such lenders. (Exhibit 10.1 to the Current Report on Form 8-K filed on April 22, 2020) | |
| | |
| *10.1c | | |
| | |
| *10.1d | | |
| | |
| *10.1e | Amendment No. 1, dated as of June 27, 2022, to the Term Loan Agreement, dated as of November 22, 2021, among FMC Corporation, the lenders party thereto, and Citibank, N.A., as administrative agent for such lenders (Exhibit 10.1 to the Current Report on Form 8-K filed on June 28, 2022) | |
| | |
| *10.1f | Amendment No. 1, dated as of June 30, 2023, to Fifth Amended and Restated Credit Agreement, dated as of June 17, 2022, among FMC Corporation, certain foreign subsidiaries of FMC Corporation party thereto, the lenders and issuing banks party thereto, and Citibank, N.A., as Administrative Agent for such lenders (Exhibit 10.1 to the Current Report on Form 8-K filed on July 7, 2023) | |
| | |
| *10.1g | Amendment No. 2, dated as of November 7, 2023, to Fifth Amended and Restated Credit Agreement, dated as of June 17, 2022, among FMC Corporation, certain foreign subsidiaries of FMC Corporation party thereto, the lenders and issuing banks party thereto, and Citibank, N.A., as Administrative Agent for such lenders (Exhibit 10.1 to the Current Report on Form 8-K filed on November 7, 2023) | |
| | |
| *10.1h | Amendment No. 3, dated as of February 3, 2025, to Fifth Amended and Restated Credit Agreement, dated as of June 17, 2022, among FMC Corporation, certain foreign subsidiaries of FMC Corporation party thereto, the lenders and issuing banks party thereto, and Citibank, N.A., as Administrative Agent for such lenders (Exhibit 10.1 to the Current Report on Form 8-K filed on February 4, 2025) | |
| | |
| *10.1i | Amendment No. 4, dated as of February 11, 2025, to Fifth Amended and Restated Credit Agreement, dated as of June 17, 2022, among FMC Corporation, certain foreign subsidiaries of FMC Corporation party thereto, the lenders and issuing banks party thereto, and Citibank, N.A., as Administrative Agent for such lenders (Exhibit 10.1 to the Current Report on Form 8-K filed on February 11, 2025) | |
| | |
| †*10.2 | | |
| | |
| †*10.2.a | | |
| | |
| †*10.2.b | | |
| | |
| †*10.3 | | |
| | |
| †*10.4 | | |
| | |
| †*10.5 | | |
| | |
| †*10.5a | | |
| | |
| †*10.5b | | |
| | |
| | | | | | |
| †*10.6 | | |
| | |
| †* 10.6a | | |
| | |
| †* 10.6b | | |
| | |
| †*10.6c | | |
| | |
| †*10.6d | | |
| | |
| †*10.6e | | |
| | |
| †*10.6f | | |
| | |
| †*10.6g | | |
| | |
| †*10.7 | | |
| | |
| †*10.7a | | |
| | |
| †*10.7b | | |
| | |
| †*10.7c | | |
| | |
| *10.7d | | |
| | |
| †*10.7e | | |
| | |
| †*10.7f | | |
| | |
| †*10.8 | | |
| | |
| †*10.9 | | |
| | |
| †*10.10 | | |
| | |
| *10.11 | | |
| | |
| *10.12 | | |
| | |
| *10.13 | | |
| | |
| | | | | | |
| *10.14 | | |
| | |
| *10.15 | | |
| | |
| †*10.16 | | |
| | |
| *10.17 | | |
| | |
| †*10.18 | | |
| | |
| †*10.19 | Executive Severance Agreement, dated April 1, 2019, between FMC Corporation and Michael Reilly (Exhibit 10.19 to the Annual Report on Form 10-K filed on February 25, 2021). Pursuant to Instruction 2 to Item 601 of Regulation S-K, Executive Severance Agreements that are substantially identical in all material respects, except as to the parties thereto and the dates thereof, between FMC Corporation and each of Ronaldo Pereira, Diane Allemang, Vsevolod Rostovtsev, and Jacqueline Scanlan were not filed. | |
| | |
| †*10.20 | | |
| | |
| †*10.21 | | |
| | |
| †*10.21a | | |
| | |
| †*10.21b | | |
| | |
| †*10.21c | | |
| | |
| †*10.21d | | |
| | |
| †*10.21e | | |
| | |
| †*10.21f | | |
| | |
| †*10.21g | | |
| | |
| †10.21h | | |
| | |
| †10.21i | | |
| | |
| †10.21j | | |
| | |
| †10.21k | | |
| | |
| †*10.22 | | |
| | |
| †*10.23 | | |
| | |
| †*10.24 | | |
| | |
| | | | | | |
| †*10.25 | | |
| | |
| *18 | | |
| | |
| *18.1 | | |
| | |
| 19 | | | |
| | |
| 21 | | | |
| | |
| 23.1 | | | |
| | |
| 31.1 | | | |
| | |
| 31.2 | | | |
| | |
| 32.1 | | | |
| | |
| 32.2 | | | |
| | |
| *97 | | |
| | |
| 101 | | Interactive Data File | |
* Incorporated by reference
† Management contract or compensatory plan or arrangement
ITEM 16. FORM 10-K SUMMARY
Optional disclosure, not included in this Report.
SIGNATURES
Pursuant to the requirements of Section 13 or 15(d) of the Securities Exchange Act of 1934, the Registrant has duly caused this report to be signed on its behalf by the undersigned, thereunto duly authorized.
| | | | | |
| FMC CORPORATION |
| (Registrant) |
| |
| By: | /s/ ANDREW D. SANDIFER |
| Andrew D. Sandifer Executive Vice President and Chief Financial Officer |
| |
| Date: February 28, 2025 |
Pursuant to the requirements of the Securities Exchange Act of 1934, this report has been signed below by the following persons on behalf of the Registrant and in the capacities and on the date indicated.
| | | | | | | | |
| Signature | Title | Date |
/S/ ANDREW D. SANDIFER Andrew D. Sandifer | Executive Vice President and Chief Financial Officer | February 28, 2025 |
| | |
/S/ NICHOLAS L. PFEIFFER Nicholas L. Pfeiffer | Vice President, Chief Accounting Officer,
and Corporate Controller | February 28, 2025 |
| | |
/S/ PIERRE R. BRONDEAU Pierre R. Brondeau | Chairman of the Board and
Chief Executive Officer | February 28, 2025 |
| | |
| | |
| | |
/S/ EDUARDO E. CORDEIRO Eduardo E. Cordeiro | Director | February 28, 2025 |
| | |
/S/ CAROL ANTHONY ("JOHN") DAVIDSON Carol Anthony ("John") Davidson | Director | February 28, 2025 |
| | |
/S/ ANTHONY DISILVESTRO Anthony DiSilvestro | Director | February 28, 2025 |
| | |
/S/ KATHY L. FORTMANN Kathy L. Fortmann | Director | February 28, 2025 |
| | |
/S/ C. SCOTT GREER C. Scott Greer | Director | February 28, 2025 |
| | |
/S/ K'LYNNE JOHNSON K'Lynne Johnson | Director | February 28, 2025 |
| | |
/S/ DIRK A. KEMPTHORNE Dirk A. Kempthorne | Director | February 28, 2025 |
| | |
| | |
| | |
/S/ MARGARETH ØVRUM Margareth Øvrum | Director | February 28, 2025 |
| | |
/S/ ROBERT C. PALLASH Robert C. Pallash | Director | February 28, 2025 |
| | |
/S/ JOHN M. RAINES John M. Raines | Director | February 28, 2025 |
| | |
/S/ PATRICIA VERDUIN PH.D. Patricia Verduin Ph.D. | Director | February 28, 2025 |