UNITED STATES
SECURITIES AND EXCHANGE COMMISSION
Washington, D.C. 20549
Form 10-K
(Mark One)
x | ANNUAL REPORT PURSUANT TO SECTION 13 OR 15 (d) OF THE SECURITIES EXCHANGE ACT OF 1934 |
For the fiscal year ended January 31, 2012
¨ | TRANSITION REPORT PURSUANT TO SECTION 13 OR 15 (d) OF THE SECURITIES EXCHANGE ACT OF 1934 |
For the transition period from to
Commission file number1-4372
|
| FOREST CITY ENTERPRISES, INC. |
| (Exact name of registrant as specified in its charter) |
| | | | | | |
| Ohio | | | | 34-0863886 |
(State or other jurisdiction of incorporation or organization) | | | | (I.R.S. Employer Identification No.) |
| | | |
Terminal Tower Suite 1100 | | 50 Public Square Cleveland, Ohio | | | | 44113 |
| (Address of principal executive offices) | | | | (Zip Code) |
| | |
Registrant’s telephone number, including area code | | | | 216-621-6060 |
| | |
Securities registered pursuant to Section 12(b) of the Act: | | | | |
| Title of each class | | | | Name of each exchange on which registered |
| | |
Class A Common Stock ($.33 1/3 par value) | | | | New York Stock Exchange |
Class B Common Stock ($.33 1/3 par value) | | | | New York Stock Exchange |
$100,000,000 Aggregate Principal Amount of 7.375% Senior Notes Due 2034 | | | | New York Stock Exchange |
Securities registered pursuant to Section 12(g) of the Act: None
Indicate by check mark if the registrant is a well-known seasoned issuer, as defined in Rule 405 of the Securities Act.
YES x NO ¨
Indicate by check mark if the registrant is not required to file reports pursuant to Section 13 or Section 15(d) of the Act.
YES ¨ NO x
Indicate by check mark whether the registrant (1) has filed all reports required to be filed by Section 13 or 15(d) of the Securities Exchange Act of 1934 during the preceding 12 months (or for such shorter period that the registrant was required to file such reports), and (2) has been subject to such filing requirements for the past 90 days.
YES x NO ¨
Indicate by check mark whether the registrant has submitted electronically and posted on its corporate Web site, if any, every Interactive Date File required to be submitted and posted pursuant to Rule 405 of Regulation S-T (§232.405 of this chapter) during the preceding 12 months (or for such shorter period that the registrant was required to submit and post such files).
YES x NO ¨
Indicate by check mark if disclosure of delinquent filers pursuant to Item 405 of Regulation S-K is not contained herein, and will not be contained, to the best of registrant’s knowledge, in definitive proxy or information statements incorporated by reference in Part III of this Form 10-K or any amendment to this Form 10-K. ¨
Indicate by check mark whether the registrant is a large accelerated filer, an accelerated filer, a non-accelerated filer, or a smaller reporting company. See the definitions of “large accelerated filer,” “accelerated filer” and “smaller reporting company” in Rule 12b-2 of the Exchange Act: (Check one):
| | | | | | |
Large accelerated filer x | | Accelerated filer ¨ | | Non-accelerated filer ¨ | | Smaller Reporting Company ¨ |
| | (Do not check if a smaller reporting company) | | |
Indicate by check mark whether the registrant is a shell company (as defined in Rule 12b-2 of the Exchange Act).
YES ¨ NO x
The aggregate market value of the outstanding common equity held by non-affiliates as of the last business day of the registrant’s most recently completed second fiscal quarter was $2,498,982,278.
The number of shares of registrant’s common stock outstanding on March 21, 2012 was 150,141,368 and 20,911,371 for Class A and Class B common stock, respectively.
DOCUMENTS INCORPORATED BY REFERENCE
Portions of the Proxy Statement for the Annual Meeting of Shareholders to be held on June 13, 2012 are incorporated by reference into Part III to the extent described herein.
Forest City Enterprises, Inc. and Subsidiaries
Annual Report on Form 10-K
For The Year Ended January 31, 2012
Table of Contents
PART I
Item 1. Business
Founded in 1920 and publicly traded since 1960, Forest City Enterprises, Inc. (with its subsidiaries, the “Company” or “Forest City”) principally engages in the ownership, development, management and acquisition of commercial and residential real estate and land in 28 states and the District of Columbia. At January 31, 2012, the Company had approximately $10.5 billion in consolidated assets, of which approximately $9.6 billion was invested in real estate, at cost. The Company’s core markets include Boston, Chicago, Dallas, Denver, Los Angeles, New York, Philadelphia, the Greater San Francisco metropolitan area, and the Greater Washington D.C. metropolitan area. The Company has offices in Albuquerque, Boston, Chicago, Dallas, Denver, London (England), Los Angeles, New York City, San Francisco, Washington, D.C. and the Company’s corporate headquarters in Cleveland, Ohio. The Company’s portfolio of real estate assets is diversified both geographically and among property types.
The Company operates through three strategic business units, all of which are reportable segments:
| | • | | Commercial Group, the Company’s largest strategic business unit, owns, develops, acquires and operates regional malls, specialty/urban retail centers, office and life science buildings, hotels and mixed-use projects. |
| | • | | Residential Group owns, develops, acquires and operates residential rental properties, including upscale and middle-market apartments and adaptive re-use developments. Additionally, it develops for-sale condominium projects and also owns interests in entities that develop and manage military family housing. |
| | • | | Land Development Group acquires and sells both land and developed lots to residential, commercial and industrial customers. It also owns and develops land into master-planned communities and mixed-use projects. As of January 31, 2012, the Board of Directors of the Company approved a strategic decision by senior management to reposition or divest significant portions of its Land Development Group and is actively reviewing alternatives to do so. See further discussion regarding this strategic decision under “Land Development Group” in this section. |
The Company has centralized the capital management, financial reporting and certain administrative functions of its business units. In most other respects, the strategic business units operate autonomously, with the Commercial Group and Residential Group each having their own development, acquisition, leasing, property and financial management functions. The Company believes this structure enables its employees to focus their expertise and to exercise the independent leadership, creativity and entrepreneurial skills appropriate for their particular business segment.
Segments of Business
The Company currently has five segments:
| | • | | The New Jersey Nets (“The Nets”) |
Financial information about industry segments required by this item is included in Item 8 - Financial Statements and Supplementary Data and Note N - Segment Information.
Commercial Group
The Company has developed and/or acquired retail projects for more than 50 years and office and mixed-use projects for more than 30 years. The Commercial Group’s diverse portfolio is in both urban and suburban locations in 15 states and the District of Columbia. The Commercial Group targets markets where it uses its expertise to develop complex projects, often employing public and/or private partnerships. As of January 31, 2012, the Commercial Group owned interests in 96 completed properties including:
| | • | | 49 office properties (13.5 million gross leasable square feet); |
| | • | | 17 regional malls (gross leasable area (“GLA”) of 9.3 million square feet); |
| | • | | 28 specialty retail centers (GLA of 6.8 million square feet); and |
| | • | | 2 hotels (1,015 rooms). |
2
Included in the regional malls total above isWestchester’s Ridge Hill, a regional mall in Yonkers, New York with GLA of 1.3 million square feet, which is currently opening in phases.
In addition, the Commercial Group has three projects under construction:
| | • | | The Yards - Boilermaker Shops,a specialty retail center in Washington, D.C. (GLA of 40,000 square feet); |
| | • | | John Hopkins Parking Garage, a 492,000 square foot parking garage in Baltimore, Maryland; and |
| | • | | Barclays Center arena in Brooklyn, New York. |
TheBarclays Center arena is expected to be completed and opened during the three months ended October 31, 2012. This 18,000 seat arena is expected to host more than 200 events annually, including professional and collegiate sports, concerts, family shows and The Nets basketball games.
In its office development activities, the Company is primarily a build-to-suit developer that works with tenants to meet their requirements. The Company’s office development has focused primarily on mixed-use projects in urban developments, often built in conjunction with hotels and/or retail centers or as part of a major office or life science campus. As a result of this focus on urban developments, the Company continues to concentrate future office and mixed-use developments largely in our core markets areas.
The Company opened its first community retail center in 1948 and its first enclosed regional mall in 1962. Since then, it has developed regional malls and specialty retail centers. The specialty retail centers include urban retail centers, entertainment-based centers, community centers and power centers (collectively, “specialty retail centers”).
Regional malls are developed in collaboration with anchor stores that typically own their facilities as an integral part of the mall structure and environment but do not generate significant direct payments to the Company. In contrast, anchor stores at specialty retail centers generally are tenants under long-term leases that contribute significant rental payments to the Company.
While the Company continues to develop regional malls in strong markets, it has also pioneered the concept of bringing specialty retailing to urban locations previously ignored by major retailers. With high population densities and disposable income levels at or near those of the suburbs, urban development is proving to be economically advantageous for the Company, for the tenants who realize high sales per square foot and for the cities that benefit from the new jobs and taxes created in the urban locations.
The following tables provide lease expiration and significant tenant information relating to the Commercial Group’s retail properties.
Schedule of Retail Lease Expirations as of January 31, 2012
| | | | | | | | | | | | |
EXPIRATION
YEAR | | NUMBER OF
EXPIRING
LEASES | | SQUARE FEET
OF EXPIRING
LEASES(3) | | PERCENTAGE
OF TOTAL
LEASED GLA (1) | | NET BASE RENT
EXPIRING(2) | | PERCENTAGE OF TOTAL BASE RENT | | AVERAGE BASE RENT PER
SQUARE FEET
EXPIRING(3) |
| | | | | | |
| 2012 | | 275 | | 909,858 | | 7.05 % | | $ 18,848,095 | | 7.36 % | | $ 27.01 |
| 2013 | | 343 | | 1,254,649 | | 9.73 | | 26,797,228 | | 10.47 | | 26.94 |
| 2014 | | 292 | | 1,159,467 | | 8.99 | | 22,305,708 | | 8.72 | | 28.14 |
| 2015 | | 208 | | 836,163 | | 6.48 | | 18,776,849 | | 7.34 | | 29.59 |
| 2016 | | 270 | | 1,436,411 | | 11.14 | | 31,815,105 | | 12.43 | | 35.65 |
| 2017 | | 163 | | 1,151,190 | | 8.93 | | 22,727,546 | | 8.88 | | 26.49 |
| 2018 | | 160 | | 738,457 | | 5.72 | | 18,814,575 | | 7.35 | | 28.16 |
| 2019 | | 121 | | 1,056,906 | | 8.20 | | 20,306,946 | | 7.94 | | 25.13 |
| 2020 | | 107 | | 837,916 | | 6.50 | | 16,970,522 | | 6.63 | | 30.40 |
| 2021 | | 130 | | 1,323,344 | | 10.26 | | 26,225,658 | | 10.25 | | 30.15 |
| Thereafter | | 74 | | 2,192,356 | | 17.00 | | 32,334,403 | | 12.63 | | 20.65 |
| Total | | 2,143 | | 12,896,717 | | 100.00 % | | $ 255,922,635 | | 100.00 % | | $ 27.56 |
| (1) | GLA = Gross Leasable Area. |
| (2) | Net base rent expiring is an operating statistic and is not comparable to rental revenue, a Generally Accepted Accounting Principles (“GAAP”) financial measure. The primary differences arise because net base rent is determined using the tenant’s contractual rental agreements at the Company’s ownership share of the base rental income from expiring leases as determined within the rent agreement and it does not include adjustments such as the impact of straight-line rent, amortization of intangible assets related to in-place leases, above and below market leases, and contingent rental payments (which are not reasonably estimable). |
| (3) | Square feet of expiring leases and average base rent per square feet are operating statistics that represent 100% of the square footage and base rental income per square foot from expiring leases. |
3
Schedule of Significant Retail Tenants as of January 31, 2012
| | | | | | |
| |
(Based on net base rent 1% or greater of the Company's ownership share) |
| TENANT | | NUMBER
OF
LEASES | | LEASED
SQUARE
FEET | | PERCENTAGE OF TOTAL RETAIL
SQUARE FEET |
| | | |
Bass Pro Shops, Inc. | | 3 | | 510,855 | | 3.96 % |
Regal Entertainment Group | | 5 | | 381,461 | | 2.96 |
AMC Entertainment, Inc. | | 5 | | 377,797 | | 2.93 |
TJX Companies | | 11 | | 347,457 | | 2.70 |
The Gap | | 27 | | 344,944 | | 2.67 |
Dick's Sporting Goods | | 6 | | 326,866 | | 2.53 |
Best Buy | | 7 | | 208,977 | | 1.62 |
Abercrombie & Fitch Stores, Inc. | | 27 | | 194,549 | | 1.51 |
The Limited | | 31 | | 192,602 | | 1.49 |
H&M Hennes & Mauritz AB | | 8 | | 141,507 | | 1.10 |
Footlocker, Inc. | | 34 | | 131,878 | | 1.02 |
Forever 21, Inc. | | 8 | | 112,661 | | 0.87 |
American Eagle Outfitters, Inc. | | 15 | | 85,972 | | 0.67 |
| | | |
Subtotal | | 187 | | 3,357,526 | | 26.03 |
| | | |
All Others | | 1,956 | | 9,539,191 | | 73.97 |
| | | |
Total | | 2,143 | | 12,896,717 | | 100.00 % |
The following tables provide lease expiration and significant tenant information relating to the Commercial Group’s office properties.
Schedule of Office Lease Expirations as of January 31, 2012
| | | | | | | | | | | | |
EXPIRATION
YEAR | | NUMBER OF
EXPIRING
LEASES | | SQUARE
FEET OF
EXPIRING
LEASES(3) | | PERCENTAGE
OF TOTAL
LEASED
GLA (1) | | NET BASE RENT
EXPIRING(2) | | PERCENTAGE
OF TOTAL
BASE RENT | | AVERAGE
BASE
RENT PER
SQUARE FEET
EXPIRING(3) |
| | | | | | |
| 2012 | | 102 | | 980,801 | | 8.77 % | | $ 25,144,510 | | 8.38 % | | $ 31.48 |
| 2013 | | 95 | | 1,136,706 | | 10.17 | | 25,084,388 | | 8.36 | | 22.73 |
| 2014 | | 73 | | 759,301 | | 6.79 | | 15,743,907 | | 5.25 | | 32.38 |
| 2015 | | 44 | | 461,184 | | 4.13 | | 8,850,686 | | 2.95 | | 22.16 |
| 2016 | | 61 | | 983,434 | | 8.80 | | 22,746,109 | | 7.58 | | 30.00 |
| 2017 | | 29 | | 464,444 | | 4.15 | | 11,097,049 | | 3.70 | | 25.66 |
| 2018 | | 27 | | 1,253,718 | | 11.21 | | 34,646,554 | | 11.54 | | 32.07 |
| 2019 | | 25 | | 896,768 | | 8.02 | | 16,013,570 | | 5.34 | | 25.11 |
| 2020 | | 14 | | 1,044,824 | | 9.34 | | 27,856,087 | | 9.28 | | 33.06 |
| 2021 | | 11 | | 663,981 | | 5.94 | | 10,389,551 | | 3.46 | | 20.42 |
| Thereafter | | 35 | | 2,535,635 | | 22.68 | | 102,502,355 | | 34.16 | | 42.08 |
| Total | | 516 | | 11,180,796 | | 100.00 % | | $ 300,074,766 | | 100.00 % | | $ 31.34 |
| (1) | GLA = Gross Leasable Area. |
| (2) | Net base rent expiring is an operating statistic and is not comparable to rental revenue, a GAAP financial measure. The primary differences arise because net base rent is determined using the tenant’s contractual rental agreements at the Company’s ownership share of the base rental income from expiring leases as determined within the rent agreement and it does not include adjustments such as the impact of straight-line rent, amortization of intangible assets related to in-place leases, above and below market leases, and contingent rental payments (which are not reasonably estimable). |
| (3) | Square feet of expiring leases and average base rent per square feet are operating statistics that represent 100% of the square footage and base rental income per square foot from expiring leases. |
4
Schedule of Significant Office Tenants as of January 31, 2012
| | | | | | | | | | |
(Based on net base rent 2% or greater of the Company’s ownership share) |
| TENANT | | LEASED SQUARE FEET | | PERCENTAGE OF TOTAL OFFICE SQUARE FEET |
| | |
City of New York | | | | 1,046,101 | | | | | 9.36 | % |
Millennium Pharmaceuticals, Inc. | | | | 698,066 | | | | | 6.24 | |
U.S. Government | | | | 670,925 | | | | | 6.00 | |
WellPoint, Inc. | | | | 392,514 | | | | | 3.51 | |
JP Morgan Chase & Co. | | | | 383,341 | | | | | 3.43 | |
Morgan Stanley & Co. | | | | 377,304 | | | | | 3.37 | |
Forest City Enterprises, Inc.(1) | | | | 358,310 | | | | | 3.20 | |
Bank of New York | | | | 323,043 | | | | | 2.89 | |
National Grid | | | | 254,034 | | | | | 2.27 | |
Clearbridge Advisors, LLC, a Legg Mason Company | | | | 193,249 | | | | | 1.73 | |
Covington & Burling, LLP | | | | 160,565 | | | | | 1.44 | |
Seyfarth Shaw, LLP | | | | 96,909 | | | | | 0.87 | |
| | |
Subtotal | | | | 4,954,361 | | | | | 44.31 | |
| | |
All Others | | | | 6,226,435 | | | | | 55.69 | |
| | |
Total | | | | 11,180,796 | | | | | 100.00 | % |
| (1) | All intercompany rental income is eliminated in consolidation. |
See the “Commercial Group” section of Management’s Discussion and Analysis of Financial Condition and Results of Operations in Item 7 for additional operating statistics.
Residential Group
The Company’s Residential Group owns, develops, acquires, leases and manages residential rental properties in 23 states and the District of Columbia. The Company has been engaged in apartment community development for over 50 years beginning in Northeast Ohio and gradually expanding nationally. Its residential portfolio includes middle-market apartments, upscale urban properties and adaptive re-use developments. The Residential Group develops for-sale condominium projects and also owns, develops and manages military family housing.
At January 31, 2012, the Residential Group’s diverse operating portfolio consisted of:
| | • | | 33,819 apartment units in 120 properties; and |
| | • | | 14,104 military housing units under management in various stages of operations and/or redevelopment. |
Included in the apartment units total above is8 Spruce Street, an 899 unit apartment community in Manhattan, New York, which is currently opening in phases.
In addition, the Residential Group has three projects under construction:
| | • | | Continental Building, a 203 unit apartment community in Dallas, Texas; |
| | • | | Botanica Eastbridge, a 118 unit apartment community in Denver, Colorado; and |
| | • | | The Aster Town Center, an 85 unit apartment community in Denver, Colorado. |
5
Land Development Group
The Company has been in the land development business since the 1930’s. The Land Development Group acquires and sells raw land and sells fully entitled developed lots to residential, commercial and industrial customers. The Land Development Group also owns and develops raw land into master-planned communities, mixed use products and other residential developments. As previously discussed, the Company has made a decision to strategically reposition significant portions of its Land Development Group. The Company is actively reviewing alternatives to sell or otherwise divest of its ownership interests in approximately 35 active land development projects. The active land development projects that will be repositioned are located throughout the United States, primarily in the Southwest, Texas, North Carolina and Ohio. As of January 31, 2012, these projects consist of 9,438 acres of undeveloped land (including 5,938 of salable acres) and options to purchase 5,731 acres at Mesa del Sol in Albuquerque, New Mexico. These projects will continue to be reported in the Land Development Group through their disposition.
As a result of the Company’s decision to reposition significant portions of its Land Development Group, the Company recorded a pre-tax impairment of $153,606,000 during the three months ended January 31, 2012. Of this amount, $113,804,000 related to fully consolidated land projects and $39,802,000 related to unconsolidated land entities. See the “Impairment of Real Estate” and “Impairment of Unconsolidated Entities” sections of Management’s Discussion and Analysis of Financial Condition and Results of Operations in Item 7 of this Form 10-K for additional information.
The Company will retain its land holdings at its Stapleton project in Denver, which is fully consolidated, and the Central Station project in downtown Chicago, which is accounted for on the equity method of accounting. As of January 31, 2012, these two land development projects consist of 237 acres of undeveloped land (including 158 of salable acres) and a purchase option for 1,323 acres at Stapleton over the next 7 years.
Through January 31, 2012, the Company has purchased 1,612 acres at Stapleton. In addition to the developable land that may be purchased thorough available purchase options, there are 1,116 acres reserved for regional parks and open space at Stapleton, of which 775 acres are currently under development or have been completed. At January 31, 2012, Stapleton also has over 2.1 million square feet of retail space, approximately 400,000 square feet of office space, over 1.2 million square feet of other commercial space and 779 apartment units (of which 295 units are currently under construction).
In addition to sales activities of the Land Development Group, the Company also sells land acquired by its Commercial Group and Residential Group adjacent to their respective projects. Proceeds and related costs from such land sales are included in the revenues and expenses of such groups.
The Nets
Our ownership of The Nets is through Nets Sports and Entertainment LLC (“NS&E”). NS&E also owns Brooklyn Arena, LLC (“Arena”), an entity that through its subsidiaries is overseeing the construction of and has a long-term lease in theBarclays Center arena, the future home of The Nets. Upon adoption of new accounting guidance for the consolidation of variable interest entities (“VIEs”) on February 1, 2010, NS&E was converted from an equity method entity to a consolidated entity. NS&E consolidates Arena and accounts for its investment in The Nets on the equity method of accounting. As a result of consolidating NS&E, the Company records the entire net loss of The Nets allocated to NS&E in equity in loss of unconsolidated entities and allocates the other NS&E minority partners’ share of loss through noncontrolling interests in our Statements of Operations for the years ended January 31, 2012 and 2011. During the year ended January 31, 2010, the Company recorded only our share of the loss for The Nets through equity in loss of unconsolidated entities.
On May 12, 2010, the Company closed on a purchase agreement with entities controlled by Mikhail Prokhorov (“MP Entities”). Pursuant to the terms of the purchase agreement, the MP Entities invested $223,000,000 and made certain funding commitments (“Funding Commitments”) to acquire 80% of The Nets, 45% of Arena and the right to purchase up to 20% of Atlantic Yards Development Company, LLC, which will develop non-arena real estate. In accordance with the Funding Commitments, the MP Entities agreed to fund The Nets operating needs up to $60,000,000, including reimbursements to us for loans made to cover The Nets operating needs from March 1, 2010 to May 12, 2010 totaling $15,000,000. The MP Entities met the $60,000,000 funding commitment during the three months ended July 31, 2011. As a result, the Company, through its investment in NS&E, is required to fund 100% of The Nets operating needs, as defined, until theBarclays Center arena is complete and open, which is expected to be during the three months ended October 31, 2012. Thereafter, members’ capital contributions will be made in accordance with the operating agreements. During the year ended January 31, 2012, the Company funded $22,978,000 of The Nets operating needs related predominantly to the 2011-2012 season.
For the years ended January 31, 2012, 2011 and 2010, the Company recognized approximately 44%, 25% and 68% of the net loss of The Nets. The increase in 2011 compared to 2010 is primarily due to the Company’s requirement to fund The Nets operating needs, subsequent to the MP Entities funding commitment being met during the three months ended July 31, 2011 and related losses which were substantially allocated to the Company. The decrease in 2010 compared to 2009 is primarily due to the MP Entities funding The Nets operating needs from May 12, 2010 as discussed above, and related losses being allocated accordingly.
6
Net Operating Income
Net Operating Income (“NOI”) is defined as revenues (excluding straight-line rent adjustments) less operating expenses (including depreciation and amortization and amortization of mortgage procurement costs for non-real estate groups) plus interest income plus equity in earnings (loss) of unconsolidated entities (excluding gain on disposition and impairment of unconsolidated entities) plus interest expense, gain (loss) on early extinguishment of debt, depreciation and amortization of unconsolidated entities. We believe NOI provides us, as well as our investors, additional information about our core business operations and, along with earnings, is necessary to understand our business and operating results. A reconciliation between NOI and Net Earnings (Loss), the most comparable financial measure calculated in accordance with GAAP, is presented below. Although NOI is not presented in accordance with GAAP, investors can use this non-GAAP measure as supplementary information to evaluate our business. NOI is not intended to be a performance measure that should be regarded as an alternative to, or more meaningful than, our GAAP measures.
Reconciliation of Net Operating Income (non-GAAP) to Net Earnings (Loss) (GAAP)(in thousands):
| | | | | | | | | | | | | | | | |
| | | Year Ended January 31, 2012 | | | Year Ended January 31, 2011 | |
| | | | |
Revenues from real estate operations | | | | | | $ | 1,089,977 | | | | | | | $ | 1,117,649 | |
Exclude straight-line rent adjustment | | | | | | | (11,134) | | | | | | | | (21,697) | |
| | | | | | | | | | | | | | | | |
Adjusted revenues | | | | | | | 1,078,843 | | | | | | | | 1,095,952 | |
Add interest and other income | | | | | | | 52,114 | | | | | | | | 52,818 | |
Add gain on disposition of partial interests in other investment - Nets | | | | | | | - | | | | | | | | 55,112 | |
Add equity in earnings (loss) of unconsolidated entities, including impairment | | | (61,039) | | | | | | | | (30,194) | | | | | |
Exclude gain on disposition of unconsolidated entities | | | (12,567) | | | | | | | | (23,461) | | | | | |
Exclude impairment of unconsolidated real estate | | | 82,186 | | | | | | | | 72,459 | | | | | |
Exclude depreciation and amortization of unconsolidated entities | | | 70,870 | | | | | | | | 54,439 | | | | | |
Exclude interest expense of unconsolidated entities | | | 100,958 | | | | | | | | 81,184 | | | | | |
Exclude (gain) loss on early extinguishment of debt of unconsolidated entities | | | 366 | | | | | | | | (2,760) | | | | | |
| | | | | | | | | | | | | | | | |
Total NOI from unconsolidated entities | | | 180,774 | | | | 180,774 | | | | 151,667 | | | | 151,667 | |
| | | | | | | | | | | | | | | | |
Total adjusted revenues and NOI from unconsolidated entities | | | | | | | 1,311,731 | | | | | | | | 1,355,549 | |
Operating expenses | | | | | | | 668,959 | | | | | | | | 647,199 | |
Add back non-Real Estate depreciation and amortization | | | | | | | 3,247 | | | | | | | | 5,028 | |
Exclude straight-line rent adjustment | | | | | | | (4,497) | | | | | | | | (5,332) | |
Exclude preference payment | | | | | | | (1,732) | | | | | | | | (2,341) | |
| | | | | | | | | | | | | | | | |
Adjusted operating expenses | | | | | | | 665,977 | | | | | | | | 644,554 | |
| | | | | | | | | | | | | | | | |
| | | | |
Net operating income | | | | | | | 645,754 | | | | | | | | 710,995 | |
| | | | |
Interest expense | | | | | | | (261,037) | | | | | | | | (309,766) | |
Gain (loss) on early extinguishment of debt | | | | | | | 9,590 | | | | | | | | (21,035) | |
Total NOI of unconsolidated entities | | | | | | | (180,774) | | | | | | | | (151,667) | |
Net gain on disposition of rental properties and partial interests in rental properties | | | | | | | 17,665 | | | | | | | | 202,878 | |
Impairment of consolidated real estate | | | | | | | (119,324) | | | | | | | | (4,763) | |
Depreciation and amortization - Real Estate Groups | | | | | | | (215,354) | | | | | | | | (229,700) | |
Amortization of mortgage procurement costs - Real Estate Groups | | | | | | | (11,812) | | | | | | | | (11,484) | |
Straight-line rent adjustment | | | | | | | 6,637 | | | | | | | | 16,365 | |
Preference payment | | | | | | | (1,732) | | | | | | | | (2,341) | |
| | | | | | | | | | | | | | | | |
| | | | |
Earnings (loss) before income taxes | | | | | | | (110,387) | | | | | | | | 199,482 | |
| | | | |
Income tax provision | | | | | | | 64,344 | | | | | | | | (70,126) | |
Equity in earnings (loss) of unconsolidated entities, including impairment | | | | | | | (61,039) | | | | | | | | (30,194) | |
| | | | | | | | | | | | | | | | |
| | | | |
Earnings (loss) from continuing operations | | | | | | | (107,082) | | | | | | | | 99,162 | |
| | | | |
Discontinued operations, net of tax | | | | | | | 106,514 | | | | | | | | (13,764) | |
| | | | | | | | | | | | | | | | |
| | | | |
Net earnings (loss) | | | | | | | (568) | | | | | | | | 85,398 | |
| | | | |
Noncontrolling interests | | | | | | | | | | | | | | | | |
Earnings from continuing operations attributable to noncontrolling interests | | | | | | | (2,736) | | | | | | | | (19,222) | |
Earnings from discontinued operations attributable to noncontrolling interests | | | | | | | (83,182) | | | | | | | | (8,128) | |
| | | | | | | | | | | | | | | | |
Noncontrolling interests | | | | | | | (85,918) | | | | | | | | (27,350) | |
| | | | | | | | | | | | | | | | |
| | | | |
Net earnings (loss) attributable to Forest City Enterprises, Inc. | | | | | | $ | (86,486) | | | | | | | $ | 58,048 | |
| | | | | | | | | | | | | | | | |
| | | | |
Preferred dividends | | | | | | | (15,400) | | | | | | | | (11,807) | |
| | | | | | | | | | | | | | | | |
Net earnings (loss) attributable to Forest City Enterprises, Inc. common shareholders | | | $ | (101,886) | | | | | | | $ | 46,241 | |
| | | | | | | | | | | | | | | | |
7
Net Operating Income (continued)
| | | | |
Year Ended January 31, 2012 | |
| |
Reconciliation to NOI by Product Type: | | | | |
NOI | | $ | 645,754 | |
Exclude: | | | | |
Casino Land Sale | | | 42,622 | |
The Nets | | | | |
Operations | | | (26,814) | |
Gain on disposition of partial interest | | | - | |
| | | | |
Total Nets | | | (26,814) | |
Corporate Activities | | | (53,837) | |
Other (1) | | | (16,655) | |
| | | | |
NOI by Product Type | | $ | 700,438 | |
| | | | |
| | | | |
Year Ended January 31, 2011 | |
| |
Reconciliation to NOI by Product Type: | | | | |
NOI | | $ | 710,995 | |
Exclude: | | | | |
Casino Land Sale | | | - | |
The Nets | | | | |
Operations | | | (17,172 | ) |
Gain on disposition of partial interest | | | 55,112 | |
| | | | |
Total Nets | | | 37,940 | |
Corporate Activities | | | (48,357 | ) |
Other (1) | | | (3,511 | ) |
| | | | |
NOI by Product Type | | $ | 724,923 | |
| | | | |
| (1) | Includes write-offs of abandoned development projects, non-capitalizable development costs, non-capitalizable marketing/promotional costs associated withBarclays Center and unallocated management and service company overhead, net of tax credit income. |
| (2) | Includes subsidized senior housing. |
8
Competition
The real estate industry is highly competitive in many of the markets in which the Company operates. There are numerous other developers, managers and owners of commercial and residential real estate and undeveloped land that compete with the Company nationally, regionally and/or locally, some of whom may have greater financial resources and market share than the Company. They compete with the Company for management and leasing opportunities, land for development, properties for acquisition and disposition, and for anchor stores and tenants for properties. The Company may not be able to successfully compete in these areas. In addition, competition could over-saturate any market; as a result, the Company may not have sufficient cash to meet the nonrecourse debt service requirements on certain of its properties. Although the Company may attempt to negotiate a restructuring or extension of the nonrecourse mortgage, it may not be successful, particularly in light of current credit markets, which could cause a property to be transferred to the mortgagee.
Tenants at the Company’s retail properties face continual competition in attracting customers from retailers at other shopping centers, catalogue companies, online merchants, warehouse stores, large discounters, outlet malls, wholesale clubs, direct mail and telemarketers. The Company’s competitors and those of its tenants could have a material adverse effect on the Company’s ability to lease space in its properties and on the rents it can charge or the concessions it may have to grant. This in turn could materially and adversely affect the Company’s results of operations and cash flows, and could affect the realizable value of its assets upon sale.
In addition to real estate competition, the Company faces competition related to the operation of The Nets. Specifically, The Nets are in competition with other members from the National Basketball Association (“NBA”), other major league sports, college athletics and other sports-related and non-sports related entertainment. If The Nets are not able to successfully manage this risk, they may incur additional losses resulting in an increase of the Company’s share of the total losses of the team.
Number of Employees
The Company had 2,870 employees as of January 31, 2012, of which 2,573 were full-time and 297 were part-time.
Available Information
Forest City Enterprises, Inc. is an Ohio corporation and its executive offices are located at Suite 1100, 50 Public Square, Cleveland, Ohio 44113. The Company makes available, free of charge, on its website at www.forestcity.net, its annual, quarterly and current reports, including amendments to such reports, as soon as reasonably practicable after the Company electronically files such material with, or furnishes such material to, the Securities and Exchange Commission (“SEC”). The Company’s SEC filings can also be obtained from the SEC website at www.sec.gov.
The Company’s corporate governance documents including the Company’s Corporate Governance Guidelines, Code of Ethical and Legal Conduct and committee charters are also available on the Company’s website at www.forestcity.net or in print to any stockholder upon written request addressed to Corporate Secretary, Forest City Enterprises, Inc., Suite 1360, 50 Public Square, Cleveland, Ohio 44113.
The information found on the Company’s website or the SEC website is not part of this Annual Report on Form 10-K.
Item 1A. Risk Factors
Lending and Capital Market Conditions May Negatively Impact Our Liquidity and Our Ability to Finance or Refinance Projects or Repay Our Debt
Current conditions of the U.S. and global economy substantially lag pre-recession levels and continue to remain volatile. Ongoing economic conditions have negatively impacted the lending and capital markets, particularly for real estate. The capital markets have witnessed significant adverse conditions, including a substantial reduction in the availability of and access to capital. Financial institutions have significantly reduced their lending with an emphasis on lessening their exposure to real estate. Originations of new loans for commercial mortgage backed securities continue to improve, but are still limited as compared to pre-recession levels. Underwriting standards are being tightened with lenders requiring lower loan-to-values, increased debt service coverage levels and higher lender spreads. These market conditions, combined with the volatility in the financial markets, have made our ability to access capital challenging. We may not be able to obtain financings on terms comparable to those we secured prior to the economic downturn, and our financing costs may be significantly higher. These conditions have required us to curtail our investment in new development projects, which will negatively impact our growth. If these conditions do not continue to improve, we may be required to further curtail our development or expansion projects and potentially write down our investments in some projects.
9
The adverse market conditions also impact our ability to, and the cost at which we, refinance our debt and obtain renewals or replacement of credit enhancement devices, such as letters of credit. While some of our current financings have extension options, some of those are contingent upon pre-determined underwriting qualifications. We cannot assure you that a given project will meet the required conditions to qualify for such extensions. Our inability to extend, repay or refinance our debt when it becomes due, including upon a default or acceleration event, could result in foreclosure on the properties pledged as collateral, which could result in a loss of our investment. While we are working to refinance or extend our maturing debt obligations, we cannot assure you that we will be able to do so on a timely basis. Moreover, we expect refinancing, when available, to occur on less favorable terms. Lenders in these market conditions will typically require a higher rate of interest, repayment of a portion of the outstanding principal or additional equity infusions to the project.
Of our total outstanding long-term debt of approximately $6.7 billion at January 31, 2012, a significant amount becomes due in each of the next three fiscal years. If these amounts cannot be refinanced, extended or repaid from other sources, such as sales of properties or new equity, our cash flow may not be sufficient to repay all maturing debt. There is also refinancing risk with respect to our $450,000,000 Third Amended and Restated Credit Agreement as amended July 31, 2011 and Third Amended and Restated Guaranty of Payment of Debt as amended July 31, 2011 (collectively, the “Credit Facility”), which is due March 30, 2014 and provides for one 12-month extension option subject to certain conditions, and our senior debt, as we have limited sources to fund such repayment.
Our total outstanding debt includes credit enhanced mortgage debt we have obtained for a number of our properties to back the bonds that are issued by a government authority and then remarketed to the public. Generally, the credit enhancement, such as a letter of credit, expires prior to the terms of the underlying mortgage debt and must be renewed or replaced to prevent acceleration of the underlying mortgage debt. We treat credit enhanced debt as maturing in the year the credit enhancement expires. However, if the credit enhancement is drawn upon due to the inability to remarket the bonds due to reasons including but not limited to market dislocation or a downgrade in the credit rating of the credit enhancer, not only would the bonds incur additional interest expense, but the debt maturity could accelerate to as early as 90 days after the acceleration occurs.
With the turmoil in the lending and capital markets, a number of financial institutions have sought federal assistance or failed. The failure of these financial institutions has reduced the number of lenders willing to lend to commercial real estate entities and may hinder our ability to access capital. In the event of a failure of a lender or counterparty to a financial contract, obligations under the financial contract might not be honored and many forms of assets may be at risk and may not be fully returned to us. Should a financial institution, particularly a construction lender, fail to fund its committed amounts when contractually obligated, our ability to meet our obligations and complete projects could be adversely impacted.
The Ownership, Development and Management of Real Estate is Exceptionally Challenging in the Current Economic Environment and We Do Not Anticipate Meaningful Improvement in the Near Term
The current economic environment has significantly impacted the real estate industry. Unemployment remains at high levels and consumer confidence, while improving, remains low, putting downward pressure on retail sales. Commercial tenants are experiencing financial pressure and are continuing to place demands on landlords to provide rent concessions. The financial hardships on some tenants are so severe that they are leaving the market entirely or declaring bankruptcy, creating increased vacancy rates in commercial properties. The tenants with good financial condition are considering offers from competing projects and are waiting for the best possible deal before committing.
The stress currently experienced by the real estate industry is particularly evident in our development projects. Projects that had good demographics and strong retailer interest to support a retail development when we began construction are experiencing leasing difficulty. When the financial markets began experiencing volatility in the second half of 2008 and the economy entered a recession, we experienced a corresponding volatility in retailer interest for our projects. Retailers continue to express interest in the projects, but are reluctant to commit to new stores in the current economic environment. As a result of this difficult environment, we have delayed anticipated openings, reduced anticipated rents and incurred additional carrying costs, all resulting in an adverse impact on our business. If we are unable to or decide not to proceed with certain projects, we could incur write-offs, some of which could be substantial, which would have a material adverse affect on our results of operations.
Until the economy, in general, and the real estate industry in particular, experience sustained improvement, fundamentals for the development and management of real estate will remain weak and we will continue to operate in a difficult environment with no near-term expectation of improvement.
We Are Subject to Risks Associated with Investments in Real Estate
The value of, and our income from, our properties may decline due to developments that adversely affect real estate generally and those developments that are specific to our properties. General factors that may adversely affect our real estate portfolios if they were to occur or continue include:
| | • | | Increases in interest rates; |
| | • | | The availability of financing, including refinancing or extensions of our nonrecourse mortgage debt maturities, on acceptable terms, or at all; |
10
| | • | | A decline in the economic conditions at the national, regional or local levels, particularly a decline in one or more of our primary markets; |
| | • | | Decreases in rental rates; |
| | • | | An increase in competition for tenants and customers or a decrease in demand by tenants and customers; |
| | • | | The financial condition of tenants, including the extent of bankruptcies and defaults; |
| | • | | An increase in supply or decrease in demand of our property types in our primary markets; |
| | • | | Declines in consumer confidence and spending during an economic recession that adversely affect our revenue from our retail centers; |
| | • | | Lingering declines in housing markets that adversely affect our revenue from our ongoing land segment and our ability to strategically reposition land held for divestiture; |
| | • | | The adoption on the national, state or local level of more restrictive laws and governmental regulations, including more restrictive zoning, land use or environmental regulations and increased real estate taxes; and |
| | • | | Opposition from local community or political groups with respect to the development, construction or operations at a particular site. |
In addition, there are factors that may adversely affect the value of specific operating properties or result in reduced income or unexpected expenses. As a result, we may not achieve our projected returns on the properties and we could lose some or all of our investments in those properties. Those operational factors include:
| | • | | Adverse changes in the perceptions of prospective tenants or purchasers of the attractiveness of the property; |
| | • | | Our inability to provide adequate management and maintenance; |
| | • | | The investigation, removal or remediation of hazardous materials or toxic substances at a site; |
| | • | | Our inability to collect rent or other receivables; |
| | • | | Vacancies and other changes in rental rates; |
| | • | | An increase in operating costs that cannot be passed through to tenants; |
| | • | | Introduction of a competitor’s property in or in close proximity to one of our current markets; |
| | • | | Underinsured or uninsured natural disasters, such as earthquakes, floods or hurricanes; and |
| | • | | Our inability to obtain adequate insurance. |
We Are Subject to Real Estate Development Risks
In addition to the risks described above, which could also adversely impact our development projects, our development projects are subject to significant risks relating to our ability to complete our projects on time and on budget. Factors that may result in a development project exceeding budget, being delayed or being prevented from completion include:
| | • | | An inability to secure sufficient financing on favorable terms, or at all, including an inability to refinance or extend construction loans; |
| | • | | Construction delays or cost overruns, either of which may increase project development costs; |
| | • | | An increase in commodity costs; |
| | • | | An inability to obtain zoning, occupancy and other required governmental permits and authorizations; |
| | • | | An inability to secure tenants or anchors necessary to support the project; |
| | • | | Failure to achieve or sustain anticipated occupancy or sales levels; and |
| | • | | Threatened or pending litigation. |
11
Some of these development risks have been magnified given current adverse industry and market conditions. See also “Lending and Capital Market Conditions May Negatively Impact Our Liquidity and Our Ability to Finance or Refinance Projects or Repay Our Debt” and “The Ownership, Development and Management of Real Estate is Exceptionally Challenging in the Current Economic Environment and We Do Not Anticipate Meaningful Improvement in the Near Term” above. If any of these events occur, we may not achieve our projected returns on properties under development and we could lose some or all of our investments in those properties. In addition, the lead time required to develop, construct and lease-up a development property has substantially increased, which could adversely impact our projected returns or result in a termination of the development project.
In the past, we have elected not to proceed, or have been prevented from proceeding, with certain development projects, and we anticipate that this may occur again. In addition, development projects may be delayed or terminated because a project partner or prospective anchor withdraws or a third party challenges our entitlements or public financing.
We periodically serve as either the construction manager or the general contractor for our development projects. The construction of real estate projects entails unique risks, including risks that the project will fail to conform to building plans, specifications and timetables. These failures could be caused by labor strikes, weather, government regulations and other conditions beyond our control. In addition, we may become liable for injuries and accidents occurring during the construction process that are underinsured.
In the construction of new projects, we generally guarantee the construction loan lender the lien-free completion of the project. This guaranty is recourse to us and places the risk of construction delays and cost overruns on us. In addition, from time to time, we guarantee our construction obligations to major tenants and public agencies. These types of guarantees are released upon completion of the project, as defined. We may have significant expenditures in the future in order to comply with our lien-free completion obligations which could have an adverse impact on our cash flows.
Examples of projects that face these and other development risks include the following:
| | • | | Brooklyn Atlantic Yards. We are in the process of developing Brooklyn Atlantic Yards, which will cost approximately $4.9 billion over the anticipated construction and development period. This long-term mixed-use project in downtown Brooklyn is expected to feature a state-of-the-art sports and entertainment arena, theBarclays Center arena, for The Nets basketball team, a member of the NBA. The acquisition and development of Brooklyn Atlantic Yards has been formally approved by the required state governmental authorities and final documentation of the transactions was executed on December 23, 2009. Tax exempt financing for the arena also closed on December 23, 2009, the proceeds of which became available on May 12, 2010. We have commenced construction of the arena and related infrastructure as well as infrastructure related to other elements of the greater Atlantic Yards development project. As a result of ongoing litigation, this project has experienced delays and may continue to experience further delays. We do not expect ongoing litigation to delay the completion of theBarclays Center arena. |
There is also the potential for increased costs and further delays to the project as a result of (i) increasing construction costs, (ii) scarcity of labor and supplies, (iii) the unavailability of additional needed financing, (iv) our or our partners’ inability or failure to meet required equity contributions, (v) increasing rates for financing, (vi) loss of arena sponsorships and related revenues, (vii) our inability to meet certain agreed upon deadlines for the development of the project and (viii) other potential litigation seeking to enjoin or prevent the project or litigation for which there may not be insurance coverage. The development of Brooklyn Atlantic Yards is being done in connection with the proposed move of The Nets to the planned arena, the timing of which is subject to delays. The arena itself (and its plans) along with any movement of the team is subject to formal approval by the NBA, which we may not receive. In addition, as applicable contractual and other deadlines and decision points approach, we could have less time and flexibility to plan and implement our responses to these or other risks to the extent that any of them may actually arise.
If any of the foregoing risks were to occur we may: (i) not be able to develop Brooklyn Atlantic Yards to the extent intended or at all resulting in a potential write-off of our investment, (ii) be required to pay the City and/or State of New York liquidated damages for failure to meet certain agreed upon project deadlines, and (iii) be in default of our non-recourse mortgages on the project. The exposure to loss on this investment is approximately $645 million, excluding any potential write-offs for the arena or any liquidated damages described in (ii) of this paragraph, and could have a significant, material adverse effect on our business, cash flows and results of operations. Even if we were able to continue with the development, or a portion thereof, we would likely not be able to do so as quickly as originally planned, would be likely to incur additional costs and may need to write-off a portion of the development.
| | • | | Westchester’s Ridge Hill.Retail leasing at ourWestchester’s Ridge Hilldevelopment project in Westchester County, New York has progressed slowly. Currently, the center is 59% leased. Portions of the retail center have been open since May 2011; however; future phases are currently under construction and the entire project is subject to a completion guaranty. The projected phased opening dates may be impacted by the final outcome of our leasing effort which in turn could increase our equity requirements into this project. |
12
Vacancies in Our Properties May Adversely Affect Our Results of Operations and Cash Flows
Our results of operations and cash flows may be adversely affected if we are unable to continue leasing a significant portion of our commercial and residential real estate portfolio. We depend on commercial and residential tenants in order to collect rents and other charges. The current economic downturn has impacted our tenants on many levels. The downturn has been particularly hard on commercial retail tenants, many of whom have announced store closings and scaled backed growth plans. If we are unable to sustain historical occupancy levels in our real estate portfolio, our cash flows and results of operations could be adversely affected. Our ability to sustain our current and historical occupancy levels also depends on many other factors that are discussed elsewhere in this section.
The Strategic Decision to Reposition or Divest Portions of our Land Business Has and May Continue to Adversely Affect Our Results of Operations and Cash Flows
On January 31, 2012, we made a strategic decision to reposition or divest portions of our traditional land business. As a result of this decision, we recorded a pre-tax non-cash impairment charge of approximately $154,000,000 during the year ended January 31, 2012. These residential development land projects, which are at various stages of development, vary in size and are located throughout the United States. The ultimate disposition of these land projects depends on various factors, including the demand for, and prices of residential land developments. If we are unable to dispose of these land projects at values acceptable to us in a reasonable period of time or at all, we may incur further impairment charges and selling costs or incur additional carrying costs related to these land projects. The strategic decision could adversely affect our ability to forge business relationships with certain governments, communities, partners and contractors in the future.
The Downturn in the Housing Market May Continue to Adversely Affect Our Results of Operations and Cash Flows
The United States has experienced a sustained downturn in the residential real estate markets, resulting in a decline in both the demand for, and price of, housing. For our land projects that we plan to retain, we depend on homebuilders and condominium builders and buyers, which have been significantly and adversely impacted by the housing downturn, to continue buying our land held for sale. We do not know how long the downturn in the housing market will last or if we will ever see a return to previous conditions. Our ability to sustain our historical sales levels of land depends in part on the strength of the housing market and will suffer until conditions improve. Our failure to successfully sell our land held for sale on favorable terms would adversely affect our results of operations and cash flows and could result in a write-down in the value of our land due to impairment.
Our Properties and Businesses Face Significant Competition
The real estate industry is highly competitive in many of the markets in which we operate. Competition could over-saturate any market, as a result of which we may not have sufficient cash to meet the nonrecourse debt service requirements on certain of our properties. Although we may attempt to negotiate a restructuring with the mortgagee, we may not be successful, particularly in light of current credit markets, which could cause a property to be transferred to the mortgagee.
There are numerous other developers, managers and owners of commercial and residential real estate and undeveloped land that compete with us nationally, regionally and/or locally, some of whom have greater financial resources and market share than us. They compete with us for management and leasing opportunities, land for development, properties for acquisition and disposition, and for anchor stores and tenants for properties. We may not be able to successfully compete in these areas. If our competitors prevent us from realizing our real estate objectives, the operating performance may fall short of expectations and adversely affect our financial performance.
Tenants at our retail properties face continual competition in attracting customers from retailers at other shopping centers, catalogue companies, online merchants, warehouse stores, large discounters, outlet malls, wholesale clubs, direct mail and telemarketers. Our competitors and those of our tenants could have a material adverse effect on our ability to lease space in our properties and on the rents we can charge or the concessions we can grant. This in turn could materially and adversely affect our results of operations and cash flows, and could affect the realizable value of our assets upon sale.
We May Be Unable to Sell Properties to Avoid Losses or to Reposition Our Portfolio
Because real estate investments are relatively illiquid, we may be unable to dispose of underperforming properties and may be unable to reposition our portfolio in response to changes in national, regional or local real estate markets, including the strategic repositioning or divestment of portions of our land segment. In addition, potential buyers may be unable to secure financing which could negatively impact our ability to dispose of our properties. As a result, we may incur operating losses from some of our properties and may have to write-down the value of some properties due to impairment.
13
Our Results of Operations and Cash Flows May Be Adversely Affected by Tenant Defaults or Bankruptcy
Our results of operations and cash flows may be adversely affected if a significant number of our tenants are unable to meet their obligations or do not renew their leases, or if we are unable to lease a significant amount of space on economically favorable terms. In the event of a default by a tenant, we may experience delays in payments and incur substantial costs in recovering our losses.
In addition, our ability to collect rents and other charges will be even more difficult if the tenant is bankrupt or insolvent. While our tenants have from time to time filed for bankruptcy or been involved in insolvency proceedings, there have been an increased number of bankruptcies with the most recent recession. We may be required to expense costs associated with leases of bankrupt tenants and may not be able to replace future rents for tenant space rejected in bankruptcy proceedings which could adversely affect our properties. The current bankruptcies of some of our tenants, and the potential bankruptcies of other tenants in the future could make it difficult for us to enforce our rights as lessor and protect our investment.
Based on tenants with net base rent of greater than 2% of total net base rent as of January 31, 2012, our five largest office tenants by leased square feet are the City of New York, Millennium Pharmaceuticals, Inc., U.S. Government, WellPoint, Inc. and JP Morgan Chase & Co. Given our large concentration of office space in New York City, we may be adversely affected by the consolidation or failure of certain financial institutions. As of January 31, 2012, our five largest retail tenants by leased square feet are Bass Pro Shops, Inc., Regal Entertainment Group, AMC Entertainment, Inc., TJX Companies and The Gap. An event of default or bankruptcy of one of our largest tenants would increase the adverse impact on us.
We May Be Negatively Impacted by the Consolidation or Closing of Anchor Stores
Our retail centers are generally anchored by department stores or other “big box” tenants. We could be adversely affected if one or more of these anchor stores were to consolidate, close or enter into bankruptcy. Given the current economic environment for retailers, we are at a heightened risk that an anchor store could close or enter into bankruptcy. Although non-tenant anchors generally do not pay us rent, they typically contribute towards common area maintenance and other expenses. Even if we own the anchor space, we may be unable to re-lease this area or to re-lease it on comparable terms. The loss of these revenues could adversely affect our results of operations and cash flows. Further, the temporary or permanent loss of any anchor likely would reduce customer traffic in the retail center, which could lead to decreased sales at other retail stores. Rents obtained from other tenants may be adversely impacted as a result of co-tenancy clauses in their leases. One or more of these factors could cause the retail center to fail to meet its debt service requirements. The consolidation of anchor stores may also negatively affect current and future development projects.
We May Be Negatively Impacted by International Activities
While our international activities are currently limited in scope and generally focused on evaluating various international opportunities, we may expand our international efforts subjecting us to risks that could have an adverse effect on the projected returns on the international projects or our overall results of operations. We have limited experience in dealing with foreign economies or cultures, changes in political environments or changes in exchange rates for foreign currencies. In addition, international activities would subject us to a wide variety of local, federal and international laws and regulations governing these foreign properties and business activities within the foreign markets with which we have little or no prior experience including laws related to anti-corruption and anti-bribery. We may experience difficulties in managing international properties, including the ability to successfully integrate these properties into our business operations and the ambiguities that arise when dealing with foreign cultures. Each of these factors may adversely affect our projected returns on foreign investments, which could in turn have an adverse effect on our results of operations.
Terrorist Attacks and Other Armed Conflicts May Adversely Affect Our Business
We have significant investments in large metropolitan areas, including New York City, Philadelphia, Boston, the Greater Washington D.C. metropolitan area, Denver, Dallas, Chicago, Los Angeles and the Greater San Francisco metropolitan area, which face a heightened risk related to terrorism. Some tenants in these areas may choose to relocate their business to less populated, lower-profile areas of the United States. This could result in a decrease in the demand for space in these areas, which could increase vacancies in our properties and force us to lease our properties on less favorable terms. In addition, properties in our real estate portfolio could be directly impacted by future terrorist attacks which could cause the value of our property and the level of our revenues to significantly decline.
Future terrorist activity, related armed conflicts or prolonged or increased tensions in the Middle East could cause consumer confidence and spending to decrease and adversely affect mall traffic. Additionally, future terrorist attacks could increase volatility in the United States and worldwide financial markets. Any of these occurrences could have a significant impact on our revenues, costs and operating results.
14
The Investment in a Professional Sports Franchise Involves Certain Risks and Future Losses Are Expected for The Nets
On August 16, 2004, we purchased a legal ownership interest in The Nets. The purchase of the interest in The Nets was the first step in our efforts to pursue development projects at Brooklyn Atlantic Yards. For a more thorough discussion of the risks associated with the Brooklyn Atlantic Yards project see “We Are Subject to Real Estate Developments Risks.” On May 12, 2010, we, through our consolidated subsidiary NS&E, closed on a purchase agreement with the MP Entities. The transaction resulted in a change of controlling ownership interest in The Nets. Following the transaction with the MP Entities, NS&E retained a 20% non-controlling ownership of The Nets. As we have a 62% ownership interest in NS&E, our resulting ownership interest in The Nets after the transaction is approximately 12%.
The Nets are currently operating at a loss and are projected to continue to operate at a loss at least as long as they remain in New Jersey. Such operating losses will need to be funded by the contribution of equity. Even when The Nets are able to relocate to Brooklyn, New York, there can be no assurance that The Nets will be profitable in the future. Losses are currently allocated to each member of the limited liability company that owns The Nets based on an analysis of the respective member’s claim on the net book equity assuming a liquidation at book value at the end of each accounting period without regard to unrealized appreciation (if any) in the fair value of The Nets. The operating agreement with the MP Entities required them to fund The Nets operating needs up to $60,000,000. The MP Entities met their $60,000,000 funding commitment during the three months ended July 31, 2011. As a result, we are, through our investment in NS&E, required to fund 100% of The Nets operating needs as defined, until the arena is complete and open, which is expected to be during the three months ended October 31, 2012. Therefore, losses allocated to us have exceeded and may continue to exceed our legal ownership interest and may be significant.
Our investment in The Nets is subject to a number of operational risks, including risks associated with operating conditions, competitive factors, economic conditions and industry conditions. If The Nets are not able to successfully manage the following operational risks, The Nets may incur additional operating losses:
| | • | | Competition with other major league sports, college athletics and other sports-related and non sports-related entertainment; |
| | • | | Dependence on competitive success of The Nets; |
| | • | | Fluctuations in the amount of revenues from advertising, sponsorships, concessions, merchandise, parking and season and other ticket sales, which are tied to the popularity and success of The Nets and general economic conditions; |
| | • | | Uncertainties of increases in players’ salaries; |
| | • | | Risk of injuries to key players; |
| | • | | Dependence on talented players; |
| | • | | Uncertainties relating to labor relations in professional sports, including the expiration of the NBA’s current collective bargaining agreement, or a player or management initiated stoppage after such expiration; and |
| | • | | Dependence on television and cable network, radio and other media contracts. |
Our High Debt Leverage May Prevent Us from Responding to Changing Business and Economic Conditions
Our high degree of debt leverage could limit our ability to obtain additional financing or adversely affect our liquidity and financial condition. We have a high ratio of debt (consisting of nonrecourse mortgage debt, a revolving credit facility and senior and subordinated debt) to total market capitalization. This ratio was approximately 75.1%, and 74.4% at January 31, 2012 and January 31, 2011, respectively, based on our long-term debt outstanding at that date and the market value of our outstanding Class A common stock and Class B common stock. Our high leverage may adversely affect our ability to obtain additional financing for working capital, capital expenditures, acquisitions, development or other general corporate purposes and may make us more vulnerable to a prolonged downturn in the economy.
Nonrecourse mortgage debt is collateralized by individual completed rental properties, projects under development and undeveloped land. We do not expect to repay a substantial amount of the principal of our outstanding debt prior to maturity or to have available funds from operations sufficient to repay this debt at maturity. As a result, it will be necessary for us to refinance our debt through new debt financings or through equity offerings. If interest rates are higher at the time of refinancing, our interest expense would increase, which would adversely affect our results of operations and cash flows. Cash flows and our liquidity would also be adversely affected if we are required to repay a portion of the outstanding principal or contribute additional equity to obtain the refinancing. In addition, in the event we were unable to secure refinancing on acceptable terms, we might be forced to sell properties on unfavorable terms, which could result in the recognition of losses and could adversely affect our financial position, results of operations and cash flows. If we were unable to make the required payments on any debt collateralized by a mortgage on one of our properties or to refinance that debt when it comes due, the mortgage lender could take that property through foreclosure and, as a result, we could lose income and asset value as well harm our Company reputation.
15
Our Corporate Debt Covenants Could Adversely Affect Our Financial Condition
We have guaranteed the obligations of our wholly-owned subsidiary, Forest City Rental Properties Corporation, or FCRPC, under the Credit Facility. The Credit Facility imposes a number of restrictive covenants on us, including a prohibition on certain consolidations and mergers, limitations on the amount of debt, guarantees and property liens that we may incur, restrictions on the pledging of ownership interests in subsidiaries, limitations on the use of cash sources and limitations on our ability to pay dividends on our common and preferred stock. The Credit Facility also requires us to maintain a specified minimum liquidity, debt service and cash flow coverage ratios and consolidated shareholders’ equity.
The indentures under which our senior and subordinated debt is issued also contain certain restrictive covenants, including, among other things, limitations on our ability to incur debt, pay dividends, acquire our common or preferred stock, permit liens on our properties or dispose of assets.
While we are in compliance with all of our covenants at January 31, 2012, we cannot guarantee our future compliance with any of the covenants. The failure to comply with any of our financial or non-financial covenants could result in an event of default and accelerate some or all of our indebtedness, which could have a material adverse effect on our financial condition. Our ability to comply with these covenants will depend upon our future economic performance. These covenants may adversely affect our ability to finance our future operations or capital needs or to engage in other business activities that may be desirable or advantageous to us.
We Are Subject to Risks Associated With Hedging Agreements
We will often enter into interest rate swap agreements and other interest rate hedging contracts, including caps and floors to mitigate or reduce our exposure to interest rate volatility or to satisfy lender requirements. While these agreements may help reduce our exposure to interest rate volatility, they also expose us to additional risks, including a risk that the counterparties will not perform. Moreover, there can be no assurance that the hedging agreement will qualify for hedge accounting or that our hedging activities will have the desired beneficial impact on our results of operations. Should we desire to terminate a hedging agreement, there could be significant costs and cash requirements involved to fulfill our initial obligation under the hedging agreement.
When a hedging agreement is required under the terms of a mortgage loan, it is often a condition that the hedge counterparty agree to certain conditions which include, but are not limited to, maintaining a specified credit rating. With the current volatility in the financial markets there is a reduced pool of eligible counterparties that can meet or are willing to agree to the required conditions which has resulted in an increased cost for hedging agreements. This could make it difficult to enter into hedging agreements in the future. Additionally, if the counterparty failed to satisfy any of the required conditions and we were unable to renegotiate the required conditions with the lender or find an alternative counterparty for such hedging agreements, we could be in default under the loan and the lender could take that property through foreclosure.
Our bonds that are structured in a total rate of return swap arrangement (“TRS”) have maturities reflected in the year the bond matures as opposed to the TRS maturity date, which is likely to be earlier. Throughout the life of the TRS, if the property is not performing at designated levels or due to changes in market conditions, the property may be obligated to make collateral deposits with the counterparty. At expiration or termination of the TRS arrangement, the property must pay or is entitled to the difference, if any, between the fair market value of the bond and par. If the property does not post collateral or make the counterparty whole at expiration, the counterparty could foreclose on the property.
Any Rise in Interest Rates Will Increase Our Interest Costs
Including the effect of the protection provided by the interest rate swaps, caps and long-term contracts in place as of January 31, 2012, a 100 basis point increase in taxable interest rates (including properties accounted for under the equity method, corporate debt and the effect of interest rate floors) would increase the annual pre-tax interest cost for the next 12 months of our variable-rate debt by approximately $11,321,000 at January 31, 2012. Although tax-exempt rates generally move in an amount that is smaller than corresponding changes in taxable interest rates, a 100 basis point increase in tax-exempt rates (including properties accounted for under the equity method) would increase the annual pre-tax interest cost for the next 12 months of our tax-exempt variable-rate debt by approximately $6,789,000 at January 31, 2012. This analysis includes a portion of our taxable and tax-exempt variable-rate debt related to construction loans for which the interest expense is capitalized. For variable rate bonds, during times of market illiquidity, a premium interest rate could be charged on the bonds to successfully market them which would result in even higher interest rates.
If We Are Unable to Obtain Tax-Exempt Financings, Our Interest Costs Would Rise
We regularly utilize tax-exempt financings and tax increment financings, which generally bear interest at rates below prevailing rates available through conventional taxable financing. We cannot assure you that tax-exempt bonds or similar government subsidized financing will continue to be available to us in the future, either for new development or acquisitions, or for the refinancing of outstanding debt. Our ability to obtain these financings or to refinance outstanding tax-exempt debt on favorable terms could significantly affect our ability to develop or acquire properties and could have a material adverse effect on our results of operations, cash flows and financial position.
16
Downgrades in Our Credit Rating Could Adversely Affect Our Performance
We are periodically rated by nationally recognized rating agencies. Any downgrades in our credit rating could impact our ability to borrow by increasing borrowing costs as well as limiting our access to capital. In addition, a downgrade could require us to post cash collateral and/or letters of credit to cover our self-insured property and liability insurance deductibles, surety bonds, energy contracts and hedge contracts which would adversely affect our cash flow and liquidity.
Our Business Will Be Adversely Impacted Should an Uninsured Loss, a Loss in Excess of Insurance Limits or a Delayed or Denied Insurance Claim Occur
We carry comprehensive insurance coverage for general liability, property, flood, wind, earthquake and rental loss (and environmental insurance on certain locations) with respect to our properties within insured limits and policy specifications that we believe are customary for similar properties. There are, however, specific types of potential losses, including environmental loss or losses of a catastrophic nature, such as losses from wars, terrorism, hurricanes, wind, earthquakes or other natural disasters, that in our judgment, cannot be purchased at a commercially viable cost or whereby such losses, if incurred, would exceed the insurance limits procured. In the event of an uninsured loss or a loss in excess of our insurance limits, or a failure by an insurer to meet its obligations under a policy, we could lose both our invested capital in, and anticipated profits from, the affected property and could be exposed to liabilities with respect to that which we thought we had adequate insurance to cover. Any such uninsured loss could materially and adversely affect our results of operations, cash flows and financial position. Under our current policies, which expire October 31, 2012, our properties are insured against acts of terrorism, subject to various limits, deductibles and exclusions for acts of war and terrorist acts involving biological, chemical and nuclear damage. Once these policies expire, we may not be able to obtain adequate terrorism coverage at a commercially reasonable cost. In addition, our insurers may not be able to maintain reinsurance sufficient to cover any losses we may incur as a result of terrorist acts. As a result, our insurers’ ability to provide future insurance for any damages that we sustain as a result of a terrorist attack may be reduced or eliminated.
Additionally, most of our current project mortgages require “all-risk”/”special form” property insurance, and we cannot assure you that we will be able to continue to obtain such “all risk”/”special form” policies that will satisfy lender requirements. We are self-insured as to the first $500,000 of commercial general liability coverage per occurrence. Further, for the first $250,000 of property damage coverage per occurrence, we utilize a wholly-owned captive insurance company and self-insurance. The wholly-owned captive insurance company is licensed, regulated and capitalized in accordance with state of Arizona statutes. The wholly-owned captive insurance company is not utilized to mitigate percentage deductibles for Florida, Hawaii, and scheduled tier one county wind property damage claims by named storms, California earthquake property damage claims, and Flood Zone A and V property claims. These percentage deductibles are self-insured. While we reasonably believe that our self-insurance and wholly-owned captive insurance company reserves are adequate for commercial property damage claims and commercial general liability claims, we cannot assure you that we will not incur losses that exceed these self- insurance and wholly-owned captive reserves.
As a property developer, owner, and manager, we will likely experience property and liability claims and will reasonably seek the coverage of the insurance policies that we have procured. There may be instances where there are severe claims that can be prolonged and insurance recoveries may be delayed or ultimately denied. This delay or denial may have an adverse impact on our financial condition.
A Downgrade or Financial Failure of Our Insurance Carriers May Have an Adverse Impact on our Financial Condition
The insurance carrier(s) that we utilize have satisfactory financial ratings at the time the policies are placed and made effective based on various insurance carrier rating agencies commonly used in the insurance industry. However, we cannot assure you that these financial ratings will remain satisfactory or constant throughout the policy period. There is a risk that these financial ratings may be downgraded throughout the policy period or that the insurance carrier(s) may experience a financial failure. A downgrade or financial failure of our insurance carrier(s) may result in their inability to pay current and future claims. This inability to pay claims may have an adverse impact on our financial condition. In addition, a downgrade or a financial failure of our insurance carrier(s) may cause our insurance renewal or replacement policy costs to increase.
We May Be Adversely Impacted by Environmental Matters
We are subject to various foreign, federal, state and local environmental protection and health and safety laws and regulations governing, among other things: the generation, storage, handling, use and transportation of hazardous materials; the emission and discharge of hazardous materials into the ground, air or water; and the health and safety of our employees. In some instances, federal, state and local laws require abatement or removal of specific hazardous materials such as asbestos-containing materials or lead-based paint, in the event of demolition, renovations, remodeling, damage or decay. Laws and regulations also impose specific worker protection and notification requirements and govern emissions of and exposure to hazardous or toxic substances, such as asbestos fibers in the air. We incur costs to comply with such laws and regulations, but we cannot assure you that we have been or will be at all times in complete compliance with such laws and regulations.
17
Under certain environmental laws, an owner or operator of real property may become liable for the costs of the investigation, removal and remediation of hazardous or toxic substances at that property. These laws often impose liability without regard to whether the owner or operator knew of, or was responsible for, the presence of the hazardous or toxic substances. Certain contamination is difficult to remediate fully and can lead to more costly design specifications, such as a requirement to install vapor barrier systems, or a limitation on the use of the property and could preclude development of a site at all. The presence of hazardous substances on a property could also result in personal injury, contribution or other claims by private parties. In addition, persons who arrange for the disposal or treatment of hazardous or toxic wastes may also be liable for the costs of the investigation, removal and remediation of those wastes at the disposal or treatment facility, regardless of whether that facility is owned or operated by that person.
We have invested, and will in the future, invest in properties that are or have been used for or are near properties that have had industrial purposes in the past. As a result, our properties are or may become contaminated with hazardous or toxic substances. We will incur costs to investigate and possibly to remediate those conditions and it is possible that some contamination will remain in or under the properties even after such remediation. While we investigate these sites and work with all relevant governmental authorities to meet their standards given our intended use of the property, it is possible that there will be new information identified in the future that indicates there are additional unaddressed environmental impacts, there could be technical developments that will require new or different remedies to be undertaken in the future, and the regulatory standards imposed by governmental authorities could change in the future.
As a result of the above, the value of our properties could decrease, our income from developed properties could decrease, our projects could be delayed, we could become obligated to third parties pursuant to indemnification agreements or guarantees, our expense to remediate or maintain the properties could increase, and our ability to successfully sell, rent or finance our properties could be adversely affected by environmental matters in a manner that could have a material adverse effect on our financial position, cash flows or results of operation. While we maintain insurance for certain environmental matters, we cannot assure you that we will not incur losses related to environmental matters, including losses that may materially exceed any available insurance.
The Ratner, Miller and Shafran Families Own a Controlling Interest in the Company, and Those Interests May Differ from Other Shareholders
Our authorized common stock consists of Class A common stock and Class B common stock. The economic rights of each Class of common stock are identical, but the voting rights differ. The Class A common stock, voting as a separate class, is entitled to elect 25% of the members of our Board of Directors, while the Class B common stock, voting as a separate class, is entitled to elect the remaining members of our Board of Directors. On all other matters, the Class A common stock and Class B common stock vote together as a single class, with each share of our Class A common stock entitled to one vote per share and each share of Class B common stock entitled to ten votes per share. At February 29, 2012, members of the Ratner, Miller and Shafran families, which include members of our current board of directors and executive officers, owned 89.0% of the Class B common stock. RMS, Limited Partnership (“RMS LP”) which owned approximately 88.5% of the Class B common stock is a limited partnership, comprised of interests of these families, with seven individual general partners, currently consisting of:
| | • | | Samuel H. Miller, Co-Chairman Emeritus of our Board of Directors; |
| | • | | Charles A. Ratner, Chairman of our Board of Directors; |
| | • | | Ronald A. Ratner, Executive Vice President of Forest City and a Director; |
| | • | | Brian J. Ratner, Executive Vice President of Forest City and a Director; |
| | • | | Deborah Ratner Salzberg, President of Forest City Washington, Inc., a subsidiary of Forest City, and a Director; |
| | • | | Joan K. Shafran, a Director; and |
Charles A. Ratner, James A. Ratner, Executive Vice President of Forest City and a Director, and Ronald A. Ratner are brothers. Albert B. Ratner, Co-Chairman Emeritus of our Board of Directors, is the father of Brian J. Ratner and Deborah Ratner Salzberg and is first cousin to Charles A. Ratner, James A. Ratner, Ronald A. Ratner, Joan K. Shafran and Bruce C. Ratner, Executive Vice President of Forest City and a Director. Samuel H. Miller was married to Ruth Ratner Miller (now deceased), a sister of Albert B. Ratner, and is the father of Abraham Miller. General partners holding 60% of the total voting power of RMS LP determine how to vote the Class B common stock held by RMS LP. No person may transfer his or her interest in the Class B common stock held by RMS LP without complying with various rights of first refusal.
18
In addition, at February 29, 2012, members of these families collectively owned 8.8% of the Class A common stock. As a result of their ownership in Forest City, these family members and RMS LP have the ability to elect a majority of our Board of Directors and to control our management and policies. Generally, they may, without the consent of our other shareholders, determine the outcome of any corporate transaction or other matters submitted to our shareholders for approval, including mergers, consolidations and the sale of all or substantially all of our assets and may also prevent or cause a change in control of Forest City.
Even if these families or RMS LP reduce their level of ownership of Class B common stock below the level necessary to maintain a majority of the voting power, specific provisions of Ohio law and our Amended Articles of Incorporation may have the effect of discouraging a third party from making a proposal to acquire us or delaying or preventing a change in control or management of Forest City without the approval of these families or RMS LP.
RMS Investment Corp. Provides Property Management and Leasing Services to Us and Is Controlled By Some of Our Affiliates
We paid approximately $230,000 and $229,000 as total compensation during the years ended January 31, 2012 and 2011, respectively, to RMS Investment Corp. for property management and leasing services. RMS Investment Corp. is controlled by members of the Ratner, Miller and Shafran families, some of whom are our directors and executive officers.
RMS Investment Corp. manages and provides leasing services to our Cleveland-area specialty retail center, Golden Gate, which has 361,000 square feet. The current rate of compensation for this management service is 4% of all rental income, plus a leasing fee of generally 3% to 4% of rental income of all new or renewed leases. Management believes these fees are comparable to those other management companies would charge to non-affiliated third parties.
Our Directors and Executive Officers May Have Interests in Competing Properties, and We Do Not Have Non-Compete Agreements with Certain of Our Directors and Executive Officers
Under our current policy, no director or executive officer, including any member of the Ratner, Miller and Shafran families, is allowed to invest in a competing real estate opportunity without first obtaining the approval of the Audit Committee of our Board of Directors. We do not have non-compete agreements with any director or executive officer, other than Charles Ratner, James Ratner, Ronald Ratner, Bruce Ratner, David LaRue and Robert O’Brien. Upon leaving Forest City, any other director, officer or employee could compete with us. Notwithstanding our policy, we permit our principal shareholders who are officers and employees to develop, expand, operate or sell, independent of our business, certain commercial, industrial and residential properties that they owned prior to the implementation of our policy. As a result of their ownership of these properties, a conflict of interest may arise between them and Forest City, which may not be resolved in our favor. The conflict may involve the development or expansion of properties that may compete with our properties and the solicitation of tenants to lease these properties.
We are Subject to Recapture Risks Associated with Sale of Tax Credits
As part of our financing strategy, we have financed several real estate projects through limited partnerships with investment partners. The investment partner, typically a large, sophisticated institution or corporate investor, invests cash in exchange for a limited partnership interest and special allocations of expenses and the majority of tax losses and credits associated with the project. These partnerships typically require us to indemnify, on an after-tax or “grossed up” basis, the investment partner against the failure to receive or the loss of allocated tax credits and tax losses.
We believe that all the necessary requirements for qualification for such tax credits have been and will be met and that our investment partners will be able to receive expense allocations associated with these properties. However, we cannot assure you that this will, in fact, be the case or that we will not be required to indemnify our investment partners on an after-tax basis for these amounts. Indemnification payments (if required) could have a material adverse effect on our results of operations and cash flows.
We Face Risks Associated with Developing and Managing Properties in Partnership with Others
We use partnerships and limited liability companies, or LLCs, to finance, develop or manage some of our real estate investments. Acting through our wholly-owned subsidiaries, we typically are a general partner or managing member in these partnerships or LLCs. There are, however, instances in which we do not control or even participate in management or day-to-day operations of these properties. The use of partnerships and LLCs involve special risks associated with the possibility that:
| | • | | Another partner or member may have interests or goals that are inconsistent with ours; |
| | • | | A general partner or managing member may take actions contrary to our instructions, requests, policies or objectives with respect to our real estate investments; or |
| | • | | A partner or a member could experience financial difficulties that prevent it from fulfilling its financial or other responsibilities to the project or its lender or the other partners or members. |
19
In the event any of our partners or members files for bankruptcy, we could be precluded from taking certain actions affecting our project without bankruptcy court approval, which could diminish our control over the project even if we were the general partner or managing member. In addition, if the bankruptcy court were to discharge the obligations of our partner or member, it could result in our ultimate liability for the project being greater than we would have otherwise been obligated for.
To the extent we are a general partner, we may be exposed to unlimited liability, which may exceed our investment or equity in the partnership. If one of our subsidiaries is a general partner of a particular partnership it may be exposed to the same kind of unlimited liability.
Failure to Continue to Maintain Effective Internal Controls in Accordance with Section 404 of the Sarbanes-Oxley Act of 2002 Could Have a Material Adverse Effect on Our Ability to Ensure Timely and Reliable Financial Reporting
Section 404 of the Sarbanes-Oxley Act of 2002, or Section 404, requires our management to evaluate the effectiveness of, and our independent registered public accounting firm to attest to, our internal control over financial reporting. We will continue our ongoing process of testing and evaluating the effectiveness of, and remediating any issues identified related to, our internal control over financial reporting. The process of documenting, testing and evaluating our internal control over financial reporting is complex and time consuming. Due to this complexity and the time-consuming nature of the process and because currently unforeseen events or circumstances beyond our control could arise, we cannot assure you that we ultimately will be able to continue to comply fully in subsequent fiscal periods with Section 404 in our Annual Report on Form 10-K. We may not be able to conclude on an ongoing basis that we have effective internal control over financial reporting in accordance with Section 404, which could adversely affect public confidence in our ability to record, process, summarize and report financial data to ensure timely and reliable external financial reporting.
Compliance or Failure to Comply with the Americans with Disabilities Act and Other Similar Laws Could Result in Substantial Costs
The Americans with Disabilities Act generally requires that public buildings, including office buildings and hotels, be made accessible to disabled persons. In the event that we are not in compliance with the Americans with Disabilities Act, the federal government could fine us or private parties could be awarded damages against us. If we are required to make substantial alterations and capital expenditures in one or more of our properties, including the removal of access barriers, it could adversely affect our results of operations and cash flows.
We may also incur significant costs complying with other regulations. Our properties are subject to various federal, state and local regulatory requirements, such as state and local fire and safety requirements. If we fail to comply with these requirements, we could incur fines or private damage awards. We believe that our properties are currently in material compliance with all of these regulatory requirements. However, existing requirements may change and compliance with future requirements may require significant unanticipated expenditures that could adversely affect our cash flows and results of operations.
Legislative and Regulatory Actions Taken Now or in the Future Could Adversely Affect Our Business.
Current economic conditions have resulted in governmental regulatory agencies and political bodies placing increased focus and scrutiny on the financial services industry. This increased scrutiny has resulted in unprecedented programs and actions targeted at restoring stability in the financial markets.
In July 2010, the U.S. Congress enacted the Dodd Frank Wall Street Reform and Consumer Protection Act (or the Dodd-Frank Act). The Dodd-Frank Act was enacted in part to impose significant investment restrictions and capital requirements on banking entities and other organizations in the financial services industry, which may result in such entities and organizations instituting more conservative practices with respect to financing instruments. While we do not operate in the financial services industry, the Dodd-Frank Act could have an adverse impact on our business, results of operations and financial condition. While the full impact of the Dodd-Frank Act cannot be assessed until all implementing regulations are released, the Dodd-Frank Act may adversely affect the cost, availability and terms of financial instruments, such as non-recourse mortgage loans, interest rate swaps and other hedging instruments; further reduce our access to capital; and limit availability of favorable terms of financing from lenders. The European Union and other major governmental authorities are in the process of enacting similar legislation which could have similar impacts on foreign investments.
In addition, U.S. Government, Federal Reserve, U.S. Treasury and other governmental and regulatory bodies have taken or are considering taking other actions to address the financial crisis. While we cannot predict whether or when such actions may occur, such actions may have an adverse impact on our business, results of operations and financial condition.
20
Changes in Market Conditions Could Continue to Hurt the Market Price of Our Publicly Traded Securities
The stock market has experienced volatile conditions, particularly with respect to companies in the real estate industry, resulting in substantial price and volume fluctuations that are often unrelated or disproportionate to the financial performance of companies. These broad market and industry fluctuations may adversely affect the price of our Class A common stock regardless of our operating performance. A decline in the price of our Class A common stock could have an adverse effect on our business by reducing our ability to generate capital through sales of our Class A common stock, subjecting us to further credit rating downgrades and, in the case of a substantial decline, increasing the risk of not satisfying the New York Stock Exchange’s continued listing standards.
Inflation May Adversely Affect our Financial Condition and Results of Operations
Although inflation has not materially impacted our results of operations to date, increases in inflation at a rate higher than increases in rental income could have a negative impact on our operating margins and cash flows. In some circumstances, increases in operating expenses for commercial properties can be passed on to our tenants. However, some of our commercial leases contain clauses that may prevent us from easily passing on increases of operating expenses to the respective tenants.
Cybersecurity risks and cyber incidents could adversely affect our business and disrupt operations
A cyber incident is considered to be any adverse event that threatens the confidentiality, integrity, or availability of our information resources. More specifically, a cyber incident is an intentional attack or an unintentional event that can include gaining unauthorized access to systems to disrupt operations, corrupt data, or steal confidential information. As our reliance on technology has increased, so have the risks posed to our systems, both internal and those we have outsourced. Our three primary risks that could directly result from the occurrence of a cyber incident include operational interruption, damage to our relationship with our tenants, and private data exposure. We have implemented processes, procedures and controls to help mitigate these risks, but these measures, as well as our increased awareness of a risk of a cyber incident, do not guarantee that our financial results will not be negatively impacted by such an incident.
Item 1B. Unresolved Staff Comments
None.
Item 2. Properties
The Corporate headquarters of Forest City Enterprises, Inc. are located in Cleveland, Ohio and are owned by the Company. The Company’s core markets include Boston, Chicago, Dallas, Denver, Los Angeles, New York, Philadelphia, the Greater San Francisco metropolitan area and the Greater Washington D.C. metropolitan area.
The following schedules present information on our portfolio of real estate assets. The first two schedules and footnotes related to the Company’s Development Pipeline provide information on properties opened in 2011 and those that are under construction as of January 31, 2012. The Real Estate Portfolio schedule is a detailed listing of our portfolio by product type further broken out by consolidated and unconsolidated assets.
21
Forest City Enterprises, Inc.
Development Pipeline
January 31, 2012
2011 Openings and Acquisitions
| | | | | | | | | | | | | | | | | | | | | | | | | | |
| Property | | Location | | Dev (D) Acq (A) | | Date Opened /
Acquired | | | FCE Legal
Ownership % | | Consolidated (C)
Unconsolidated (U) | | Total Cost | | | Sq. ft./ No. of
Units | | | | | Gross
Leasable
Area | |
| | | | | | | | | | | | | | (in millions) | | | | | | | | | |
Retail Centers: | | | | | | | | | | | | | | | | | | | | | | | | | | |
Westchester’s Ridge Hill (a) | | Yonkers, NY | | D | | | Q2-11/12 | | | 70.0% | | C | | $ | 868.2 | | | | 1,336,000 | | | (c) | | | 1,336,000 | |
| | | | | | | | | |
Residential: | | | | | | | | | | | | | | | | | | | | | | | | | | |
8 Spruce Street (b) | | Manhattan, NY | | D | | | Q1-11/12 | | | 35.7% | | U | | $ | 875.7 | | | | 899 | | | | | | | |
Foundry Lofts | | Washington, D.C. | | D | | | Q4-11 | | | 100.0% | | C | | | 61.4 | | | | 170 | | | | | | | |
| | | | | | | | | | | | | | $ | 937.1 | | | | 1,069 | | | | | | | |
| | | | | | | | | |
Total Openings and Acquisitions | | | | | | | | | | | | | | $ | 1,805.3 | | | | | | | | | | | |
See attached footnotes.
22
Forest City Enterprises, Inc.
Development Pipeline
January 31, 2012
Under Construction
| | $,0000000 | | $,0000000 | | $,0000000 | | | $,0000000 | | | $,0000000 | | | $,0000000 | | | | $,0000000 | | | | $,0000000 | | | | $,0000000 | |
| Property | | Location | | Dev (D)
Acq (A) | | Anticipated
Opening | | FCE Legal
Ownership % | | | Consolidated (C)
Unconsolidated (U) | | Total Cost | | | Sq. ft./No.
of Units | | | Gross
Leasable
Area | | | Lease
Commitment % | |
| | | | | | | | | | | | | | (in millions) | | | | | | | | | | |
Retail Centers: (d) | | | | | | | | | | | | | | | | | | | | | | | | | | | | |
The Yards - Boilermaker Shops | | Washington, D.C. | | D | | Q3-12 | | | 100.0% | | | C | | $ | 19.2 | | | | 40,000 | | | | 40,000 | | | | 74% | |
| | | | | | | | | | | | | | | | | | | | | | | | | | | | |
| | | | | | | | | |
Office: | | | | | | | | | | | | | | | | | | | | | | | | | | | | |
Johns Hopkins Parking Garage | | Baltimore, MD | | D | | Q3-12 | | | 85.0% | | | C | | $ | 30.1 | | | | 492,000 | | | | | | | | | |
| | | | | | | | | | | | | | | | | | | | | | | | | | | | |
| | | | | | | | | |
Residential: | | | | | | | | | | | | | | | | | | | | | | | | | | | | |
The Aster Town Center (formerly Novella) | | Denver, CO | | D | | Q1-12 | | | 90.0% | | | C | | $ | 10.9 | | | | 85 | | | | | | | | | |
Botanica Eastbridge | | Denver, CO | | D | | Q2-12 | | | 90.0% | | | C | | | 15.4 | | | | 118 | | | | | | | | | |
Continental Building | | Dallas, TX | | D | | Q1-13 | | | 100.0% | | | C | | | 54.3 | | | | 203 | | | | | | | | | |
| | | | | | | | | | | | | | | | | | | | | | | | | | | | |
| | | | | | | | | | | | | | $ | 80.6 | | | | 406 | | | | | | | | | |
| | | | | | | | | | | | | | | | | | | | | | | | | | | | |
| | | | | | | | | |
Arena: | | | | | | | | | | | | | | | | | | | | | | | | | | | | |
Barclays Center | | Brooklyn, NY | | D | | Q3-12 | | | 34.0% | | | C | | $ | 904.3 | | | | 670,000 | | | | 18,000 seats | (e) | | | 64% | (f) |
| | | | | | | | | | | | | | | | | | | | | | | | | | | | |
| | | | | | | | | |
| | | | | | | | | | | | | | | | | | | | | | | | | | | | |
Total Under Construction | | | | | | | | | | | | | | $ | 1,034.2 | | | | | | | | | | | | | |
| | | | | | | | | | | | | | | | | | | | | | | | | | | | |
| | | | | | | | | |
Fee Development Projects | | | | | | | | | | | | | | | | | | | | | | | | | | | | |
Las Vegas City Hall (g) | | Las Vegas, NV | | D | | Q1-12 | | | – | | | U | | $ | 146.2 | | | | 270,000 | | | | | | | | | |
Dept. of Health & Mental Hygiene (DHMH) (g) | | Baltimore, MD | | D | | Q2-14 | | | – | | | U | | | 135.0 | | | | 234,000 | | | | | | | | | |
| | | | | | | | | | | | | | | | | | | | | | | | | | | | |
| | | | | | | | | | | | | | $ | 281.2 | | | | 504,000 | | | | | | | | | |
| | | | | | | | | | | | | | | | | | | | | | | | | | | | |
See attached footnotes.
Military Housing – see footnote h.
23
Development Pipeline
January 31, 2012 Footnotes
| | (a) | Phased-in opening. Costs are representative of the total project cost, including 432,000 square feet opened as of March 12, 2012. |
| | (b) | Phased-in opening. Costs are representative of the total project cost, including 787 units opened as of March 12, 2012. As of March 12, 2012, 655 leases have been signed, representing 73% of the total 899 units after construction is complete. |
| | (c) | Includes 156,000 square feet of office space. |
| | (d) | Updated lease commitments as of March 12, 2012. |
| | (e) | The Nets, a member of the NBA, has a 37 year license agreement to use the arena. |
| | (f) | Represents the percentage of forecasted contractually obligated arena income that is under contract. Contractually obligated income, which includes revenue from naming rights, sponsorships, suite licenses, Nets minimum rent and food concession agreements, accounts for 72% of total forecasted revenues for the arena. |
| | (g) | These are fee development projects. Therefore, these costs are not included on the Company’s balance sheet. In March 2012, the Las Vegas City Hall, which we developed for the City of Las Vegas on a fee basis as part of a public-private partnership, was completed. |
| | (h) | Below is a summary of the Company’s unconsolidated investments for Military Housing development projects that are accounted for under the equity method. The Company provides development, construction and management services for these projects and receives agreed upon fees for these services. Phases are considered under construction until the completion of the initial development period as defined in the respective agreements. |
| | | | | | | | | | | | |
| Property | | Location | | Opening/ Anticipated
Opening | | Completed
Cost | | | No. of Units | |
| |
| | | | | | | (in millions | ) | | | | |
Military Housing - Recent Openings | | | | | | | | | | | | |
Navy, Hawaii Increment III | | Honolulu, HI | | 2007-Q1-11 | | $ | 443.1 | | | | 2,520 | |
Marines, Hawaii Increment II | | Honolulu, HI | | 2007-Q2-11 | | | 289.1 | | | | 1,175 | |
Navy Midwest | | Chicago, IL | | 2006-Q4-11 | | | 200.3 | | | | 1,401 | |
Air Force Academy | | Colorado Springs, CO | | 2007-Q4-11 | | | 69.5 | | | | 427 | |
Pacific Northwest Communities | | Seattle, WA | | 2007-Q4-11 | | | 280.5 | | | | 2,985 | |
Midwest Millington | | Memphis, TN | | 2008-Q4-11 | | | 33.1 | | | | 318 | |
| | | | | | | | |
Total Recent Openings | | | | | | $ | 1,315.6 | | | | 8,826 | |
| | | | | | | | |
| | | | |
Military Housing - Under Construction | | | | | | | | | | | | |
Hawaii Phase IV | | Kaneohe, HI | | 2007-2014 | | $ | 476.7 | | | | 1,141 | |
Air Force - Southern Group: | | | | | | | | | | | | |
Keesler Air Force Base | | Biloxi, MS | | 2011-2012 | | | 5.0 | | | | 1,188 | |
Joint Base Charleston | | Charleston, SC | | 2011-2013 | | | 72.0 | | | | 345 | |
Arnold Air Force Base | | Tullahoma, TN | | 2011-2013 | | | 10.1 | | | | 22 | |
Shaw Air Force Base | | Sumter, SC | | 2011-2015 | | | 156.5 | | | | 630 | |
| | | | | | | | |
Subtotal Air Force - Southern Group | | | | | | $ | 243.6 | | | | 2,185 | |
| | | | | | | | |
Total Under Construction | | | | | | $ | 720.3 | | | | 3,326 | |
| | | | | | | | |
24
Forest City Enterprises, Inc. Real Estate Portfolio as of January 31, 2012
COMMERCIAL GROUP - OFFICE BUILDINGS
| | | | | | | | | | | | | | | | | | | | | | |
| Name | | Date of
Opening/
Acquisition/
Expansion | | Legal
Ownership (1) | | | Pro-Rata
Ownership (2) | | | Location | | Major Tenants | | Leasable
Square Feet | | | Leasable
Square
Feet at Pro- Rata % | |
| | | | | | | |
Consolidated Office Buildings | | | | | | | | | | | | | | | | | | | | | | |
2 Hanson Place | | 2004 | | | 100.00% | | | | 100.00% | | | Brooklyn, NY | | Bank of New York, HSBC | | | 399,000 | | | | 399,000 | |
4930 Oakton | | 2006 | | | 100.00% | | | | 100.00% | | | Skokie, IL | | Sanford Brown College | | | 40,000 | | | | 40,000 | |
Ballston Common Office Center | | 2005 | | | 100.00% | | | | 100.00% | | | Arlington, VA | | US Coast Guard; Better Business Bureau | | | 174,000 | | | | 174,000 | |
Colorado Studios | | 2007 | | | 90.00% | | | | 90.00% | | | Denver, CO | | Colorado Studios | | | 75,000 | | | | 68,000 | |
Commerce Court | | 2007 | | | 100.00% | | | | 100.00% | | | Pittsburgh, PA | | US Bank; Wesco Distributors; Cardworks Services; Marc USA | | | 379,000 | | | | 379,000 | |
Edgeworth Building | | 2006 | | | 100.00% | | | | 100.00% | | | Richmond, VA | | Hirschler Fleischer; Ernst & Young | | | 137,000 | | | | 137,000 | |
Eleven MetroTech Center | | 1995 | | | 85.00% | | | | 85.00% | | | Brooklyn, NY | | City of New York - DoITT; E-911 | | | 216,000 | | | | 184,000 | |
Fairmont Plaza | | 1998 | | | 100.00% | | | | 100.00% | | | San Jose, CA | | Littler Mendelson; Merrill Lynch; UBS Financial; Camera 12 Cinemas; Accenture | | | 405,000 | | | | 405,000 | |
Fifteen MetroTech Center | | 2003 | | | 95.00% | | | | 95.00% | | | Brooklyn, NY | | Wellpoint, Inc.; City of New York - HRA | | | 650,000 | | | | 618,000 | |
Halle Building | | 1986 | | | 100.00% | | | | 100.00% | | | Cleveland, OH | | Case Western Reserve University; Grant Thornton; CEOGC | | | 409,000 | | | | 409,000 | |
Harlem Center | | 2003 | | | 100.00% | | | | 100.00% | | | Manhattan, NY | | Office of General Services-Temporary Disability & Assistance; State Liquor Authority | | | 147,000 | | | | 147,000 | |
Higbee Building | | 1990 | | | 100.00% | | | | 100.00% | | | Cleveland, OH | | Key Bank; Horseshoe Casino | | | 815,000 | | | | 815,000 | |
Illinois Science and Technology Park | | | | | | | | | | | | | | | | | | | | | | |
- 4901 Searle (A) | | 2006 | | | 100.00% | | | | 100.00% | | | Skokie, IL | | Northshore University Health System | | | 224,000 | | | | 224,000 | |
- 8025 Lamon (P) | | 2006 | | | 100.00% | | | | 100.00% | | | Skokie, IL | | NanoInk, Inc.; Midwest Bio Research; Vetter Development Services | | | 128,000 | | | | 128,000 | |
- 8030 Lamon (J) | | 2010 | | | 100.00% | | | | 100.00% | | | Skokie, IL | | Leasing in progress | | | 147,000 | | | | 147,000 | |
- 8045 Lamon (Q) | | 2007 | | | 100.00% | | | | 100.00% | | | Skokie, IL | | Astellas; Polyera; APP Pharmaceuticals, LLC | | | 161,000 | | | | 161,000 | |
Johns Hopkins - 855 North Wolfe Street | | 2008 | | | 83.99% | | | | 98.81% | | | East Baltimore, MD | | Johns Hopkins; Brain Institute; Howard Hughes Institute; Lieber Institute | | | 279,000 | | | | 276,000 | |
New York Times | | 2007 | | | 100.00% | | | | 100.00% | | | Manhattan, NY | | ClearBridge Advisors, LLC, a Legg Mason Co.; Covington & Burling; Osler Hoskin & Harcourt; Seyfarth Shaw | | | 738,000 | | | | 738,000 | |
Nine MetroTech Center North | | 1997 | | | 85.00% | | | | 85.00% | | | Brooklyn, NY | | City of New York - Fire Department | | | 317,000 | | | | 269,000 | |
One MetroTech Center | | 1991 | | | 82.50% | | | | 82.50% | | | Brooklyn, NY | | JP Morgan Chase; National Grid | | | 937,000 | | | | 773,000 | |
One Pierrepont Plaza | | 1988 | | | 100.00% | | | | 100.00% | | | Brooklyn, NY | | Morgan Stanley; U.S. Probation | | | 659,000 | | | | 659,000 | |
Post Office Plaza (MK Ferguson) | | 1990 | | | 100.00% | | | | 100.00% | | | Cleveland, OH | | Washington Group; Chase Manhattan Mortgage Corp; Quicken Loans; Squire Sanders | | | 476,000 | | | | 476,000 | |
Richmond Office Park | | 2007 | | | 100.00% | | | | 100.00% | | | Richmond, VA | | The Brinks Co.; Wachovia Bank; Bon Secours Virginia HealthSource | | | 568,000 | | | | 568,000 | |
Skylight Office Tower | | 1991 | | | 92.50% | | | | 100.00% | | | Cleveland, OH | | Cap Gemini; Ulmer & Berne, LLP | | | 321,000 | | | | 321,000 | |
Stapleton - 3055 Roslyn | | 2006 | | | 90.00% | | | | 90.00% | | | Denver, CO | | University of Colorado Hospital | | | 45,000 | | | | 41,000 | |
Ten MetroTech Center | | 1992 | | | 100.00% | | | | 100.00% | | | Brooklyn, NY | | Internal Revenue Service | | | 365,000 | | | | 365,000 | |
Terminal Tower | | 1983 | | | 100.00% | | | | 100.00% | | | Cleveland, OH | | Forest City Enterprises, Inc.; Falls Communications; Riverside Company | | | 597,000 | | | | 597,000 | |
Twelve MetroTech Center | | 2004 | | | 100.00% | | | | 100.00% | | | Brooklyn, NY | | National Union Fire Insurance Co. | | | 177,000 | | | | 177,000 | |
Two MetroTech Center | | 1990 | | | 82.50% | | | | 82.50% | | | Brooklyn, NY | | City of New York - Board of Education; City of New York - DoITT | | | 522,000 | | | | 431,000 | |
University of Pennsylvania | | 2004 | | | 100.00% | | | | 100.00% | | | Philadelphia, PA | | University of Pennsylvania | | | 122,000 | | | | 122,000 | |
| | | | | | | | | | | | | | | | | | |
Consolidated Office Buildings Subtotal | | | 10,629,000 | | | | 10,248,000 | |
| | | | | | | | | | | | | | | | | | |
25
Forest City Enterprises, Inc. Real Estate Portfolio as of January 31, 2012
COMMERCIAL GROUP - OFFICE BUILDINGS (continued)
| | | | | | | | | | | | | | | | | | | | | | |
| Name | | Date of
Opening/
Acquisition/
Expansion | | Legal
Ownership (1) | | | Pro-Rata
Ownership (2) | | | Location | | Major Tenants | | Leasable
Square Feet | | | Leasable
Square Feet at Pro-
Rata % | |
| | | | | | | |
Unconsolidated Office Buildings | | | | | | | | | | | | | | | | | | | | | | |
35 Landsdowne Street | | 2002 | | | 51.00% | | | | 51.00% | | | Cambridge, MA | | Millennium Pharmaceuticals | | | 202,000 | | | | 103,000 | |
350 Massachusetts Ave | | 1998 | | | 50.00% | | | | 50.00% | | | Cambridge, MA | | Star Market; Tofias; Novartis | | | 169,000 | | | | 85,000 | |
40 Landsdowne Street | | 2003 | | | 51.00% | | | | 51.00% | | | Cambridge, MA | | Millennium Pharmaceuticals | | | 215,000 | | | | 110,000 | |
45/75 Sidney Street | | 1999 | | | 51.00% | | | | 51.00% | | | Cambridge, MA | | Millennium Pharmaceuticals;
Novartis | | | 277,000 | | | | 141,000 | |
65/80 Landsdowne Street | | 2001 | | | 51.00% | | | | 51.00% | | | Cambridge, MA | | Partners HealthCare System | | | 122,000 | | | | 62,000 | |
818 Mission Street | | 2008 | | | 50.00% | | | | 50.00% | | | San Francisco, CA | | Denny's; Community Vocational
Enterprises | | | 28,000 | | | | 14,000 | |
88 Sidney Street | | 2002 | | | 51.00% | | | | 51.00% | | | Cambridge, MA | | Vertex Pharmaceuticals | | | 145,000 | | | | 74,000 | |
Bulletin Building | | 2006 | | | 50.00% | | | | 50.00% | | | San Francisco, CA | | Great West Life and Annuity;
Corinthian School | | | 78,000 | | | | 39,000 | |
Chagrin Plaza I & II | | 1969 | | | 66.67% | | | | 66.67% | | | Beachwood, OH | | Nine Sigma; Benihana; H&R Block | | | 113,000 | | | | 75,000 | |
Clark Building | | 1989 | | | 50.00% | | | | 50.00% | | | Cambridge, MA | | Sanofi Pasteur Biologics; Agios
Pharmaceuticals | | | 122,000 | | | | 61,000 | |
Enterprise Place | | 1998 | | | 50.00% | | | | 50.00% | | | Beachwood, OH | | University of Phoenix; Advance
Payroll; PS Executive Centers;
Retina Assoc. of Cleveland | | | 132,000 | | | | 66,000 | |
Jackson Building | | 1987 | | | 51.00% | | | | 51.00% | | | Cambridge, MA | | Ariad Pharmaceuticals | | | 99,000 | | | | 50,000 | |
Liberty Center | | 1986 | | | 50.00% | | | | 50.00% | | | Pittsburgh, PA | | Federated Investors; Direct Energy
Business | | | 526,000 | | | | 263,000 | |
Mesa del Sol - 5600 University SE | | 2006 | | | 47.50% | | | | 47.50% | | | Albuquerque, NM | | MSR-FSR, LLC; CFV Solar | | | 87,000 | | | | 41,000 | |
Mesa del Sol - Aperture Center | | 2008 | | | 47.50% | | | | 47.50% | | | Albuquerque, NM | | Forest City Covington NM, LLC | | | 76,000 | | | | 36,000 | |
Mesa del Sol - Fidelity | | 2008/2009 | | | 47.50% | | | | 47.50% | | | Albuquerque, NM | | Fidelity Investments | | | 210,000 | | | | 100,000 | |
Richards Building | | 1990 | | | 51.00% | | | | 51.00% | | | Cambridge, MA | | Genzyme Biosurgery; Alkermes,
Inc. | | | 126,000 | | | | 64,000 | |
Signature Square I | | 1986 | | | 50.00% | | | | 50.00% | | | Beachwood, OH | | Ciuni & Panichi; PCC Airfoils;
Liberty Bank | | | 79,000 | | | | 40,000 | |
Signature Square II | | 1989 | | | 50.00% | | | | 50.00% | | | Beachwood, OH | | Pro Ed Communications; Goldberg
Co.; Resilience Mgt. | | | 82,000 | | | | 41,000 | |
| | | | | | | | | | | | | | | | | | |
Unconsolidated Office Buildings Subtotal | | | | | | | | | | | | | | | 2,888,000 | | | | 1,465,000 | |
| | | | | | | | | | | | | | | | | | |
| | | | | | | |
Total Office Buildings at January 31, 2012 | | | | | | | | | | | | | | | | | 13,517,000 | | | | 11,713,000 | |
| | | | | | | | | | | | | | | | | | |
Total Office Buildings at January 31, 2011 | | | | | | | | | | | | | | | | | 14,259,000 | | | | 11,985,000 | |
| | | | | | | | | | | | | | | | | | |
26
Forest City Enterprises, Inc. Real Estate Portfolio as of January 31, 2012
COMMERCIAL GROUP - RETAIL CENTERS
| | | | | | | | | | | | | | | | | | | | | | | | | | | | | | |
| Name | | Date of
Opening/
Acquisition/
Expansion | | Legal
Ownership (1) | | | Pro-Rata
Ownership (2) | | | Location | | Major Tenants | | Total
Square Feet | | | Total
Square
Feet at Pro-
Rata % | | | Gross
Leasable
Area | | | Gross
Leasable
Area at Pro-
Rata % | |
| | | | | | | | | |
Consolidated Regional Malls | | | | | | | | | | | | | | | | | | | | | | | | | | | | | | |
Antelope Valley Mall | | 1990/1999 | | | 78.00% | | | | 78.00% | | | Palmdale, CA | | Macy’s; Sears; JCPenney; Dillard’s; Forever 21; Cinemark Theatre | | | 1,196,000 | | | | 933,000 | | | | 478,000 | | | | 373,000 | |
Ballston Common Mall | | 1986/1999 | | | 100.00% | | | | 100.00% | | | Arlington, VA | | Macy’s; Sport & Health; Regal Cinemas | | | 579,000 | | | | 579,000 | | | | 311,000 | | | | 311,000 | |
Galleria at Sunset | | 1996/2002 | | | 100.00% | | | | 100.00% | | | Henderson, NV | | Dillard’s; Macy’s; JCPenney; Dick’s Sporting Goods; Kohl’s | | | 1,048,000 | | | | 1,048,000 | | | | 412,000 | | | | 412,000 | |
Mall at Robinson | | 2001 | | | 56.67% | | | | 100.00% | | | Pittsburgh, PA | | Macy’s; Sears; JCPenney; Dick’s Sporting Goods | | | 880,000 | | | | 880,000 | | | | 384,000 | | | | 384,000 | |
Northfield at Stapleton | | 2005/2006 | | | 100.00% | | | | 100.00% | | | Denver, CO | | Bass Pro Shops; Target; Harkins Theatre; JCPenney; Macy’s | | | 1,127,000 | | | | 1,127,000 | | | | 664,000 | | | | 664,000 | |
Orchard Town Center | | 2008/2012 | | | 100.00% | | | | 100.00% | | | Westminster, CO | | JCPenney; Macy’s; Target; AMC Theatres | | | 1,043,000 | | | | 1,043,000 | | | | 507,000 | | | | 507,000 | |
Promenade Bolingbrook | | 2007 | | | 100.00% | | | | 100.00% | | | Bolingbrook, IL | | Bass Pro Shops; Macy’s; Gold Class Cinemas; Barnes & Noble; Designer Shoe Warehouse | | | 771,000 | | | | 771,000 | | | | 575,000 | | | | 575,000 | |
Promenade in Temecula | | 1999/2002/2009 | | | 75.00% | | | | 100.00% | | | Temecula, CA | | JCPenney; Sears; Macy’s; Edwards Cinema | | | 1,279,000 | | | | 1,279,000 | | | | 544,000 | | | | 544,000 | |
Shops at Wiregrass | | 2008 | | | 50.00% | | | | 100.00% | | | Tampa, FL | | JCPenney; Dillard’s; Macy’s; Barnes & Noble | | | 734,000 | | | | 734,000 | | | | 349,000 | | | | 349,000 | |
Short Pump Town Center | | 2003/2005 | | | 50.00% | | | | 100.00% | | | Richmond, VA | | Nordstrom; Macy’s; Dillard’s; Dick’s Sporting Goods | | | 1,303,000 | | | | 1,303,000 | | | | 591,000 | | | | 591,000 | |
South Bay Galleria | | 1985/2001 | | | 100.00% | | | | 100.00% | | | Redondo Beach, CA | | Nordstrom; Macy’s; Kohl’s; AMC Theatres | | | 956,000 | | | | 956,000 | | | | 389,000 | | | | 389,000 | |
Victoria Gardens | | 2004/2007 | | | 80.00% | | | | 80.00% | | | Rancho Cucamonga, CA | | Bass Pro Shops; Macy’s; JCPenney; AMC Theatres | | | 1,401,000 | | | | 1,121,000 | | | | 829,000 | | | | 663,000 | |
^ Westchester’s Ridge Hill | | 2011/2012 | | | 70.00% | | | | 100.00% | | | Yonkers, NY | | Lord & Taylor; WESTMED Medical Group; LA Fitness; National Amusements' Cinema de Lux; Whole Foods; Dick’s Sporting Goods | | | 1,336,000 | | | | 1,336,000 | | | | 1,336,000 | | | | 1,336,000 | |
| | | | | | | | | | | | | | | | | | |
| | Consolidated Regional Malls Subtotal | | | | | | | | 13,653,000 | | | | 13,110,000 | | | | 7,369,000 | | | | 7,098,000 | |
| | | | | | | | | | | | | | | | | | |
27
Forest City Enterprises, Inc. Real Estate Portfolio as of January 31, 2012
COMMERCIAL GROUP – RETAIL CENTERS (continued)
| | | | | | | | | | | | | | | | | | | | | | | | | | | | | | |
| Name | | Date of
Opening/
Acquisition/
Expansion | | Legal
Ownership (1) | | | Pro-Rata
Ownership (2) | | | Location | | Major Tenants | | Total
Square
Feet | | | Total
Square
Feet at Pro-
Rata % | | | Gross
Leasable
Area | | | Gross
Leasable
Area at Pro-
Rata % | |
| | | | | | | | | |
Consolidated Specialty Retail Centers | | | | | | | | | | | | | | | | | | | | | | | | | | | | | | |
Atlantic Center Site V | | 1998 | | | 100.00% | | | | 100.00% | | | Brooklyn, NY | | Modell’s | | | 17,000 | | | | 17,000 | | | | 17,000 | | | | 17,000 | |
Avenue at Tower City Center | | 1990 | | | 100.00% | | | | 100.00% | | | Cleveland, OH | | Hard Rock Café; Morton’s of Chicago; Cleveland Cinemas; Horseshoe Casino (located in Higbee Building) | | | 365,000 | | | | 365,000 | | | | 365,000 | | | | 365,000 | |
Brooklyn Commons | | 2004 | | | 100.00% | | | | 100.00% | | | Brooklyn, NY | | Lowe’s | | | 151,000 | | | | 151,000 | | | | 151,000 | | | | 151,000 | |
Market at Tobacco Row | | 2002 | | | 100.00% | | | | 100.00% | | | Richmond, VA | | Rich Foods; CVS/Pharmacy | | | 43,000 | | | | 43,000 | | | | 43,000 | | | | 43,000 | |
Quartermaster Plaza | | 2004 | | | 100.00% | | | | 100.00% | | | Philadelphia, PA | | Home Depot; BJ’s Wholesale Club; Staples; PetSmart; Walgreen’s | | | 456,000 | | | | 456,000 | | | | 456,000 | | | | 456,000 | |
++ Quebec Square | | 2002 | | | 90.00% | | | | 90.00% | | | Denver, CO | | Walmart; Home Depot; Sam’s Club; Ross Dress for Less; Office Depot; PetSmart | | | 739,000 | | | | 665,000 | | | | 217,000 | | | | 195,000 | |
Station Square | | 1994/2002 | | | 100.00% | | | | 100.00% | | | Pittsburgh, PA | | Hard Rock Café; Grand Concourse Restaurant; Buca Di Beppo | | | 291,000 | | | | 291,000 | | | | 291,000 | | | | 291,000 | |
* The Yards-Boilermaker Shops | | 2012 | | | 100.00% | | | | 100.00% | | | Washington, D.C. | | Forest City Enterprises; Buzz Bakery; Huey’s 24/7 Diner; Willie’s Brew & Que; Well’s Cleaners; Smith & Union Brewery | | | 40,000 | | | | 40,000 | | | | 40,000 | | | | 40,000 | |
Town Center (East 29th Avenue) | | 2004 | | | 90.00% | | | | 90.00% | | | Denver, CO | | King Soopers; Walgreen’s; Casey’s Pub; Chipotle; SDC Services Corp.; Exempla, Inc. | | | 181,000 | | | | 163,000 | | | | 98,000 | | | | 88,000 | |
White Oak Village | | 2008 | | | 50.00% | | | | 100.00% | | | Richmond, VA | | Target; Lowe’s; Sam’s Club; JCPenney; OfficeMax; PetSmart; Martin’s | | | 843,000 | | | | 843,000 | | | | 295,000 | | | | 295,000 | |
| | | | | | | | | | | | | | | | | | |
| | Consolidated Specialty Retail Centers Subtotal | | | | | | | | 3,126,000 | | | | 3,034,000 | | | | 1,973,000 | | | | 1,941,000 | |
| | | | | | | | | | | | | | | | | | |
| | | | | | | |
| | Consolidated Retail Centers Total | | | | | | | | 16,779,000 | | | | 16,144,000 | | | | 9,342,000 | | | | 9,039,000 | |
| | | | | | | | | | | | | | | | | | |
28
Forest City Enterprises, Inc. Real Estate Portfolio as of January 31, 2012
COMMERCIAL GROUP - RETAIL CENTERS (continued)
| | | | | | | | | | | | | | | | | | | | | | | | | | | | | | | | |
| Name | | Date of
Opening/
Acquisition/
Expansion | | Legal
Ownership (1) | | | Pro-Rata
Ownership (2) | | | Location | | | Major Tenants | | Total Square Feet | | | Total Square Feet at Pro- Rata % | | | Gross
Leasable
Area | | | Gross
Leasable Area at Pro- Rata % | |
| | | | | | | | | |
Unconsolidated Regional Malls | | | | | | | | | | | | | | | | | | | | | | | | | | | | | | | | |
Boulevard Mall | | 1996/2000 | | | 50.00% | | | | 50.00% | | | | Amherst, NY | | | JCPenney; Macy’s; Sears; Michael’s | | | 912,000 | | | | 456,000 | | | | 336,000 | | | | 168,000 | |
Charleston Town Center | | 1983 | | | 50.00% | | | | 50.00% | | | | Charleston, WV | | | Macy’s; JCPenney; Sears; Brickstreet Insurance | | | 897,000 | | | | 449,000 | | | | 363,000 | | | | 182,000 | |
Mall at Stonecrest | | 2001 | | | 51.00% | | | | 51.00% | | | | Atlanta, GA | | | Kohl’s; Sears; JCPenney; Dillard’s; AMC Theatres; Macy’s | | | 1,226,000 | | | | 625,000 | | | | 397,000 | | | | 202,000 | |
San Francisco Centre | | 2006 | | | 50.00% | | | | 50.00% | | | | San Francisco, CA | | | Nordstrom; Bloomingdale’s; Century Theaters; San Francisco State University; Microsoft | | | 1,462,000 | | | | 731,000 | | | | 788,000 | | | | 394,000 | |
| | | | | | | | | | | | | | | | | | | | |
Unconsolidated Regional Malls Subtotal | | | 4,497,000 | | | | 2,261,000 | | | | 1,884,000 | | | | 946,000 | |
| | | | | | | | | | | | | | | | | | | | |
Unconsolidated Specialty Retail Centers | | | | | | | | | | | | | | | | | | | | | | | | | | | | | | | | |
42nd Street | | 1999 | | | 51.00% | | | | 51.00% | | | | Manhattan, NY | | | AMC Theatres; Madame Tussaud’s Wax Museum; Modell's; Dave & Buster’s; Ripley’s Believe It or Not!; Famous Dave’s BBQ | | | 309,000 | | | | 158,000 | | | | 309,000 | | | | 158,000 | |
Atlantic Center | | 1996 | | | 51.00% | | | | 51.00% | | | | Brooklyn, NY | | | Pathmark; OfficeMax; Old Navy; Marshall’s; NYC - Dept of Motor Vehicles; Best Buy | | | 395,000 | | | | 201,000 | | | | 395,000 | | | | 201,000 | |
Atlantic Terminal | | 2004 | | | 51.00% | | | | 51.00% | | | | Brooklyn, NY | | | Target; Designer Shoe Warehouse; Chuck E. Cheese’s; Daffy’s; Guitar Center | | | 371,000 | | | | 189,000 | | | | 371,000 | | | | 189,000 | |
Bruckner Boulevard | | 1996 | | | 51.00% | | | | 51.00% | | | | Bronx, NY | | | Conway; Old Navy; Marshall's | | | 113,000 | | | | 58,000 | | | | 113,000 | | | | 58,000 | |
Columbia Park Center | | 1999 | | | 38.25% | | | | 38.25% | | | | North Bergen, NJ | | | Shop Rite; Old Navy; Staples; Ballys; Shopper’s World; Phoenix Theatres | | | 351,000 | | | | 134,000 | | | | 351,000 | | | | 134,000 | |
Court Street | | 2000 | | | 51.00% | | | | 51.00% | | | | Brooklyn, NY | | | United Artists Theatres; Barnes & Noble | | | 102,000 | | | | 52,000 | | | | 102,000 | | | | 52,000 | |
Eastchester | | 2000 | | | 51.00% | | | | 51.00% | | | | Bronx, NY | | | Pathmark | | | 63,000 | | | | 32,000 | | | | 63,000 | | | | 32,000 | |
East River Plaza | | 2009/2010 | | | 35.00% | | | | 50.00% | | | | Manhattan, NY | | | Costco; Target; Best Buy; Marshall’s; PetSmart; Bob’s Furniture; Old Navy | | | 527,000 | | | | 264,000 | | | | 527,000 | | | | 264,000 | |
Forest Avenue | | 2000 | | | 51.00% | | | | 51.00% | | | | Staten Island, NY | | | United Artists Theatres | | | 70,000 | | | | 36,000 | | | | 70,000 | | | | 36,000 | |
Golden Gate | | 1958 | | | 50.00% | | | | 50.00% | | |
| Mayfield Heights,
OH |
| | OfficeMax; JoAnn Fabrics; Marshall’s; World Market; HH Gregg; PetSmart | | | 361,000 | | | | 181,000 | | | | 361,000 | | | | 181,000 | |
Gun Hill Road | | 1997 | | | 51.00% | | | | 51.00% | | | | Bronx, NY | | | Home Depot; Chuck E. Cheese’s | | | 147,000 | | | | 75,000 | | | | 147,000 | | | | 75,000 | |
Harlem Center | | 2002 | | | 51.00% | | | | 51.00% | | | | Manhattan, NY | | | Marshall’s; CVS/Pharmacy; Staples; H&M; Planet Fitness | | | 126,000 | | | | 64,000 | | | | 126,000 | | | | 64,000 | |
Kaufman Studios | | 1999 | | | 51.00% | | | | 51.00% | | | | Queens, NY | | | United Artists Theatres | | | 84,000 | | | | 43,000 | | | | 84,000 | | | | 43,000 | |
Marketplace at Riverpark | | 1996 | | | 50.00% | | | | 50.00% | | | | Fresno, CA | | | JCPenney; Best Buy; Marshall’s; OfficeMax; Old Navy; Target; Sports Authority | | | 471,000 | | | | 236,000 | | | | 296,000 | | | | 148,000 | |
Northern Boulevard | | 1997 | | | 51.00% | | | | 51.00% | | | | Queens, NY | | | Stop & Shop; Marshall’s; Old Navy; AJ Wright; Guitar Center | | | 218,000 | | | | 111,000 | | | | 218,000 | | | | 111,000 | |
Plaza at Robinson Town Center | | 1989 | | | 50.00% | | | | 50.00% | | | | Pittsburgh, PA | | | T.J. Maxx; Marshall’s; IKEA; Value City; JoAnn Fabrics; HomeGoods | | | 507,000 | | | | 254,000 | | | | 507,000 | | | | 254,000 | |
Queens Place | | 2001 | | | 51.00% | | | | 51.00% | | | | Queens, NY | | | Target; Best Buy; Macy’s Furniture; Designer Shoe Warehouse | | | 455,000 | | | | 232,000 | | | | 221,000 | | | | 113,000 | |
Richmond Avenue | | 1998 | | | 51.00% | | | | 51.00% | | | | Staten Island, NY | | | Staples; Dick’s Sporting Goods | | | 76,000 | | | | 39,000 | | | | 76,000 | | | | 39,000 | |
Village at Gulfstream Park | | 2010 | | | 50.00% | | | | 50.00% | | |
| Hallandale Beach,
FL |
| | Crate & Barrel; The Container Store; Texas de Brazil; Yard House | | | 511,000 | | | | 256,000 | | | | 511,000 | | | | 256,000 | |
| | | | | | | | | | | | | | | | | | | | |
Unconsolidated Specialty Retail Centers Subtotal | | | 5,257,000 | | | | 2,615,000 | | | | 4,848,000 | | | | 2,408,000 | |
| | | | | | | | | | | | | | | | | | | | |
| | | | |
Unconsolidated Retail Centers Total | | | 9,754,000 | | | | 4,876,000 | | | | 6,732,000 | | | | 3,354,000 | |
| | | | | | | | | | | | | | | | | | | | |
Total Retail Centers at January 31, 2012 | | | 26,533,000 | | | | 21,020,000 | | | | 16,074,000 | | | | 12,393,000 | |
| | | | | | | | | | | | | | | | | | | | |
Total Retail Centers at January 31, 2011 | | | 26,464,000 | | | | 22,511,000 | | | | 16,005,000 | | | | 13,640,000 | |
| | | | | | | | | | | | | | | | | | | | |
29
Forest City Enterprises, Inc. Real Estate Portfolio as of January 31, 2012
COMMERCIAL GROUP - HOTELS
| | | | | | | | | | | | | | | | | | | | | | | | |
| Name | | Date of
Opening/
Acquisition/ Expansion | | | Legal
Ownership (1) | | | Pro-Rata
Ownership (2) | | | Location | | | Rooms | | | Hotel Rooms at Pro-Rata % | |
| | | | | | |
Consolidated Hotels | | | | | | | | | | | | | | | | | | | | | | | | |
Sheraton Station Square | | | 1998/2001 | | | | 100.00% | | | | 100.00% | | | | Pittsburgh, PA | | | | 399 | | | | 399 | |
| | | | | | | | | | | | | | | | | | | | |
| | | | | | |
Unconsolidated Hotels | | | | | | | | | | | | | | | | | | | | | | | | |
Westin Convention Center | | | 1986 | | | | 50.00% | | | | 50.00% | | | | Pittsburgh, PA | | | | 616 | | | | 308 | |
| | | | | | | | | | | | | | | | | | | | |
| | |
Total Hotel Rooms at January 31, 2012 | | | | 1,015 | | | | 707 | |
| | | | | | | | | | | | | | | | | | | | |
Total Hotel Rooms at January 31, 2011 | | | | 1,573 | | | | 1,265 | |
| | | | | | | | | | | | | | | | | | | | |
| | | | | | | | | | | | | | | | | | | | | | | | | | | | | | | | | | |
| COMMERCIAL GROUP - ARENA | | | | | | | | | | | | | | Major Tenants | | Total
Square
Feet | | | Total Square
Feet at Pro- Rata % | | | Est. Seating Capacity for NBA
Basketball
Event | | | Est. Seating Capacity
for NBA
Basketball
Event at
Pro-Rata % | |
| | | | | | | | | |
* Barclays Center | | | 2012 | | | | 34.01 | % | | | 34.01 | % | | | Brooklyn, NY | | | The Nets NBA Team | | | 670,000 | | | | 228,000 | | | | 18,000 | | | | 6,122 | |
| | | | | | | | | | | | | | | | | | | | | | |
30
Forest City Enterprises, Inc. Real Estate Portfolio as of January 31, 2012
RESIDENTIAL GROUP - APARTMENTS
| | | | | | | | | | | | | | | | | | | | |
| Name | | Date of Opening/ Acquisition/
Expansion | | Legal Ownership (1) | | | Pro-Rata
Ownership (2) | | | Location | | Leasable
Units(3) | | | Leasable Units
at Pro-Rata % (3) | |
| | | | | | |
Consolidated Apartment Communities | | | | | | | | | | | | | | | | | | | | |
100 Landsdowne Street | | 2005 | | | 100.00% | | | | 100.00% | | | Cambridge, MA | | | 203 | | | | 203 | |
1251 S. Michigan | | 2006 | | | 0.01% | | | | 100.00% | | | Chicago, IL | | | 91 | | | | 91 | |
American Cigar Company | | 2000 | | | 100.00% | | | | 100.00% | | | Richmond, VA | | | 171 | | | | 171 | |
Ashton Mill | | 2005 | | | 100.00% | | | | 100.00% | | | Cumberland, RI | | | 193 | | | | 193 | |
* Botanica Eastbridge | | 2012 | | | 90.00% | | | | 90.00% | | | Denver, CO | | | 118 | | | | 106 | |
Brookview Place | | 1979 | | | 3.00% | | | | 3.00% | | | Dayton, OH | | | 232 | | | | 7 | |
Cameron Kinney | | 2007 | | | 100.00% | | | | 100.00% | | | Richmond, VA | | | 259 | | | | 259 | |
Cedar Place | | 1974 | | | 2.39% | | | | 100.00% | | | Lansing, MI | | | 220 | | | | 220 | |
Consolidated-Carolina | | 2003 | | | 89.99% | | | | 100.00% | | | Richmond, VA | | | 158 | | | | 158 | |
* Continental Building | | 2013 | | | 100.00% | | | | 100.00% | | | Dallas, TX | | | 203 | | | | 203 | |
Cutter’s Ridge at Tobacco Row | | 2006 | | | 100.00% | | | | 100.00% | | | Richmond, VA | | | 12 | | | | 12 | |
Drake | | 1998 | | | 95.05% | | | | 95.05% | | | Philadelphia, PA | | | 284 | | | | 270 | |
Easthaven at the Village | | 1994/1995 | | | 100.00% | | | | 100.00% | | | Beachwood, OH | | | 360 | | | | 360 | |
Emerald Palms | | 1996/2004 | | | 100.00% | | | | 100.00% | | | Miami, FL | | | 505 | | | | 505 | |
Foundry Lofts | | 2011 | | | 100.00% | | | | 100.00% | | | Washington, D.C. | | | 170 | | | | 170 | |
Grand Lowry Lofts | | 2000 | | | 100.00% | | | | 100.00% | | | Denver, CO | | | 261 | | | | 261 | |
Hamel Mill Lofts | | 2008/2010 | | | 90.00% | | | | 100.00% | | | Haverhill, MA | | | 305 | | | | 305 | |
Heritage | | 2002 | | | 100.00% | | | | 100.00% | | | San Diego, CA | | | 230 | | | | 230 | |
Independence Place I | | 1973 | | | 50.00% | | | | 50.00% | | | Parma Heights, OH | | | 202 | | | | 101 | |
Independence Place II | | 2003 | | | 100.00% | | | | 100.00% | | | Parma Heights, OH | | | 201 | | | | 201 | |
Kennedy Biscuit Lofts | | 1990 | | | 3.00% | | | | 100.00% | | | Cambridge, MA | | | 142 | | | | 142 | |
Knolls | | 1995 | | | 1.00% | | | | 95.00% | | | Orange, CA | | | 260 | | | | 247 | |
Lofts 23 | | 2005 | | | 100.00% | | | | 100.00% | | | Cambridge, MA | | | 51 | | | | 51 | |
Lofts at 1835 Arch | | 2001 | | | 95.05% | | | | 95.05% | | | Philadelphia, PA | | | 191 | | | | 182 | |
Lucky Strike | | 2008 | | | 88.98% | | | | 100.00% | | | Richmond, VA | | | 131 | | | | 131 | |
Mercantile Place on Main | | 2008 | | | 100.00% | | | | 100.00% | | | Dallas, TX | | | 366 | | | | 366 | |
Metro 417 | | 2005 | | | 100.00% | | | | 100.00% | | | Los Angeles, CA | | | 277 | | | | 277 | |
Metropolitan | | 1989 | | | 100.00% | | | | 100.00% | | | Los Angeles, CA | | | 270 | | | | 270 | |
Midtown Towers | | 1969 | | | 100.00% | | | | 100.00% | | | Parma, OH | | | 635 | | | | 635 | |
Millender Center | | 1985 | | | 5.57% | | | | 90.56% | | | Detroit, MI | | | 339 | | | | 307 | |
Museum Towers | | 1997 | | | 100.00% | | | | 100.00% | | | Philadelphia, PA | | | 286 | | | | 286 | |
North Church Towers | | 2009 | | | 100.00% | | | | 100.00% | | | Parma Heights, OH | | | 399 | | | | 399 | |
31
Forest City Enterprises, Inc. Real Estate Portfolio as of January 31, 2012
RESIDENTIAL GROUP - APARTMENTS (continued)
| | | | | | | | | | | | | | | | | | | | | | |
| Name | | Date of Opening/ Acquisition/ Expansion | | | Legal Ownership (1) | | | Pro-Rata Ownership (2) | | | Location | | Leasable
Units(3) | | | Leasable Units at Pro-Rata % (3) | |
Consolidated Apartment Communities (continued) | | | | | | | | | | | | | | | | | | | | | | |
One Franklintown | | | 1988 | | | | 100.00% | | | | 100.00% | | | Philadelphia, PA | | | 335 | | | | 335 | |
Parmatown Towers and Gardens | | | 1972-1973 | | | | 100.00% | | | | 100.00% | | | Parma, OH | | | 406 | | | | 406 | |
Pavilion | | | 1992 | | | | 95.00% | | | | 95.00% | | | Chicago, IL | | | 1,114 | | | | 1,058 | |
Perrytown Place | | | 1973 | | | | 8.12% | | | | 100.00% | | | Pittsburgh, PA | | | 231 | | | | 231 | |
Presidio Landmark | | | 2010 | | | | 1.00% | | | | 100.00% | | | San Francisco, CA | | | 161 | | | | 161 | |
Queenswood | | | 1990 | | | | 93.36% | | | | 93.36% | | | Corona, NY | | | 296 | | | | 276 | |
Sky55 | | | 2006 | | | | 100.00% | | | | 100.00% | | | Chicago, IL | | | 411 | | | | 411 | |
Southfield | | | 2002 | | | | 100.00% | | | | 100.00% | | | Whitemarsh, MD | | | 212 | | | | 212 | |
* The Aster Town Center | | | 2012 | | | | 90.00% | | | | 90.00% | | | Denver, CO | | | 85 | | | | 77 | |
Town Center (Botanica on the Green & Crescent Flats) | | | 2004/2007 | | | | 90.00% | | | | 90.00% | | | Denver, CO | | | 298 | | | | 268 | |
Wilson Building | | | 2007 | | | | 100.00% | | | | 100.00% | | | Dallas, TX | | | 135 | | | | 135 | |
| | | | | | | | | | | | | | | | | | |
Consolidated Apartment Communities Subtotal | | | 11,409 | | | | 10,889 | |
| | | | | | | | | | | | | | | | | | |
| | | | | | |
Consolidated Supported-Living Apartments | | | | | | | | | | | | | | | | | | | | | | |
Forest Trace | | | 2000 | | | | 100.00% | | | | 100.00% | | | Lauderhill, FL | | | 322 | | | | 322 | |
| | | | | | | | | | | | | | | | | | |
| | |
Consolidated Apartments Total | | | 11,731 | | | | 11,211 | |
| | | | | | | | | | | | | | | | | | |
32
Forest City Enterprises, Inc. Real Estate Portfolio as of January 31, 2012
RESIDENTIAL GROUP - APARTMENTS (continued)
| | | | | | | | | | | | | | | | | | | | |
| Name | | Date of
Opening/
Acquisition/ Expansion | | Legal
Ownership (1) | | | Pro-Rata
Ownership (2) | | | Location | | Leasable
Units(3) | | | Leasable Units at Pro-Rata % (3) | |
| | | | | | |
Unconsolidated Apartment Communities | | | | | | | | | | | | | | | | | | | | |
^ 8 Spruce Street | | 2011/2012 | | | 35.70% | | | | 51.00% | | | Manhattan, NY | | | 899 | | | | 458 | |
Arbor Glen | | 2001-2007 | | | 50.00% | | | | 50.00% | | | Twinsburg, OH | | | 288 | | | | 144 | |
Barrington Place | | 2008 | | | 49.00% | | | | 49.00% | | | Raleigh, NC | | | 274 | | | | 134 | |
Bayside Village | | 1988-1989 | | | 50.00% | | | | 50.00% | | | San Francisco, CA | | | 862 | | | | 431 | |
Big Creek | | 1996-2001 | | | 50.00% | | | | 50.00% | | | Parma Heights, OH | | | 516 | | | | 258 | |
Camelot | | 1967 | | | 50.00% | | | | 50.00% | | | Parma Heights, OH | | | 151 | | | | 76 | |
Cherry Tree | | 1996-2000 | | | 50.00% | | | | 50.00% | | | Strongsville, OH | | | 442 | | | | 221 | |
Chestnut Lake | | 1969 | | | 50.00% | | | | 50.00% | | | Strongsville, OH | | | 789 | | | | 395 | |
Cobblestone Court Apartments | | 2006-2009 | | | 50.00% | | | | 50.00% | | | Painesville, OH | | | 400 | | | | 200 | |
Colonial Grand | | 2003 | | | 50.00% | | | | 50.00% | | | Tampa, FL | | | 176 | | | | 88 | |
Coppertree | | 1998 | | | 50.00% | | | | 50.00% | | | Mayfield Heights, OH | | | 342 | | | | 171 | |
Deer Run | | 1987-1990 | | | 46.00% | | | | 46.00% | | | Twinsburg, OH | | | 562 | | | | 259 | |
DKLB BKLN | | 2009/2010 | | | 40.80% | | | | 51.00% | | | Brooklyn, NY | | | 365 | | | | 186 | |
Eaton Ridge | | 2002-2004 | | | 50.00% | | | | 50.00% | | | Sagamore Hills, OH | | | 260 | | | | 130 | |
Fenimore Court | | 1982 | | | 7.06% | | | | 50.00% | | | Detroit, MI | | | 144 | | | | 72 | |
Fort Lincoln II | | 1979 | | | 45.00% | | | | 45.00% | | | Washington, D.C. | | | 176 | | | | 79 | |
Fort Lincoln III & IV | | 1981 | | | 24.90% | | | | 24.90% | | | Washington, D.C. | | | 306 | | | | 76 | |
Grand | | 1999 | | | 42.75% | | | | 42.75% | | | North Bethesda, MD | | | 549 | | | | 235 | |
Hamptons | | 1969 | | | 50.00% | | | | 50.00% | | | Beachwood, OH | | | 651 | | | | 326 | |
Hunter’s Hollow | | 1990 | | | 50.00% | | | | 50.00% | | | Strongsville, OH | | | 208 | | | | 104 | |
Legacy Arboretum | | 2008 | | | 49.00% | | | | 49.00% | | | Charlotte, NC | | | 266 | | | | 130 | |
Legacy Crossroads | | 2008-2009 | | | 50.00% | | | | 50.00% | | | Cary, NC | | | 344 | | | | 172 | |
Lenox Club | | 1991 | | | 47.50% | | | | 47.50% | | | Arlington, VA | | | 385 | | | | 183 | |
Lenox Park | | 1992 | | | 47.50% | | | | 47.50% | | | Silver Spring, MD | | | 406 | | | | 193 | |
Liberty Hills | | 1979-1986 | | | 50.00% | | | | 50.00% | | | Solon, OH | | | 396 | | | | 198 | |
Newport Landing | | 2002-2005 | | | 50.00% | | | | 50.00% | | | Coventry Township, OH | | | 336 | | | | 168 | |
Noble Towers | | 1979 | | | 50.00% | | | | 50.00% | | | Pittsburgh, PA | | | 133 | | | | 67 | |
Parkwood Village | | 2001-2002 | | | 50.00% | | | | 50.00% | | | Brunswick, OH | | | 204 | | | | 102 | |
Pine Ridge Valley | | 1967-1974,
2005-2007 | | | 50.00% | | | | 50.00% | | | Willoughby Hills, OH | | | 1,309 | | | | 655 | |
Residences at University Park | | 2002 | | | 40.00% | | | | 40.00% | | | Cambridge, MA | | | 135 | | | | 54 | |
33
Forest City Enterprises, Inc. Real Estate Portfolio as of January 31, 2012
RESIDENTIAL GROUP - APARTMENTS (continued)
| | | | | | | | | | | | | | | | | | | | |
| Name | | Date of
Opening/
Acquisition/ Expansion | | Legal
Ownership (1) | | | Pro-Rata
Ownership (2) | | | Location | | Leasable
Units(3) | | | Leasable Units at Pro-Rata % (3) | |
| | | | | | |
Unconsolidated Apartment Communities (continued) | | | | | | | | | | | | | | | | | | | | |
Settler’s Landing at Greentree | | 2000-2004 | | | 50.00% | | | | 50.00% | | | Streetsboro, OH | | | 408 | | | | 204 | |
Stratford Crossing | | 2007-2010 | | | 50.00% | | | | 50.00% | | | Wadsworth, OH | | | 348 | | | | 174 | |
Surfside Towers | | 1970 | | | 50.00% | | | | 50.00% | | | Eastlake, OH | | | 246 | | | | 123 | |
Sutton Landing | | 2007-2009 | | | 50.00% | | | | 50.00% | | | Brimfield, OH | | | 216 | | | | 108 | |
Tamarac | | 1990-2001 | | | 50.00% | | | | 50.00% | | | Willoughby, OH | | | 642 | | | | 321 | |
Uptown Apartments | | 2008 | | | 50.00% | | | | 50.00% | | | Oakland, CA | | | 665 | | | | 333 | |
Westwood Reserve | | 2002 | | | 50.00% | | | | 50.00% | | | Tampa, FL | | | 340 | | | | 170 | |
Woodgate / Evergreen Farms | | 2004-2006 | | | 33.33% | | | | 33.33% | | | Olmsted Township, OH | | | 348 | | | | 116 | |
Worth Street | | 2003 | | | 50.00% | | | | 50.00% | | | Manhattan, NY | | | 330 | | | | 165 | |
| | | | | | | | | | | | | | | | |
Unconsolidated Apartment Communities Subtotal | | | 15,817 | | | | 7,679 | |
| | | | | | | | | | | | | | | | |
| | | | | | |
Unconsolidated Senior Housing Apartments | | | | | | | | | | | | | | | | | | | | |
| | | | | | |
Autumn Ridge | | 2002 | | | 100.00% | | | | 100.00% | | | Sterling Heights, MI | | | 251 | | | | 251 | |
Bowin | | 1998 | | | 95.05% | | | | 95.05% | | | Detroit, MI | | | 193 | | | | 183 | |
Brookpark Place | | 1976 | | | 100.00% | | | | 100.00% | | | Wheeling, WV | | | 152 | | | | 152 | |
Buckeye Towers | | 1976 | | | 8.94% | | | | 8.94% | | | New Boston, OH | | | 120 | | | | 11 | |
Burton Place | | 2000 | | | 90.00% | | | | 90.00% | | | Burton, MI | | | 200 | | | | 180 | |
Cambridge Towers | | 2002 | | | 100.00% | | | | 100.00% | | | Detroit, MI | | | 250 | | | | 250 | |
Canton Towers | | 1978 | | | 8.94% | | | | 8.94% | | | Canton, OH | | | 199 | | | | 18 | |
Carl D. Perkins | | 2002 | | | 100.00% | | | | 100.00% | | | Pikeville, KY | | | 150 | | | | 150 | |
Connellsville Towers | | 1981 | | | 9.59% | | | | 9.59% | | | Connellsville, PA | | | 111 | | | | 11 | |
Coraopolis Towers | | 2002 | | | 80.00% | | | | 80.00% | | | Coraopolis, PA | | | 200 | | | | 160 | |
Donora Towers | | 2002 | | | 100.00% | | | | 100.00% | | | Donora, PA | | | 103 | | | | 103 | |
Farmington Place | | 1980 | | | 100.00% | | | | 100.00% | | | Farmington, MI | | | 153 | | | | 153 | |
Frenchtown Place | | 1975 | | | 8.12% | | | | 100.00% | | | Monroe, MI | | | 151 | | | | 151 | |
Glendora Gardens | | 1983 | | | 1.99% | | | | 45.51% | | | Glendora, CA | | | 105 | | | | 48 | |
Grove | | 2003 | | | 100.00% | | | | 100.00% | | | Ontario, CA | | | 101 | | | | 101 | |
Lakeland | | 1998 | | | 95.10% | | | | 95.10% | | | Waterford, MI | | | 200 | | | | 190 | |
Lima Towers | | 1977 | | | 8.94% | | | | 8.94% | | | Lima, OH | | | 200 | | | | 18 | |
Miramar Towers | | 1980 | | | 7.98% | | | | 100.00% | | | Los Angeles, CA | | | 157 | | | | 157 | |
34
Forest City Enterprises, Inc. Real Estate Portfolio as of January 31, 2012
RESIDENTIAL GROUP - APARTMENTS (continued)
| | | | | | | | | | | | | | | | | | | | |
| Name | | Date of
Opening/
Acquisition/ Expansion | | Legal
Ownership (1) | | | Pro-Rata
Ownership (2) | | | Location | | Leasable
Units(3) | | | Leasable Units at Pro-Rata % (3) | |
| | | | | |
Unconsolidated Senior Housing Apartments (continued) | | | | | | | | | | | | | | | | | | |
North Port Village | | 1981 | | | 30.60% | | | | 30.60% | | | Port Huron, MI | | | 251 | | | | 77 | |
Nu Ken Tower (Citizen’s Plaza) | | 1981 | | | 8.84% | | | | 50.00% | | | New Kensington, PA | | | 101 | | | | 51 | |
Oceanpointe Towers | | 1980 | | | 7.98% | | | | 100.00% | | | Long Branch, NJ | | | 151 | | | | 151 | |
Panorama Towers | | 1978 | | | 99.00% | | | | 99.00% | | | Panorama City, CA | | | 154 | | | | 152 | |
Park Place Towers | | 1975 | | | 21.79% | | | | 100.00% | | | Mt. Clemens, MI | | | 187 | | | | 187 | |
Pine Grove Manor | | 1973 | | | 9.76% | | | | 100.00% | | | Muskegon Township, MI | | | 172 | | | | 172 | |
Plymouth Square | | 2003 | | | 100.00% | | | | 100.00% | | | Detroit, MI | | | 280 | | | | 280 | |
Potomac Heights Village | | 1981 | | | 7.98% | | | | 100.00% | | | Keyser, WV | | | 141 | | | | 141 | |
Riverside Towers | | 1977 | | | 9.63% | | | | 100.00% | | | Coshocton, OH | | | 100 | | | | 100 | |
Shippan Avenue | | 1980 | | | 100.00% | | | | 100.00% | | | Stamford, CT | | | 148 | | | | 148 | |
St. Mary’s Villa | | 2002 | | | 40.07% | | | | 40.07% | | | Newark, NJ | | | 360 | | | | 144 | |
The Springs | | 1981 | | | 7.98% | | | | 100.00% | | | La Mesa, CA | | | 129 | | | | 129 | |
Tower 43 | | 2002 | | | 100.00% | | | | 100.00% | | | Kent, OH | | | 101 | | | | 101 | |
Towne Centre Place | | 1975 | | | 8.31% | | | | 100.00% | | | Ypsilanti, MI | | | 170 | | | | 170 | |
Village Center | | 1983 | | | 100.00% | | | | 100.00% | | | Detroit, MI | | | 254 | | | | 254 | |
Village Square | | 1978 | | | 100.00% | | | | 100.00% | | | Williamsville, NY | | | 100 | | | | 100 | |
Ziegler Place | | 1978 | | | 100.00% | | | | 100.00% | | | Livonia, MI | | | 141 | | | | 141 | |
| | | | | | | | | | | | | | | | |
Unconsolidated Senior Housing Apartments Subtotal | | | 5,936 | | | | 4,785 | |
| | | | | | | | | | | | | | | | |
| | |
Unconsolidated Apartments Total | | | 21,753 | | | | 12,464 | |
| | | | | | | | | | | | | | | | |
| | |
Combined Apartments Total | | | 33,484 | | | | 23,675 | |
| | | | | | | | | | | | | | | | |
| | |
Federally Subsidized Housing (Total of 5 Buildings) | | | 741 | | | | | |
| | | | | | | | | | | | | | | | | | | | |
| | |
Total Apartment Units at January 31, 2012 | | | 34,225 | | | | | |
| | | | | | | | | | | | | | | | | | | | |
Total Apartment Units at January 31, 2011 | | | 34,355 | | | | | |
| | | | | | | | | | | | | | | | | | | | |
35
Forest City Enterprises, Inc. Real Estate Portfolio as of January 31, 2012
RESIDENTIAL GROUP - MILITARY HOUSING
| | | | | | | | | | | | | | | | | | |
| Name | | Date of
Opening/
Acquisition/ Expansion | | | Legal
Ownership (1) | | | Pro-Rata
Ownership (2) | | | Location | | Leasable Units(3) | |
| | | | | |
Unconsolidated Military Housing^ | | | | | | | | | | | | | | | | | | |
Air Force Academy | | | 2007-2011 | | | | 50.00% | | | | 50.00% | | | Colorado Springs, CO | | | 427 | |
* Hawaii Phase IV | | | 2007-2014 | | | | 1.00% | | | | ^^ | | | Kaneohe, HI | | | 1,141 | |
Marines, Hawaii Increment II | | | 2007-2011 | | | | 1.00% | | | | ^^ | | | Honolulu, HI | | | 1,175 | |
Midwest Millington | | | 2008-2011 | | | | 1.00% | | | | ^^ | | | Memphis, TN | | | 318 | |
Navy, Hawaii Increment III | | | 2007-2011 | | | | 1.00% | | | | ^^ | | | Honolulu, HI | | | 2,520 | |
Navy Midwest | | | 2006-2011 | | | | 1.00% | | | | ^^ | | | Chicago, IL | | | 1,401 | |
Ohana Military Communities, Hawaii Increment I | | | 2005-2008 | | | | 1.00% | | | | ^^ | | | Honolulu, HI | | | 1,952 | |
Pacific Northwest Communities | | | 2007-2011 | | | | 20.00% | | | | ^^ | | | Seattle, WA | | | 2,985 | |
Southern Group: | | | | | | | | | | | | | | | | | | |
* Arnold Air Force Base | | | 2011-2013 | | | | 100.00% | | | | ^^^ | | | Tullahoma, TN | | | 22 | |
* Joint Base Charleston | | | 2011-2013 | | | | 100.00% | | | | ^^^ | | | Charleston, SC | | | 345 | |
* Keesler Air Force Base | | | 2011-2012 | | | | 100.00% | | | | ^^^ | | | Biloxi, MS | | | 1,188 | |
* Shaw Air Force Base | | | 2011-2015 | | | | 100.00% | | | | ^^^ | | | Sumter, SC | | | 630 | |
| | | | | | | | | | | | | | | | | | |
Unconsolidated Military Housing Total | | | 14,104 | |
| | | | | | | | | | | | | | | | | | |
| |
Total Military Housing Units at January 31, 2012 | | | 14,104 | |
| | | | | | | | | | | | | | | | | | |
Total Military Housing Units at January 31, 2011 | | | 11,919 | |
| | | | | | | | | | | | | | | | | | |
| (1) | Legal ownership percentage represents our actual equity ownership percentage and reflects the percentage of income or loss allocation we expect to receive after settlement of any preferred returns which we or our partners may be entitled to in accordance with the applicable agreements. |
| (2) | Pro-Rata ownership percentage represents the percentage of income or loss allocation we expect to receive prior to the settlement of any preferred returns which we or our partners may be entitled to in accordance with the applicable agreements. After settlement of the preferred returns, it is expected that our capital balance would be proportionate to our legal ownership. |
| (3) | Leaseable units represent 100% of the leasable units in the apartment community. Leasable units at Pro-Rata % represents the total leasable units multiplied by the Pro-Rata ownership percent. |
| * | Property under construction as of January 31, 2012. |
| ++ | Propertys old subsequent to January 31, 2012. |
| ^ | Property to open in phases . |
| ^^ | Our share of residual cash flow ranges from 0-20% during the life cycle of the project. |
| ^^^ | We do not share in any cash flow from operations . However, we are entitled to the return of our equity at the end of the 50-year lease term. |
36
Item 3. Legal Proceedings
The Company is involved in various claims and lawsuits incidental to its business, and management and legal counsel believe that these claims and lawsuits will not have a material adverse effect on the Company’s consolidated financial statements.
Item 4. Mine Safety Disclosures
Not applicable.
Pursuant to General Instruction G of Form 10-K, the following is included as an unnumbered item to Part I of the Form 10-K.
Executive Officers of the Registrant
The following list is included in Part I of this Report in lieu of being included in the Proxy Statement for the Annual Meeting of Shareholders to be held on June 13, 2012. The names and ages of and positions held by the executive officers of the Company are presented in the following list. Each individual has been appointed to serve for the period which ends on the date of the Annual Meeting of Shareholders to be held on June 13, 2012.
| | | | |
Name | | Age | | Current Position |
Charles A. Ratner(1) | | 70 | | Chairman of the Board of Directors |
David J. LaRue | | 50 | | Chief Executive Officer, President and Director |
Bruce C. Ratner(1) | | 67 | | Executive Vice President and Director |
James A. Ratner(1) | | 67 | | Executive Vice President and Director |
Ronald A. Ratner(1) | | 64 | | Executive Vice President and Director |
Brian J. Ratner(1) | | 54 | | Executive Vice President and Director |
Robert G. O’Brien | | 54 | | Executive Vice President and Chief Financial Officer |
Linda M. Kane | | 54 | | Senior Vice President and Treasurer |
Charles D. Obert | | 46 | | Senior Vice President, Chief Accounting Officer and Corporate Controller |
Andrew J. Passen | | 63 | | Executive Vice President, Human Resources |
Geralyn M. Presti | | 56 | | Senior Vice President, General Counsel and Secretary |
| | • | | Charles A. Ratner has been Chairman of the Board of Directors since June 2011. He previously served as Chief Executive Officer from June 1995 to June 2011, President from June 1993 to June 2011, Chief Operating Officer from June 1993 to June 1995 and Executive Vice President prior to June 1993. |
| | • | | David J. LaRue has been Chief Executive Officer and President since June 2011. He previously served as Executive Vice President and Chief Operating Officer from March 2010 to June 2011 and President and Chief Operating Officer of Forest City’s Commercial Group since 2003. |
| | • | | Bruce C. Ratner has been Executive Vice President since November 2006. He has been Chief Executive Officer of Forest City Ratner Companies, a subsidiary of the Company, since 1987. |
| | • | | James A. Ratner has been Executive Vice President since March 1988. |
| | • | | Ronald A. Ratner has been Executive Vice President since March 1988. |
| | • | | Brian J. Ratner has been Executive Vice President since June 2001. |
| | • | | Robert G. O’Brien has been Executive Vice President and Chief Financial Officer since April 2008. He previously served as Vice President, Finance and Investment from February 2008 to April 2008 and Executive Vice President, Strategy and Investment, of Forest City Rental Properties Corporation, a subsidiary of the Company, from October 2000 to January 2008. |
| | • | | Linda M. Kane has been Treasurer since September 2011 and Senior Vice President since June 2002. She previously served as Chief Accounting and Administrative Officer from December 2007 to September 2011, Corporate Controller from March 1995 to December 2007 and Vice President from March 1995 to June 2002. |
| | • | | Charles D. Obert has been Chief Accounting Officer and Senior Vice President since September 2011 and Vice President and Corporate Controller since December 2007. He previously served as Vice President and Assistant Controller from August 2004 to December 2007. |
| | • | | Andrew J. Passen has been Executive Vice President, Human Resources since April 2006. |
| | • | | Geralyn M. Presti has been Senior Vice President and General Counsel since July 2002 and Secretary since April 2008. She previously served as Assistant Secretary from July 2002 to April 2008, Deputy General Counsel from January 2000 to June 2002, and Associate General Counsel from December 1996 to January 2000. |
| | (1) | Charles A. Ratner, James A. Ratner and Ronald A. Ratner are brothers. Bruce C. Ratner is first cousin to Charles A. Ratner, James A. Ratner, Ronald A. Ratner and Joan Shafran, a Director of the Company. Brian Ratner is brother to Deborah Ratner-Salzberg, a Director of the Company. |
37
PART II
Item 5. Market for Registrant’s Common Equity, Related Stockholder Matters and Issuer Purchases of Equity Securities
The Company’s Class A and Class B common stock are traded on the New York Stock Exchange (“NYSE”) under the symbols FCEA and FCEB, respectively. At January 31, 2012 and 2011, the market price of the Company’s Class A common stock was $13.13 and $16.91, respectively, and the market price of the Company’s Class B common stock was $13.17 and $16.77, respectively. As of February 29, 2012, the number of registered holders of Class A and Class B common stock was 1,064 and 425, respectively.
The following tables summarize the quarterly high and low sales prices per share of the Company’s Class A and Class B common stock as reported by the NYSE and the dividends declared per common share:
| | | | | | | | | | | | | | | | |
| | | Quarter Ended | |
| | | January 31,
2012 | | | October 31,
2011 | | | July 31,
2011 | | | April 30,
2011 | |
| | | | | |
Market price range of common stock | | | | | | | | | | | | | | | | |
Class A | | | | | | | | | | | | | | | | |
High | | $ | 14.00 | | | $ | 17.82 | | | $ | 19.24 | | | $ | 19.26 | |
Low | | $ | 10.88 | | | $ | 9.76 | | | $ | 17.78 | | | $ | 17.30 | |
Class B | | | | | | | | | | | | | | | | |
High | | $ | 13.92 | | | $ | 17.77 | | | $ | 19.17 | | | $ | 19.26 | |
Low | | $ | 10.85 | | | $ | 9.78 | | | $ | 17.66 | | | $ | 17.27 | |
Quarterly dividends declared per common share Class A and Class B(1) | | $ | - | | | $ | - | | | $ | - | | | $ | - | |
| |
| | | Quarter Ended | |
| | | January 31,
2011 | | | October 31,
2010 | | | July 31,
2010 | | | April 30,
2010 | |
| | | | | |
Market price range of common stock | | | | | | | | | | | | | | | | |
Class A | | | | | | | | | | | | | | | | |
High | | $ | 16.98 | | | $ | 14.63 | | | $ | 15.70 | | | $ | 16.10 | |
Low | | $ | 14.78 | | | $ | 11.05 | | | $ | 11.01 | | | $ | 10.70 | |
Class B | | | | | | | | | | | | | | | | |
High | | $ | 16.95 | | | $ | 14.60 | | | $ | 15.78 | | | $ | 16.02 | |
Low | | $ | 14.70 | | | $ | 11.04 | | | $ | 10.97 | | | $ | 10.68 | |
Quarterly dividends declared per common share Class A and Class B(1) | | $ | - | | | $ | - | | | $ | - | | | $ | - | |
| (1) | The payment of future dividends will depend upon such factors as earnings, capital requirements and financial condition of the Company. The Company has the ability to pay cash dividends, but does not anticipate doing so due to its current capital strategy. Retained earnings of $24,000,000 were available for payment of dividends as of January 31, 2012 under the restrictions contained in the revolving credit facility as amended July 13, 2011, which removed the previous prohibition on paying common stock dividends. |
For the three months ended January 31, 2012, there were no unregistered issuances or repurchases of stock.
38
The following graph shows a comparison of cumulative total return for the period from January 31, 2007 through January 31, 2012 among the Company’s Class A Common Stock (FCEA) and Class B Common Stock (FCEB), Standard & Poor’s 500 Stock Index (“S&P 500®”) and the Dow Jones U.S. Real Estate Index. The cumulative total return is based on a $100 investment on January 31, 2007 and the subsequent change in market prices of the securities at each respective fiscal year end. It also assumes that dividends were reinvested quarterly.
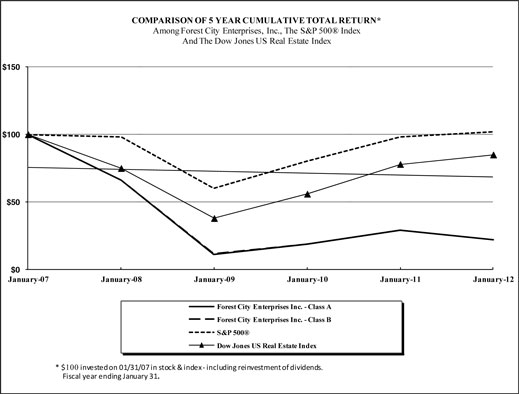
| | | | | | | | | | | | |
| | | Jan-07 | | Jan-08 | | Jan-09 | | Jan-10 | | Jan-11 | | Jan-12 |
Forest City Enterprises Inc. Class A | | $100 | | $66 | | $11 | | $19 | | $29 | | $22 |
Forest City Enterprises Inc. Class B | | $100 | | $66 | | $12 | | $19 | | $29 | | $22 |
S&P 500® | | $100 | | $98 | | $60 | | $80 | | $98 | | $102 |
Dow Jones US Real Estate Index | | $100 | | $75 | | $38 | | $56 | | $78 | | $85 |
For information with respect to securities authorized for issuance under equity compensation plans, see “Item 12. Security Ownership of Certain Beneficial Owners and Management and Related Stockholder Matters.”
39
Item 6. Selected Financial Data
The Operating Results and per share amounts presented below have been reclassified for properties disposed of and/or classified as held for sale during the years ended January 31, 2012, 2011, 2010, 2009 and 2008. The following data should be read in conjunction with our financial statements and notes thereto and Management’s Discussion and Analysis of Financial Condition and Results of Operations (“MD&A”) included elsewhere in this Form 10-K. Our historical operating results may not be comparable to our future operating results.
| | | $000,000,000 | | | | $000,000,000 | | | | $000,000,000 | | | | $000,000,000 | | | | $000,000,000 | |
| | | Years Ended January 31, | |
| | | 2012 | | | 2011 | | | 2010 | | | 2009 | | | 2008 | |
| | | | |
| | | (in thousands, except share and per share data) | |
Operating Results: | | | | | | | | | | | | | | | | | | | | |
Total revenues from real estate operations(1) | | $ | 1,089,977 | | | $ | 1,117,649 | | | $ | 1,193,970 | | | $ | 1,210,482 | | | $ | 1,211,017 | |
| | | | |
| | | | | |
Earnings (loss) from continuing operations attributable to Forest City Enterprises, Inc.(1) | | $ | (109,818 | ) | | $ | 79,940 | | | $ | (14,208 | ) | | $ | (121,748 | ) | | $ | (15,352 | ) |
Earnings (loss) from discontinued operations attributable to Forest City Enterprises, Inc.(1) | | | 23,332 | | | | (21,892 | ) | | | (12,770 | ) | | | 12,174 | | | | 64,538 | |
| | | | |
Net earnings (loss) attributable to Forest City Enterprises, Inc. | | $ | (86,486 | ) | | $ | 58,048 | | | $ | (26,978 | ) | | $ | (109,574 | ) | | $ | 49,186 | |
| | | | |
| | | | | |
Diluted Earnings per Common Share: | | | | | | | | | | | | | | | | | | | | |
Earnings (loss) from continuing operations attributable to Forest City Enterprises, Inc.(1) | | $ | (0.74 | ) | | $ | 0.43 | | | $ | (0.10 | ) | | $ | (1.18 | ) | | $ | (0.15 | ) |
Earnings (loss) from discontinued operations attributable to Forest City Enterprises, Inc.(1) | | | 0.13 | | | | (0.13 | ) | | | (0.09 | ) | | | 0.11 | | | | 0.62 | |
| | | | |
Net earnings (loss) attributable to Forest City Enterprises, Inc. | | $ | (0.61 | ) | | $ | 0.30 | | | $ | (0.19 | ) | | $ | (1.07 | ) | | $ | 0.47 | |
| | | | |
| | | | | |
Weighted Average Diluted Shares Outstanding | | | 168,170,650 | | | | 173,437,886 | | | | 139,825,349 | | | | 102,755,315 | | | | 102,261,740 | |
| | | | |
| | | | | |
Cash Dividend Declared per share-Class A and B Common Stock | | $ | - | | | $ | - | | | $ | - | | | $ | 0.24 | | | $ | 0.31 | |
| | | | |
| | | $000,00,00,00 | | | | $000,00,00,00 | | | | $000,00,00,00 | | | | $000,00,00,00 | | | | $000,00,00,00 | |
| | | January 31, | |
| | | 2012 | | | 2011 | | | 2010 | | | 2009 | | | 2008 | |
| | | | |
| | | (in thousands) | |
Financial Position: | | | | | | | | | | | | | | | | | | | | |
Consolidated assets | | $ | 10,504,283 | | | $ | 12,059,701 | | | $ | 12,174,177 | | | $ | 11,658,162 | | | $ | 10,449,267 | |
Real estate, at cost | | $ | 9,589,725 | | | $ | 11,166,539 | | | $ | 11,340,779 | | | $ | 10,648,573 | | | $ | 9,225,753 | |
Long-term debt, primarily nonrecourse mortgages and notes payable | | $ | 6,698,052 | | | $ | 8,118,053 | | | $ | 8,779,813 | | | $ | 8,457,471 | | | $ | 7,359,718 | |
| | (1) | This category is adjusted for discontinued operations. See the “Discontinued Operations” section of the MD&A in Item 7. |
Item 7. Management’s Discussion and Analysis of Financial Condition and Results of Operations
Corporate Description
We principally engage in the ownership, development, management and acquisition of commercial and residential real estate and land throughout the United States. We operate through three strategic business units and five reportable segments. TheCommercial Group, our largest strategic business unit, owns, develops, acquires and operates regional malls, specialty/urban retail centers, office and life science buildings, hotels and mixed-use projects. TheResidential Group owns, develops, acquires and operates residential rental properties, including upscale and middle-market apartments and adaptive re-use developments. Additionally, the Residential Group develops for-sale condominium projects and also owns interests in entities that develop and manage military family housing. TheLand Development Group acquires and sells both land and developed lots to residential, commercial and industrial customers. It also owns and develops land into master-planned communities and mixed-use projects. As of January 31, 2012, our Board of Directors approved a strategic decision by senior management to reposition or divest significant portions of our Land Development Group and are actively reviewing alternatives to do so. See further discussion under “Land Development Group” in this section.
Corporate Activities andThe Nets, a member of the National Basketball Association (“NBA”) in which we account for our investment on the equity method of accounting, are other reportable segments of ours.
We have approximately $10.5 billion of consolidated assets in 28 states and the District of Columbia at January 31, 2012. Our core markets include Boston, Chicago, Dallas, Denver, Los Angeles, New York, Philadelphia, the Greater San Francisco metropolitan area and the Greater Washington D.C. metropolitan area. We have offices in Albuquerque, Boston, Chicago, Dallas, Denver, London (England), Los Angeles, New York City, San Francisco, Washington, D.C., and our corporate headquarters in Cleveland, Ohio.
40
Significant milestones occurring during 2011 included:
| | • | | Former CEO Charles A. Ratner becoming Chairman of the Board, succeeded as President and CEO by David J. LaRue, previously Executive Vice President and COO. The changes were part of the Company’s succession planning process and became effective following our Annual Meeting of Shareholders on June 10, 2011; |
| | • | | Entering into joint venture agreements with an outside partner, an affiliated entity of Madison International Realty LLC. The outside partner invested in a total of 15 retail properties located in the New York City metropolitan area generating gross proceeds of $178,286,000. The outside partner received a 49% equity interest in 15 mature retail properties, 14 of which were formerly wholly-owned by us and one retail property that was owned 75% by us; |
| | • | | The sale of two parcels of land, with air rights, to Rock Ohio Caesars Cleveland, LLC (“Rock Ohio”) for development of a casino in downtown Cleveland. The sales price of one parcel and air rights was $45,000,000 and the sales price of the second parcel and air rights was $40,000,000. The land is adjacent to ourTower City Center mixed-use complex; |
| | • | | The signing of a lease agreement with Rock Ohio for space in theHigbee Buildingin downtown Cleveland. Rock Ohio plans to use the space for Phase I of its new casino. The five-year lease, which includes extension options, is for approximately 303,000 square feet of space on the concourse level and first, second and third floors of the building; |
| | • | | The sale ofWaterfront Station – East 4th & West 4th Buildings, office buildings in Washington, D.C. for a sales price of $356,000,000. The sale generated net cash proceeds of $61,490,000; |
| | • | | The sale of theCharleston Marriotthotel in Charleston, West Virginia, for a sales price of $25,500,000. The sale generated net cash proceeds of approximately $7,500,000; |
| | • | | The sale of the Ritz-Carltonhotel in Cleveland, Ohio, for a sales price of $36,500,000. The sale generated net cash proceeds of approximately $31,000,000; |
| | • | | The sale of our 50% interest inMetropolitan Lofts, a 264 unit apartment community in Los Angeles, California, to the other 50% partner. The price reflects a total property value of $73,600,000. The sale generated net cash proceeds of approximately $13,200,000; |
| | • | | The phased-in opening of8 Spruce Street, an apartment community in Manhattan, New York. As of January 31, 2012 leases have been signed for 610 units of the total 899 units for the project; |
| | • | | The phased-in opening ofWestchester’s Ridge Hill, a retail center in Yonkers, New York. As of January 31, 2012 we have opened approximately 424,000 square feet of the total 1,336,000 square feet. Tenants opening during 2011 included Charming Charlie, The Cheesecake Factory, Cinema de Lux, Desigual, Dick’s Sporting Goods, Gap, Guitar Center, H&M, L.L.Bean, Old Navy, Orvis, REI, Sephora, Sur La Table, Texas de Brazil, Whole Foods Market, Yard House and WESTMED Medical Group, the retail center’s anchor office tenant; |
| | • | | The opening ofFoundry Lofts, a 170 unit apartment community atThe Yards, Washington, D.C.’s up-and-coming urban development in the Capitol Riverfront area. The property is an adaptive reuse of a historic industrial building and opened with 50% of units preleased; |
| | • | | Closing on a new $450,000,000 revolving credit facility with a 14 member bank group. The three-year facility, with an additional one-year extension option, originally closed on March 30, 2011 with a $425,000,000 borrowing capacity. Subsequently, in April 2011, an accordion feature was exercised increasing the total borrowing capacity to $450,000,000; |
| | • | | The issuance, at par, of $350,000,000 aggregate principal amount of our 4.25% Convertible Senior Notes due August 2018 (“2018 Senior Notes”). Interest on the notes is payable semi-annually at a rate of 4.25% per annum. We received cash proceeds of approximately $339,375,000 net of estimated offering expenses; |
| | • | | Closing on the privately negotiated exchange of $40,000,000 aggregate principal amount of our 5.00% Convertible Senior Notes due 2016 (“2016 Senior Notes”) for a total of 3,444,293 shares of our Class A common stock; |
41
| | • | | Recapitalization and modified credit facilities for8 Spruce Street andDKLB BKLNan apartment community in Brooklyn, New York. For8 Spruce Street, our 30% equity partner in the project converted its $110,000,000 of mezzanine debt to equity, increasing its equity ownership to 49%. We also modified the property’s existing nonrecourse financing, whereby the credit facility was reduced from $605,000,000 to $539,000,000 and the maturity was extended through July 1, 2016. These changes reduce total available debt on the property from $715,000,000 to $539,000,000 and our pro-rata share of the debt from approximately $500,000,000 to $275,000,000. ForDKLB BKLN, the holder of $30,000,000 mezzanine debt converted its mezzanine debt to a 49% equity interest in the property. We also modified the property’s existing bank financing, whereby the balance was reduced from $117,000,000 to $104,000,000 and the maturity was extended through July 3, 2013. These changes reduce total debt on the property from $147,000,000 to $104,000,000 and our pro-rata share of the debt from approximately $147,000,000 to $53,000,000; |
| | • | | Commencing construction of theContinental Building, a 203 unit apartment community in Dallas, Texas, following the closing of the $28,109,000 mortgage loan; |
| | • | | Commencing construction ofThe Aster Town Center, a 85 unit apartment community andBotanica Eastbridge, a 118 unit apartment community, at our Stapleton project in Denver, Colorado; |
| | • | | Commencing construction on theThe Yards - Boilermaker Shops, an adaptive reuse property in Washington, D.C. that will include 40,000 square feet of ground-level retail and mezzanine office space. The property was 74% preleased as of January 31, 2012; |
| | • | | Forest City Military Communities and the U.S. Air Force, through the Air Force Center for Engineering and the Environment, closing a 50-year housing privatization agreement for the development and management of 2,185 family homes at four U.S. Air Force bases in the Southeast, bringing Forest City’s military managed housing portfolio to more than 14,000 homes; |
| | • | | Being selected as developer by the Port of San Francisco for Pier 70’s 25-acre waterfront site. Pier 70 is a 69-acre historic marine industrial area on San Francisco’s central waterfront, located immediately south of Mission Bay. Plans call for the site to be redeveloped over a multiyear period to meet the Port’s master plan goals for new development, historic preservation, and the creation of waterfront open space; |
| | • | | The selection by the Georgia Department of Transportation to lead a project team in the development of a new multi-modal transportation hub in downtown Atlanta. We will be responsible for fee-based master planning for the project which will be developed on a 119-acre site; and |
| | • | | Closing $1,193,693,000 in nonrecourse mortgage financing transactions. |
In addition, subsequent to January 31, 2012, we achieved the following significant milestones:
| | • | | The announcement that our Board of Directors has determined to reduce the authorized size of the Board from fifteen authorized seats to thirteen, effective with our Annual Meeting of Shareholders in June 2012 (“Annual Meeting”). Two non-independent directors, James A. Ratner and Joan K. Shafran, will complete their current terms and will not be re-nominated at the Annual Meeting. This planned change will allow for the election or appointment of an independent director, once a suitable candidate is identified, and to have the composition of our Board change to a majority of independent directors; |
| | • | | The sale ofQuebec Square, a specialty retail center in Denver, Colorado for a sales price of $34,250,000. The sale generated net cash proceeds of approximately $8,000,000. The disposition of this specialty retail center is part of our retail strategy to divest non-core products; |
| | • | | The dedication of the newly completed Las Vegas City Hall, which we developed for the City of Las Vegas on a fee basis as part of a public-private partnership; and |
| | • | | Addressing $161,232,000 of nonrecourse mortgage debt financings that would have matured during the year ended January 31, 2013, through closed transactions, commitments and/or automatic extensions. |
42
Critical Accounting Policies
Our consolidated financial statements include all majority-owned subsidiaries where we have financial or operational control and variable interest entities (“VIEs”) where we are deemed to be the primary beneficiary. The preparation of consolidated financial statements in conformity with accounting principles generally accepted in the United States of America requires us to make estimates and assumptions in certain circumstances that affect amounts reported in the accompanying consolidated financial statements and related notes. In preparing these financial statements, we have identified certain critical accounting policies which are subject to judgment and uncertainties. We have used our best judgment to determine estimates of certain amounts included in the financial statements as a result of these policies, giving due consideration to materiality. As a result of uncertainties surrounding these events at the time the estimates are made, actual results could differ from these estimates causing adjustments to be made in subsequent periods to reflect more current information. The accounting policies that we believe contain uncertainties that are considered critical to understanding the consolidated financial statements are discussed below. Our management reviews and discusses the policies below on a regular basis. These policies have also been discussed with our audit committee of the Board of Directors.
Revision of Prior Period Financial Statements
Historically, we wrote-off specific development projects when management determined it was probable the specific project would not be developed. In addition, we recorded an allowance for estimated project write-offs for projects under development that had not yet been abandoned (the “Allowance”). We have reconsidered the historical accounting policy related to the Allowance. We determined that recording the Allowance was not in accordance with ASC 970-360-40 (Real Estate – Abandonments) and concluded that the reserve should be removed (“Allowance Revision”). The impact of the Allowance Revision was an understatement of operating expenses of $1,000,000 ($612,000 after tax) and an overstatement of operating expenses of $6,000,000 ($3,673,000 after tax) for the years ended January 31, 2011 and 2010, respectively, an overstatement of accounts payable, accrued expenses and other liabilities of $22,786,000 and an understatement of deferred income tax liability of $8,837,000 as of January 31, 2011 and a $10,888,000 understatement of retained earnings as of January 31, 2009. For the year ended January 31, 2011, basic earnings per common share from continuing operations decreased from $.43 to $.42. For the year ended January 31, 2010, basic and diluted loss from continuing operations per common share decreased from $ (.13) to $ (.10), and basic and diluted net loss per common share decreased from $ (.22) to $ (.19) as a result of the Allowance Revision. We assessed the materiality of this error on prior periods’ financial statements in accordance with ASC 250 (SEC’s Staff Accounting Bulletin No. 99, Materiality), and concluded that the error was not material to any prior annual or interim periods but the cumulative adjustment necessary to remove the Allowance would be material if the correction was recorded during the year ended January 31, 2012. Accordingly, in accordance with ASC 250 (SEC Staff Accounting Bulletin No. 108, “Considering the Effects of Prior Year Misstatements when Quantifying Misstatements in Current Year Financial Statements,”), the financial statements as of January 31, 2011 and the two years then ended presented herein, the three quarters ended October 31, 2011, and the four quarters of the year ended January 31, 2010 presented in the Quarterly Consolidated Financial Data have been revised to correct the error.
Fiscal Year – The years 2011, 2010 and 2009 refer to the fiscal years ended January 31, 2012, 2011 and 2010, respectively.
Recognition of Revenue
Real Estate Sales– The specific timing of a sale transaction and recognition of profit is measured against various criteria in the real estate sales accounting guidance covering the terms of the transaction and any continuing involvement in the form of management or financial assistance associated with the property. If the sales criteria are not met, we defer gain recognition and account for the transaction by applying the deposit, finance, installment or cost recovery methods, as appropriate.
Consolidated operating properties that have been sold or determined to be held for sale are reported as discontinued operations. We consider assets held for sale when the transaction has been approved by management and there are no significant contingencies related to the sale that may prevent the transaction from closing. In most transactions, these contingencies are not satisfied until the actual closing and, accordingly, the property is not identified as held for sale until the closing actually occurs. However, each potential sale is evaluated based on its separate facts and circumstances.
Leasing Operations– We enter into leases with tenants in our rental properties. The lease terms of tenants occupying space in the retail centers and office buildings generally range from 1 to 30 years, excluding leases with certain anchor tenants, which typically run longer. Minimum rents are recognized on a straight-line basis over the non-cancelable term of the related lease, which include the effects of rent steps and rent abatements under the leases. Overage rents are recognized only after the contingency has been removed (i.e., sales thresholds have been achieved). Recoveries from tenants for taxes, insurance and other commercial property operating expenses are recognized as revenues in the period the applicable costs are incurred.
Construction– Revenues and profit on long-term fixed-price contracts are recorded using the percentage-of-completion method. Revenues on reimbursable cost-plus fee contracts are recorded in the amount of the accrued reimbursable costs plus proportionate fees at the time the costs are incurred.
Military Housing Fee Revenues– Development fees related to military housing projects are earned based on a contractual percentage of the actual development costs incurred. Additional development incentive fees are recognized based upon successful completion of criteria, such as incentives to realize development cost savings, encourage small and local business participation, comply with specified safety standards and other project management incentives as specified in the development agreements.
Construction management fees are earned based on a contractual percentage of the actual construction costs incurred. Additional construction incentive fees are recognized based upon successful completion of certain criteria as set forth in the construction contracts.
Property management and asset management fees are earned based on a contractual percentage of the annual net rental income and annual operating income, respectively, that is generated by the military housing privatization projects as defined in the agreements. Additional property management incentive fees are recognized based upon successful completion of certain criteria as set forth in the property management agreements.
43
Recognition of Costs and Expenses
Operating expenses primarily represent the recognition of operating costs, which are charged to operations as incurred, administrative expenses and taxes other than income taxes. Interest expense and real estate taxes during active development and construction are capitalized as a part of the project cost.
Depreciation and amortization is generally computed on a straight-line method over the estimated useful life of the asset. The estimated useful lives of buildings and certain first generation tenant allowances that are considered by management as a component of the building are primarily 50 years. Subsequent tenant improvements and those first generation tenant allowances not considered a component of the building are amortized over the life of the tenant’s lease. This estimated life is based on the length of time the asset is expected to generate positive operating cash flows. Actual events and circumstances can cause the life of the building and tenant improvement to be different than the estimates made. Additionally, lease terminations can affect the economic life of the tenant improvements.
Major improvements and tenant improvements that are considered to be our assets are capitalized in real estate costs and expensed through depreciation charges. Tenant improvements that are considered lease inducements are capitalized into other assets and amortized as a reduction of rental revenues over the life of the tenant’s lease. Repairs, maintenance and minor improvements are expensed as incurred.
A variety of costs are incurred in the development and leasing of properties. After determination is made to capitalize a cost, it is allocated to the specific component of a project that is benefited. Determination of when a development project is substantially complete and capitalization must cease involves judgment. Our capitalization policy on development properties is based on accounting guidance for the capitalization of interest cost and accounting guidance for costs and the initial rental operations of real estate properties. The costs of land and buildings under development include specifically identifiable costs. The capitalized costs include pre-construction costs essential to the development of the property, development costs, construction costs, interest costs, real estate taxes, salaries and related costs and other costs incurred during the period of development. We consider a construction project as substantially complete and held available for occupancy upon the completion of tenant improvements, but no later than one year from cessation of major construction activity. We cease capitalization on any portion substantially completed and occupied or held available for occupancy, and capitalize only those costs associated with the portion under construction. Costs and accumulated depreciation applicable to assets retired or sold are eliminated from the respective accounts and any resulting gains or losses are reported in the Consolidated Statements of Operations.
Acquisition of Rental Properties – Upon acquisition of a rental property, the purchase price of the property is allocated to net tangible and identified intangible assets acquired based on fair values. Above-market and below-market in-place lease values for acquired properties are recorded based on the present value (using an interest rate which reflects the risks associated with the leases acquired) of the difference between (i) the contractual amounts to be paid pursuant to the in-place leases and (ii) our estimate of the fair market lease rates for the corresponding in-place leases, measured over a period equal to the remaining non-cancelable term of the lease. Capitalized above-market lease values are amortized as a reduction of rental revenues (or rental expense for ground leases in which we are the lessee) over the remaining non-cancelable terms of the respective leases. Capitalized below-market lease values are amortized as an increase to rental revenues (or rental expense for ground leases in which we are the lessee) over the remaining non-cancelable terms of the respective leases, including any fixed-rate renewal periods that are probable of being exercised. For our below market lease and in-place lease intangibles that remain at January 31, 2012 and 2011, there were no fixed rate renewal periods associated with these leases that we deemed probable of renewal and included in the calculation of the intangible asset value or related amortization period.
Intangible assets also include amounts representing the value of tenant relationships and in-place leases based on our evaluation of each tenant’s lease and our overall relationship with the respective tenant. We estimate the cost to execute leases with terms similar to in-place leases, including leasing commissions, legal expenses and other related expenses. This intangible asset is amortized to expense over the remaining term of the respective lease. Our estimates of value are made using methods similar to those used by independent appraisers or by using independent appraisals. Factors considered by us in this analysis include an estimate of the carrying costs during the expected lease-up periods, current market conditions and costs to execute similar leases. In estimating carrying costs, we include real estate taxes, insurance and other operating expenses and estimates of lost rentals at market rates during the expected lease-up periods, which primarily range from three to twelve months. We also consider information obtained about each property as a result of our pre-acquisition due diligence, marketing and leasing activities in estimating the fair value of the tangible and intangible assets acquired. We also use the information obtained as a result of our pre-acquisition due diligence as part of considering any conditional asset retirement obligations, and when necessary, will record a conditional asset retirement obligation as part of our purchase price.
44
When calculating the estimated value to assign to a tenant relationship intangible asset, we estimate the likelihood that a lessee will execute a lease renewal and other factors relative to the relationship. In determining the likelihood of lease renewal, we utilize a probability weighted model based on many factors. Other qualitative factors related to the relationship that we consider include, but are not limited to the nature and extent of the business relationship with the tenant, growth prospects for developing new business with the tenant and the tenant’s credit quality. The value of tenant relationship intangibles is amortized over the remaining initial lease term and expected renewals, but in no event longer than the remaining depreciable life of the building. The value of in-place leases is amortized over the remaining non-cancelable term of the respective leases and any fixed-rate renewal periods that are deemed probable.
In the event that a tenant terminates its lease, the unamortized portion of each intangible asset, including market rate adjustments, in-place lease values and tenant relationship values, would be charged to expense.
Allowance for Doubtful Accounts and Reserves on Notes Receivable – We record allowances against our rent receivables from tenants and other receivables that we consider uncollectible. These allowances are based on management’s estimate of receivables that will not be realized from cash receipts in subsequent periods. We also maintain an allowance for receivables arising from the straight-lining of rents. This receivable arises from earnings recognized in excess of amounts currently due under the lease agreements. Management exercises judgment in establishing these allowances and considers payment history and current credit status in developing these estimates. The allowance against our straight-line rent receivable is based on historical experience with early lease terminations as well as specific review of significant tenants and tenants that are having known financial difficulties. There is a risk that our estimate of the expected activity of current tenants may not accurately reflect future events. If the estimate does not accurately reflect future tenant vacancies, the reserve for straight-line rent receivable may be over or understated by the actual tenant vacancies that occur.
We estimate the allowance for notes receivable based on our assessment of expected future cash flows estimated to be received with consideration given to any collateral of the respective note. If our estimate of expected future cash flows does not accurately reflect actual events, our reserve on notes receivable may be over or understated by the actual cash flows that occur. Our allowance for doubtful accounts, which includes our straight-line allowance, was $25,875,000 and $31,192,000, at January 31, 2012 and 2011, respectively.
Historic and New Market Tax Credit Entities – We have certain investments in properties that have received, or we believe are entitled to receive, historic preservation tax credits on qualifying expenditures under Internal Revenue Code (“IRC”) section 47 and new market tax credits on qualifying investments in designated community development entities (“CDEs”) under IRC section 45D, as well as various state credit programs, including participation in the New York State Brownfield Tax Credit Program, which entitles the members to tax credits based on qualified expenditures at the time those qualified expenditures are placed in service. We typically enter into these investments with sophisticated financial investors. In exchange for the financial investors’ initial contribution into the investment, the financial investor is entitled to substantially all of the benefits derived from the tax credit, but generally has no material interest in the underlying economics of the property. Typically, these arrangements have put/call provisions (which range up to 7 years) whereby we may be obligated (or entitled) to repurchase the financial investors’ interest. We have consolidated each of these entities in our consolidated financial statements and have reflected these investor contributions as accounts payable, accrued expenses and other liabilities.
We guarantee the financial investor that in the event of a subsequent recapture by a taxing authority due to our noncompliance with applicable tax credit guidelines we will indemnify the financial investor for any recaptured tax credits. We initially record a liability for the cash received from the financial investor. We generally record income upon completion and certification of the qualifying development expenditures for historic tax credits and upon certification of the qualifying investments in designated CDEs for new market tax credits resulting in an adjustment of the liability at each balance sheet date to the amount that would be paid to the financial investor based upon the tax credit compliance regulations, which range from 0 to 7 years. Income related to the sale of tax credits is recorded in interest and other income.
Impairment of Real Estate – We review our real estate portfolio, including land held for development and sale, for impairment whenever events or changes indicate that our carrying value may not be recoverable. Impairment indicators include, but are not limited to, significant decreases in property net operating income, significant decreases in occupancy rates, the physical condition of the property and general economic conditions. A property’s value is impaired only if management’s estimate of the aggregate future cash flows (undiscounted and without interest charges) to be generated by the property are less than the carrying value of the property. In addition, the undiscounted cash flows may consider a probability-weighted cash flow estimation approach when alternative courses of action to recover the carrying amount of a long-lived asset are under consideration or a range is estimated at the balance sheet date. Significant estimates are made in the determination of future undiscounted cash flows including future net operating income, estimated holding periods, risk of foreclosure and estimated cash proceeds received upon disposition of the asset. To the extent an impairment has occurred, the loss will be measured as the excess of the carrying amount of the property over the fair value of the property. Determining fair value of real estate, if required, also involves significant judgments and estimates including discount and capitalization rates. Changes to these estimates made by management could affect whether or not an impairment charge would be required and/or the amount of impairment charges recognized. See the “Impairment of Real Estate” section of MD&A for additional information.
45
Impairment of Unconsolidated Entities – We review our portfolio of unconsolidated entities for other-than-temporary impairments whenever events or changes indicate that our carrying value in the investments may be in excess of fair value. A loss in value of an equity method investment which is other-than-temporary is recognized as an impairment of unconsolidated entities. This determination is based upon the length of time elapsed, severity of decline, possible recovery period and other relevant facts. Determining fair value of a real estate investment and whether or not a loss is other-than-temporary involves significant judgments and estimates. Examples of these estimates include timing and amounts of expected cash flows, discount rates, capitalization rates, comparable sales data, among other things. Changes to these estimates made by management could affect whether or not an impairment charge would be required and/or the amount of impairment charges recognized. See the “Impairment of Unconsolidated Entities” section of MD&A for additional information.
Variable Interest Entities– The accounting guidance for consolidation of VIEs requires an ongoing reassessment of determining whether a variable interest gives a company a controlling financial interest in a VIE. The guidance eliminates the quantitative approach to evaluating VIEs for consolidation. We continually reassess whether or not we have (a) the power to direct the activities that most significantly affect the VIE’s economic performance and (b) the obligation to absorb losses or the right to receive benefits that could potentially be significant to the VIE. We also perform continuous reassessments of our primary beneficiary status rather than event-driven assessments. These assessments, by their nature, require significant judgment.
Results of Operations
Net Earnings (Loss) Attributable to Forest City Enterprises, Inc. –Net loss attributable to Forest City Enterprises, Inc. for the year ended January 31, 2012 was $86,486,000 versus net earnings of $58,048,000 for the year ended January 31, 2011. Although we have substantial recurring revenue sources from our properties, we also enter into significant transactions, which create substantial variances in net earnings (loss) between periods. This variance to the prior year is primarily attributable to the following decreases, which are net of noncontrolling interest:
| | • | | $176,192,000 related to the 2010 gain on disposition of partial interest in seven mixed-useUniversity Park life science properties in Cambridge, Massachusetts, related to the formation of a new joint venture with an outside partner; |
| | • | | $54,185,000 related to the 2011 increase in impairment charges of consolidated (including discontinued operations) and unconsolidated entities; |
| | • | | $31,437,000 related to the 2010 gain on disposition of partial interest in The Nets; |
| | • | | $29,342,000 related to the 2010 gain on disposition of partial interest inThe Grand,Lenox Club andLenox Park, apartment communities in the Washington D.C. metropolitan area, related to the formation of a new joint venture with an outside partner; |
| | • | | $14,739,000 related to a 2011 increase in allocated losses from our equity investment in The Nets (see “The Nets” section of the MD&A); |
| | • | | $10,894,000 related to the 2010 gains on disposition of our unconsolidated investments exceeding 2011. The 2011 gains related toMetropolitan Lofts andTwin Lake Towers, apartment communities in Los Angeles, California and Denver, Colorado, respectively, while the 2010 gains primarily related toMillender Center, a mixed-use property in Detroit, Michigan, andWoodbridge Crossing, a specialty retail center in Woodbridge, New Jersey; |
| | • | | $9,649,000 related to the lease up losses of8 Spruce Street, an apartment community in Manhattan, New York, currently being opened in phases. This property was consolidated until a recapitalization transaction in July 2011 which resulted in joint control of the investment; |
| | • | | $4,683,000 related to a decrease in income recognized on the sale of state and federal Historic Preservation Tax Credits and New Market Tax Credits in 2011 compared to 2010; and |
| | • | | $4,200,000 related to increases in professional fees associated with strategic planning and process improvement initiatives in 2011 compared to 2010. |
These decreases were partially offset by the following increases, net of noncontrolling interest:
| | • | | $42,622,000 related to the 2011 sale of land and air rights for development of a casino in downtown Cleveland, Ohio; |
| | • | | $26,105,000 (which includes $3,126,000 for unconsolidated entities) related to gains on extinguishment of debt in 2011 compared to losses on extinguishment of debt in 2010; |
46
| | • | | $9,561,000 due to the 2011 gain on disposition of partial interests in 15 retail properties in the New York City metropolitan area, related to the formation of new joint venture agreements with an outside partner; |
| | • | | $6,359,000 related to a decrease in interest expense on our corporate debt due primarily to decreased borrowings on our revolving credit facility and lower interest attributable to our senior and subordinated debt; |
| | • | | $5,849,000 related to the 2011 gain on disposition of partial interest in theMall at Stonecrest, a regional mall in Atlanta, Georgia, related to the formation of a new joint venture with an outside partner; |
| | • | | $4,704,000 related to the 2011 gains on disposition of rental properties exceeding 2010 gains. The 2011 gains related toWaterfront Station – East 4th & West 4th Buildings, office buildings in Washington, D.C.,Charleston Marriott, a hotel in Charleston, West Virginia,250 Huron, an office building in Cleveland, Ohio, andRitz-Carlton, a hotel in Cleveland, Ohio. The 2010 gains related toSimi Valley Town Center, a regional mall in Simi Valley, California,Saddle Rock Village, a specialty retail center in Aurora, Colorado,101 San Fernando, an apartment community in San Jose, California, and an investment in a triple net lease retail property located in Pueblo, Colorado; |
| | • | | $2,656,000 related to transaction costs expensed during 2010 that were incurred in connection with a potential partial disposition of certain rental properties that did not occur; |
| | • | | $2,255,000 related to the 2011 gain on the sale of an annex building containing 8 units adjacent to ourDallas Wilson Building, an apartment building in Dallas, Texas; and |
| | • | | $104,284,000 due to decreased income tax expense attributable to both continuing and discontinued operations primarily related to the fluctuations in earnings (loss) before income taxes and pre-tax earnings (loss) including gains included in discontinued operations. These fluctuations are primarily due to the various transactions discussed herein. |
Net earnings attributable to Forest City Enterprises, Inc. for the year ended January 31, 2011 was $58,048,000 versus a net loss of $26,978,000 for the year ended January 31, 2010. The variance to the prior year is primarily attributable to the following increases, which are net of noncontrolling interest:
| | • | | $176,192,000 related to the 2010 gain on disposition of partial interest in seven mixed-useUniversity Park life science properties related to the formation of a new joint venture with an outside partner; |
| | • | | $41,372,000 related to the 2010 gains on disposition of rental properties exceeding 2009. The 2010 gains related toSimi Valley Town Center,Saddle Rock Village,101 San Fernandoand an investment in a triple net lease retail property located in Pueblo, Colorado. The 2009 gains primarily related toGrand Avenue, a specialty retail center in Queens, New York; |
| | • | | $31,437,000 related to the 2010 gain on disposition of partial interest in The Nets; |
| | • | | $31,414,000 related to a 2010 decrease in allocated losses from our equity investment in The Nets; |
| | • | | $29,342,000 related to the 2010 gain on disposition of partial interest inThe Grand,Lenox Club andLenox Park, related to the formation of a new joint venture with an outside partner; |
| | • | | $9,479,000 (which includes $2,741,000 for unconsolidated entities) of decreased write-offs of abandoned development projects in 2010 compared to 2009; |
| | • | | $3,998,000 related to the 2009 participation payment on the refinancing of45/75 Sidney, office buildings in Cambridge, Massachusetts, that did not recur; and |
| | • | | $3,395,000 of decreased company-wide severance and outplacement costs in 2010 compared to 2009. |
These increases were partially offset by the following decreases, net of noncontrolling interest:
| | • | | $84,682,000 related to the 2010 increase in impairment charges of consolidated (including discontinued operations) and unconsolidated entities; |
| | • | | $32,339,000 (which includes $2,016,000 for unconsolidated entities) primarily related to decreased gains on early extinguishment of debt in 2010 compared to 2009; |
47
| | • | | $23,496,000 related to the 2010 loss on early extinguishment of debt on the exchange of a portion of our 2016 Senior Notes for Class A common stock offset by the 2010 gain on early extinguishment of debt on the exchange of a portion of our 3.625% Puttable Equity Linked Senior Notes due 2011 (“2011 Senior Notes”), 7.625% Senior Notes due 2015 (“2015 Senior Notes”) and 6.50% Senior Notes due 2017 (“2017 Senior Notes”) for a new issue of Series A preferred stock and purchase of a portion of our 2011 and 2017 Senior Notes; |
| | • | | $26,300,000 related to the 2009 gains on disposition of our unconsolidated investments exceeding 2010. The 2010 gains primarily related toMillender CenterandWoodbridge Crossing, while the 2009 gains related toClassic Residence by Hyatt properties, supported-living apartments in Teaneck, New Jersey, Chevy Chase, Maryland and Yonkers, New York,Clarkwood andGranada Gardens, apartment communities in Warrensville Heights, Ohio, andBoulevard Towers, an apartment community in Amherst, New York; |
| | • | | $9,131,000 primarily related to military housing fee income from the management and development of military housing units in Hawaii, Illinois, Washington and Colorado in 2010 compared to 2009; |
| | • | | $7,703,000 (which includes $2,523,000 for unconsolidated entities) related to a 2009 reinstatement by the United States Department of Housing and Urban Development (“HUD”) of certain replacement reserves previously written off at four of our residential properties located in Michigan that did not recur; |
| | • | | $3,599,000 related to a 2009 gain for insurance proceeds received related to fire damage of an apartment building in excess of the book value of the damaged asset that did not recur; |
| | • | | $2,656,000 related to transaction costs expensed during 2010 that were incurred in connection with a potential partial disposition of certain rental properties that did not occur; |
| | • | | $2,396,000 related to the 2009 net gain on an industrial land sale atMesa del Sol in Albuquerque, New Mexico; and |
| | • | | $75,843,000 due to increased income tax expense attributable to both continuing and discontinued operations primarily related to the fluctuations in earnings (loss) before income taxes and pre-tax earnings (loss) including gains included in discontinued operations. These fluctuations are primarily due to the various transactions discussed herein. |
48
Summary of Segment Operating Results – The following tables present a summary of revenues from real estate operations, operating expenses, interest expense, equity in earnings of unconsolidated entities and impairment of unconsolidated entities by segment. See discussion of these amounts by segment in the narratives following the tables.
| | | | | | | | | | | | |
| | | Years Ended January 31, | |
| | | 2012 | | | 2011 | | | 2010 | |
| | | (in thousands) | |
Revenues from Real Estate Operations | | | | | | | | | | | | |
Commercial Group | | $ | 734,967 | | | $ | 849,291 | | | $ | 889,558 | |
Commercial Group Land Sales | | | 55,463 | | | | 24,742 | | | | 27,068 | |
Residential Group | | | 255,127 | | | | 211,485 | | | | 257,077 | |
Land Development Group | | | 44,420 | | | | 32,131 | | | | 20,267 | |
The Nets | | | - | | | | - | | | | - | |
Corporate Activities | | | - | | | | - | | | | - | |
Total Revenues from Real Estate Operations | | $ | 1,089,977 | | | $ | 1,117,649 | | | $ | 1,193,970 | |
| | | |
Operating Expenses | | | | | | | | | | | | |
Commercial Group | | $ | 380,460 | | | $ | 404,953 | | | $ | 413,517 | |
Cost of Commercial Group Land Sales | | | 10,147 | | | | 19,970 | | | | 21,609 | |
Residential Group | | | 178,224 | | | | 136,596 | | | | 156,886 | |
Land Development Group | | | 47,543 | | | | 38,650 | | | | 33,119 | |
The Nets | | | - | | | | - | | | | - | |
Corporate Activities | | | 52,585 | | | | 47,030 | | | | 39,857 | |
Total Operating Expenses | | $ | 668,959 | | | $ | 647,199 | | | $ | 664,988 | |
| | | |
Interest Expense | | | | | | | | | | | | |
Commercial Group | | $ | 168,810 | | | $ | 221,642 | | | $ | 232,344 | |
Residential Group | | | 31,946 | | | | 21,233 | | | | 27,515 | |
Land Development Group | | | 3,443 | | | | 3,007 | | | | 2,109 | |
The Nets | | | - | | | | - | | | | - | |
Corporate Activities | | | 56,838 | | | | 63,884 | | | | 80,891 | |
Total Interest Expense | | $ | 261,037 | | | $ | 309,766 | | | $ | 342,859 | |
| | | |
Equity in Earnings of Unconsolidated Entities | | | | | | | | | | | | |
Commercial Group | | $ | 19,887 | | | $ | 14,177 | | | $ | 6,657 | |
Gain on disposition ofWoodbridge Crossing | | | - | | | | 6,443 | | | | - | |
Residential Group | | | 10,482 | | | | 19,567 | | | | 2,969 | |
Gain on disposition ofMetropolitan Lofts | | | 9,964 | | | | - | | | | - | |
Gain on disposition ofTwin Lake Towers | | | 2,603 | | | | - | | | | - | |
Gain on disposition ofMillender Center | | | - | | | | 15,633 | | | | - | |
Gain on disposition ofPebblecreek | | | - | | | | 2,215 | | | | - | |
Gain on disposition ofClassic Residence by Hyattproperties | | | - | | | | - | | | | 31,703 | |
Gain on disposition ofClarkwood | | | - | | | | - | | | | 6,983 | |
Gain on disposition ofGranada Gardens | | | - | | | | - | | | | 6,577 | |
Gain on disposition ofBoulevard Towers | | | - | | | | - | | | | 4,498 | |
Land Development Group | | | 5,025 | | | | 2,548 | | | | 5,405 | |
The Nets | | | (26,814 | ) | | | (18,318 | ) | | | (43,489 | ) |
Corporate Activities | | | - | | | | - | | | | - | |
Total Equity in Earnings of Unconsolidated Entities | | $ | 21,147 | | | $ | 42,265 | | | $ | 21,303 | |
Impairment of Unconsolidated Entities | | | | | | | | | | | | |
Commercial Group | | $ | 40,284 | | | $ | 49,889 | | | $ | 10,521 | |
Residential Group | | | - | | | | - | | | | 24,303 | |
Land Development Group | | | 41,902 | | | | 22,570 | | | | 1,532 | |
The Nets | | | - | | | | - | | | | - | |
Corporate Activities | | | - | | | | - | | | | - | |
Total Impairment of Unconsolidated Entities | | $ | 82,186 | | | $ | 72,459 | | | $ | 36,356 | |
49
Commercial Group
Revenues from Real Estate Operations – Revenues from real estate operations for the Commercial Group, including the group’s land sales, decreased by $83,603,000, or 9.6%, for the year ended January 31, 2012 compared to the same period in the prior year. The variance is primarily attributable to the following decreases:
| | • | | $86,147,000 related to the change from full consolidation method of accounting to equity method upon the formation of a new joint venture in 2011 with an outside partner in 15 retail properties in the New York City metropolitan area; |
| | • | | $17,299,000 related to the change from full consolidation method of accounting to equity method for8 Spruce Street in 2011 due to recapitalization transactions. The revenues for 2010 and for 2011 prior to the conversion to equity method of accounting on July 1, 2011 relate to amounts earned on a construction contract with the New York City School Construction Authority for the construction of a school on the lower floors at8 Spruce Street. This represents a reimbursement of costs that is included in operating expenses; |
| | • | | $14,279,000 related to decreases in commercial outlot land sales primarily atSouth Bay Southern Center in Redondo Beach, California,Salt Lake Cityin Utah, Orchard Town Centerin Westminster, Colorado, andWestchester’s Ridge Hill in Yonkers, New York, which were partially offset by an increase atJohns Hopkins – 855 North Wolfe Street in East Baltimore, Maryland; |
| | • | | $11,688,000 related to decreased occupancy atTwo MetroTech CenterandOne Pierrepont Plaza in Brooklyn, New York andSouth Bay Galleria in Redondo Beach, California; |
| | • | | $7,835,000 related to the change from full consolidation method of accounting to equity method upon the formation of a new joint venture in 2010 with an outside partner inUniversity Park: and |
| | • | | $5,965,000 related to the change from full consolidation method of accounting to equity method upon the formation of a new joint venture in 2011 with an outside partner at theMall at Stonecrest. |
These decreases were partially offset by the following increases:
| | • | | $45,000,000 related to the 2011 sale of land and air rights for development of a casino in downtown Cleveland, Ohio; |
| | • | | $7,893,000 related to increased occupancy atOrchard Town Center,Illinois Science and Technology Park in Skokie, Illinois,Promenade Bolingbrook in Bolingbrook, Illinois,Johns Hopkins – 855 North Wolfe Street andPromenade in Temecula in Temecula, California; |
| | • | | $5,369,000 related to increased revenues on a lease with Rock Ohio for space in theHigbee Buildingin Cleveland, Ohio for Phase I of its new casino; and |
| | • | | $4,294,000 related to the phased opening ofWestchester’s Ridge Hill. |
The balance of the remaining decrease of $2,946,000 was generally due to miscellaneous fluctuations.
Revenues from real estate operations for the Commercial Group, including the group’s land sales, decreased by $42,593,000, or 4.6%, for the year ended January 31, 2011 compared to the same period in the prior year. The variance is primarily attributable to the following decreases:
| | • | | $62,754,000 related to the change from full consolidation method of accounting to equity method upon the formation of a new joint venture with an outside partner inUniversity Park; and |
| | • | | $2,326,000 related to decreases in commercial outlot land sales primarily atSalt Lake City,Victoria Gardensin Rancho Cucamonga, California,Westchester’s Ridge Hill andShort Pump Town Center in Richmond, Virginia, which were partially offset by increases atSouth Bay Southern Center andOrchard Town Center. |
These decreases were partially offset by the following increases:
| | • | | $13,221,000 related to increased revenues earned on a construction contract with the New York City School Construction Authority for the construction of a school on the lower floors at8 Spruce Street. This represents a reimbursement of costs that is included in operating expenses; |
50
| | • | | $5,818,000 related to increased occupancy atIllinois Science and Technology ParkandHigbee Building; |
| | • | | $3,910,000 related to development fee income atLas Vegas City Hall, a fee-based project in Nevada; and |
| | • | | $2,257,000 related to the property expansion atPromenade in Temecula. |
The balance of the remaining decrease of $2,719,000 was generally due to miscellaneous fluctuations.
Operating and Interest Expenses –Operating expenses for the Commercial Group decreased $34,316,000, or 8.1%, for the year ended January 31, 2012 compared to the same period in the prior year. The variance is primarily attributable to the following decreases:
| | • | | $33,404,000 related to the change from full consolidation method of accounting to equity method upon the formation of a new joint venture in 2011 with an outside partner in 15 retail properties in the New York City metropolitan area; |
| | • | | $17,299,000 related to the change from full consolidation method of accounting to equity method for8 Spruce Street in 2011 due to recapitalization transactions. The operating expense for 2010 and for 2011 prior to the conversion to equity method of accounting on July 1, 2011 relate to construction of a school at8 Spruce Street. These costs are reimbursed by the New York City School Construction Authority which are included in revenues from real estate operations; |
| | • | | $12,201,000 related to decreases in commercial outlot land sales primarily atSouth Bay Southern Center,Salt Lake City, Orchard Town Center andWestchester’s Ridge Hill, which were partially offset by an increase atJohns Hopkins – 855 North Wolfe Street; |
| | • | | $2,379,000 related to the change from full consolidation method of accounting to equity method upon the formation of a new joint venture in 2010 with an outside partner inUniversity Park; and |
| | • | | $2,168,000 related to the change from full consolidation method of accounting to equity method upon the formation of a new joint venture in 2011 with an outside partner at theMall at Stonecrest. |
These decreases were partially offset by the following increases:
| | • | | $7,195,000 related to the phased opening ofWestchester’s Ridge Hill; |
| | • | | $4,234,000 primarily related to increased marketing costs related to theBarclays Center arena; |
| | • | | $3,468,000 related to increased research and development costs for a modular construction project atAtlantic Yards in Brooklyn, New York; |
| | • | | $2,739,000 related to increased write-offs of abandoned development projects in 2011 compared to 2010; |
| | • | | $2,378,000 related to the 2011 cost of sale of land and air rights to Rock Ohio for development of its casino in downtown Cleveland, Ohio; and |
| | • | | $2,309,000 related to increased real estate tax expense on the land parcels sold to Rock Ohio for development of its casino in downtown Cleveland, Ohio. |
The balance of the remaining increase of $10,812,000 was generally due to miscellaneous fluctuations.
Operating expenses for the Commercial Group decreased $10,203,000, or 2.3%, for the year ended January 31, 2011 compared to the same period in the prior year. The variance is primarily attributable to the following decreases:
| | • | | $23,436,000 related to the change from full consolidation method of accounting to equity method upon the formation of a new joint venture with an outside partner inUniversity Park; |
| | • | | $5,875,000 related to decreased write-offs of abandoned development projects in 2010 compared to 2009; and |
| | • | | $1,639,000 related to decreases in commercial outlot land sales primarily atSalt Lake City,Victoria Gardens,Westchester’s Ridge Hill andShort Pump Town Center, which were partially offset by increases atSouth Bay Southern Center andOrchard Town Center. |
51
These decreases were partially offset by the following increases:
| | • | | $13,221,000 related to construction of a school at8 Spruce Street. These costs are reimbursed by the New York City School Construction Authority which are included in revenues from real estate operations; |
| | • | | $8,302,000 related to the change from equity method of accounting to full consolidation method for theBarclays Center arena upon the adoption of new accounting guidance for consolidation of VIEs. These costs represent non-capitalizable expenses, primarily marketing costs, related to theBarclays Center arena; |
| | • | | $2,171,000 related to increased occupancy atHigbee BuildingandIllinois Science and Technology Park;and |
| | • | | $1,575,000 related to development expenses atLas Vegas City Hall. |
The balance of the remaining decrease of $4,522,000 was generally due to miscellaneous fluctuations.
Interest expense for the Commercial Group decreased by $52,832,000, or 23.8%, for the year ended January 31, 2012 compared to the same period in the prior year. This decrease is primarily attributable to the change from full consolidation method of accounting to equity method upon the formation of a new joint venture with an outside partner in 15 retail properties in the New York City metropolitan area in 2011 and increased capitalized interest due to additional qualified expenditures. Interest expense for the Commercial Group decreased by $10,702,000, or 4.6%, for the year ended January 31, 2011 compared to the same period in the prior year. This decrease is primarily attributable to the change from full consolidation method of accounting to equity method upon the formation of a new joint venture with an outside partner inUniversity Park.This decrease was primarily offset by increases attributable to the property expansion atPromenade in Temecula, mortgage interest expense atJohns Hopkins—855 North Wolfe Street related to the terms of a renegotiated forward interest rate swap and changes in mark-to-market adjustments on non-designated interest rate swaps.
Comparable occupancy for the Commercial Group is 90.9% and 91.0% for retail and office, respectively, as of January 31, 2012 compared to 91.2% and 89.5%, respectively, as of January 31, 2011. Retail and office occupancy as of January 31, 2012 and 2011 is based on square feet leased at the end of the fiscal quarter. Comparable occupancy relates to properties opened and operated in both the years ended January 31, 2012 and 2011. Average occupancy for hotels for the year ended January 31, 2012 is 69.1% compared to 69.0% for the year ended January 31, 2011.
As of January 31, 2012, the average base rent per square feet expiring for retail and office leases is $27.56 and $31.34, respectively, compared to $27.79 and $31.11, respectively, as of January 31, 2011. Square feet of expiring leases and average base rent per square feet are operating statistics that represent 100% of the square footage and base rental income per square foot from expiring leases. The average daily rate (“ADR”) for our hotel portfolio is $141.91 and $140.03 for the years ended January 31, 2012 and 2011, respectively. ADR is an operating statistic and is calculated by dividing revenue by the number of rooms sold for all hotels that were open and operating for both the years ended January 31, 2012 and 2011.
We continuously monitor retail and office leases expiring in the short to mid-term. Management’s plan to obtain lease renewals for expiring retail and office leases includes signing of lease extensions, if available and active marketing for available or soon to be available space to new or existing tenants in the normal course of business.
52
Leasing Summary
Retail Centers
The following tables represent those new leases and gross leasable area (“GLA”) signed on the same space in which there was a former tenant and existing tenant renewals.
| | | | | | | | | | | | | | | | | | |
| Regional Malls - Quarterly |
| Quarter | | Number of Leases Signed | | | GLA Signed | | | Contractual Rent Per Square Foot (1)(2) | | | Prior Rent Per Square Foot (1)(2) | | | Cash Basis % Change over Prior Rent |
1st Quarter 2011 | | | 29 | | | | 64,008 | | | $ | 60.70 | | | $ | 58.14 | | | 4% |
2nd Quarter 2011 | | | 30 | | | | 66,897 | | | $ | 79.63 | | | $ | 72.72 | | | 10% |
3rd Quarter 2011 | | | 48 | | | | 162,170 | | | $ | 49.53 | | | $ | 45.43 | | | 9% |
4th Quarter 2011 | | | 59 | | | | 149,030 | | | $ | 60.95 | | | $ | 55.35 | | | 10% |
| | | | |
Total - 12 months | | | 166 | | | | 442,105 | | | $ | 59.55 | | | $ | 54.75 | | | 9% |
| | | | | | | | | | | | | | | |
| | | | | | | | | | | | | | | | | | |
| Specialty Retail Centers - Quarterly |
| Quarter | | Number of Leases Signed | | | GLA Signed | | | Contractual Rent Per Square Foot (1)(2) | | | Prior Rent Per Square Foot (1)(2) | | | Cash Basis % Change over Prior Rent |
1st Quarter 2011 | | | 5 | | | | 11,900 | | | $ | 48.92 | | | $ | 41.22 | | | 19% |
2nd Quarter 2011 | | | 4 | | | | 15,522 | | | $ | 21.04 | | | $ | 21.43 | | | (2%) |
3rd Quarter 2011 | | | 10 | | | | 34,385 | | | $ | 62.29 | | | $ | 56.11 | | | 11% |
4th Quarter 2011 | | | 10 | | | | 84,952 | | | $ | 30.97 | | | $ | 27.80 | | | 11% |
| | | | |
Total - 12 months | | | 29 | | | | 146,759 | | | $ | 38.71 | | | $ | 34.85 | | | 11% |
| | | | | | | | | | | | | | | |
Office Buildings
The following table represents all new leases compared to terms of all expired leases in our office portfolio over the past 12 months.
| | | | | | | | | | | | | | | | | | | | | | | | | | |
| Quarterly | | | | | | | | | | | | | | | | | | | | |
| Quarter | | Number of Leases Signed | | | Number of Leases Expired | | | GLA Signed | | | GLA Expired | | | Contractual Rent Per Square Foot (2) | | | Expiring Rent Per Square Foot (2) | | | Cash Basis % Change over Prior Rent |
1st Quarter 2011 | | | 38 | | | | 24 | | | | 649,323 | | | | 327,228 | | | $ | 32.56 | | | $ | 29.57 | �� | | 10% |
2nd Quarter 2011 | | | 19 | | | | 19 | | | | 127,285 | | | | 110,492 | | | $ | 19.22 | | | $ | 18.37 | | | 5% |
3rd Quarter 2011 | | | 33 | | | | 27 | | | | 178,838 | | | | 178,598 | | | $ | 26.20 | | | $ | 29.22 | | | (10%) |
4th Quarter 2011 | | | 46 | | | | 33 | | | | 703,488 | | | | 683,121 | | | $ | 30.13 | | | $ | 27.86 | | | 8% |
| | | | |
Total - 12 months | | | 136 | | | | 103 | | | | 1,658,934 | | | | 1,299,439 | | | $ | 29.82 | | | $ | 27.67 | | | 8% |
| | | | | | | | | | | | | | | |
| (1) | Retail contractual rent per square foot includes fixed minimum rent and fixed additional charges for marketing/promotional charges and common area maintenance. |
| (2) | For all new leases, contractual rent per square foot is the new annualized rental rate as of rental commencement. For all expiring leases, contractual rent per square foot is the annualized rental rate at the time of expiration, which includes any applicable escalations. |
Net Operating Income (“NOI”) is defined as revenues (excluding straight-line rent adjustments) less operating expenses (including depreciation and amortization and amortization of mortgage procurement costs for non-real estate groups) plus interest income, plus equity in earnings (loss) of unconsolidated entities (excluding gain on disposition and impairment of unconsolidated entities) plus interest expense, gain (loss) on early extinguishment of debt, depreciation and amortization of unconsolidated entities. Comparable NOI is an operating statistic defined as NOI from properties opened and operated in all periods presented net of noncontrolling interests.
53
The percentage change of comparable NOI over the same period in the prior year is as follows:
| | | | | | | | |
| | | Years Ended January 31, | |
| | | 2012 | | | 2011 | |
| | |
Retail | | | 2.6 | % | | | 2.2 | % |
| | |
Office | | | (2.6 | %) | | | 2.1 | % |
| | |
Hotel | | | 0.1 | % | | | (3.9 | %) |
The increase for retail for the year ended January 31, 2012 is primarily due to increase in occupancy as well as increased rents as discussed in the tables above. The decrease for office for the year ended January 31, 2012 is primarily due to decreases in occupancy primarily atTwo Metrotech Center andOne Pierrepont Plaza in Brooklyn, New York partially offset by increased rents as discussed in the tables above.
See the “Commercial Group” section in Item 1 of this Form 10-K for additional operating statistics.
Residential Group
Revenues from Real Estate Operations –Included in revenues from real estate operations is fee income related to the development and construction management related to our military housing projects. Military housing fee income and related operating expenses may vary significantly from period to period based on the timing of development and construction activity at each applicable project. Revenues from real estate operations for the Residential Group increased by $43,642,000, or 20.6%, during the year ended January 31, 2012 compared to the prior year. The variance is primarily attributable to the following increases:
$29,483,000 related to military housing fee income from the management and development of units in our military housing portfolio (see the “Military Housing Fee Revenues” section below for further detail);
| | • | | $4,450,000 related to the change from equity method to full consolidation method of accounting forMillender Center; |
| | • | | $3,811,000 related to new property openings as noted in the table below; |
| | • | | $2,913,000 related to third party management fees and other fee income; and |
| | • | | $1,997,000 related to the sale of land parcels and related development opportunities in Richmond, Virginia. |
These increases were partially offset by the following decrease:
| | • | | $3,356,000 related to the change from full consolidation to equity method of accounting forDKLB BKLN as a result of the recapitalization of this entity. |
The balance of the remaining increase of $4,344,000 was generally due to increased rents and occupancies across our multi-family rental portfolio and other miscellaneous fluctuations.
Revenues from real estate operations for the Residential Group decreased by $45,592,000, or 17.7%, during the year ended January 31, 2011 compared to the prior year. The variance is primarily attributable to the following decreases:
| | • | | $27,628,000 related to the change from full consolidation method of accounting to equity method upon the formation of a new joint venture with an outside partner forThe Grand,Lenox ParkandLenox Club; |
| | • | | $14,000,000 related to the land sale and related development opportunity in Mamaroneck, New York in the prior year; |
| | • | | $13,746,000 related to the deconsolidation of seven properties upon the adoption of accounting guidance for consolidation of VIEs; |
| | • | | $11,881,000 related to military housing fee income from the management and development of units in our military housing portfolio; and |
54
| | • | | $4,642,000 related to insurance premiums earned from an owner’s controlled insurance program. |
These decreases were partially offset by the following increases:
| | • | | $12,683,000 primarily related to new property openings and acquired properties as noted in the table below; and |
| | • | | $6,770,000 related to third party management fees and other fee income. |
The balance of the remaining increase of $6,852,000 was generally due to miscellaneous fluctuations as a result of improving operating fundamentals such as occupancy rates and net rental income.
Operating and Interest Expenses –Operating expenses for the Residential Group increased by $41,628,000, or 30.5%, during the year ended January 31, 2012 compared to the prior year. This variance is primarily attributable to the following increases:
| | • | | $28,636,000 related to management expenditures associated with military housing fee revenues; |
| | • | | $6,046,000 related to expenditures associated with third party management and consulting fee arrangements; |
| | • | | $3,019,000 related to the change from equity method to full consolidation method of accounting forMillender Center; |
| | • | | $2,400,000 related to an unfavorable judgment from litigation atEasthaven at the Village, an apartment community in Beachwood, Ohio, arising from a building fire in 2007; |
| | • | | $2,352,000 related to new property openings as noted in the table below; and |
| | • | | $1,950,000 related to the cost of the land sale and related development opportunities in Richmond, Virginia. |
These increases were partially offset by the following decrease:
| | • | | $2,993,000 related to decreased write-offs of abandoned development projects in 2011 as compared to 2010. |
The balance of the remaining increase of $218,000 was generally due to direct property expenses and general operating activities.
Operating expenses for the Residential Group decreased by $20,290,000, or 12.9%, during the year ended January 31, 2011 compared to the prior year. This variance is primarily attributable to the following decreases:
| | • | | $14,000,000 related to the cost of the land sale and related development opportunity in Mamaroneck, New York in the prior year; |
| | • | | $11,783,000 related to the change from full consolidation method of accounting to equity method upon the formation of a new joint venture with an outside partner forThe Grand,Lenox ParkandLenox Club; |
| | • | | $6,725,000 related to the deconsolidation of seven properties upon the adoption of accounting guidance for consolidation of VIEs; |
| | • | | $5,281,000 related to decreased write-offs of abandoned development projects in 2010 as compared to 2009; |
| | • | | $4,283,000 related to insurance expenses associated with an owner’s controlled insurance program; and |
| | • | | $4,131,000 related to management expenditures associated with military housing fee revenues. |
These decreases were partially offset by the following increases:
| | • | | $10,226,000 related to a 2009 reinstatement by HUD of certain replacement reserves previously written off at three of our residential properties located in Michigan, that did not recur; |
| | • | | $5,420,000 related to new property openings and acquired properties as noted in the table below; and |
| | • | | $2,156,000 related to expenditures associated with third party management fee arrangements. |
55
The balance of the remaining increase of $8,111,000 was generally due to miscellaneous fluctuations.
Interest expense for the Residential Group increased by $10,713,000, or 50.5%, during the year ended January 31, 2012 compared to the same period in the prior year. This increase is primarily a result of the opening of new properties, as noted in the table below, and mark-to-market adjustments on non-designated interest rate swaps.
Interest expense for the Residential Group decreased by $6,282,000, or 22.8%, during the year ended January 31, 2011 compared to the same period in the prior year. This decrease is primarily attributable to the deconsolidation of properties as a result of adopting new accounting guidance on the consolidation of VIEs, the change from full consolidation method of accounting to equity method upon the formation of a new joint venture with an outside partner forThe Grand,Lenox Park andLenox Club and mark-to-market adjustments on non-designated interest rate swaps partially offset by openings and acquisitions of new properties.
The following table presents the increases (decreases) in revenues, operating expenses and interest expense for newly-opened properties for the year ended January 31, 2012 compared to the same period in the prior year:
| | | | | | | | | | | | | | | | | | | | | | |
| | | | | | | | | | | Year Ended January 31,
2012 vs. 2011 | |
| Property | | Location | | | Quarter-Year Opened | | Units | | | Revenues from Real Estate Operations | | | Operating
Expenses | | | Interest
Expense | |
| |
| | | | | | | | | | | | | | (in thousands) | | | | |
| | | | | | |
Foundry Lofts | | | Washington, D.C. | | | Q4-2011 | | | 170 | | | $ | 108 | | | $ | 1,571 | | | $ | (571 | ) |
Presidio Landmark | | | San Francisco, California | | | Q3-2010 | | | 161 | | | | 2,613 | | | | 1,464 | | | | 3,712 | |
Hamel Mill Lofts | | | Haverhill, Massachusetts | | | Q4-2008/Q3-2010 (1) | | | 305 | | | | 1,090 | | | | (683 | ) | | | 43 | |
| | | | | | | | | | | | | | |
Total | | | | | | | | | | | | $ | 3,811 | | | $ | 2,352 | | | $ | 3,184 | |
| | | | | | | | | | | | | | |
| (1) | Property to open in phases. |
The following table presents the increases (decreases) in revenues, operating expenses and interest expense for newly-opened/acquired properties for the year ended January 31, 2011 compared to the same period in the prior year:
| | | | | | | | | | | | | | | | | | | | | | |
| | | | | | | | | | | Year Ended January 31, | |
| | | | | | | | | | | 2011 vs. 2010 | |
| Property | | Location | | | Quarter-Year Opened | | Units | | | Revenues from Real Estate
Operations | | | Operating
Expenses | | | Interest
Expense | |
| |
| | | | | | | | | | | | | | (in thousands) | | | | |
| | | | | | |
Presidio Landmark | | | San Francisco, California | | | Q3-2010 | | | 161 | | | $ | 117 | | | $ | 1,579 | | | $ | 2,566 | |
DKLB BKLN | | | Brooklyn, New York | | | Q4-2009/Q2-2010 (1) | | | 365 | | | | 7,069 | | | | 2,015 | | | | 4,736 | |
North Church Towers | | | Parma Heights, Ohio | | | Q3-2009(2) | | | 399 | | | | 1,787 | | | | 1,393 | | | | 212 | |
Hamel Mill Lofts | | | Haverhill, Massachusetts | | | Q4-2008/Q3-2010 (1) | | | 305 | | | | 2,067 | | | | 983 | | | | 932 | |
Mercantile Place on Main | | | Dallas, Texas | | | Q1-2008/Q4-2008 (1) | | | 366 | | | | 1,643 | | | | (550 | ) | | | (21 | ) |
| | | | | | | | | | | | | | |
Total | | | | | | | | | | | | $ | 12,683 | | | $ | 5,420 | | | $ | 8,425 | |
| | | | | | | | | | | | | | |
| (1) | Property to open in phases. |
Comparable average occupancy for the Residential Group is 94.7% and 93.8% for the years ended January 31, 2012 and 2011, respectively. Average residential occupancy for the years ended January 31, 2012 and 2011 is calculated by dividing gross potential rent less vacancy by gross potential rent. Gross potential rent (“GPR”) is calculated based on actual rents per lease agreements for occupied apartment units and at market rents for vacant apartment units. Market rental rates are determined using a variety of factors which include availability of specific apartment unit types (one bedroom, two bedroom, etc.), seasonality factors and rents offered by competitive properties for similar apartment types in the same geographic market. Comparable average occupancy relates to properties opened and operated in both the years ended January 31, 2012 and 2011.
Comparable net rental income (“NRI”) for our Residential Group was 92.2% and 90.0% for the years ended January 31, 2012 and 2011, respectively. NRI is an operating statistic that represents the percentage of potential rent received after deducting vacancy and rent concessions from GPR.
56
Comparable NOI is an operating statistic defined as net operating income from properties opened and operated in all periods presented net of noncontrolling interests. Comparable NOI increased 7.3% and 4.3% for the years ended January 31, 2012 and 2011 compared to the same periods in the prior year. The increase in comparable net operating income is primarily related to continued improvements in occupancies, rents, and a continued reduction in concessions.
Military Housing Fee Revenues– Development fees related to military housing projects are earned based on a contractual percentage of the actual development costs incurred. Additional development incentive fees are recognized based upon successful completion of criteria, such as incentives to realize development cost savings, encourage small and local business participation, comply with specified safety standards and other project management incentives as specified in the development agreements. Development and development incentive fees of $35,323,000, $5,861,000 and $14,030,000 were recognized during the years ended January 31, 2012, 2011 and 2010, respectively, which were recorded in revenues from real estate operations.
Construction management fees are earned based on a contractual percentage of the actual construction costs incurred. Additional construction incentive fees are recognized based upon successful completion of certain criteria as set forth in the construction contracts. Construction and incentive fees of $4,158,000, $5,618,000 and $9,857,000 were recognized during the years ended January 31, 2012, 2011 and 2010, respectively, which were recorded in revenues from real estate operations.
Property management and asset management fees are earned based on a contractual percentage of the annual net rental income and annual operating income, respectively, that is generated by the military housing privatization projects as defined in the agreements. Additional property management incentive fees are recognized based upon successful completion of certain criteria as set forth in the property management agreements. Property management, management incentive and asset management fees of $17,456,000, $15,975,000 and $15,448,000 were recognized during the years ended January 31, 2012, 2011 and 2010, respectively, which were recorded in revenues from real estate operations.
Land Development Group
On January 31, 2012, our Board of Directors approved a strategic decision by senior management to reposition portions of the investment in our Land Development Group as part of a greater focus on core rental products in core markets. The Land Development Group buys and sells raw land, develops subdivisions and sells lots to homebuilders. The economic downturn, particularly in the housing market, has led to increased volatility in the land projects, making it challenging to fit into our long-term strategic plan. We have approximately 35 active land projects in which we are currently reviewing our divestiture options. The primary regions with active land projects that we are actively seeking to divest include the southwestern United States, Texas, North Carolina and Ohio. These projects will continue to be reported in the Land Development Group through their disposition. As a result of our strategic decision to divest, we dramatically shortened the estimated holding periods of the land projects. This reduced estimate of future undiscounted cash flows was not sufficient to recover the carrying value of the assets, resulting in an impairment charge. For additional information, see the “Impairment of Real Estate” and “Impairment of Unconsolidated Entities” section of the MD&A.
We will retain our land holdings at our Stapleton project in Denver, which is fully consolidated, and the Central Station project in downtown Chicago, which is accounted for on the equity method of accounting.
Operating results of the Land Development Group are discussed below.
Revenues from Real Estate Operations – Land sales and the related gross margins vary from period to period depending on the timing of sales and general market conditions. Although improved over the same period in the prior year, our land sales continue to be impacted by decreased demand from home buyers in certain core markets for the land business, reflecting conditions throughout the housing industry. Revenues from real estate operations for the Land Development Group increased by $12,289,000 for the year ended January 31, 2012 compared to the same period in the prior year. This variance is primarily attributable to the following increases:
| | • | | $12,093,000 related to higher land sales atStapleton in Denver, Colorado; and |
| | • | | $1,909,000 related to higher land sales atTangerine Crossing in Tucson, Arizona, andMill Creek in York County, South Carolina. |
The balance of the remaining decrease of $1,713,000 was primarily due to fluctuations in land sales at other land development projects.
57
Revenues from real estate operations for the Land Development Group increased by $11,864,000 for the year ended January 31, 2011 compared to the same period in the prior year. This variance is primarily attributable to the following increases:
| | • | | $9,502,000 related to higher land sales atStapleton; and |
| | • | | $4,560,000 related to higher land sales atTangerine Crossing,Mill Creek,Legacy Lakes in Aberdeen, North Carolina,Waterbury in North Ridgeville, Ohio and a land development project in Eaton Township, Ohio. |
These increases were partially offset by the following decrease:
| | • | | $2,327,000 related to lower unit sales atRockport Square in Lakewood, Ohio and lower land sales at Creekstone in Copley, Ohio. |
The balance of the remaining increase of $129,000 was primarily due to fluctuations in land sales at other land development projects.
Operating and Interest Expenses –Operating expenses for the Land Development Group increased by $8,893,000 for the year ended January 31, 2012 compared to the same period in the prior year. This variance is primarily attributable to the following increases:
| | • | | $6,880,000 primarily related to higher land sales atStapleton; and |
| | • | | $2,045,000 related to higher land sales atTangerine Crossing andMill Creek. |
The balance of the remaining decrease of $32,000 was primarily due to fluctuations in land sales and operating results at other land development projects.
Operating expenses for the Land Development Group increased by $5,531,000 for the year ended January 31, 2011 compared to the same period in the prior year. This variance is primarily attributable to the following increases:
| | • | | $8,727,000 primarily related to higher land sales atStapleton;and |
| | • | | $4,706,000 primarily related to higher land sales atTangerine Crossing, Mill Creek,Legacy Lakes,Waterbury and a land development project in Eaton Township, Ohio. |
These increases were partially offset by the following decreases:
| | • | | $2,735,000 primarily related to lower unit sales atRockport Square and lower land sales at Creekstone; and |
| | • | | $2,500,000 nonrecurring legal settlement in 2009 related to a former joint venture. |
The balance of the remaining decrease of $2,667,000 was primarily due to fluctuations in land sales and operating result at other land development projects.
Interest expense for the Land Development Group increased by $436,000 for the year ended January 31, 2012 and $898,000 during the year ended January 31, 2011 compared to the same periods in the prior years. Interest expense varies from year to year depending on the level of interest-bearing debt within the Land Development Group and interest rates.
The Nets
On May 12, 2010, we closed on a purchase agreement with entities controlled by Mikhail Prokhorov (“MP Entities”). Pursuant to the terms of the purchase agreement, the MP Entities invested $223,000,000 and made certain funding commitments (“Funding Commitments”) to acquire 80% of The Nets, 45% of Brooklyn Arena, LLC (“Arena”) and the right to purchase up to 20% of Atlantic Yards Development Company, LLC, which will develop non-arena real estate. In accordance with the Funding Commitments, the MP Entities agreed to fund The Nets operating needs up to $60,000,000, including reimbursements to us for loans made to cover The Nets operating needs from March 1, 2010 to May 12, 2010 totaling $15,000,000. Of this total reimbursement, $9,237,000 represented operating losses incurred during the period from March 1, 2010 to May 12, 2010, which was recognized in our gain on the sale of The Nets during the year ended January 31, 2011 (see the “Net Gain on Disposition of Partial Interests in Rental Properties and Other Investment” section of the MD&A). The MP Entities met the
58
$60,000,000 funding commitment during the three months ended July 31, 2011. As a result, we are, through our investment in Nets Sports and Entertainment, LLC (“NS&E”), required to fund 100% of The Nets operating needs, as defined, until theBarclays Centerarena is complete and open, which is expected to be during the three months ended October 31, 2012. Thereafter, members’ capital contributions will be made in accordance with the operating agreements. During the year ended January 31, 2012, we funded $22,978,000 of The Nets operating needs related predominantly to the 2011-2012 season.
The amount of equity in loss, net of noncontrolling interests, was $26,814,000, $12,075,000 and $43,489,000 for the years ended January 31, 2012, 2011 and 2010, respectively. The increase in 2011 compared to 2010 is primarily due to the $60,000,000 funding commitment having been met by the MP Entities during the three months ended July 31, 2011 resulting in the allocation of losses to NS&E. The decrease in 2010 compared to 2009 is primarily due to the allocation of losses to the MP Entities, since May 12, 2010, as discussed above.
Corporate Activities
Operating and Interest Expenses – Operating expenses for Corporate Activities increased by $5,555,000 for the year ended January 31, 2012 compared to the prior year. The increase was attributed to increased payroll and related benefits, including stock-based compensation of $5,627,000 and professional fees of $4,200,000 associated with strategic planning and process improvement initiatives, offset by a decrease in a nonrecurring expense of $4,000,000 related to the settlement of a liability claim that we may be able to recoup in the future.
Operating expenses increased $7,173,000 for the year ended January 31, 2011 compared to the prior year. The increase was primarily related to increased payroll and related benefits, including stock-based compensation of $2,038,000, an increase in a nonrecurring expense of $4,000,000 related to the settlement of a liability claim as discussed above, an increase in professional fees of $2,823,000 associated with strategic planning and process improvement initiatives, offset by a decrease to company-wide severance and outplacement expenses of $3,395,000. Included in Corporate Activities payroll and related benefits was termination benefit expense of approximately $5,600,000 and $5,300,000 for the years ended January 31, 2012 and 2011, respectively, related to respective workforce reduction during those periods.
Interest expense decreased by $7,046,000 for the year ended January 31, 2012 compared to the prior year, primarily as a result of decreased interest on our revolving credit facility as a result of decreased borrowings and a lower interest rate and the exchange of $110,000,000 and $40,000,000 of our 2016 Senior Notes for Class A common stock in January 2011 and May 2011, respectively, partially offset by interest on the $350,000,000 of our 2018 Senior Notes issued in July 2011.
Interest expense decreased by $17,007,000 for the year ended January 31, 2011 compared to the prior year, as a result of the retirement of the $178,749,000 of our 2011, 2015 and 2017 Senior Notes in exchange for a new issuance of Series A preferred stock on March 9, 2010 and decreased interest expense on corporate interest rate swaps due to a reduction in the strike rate of the active swaps compared to the London Interbank Offered Rate (“LIBOR”) rate which stayed at historically low levels throughout 2010.
Other Activity
The following items are discussed on a consolidated basis.
Interest and Other Income
Interest and other income was $52,114,000, $52,818,000 and $53,945,000 for the years ended January 31, 2012, 2011 and 2010, respectively. The decrease of $704,000 for the year ended January 31, 2012 compared to the prior year is primarily due to a decrease of $4,683,000 related to the income recognition on the sale of state and federal historic preservation tax credits and new market tax credits. This decrease was partially offset by an increase of $4,808,000 related to interest income earned on a total rate of return swap (“TRS”). The decrease of $1,127,000 for the year ended January 31, 2011 compared to the prior year is primarily due to a gain recognized in 2009 of $3,599,000 related to insurance proceeds received due to fire damage at an apartment building in excess of the net book value of the damaged asset and a decrease of $719,000 related to the income recognition on the sale of state and federal historic preservation tax credits, Brownfield tax credits and new market tax credits. These decreases were partially offset by an increase of $2,982,000 related to interest income earned on a TRS.
59
Equity in Earnings (Loss) of Unconsolidated Entities (also see the “Impairment of Unconsolidated Entities” section of the MD&A)
Equity in earnings of unconsolidated entities was $21,147,000 for the year ended January 31, 2012 and $42,265,000 for the year ended January 31, 2011, representing a decrease of $21,118,000. The variance is primarily attributable to the following decreases that occurred within our equity method investments:
| | • | | $6,443,000 related to the 2010 gain on disposition ofWoodbridge Crossing; |
| | • | | $3,936,000 primarily related to 2010 lease termination fee income atSan Francisco Centre,a regional mall in San Francisco, California, that did not recur; and |
| | • | | $2,791,000 related to the 2010 gain on early extinguishment of the Urban Redevelopment Authority loan atLiberty Center, an office building located in Pittsburgh, Pennsylvania. |
| | • | | $15,633,000 primarily related to the 2010 gain on disposition ofMillender Center; |
| | • | | $5,537,000 related to the lease up losses of8 Spruce Streetcurrently being opened in phases andDKLB BKLN that opened in phases beginning in the fourth quarter of 2009. These two properties were consolidated until the recapitalization transaction in July 2011 which resulted in joint control of the investment; |
| | • | | $2,317,000 primarily related to increased interest expense due to an increased effective rate on the property level nonrecourse mortgage that is no longer hedged at the entity level atUptown Apartments, an apartment community in Oakland, California; |
| | • | | $2,215,000 related to the 2010 gain on disposition ofPebble Creek, an apartment community in Twinsburg, Ohio; and |
| | • | | $1,502,000 primarily related to a favorable 2010 legal settlement atOceanpointe Towers, a senior housing apartment community in Long Branch, New Jersey. |
| | • | | $8,496,000 related to The Nets. |
These decreases were partially offset by the following increases:
| | • | | $7,861,000 related to the change from full consolidation method of accounting to equity method upon the formation of a new joint venture in 2011 with an outside partner in 15 retail properties in the New York City metropolitan area; |
| | • | | $2,557,000 related to the 2010 write-off of an abandoned development project in Pittsburgh, Pennsylvania; and |
| | • | | $1,046,000 related to the 2010 loss on disposition of our partnership interests inMetreon,a specialty retail center in San Francisco, California. |
| | • | | $9,964,000 relates to the 2011 gain on disposition of our partnership interest inMetropolitan Lofts; |
| | • | | $2,603,000 relates to the 2011 gain on disposition of our partnership interest inTwin Lake Towers; and |
| | • | | $1,116,000 primarily related to a 2010 nonrecurring legal settlement at3800 Wilshire, a condominium project in Los Angeles, California. |
| | • | | $1,926,000 related to the 2011 gain on early extinguishment of nonrecourse mortgage debt atSterling Lakes,a mixed-use land development project in Pepper Pike, Ohio. |
The balance of the remaining increase of $679,000 was due to fluctuations in the operations of our equity method investments.
60
Equity in earnings of unconsolidated entities was $42,265,000 for the year ended January 31, 2011 and $21,303,000 for the year ended January 31, 2010, representing an increase of $20,962,000. The variance is primarily attributable to the following increases that occurred within our equity method investments:
| | • | | $9,195,000 related to the 2010 contribution of partnership interests to a new joint venture in theUniversity Park project resulting in joint control with the outside partner. The seven buildings were fully consolidated in 2009 and converted to the equity method of accounting in 2010 due to the partial disposition; |
| | • | | $6,443,000 related to the 2010 gain on disposition ofWoodbridge Crossing; |
| | • | | $3,190,000 primarily related to lease termination fee income atSan Francisco Centre; and |
| | • | | $2,791,000 related to the 2010 gain on early extinguishment of the Urban Redevelopment Authority loan atLiberty Center. |
| | • | | $15,633,000 primarily related to the 2010 gain on disposition ofMillender Center; |
| | • | | $5,243,000 primarily related to a decrease in lease-up losses atUptown Apartments; |
| | • | | $3,934,000 related to the deconsolidation of seven properties as a result of adopting new accounting guidance on the consolidation of VIEs; |
| | • | | $2,684,000 related to the 2010 disposition of partial interests in three apartment communities,The Grand,Lenox ClubandLenox Park, which were fully consolidated in 2009 and converted to the equity method of accounting in 2010 upon the partial disposition; |
| | • | | $2,215,000 related to the 2010 gain on disposition ofPebble Creek; and |
| | • | | $1,502,000 related to a favorable 2010 legal settlement atOceanpointe Towers. |
| | • | | $1,904,000 related to increased land sales at various land development projects in San Antonio, Texas. |
| | • | | $25,171,000 related to a reduction in our share of the losses of The Nets. |
These increases were partially offset by the following decreases:
| | • | | $4,533,000 related to the deconsolidation of a property as a result of adopting new accounting guidance on the consolidation of VIEs; |
| | • | | $2,557,000 related to the 2010 write-off of an abandoned development project in Pittsburgh, Pennsylvania; and |
| | • | | $1,046,000 related to the 2010 loss on disposition of our partnership interests inMetreon. |
| | • | | $31,703,000 related to the 2009 gain on disposition of our partnership interest in threeClassic Residence by Hyattproperties; |
| | • | | $6,983,000 related to the 2009 gain on disposition of our partnership interest inClarkwood; |
| | • | | $6,577,000 related to the 2009 gain on disposition of our partnership interest inGranada Gardens; and |
| | • | | $4,498,000 related to the 2009 gain on disposition of our partnership interest inBoulevard Towers. |
61
| | • | | $2,396,000 related to the 2009 net gain on an industrial land sale atMesa del Sol; and |
| | • | | $1,874,000 related to the 2009 gain on early extinguishment of nonrecourse mortgage debt atShamrock Business Centerin Painesville, Ohio. |
The balance of the remaining increase of $3,224,000 was due to fluctuations in the operations of our equity method investments.
Amortization of Mortgage Procurement Costs
We amortize mortgage procurement costs over the term of the related nonrecourse mortgage debt and notes payable. For the years ended January 31, 2012, 2011 and 2010, we recorded amortization of mortgage procurement costs of $11,812,000, $11,484,000 and $13,653,000, respectively. Amortization of mortgage procurement costs increased $328,000 and decreased $2,169,000 for the years ended January 31, 2012 and 2011, respectively, compared to the same periods in the prior years.
Gain (Loss) on Extinguishment of Debt
See Note S – Impairment of Real Estate, Impairment of Unconsolidated Entities, Write-off of Abandoned Development Projects and Gain (Loss) on Extinguishment of Debt in the Notes to Consolidated Financial Statements in Item 8 of this Form 10-K for detailed information.
Impairment of Real Estate
We review our real estate portfolio, including land held for development and sale, for impairment whenever events or changes indicate that our carrying value of the long-lived assets may not be recoverable. In cases where we do not expect to recover our carrying costs, an impairment charge is recorded. In order to determine whether the carrying costs are recoverable from estimated future undiscounted cash flows, we use various assumptions that include future net operating income, estimated holding periods, risk of foreclosure and estimated cash proceeds received upon the disposition of the asset. If the carrying costs are not recoverable, we are required to record an impairment to reduce the carrying costs to estimated fair value. The assumptions used to estimate fair value are considered to be Level 2 or 3 inputs. Our assumptions were based on current information. If the conditions mentioned above continue to deteriorate, or if our plans regarding our assets change, additional impairment charges may occur in the future.
The impairments recorded during the years ended January 31, 2012, 2011 and 2010 represent write-downs to the estimated fair value due to changes in events, such as a change in strategy for certain assets, a bona fide third-party purchase offer or changes in certain assumptions, including estimated holding periods and current market conditions and the impact of these assumptions to the properties’ estimated future cash flows.
The following table summarizes our impairment of real estate included in continuing operations.
| | $000,000,000 | | | $000,000,000 | | | | $000,000,000 | | | | $000,000,000 | |
| | | | | Years Ended January 31, | |
| | | | | 2012 | | | 2011 | | | 2010 | |
| | | | | (in thousands) | |
Land held for divestiture | | Various | | $ | 115,654 | | | $ | - | | | $ | - | |
Investment in triple net lease retail property | | Portage, Michigan | | | 3,435 | | | | - | | | | 3,552 | |
Development property at Waterfront Station | | Washington, D.C. | | | - | | | | 3,103 | | | | - | |
Gladden Farms (Land Project) | | Marana, Arizona | | | - | | | | 650 | | | | 2,985 | |
Other | | | | | 235 | | | | 1,010 | | | | 2,370 | |
| | | | $ | 119,324 | | | $ | 4,763 | | | $ | 8,907 | |
On January 31, 2012, our Board of Directors approved a strategic decision by senior management to reposition portions of the investment in our Land Development Group as part of a greater focus on core rental products in core markets. The Land Development Group buys and sells raw land, develops subdivisions and sells lots to homebuilders. The economic downturn, particularly in the housing market, has led to increased volatility in the land projects, making it challenging to fit into our long-term strategic plan. We have approximately 35 active land projects, including 18 accounted for on the equity method, in which we are currently reviewing our divestiture options. The primary regions with active land projects that we are actively seeking to divest include the southwestern United States, Texas, North Carolina and Ohio. Accordingly, these land assets and related nonrecourse mortgage debt have been reclassified as held for sale on the Consolidated Balance Sheets at January 31, 2012. Held for sale assets are required to be recorded at fair value less cost to sell. As a result of our strategic decision to divest, we dramatically shortened the estimated holding periods of the land projects. This reduced estimate of future undiscounted cash flows was not sufficient to recover the carrying value of the assets, resulting in an impairment charge of $115,654,000 during the year ended January 31, 2012.
62
In addition, we had impairments related to consolidated real estate assets that were disposed of during the periods presented. The following table summarizes our impairment of real estate included in discontinued operations.
| | $00,000.00 | | | $00,000.00 | | | | $00,000.00 | | | | $00,000.00 | |
| | | | | Years Ended January 31, | |
| | | | | 2012 | | | 2011 | | | 2010 | |
| | | | | (in thousands) | |
250 Huron (Office Building) | | Cleveland, Ohio | | $ | 10,257 | | | $ | 2,040 | | | $ | - | |
Simi Valley Town Center (Regional Mall) | | Simi Valley, California | | | - | | | | 76,962 | | | | - | |
Investment in triple net lease retail property | | Pueblo, Colorado | | | - | | | | 2,641 | | | | - | |
Saddle Rock Village (Specialty Retail Center) | | Aurora, Colorado | | | - | | | | - | | | | 13,179 | |
Two Sterling Glen supported-living apartment communities | | Great Neck, | | | | | | | | | | | | |
| New York and Glen Cove, New York | | | - | | | | - | | | | 9,775 | |
101 San Fernando (Apartment Community) | | San Jose, California | | | - | | | | - | | | | 4,440 | |
| | | | $ | 10,257 | | | $ | 81,643 | | | $ | 27,394 | |
In 2008,250 Huron, an office building located in Cleveland, Ohio was vacated by its single tenant, which occupied the entire building. A lease termination payment received by us was placed into escrow for the purpose of servicing the nonrecourse mortgage debt until new tenants for the building could be obtained. During 2010, we entered into an option to sell the building at a sales price that was below the carrying value, resulting in an impairment charge of $2,040,000 during the year ended January 31, 2011. Unable to obtain the necessary lender approval for the purchaser to assume the nonrecourse mortgage debt, the option to sell expired in August 2011. Subsequently, we received a notice of default from the loan servicer. As a result, we no longer intended to hold the property long term and dramatically shortened its estimated holding period. This reduced estimate of future undiscounted cash flows was not sufficient to recover the carrying value of the asset, resulting in an impairment charge of $10,257,000 during the year ended January 31, 2012. The impairment, which was recorded prior to the ultimate disposition, resulted in the carrying value of the real estate being less than the nonrecourse mortgage. During December 2011, the lender sold the nonrecourse mortgage debt to a third party with whom we entered into negotiations to transfer the property to in full satisfaction of the outstanding nonrecourse mortgage debt balance. During January 2012, we transferred the property to the new nonrecourse mortgage debt holder in full satisfaction of the debt. As a result, upon disposition, we recorded a gain on disposition of $9,428,000 for the year ended January 31, 2012. Upon disposition, we reclassified all revenues and expenses, as well as the gain to discontinued operations.
Occupancy levels and estimated future cash flows were significantly decreasing during 2010 atSimi Valley Town Center, a regional mall located in Simi Valley, California, due to the consolidation of two anchor stores at the property, greater competition than originally anticipated and the general economic downturn. We had ongoing discussions with the mortgage lender regarding the performance of the property and the expectation that it would be unable to generate sufficient cash flow to cover the debt service of the nonrecourse mortgage note. During the year ended January 31, 2011, the mortgage lender determined it wanted to exit the investment by selling the nonrecourse mortgage note and we agreed to transfer the property to the purchaser of the nonrecourse mortgage upon a sale. Based on these events and changes in circumstances, we dramatically shortened our estimated asset holding period. As a result, estimated future undiscounted cash flows were not sufficient to recover the carrying value and the asset was recorded at its estimated fair value resulting in an impairment charge of $76,962,000 during the year ended January 31, 2011. The impairment, which was recorded prior to the ultimate disposition in December 2010, resulted in the carrying value of the real estate being less than the nonrecourse mortgage. As a result, upon disposition, we recorded a gain of $46,802,000 for the year ended January 31, 2011. Upon disposition, we reclassified all revenues and expenses, as well as the gain to discontinued operations.
In addition, we recorded impairments of real estate for other properties included in discontinued operations as described in the table above. These impairments represent a write down to the estimated fair value due to changes in events, related to a bona fide third-party purchase offer and consideration of current market conditions and the impact of these events to the properties’ estimated future cash flows.
Impairment of Unconsolidated Entities
We review our portfolio of unconsolidated entities for other-than-temporary impairments whenever events or changes indicate that our carrying value in the investments may be in excess of fair value. An equity method investment’s value is impaired if management’s estimate of its fair value is less than the carrying value and the difference is deemed to be other-than-temporary. In order to arrive at the estimates of fair value, we use varying assumptions that may include comparable sale prices, market discount rates, market capitalization rates and estimated future discounted cash flows specific to the geographic region and property type. For newly opened properties, assumptions also include the timing of initial lease up at the property and tenant improvements. In the event the initial lease up assumptions differ from actual results, estimated future discounted cash flows may vary resulting in impairment charges in future periods.
63
The following table summarizes our impairment of unconsolidated entities.
| | $0000000 | | | $0000000 | | | | $0000000 | | | | $0000000 | |
| | | | | Years Ended January 31, | |
| | | | | 2012 | | | 2011 | | | 2010 | |
| | | | | (in thousands) | |
Equity method investments in land entities | | Various | | $ | 41,902 | | | $ | - | | | $ | - | |
Specialty Retail Centers: | | | | | | | | | | | | | | |
Village at Gulfstream Park | | Hallandale Beach, Florida | | | 35,674 | | | | 35,000 | | | | - | |
Metreon | | San Francisco, California | | | - | | | | 4,595 | | | | - | |
Commercial land and development rights | | Cleveland, Ohio | | | 4,610 | | | | - | | | | - | |
Four Museum Park properties at Central Station | | Chicago, Illinois | | | - | | | | 18,311 | | | | - | |
Office Buildings: | | | | | | | | | | | | | | |
818 Mission Street | | San Francisco, California | | | - | | | | 4,018 | | | | - | |
Bulletin Building | | San Francisco, California | | | - | | | | 3,543 | | | | - | |
Millender Center | | Detroit, Michigan | | | - | | | | - | | | | 10,317 | |
Pittsburgh Peripheral (Commercial Group Land Project) | | Pittsburgh, Pennsylvania | | | - | | | | - | | | | 7,217 | |
Uptown Apartments | | Oakland, California | | | - | | | | - | | | | 6,781 | |
Classic Residence by Hyatt (Supported-Living Apartments) | | Yonkers, New York | | | - | | | | - | | | | 3,152 | |
Other | | | | | - | | | | 6,992 | | | | 8,889 | |
| | | | $ | 82,186 | | | $ | 72,459 | | | $ | 36,356 | |
As mentioned earlier, we have made a strategic decision to divest of portions of our Land Development Group, which includes 18 land development projects accounted for on the equity method. During the customary due diligence in arriving at the strategic decision, we had in-depth interactions with industry consultants, brokers and other land owners. Based on the due diligence, it was apparent that land values for the residential housing market continued to deteriorate in the fourth quarter of 2011, specifically in the southwestern United States. We revised our assumptions used to arrive at the estimate of fair value, including future discounted cash flows, comparable sales prices and market discount rates by geographic region. As a result, we recorded an impairment charge of $41,902,000 during the year ended January 31, 2012.
The impairments recorded during the years ended January 31, 2012 and 2011 atVillage at Gulfstream Park, a specialty retail center in Hallandale Beach, Florida represent other-than-temporary impairments in our equity method investment. The specialty retail center was fully opened in February 2010 and was leased during the general economic downturn which resulted in a longer initial lease up period than originally projected and increased rent concessions to the existing tenant base. Based on these conditions, management revised its estimate of future discounted cash flows, which are a key component in estimating fair value, resulting in an impairment charge of $35,000,000 during the year ended January 31, 2011. During the year ended January 31, 2012, the general economic conditions continued to negatively impact the operating results at the specialty retail center. The specialty retail center has continued to experience a slower than anticipated lease-up period and has not reached the expected level of cash flows used in previous estimates of fair value. Based on these conditions, management revised its estimate of future discounted cash flows downward. As a result, our equity method investment was recorded at its estimated fair value, resulting in an additional impairment charge of $35,674,000 during the year ended January 31, 2012.
The impairments recorded during the year ended January 31, 2011 atCentral Station, a mixed-use land development project in Chicago, Illinois represent other-than-temporary impairments in our investments of four unconsolidated entities which hold investments in certain condominium buildings. Due to the continued price deterioration of the Chicago condominium market, we made a strategic business decision during the year ended January 31, 2011 to rent some of the condominium units. This decision combined with other changes in circumstances resulted in a reduction of estimated discounted cash flows expected from these entities which are a key component in the associated fair value estimates. As a result, the investments in the unconsolidated entities were recorded at these reduced estimated fair values as of January 31, 2011, resulting in the impairment charges during the year ended January 31, 2011.
Write-Off of Abandoned Development Projects
On a quarterly basis, we review each project under development to determine whether it is probable the project will be developed. If we determine that the project will not be developed, project costs are written off as an abandoned development project cost. We abandon certain projects under development for a number of reasons, including, but not limited to, changes in local market conditions, increases in construction or financing costs or third party challenges related to entitlements or public financing. We wrote off abandoned development projects of $8,838,000, $9,195,000 and $20,739,000 for the years ended January 31, 2012, 2011 and 2010, respectively, which were recorded in operating expenses.
64
In addition, included in equity in earnings of unconsolidated entities are write-offs of $3,045,000 and $304,000 for the years ended January 31, 2011 and 2010, respectively, which represent our proportionate share of write-offs of abandoned development projects of equity method investments. We had no write-offs of abandoned development projects related to unconsolidated entities for the year ended January 31, 2012.
Depreciation and Amortization
We recorded depreciation and amortization expense of $218,601,000, $234,728,000 and $256,606,000 for the years ended January 31, 2012, 2011 and 2010, respectively, which is a decrease of $16,127,000, or 6.9%, and $21,878,000, or 8.5%, compared to the same periods in the prior years. The decrease for the year ended January 31, 2012 compared to the prior year is primarily attributable to the disposition of partial interests in rental properties, the largest of which related to 15 retail properties during the first quarter of 2011, partially offset by new property openings. The decrease for the year ended January 31, 2011 compared to the prior year is primarily attributable to the deconsolidation of nine entities due to the adoption of new consolidation accounting guidance and the disposition of partial interests in three residential and seven commercial rental properties offset by new property openings.
Net Gain (Loss) on Disposition of Partial Interests in Rental Properties and Other Investment
The net gain (loss) on disposition of partial interests in rental properties and other investment is comprised of the following:
| | | $00000000 | | | | $00000000 | | | | $00000000 | |
| | | Years Ended January 31, | |
| | | 2012 | | | 2011 | | | 2010 | |
| | | (in thousands) | |
New York Retail Joint Venture | | $ | 9,561 | | | $ | - | | | $ | - | |
Stonecrest Mall Joint Venture | | | 5,849 | | | | - | | | | - | |
Annex building adjacent to the Dallas Wilson Building | | | 2,255 | | | | - | | | | - | |
University Park Joint Venture | | | - | | | | 176,192 | | | | - | |
The Nets | | | - | | | | 55,112 | | | | - | |
Bernstein Joint Venture | | | - | | | | 29,342 | | | | - | |
Other transaction costs | | | - | | | | (2,656 | ) | | | - | |
| | $ | 17,665 | | | $ | 257,990 | | | $ | - | |
See Note L - Net Gain (Loss) on Disposition of Partial Interests in Rental Properties and Other Investment in the Notes to Consolidated Financial statements in Item 8 of this Form 10-K for additional information.
Discontinued Operations
See Note T - Discontinued Operations and Gain (Loss) on Disposition of Rental Properties in the Notes to Consolidated Financial Statements in Item 8 of this Form 10-K for detailed information.
FINANCIAL CONDITION AND LIQUIDITY
With the exception of multi-family rental properties, ongoing economic conditions continue to put downward pressure on occupancies, rent levels and property values. Access to bank credit and capital has improved modestly since 2010, with the larger banks and permanent lenders indicating an increased interest in originating new loans for real estate projects, particularly as existing loans in their portfolios get paid off. Underwriting standards remain conservative, with lenders favoring high quality existing operating assets in strong markets. Originations of new loans for commercial mortgage backed securities remain well below the levels in 2006 and 2007. While a limited number of banks have begun to originate construction loans for new apartment projects, lending for land acquisition and construction loans for office or retail projects remain difficult to obtain. We believe loans for real estate projects will continue to be constrained for the foreseeable future.
Our principal sources of funds are cash provided by operations, including land sales, our bank revolving credit facility, nonrecourse mortgage debt and notes payable, dispositions of operating properties or development projects through sales or equity joint ventures, proceeds from the issuance of senior notes, proceeds from the issuance of common or preferred equity and other financing arrangements. We have consistently disposed of properties in an effort to recycle capital and reposition our portfolio. Over the last ten years, we have generated cash proceeds from sales and/or disposition of partial interests in rental properties that averaged in excess of $100,000,000 per year. Given the diversity of our portfolio by market and product type, we believe that the market for property dispositions at some level will continue to be available. The current market should allow us to continue our ongoing strategy to recycle capital and reposition the portfolio through property dispositions.
65
Our principal uses of funds are the financing of our real estate operating and development projects and acquisitions of real estate, capital expenditures for our existing portfolio and principal and interest payments on our nonrecourse mortgage debt, notes payable and bank revolving credit facility, interest and principal payments on our outstanding senior notes and dividend payments on our Series A preferred stock.
Our primary capital strategy seeks to isolate the operating and financial risk at the property level to maximize returns and reduce risk on and of our equity capital. As such, substantially all of our operating and development properties are separately encumbered with nonrecourse mortgage debt and notes payable. We do not cross-collateralize our mortgage debt and notes payable outside of a single identifiable project. We operate as a C-corporation and retain substantially all of our internally generated cash flows. This cash flow, together with refinancing and property sale proceeds, has historically provided us with the necessary liquidity to take advantage of investment opportunities. The economic downturn and its impact on the lending and capital markets reduced our ability to finance development and acquisition opportunities and also increased the required rates of return to make new investment opportunities appealing. As a result of these market changes, we have dramatically cut back on entering into new development and acquisition activities.
Despite the decrease in development activities, we intend to complete all projects that are under construction. We continue to make progress on certain other pre-development projects primarily located in core markets. The cash we believe is required to fund our equity in projects under construction and development plus any cash necessary to extend or paydown our 2012 debt maturities is anticipated to exceed our cash from operations. As a result, we intend to extend maturing debt or repay it with net proceeds from property sales, equity joint ventures or future debt or equity financing.
During the year ended January 31, 2012, we were successful in closing several transactions that improved our liquidity, strengthened our Balance Sheet and addressed certain near term maturities of our debt.
| | • | | We successfully entered into a Third Amended and Restated Credit Agreement and a Third Amended and Restated Guaranty of Payment of Debt (collectively, the “Credit Facility”) which fixed our total available borrowings at $450,000,000 while removing the provision to reduce this maximum for specified external capital raising events. The Credit Facility matures on March 30, 2014 and provides for one 12-month extension option, subject to certain conditions and replaces a previous facility that was set to expire February 1, 2012. Although both the new and previous facilities bear interest at LIBOR plus 3.75%, the LIBOR floor under the new Credit Facility was reduced from 200 basis points to 100 basis points. The Credit Facility removes the previous prohibition on paying common stock dividends, subject to a specified limitation. As amended on July 13, 2011, this limitation allows us to utilize up to $24,000,000 during any four consecutive fiscal quarter periods for either common stock dividends or common stock repurchases and required a portion of the proceeds from the issuance of our 2018 Senior Notes to be used to retire certain debt, as discussed below. |
| | • | | In July 2011, we issued $350,000,000 of our 2018 Senior Notes in a private placement (the “Issuance”). As required by our Credit Facility, 75% of the net proceeds ($254,531,000) were required to be used to retire debt no later than 180 days subsequent to the closing of such Issuance, subject to an additional 90 day extension provided certain terms of the amendment are met. During the three months ended October 31, 2011, using the proceeds from this Issuance, we made paydowns on selected nonrecourse mortgage debt, including properties specifically discussed below, in a continued effort to address near to mid-term debt maturities. In addition, the remaining $46,891,000 of our Puttable Equity-Linked Senior Notes due 2011 matured and were paid in full during the year ended January 31, 2012. As of January 31, 2012, the requirement has been met and no further reserve for retirement of debt is required. |
| | • | | We generated significant net proceeds from property sales and equity joint ventures of $353,243,000, the majority of which relates to new joint ventures formed with an outside partner for equity interests in 15 retail properties located in the New York City metropolitan area (see the “Net Gain on Disposition of Partial Interest in Rental Properties and Other Investment” section of the MD&A) and the sale ofWaterfront Station – East 4th & West 4th Buildings (see the “Discontinued Operations” section of the MD&A). This liquidity will be used to fund our equity requirements in our development projects and extend or paydown near term debt maturities. |
| | • | | During May 2011, we continued to address future liquidity needs related to our near to mid-term senior unsecured notes and deleverage our Balance Sheet, by entering into separate, privately negotiated exchange agreements whereby we exchanged $40,000,000 in aggregate principal of our 2016 Senior Notes for 3,444,293 shares of Class A common stock. This transaction strengthened our Balance Sheet by converting senior recourse debt with a 2016 maturity date with permanent equity. |
66
| | • | | During July 2011, we also completed recapitalizations and modified credit facilities for8 Spruce Street andDKLB BKLN. These transactions resulted in significant debt reduction for the properties. For8 Spruce Street, our 30% partner in the project converted its $110,000,000 of mezzanine debt to equity, increasing its equity ownership to 49%. We also modified the property’s existing nonrecourse financing, whereby the credit facility was reduced from $605,000,000 to $539,000,000 and the maturity was extended through July 1, 2016. These changes reduce total available debt on the property from $715,000,000 to $539,000,000. ForDKLB BKLN, the holder of $30,000,000 mezzanine debt converted its mezzanine debt to a 49% equity interest in the property. We also modified the property’s existing bank financing, whereby the balance was reduced from $117,000,000 to $104,000,000 and the maturity was extended through July 3, 2013. These changes reduce total debt on the property from $147,000,000 to $104,000,000. |
We continue to explore various other options to strengthen our balance sheet and enhance our liquidity, but can give no assurance that we can accomplish any of these other options on favorable terms or at all. If we cannot enhance our liquidity, it could adversely impact our growth and result in further curtailment of development activities.
As of January 31, 2012 we had $1,334,090,000 of nonrecourse mortgage financings with scheduled maturities during the fiscal year ending January 31, 2013, of which $93,883,000 represents regularly scheduled amortization payments. Subsequent to January 31, 2012, we have addressed $161,232,000 of these maturities, through closed transactions, commitments and/or automatic extensions. We also have extension options available on $669,022,000 of these 2012 maturities, all of which require some predefined condition in order to qualify for the extension, such as meeting or exceeding leasing hurdles, loan to value ratios or debt service coverage requirements. We cannot give assurance that the defined hurdles or milestones will be achieved to qualify for these extensions. We are currently in negotiations to refinance and/or extend the remaining $409,953,000 of nonrecourse debt scheduled to mature during the year ended January 31, 2013. We cannot give assurance as to the ultimate result of these negotiations. As with all nonrecourse mortgages, if we are unable to negotiate an extension or otherwise refinance the mortgage, we could go into default and the lender could commence foreclosure proceedings.
We have two nonrecourse mortgages amounting to $80,382,000 that are in default as of January 31, 2012 and are included in 2012 nonrecourse mortgage financings due during the fiscal year ended January 31, 2013. During 2011, the lender commenced foreclosure proceedings on one of these nonrecourse mortgages with a balance of $73,500,000. Upon the actual disposition of the asset securing the nonrecourse mortgage, we will be relieved of any payment obligation under the nonrecourse mortgage and will recognize a gain for the excess of the carrying value of the mortgage over the fair value of the asset disposed. We are actively negotiating with the lender on a $6,882,000 nonrecourse mortgage loan to resolve the mortgage default, although there is no assurance that the negotiations will be successful. If we are unable to successfully negotiate an extension, the lender could commence foreclosure proceedings and we could lose the real estate asset’s carrying value. The loss of either of these properties would not have a significant impact to our financial condition, cash flows or liquidity.
As of January 31, 2012, we had two nonrecourse mortgages greater than five percent of our total nonrecourse mortgage debt and notes payable. The mortgages, encumberingNew York Times, an office building in Manhattan, New York andWestchester’s Ridge Hill, have outstanding balances of $640,000,000 and $487,727,000, respectively, at January 31, 2012.
As of January 31, 2012, our share of nonrecourse mortgage debt and notes payable recorded on our unconsolidated subsidiaries amounted to $2,306,465,000 of which $207,659,000 ($25,515,000 represents scheduled principal payments) was scheduled to mature during the year ending January 31, 2013. Negotiations are ongoing on the 2012 maturities, but we cannot give assurance that we will obtain these financings on favorable terms or at all.
Two of our joint ventures accounted for under the equity method of accounting have nonrecourse mortgages that are past due or in default at January 31, 2012 (our proportional share of these mortgages is $5,829,000). If we go into default and are unable to negotiate an extension or otherwise cure the default, the lenders could commence foreclosure proceedings. The carrying value of our investments in the joint ventures was $-0- at January 31, 2012.
67
Financial Covenants
The Company’s Credit Facility and indenture dated May 19, 2003 (“2003 Indenture”) contain certain restrictive financial covenants. A summary of the key financial covenants as defined in each agreement, all of which the Company is compliant with at January 31, 2012, follows:
| | | | | | | | |
| | | Requirement
Per Agreement | | | As of
January 31, 2012 | |
| | | | |
| | | (dollars in thousands) | |
Credit Facility Financial Covenants | | | | | | | | |
| | |
Debt Service Coverage Ratio | | | 1.35x | | | | 1.93x | |
Cash Flow Coverage Ratio | | | 2.50x | | | | 3.86x | |
Total Development Ratio | | | <17% | | | | 10.64% | |
Minimum Consolidated Shareholders’ Equity, as defined | | $ | 2,320,175 | | | $ | 3,505,097 | |
| | |
2003 Indenture Financial Covenants(1) | | | | | | | | |
| | |
Ratio of Consolidated EBITDA to Interest | | | >1.30x | | | | 1.82x | |
Minimum Net Worth, as defined | | $ | 999,434 | | | $ | 4,061,179 | |
| | (1) | Violation of these financial covenants alone would not automatically cause the notes issued under the 2003 Indenture to become due and payable, but would prevent the Company from incurring or permitting a subsidiary from incurring additional debt, as defined in the 2003 Indenture, unless otherwise permitted by the 2003 Indenture. |
Bank Revolving Credit Facility
The following table summarizes available credit on the Credit Facility:
| | | | | | | | |
| | | January 31, | |
| | | | |
| | | 2012 | | | 2011 | |
| | | | |
| | | (in thousands) | |
Maximum borrowings | | $ | 450,000 | | | $ | 470,336 | |
Less outstanding balances and reserves: | | | | | | | | |
Borrowings | | | - | | | | 137,152 | |
Letters of credit | | | 69,389 | | | | 63,418 | |
Surety bonds | | | - | | | | - | |
Reserve for retirement of indebtedness | | | - | | | | 46,891 | |
| | | | |
Available credit | | $ | 380,611 | | | $ | 222,875 | |
| | | | |
See Note G – Bank Revolving Credit Facility in the Notes to Consolidated Financial Statements in Item 8 of this Form 10-K for additional information.
68
Senior and Subordinated Debt
The following table summarizes our senior and subordinated debt:
| | | | | | | | |
| | | January 31, | |
| | | | |
| | | 2012 | | | 2011 | |
| | | | |
| | | (in thousands) | |
Senior Notes: | | | | | | | | |
3.625% Puttable Equity-Linked Senior Notes due 2011, net of discount | | $ | - | | | $ | 45,480 | |
3.625% Puttable Equity-Linked Senior Notes due 2014, net of discount | | | 199,132 | | | | 198,806 | |
7.625% Senior Notes due 2015 | | | 178,253 | | | | 178,253 | |
5.000% Convertible Senior Notes due 2016 | | | 50,000 | | | | 90,000 | |
6.500% Senior Notes due 2017 | | | 132,144 | | | | 132,144 | |
4.250% Convertible Senior Notes due 2018 | | | 350,000 | | | | - | |
7.375% Senior Notes due 2034 | | | 100,000 | | | | 100,000 | |
| | | | |
| | |
Total Senior Notes | | | 1,009,529 | | | | 744,683 | |
| | | | |
| | |
Subordinated Debt: | | | | | | | | |
Subordinate Tax Revenue Bonds due 2013 | | | 29,000 | | | | 29,000 | |
| | | | |
| | |
Total Senior and Subordinated Debt | | $ | 1,038,529 | | | $ | 773,683 | |
| | | | |
See Note H – Senior and Subordinated Debt in the Notes to Consolidated Financial Statements in Item 8 of this Form 10-K for additional information.
Nonrecourse Debt Financings
We use taxable and tax-exempt nonrecourse debt for our real estate projects. Substantially all of our operating and development properties are separately encumbered with nonrecourse mortgage debt which in some limited circumstances is supplemented by nonrecourse notes payable (collectively “nonrecourse debt”). For real estate projects financed with tax-exempt debt, we generally utilize variable-rate debt. For construction loans, we generally pursue variable-rate financings with maturities ranging from two to five years. For those real estate projects financed with taxable debt, we generally seek long-term, fixed-rate financing for those operating projects whose loans mature or are projected to open and achieve stabilized operations.
We are actively working to refinance and/or extend the maturities of the nonrecourse debt that is coming due in the next 24 months. During the year ended January 31, 2012, we completed the following financings:
| | | | |
| Purpose of Financing | | Amount | |
| | | (in thousands) | |
Refinancings | | $ | 339,154 | |
Construction and development projects(1) | | | 347,237 | |
Loan extensions/additional fundings | | | 535,411 | |
| | | | |
| | $ | 1,221,802 | |
| | | | |
| | (1) | Represents the full amount available to be drawn on the loans. |
69
Cash Flows
Operating Activities
Net cash provided by operating activities was $298,763,000, $267,247,000 and $420,329,000 for the years ended January 31, 2012, 2011 and 2010, respectively. The increase in net cash provided by operating activities for the year ended January 31, 2012, compared to the year ended January 31, 2011, of $31,516,000 and the decrease in net cash provided by operating activities for the year ended January 31, 2011, compared to the year ended January 31, 2010, of $153,082,000 are the result of the following (in thousands):
| | | | | | | | |
| | | Years Ended January 31, | |
| | | | |
| | | 2012 vs. 2011 | | | 2011 vs. 2010 | |
| | | | |
| | |
Decrease in rents and other revenues received | | $ | (93,373 | ) | | $ | (85,924 | ) |
Decrease in interest and other income received | | | (40,620 | ) | | | (18,304 | ) |
Increase in cash distributions from unconsolidated entities | | | 12,597 | | | | 7,032 | |
Increase in proceeds from land sales-Land Development Group | | | 8,961 | | | | 11,405 | |
Increase in proceeds from land sales-Commercial Group | | | 20,694 | | | | 5,269 | |
Increase in land development expenditures | | | (256 | ) | | | (17,340 | ) |
Decrease (increase) in operating expenditures | | | 38,078 | | | | (39,835 | ) |
Decrease (increase) in restricted cash and escrowed funds used for operating purposes | | | 27,347 | | | | (26,784 | ) |
Decrease in interest paid | | | 58,088 | | | | 11,399 | |
| | | | |
| | |
Net increase (decrease) in cash provided by operating activities | | $ | 31,516 | | | $ | (153,082 | ) |
| | | | |
70
Investing Activities
Net cash used in investing activities was $440,197,000, $847,049,000 and $1,153,946,000 for the years ended January 31, 2012, 2011 and 2010, respectively. The net cash used in investing activities consisted of the following:
| | | $00000000 | | | | $00000000 | | | | $00000000 | |
| | | Years Ended January 31, | |
| | | | |
| | | 2012 | | | 2011 | | | 2010 | |
| | | | |
| | | (in thousands) | |
Capital expenditures: | | | | | | | | | | | | |
Projects under construction or development: | | | | | | | | | | | | |
Barclays Center, a sports arena complex under construction in Brooklyn, New York(1) | | $ | (249,139 | ) | | $ | (123,046 | ) | | $ | - | |
Westchester’s Ridge Hill, a regional mall in Yonkers, New York | | | (159,370 | ) | | | (118,213 | ) | | | (184,165 | ) |
Atlantic Yards, a mixed-use development project in Brooklyn, New York | | | (111,752 | ) | | | (127,780 | ) | | | (18,702 | ) |
8 Spruce Street, an unconsolidated mixed-use residential project in Manhattan, New York(2) | | | (47,583 | ) | | | (133,272 | ) | | | (216,152 | ) |
Waterfront Station-East 4th & West 4th Buildings, office buildings in Washington, D.C. | | | (9,967 | ) | | | (10,541 | ) | | | (115,438 | ) |
DKLB BKLN, an unconsolidated apartment building in Brooklyn, New York(2) | | | (359 | ) | | | (21,285 | ) | | | (82,155 | ) |
Village at Gulfstream Park, an unconsolidated specialty retail center in Hallandale Beach, Florida(2) | | | - | | | | - | | | | (69,729 | ) |
Other | | | (130,412 | ) | | | (119,037 | ) | | | (174,222 | ) |
| | | | |
Total projects under construction or development(3) | | | (708,582 | ) | | | (653,174 | ) | | | (860,563 | ) |
| | | |
Operating properties: | | | | | | | | | | | | |
Commercial Segment | | | (12,759 | ) | | | (21,189 | ) | | | (41,221 | ) |
Residential Segment | | | (13,351 | ) | | | (9,998 | ) | | | (11,616 | ) |
Other | | | (1,193 | ) | | | (111 | ) | | | (277 | ) |
| | | | |
Total operating properties | | | (27,303 | ) | | | (31,298 | ) | | | (53,114 | ) |
| | | |
Tenant improvements: | | | | | | | | | | | | |
Commercial Segment | | | (24,496 | ) | | | (38,686 | ) | | | (28,932 | ) |
| | | | |
Total capital expenditures | | $ | (760,381 | ) | | $ | (723,158 | ) | | $ | (942,609 | ) |
| | | | |
| | | |
Payment of lease procurement costs(4) | | | (22,907 | ) | | | (20,387 | ) | | | (13,153 | ) |
| | | |
(Increase) decrease in other assets | | | (14,489 | ) | | | (57,226 | ) | | | 2,373 | |
| | | |
Decrease (increase) in restricted cash used for investing purposes: | | | | | | | | | | | | |
Barclays Center, a sports arena complex under construction in Brooklyn, New York(1) | | $ | 143,615 | | | $ | (132,542 | ) | | $ | - | |
8 Spruce Street, an unconsolidated mixed-use residential project in Manhattan, New York(2) | | | 49,665 | | | | (68,485 | ) | | | (17,085 | ) |
Foundry Lofts, an apartment community in Washington, D.C. | | | 26,286 | | | | (31,677 | ) | | | - | |
John Hopkins Parking Garage, in East Baltimore, Maryland | | | 14,350 | | | | - | | | | - | |
Westchester’s Ridge Hill, a regional mall in Yonkers, New York | | | 3,898 | | | | (20,637 | ) | | | - | |
DKLB BKLN, an unconsolidated apartment building in Brooklyn, New York(2) | | | 571 | | | | 19,817 | | | | (1,958 | ) |
Atlantic Yards, a mixed-use development project in Brooklyn, New York | | | (118,967 | ) | | | (23,465 | ) | | | (141,642 | ) |
John Hopkins-855 North Wolfe Street, an office building in East Baltimore, Maryland | | | (21,417 | ) | | | - | | | | - | |
Hamel Mill Lofts, an apartment community in Haverhill, Massachusetts | | | (7,060 | ) | | | (1,723 | ) | | | (1,730 | ) |
Sky55, an apartment complex in Chicago, Illinois | | | (6,783 | ) | | | - | | | | - | |
Collateral returned (posted) for a forward swap onEast River Plaza,an unconsolidated retail project in Manhattan, New York | | | - | | | | 22,930 | | | | (378 | ) |
Village at Gulfstream Park, an unconsolidated specialty retail center in Hallandale Beach, Florida(2) | | | - | | | | - | | | | 17,103 | |
Collateral returned for a TRS onSterling Glen of Rye Brook,a supported-living community in Rye Brook, New York | | | - | | | | - | | | | 12,500 | |
Other | | | 5,999 | | | | (13,242 | ) | | | 861 | |
| | | | |
Total decrease (increase) in restricted cash used for investing purposes | | $ | 90,157 | | | $ | (249,024 | ) | | $ | (132,329 | ) |
| | | | |
| | | |
Proceeds from disposition of full or partial interests in rental properties and other investments: | | | | | | | | | | | | |
Disposition of partial interests in 15 retail properties in the New York metropolitan area | | $ | 166,510 | | | $ | - | | | $ | - | |
Waterfront Station-East 4th & West 4th Buildings, office buildings in Washington, D.C. | | | 126,123 | | | | - | | | | - | |
Ritz-Carlton, a hotel in Cleveland, Ohio | | | 31,006 | | | | - | | | | - | |
Development project in Washington, D.C. | | | 19,348 | | | | - | | | | - | |
Charleston Marriott, a hotel in Charleston, West Virginia | | | 7,480 | | | | - | | | | - | |
Disposition of annex building adjacent to theDallas Wilson Building,an apartment building in Dallas, Texas | | | 2,776 | | | | - | | | | - | |
Disposition of partial interests in seven buildings in ourUniversity Parkproject in Cambridge, Massachusetts | | | - | | | | 139,457 | | | | - | |
Disposition of partial interests in three apartment communities in the Washington D.C. metropolitan area | | | - | | | | 28,922 | | | | - | |
101 San Fernando, an apartment community in San Jose, California | | | - | | | | 20,534 | | | | - | |
Investment in triple net lease retail property | | | - | | | | 1,676 | | | | - | |
Saddle Rock Village, a specialty retail center in Aurora, Colorado | | | - | | | | 756 | | | | - | |
Grand Avenue,a specialty retail center in Queens, New York | | | - | | | | - | | | | 9,042 | |
Four Sterling Glen supported-living communities | | | - | | | | - | | | | 2,872 | |
Proceeds from a note receivable related to disposition of Lumber Group | | | - | | | | - | | | | 1,172 | |
| | | | |
Total proceeds from disposition of full or partial interests in rental properties and other investments | | $ | 353,243 | | | $ | 191,345 | | | $ | 13,086 | |
| | | | |
71
Investing Activities(continued)
| | | $00000000 | | | | $00000000 | | | | $00000000 | |
| | | Years Ended January 31, | |
| | | | |
| | | 2012 | | | 2011 | | | 2010 | |
| | | | |
| | | (in thousands) | |
Change in investments in and advances to unconsolidated entities—(investment in) or return of investment: | | | | | | | | | | | | |
Dispositions: | | | | | | | | | | | | |
Metropolitan Lofts, an unconsolidated apartment community in Los Angeles, California | | $ | 12,590 | | | $ | - | | | $ | - | |
Metreon, an unconsolidated specialty retail center in San Francisco, California | | | - | | | | 17,882 | | | | - | |
Millender Center, (hotel, parking, office and retail) in Detroit, Michigan | | | - | | | | 14,130 | | | | - | |
Classic Residence by Hyatt, three unconsolidated supported-living communities in Teaneck, New Jersey, | | | | | | | | | | | | |
Chevy Chase, Maryland and Yonkers, New York | | | - | | | | - | | | | 30,101 | |
Residential Projects: | | | | | | | | | | | | |
8 Spruce Street, an unconsolidated mixed-use residential project under construction in Manhattan, New York(2) | | | (62,467 | ) | | | - | | | | - | |
DKLB BKLN, an unconsolidated apartment community in Brooklyn, New York(2) | | | (11,894 | ) | | | - | | | | - | |
An unconsolidated residential development project in Boston, Massachusetts | | | (6,217 | ) | | | - | | | | - | |
Uptown Apartments, an unconsolidated apartment community in Oakland, California | | | (2,650 | ) | | | (3,497 | ) | | | (4,239 | ) |
Bayside Village, primarily refinancing proceeds from an unconsolidated apartment community in San Francisco | | | - | | | | - | | | | 18,819 | |
Autumn Ridge, primarily refinancing proceeds from an unconsolidated senior housing apartment community in Sterling Heights, Michigan | | | - | | | | 4,886 | | | | - | |
The Grand,Lenox Club andLenox Park, primarily proceeds from additional financing at the unconsolidated entity that owns these apartment communities located in the Washington D.C. area | | | - | | | | 4,000 | | | | - | |
Plymouth Square, primarily refinancing proceeds from an unconsolidated senior housing apartment community in Detroit, Michigan | | | - | | | | 3,467 | | | | - | |
Cambridge Towers, primarily refinancing proceeds from an unconsolidated senior housing apartment community in Detroit, Michigan | | | - | | | | 3,453 | | | | - | |
St. Mary's Villa, primarily refinancing proceeds from an unconsolidated senior housing apartment community in Newark, New Jersey | | | - | | | | - | | | | 4,830 | |
The Nets, a National Basketball Association member | | | (22,978 | ) | | | - | | | | (45,000 | ) |
Commercial Projects: | | | | | | | | | | | | |
Queens Place, primarily refinancing proceeds from an unconsolidated specialty retail center in Queens, New York | | | 12,600 | | | | - | | | | - | |
65/80 Landsdowne Street, primarily refinancing proceeds from an unconsolidated office building in Cambridge, Massachusetts | | | 12,059 | | | | - | | | | - | |
Village at Gulfstream Park, an unconsolidated specialty retail center in Hallandale Beach, Florida(2) | | | (11,600 | ) | | | (10,445 | ) | | | - | |
818 Mission Street, an unconsolidated office building in San Francisco, California | | | (4,455 | ) | | | - | | | | - | |
Liberty Center, contribution for the repayment of debt at an unconsolidated office building in Pittsburgh, Pennsylvania | | | - | | | | (4,300 | ) | | | - | |
East River Plaza, an unconsolidated specialty retail center in Manhattan, New York | | | - | | | | - | | | | (20,978 | ) |
Barclays Center, a sports arena complex under construction in Brooklyn, New York(1) | | | - | | | | - | | | | (18,590 | ) |
Land Development: | | | | | | | | | | | | |
Woodforest, an unconsolidated project in Houston, Texas | | | - | | | | (3,850 | ) | | | - | |
Gladden Farms II, an unconsolidated project in Marana, Arizona | | | - | | | | - | | | | (6,312 | ) |
Return of temporary advances from various Commercial Group properties to implement uniform portfolio cash management process | | | - | | | | (9,527 | ) | | | (28,100 | ) |
Other net advances of investment of equity method investments and other advances to affiliates | | | (808 | ) | | | (4,798 | ) | | | (11,845 | ) |
| | | | |
Subtotal | | $ | (85,820 | ) | | $ | 11,401 | | | $ | (81,314 | ) |
| | | | |
Net cash used in investing activities | | $ | (449,978 | ) | | $ | (847,049 | ) | | $ | (1,153,946 | ) |
| | | | |
| | (1) | This project changed from the equity method of accounting to full consolidation during the year ended January 31, 2010 due to the adoption of new accounting guidance for the consolidation of VIEs. Changes in investments in and advances to unconsolidated entities represent activity prior to the change to full method of accounting while capital expenditures and changes in restricted cash represent activity after the change to full method of accounting. |
| | (2) | 8 Spruce Street andDKLB BKLN changed from the full consolidation method of accounting to equity method of accounting during the year ended January 31, 2012 due to recapitalization transactions.Village at Gulfstream Park changed from the full consolidation method of accounting to equity method of accounting during the year ended January 31, 2011 due to the adoption of new accounting guidance for the consolidation of VIEs. Capital expenditures and changes in restricted cash represent activity prior to the change to equity method of accounting while changes in investments in and advances to unconsolidated entities represent activity subsequent to the change to equity method of accounting. |
| | (3) | We capitalized internal costs related to projects under construction and development of $50,739, $56,514 and $50,877, including compensation related costs of $41,278, $47,703 and $40,964 for the years ended January 31, 2012, 2011 and 2010, respectively. Total capitalized internal costs represent approximately 6.59%, 7.81% and 5.40% of total capital expenditures for the years ended January 31, 2012, 2011 and 2010, respectively. |
| | (4) | We capitalized internal costs related to leasing activities of $6,839, $5,481 and $6,995, including compensation related costs of $5,493, $4,129 and $5,045 for the years ended January 31, 2012, 2011 and 2010, respectively. |
72
Financing Activities
Net cash provided by financing activities was $165,548,000, $521,769,000 and $717,717,000 for the years ended January 31, 2012, 2011 and 2010, respectively. The net cash provided by financing activities consisted of the following:
| | | $0000000 | | | | $0000000 | | | | $0000000 | |
| | | Years Ended January 31, | |
| | | | |
| | | 2012 | | | 2011 | | | 2010 | |
| | | | |
| | | (in thousands) | |
| | | |
Proceeds from nonrecourse mortgage debt and notes payable | | $ | 695,449 | | | $ | 658,833 | | | $ | 770,972 | |
Principal payments on nonrecourse mortgage debt and notes payable | | | (572,584 | ) | | | (321,629 | ) | | | (260,294 | ) |
Borrowings on bank revolving credit facility | | | 464,575 | | | | 876,052 | | | | 844,000 | |
Payments on bank revolving credit facility | | | (601,727 | ) | | | (822,416 | ) | | | (1,125,984 | ) |
Payment of Puttable Equity-Linked Senior Notes due 2011 | | | (39,407 | ) | | | - | | | | - | |
Payment of subordinated debt | | | - | | | | - | | | | (20,400 | ) |
Proceeds from issuance of Convertible Senior Notes due 2018, net of $10,625 of issuance costs | | | 339,375 | | | | - | | | | - | |
Payment of transaction costs related to exchanges of Convertible Senior Notes due 2016 for Class A common stock | | | (3,200 | ) | | | - | | | | - | |
Purchase of senior notes due 2011 and 2017 | | | - | | | | (16,569 | ) | | | - | |
Proceeds received from partial termination of Convertible Senior Notes hedge | | | - | | | | 1,869 | | | | - | |
Proceeds from Puttable Equity-Linked Senior Notes due 2014, net of $2,803 of issuance costs and discount | | | - | | | | - | | | | 29,764 | |
Proceeds from Convertible Senior Notes due 2016, net of $6,838 of issuance costs | | | - | | | | - | | | | 193,162 | |
Payment for Convertible Senior Notes hedge transaction | | | - | | | | - | | | | (15,900 | ) |
Payment of deferred financing costs | | | (14,923 | ) | | | (36,745 | ) | | | (32,756 | ) |
Change in restricted cash and escrowed funds and book overdrafts | | | (1,578 | ) | | | (1,322 | ) | | | (4,251 | ) |
Proceeds from issuance of Series A preferred stock, net of $5,544 of issuance costs | | | - | | | | 44,456 | | | | - | |
Payment for equity call hedge related to the issuance of Series A preferred stock | | | - | | | | (17,556 | ) | | | - | |
Dividends paid to preferred shareholders | | | (15,400 | ) | | | (11,807 | ) | | | - | |
Sale of common stock, net | | | - | | | | - | | | | 329,917 | |
Purchase of treasury stock | | | (1,670 | ) | | | (786 | ) | | | (133 | ) |
Exercise of stock options | | | 195 | | | | 2,621 | | | | 128 | |
Contributions from redeemable noncontrolling interest | | | - | | | | 181,909 | | | | - | |
Contributions from noncontrolling interests | | | 6,087 | | | | 5,636 | | | | 21,831 | |
Distributions to noncontrolling interests | | | (89,644 | ) | | | (20,777 | ) | | | (12,339 | ) |
| | | | |
Net cash provided by financing activities | | $ | 165,548 | | | $ | 521,769 | | | $ | 717,717 | |
| | | | |
CLASS A COMMON UNITS
We and certain of our affiliates entered into a Master Contribution and Sale Agreement (the “Master Contribution Agreement”) with Bruce C. Ratner (“Mr. Ratner”), an Executive Vice President and Director of ours, and certain entities and individuals affiliated with Mr. Ratner (the “BCR Entities”) on August 14, 2006. Pursuant to the Master Contribution Agreement, on November 8, 2006, we issued Class A Common Units (“Units”) in a jointly-owned limited liability company to the BCR Entities in exchange for their interests in a total of 30 retail, office and residential operating properties, and certain service companies, all in the greater New York City metropolitan area. We accounted for the issuance of the Units in exchange for the noncontrolling interests under the purchase method of accounting. The Units may be exchanged for one of the following forms of consideration at our sole discretion: (i) an equal number of shares of our Class A common stock or, (ii) cash based on a formula using the average closing price of the Class A common stock at the time of conversion or, (iii) a combination of cash and shares of our Class A common stock. We have no rights to redeem or repurchase the Units. At January 31, 2012 and 2011, 3,646,755 Units were outstanding. The carrying value of the Units of $186,021,000 is included as noncontrolling interests at January 31, 2012 and 2011.
Also pursuant to the Master Contribution Agreement, we and Mr. Ratner agreed that certain projects under development would remain owned jointly until such time as each individual project was completed and achieved “stabilization.” As each of the development projects achieves stabilization, it is valued and we, in our discretion, choose among various options for the ownership of the project following stabilization consistent with the Master Contribution Agreement. The development projects were not covered by the Tax Protection Agreement (the “Tax Protection Agreement”) that the parties entered into in connection with the Master Contribution Agreement. The Tax Protection Agreement indemnified the BCR Entities included in the initial closing against taxes payable by reason of any subsequent sale of certain operating properties.
In accordance with the terms of the Tax Protection Agreement, we paid the BCR Entities $1,074,000 and $1,695,000 for tax indemnification during the years ended January 31, 2012 and 2011.
73
New York Times and Twelve MetroTech Center
Two of the development projects,New York Times, an office building located in Manhattan, New York andTwelve MetroTech Center, an office building located in Brooklyn, New York, achieved stabilization in 2008. We elected to cause certain of our affiliates to acquire for cash the BCR Entities’ interests in the two projects pursuant to agreements dated May 6, 2008 and May 12, 2008, respectively. In accordance with the agreements, the applicable BCR Entities assigned and transferred their interests in the two projects to affiliates of ours and will receive approximately $121,000,000 over a 15 year period. An affiliate of ours has also agreed to indemnify the applicable BCR Entity against taxes payable by it by reason of a subsequent sale or other disposition of one of the projects. The tax indemnity provided by the affiliate of ours expires on December 31, 2014 and is similar to the indemnities provided for the operating properties under the Tax Protection Agreement.
The consideration exchanged by us for the BCR Entities’ interest in the two development projects has been accounted for under the purchase method of accounting. Pursuant to the agreements, the BCR Entities received an initial cash amount of $49,249,000. We calculated the net present value of the remaining payments over the 15 year period using a discounted interest rate. This initial discounted amount of $56,495,000 was recorded in accounts payable and accrued expenses and will be accreted up to the total liability through interest expense over the next 15 years using the effective interest method.
COMMITMENTS AND CONTINGENCIES
See Note P – Commitments and Contingencies in the Notes to Consolidated Financial Statements in Item 8 of this Form 10-K for detailed information.
CONTRACTUAL OBLIGATIONS AND OFF-BALANCE SHEET ARRANGEMENTS
As of January 31, 2012, we are subject to certain contractual obligations, some of which are off-balance sheet, as described in the table below:
| | | $000000000 | | | | $000000000 | | | | $000000000 | | | | $000000000 | | | | $000000000 | | | | $000000000 | | | | $000000000 | |
| | | Payments Due by Period | |
| | | January 31, | |
| | | Total | | | 2013 | | | 2014 | | | 2015 | | | 2016 | | | 2017 | | | Thereafter | |
| | | | |
| | | (in thousands) | |
Long-Term Debt: | | | | | | | | | | | | | | | | | | | | | | | | | | | | |
Nonrecourse mortgage debt and notes payable(1) | | $ | 5,659,523 | | | $ | 1,334,090 | | | $ | 787,769 | | | $ | 316,194 | | | $ | 346,610 | | | $ | 420,946 | | | $ | 2,453,914 | |
Share of nonrecourse mortgage debt and notes payable of unconsolidated entities | | | 2,306,465 | | | | 207,659 | | | | 246,128 | | | | 272,980 | | | | 153,966 | | | | 376,624 | | | | 1,049,108 | |
Bank revolving credit facility(2) | | | - | | | | - | | | | - | | | | - | | | | - | | | | - | | | | - | |
Senior and subordinated debt | | | 1,038,529 | | | | - | | | | 29,000 | | | | 199,132 | | | | 178,253 | | | | 50,000 | | | | 582,144 | |
Interest payments on long-term debt | | | 2,663,843 | | | | 449,486 | | | | 384,873 | | | | 322,975 | | | | 282,518 | | | | 242,493 | | | | 981,498 | |
Preferred stock dividends(3) | | | 77,000 | | | | 15,400 | | | | 15,400 | | | | 15,400 | | | | 15,400 | | | | 15,400 | | | | - | |
Operating leases | | | 107,026 | | | | 6,333 | | | | 5,605 | | | | 4,700 | | | | 4,648 | | | | 4,720 | | | | 81,020 | |
Share of operating leases of unconsolidated entities | | | 546,996 | | | | 11,000 | | | | 11,049 | | | | 10,992 | | | | 11,121 | | | | 11,440 | | | | 491,394 | |
Construction contracts | | | 326,770 | | | | 318,925 | | | | 7,003 | | | | 238 | | | | 211 | | | | 217 | | | | 176 | |
Military housing construction contracts(4) | | | 316,683 | | | | 133,279 | | | | 117,553 | | | | 50,429 | | | | 15,422 | | | | - | | | | - | |
Other(5) | | | 73,580 | | | | 37,196 | | | | 33,648 | | | | 1,576 | | | | 941 | | | | 193 | | | | 26 | |
| | | | |
| | | | | | | |
Total Contractual Obligations | | $ | 13,116,415 | | | $ | 2,513,368 | | | $ | 1,638,028 | | | $ | 1,194,616 | | | $ | 1,009,090 | | | $ | 1,122,033 | | | $ | 5,639,280 | |
| | | | |
| | (1) | We have a substantial amount of nonrecourse mortgage debt, the details of which are further described within Item 7A. Quantitative and Qualitative Disclosures About Market Risk. We are contractually obligated to pay the interest and principal when due on these mortgages. Because we utilize mortgage debt as one of our primary sources of capital, the balances and terms of the mortgages, and therefore the estimate of future contractual obligations including interest payments, are subject to frequent changes due to property dispositions, mortgage refinancings, changes in variable interest rates and new mortgage debt in connection with property additions. |
| | (2) | The Credit Facility matures on March 30, 2014. |
| | (3) | These amounts represent dividends that we are obligated to declare and pay on our 7.0% Series A cumulative perpetual convertible preferred stock. For purposes of this table, we assume that all preferred stock is converted into Class A common stock on January 31, 2017. |
| | (4) | These amounts represent funds that we are obligated to pay under various construction contracts related to our military housing projects where we act as the construction manager. These obligations are primarily reimbursable costs from the respective projects and a corresponding account receivable is recorded when the costs are incurred. |
| | (5) | These amounts represent funds that we are legally obligated to pay under various service contracts, employment contracts and licenses over the next several years as well as unrecognized tax benefits. These contracts are typically greater than one year and either do not contain a cancellation clause or cannot be terminated without substantial penalty. We have several service contracts with vendors related to our property management including maintenance, landscaping, security and phone service. In addition, we have other service contacts that we enter into during our normal course of business which extend beyond one year and are based on usage including snow plowing, answering services, copier maintenance and cycle painting. As we are unable to predict the usage variables, these contracts have been excluded from our summary of contractual obligations at January 31, 2012. |
74
INFLATION
Substantially all of our long-term leases contain provisions designed to mitigate the adverse impact of inflation. Such provisions include clauses enabling us to receive additional rental income from escalation clauses, which generally increase rental rates during the terms of the leases and/or percentage rentals based on tenants’ gross sales. Such escalations are determined by negotiation, increases in the consumer price index or similar inflation indices. In addition, we seek increased rents upon renewal at market rates for our short-term leases. Most of our leases require the tenants to pay a share of operating expenses, including common area maintenance, real estate taxes, insurance and utilities, thereby reducing our exposure to increases in costs and operating expenses resulting from inflation.
LEGAL PROCEEDINGS
We are involved in various claims and lawsuits incidental to our business, and management and legal counsel believe that these claims and lawsuits will not have a material adverse effect on our consolidated financial statements.
NEW ACCOUNTING GUIDANCE
The following accounting pronouncements were adopted during the year ended January 31, 2012:
In December 2010, the Financial Accounting Standards Board (“FASB”) issued an amendment to the accounting guidance on the disclosure of supplementary pro forma information for business combinations. This guidance specifies that if a public entity is required to present pro forma comparative financial statements for business combinations that occurred during the current reporting period, the entity should disclose revenue and earnings of the combined entity as though the business combination(s) that occurred during the current year had occurred as of the beginning of the comparable prior annual reporting period only. The guidance is effective for fiscal years beginning on or after December 15, 2010. The adoption of this guidance on February 1, 2011 did not have an impact on our consolidated financial statement disclosures.
In December 2010, the FASB issued an amendment to the accounting guidance on goodwill and other intangible assets. This guidance specifies when to perform Step 2 of the goodwill impairment test for reporting units with zero or negative carrying amounts. For those reporting units with zero or negative carrying amounts, an entity is required to perform Step 2 of the goodwill impairment test if it is more likely than not that a goodwill impairment exists. In determining whether it is more likely than not that a goodwill impairment exists, an entity should consider whether there are any adverse qualitative factors indicating that an impairment may exist. The guidance is effective for fiscal years beginning after December 15, 2010. The adoption of this guidance on February 1, 2011 did not have a material impact on our consolidated financial statements.
The following new accounting pronouncements will be adopted on their respective required effective dates:
In December 2011, the FASB issued an amendment to the accounting guidance on derecognition of in substance real estate. This guidance specifies that when a parent company (reporting entity) ceases to have a controlling financial interest (as described in the accounting guidance on Consolidation) in a subsidiary that is in substance real estate as a result of a default on the subsidiary’s nonrecourse debt, the reporting entity should apply the guidance on property, plant and equipment to determine whether it should derecognize the in substance real estate. Generally, a reporting entity would not satisfy the requirements to derecognize the in substance real estate before the legal transfer of the real estate to the lender and the extinguishment of the related nonrecourse indebtedness. This guidance is effective for annual and interim reporting periods beginning on or after June 15, 2012. Early adoption is permitted. As this guidance is transactional based, we cannot estimate its impact on our consolidated financial statements.
In December 2011, the FASB issued an amendment to the accounting guidance on the presentation of the balance sheet. This guidance requires entities to disclose both gross information and net information on both instruments and transactions eligible for offset on the balance sheets and instruments and transactions subject to an agreement similar to a master netting arrangement. This guidance is effective for annual and interim reporting periods beginning on or after January 1, 2013. Early adoption is not permitted. We do not expect the adoption of the guidance to have a material impact on our consolidated financial statements.
In September 2011, the FASB issued an amendment to the accounting guidance on testing goodwill for impairment. This guidance provides an entity the option to first assess qualitative factors to determine whether the existence of events or circumstances leads to a determination that it is more likely than not that the fair value of a reporting unit is less than its carrying amount. If after performing a qualitative assessment, an entity determines that it is not more likely than not that the fair market value of a reporting unit is less than its carrying amount, then performing the two-step goodwill impairment test is not necessary. If an entity concludes otherwise, it is then required to perform the first step of the two-step goodwill impairment test. This guidance is effective for annual and interim goodwill impairment tests performed for fiscal years beginning after
75
December 15, 2011. Early adoption is permitted. We do not expect the adoption of this accounting guidance to have a material impact on our consolidated financial statements.
In June 2011, the FASB issued an amendment to the accounting guidance for the presentation of comprehensive income. This guidance provides an entity the option to present the total of comprehensive income, the components of net income, and the components of other comprehensive income either in a single continuous statement of comprehensive income or in two separate but consecutive statements. In addition, this guidance requires an entity to present on the face of the financial statements reclassification adjustments for items that are reclassified from other comprehensive income to net income in the statement(s) where the components of net income and the components of other comprehensive income are presented. In December 2011, the FASB issued guidance which defers the new presentation requirements for reclassification adjustments of items that are reclassified from other comprehensive income to net income in the statement(s) where the components of net income and the components of other comprehensive income are presented. This guidance, except for the indefinitely deferred guidance on the new presentation requirements for reclassification adjustments, is effective for annual and interim reporting periods beginning after December 15, 2011. Early adoption is permitted. We do not expect the adoption of this accounting guidance to have a material impact on our consolidated financial statements.
In May 2011, the FASB issued amendments to the accounting guidance on fair value measurement and disclosure requirements. This guidance results in common fair value measurement and disclosure requirements for financial statements prepared in accordance with accounting principles generally accepted in the United States of America (“GAAP”) and International Financial Reporting Standards. As a result, this guidance changes the wording used to describe many of the existing requirements for measuring fair value and for disclosing information about fair value measurements, but for many requirements the intent is not to change the existing application. Some of the guidance clarifies the FASB’s intent about the application of existing fair value measurement requirements or may change a particular principle or requirement for measuring fair value or for disclosing information about fair value measurements. This guidance is effective for annual and interim reporting periods beginning after December 15, 2011. Early adoption is not permitted. We do not expect the adoption of the guidance to have a material impact on our consolidated financial statements.
In April 2011, the FASB issued an amendment to the guidance on accounting for transfers and servicing to improve the accounting for repurchase agreements and other agreements that entitle and obligate a transferor to repurchase or redeem financial assets before their maturity. The guidance specifies when an entity may or may not recognize a sale upon the transfer of financial assets subject to repurchase agreements, based upon whether the entity has maintained effective control over the transferred financial assets. This guidance is effective for annual and interim reporting periods beginning on or after December 15, 2011. Early adoption is not permitted. We do not expect the adoption of this accounting guidance to have a material impact on our consolidated financial statements.
INFORMATION RELATING TO FORWARD-LOOKING STATEMENTS
This Annual Report on Form 10-K, together with other statements and information publicly disseminated by us, contains “forward-looking statements” within the meaning of Section 27A of the Securities Act of 1933, as amended, and Section 21E of the Securities Exchange Act of 1934, as amended. Such statements reflect management’s current views with respect to financial results related to future events and are based on assumptions and expectations that may not be realized and are inherently subject to risks and uncertainties, many of which cannot be predicted with accuracy and some of which might not even be anticipated. Future events and actual results, financial or otherwise, may differ from the results discussed in the forward-looking statements. Risk factors discussed in Item 1A of this Form 10-K and other factors that might cause differences, some of which could be material, include, but are not limited to, the impact of current lending and capital market conditions on our liquidity, ability to finance or refinance projects and repay our debt, the impact of the current economic environment on the ownership, development and management of our real estate portfolio, general real estate investment and development risks, vacancies in our properties, the strategic decision to reposition or divest portions of our land business, further downturns in the housing market, competition, illiquidity of real estate investments, bankruptcy or defaults of tenants, anchor store consolidations or closings, international activities, the impact of terrorist acts, risks associated with an investment in a professional sports team, our substantial debt leverage and the ability to obtain and service debt, the impact of restrictions imposed by our credit facility and senior debt, exposure to hedging agreements, the level and volatility of interest rates, the continued availability of tax-exempt government financing, the impact of credit rating downgrades, effects of uninsured or underinsured losses, effects of a downgrade or failure of our insurance carriers, environmental liabilities, conflicts of interest, risks associated with the sale of tax credits, risks associated with developing and managing properties in partnership with others, the ability to maintain effective internal controls, compliance with governmental regulations, increased legislative and regulatory scrutiny of the financial services industry, volatility in the market price of our publicly traded securities, inflation risks, litigation risks, cybersecurity risks and cyber incidents, as well as other risks listed from time to time in our reports filed with the Securities and Exchange Commission. We have no obligation to revise or update any forward-looking statements, other than imposed by law, as a result of future events or new information. Readers are cautioned not to place undue reliance on such forward-looking statements.
76
Item 7A. Quantitative and Qualitative Disclosures About Market Risk
Our market risk includes the increased difficulty or inability to obtain construction loans, refinance existing construction loans into long-term fixed-rate nonrecourse financing, refinance existing nonrecourse financing at maturity, obtain renewals or replacement of credit enhancement devices, such as letters of credit, or otherwise obtain funds by selling real estate assets or by raising equity (see the “Lending and Capital Market Conditions May Negatively Impact Our Liquidity and Our Ability to Finance or Refinance Projects or Repay Our Debt” section of Item 1A. Risk Factors). We also have interest-rate exposure on our current variable-rate debt portfolio. During the construction period, we have historically used variable-rate debt to finance developmental projects. At January 31, 2012, our outstanding variable-rate debt consisted of $1,802,629,000 of taxable debt and $437,209,000 of tax-exempt debt. Upon opening and achieving stabilized operations, we have historically procured long-term fixed-rate financing for our rental properties. With the volatility of the capital markets, we may not be able to procure long-term fixed-rate financing and periodically must pursue extending maturities with existing lenders at current market terms. Additionally, we are exposed to interest rate risk upon maturity of our long-term fixed-rate financings.
Interest Rate Exposure
At January 31, 2012, the composition of nonrecourse debt was as follows:
| | | | | | | | | | | | | | | | | | | | |
| | | Operating
Properties | | | Development
Projects | | | Land
Projects | | | Total | | | Total
Weighted
Average Rate | |
| | | | |
| | | (dollars in thousands) | |
| | | | | |
Fixed Rate | | $ | 3,008,293 | | | $ | 406,619 | | | $ | 4,773 | | | $ | 3,419,685 | | | | 5.65 | % |
Variable Rate | | | | | | | | | | | | | | | | | | | | |
Taxable | | | 1,378,585 | | | | 409,733 | | | | 14,311 | | | | 1,802,629 | | | | 4.76 | % |
Tax-Exempt | | | 421,434 | | | | - | | | | 15,775 | | | | 437,209 | | | | 1.55 | % |
| | | | | | | | | | | | | | | | | | | | |
| | $ | 4,808,312 | | | $ | 816,352 | | | $ | 34,859 | | | $ | 5,659,523 | | | | 5.05 | % |
| | | | | | | | | | | | | | | | | | | | |
| | | | |
Total gross commitment from lenders | | | $ | 1,338,181 | | | $ | 35,058 | | | | | | | | | |
| | | | | | | | | | | | | | | | | | | | |
To mitigate short-term variable interest rate risk, we have purchased interest rate hedges for our variable-rate debt as follows:
Taxable (Priced off of LIBOR Index)
| | | | | | | | | | | | | | | | |
| | | Caps | | | Swaps | |
| Period Covered | | Notional
Amount | | | Average Base
Rate | | | Notional
Amount | | | Average Base
Rate | |
| | | (dollars in thousands) | |
| | | | |
02/01/12-02/01/13 | | $ | 243,582 | | | | 3.36 % | | | $ | 897,193 | | | | 4.33 % | |
02/01/13-02/01/14 | | | 13,826 | | | | 6.55 | | | | 998,139 | | | | 4.02 | |
02/01/14-02/01/15 | | | 12,317 | | | | 6.50 | | | | 652,496 | | | | 5.44 | |
02/01/15-02/01/16 | | | - | | | | - | | | | 651,810 | | | | 5.45 | |
02/01/16-09/01/17 | | | - | | | | - | | | | 640,000 | | | | 5.50 | |
Tax-Exempt (Priced off of SIFMA Index)
| | | | | | | | |
| | | Caps | |
| Period Covered | | Notional
Amount | | | Average Base
Rate | |
| | | (dollars in thousands) | |
| | |
02/01/12-02/01/13 | | $ | 174,094 | | | | 5.83 % | |
02/01/13-02/01/14 | | | 161,379 | | | | 5.82 | |
02/01/14-01/02/15 | | | 118,655 | | | | 5.81 | |
The tax-exempt caps generally were purchased in conjunction with lender hedging requirements that require the borrower to protect against significant fluctuations in interest rates. Except for those requirements, we generally do not hedge tax-exempt debt because, since 1990, the base rate of this type of financing has averaged 2.67% and has never exceeded 8.00%.
77
Forward Swaps
We enter into forward swaps to protect ourselves against fluctuations in the swap rate at terms ranging between five to ten years associated with forecasted fixed rate borrowings. At the time we secure and lock an interest rate on an anticipated financing, we intend to simultaneously terminate the forward swap associated with that financing. At January 31, 2012, we had no forward swaps outstanding.
Sensitivity Analysis to Changes in Interest Rates
Including the effect of the protection provided by the interest rate swaps, caps and long-term contracts in place as of January 31, 2012, a 100 basis point increase in taxable interest rates (including properties accounted for under the equity method, corporate debt and the effect of interest rate floors) would increase the annual pre-tax interest cost for the next 12 months of our variable-rate debt by approximately $11,321,000 at January 31, 2012. Although tax-exempt rates generally move in an amount that is smaller than corresponding changes in taxable interest rates, a 100 basis point increase in tax-exempt rates (including properties accounted for under the equity method) would increase the annual pre-tax interest cost for the next 12 months of our tax-exempt variable-rate debt by approximately $6,789,000 at January 31, 2012. This analysis includes a portion of our taxable and tax-exempt variable-rate debt related to construction loans for which the interest expense is capitalized.
From time to time, we and/or certain of our joint ventures (the “Joint Ventures”) enter into TRS on various tax-exempt fixed-rate borrowings generally held by us and/or within the Joint Ventures. The TRS convert these borrowings from a fixed rate to a variable rate and provide an efficient financing product to lower the cost of capital. In exchange for a fixed rate, the TRS require that we and/or the Joint Ventures pay a variable rate, generally equivalent to the SIFMA rate plus a spread. At January 31, 2012 the SIFMA rate was 0.08%. Additionally, we and/or the Joint Ventures have guaranteed the fair value of the underlying borrowing. Any fluctuation in the value of the TRS would be offset by the fluctuation in the value of the underlying borrowing, resulting in minimal financial impact to us and/or the Joint Ventures. At January 31, 2012, the aggregate notional amount of TRS that are designated as fair value hedging instruments is $270,757,000. The underlying TRS borrowings are subject to a fair value adjustment. In addition, we have TRS with a notional amount of $172,063,000 that is not designated as fair value hedging instruments, but is subject to interest rate risk.
We estimate the fair value of our hedging instruments based on interest rate market and bond pricing models. At January 31, 2012 and 2011, we reported interest rate caps and floors at fair value of approximately $13,000 and $195,000, respectively, in other assets. We also included interest rate swap agreements and TRS with positive fair values of approximately $11,391,000 and $4,661,000 at January 31, 2012 and 2011, respectively, in other assets. At January 31, 2012 and 2011, we included interest rate swap agreements and TRS that had a negative fair value of approximately $174,020,000 and $156,587,000, respectively, in accounts payable, accrued expenses and other liabilities.
We estimate the fair value of our long-term debt instruments by market rates, if available, or by discounting future cash payments at interest rates that approximate the current market. Estimated fair value is based upon market prices of public debt, available industry financing data, current treasury rates and recent financing transactions. Based on these parameters, the table below contains the estimated fair value of our long-term debt at January 31, 2012.
| | | | | | | | | | | | |
| | | Carrying Value | | | Fair Value | | | Fair Value with 100 bp Decrease
in Market Rates | |
| | | | |
| | | (in thousands) | |
| | | |
Fixed Rate Debt | | | $ 4,458,214 | | | | $ 4,719,636 | | | | $ 5,006,004 | |
Variable Rate Debt | | | | | | | | | | | | |
Taxable | | | 1,802,629 | | | | 1,911,665 | | | | 1,982,080 | |
Tax-Exempt | | | 437,209 | | | | 430,197 | | | | 491,790 | |
| | | | |
Total Variable Rate Debt | | | $ 2,239,838 | | | | $ 2,341,862 | | | | $ 2,473,870 | |
| | | | |
Total Long-Term Debt | | | $ 6,698,052 | | | | $ 7,061,498 | | | | $ 7,479,874 | |
| | | | |
The following tables provide information about our financial instruments that are sensitive to changes in interest rates.
78
Item 7A. Quantitative and Qualitative Disclosures About Market Risk (continued)
January 31, 2012
| | | | | | | | | | | | | | | | | | | | | | | | | | | | | | | | |
| | | Expected Maturity Date | | | | | | | |
| | | Year Ending January 31, | | | | | | | |
Long-Term
Debt | | 2013 | | | 2014 | | | 2015 | | | 2016 | | | 2017 | | | Period
Thereafter | | | Total
Outstanding
1/31/12 | | | Fair Market
Value 1/31/12 | |
| | | (dollars in thousands) | |
| | | | | | | | |
Fixed: | | | | | | | | | | | | | | | | | | | | | | | | | | | | | | | | |
Fixed-rate debt | | $ | 294,235 | | | $ | 602,745 | | | $ | 291,315 | | | $ | 346,320 | | | $ | 420,637 | | | $ | 1,464,433 | | | $ | 3,419,685 | | | $ | 3,737,890 | |
Weighted average interest rate | | | 5.96 % | | | | 6.46 % | | | | 6.04 % | | | | 5.57 % | | | | 5.75 % | | | | 5.16 % | | | | 5.65 % | | | | | |
| | | | | | | | |
Senior & subordinated debt(1) | | | - | | | | 29,000 (4) | | | | 199,132 (3) | | | | 178,253 | | | | 50,000 | | | | 582,144 | | | | 1,038,529 | | | | 981,746 | |
Weighted average interest rate | | | - % | | | | 7.88 % | | | | 3.63 % | | | | 7.63 % | | | | 5.00 % | | | | 5.30 % | | | | 5.43 % | | | | | |
Total Fixed-Rate Debt | | | 294,235 | | | | 631,745 | | | | 490,447 | | | | 524,573 | | | | 470,637 | | | | 2,046,577 | | | | 4,458,214 | | | | 4,719,636 | |
| | | | | | | | |
Variable: | | | | | | | | | | | | | | | | | | | | | | | | | | | | | | | | |
Variable-rate debt | | | 1,039,618 | | | | 93,969 | | | | 24,607 | | | | - | | | | - | | | | 644,435 | | | | 1,802,629 | | | | 1,911,665 | |
Weighted average interest rate(2) | | | 3.53 % | | | | 6.59 % | | | | 3.85 % | | | | - % | | | | - % | | | | 6.52 % | | | | 4.76 % | | | | | |
| | | | | | | | |
Tax-exempt | | | 237 | | | | 91,055 | | | | 272 | | | | 290 | | | | 309 | | | | 345,046 | | | | 437,209 | | | | 430,197 | |
Weighted average interest rate(2) | | | 1.58 % | | | | 2.56 % | | | | 1.58 % | | | | 1.58 % | | | | 1.58 % | | | | 1.29 % | | | | 1.55 % | | | | | |
| | | | | | | | |
Bank revolving credit facility(1) | | | - | | | | - | | | | - | | | | - | | | | - | | | | - | | | | - | | | | - | |
Weighted average interest rate | | | - % | | | | - % | | | | - % | | | | - % | | | | - % | | | | - % | | | | - % | | | | | |
Total Variable-Rate Debt | | | 1,039,855 | | | | 185,024 | | | | 24,879 | | | | 290 | | | | 309 | | | | 989,481 | | | | 2,239,838 | | | | 2,341,862 | |
| | | | | | | | |
Total Long-Term Debt | | $ | 1,334,090 | | | $ | 816,769 | | | $ | 515,326 | | | $ | 524,863 | | | $ | 470,946 | | | $ | 3,036,058 | | | $ | 6,698,052 | | | $ | 7,061,498 | |
| | | | | | | | |
Weighted average interest rate | | | 4.06 % | | | | 6.09 % | | | | 5.00 % | | | | 6.27 % | | | | 5.67 % | | | | 5.03 % | | | | 5.11 % | | | | | |
| (1) | Represents recourse debt. |
| (2) | Weighted average interest rate is based on current market rates as of January 31, 2012. |
| (3) | Contains the principal amount of the puttable equity-linked senior notes due 2014 less the unamortized discount of $868 as of January 31, 2012. |
| (4) | The mandatory tender date of the custodial receipts, which represent ownership in the bonds, was used for the expected maturity date in lieu of the maturity date on the face of the bonds. |
79
Item 7A. Quantitative and Qualitative Disclosures About Market Risk (continued)
January 31, 2011
| | | | | | | | | | | | | | | | | | | | | | | | | | | | | | | | |
| | | Expected Maturity Date | | | | | | | |
| | | Year Ending January 31, | | | | | | | |
Long-Term
Debt | | 2012 | | | 2013 | | | 2014 | | | 2015 | | | 2016 | | | Period
Thereafter | | | Total
Outstanding
1/31/11 | | | Fair Market
Value 1/31/11 | |
| | | (dollars in thousands) | | | | | | | |
| | | | | | | | |
Fixed: | | | | | | | | | | | | | | | | | | | | | | | | | | | | | | | | |
Fixed-rate debt | | $ | 280,274 | | | $ | 345,211 | | | $ | 855,352 | | | $ | 462,257 | | | $ | 361,758 | | | $ | 1,570,594 | | | $ | 3,875,446 | | | $ | 4,087,103 | |
Weighted average interest rate | | | 6.77 % | | | | 6.10 % | | | | 6.56 % | | | | 5.96 % | | | | 5.59 % | | | | 5.75 % | | | | 6.04 % | | | | | |
| | | | | | | | |
Senior & subordinated debt(1) | | | 45,480 (3) | | | | - | | | | 29,000 (5) | | | | 198,806 (4) | | | | 178,253 | | | | 322,144 | | | | 773,683 | | | | 715,625 | |
Weighted average interest rate | | | 3.63 % | | | | - % | | | | 7.88 % | | | | 3.63 % | | | | 7.63 % | | | | 6.35 % | | | | 5.84 % | | | | | |
Total Fixed-Rate Debt | | | 325,754 | | | | 345,211 | | | | 884,352 | | | | 661,063 | | | | 540,011 | | | | 1,892,738 | | | | 4,649,129 | | | | 4,802,728 | |
| | | | | | | | |
Variable: | | | | | | | | | | | | | | | | | | | | | | | | | | | | | | | | |
Variable-rate debt | | | 798,146 | | | | 1,064,953 | | | | 46,411 | | | | 12,414 | | | | - | | | | 640,220 | | | | 2,562,144 | | | | 2,617,433 | |
Weighted average interest rate(2) | | | 3.80 % | | | | 3.38 % | | | | 6.05 % | | | | 1.46 % | | | | - % | | | | 7.18 % | | | | 4.50 % | | | | | |
| | | | | | | | |
Tax-exempt | | | 132,430 | | | | 204,616 | | | | 91,565 | | | | 815 | | | | 869 | | | | 339,333 | | | | 769,628 | | | | 764,981 | |
Weighted average interest rate(2) | | | 2.63 % | | | | 2.52% | | | | 2.78 % | | | | 3.79 % | | | | 3.79 % | | | | 1.42 % | | | | 2.09 % | | | | | |
| | | | | | | | |
Bank revolving credit facility(1) | | | - | | | | 137,152 | | | | - | | | | - | | | | - | | | | - | | | | 137,152 | | | | 137,152 | |
Weighted average interest rate(2) | | | - % | | | | 5.75 % | | | | - % | | | | - % | | | | - % | | | | - % | | | | 5.75 % | | | | | |
Total Variable-Rate Debt | | | 930,576 | | | | 1,406,721 | | | | 137,976 | | | | 13,229 | | | | 869 | | | | 979,553 | | | | 3,468,924 | | | | 3,519,566 | |
| | | | | | | | |
Total Long-Term Debt | | $ | 1,256,330 | | | $ | 1,751,932 | | | $ | 1,022,328 | | | $ | 674,292 | | | $ | 540,880 | | | $ | 2,872,291 | | | $ | 8,118,053 | | | $ | 8,322,294 | |
| | | | | | | | |
Weighted average interest rate | | | 4.33 % | | | | 4.00 % | | | | 6.24 % | | | | 5.19 % | | | | 6.26 % | | | | 5.62 % | | | | 5.16 % | | | | | |
| (1) | Represents recourse debt. |
| (2) | Weighted average interest rate is based on current market rates as of January 31, 2011. |
| (3) | Represents the principal amount of the puttable equity-linked senior notes due 2011 of $46,891 less the unamortized discount of $1,411 as of January 31, 2011, as adjusted for the adoption of accounting guidance for convertible debt instruments. This unamortized discount is accreted through interest expense, which resulted in an effective interest rate of 7.51%. |
| (4) | Contains the principal amount of the puttable equity-linked senior notes due 2014 less the unamortized discount of $1,194 as of January 31, 2011. |
| (5) | The mandatory tender date of the custodial receipts, which represent ownership in the bonds, was used for the expected maturity date in lieu of the maturity date on the face of the bonds. |
80
Item 8. Financial Statements and Supplementary Data
INDEX TO FINANCIAL STATEMENTS
81
REPORT OF INDEPENDENT REGISTERED PUBLIC ACCOUNTING FIRM
To the Shareholders and Board of Directors
of Forest City Enterprises, Inc.:
In our opinion, the accompanying consolidated balance sheets and the related consolidated statements of operations, of comprehensive income (loss), of equity and of cash flows present fairly, in all material respects, the financial position of Forest City Enterprises, Inc. and subsidiaries at January 31, 2012 and January 31, 2011, and the results of their operations and their cash flows for each of the three years in the period ended January 31, 2012 in conformity with accounting principles generally accepted in the United States of America. In addition, in our opinion, the financial statement schedules listed in the accompanying index present fairly, in all material respects, the information set forth therein when read in conjunction with the related consolidated financial statements. Also in our opinion, the Company maintained, in all material respects, effective internal control over financial reporting as of January 31, 2012, based on criteria established inInternal Control—Integrated Framework issued by the Committee of Sponsoring Organizations of the Treadway Commission (COSO). The Company’s management is responsible for these financial statements and financial statement schedules, for maintaining effective internal control over financial reporting and for its assessment of the effectiveness of internal control over financial reporting, included in Management’s Report on Internal Control over Financial Reporting appearing under Item 9A. Our responsibility is to express opinions on these financial statements, on the financial statement schedules, and on the Company’s internal control over financial reporting based on our integrated audits. We conducted our audits in accordance with the standards of the Public Company Accounting Oversight Board (United States). Those standards require that we plan and perform the audits to obtain reasonable assurance about whether the financial statements are free of material misstatement and whether effective internal control over financial reporting was maintained in all material respects. Our audits of the financial statements included examining, on a test basis, evidence supporting the amounts and disclosures in the financial statements, assessing the accounting principles used and significant estimates made by management, and evaluating the overall financial statement presentation. Our audit of internal control over financial reporting included obtaining an understanding of internal control over financial reporting, assessing the risk that a material weakness exists, and testing and evaluating the design and operating effectiveness of internal control based on the assessed risk. Our audits also included performing such other procedures as we considered necessary in the circumstances. We believe that our audits provide a reasonable basis for our opinions.
A company’s internal control over financial reporting is a process designed to provide reasonable assurance regarding the reliability of financial reporting and the preparation of financial statements for external purposes in accordance with generally accepted accounting principles. A company’s internal control over financial reporting includes those policies and procedures that (i) pertain to the maintenance of records that, in reasonable detail, accurately and fairly reflect the transactions and dispositions of the assets of the company; (ii) provide reasonable assurance that transactions are recorded as necessary to permit preparation of financial statements in accordance with generally accepted accounting principles, and that receipts and expenditures of the company are being made only in accordance with authorizations of management and directors of the company; and (iii) provide reasonable assurance regarding prevention or timely detection of unauthorized acquisition, use, or disposition of the company’s assets that could have a material effect on the financial statements.
Because of its inherent limitations, internal control over financial reporting may not prevent or detect misstatements. Also, projections of any evaluation of effectiveness to future periods are subject to the risk that controls may become inadequate because of changes in conditions, or that the degree of compliance with the policies or procedures may deteriorate.
/s/ PricewaterhouseCoopers LLP
Cleveland, Ohio
April 2, 2012
82
Forest City Enterprises, Inc. and Subsidiaries
Consolidated Balance Sheets
| | | | | | | | |
| | | January 31, | |
| | | 2012 | | | 2011 | |
| | | | |
| | | (in thousands) | |
| | |
Assets | | | | | | | | |
Real Estate | | | | | | | | |
Completed rental properties | | $ | 7,183,448 | | | $ | 8,215,425 | |
Projects under construction and development | | | 2,328,979 | | | | 2,706,235 | |
Land held for development and sale | | | 77,298 | | | | 244,879 | |
| | | | |
Total Real Estate | | | 9,589,725 | | | | 11,166,539 | |
Less accumulated depreciation | | | (1,526,503 | ) | | | (1,614,399 | ) |
| | | | |
| | |
Real Estate, net – (variable interest entities $2,103.8 and $2,627.8 million, respectively) | | | 8,063,222 | | | | 9,552,140 | |
| | |
Cash and equivalents – (variable interest entities $17.8 million and $24.7 million, respectively) | | | 217,486 | | | | 193,372 | |
Restricted cash and escrowed funds – (variable interest entities $348.1 million and $471.4 million, respectively) | | | 542,566 | | | | 720,180 | |
Notes and accounts receivable, net | | | 406,244 | | | | 403,101 | |
Investments in and advances to unconsolidated entities | | | 609,079 | | | | 431,509 | |
Other assets – (variable interest entities $130.8 million and $166.8 million, respectively) | | | 608,541 | | | | 759,399 | |
Land held for divestiture | | | 57,145 | | | | — | |
| | | | |
Total Assets | | $ | 10,504,283 | | | $ | 12,059,701 | |
| | | | |
| | |
Liabilities and Equity | | | | | | | | |
Liabilities | | | | | | | | |
Mortgage debt and notes payable, nonrecourse – (variable interest entities $1,122.0 million and $1,879.0 million, respectively) | | $ | 5,640,439 | | | $ | 7,207,218 | |
Bank revolving credit facility | | | — | | | | 137,152 | |
Senior and subordinated debt – (variable interest entities $29.0 million, as of each period) | | | 1,038,529 | | | | 773,683 | |
Accounts payable, accrued expenses and other liabilities – (variable interest entities $171.0 million and $150.2 million, respectively) | | | 1,112,462 | | | | 1,051,256 | |
Cash distributions and losses in excess of investments in unconsolidated entities | | | 279,708 | | | | 290,492 | |
Deferred income taxes | | | 433,040 | | | | 498,811 | |
Mortgage debt and notes payable, nonrecourse of land held for divestiture | | | 19,084 | | | | — | |
| | | | |
Total Liabilities | | | 8,523,262 | | | | 9,958,612 | |
| | |
Redeemable Noncontrolling Interest | | | 229,149 | | | | 226,829 | |
| | |
Commitments and Contingencies | | | — | | | | — | |
| | |
Equity | | | | | | | | |
Shareholders’ Equity | | | | | | | | |
Preferred stock—7.0% Series A cumulative perpetual convertible, without par value, $50 liquidation preference; 6,400,000 shares authorized; 4,399,998 shares issued and outstanding, respectively | | | 220,000 | | | | 220,000 | |
Preferred stock – without par value; 13,600,000 shares authorized, no shares issued | | | — | | | | — | |
Common stock – $.33 1/3 par value
Class A, 371,000,000 shares authorized, 148,336,178 and 144,251,634 shares issued and 148,227,849 and 144,230,310 shares outstanding, respectively | | | 49,445 | | | | 48,084 | |
Class B, convertible, 56,000,000 shares authorized, 20,934,335 and 21,218,753 shares issued and outstanding, respectively; 26,257,961 issuable | | | 6,978 | | | | 7,073 | |
| | | | |
Total common stock | | | 56,423 | | | | 55,157 | |
Additional paid-in capital | | | 740,988 | | | | 689,004 | |
Retained earnings | | | 571,989 | | | | 673,875 | |
Less treasury stock, at cost; 108,329 and 21,324 Class A shares, respectively | | | (1,874 | ) | | | (259 | ) |
| | | | |
Shareholders' equity before accumulated other comprehensive loss | | | 1,587,526 | | | | 1,637,777 | |
Accumulated other comprehensive loss | | | (120,460 | ) | | | (94,429 | ) |
| | | | |
Total Shareholders’ Equity | | | 1,467,066 | | | | 1,543,348 | |
Noncontrolling interest | | | 284,806 | | | | 330,912 | |
| | | | |
Total Equity | | | 1,751,872 | | | | 1,874,260 | |
| | | | |
| | |
Total Liabilities and Equity | | $ | 10,504,283 | | | $ | 12,059,701 | |
| | | | |
The accompanying notes are an integral part of these consolidated financial statements.
83
Forest City Enterprises, Inc. and Subsidiaries
Consolidated Statements of Operations
| | | $00,000,000.00 | | | | $00,000,000.00 | | | | $00,000,000.00 | |
| | | Years Ended January 31, | |
| | | 2012 | | | 2011 | | | 2010 | |
| | | (in thousands, except per share data) | |
| | | |
Revenues from real estate operations | | $ | 1,089,977 | | | $ | 1,117,649 | | | $ | 1,193,970 | |
| | | |
Expenses | | | | | | | | | | | | |
Operating expenses | | | 668,959 | | | | 647,199 | | | | 664,988 | |
Depreciation and amortization | | | 218,601 | | | | 234,728 | | | | 256,606 | |
Impairment of real estate | | | 119,324 | | | | 4,763 | | | | 8,907 | |
| | | 1,006,884 | | | | 886,690 | | | | 930,501 | |
| | | |
Interest expense | | | (261,037 | ) | | | (309,766 | ) | | | (342,859 | ) |
Amortization of mortgage procurement costs | | | (11,812 | ) | | | (11,484 | ) | | | (13,653 | ) |
Gain (loss) on extinguishment of debt | | | 9,590 | | | | (21,035 | ) | | | 36,569 | |
| | | |
Interest and other income | | | 52,114 | | | | 52,818 | | | | 53,945 | |
Net gain on disposition of partial interests in rental properties and other investment | | | 17,665 | | | | 257,990 | | | | - | |
| | | |
Earnings (loss) before income taxes | | | (110,387 | ) | | | 199,482 | | | | (2,529 | ) |
| | | |
Income tax expense (benefit) | | | | | | | | | | | | |
Current | | | (9,300 | ) | | | 602 | | | | 7,647 | |
Deferred | | | (55,044 | ) | | | 69,524 | | | | (17,787 | ) |
| | | (64,344 | ) | | | 70,126 | | | | (10,140 | ) |
| | | |
Equity in earnings of unconsolidated entities | | | 21,147 | | | | 42,265 | | | | 21,303 | |
Impairment of unconsolidated entities | | | (82,186 | ) | | | (72,459 | ) | | | (36,356 | ) |
| | | |
Earnings (loss) from continuing operations | | | (107,082 | ) | | | 99,162 | | | | (7,442 | ) |
| | | |
Discontinued operations, net of tax: | | | | | | | | | | | | |
Operating earnings from rental properties | | | 992 | | | | 4,007 | | | | 342 | |
Impairment of real estate | | | (6,279 | ) | | | (49,980 | ) | | | (16,770 | ) |
Gain on disposition of rental properties | | | 111,801 | | | | 32,209 | | | | 2,784 | |
Gain on disposition of Lumber Group | | | - | | | | - | | | | 718 | |
| | | | | | | | | | | | |
| | | 106,514 | | | | (13,764 | ) | | | (12,926 | ) |
| | | |
Net earnings (loss) | | | (568 | ) | | | 85,398 | | | | (20,368 | ) |
| | | |
Noncontrolling interests | | | | | | | | | | | | |
Earnings from continuing operations attributable to noncontrolling interests | | | (2,736 | ) | | | (19,222 | ) | | | (6,766 | ) |
(Earnings) loss from discontinued operations attributable to noncontrolling interests | | | (83,182 | ) | | | (8,128 | ) | | | 156 | |
| | | (85,918 | ) | | | (27,350 | ) | | | (6,610 | ) |
Net earnings (loss) attributable to Forest City Enterprises, Inc. | | | (86,486 | ) | | | 58,048 | | | | (26,978 | ) |
Preferred dividends | | | (15,400 | ) | | | (11,807 | ) | | | - | |
Net earnings (loss) attributable to Forest City Enterprises, Inc. common shareholders | | $ | (101,886 | ) | | $ | 46,241 | | | $ | (26,978 | ) |
| | | | | | | | | | | | |
| | | |
Basic earnings (loss) per common share | | | | | | | | | | | | |
Earnings (loss) from continuing operations attributable to Forest City Enterprises, Inc. common shareholders | | $ | (0.74 | ) | | $ | 0.42 | | | $ | (0.10 | ) |
Earnings (loss) from discontinued operations attributable to Forest City Enterprises, Inc. common shareholders | | | 0.13 | | | | (0.13 | ) | | | (0.09 | ) |
Net earnings (loss) attributable to Forest City Enterprises, Inc. common shareholders | | $ | (0.61 | ) | | $ | 0.29 | | | $ | (0.19 | ) |
| | | | | | | | | | | | |
| | | |
Diluted earnings (loss) per common share | | | | | | | | | | | | |
Earnings (loss) from continuing operations attributable to Forest City Enterprises, Inc. common shareholders | | $ | (0.74 | ) | | $ | 0.43 | | | $ | (0.10 | ) |
Earnings (loss) from discontinued operations attributable to Forest City Enterprises, Inc. common shareholders | | | 0.13 | | | | (0.13 | ) | | | (0.09 | ) |
Net earnings (loss) attributable to Forest City Enterprises, Inc. common shareholders | | $ | (0.61 | ) | | $ | 0.30 | | | $ | (0.19 | ) |
| | | | | | | | | | | | |
The accompanying notes are an integral part of these consolidated financial statements.
84
Forest City Enterprises, Inc. and Subsidiaries
Consolidated Statements of Comprehensive Income (Loss)
| | | $0000000 | | | | $0000000 | | | | $0000000 | |
| | | Years Ended January 31, | |
| | | 2012 | | | 2011 | | | 2010 | |
| | | (in thousands) | |
| | | |
Net earnings (loss) | | $ | (568 | ) | | $ | 85,398 | | | $ | (20,368 | ) |
| | | |
Other comprehensive income (loss), net of tax: | | | | | | | | | | | | |
| | | |
Unrealized net gains (losses) on investment securities | | | 25 | | | | (18 | ) | | | (187 | ) |
| | | |
Foreign currency translation adjustments | | | (26 | ) | | | (30 | ) | | | 474 | |
| | | |
Unrealized net gains (losses) on interest rate derivative contracts | | | (24,980 | ) | | | (7,178 | ) | | | 20,291 | |
| | | |
Total other comprehensive income (loss), net of tax | | | (24,981 | ) | | | (7,226 | ) | | | 20,578 | |
| | | |
Comprehensive income (loss) | | | (25,549 | ) | | | 78,172 | | | | 210 | |
| | | |
Comprehensive income attributable to noncontrolling interest | | | (86,968 | ) | | | (27,287 | ) | | | (6,933 | ) |
| | | |
Total comprehensive income (loss) attributable to Forest City Enterprises, Inc. | | $ | (112,517 | ) | | $ | 50,885 | | | $ | (6,723 | ) |
The accompanying notes are an integral part of these consolidated financial statements.
85
Forest City Enterprises, Inc. and Subsidiaries
Consolidated Statements of Equity
| | | $0000000 | | | | $0000000 | | | | $0000000 | | | | $0000000 | | | | $0000000 | | | | $0000000 | | | | $0000000 | | | | $0000000 | | | | $0000000 | | | | $0000000 | | | | $0000000 | | | | $0000000 | | | | $0000000 | |
| | | Preferred Stock | | | Common Stock | | | Additional | | | | | | | | | | | | Accumulated Other | | | | | | | |
| | | Series A | | | Class A | | | Class B | | | Paid-In | | | Retained | | | Treasury Stock | | | Comprehensive | | | Noncontrolling | | | | |
| | | Shares | | | Amount | | | Shares | | | Amount | | | Shares | | | Amount | | | Capital | | | Earnings | | | Shares | | | Amount | | | (Loss) Income | | | Interest | | | Total | |
| | | (in thousands) | |
Balances at January 31, 2009, as previously reported | | | — | | | $ | — | | | | 80,082 | | | $ | 26,694 | | | | 22,798 | | | $ | 7,599 | | | $ | 267,796 | | | $ | 643,724 | | | | 2 | | | $ | (21 | ) | | $ | (107,521 | ) | | $ | 337,828 | | | $ | 1,176,099 | |
Allowance for projects under development revision (See Note A) | | | | | | | | | | | | | | | | | | | | | | | | | | | | | | | 10,888 | | | | | | | | | | | | | | | | | | | | 10,888 | |
Balances at January 31, 2009, as adjusted | | | — | | | $ | — | | | | 80,082 | | | $ | 26,694 | | | | 22,798 | | | $ | 7,599 | | | $ | 267,796 | | | $ | 654,612 | | | | 2 | | | $ | (21 | ) | | $ | (107,521 | ) | | $ | 337,828 | | | $ | 1,186,987 | |
Net loss | | | | | | | | | | | | | | | | | | | | | | | | | | | | | | | (26,978 | ) | | | | | | | | | | | | | | | 6,610 | | | | (20,368 | ) |
Other comprehensive loss, net of tax | | | | | | | | | | | | | | | | | | | | | | | | | | | | | | | | | | | | | | | | | | | 20,255 | | | | 323 | | | | 20,578 | |
Issuance of Class A common shares in equity offering | | | | | | | | | | | 52,325 | | | | 17,442 | | | | | | | | | | | | 312,475 | | | | | | | | | | | | | | | | | | | | | | | | 329,917 | |
Purchase of treasury stock | | | | | | | | | | | | | | | | | | | | | | | | | | | | | | | | | | | 26 | | | | (133 | ) | | | | | | | | | | | (133 | ) |
Conversion of Class B to Class A shares | | | | | | | | | | | 282 | | | | 94 | | | | (282 | ) | | | (94 | ) | | | | | | | | | | | | | | | | | | | | | | | | | | | - | |
Exercise of stock options | | | | | | | | | | | 15 | | | | 5 | | | | | | | | | | | | 123 | | | | | | | | | | | | | | | | | | | | | | | | 128 | |
Exchange of Puttable Equity-Linked Senior Notes due 2011 | | | | | | | | | | | | | | | | | | | | | | | | | | | (17,490 | ) | | | | | | | | | | | | | | | | | | | | | | | (17,490 | ) |
Purchase of Convertible Senior Note hedge, net of tax | | | | | | | | | | | | | | | | | | | | | | | | | | | (9,734 | ) | | | | | | | | | | | | | | | | | | | | | | | (9,734 | ) |
Restricted stock vested | | | | | | | | | | | 132 | | | | 44 | | | | | | | | | | | | (44 | ) | | | | | | | | | | | | | | | | | | | | | | | - | |
Stock-based compensation | | | | | | | | | | | | | | | | | | | | | | | | | | | 16,738 | | | | | | | | | | | | | | | | | | | | | | | | 16,738 | |
Excess income tax deficiency from stock based compensation | | | | | | | | | | | | | | | | | | | | | | | | | | | (2,068 | ) | | | | | | | | | | | | | | | | | | | | | | | (2,068 | ) |
Acquisition of partners' noncontrolling interest in consolidated subsidiary | | | | | | | | | | | | | | | | | | | | | | | | | | | 3,393 | | | | | | | | | | | | | | | | | | | | (3,393 | ) | | | - | |
Contributions from noncontrolling interests | | | | | | | | | | | | | | | | | | | | | | | | | | | | | | | | | | | | | | | | | | | | | | | 21,831 | | | | 21,831 | |
Distributions to noncontrolling interests | | | | | | | | | | | | | | | | | | | | | | | | | | | | | | | | | | | | | | | | | | | | | | | (12,339 | ) | | | (12,339 | ) |
Change to full consolidation method of accounting for a subsidiary | | | | | | | | | | | | | | | | | | | | | | | | | | | | | | | | | | | | | | | | | | | | | | | 5,010 | | | | 5,010 | |
Other changes in noncontrolling interests | | | | | | | | | | | | | | | | | | | | | | | | | | | | | | | | | | | | | | | | | | | | | | | 344 | | | | 344 | |
Balances at January 31, 2010 | | | — | | | $ | — | | | | 132,836 | | | $ | 44,279 | | | | 22,516 | | | $ | 7,505 | | | $ | 571,189 | | | $ | 627,634 | | | | 28 | | | $ | (154 | ) | | $ | (87,266 | ) | | $ | 356,214 | | | $ | 1,519,401 | |
Cumulative effect of adoption of new consolidation accounting guidance | | | | | | | | | | | | | | | | | | | | | | | | | | | | | | | | | | | | | | | | | | | | | | | (74,034 | ) | | | (74,034 | ) |
Net earnings, net of $1,925 attributable to redeemable noncontrolling interest | | | | | | | | | | | | | | | | | | | | | | | | | | | | | | | 58,048 | | | | | | | | | | | | | | | | 29,275 | | | | 87,323 | |
Other comprehensive loss, net of tax | | | | | | | | | | | | | | | | | | | | | | | | | | | | | | | | | | | | | | | | | | | (7,163 | ) | | | (63 | ) | | | (7,226 | ) |
Purchase of treasury stock | | | | | | | | | | | | | | | | | | | | | | | | | | | | | | | | | | | 54 | | | | (786 | ) | | | | | | | | | | | (786 | ) |
Conversion of Class B to Class A shares | | | | | | | | | | | 1,297 | | | | 432 | | | | (1,297 | ) | | | (432 | ) | | | | | | | | | | | | | | | | | | | | | | | | | | | - | |
Issuance of Class A shares in exchange for Convertible Senior Notes | | | | | | | | | | | 9,774 | | | | 3,258 | | | | | | | | | | | | 133,186 | | | | | | | | | | | | | | | | | | | | | | | | 136,444 | |
Proceeds received from partial termination of Convertible Senior Notes hedge | | | | | | | | | | | | | | | | | | | | | | | | | | | 1,869 | | | | | | | | | | | | | | | | | | | | | | | | 1,869 | |
Issuance of Series A preferred stock for cash | | | 1,000 | | | | 50,000 | | | | | | | | | | | | | | | | | | | | (5,544 | ) | | | | | | | | | | | | | | | | | | | | | | | 44,456 | |
Issuance of Series A preferred stock in exchange for Senior Notes | | | 3,400 | | | | 170,000 | | | | | | | | | | | | | | | | | | | | (2,342 | ) | | | | | | | | | | | | | | | | | | | | | | | 167,658 | |
Purchase of equity call hedge related to issuance of preferred stock | | | | | | | | | | | | | | | | | | | | | | | | | | | (17,556 | ) | | | | | | | | | | | | | | | | | | | | | | | (17,556 | ) |
Preferred stock dividends | | | | | | | | | | | | | | | | | | | | | | | | | | | | | | | (11,807 | ) | | | | | | | | | | | | | | | | | | | (11,807 | ) |
Exercise of stock options | | | | | | | | | | | 123 | | | | 41 | | | | | | | | | | | | 1,899 | | | | | | | | (61 | ) | | | 681 | | | | | | | | | | | | 2,621 | |
Purchase of Puttable Equity-Linked Senior Notes due 2011 | | | | | | | | | | | | | | | | | | | | | | | | | | | 7 | | | | | | | | | | | | | | | | | | | | | | | | 7 | |
Restricted stock vested | | | | | | | | | | | 222 | | | | 74 | | | | | | | | | | | | (74 | ) | | | | | | | | | | | | | | | | | | | | | | | - | |
Stock-based compensation | | | | | | | | | | | | | | | | | | | | | | | | | | | 14,931 | | | | | | | | | | | | | | | | | | | | | | | | 14,931 | |
Excess income tax deficiency from stock-based compensation | | | | | | | | | | | | | | | | | | | | | | | | | | | (2,216 | ) | | | | | | | | | | | | | | | | | | | | | | | (2,216 | ) |
Redeemable noncontrolling interest adjustment | | | | | | | | | | | | | | | | | | | | | | | | | | | (6,845 | ) | | | | | | | | | | | | | | | | | | | | | | | (6,845 | ) |
Acquisition of partner's noncontrolling interest in consolidated subsidiary | | | | | | | | | | | | | | | | | | | | | | | | | | | 500 | | | | | | | | | | | | | | | | | | | | (500 | ) | | | - | |
Contributions from noncontrolling interests | | | | | | | | | | | | | | | | | | | | | | | | | | | | | | | | | | | | | | | | | | | | | | | 18,136 | | | | 18,136 | |
Distributions to noncontrolling interests | | | | | | | | | | | | | | | | | | | | | | | | | | | | | | | | | | | | | | | | | | | | | | | (20,777 | ) | | | (20,777 | ) |
Change to equity method of accounting due to disposition of partial interests in rental properties | | | | | | | | | | | | | | | | | | | | | | | | | | | | | | | | | | | | | | | | | | | | | | | 23,493 | | | | 23,493 | |
Other changes in noncontrolling interests | | | | | | | | | | | | | | | | | | | | | | | | | | | | | | | | | | | | | | | | | | | | | | | (832 | ) | | | (832 | ) |
Balances at January 31, 2011 | | | 4,400 | | | $ | 220,000 | | | | 144,252 | | | $ | 48,084 | | | | 21,219 | | | $ | 7,073 | | | $ | 689,004 | | | $ | 673,875 | | | | 21 | | | $ | (259 | ) | | $ | (94,429 | ) | | $ | 330,912 | | | $ | 1,874,260 | |
Net earnings, net of $4,567 attributable to redeemable noncontrolling interest | | | | | | | | | | | | | | | | | | | | | | | | | | | | | | | (86,486 | ) | | | | | | | | | | | | | | | 90,485 | | | | 3,999 | |
Other comprehensive loss, net of tax | | | | | | | | | | | | | | | | | | | | | | | | | | | | | | | | | | | | | | | | | | | (26,031 | ) | | | 1,050 | | | | (24,981 | ) |
Purchase of treasury stock | | | | | | | | | | | | | | | | | | | | | | | | | | | | | | | | | | | 90 | | | | (1,670 | ) | | | | | | | | | | | (1,670 | ) |
Conversion of Class B to Class A shares | | | | | | | | | | | 284 | | | | 95 | | | | (284 | ) | | | (95 | ) | | | | | | | | | | | | | | | | | | | | | | | | | | | - | |
Issuance of Class A shares in exchange for Convertible Senior Notes due 2016 | | | | | | | | | | | 3,444 | | | | 1,148 | | | | | | | | | | | | 47,594 | | | | | | | | | | | | | | | | | | | | | | | | 48,742 | |
Restricted stock vested | | | | | | | | | | | 343 | | | | 114 | | | | | | | | | | | | (114 | ) | | | | | | | | | | | | | | | | | | | | | | | - | |
Exercise of stock options | | | | | | | | | | | 13 | | | | 4 | | | | | | | | | | | | 136 | | | | | | | | (3 | ) | | | 55 | | | | | | | | | | | | 195 | |
Preferred stock dividends | | | | | | | | | | | | | | | | | | | | | | | | | | | | | | | (15,400 | ) | | | | | | | | | | | | | | | | | | | (15,400 | ) |
Stock-based compensation | | | | | | | | | | | | | | | | | | | | | | | | | | | 12,585 | | | | | | | | | | | | | | | | | | | | | | | | 12,585 | |
Excess income tax deficiency from stock-based compensation | | | | | | | | | | | | | | | | | | | | | | | | | | | (812 | ) | | | | | | | | | | | | | | | | | | | | | | | (812 | ) |
Redeemable noncontrolling interest adjustment | | | | | | | | | | | | | | | | | | | | | | | | | | | (6,887 | ) | | | | | | | | | | | | | | | | | | | | | | | (6,887 | ) |
Acquisition of partners' noncontrolling interest in consolidated subsidiaries | | | | | | | | | | | | | | | | | | | | | | | | | | | (518 | ) | | | | | | | | | | | | | | | | | | | (20,435 | ) | | | (20,953 | ) |
Contributions from noncontrolling interests | | | | | | | | | | | | | | | | | | | | | | | | | | | | | | | | | | | | | | | | | | | | | | | 6,087 | | | | 6,087 | |
Distributions to noncontrolling interests | | | | | | | | | | | | | | | | | | | | | | | | | | | | | | | | | | | | | | | | | | | | | | | (89,644 | ) | | | (89,644 | ) |
Change to equity method of accounting for subsidiaries | | | | | | | | | | | | | | | | | | | | | | | | | | | | | | | | | | | | | | | | | | | | | | | (33,598 | ) | | | (33,598 | ) |
Other changes in noncontrolling interests | | | | | | | | | | | | | | | | | | | | | | | | | | | | | | | | | | | | | | | | | | | | | | | (51 | ) | | | (51 | ) |
Balances at January 31, 2012 | | | 4,400 | | | $ | 220,000 | | | | 148,336 | | | $ | 49,445 | | | | 20,935 | | | $ | 6,978 | | | $ | 740,988 | | | $ | 571,989 | | | | 108 | | | $ | (1,874 | ) | | $ | (120,460 | ) | | $ | 284,806 | | | $ | 1,751,872 | |
The accompanying notes are an integral part of these consolidated financial statements.
86
Forest City Enterprises, Inc. and Subsidiaries
Consolidated Statements of Cash Flows
| | | $00000000 | | | | $00000000 | | | | $00000000 | |
| | | Years Ended January 31, | |
| | | 2012 | | | 2011 | | | 2010 | |
| | | (in thousands) | |
| | | |
Net earnings (loss) | | $ | (568 | ) | | $ | 85,398 | | | $ | (20,368 | ) |
Depreciation and amortization | | | 218,601 | | | | 234,728 | | | | 256,606 | |
Amortization of mortgage procurement costs | | | 11,812 | | | | 11,484 | | | | 13,653 | |
Impairment of real estate | | | 119,324 | | | | 4,763 | | | | 8,907 | |
Impairment of unconsolidated entities | | | 82,186 | | | | 72,459 | | | | 36,356 | |
Write-off of abandoned development projects | | | 8,838 | | | | 9,195 | | | | 20,739 | |
(Gain) loss on extinguishment of debt | | | (9,590 | ) | | | 21,035 | | | | (36,569 | ) |
Net gain on disposition of partial interests in rental properties and other investment | | | (17,665 | ) | | | (257,990 | ) | | | - | |
Deferred income tax expense (benefit) | | | (55,044 | ) | | | 69,524 | | | | (17,787 | ) |
Equity in earnings of unconsolidated entities | | | (21,147 | ) | | | (42,265 | ) | | | (21,303 | ) |
Stock-based compensation expense | | | 7,650 | | | | 7,969 | | | | 7,509 | |
Amortization and mark-to-market adjustments of derivative instruments | | | 2,279 | | | | 3,606 | | | | 4,106 | |
Non-cash interest expense related to Puttable Equity-Linked Senior Notes | | | 1,737 | | | | 1,858 | | | | 6,917 | |
Cash distributions from operations of unconsolidated entities | | | 59,399 | | | | 46,802 | | | | 39,770 | |
Discontinued operations: | | | | | | | | | | | | |
Depreciation and amortization | | | 4,339 | | | | 13,289 | | | | 12,149 | |
Amortization of mortgage procurement costs | | | 762 | | | | 2,127 | | | | 371 | |
Impairment of real estate | | | 10,257 | | | | 81,643 | | | | 27,394 | |
Write-off of abandoned development projects | | | - | | | | - | | | | 676 | |
Deferred income tax expense (benefit) | | | 6,536 | | | | (15,002 | ) | | | (6,705 | ) |
Gain on disposition of rental properties and Lumber Group | | | (133,554 | ) | | | (51,303 | ) | | | (5,720 | ) |
Cost of sales of land included in projects under construction and development and completed rental properties | | | 10,820 | | | | 18,490 | | | | 35,607 | |
Increase in land held for development and sale | | | (11,860 | ) | | | (14,973 | ) | | | (6,861 | ) |
Decrease in notes and accounts receivable | | | 3,575 | | | | 7,595 | | | | 12,912 | |
(Increase) decrease in other assets | | | (11,433 | ) | | | 15,415 | | | | 15,566 | |
Increase in restricted cash and escrowed funds used for operating purposes | | | (4,354 | ) | | | (31,701 | ) | | | (4,917 | ) |
Increase (decrease) in accounts payable, accrued expenses and other liabilities | | | 15,863 | | | | (26,899 | ) | | | 41,321 | |
| | | |
Net cash provided by operating activities | | $ | 298,763 | | | $ | 267,247 | | | $ | 420,329 | |
The accompanying notes are an integral part of these consolidated financial statements.
87
Forest City Enterprises, Inc. and Subsidiaries
Consolidated Statements of Cash Flows
| | | $00000000 | | | | $00000000 | | | | $00000000 | |
| | | Years Ended January 31, | |
| | | 2012 | | | 2011 | | | 2010 | |
| | | (in thousands) | |
| | | |
Cash Flows from Investing Activities | | | | | | | | | | | | |
Capital expenditures | | $ | (760,381 | ) | | $ | (723,158 | ) | | $ | (942,609 | ) |
Payment of lease procurement costs | | | (22,907 | ) | | | (20,387 | ) | | | (13,153 | ) |
(Increase) decrease in other assets | | | (14,489 | ) | | | (57,226 | ) | | | 2,373 | |
Decrease (increase) in restricted cash and escrowed funds used for investing purposes | | | 90,157 | | | | (249,024 | ) | | | (132,329 | ) |
Proceeds from disposition of full or partial interests in rental properties and other investments | | | 353,243 | | | | 191,345 | | | | 13,086 | |
(Increase) decrease in investments in and advances to unconsolidated entities | | | (85,820 | ) | | | 11,401 | | | | (81,314 | ) |
| | | |
Net cash used in investing activities | | | (440,197 | ) | | | (847,049 | ) | | | (1,153,946 | ) |
| | | |
Cash Flows from Financing Activities | | | | | | | | | | | | |
Proceeds from nonrecourse mortgage debt and notes payable | | | 695,449 | | | | 658,833 | | | | 770,972 | |
Principal payments on nonrecourse mortgage debt and notes payable | | | (572,584 | ) | | | (321,629 | ) | | | (260,294 | ) |
Borrowings on bank revolving credit facility | | | 464,575 | | | | 876,052 | | | | 844,000 | |
Payments on bank revolving credit facility | | | (601,727 | ) | | | (822,416 | ) | | | (1,125,984 | ) |
Payment of Puttable Equity-Linked Senior Notes due 2011 | | | (39,407 | ) | | | - | | | | - | |
Payment of subordinated debt | | | - | | | | - | | | | (20,400 | ) |
Proceeds from issuance of Convertible Senior Notes due 2018, net of $10,625 of issuance costs | | | 339,375 | | | | - | | | | - | |
Payment of transaction costs related to exchanges of Convertible Senior Notes due 2016 for Class A common stock | | | (3,200 | ) | | | - | | | | - | |
Purchase of senior notes due 2011 and 2017 | | | - | | | | (16,569 | ) | | | - | |
Proceeds received from partial termination of Convertible Senior Notes hedge | | | - | | | | 1,869 | | | | - | |
Proceeds from Puttable Equity-Linked Senior Notes due 2014, net of $2,803 of issuance costs and discount | | | - | | | | - | | | | 29,764 | |
Proceeds from Convertible Senior Notes due 2016, net of $6,838 of issuance costs | | | - | | | | - | | | | 193,162 | |
Payment for Convertible Senior Notes hedge transaction | | | - | | | | - | | | | (15,900 | ) |
Payment of deferred financing costs | | | (14,923 | ) | | | (36,745 | ) | | | (32,756 | ) |
Change in restricted cash and escrowed funds and book overdrafts | | | (1,578 | ) | | | (1,322 | ) | | | (4,251 | ) |
Proceeds from issuance of Series A preferred stock, net of $5,544 of issuance costs | | | - | | | | 44,456 | | | | - | |
Payment for equity call hedge related to the issuance of Series A preferred stock | | | - | | | | (17,556 | ) | | | - | |
Dividends paid to preferred shareholders | | | (15,400 | ) | | | (11,807 | ) | | | - | |
Sale of common stock, net | | | - | | | | - | | | | 329,917 | |
Purchase of treasury stock | | | (1,670 | ) | | | (786 | ) | | | (133 | ) |
Exercise of stock options | | | 195 | | | | 2,621 | | | | 128 | |
Contributions from redeemable noncontrolling interest | | | - | | | | 181,909 | | | | - | |
Contributions from noncontrolling interests | | | 6,087 | | | | 5,636 | | | | 21,831 | |
Distributions to noncontrolling interests | | | (89,644 | ) | | | (20,777 | ) | | | (12,339 | ) |
| | | |
Net cash provided by financing activities | | | 165,548 | | | | 521,769 | | | | 717,717 | |
| | | |
Net increase (decrease) in cash and equivalents | | | 24,114 | | | | (58,033 | ) | | | (15,900 | ) |
| | | |
Cash and equivalents at beginning of period | | | 193,372 | | | | 251,405 | | | | 267,305 | |
| | | |
Cash and equivalents at end of period | | $ | 217,486 | | | $ | 193,372 | | | $ | 251,405 | |
The accompanying notes are an integral part of these consolidated financial statements.
88
Forest City Enterprises, Inc. and Subsidiaries
Consolidated Statements of Cash Flows
Supplemental Non-Cash Disclosures:
The following table represents a summary of non-cash transactions primarily as a result of changes in consolidation methods due to the occurrence of certain triggering events including, but not limited to, dispositions of partial interests of rental properties and other recapitalization transactions. In addition, there were multiple changes in consolidation methods upon adoption of new accounting guidance for the consolidation of variable interest entities during the year ended January 31, 2011. Other non-cash transactions included in the table include, the effect of various transactions involving the exchange of a portion of the Company’s senior notes for (i) new issuances of Senior Notes, (ii) shares of the Company’s Class A common stock or (iii) shares of the Company’s Series A Preferred Stock, acquisitions of partners noncontrolling interests, dispositions of properties whereby the nonrecourse mortgage debt is assumed by the buyer, the change in construction payables, the reclassification prior to sale of outlot land parcels from projects under construction and development or completed rental properties to land held for sale and the capitalization of stock-based compensation granted to employees directly involved with the development and construction of real estate.
| | | $000000000 | | | | $000000000 | | | | $000000000 | |
| | | Years Ended January 31, | |
| | | 2012 | | | 2011 | | | 2010 | |
| | | (in thousands) | |
| | | |
Operating activities | | | | | | | | | | | | |
Increase in land held for development and sale | | $ | (1,399 | ) | | $ | (31,599 | ) | | $ | (50,740 | ) |
Decrease in notes and accounts receivable | | | 16,785 | | | | 22,560 | | | | 10,842 | |
Decrease in other assets | | | 155,458 | | | | 80,953 | | | | 46,620 | |
Decrease (increase) in restricted cash and escrowed funds | | | 149,586 | | | | (1,953 | ) | | | (142 | ) |
Increase (decrease) in accounts payable, accrued expenses and other liabilities | | | 14,188 | | | | (111,940 | ) | | | (97,233 | ) |
Total effect on operating activities | | $ | 334,618 | | | $ | (41,979 | ) | | $ | (90,653 | ) |
| | | |
Investing activities | | | | | | | | | | | | |
Decrease in projects under construction and development | | $ | 429,690 | | | $ | 32,816 | | | $ | 108,000 | |
Decrease in completed rental properties | | | 1,230,710 | | | | 667,495 | | | | 68,003 | |
(Increase) decrease in investments in and advances to unconsolidated entities | | | (298,492 | ) | | | 111,644 | | | | 12,789 | |
Total effect on investing activities | | $ | 1,361,908 | | | $ | 811,955 | | | $ | 188,792 | |
| | | |
Financing activities | | | | | | | | | | | | |
Decrease in nonrecourse mortgage debt and notes payable | | $ | (1,648,245 | ) | | $ | (776,588 | ) | | $ | (112,379 | ) |
(Decrease) increase in senior and subordinated debt | | | (40,000 | ) | | | (277,658 | ) | | | 11,414 | |
Decrease in deferred tax liability | | | - | | | | - | | | | (6,218 | ) |
Increase in preferred stock | | | - | | | | 170,000 | | | | - | |
Increase in class A common stock | | | 959 | | | | 2,636 | | | | - | |
Increase in additional paid-in capital | | | 36,904 | | | | 102,939 | | | | 7,427 | |
Increase in redeemable noncontrolling interest | | | 6,887 | | | | 46,845 | | | | - | |
(Decrease) increase in noncontrolling interest | | | (53,031 | ) | | | (38,150 | ) | | | 1,617 | |
Total effect on financing activities | | $ | (1,696,526 | ) | | $ | (769,976 | ) | | $ | (98,139 | ) |
89
Forest City Enterprises, Inc. and Subsidiaries
Notes to Consolidated Financial Statements
A.Summary of Significant Accounting Policies
Nature of Business
Forest City Enterprises, Inc. (the “Company”) principally engages in the ownership, development, management and acquisition of commercial and residential real estate and land throughout the United States. The Company operates through three strategic business units and five reportable segments. The three strategic business units/reportable segments are the Commercial Group, Residential Group and Land Development Group (collectively, the “Real Estate Groups”). TheCommercial Group, the Company’s largest strategic business unit, owns, develops, acquires and operates regional malls, specialty/urban retail centers, office and life science buildings, hotels and mixed-use projects. TheResidential Groupowns, develops, acquires and operates residential rental properties, including upscale and middle-market apartments and adaptive re-use developments. Additionally, the Residential Group develops for-sale condominium projects and also owns interests in entities that develop and manage military family housing. TheLand Development Groupacquires and sells both land and developed lots to residential, commercial and industrial customers. It also owns and develops land into master-planned communities and mixed-use projects. As of January 31, 2012, the Board of Directors of the Company approved a strategic decision by senior management to reposition or divest significant portions of its Land Development Group and is actively reviewing alternatives to do so.
Corporate Activitiesand The Nets, a member of the National Basketball Association (“NBA”) in which the Company accounts for its investment on the equity method of accounting, are other reportable segments of the Company.
The Company has approximately $10.5 billion of consolidated assets in 28 states and the District of Columbia at January 31, 2012. The Company’s core markets include Boston, Chicago, Dallas, Denver, Los Angeles, New York, Philadelphia, the Greater San Francisco metropolitan area and the Greater Washington D.C. metropolitan area. The Company has offices in Albuquerque, Boston, Chicago, Dallas, Denver, London (England), Los Angeles, New York City, San Francisco, Washington, D.C., and the Company’s corporate headquarters in Cleveland, Ohio.
Revision of Prior Period Financial Statements
Historically, the Company wrote-off specific development projects when management determined it was probable the specific project would not be developed. In addition, the Company recorded an allowance for estimated project development write-offs for projects under development that had not yet been abandoned (the “Allowance”). In connection with the preparation of its financial statements for the year ended January 31, 2012, the Company has reconsidered the historical accounting policy related to the Allowance and has determined that recording the Allowance was not in accordance with ASC 970-360-40 (Real Estate – Abandonments) and concluded that the reserve should be removed (“Allowance Revision”). The Company assessed the materiality of this error on prior periods’ financial statements in accordance with ASC 250 (SEC’s Staff Accounting Bulletin No. 99, Materiality), and concluded that the error was not material to any prior annual or interim periods, but the cumulative adjustment necessary to remove the Allowance would be material if the correction was recorded during the year ended January 31, 2012. Accordingly, in accordance with ASC 250 (SEC Staff Accounting Bulletin No. 108, “Considering the Effects of Prior Year Misstatements when Quantifying Misstatements in Current Year Financial Statements,”), the financial statements as of January 31, 2011 and the two years then ended, which are presented herein have been revised. The following are selected line items from our financial statements illustrating the affect of the error correction thereon:
| | | | | | | | | | | | |
| | | As Reported | | | Adjustment | | | As Revised | |
| | | (in thousands, except per share data) | |
Consolidated Balance Sheet as of January 31, 2011 | | | | | | | | | | | | |
| | | |
Accounts payable, accrued expenses and other liabilities | | $ | 1,074,042 | | | $ | (22,786 | ) | | $ | 1,051,256 | |
Deferred income taxes | | | 489,974 | | | | 8,837 | | | | 498,811 | |
Retained earnings | | | 659,926 | | | | 13,949 | | | | 673,875 | |
| | | |
Consolidated Statement of Operations for the year ended January 31, 2011 | | | | | | | | | | | | |
| | | |
Operating expenses | | | 646,199 | | | | 1,000 | | | | 647,199 | |
Deferred income tax expense (benefit) | | | 69,912 | | | | (388 | ) | | | 69,524 | |
Earnings (loss) from continuing operations | | | 99,774 | | | | (612 | ) | | | 99,162 | |
Net earnings (loss) attributable to Forest City Enterprises, Inc. common shareholders | | | 46,853 | | | | (612 | ) | | | 46,241 | |
Basic earnings (loss) per common share from continuing operations attributable to Forest City Enterprises, Inc. common shareholders | | | 0.43 | | | | (0.01 | ) | | | 0.42 | |
| | | |
Consolidated Statement of Operations for the year ended January 31, 2010 | | | | | | | | | | | | |
| | | |
Operating expenses | | | 670,988 | | | | (6,000 | ) | | | 664,988 | |
Deferred income tax expense (benefit) | | | (20,114 | ) | | | 2,327 | | | | (17,787 | ) |
Earnings (loss) from continuing operations | | | (11,115 | ) | | | 3,673 | | | | (7,442 | ) |
Net earnings (loss) attributable to Forest City Enterprises, Inc. common shareholders | | | (30,651 | ) | | | 3,673 | | | | (26,978 | ) |
Basic and diluted earnings (loss) per common share from continuing operations attributable to Forest City Enterprises, Inc. common shareholders | | | (0.13 | ) | | | 0.03 | | | | (0.10 | ) |
The impact of the Allowance Revision also includes an understatement of $10,888,000 to retained earnings as of January 31, 2009.
Principles of Consolidation
The accompanying consolidated financial statements include the accounts of Forest City Enterprises, Inc., its wholly-owned subsidiaries and entities in which it has a controlling interest in accordance with accounting principles generally accepted in the United States of America (“GAAP”). All intercompany balances and transactions have been eliminated in consolidation.
The accounting guidance for consolidation of variable interest entities (“VIE”) requires an ongoing reassessment of determining whether a variable interest gives a company a controlling financial interest in a VIE. The Company continuously reassesses whether or not it has the (a) power to direct the activities of the VIE that most significantly affect the VIE’s economic performance and (b) the obligation to absorb losses or the right to receive benefits that could potentially be significant to the VIE.
The Company adopted the above accounting guidance for the consolidation of VIEs on February 1, 2010. As a result, the Company consolidated one previously unconsolidated entity in the Commercial Group, deconsolidated 9 entities (2 in the Commercial Group and 7 in the Residential Group) and recorded a $74,034,000 reduction to noncontrolling interest included in equity as a cumulative effect of adoption of new consolidation accounting guidance.
90
Forest City Enterprises, Inc. and Subsidiaries
Notes to Consolidated Financial Statements
A.Summary of Significant Accounting Policies (continued)
Variable Interest Entities
The Company’s VIEs consist of joint ventures that are engaged, directly or indirectly, in the ownership, development and management of office buildings, regional malls, specialty retail centers, apartment communities, military housing, supported-living communities, hotels, land development and The Nets. As of January 31, 2012, the Company determined that it was the primary beneficiary of and therefore consolidated 33 VIEs representing 22 properties (18 VIEs representing 9 properties in the Residential Group, 13 VIEs representing 11 properties in the Commercial Group and 2 VIEs/properties in the Land Development Group). The creditors of the consolidated VIEs do not have recourse to the Company’s general credit. As of January 31, 2012, the Company held variable interests in 60 VIEs for which it is not the primary beneficiary. The maximum exposure to loss as a result of its involvement with these unconsolidated VIEs is limited to the Company’s recorded investments in those VIEs totaling approximately $65,000,000 at January 31, 2012. In addition, the Company has also determined that it is the primary beneficiary of a VIE which holds collateralized borrowings of $29,000,000 as of January 31, 2012 (see Note H – Senior and Subordinated Debt).
During the year ended January 31, 2012, the Company completed a recapitalization transaction at8 Spruce Street,an apartment community in Manhattan, New York, whereby the existing noncontrolling partner converted its mezzanine debt to equity and the entity repaid other nonrecourse mortgage debt. Following the transaction, the Company determined the entity no longer qualified as a VIE. Based on the new equity structure, the amended partnership agreements and the substantive participating rights of the outside equity partner, the entity was deconsolidated during the year ended January 31, 2012. The impact of the deconsolidation of the VIE on the Consolidated Balance Sheets and parenthetical disclosures of the VIE balances were decreases of $744,999,000 to real estate, net, $4,588,000 to cash and equivalents, $66,882,000 to restricted cash and escrowed funds, $18,561,000 to other assets, $670,000,000 to nonrecourse mortgage debt and $35,009,000 to accounts payable, accrued expenses and other liabilities, offset by an increase to investments in and advances to affiliates of $130,021,000.
During the year ended January 31, 2010, the Company settled outstanding debt of one of its unconsolidated subsidiaries,Gladden Farms II, a land development project located in Marana, Arizona. In addition, the outside partner communicated its intention to discontinue any future funding into the project. As a result of the loan transaction and the related negotiations with the outside partner, it has been determined thatGladden Farms II is a VIE and the Company is the primary beneficiary, which required consolidation of the entity during the year ended January 31, 2010. The impact of the initial consolidation ofGladden Farms II was an increase in net real estate of approximately $21,643,000 and an increase in noncontrolling interests of approximately $5,010,000. Based on the estimate of fair value, the Company recorded a gain of $1,774,000 upon consolidation of the entity that is recorded in interest and other income for the year ended January 31, 2010.
Use of Estimates
The preparation of consolidated financial statements in conformity with GAAP requires the Company to make estimates and assumptions in certain circumstances that affect amounts reported in the accompanying consolidated financial statements and related notes. Some of the critical estimates made by the Company include, but are not limited to, determination of the primary beneficiary of VIEs, estimates of useful lives for long-lived assets, reserves for collection on accounts and notes receivable and other investments, impairment of real estate and other-than-temporary impairments on its equity method investments. As a result of the nature of estimates made by the Company, actual results could differ.
Reclassification
Certain prior year amounts in the accompanying consolidated financial statements have been reclassified to conform to the current year’s presentation. $290,492,000 was reclassified from investments in and advances to unconsolidated entities to cash distributions and losses in excess of investments in unconsolidated entities in the Consolidated Balance Sheet as of January 31, 2011.
Fiscal Year
The years 2011, 2010 and 2009 refer to the fiscal years ended January 31, 2012, 2011 and 2010, respectively.
91
Forest City Enterprises, Inc. and Subsidiaries
Notes to Consolidated Financial Statements
A.Summary of Significant Accounting Policies (continued)
Recognition of Revenue
Real Estate Sales– The specific timing of a sale transaction and recognition of profit is measured against various criteria in the real estate sales accounting guidance covering the terms of the transaction and any continuing involvement in the form of management or financial assistance associated with the property. If the sales criteria are not met, the Company defers gain recognition and accounts for the transaction by applying the deposit, finance, installment or cost recovery methods, as appropriate.
Consolidated operating properties that have been sold or determined to be held for sale are reported as discontinued operations. The Company considers assets held for sale when the transaction has been approved by management and there are no significant contingencies related to the sale that may prevent the transaction from closing. In most transactions, these contingencies are not satisfied until the actual closing and, accordingly, the property is not identified as held for sale until the closing actually occurs. However, each potential sale is evaluated based on its separate facts and circumstances.
Leasing Operations– The Company enters into leases with tenants in its rental properties. The lease terms of tenants occupying space in the retail centers and office buildings generally range from 1 to 30 years, excluding leases with certain anchor tenants, which typically run longer. Minimum rents are recognized on a straight-line basis over the non-cancelable term of the related lease, which include the effects of rent steps and rent abatements under the leases. Overage rents are recognized only after the contingency has been removed (i.e., sales thresholds have been achieved). Recoveries from tenants for taxes, insurance and other commercial property operating expenses are recognized as revenues in the period the applicable costs are incurred.
Construction– Revenues and profit on long-term fixed-price contracts are recorded using the percentage-of-completion method. Revenues on reimbursable cost-plus fee contracts are recorded in the amount of the accrued reimbursable costs plus proportionate fees at the time the costs are incurred.
Military Housing Fee Revenues– Development fees related to military housing projects are earned based on a contractual percentage of the actual development costs incurred. Additional development incentive fees are recognized based upon successful completion of criteria, such as incentives to realize development cost savings, encourage small and local business participation, comply with specified safety standards and other project management incentives as specified in the development agreements.
Construction management fees are earned based on a contractual percentage of the actual construction costs incurred. Additional construction incentive fees are recognized based upon successful completion of certain criteria as set forth in the construction contracts.
Property management and asset management fees are earned based on a contractual percentage of the annual net rental income and annual operating income, respectively, that is generated by the military housing privatization projects as defined in the agreements. Additional property management incentive fees are recognized based upon successful completion of certain criteria as set forth in the property management agreements.
Recognition of Costs and Expenses
Operating expenses primarily represent the recognition of operating costs, which are charged to operations as incurred, administrative expenses and taxes other than income taxes. Interest expense and real estate taxes during active development and construction are capitalized as a part of the project cost.
Depreciation and amortization is generally computed on a straight-line method over the estimated useful life of the asset. The estimated useful lives of buildings and certain first generation tenant allowances that are considered by management as a component of the building are primarily 50 years. Subsequent tenant improvements and those first generation tenant allowances not considered a component of the building are amortized over the life of the tenant’s lease. This estimated life is based on the length of time the asset is expected to generate positive operating cash flows. Actual events and circumstances can cause the life of the building and tenant improvement to be different than the estimates made. Additionally, lease terminations can affect the economic life of the tenant improvements.
Major improvements and tenant improvements that are considered to be the Company’s assets are capitalized in real estate costs and expensed through depreciation charges. Tenant improvements that are considered lease inducements are capitalized into other assets and amortized as a reduction of rental revenues over the life of the tenant’s lease. Repairs, maintenance and minor improvements are expensed as incurred.
92
Forest City Enterprises, Inc. and Subsidiaries
Notes to Consolidated Financial Statements
A.Summary of Significant Accounting Policies (continued)
A variety of costs are incurred in the development and leasing of properties. After determination is made to capitalize a cost, it is allocated to the specific component of a project that is benefited. Determination of when a development project is substantially complete and capitalization must cease involves judgment. The Company’s capitalization policy on development properties is based on accounting guidance for the capitalization of interest cost and accounting guidance for costs and the initial rental operations of real estate properties. The costs of land and buildings under development include specifically identifiable costs. The capitalized costs include pre-construction costs essential to the development of the property, development costs, construction costs, interest costs, real estate taxes, salaries and related costs and other costs incurred during the period of development. The Company considers a construction project as substantially complete and held available for occupancy upon the completion of tenant improvements, but no later than one year from cessation of major construction activity. The Company ceases capitalization on any portion substantially completed and occupied or held available for occupancy, and capitalizes only those costs associated with the portion under construction. Costs and accumulated depreciation applicable to assets retired or sold are eliminated from the respective accounts and any resulting gains or losses are reported in the Consolidated Statements of Operations.
Termination Benefits
During the years ended January 31, 2012, 2011 and 2010, the Company’s workforce was reduced. The Company provided outplacement services to terminated employees and severance payments based on years of service and other defined criteria. Termination benefits expense (outplacement and severance) are included in operating expenses and reported in the Corporate Activities segment.
The activity in the accrued severance balance for termination costs is as follows:
| | | $000000000 | |
| | | Total | |
| | | (in thousands) | |
| |
Accrued severance balance at January 31, 2009 | | $ | 3,360 | |
| |
Termination benefits expense | | | 8,720 | |
Payments | | | (8,719 | ) |
Accrued severance balance at January 31, 2010 | | | 3,361 | |
| |
Termination benefits expense | | | 5,325 | |
Payments | | | (5,930 | ) |
| |
Accrued severance balance at January 31, 2011 | | | 2,756 | |
| |
Termination benefits expense | | | 5,652 | |
Payments | | | (2,247 | ) |
| |
Accrued severance balance at January 31, 2012 | | $ | 6,161 | |
Impairment of Real Estate
The Company reviews its real estate portfolio, including land held for development and sale, for impairment whenever events or changes indicate that its carrying value may not be recoverable. Impairment indicators include, but are not limited to, significant decreases in property net operating income, significant decreases in occupancy rates, the physical condition of the property and general economic conditions. A property’s value is impaired only if management’s estimate of the aggregate future cash flows (undiscounted and without interest charges) to be generated by the property are less than the carrying value of the property. In addition, the undiscounted cash flows may consider a probability-weighted cash flow estimation approach when alternative courses of action to recover the carrying amount of a long-lived asset are under consideration or a range is estimated at the balance sheet date. Significant estimates are made in the determination of future undiscounted cash flows including future net operating income, estimated holding periods, risk of foreclosure and estimated cash proceeds received upon disposition of the asset. To the extent an impairment has occurred, the loss will be measured as the excess of the carrying amount of the property over the fair value of the property. Determining fair value of real estate, if required, also involves significant judgments and estimates including discount and capitalization rates. Changes to these estimates made by management could affect whether or not an impairment charge would be required and/or the amount of impairment charges recognized.
93
Forest City Enterprises, Inc. and Subsidiaries
Notes to Consolidated Financial Statements
A.Summary of Significant Accounting Policies (continued)
Impairment of Unconsolidated Entities
The Company reviews its portfolio of unconsolidated entities for other-than-temporary impairments whenever events or changes indicate that its carrying value in the investments may be in excess of fair value. A loss in value of an equity method investment which is other-than-temporary is recognized as an impairment of unconsolidated entities. This determination is based upon the length of time elapsed, severity of decline, possible recovery period and other relevant facts. Determining fair value of a real estate investment and whether or not a loss is other-than-temporary involves significant judgments and estimates. Examples of these estimates include timing and amounts of expected cash flows, discount rates, capitalization rates, comparable sales data, among other things. Changes to these estimates made by management could affect whether or not an impairment charge would be required and/or the amount of impairment charges recognized.
Stock-Based Compensation
Stock-based compensation cost is measured at the date of grant and is based on the fair value of the equity award. The fair value of stock options is computed using the Black-Scholes option pricing model, which incorporates assumptions for risk-free rate, expected volatility, dividend yield, and expected life of the options. The fair value of restricted stock is equal to the closing price of the stock on the date of grant. The fair value cost of stock options and restricted stock, as adjusted for estimated forfeitures, is recognized over the requisite service period of the grantee using the straight-line attribution method. Cost recognition is accelerated if the grantee is retirement-eligible (as defined in the 1994 Stock Plan) or becomes retirement-eligible before the end of the nominal vesting period. The cost is recognized immediately if the grantee is retirement-eligible at the date of grant or on a straight-line basis over the period ending with the first anniversary from the date of grant when the individual becomes retirement-eligible. The fair value of performance shares is equal to the closing price of the underlying stock on the date of grant. The compensation cost is recognized on a straight-line basis over the related performance period if it is probable that the performance goals will be achieved.
Earnings Per Share
The Company’s restricted stock is considered a participating security pursuant to the two-class method for computing basic earnings per share (“EPS”). The Class A Common Units issued in exchange for Bruce C. Ratner’s noncontrolling interests in the Forest City Ratner Company portfolio in November 2006 (see Note U – Class A Common Units), which are reflected as noncontrolling interests in the Consolidated Balance Sheets, are considered convertible participating securities as they are entitled to participate in any dividends paid to the Company’s common shareholders. The Class A Common Units are included in the computation of basic EPS using the two-class method and are included in the computation of diluted EPS using the if-converted method. The Class A common stock issuable in connection with the put or conversion of the Puttable Equity-Linked Senior Notes due 2014, Convertible Senior Notes due 2016, Convertible Senior Notes due 2018 and Series A preferred stock are included in the computation of diluted EPS using the if-converted method.
Acquisition of Rental Properties
Upon acquisition of a rental property, the purchase price of the property is allocated to net tangible and identified intangible assets acquired based on fair values. Above-market and below-market in-place lease values for acquired properties are recorded based on the present value (using an interest rate which reflects the risks associated with the leases acquired) of the difference between (i) the contractual amounts to be paid pursuant to the in-place leases and (ii) the Company’s estimate of the fair market lease rates for the corresponding in-place leases, measured over a period equal to the remaining non-cancelable term of the lease. Capitalized above-market lease values are amortized as a reduction of rental revenues (or rental expense for ground leases in which the Company is the lessee) over the remaining non-cancelable terms of the respective leases. Capitalized below-market lease values are amortized as an increase to rental revenues (or rental expense for ground leases in which the Company is the lessee) over the remaining non-cancelable terms of the respective leases, including any fixed-rate renewal periods that are probable of being exercised. For the Company’s below market lease and in-place lease intangibles that remain at January 31, 2012 and 2011, there were no fixed rate renewal periods associated with these leases that the Company deemed probable of renewal and included in the calculation of the intangible asset value or related amortization period.
Intangible assets also include amounts representing the value of tenant relationships and in-place leases based on the Company’s evaluation of each tenant’s lease and the Company’s overall relationship with the respective tenant. The Company estimates the cost to execute leases with terms similar to in-place leases, including leasing commissions, legal expenses and other related expenses. This intangible asset is amortized to expense over the remaining term of the respective lease. The Company’s estimates of value are made using methods similar to those used by independent appraisers or by using independent appraisals. Factors considered by the Company in this analysis include an estimate of the carrying costs during the expected lease-up periods, current market conditions and costs to execute similar leases. In estimating carrying costs, the Company includes real estate taxes, insurance and other operating expenses and estimates of lost rentals at market rates during the
94
Forest City Enterprises, Inc. and Subsidiaries
Notes to Consolidated Financial Statements
A.Summary of Significant Accounting Policies (continued)
expected lease-up periods, which primarily range from three to twelve months. The Company also considers information obtained about each property as a result of its pre-acquisition due diligence, marketing and leasing activities in estimating the fair value of the tangible and intangible assets acquired. The Company also uses the information obtained as a result of its pre-acquisition due diligence as part of considering any conditional asset retirement obligations, and when necessary, will record a conditional asset retirement obligation as part of its purchase price.
When calculating the estimated value to assign to a tenant relationship intangible asset, the Company estimates the likelihood that a lessee will execute a lease renewal and other factors relative to the relationship. In determining the likelihood of lease renewal, the Company utilizes a probability weighted model based on many factors. Other qualitative factors related to the relationship that we consider include, but are not limited to the nature and extent of the business relationship with the tenant, growth prospects for developing new business with the tenant and the tenant’s credit quality. The value of tenant relationship intangibles is amortized over the remaining initial lease term and expected renewals, but in no event longer than the remaining depreciable life of the building. The value of in-place leases is amortized over the remaining non-cancelable term of the respective leases and any fixed-rate renewal periods that are deemed probable.
In the event that a tenant terminates its lease, the unamortized portion of each intangible asset, including market rate adjustments, in-place lease values and tenant relationship values, would be charged to expense.
Cash and Equivalents
The Company considers all highly liquid instruments purchased with a maturity of three months or less to be cash equivalents. Cash equivalents are stated at cost, which approximates market value.
Cash flows associated with items intended as hedges of identifiable transactions or events are classified in the same category as the cash flows from the items being hedged. Cash flows from derivatives not designated as cash flow or fair value hedges are generally classified in the investing section in the Consolidated Statements of Cash Flows.
Cash flows associated with lease procurement costs are classified as investing activities and consist primarily of lease commissions and related legal fees associated with procuring first generation tenants under long-term lease agreements for office buildings, retail regional malls or specialty retail centers. The Company primarily incurs these costs during the development phase of the project and they are integral to starting construction and ultimately completing the project. Management views these lease procurement costs as part of the initial investment to obtain long-term cash inflow.
The Company maintains operating cash and reserves for replacement balances in financial institutions which, from time to time, may exceed federally insured limits. The Company periodically assesses the financial condition of these institutions and believes that the risk of loss is minimal.
Restricted Cash and Escrowed Funds
Restricted cash and escrowed funds represent legally restricted amounts with financial institutions for debt services payments, taxes and insurance, collateral, security deposits, capital replacement, improvement and operating reserves, bond funds, development escrows and construction escrows.
During the year ended January 31, 2010, $10,226,000 of certain replacement reserves previously written off were reinstated by HUD. This amount was recorded as an increase to restricted cash and as a reduction of operating expenses.
Allowance for Doubtful Accounts and Reserves on Notes Receivable
The Company records allowances against its rent receivables from tenants and other receivables that it considers uncollectible. These allowances are based on management’s estimate of receivables that will not be realized from cash receipts in subsequent periods. The Company also maintains an allowance for receivables arising from the straight-lining of rents. This receivable arises from earnings recognized in excess of amounts currently due under the lease agreements. Management exercises judgment in establishing these allowances and considers payment history and current credit status in developing these estimates. The allowance against the straight-line rent receivable is based on historical experience with early lease terminations as well as specific review of significant tenants and tenants that are having known financial difficulties. There is a risk that the estimate of the expected activity of current tenants may not accurately reflect future events. If the estimate does not accurately reflect future tenant vacancies, the reserve for straight-line rent receivable may be over or understated by the actual tenant vacancies that occur.
The Company estimates the allowance for notes receivable based on its assessment of expected future cash flows estimated to be received with consideration given to any collateral of the respective note. If the estimate of expected future cash flows does not accurately reflect actual events, the reserve on notes receivable may be over or understated by the actual cash flows that occur.
95
Forest City Enterprises, Inc. and Subsidiaries
Notes to Consolidated Financial Statements
A.Summary of Significant Accounting Policies (continued)
Investments in Unconsolidated Entities
The Company accounts for its investments in unconsolidated entities using the equity method of accounting whereby the cost of an investment is adjusted for the Company’s share of income or loss from the date of acquisition, increased for equity contributions made and reduced by distributions received. The income or loss for each unconsolidated entity is allocated in accordance with the provisions of the applicable operating agreements, which may differ from the ownership interest held by each investor. Certain of the Company’s investments in unconsolidated entities share of cumulative allocated losses and cash distributions received exceeds its cumulative allocated share of income and equity contributions. As a result, the carrying value of certain investments of unconsolidated entities is negative. Unconsolidated entities with negative carrying values are included in cash distributions and losses in excess of investments in unconsolidated entities in the Company’s Consolidated Balance Sheet. Differences between the Company’s carrying value of its investment on the unconsolidated entities and the Company’s underlying equity of such unconsolidated entities are amortized over the respective lives of the underlying assets or liabilities, as applicable. The Company records income or loss in certain unconsolidated entities based on the distribution priorities, which may change upon the achievement of certain return thresholds.
As is customary within the real estate industry, the Company invests in certain projects through partnerships and limited liability entities. The Company may provide funding in excess of its legal ownership. Such fundings are typically interest-bearing or entitle the Company to a preference on and of such advances on property cash flows and are included in investments in and advances to unconsolidated entities.
Other Assets
Included in other assets are costs incurred in connection with obtaining financings which are deferred and amortized over the life of the related debt. Costs incurred in connection with leasing space to tenants are also included in other assets and are deferred and amortized using the straight-line method over the lives of the related leases.
Investments in securities classified as available-for-sale are reflected in other assets at market value with the unrealized gains or losses reflected as accumulated other comprehensive income (loss). Unrealized gains or losses were not material for any of the three years ending January 31, 2012, 2011 and 2010.
Intangible Assets– Upon an acquisition of a rental property, the Company records intangible assets acquired at their estimated fair value separate and apart from goodwill. The Company amortizes identified intangible assets with finite lives on a straight-line basis over the period the assets are expected to contribute directly or indirectly to the future cash flows of the rental property acquired. Intangible assets are reviewed for impairment whenever events or changes in circumstances indicate that their carrying amount may not be recoverable. An impairment loss is recognized if the carrying amount of an intangible asset is not recoverable and its carrying amount exceeds its estimated fair value.
In connection with the Company’s military housing projects, it records intangible assets based upon the costs associated with acquiring military housing development and management contracts that are in progress. Intangible assets related to the military housing development contracts are amortized based upon the ratio of development fees earned in relation to overall fee income to be earned throughout the contract period. Intangible assets related to the military housing management contracts are amortized based upon a straight-line basis over the remaining term of the management contracts.
See Note D – Other Assets for additional information on intangible assets.
Accounts Payable, Accrued Expenses and Other Liabilities
At January 31, 2012 and 2011, accounts payable, accrued expenses and other liabilities include book overdrafts of $-0- and $10,371,000, respectively. The overdrafts are a result of the Company’s cash management program and represent checks issued but not yet presented to a bank for collection.
96
Forest City Enterprises, Inc. and Subsidiaries
Notes to Consolidated Financial Statements
A.Summary of Significant Accounting Policies (continued)
Accumulated Other Comprehensive Loss
The following table summarizes the components of accumulated other comprehensive income (loss) (“accumulated OCI”):
| | | | | | | | | | | | |
| | | January 31, | |
| | | | |
| | | 2012 | | | 2011 | | | 2010 | |
| | | | |
| | | (in thousands) | |
| | | |
Unrealized losses on securities | | $ | 445 | | | $ | 485 | | | $ | 456 | |
Unrealized losses on foreign currency translation | | | 1,558 | | | | 1,516 | | | | 1,467 | |
Unrealized losses on interest rate contracts(1) | | | 194,928 | | | | 153,432 | | | | 141,764 | |
| | | | |
| | | 196,931 | | | | 155,433 | | | | 143,687 | |
Noncontrolling interest and income tax benefit | | | (76,471 | ) | | | (61,004 | ) | | | (56,421 | ) |
| | | | |
Accumulated Other Comprehensive Loss | | $ | 120,460 | | | $ | 94,429 | | | $ | 87,266 | |
| | | | |
| | (1) | Included in the amounts as of January 31, 2012, 2011 and 2010 are $143,303, $102,387 and $89,637, respectively, of unrealized losses on an interest rate swap associated withNew York Times, an office building in Manhattan, New York, on its nonrecourse mortgage debt with a notional amount of $640,000. This swap effectively fixes the mortgage at an all-in lender interest rate of 6.40% (5.50% swap rate plus 0.90% lender spread) and expires in September 2017. Approximately $33,345 is expected to be reclassified from accumulated OCI to interest expense within the next twelve months. |
Fair Value of Financial Instruments
The carrying amount of notes and accounts receivable and accounts payable, accrued expenses and other liabilities approximates fair value based upon the short-term nature of the instruments. The Company estimates the fair value of its debt instruments by discounting future cash payments at interest rates that the Company believes approximate the current market. Estimated fair value is based upon market prices of public debt, available industry financing data, current treasury rates and recent financing transactions.
The following table summarizes the fair value of nonrecourse mortgage debt and notes payable, bank revolving credit facility, senior and subordinated debt and nonrecourse mortgage debt and notes payable of land held for divestiture:
| | | | | | | | | | | | | | | | | | |
| | | January 31, 2012 | | | | | January 31, 2011 | |
| | | | |
| | | Carrying Value | | | Fair Value | | | | | Carrying Value | | | Fair Value | |
| | | (in thousands) | | | | | (in thousands) | |
| | | | | |
Fixed Rate Debt | | $ | 4,458,214 | | | $ | 4,719,636 | | | | | $ | 4,649,129 | | | $ | 4,802,728 | |
Variable Rate Debt | | | 2,239,838 | | | | 2,341,862 | | | | | | 3,468,924 | | | | 3,519,566 | |
| | | | |
Total | | $ | 6,698,052 | | | $ | 7,061,498 | | | | | $ | 8,118,053 | | | $ | 8,322,294 | |
| | | | |
See Note J – Fair Value Measurements for fair values of other financial instruments.
97
Forest City Enterprises, Inc. and Subsidiaries
Notes to Consolidated Financial Statements
A.Summary of Significant Accounting Policies (continued)
Historic and New Market Tax Credit Entities
The Company has certain investments in properties that have received, or the Company believes are entitled to receive, historic preservation tax credits on qualifying expenditures under Internal Revenue Code (“IRC”) section 47 and new market tax credits on qualifying investments in designated community development entities (“CDEs”) under IRC section 45D, as well as various state credit programs, including participation in the New York State Brownfield Tax Credit Program, which entitles the members to tax credits based on qualified expenditures at the time those qualified expenditures are placed in service. The Company typically enters into these investments with sophisticated financial investors. In exchange for the financial investors’ initial contribution into the investment, the financial investor is entitled to substantially all of the benefits derived from the tax credit, but generally has no material interest in the underlying economics of the property. Typically, these arrangements have put/call provisions (which range up to 7 years) whereby the Company may be obligated (or entitled) to repurchase the financial investors’ interest. The Company has consolidated each of these entities in its consolidated financial statements and has reflected these investor contributions as accounts payable, accrued expenses and other liabilities.
The Company guarantees the financial investor that in the event of a subsequent recapture by a taxing authority due to the Company’s noncompliance with applicable tax credit guidelines it will indemnify the financial investor for any recaptured tax credits. The Company initially records a liability for the cash received from the financial investor. The Company generally records income upon completion and certification of the qualifying development expenditures for historic tax credits and upon certification of the qualifying investments in designated CDEs for new market tax credits resulting in an adjustment of the liability at each balance sheet date to the amount that would be paid to the financial investor based upon the tax credit compliance regulations, which range from 0 to 7 years. Income related to the sale of tax credits of $27,296,000, $31,979,000 and $32,698,000 was recognized during the years ended January 31, 2012, 2011 and 2010, respectively, which was recorded in interest and other income.
Income Taxes
Deferred tax assets and liabilities are recorded to reflect the expected tax consequences on future years attributable to temporary differences between the financial statement carrying amounts and the tax basis of existing assets and liabilities. The Company has recognized the benefit of its tax loss carryforward, which it expects to use as a reduction of the deferred tax expense. The Company records valuation allowances against deferred tax assets if it is more likely than not that a portion or all of the deferred tax asset will not be realized. The Company’s financial statements reflect the expected future tax consequences of a tax position if that tax position is more likely than not of being sustained upon examination, presuming the taxing authorities have full knowledge of the position and all relevant facts. The Company records interest and penalties related to uncertain income tax positions as a component of income tax expense.
Derivative Instruments and Hedging Activities
Derivatives are recorded at fair value. The accounting for changes in the fair value of derivatives depends on the intended use of the derivative, whether the Company has elected to designate a derivative in a hedging relationship and it meets the hedge accounting requirements. Derivatives designated and qualifying as a hedge of the exposure to changes in the fair value of an asset, liability, or firm commitment attributable to a particular risk, such as interest rate risk, are considered fair value hedges. Derivatives designated and qualifying as a hedge of the exposure to variability in expected future cash flows, or other types of forecasted transactions, are considered cash flow hedges. Hedge accounting generally provides for the matching of the timing of gain or loss recognition on the hedging instrument with the recognition of the changes in the fair value of the hedged asset or liability that are attributable to the hedged risk in a fair value hedge or the earnings effect of the hedged forecasted transactions in a cash flow hedge. The Company may enter into derivative contracts that are intended to economically hedge certain of its risks, even though hedge accounting does not apply or the Company elects not to apply hedge accounting.
Noncontrolling Interest
Interests held by partners in consolidated real estate partnerships are reflected in noncontrolling interest, which represents the noncontrolling partners’ share of the underlying net assets of the Company’s consolidated subsidiaries. Noncontrolling interest that is not redeemable is reported in the equity section of the Consolidated Balance Sheets.
Noncontrolling interests where the Company may be required to repurchase the noncontrolling interest at fair value under a put option or other contractual redemption requirement are reported in the mezzanine section of the Consolidated Balance Sheets between liabilities and equity, as redeemable noncontrolling interest. The Company adjusts the redeemable noncontrolling interest to redemption value (which approximates fair value) at each balance sheet date with changes recognized as an adjustment to additional paid-in capital (see Note J – Fair Value Measurements).
98
Forest City Enterprises, Inc. and Subsidiaries
Notes to Consolidated Financial Statements
A.Summary of Significant Accounting Policies (continued)
New Accounting Guidance
The following accounting pronouncements were adopted during the year ended January 31, 2012:
In December 2010, the Financial Accounting Standards Board (“FASB”) issued an amendment to the accounting guidance on the disclosure of supplementary pro forma information for business combinations. This guidance specifies that if a public entity is required to present pro forma comparative financial statements for business combinations that occurred during the current reporting period, the entity should disclose revenue and earnings of the combined entity as though the business combination(s) that occurred during the current year had occurred as of the beginning of the comparable prior annual reporting period only. The guidance is effective for fiscal years beginning on or after December 15, 2010. The adoption of this guidance on February 1, 2011 did not have an impact on the Company’s consolidated financial statement disclosures.
In December 2010, the FASB issued an amendment to the accounting guidance on goodwill and other intangible assets. This guidance specifies when to perform Step 2 of the goodwill impairment test for reporting units with zero or negative carrying amounts. For those reporting units with zero or negative carrying amounts, an entity is required to perform Step 2 of the goodwill impairment test if it is more likely than not that a goodwill impairment exists. In determining whether it is more likely than not that a goodwill impairment exists, an entity should consider whether there are any adverse qualitative factors indicating that an impairment may exist. The guidance is effective for fiscal years beginning after December 15, 2010. The adoption of this guidance on February 1, 2011 did not have a material impact on the Company’s consolidated financial statements.
The following new accounting pronouncements will be adopted on their respective required effective dates:
In December 2011, the FASB issued an amendment to the accounting guidance on derecognition of in substance real estate. This guidance specifies that when a parent company (reporting entity) ceases to have a controlling financial interest (as described in the accounting guidance on Consolidation) in a subsidiary that is in substance real estate as a result of a default on the subsidiary’s nonrecourse debt, the reporting entity should apply the guidance on property, plant and equipment to determine whether it should derecognize the in substance real estate. Generally, a reporting entity would not satisfy the requirements to derecognize the in substance real estate before the legal transfer of the real estate to the lender and the extinguishment of the related nonrecourse indebtedness. This guidance is effective for annual and interim reporting periods beginning on or after June 15, 2012. Early adoption is permitted.
In December 2011, the FASB issued an amendment to the accounting guidance on the presentation of the balance sheet. This guidance requires entities to disclose both gross information and net information on both instruments and transactions eligible for offset on the balance sheets and instruments and transactions subject to an agreement similar to a master netting arrangement. This guidance is effective for annual and interim reporting periods beginning on or after January 1, 2013. Early adoption is not permitted. The Company does not expect the adoption of the guidance to have a material impact on its consolidated financial statements.
In September 2011, the FASB issued an amendment to the accounting guidance on testing goodwill for impairment. This guidance provides an entity the option to first assess qualitative factors to determine whether the existence of events or circumstances leads to a determination that it is more likely than not that the fair value of a reporting unit is less than its carrying amount. If after performing a qualitative assessment, an entity determines that it is not more likely than not that the fair market value of a reporting unit is less than its carrying amount, then performing the two-step goodwill impairment test is not necessary. If an entity concludes otherwise, it is then required to perform the first step of the two-step goodwill impairment test. This guidance is effective for annual and interim goodwill impairment tests performed for fiscal years beginning after December 15, 2011. Early adoption is permitted. The Company does not expect the adoption of this accounting guidance to have a material impact on its consolidated financial statements.
In June 2011, the FASB issued an amendment to the accounting guidance for the presentation of comprehensive income. This guidance provides an entity the option to present the total of comprehensive income, the components of net income, and the components of other comprehensive income either in a single continuous statement of comprehensive income or in two separate but consecutive statements. In addition, this guidance requires an entity to present on the face of the financial statements reclassification adjustments for items that are reclassified from other comprehensive income to net income in the statement(s) where the components of net income and the components of other comprehensive income are presented. In December 2011, the FASB issued guidance which defers the new presentation requirements for reclassification adjustments of items that are reclassified from other comprehensive income to net income in the statement(s) where the components of net income and the components of other comprehensive income are presented. This guidance, except for the indefinitely deferred guidance on the new presentation requirements for reclassification adjustments, is effective for annual and interim reporting periods beginning after December 15, 2011. Early adoption is permitted. The Company does not expect the adoption of this accounting guidance to have a material impact on its consolidated financial statements.
99
Forest City Enterprises, Inc. and Subsidiaries
Notes to Consolidated Financial Statements
A.Summary of Significant Accounting Policies (continued)
In May 2011, the FASB issued amendments to the accounting guidance on fair value measurement and disclosure requirements. This guidance results in common fair value measurement and disclosure requirements for financial statements prepared in accordance with GAAP and International Financial Reporting Standards. As a result, this guidance changes the wording used to describe many of the existing requirements for measuring fair value and for disclosing information about fair value measurements, but for many requirements the intent is not to change the existing application. Some of the guidance clarifies the FASB’s intent about the application of existing fair value measurement requirements or may change a particular principle or requirement for measuring fair value or for disclosing information about fair value measurements. This guidance is effective for annual and interim reporting periods beginning after December 15, 2011. Early adoption is not permitted. The Company does not expect the adoption of the guidance to have a material impact on its consolidated financial statements.
In April 2011, the FASB issued an amendment to the guidance on accounting for transfers and servicing to improve the accounting for repurchase agreements and other agreements that entitle and obligate a transferor to repurchase or redeem financial assets before their maturity. The guidance specifies when an entity may or may not recognize a sale upon the transfer of financial assets subject to repurchase agreements, based upon whether the entity has maintained effective control over the transferred financial assets. This guidance is effective for annual and interim reporting periods beginning on or after December 15, 2011. Early adoption is not permitted. The Company does not expect the adoption of this accounting guidance to have a material impact on its consolidated financial statements.
B.Notes and Accounts Receivable, Net
The components of notes and accounts receivable, net are as follows:
| | | | | | | | |
| | | Years Ended January 31, | |
| | | | |
| | | 2012 | | | 2011 | |
| | | | |
| | | (dollars in thousands) | |
| | |
Straight-line rent from tenants | | $ | 136,486 | | | $ | 162,353 | |
Military Housing, primarily reimbursable construction costs | | | 37,830 | | | | 38,151 | |
Stapleton advances (see below) | | | 82,920 | | | | 64,065 | |
Receivables from tenants | | | 30,616 | | | | 34,724 | |
Other accounts receivable | | | 98,402 | | | | 81,989 | |
Notes receivable | | | 45,865 | | | | 53,011 | |
| | | | |
| | | 432,119 | | | | 434,293 | |
Allowance for doubtful accounts | | | (25,875) | | | | (31,192) | |
| | | | |
| | |
Notes and Accounts Receivable, Net | | $ | 406,244 | | | $ | 403,101 | |
| | | | |
| | |
Weighted average interest rate on notes receivable | | | 5.14% | | | | 5.34% | |
| | |
Notes receivable due within one year | | $ | 16,898 | | | $ | 18,330 | |
Stapleton Advances
Stapleton Land, LLC has made certain interest-bearing advances to the Park Creek Metropolitan District (the “District”) for in-tract infrastructure. The advances are subordinate to the District’s senior and subordinated bonds (see Note F - Financing Arrangements). The Company recorded $6,439,000, $4,237,000 and $3,120,000 of interest income related to these advances for the years ended January 31, 2012, 2011 and 2010, respectively. The advances had a weighted average interest rate of 8.75% at January 31, 2012.
100
Forest City Enterprises, Inc. and Subsidiaries
Notes to Consolidated Financial Statements
C.Investments in Unconsolidated Entities
Investments in unconsolidated entities include investments in and advances to unconsolidated entities and cash distributions and losses in excess of investments in unconsolidated entities that the Company does not control and/or is not deemed to be the primary beneficiary, which are accounted for under the equity method of accounting.
The following is a reconciliation of members’ and partners’ equity to the Company’s carrying value:
| | | | | | | | |
| | | January 31, | |
| | | | |
| | | 2012 | | | 2011 | |
| | | | |
| | | (in thousands) | |
| | |
Members’ and partners’ equity, as below | | $ | 945,129 | | | $ | 587,164 | |
Equity of other members and partners | | | 790,618 | | | | 616,640 | |
| | | | |
| | |
Company’s investment in partnerships | | | 154,511 | | | | (29,476 | ) |
Basis differences(1) | | | 79,913 | | | | 76,634 | |
Advances to and on behalf of affiliates | | | 94,947 | | | | 93,859 | |
| | | | |
Total Investments in Unconsolidated Entities | | $ | 329,371 | | | $ | 141,017 | |
| | | | |
| | |
Assets - Investments in and advances to unconsolidated entities | | $ | 609,079 | | | $ | 431,509 | |
Liabilities - Cash distributions and losses in excess of investments in unconsolidated entities | | | (279,708 | ) | | | (290,492 | ) |
| | | | |
Total Investments in Unconsolidated Entities | | $ | 329,371 | | | $ | 141,017 | |
| | | | |
| | (1) | This amount represents the aggregate difference between the Company’s historical cost basis and the basis reflected at the equity method venture level, which is typically amortized over the life of the related assets and liabilities. Basis differences occur from certain acquisition, transaction and other costs, as well as other-than-temporary impairments that are not reflected in the net assets of the equity method venture. |
Summarized financial information for the equity method investments, including those shown separately later in this Note C, is as follows:
| | | | | | | | |
| | | (Combined 100%) January 31, | |
| | | 2012 | | | 2011 | |
| | | (in thousands) | |
| | |
Balance Sheet: | | | | | | | | |
Real Estate | | | | | | | | |
Completed rental properties | | $ | 7,287,539 | | | $ | 5,514,041 | |
Projects under construction and development | | | 287,738 | | | | 174,106 | |
Land held for development and sale(1) | | | 224,224 | | | | 272,930 | |
Total Real Estate | | | 7,799,501 | | | | 5,961,077 | |
Less accumulated depreciation | | | (1,257,091 | ) | | | (944,968 | ) |
Real Estate, net | | | 6,542,410 | | | | 5,016,109 | |
Cash and equivalents | | | 149,702 | | | | 109,246 | |
Restricted cash - military housing bond funds | | | 284,641 | | | | 384,584 | |
Other restricted cash and escrowed funds | | | 274,201 | | | | 206,778 | |
Other assets | | | 756,564 | | | | 536,246 | |
Operating property assets held for sale(3) | | | - | | | | 67,190 | |
Total Assets | | $ | 8,007,518 | | | $ | 6,320,153 | |
Mortgage debt and notes payable, nonrecourse(2) | | $ | 6,551,891 | | | $ | 5,301,900 | |
Other liabilities | | | 510,498 | | | | 369,871 | |
Liabilities of operating property held for sale(3) | | | - | | | | 61,218 | |
Members’ and partners’ equity | | | 945,129 | | | | 587,164 | |
Total Liabilities and Members’ and Partners’ Equity | | $ | 8,007,518 | | | $ | 6,320,153 | |
| | (1) | The amount at January 31, 2012 includes $181,749 of land held by unconsolidated entities in which the Company is currently reviewing its options to divest its portion of land held by these unconsolidated entities. |
| | (2) | The amount at January 31, 2012 includes $35,551 of mortgage debt and notes payable, nonrecourse related to the land held by the unconsolidated entities discussed in footnote (1). |
| | (3) | Represents assets and liabilities ofMetropolitan Lofts, an unconsolidated apartment community in Los Angeles, California, which was disposed of February 1, 2011. |
101
Forest City Enterprises, Inc. and Subsidiaries
Notes to Consolidated Financial Statements
C.Investments in Unconsolidated Entities (continued)
| | | $0,000,00 | | | | $0,000,00 | | | | $0,000,00 | |
| | | (Combined 100%) Years Ended January 31, | |
| | | 2012 | | | 2011 | | | 2010 | |
| | | (in thousands) | |
| | | |
Operations: | | | | | | | | | | | | |
Revenues | | $ | 1,051,766 | | | $ | 916,942 | | | $ | 818,875 | |
Operating expenses | | | (573,060 | ) | | | (529,975 | ) | | | (528,408 | ) |
Interest expense including early extinguishment of debt | | | (323,667 | ) | | | (264,548 | ) | | | (217,131 | ) |
Impairment of real estate(1) | | | - | | | | (1,457 | ) | | | - | |
Depreciation and amortization | | | (203,319 | ) | | | (167,731 | ) | | | (145,097 | ) |
Interest and other income | | | 14,757 | | | | 15,782 | | | | 13,129 | |
Loss from continuing operations | | $ | (33,523 | ) | | $ | (30,987 | ) | | $ | (58,632 | ) |
Discontinued operations: | | | | | | | | | | | | |
Operating earnings (loss) from rental properties | | | - | | | | 1,842 | | | | (2,007 | ) |
Gain on disposition of rental properties(2) | | | - | | | | 28,289 | | | | - | |
Discontinued operations subtotal | | | - | | | | 30,131 | | | | (2,007 | ) |
Net loss (pre-tax) | | $ | (33,523 | ) | | $ | (856 | ) | | $ | (60,639 | ) |
Company’s portion of net earnings (loss) (pre-tax) | | | 8,580 | | | | 42,352 | | | | (28,458 | ) |
Impairment of investments in unconsolidated entities(1) | | | (82,186 | ) | | | (71,716 | ) | | | (36,356 | ) |
Gain (loss) on disposition of equity method investments(2) | | | 12,567 | | | | (830 | ) | | | 49,761 | |
Net loss (pre-tax) from unconsolidated entities | | $ | (61,039 | ) | | $ | (30,194 | ) | | $ | (15,053 | ) |
| | (1) | The following tables show the detail of the impairments noted above: |
| | $000,000,0000 | | | $000,000,0000 | | | | $000,000,0000 | | | | $000,000,0000 | |
| | | | | Years Ended January 31, | |
| | | | | 2012 | | | 2011 | | | 2010 | |
| | | | | (in thousands) | |
Impairment of real estate: | | | | | | | | | | | | | | |
Old Stone Crossing at Caldwell Creek (Mixed-Use Land Development) | | Charlotte, North Carolina | | $ | - | | | $ | 1,457 | | | $ | - | |
Company’s portion of impairment of real estate | | | | $ | - | | | $ | 743 | | | $ | - | |
Impairment of investments in unconsolidated entities: | | | | | | | | | | | | | | |
Equity method investments in land entities | | Various | | $ | 41,902 | | | $ | - | | | $ | - | |
Specialty Retail Centers: | | | | | | | | | | | | | | |
Village at Gulfstream Park | | Hallandale Beach, Florida | | | 35,674 | | | | 35,000 | | | | - | |
Metreon | | San Francisco, California | | | - | | | | 4,595 | | | | - | |
Commercial land and development rights | | Cleveland, Ohio | | | 4,610 | | | | - | | | | - | |
Four Museum Park properties at Central Station | | Chicago, Illinois | | | - | | | | 18,311 | | | | - | |
Office Buildings: | | | | | | | | | | | | | | |
818 Mission Street | | San Francisco, California | | | - | | | | 4,018 | | | | - | |
Bulletin Building | | San Francisco, California | | | - | | | | 3,543 | | | | - | |
Millender Center | | Detroit, Michigan | | | - | | | | - | | | | 10,317 | |
Pittsburgh Peripheral (Commercial Group Land Project) | | Pittsburgh, Pennsylvania | | | - | | | | - | | | | 7,217 | |
Uptown Apartments | | Oakland, California | | | - | | | | - | | | | 6,781 | |
Classic Residence by Hyatt (Supported-Living Apartments) | | Yonkers, New York | | | - | | | | - | | | | 3,152 | |
Other | | | | | - | | | | 6,249 | | | | 8,889 | |
Total impairment of investments in unconsolidated entities | | | | $ | 82,186 | | | $ | 71,716 | | | $ | 36,356 | |
Total impairment of unconsolidated entities | | | | $ | 82,186 | | | $ | 72,459 | | | $ | 36,356 | |
| | (2) | Upon disposition, investments accounted for on the equity method are not classified as discontinued operations; therefore, gains or losses on the disposition of these properties are reported in continuing operations. The following table shows the detail of the gains and losses on the disposition of unconsolidated entities: |
| | $000,000,0000 | | | $000,000,0000 | | | | $000,000,0000 | | | | $000,000,0000 | |
| | | | | Years Ended January 31, | |
| | | | | 2012 | | | 2011 | | | 2010 | |
| | | | | (in thousands) | |
Gain on disposition of rental properties: | | | | | | | | | | | | | | |
Millender Center (hotel, parking, office and retail) | | Detroit, Michigan | | $ | - | | | $ | 17,291 | | | $ | - | |
Woodbridge Crossing (Specialty Retail Center) | | Woodbridge, New Jersey | | | - | | | | 6,443 | | | | - | |
Pebble Creek (Apartment Community) | | Twinsburg, Ohio | | | - | | | | 4,555 | | | | - | |
Gain on disposition of rental properties | | | | $ | - | | | $ | 28,289 | | | $ | - | |
Company’s portion of gain on disposition of rental properties | | | | $ | - | | | $ | 24,291 | | | $ | - | |
Gain (loss) on disposition of equity method investments: | | | | | | | | | | | | | | |
Apartment Communities: | | | | | | | | | | | | | | |
Metropolitan Lofts | | Los Angeles, California | | $ | 9,964 | | | $ | - | | | $ | - | |
Twin Lake Towers | | Denver, Colorado | | | 2,603 | | | | - | | | | - | |
Clarkwood | | Warrensville Heights, Ohio | | | - | | | | - | | | | 6,983 | |
Granada Gardens | | Warrensville Heights, Ohio | | | - | | | | - | | | | 6,577 | |
Boulevard Towers | | Amherst, New York | | | - | | | | - | | | | 4,498 | |
Sale of three Classic Residence by Hyatt | | Chevy Chase, Maryland, | | | | | | | | | | | | |
(Supported-Living Apartments) | | Teaneck, New Jersey and Yonkers, New York | | | - | | | | - | | | | 31,703 | |
Other | | | | | - | | | | (830 | ) | | | - | |
Total gain (loss) on disposition of equity method investments, net | | | | $ | 12,567 | | | $ | (830 | ) | | $ | 49,761 | |
102
Forest City Enterprises, Inc. and Subsidiaries
Notes to Consolidated Financial Statements
C.Investments in Unconsolidated Entities (continued)
For the year ended January 31, 2012, Brooklyn Basketball Holdings, LLC (“BBH”), an equity method investment that owns The Nets was deemed a significant subsidiary. Summarized financial information for BBH is as follows:
| | | | | | | | |
| | | January 31, | |
| | | | |
| | | 2012 | | | 2011 | |
| | | | |
| | | (in thousands) | |
| | |
Balance Sheet: | | | | | | | | |
Current assets | | $ | 15,955 | | | $ | 12,271 | |
Non-current assets | | | 223,112 | | | | 227,155 | |
| | | | |
| | |
Total Assets | | $ | 239,067 | | | $ | 239,426 | |
| | | | |
Current liabilities | | $ | 126,457 | | | $ | 110,028 | |
Non-current liabilities | | | 123,809 | | | | 107,151 | |
Members’ equity (deficit) | | | (11,199 | ) | | | 22,247 | |
| | | | |
| | |
Total Liabilities and Members’ Equity (Deficit) | | $ | 239,067 | | | $ | 239,426 | |
| | | | |
| | |
| | | Year Ended
January 31, | | | May 12, 2010
through
January 31, | |
| | | | |
| | | 2012 | | | 2011 | |
| | | | |
| | | (in thousands) | |
| | |
Operations: | | | | | | | | |
Revenues | | $ | 54,593 | | | $ | 31,601 | |
Operating expenses | | | (93,765 | ) | | | (54,246 | ) |
Interest expense, net | | | (13,906 | ) | | | (7,981 | ) |
Depreciation and amortization | | | (7,999 | ) | | | (3,476 | ) |
| | | | | | | | |
| | |
Net loss (pre-tax) | | $ | (61,077 | ) | | $ | (34,102 | ) |
| | | | | | | | |
| | |
Company’s portion of net loss (pre-tax) | | $ | (26,814 | ) | | $ | - | (1) |
| | | | | | | | |
| | (1) | On May 12, 2010, entities controlled by Mikhail Prokhorov (“MP Entities”) acquired 80% of the Nets, at which time BBH was formed. Losses from May 12, 2010 through January 31, 2011 were allocated solely to the MP Entities. |
D.Other Assets
Included in other assets are costs incurred in connection with obtaining financing, which are deferred and amortized over the life of the related debt on a straight line basis, which approximates the effective interest method. Costs incurred in connection with leasing space to tenants are also included in other assets and are deferred and amortized using the straight-line method over the lives of the related leases.
| | | | | | | | |
| | | January 31, | |
| | | | |
| | | 2012 | | | 2011 | |
| | | | |
| | | (in thousands) | |
| | |
Lease procurement costs, net | | $ | 227,568 | | | $ | 275,849 | |
Prepaid expenses and other deferred costs, net | | | 227,354 | | | | 266,689 | |
Intangible assets, net | | | 107,192 | | | | 135,906 | |
Mortgage procurement costs, net | | | 46,427 | | | | 80,955 | |
| | | | |
| | |
Other Assets | | $ | 608,541 | | | $ | 759,399 | |
| | | | |
During the years ended January 31, 2012, 2011 and 2010, the Company recorded $7,412,000, $12,484,000 and $16,865,000, respectively, of amortization expense related to intangible assets. The estimated aggregate amortization expense related to intangible assets is $8,633,000, $6,980,000, $6,185,000, $5,667,000 and $5,139,000 for the years ended January 31, 2013, 2014, 2015, 2016 and 2017, respectively.
103
Forest City Enterprises, Inc. and Subsidiaries
Notes to Consolidated Financial Statements
E.Mortgage Debt and Notes Payable, Nonrecourse
Nonrecourse mortgage debt and notes payable, which is collateralized solely by completed rental properties, projects under construction and development and undeveloped land, was as follows:
| | | | | | | | | | | | | | | | | | | | |
| January 31, 2012 | | Operating
Properties | | | Development
Projects | | | Land
Projects | | | Total | | | Total
Weighted
Average
Rate | |
| | | | |
| | | (dollars in thousands) | |
| | | | | |
Fixed | | $ | 3,008,293 | | | $ | 406,619 | | | $ | 4,773 | | | $ | 3,419,685 | | | | 5.65 | % |
Variable | | | | | | | | | | | | | | | | | | | | |
Taxable | | | 1,378,585 | | | | 409,733 | | | | 14,311 | | | | 1,802,629 | | | | 4.76 | % |
Tax-Exempt | | | 421,434 | | | | - | | | | 15,775 | | | | 437,209 | | | | 1.55 | % |
| | | | | | | | |
| | $ | 4,808,312 | | | $ | 816,352 | (1) | | $ | 34,859 | | | $ | 5,659,523 | | | | 5.05 | % |
| | | | | | | | |
| | | | | |
Total gross commitment from lenders | | | | | | $ | 1,338,181 | | | $ | 35,058 | | | | | | | | | |
| | | | | | | | | | | | | | | | |
|
(1) Includes mortage debt and notes payable, nonrecourse and mortgage debt and notes payable, nonrecourse of land held for divestiture. |
| | | | | | | | | | | | | | | | | | | | |
| January 31, 2011 | | Operating
Properties | | | Development
Projects | | | Land
Projects | | | Total | | | Total
Weighted
Average
Rate | |
| | | | |
| | | (dollars in thousands) | |
| | | | | |
Fixed | | $ | 3,693,608 | | | $ | 172,635 | | | $ | 9,203 | | | $ | 3,875,446 | | | | 6.04 | % |
Variable | | | | | | | | | | | | | | | | | | | | |
Taxable | | | 1,554,487 | | | | 1,000,775 | | | | 6,882 | | | | 2,562,144 | | | | 4.50 | % |
Tax-Exempt | | | 530,728 | | | | 203,900 | | | | 35,000 | | | | 769,628 | | | | 2.09 | % |
| | | | | | | | |
| | $ | 5,778,823 | | | $ | 1,377,310 | (1) | | $ | 51,085 | | | $ | 7,207,218 | | | | 5.07 | % |
| | | | | | | | |
| | | | | |
Total gross commitment from lenders | | | | | | $ | 2,027,549 | | | $ | 51,085 | | | | | | | | | |
| | | | | | | | | | | | | | | | |
| | (1) | Proceeds from outstanding debt of $1,646 and $150,165 described above are recorded as restricted cash and escrowed funds as of January 31, 2012 and 2011, respectively. For bonds issued in conjunction with development, the full amount of the bonds is issued at the beginning of construction and must remain in escrow until costs are incurred. |
The Company generally borrows funds for development and construction projects with maturities of two to five years utilizing variable-rate financing. Upon opening and achieving stabilized operations, the Company generally pursues long-term fixed-rate financing.
The following summarizes the composition of mortgage debt and notes payable, nonrecourse maturities including scheduled amortization and balloon payments as of January 31, 2012:
| | | | | | | | | | | | |
| Fiscal Years Ending January 31, | | Total
Maturities | | | Scheduled
Amortization | | | Scheduled
Balloon
Payments | |
| |
| | | (in thousands) | |
| | | |
2013 | | $ | 1,334,090 | | | $ | 93,883 | | | $ | 1,240,207 | |
2014 | | | 787,769 | | | | 41,331 | | | | 746,438 | |
2015 | | | 316,194 | | | | 33,347 | | | | 282,847 | |
2016 | | | 346,610 | | | | 30,843 | | | | 315,767 | |
2017 | | | 420,946 | | | | 24,060 | | | | 396,886 | |
Thereafter | | | 2,453,914 | | | | | | | | | |
| | | | | | | | | | | | |
Total | | $ | 5,659,523 | | | | | | | | | |
| | | | | | | | | | | | |
104
Forest City Enterprises, Inc. and Subsidiaries
Notes to Consolidated Financial Statements
F.Financing Arrangements
On August 16, 2005, the District issued $58,000,000 Junior Subordinated Limited Property Tax Supported Revenue Bonds, Series 2005 (the “Junior Subordinated Bonds”). The Junior Subordinated Bonds initially were to pay a variable rate of interest. Upon issuance, the Junior Subordinated Bonds were purchased by a third party and the sales proceeds were deposited with a trustee pursuant to the terms of the Series 2005 Investment Agreement. Under the terms of the Series 2005 Investment Agreement, after March 1, 2006, the District may elect to withdraw funds from the trustee for reimbursement for certain qualified infrastructure and interest expenditures (“Qualifying Expenditures”). In the event that funds from the trustee are used for Qualifying Expenditures, a corresponding amount of the Junior Subordinated Bonds converts to an 8.5% fixed rate and matures in December 2037 (“Converted Bonds”). On August 16, 2005, Stapleton Land, LLC, a consolidated subsidiary, entered into a Forward Delivery Placement Agreement (“FDA”) whereby Stapleton Land, LLC was entitled and obligated to purchase the converted fixed rate Junior Subordinated Bonds through June 2, 2008. The District withdrew $58,000,000 of funds from the trustee for reimbursement of certain Qualifying Expenditures by June 2, 2008 and the Junior Subordinated Bonds became Converted Bonds. The Converted Bonds were acquired by Stapleton Land, LLC under the terms of the FDA. Stapleton Land, LLC immediately transferred the Converted Bonds to investment banks and the Company simultaneously entered into a total rate of return swap (“TRS”) with a notional amount of $58,000,000. The Company receives a fixed rate of 8.5% and pays the SIFMA rate plus a spread on the TRS related to the Converted Bonds. The Company determined that the sale of the Converted Bonds to the investment banks and simultaneous execution of the TRS did not surrender control; therefore, the Converted Bonds have been recorded as a secured borrowing and included in mortgage debt and notes payable, nonrecourse.
Prior to May 12, 2011, consolidated subsidiaries of the Company purchased $23,000,000 of the Converted Bonds from the investment banks. Simultaneous to each purchase, a corresponding amount of a related TRS was terminated and the corresponding secured borrowing was removed from the Consolidated Balance Sheets. On May 12, 2011, the District refinanced $42,000,000 of the outstanding $58,000,000 Junior Subordinated Bonds. The Company received $23,000,000 of the refinancing proceeds as repayment of Converted Bonds held by its consolidated subsidiaries and the investment banks received the remaining $19,000,000 of refinancing proceeds which simultaneously terminated a corresponding amount of the related TRS and corresponding secured borrowing. On December 1, 2011, $225,000 of the Converted Bonds was redeemed by the investment banks and a corresponding amount of the related TRS and corresponding secured borrowings were simultaneously terminated. The fair value of the Converted Bonds recorded in other assets was $15,775,000 and $58,000,000 at January 31, 2012 and 2011, respectively. Outstanding TRS contracts were in place on the $15,775,000 and $35,000,000 of secured borrowings related to the Converted Bonds at January 31, 2012 and 2011, respectively. At January 31, 2012, the outstanding TRS contracts were supported by collateral consisting primarily of certain notes receivable owned by the Company aggregating $5,235,000. The Company recorded net interest income of $1,220,000, $1,966,000 and $2,331,000 related to the TRS for the years ended January 31, 2012, 2011 and 2010, respectively.
G.Bank Revolving Credit Facility
On March 30, 2011, the Company and its 13-member bank group entered into a Third Amended and Restated Credit Agreement and a Third Amended and Restated Guaranty of Payment of Debt (collectively, the “Credit Facility”). On April 21, 2011, one additional member was admitted to the bank group and the total available borrowings were increased from $425,000,000 to $450,000,000. The Credit Facility matures on March 30, 2014 and provides for one, 12-month extension option, subject to certain conditions. Borrowings bear interest at LIBOR, subject to a floor of 100 basis points, plus 3.75%. Up to $100,000,000 of the available borrowings may be used, in the aggregate, for letters of credit and/or surety bonds. The Credit Facility has a number of restrictive covenants, including a prohibition on certain consolidations and mergers, limitations on the amount of debt, guarantees and property liens that the Company may incur and restrictions on the pledging of ownership interests in subsidiaries. The Credit Facility removes the previous prohibition on paying common stock dividends, subject to a specified limitation. As amended on July 13, 2011, this limitation allows the Company to utilize up to $24,000,000 during any four consecutive fiscal quarter periods for either common stock dividends or common stock repurchases and required a portion of the proceeds from the issuance of the Company’s 2018 Senior Notes to be used to retire certain debt, as discussed below. Additionally, the Credit Facility contains certain development limitations and financial covenants, including the maintenance of minimum liquidity, certain debt service and cash flow coverage ratios, and specified levels of shareholders’ equity (all as specified in the Credit Facility). At January 31, 2012, the Company was in compliance with all of these financial covenants.
105
Forest City Enterprises, Inc. and Subsidiaries
Notes to Consolidated Financial Statements
G.Bank Revolving Credit Facility (continued)
On March 30, 2011, the Company also entered into a First Amendment to the Pledge Agreement (“Pledge Agreement”) with the banks party to the Credit Facility. The Pledge Agreement secures the Company’s obligations under the Credit Facility by granting a security interest to the bank group in its right, title and interest as a member, partner, shareholder or other equity holder of certain direct subsidiaries, including, but not limited to, its right to receive profits, proceeds, accounts, income, dividends, distributions or return of capital from such subsidiaries, to the extent the granting of such security interest would not result in a default under project level financing or the organizational documents of such subsidiaries.
On July 13, 2011, the Company entered into a first amendment to the Credit Facility. This amendment permitted the Company to issue $350,000,000 of Convertible Senior Notes due 2018 (the “Issuance”). The amendment required that 75% of the net proceeds ($254,531,000) from the Issuance be used to retire debt no later than 180 days subsequent to the closing of such Issuance, subject to an additional 90-day extension provided certain terms of the amendment are met. At January 31, 2012, the Company has fully met this requirement and no further reserve for retirement of debt is required.
The following table summarizes the available credit on the Credit Facility:
| | | | | | | | |
| | | January 31, | |
| | | | |
| | | 2012 | | | 2011 | |
| | | | |
| | | (in thousands) | |
| | |
Maximum borrowings | | $ | 450,000 | | | $ | 470,336 | |
Less outstanding balances and reserves: | | | | | | | | |
Borrowings | | | - | | | | 137,152 | |
Letters of credit | | | 69,389 | | | | 63,418 | |
Surety bonds | | | - | | | | - | |
Reserve for retirement of indebtedness | | | - | | | | 46,891 | |
| | | | |
Available credit | | $ | 380,611 | | | $ | 222,875 | |
| | | | |
H.Senior and Subordinated Debt
The following table summarizes the Company’s senior and subordinated debt:
| | | | | | | | |
| | | January 31, | |
| | | | |
| | | 2012 | | | 2011 | |
| | | | |
| | | (in thousands) | |
| | |
Senior Notes: | | | | | | | | |
3.625% Puttable Equity-Linked Senior Notes due 2011, net of discount | | $ | - | | | $ | 45,480 | |
3.625% Puttable Equity-Linked Senior Notes due 2014, net of discount | | | 199,132 | | | | 198,806 | |
7.625% Senior Notes due 2015 | | | 178,253 | | | | 178,253 | |
5.000% Convertible Senior Notes due 2016 | | | 50,000 | | | | 90,000 | |
6.500% Senior Notes due 2017 | | | 132,144 | | | | 132,144 | |
4.250% Convertible Senior Notes due 2018 | | | 350,000 | | | | - | |
7.375% Senior Notes due 2034 | | | 100,000 | | | | 100,000 | |
| | | | |
| | |
Total Senior Notes | | | 1,009,529 | | | | 744,683 | |
| | | | |
| | |
Subordinated Debt: | | | | | | | | |
Subordinate Tax Revenue Bonds due 2013 | | | 29,000 | | | | 29,000 | |
| | | | |
| | |
Total Senior and Subordinated Debt | | $ | 1,038,529 | | | $ | 773,683 | |
| | | | |
All of the Company’s senior notes are unsecured senior obligations and rank equally with all existing and future unsecured indebtedness; however, they are effectively subordinated to all existing and future secured indebtedness and other liabilities of the Company’s subsidiaries to the extent of the value of the collateral securing such other debt, including the Credit Facility. The indentures governing the senior notes contain covenants providing, among other things, limitations on incurring additional debt and payment of dividends. At January 31, 2012, the Company was in compliance with all of these financial covenants.
106
Forest City Enterprises, Inc. and Subsidiaries
Notes to Consolidated Financial Statements
H.Senior and Subordinated Debt (continued)
Puttable Equity-Linked Senior Notes due 2011
During October 2011, the Company’s remaining 3.625% Puttable Equity-Linked Senior Notes due 2011 (“2011 Senior Notes”) matured and were paid in full.
The following table summarizes the carrying amounts of the Company’s debt and equity balances related to the 2011 Senior Notes:
| | | | |
| | | January 31, | |
| | | 2011 | |
| | | (in thousands) | |
| |
Carrying amount of equity component | | $ | 7,484 | |
| | | | |
| |
Outstanding principal amount of the puttable equity-linked senior notes | | | 46,891 | |
Unamortized discount | | | (1,411 | ) |
| | | | |
Net carrying amount of the puttable equity-linked senior notes | | $ | 45,480 | |
| | | | |
The unamortized discount was amortized as additional interest expense through October 15, 2011. The effective interest rate for the liability component of the 2011 Senior Notes was 7.51%. The Company recorded non-cash interest expense of $1,411,000, $1,532,000 and $6,809,000 for the years ended January 31, 2012, 2011 and 2010, respectively. The Company recorded contractual interest expense of $1,204,000, $2,001,000 and $7,973,000 for the years ended January 31, 2012, 2011 and 2010, respectively.
Puttable Equity-Linked Senior Notes due 2014
On October 7, 2009, the Company issued $167,433,000 of 3.625% Puttable Equity-Linked Senior Notes due October 15, 2014 (“2014 Senior Notes”) to certain holders in exchange for $167,433,000 of 2011 Senior Notes. Concurrent with this exchange, the Company issued an additional $32,567,000 of 2014 Senior Notes in a private placement, net of a 5% discount. Interest on the 2014 Senior Notes is payable semi-annually in arrears on April 15 and October 15.
Holders may put their 2014 Senior Notes to the Company at any time prior to the earlier of (i) stated maturity or (ii) the Put Termination Date, as defined below. Upon a put, a note holder would receive 68.7758 shares of the Company’s Class A common stock per $1,000 principal amount of 2014 Senior Notes, based on a put value price of $14.54 per share of Class A common stock, subject to adjustment. The amount payable upon a put of the 2014 Senior Notes is only payable in shares of the Company’s Class A common stock, except for cash paid in lieu of fractional shares. If the daily volume weighted average price of the Class A common stock has equaled or exceeded 130% ($18.90 at January 31, 2012) of the put value price then in effect for at least 20 trading days in any 30 trading day period, the Company may, at its option, elect to terminate the rights of the holders to put their 2014 Senior Notes to the Company. If it so elects, the Company is required to issue a put termination notice that designates an effective date on which the holders termination put rights will be terminated, which shall be a date at least 20 days after the mailing of such put termination notice (the “Put Termination Date”). Holders electing to put their 2014 Senior Notes after the mailing of a put termination notice and before the Put Termination Date shall receive a coupon make-whole payment in an amount equal to the remaining scheduled interest payments attributable to such notes from the last applicable interest payment date through and including October 15, 2013. This coupon make-whole payment is payable, at the Company’s option, in either cash or Class A common stock.
Senior Notes due 2015
On May 19, 2003, the Company issued $300,000,000 of 7.625% Senior Notes due June 1, 2015 (“2015 Senior Notes”) in a public offering. Accrued interest is payable semi-annually on December 1 and June 1. Effective June 1, 2011, the 2015 Senior Notes are redeemable by the Company, in whole or in part, at par. During the year ended January 31, 2011, the Company retired $121,747,000 of 2015 Senior Notes in exchange for Series A preferred stock.
107
Forest City Enterprises, Inc. and Subsidiaries
Notes to Consolidated Financial Statements
H.Senior and Subordinated Debt (continued)
Convertible Senior Notes due 2016
On October 26, 2009, the Company issued $200,000,000 of 5.00% Convertible Senior Notes due October 15, 2016 (“2016 Senior Notes”) in a private placement. The 2016 Senior Notes were issued at par and accrued interest is payable semi-annually on April 15 and October 15.
On May 5, 2011, the Company entered into separate, privately negotiated exchange agreements with certain holders of the 2016 Senior Notes to exchange such notes for shares of the Company’s Class A common stock. In order to induce the holders to make the exchange, the Company agreed to increase the conversion rate from 71.8894 shares of Class A common stock per $1,000 principal amount of 2016 Senior Notes to 86.1073 shares, which factors in foregone interest to the holders among other inducements. Under the terms of the agreements, holders agreed to exchange $40,000,000 in aggregate principal amount of 2016 Senior Notes for a total of 3,444,293 shares of Class A common stock. Any accrued but unpaid interest was paid in cash. Under the accounting guidance for induced conversion of convertible debt, the additional amounts paid to induce the holders to exchange their 2016 Senior Notes was expensed resulting in a non-tax deductible loss of $10,800,000 during the year ended January 31, 2012, which is recorded as early extinguishment of debt.
On January 27, 2011, the Company entered into separate, privately negotiated exchange agreements with certain holders of its 2016 Senior Notes to exchange such notes for shares of Class A common stock. In order to induce the holders to make the exchange, the Company agreed to increase the conversion rate from 71.8894 shares of Class A common stock per $1,000 principal amount of 2016 Senior Notes to 88.8549 shares, which factors in foregone interest to the holders among other inducements. Under the terms of the agreements, holders agreed to exchange $110,000,000 in aggregate principal amount of 2016 Senior Notes for a total of 9,774,039 shares of Class A common stock. Any accrued but unpaid interest was paid in cash. Under the accounting guidance for induced conversions of convertible debt, the additional amounts paid to induce the holders to exchange their 2016 Senior Notes was expensed resulting in a non-tax deductible loss of $31,689,000 during the year ended January 31, 2011, which is recorded as early extinguishment of debt.
Holders may convert their 2016 Senior Notes at their option at any time prior to the close of business on the second scheduled trading day immediately preceding the maturity date. Upon conversion, a note holder would receive 71.8894 shares of Class A common stock per $1,000 principal amount of 2016 Senior Notes, based on a put value price of approximately $13.91 per share of Class A common stock, subject to adjustment. The amount payable upon a conversion of the 2016 Senior Notes is only payable in shares of the Company’s Class A common stock, except for cash paid in lieu of fractional shares.
In connection with the issuance of the 2016 Senior Notes, the Company entered into a convertible note hedge transaction. The convertible note hedge transaction is intended to reduce, subject to a limit, the potential dilution with respect to the Company’s Class A common stock upon conversion of the 2016 Senior Notes. The net effect of the convertible note hedge transaction, from the Company’s perspective, is to approximate an effective conversion price of $16.37 per share. The terms of the 2016 Senior Notes were not affected by the convertible note hedge transaction. The convertible note hedge transaction was recorded as a reduction of shareholders’ equity through additional paid in capital. In connection with the January 27, 2011 exchange transaction previously discussed, the Company terminated a portion of the convertible note hedge which resulted in the receipt of cash proceeds of $1,869,000.
Senior Notes due 2017
On January 25, 2005, the Company issued $150,000,000 of 6.500% Senior Notes due February 1, 2017 (“2017 Senior Notes”) in a public offering. Accrued interest is payable semi-annually on February 1 and August 1. As of February 1, 2011, the 2017 Senior Notes may be redeemed by the Company, in whole or in part, at a redemption price of 102.167% and systematically reduced to par through February 1, 2013. During the year ended January 31, 2011, the Company retired $5,826,000 of 2017 Senior Notes in exchange for Series A preferred stock and also purchased on the open market $12,030,000 in principal of 2017 Senior Notes.
108
Forest City Enterprises, Inc. and Subsidiaries
Notes to Consolidated Financial Statements
H.Senior and Subordinated Debt (continued)
Convertible Senior Notes due 2018
On July 19, 2011, the Company issued $350,000,000 of 4.25% Convertible Senior Notes due August 15, 2018 (“2018 Senior Notes”) in a private placement. The 2018 Senior Notes were issued at par and accrued interest is payable semi-annually on February 15 and August 15, beginning February 15, 2012.
Holders may convert their 2018 Senior Notes at their option at any time prior to the close of business on the scheduled trading day immediately preceding the maturity date. Upon conversion, a note holder would receive 46.1425 shares of Class A common stock per $1,000 principal amount of 2018 Senior Notes, based on a conversion price of approximately $21.67 per share of Class A common stock, subject to adjustment. The amount payable upon a conversion of the 2018 Senior Notes is only payable in shares of Class A common stock, except for cash paid in lieu of fractional shares. If the daily volume weighted average price of the Class A common stock has equaled or exceeded 130% ($28.17 at January 31, 2012) of the conversion price then in effect for at least 20 trading days in a 30 trading day period, the Company may, at its option, elect to terminate the conversion rights of the holders at any time. If it so elects, the Company is required to issue a conversion rights termination notice that designates an effective date on which the holders conversion rights will be terminated, which shall be a date at least 20 days after the mailing of such conversion rights termination notice (the “Conversion Termination Date”). Holders electing to convert their 2018 Senior Notes after the mailing of a conversion rights termination notice and before the Conversion Termination Date shall receive cash payments of accrued and unpaid interest to, but not including, the conversion date and a make-whole premium for an amount equal to the remaining scheduled interest payments attributable to such notes through and including August 15, 2014.
Senior Notes due 2034
On February 10, 2004, the Company issued $100,000,000 of 7.375% Senior Notes due February 1, 2034 in a public offering. Accrued interest is payable quarterly on February 1, May 1, August 1, and November 1. These senior notes may be redeemed by the Company, in whole or in part, at any time at par, plus accrued interest.
Subordinated Debt
In May 2003, the Company purchased $29,000,000 of subordinate tax revenue bonds that were contemporaneously transferred to a custodian, which in turn issued custodial receipts that represent ownership in the bonds to unrelated third parties. The bonds bear a fixed interest rate of 7.875%. The Company evaluated the transfer pursuant to the accounting guidance on accounting for transfers and servicing of financial assets and extinguishment of liabilities and has determined that the transfer does not qualify for sale accounting treatment principally because the Company has guaranteed the payment of principal and interest in the event that there is insufficient tax revenue to support the bonds when the custodial receipts are subject to mandatory tender on December 1, 2013. As such, the Company is the primary beneficiary of this VIE and the book value (which approximated amortized costs) of the bonds was recorded as a collateralized borrowing reported as senior and subordinated debt and as held-to-maturity securities reported as other assets.
Consolidated Interest Expense
The following table summarizes interest incurred, capitalized and paid on all forms of indebtedness (included in Notes E, G and H).
| | | $0,00000 | | | | $0,00000 | | | | $0,00000 | |
| | | Years Ended January 31, | |
| | | 2012 | | | 2011 | | | 2010 | |
| | | | |
| | | (in thousands) | |
| | | |
Interest incurred | | $ | 454,485 | | | $ | 482,430 | | | $ | 455,746 | |
Interest capitalized | | | (193,448 | ) | | | (172,664 | ) | | | (112,887 | ) |
| | | | |
Net interest expense | | $ | 261,037 | | | $ | 309,766 | | | $ | 342,859 | |
| | | | |
| | | |
Interest incurred from discontinued operations | | $ | 2,937 | | | $ | 11,404 | | | $ | 9,595 | |
| | | | |
| | | |
Cash paid for interest (net of amount capitalized) | | $ | 260,822 | | | $ | 318,910 | | | $ | 330,309 | |
| | | | |
109
Forest City Enterprises, Inc. and Subsidiaries
Notes to Consolidated Financial Statements
I.Derivative Instruments and Hedging Activities
Risk Management Objective of Using Derivatives
The Company maintains an overall interest rate risk management strategy that incorporates the use of derivative instruments to minimize significant unplanned decreases in earnings and cash flows that may be caused by interest rate volatility. Derivative instruments that are used as part of the Company’s strategy include interest rate swaps and option contracts that have indices related to the pricing of specific balance sheet liabilities. The Company enters into interest rate swaps to convert certain floating-rate debt to fixed-rate long-term debt, and vice-versa, depending on market conditions, or forward starting swaps to hedge the changes in benchmark interest rates on forecasted financings. The Company enters into interest rate swap agreements for hedging purposes for periods that are generally one to ten years. Option products utilized include interest rate caps, floors and Treasury options. The use of these option products is consistent with the Company’s risk management objective to reduce or eliminate exposure to variability in future cash flows primarily attributable to changes in benchmark rates relating to forecasted financings, and the variability in cash flows attributable to increases relating to interest payments on its floating-rate debt. The caps and floors have typical durations ranging from one to three years while the Treasury options are for periods of five to ten years. The Company does not have any Treasury options outstanding at January 31, 2012.
Cash Flow Hedges of Interest Rate Risk
The Company’s objectives in using interest rate derivatives are to add stability to interest expense and to manage its exposure to interest rate movements. To accomplish these objectives, the Company primarily uses interest rate caps and swaps as part of its interest rate risk management strategy. Interest rate caps designated as cash flow hedges involve the receipt of variable-rate amounts from a counterparty if interest rates rise above the strike rate on the contract in exchange for an upfront premium. Interest rate swaps designated as cash flow hedges involve the receipt of variable-rate amounts from a counterparty in exchange for the Company making fixed-rate payments over the life of the agreements without exchange of the underlying notional amount.
The effective portion of changes in the fair value of derivatives designated and qualifying as cash flow hedges is recorded in accumulated OCI and is subsequently reclassified into earnings in the period that the hedged forecasted transaction affects earnings. The ineffective portion of the change in fair value of the derivatives is recognized directly in earnings. The amount of ineffectiveness was insignificant for the years ended January 31, 2012 and 2011, and the Company recorded $1,012,000 as an increase in interest expense for the year ended January 31, 2010 which represented total ineffectiveness of all fully consolidated cash flow hedges. Included in the total ineffectiveness charged to earnings are derivative losses reclassified from accumulated OCI as a result of forecasted transactions that did not occur by the end of the originally specified time period or within an additional two-month period of time thereafter (missed forecasted transaction). There were no missed forecasted transactions for the years ended January 31, 2012 and 2011. For the year ended January 31, 2010, there was one missed forecasted transaction that resulted in $928,000 of the total ineffectiveness recognized in the period. As of January 31, 2012, the Company expects that within the next twelve months it will reclassify amounts recorded in accumulated OCI into earnings as an increase in interest expense of approximately $27,718,000, net of tax. However, the actual amount reclassified could vary due to future changes in fair value of these derivatives.
Fair Value Hedges of Interest Rate Risk
From time to time, the Company and/or certain of its joint ventures (the “Joint Ventures”) enter into TRS on various tax-exempt fixed-rate borrowings generally held by the Company and/or within the Joint Ventures. The TRS convert these borrowings from a fixed rate to a variable rate and provide an efficient financing product to lower the cost of capital. In exchange for a fixed rate, the TRS require the Company and/or the Joint Ventures pay a variable rate, generally equivalent to the SIFMA rate plus a spread. At January 31, 2012, the SIFMA rate was 0.08%. Additionally, the Company and/or the Joint Ventures have guaranteed the fair value of the underlying borrowing. Any fluctuation in the value of the TRS would be offset by the fluctuation in the value of the underlying borrowing, resulting in minimal financial impact to the Company and/or the Joint Ventures. At January 31, 2012, the aggregate notional amount of TRS that are designated as fair value hedging instruments is $270,757,000. The underlying TRS borrowings are subject to a fair value adjustment (see Note J – Fair Value Measurements).
110
Forest City Enterprises, Inc. and Subsidiaries
Notes to Consolidated Financial Statements
I.Derivative Instruments and Hedging Activities (continued)
Nondesignated Hedges of Interest Rate Risk
The Company entered into derivative contracts that are intended to economically hedge certain interest rate risk, even though the contracts do not qualify for hedge accounting or the Company has elected not to apply hedge accounting. In situations in which hedge accounting is discontinued, or not elected, and the derivative remains outstanding, the Company records the derivative at its fair value and recognizes changes in the fair value in the Consolidated Statements of Operations.
The Company enters into forward swaps to protect itself against fluctuations in the swap rate at terms ranging between five to ten years associated with forecasted fixed rate borrowings. At the time the Company secures and locks an interest rate on an anticipated financing, it intends to simultaneously terminate the forward swap associated with that financing. At January 31, 2012, the Company had no forward swaps outstanding. The Company terminated forward swaps with notional amounts of $62,800,000 and $107,000,000 on February 1, 2011 and May 3, 2010, respectively. These forward swaps were not designated as cash flow hedges under the accounting guidance on derivatives and hedging activities. As such, the change in fair value of these swaps were marked to market through earnings on a quarterly basis. Related to these forward swaps, the Company recorded $(229,000), $1,200,000 and $(4,761,000) for the years ended January 31, 2012, 2011 and 2010, respectively, as an increase (reduction) of interest expense.
In instances where the Company enters into separate derivative instruments effectively hedging the same debt for consecutive annual periods, the amount of notional is excluded from the following disclosure in an effort to provide information that enables the financial statement user to understand the Company’s volume of derivative activity. The following table presents the fair values and location in the Consolidated Balance Sheets of all derivative instruments.
| | | | | | | | | | | | | | | | |
| | | Fair Value of Derivative Instruments
January 31, 2012 | |
| | | Asset Derivatives (included in Other Assets) | | | Liability Derivatives (included in Accounts Payable and Accrued Expenses) | |
| | | | |
| | | Current
Notional | | | Fair Value | | | Current
Notional | | | Fair Value | |
| | | | |
| | | (in thousands) | |
| | | | |
Derivatives Designated as Hedging Instruments | | | | | | | | | | | | | | | | |
Interest rate caps | | $ | - | | | $ | - | | | $ | - | | | $ | - | |
Interest rate swap agreements | | | - | | | | - | | | | 897,193 | | | | 148,699 | |
TRS | | | 27,197 | | | | 774 | | | | 243,560 | | | | 9,954 | |
| | | | | | | | | | | | | | | | |
Total derivatives designated as hedging instruments | | $ | 27,197 | | | $ | 774 | | | $ | 1,140,753 | | | $ | 158,653 | |
| | | | | | | | | | | | | | | | |
| | | | |
Derivatives Not Designated as Hedging Instruments | | | | | | | | | | | | | | | | |
Interest rate caps and floors | | $ | 435,201 | | | $ | 13 | | | $ | - | | | $ | - | |
Interest rate swap agreements | | | 19,521 | | | | 1,083 | | | | - | | | | - | |
TRS | | | 141,703 | | | | 9,534 | | | | 30,360 | | | | 15,367 | |
| | | | | | | | | | | | | | | | |
Total derivatives not designated as hedging instruments | | $ | 596,425 | | | $ | 10,630 | | | $ | 30,360 | | | $ | 15,367 | |
| | | | | | | | | | | | | | | | |
| |
| | | January 31, 2011 | |
| | | (in thousands) | |
Derivatives Designated as Hedging Instruments | | | | | | | | | | | | | | | | |
Interest rate caps | | $ | 476,100 | | | $ | 184 | | | $ | - | | | $ | - | |
Interest rate swap agreements | | | 300,000 | | | | 716 | | | | 1,285,000 | | | | 110,398 | |
TRS | | | - | | | | - | | | | 280,885 | | | | 21,938 | |
| | | | | | | | | | | | | | | | |
Total derivatives designated as hedging instruments | | $ | 776,100 | | | $ | 900 | | | $ | 1,565,885 | | | $ | 132,336 | |
| | | | | | | | | | | | | | | | |
| | | | |
Derivatives Not Designated as Hedging Instruments | | | | | | | | | | | | | | | | |
Interest rate caps | | $ | 1,943,202 | | | $ | 11 | | | $ | - | | | $ | - | |
Interest rate swap agreements | | | 20,117 | | | | 1,801 | | | | 60,900 | | | | 14,011 | |
TRS | | | 140,800 | | | | 2,144 | | | | 30,600 | | | | 10,240 | |
| | | | | | | | | | | | | | | | |
Total derivatives not designated as hedging instruments | | $ | 2,104,119 | | | $ | 3,956 | | | $ | 91,500 | | | $ | 24,251 | |
| | | | | | | | | | | | | | | | |
111
Forest City Enterprises, Inc. and Subsidiaries
Notes to Consolidated Financial Statements
I.Derivative Instruments and Hedging Activities (continued)
The following tables present the impact of gains and losses related to derivative instruments designated as cash flow hedges included in the accumulated OCI section of the Consolidated Balance Sheets and in equity in loss of unconsolidated entities and interest expense in the Consolidated Statements of Operations:
| | | | | | | | | | | | | | |
| | | | | | Gain (Loss) Reclassified from Accumulated OCI | |
Derivatives Designated as Cash Flow Hedging Instruments | | Gain (Loss)
Recognized in OCI
(Effective Portion) | | | Location on
Consolidated
Statements of
Operations | | Effective Amount | | | Ineffective
Amount | |
Year Ended January 31, 2012 | | | (in thousands) | |
Interest rate caps, interest rate swaps
and Treasury options | | $ | (48,087 | ) | | Interest expense | | $ | (3,514 | ) | | $ | 1 | |
Interest rate caps, interest rate swaps and Treasury options | | | - | | | Equity in loss of
unconsolidated
entities | | | (372 | ) | | | (565 | ) |
| | | | | | | | | | | | | | |
Total | | $ | (48,087 | ) | | | | $ | (3,886 | ) | | $ | (564 | ) |
| | | | | | | | | | | | | | |
| | | | |
Year Ended January 31, 2011 | | | | | | | | | | | | | | |
Interest rate caps, interest rate swaps
and Treasury options | | $ | (14,854 | ) | | Interest expense | | $ | (2,841 | ) | | $ | 1 | |
Treasury options | | | - | | | Equity in loss of
unconsolidated
entities | | | (80 | ) | | | (5 | ) |
| | | | | | | | | | | | | | |
Total | | $ | (14,854 | ) | | | | $ | (2,921 | ) | | $ | (4 | ) |
| | | | | | | | | | | | | | |
| | | | |
Year Ended January 31, 2010 | | | | | | | | | | | | | | |
Interest rate caps, interest rate swaps
and Treasury options | | $ | 27,386 | | | Interest expense | | $ | (3,266 | ) | | $ | (1,012 | ) |
Treasury options | | | - | | | Equity in loss of
unconsolidated
entities | | | (178 | ) | | | (1,099 | ) |
| | | | | | | | | | | | | | |
Total | | $ | 27,386 | | | | | $ | (3,444 | ) | | $ | (2,111 | ) |
| | | | | | | | | | | | | | |
112
Forest City Enterprises, Inc. and Subsidiaries
Notes to Consolidated Financial Statements
I.Derivative Instruments and Hedging Activities (continued)
The following table presents the impact of gains and losses in the Consolidated Statements of Operations related to derivative instruments:
| | | $,000000 | | | | $,000000 | | | | $,000000 | |
| | | Net Gain (Loss) Recognized | |
| | | Years Ended January 31, | |
| | | 2012 | | | 2011 | | | 2010 | |
Derivatives Designated as Fair Value Hedging Instruments | | (in thousands) | |
| | | |
TRS(1) | | $ | 11,855 | | | $ | 1,924 | | | $ | 16,351 | |
| |
Derivatives Not Designated as Hedging Instruments | | | |
| | | |
Interest rate caps, interest rate swaps and floors | | $ | (1,037 | ) | | $ | (2,158 | ) | | $ | 1,388 | |
TRS | | | 2,264 | | | | 1,341 | | | | (2,873 | ) |
Total | | $ | 1,227 | | | $ | (817 | ) | | $ | (1,485 | ) |
| | (1) | The net loss recognized in interest expense from the change in fair value of the underlying TRS borrowings was $11,855, $1,924 and $16,351 for the years ended January 31, 2012, 2011 and 2010, respectively, offsetting the gain recognized on the TRS (see Note J – Fair Value Measurements). |
Credit-risk-related Contingent Features
The principal credit risk to the Company through its interest rate risk management strategy is the potential inability of the financial institution from which the derivative financial instruments were purchased to cover its obligations. If a counterparty fails to fulfill its performance obligations under a derivative contract, the Company’s risk of loss approximates the fair value of the derivative. To mitigate this exposure, the Company generally purchases its derivative financial instruments from the financial institution that issues the related debt, from financial institutions with which the Company has other lending relationships, or from financial institutions with a minimum credit rating of AA at the time the Company enters into the transaction.
The Company has agreements with its derivative counterparties that contain a provision under which the derivative counterparty could terminate the derivative obligations if the Company defaults on its obligations under the Credit Facility and designated conditions are fulfilled. In instances where subsidiaries of the Company have derivative obligations that are secured by a mortgage, the derivative obligations could be terminated if the indebtedness between the two parties is terminated, either by loan payoff or default of the indebtedness. In addition, the Company has certain derivative contracts which provide that if the Company’s credit rating were to fall below certain levels, it may trigger additional collateral to be posted with the counterparty up to the full amount of the liability position of the derivative contracts. Also, certain subsidiaries of the Company have agreements with certain of its derivative counterparties that contain provisions whereby the subsidiaries of the Company must maintain certain minimum financial ratios.
As of January 31, 2012, the aggregate fair value of all derivative instruments in a liability position, prior to the adjustment for nonperformance risk of $16,127,000, is $190,147,000. The Company had posted collateral consisting primarily of cash and notes receivable of $82,180,000 related to all derivative instruments. If all credit risk contingent features underlying these agreements had been triggered on January 31, 2012, the Company would have been required to post collateral of the full amount of the liability position.
113
Forest City Enterprises, Inc. and Subsidiaries
Notes to Consolidated Financial Statements
J.Fair Value Measurements
The Company’s financial assets and liabilities subject to fair value measurements are interest rate caps, interest rate swap agreements, TRS and borrowings subject to TRS (see Note I - Derivative Instruments and Hedging Activities). The Company’s impairment of real estate and unconsolidated entities are also subject to fair value measurements (see Note S – Impairment of Real Estate, Impairment of Unconsolidated Entities, Write-off of Abandoned Development Projects and Gain (Loss) on Extinguishment of Debt and see Note T - Discontinued Operations and Gain on Disposition of Rental Properties).
Fair Value Hierarchy
The accounting guidance related to estimating fair value specifies a hierarchy of valuation techniques based upon whether the inputs to those valuation techniques reflect assumptions other market participants would use based upon market data obtained from independent sources (also referred to as observable inputs). The following summarizes the fair value hierarchy:
| | • | | Level 1 – Quoted prices in active markets that are unadjusted and accessible at the measurement date for identical, unrestricted assets or liabilities; |
| | • | | Level 2 – Quoted prices for identical assets and liabilities in markets that are not active, quoted prices for similar assets and liabilities in active markets or financial instruments for which significant observable inputs are available, either directly or indirectly such as interest rates and yield curves that are observable at commonly quoted intervals; and |
| | • | | Level 3 – Prices or valuations that require inputs that are unobservable. |
In certain cases, the inputs used to measure fair value may fall into different levels of the fair value hierarchy. In such cases, the level in the fair value hierarchy within which the fair value measurement in its entirety falls has been determined based on the lowest level input that is significant to the fair value measurement in its entirety. The Company’s assessment of the significance of a particular input to the fair value measurement in its entirety requires judgment and considers factors specific to the asset or liability.
Measurement of Fair Value
The Company estimates the fair value of its hedging instruments based on interest rate market and bond pricing models. Although the Company has determined that the significant inputs used to value its hedging instruments fall within Level 2 of the fair value hierarchy, the credit valuation adjustments associated with the Company’s counterparties and its own credit risk utilize Level 3 inputs, such as estimates of current credit spreads to evaluate the likelihood of default by itself and its counterparties. As of January 31, 2012, the Company has assessed the significance of the impact of the credit valuation adjustments on the overall valuation of its hedging instruments’ positions and has determined that the credit valuation adjustments are significant to the overall valuation of one interest rate swap and are not significant to the overall valuation of all of its other hedging instruments. As a result, the Company has determined that one interest rate swap is classified in Level 3 of the fair value hierarchy and all of its other hedging instruments valuations are classified in Level 2 of the fair value hierarchy.
The Company’s TRS have termination values equal to the difference between the fair value of the underlying bonds and the bonds base (acquired) price times the stated par amount of the bonds. Upon termination of the contract with the counterparty, the Company is entitled to receive the termination value if the underlying fair value of the bonds is greater than the base price and is obligated to pay the termination value if the underlying fair value of the bonds is less than the base price. The underlying borrowings generally have call features at par and without prepayment penalties. The call features of the underlying borrowings would result in a significant discount factor to any value attributed to the exchange of cash flows in these contracts by another market participant willing to purchase the Company’s positions. Therefore, the Company believes the termination value of the TRS approximates the fair value another market participant would assign to these contracts. The Company compares estimates of fair value to those provided by the respective counterparties on a quarterly basis. The Company has determined its fair value estimate of TRS is classified in Level 3 of the fair value hierarchy.
To determine the fair value of the underlying borrowings subject to TRS, the base price is initially used as the estimate of fair value. The Company adjusts the fair value based upon observable and unobservable measures such as the financial performance of the underlying collateral, interest rate risk spreads for similar transactions and loan to value ratios. In the absence of such evidence, management’s best estimate is used. At January 31, 2012, the notional amount of TRS borrowings subject to fair value adjustments is approximately $270,757,000.
114
Forest City Enterprises, Inc. and Subsidiaries
Notes to Consolidated Financial Statements
J.Fair Value Measurements (continued)
Items Measured at Fair Value on a Recurring Basis
The Company’s financial assets consist of interest rate caps, interest rate swap agreements and TRS with positive fair values that are included in other assets. The Company’s financial liabilities consist of interest rate swap agreements and TRS with negative fair values that are included in accounts payable, accrued expenses and other liabilities and borrowings subject to TRS included in mortgage debt and notes payable, nonrecourse. The Company records the redeemable noncontrolling interest related to Brooklyn Arena, LLC (“Arena”) at redemption value, which approximates fair value. The following table presents information about the Company’s financial assets and liabilities and redeemable noncontrolling interest that were measured at fair value on a recurring basis, and indicates the fair value hierarchy of the valuation techniques utilized to determine such fair value.
| | | $,0000000 | | | | $,0000000 | | | | $,0000000 | | | | $,0000000 | |
| | | Fair Value Measurements at January 31, 2012 | |
| | | | |
| | | Level 1 | | | Level 2 | | | Level 3 | | | Total | |
| | | | |
| | | (in thousands) | |
| | | | |
Interest rate caps | | $ | - | | | $ | 13 | | | $ | - | | | $ | 13 | |
Interest rate swap agreements (positive fair value) | | | - | | | | 1,083 | | | | - | | | | 1,083 | |
Interest rate swap agreements (negative fair value) | | | - | | | | (5,396 | ) | | | (143,303 | ) | | | (148,699 | ) |
TRS (positive fair value) | | | - | | | | - | | | | 10,308 | | | | 10,308 | |
TRS (negative fair value) | | | - | | | | - | | | | (25,321 | ) | | | (25,321 | ) |
Fair value adjustment to the borrowings subject to TRS | | | - | | | | - | | | | 9,180 | | | | 9,180 | |
Redeemable noncontrolling interest | | | - | | | | - | | | | (229,149 | ) | | | (229,149 | ) |
| | | | |
Total | | $ | - | | | $ | (4,300 | ) | | $ | (378,285 | ) | | $ | (382,585 | ) |
| | | | |
The table below presents a reconciliation of all financial assets and liabilities and redeemable noncontrolling interest measured at fair value on a recurring basis using significant unobservable inputs (Level 3).
| | | $,0000000 | | | | $,0000000 | | | | $,0000000 | | | | $,0000000 | | | | $,0000000 | | | | $,0000000 | |
| | | Fair Value Measurements Year Ended January 31, 2012 | |
| | | | |
| | | Redeemable Noncontrolling Interest | | | Interest Rate Swaps | | | Net TRS | | | Fair value adjustment to the borrowings subject to TRS | | | Total
TRS Related | | | Total | |
| | | | | | | | | | | | | | | | |
| | | (in thousands) | |
| | | | | | |
Balance, February 1, 2011 | | $ | (226,829 | ) | | $ | (102,387 | ) | | $ | (30,034 | ) | | $ | 21,938 | | | $ | (8,096 | ) | | $ | (337,312 | ) |
Loss attributable to redeemable noncontrolling interest | | | 4,567 | | | | - | | | | - | | | | - | | | | - | | | | 4,567 | |
Total realized and unrealized gains (losses): | | | | | | | | | | | | | | | | | | | | | | | | |
Included in earnings | | | - | | | | - | | | | 14,118 | | | | (11,855 | ) | | | 2,263 | | | | 2,263 | |
Included in other comprehensive income | | | - | | | | (40,916 | ) | | | - | | | | - | | | | - | | | | (40,916 | ) |
Included in additional paid-in capital | | | (6,887 | ) | | | - | | | | - | | | | - | | | | - | | | | (6,887 | ) |
Settlement | | | - | | | | - | | | | 903 | | | | (903 | ) | | | - | | | | - | |
| | | | | | | | | | | | | | | | |
| | | | | | |
Balance, January 31, 2012 | | $ | (229,149 | ) | | $ | (143,303 | ) | | $ | (15,013 | ) | | $ | 9,180 | | | $ | (5,833 | ) | | $ | (378,285 | ) |
| | | | | | | | | | | | | | | | |
K.Commercial Group Land Sales
On January 31, 2011, the Company closed on the sale of two parcels of land, with air rights, to Rock Ohio Caesars Cleveland, LLC for development of a casino in downtown Cleveland. The land is adjacent to the Company’sTower City Centermixed-use complex. The sales price for one parcel, an approximate 6 acre land parcel and air rights (“Parcel #1”), was $45,000,000. The sales price for the second parcel, an approximate 10 acre land parcel and air rights (“Parcel #2”), was $40,000,000.
115
Forest City Enterprises, Inc. and Subsidiaries
Notes to Consolidated Financial Statements
K.Commercial Group Land Sales (continued)
At January 31, 2011, the Company received cash deposits of $8,550,000 and $2,500,000 on Parcel #1 and Parcel #2, respectively. During the three months ended April 30, 2011, the Company received $33,950,000 of the purchase price of Parcel #1. With the receipt of this payment the buyer’s initial and continuing investment on the sale of Parcel #1 was adequate for gain recognition under the full accrual method in accordance with accounting guidance for sales of real estate. As such, the entire sales price is included in revenues from real estate operations and the related cost of land is included in operating expenses, resulting in a gain on sale of approximately $42,622,000 for the year ended January 31, 2012. The final $2,500,000 of the purchase price of Parcel #1 was received during the three months ended October 31, 2011.
During the year ended January 31, 2012, the Company received an additional installment of $4,500,000 of the purchase price of Parcel #2. The minimum initial investment related to Parcel #2 still has not been met at January 31, 2012 and accordingly, the deposits received are recorded as a deposit liability under the deposit method in accordance with accounting guidance for sales of real estate and included in accounts payable, accrued expenses and other liabilities at January 31, 2012. During February 2012, the Company received the final installment of the purchase price of Parcel #2. The Company expects to recognize a gain on sale of approximately $36,400,000 during the first quarter of 2012.
L.Net Gain (Loss) on Disposition of Partial Interests in Rental Properties and Other Investment
The net gain (loss) on disposition of partial interests in rental properties and other investment is comprised of the following:
| | | $,0000000 | | | | $,0000000 | | | | $,0000000 | |
| | | Years Ended January 31, | |
| | | 2012 | | | 2011 | | | 2010 | |
| | | (in thousands) | |
| | | |
New York Retail Joint Venture | | $ | 9,561 | | | $ | - | | | $ | - | |
Stonecrest Mall Joint Venture | | | 5,849 | | | | - | | | | - | |
Annex building adjacent to the Dallas Wilson Building | | | 2,255 | | | | - | | | | - | |
University Park Joint Venture | | | - | | | | 176,192 | | | | - | |
The Nets | | | - | | | | 55,112 | | | | - | |
Bernstein Joint Venture | | | - | | | | 29,342 | | | | - | |
Other transaction costs | | | - | | | | (2,656 | ) | | | - | |
| | $ | 17,665 | | | $ | 257,990 | | | $ | - | |
New York Retail Joint Venture
On March 29, 2011, the Company entered into joint venture agreements with an outside partner, an affiliated entity of Madison International Realty LLC. The outside partner invested in a total of 15 retail properties located in the New York City metropolitan area. The outside partner received a 49% equity interest in 15 mature retail properties, 14 of which were formerly wholly-owned by the Company and one retail property that was owned 75% by the Company.
For its 49% equity interests, the outside partner invested cash and assumed debt of $244,952,000, representing 49% of the nonrecourse mortgage debt on the 15 properties. As of January 31, 2012, the Company received proceeds of $178,286,000, primarily in the form of a loan. Based on the net amount of cash received, the outside partner’s minimum initial investment requirement of 20% was not met. As such, the transaction did not qualify for full gain recognition under accounting guidance related to real estate sales. Therefore, the installment method of gain recognition was applied, resulting in a net gain on disposition of partial interest in rental properties of $9,561,000 during the year ended January 31, 2012 with the remaining gain of $114,465,000 deferred and included in accounts payable, accrued expenses and other liabilities at January 31, 2012. Transaction costs totaling $11,776,000, of which, $5,779,000 relating to participation payments made to the ground lessors of two of the properties in accordance with the respective ground lease agreements, did not qualify for deferral and were included in the calculation of the net gain on disposition of partial interests in rental properties of $9,561,000 for the year ended January 31, 2012. The 15 properties are adequately capitalized and do not contain the characteristics of a VIE. Based on this and the substantive participating rights held by the outside partner with regards to the properties, the Company concluded it appropriate to deconsolidate the entity and account for it under the equity method of accounting.
Stonecrest Mall Joint Venture
On October 19, 2011, the Company entered into a joint venture agreement with an outside partner whereby the outside partner invested in theMall at Stonecrest, a regional mall located in Atlanta, Georgia (“Stonecrest”). The outside partner received a 49% equity interest in Stonecrest.
116
Forest City Enterprises, Inc. and Subsidiaries
Notes to Consolidated Financial Statements
L.Net Gain (Loss) on Disposition of Partial Interests in Rental Properties and Other Investment (continued)
For its 49% equity interest, the outside partner assumed debt of $49,464,000, representing 49% of the nonrecourse mortgage debt on the property. In addition, the Company is entitled to receive up to $3,750,000 of contingent consideration, based on Stonecrest’s financial results as defined in the partnership agreement, none of which has been recognized during the year ended January 31, 2012, The transaction resulted in a gain on disposition of partial interests in rental property of $5,849,000 during the year ended January 31, 2012. The property is adequately capitalized and does not contain the characteristics of a VIE. Based on this and the substantive participating rights held by the outside partner with regards to the property, the Company concluded it appropriate to deconsolidate the entity and account for it under the equity method of accounting.
Annex building adjacent to the Dallas Wilson Building
On December 15, 2011, the Company sold an annex building containing 8 units adjacent to theDallas Wilson Building,an apartment building located in Dallas, Texas, for $2,800,000. The transaction resulted in a gain of $2,255,000 during the year ended January 31, 2012. The remaining 135 units of theDallas Wilson Building are wholly-owned by the Company and will continue to be fully consolidated.
University Park Joint Venture
On February 22, 2010, the Company formed a joint venture and admitted HCN FCE Life Sciences, LLC (“HCN”) as a 49% partner to the joint venture to acquire seven life science office buildings in the Company’s mixed-use University Park project in Cambridge, Massachusetts, formerly wholly-owned by the Company. The Company, through a wholly-owned subsidiary, owns the remaining 51%.
The Company contributed the seven real estate assets, which were encumbered by approximately $320,000,000 of nonrecourse mortgage debt to the joint venture for its 51% ownership interests. HCN contributed $170,444,000 of cash to the joint venture and assumed a 49% share of the nonrecourse mortgage debt assumed by the joint venture for its 49% ownership interests. In exchange for its contributed real estate assets, the Company received cash proceeds of $170,444,000 of which $135,117,000 was in the form of a loan from the joint venture and the remaining $35,327,000 was an unrestricted cash distribution from the joint venture. Based on the amount of cash received, the Company recognized the full gain of $176,192,000, net of transaction costs of $31,268,000, during the year ended January 31, 2011.
Included in these transaction costs were $23,251,000 of participation payments made to the ground lessor of the seven properties in accordance with the respective ground lease agreements. As a result of this transaction, the Company is accounting for the joint venture and the seven properties as equity method investments since both partners have joint control of the new venture and the properties.
The Nets
On May 12, 2010, entities controlled by Mikhail Prokhorov (“MP Entities”) invested $223,000,000 and made certain funding commitments to acquire 80% of The Nets, 45% of Arena, the entity that through its subsidiaries is overseeing the construction of and has a long-term lease in theBarclays Centerarena, and the right to purchase up to 20% of Atlantic Yards Development Company, LLC, which will develop non-arena real estate.
The transaction resulted in a change of controlling ownership interest in The Nets and a pre-tax net gain recognized by the Company of $55,112,000 ($31,437,000 after noncontrolling interest). This net gain is comprised of the gain on the transfer of ownership interest combined with the adjustment to fair value of the 20% retained noncontrolling interest.
In accordance with accounting guidance on real estate sales, the sale of 45% interest in Arena was not deemed a culmination of the earning process since no cash was withdrawn; therefore the transaction does not have an earnings impact.
The MP Entities have the right to put their Arena ownership interests to the Company during a four-month period following the ten-year anniversary of the completion of theBarclays Centerarena for fair market value, as defined in the agreement. Due to the put option, the noncontrolling interest is redeemable and does not qualify as permanent equity. As a result, this amount is recorded as redeemable noncontrolling interest in the mezzanine section of the Company’s consolidated balance sheet and is reported at redemption value, which represents fair market value, on a recurring basis.
Net Sports and Entertainment, LLC (“NS&E”) has a similar right to put its noncontrolling interest in The Nets to the MP Entities at fair market value during the same time period as the MP Entities have their put right on Arena.
117
Forest City Enterprises, Inc. and Subsidiaries
Notes to Consolidated Financial Statements
L.Net Gain (Loss) on Disposition of Partial Interests in Rental Properties and Other Investment (continued)
Bernstein Joint Venture
On February 19, 2010 the Company formed a joint venture with the Bernstein Development Corporation to hold the Company’s previously held investment interests in three residential properties totaling 1,340 rental units located within the Washington, D.C. metropolitan area. Both partners in the new joint venture have a 50% interest and joint control over the properties.
The Company received $28,922,000 in cash proceeds and the joint venture assumed $163,000,000 of the nonrecourse mortgage debt on the properties resulting in gains on disposition of partial interests in rental properties and other investment of $29,342,000 for the year ended January 31, 2011. As a result of this transaction, the Company is accounting for the joint venture and the three properties as equity method investments since both partners have joint control of the new venture and the properties.
Other Transaction Costs
Other transaction costs of $2,656,000 represent costs incurred in connection with a potential partial disposition in certain rental properties. During the year ended January 31, 2011, the Company abandoned the proposed transaction and all related transaction costs were expensed.
M.Income Taxes
The income tax expense (benefit) related to continuing operations consists of the following:
| | | $000.00.00 | | | | $000.00.00 | | | | $000.00.00 | |
| | | Years Ended January 31, | |
| | | | |
| | | 2012 | | | 2011 | | | 2010 | |
| | | | |
| | | (in thousands) | |
| | | |
Current | | | | | | | | | | | | |
Federal | | $ | (9,252 | ) | | $ | (3,780 | ) | | $ | 2,327 | |
State | | | (48 | ) | | | 4,382 | | | | 5,320 | |
| | | | |
| | | (9,300 | ) | | | 602 | | | | 7,647 | |
| | | | |
| | | |
Deferred | | | | | | | | | | | | |
Federal | | $ | (42,342 | ) | | $ | 63,664 | | | $ | (16,554 | ) |
State | | | (12,702 | ) | | | 5,860 | | | | (1,233 | ) |
| | | | |
| | | (55,044 | ) | | | 69,524 | | | | (17,787 | ) |
| | | | |
Total income tax expense (benefit) | | $ | (64,344 | ) | | $ | 70,126 | | | $ | (10,140 | ) |
| | | | |
118
Forest City Enterprises, Inc. and Subsidiaries
Notes to Consolidated Financial Statements
M. Income Taxes (continued)
The effective tax rate for income taxes from continuing operations varies from the federal statutory rate of 35% due to the following items:
| | | | | | | | | | | | |
| | | Years Ended January 31, | |
| | | 2012 | | | 2011 | | | 2010 | |
| | | (dollars in thousands) | |
| | | |
Earnings (loss) before income taxes | | $ | (110,387 | ) | | $ | 199,482 | | | $ | (2,529 | ) |
Equity in loss of unconsolidated entities, net of impairment | | | (61,039 | ) | | | (30,194 | ) | | | (15,053 | ) |
Less: Noncontrolling interests | | | (2,736 | ) | | | (19,222 | ) | | | (6,766 | ) |
Earnings (loss) from continuing operations, including noncontrolling interest, before income taxes | | $ | (174,162 | ) | | $ | 150,066 | | | $ | (24,348 | ) |
| | | |
Income taxes computed at the statutory rate | | $ | (60,957 | ) | | $ | 52,523 | | | $ | (8,522 | ) |
Increase (decrease) in tax resulting from: | | | | | | | | | | | | |
State taxes, net of federal benefit | | | (6,580 | ) | | | 5,120 | | | | 5,132 | |
Cumulative effect of change in state tax rate, net of federal benefit | | | – | | | | – | | | | (6,082 | ) |
State net operating loss, net of federal benefit | | | 2,474 | | | | 466 | | | | (8,849 | ) |
General Business Credits | | | 446 | | | | (1,556 | ) | | | (2,415 | ) |
Valuation allowance | | | (6,414 | ) | | | (86 | ) | | | 10,597 | |
Charitable contributions | | | 2,204 | | | | 4,040 | | | | 2,195 | |
Permanent adjustments | | | 38 | | | | 390 | | | | 229 | |
Conversion/Exchange of senior debt | | | 3,780 | | | | 10,274 | | | | (5,588 | ) |
Other items | | | 665 | | | | (1,045 | ) | | | 3,163 | |
Total income tax expense (benefit) | | $ | (64,344 | ) | | $ | 70,126 | | | $ | (10,140 | ) |
Effective tax rate | | | 36.94 | % | | | 46.73 | % | | | 41.65 | % |
| | | |
The components of the deferred income tax expense (benefit) for continuing operations are as follows: | | | | | | | | | | | | |
Excess of tax over financial statement depreciation and amortization | | $ | 17,165 | | | $ | 7,946 | | | $ | (1,098 | ) |
Costs on land and rental properties under development expensed for tax purposes | | | 34,333 | | | | 29,629 | | | | 12,520 | |
Revenues and expenses recognized in different periods for tax and financial statement purposes | | | (50,898 | ) | | | 32,131 | | | | 17,772 | |
Difference between tax and financial statements related to unconsolidated entities | | | (18,674 | ) | | | (13,339 | ) | | | 1,901 | |
Impairment of real estate | | | (41,678 | ) | | | (1,133 | ) | | | (3,117 | ) |
Deferred state taxes, net of federal benefit | | | (3,698 | ) | | | 1,689 | | | | (5,870 | ) |
Utilization of (addition to) tax loss carryforward excluding effect of stock options | | | 10,974 | | | | 13,066 | | | | (41,019 | ) |
Cumulative effect of change in state tax rate, net of federal benefit | | | – | | | | – | | | | (6,082 | ) |
Valuation allowance | | | (6,414 | ) | | | (86 | ) | | | 10,597 | |
General Business Credits | | | 446 | | | | (1,556 | ) | | | (2,415 | ) |
Alternative Minimum Tax credits | | | 3,400 | | | | 1,177 | | | | (976 | ) |
Deferred income tax expense (benefit) | | $ | (55,044 | ) | | $ | 69,524 | | | $ | (17,787 | ) |
See Note T for disclosure of income taxes for discontinued operations.
119
Forest City Enterprises, Inc. and Subsidiaries
Notes to Consolidated Financial Statements
M. Income Taxes (continued)
The components of the deferred income tax liability are as follows.
| | | | | | | | | | | | | | | | |
| | | At January 31, | |
| | | Temporary Differences | | | Deferred Tax | |
| | | 2012 | | | 2011 | | | 2012 | | | 2011 | |
| | | (in thousands) | |
| | | | |
Depreciation | | $ | 430,713 | | | $ | 459,207 | | | $ | 167,043 | | | $ | 178,094 | |
Capitalized costs | | | 1,043,938 | | | | 1,162,185 | | | | 404,871 | | | | 450,730 | |
Tax loss carryforward | | | (115,385 | ) | | | (150,821 | ) | | | (40,385 | ) | | | (52,787 | ) |
State loss carryforward, net of federal benefit | | | – | | | | – | | | | (25,473 | ) | | | (27,934 | ) |
Valuation allowance | | | – | | | | – | | | | 55,330 | | | | 61,744 | |
Federal tax credits and other carryforwards | | | – | | | | – | | | | (57,503 | ) | | | (63,860 | ) |
Other comprehensive income (loss) | | | (196,775 | ) | | | (154,226 | ) | | | (76,315 | ) | | | (59,796 | ) |
Basis in unconsolidated entities | | | 156,445 | | | | 128,703 | | | | 60,674 | | | | 49,488 | |
Other | | | (130,378 | ) | | | (91,889 | ) | | | (55,202 | ) | | | (36,868 | ) |
| | | | |
Total | | $ | 1,188,558 | | | $ | 1,353,159 | | | $ | 433,040 | | | $ | 498,811 | |
Income taxes paid (refunded) were $3,743,000, $9,026,000 and $(709,000) for the years ended January 31, 2012, 2011 and 2010, respectively. At January 31, 2012, the Company had a federal net operating loss carryforward for tax purposes of $170,233,000 (generated primarily from the impact on its net earnings of tax depreciation expense from real estate properties and excess deductions from stock-based compensation) that will expire in the years ending January 31, 2026 through January 31, 2032, a charitable contribution deduction carryforward of $30,401,000 that will expire in the years ending January 31, 2013 through January 31, 2017, General Business Credit carryovers of $20,212,000 that will expire in the years ending January 31, 2013 through January 31, 2032, and an alternative minimum tax (“AMT”) credit carryforward of $27,452,000 that is available until used to reduce federal tax to the AMT amount.
The Company’s policy is to consider a variety of tax-deferral strategies, including tax deferred exchanges, when evaluating its future tax position. The Company has a full valuation allowance against the deferred tax asset associated with its charitable contributions. The Company has a valuation allowance against its general business credits, other than those general business credits which are eligible to be utilized to reduce future AMT liabilities. The Company has a valuation allowance against certain of its state net operating losses and state bonus depreciation deferred assets. These valuation allowances exist because management believes it is more likely than not that the Company will not realize these benefits.
The Company applies the “with-and-without” methodology for recognizing excess tax benefits from the deduction of stock-based compensation. The net operating loss available for the tax return, as is noted in the paragraph above, is greater than the net operating loss available for the tax provision due to excess deductions from stock-based compensation reported on the return, as well as the impact of adjustments to the net operating loss under accounting guidance on accounting for uncertainty in income taxes. As of January 31, 2012, the Company has not recorded a net deferred tax asset of approximately $17,265,000 from excess stock-based compensation deductions taken on the tax return for which a benefit has not yet been recognized in the Company’s tax provision.
| | | | | | | | |
| | | At January 31, | |
| | | 2012 | | | 2011 | |
| | | (in thousands) | |
| | |
Deferred tax liabilities | | $ | 1,802,841 | | | $ | 1,588,086 | |
| | |
Deferred tax assets | | | 1,425,131 | | | | 1,151,019 | |
| | |
Less: valuation allowance (1) | | | (55,330 | ) | | | (61,744 | ) |
| | |
| | | 1,369,801 | | | | 1,089,275 | |
| | |
Net deferred tax liability | | $ | 433,040 | | | $ | 498,811 | |
| (1) | The valuation allowance is related to state net operating losses and bonus depreciation, general business credits and charitable contributions. |
120
Forest City Enterprises, Inc. and Subsidiaries
Notes to Consolidated Financial Statements
M. Income Taxes (continued)
Accounting for Uncertainty in Income Taxes
Unrecognized tax benefits represent those tax benefits related to tax positions that have been taken or are expected to be taken in tax returns that are not recognized in the financial statements because management has either concluded that it is not more likely than not that the tax position will be sustained if audited by the appropriate taxing authority or the amount of the benefit will be less than the amount taken or expected to be taken in its income tax returns.
As of January 31, 2012 and 2011, the Company had unrecognized tax benefits of $788,000 and $408,000, respectively. The Company recognizes estimated interest payable on underpayments of income taxes and estimated penalties as components of income tax expense. As of January 31, 2012 and 2011, the Company had approximately $154,000 and $100,000, respectively, of accrued interest and penalties related to uncertain income tax positions. The Company recorded income tax expense (benefit) relating to interest and penalties on uncertain tax positions of $54,000, $(424,000) and $61,000 for the years ended January 31, 2012, 2011 and 2010, respectively.
The Company files a consolidated United States federal income tax return. Where applicable, the Company files combined income tax returns in various states and it files individual separate income tax returns in other states. The Company’s federal consolidated income tax returns for the year ended January 31, 2009 and subsequent years are subject to examination by the Internal Revenue Service. Certain of the Company’s state returns for the years ended January 31, 2003 through January 31, 2008 and all state returns for the year ended January 31, 2009 and subsequent years are subject to examination by various taxing authorities.
A reconciliation of the total amounts of the Company’s unrecognized tax benefits, exclusive of interest and penalties, is depicted in the following table:
| | | | | | | | |
| | | Unrecognized Tax Benefit
January 31, | |
| | | | |
| | | 2012 | | | 2011 | |
| | | | |
| | | (in thousands) | |
| | |
Beginning balance, February 1, 2011 and 2010 | | $ | 408 | | | $ | 1,611 | |
| | |
Gross increases for tax positions of prior years | | | 458 | | | | - | |
Gross decreases for tax positions of prior years | | | - | | | | (45) | |
Gross increases for tax positions of current year | | | - | | | | - | |
Settlements | | | - | | | | (7) | |
Lapse of statutes of limitation | | | (78) | | | | (1,151) | |
| | | | |
| | |
Unrecognized tax benefits balance at January 31, 2012 and 2011 | | $ | 788 | | | $ | 408 | |
| | | | |
The total amount of unrecognized tax benefits that would affect the Company’s effective tax rate, if recognized as of January 31, 2012 and 2011, is $357,000 and $121,000, respectively. Based upon the Company’s assessment of the outcome of examinations that are in progress, the settlement of liabilities, or as a result of the expiration of the statutes of limitation for certain jurisdictions, it is reasonably possible that the related unrecognized tax benefits for tax positions taken regarding previously filed tax returns will change from those recorded at January 31, 2012. Included in the $788,000 of unrecognized benefits noted above is $786,000 which, due to the reasons above, could decrease during the next twelve months.
121
Forest City Enterprises, Inc. and Subsidiaries
Notes to Consolidated Financial Statements
N. Segment Information
The following tables summarize financial data for the Company’s five reportable segments. All amounts are presented in thousands.
| | | | | | | | |
| | | January 31, | |
| | | 2012 | | | 2011 | |
| | | | |
| | | Identifiable Assets | |
| | | | |
Commercial Group | | $ | 7,970,069 | | | $ | 8,617,287 | |
Residential Group | | | 2,022,135 | | | | 2,825,527 | |
Land Development Group | | | 352,248 | | | | 498,190 | |
The Nets (1) | | | (3,836) | | | | - | |
Corporate Activities | | | 163,667 | | | | 118,697 | |
| | | | |
| | $ | 10,504,283 | | | $ | 12,059,701 | |
| | | | |
| | | | | | | | | | | | | | | | | | | | | | | | |
| | | Years Ended January 31, | | | Years Ended January 31, | |
| | | 2012 | | | 2011 | | | 2010 | | | 2012 | | | 2011 | | | 2010 | |
| | | Revenues from Real Estate Operations | | | Operating Expenses | |
| | | | | | |
Commercial Group | | $ | 734,967 | | | $ | 849,291 | | | $ | 889,558 | | | $ | 380,460 | | | $ | 404,953 | | | $ | 413,517 | |
Commercial Group Land Sales | | | 55,463 | | | | 24,742 | | | | 27,068 | | | | 10,147 | | | | 19,970 | | | | 21,609 | |
Residential Group | | | 255,127 | | | | 211,485 | | | | 257,077 | | | | 178,224 | | | | 136,596 | | | | 156,886 | |
Land Development Group | | | 44,420 | | | | 32,131 | | | | 20,267 | | | | 47,543 | | | | 38,650 | | | | 33,119 | |
The Nets | | | - | | | | - | | | | - | | | | - | | | | - | | | | - | |
Corporate Activities | | | - | | | | - | | | | - | | | | 52,585 | | | | 47,030 | | | | 39,857 | |
| | $ | 1,089,977 | | | $ | 1,117,649 | | | $ | 1,193,970 | | | $ | 668,959 | | | $ | 647,199 | | | $ | 664,988 | |
| | | | | | | |
| | | Depreciation and Amortization Expense | | | Interest Expense | |
| | | | | | |
Commercial Group | | $ | 163,170 | | | $ | 178,719 | | | $ | 195,071 | | | $ | 168,810 | | | $ | 221,642 | | | $ | 232,344 | |
Residential Group | | | 53,677 | | | | 53,906 | | | | 57,992 | | | | 31,946 | | | | 21,233 | | | | 27,515 | |
Land Development Group | | | 240 | | | | 334 | | | | 830 | | | | 3,443 | | | | 3,007 | | | | 2,109 | |
The Nets | | | - | | | | - | | | | - | | | | - | | | | - | | | | - | |
Corporate Activities | | | 1,514 | | | | 1,769 | | | | 2,713 | | | | 56,838 | | | | 63,884 | | | | 80,891 | |
| | $ | 218,601 | | | $ | 234,728 | | | $ | 256,606 | | | $ | 261,037 | | | $ | 309,766 | | | $ | 342,859 | |
| | | | | | | |
| | | Interest and Other Income | | | Capital Expenditures | |
| | | | | | |
Commercial Group | | $ | 21,198 | | | $ | 23,384 | | | $ | 19,515 | | | $ | 604,737 | | | $ | 500,336 | | | $ | 552,241 | |
Residential Group | | | 19,816 | | | | 19,830 | | | | 23,673 | | | | 154,475 | | | | 222,712 | | | | 390,088 | |
Land Development Group | | | 10,838 | | | | 9,162 | | | | 9,508 | | | | 558 | | | | - | | | | - | |
The Nets | | | - | | | | - | | | | - | | | | - | | | | - | | | | - | |
Corporate Activities | | | 262 | | | | 442 | | | | 1,249 | | | | 611 | | | | 110 | | | | 280 | |
| | $ | 52,114 | | | $ | 52,818 | | | $ | 53,945 | | | $ | 760,381 | | | $ | 723,158 | | | $ | 942,609 | |
| (1) | The identifiable assets of $(3,836) at January 31, 2012 represent losses in excess of the Company’s investment basis in The Nets. |
122
Forest City Enterprises, Inc. and Subsidiaries
Notes to Consolidated Financial Statements
| N. | Segment Information (continued) |
The Company uses a measure defined as Earnings Before Depreciation, Amortization and Deferred Taxes (“EBDT”) to report its operating results. EBDT is a non-GAAP measure and is defined as net earnings excluding the following items at the Company’s proportional share: i) gain (loss) on disposition of rental properties, divisions and other investments (net of tax); ii) the adjustment to recognize rental revenues and rental expense using the straight-line method; iii) non-cash charges for real estate depreciation, amortization, amortization of mortgage procurement costs: iv) deferred income taxes; v) preferred payment which is classified as noncontrolling interest expense in the Company’s Consolidated Statements of Operations; vi) impairment of real estate (net of tax); vii) extraordinary items (net of tax); viii) cumulative or retrospective effect of change in accounting principle (net of tax); and ix) revisions of prior period financial statements.
The Company believes that, although its business has many facets such as development, acquisitions, disposals and property management, the core of its business is the recurring operations of its portfolio of real estate assets. The Company’s Chief Executive Officer, the chief operating decision maker, uses EBDT, as presented, to assess performance of its portfolio of real estate assets by operating segment because it provides information on the financial performance of the core real estate portfolio operations. EBDT measures the profitability of a real estate segment’s operations of collecting rent, paying operating expenses and servicing its debt. The Company’s segments adhere to the accounting policies described in Note A.
Effective during the year ended January 31, 2012, under the direction of the Company’s chief operating decision maker, EBDT provided in order to assess performance for the Real Estate Groups and The Nets was on a pre-tax basis. The Corporate Activities segment controls tax strategies and evaluates results on a consolidated basis. As a result, beginning February 1, 2011, the Company no longer allocates income tax expense (benefit) to the Real Estate Groups or The Nets. In addition, based on the consolidated evaluation of income taxes, it was determined that EBDT would exclude all deferred income taxes instead of just those attributable to the Real Estate Groups. All amounts in the following table are presented in thousands:
(continued on next page)
123
Forest City Enterprises, Inc. and Subsidiaries
Notes to Consolidated Financial Statements
| N. | Segment Information (continued) |
Reconciliation of EBDT to Net Earnings (Loss) by Segment:
| | | | | | | | | | | | | | | | | | | | | | | | |
| Year Ended January 31, 2012 | | Commercial
Group | | | Residential
Group | | | Land
Development
Group | | | The Nets | | | Corporate | | | Total | |
EBDT | | $ | 325,063 | | | $ | 100,924 | | | $ | 8,541 | | | $ | (26,814 | ) | | $ | (73,330 | ) | | $ | 334,384 | |
Depreciation and amortization – Real Estate Groups | | | (198,063 | ) | | | (80,238 | ) | | | (249 | ) | | | - | | | | - | | | | (278,550 | ) |
Amortization of mortgage procurement costs – Real Estate Groups | | | (10,519 | ) | | | (3,506 | ) | | | (289 | ) | | | - | | | | - | | | | (14,314 | ) |
Straight-line rent adjustment | | | 6,382 | | | | 255 | | | | - | | | | - | | | | - | | | | 6,637 | |
Preference payment | | | (1,732 | ) | | | - | | | | - | | | | - | | | | - | | | | (1,732 | ) |
Gain on disposition of partial interests in rental properties | | | 15,410 | | | | 2,255 | | | | - | | | | - | | | | - | | | | 17,665 | |
Gain on disposition of unconsolidated entities | | | - | | | | 12,567 | | | | - | | | | - | | | | - | | | | 12,567 | |
Impairment of real estate | | | (3,435 | ) | | | (235 | ) | | | (115,411 | ) | | | - | | | | - | | | | (119,081 | ) |
Impairment of unconsolidated real estate | | | (40,284 | ) | | | - | | | | (41,902 | ) | | | - | | | | - | | | | (82,186 | ) |
Allowance for projects under development revision (See note A) | | | 700 | | | | 300 | | | | - | | | | - | | | | - | | | | 1,000 | |
Discontinued operations: | | | | | | | | | | | | | | | | | | | | | | | | |
Depreciation and amortization – Real Estate Groups | | | (3,154 | ) | | | - | | | | - | | | | - | | | | - | | | | (3,154 | ) |
Amortization of mortgage procurement costs – Real Estate Groups | | | (356 | ) | | | - | | | | - | | | | - | | | | - | | | | (356 | ) |
Straight-line rent adjustment | | | 571 | | | | - | | | | - | | | | - | | | | - | | | | 571 | |
Gain on disposition of rental properties | | | 51,796 | | | | - | | | | - | | | | - | | | | - | | | | 51,796 | |
Impairment of real estate | | | (10,257 | ) | | | - | | | | - | | | | - | | | | - | | | | (10,257 | ) |
Income tax benefit (expense): | | | | | | | | | | | | | | | | | | | | | | | | |
Deferred income taxes | | | - | | | | - | | | | - | | | | - | | | | 48,508 | | | | 48,508 | |
Current income taxes attributable to above dispositions | | | - | | | | - | | | | - | | | | - | | | | (49,984 | ) | | | (49,984 | ) |
Net earnings (loss) attributable to Forest City Enterprises, Inc. | | $ | 132,122 | | | $ | 32,322 | | | $ | (149,310 | ) | | $ | (26,814 | ) | | $ | (74,806 | ) | | $ | (86,486 | ) |
Preferred dividends | | | - | | | | - | | | | - | | | | - | | | | (15,400 | ) | | | (15,400 | ) |
Net earnings (loss) attributable to Forest City Enterprises, Inc. common shareholders | | $ | 132,122 | | | $ | 32,322 | | | $ | (149,310 | ) | | $ | (26,814 | ) | | $ | (90,206 | ) | | $ | (101,886 | ) |
| Year Ended January 31, 2011 | | | | | | | | | | | | | | | | | | |
EBDT | | $ | 277,480 | | | $ | 106,556 | | | $ | 2,376 | | | $ | 9,651 | | | $ | (86,188 | ) | | $ | 309,875 | |
Depreciation and amortization – Real Estate Groups | | | (199,640 | ) | | | (75,606 | ) | | | (264 | ) | | | - | | | | - | | | | (275,510 | ) |
Amortization of mortgage procurement costs – Real Estate Groups | | | (10,444 | ) | | | (2,568 | ) | | | (273 | ) | | | - | | | | - | | | | (13,285 | ) |
Deferred taxes – Real Estate Groups | | | (12,600 | ) | | | (3,002 | ) | | | (591 | ) | | | - | | | | (19,095 | ) | | | (35,288 | ) |
Straight-line rent adjustment | | | 15,851 | | | | 522 | | | | (8 | ) | | | - | | | | - | | | | 16,365 | |
Preference payment | | | (2,341 | ) | | | - | | | | - | | | | - | | | | - | | | | (2,341 | ) |
Gain on disposition of partial interests in rental properties, net of tax | | | 106,943 | | | | 18,083 | | | | - | | | | - | | | | - | | | | 125,026 | |
Gain on disposition of unconsolidated entities, net of tax | | | 3,436 | | | | 10,926 | | | | - | | | | - | | | | - | | | | 14,362 | |
Impairment of real estate, net of tax | | | (964 | ) | | | - | | | | (1,016 | ) | | | - | | | | - | | | | (1,980 | ) |
Impairment of unconsolidated entities, net of tax | | | (30,115 | ) | | | - | | | | (13,817 | ) | | | - | | | | - | | | | (43,932 | ) |
Allowance for projects under development revision (See note A) | | | (700 | ) | | | (300 | ) | | | - | | | | - | | | | - | | | | (1,000 | ) |
Discontinued operations, net of tax: | | | | | | | | | | | | | | | | | | | | | | | | |
Depreciation and amortization – Real Estate Groups | | | (9,896 | ) | | | (636 | ) | | | - | | | | - | | | | - | | | | (10,532 | ) |
Amortization of mortgage procurement costs – Real Estate Groups | | | (1,043 | ) | | | (13 | ) | | | - | | | | - | | | | - | | | | (1,056 | ) |
Deferred taxes – Real Estate Groups | | | (2,069 | ) | | | (400 | ) | | | - | | | | - | | | | - | | | | (2,469 | ) |
Straight-line rent adjustment | | | 1,795 | | | | - | | | | - | | | | - | | | | - | | | | 1,795 | |
Gain on disposition of rental properties | | | 26,899 | | | | 1,099 | | | | - | | | | - | | | | - | | | | 27,998 | |
Impairment of real estate, net of tax | | | (49,980 | ) | | | - | | | | - | | | | - | | | | - | | | | (49,980 | ) |
Net earnings (loss) attributable to Forest City Enterprises, Inc. | | $ | 112,612 | | | $ | 54,661 | | | $ | (13,593 | ) | | $ | 9,651 | | | $ | (105,283 | ) | | $ | 58,048 | |
Preferred dividends | | | - | | | | - | | | | - | | | | - | | | | (11,807 | ) | | | (11,807 | ) |
Net earnings (loss) attributable to Forest City Enterprises, Inc. common shareholders | | $ | 112,612 | | | $ | 54,661 | | | $ | (13,593 | ) | | $ | 9,651 | | | $ | (117,090 | ) | | $ | 46,241 | |
| | | | | | |
| Year Ended January 31, 2010 | | | | | | | | | | | | | | | | | | |
EBDT | | $ | 286,420 | | | $ | 122,769 | | | $ | 12,828 | | | $ | (28,674 | ) | | $ | (92,237 | ) | | $ | 301,106 | |
Depreciation and amortization – Real Estate Groups | | | (201,660 | ) | | | (79,910 | ) | | | (387 | ) | | | - | | | | - | | | | (281,957 | ) |
Amortization of mortgage procurement costs – Real Estate Groups | | | (11,963 | ) | | | (2,627 | ) | | | (624 | ) | | | - | | | | - | | | | (15,214 | ) |
Deferred taxes – Real Estate Groups | | | (11,860 | ) | | | (12,010 | ) | | | (7,987 | ) | | | - | | | | 9,293 | | | | (22,564 | ) |
Straight-line rent adjustment | | | 12,287 | | | | 86 | | | | - | | | | - | | | | - | | | | 12,373 | |
Preference payment | | | (2,341 | ) | | | - | | | | - | | | | - | | | | - | | | | (2,341 | ) |
Gain on disposition of unconsolidated entities, net of tax | | | - | | | | 30,462 | | | | - | | | | - | | | | - | | | | 30,462 | |
Impairment of real estate, net of tax | | | (2,174 | ) | | | (897 | ) | | | (2,381 | ) | | | - | | | | - | | | | (5,452 | ) |
Impairment of unconsolidated entities, net of tax | | | (6,441 | ) | | | (14,877 | ) | | | (938 | ) | | | - | | | | - | | | | (22,256 | ) |
Allowance for projects under development revision (See note A) | | | 4,200 | | | | 1,800 | | | | - | | | | - | | | | - | | | | 6,000 | |
Discontinued operations, net of tax: | | | | | | | | | | | | | | | | | | | | | | | | |
Depreciation and amortization – Real Estate Groups | | | (9,038 | ) | | | (2,874 | ) | | | - | | | | - | | | | - | | | | (11,912 | ) |
Amortization of mortgage procurement costs – Real Estate Groups | | | (293 | ) | | | (76 | ) | | | - | | | | - | | | | - | | | | (369 | ) |
Deferred taxes – Real Estate Groups | | | (1,581 | ) | | | (874 | ) | | | - | | | | - | | | | - | | | | (2,455 | ) |
Straight-line rent adjustment | | | 869 | | | | - | | | | - | | | | - | | | | - | | | | 869 | |
Gain on disposition of rental properties | | | 2,784 | | | | - | | | | - | | | | - | | | | - | | | | 2,784 | |
Impairment of real estate, net of tax | | | (8,067 | ) | | | (8,703 | ) | | | - | | | | - | | | | - | | | | (16,770 | ) |
Deferred gain on disposition of Lumber Group | | | - | | | | - | | | | - | | | | - | | | | 718 | | | | 718 | |
Net earnings (loss) attributable to Forest City Enterprises, Inc. | | $ | 51,142 | | | $ | 32,269 | | | $ | 511 | | | $ | (28,674 | ) | | $ | (82,226 | ) | | $ | (26,978 | ) |
124
Forest City Enterprises, Inc. and Subsidiaries
Notes to Consolidated Financial Statements
O. Leases
The following tables include all lease obligations of the Company.
The Company as Lessor
The following table summarizes the minimum future rental income to be received on non-cancelable operating leases of commercial properties that generally extend for periods of more than one year.
| | | | |
| Years Ending January 31, | | | |
| | | (in thousands) | |
| |
2013 | | $ | 489,753 | |
2014 | | | 493,171 | |
2015 | | | 470,152 | |
2016 | | | 443,499 | |
2017 | | | 417,523 | |
Later years | | | 2,144,100 | |
| | $ | 4,458,198 | |
Most of the commercial leases include provisions for reimbursements of other charges including real estate taxes, utilities and operating costs which are included in revenues from real estate operations. The following table summarizes total reimbursements.
| | | | |
| Years Ended January 31, | | | |
| | | (in thousands) | |
| |
2012 | | $ | 162,899 | |
2011 | | $ | 205,446 | |
2010 | | $ | 193,121 | |
The Company as Lessee
The Company is a lessee under various operating leasing arrangements for real property and equipment. The most significant of these involve ground leases which expire between the years 2012 and 2100, excluding optional renewal periods. The Company is subject to participation payments under certain of its ground leases, the most significant of which are in Boston and New York City. These payments are triggered by defined events within the respective lease agreements and the timing and future amounts are not determinable by the Company.
Minimum fixed rental payments under long-term leases (over one year) in effect at January 31, 2012 are as follows.
| | | | |
| Years Ending January 31, | | | |
| | | (in thousands) | |
| |
2013 | | $ | 6,333 | |
2014 | | | 5,605 | |
2015 | | | 4,700 | |
2016 | | | 4,648 | |
2017 | | | 4,720 | |
Later years | | | 81,020 | |
| | $ | 107,026 | |
The following table summarizes rent expense.
| | | | |
| Years Ended January 31, | | | |
| | | (in thousands) | |
| |
2012 | | $ | 8,763 | |
2011 | | $ | 19,428 | |
2010 | | $ | 25,614 | |
125
Forest City Enterprises, Inc. and Subsidiaries
Notes to Consolidated Financial Statements
P. Commitments and Contingencies
The Company has various guarantees, including indirect guarantees of indebtedness of others. The Company believes the risk of payment under these guarantees, as described below, is remote and, to date, no payments have been made under these guarantees.
As of January 31, 2012, the Company has a guaranteed loan of $1,400,000 relating to the Company’s share of a bond issue made by theVillage of Woodridge, relating to a Land Development Group project in suburban Chicago, Illinois. This bond issue guarantee terminates April 30, 2015, unless the bonds are paid sooner, and is limited to $500,000 in any one year. The Company also had outstanding letters of credit of $69,389,000 as of January 31, 2012. The maximum potential amount of future payments on the guaranteed loan and letters of credit the Company could be required to make is the total amounts noted above.
The Company has entered into certain partnerships whereby the outside investment partner is allocated certain tax credits. These partnerships typically require the Company to indemnify, on an after-tax or “grossed up” basis, the investment partner against the failure to receive or the loss of allocated tax credits and tax losses. At January 31, 2012, the maximum potential payment under these tax indemnity guarantees was approximately $148,992,000. The Company believes that all necessary requirements for qualifications for such tax credits have been and will continue to be met and that the Company’s investment partners will be able to receive expense allocations associated with the properties. The Company does not expect to make any payments under these guarantees.
The Company’s mortgage loans are nonrecourse; however, in some cases, lenders carve out certain items from the nonrecourse provisions. These carve-out items enable the lenders to seek recourse if the Company or the joint venture engages in certain acts as defined in the respective agreements such as commit fraud, intentionally misapply funds, or intentionally misrepresent facts. The Company has also provided certain environmental guarantees. Under these environmental remediation guarantees, the Company must remediate any hazardous materials brought onto the property in violation of environmental laws. The maximum potential amount of future payments the Company could be required to make on the environmental guarantees is limited to the actual losses suffered or actual remediation costs incurred. A portion of these carve-outs and guarantees have been made on behalf of joint ventures and the Company believes any liability would not exceed its partners’ share of the outstanding principal balance of the loans in which these carve-outs and environmental guarantees have been made. At January 31, 2012, the outstanding balance of the partners’ share of these loans was approximately $753,978,000. The Company believes the risk of payment on the carve-out guarantees is mitigated, in most cases, by the fact that the Company manages the property, and in the event the Company’s partner did violate one of the carve-out items, the Company would seek recovery from its partner for any payments the Company would make. Additionally, the Company further mitigates its exposure through environmental insurance and other types of insurance coverage.
The Company monitors its properties for the presence of hazardous or toxic substances. Other than those environmental matters identified during the acquisition of a site (which are generally remediated prior to the commencement of development), the Company is not aware of any environmental liability with respect to its operating properties that would have a material adverse effect on its financial position, cash flows or results of operations. However, there can be no assurance that such a material environmental liability does not exist. The existence of any such material environmental liability could have an adverse effect on the Company’s results of operations and cash flow. The Company carries environmental insurance and believes that the policy terms, conditions, limits and deductibles are adequate and appropriate under the circumstances, given the relative risk of loss, the cost of such coverage and current industry practice.
The Company customarily guarantees lien-free completion of projects under construction. Upon completion as defined, the guarantees are released. The Company currently provides the following completion guarantees on its completed projects and projects under construction and development (including unconsolidated properties):
| | | | | | | | |
| | | Total Costs | | | Percent
Completed | |
| | | | |
| | | (dollars in thousands) | |
| | |
At January 31, 2012 | | | | | | | | |
Openings and acquisitions | | $ | 1,942,447 | | | | 93% | |
Under construction | | | 1,124,938 | | | | 69% | |
| | | | |
Total Real Estate | | $ | 3,067,385 | | | | 84% | |
| | | | |
126
Forest City Enterprises, Inc. and Subsidiaries
Notes to Consolidated Financial Statements
| P. | Commitments and Contingencies (continued) |
Additionally, the Company has provided a guaranty of payment, performance and completion of certain obligations associated with certain Military Housing Privatization Initiative (“MHPI”) projects. These guarantees do not include a guaranty of available MHPI project sources and the Company cannot be compelled to replace a deficiency in available sources. In the event the guaranty were called upon, any money advanced by the Company would be replaced by appropriate sources available within the MHPI project. Inclusive of the available MHPI project sources, the Company believes its maximum net exposure to be $88,493,000 at January 31, 2012. Currently, the Company anticipates further MHPI project sources will cover this maximum exposure and future advances by the Company will not be required.
In addition to what is stated above, the Company has guaranteed the lender the lien free completion of certain horizontal infrastructure associated with certain land development projects. The maximum amount due by the Company under these completion guarantees is limited to $39,340,000.
The Company is also involved in certain claims and litigation related to its operations and development. Based on the facts known at this time, management has consulted with legal counsel and is of the opinion that the ultimate outcome of all such claims and litigation will not have a material adverse effect on the financial condition, results of operations or cash flows of the Company.
In connection with the Company’s (through its subsidiary NS&E) August 2004 purchase of The Nets and its May 12, 2010 sale of an 80% interest in The Nets, the Company, certain subsidiaries and certain members have provided an indemnity guarantee to the NBA for any losses arising from the transaction, including the potential relocation of the team. The Company’s indemnity is effective as long as the Company owns an interest in the team. The indemnification provisions are standard provisions that are required by the NBA. The Company and the other indemnifying parties have insurance coverage of $100,000,000 in connection with this indemnity. The Company evaluated the indemnity guarantee and determined that the fair value of the Company’s known liability for its obligations under the guarantee was not material.
Certain ground leases include provisions requiring the Company to indemnify the ground lessor against claims or damages occurring on or about the leased property during the term of the ground lease. These indemnities generally were entered into prior to the effective date of accounting guidance related to guarantees; therefore, they have not been recorded in the Company’s consolidated financial statements at January 31, 2012. The maximum potential amount of future payments the Company could be required to make is limited to the actual losses suffered. The Company mitigates its exposure to loss related to these indemnities through insurance coverage.
The Company is party to an easement agreement under which it has agreed to indemnify a third party for any claims or damages arising from the use of the easement area in one of its development projects. The maximum potential amount of future payments the Company could be required to make is limited to the actual losses suffered. The Company mitigates its exposure to loss related to the easement agreement through insurance coverage.
The Company issued a $40,000,000 guaranty in connection with certain environmental testing and subsurface investigation work that was performed pursuant to a temporary entry license agreement issued by the Metropolitan Transportation Authority and the Long Island Rail Road Company in connection with the development of a mixed-use project in Brooklyn, New York. Under the terms of the license agreement, the sum of the guaranty could be reduced two years after completion of the work if no environmental response action was required, and remain in place in such reduced amount for an additional four years. The work was completed on July 16, 2006, and no environmental response action arose from the work. Accordingly, the guaranty was reduced to $30,000,000 and will remain in place until July 16, 2012. The Company is not aware of any further environmental work related to this project or guarantee that would have a material effect on its financial position, cash flows or results of operations.
127
Forest City Enterprises, Inc. and Subsidiaries
Notes to Consolidated Financial Statements
Q. Stock-Based Compensation
The Company’s 1994 Stock Plan (the “Plan”) permits the award of Class A stock options, restricted shares, performance shares and other equity awards to key employees and nonemployee directors of the Company. The aggregate maximum number of shares that may be issued under the Plan is 16,750,000 for all types of awards including 5,400,000 for restricted shares and performance shares.
As of January 31, 2012, the total number of shares available for granting of all types of awards was 4,289,404, of which 2,572,837 may be restricted shares or performance shares. The maximum annual award to an individual is 400,000 stock options, 225,000 restricted shares and 100,000 performance shares. Stock options have a maximum term of 10 years and are awarded with an exercise price at least equal to the market value of the stock on the date of grant. Class A common stock issued upon the exercise of stock options may be issued out of authorized and unissued shares or treasury stock. The Plan, which is administered by the Compensation Committee of the Board of Directors, does not allow the reduction of option prices without shareholder approval, except for the anti-dilution adjustments permitted by the Plan. The Company has not amended the terms of any previously issued equity award. All outstanding stock options have an exercise price equal to the fair market value of the underlying stock at the date of grant, a 10-year term, and graded vesting over three to four years. All outstanding restricted shares have graded vesting over three to four years.
The amount of stock-based compensation costs and related deferred income tax benefit recognized in the financial statements are as follows:
| | | | | | | | | | | | |
| | | Years Ended January 31, | |
| | | | |
| | | 2012 | | | 2011 | | | 2010 | |
| | | | |
| | | (in thousands) | |
| | | |
Stock option costs | | $ | 2,606 | | | $ | 6,085 | | | $ | 8,472 | |
Restricted stock costs | | | 9,979 | | | | 8,846 | | | | 8,266 | |
| | | | |
Total stock-based compensation costs | | | 12,585 | | | | 14,931 | | | | 16,738 | |
Less amount capitalized into qualifying real estate projects | | | (4,935) | | | | (6,962) | | | | (9,229) | |
| | | | |
Amount charged to operating expenses | | | 7,650 | | | | 7,969 | | | | 7,509 | |
Depreciation expense on capitalized stock-based compensation | | | 1,246 | | | | 602 | | | | 417 | |
| | | | |
Total stock-based compensation expense | | $ | 8,896 | | | $ | 8,571 | | | $ | 7,926 | |
| | | | |
| | | |
Deferred income tax benefit | | $ | 3,184 | | | $ | 2,935 | | | $ | 2,666 | |
| | | | |
The amounts of stock-based compensation expensed at the date of grant for awards granted to retirement-eligible grantees during the years ended January 31, 2012, 2011 and 2010 were $1,022,000, $1,136,000 and $350,000, respectively. During the year ended January 31, 2012, previously recorded stock option costs in the amount of $1,622,000, most of which was previously capitalized into real estate projects, were reversed to reflect actual forfeitures in excess of estimated forfeitures.
The accounting guidance for share-based payment requires the cash flows resulting from the tax benefits from tax deductions in excess of the compensation cost recognized for those options or shares (excess tax benefits) to be classified as financing cash flows in the Consolidated Statements of Cash Flows. The Company records excess tax benefits only if the excess tax deductions reduce taxes payable computed on a with-and-without basis. There were no excess tax benefits recorded under this accounting guidance and classified as financing cash flows for the years ended January 31, 2012, 2011 and 2010.
Stock Options
The fair value of each option grant is estimated on the date of grant using the Black-Scholes option-pricing model with the following weighted-average assumptions used for options granted during the respective years.
| | | | | | | | | | | | |
| | | Years Ended January 31, | |
| | | 2012 | | | 2011 | | | 2010 | |
| | | |
Risk-free interest rate | | | 2.61 | % | | | 2.79 | % | | | 2.02 | % |
Expected volatility | | | 72.40 | % | | | 71.51 | % | | | 65.90 | % |
Expected dividend yield | | | 0.00 | % | | | 0.00 | % | | | 0.00 | % |
Expected term (in years) | | | 5.50 | | | | 5.50 | | | | 5.50 | |
128
Forest City Enterprises, Inc. and Subsidiaries
Notes to Consolidated Financial Statements
| Q. | Stock-Based Compensation (continued) |
The risk-free interest rate was based on published yields of U.S. zero coupon bonds having a maturity date approximating the expected term of the options. Expected volatility was based on the historical volatility of the Company’s stock using the daily closing prices of the Company’s Class A common stock over a period of time equivalent to the expected term of the options. The expected dividend yield was based on the Company’s recent annual dividend divided by the average price of the Company’s Class A common stock during that period. Historical plan experience was used to estimate the expected term of options granted.
The following table provides a summary of stock option activity for the year ended January 31, 2012:
| | | | | | | | | | | | | | | | |
| | | Shares | | | Weighted
Average
Exercise Price | | | Weighted
Average
Remaining
Contractual
Term (in years) | | | Intrinsic
Value (in thousands) | |
| | | | |
Outstanding at January 31, 2011 | | | 4,126,678 | | | $ | 36.76 | | | | | | | | | |
Granted | | | 473,519 | | | $ | 17.72 | | | | | | | | | |
Exercised | | | (15,807 | ) | | $ | 12.22 | | | | | | | | | |
Forfeited/expired | | | (162,147 | ) | | $ | 44.54 | | | | | | | | | |
| | | | | | | | | | | | | | | | |
| | | | |
Outstanding at January 31, 2012 | | | 4,422,243 | | | $ | 34.53 | | | | 5.10 | | | $ | 1,480 | |
| | | | | | | | | | | | | | | | |
Options exercisable (fully vested) at January 31, 2012 | | | 3,189,378 | | | $ | 40.79 | | | | 3.91 | | | $ | 520 | |
| | | | | | | | | | | | | | | | |
The weighted average grant-date fair value of stock options granted during the years ended January 31, 2012, 2011 and 2010 was $11.20, $9.99 and $4.56, respectively. The total intrinsic value of stock options exercised during the years ended January 31, 2012, 2011 and 2010 was $84,000, $389,000 and $72,000, respectively. Cash received from stock options exercised during the years ended January 31, 2012, 2011 and 2010 was $195,000, $2,621,000 and $128,000, respectively. There was no income tax benefit realized as a reduction of income taxes payable from stock options exercised during the years ended January 31, 2012, 2011 and 2010. At January 31, 2012, there was $5,100,000 of unrecognized compensation cost related to stock options that is expected to be recognized over a weighted-average period of 2.66 years.
Restricted Stock
The following table provides a summary of restricted stock activity for the year ended January 31, 2012:
| | | | | | | | |
| | | Shares | | | Weighted
Average
Grant-Date
Fair Value | |
| | |
Unvested shares at January 31, 2011 | | | 1,570,138 | | | $ | 17.16 | |
Granted | | | 730,554 | | | $ | 17.72 | |
Vested | | | (343,125 | ) | | $ | 24.78 | |
Forfeited | | | (62,542 | ) | | $ | 16.57 | |
| | | | | | | | |
Unvested shares at January 31, 2012 | | | 1,895,025 | | | $ | 16.02 | |
| | | | | | | | |
Restricted stock represents a grant of Class A common stock to key employees and nonemployee directors subject to restrictions on disposition, transferability and risk of forfeiture, while having the rights to vote the shares and receive dividends. The restrictions generally lapse on the second, third and fourth anniversary of the date of grant. Grants that have graded vesting over three years lapse one-third on each anniversary of the date of grant. Restricted shares subject to the restrictions mentioned above are considered to be nonvested shares under the accounting guidance for share-based payment and are not reflected as issued and outstanding shares until the restrictions lapse. At that time, the shares are released to the grantee and the Company records the issuance of the shares. At January 31, 2012, all unvested shares of restricted stock were excluded from issued and outstanding shares of Class A common stock in the accompanying consolidated financial statements.
129
Forest City Enterprises, Inc. and Subsidiaries
Notes to Consolidated Financial Statements
| Q. | Stock-Based Compensation (continued) |
The weighted average grant-date fair value of restricted stock granted during the years ended January 31, 2012, 2011 and 2010 was $17.72, $15.89 and $7.80, respectively. The total fair value of shares that vested during the years ended January 31, 2012, 2011 and 2010 was $8,503,000, $8,821,000 and $5,884,000, respectively. At January 31, 2012, there was $16,757,000 of unrecognized compensation cost related to restricted stock that is expected to be recognized over a weighted-average period of 2.60 years.
In connection with the vesting of restricted stock during the years ended January 31, 2012, 2011 and 2010, the Company repurchased into treasury 90,104, 54,732 and 26,188 shares, respectively, of Class A common stock to satisfy the employees’ related minimum statutory tax withholding requirements. These shares were placed in treasury with an aggregate cost basis of $1,670,000, $786,000 and $133,000, respectively.
Performance Shares
Performance shares may be granted to selected executives and the vesting of the shares is contingent upon meeting management objectives established by the Compensation Committee of the Board of Directors. The management objectives may be company-wide or business unit performance goals that must be met within a performance period of at least one year. Performance shares will generally be granted at target levels and the ultimate number of shares earned will depend upon the degree performance goals are met at the end of the performance period. The fair value of performance shares are based on the closing price of the underlying stock on the date of grant and recorded as stock-based compensation cost over the performance period. If the performance goals are not met or below target, then any related recognized compensation costs will be reversed. If the performance goals are exceeded, additional compensation costs will be recorded, as applicable, up to the maximum specified in the grant.
In June 2008, the Company granted 172,609 performance shares under the 1994 Stock Plan to selected key executives having a grant-date fair value of $36.38 per share. The performance shares vest if performance goals are achieved during the period from May 1, 2008 to January 31, 2012. The performance shares were granted at target levels and the ultimate number of shares earned ranged from 0% to 175% depending upon the degree the performance goals were met. The cost of this grant has not been recorded because the performance goals were not achieved.
R.Earnings Per Share
The Company’s restricted stock is considered a participating security pursuant to the two-class method for computing basic EPS. The Class A Common Units, which are reflected as noncontrolling interests in the Consolidated Balance Sheets, are considered convertible participating securities as they are entitled to participate in any dividends paid to the Company’s common shareholders. The Class A Common Units are included in the computation of basic EPS using the two-class method and are included in the computation of diluted EPS using the if-converted method. The Class A common stock issuable in connection with a put or conversion of the 2014 Senior Notes, 2016 Senior Notes, 2018 Senior Notes and Series A preferred stock are included in the computation of diluted EPS using the if-converted method. The loss from continuing operations attributable to the Company and the net loss attributable to the Company for the years ended January 31, 2012 and 2010 were allocated solely to holders of common stock as the participating security holders do not share in the losses.
130
Forest City Enterprises, Inc. and Subsidiaries
Notes to Consolidated Financial Statements
| R. | Earnings Per Share (continued) |
The reconciliation of the amounts used in the basic and diluted EPS computations is shown in the following table:
| | | | | | | | | | | | |
| | | Years Ended January 31, | |
| | | 2012 | | | 2011 | | | 2010 | |
Numerators(in thousands) | | | | | | | | | | | | |
Earnings (loss) from continuing operations attributable to Forest City Enterprises, Inc. | | $ | (109,818 | ) | | $ | 79,940 | | | $ | (14,208 | ) |
Dividends on preferred stock | | | (15,400 | ) | | | (11,807 | ) | | | - | |
Undistributed earnings allocated to participating securities | | | - | | | | (2,183 | ) | | | - | |
| | | |
Earnings (loss) from continuing operations attributable to Forest City Enterprises, Inc.
common shareholders - Basic | | | (125,218 | ) | | | 65,950 | | | | (14,208 | ) |
Undistributed earnings allocated to participating securities | | | - | | | | 2,183 | | | | - | |
Interest on convertible debt | | | - | | | | 4,438 | | | | - | |
Preferred distribution on Class A Common Units | | | - | | | | 1,433 | | | | - | |
| | | |
Earnings (loss) from continuing operations attributable to Forest City Enterprises, Inc.
common shareholders - Diluted | | $ | (125,218 | ) | | $ | 74,004 | | | $ | (14,208 | ) |
| Net earnings (loss) attributable to Forest City Enterprises, Inc. | | $ | (86,486 | ) | | $ | 58,048 | | | $ | (26,978 | ) |
| Dividends on preferred stock | | | (15,400 | ) | | | (11,807 | ) | | | - | |
| Undistributed earnings allocated to participating securities | | | - | | | | (1,501 | ) | | | - | |
| | | |
Net earnings (loss) attributable to Forest City Enterprises, Inc.
common shareholders - Basic | | | (101,886 | ) | | | 44,740 | | | | (26,978 | ) |
| Undistributed earnings allocated to participating securities | | | - | | | | 1,501 | | | | - | |
| Interest on convertible debt | | | - | | | | 4,438 | | | | - | |
| Preferred distribution on Class A Common Units | | | - | | | | 1,433 | | | | - | |
| | | |
Net earnings (loss) attributable to Forest City Enterprises, Inc. common shareholders -
Diluted | | $ | (101,886 | ) | | $ | 52,112 | | | $ | (26,978 | ) |
| | | |
Denominators | | | | | | | | | | | | |
Weighted average shares outstanding - Basic | | | 168,170,650 | | | | 155,485,243 | | | | 139,825,349 | |
Effect of stock options and restricted stock | | | - | | | | 550,730 | | | | - | |
Effect of convertible debt | | | - | | | | 13,755,158 | | | | - | |
Effect of convertible Class A Common Units | | | - | | | | 3,646,755 | | | | - | |
Weighted average shares outstanding - Diluted(1) | | | 168,170,650 | | | | 173,437,886 | | | | 139,825,349 | |
| | | |
Earnings Per Share | | | | | | | | | | | | |
Earnings (loss) from continuing operations attributable to Forest City Enterprises, Inc.
common shareholders - Basic | | $ | (0.74 | ) | | $ | 0.42 | | | $ | (0.10 | ) |
Earnings (loss) from continuing operations attributable to Forest City Enterprises, Inc.
common shareholders - Diluted | | $ | (0.74 | ) | | $ | 0.43 | | | $ | (0.10 | ) |
Net earnings (loss) attributable to Forest City Enterprises, Inc.
common shareholders - Basic | | $ | (0.61 | ) | | $ | 0.29 | | | $ | (0.19 | ) |
Net earnings (loss) attributable to Forest City Enterprises, Inc.
common shareholders - Diluted(2) | | $ | (0.61 | ) | | $ | 0.30 | | | $ | (0.19 | ) |
| (1) a) | Incremental shares from dilutive options, restricted stock and convertible securities aggregating 45,856,959 and 12,065,194 for the years ended January 31, 2012 and 2010, respectively, were not included in the computation of diluted EPS because their effect is anti-dilutive due to the loss from continuing operations. |
| | b) | Weighted-average options and restricted stock of 4,222,955, 4,447,652 and 4,520,436 for the years ended January 31, 2012, 2011 and 2010, respectively, were not included in the computation of diluted EPS because their effect is anti-dilutive. Weighted-average shares issuable upon the conversion of preferred stock and 2016 Senior Notes of 13,115,165 and 14,356,215, respectively, for the year ended January 31, 2011, were not included in the computation of diluted EPS because their effect is anti-dilutive under the if-converted method. |
| | c) | Weighted-average performance shares for the years ended January 31, 2012, 2011 and 2010 were not included in the computation of diluted EPS because the performance criteria were not satisfied as of the end of the respective periods. |
| (2) | The accounting guidance on earnings per share requires that the number of diluted common shares used in computing the diluted per-share amount for earnings from continuing operations also be used in computing the diluted per-share amount for net earnings (loss) even if those amounts are anti-dilutive to the diluted per-share amount for net earnings (loss). Certain dilutive common shares had such an effect for the year ended January 31, 2011. |
131
Forest City Enterprises, Inc. and Subsidiaries
Notes to Consolidated Financial Statements
S. Impairment of Real Estate, Impairment of Unconsolidated Entities, Write-Off of Abandoned Development Projects and Gain (Loss) on Extinguishment of Debt
Impairment of Real Estate
The Company reviews its real estate portfolio, including land held for development and sale, for impairment whenever events or changes indicate that its carrying value may not be recoverable. In cases where the Company does not expect to recover its carrying costs, an impairment charge is recorded. In order to determine whether the carrying costs are recoverable from estimated future undiscounted cash flows, the Company uses various assumptions that include future net operating income, estimated holding periods, risk of foreclosure and estimated cash proceeds received upon the disposition of the asset. If the carrying costs are not recoverable, the Company is required to record an impairment to reduce the carrying costs to estimated fair value. The assumptions used to estimate fair value are considered to be Level 2 or 3 inputs. The Company’s assumptions were based on current information. If the conditions mentioned above continue to deteriorate, or if the Company’s plans regarding its assets change, additional impairment charges may occur in the future.
The impairments recorded during the years ended January 31, 2012, 2011 and 2010 represent write-downs to the estimated fair value due to changes in events, such as a change in strategy for certain assets, a bona fide third-party purchase offer or changes in certain assumptions, including estimated holding periods and current market conditions and the impact of these assumptions to the properties’ estimated future cash flows.
The following table summarizes the Company’s impairment of real estate included in continuing operations.
| | | | | | | | | | | | | | |
| | | | | Years Ended January 31, | |
| | | | | 2012 | | | 2011 | | | 2010 | |
| | | | | (in thousands) | |
| | | | |
Land held for divestiture | | Various | | $ | 115,654 | | | $ | - | | | $ | - | |
Investment in triple net lease retail property | | Portage, Michigan | | | 3,435 | | | | - | | | | 3,552 | |
Development property at Waterfront Station | | Washington, D.C. | | | - | | | | 3,103 | | | | - | |
Gladden Farms (Land Project) | | Marana, Arizona | | | - | | | | 650 | | | | 2,985 | |
Other | | | | | 235 | | | | 1,010 | | | | 2,370 | |
| | | | $ | 119,324 | | | $ | 4,763 | | | $ | 8,907 | |
On January 31, 2012, the Board of Directors of the Company approved a strategic decision by senior management to reposition portions of the Company’s investment in the Land Development Group as part of a greater focus on core rental products in core markets. The Company’s Land Development Group buys and sells raw land, develops subdivisions and sells lots to homebuilders. The economic downturn, particularly in the housing market, has led to increased volatility in land projects, making it challenging to fit into the Company’s long-term strategic plan. The Company has approximately 35 active land projects, including 18 accounted for on the equity method, in which it is currently reviewing its divestiture options. The primary regions with active land projects that the Company is actively seeking to divest include the southwestern United States, Texas, North Carolina and Ohio. Accordingly, these land assets and related nonrecourse mortgage debt have been reclassified as held for sale on the Consolidated Balance Sheets at January 31, 2012. Held for sale assets are required to be recorded at fair value less cost to sell. As a result of the Company’s strategic decision to divest, it dramatically shortened the estimated holding periods of the land projects. This reduced estimate of future undiscounted cash flows was not sufficient to recover the carrying value of the assets, resulting in an impairment charge of $115,654,000 during the year ended January 31, 2012.
In addition, the Company had impairments related to consolidated real estate assets that were disposed of during the periods presented. The following table summarizes the Company’s impairment of real estate included in discontinued operations.
| | | | | | | | | | | | | | |
| | | | | Years Ended January 31, | |
| | | | | 2012 | | | 2011 | | | 2010 | |
| | | | | (in thousands) | |
| | | | |
250 Huron (Office Building) | | Cleveland, Ohio | | $ | 10,257 | | | $ | 2,040 | | | $ | - | |
Simi Valley Town Center (Regional Mall) | | Simi Valley, California | | | - | | | | 76,962 | | | | - | |
Investment in triple net lease retail property | | Pueblo, Colorado | | | - | | | | 2,641 | | | | - | |
Saddle Rock Village (Specialty Retail Center) | | Aurora, Colorado | | | - | | | | - | | | | 13,179 | |
Two Sterling Glen supported-living apartment communities | | Great Neck, New York and Glen Cove, New York | | | - | | | | - | | | | 9,775 | |
101 San Fernando (Apartment Community) | | San Jose, California | | | - | | | | - | | | | 4,440 | |
| | | | $ | 10,257 | | | $ | 81,643 | | | $ | 27,394 | |
132
Forest City Enterprises, Inc. and Subsidiaries
Notes to Consolidated Financial Statements
| S. | Impairment of Real Estate, Impairment of Unconsolidated Entities, Write-Off of Abandoned Development Projects and Gain (Loss) on Extinguishment of Debt (continued) |
In 2008,250 Huron, an office building located in Cleveland, Ohio was vacated by its single tenant, which occupied the entire building. A lease termination payment received by the Company was placed into escrow for the purpose of servicing the nonrecourse mortgage debt until new tenants for the building could be obtained. During 2010, the Company entered into an option to sell the building at a sales price that was below the carrying value, resulting in an impairment charge of $2,040,000 during the year ended January 31, 2011. Unable to obtain the necessary lender approval for the purchaser to assume the nonrecourse mortgage debt, the option to sell expired in August 2011. Subsequently, the Company received a notice of default from the loan servicer. As a result, the Company no longer intended to hold the property long term and dramatically shortened its estimated holding period. This reduced estimate of future undiscounted cash flows was not sufficient to recover the carrying value of the asset, resulting in an impairment charge of $10,257,000 during the year ended January 31, 2012. The impairment, which was recorded prior to the ultimate disposition, resulted in the carrying value of the real estate being less than the nonrecourse mortgage. During December 2011, the lender sold the nonrecourse mortgage debt to a third party with whom the Company entered into negotiations to transfer the property to in full satisfaction of the outstanding nonrecourse mortgage debt balance. During January 2012, the Company transferred the property to the new nonrecourse mortgage debt holder in full satisfaction of the debt. As a result, the Company recorded a gain on disposition of $9,428,000 for the year ended January 31, 2012. Upon disposition, the Company reclassified all revenues and expenses, as well as the gain to discontinued operations.
Occupancy levels and estimated future cash flows were significantly decreasing during 2010 atSimi Valley Town Center, a regional mall located in Simi Valley, California, due to the consolidation of two anchor stores at the property, greater competition than originally anticipated and the general economic downturn. The Company had ongoing discussions with the mortgage lender regarding the performance of the property and the expectation that it would be unable to generate sufficient cash flow to cover the debt service of the nonrecourse mortgage note. During the year ended January 31, 2011, the mortgage lender determined it wanted to exit the investment by selling the nonrecourse mortgage note and the Company agreed to transfer the property to the purchaser of the nonrecourse mortgage upon a sale. Based on these events and changes in circumstances, the Company dramatically shortened its estimated asset holding period. As a result, estimated future undiscounted cash flows were not sufficient to recover the carrying value and the asset was recorded at its estimated fair value resulting in an impairment charge of $76,962,000 during the year ended January 31, 2011. The impairment, which was recorded prior to the ultimate disposition in December 2010, resulted in the carrying value of the real estate being less than the nonrecourse mortgage. As a result, upon disposition, the Company recorded a gain of $46,802,000 for the year ended January 31, 2011. Upon disposition, the Company reclassified all revenues and expenses, as well as the gain to discontinued operations.
In addition, the Company recorded impairments of real estate for other properties included in discontinued operations as described in the table above. These impairments represent a write down to the estimated fair value due to changes in events, related to a bona fide third-party purchase offer and consideration of current market conditions and the impact of these events to the properties’ estimated future cash flows.
Impairment of Unconsolidated Entities
The Company reviews its portfolio of unconsolidated entities for other-than-temporary impairments whenever events or changes indicate that its carrying value in the investments may be in excess of fair value. An equity method investment’s value is impaired if management’s estimate of its fair value is less than the carrying value and the difference is deemed to be other-than-temporary. In order to arrive at the estimates of fair value, the Company uses varying assumptions that may include comparable sale prices, market discount rates, market capitalization rates and estimated future discounted cash flows specific to the geographic region and property type, which are considered to be Level 3 inputs. For newly opened properties, assumptions also include the timing of initial lease up at the property and tenant improvements. In the event the initial lease up assumptions differ from actual results, estimated future discounted cash flows may vary resulting in impairment charges in future periods.
133
Forest City Enterprises, Inc. and Subsidiaries
Notes to Consolidated Financial Statements
| S. | Impairment of Real Estate, Impairment of Unconsolidated Entities, Write-Off of Abandoned Development Projects and Gain (Loss) on Extinguishment of Debt (continued) |
The following table summarizes the Company’s impairment of unconsolidated entities.
| | | | | | | | | | | | | | |
| | | | | Years Ended January 31, | |
| | | | | | |
| | | | | 2012 | | | 2011 | | | 2010 | |
| | | | | | |
| | | | | (in thousands) | |
Equity method investments in land entities | | Various | | $ | 41,902 | | | $ | - | | | $ | - | |
Specialty Retail Centers: | | | | | | | | | | | | | | |
Village at Gulfstream Park | | Hallandale Beach, Florida | | | 35,674 | | | | 35,000 | | | | - | |
Metreon | | San Francisco, California | | | - | | | | 4,595 | | | | - | |
Commercial land and development rights | | Cleveland, Ohio | | | 4,610 | | | | - | | | | - | |
Four Museum Park properties at Central Station | | Chicago, Illinois | | | - | | | | 18,311 | | | | - | |
Office Buildings: | | | | | | | | | | | | | | |
818 Mission Street | | San Francisco, California | | | - | | | | 4,018 | | | | - | |
Bulletin Building | | San Francisco, California | | | - | | | | 3,543 | | | | - | |
Millender Center | | Detroit, Michigan | | | - | | | | - | | | | 10,317 | |
Pittsburgh Peripheral (Commercial Group Land Project) | | Pittsburgh, Pennsylvania | | | - | | | | - | | | | 7,217 | |
Uptown Apartments | | Oakland, California | | | - | | | | - | | | | 6,781 | |
Classic Residence by Hyatt (Supported-Living Apartments) | | Yonkers, New York | | | - | | | | - | | | | 3,152 | |
Other | | | | | - | | | | 6,992 | | | | 8,889 | |
| | | | | | |
| | | | $ | 82,186 | | | $ | 72,459 | | | $ | 36,356 | |
| | | | | | |
As mentioned earlier, the Company has made a strategic decision to divest of portions of its Land Development Group, which includes 18 land development projects accounted for on the equity method. During the customary due diligence in arriving at the strategic decision, the Company had in-depth interactions with industry consultants, brokers and other land owners. Based on the due diligence, it was apparent that land values for the residential housing market continued to deteriorate in the fourth quarter of 2011, specifically in the southwestern United States. The Company revised its assumptions used to arrive at the estimate of fair value, including future discounted cash flows, comparable sales prices and market discount rates by geographic region. As a result, the Company recorded an impairment charge of $41,902,000 during the year ended January 31, 2012.
The impairments recorded during the years ended January 31, 2012 and 2011 atVillage at Gulfstream Park, a specialty retail center in Hallandale Beach, Florida represent other-than-temporary impairments in the Company’s equity method investment. The specialty retail center was fully opened in February 2010 and was leased during the general economic downturn which resulted in a longer initial lease up period than originally projected and increased rent concessions to the existing tenant base. Based on these conditions, management revised its estimate of future discounted cash flows, which are a key component in estimating fair value, resulting in an impairment charge of $35,000,000 during the year ended January 31, 2011. During the year ended January 31, 2012, the general economic conditions continued to negatively impact the operating results at the specialty retail center. The specialty retail center has continued to experience a slower than anticipated lease-up period and has not reached the expected level of cash flows used in previous estimates of fair value. Based on these conditions, management revised its estimate of future discounted cash flows downward. As a result, the Company’s equity method investment was recorded at its estimated fair value, resulting in an additional impairment charge of $35,674,000 during the year ended January 31, 2012.
The impairments recorded during the year ended January 31, 2011 atCentral Station, a mixed-use land development project in Chicago, Illinois represent other-than-temporary impairments in the Company’s investments of four unconsolidated entities which hold investments in certain condominium buildings. Due to the continued price deterioration of the Chicago condominium market, the Company made a strategic business decision during the year ended January 31, 2011 to rent some of the condominium units. This decision combined with other changes in circumstances resulted in a reduction of estimated discounted cash flows expected from these entities which are a key component in the associated fair value estimates. As a result, the investments in the unconsolidated entities were recorded at these reduced estimated fair values as of January 31, 2011, resulting in the impairment charges during the year ended January 31, 2011.
134
Forest City Enterprises, Inc. and Subsidiaries
Notes to Consolidated Financial Statements
| S. | Impairment of Real Estate, Impairment of Unconsolidated Entities, Write-Off of Abandoned Development Projects and Gain (Loss) on Extinguishment of Debt (continued) |
Write-Off of Abandoned Development Projects
On a quarterly basis, the Company reviews each project under development to determine whether it is probable the project will be developed. If management determines that the project will not be developed, project costs are written off as an abandoned development project cost. The Company abandons certain projects under development for a number of reasons, including, but not limited to, changes in local market conditions, increases in construction or financing costs or third party challenges related to entitlements or public financing. The Company wrote off abandoned development projects of $8,838,000, $9,195,000 and $20,739,000 for the years ended January 31, 2012, 2011 and 2010, respectively, which were recorded in operating expenses.
In addition, included in equity in earnings of unconsolidated entities are write-offs of $3,045,000 and $304,000 for the years ended January 31, 2011 and 2010, respectively, which represent the Company’s proportionate share of write-offs of abandoned development projects of equity method investments. The Company had no write-offs of abandoned development projects related to unconsolidated entities for the year ended January 31, 2012.
Gain (Loss) on Extinguishment of Debt
For the years ended January 31, 2012, 2011 and 2010, the Company recorded $9,590,000, $(21,035,000) and $36,569,000, respectively, as gain (loss) on extinguishment of debt. The gain for 2011 includes gains of $15,101,000 on extinguishment of nonrecourse mortgage debt at a mixed-use development project located in Las Vegas, Nevada, $5,329,000 related to the early extinguishment of Urban Development Action Grant loans onAvenue at Tower City Center, a specialty retail center located in Cleveland, Ohio. These gains were offset by non-tax deductible losses of $10,800,000 related to the exchange of a portion of the 2016 Senior Notes for Class A common stock.
The amounts for the year ended January 31, 2011 include a $31,689,000 loss related to the exchange of a portion of the Company’s 2016 Senior Notes for Class A common stock, offset by a $2,472,000 gain on early extinguishment of nonrecourse mortgage debt atBotanica on the GreenandCrescent Flats, apartment communities located in Denver, Colorado, a $6,297,000 gain related to the exchange of a portion of the 2011, 2015 and 2017 Senior Notes for Series A preferred stock and a $1,896,000 gain on the early extinguishment of a portion of the 2011 and 2017 Senior Notes. For the year ended January 31, 2010, the amount primarily represents gains on early extinguishment of nonrecourse mortgage debt at an underperforming retail project, a land development project in Marana, Arizona,Gladden Farms, and the gain related to the exchange of a portion of the Company’s 2011 Senior Notes for 2014 Senior Notes.
T. Discontinued Operations and Gain (Loss) on Disposition of Rental Properties
The following table lists rental properties included in discontinued operations:
| | | | | | | | | | | | | | | | | | |
| Property | | Location | | Square Feet/
Number of Units | | Period
Disposed | | Year
Ended
1/31/2012 | | | Year
Ended
1/31/2011 | | | Year
Ended
1/31/2010 | |
| | | | | | |
Commercial Group: | | | | | | | | | | | | | | | | | | |
Ritz-Carlton hotel | | Cleveland, Ohio | | 206 rooms | | Q4-2011 | | | Yes | | | | Yes | | | | Yes | |
250 Huron | | Cleveland, Ohio | | 119,000 square feet | | Q4-2011 | | | Yes | | | | Yes | | | | Yes | |
Waterfront Station – East 4th & West 4th Buildings | | Washington, D.C. | | 631,000 square feet | | Q2-2011 | | | Yes | | | | Yes | | | | Yes | |
Charleston Marriott hotel | | Charleston, West Virginia | | 352 rooms | | Q1-2011 | | | Yes | | | | Yes | | | | Yes | |
Simi Valley Town Center | | Simi Valley, California | | 612,000 square feet | | Q4-2010 | | | - | | | | Yes | | | | Yes | |
Investment in triple net lease retail property | | Pueblo, Colorado | | 203,000 square feet | | Q4-2010 | | | - | | | | Yes | | | | Yes | |
Saddle Rock Village | | Aurora, Colorado | | 294,000 square feet | | Q3-2010 | | | - | | | | Yes | | | | Yes | |
Grand Avenue | | Queens, New York | | 100,000 square feet | | Q1-2009 | | | - | | | | - | | | | Yes | |
| | | | | | |
Residential Group: | | | | | | | | | | | | | | | | | | |
101 San Fernando | | San Jose, California | | 323 units | | Q2-2010 | | | - | | | | Yes | | | | Yes | |
Sterling Glen of Glen Cove | | Glen Cove, New York | | 80 units | | Q3-2009 | | | - | | | | - | | | | Yes | |
Sterling Glen of Great Neck | | Great Neck, New York | | 142 units | | Q3-2009 | | | - | | | | - | | | | Yes | |
135
Forest City Enterprises, Inc. and Subsidiaries
Notes to Consolidated Financial Statements
T.Discontinued Operations and Gain (Loss) on Disposition of Rental Properties (continued)
The following table summarizes the operating results related to discontinued operations:
| | | | | | | | | | | | |
| | | Years Ended January 31, | |
| | | 2012 | | | 2011 | | | 2010 | |
| | | (in thousands) | |
| | | |
Revenues from real estate operations | | $ | 29,099 | | | $ | 77,992 | | | $ | 68,728 | |
| | | |
Expenses | | | | | | | | | | | | |
Operating expenses | | | 20,171 | | | | 47,121 | | | | 46,013 | |
Depreciation and amortization | | | 4,339 | | | | 13,289 | | | | 12,149 | |
Impairment of real estate | | | 10,257 | | | | 81,643 | | | | 27,394 | |
| | | 34,767 | | | | 142,053 | | | | 85,556 | |
Interest expense | | | (2,937 | ) | | | (11,404 | ) | | | (9,595 | ) |
Amortization of mortgage procurement costs | | | (762 | ) | | | (2,127 | ) | | | (371 | ) |
Interest income | | | 2 | | | | 14 | | | | 60 | |
Gain on disposition of rental properties | | | 133,554 | | | | 51,303 | | | | 5,720 | |
| | | |
Earnings (loss) before income taxes | | | 124,189 | | | | (26,275 | ) | | | (21,014 | ) |
| | | |
Income tax expense (benefit) | | | | | | | | | | | | |
Current | | | 11,139 | | | | 2,491 | | | | (1,383 | ) |
Deferred | | | 6,536 | | | | (15,002 | ) | | | (6,705 | ) |
| | | 17,675 | | | | (12,511 | ) | | | (8,088 | ) |
Earnings (loss) from discontinued operations | | | 106,514 | | | | (13,764 | ) | | | (12,926 | ) |
| | | |
Noncontrolling interests | | | | | | | | | | | | |
Gain on disposition of rental properties | | | 81,758 | | | | 4,211 | | | | - | |
Operating earnings (loss) from rental properties | | | 1,424 | | | | 3,917 | | | | (156 | ) |
| | | 83,182 | | | | 8,128 | | | | (156 | ) |
Earnings (loss) from discontinued operations attributable to Forest City Enterprises, Inc. | | $ | 23,332 | | | $ | (21,892 | ) | | $ | (12,770 | ) |
The following table summarizes the pre-tax gain (loss) on disposition of rental properties:
| | | $000,00 | | | | $000,00 | | | | $000,00 | |
| | | Years Ended January 31, | |
| | | 2012 | | | 2011 | | | 2010 | |
| | | (in thousands) | |
| | | |
Office Buildings: | | | | | | | | | | | | |
Waterfront Station – East 4th & West 4th Buildings | | $ | 111,738 | | | $ | - | | | $ | - | |
250 Huron | | | 9,428 | | | | - | | | | - | |
Hotels: | | | | | | | | | | | | |
Charleston Marriott | | | 9,957 | | | | - | | | | - | |
Ritz-Carlton | | | 2,431 | | | | - | | | | - | |
Simi Valley Town Center (Regional Mall) | | | - | | | | 46,802 | | | | - | |
101 San Fernando (Apartment Community) | | | - | | | | 6,204 | | | | - | |
Specialty Retail Centers: | | | | | | | | | | | | |
Saddle Rock Village | | | - | | | | (1,428 | ) | | | - | |
Grand Avenue | | | - | | | | - | | | | 4,548 | |
Other | | | - | | | | (275 | ) | | | 1,172 | |
Total | | $ | 133,554 | | | $ | 51,303 | | | $ | 5,720 | |
136
Forest City Enterprises, Inc. and Subsidiaries
Notes to Consolidated Financial Statements
U.Class A Common Units
Master Contribution Agreement
The Company and certain of its affiliates entered into a Master Contribution and Sale Agreement (the “Master Contribution Agreement”) with Bruce C. Ratner (“Mr. Ratner”), an Executive Vice President and Director of the Company, and certain entities and individuals affiliated with Mr. Ratner (the “BCR Entities”) on August 14, 2006. Pursuant to the Master Contribution Agreement, on November 8, 2006, the Company issued Class A Common Units (“Units”) in a jointly-owned limited liability company to the BCR Entities in exchange for their interests in a total of 30 retail, office and residential operating properties, and certain service companies, all in the greater New York City metropolitan area. The Company accounted for the issuance of the Units in exchange for the noncontrolling interests under the purchase method of accounting. The Units may be exchanged for one of the following forms of consideration at the Company’s sole discretion: (i) an equal number of shares of the Company’s Class A common stock or, (ii) cash based on a formula using the average closing price of the Class A common stock at the time of conversion or, (iii) a combination of cash and shares of the Company’s Class A common stock. The Company has no rights to redeem or repurchase the Units. At January 31, 2012 and 2011, 3,646,755 Units were outstanding. The carrying value of the Units of $186,021,000 is included as noncontrolling interests at January 31, 2012 and 2011.
Also pursuant to the Master Contribution Agreement, the Company and Mr. Ratner agreed that certain projects under development would remain owned jointly until such time as each individual project was completed and achieved “stabilization.” As each of the development projects achieves stabilization, it is valued and the Company, in its discretion, chooses among various options for the ownership of the project following stabilization consistent with the Master Contribution Agreement. The development projects were not covered by the Tax Protection Agreement (the “Tax Protection Agreement”) that the parties entered into in connection with the Master Contribution Agreement. The Tax Protection Agreement indemnified the BCR Entities included in the initial closing against taxes payable by reason of any subsequent sale of certain operating properties.
In accordance with the terms of the Tax Protection Agreement, the Company paid BCR Entities $1,074,000 and $1,695,000 for tax indemnification during the years ended January 31, 2012 and 2011, respectively.
New York Times and Twelve MetroTech Center
Two of the development projects,New York Times, an office building located in Manhattan, New York andTwelve MetroTech Center, an office building located in Brooklyn, New York, achieved stabilization in 2008. The Company elected to cause certain of its affiliates to acquire for cash the BCR Entities’ interests in the two projects pursuant to agreements dated May 6, 2008 and May 12, 2008, respectively. In accordance with the agreements, the applicable BCR Entities assigned and transferred their interests in the two projects to affiliates of the Company and will receive approximately $121,000,000 over a 15 year period. An affiliate of the Company has also agreed to indemnify the applicable BCR Entity against taxes payable by it by reason of a subsequent sale or other disposition of one of the projects. The tax indemnity provided by the affiliate of the Company expires on December 31, 2014 and is similar to the indemnities provided for the operating properties under the Tax Protection Agreement.
The consideration exchanged by the Company for the BCR Entities’ interest in the two development projects has been accounted for under the purchase method of accounting. Pursuant to the agreements, the BCR Entities received an initial cash amount of $49,249,000. The Company calculated the net present value of the remaining payments over the 15 year period using a discounted interest rate. This initial discounted amount of $56,495,000 was recorded in accounts payable and accrued expenses and will be accreted up to the total liability through interest expense over the next 15 years using the effective interest method.
V. Capital Stock
Common Stock
The Company’s authorized common stock consists of Class A common stock and Class B common stock. The economic rights of each class of common stock are identical, but the voting rights differ. The Class A common stock, voting as a separate class, is entitled to elect 25% of the members of the Company’s board of directors, while the Class B common stock, voting as a separate class, is entitled to elect the remaining 75% of the Company’s board of directors. When the Class A common stock and Class B common stock vote together as a single class, each share of Class A common stock is entitled to one vote per share and each share of Class B common stock is entitled to ten votes per share. Class B Common Stock is convertible into Class A common stock on a share-for-share basis at the option of the holder. In June 2010, the shareholders of the Company approved increasing the number of authorized shares of Class A common stock to 371,000,000 shares.
137
Forest City Enterprises, Inc. and Subsidiaries
Notes to Consolidated Financial Statements
V.Capital Stock (continued)
On May 5, 2011, the Company entered into separate, privately negotiated exchange agreements with certain holders of the 2016 Senior Notes to exchange such notes for shares of the Company’s Class A common stock. In order to induce the holders to make the exchange, the Company agreed to increase the conversion rate from 71.8894 shares of Class A common stock per $1,000 principal amount of 2016 Senior Notes to 86.1073 shares, which factors in foregone interest to the holders among other inducements. Under the terms of the agreements, holders agreed to exchange $40,000,000 in aggregate principal amount of 2016 Senior Notes for a total of 3,444,293 shares of Class A common stock.
On January 27, 2011, the Company entered into separate, privately negotiated exchange agreements with certain holders of its 2016 Senior Notes to exchange the notes for shares of Class A common stock. In order to induce the holders to make the exchange, the Company agreed to increase the conversion rate from 71.8894 shares of Class A common stock per $1,000 principal amount of 2016 Senior Notes to 88.8549 shares, which factors in lost interest to the holders among other inducements. Under the terms of the agreements, holders agreed to exchange $110,000,000 in aggregate principal amount of 2016 Senior Notes for a total of 9,774,039 shares of Class A common stock.
In May 2009, the Company sold 52,325,000 shares of its Class A common stock in a public offering at a price of $6.60 per share, which included 6,825,000 shares issued as a result of the underwriters’ exercise of their over-allotment option in full. The offering generated net proceeds of $329,917,000 after deducting underwriting discounts, commissions and other offering expenses, which were used to reduce a portion of the Company’s outstanding borrowings under its then current bank revolving credit facility.
Preferred Stock
The Company’s Amended Articles of Incorporation authorize the Company to issue, from time to time, shares of preferred stock. On March 4, 2010, the Company further amended its Amended Articles of Incorporation to designate a series of preferred stock as Series A preferred stock, authorized 6,400,000 shares of Series A preferred stock, and set forth the dividend rate, the designations, and certain other powers, preferences and relative, participating, optional or other rights, and the qualifications, limitations and restrictions, of the Series A preferred stock. The Series A preferred stock will rank junior to all of the Company’s existing and future debt obligations, including convertible or exchangeable debt securities; senior to the Company’s Class A common stock and Class B common stock and any future equity securities that by their terms rank junior to the Series A preferred stock with respect to distribution rights or payments upon the Company’s liquidation, winding-up or dissolution; equal with future series of preferred stock or other equity securities that by their terms are on a parity with the Series A preferred stock; and junior to any future equity securities that by their terms rank senior to the Series A preferred stock.
On March 4, 2010, the Company entered into separate, privately negotiated exchange agreements with certain holders of three separate series of the Company’s 2011, 2015 and 2017 Senior Notes. Under the terms of the agreements, these holders agreed to exchange their notes for a new issue of Series A preferred stock. Amounts exchanged in each series are as follows: $51,176,000 of 2011 Senior Notes, $121,747,000 of 2015 Senior Notes and $5,826,000 of 2017 Senior Notes, which were exchanged for $50,664,000, $114,442,000 and $4,894,000 of Series A preferred stock, respectively. The Company also issued an additional $50,000,000 of Series A preferred stock for cash pursuant to separate, privately negotiated purchase agreements. Net proceeds from the issuance, net of the cost of an equity call hedge transaction described below and offering expenses, were $26,900,000. The closing of the exchanges and the issuance described above occurred on March 9, 2010 and the Company issued approximately 4,400,000 shares of Series A preferred stock.
Holders may convert the Series A preferred stock at their option, into shares of Class A common stock, at any time. Upon conversion, the holder would receive approximately 3.3 shares of Class A common stock per $50 liquidation preference of Series A preferred stock, based on an initial conversion price of $15.12 per share of Class A common stock, subject to adjustment. The Company may elect to mandatorily convert some or all of the Series A preferred stock if the Daily Volume Weighted Average Price of its Class A common stock equals or exceeds 150% of the initial conversion price then in effect for at least 20 out of 30 consecutive trading days. If the Company elects to mandatorily convert some or all of the Series A preferred stock, the Company must make a dividend make-whole payment on the Series A preferred stock equal to the total value of the aggregate amount of dividends that would have accrued and become payable from March 2010 to March 2013, less any dividends already paid on the Series A preferred stock. The dividend make-whole payment is payable in cash or shares of the Company’s Class A common stock, or a combination thereof, at the Company’s option. In the event the Company does not declare and pay a Series A preferred stock dividend on a quarterly dividend payment date, as set forth in the Amended Articles of Incorporation of the Company, then such dividend shall accrue on a daily basis and accumulate to the extent not paid on such date, and the conversion rate of the Series A preferred stock will be subject to adjustment. In addition, the holders of the Series A preferred stock are entitled to elect one additional Director of the Company if dividends payable on such preferred stock are in arrears for eight consecutive or non-consecutive quarterly periods.
138
Forest City Enterprises, Inc. and Subsidiaries
Notes to Consolidated Financial Statements
V.Capital Stock (continued)
In connection with the exchanges and issuance described above, the Company entered into equity call hedge transactions. The equity call hedge transactions are intended to reduce, subject to a limit, the potential dilution of the Company’s Class A common stock upon conversion of the Series A preferred stock. The net effect of the equity call hedge transactions, from the Company’s perspective, is to approximate an effective conversion price of $18.27 per share. The terms of the Series A preferred stock are not affected by the equity call hedge transactions.
The Company declared and paid Series A preferred stock dividends of $15,400,000 and $11,807,000 during the year ended January 31, 2012 and 2011, respectively, to preferred shareholders. Undeclared Series A preferred stock dividends were approximately $1,925,000 at January 31, 2012. Effective February 1, 2012, the Company’s Board of Directors declared cash dividends on the outstanding shares of Series A preferred stock dividends of approximately $3,850,000 for the period from December 15, 2011 to March 14, 2012 to shareholders of record at the close of business on March 1, 2012, which will be paid on March 15, 2012.
In June 2010, the shareholders of the Company approved increasing the number of authorized shares of preferred stock to 20,000,000 shares.
139
Forest City Enterprises, Inc. and Subsidiaries
Quarterly Consolidated Financial Data (Unaudited)
Revenues from real estate operations and earnings (loss) before income taxes have been reclassified for consolidated operating properties disposed of and included in discontinued operations. The following quarterly consolidated financial data for each of the first three quarters of the year ended January 31, 2012 and the third quarter ended October 31, 2010 have been revised to reflect the correction of the error described in Note A.
| | | | | | | | | | | | | | | | | | | | | | | | | | | | |
| | | Quarter Ended | |
| | | January 31, 2012 | | | October 31,
2011 | | | July 31,
2011 | | | April 30,
2011 | |
| | | | As Reported | | | As Revised | | | As Reported | | | As Revised | | | As Reported | | | As Revised | |
| | |
| | | (in thousands, except per share data) | | | | |
Revenues from real estate operations | | $ | 281,249 | | | $ | 257,015 | | | $ | 257,015 | | | $ | 246,559 | | | $ | 246,559 | | | $ | 305,154 | | | $ | 305,154 | |
Earnings (loss) before income taxes | | $ | (132,245 | ) | | $ | (1,052 | ) | | $ | 948 | | | $ | (19,681 | ) | | $ | (17,681 | ) | | $ | 40,591 | | | $ | 38,591 | |
Net earnings (loss) attributable to Forest City Enterprises, Inc. common shareholders | | $ | (109,236 | ) | | $ | (41,875 | ) | | $ | (40,651 | ) | | $ | 4,284 | | | $ | 5,508 | | | $ | 43,717 | | | $ | 42,493 | |
Basic net earnings (loss) attributable to Forest City Enterprises, Inc. common shareholders per common share(1) | | $ | (0.65 | ) | | $ | (0.25 | ) | | $ | (0.24 | ) | | $ | 0.02 | | | $ | 0.03 | | | $ | 0.26 | | | $ | 0.25 | |
Diluted net earnings (loss) attributable to Forest City Enterprises, Inc. common shareholders per common share(1) | | $ | (0.65 | ) | | $ | (0.25 | ) | | $ | (0.24 | ) | | $ | 0.02 | | | $ | 0.03 | | | $ | 0.24 | | | $ | 0.23 | |
| | | | | | | | | | | | | | | | | | | | |
| | | Quarter Ended | |
| | | January 31,
2011 | | | October 31,
2010 | | | July 31,
2010 | | | April 30,
2010 | |
| | | | As
Reported | | | As
Revised | | | |
| | |
| | | (in thousands, except per share data) | |
| | | | | |
Revenues from real estate operations | | $ | 280,147 | | | $ | 282,806 | | | $ | 282,806 | | | $ | 290,029 | | | $ | 264,667 | |
Earnings (loss) before income taxes | | $ | (37,040 | ) | | $ | (4,887 | ) | | $ | (5,887 | ) | | $ | 256,533 | | | $ | (14,124 | ) |
Net earnings (loss) attributable to Forest City Enterprises, Inc. common shareholders | | $ | (5,683 | ) | | $ | (50,641 | ) | | $ | (51,253 | ) | | $ | 118,739 | | | $ | (15,562 | ) |
Basic net earnings (loss) attributable to Forest City Enterprises, Inc. common shareholders per common share(1) | | $ | (0.04 | ) | | $ | (0.33 | ) | | $ | (0.33 | ) | | $ | 0.74 | | | $ | (0.10 | ) |
Diluted net earnings (loss) attributable to Forest City Enterprises, Inc. common shareholders per common share(1) | | $ | (0.04 | ) | | $ | (0.33 | ) | | $ | (0.33 | ) | | $ | 0.62 | | | $ | (0.10 | ) |
| | (1) | The Company’s restricted stock is considered a participating security pursuant to the two-class method for computing basic earnings per share (“EPS”). The Class A Common Units are considered convertible participating securities as they are entitled to participate in any dividends paid to the Company’s common shareholders. The Class A Common Units are included in the computation of basic EPS using the two-class method and are included in the computation of diluted EPS using the if-converted method. Basic EPS is computed by dividing net earnings less the allocable undistributed earnings of all participating securities by the weighted average number of common shares outstanding during the period. Diluted EPS includes the effect of applying the if-converted method to the Class A Common Units, convertible debt securities, convertible preferred stock and the potential dilutive effect of the Company’s stock plan by adjusting the denominator using the treasury stock method. The sum of the four quarters’ EPS may not equal the annual EPS due to the weighting of stock and option activity occurring during the year and the exclusion of dilutive securities from the computation during loss periods. |
140
Item 9. Changes In and Disagreements With Accountants on Accounting and Financial Disclosure
None.
Item 9A. Controls and Procedures
DISCLOSURE CONTROLS
The Company maintains a set of disclosure controls and procedures designed to ensure that information required to be disclosed by the Company in reports that it files or furnishes under the Securities Exchange Act of 1934 (“Securities Exchange Act”) is recorded, processed, summarized and reported within the time periods specified in Securities and Exchange Commission rules and forms and that such information is accumulated and communicated to the Company’s management, including the Chief Executive Officer (“CEO”) and Chief Financial Officer (“CFO”), as appropriate, to allow timely decisions regarding required disclosure. As of the end of the period covered by this annual report, an evaluation of the effectiveness of the Company’s disclosure controls and procedures, as defined in Rule 13a-15(e) under the Securities Exchange Act, was carried out under the supervision and with the participation of the Company’s management, which includes the CEO and CFO. Based on that evaluation, the CEO and CFO have concluded that the Company’s disclosure controls and procedures were effective as of January 31, 2012.
In connection with the rules, the Company continues to review and document its disclosure controls and procedures, including the Company’s internal control over financial reporting, and may from time to time make changes aimed at enhancing their effectiveness and ensuring that the Company’s systems evolve with the business.
Management’s Report on Internal Control Over Financial Reporting
Our management is responsible for establishing and maintaining adequate internal control over financial reporting. Internal control over financial reporting is a process designed by, or under the supervision of the President and CEO and CFO, and effected by our board of directors, management and other personnel, to provide reasonable assurance regarding the reliability of financial reporting and the preparation of financial statements for external purposes in accordance with generally accepted accounting principles, and includes those policies and procedures that:
| (1) | Pertain to the maintenance of records that in reasonable detail accurately and fairly reflect the transactions involving our assets; |
| (2) | Provide reasonable assurance that transactions are recorded as necessary to permit preparation of financial statements in accordance with generally accepted accounting principles, and that our receipts and expenditures are being made only in accordance with authorizations of our management and directors; and |
| (3) | Provide reasonable assurance regarding prevention or timely detection of unauthorized acquisition, use or disposition of our assets that could have a material effect on our consolidated financial statements. |
Because of its inherent limitations, internal control over financial reporting may not prevent or detect misstatements. Also, projections of any evaluation of effectiveness to future periods are subject to the risk that controls may become inadequate because of changes in conditions, or that the degree of compliance with the policies or procedures may deteriorate.
Our management has used the framework set forth in the report entitled “Internal Control – Integrated Framework” published by the Committee of Sponsoring Organizations of the Treadway Commission (COSO) to evaluate the effectiveness of our internal control over financial reporting. Based on our evaluation under the framework in “Internal Control – Integrated Framework,” our management has concluded that our internal control over financial reporting was effective as of January 31, 2012.
The effectiveness of our internal control over financial reporting as of January 31, 2012 has been audited by our independent registered public accounting firm, PricewaterhouseCoopers LLP, as stated in their report, which appears on page 82 of this Annual Report on Form 10-K.
141
Changes in Internal Control over Financial Reporting
In connection with the evaluation required by Rule 13a-15(d) under the Securities Exchange Act, the Company’s management, including the CEO and CFO, concluded that there were no changes in the Company’s internal control over financial reporting, as defined in Rule 13a-15(f) under the Securities Exchange Act, that occurred during the Company’s most recently completed fiscal quarter that have materially affected, or are reasonably likely to materially affect, the Company’s internal control over financial reporting.
Respectfully,
|
| /s/ David J. LaRue |
David J. LaRue President and Chief Executive Officer |
|
| /s/ Robert G. O’Brien |
Robert G. O’Brien Executive Vice President and Chief Financial Officer |
142
Item 9B. Other Information
None.
PART III
Item 10. Directors, Executive Officers and Corporate Governance
| (a) | Information about our Directors will be contained in the “Election of Directors” section of the definitive proxy statement, to be filed in connection with the annual meeting of shareholders to be held on June 13, 2012, and is incorporated herein by reference. |
| (b) | Pursuant to General Instruction G of Form 10-K and Item 401(b) of Regulation S-K, information about Executive Officers of the Company is reported in Part I of this Annual Report on Form 10-K. |
| (c) | The disclosure of delinquent filers, if any, under Section 16(a) of the Securities Exchange Act of 1934 will be contained in the “Section 16(a) Beneficial Ownership Reporting/Compliance” section of the definitive proxy statement, to be filed in connection with the annual meeting of shareholders to be held on June 13, 2012, and is incorporated herein by reference. |
The Company has a separately-designated standing audit committee. Information about the Company’s audit committee and the audit committee financial expert will be contained in the “Meetings and Committees of the Board of Directors” section of the definitive proxy statement, to be filed in connection with the annual meeting of shareholders to be held on June 13, 2012, and are incorporated herein by reference.
The Company’s Code of Legal and Ethical Conduct can be found on the Company’s website at www.forestcity.net under “Investors - Corporate Governance” and is also available in print, free of charge, to any shareholder upon written request addressed to Corporate Secretary, Forest City Enterprises, Inc., Suite 1360, 50 Public Square, Cleveland, Ohio 44113. Additional information about the Company’s Code of Legal and Ethical Conduct will be contained in the “Corporate Governance” section of the definitive proxy statement, to be filed in connection with the annual meeting of shareholders to be held on June 13, 2012, and is incorporated herein by reference. The Company intends to disclose on its website any amendment to, or waiver of, any provision of this code applicable to its directors and executive officers that would otherwise be required to be disclosed under the rules of the SEC or New York Stock Exchange.
Item 11. Executive Compensation
The information required by this item will be contained in the “Director Compensation,” “Compensation Committee Interlocks and Insider Participation,” “Compensation Discussion & Analysis,” “Potential Payments Upon Termination” and “Executive Compensation Tables” sections of the definitive proxy statement, to be filed in connection with the annual meeting of shareholders to be held on June 13, 2012, and is incorporated herein by reference.
Item 12. Security Ownership of Certain Beneficial Owners and Management and Related Stockholder Matters
The information required by this item will be contained in the “Election of Directors,” “Principal Security Holders” and “Equity Compensation Plan Information” sections of the definitive proxy statement, to be filed in connection with the annual meeting of shareholders to be held on June 13, 2012 and is incorporated herein by reference.
Item 13. Certain Relationships and Related Transactions, and Director Independence
The information required by this item will be contained in the “Corporate Governance – Independence Determinations” and “Certain Relationships and Related Transactions” sections of the definitive proxy statement, to be filed in connection with the annual meeting of shareholders to be held on June 13, 2012, and is incorporated herein by reference.
Item 14. Principal Accountant Fees and Services
The information required by this item will be contained in the “Independent Registered Public Accounting Firm Fees and Services” section of the definitive proxy statement, to be filed in connection with the annual meeting of shareholders to be held on June 13, 2012, and is incorporated herein by reference.
143
PART IV
Item 15. Exhibits and Financial Statements Schedules
| | (a) | List of Documents filed as part of this report. |
| | 1. | Financial statements and supplementary data included in Part II, Item 8: |
Report of Independent Registered Public Accounting Firm
Consolidated Balance Sheets – January 31, 2012 and 2011
Consolidated Statements of Operations for the years ended January 31, 2012, 2011 and 2010
Consolidated Statements of Comprehensive Income (Loss) for the years ended January 31, 2012, 2011 and 2010
Consolidated Statements of Shareholders’ Equity for the years ended January 31, 2012, 2011 and 2010
Consolidated Statements of Cash Flows for the years ended January 31, 2012, 2011 and 2010
Notes to Consolidated Financial Statements
Supplementary Data – Quarterly Consolidated Financial Data (Unaudited)
| | 2. | Financial statements and schedules required by Part II, Item 8 are included in Part IV, Item 15(c): |
| | | | |
| | | Page No. | |
Schedule II – Valuation and Qualifying Accounts for the years ended January 31, 2012, 2011 and 2010 | | | 150 | |
Schedule III – Real Estate and Accumulated Depreciation at January 31, 2012 with reconciliations for the years ended January 31, 2012, 2011 and 2010 | | | 151 | |
Schedules other than those listed above are omitted for the reason that they are not required or are not applicable, or the required information is shown in the consolidated financial statements or notes thereto. Columns omitted from schedules filed have been omitted because the information is not applicable.
| | 3. | Exhibits – see (b) starting on page 145. |
144
(b) Exhibits
| | | | |
Exhibit
Number | | | | Description of Document |
| | |
3.1 | | - | | Amended Articles of Incorporation of Forest City Enterprises, Inc., restated effective October 1, 2008, incorporated by reference to Exhibit 3.1 to the Company’s Form 10-Q for the quarter ended October 31, 2008 (File No. 1-4372). |
| | |
3.1.1 | | - | | Certificate of Amendment by Directors to the Amended Articles of Incorporation of Forest City Enterprises, Inc. dated March 4, 2010 (setting forth Section C(2), Article IV, Preferred Stock Designation of the Series A Cumulative Perpetual Convertible Preferred Stock), incorporated by reference to Exhibit 3.1 to the Company’s Form 8-K filed on March 9, 2010 (File No. 1-4372). |
| | |
3.1.2 | | - | | Certificate of Amendment by Shareholders to the Amended Articles of Incorporation of Forest City Enterprises, Inc. dated June 25, 2010, incorporated by reference to Exhibit 3.3 to the Company’s Form 10-Q for the quarter ended July 31, 2010 (File No. 1-4372). |
| | |
3.2 | | - | | Code of Regulations as amended August 11, 2010 (Corrected), incorporated by reference to Exhibit 3.1 to the Company’s Form 10-Q for the quarter ended October 31, 2011 (File No. 1-4372). |
| | |
4.1 | | - | | Senior Note Indenture, dated as of May 19, 2003, between Forest City Enterprises, Inc., as issuer, and The Bank of New York, as trustee, incorporated by reference to Exhibit 4.1 to the Company’s Form 8-K filed on May 20, 2003 (File No. 1-4372). |
| | |
4.2 | | - | | Form of 7.625% Senior Note due 2015, incorporated by reference to Exhibit 4.2 to the Company’s Form 8-K filed on May 20, 2003 (File No. 1-4372). |
| | |
4.3 | | - | | Form of 7.375% Senior Note due 2034, incorporated by reference to Exhibit 4.2 to the Company’s Registration Statement on Form 8-A filed on February 10, 2004 (File No. 1-4372). |
| | |
4.4 | | - | | Form of 6.50% Senior Note due 2017, incorporated by reference to Exhibit 4.2 to the Company’s Form 8-K filed on January 26, 2005 (File No. 1-4372). |
| | |
4.5 | | - | | Indenture, dated as of October 7, 2009, between Forest City Enterprises, Inc., as issuer, and The Bank of New York Mellon Trust Company, N.A., as trustee, including as Exhibit A thereto, the Form of 3.625% Puttable Equity-Linked Senior Note due 2014, incorporated by reference to Exhibit 4.6 to the Company’s Form 10-Q for the quarter ended October 31, 2009 (File No. 1-4372). |
| | |
4.5.1 | | - | | First Supplemental Indenture, dated as of May 21, 2010, between Forest City Enterprises, Inc., as issuer, and The Bank of New York Mellon Trust Company, N.A., as trustee, supplemental to Indenture dated as of October 7, 2009, incorporated by reference to Exhibit 4.1 to the Company’s Form 8-K filed on May 26, 2010 (File No. 1-4372). |
| | |
4.6 | | - | | Indenture, dated as of October 26, 2009, between Forest City Enterprises, Inc., as issuer, and The Bank of New York Mellon Trust Company, N.A., as trustee, including as Exhibit A thereto, the Form of 5.00% Convertible Senior Note due 2016, incorporated by reference to Exhibit 4.1 to the Company’s Form 8-K filed on October 26, 2009 (File No. 1-4372). |
| | |
4.7 | | - | | Indenture, dated as of July 9, 2011, between Forest City Enterprises, Inc., an issuer, and The Bank of New York Mellon Company Trust Company, N.A., as trustee, including, as Exhibit A thereto, the Form of 4.25% Convertible Senior Note due 2018, incorporated by reference to Exhibit 4.1 to the Company’s Form 8-K filed on July 19, 2011 (File No. 1-4372). |
| | |
9.1 | | - | | Voting Agreement, dated November 8, 2006, by and among Forest City Enterprises, Inc., RMS Limited Partnership, Powell Partners, Limited, Joseph M. Shafran and Bruce C. Ratner, incorporated by reference to Exhibit 9.1 to the Company’s Form 10-K for the year ended January 31, 2007 (File No. 1-4372). |
| | |
+10.1 | | - | | Dividend Reinvestment and Stock Purchase Plan, incorporated by reference to Exhibit 10.1 to the Company’s Form 10-Q for the quarter ended October 31, 2009 (File No. 1-4372). |
145
| | | | |
Exhibit
Number | | | | Description of Document |
| | |
+10.2 | | - | | Supplemental Unfunded Deferred Compensation Plan for Executives, incorporated by reference to Exhibit 10.9 to the Company’s Form 10-K for the year ended January 31, 1997 (File No. 1-4372). |
| | |
+10.3 | | - | | Deferred Compensation Plan for Executives, effective as of January 1, 1999, incorporated by reference to Exhibit 10.43 to the Company’s Form 10-K for the year ended January 31, 1999 (File No. 1-4372). |
| | |
+10.3.1 | | - | | First Amendment to the Deferred Compensation Plan for Executives, effective as of October 1, 1999, incorporated by reference to Exhibit 10.45 to the Company’s Form 10-Q for the quarter ended April 30, 2005 (File No. 1-4372). |
| | |
+10.3.2 | | - | | Second Amendment to the Deferred Compensation Plan for Executives, effective as of December 31, 2004, incorporated by reference to Exhibit 10.46 to the Company’s Form 10-Q for the quarter ended April 30, 2005 (File No. 1-4372). |
| | |
+10.4 | | - | | Forest City Enterprises, Inc. 2005 Deferred Compensation Plan for Executives (As Amended and Restated Effective January 1, 2008), incorporated by reference to Exhibit 10.21 to the Company’s Form 10-K for the year ended January 31, 2008 (File No. 1-4372). |
| | |
+10.4.1 | | - | | First Amendment to Forest City Enterprises, Inc. 2005 Deferred Compensation Plan for Executives (As Amended and Restated Effective January 1, 2008), effective as of December 17, 2009, incorporated by reference to Exhibit 10.7 to the Company’s Form 10-K for the year ended January 31, 2010 (File No. 1-4372). |
| | |
+10.5 | | - | | Deferred Compensation Plan for Nonemployee Directors, effective as of January 1, 1999, incorporated by reference to Exhibit 10.44 to the Company’s Form 10-K for the year ended January 31, 1999 (File No. 1-4372). |
| | |
+10.5.1 | | - | | First Amendment to the Deferred Compensation Plan for Nonemployee Directors, effective October 1, 1999, incorporated by reference to Exhibit 4.6 to the Company’s Registration Statement on Form S-8 (Registration No. 333-38912). |
| | |
+10.5.2 | | - | | Second Amendment to the Deferred Compensation Plan for Nonemployee Directors, effective March 10, 2000, incorporated by reference to Exhibit 4.7 to the Company’s Registration Statement on Form S-8 (Registration No. 333-38912). |
| | |
+10.5.3 | | - | | Third Amendment to the Deferred Compensation Plan for Nonemployee Directors, effective March 12, 2004, incorporated by reference to Exhibit 10.39 to the Company’s Form 10-Q for the quarter ended July 31, 2004 (File No. 1-4372). |
| | |
+10.5.4 | | - | | Fourth Amendment to the Deferred Compensation Plan for Nonemployee Directors, effective as of December 31, 2004, incorporated by reference to Exhibit 10.47 to the Company’s Form 10-Q for the quarter ended April 30, 2005 (File No. 1-4372). |
| | |
+10.5.5 | | - | | Fifth Amendment to the Deferred Compensation Plan for Nonemployee Directors, effective as of March 26, 2008, incorporated by reference to Exhibit 10.60 to the Company’s Form 10-K for the year ended January 31, 2008 (File No. 1-4372). |
| | |
+10.5.6 | | - | | Sixth Amendment to Deferred Compensation Plan for Nonemployee Directors, effective as of December 17, 2009, incorporated by reference to Exhibit 10.14 to the Company’s Form 10-K for the year ended January 31, 2010 (File No. 1-4372). |
| | |
+10.6 | | - | | Forest City Enterprises, Inc. 2005 Deferred Compensation Plan for Nonemployee Directors (As Amended and Restated effective January 1, 2008), incorporated by reference to Exhibit 10.60 to the Company’s Form 10-Q for the quarter ended April 30, 2008 (File No. 1-4372). |
| | |
+10.6.1 | | - | | First Amendment to Forest City Enterprises, Inc. 2005 Deferred Compensation Plan for Nonemployee Directors (As Amended and Restated effective January 1, 2008), effective December 17, 2009, incorporated by reference to Exhibit 10.16 to the Company’s Form 10-K for the year ended January 31, 2010 (File No. 1-4372). |
| | |
+10.7 | | - | | Forest City Enterprises, Inc. Executive Short-Term Incentive Plan (As Amended and Restated as of June 19, 2008), incorporated by reference to Exhibit 10.2 to the Company’s Form 8-K filed on June 24, 2008 (File No. 1-4372). |
146
| | | | |
Exhibit
Number | | | | Description of Document |
| | |
+10.8 | | - | | Forest City Enterprises, Inc. Executive Long-Term Incentive Plan (As Amended and Restated as of June 19, 2008), incorporated by reference to Exhibit 10.3 to the Company’s Form 8-K filed on June 24, 2008 (File No. 1-4372). |
| | |
+10.9 | | - | | Forest City Enterprises, Inc. Senior Management Short-Term Incentive Plan (Effective February 1, 2008), incorporated by reference to Exhibit 10.4 to the Company’s Form 8-K filed on June 24, 2008 (File No. 1-4372). |
| | |
+10.10 | | - | | Forest City Enterprises, Inc. Senior Management Long-Term Incentive Plan (Effective February 1, 2008), incorporated by reference to Exhibit 10.5 to the Company’s Form 8-K filed on June 24, 2008 (File No. 1-4372). |
| | |
+10.11 | | - | | Forest City Enterprises, Inc. Amended Board of Directors Compensation Policy, effective February 1, 2008, incorporated by reference to Exhibit 10.33 to the Company’s Form 10-K for the year ended January 31, 2008 (File No. 1-4372). |
| | |
+10.12 | | - | | Forest City Enterprises, Inc. Unfunded Nonqualified Supplemental Retirement Plan for Executives (As Amended and Restated Effective January 1, 2008), incorporated by reference to Exhibit 10.59 to the Company’s Form 10-K for the year ended January 31, 2008 (File No. 1-4372). |
| | |
+10.13 | | - | | Amended and Restated Form of Incentive and Nonqualified Stock Option Agreement, effective as of March 25, 2010, incorporated by reference to Exhibit 10.23 to the Company’s Form 10-K for the year ended January 31, 2010 (File No. 1-4372). |
| | |
+10.14 | | - | | Amended and Restated Form of Restricted Stock Agreement, effective as of March 25, 2010, incorporated by reference to Exhibit 10.24 to the Company’s Form 10-K for the year ended January 31, 2010 (File No. 1-4372). |
| | |
+10.15 | | - | | Form of Forest City Enterprises, Inc. Performance Shares Agreement, incorporated by reference to Exhibit 10.6 to the Company’s Form 8-K filed on June 24, 2008 (File No. 1-4372). |
| | |
+10.16 | | - | | Form of Forest City Enterprises, Inc. Nonqualified Stock Option Agreement for Nonemployee Directors, incorporated by reference to Exhibit 10.66 to the Company’s Form 10-Q for the quarter ended July 31, 2008 (File No. 1-4372). |
| | |
+10.17 | | - | | Form of Forest City Enterprises, Inc. Restricted Shares Agreement for Nonemployee Directors, incorporated by reference to Exhibit 10.67 to the Company’s Form 10-Q for the quarter ended July 31, 2008 (File No. 1-4372). |
| | |
+10.18 | | - | | Forest City Enterprises, Inc. 1994 Stock Plan (As Amended and Restated as of June 16, 2010), incorporated by reference to Exhibit 10.28 to the Company’s Form 10-Q for the quarter ended July 31, 2010 (File No. 1-4372). |
| | |
+10.19 | | - | | Employment Agreement, dated September 22, 2011, by and among Forest City Enterprises, Inc. and David J. LaRue, incorporated by reference to Exhibit 10.1 to the Company’s Form 8-K filed on September 26, 2011 (File No. 1-4372). |
| | |
+10.20 | | - | | Agreement regarding death benefits entered into on May 31, 1999, between Forest City Enterprises, Inc. and David J. LaRue, incorporated by reference to Exhibit 10.3 to the Company’s Form 10-Q for the quarter ended October 31, 2011 (File No. 1-4372). |
| | |
+10.21 | | - | | Employment Agreement, dated September 22, 2011, by and among Forest City Enterprises, Inc. and Robert G. O’Brien, incorporated by reference to Exhibit 10.2 to the Company’s Form 8-K filed on September 26, 2011 (File No. 1-4372). |
| | |
+10.22 | | - | | Agreement regarding death benefits entered into on May 31, 1999, between Forest City Enterprises, Inc. and Robert G. O’Brien, incorporated by reference to Exhibit 10.29 to the Company’s Form 10-Q for the quarter ended April 30, 2009 (File No. 1-4372). |
| | |
+10.23 | | - | | Employment Agreement entered into on July 20, 2005, effective February 1, 2005, between Forest City Enterprises, Inc. and Charles A. Ratner, incorporated by reference to Exhibit 10.1 to the Company’s Form 8-K filed on July 26, 2005 (File No. 1-4372). |
147
| | | | |
Exhibit
Number | | | | Description of Document |
| | |
| +10.23.1 | | - | | First Amendment to Employment Agreement, dated as of November 9, 2006, by and among Charles A. Ratner and Forest City Enterprises, Inc., incorporated by reference to Exhibit 10.2 to the Company’s Form 8-K filed on November 13, 2006 (File No. 1-4372). |
| | |
| +10.24 | | - | | Employment Agreement entered into on July 20, 2005, effective February 1, 2005, between Forest City Enterprises, Inc. and James A. Ratner, incorporated by reference to Exhibit 10.2 to the Company’s Form 8-K filed on July 26, 2005 (File No. 1-4372). |
| | |
| +10.24.1 | | - | | First Amendment to Employment Agreement, dated as of November 9, 2006, by and among James A. Ratner and Forest City Enterprises, Inc, incorporated by reference to Exhibit 10.3 to the Company’s Form 8-K filed on November 13, 2006 (File No. 1-4372). |
| | |
| +10.25 | | - | | Employment Agreement entered into on July 20, 2005, effective February 1, 2005, between Forest City Enterprises, Inc. and Ronald A. Ratner, incorporated by reference to Exhibit 10.3 to the Company’s Form 8-K filed on July 26, 2005 (File No. 1-4372). |
| | |
| +10.25.1 | | - | | First Amendment to Employment Agreement, dated as of November 9, 2006, by and among Ronald A. Ratner and Forest City Enterprises, Inc., incorporated by reference to Exhibit 10.4 to the Company’s Form 8-K filed on November 13, 2006 (File No. 1-4372). |
| | |
| +10.26 | | - | | Employment Agreement, effective November 9, 2006, by and among Bruce C. Ratner and Forest City Enterprises, Inc., incorporated by reference to Exhibit 10.1 to the Company’s Form 8-K filed on November 13, 2006 (File No. 1-4372). |
| | |
| 10.27 | | - | | Master Contribution and Sale Agreement, dated as of August 10, 2006, by and among Forest City Enterprises, Inc., certain entities affiliated with Forest City Enterprises, Inc., Forest City Master Associates III, LLC, certain entities affiliated with Forest City Master Associates III, LLC, certain entities affiliated with Bruce C. Ratner and certain individuals affiliated with Bruce C. Ratner, incorporated by reference to Exhibit 10.37 to the Company’s Form 10-Q for the quarter ended July 31, 2009 (File No. 1-4372). Portions of this exhibit have been omitted pursuant to a request for confidential treatment. |
| | |
| 10.28 | | - | | Registration Rights Agreement by and among Forest City Enterprises, Inc. and the holders of BCR Units listed on Schedule A thereto dated November 8, 2006, incorporated by reference to Exhibit 10.1 to the Company’s Registration Statement on Form S-3 filed on November 7, 2007 (Registration No. 333-147201). |
| | |
| 10.29 | | - | | Third Amended and Restated Credit Agreement, dated as of March 30, 2011, by and among Forest City Rental Properties Corporation, as Borrower, KeyBank National Association, as Administrative Agent, PNC Bank, National Association, as Syndication Agent, Bank of America, N.A., as Documentation Agent and the banks named therein, incorporated by reference to Exhibit 10.1 to the Company’s Form 8-K filed on April 5, 2011 (File No. 1-4372). |
| | |
| 10.29.1 | | - | | Increase notice, dated as of April 21, 2011, pursuant to the third Amended and Restated Credit Agreement, dated as of March 30, 2011, by and among Forest City Rental Properties Corporation, as Borrower, KeyBank National Association, as Administrative Agent, PNC Bank, National Association, as Syndication Agent, Bank of America, N.A., as Document Agent and the banks named therein, incorporated by reference to Exhibit 10.28.1 to the Company’s Form 10-Q for the quarter ended April 30, 2011 (File No. 1-4372). |
| | |
| 10.30 | | - | | Third Amended and Restated Guaranty of Payment of Debt, dated as of March 30, 2011, by and among Forest City Enterprises, Inc., as Guarantor, KeyBank National Association, as Administrative Agent, PNC Bank, National Association, as Syndication Agent, Bank of America, N.A., as Documentation Agent and the banks named therein, incorporated by reference to Exhibit 10.2 to the Company’s Form 8-K filed on April 5, 2011 (File No. 1-4372). |
| | |
| 10.31 | | - | | First Amendment to the Third Amended and Restated Credit Agreement and Third Amended and Restated Guaranty of Payment of Debt, dated as of July 13, 2011, by and among Forest City Rental Properties Corporation, Forest City Enterprises, Inc., KeyBank National Association, as Administrative Agent, PNC Bank National Association, as Syndication Agent, Bank of America, N.A., as Documentation Agent, and the banks named therein, incorporated by reference to Exhibit 10.1 to the Company’s Form 8-K filed on July 13, 2011 (File No. 1-4372). |
148
| | | | |
Exhibit
Number | | | | Description of Document |
| | |
| 10.32 | | - | | Pledge Agreement, dated as of January 29, 2010, by Forest City Rental Properties Corporation, Forest City Enterprises, Inc., KeyBank National Association, as Agent for itself and the other banks, incorporated by reference to Exhibit 10.2 to the Company’s Form 8-K filed on February 4, 2010 (File No. 1-4372). |
| | |
| 10.32.1 | | - | | First Amendment to Pledge Agreement, dated as of March 30, 2011, by Forest City Rental Properties Corporation, Forest City Enterprises, Inc., KeyBank National Association, as Agent for itself and the other banks, incorporated by reference to Exhibit 10.3 to the Company’s Form 8-K filed on April 5, 2011 (File No. 1-4372). |
| | |
| 10.33 | | - | | Form of Exchange Agreement, pertaining to 5.00% Convertible Senior Note due 2016, incorporated by reference to Exhibit 10.1 to the Company’s Form 8-K filed on January 27, 2011 (File No. 1-4372). |
| | |
| 10.34 | | - | | Form of Exchange Agreement, pertaining to 5.00% Convertible Senior Note due 2016, incorporated by reference to Exhibit 10.1 to the Company’s Form 8-K filed on May 5, 2011 (File No. 1-4372). |
| | |
| *21 | | - | | Subsidiaries of the Registrant. |
| | |
| *23 | | - | | Consent of PricewaterhouseCoopers LLP. |
| | |
| *24 | | - | | Powers of attorney. |
| | |
| *31.1 | | - | | Principal Executive Officer’s Certification pursuant to Section 302 of the Sarbanes-Oxley Act of 2002. |
| | |
| *31.2 | | - | | Principal Financial Officer’s Certification pursuant to Section 302 of the Sarbanes-Oxley Act of 2002. |
| | |
| *32.1 | | - | | Certification pursuant to 18 U.S.C. Section 1350, as adopted pursuant to Section 906 of the Sarbanes-Oxley Act of 2002. |
| | |
| *99.1 | | - | | Nets Sports and Entertainment, LLC and Subsidiaries Consolidated Balance Sheet at June 30, 2010, and Consolidated Statement of Operations, Consolidated Statement of Members’ Equity, and Consolidated Statement of Cash Flows for the fiscal year then ended, including the Notes thereto. |
| | |
| **101 | | - | | The following financial information from Forest City Enterprises, Inc.’s Annual Report on Form 10-K for the year ended January 31, 2012, formatted in XBRL (eXtensible Business Reporting Language): (i) Consolidated Balance Sheets; (ii) Consolidated Statements of Operations; (iii) Consolidated Statements of Comprehensive Income (Loss); (iv) Consolidated Statements of Equity; (v) Consolidated Statements of Cash Flows, and (vi) Notes to Consolidated Financial Statements. |
| + | Management contract or compensatory arrangement required to be filed as an exhibit to this Form 10-K pursuant to Item 6. |
| ** | Submitted electronically herewith. In accordance with Rule 406T of Regulation S-T, the XBRL related information in Exhibit 101 to this Annual Report on Form 10-K shall not be deemed to be “filed” for purposes of Section 18 of the Exchange Act, or otherwise subject to the liability of that section, and shall not be part of any registration or other document filed under the Securities Act or the Exchange Act, except as shall be expressly set forth by specific reference in such filing. |
149
Item 15. Financial Statements Schedules
(c) Financial Statements Schedules
SCHEDULE VALUATION AND QUALIFYING ACCOUNTSSCHEDULE II – VALUATION AND QUALIFYING ACCOUNTS
| | | | | | | | | | | | | | | | |
| Description | | Balance at
Beginning
of Period | | | Additions
Charged to
Costs and
Expenses | | | Deductions | | | Balance at
End of
Period | |
| | | (in thousands) | |
| | | | |
Allowance for doubtful accounts and notes receivable | | | | | | | | | | | | | | | | |
January 31, 2012 | | $ | 31,192 | | | $ | 5,439 | | | $ | 10,756 | | | $ | 25,875 | |
January 31, 2011 | | $ | 33,825 | | | $ | 7,242 | | | $ | 9,875 | | | $ | 31,192 | |
January 31, 2010 | | $ | 27,213 | | | $ | 12,977 | | | $ | 6,365 | | | $ | 33,825 | |
| | | | |
Valuation reserve on other investments | | | | | | | | | | | | | | | | |
January 31, 2012 | | $ | 4,881 | | | $ | 287 | | | $ | - | | | $ | 5,168 | |
January 31, 2011 | | $ | 4,820 | | | $ | 61 | | | $ | - | | | $ | 4,881 | |
January 31, 2010 | | $ | 5,952 | | | $ | 182 | | | $ | 1,314 | | | $ | 4,820 | |
| | | | |
Valuation allowances for deferred tax assets | | | | | | | | | | | | | | | | |
January 31, 2012 | | $ | 61,744 | | | $ | 1,962 | | | $ | 8,376 | | | $ | 55,330 | |
January 31, 2011 | | $ | 58,396 | | | $ | 8,932 | | | $ | 5,584 | | | $ | 61,744 | |
January 31, 2010 | | $ | 48,155 | | | $ | 13,959 | | | $ | 3,718 | | | $ | 58,396 | |
150
(c) Financial Statements Schedules (continued)
REAL ESTATE AND ACCUMULATED DEPRECIATIONSCHEDULE III – REAL ESTATE AND ACCUMULATED DEPRECIATION
Forest City Enterprises, Inc. and Subsidiaries
| | | | | | | | | | | | | | | | | | | | | | | | | | | | | | | | | | | | | | | | |
| | | | | | | | Initial Cost to Company | | | Cost
Capitalized
Subsequent to
Acquisition | | | Gross Amount at Which Carried at Close of January 31, 2012 | | | Accumulated Depreciation at January 31, 2012 (C) | | | Date of Construction/ Acquisition | | | Range of Lives on
Which Depreciation in Latest Income Statement is Computed |
Name | | Location | | Amount of Encumbrance at January 31, 2012 | | | Land | | | Buildings and Improvements | | | Improvements and Carrying
Costs | | | Land | | | Buildings and Improvements | | | Total (A)(B) | | | | |
| | | | | | | | | | | |
| | | | | | | | | | | |
| | | | | | | | | | | |
Office Buildings and Hotel | | | | | | | | | | | | | | | | | | | | | | | | | | | | | | | | | | | | | | | | |
2 Hanson Place | | Brooklyn, NY | | $ | 105,882 | | | $ | - | | | $ | 108,940 | | | $ | 3,661 | | | $ | - | | | $ | 112,601 | | | $ | 112,601 | | | $ | 16,858 | | | | 2004 | | | (1) |
4930 Oakton | | Skokie, IL | | | - | | | | 670 | | | | 1,842 | | | | 2,554 | | | | 1,081 | | | | 3,985 | | | | 5,066 | | | | 485 | | | | 2006 | | | (1) |
Ballston Common Office Center | | Arlington, VA | | | 44,847 | | | | 7,301 | | | | 45,964 | | | | 4,379 | | | | 7,301 | | | | 50,343 | | | | 57,644 | | | | 7,986 | | | | 2005 | | | (1) |
Colorado Studios | | Denver, CO | | | - | | | | 899 | | | | 1,085 | | | | 49 | | | | 948 | | | | 1,085 | | | | 2,033 | | | | 522 | | | | 2007 | | | (1) |
Commerce Court | | Pittsburgh, PA | | | 25,045 | | | | 3,432 | | | | 20,873 | | | | 1,581 | | | | 3,432 | | | | 22,454 | | | | 25,886 | | | | 5,878 | | | | 2007 | | | (1) |
Edgeworth Building | | Richmond, VA | | | 18,830 | | | | 942 | | | | 29,353 | | | | 894 | | | | 942 | | | | 30,247 | | | | 31,189 | | | | 3,107 | | | | 2006 | | | (1) |
Eleven MetroTech Center | | Brooklyn, NY | | | 61,000 | | | | - | | | | 41,290 | | | | 8,835 | | | | 6,270 | | | | 43,855 | | | | 50,125 | | | | 18,566 | | | | 1995 | | | (1) |
Fairmont Plaza | | San Jose, CA | | | 63,524 | | | | - | | | | 74,624 | | | | 10,234 | | | | 4,065 | | | | 80,793 | | | | 84,858 | | | | 24,512 | | | | 1998 | | | (1) |
Fifteen MetroTech Center | | Brooklyn, NY | | | 250,000 | | | | 3,762 | | | | 163,414 | | | | 8,488 | | | | - | | | | 175,664 | | | | 175,664 | | | | 29,026 | | | | 2003 | | | (1) |
Halle Building | | Cleveland, OH | | | 11,565 | | | | 503 | | | | 9,776 | | | | 60,770 | | | | 4,819 | | | | 66,230 | | | | 71,049 | | | | 35,148 | | | | 1986 | | | (1) |
Harlem Center | | Manhattan, NY | | | 32,108 | | | | - | | | | 31,672 | | | | 8,362 | | | | - | | | | 40,034 | | | | 40,034 | | | | 5,945 | | | | 2003 | | | (1) |
Higbee Building | | Cleveland, OH | | | 14,713 | | | | 2,452 | | | | 21,261 | | | | 58,187 | | | | 4,962 | | | | 76,938 | | | | 81,900 | | | | 9,804 | | | | 1990 | | | (1) |
Illinois Science and Technology Park | | | | | | | | | | | | | | | | | | | | | | | | | | | | | | | | | | | | | | | | |
- 4901 Searle (A) | | Skokie, IL | | | 21,589 | | | | 837 | | | | 16,227 | | | | 4,347 | | | | 1,674 | | | | 19,737 | | | | 21,411 | | | | 2,311 | | | | 2006 | | | (1) |
- 8025 Lamon (P) | | Skokie, IL | | | 5,455 | | | | 978 | | | | 6,426 | | | | 18,627 | | | | 1,957 | | | | 24,074 | | | | 26,031 | | | | 1,988 | | | | 2006 | | | (1) |
- 8030 Lamon (J) | | Skokie, IL | | | - | | | | 1,325 | | | | 17,376 | | | | 19 | | | | 1,325 | | | | 17,395 | | | | 18,720 | | | | 694 | | | | 2010 | | | (1) |
- 8045 Lamon (Q) | | Skokie, IL | | | 18,045 | | | | 3,301 | | | | 21,198 | | | | 28,219 | | | | 6,601 | | | | 46,117 | | | | 52,718 | | | | 4,231 | | | | 2007 | | | (1) |
Johns Hopkins-855 North Wolfe Street | | East Baltimore, MD | | | 70,280 | | | | 7,314 | | | | 76,318 | | | | 8,434 | | | | 7,314 | | | | 84,752 | | | | 92,066 | | | | 6,035 | | | | 2008 | | | (1) |
New York Times | | Manhattan, NY | | | 640,000 | | | | 91,737 | | | | 375,931 | | | | 137,469 | | | | 141,678 | | | | 463,459 | | | | 605,137 | | | | 39,641 | | | | 2007 | | | (1) |
Nine MetroTech Center North | | Brooklyn, NY | | | 63,000 | | | | - | | | | 64,303 | | | | 4,250 | | | | 380 | | | | 68,173 | | | | 68,553 | | | | 20,478 | | | | 1997 | | | (1) |
One MetroTech Center | | Brooklyn, NY | | | 169,231 | | | | - | | | | 212,153 | | | | 49,375 | | | | 23,543 | | | | 237,985 | | | | 261,528 | | | | 94,856 | | | | 1991 | | | (1) |
One Pierrepont Plaza | | Brooklyn, NY | | | 15,864 | | | | - | | | | 86,863 | | | | 91,137 | | | | 558 | | | | 177,442 | | | | 178,000 | | | | 95,450 | | | | 1988 | | | (1) |
Post Office Plaza (MK Ferguson) | | Cleveland, OH | | | 15,500 | | | | - | | | | 57,213 | | | | 23,363 | | | | - | | | | 80,576 | | | | 80,576 | | | | 34,992 | | | | 1990 | | | (1) |
Richmond Office Park | | Richmond, VA | | | 64,189 | | | | 11,766 | | | | 88,632 | | | | 4,876 | | | | 11,766 | | | | 93,508 | | | | 105,274 | | | | 11,098 | | | | 2007 | | | (1) |
Sheraton Station Square Hotel | | Pittsburgh, PA | | | 43,812 | | | | 2,172 | | | | 53,153 | | | | 3,888 | | | | 2,180 | | | | 57,033 | | | | 59,213 | | | | 17,552 | | | | 1998 | | | (1) |
Skylight Office Tower | | Cleveland, OH | | | 28,459 | | | | 2,500 | | | | 32,695 | | | | 32,592 | | | | - | | | | 67,787 | | | | 67,787 | | | | 32,792 | | | | 1991 | | | (1) |
Stapleton-3055 Roslyn | | Denver, CO | | | 4,684 | | | | 225 | | | | 7,523 | | | | 728 | | | | 225 | | | | 8,251 | | | | 8,476 | | | | 868 | | | | 2006 | | | (1) |
Ten MetroTech Center | | Brooklyn, NY | | | 73,500 | | | | 3,680 | | | | 95,234 | | | | 5,350 | | | | 9,265 | | | | 94,999 | | | | 104,264 | | | | 46,948 | | | | 1992 | | | (1) |
Terminal Tower | | Cleveland, OH | | | 35,247 | | | | - | | | | 29,422 | | | | 78,546 | | | | - | | | | 107,968 | | | | 107,968 | | | | 51,241 | | | | 1983 | | | (1) |
Twelve MetroTech Center | | Brooklyn, NY | | | 45,000 | | | | - | | | | 42,344 | | | | 16,141 | | | | 1,847 | | | | 56,638 | | | | 58,485 | | | | 7,646 | | | | 2004 | | | (1) |
Two MetroTech Center | | Brooklyn, NY | | | 63,249 | | | | - | | | | 155,280 | | | | (236 | ) | | | 7,137 | | | | 147,907 | | | | 155,044 | | | | 60,275 | | | | 1990 | | | (1) |
University of Pennsylvania | | Philadelphia, PA | | | 51,615 | | | | - | | | | 41,146 | | | | 10,665 | | | | - | | | | 51,811 | | | | 51,811 | | | | 7,350 | | | | 2004 | | | (1) |
Miscellaneous Investments | | Various | | | 8,355 | | | | 3,815 | | | | 83,375 | | | | 1,398 | | | | 3,982 | | | | 84,606 | | | | 88,588 | | | | 16,708 | | | | Various | | | (1) |
| | | | | | | | | | | | |
Office Buildings and Hotel Subtotal | | $ | 2,064,588 | | | $ | 149,611 | | | $ | 2,112,906 | | | $ | 687,182 | | | $ | 255,252 | | | $ | 2,694,447 | | | $ | 2,949,699 | | | $ | 710,991 | | | | | | | |
151
(c) Financial Statements Schedules (continued)
SCHEDULE III – REAL ESTATE AND ACCUMULATED DEPRECIATION (continued)
Forest City Enterprises, Inc. and Subsidiaries
| | | | | | | | | | | | | | | | | | | | | | | | | | | | | | | | | | | | | | |
| | | | | | | | Initial Cost to Company | | | Cost Capitalized
Subsequent to Acquisition | | | Gross Amount at Which Carried at Close of January 31, 2012 | | | Accumulated
Depreciation
at January 31,
2012 (C) | | | Date of
Construction/
Acquisition | | Range of Lives
on Which Depreciation in Latest
Income
Statement is
Computed |
| Name | | Location | | Amount of
Encumbrance
at January 31,
2012 | | | Land | | | Buildings and
Improvements | | | Improvements
and Carrying
Costs | | | Land | | | Buildings and
Improvements | | | Total
(A)(B) | | | | |
Retail | | | | | | | | | | | | | | | | | | | | | | | | | | | | | | | | | | | | | | |
Antelope Valley Mall | | Palmdale, CA | | $ | 98,641 | | | $ | 1,492 | | | $ | 58,028 | | | $ | 66,615 | | | $ | 10,073 | | | $ | 116,062 | | | $ | 126,135 | | | $ | 36,952 | | | 1999 | | (1) |
Atlantic Center Site V | | Brooklyn, NY | | | 3,782 | | | | - | | | | 3,238 | | | | 1,485 | | | | 1,047 | | | | 3,676 | | | | 4,723 | | | | 1,055 | | | 1998 | | (1) |
Avenue at Tower City Center | | Cleveland, OH | | | 26,492 | | | | - | | | | 174,726 | | | | 24,366 | | | | 176 | | | | 198,916 | | | | 199,092 | | | | 92,337 | | | 1990 | | (1) |
Ballston Common Mall | | Arlington, VA | | | 46,957 | | | | 170 | | | | 18,069 | | | | 66,452 | | | | 442 | | | | 84,249 | | | | 84,691 | | | | 41,289 | | | 1986 | | (1) |
Brooklyn Commons | | Brooklyn, NY | | | 22,716 | | | | - | | | | 23,794 | | | | 1,449 | | | | 19,778 | | | | 5,465 | | | | 25,243 | | | | 1,126 | | | 2004 | | (1) |
Galleria at Sunset | | Henderson, NV | | | 152,015 | | | | 14,965 | | | | 161,893 | | | | - | | | | 30,799 | | | | 146,059 | | | | 176,858 | | | | 34,496 | | | 1996 | | (1) |
Mall at Robinson | | Pittsburgh, PA | | | 79,000 | | | | 5,475 | | | | 101,086 | | | | - | | | | 5,135 | | | | 101,426 | | | | 106,561 | | | | 27,176 | | | 2001 | | (1) |
Northfield at Stapleton | | Denver, CO | | | 43,401 | | | | 4,830 | | | | 80,687 | | | | 83,220 | | | | 24,907 | | | | 143,830 | | | | 168,737 | | | | 20,919 | | | 2005 | | (1) |
Orchard Town Center | | Westminster, CO | | | 62,856 | | | | 31,129 | | | | 99,139 | | | | 12,815 | | | | 31,129 | | | | 111,954 | | | | 143,083 | | | | 12,476 | | | 2008 | | (1) |
Promenade Bolingbrook | | Bolingbrook, IL | | | 74,621 | | | | 20,271 | | | | 95,390 | | | | 21,504 | | | | 20,985 | | | | 116,180 | | | | 137,165 | | | | 14,391 | | | 2007 | | (1) |
Promenade in Temecula | | Temecula, CA | | | 167,147 | | | | 5,837 | | | | 59,319 | | | | 144,341 | | | | 17,428 | | | | 192,069 | | | | 209,497 | | | | 33,168 | | | 1999 | | (1) |
Quartermaster Plaza | | Philadelphia, PA | | | 67,219 | | | | 36,443 | | | | 32,325 | | | | 1,111 | | | | 35,340 | | | | 34,539 | | | | 69,879 | | | | 10,542 | | | 2004 | | (1) |
Quebec Square | | Denver, CO | | | 25,000 | | | | 1,616 | | | | 20,615 | | | | 7,690 | | | | 2,080 | | | | 27,841 | | | | 29,921 | | | | 6,077 | | | 2002 | | (1) |
Shops at Wiregrass | | Tampa, FL | | | 118,440 | | | | 28,842 | | | | 109,587 | | | | 1,248 | | | | 35,109 | | | | 104,568 | | | | 139,677 | | | | 11,750 | | | 2008 | | (1) |
Short Pump Town Center | | Richmond, VA | | | 154,216 | | | | 20,023 | | | | 136,172 | | | | 12,016 | | | | 15,124 | | | | 153,087 | | | | 168,211 | | | | 25,603 | | | 2003 | | (1) |
South Bay Galleria | | Redondo Beach, CA | | | 121,117 | | | | 1,297 | | | | 108,236 | | | | 24,630 | | | | 8,144 | | | | 126,019 | | | | 134,163 | | | | 28,477 | | | 1985 | | (1) |
Station Square | | Pittsburgh, PA | | | 25,286 | | | | 5,989 | | | | 27,519 | | | | 19,064 | | | | 6,252 | | | | 46,320 | | | | 52,572 | | | | 19,255 | | | 1994 | | (1) |
Tower City Parking | | Cleveland, OH | | | 1,508 | | | | 2,317 | | | | 11,789 | | | | 18,956 | | | | 3,337 | | | | 29,725 | | | | 33,062 | | | | 12,151 | | | 1990 | | (1) |
Victoria Gardens | | Rancho Cucamonga, CA | | | 201,375 | | | | 19,272 | | | | 175,662 | | | | 38,881 | | | | 10,242 | | | | 223,573 | | | | 233,815 | | | | 30,365 | | | 2004 | | (1) |
Westchester's Ridge Hill | | Yonkers, NY | | | 157,194 | | | | 77,892 | | | | 192,147 | | | | - | | | | 77,892 | | | | 192,147 | | | | 270,039 | | | | 3,706 | | | 2011 | | (1) |
White Oak Village | | Richmond, VA | | | 54,099 | | | | 23,738 | | | | 39,758 | | | | 1,467 | | | | 24,429 | | | | 40,534 | | | | 64,963 | | | | 5,599 | | | 2008 | | (1) |
Miscellaneous Investments | | Various | | | 32,066 | | | | 16,521 | | | | 42,227 | | | | 2,119 | | | | 19,342 | | | | 41,525 | | | | 60,867 | | | | 7,233 | | | Various | | (1) |
| | | | | | | | | | |
Retail Subtotal | | | | $ | 1,735,148 | | | $ | 318,119 | | | $ | 1,771,406 | | | $ | 549,429 | | | $ | 399,190 | | | $ | 2,239,764 | | | $ | 2,638,954 | | | $ | 476,143 | | | | | |
| | | | | | | | | | | |
Apartments | | | | | | | | | | | | | | | | | | | | | | | | | | | | | | | | | | | | | | |
100 Landsdowne Street | | Cambridge, MA | | $ | 45,000 | | | $ | 728 | | | $ | 60,020 | | | $ | (160 | ) | | $ | 819 | | | $ | 59,769 | | | $ | 60,588 | | | $ | 10,359 | | | 2005 | | (1) |
1251 S. Michigan | | Chicago, IL | | | 9,500 | | | | 97 | | | | 13,978 | | | | 650 | | | | 106 | | | | 14,619 | | | | 14,725 | | | | 2,125 | | | 2006 | | (1) |
American Cigar Company | | Richmond, VA | | | 11,530 | | | | 1,395 | | | | 23,533 | | | | 405 | | | | 1,356 | | | | 23,977 | | | | 25,333 | | | | 3,192 | | | 2000 | | (1) |
Ashton Mill | | Cumberland, RI | | | 17,290 | | | | 2,885 | | | | 33,844 | | | | 9,137 | | | | 3,242 | | | | 42,624 | | | | 45,866 | | | | 6,455 | | | 2005 | | (1) |
Brookview Place | | Dayton, OH | | | 3,294 | | | | 155 | | | | 4,588 | | | | - | | | | 155 | | | | 4,588 | | | | 4,743 | | | | 3,360 | | | 1979 | | (1) |
Cameron Kinney | | Richmond, VA | | | 14,000 | | | | 2,340 | | | | 23,206 | | | | 3,175 | | | | 2,468 | | | | 26,253 | | | | 28,721 | | | | 3,287 | | | 2007 | | (1) |
Cedar Place | | Lansing, MI | | | 3,988 | | | | 399 | | | | 7,000 | | | | 27 | | | | 399 | | | | 7,027 | | | | 7,426 | | | | 3,168 | | | 1974 | | (1) |
Consolidated-Carolina | | Richmond, VA | | | 21,290 | | | | 1,028 | | | | 30,425 | | | | 1,374 | | | | 1,032 | | | | 31,795 | | | | 32,827 | | | | 5,892 | | | 2003 | | (1) |
Cutter's Ridge at Tobacco Row | | Richmond, VA | | | - | | | | 389 | | | | 4,356 | | | | (130 | ) | | | 389 | | | | 4,226 | | | | 4,615 | | | | 833 | | | 2006 | | (1) |
152
(c) Financial Statements Schedules (continued)
SCHEDULE III – REAL ESTATE AND ACCUMULATED DEPRECIATION (continued)
Forest City Enterprises, Inc. and Subsidiaries
| | | | | | | | | | | | | | | | | | | | | | | | | | | | | | | | | | | | | | |
| | | | | | | | Initial Cost to Company | | | Cost
Capitalized Subsequent to Acquisition | | | Gross Amount at Which Carried at Close of January 31, 2012 | | | Accumulated Depreciation at January 31, 2012 (C) | | | Date of Construction/ Acquisition | | Range of Lives on Which Depreciation in Latest Income Statement is Computed |
Name | | Location | | Amount of Encumbrance at January 31, 2012 | | | Land | | | Buildings and Improvements | | | Improvements and Carrying Costs | | | Land | | | Buildings and Improvements | | | Total (A)(B) | | | | |
| | | | | | | | | | | |
| | | | | | | | | | | |
| | | | | | | | | | | |
Apartments (continued) | | | | | | | | | | | | | | | | | | | | | | | | | | | | | | | | | | | | | | |
Drake | | Philadelphia, PA | | | 28,169 | | | | 1,353 | | | | 38,104 | | | | 8,097 | | | | 1,353 | | | | 46,201 | | | | 47,554 | | | | 11,373 | | | 1998 | | (1) |
Easthaven at the Village | | Beachwood, OH | | | 26,456 | | | | 7,919 | | | | 39,768 | | | | 7,241 | | | | 8,081 | | | | 46,847 | | | | 54,928 | | | | 16,260 | | | 1994 | | (1) |
Emerald Palms | | Miami, FL | | | 24,908 | | | | 3,311 | | | | 27,017 | | | | 4,519 | | | | 3,070 | | | | 31,777 | | | | 34,847 | | | | 11,737 | | | 1996 | | (1) |
Forest Trace | | Lauderhill, FL | | | 38,907 | | | | 4,356 | | | | 41,505 | | | | 1,411 | | | | 4,463 | | | | 42,809 | | | | 47,272 | | | | 11,856 | | | 2000 | | (1) |
Foundry Lofts | | Washington, D.C. | | | 47,700 | | | | 2,086 | | | | 52,806 | | | | - | | | | 2,086 | | | | 52,806 | | | | 54,892 | | | | 328 | | | 2011 | | (1) |
Grand Lowry Lofts | | Denver, CO | | | 18,186 | | | | 1,448 | | | | 22,726 | | | | 1,955 | | | | 1,605 | | | | 24,524 | | | | 26,129 | | | | 4,231 | | | 2000 | | (1) |
Hamel Mill Lofts | | Haverhill, MA | | | 41,361 | | | | 3,974 | | | | 72,902 | | | | 497 | | | | 3,974 | | | | 73,399 | | | | 77,373 | | | | 4,537 | | | 2008 | | (1) |
Heritage | | San Diego, CA | | | 23,797 | | | | 7,433 | | | | 42,202 | | | | 3,280 | | | | 7,438 | | | | 45,477 | | | | 52,915 | | | | 12,125 | | | 2002 | | (1) |
Independence Place I | | Parma Heights, OH | | | 4,263 | | | | 210 | | | | 6,671 | | | | 740 | | | | 215 | | | | 7,406 | | | | 7,621 | | | | 3,681 | | | 1973 | | (1) |
Independence Place II | | Parma Heights, OH | | | 3,450 | | | | 498 | | | | 3,931 | | | | 1,403 | | | | 507 | | | | 5,325 | | | | 5,832 | | | | 1,301 | | | 2003 | | (1) |
Kennedy Biscuit Lofts | | Cambridge, MA | | | 20,600 | | | | 716 | | | | 23,645 | | | | 3,672 | | | | 719 | | | | 27,314 | | | | 28,033 | | | | 13,786 | | | 1990 | | (1) |
Knolls | | Orange, CA | | | 19,309 | | | | 53 | | | | 23,759 | | | | 296 | | | | 53 | | | | 24,055 | | | | 24,108 | | | | 9,644 | | | 1995 | | (1) |
Lofts 23 | | Cambridge, MA | | | 6,256 | | | | 221 | | | | 17,026 | | | | 52 | | | | 314 | | | | 16,985 | | | | 17,299 | | | | 3,314 | | | 2005 | | (1) |
Lofts at 1835 Arch | | Philadelphia, PA | | | 20,478 | | | | 2,076 | | | | 27,430 | | | | 11,887 | | | | 2,082 | | | | 39,311 | | | | 41,393 | | | | 8,834 | | | 2001 | | (1) |
Lucky Strike | | Richmond, VA | | | 15,257 | | | | 1,105 | | | | 34,095 | | | | 31 | | | | 3,019 | | | | 32,212 | | | | 35,231 | | | | 3,731 | | | 2008 | | (1) |
Mercantile Place on Main | | Dallas, TX | | | 36,066 | | | | 8,876 | | | | 75,478 | | | | 5,018 | | | | 8,795 | | | | 80,577 | | | | 89,372 | | | | 9,072 | | | 2008 | | (1) |
Metro 417 | | Los Angeles, CA | | | 44,888 | | | | 8,545 | | | | 67,326 | | | | 4,094 | | | | 8,545 | | | | 71,420 | | | | 79,965 | | | | 10,677 | | | 2005 | | (1) |
Metropolitan | | Los Angeles, CA | | | 38,900 | | | | 4,420 | | | | 36,557 | | | | 9,410 | | | | 4,458 | | | | 45,929 | | | | 50,387 | | | | 20,417 | | | 1989 | | (1) |
Midtown Towers | | Parma, OH | | | 13,615 | | | | 1,215 | | | | 11,091 | | | | 10,317 | | | | 1,268 | | | | 21,355 | | | | 22,623 | | | | 8,075 | | | 1969 | | (1) |
Millender Center | | Detroit, MI | | | 9,206 | | | | 1,247 | | | | 16,847 | | | | 265 | | | | 1,247 | | | | 17,112 | | | | 18,359 | | | | 9,483 | | | 1985 | | (1) |
Museum Towers | | Philadelphia, PA | | | 32,400 | | | | 3,474 | | | | 18,158 | | | | 5,963 | | | | 3,909 | | | | 23,686 | | | | 27,595 | | | | 7,634 | | | 1997 | | (1) |
North Church Towers | | Parma Heights, OH | | | 5,046 | | | | 789 | | | | 4,037 | | | | 409 | | | | 789 | | | | 4,446 | | | | 5,235 | | | | 634 | | | 2009 | | (1) |
One Franklintown | | Philadelphia, PA | | | 38,926 | | | | 1,658 | | | | 31,489 | | | | 8,111 | | | | 1,741 | | | | 39,517 | | | | 41,258 | | | | 18,371 | | | 1988 | | (1) |
Parmatown Towers and Gardens | | Parma, OH | | | 6,274 | | | | 330 | | | | 5,059 | | | | 7,545 | | | | 1,059 | | | | 11,875 | | | | 12,934 | | | | 7,756 | | | 1972 | | (1) |
Pavilion | | Chicago, IL | | | 55,425 | | | | 5,250 | | | | 29,505 | | | | 11,733 | | | | 5,265 | | | | 41,223 | | | | 46,488 | | | | 9,991 | | | 1992 | | (1) |
Perrytown Place | | Pittsburgh, PA | | | 4,802 | | | | 463 | | | | 6,898 | | | | 1 | | | | 463 | | | | 6,899 | | | | 7,362 | | | | 3,566 | | | 1973 | | (1) |
Presidio Landmark | | San Francisco, CA | | | 56,474 | | | | 2,060 | | | | 92,687 | | | | 1,873 | | | | 2,060 | | | | 94,560 | | | | 96,620 | | | | 4,252 | | | 2010 | | (1) |
Queenswood | | Corona, NY | | | 28,729 | | | | 321 | | | | 39,243 | | | | 557 | | | | 327 | | | | 39,794 | | | | 40,121 | | | | 15,862 | | | 1990 | | (1) |
Sky55 | | Chicago, IL | | | 67,915 | | | | 3,965 | | | | 80,930 | | | | 63 | | | | 4,011 | | | | 80,947 | | | | 84,958 | | | | 14,265 | | | 2006 | | (1) |
Southfield | | Whitemarsh, MD | | | 15,099 | | | | 3,260 | | | | 8,318 | | | | 12,621 | | | | 3,335 | | | | 20,864 | | | | 24,199 | | | | 5,410 | | | 2002 | | (1) |
Town Center (Botanica on the Green & Crescent Flats) | | Denver, CO | | | 32,011 | | | | 3,436 | | | | 63,073 | | | | 3,802 | | | | 3,346 | | | | 66,965 | | | | 70,311 | | | | 13,186 | | | 2004 | | (1) |
Wilson Building | | Dallas, TX | | | 12,776 | | | | 2,217 | | | | 16,565 | | | | 3,306 | | | | 1,937 | | | | 20,151 | | | | 22,088 | | | | 2,103 | | | 2007 | | (1) |
Miscellaneous Investments | | Various | | | 45,035 | | | | 966 | | | | 26,614 | | | | 36,677 | | | | 999 | | | | 63,258 | | | | 64,257 | | | | 15,120 | | | Various | | (1) |
| | | | | | | | | | |
Apartments Subtotal | | $ | 1,008,576 | | | $ | 98,667 | | | $ | 1,304,412 | | | $ | 181,324 | | | $ | 102,499 | | | $ | 1,481,904 | | | $ | 1,584,403 | | | $ | 331,283 | | | | | |
153
(c) Financial Statements Schedules (continued)
SCHEDULE III – REAL ESTATE AND ACCUMULATED DEPRECIATION (continued)
Forest City Enterprises, Inc. and Subsidiaries
| | | | | | | | | | | | | | | | | | | | | | | | | | | | | | | | | | | | | | |
Name | | | | | | | Initial Cost to Company | | | Cost Capitalized Subsequent to Acquisition | | | Gross Amount at Which Carried at Close of January 31, 2012 | | | Accumulated Depreciation at January 31, 2012 (C) | | | Date of Construction/ Acquisition | | Range of Lives
on Which
Depreciation in Latest
Income Statement is Computed |
| | | | | | | | |
| | Location | | Amount of Encumbrance at January 31, 2012 | | | Land | | | Buildings and Improvements | | | Improvements and Carrying Costs | | | Land | | | Buildings and Improvements | | | Total (A)(B) | | | | |
| | | | | | | | | | | |
| | | | | | | | | | | |
| | | | | | | | | | | |
Land Held for Development and Sale | | | | | | | | | | | | | | | | | | | | | | | | | | | | | | | | | | | | | | |
Stapleton | | Denver, CO | | $ | 15,775 | | | $ | 77,298 | | | $ | - | | | $ | - | | | $ | 77,298 | | | $ | - | | | $ | 77,298 | | | $ | - | | | Various | | (1) |
| | | | | | | | | | | |
Leasehold Improvements and Other Equipment | | | | | | | | | | | | | | | | | | | | | | | | | | | | | | | | | | | | | | |
| | | | | | | | | | | |
Miscellaneous Investments | | Various | | $ | - | | | $ | - | | | $ | 10,392 | | | $ | - | | | $ | - | | | $ | 10,392 | | | $ | 10,392 | | | $ | 8,086 | | | Various | | (1) |
Construction Projects | | | | | | | | | | | | | | | | | | | | | | | | | | | | | | | | | | | | | | |
Barclays Center Arena | | Brooklyn, NY | | $ | 206,253 | | | $ | - | | | $ | 591,228 | | | $ | - | | | $ | - | | | $ | 591,228 | | | $ | 591,228 | | | $ | - | | | Various | | (1) |
Botanica Eastbridge | | Denver, CO | | | - | | | | 631 | | | | 3,639 | | | | - | | | | 631 | | | | 3,639 | | | | 4,270 | | | | - | | | Various | | (1) |
Continental Building | | Dallas, TX | | | 6,596 | | | | 1,950 | | | | 18,628 | | | | - | | | | 1,950 | | | | 18,628 | | | | 20,578 | | | | - | | | Various | | (1) |
Johns Hopkins Parking Garage | | East Baltimore, MD | | | 775 | | | | 1,600 | | | | 8,450 | | | | - | | | | 1,600 | | | | 8,450 | | | | 10,050 | | | | - | | | Various | | (1) |
The Aster Town Center | | Denver, CO | | | - | | | | 335 | | | | 5,448 | | | | - | | | | 335 | | | | 5,448 | | | | 5,783 | | | | - | | | Various | | (1) |
The Yards - Boilermaker Shops | | Washington, D.C. | | | - | | | | 24 | | | | 7,550 | | | | - | | | | 24 | | | | 7,550 | | | | 7,574 | | | | - | | | Various | | (1) |
Westchester’s Ridge Hill | | Yonkers, NY | | | 330,533 | | | | 34,024 | | | | 533,881 | | | | - | | | | 34,024 | | | | 533,881 | | | | 567,905 | | | | - | | | Various | | (1) |
Development Projects | | | | | | | | | | | | | | | | | | | | | | | | | | | | | | | | | | | | | | |
Atlantic Yards | | Brooklyn, NY | | | 260,627 | | | | 678,229 | | | | - | | | | - | | | | 678,229 | | | | - | | | | 678,229 | | | | - | | | Various | | (1) |
The Yards | | Washington, D.C. | | | - | | | | 173 | | | | 65,335 | | | | - | | | | 173 | | | | 65,335 | | | | 65,508 | | | | - | | | Various | | (1) |
Colorado Science + Technology Park at Fitzsimmons | | Aurora, CO | | | - | | | | 1,750 | | | | 22,402 | | | | - | | | | 1,750 | | | | 22,402 | | | | 24,152 | | | | - | | | Various | | (1) |
LiveWork Las Vegas | | Las Vegas, NV | | | - | | | | 141,853 | | | | - | | | | - | | | | 141,853 | | | | - | | | | 141,853 | | | | - | | | Various | | (1) |
The Science + Technology Park at Johns Hopkins | | East Baltimore, MD | | | - | | | | 5,386 | | | | 16,043 | | | | - | | | | 5,386 | | | | 16,043 | | | | 21,429 | | | | - | | | Various | | (1) |
Waterfront Station | | Washington, D.C. | | | - | | | | 559 | | | | 26,824 | | | | - | | | | 559 | | | | 26,824 | | | | 27,383 | | | | - | | | Various | | (1) |
Miscellaneous Investments | | Various | | | 11,568 | | | | 20,805 | | | | 142,232 | | | | - | | | | 20,805 | | | | 142,232 | | | | 163,037 | | | | - | | | Various | | (1) |
| | | | | | | | | | |
Construction and Development Subtotal | | $ | 816,352 | | | $ | 887,319 | | | $ | 1,441,660 | | | $ | - | | | $ | 887,319 | | | $ | 1,441,660 | | | $ | 2,328,979 | | | $ | - | | | | | |
Total Real Estate | | | | $ | 5,640,439 | | | $ | 1,531,014 | | | $ | 6,640,776 | | | $ | 1,417,935 | | | $ | 1,721,558 | | | $ | 7,868,167 | | | $ | 9,589,725 | | | $ | 1,526,503 | | | | | |
Land Held for Divestiture | | Various | | | 19,084 | | | | 57,145 | | | | - | | | | - | | | | 57,145 | | | | - | | | | 57,145 | | | | - | | | | | (1) |
| | | | | | | | | | |
Total Real Estate Including Land Held for Divestiture | | | | $ | 5,659,523 | | | $ | 1,588,159 | | | $ | 6,640,776 | | | $ | 1,417,935 | | | $ | 1,778,703 | | | $ | 7,868,167 | | | $ | 9,646,870 | | | $ | 1,526,503 | | | | | |
| | | | | | | | | | |
| | (A) | The aggregate cost at January 31, 2012 for federal income tax purposes was $8,666,129. For (B) and (C) refer to the following page. |
| | (1) | Depreciation is computed based upon the following estimated useful lives: |
| | |
| | | Years |
Building and improvements | | 50 |
Equipment and fixtures | | 5 – 15 |
Tenant improvements | | Shorter of useful life or applicable lease term |
154
(c) Financial Statements Schedules (continued)
SCHEDULE III – REAL ESTATE AND ACCUMULATED DEPRECIATION (continued)
| | | | | | | | | | | | |
| | | Years Ended January 31, | |
| | | 2012 | | | 2011 | | | 2010 | |
| | | (in thousands) | |
(B) Reconciliations of total real estate carrying value are as follows: | | | | | | | | | | | | |
Balance at beginning of period | | $ | 11,166,539 | | | $ | 11,340,779 | | | $ | 10,648,573 | |
Additions during period - | | | | | | | | | | | | |
Improvements | | | 874,614 | | | | 744,415 | | | | 889,440 | |
Other additions, primarily as a result of change in accounting method of property | | | 3,577 | | | | 166,038 | | | | - | |
Other acquisitions | | | 9,201 | | | | - | | | | 4,713 | |
| | | | |
| | | 887,392 | | | | 910,453 | | | | 894,153 | |
| | | | |
| | | |
Deductions during period - | | | | | | | | | | | | |
Cost of real estate sold or retired | | | (422,342 | ) | | | (187,069 | ) | | | (151,637 | ) |
Cost of real estate in connection with disposal of partial interests | | | (404,893 | ) | | | (514,533 | ) | | | - | |
Other deductions, primarily as a result of change in accounting method of property | | | (1,579,826 | ) | | | (383,091 | ) | | | (50,310 | ) |
| | | | |
| | | (2,407,061 | ) | | | (1,084,693 | ) | | | (201,947 | ) |
| | | | |
Balance at end of period | | $ | 9,646,870 | | | $ | 11,166,539 | | | $ | 11,340,779 | |
| | | | |
(C) Reconciliations of accumulated depreciation are as follows: | | | | | | | | | | | | |
Balance at beginning of period | | $ | 1,614,399 | | | $ | 1,593,658 | | | $ | 1,419,271 | |
Additions during period - Charged to profit or loss | | | 181,865 | | | | 197,120 | | | | 204,935 | |
Net other additions (deductions) during period -
Acquisitions, retirements, sales or disposals | | | (269,761 | ) | | | (176,379 | ) | | | (30,548 | ) |
| | | | |
Balance at end of period | | $ | 1,526,503 | | | $ | 1,614,399 | | | $ | 1,593,658 | |
| | | | |
155
SIGNATURES
Pursuant to the requirements of Section 13 or 15(d) of the Securities Exchange Act of 1934, the Registrant has duly caused this report to be signed on its behalf by the undersigned, thereunto duly authorized.
| | | | | | |
| | | | | | FOREST CITY ENTERPRISES, INC. (Registrant) |
| | | |
Date: April 2, 2012 | | | | BY: | | /s/ David J. LaRue |
| | | | | | (David J. LaRue, President and Chief Executive Officer) |
Pursuant to the requirements of the Securities Exchange Act of 1934, this report has been signed below by the following persons on behalf of the Registrant and in the capacities and on the dates indicated.
| | | | |
Signature | | Title | | Date |
| | |
* (Charles A. Ratner) | | Chairman of the Board and Director | | April 2, 2012 |
| | |
/s/ David J. LaRue (David J. LaRue) | | President, Chief Executive Officer and Director (Principal Executive Officer) | | April 2, 2012 |
| | |
/s/ Robert G. O’Brien (Robert G. O’Brien) | | Executive Vice President and Chief Financial Officer (Principal Financial Officer) | | April 2, 2012 |
| | |
/s/ Charles D. Obert (Charles D. Obert) | | Senior Vice President, Chief Accounting Officer and Corporate Controller (Principal Accounting Officer) | | April 2, 2012 |
| | |
* (James A. Ratner) | | Executive Vice President and Director | | April 2, 2012 |
| | |
* (Ronald A. Ratner) | | Executive Vice President and Director | | April 2, 2012 |
| | |
* (Brian J. Ratner) | | Executive Vice President and Director | | April 2, 2012 |
| | |
* (Bruce C. Ratner) | | Executive Vice President and Director | | April 2, 2012 |
| | |
* (Deborah Ratner Salzberg) | | Director | | April 2, 2012 |
| | |
* (Michael P. Esposito, Jr.) | | Director | | April 2, 2012 |
| | |
* (Scott S. Cowen) | | Director | | April 2, 2012 |
| | |
* (Arthur F. Anton) | | Director | | April 2, 2012 |
| | |
* (Joan K. Shafran) | | Director | | April 2, 2012 |
| | |
* (Louis Stokes) | | Director | | April 2, 2012 |
| | |
* (Stan Ross) | | Director | | April 2, 2012 |
| | |
* (Deborah L. Harmon) | | Director | | April 2, 2012 |
The Registrant plans to distribute to security holders a copy of the Annual Report and Proxy material on or about April 28, 2012.
| * | The undersigned, pursuant to a Power of Attorney executed by each of the Directors and Officers identified above and filed with the Securities and Exchange Commission, by signing his name hereto, does hereby sign and execute this Form 10-K on behalf of each of the persons noted above, in the capacities indicated. |
| | | | |
/s/ David J. LaRue | | | | April 2, 2012 |
(David J. LaRue, Attorney-in-Fact) | | | | |
156