UNITED STATES
SECURITIES AND EXCHANGE COMMISSION
Washington, DC 20549
FORM 10-K
(Mark One)
| |
☒ | ANNUAL REPORT PURSUANT TO SECTION 13 OR 15(d) OF THE SECURITIES EXCHANGE ACT OF 1934 |
For the fiscal year ended December 31, 2024
| |
☐ | TRANSITION REPORT PURSUANT TO SECTION 13 OR 15(d) OF THE SECURITIES EXCHANGE ACT OF 1934 |
For the transition period from _____________ to _____________
Commission file number 1-6961
TEGNA INC.
(Exact name of registrant as specified in its charter)
| | |
Delaware | | 16-0442930 |
(State or other jurisdiction of incorporation or organization) | | (I.R.S. Employer identification No.) |
8350 Broad Street, Suite 2000, Tysons, Virginia | | 22102-5151 |
(Address of principal executive offices) | | (Zip Code) |
(703) 873-6600 | | |
(Registrant’s telephone number, including area code) | | |
Securities registered pursuant to Section 12(b) of the Act:
| | |
Title of each class | Trading Symbol | Name of each exchange on which registered |
Common Stock, par value $1.00 per share | TGNA | The New York Stock Exchange |
Securities registered pursuant to Section 12(g) of the Act: None
Indicate by check mark if the registrant is a well-known seasoned issuer, as defined in Rule 405 of the Securities Act. Yes ☒ No ☐
Indicate by check mark if the registrant is not required to file reports pursuant to Section 13 or Section 15(d) of the Act. Yes ☐ No ☒
Indicate by check mark whether the registrant (1) has filed all reports required to be filed by Section 13 or 15(d) of the Securities Exchange Act of 1934 during the preceding 12 months (or for such shorter period that the registrant was required to file such reports), and (2) has been subject to such filing requirements for the past 90 days.
Yes ☒ No ¨
Indicate by check mark whether the registrant has submitted electronically every Interactive Data File required to be submitted pursuant to Rule 405 of Regulation S-T (§232.405 of this chapter) during the preceding 12 months (or for such shorter period that the registrant was required to submit such files). Yes ☒ No
Indicate by check mark whether the registrant is a large accelerated filer, an accelerated filer, a non-accelerated filer, a smaller reporting company or an emerging growth company. See the definitions of “large accelerated filer,” “accelerated filer”, “smaller reporting company” and “emerging growth company” in Rule 12b-2 of the Exchange Act:
| | | | | | | |
Large Accelerated Filer | ☒ | Accelerated filer | ☐ | Non-accelerated filer | ☐ | Smaller reporting company | ☐ |
| | | | | | Emerging growth company | ☐ |
If an emerging growth company, indicate by check mark if the registrant has elected not to use the extended transition period for complying with any new or revised financial accounting standards provided pursuant to Section 13(a) of the Exchange Act. ¨
Indicate by check mark whether the registrant has filed a report on and attestation to its management’s assessment of the effectiveness of its internal control over financial reporting under Section 404(b) of the Sarbanes-Oxley Act (15 U.S.C. 7262(b)) by the registered public accounting firm that prepared or issued its audit report. Yes ☒ No ☐
If securities are registered pursuant to Section 12(b) of the Act, indicate by check mark whether the financial statements of the registrant included in the filing reflect the correction of an error to previously issued financial statements. ¨
Indicate by check mark whether any of those error corrections are restatements that required a recovery analysis of incentive-based compensation received by any of the registrant’s executive officers during the relevant recovery period pursuant to §240.10D-1(b). ¨
Indicate by check mark whether the registrant is a shell company (as defined in Rule 12b-2 of the Act). Yes ☐ No ☒
The aggregate market value of the voting common equity held by non-affiliates of the registrant based on the closing sales price of the registrant’s Common Stock as reported on The New York Stock Exchange on June 30, 2024, was $2,307,432,488. The registrant has no non-voting common equity. As of February 19, 2025, 159,898,056 shares of the registrant’s Common Stock were outstanding.
DOCUMENTS INCORPORATED BY REFERENCE
Information pertaining to Part III of this Form 10-K is incorporated by reference to our 2025 definitive proxy statement. The 2025 definitive proxy statement will be filed with the U.S. Securities and Exchange Commission within 120 days of our fiscal year ended December 31, 2024.
INDEX TO TEGNA INC.
Dec. 31, 2024 FORM 10-K
PART I
Our Business Overview
TEGNA Inc. serves local communities across the U.S. through trustworthy journalism, engaging content, and tools to help people navigate their daily lives. Through customized marketing solutions, we help businesses grow and thrive. With 64 television stations and two radio stations in 51 U.S. markets, we are the largest owner of top four network affiliates in the top 25 markets among independent station groups, reaching approximately 39% of U.S. television households. We are one of the nation’s largest producers of local news producing more than 1,700 hours of news per week. Additionally, through our network affiliation and local sports rights agreements, we carry popular sports content which includes professional and collegiate sports and the Olympics. We also own leading multicast networks True Crime Network and Quest. Each television station has a robust digital presence across online, mobile, connected television, streaming and social platforms, reaching consumers on all devices and platforms they use to consume news content. Our combined local and national sales forces capitalize on the reach provided by these offerings to provide our advertising customers with an extensive customer base. We deliver results for advertisers across television, digital, connected TV (CTV) and streaming app platforms, including Premion, our streaming app and CTV advertising network. We have been consistently honored with the industry’s top awards, including Edward R. Murrow, George Polk, Alfred I. DuPont and Emmy Awards.
We also strive to better serve our communities, customers and advertisers through local streaming apps that offer live and on-demand personalized, hyper-local, always-on content and services. Through this approach to local streaming, we seek to focus on content that is hyper-relevant to our audience and that in turn provides further value to our advertising customers by allowing them to effectively reach their target audience on whatever device our viewers may be consuming our content on.
In late 2016, we launched Premion, the industry’s first local advertising solution for streaming apps and CTV platforms. We provide local, regional and national brands with an effective, turnkey solution to run streaming CTV advertising campaigns in all 210 linear television markets in the United States. We have built our advertising business on local as our competitive advantage: our large, local salesforce is leveraging relationships with local and regional advertisers to sell Premion inventory to deliver scale and measurable outcomes at the local level. Premion and Gray Television, Inc. (Gray) are in a commercial arrangement under which Gray resells Premion services across all of Gray’s 113 television markets. Our TEGNA stations and Gray each have the right to independently sell Premion’s inventory in markets where we both operate a local television station. With this additional sales channel, our combined TEGNA, Gray and Premion direct sales forces reach streaming apps CTV platform viewers in approximately 78% of U.S. television households.
Our Operating Structure
We have one operating and reportable segment, which generated revenues of $3.1 billion in 2024. The primary sources of our revenues are: 1) subscription revenues, reflecting fees paid by satellite, cable, streaming apps (services that deliver video content to consumers over the Internet) and telecommunications providers to carry our television signals on their systems; 2) advertising & marketing services (AMS) revenues, which include local and national non-political television advertising, digital marketing services (including Premion), and advertising on stations’ websites, tablet and mobile products and streaming apps; 3) political advertising revenues, which are driven by even-year election cycles at the local and national level (e.g. 2022, 2024, etc.) and particularly in the second half of those years; and 4) other services, such as production of programming, tower rentals and distribution of our local news content.
Our Revenue Sources
Subscription
Subscription revenue is generated from retransmission agreements with multichannel video programming distributors (e.g., cable and satellite providers) (MVPDs) and virtual multichannel video programming distributors that deliver a package of linear video content to consumers over the Internet (vMVPDs). Under these multi-year contracts, we grant these providers the right to include our stations’ linear television signals in their packages of video offerings that they make available to consumers in exchange for a fee. The amount of revenue earned is based on the number of subscribers to which the MVPDs and vMVPDs retransmit our signal and is calculated at the negotiated fee per subscriber under each agreement.
Linear broadcast television channels, powered by compelling local and network content continue to have broad appeal in terms of household viewership, viewing time and audience reach, making it highly desirable for distributors and providers to include our stations in their channel lineups. The overall reach of events such as the Olympics and NFL football, together with our extensive local news and non-news programming, continues to surpass the reach in viewership of individual cable channels. Our ratings and reach are driven by the quality of programs we and our network partners produce and by the strong local connections we have to our communities, which gives us a unique position among the numerous program choices viewers have, regardless of platform.
Advertising and marketing services
The advertising revenues generated by a station’s local news programs make up a significant part of its total advertising revenues. Advertising pricing is influenced by demand for advertising time. This demand is driven by a variety of factors, including the size and demographics of the local populations, the concentration of businesses, local economic conditions, and the popularity or ratings of the station’s programming. Almost all national advertising is placed through our centralized internal national sales force, while local advertising time is sold by each station’s own local sales force.
Our television stations produce local programming such as news, sports, weather, and entertainment. In addition, our portfolio of “Big 4” NBC, CBS, ABC and FOX stations operate under long-term network affiliation agreements. Generally, a network provides programming to its affiliated television stations and the network sells commercial advertising for certain of the available advertising spots within such programming, while our television stations sell some of the available commercial advertising spots within the network programming as well as the other local programming that the station originates.
Our dedicated, experienced team of advertising professionals aim to deliver customized marketing solutions with seamless execution to help our clients grow their business. Across linear, desktop, mobile and streaming platforms, TEGNA connects our clients’ brands and messaging with locally-motivated audiences to advance their marketing and business objectives via a holistic marketing approach. In addition to delivering relevant audiences, TEGNA supports clients with vertical insights and innovative attribution analytics to optimize, and demonstrate performance on our client’s media investments. For advertisers of all sizes, TEGNA offers brand exposure across both individual and multiple-market campaigns.
Political
Broadcast television remains the most popular medium for political advertising. Political advertising is sold to presidential, gubernatorial, U.S. Senate and House of Representative candidates, as well as for state and local races and issues. It is also sold to political action committees (PACs) and other advocacy groups. Our broadcasting assets, paired with Premion, offer political campaigns the ability to reach voters across the country, not just in our TEGNA television markets. Political advertising has proven to be a strong, dependable revenue stream. We believe we are well-positioned for political revenues in even years to come based on our station footprint and reach.
Our Strategy
TEGNA provides an essential service to local communities across America. Local news helps communities in times of crisis, holds people in power to account, and connects people to the information and stories that help them navigate their daily lives and engage in their communities. According to Pews Research, the vast majority of U.S. adults (85%) say local news outlets are at least somewhat important to the well-being of their local community including 44% who say local journalism is extremely or very important to their community.
We reach people over the air (approximately 15 to 20% of American households depend on over-the-air TV in part or completely for access to television), on cable and satellite, on CTVs through our live and on demand streaming apps, and online through our local websites and apps. In aggregate, we serve over 100 million people with our trusted information every month.
TEGNA is recognized as an excellent news organization, and in 2024 our stations were recognized with ten 2024 National Edward R. Murrow Awards for excellence in broadcast journalism, more than any other station group. KARE in Minneapolis was recognized for Overall Excellence, Large Market Television, marking a third consecutive year a TEGNA station has received this honor. Our stations also received 73 Regional Edward R. Murrow Awards, including six for overall excellence, the highest achievement awarded, as well as 22 First Place National Press Photographers Association Awards, two 2024 Alfred I. duPont-Columbia University Awards and two Gracie Awards.
Our local brands—like KUSA, WFAA, News Channel Maine, and First Coast News—have served their communities for decades, building strong relationships with their local audiences. In an era of wavering trust in news and institutions, local news continues to be viewed by a majority of consumers as objective, nonpartisan, and trustworthy.
We also provide an essential service to local advertisers who want to grow their business by reaching local consumers, with more than 12,600 local, regional, and national advertisers connecting with their future customers through our TV and digital products.
As the media ecosystem has evolved, and consumers have developed insatiable appetites for relevant content on all of their screens, the internet has created new opportunities to better serve local communities with personalized, hyper-local, always-on content and services. TEGNA’s strong local news brands, deep community trust, and the skill of professional local news teams, and relationships with local advertisers are valuable assets that create a “right to win” in this rapidly evolving space.
To capitalize on these new digital opportunities, we are transforming how we create the news, sell local advertisers, and operate the company, guided by the following strategic choices:
1.Commitment to Local Journalism: Our core purpose is to build a sustainable future for trusted local journalism. We will intensify efforts to engage our communities whenever and wherever they need us, on whichever platform or screen that best suits their viewing habits.
2.A+ Talent and Culture: We strive to have the best talent and a culture of high focus and increased accountability for the company. By fostering an environment of excellence, we intend to ensure that our workforce is engaged, empowered, and equipped to drive our transformation and success.
3.Maximizing Our Linear TV Business: While the linear TV model is evolving, it remains a vital revenue source. We intend to maintain an unwavering focus on excellence in our traditional operations—breaking major stories, optimizing distribution agreements, and delivering value to our advertisers—to preserve our brand strength and financial stability.
4.Reimagining News Production: To meet audiences on their preferred platforms—smartphones, connected TVs, and traditional broadcasts—we are investing and working to modernize our news operations. This transformation includes leveraging AI, automation, and shared resources across stations to expand our reporting capabilities.
5.Integrating Sales Across Platforms: We are reforming our local sales approach by integrating linear and digital advertising solutions. We believe this will enhance the value we deliver to advertisers, supported by centralized automation and efficiency-driven initiatives.
6.Personalized Viewer Experiences: We are shifting from a traditional one-to-many broadcast mindset to a one-to-one engagement strategy, tailoring content delivery through digital platforms that grow more relevant and personalized with user interaction.
7.Zero Waste: We are reforming our operating system to ensure that every dollar we invest and every hour we spend directly contributes to audience growth, revenue generation, and margin expansion. We will be relentless in eliminating inefficiencies and focusing only on high-impact work.
8.M&A: In a shifting regulatory landscape, we see tremendous potential in broadcasting, and believe we are well positioned to participate in market activity due to our liquidity, capital resources and financial condition, helping us to invest in expanding news and services, while potentially improving profits. Any action to make changes to the regulatory environment, including changes to the local broadcast ownership restrictions, would represent an important development for the industry and we expect to be closely involved.
Executing on these strategic priorities will improve our service to local communities, ensure a sustainable future for local news, and drive long term value for our shareholders.
Our Competition
Our business is comprised of linear television, streaming video, digital media, and marketing services for advertisers. Across these businesses, we compete for audiences, advertisers, and subscription revenue.
Audiences. The media landscape has undergone a dramatic transformation in recent years, with audience attention fragmenting across a vast and ever-growing array of channels. While we still compete with other broadcast stations for local linear news audiences, viewership of traditional broadcast television is steadily declining, particularly among younger demographics. Social media platforms like Facebook, Instagram and X, along with streaming giants like YouTube, Netflix, and Amazon Prime Video, dominate consumer attention. An ever-expanding creator economy now competes with traditional news outlets for consumer attention.
Advertisers: As audience attention has fragmented, so have advertiser dollars. While our stations still compete with traditional media companies, including broadcasters and other local media (e.g., newspapers and radio stations), they also increasingly compete with a vast array of digital competitors. According to BIA Advisory Services, digital media was expected to account for 49% of local advertising spend in 2024. These digital competitors include:
•Social media platforms (Facebook, Instagram, TikTok, etc.) which offer highly targeted advertising options and sophisticated data analytics;
•Streaming services (YouTube, Hulu, Netflix, etc.) that provide engaging content environments and increasingly robust advertising platforms;
•Search engines (Google, Bing, etc.) that dominate online advertising through search ads, display ads, and programmatic advertising;
•Online publishers (news websites, blogs, etc.) that offer niche audiences and opportunities for native advertising; and
•Programmatic platforms which offer advertisers the ability to reach specific audiences across multiple channels through the aggregation of a wide array of digital inventory.
•Free Ad Supported Streaming Television (FAST) distributors: As we expand distribution beyond traditional cable to other platforms, we encounter fierce competition from a vast array of content providers, including streaming services, other broadcasters, and niche channels, all vying for subscriber attention and revenue.
Subscription: As a broadcaster, our pursuit of subscription dollars faces a multifaceted competitive landscape.
•Traditional local cable multichannel video programming distributors MVPDs: We compete with fellow broadcasters for carriage fees alongside other cable properties like sports networks and premium channels.
•vMVPDs: In most cases, our network partners have not given us the right to negotiate carriage fees directly with vMVPDs. Instead, the networks negotiate rates on our behalf as part of the networks’ negotiations for carriage of their own programming assets, which can lead to the network prioritizing payment for those assets over ours.
•Network streaming platforms (e.g., Peacock and Paramount+): Networks may prioritize their own content within their branded streaming services, potentially impacting their willingness to pay us for our content.
Our Regulatory Environment
Our television and radio stations are operated under the authority of the Federal Communications Commission (FCC), the Communications Act of 1934, as amended (Communications Act), and the rules and policies of the FCC (FCC regulations). As a result, our stations are subject to a variety of obligations, such as restrictions on the broadcast of material deemed “indecent” or “profane,” sponsorship identification requirements, requirements to provide or pass through closed captioning for most programming, rules requiring the public disclosure of certain information about our stations’ operations (such as information regarding the sale of political advertising), and the obligation to offer programming responsive to the needs and interests of our stations’ communities. The FCC and/or Congress may alter or add to these requirements, and any such changes may affect the performance of our business. Certain significant elements of the FCC’s current regulatory framework for broadcast television are described in further detail below.
Licensing. Television and radio broadcast licenses generally are granted for eight-year periods. They are renewable upon application to the FCC and usually are renewed, except in rare cases in which a petition to deny, a complaint or an adverse finding as to the licensee’s qualifications results in loss of the license. We believe that our stations operate in substantial compliance with the Communications Act and FCC regulations.
Local Broadcast Ownership Restrictions. FCC regulations provide certain broadcast ownership rules and regulate network and local programming practices. Most notably, the rules generally permit common ownership of two full power television stations in the same market only if at least one of the commonly owned stations is not among the top four rated stations in the market at the time of acquisition (the Top Four Restriction), subject to case-by-case consideration of transactions that would result in new or continued common ownership of two top four rated stations in a market. TEGNA currently owns two separate full-power stations in twelve markets; in only one of those markets (Jacksonville, FL) are both stations affiliated with a Big 4 network. (In one additional market, our station KPNX, Mesa, AZ, operates a full power satellite station, KNAZ-TV, Flagstaff, AZ; both are affiliated with NBC.) If the Top Four Restriction were loosened or eliminated, we may have opportunities to benefit from greater in-market scale through the acquisition of additional Big 4 affiliations.
The FCC is required by statute to review these rules and regulations every four years, in a process known as a Quadrennial Review. On December 22, 2023, the FCC adopted an order completing its 2018 Quadrennial Review. The December 2023 order largely left in place the existing local broadcast ownership restrictions, except for adopting a more restrictive application of the local television ownership rule’s Top Four Restriction. The FCC previously had adopted a rule prohibiting one television station in a market from acquiring a network affiliation from another station in the market if the affiliation change would result in the buyer owning, operating, or controlling two full power stations rated among the top four stations in the market at the time of the transaction. The FCC asserted that such network affiliation transactions between stations would constitute the functional equivalent of a license assignment or transfer of control subject to the Top Four Restrictions. However, low power television stations (including Class A stations) and multicast programming streams of a station generally are not counted as separate stations subject to the FCC’s local television ownership rules, including the Top Four Restriction. In the December 2023 order, the FCC expanded its application of the Top Four Restriction to also prohibit network affiliation transactions between stations in which the buyer broadcasts the acquired network programming on a low power station or multicast program stream, if the transaction would violate the Top Four Restrictions if the acquired network programming were broadcast on a separate full power station. The December 2023 order does not require the divestiture of any existing network affiliations. However, combinations that were formed through transactions that would violate the newly revised Top Four Restrictions will not be assignable or transferable absent FCC approval. In February 2024, the National Association of Broadcasters and several individual broadcasters filed petitions for review of the December 2023 order. They argue that the order’s retention and tightening of existing broadcast television and radio ownership limits was arbitrary and capricious and violates the statutory requirement that the FCC “repeal” or “modify” broadcast ownership rules that the FCC cannot show remain “necessary in the public interest as the result of competition.” The ABC, CBS, FOX and NBC affiliate associations jointly intervened in support of the petitioners. The petitions were consolidated and are pending in the U.S. Court of Appeals for the Eighth Circuit.
The FCC separately initiated a parallel 2022 Quadrennial Review proceeding on December 22, 2022. That proceeding remains pending.
The FCC requires the disclosure of shared services agreements (SSAs) in stations’ online public inspection files, though these agreements generally are not deemed to be attributable ownership interests. The FCC defines SSAs broadly to include a wide range of agreements between separately owned stations, including news sharing agreements and other agreements involving “station-related services.” We are party to an SSA under which our television station in Toledo, WTOL, provides certain services (not including advertising sales) to another Toledo television station owned by a third party. We are party to several other agreements involving the limited sharing of certain equipment and resources; some of these agreements may qualify as SSAs subject to disclosure.
National Broadcast Ownership Restrictions. The Communications Act includes a national ownership cap for broadcast television stations that prohibits any one person or entity from having, in the aggregate, market reach of more than 39% of all U.S. television households. FCC regulations permit stations to discount the market reach of stations that broadcast on UHF channels by 50% (the UHF discount). In December 2017, the FCC issued a Notice of Proposed Rulemaking seeking comments on whether it can or should modify or eliminate the national ownership cap and/or the UHF discount; that proceeding remains open. Our 64 television stations reach approximately 29.0% of U.S. television households when the UHF discount is applied and approximately 39% without the UHF discount, based on Comscore U.S. television household estimates as of January 2025.
Retransmission Consent. As permitted by the Communications Act and FCC rules, we require cable and satellite operators to negotiate retransmission consent agreements to retransmit our television stations’ signals. Under the applicable statutory provisions and FCC rules, such negotiations must be conducted in “good faith.” FCC rules also provide stations with certain protections against cable and satellite operators importing duplicating network or syndicated programming broadcast by distant stations. Pay-TV interests and other parties continue to advocate for the FCC to alter or eliminate various aspects of the rules governing retransmission consent negotiations and stations’ exclusivity rights. If changes to the retransmission consent and/or exclusivity rules are adopted in the future, such developments could give cable and satellite operators leverage against broadcasters in retransmission consent negotiations, which could possibly adversely impact our revenue from retransmission and advertising. In addition, vMVPD platforms such as Hulu + Live TV, YouTube TV and DIRECTV Stream are not currently classified as MVPDs subject to the FCC’s retransmission consent negotiation rules. We have distribution contracts with major network partners and vMVPD platforms for carriage of our affiliated stations’ content on these platforms. We also have contracts with Fubo and DIRECTV Stream providing for those operators’ carriage of our independent stations KONG (Everett, WA) and KFAA-TV (Decatur, TX) and our MyNetwork-affiliated station KTVD (Denver, CO).
NextGen TV (ATSC 3.0). In November 2017, the FCC adopted an order authorizing broadcast television stations to voluntarily transition to a new technical standard, called Next Generation TV or ATSC 3.0. On June 20, 2023, the FCC adopted an order extending and revising certain of its rules governing the ATSC 3.0 transition. The new standard makes possible a variety of benefits for both broadcasters and viewers, including better sound and picture quality, hyper-localized programming including news and weather, enhanced emergency alerts, improved mobile reception, the use of targeted advertising, and more efficient use of spectrum, potentially allowing for more multicast streams to be aired on the same 6 megahertz channel. However, ATSC 3.0 is not backwards compatible with existing television equipment. To ensure continued service to all viewers, the FCC requires full-power television stations that transition to the new standard to continue broadcasting a version of at least the station’s primary program stream in the existing DTV standard (known as ATSC 1.0) until the FCC phases out the requirement in a future order. Current rules require the content of this primary stream simulcast signal to be substantially similar to the programming aired on the station’s ATSC 3.0 primary program stream until July 17, 2027. Transitioning a station to ATSC 3.0 is voluntary under current FCC rules and may require significant expenditures. As of December 31, 2024, we are broadcasting the following primary channels in both ATSC 1.0 and ATSC 3.0 formats: KGW (Portland, OR), WTSP (Tampa, FL), KUSA (Denver, CO), KING (Seattle, WA), KONG (Everett, WA), WGRZ (Buffalo, NY), KXTV (Sacramento, CA), KPNX (Mesa, AZ), WCNC (Charlotte, NC), KTHV (Little Rock, AR), WXIA (Atlanta, GA), KSDK (St. Louis, MO), WTHR (Indianapolis, IN), WTIC (Hartford, CT), WCCT (Waterbury, CT), KHOU (Houston, TX), WUSA (Washington, DC), WHAS (Louisville, KY), WWL (New Orleans, LA), WUPL (Slidell, LA), KARE (Minneapolis, MN), KENS (San Antonio, TX), and KMSB (Tucson, AZ). In each case, in accordance with FCC rules, we have entered into channel sharing agreements with other local broadcasters in the market to facilitate this transition by hosting the applicable primary channel in either ATSC 1.0 or 3.0 format. We have converted KONG (Everett, WA), WCCT-TV (Waterbury, CT) and WUPL (New Orleans, LA) to operate in ATSC 3.0; each of these stations serves as a 3.0 “lighthouse” for its market and has its primary and multicast channels broadcast in ATSC 1.0 via channel sharing arrangements. The remaining stations noted above continue to operate their own facilities in ATSC 1.0 format while simulcasting their primary channels in ATSC 3.0 via a 3.0 lighthouse. We expect to continue rolling out the new standard in coordination with other broadcasters, taking into account relevant market dynamics and our overall capital planning. As we roll ATSC 3.0 service out to our stations, there can be no guarantee that such service will earn sufficient additional revenues to offset the related expenditures.
We are subject to various laws and government regulations concerning environmental matters and employee safety and health. U.S. federal environmental legislation that pertains to us include the Toxic Substances Control Act, the Resource Conservation and Recovery Act, the Clean Air Act, the Clean Water Act, the Safe Drinking Water Act and the Comprehensive Environmental Response, Compensation and Liability Act (also known as Superfund). We are also regulated by the Occupational Safety and Health Administration (OSHA) concerning employee safety and health matters. The Environmental Protection Agency (EPA), OSHA and other federal agencies have the authority to write regulations that have an effect on our operations.
In addition to these federal regulations, various states have authority under the federal statutes mentioned above. Many state and local governments have adopted environmental and employee safety and health laws and regulations, some of which are similar to federal requirements. State and federal authorities may seek fines and penalties for violating these laws and regulations. We believe that we have complied with such proceedings and orders at our stations without any materially adverse effect on our Consolidated Balance Sheets, Consolidated Statements of Income or Consolidated Statements of Cash Flows.
Our Human Capital
Our people play an important role in our success in today’s rapidly evolving media landscape. Our key human capital management objectives are to attract, retain and develop the highest caliber talent in our industry. Our human resources programs are designed to support these objectives by offering competitive pay and growth and development opportunities.
As of December 31, 2024, we employed approximately 5,900 full-time and part-time people. Approximately 10% of our employees are represented by labor unions. They are represented by 27 local bargaining units (most of which are affiliated with one of four major unions) under local collective bargaining agreements. These agreements conform generally with the pattern of labor agreements in the broadcasting industry. We do not engage in industry-wide or company-wide bargaining.
TEGNA provides a range of learning and development opportunities for employees and leaders to help expand their skills and prepare them to step into larger roles in the future and grow their careers, including:
•Manager Training: We invest in the learning and development of our managers as they are critical to the company’s long-term success. Our manager training is based on TEGNA’s critical leadership skills and provides a targeted and progressive curriculum. The program includes content on foundational policies and procedures, how to lead effectively, how managers can foster a high-performing team, and how to lead strategically through change and collaboration. We held five of these manager training sessions in 2024, covering approximately 125 managers.
•Content & Ethical Journalism Training: In 2024, content leaders in our newsrooms were offered training opportunities, including ethics on detecting misinformation.
•Sales Training: In 2024, we launched a new sales training resource built for sellers by sellers that includes “snackable” video learning modules. All TEGNA sellers - 785 employees in 54 locations were given access to the training modules. TEGNA’s Sales-In-Residence program has evolved to become the Sales Development Representative (SDR) Academy, which provides recent college graduates and professionals new to the industry with training and development. In 2024, the 12-month in-person program, located in Dallas, Texas, trained seven individuals.
To grow and develop new talent, TEGNA offers the following early career programs:
•Producer-in-Residence (PIR) Program: TEGNA’s Producer-in-Residence (PIR) program has grown to one of the largest entry-level producer development programs in the industry. We search for PIR participants at major journalism schools as well as regional universities and colleges. The program includes a producer boot camp followed by two-years of early career training as a producer at one of our local stations. In the last seven years, we have either promoted or are on track to promote 80% of the 230 graduates hired into a regular producer position at a TEGNA station before the end of two-years. In 2024, we hired 50 program participants.
•Summer Intern Program: TEGNA’s Summer Intern program provides rising college seniors with meaningful work assignments, connections to the communities we serve, and career development opportunities. We offer a variety of intern tracks, including producer, advertising sales and marketing. The program has improved our intern-to-employee conversion rate and introduced a broad cross-section of next-generation news talent to TEGNA.
Maintaining the health and well-being of our employees and their families is a top priority for our company. TEGNA benefits offer:
•Plan Choice: TEGNA offers two medical plans, a Consumer Choice Health Plan (CCHP) and a Preferred Provider Organization (PPO) plan. Both plans offer access to the same network of providers, preventive care options and affordable prescription medication. Our plans are designed to support the various life stages of our employees and their families.
•Free Dental Coverage for Children: Employees can elect dental coverage from Delta Dental of Virginia without a TEGNA medical plan. Delta Dental’s Right Start 4 Kids program offers 100% coverage for diagnostic, preventive, basic, and major services for dependent children up to age 13.
•Enhanced Prescription Drug Care: TEGNA has partnered with PrudentRx to cover certain specialty medications at 100%. Our prescription drug partner, CVS Caremark, has launched Caremark® Cost Saver™ to provide automatic access to GoodRx’s prescription pricing, ensuring employees always pay the lower price for generic medications.
•Virtual Telehealth: In today’s mobile world, having access to healthcare on-the-go is important. Through Teladoc®, employees have 24/7 access to on-demand U.S. board-certified doctors and clinicians for non-emergency or general medical care available through video, phone or mobile app. TEGNA covers up to nine visits per family annually.
TEGNA provides employees a wide variety of mental health related benefits including:
•Spring Health provides convenient, comprehensive and confidential wellness services, available 24/7. The program covers 12 therapy sessions annually for employees and each of their family members – even if the employee is not enrolled in TEGNA’s medical plans. Employees are paired with a Care Navigator, a licensed mental health professional, for hands-on guidance and care coordination. They can also recommend other in-network providers.
•Throughout 2024, Spring Health hosted webinars on family mental health, safeguarding overall well-being and developing healthy habits such as mindfulness for managing stress.
TEGNA also provides a number of benefits to support our employees in their personal and family life, including:
•TEGNA 401(k) Savings Plan: TEGNA’s 401(k) Savings Plan helps employees save now so they can experience financial security in the future. All employees, including part-time and temporary employees, can participate in the program. Contributions made up to the first four percent of pay are eligible for a 100% match from the company.
•Fertility Benefits: Fertility benefits are covered at no additional cost to employees enrolled in TEGNA’s medical plans. The plan connects employees to the highest quality fertility specialists across the U.S., who use the latest advancements in science and technology to increase the chances of a healthy and successful pregnancy.
•Parental Leave: All new parents receive at least six weeks of parental leave to focus on their growing family. Women who give birth can take a minimum of 12 weeks maternity leave paid at 100%.
•Adoption or Surrogacy Assistance: Adoption and surrogacy assistance helps to pay for expenses incurred in building a family. The plan will reimburse 100% of eligible expenses to a maximum of $10,000.
•Family Support: Employees have access to Family First, which provides care plans, ongoing support, and help managing legal, emotional and financial issues related to caring for aging parents or chronically ill family members. A partnership with Care@Work by Care.com helps employees manage family care needs while balancing work, including child, elder or pet care.
•Time Away: Time away from the office is an important benefit that enables employees to relax and refresh mentally and physically. TEGNA’s paid time off program gives employees the flexibility to take time off by combining vacation, sick and floating holidays. Company holidays are observed throughout the year.
Our head of security and safety coordinates ongoing safety training in all our newsrooms as part of our protection protocols for journalists. Between 2021-2024, more than 80 sessions have been completed. In addition, in 2024 all TEGNA journalists were trained on election security.
To foster an environment with a wide range of backgrounds, perspectives, experiences, qualifications and skill sets, we actively seek talent through recruiting and professional development, provide training for content teams through our Inclusive Journalism program and offer learning opportunities for all employees. Accomplishments in 2024, include the following:
1.Talent Pipeline and Bench Strength: Increase partnerships with professional organizations, colleges and universities and build on our existing internship, Producer-in-Residence, and other programs.
•Progress: In 2024, in addition to our Producer-In-Residence Program, SDR Academy and internship program, to grow our talent and offer opportunities for networking and professional development, we attended eight major professional journalism conferences to recruit talent and provided grants to 36 employees to attend these conferences.
2.Multi-Year Inclusive Journalism Program: Development and launch of customized, multi-year Inclusive Journalism Program with expert external partners.
•Progress: Begun in 2020 and with support from The Poynter Institute and Horowitz Research, our Inclusive Journalism program trains content teams to authentically represent perspectives and experiences of all our audiences and foster trust while better serving the needs of our communities. In 2024, Poynter provided an annual training to all new content employees. Horowitz Research began a fourth round of audits of news, digital, and marketing content for each station. Feedback from these audits has helped newsrooms produce stories with more context to better reflect their communities.
3.Employee Training: Provide employees with ongoing resources and platforms to increase learning and discussion.
•Progress: In 2024, all employees were required to complete Integrity and Respect training. As part of our formal manager training, managers were required to complete courses on several topics, including respect in the workplace. Through our employee newsletter, we also regularly shared topics and resources for continued learning.
Our Corporate Responsibility and Sustainability
Our enduring purpose to serve the greater good of our communities guides our work and propels our stations and employees to be forces for positive change in the communities where we live and work.
Environmental Commitment – In addition to stations’ regularly reporting on environmental topics that impact their communities, TEGNA is focused on being responsible stewards of our resources.
TEGNA has focused on reducing business travel by using video conferencing technology across the company. We continue to apply thoughtful energy efficiency strategies, including updating stations’ studio lighting to LEDs, replacing inefficient HVAC systems and replacing roofs with energy efficient materials. Our practices include recycling and responsible disposal of technology products and equipment such as batteries and reducing the waste we generate at corporate offices and in production processes.
TEGNA’s most recent studio build-outs have been in LEED certified buildings, and we consider this certification when looking for studio space. From 2019 through 2023 we retired approximately 40% of our large news gathering fleet as we transitioned to smaller and more fuel-efficient vehicles. We continue to test satellite-based internet service products that will allow us to retire large vehicles. As our transmitters reach end of life, we source replacement transmitters that are more efficient from an electricity and HVAC perspective.
Social Impact – In 2024, our stations and news teams strove to be the most trusted sources of news in our communities and to be agents of beneficial change in the markets we serve. Our local journalists are empowered to seek out the stories that matter most to their audience and pursue investigations that expose wrongdoing while continuing to maintain the highest ethical standards.
Each year, TEGNA’s stations generate exceptional, award-winning investigative journalism that changes lives and laws in the local communities they serve. In 2024, TEGNA stations were honored with:
•National Edward R. Murrow Awards Highlight Excellence in Broadcast Journalism – Stations received ten 2024 National Edward R. Murrow Awards for excellence in broadcast journalism, more than any other station group. KARE in Minneapolis was recognized for Overall Excellence, Large Market Television, marking a third consecutive year a TEGNA station has received this honor.
•Regional Edward R. Murrow Awards Including for Overall Excellence – Stations received 73 Regional Edward R. Murrow Awards, including six for overall excellence, the highest achievement awarded, seven diversity, equity and inclusion and five innovation awards. Stations received more honors in these categories than any other local broadcast station group.
•National Association of Black Journalists Salute to Excellence Awards – WXIA in Atlanta, WGRZ in Buffalo, WKYC in Cleveland, WTSP in Tampa and WFAA in Dallas were honored with six Salute to Excellence Awards presented by the National Association of Black Journalists.
•Twenty-Two First Place National Press Photographers Association Awards – Stations received numerous awards from the National Press Photographers Association, including Large Market Station of the Year for WFAA in Dallas, Ernie Crisp Photojournalist of the Year for Michael Grady at KUSA in Denver, Editor of the Year for Michael Grady at KUSA in Denver, NPPA Award for Reporting for Jobin Panicker at WFAA and Documentary of the Year for Chris Hansen at KUSA.
•Two 2024 Alfred I. duPont-Columbia University Awards – Honoring excellence in broadcast, online and documentary journalism, KUSA was recognized for “BURNED,” a multi-year project documenting the devastating 2021 Marshall Fire in Boulder County. KVUE in Austin was honored for “Accountability After Uvalde,” revealing the failures of law enforcement in the aftermath of the mass shooting at Robb Elementary in Uvalde, Texas.
•Two Gracie Awards Spotlight Women in Media – WKYC in Cleveland and KXTV in Sacramento received 2024 Alliance for Women in Media Foundation Gracie Awards, which spotlight women in media who have made inspirational contributions to the industry. WKYC’s Jessica Miller received an award for “Health, Hope & Healing: The Loneliness Epidemic.” KXTV received an investigative feature award for “Price of Care: State Agency Neglects Those It Promised to Protect.”
Our mission to serve the greater good of our communities goes beyond keeping our audience informed and safe. TEGNA and our stations take an active role in helping make our communities better places to live and work. In 2024, TEGNA was recognized by The Civic 50 for a fifth consecutive year as one of the 50 most community-minded companies in the United States and the Telecommunications Sector Leader.
TEGNA stations identify pressing needs in their communities and partner with local nonprofit organizations to help address these issues. In 2024, TEGNA Foundation Community Grants were distributed within the United Nations Sustainable Development Goal framework, with the majority of 2024 grants supporting three major categories: Good Health and Well-Being (59%); Quality Education (16%); and Zero Hunger (15%).
TEGNA stations amplified the impact of charitable donations through on-air and digital awareness campaigns to raise the profile of important issues and causes. In 2024, stations made 401 grants totaling $1.85 million.
In 2024, the TEGNA Foundation made grants to support training for the next generation of journalists; education and development opportunities for journalists and other professionals in the media field; and protection of First Amendment freedoms.
Several special grants were also made in 2024, including: support for broadcasters in need, through the Broadcasters Foundation of America and support for The Media Institute in its nonpartisan efforts to promote freedom of speech and encourage a competitive media environment and communications industry.
TEGNA also serves and supports our communities by offering free airtime for nonprofits and charitable organizations to broadcast public service announcements (PSAs) that serve the public interest.
Corporate Governance – Our management and Board of Directors aim to create value for our shareholders through effective, ethical management of our company. Our Board of Directors has implemented strong corporate governance policies that align with best practices for publicly held companies and the evolving expectations of shareholders and institutional investors.
•Independent Board Oversight: We have an independent and diverse Board, led by an independent chair. The Board maintains objective oversight as ten out of TEGNA’s eleven directors are independent, with CEO Michael Steib serving as the only TEGNA employee on the Board. The separation of the roles of Chair and CEO allows for effective, independent Board oversight and communication, while enabling the CEO to focus on executing the strategic plan and managing operations. The Board also conducts an annual performance evaluation to ensure the effectiveness of the Board and its committees, as well as the broader Board leadership structure.
•Active, Engaged Board: Our directors spend significant time engaged in strategy discussions in order to identify potential opportunities to create value for our shareholders. The Board also oversees risk management through regular discussions with senior leadership, considering risks in the context of our strategic plan and operations. Directors play a key role in TEGNA’s shareholder engagement program, which actively seeks feedback from investors to gain a better perspective on our management, corporate governance, and performance in key areas.
•Experience Aligned with Long-Term Strategy: TEGNA’s Board regularly reviews director composition and tenure in order to ensure that its directors’ areas of expertise align with TEGNA’s strategic evolution. This process has resulted in the Board adding five independent Directors since 2018 (including two in 2024), with, collectively, deep expertise in media, technology, social/digital, capital markets, corporate finance and M&A.
In addition to the corporate governance practices discussed above, other important corporate governance practices we follow include:
•All of our directors are elected annually;
•Our directors and executive officers are subject to stock ownership guidelines;
•We do not have a shareholder rights plan (poison pill) in place;
•Our Board has adopted a proxy access by-law provision; and
•Mergers and other business combinations involving the Company generally may be approved by a simple majority vote.
Additional information regarding our corporate governance practices is included in our Principles of Corporate Governance posted on the Corporate Governance page under the “Investors” menu of our website at www.tegna.com.
MARKETS WE SERVE
TELEVISION STATIONS AND AFFILIATED DIGITAL PLATFORM
| | | | | | | | | | | | | | |
State/District of Columbia | | City | | Station/website | | Channel (1)/Network | | Affiliation Agreement Expires in | | Market TV
Households (2) | | | Founded |
Alabama | | Huntsville | | WZDX(TV): rocketcitynow.com | | Ch. 54/FOX | | 2025 | | | 314,569 | | | 1985 |
Arizona | | Flagstaff | | KNAZ-TV: 12news.com | | Ch. 2/NBC | | 2027 | | | 1,542,915 | | | 1970 |
| | Mesa | | KPNX(TV): 12news.com | | Ch. 12/NBC | | 2027 | | | 1,542,915 | | | 1953 |
| | Tucson | | KMSB(TV): tucsonnewsnow.com | | Ch. 11/FOX | | 2025 | | | 335,291 | | | 1967 |
| | | | KTTU(TV): tucsonnewsnow.com | | Ch. 18/CW | | 2026 | | | 335,291 | | | 1984 |
Arkansas | | Fort Smith | | KFSM-TV: 5newsonline.com | | Ch. 5/CBS | | 2028 | | | 220,765 | | | 1956 |
| | Little Rock | | KTHV(TV): thv11.com | | Ch. 11/CBS | | 2028 | | | 381,338 | | | 1955 |
California | | Sacramento | | KXTV(TV): abc10.com | | Ch. 10/ABC | | 2026 | | | 1,090,321 | | | 1955 |
| | San Diego | | KFMB-TV: cbs8.com | | Ch. 8/CBS | | 2028 | | | 763,399 | | | 1949 |
Colorado | | Denver | | KTVD(TV): my20denver.com | | Ch. 20/MNTV | | 2026 | | | 1,305,610 | | | 1988 |
| | | | KUSA(TV): 9news.com | | Ch. 9/NBC | | 2027 | | | 1,305,610 | | | 1952 |
Connecticut | | Hartford | | WTIC-TV: fox61.com | | Ch. 61/FOX | | 2025 | | | 793,076 | | | 1984 |
| | Waterbury | | WCCT-TV: yourcwtv.com/partners/hartford | | Ch. 20/CW | | 2026 | | | 793,076 | | | 1953 |
District of Columbia | | Washington | | WUSA(TV): wusa9.com | | Ch. 9/CBS | | 2028 | | | 1,997,731 | | | 1949 |
Florida | | Orange Park | | WJXX(TV): firstcoastnews.com | | Ch. 25/ABC | | 2026 | | | 566,106 | | | 1989 |
| | Jacksonville | | WTLV(TV): firstcoastnews.com | | Ch. 12/NBC | | 2027 | | | 566,106 | | | 1957 |
| | St. Petersburg | | WTSP(TV): wtsp.com | | Ch. 10/CBS | | 2028 | | | 1,488,663 | | | 1965 |
Georgia | | Atlanta | | WATL(TV): 11alive.com | | Ch. 36/MNTV | | 2026 | | | 1,864,478 | | | 1954 |
| | | | WXIA-TV: 11alive.com | | Ch. 11/NBC | | 2027 | | | 1,864,478 | | | 1948 |
| | Macon | | WMAZ-TV: 13wmaz.com | | Ch. 13/CBS | | 2028 | | | 173,003 | | | 1953 |
Idaho | | Boise | | KTVB(TV) (3): ktvb.com | | Ch. 7/NBC | | 2027 | | | 209,606 | | | 1953 |
Illinois | | Moline | | WQAD-TV: wqad.com | | Ch. 8/ABC | | 2026 | | | 230,224 | | | 1963 |
Indiana | | Indianapolis | | WTHR(TV) (4): wthr.com | | Ch. 13/NBC | | 2027 | | | 855,704 | | | 1957 |
Iowa | | Ames | | WOI-DT: weareiowa.com | | Ch. 5/ABC | | 2026 | | | 351,180 | | | 1950 |
| | Ames | | KCWI-TV: weareiowa.com | | Ch. 23/CW | | 2026 | | | 351,180 | | | 1999 |
Kentucky | | Louisville | | WHAS-TV: whas11.com | | Ch. 11/ABC | | 2026 | | | 548,724 | | | 1950 |
Louisiana | | New Orleans | | WWL-TV: wwltv.com | | Ch. 4/CBS | | 2028 | | | 517,618 | | | 1957 |
| | Slidell | | WUPL(TV) (5): wwltv.com/mytv | | Ch. 54/MNTV | | 2026 | | | 517,618 | | | 1955 |
Maine | | Bangor | | WLBZ(TV): newscentermaine.com | | Ch. 2/NBC | | 2027 | | | 103,646 | | | 1954 |
| | Portland | | WCSH(TV): newscentermaine.com | | Ch. 6/NBC | | 2027 | | | 335,060 | | | 1953 |
Michigan | | Grand Rapids | | WZZM(TV): wzzm13.com | | Ch. 13/ABC | | 2026 | | | 578,681 | | | 1962 |
Minnesota | | Minneapolis | | KARE(TV): kare11.com | | Ch. 11/NBC | | 2027 | | | 1,443,128 | | | 1953 |
Missouri | | St. Louis | | KSDK(TV): ksdk.com | | Ch. 5/NBC | | 2027 | | | 967,153 | | | 1947 |
New York | | Buffalo | | WGRZ(TV): wgrz.com | | Ch. 2/NBC | | 2027 | | | 534,178 | | | 1954 |
North Carolina | | Charlotte | | WCNC-TV: wcnc.com | | Ch. 36/NBC | | 2027 | | | 1,005,790 | | | 1967 |
| | Greensboro | | WFMY-TV: wfmynews2.com | | Ch. 2/CBS | | 2028 | | | 565,722 | | | 1949 |
Ohio | | Cleveland | | WKYC-TV: wkyc.com | | Ch. 3/NBC | | 2027 | | | 1,259,297 | | | 1948 |
| | Columbus | | WBNS-TV (6): 10tv.com | | Ch. 10/CBS | | 2028 | | | 771,290 | | | 1949 |
| | Toledo | | WTOL(TV): wtol.com | | Ch. 11/CBS | | 2028 | | | 339,238 | | | 1958 |
Oregon | | Portland | | KGW(TV) (7): kgw.com | | Ch. 8/NBC | | 2027 | | | 907,501 | | | 1956 |
Pennsylvania | | Scranton | | WNEP-TV: wnep.com | | Ch. 16/ABC | | 2026 | | | 448,547 | | | 1954 |
| | York | | WPMT(TV): fox43.com | | Ch. 43/FOX | | 2025 | | | 624,724 | | | 1952 |
South Carolina | | Columbia | | WLTX(TV): wltx.com | | Ch. 19/CBS | | 2028 | | | 315,679 | | | 1953 |
Tennessee | | Knoxville | | WBIR-TV: wbir.com | | Ch. 10/NBC | | 2027 | | | 416,037 | | | 1956 |
| | Memphis | | WATN-TV: localmemphis.com | | Ch. 24/ABC | | 2026 | | | 513,865 | | | 1978 |
| | | | WLMT(TV): localmemphis.com | | Ch. 30/CW | | 2026 | | | 513,865 | | | 1983 |
Texas | | Abilene | | KXVA(TV): myfoxzone.com | | Ch. 15/FOX | | 2025 | | | 76,289 | | | 2001 |
| | Austin | | KVUE(TV): kvue.com | | Ch. 24/ABC | | 2026 | | | 672,505 | | | 1971 |
| | Beaumont | | KBMT(TV) (8): 12newsnow.com | | Ch. 12/ABC | | 2026 | | | 120,181 | | | 1961 |
| | Corpus Christi | | KIII-TV: kiiitv.com | | Ch. 3/ABC | | 2026 | | | 136,543 | | | 1964 |
| | Dallas | | WFAA(TV): wfaa.com | | Ch. 8/ABC | | 2026 | | | 2,105,541 | | | 1949 |
| | Decatur | | KFAA-TV: wfaa.com | | Ch. 29/IND | | N/A | | | 2,105,541 | | | 1993 |
| | Houston | | KHOU(TV): khou.com | | Ch. 11/CBS | | 2028 | | | 1,805,453 | | | 1953 |
| | Conroe | | KTBU(TV): khou.com | | Ch. 55/Quest | | N/A | | | 1,805,453 | | | 2004 |
| | Odessa | | KWES-TV: newswest9.com | | Ch. 9/NBC | | 2027 | | | 102,838 | | | 1958 |
| | San Angelo | | KIDY(TV): myfoxzone.com | | Ch. 6/FOX | | 2025 | | | 41,365 | | | 1984 |
| | San Antonio | | KENS(TV): kens5.com | | Ch. 5/CBS | | 2028 | | | 736,825 | | | 1950 |
| | Nacogdoches | | KYTX(TV): cbs19.tv | | Ch. 19/CBS | | 2028 | | | 187,458 | | | 2008 |
| | Temple | | KCEN-TV (9): kcentv.com | | Ch. 9/NBC | | 2027 | | | 266,049 | | | 1953 |
Virginia | | Hampton | | WVEC(TV) (10): 13newsnow.com | | Ch. 13/ABC | | 2026 | | | 582,240 | | | 1953 |
Washington | | Seattle | | KING-TV: king5.com | | Ch. 5/NBC | | 2027 | | | 1,401,819 | | | 1948 |
| | Everett | | KONG(TV): king5.com | | Ch. 16/IND | | N/A | | | 1,401,819 | | | 1997 |
| | Spokane | | KREM(TV): krem.com | | Ch. 2/CBS | | 2028 | | | 324,849 | | | 1954 |
| | | | KSKN(TV): spokanescw22.com | | Ch. 22/CW | | 2026 | | | 324,849 | | | 1983 |
(1) Channel refers to the viewer-facing “virtual” channel associated with the station’s brand, which may differ from the radio frequency channel on which the station transmits.
(2) Market TV Households is the number of television households in each market, according to Comscore estimates effective January 2025. As of March 1, 2024, Comscore became TEGNA’s primary audience measurement partner. Comscore estimates are not directly comparable to Nielsen-based market household estimates included in prior years’ Annual Reports on Form 10-K.
(3) We also own KTFT-LD (NBC), a low power television station in Twin Falls, ID.
(4) We also own WALV-CD, a Class A television station in Indianapolis, IN.
(5) We also own WBXN-CD, a Class A television station in New Orleans, LA.
(6) We also own two radio stations, WBNS(AM) (1460), and WBNS-FM (97.1).
(7) We also own KGWZ-LD, a low power television station in Portland, OR.
(8) KBMT also operates a subchannel (KJAC/NBC), which is not counted. We also own KUIL-LD, a low power station in Beaumont, TX.
(9) We also own KAGS-LD, a low power television station in Bryan, TX.
(10) We also own WYSJ-CD, a Class A low power television station in Yorktown, VA and WJHJ-LD, a low power television station in Newport News, VA.
|
In addition to the above television station properties, we also have the following digital and multicast network operations which support our television stations: |
Locked On Podcast Network: www.lockedonpodcasts.com |
Premion: www.premion.com |
True Crime Network and Quest multicast networks: www.truecrimenetworktv.com and www.questtv.com |
|
INVESTMENTS We have non-controlling ownership interests in the following companies: |
6AM City, Inc: www.6amcity.com |
All City Network: www.allcitynetwork.com |
Baller TV: www.ballertv.com |
Boom Shakalaka: www.booment.com |
Bustle Digital Group: www.bustle.com |
Canela Media: www.canelamedia.com |
CareerBuilder: www.careerbuilder.com |
Kin Community: www.kincommunity.com |
MadHive: www.madhive.com |
Offline Ventures: www.offline.vc |
Pearl: www.pearltv.com |
Run3TV: www.pearltv.com |
SIGNIA Venture Partners: www.signiaventurepartners.com |
ViewLift: www.viewlift.com |
Vizbee: www.vizbee.tv |
Whistle Sports: www.teamwhistle.com |
TEGNA ONLINE: News and information about us is available on our website, www.TEGNA.com. In addition to news and other information about us, we provide access through this site to our annual report on Form 10-K, our quarterly reports on Form 10-Q, our current reports on Form 8-K and all amendments to those reports as soon as reasonably practicable after we file or furnish them electronically to the Securities and Exchange Commission (SEC). Certifications by our Chief Executive Officer and Chief Financial Officer are included as exhibits to our SEC reports (including this Form 10-K). We also provide access on this website to our Principles of Corporate Governance, the charters of our Audit, Leadership Development and Compensation, and Governance, Public Policy and Corporate Responsibility committees and other important governance documents and policies, including our Ethics and Insider Trading Policies. Copies of all of these corporate governance documents are available to any shareholder upon written request made to our Secretary at the headquarters address. We will disclose on our website changes to, or waivers of, our corporate ethics policy.
Our General Company Information
Our company was founded by Frank E. Gannett and associates in 1906 and was incorporated in 1923. We listed shares publicly for the first time in 1967 and reincorporated in Delaware in 1972. Our headquarters is located at 8350 Broad Street, Suite 2000, Tysons, VA, 22102. Our telephone number is (703) 873-6600 and our website home page is www.tegna.com. We make our website content available for information purposes only. It should not be relied upon for investment purposes, nor is it incorporated by reference into this Annual Report on Form 10-K.
Our annual reports on Form 10-K, quarterly reports on Form 10-Q, current reports on Form 8-K, proxy statements for our annual stockholders’ meetings and amendments to those reports are available free of charge on our investor website, under “Investors” at www.tegna.com as soon as reasonably practical after we electronically file the material with, or furnish it to, the Securities and Exchange Commission (SEC). We also routinely post important information for investors on our investor website, under “Investors” at www.tegna.com. We use this website as a means of disclosing material information in compliance with our disclosure obligations under Regulation FD. Accordingly, investors should monitor the “Investors” section of our website, in addition to following our press releases, SEC filings, public conference calls, presentations and webcasts. In addition, copies of our annual reports will be made available, free of charge, upon written request. The SEC also maintains a website at www.sec.gov that contains reports, proxy statements and other information regarding SEC registrants, including TEGNA Inc.
Certain factors affecting forward-looking statements
Certain statements in this Annual Report on Form 10-K that do not describe historical facts may constitute forward-looking statements within the meaning of the U.S. Private Securities Litigation Reform Act of 1995 and the “safe harbor” provisions of Section 27A of the Securities Act of 1933, as amended, and Section 21E of the Securities Exchange Act of 1934, as amended. Without limitation, any statements preceded or followed by or that include the words “targets,” “plans,” “believes,” “expects,” “intends,” “will,” “likely,” “may,” “anticipates,” “estimates,” “projects,” “should,” “would,” “could,” “might,” “expect,” “positioned,” “strategy,” “future,” “potential,” “forecast,” “outlook,” or words, phrases or terms of similar substance or the negative thereof, are forward-looking statements. These include, but are not limited to, statements regarding TEGNA’s future financial and operating results (including growth and earnings), capital allocation framework, plans, objectives, expectations and intentions and other statements that are not historical facts. These forward-looking statements are necessarily estimates reflecting the best judgment and current views, projections, estimates, expectations, plans, assumptions and beliefs about future events (in each case subject to change) of TEGNA’s senior management and involve a number of risks, uncertainties and other factors, many of which may be beyond our control that could cause actual results to differ materially from those views, projections, estimates, expectations, plans, assumptions and beliefs expressed or implied in such forward-looking statements. These risks, uncertainties and other factors include, but are not limited to, risks and uncertainties related to:
•Changes in the market price of TEGNA’s shares, general market conditions, constraints, volatility, or disruptions in the capital markets;
•The possibility that TEGNA’s capital allocation plan, including dividends, share repurchases and/or strategic acquisitions, investments and partnerships may not enhance long-term stockholder value;
•Legal proceedings, judgments or settlements;
•TEGNA’s ability to re-price or renew subscribers;
•Changes in, or failure or inability to comply with, government regulations including, without limitation, regulations of the FCC, and adverse outcomes from regulatory proceedings;
•The effects of extreme weather and climate events on our operations as well as our counterparties, customers, employees, third-party vendors and suppliers;
•Changes in technology, including changes in the distribution and viewing of television programming;
•The reaction by advertisers, programming providers, strategic partners, FCC or other government regulators to businesses that we may seek to acquire;
•The risk that we may become responsible for certain liabilities of the businesses that we may acquire;
•Future financial performance, including our ability to obtain additional financing in the future on favorable terms;
•The failure of our business to produce projected revenues or cash flows;
•Continued consolidation in the industry, including MVPDs, vMVPDs, advertising agencies and other important third parties;
•The loss of key personnel and/or talent or expenditure of a greater amount of resources attracting, retaining and motivating key personnel than in the past;
•Strikes or other union job actions that affect our operations, including, without limitation, failure to renew our collective bargaining agreements on mutually favorable terms;
•Uncertainties inherent in the development of new business lines and business strategies;
•Changes in laws or regulations under which we operate;
•Competitor responses to our products and services;
•Changes in consumer behaviors and impacts on and modifications to TEGNA’s operations and business relating thereto; and
•Other economic, competitive, governmental, technological and other factors and risks that may affect TEGNA’s operations or financial results, which are discussed in this Annual Report on Form 10-K. Any forward-looking statements in this Annual Report on Form 10-K should be evaluated in light of these important factors.
The list of factors above is illustrative, but by no means exhaustive. All forward-looking statements should be evaluated with the understanding of their inherent uncertainty. All subsequent written and oral forward-looking statements concerning the matters addressed in this Annual Report on Form 10-K and attributable to us or any person acting on our behalf are qualified by these cautionary statements.
Although we believe that the expectations reflected in the forward-looking statements are reasonable, these expectations may not be achieved. We may change our intentions, beliefs or expectations at any time and without notice, based upon any change in our assumptions or otherwise. We undertake no obligation to publicly update or revise any forward-looking statements, whether as a result of new information, future events or otherwise.
ITEM 1A. RISK FACTORS
The following risk factors and the forward-looking statements disclaimer included above should be read carefully in connection with evaluating our business and investing in our securities. These risks and uncertainties could cause actual results and events to differ materially from those anticipated. We seek to identify, manage and mitigate risks to our business, but risk and uncertainty cannot be eliminated or necessarily predicted. Many of the risk factors described under one heading below may apply to more than one section in which we have grouped them for the purpose of this presentation. The risks described below may not be the only risks we face. Additional risks that we do not yet perceive or that we currently believe are immaterial may adversely affect our business and the trading price of our securities. As a result, you should consider all of the following factors, together with all of the other information presented in this Annual Report on Form 10-K, in evaluating our business. These risk factors may be amended, supplemented or superseded from time to time in future filings and reports that we file with the SEC.
Risks Related to Our Business and Industry
We are impacted by demand for advertising, which, in turn, depends on a number of factors, some of which are cyclical and/or seasonal, and will also fluctuate as a result of a number of other factors, many of which are beyond our control
In 2024, 40% of our revenues were derived from non-political television spot and digital advertising. Demand for advertising is highly correlated with the strength of the U.S. economy, both in the markets our stations serve and in the nation as a whole. Consequently, our operating results depend on the relative strength of the economy in our principal television markets as well as the strength or weakness of regional and national economic factors. Measures taken by the government in 2024, including interest rate cuts by the Federal Reserve, eased certain pressures on the economy, but other macroeconomic factors, including inflation above certain benchmarks, as well as the new presidential administration, could result in future reversals of the government’s current economic policies. This uncertainty and volatility may impact our AMS revenue results. Macroeconomic factors resulted in a continued softening of the national advertising market in 2024, which impacted our AMS revenues for the year. These factors may continue to pressure advertising revenues in 2025.
Our advertising revenues can also be affected by a variety of other factors outside our control, including, among other things, the viewership of the programming offered by our television stations, local and national advertising price fluctuations, the duration and extent of any network preemption of regularly scheduled programming for any reason, audience/attribution measurement services and industry adoption of such services, consolidation of agencies in the marketplace, our competitors’ activities, including increased competition from other advertising-based mediums, particularly digital and streaming platforms, and the internet and labor disputes or other disruptions at programming providers, networks or professional sports leagues.
Our advertising revenues also vary substantially from year to year, driven by the political election cycle (i.e., even years, with presidential election cycles every four years driving outsized revenues); the ability and willingness of candidates and political action committees to raise and spend funds on television and digital advertising; and the competitiveness of the election races in our stations’ markets. In addition, advertising revenues are subject to seasonal fluctuations, with our second and fourth quarter operating results generally being stronger than those of the first and third quarters, driven by the increases in spring seasonal advertising in the second quarter and in advertising for the holiday season in the fourth quarter.
Competition from alternative forms of media may impair our ability to grow or maintain revenue levels in traditional and new businesses
Advertising and marketing services produce a significant portion of our revenues, with our stations’ affiliated desktop, mobile and tablet advertising revenues, as well as our streaming app product offerings being important components. Technology, particularly new video formats, streaming and downloading capabilities via the Internet, video-on-demand and other devices and technologies used in the entertainment industry continue to evolve rapidly, leading to alternative methods for the delivery and storage of content. These technological advancements have driven changes in consumer behavior and have empowered consumers to seek more control over when, where and how they consume news and entertainment, including through so-called “cutting the cord” and other consumption strategies. These changes in consumption have had a negative impact on our ability to generate subscription revenues, as the number of MVPD subscribers has declined period-over-period. For example according to a Wells Fargo equity research report (November 2024), it is estimated that pay-TV subscribers decreased by 7.4% in 2024. Since our subscription revenue is based on the number of pay-TV subscribers of our MVPD partners and their subscriber counts have declined, our subscriber revenue has experienced downward pressure. As cord-cutting has accelerated, we have not been able to renew MVPD contracts on terms that are sufficiently favorable to offset this subscriber decline, and as a result, our subscriber revenues declined in 2024. If current cord-cutting trends continue downward, or accelerate, and we are not able to negotiate renewed MVPD contracts on terms that are sufficiently favorable to offset the subscriber-driven declines, then we may experience a material decline in subscription revenue. In addition, there can be no assurance that these contracts will be renewed in the future, or renewed on favorable terms to us.
These innovations may affect our ability to maintain the audience for our linear television product, which may make our television stations less attractive to advertisers. For example, increasing demand for content generated for consumption through other forms of media such as Amazon Prime Video, YouTube, Disney+, Max, Hulu, Netflix, Paramount+ or Peacock could cause our advertising revenues to decline as a result of changes to the ratings of our programming, which may materially negatively affect our business and results of operations.
The value of our assets or operations may be diminished if our information technology systems fail to perform adequately
Our information technology systems are critically important to operating our business efficiently and effectively. We rely on our information technology systems, including systems hosted and operated by third-party vendors on our behalf, to manage our business data, communications, news and advertising content, digital products, order entry, fulfillment and other business processes. The failure of information technology systems to perform as we anticipate could disrupt our business and could result in transaction errors, processing inefficiencies, broadcasting disruptions, and loss of sales and customers, causing our business and results to be impacted.
Our efforts to minimize the likelihood and impact of adverse cybersecurity incidents and to protect our technology and confidential information may not be successful and our business could be negatively affected
In addition to the operational risks described above, our information technology systems and infrastructure, and that of our vendors, are also exposed to increasing risks related to cybersecurity incidents. Cybersecurity attacks by third parties with malicious intent, including but not limited to, attacks on these systems, pose risks to our company. Further, advances in technology and the increasing sophistication of attackers have led to more frequent and effective cyber-attacks, including advanced persistent threats by state-sponsored actors, cyber-attacks relying on complex social engineering or “phishing” tactics, ransomware attacks, and other methods. We take measures to minimize the risk and impact of a cyber-attack, including utilization of multi-factor authentication, deployment of firewalls, virtual private networks for remote access, elevated access controls, standardized vendor access, active patching monitoring / logging, and regular training of our employees related to protecting sensitive information and recognizing “phishing” attacks. The measures we employ may not always be effective to prevent or detect cyber-attacks or incidents, and unauthorized access to our technology and confidential information may occur. Depending on the severity of the incident or cyber-attack, such events could result in business interruptions, disclosure of nonpublic information, loss of sales and customers, misstated financial data, liabilities for stolen assets or information, diversion of our management’s attention, transaction errors, processing inefficiencies, increased cybersecurity protection costs, litigation, and financial consequences, any or all of which could adversely affect our business operations and reputation. In addition, cybersecurity incidents could subject us to civil liability to customers and other third parties, as well as fines, penalties, or other legal recourse imposed by governmental or regulatory authorities, which could be substantial. We maintain cyber risk insurance, but this insurance may not cover, or may be insufficient to cover, all of our losses from incidents impacting our systems or those of our vendors. In addition, our business operations may be disrupted, and our results of operations may be impaired, by the impact of breaches or cyber-attacks on our vendors, and these potential disruptions and impairments may not be covered by our insurance policies.
We rely upon cloud computing services to operate certain significant aspects of our business and any disruption could have an adverse effect on our financial condition and results of operations
Our business depends upon cloud computing services provided by third parties to provide a distributed computing infrastructure platform for certain of our business operations, including data processing, storage capabilities, and other services. Such third-party cloud computing services are vulnerable to damage or interruption from infrastructure changes, natural disasters, cybersecurity attacks, power outages, terrorist attacks, and other events or acts. For example, in 2024 one or our key vendors experienced a worldwide outage of its systems that temporarily impacted our ability to broadcast new content. Because of the very short duration of the outage, the event did not have a material impact on our business, but future similar events of longer duration could have a material impact. We could experience future interruptions, delays and outages in service and availability from our third-party cloud computing providers from time to time due to a variety of factors, including, but not limited to, infrastructure changes, human or software errors, website hosting disruptions and capacity constraints. Because we cannot easily switch our cloud computing operations to other third-party providers without significant costs, any future disruption of or interference with our use of third-party cloud computing service providers could have a materially negative impact on our business and the results of our operations.
As has historically been the case in the broadcast sector, loss of, or changes in, affiliation agreements or retransmission consent agreements could adversely affect operating results for our stations
Most of our stations are covered by our network affiliation agreements with the major broadcast television networks (ABC, CBS, NBC, and Fox). Under these agreements, the television networks produce and distribute programming to us in exchange for our stations’ commitments to air the programming at specified times and to pay the networks monetary compensation and other consideration, such as commercial announcement time during the programming. The cost of network affiliation agreements represents a significant portion of our operating expenses.
Each of our network affiliation agreements has a stated expiration date. With respect to the major broadcast networks, our principal expirations occur in the following years: NBC-early 2027, CBS-2028, ABC-2026 and Fox-2025. If renewed, our network affiliation agreements may be renewed on terms that are less favorable to us. The non-renewal or termination of any of our network affiliation agreements would prevent us from being able to carry programming of the affiliate network. This loss of programming would require us to obtain replacement programming, which may involve higher costs and/or which may not be as attractive to our audiences, resulting in reduced revenues.
In recent years, the networks have begun streaming their programming directly to consumers on the Internet and other distribution platforms (e.g., CBS on Paramount+ and NBC on Peacock), in some cases live or within a short period of the original network programming broadcast on local television stations, including those we own. An increase in the availability of network programming, particularly sports programming, on alternative platforms that either bypass or provide less favorable terms to local stations – such as cable channels, the Internet and other distribution vehicles – may dilute the exclusivity and the value of network programming originally broadcast by our stations and could adversely affect the business, financial condition and results of operations of our stations.
Our retransmission consent agreements with major cable, satellite and telecommunications service providers (also referred to as multichannel video programming distributors or MVPDs) permit them to retransmit our stations’ signals to their subscribers in exchange for the payment of compensation to us (which we classify as subscription revenues). This source of revenue represented approximately 47% of our 2024 total revenues and 52% of our 2023 revenues. On occasion, we may not be able to agree on mutually acceptable terms when negotiating renewals. When this happens, the MVPD will be required to cease airing our programming (commonly referred to as a “blackout” or “going dark”), and we will not be compensated by the MVPD during the period of the blackout. Future blackouts, should they occur, or if we are unable to renew our retransmission agreements on market terms, or at all, could negatively impact our business, financial condition and results of operations.
In addition, pay-TV interests and other parties continue to advocate for the FCC to alter or eliminate various aspects of the rules governing retransmission consent negotiations. On December 31, 2024, the FCC adopted rules requiring MVPDs to report future blackouts with broadcasters lasting longer than 24 hours to an FCC-operated, publicly accessible database; as of February 27, 2025, these rules are pending publication in the Federal Register, and no compliance date has been announced. The order adopting the rules contemplates that this reporting will be used, among other purposes, to “assist the Commission and Congress in the development of public policy relating to retransmission consent.” If in the future changes to the retransmission consent rules were adopted, such developments could give cable and satellite operators leverage against broadcasters in retransmission consent negotiations, which could possibly adversely impact our revenue from retransmission and advertising.
We operate our business in a single broadcast segment, which increases our exposure to the changes and highly competitive environment of the broadcast industry
Broadcast companies operate in a highly competitive environment and compete for audiences, advertising and marketing services revenue and quality programming. Lower audience share, declines in advertising and marketing services spending, and increased programming costs would adversely affect our business, financial condition and results of operations. There can be no assurance that we will be able to compete successfully against existing, new or potential competitors, or that competition and consolidation in the media marketplace will not have a material adverse effect on our business, financial condition or results of operations.
In addition, the FCC and Congress may enact new laws and regulations, and/or changes to existing laws and regulations, that could impact media ownership and other broadcast-related activities. Changes to FCC rules may lead to additional opportunities as well as increased uncertainty in the industry.
Changing regulations may also impair or reduce our leverage in negotiating affiliation or retransmission agreements, adversely affecting our revenues, or result in increased costs, reduced valuations for certain broadcasting properties or other impacts, all of which may adversely impact our future profitability. All of our stations are required to hold broadcasting licenses from the FCC; when granted, these licenses are generally granted for a period of eight years. Under certain circumstances, the FCC is not required to renew any license and could decline to renew future license applications.
Changes in the regulatory environment could increase our costs or limit our opportunities for growth
Our stations are subject to various obligations and restrictions under the Communications Act of 1934, as amended (the Communications Act), and FCC regulations. These requirements may be affected by legislation, FCC actions, or court decisions, and any such changes may affect the performance of our business, such as by imposing new obligations or by limiting our television stations’ exclusivity or retransmission consent rights. Broadcast station acquisitions also are subject to FCC review and approval. While FCC rules and policies, including broadcast ownership rules, are widely expected to become more permissive in the new administration, there can be no assurances that any such changes will be adopted or, if they are, that such changes will result in acquisitions or other strategic transactions by the Company.
In addition, prospective acquisition activities may be subject to antitrust review by the Antitrust Division of the Department of Justice (DOJ). Changes to the Hart-Scott-Rodino (HSR) rules adopted by the Federal Trade Commission (FTC) in 2024, with DOJ’s concurrence, are expected to require significant additional time and effort to make filings for transactions that require review under the HSR Act and could result in greater scrutiny by the DOJ of proposed transactions. DOJ’s review could result in restrictions on our ability to pursue or consummate future transactions, and/or a requirement that we divest certain television stations if an acquisition would result in excessive concentration in a market. Moreover, the DOJ’s review and enforcement policies may change in the new administration. As a result, we cannot assure investors that any future transaction that we enter into will be approved, or that a requirement to divest existing stations will not have an adverse effect on the transaction or on our business.
We may be subject to investigations or fines from governmental authorities, such as, but not limited to penalties related to violations of FCC indecency, children’s programming, sponsorship identification, closed captioning and other FCC rules and policies, the enforcement of which has increased in recent years, and complaints related to such violations may delay our FCC license renewal applications with the FCC
We provide a significant amount of live news reporting that is provided by the broadcast networks or is controlled by our on-air news talent. Although both broadcast networks and our on-air talent have generally been professional and careful about the information they communicate, there is always the possibility that information may be reported that is inaccurate or in violation of certain indecency rules promulgated by the FCC. In addition, entertainment and sports programming provided by broadcast syndicators and networks may contain content that is in violation of the indecency rules promulgated by the FCC. Because the interpretation by the courts and the FCC of the indecency or other rules is not always clear, it is sometimes difficult for us to determine in advance what may be indecent programming. We have insurance to cover some of the liabilities that may occur, but the FCC has enhanced its enforcement efforts relating to the regulation of indecency. Also, the FCC has various other rules governing broadcast content, including but not limited to obligations to air children’s television programming, commercial matter limitations within children’s programming, and closed captioning and sponsorship identification requirements. We are subject to such rules regardless of whether the programming is produced by us or by third parties. Violation of the indecency, children’s programming, closed captioning, sponsorship identification, or other rules could potentially subject us to penalties, license revocation, or renewal or qualification proceedings. In the past, we have incurred fines, none of which have been material. There can be no assurance that future incidents that may lead to significant fines or other penalties by the FCC can be avoided.
The success of much of our business is dependent upon the retention and performance of on-air talent and program hosts and other key employees
Our business depends upon the continued efforts, abilities and expertise of our corporate executive team. There can be no assurance that these individuals will remain with us. Our business, financial condition and results of operations could be materially adversely affected if we lose any of these persons and are unable to attract and retain qualified replacements. Additionally, our stations independently contract with several on-air personalities and hosts with significant loyal audiences in their respective markets. Although our stations have entered into long-term agreements with some of their key on-air talent and program hosts to protect their interests in those relationships, we can give no assurance that all or any of these persons will remain with our stations or will retain their audiences. Competition for these individuals is intense and several states restrict our ability to enter into noncompete agreements with such personnel. Our competitors may choose to extend offers to any of these individuals on terms which our stations may be unable or unwilling to meet. Furthermore, the popularity and audience loyalty of our stations key on-air talent and program hosts is highly sensitive to rapidly changing public tastes. A loss of such popularity or audience loyalty is beyond our control and could limit our stations’ ability to generate revenue and could have a material adverse effect on our business, financial condition and results of operations.
We have invested and will continue to invest in new technology initiatives which may not result in usable technology or intellectual property
We have also invested in, and will continue to invest in, the development of other technologies and products. Product development is a costly, complex and time-consuming process, and the investment in product development often involves a long wait until a return, if any, is achieved on such investment. We continue to make significant investments in research and development relating to our technologies and products. Investments in new technology and processes are inherently speculative. Technical obstacles and challenges we encounter in our research and development process may result in delays in or abandonment of product commercialization, substantially increase the costs of development and negatively affect our results of operations.
We could be adversely affected by strikes or other union job actions
The cost of producing and distributing entertainment programming has increased substantially in recent years due to, among other things, the increasing demands of creative talent and industry-wide collective bargaining agreements. Although we generally purchase programming content from others rather than produce such content ourselves, our program suppliers engage the services of writers, directors, actors and on-air and other talent, trade employees, and others, some of whom are subject to these collective bargaining agreements. Approximately 10% of our employees are represented by labor unions under collective bargaining agreements. If we or our program suppliers are unable to renew expiring collective bargaining agreements, it is possible that the affected unions could take action in the form of strikes or work stoppages. Failure to renew these agreements, higher costs in connection with these agreements or a significant labor dispute could adversely affect our business by causing, among other things, delays in production that lead to declining viewers, a significant disruption of operations, and reductions in the profit margins of our programming and the amounts we can charge advertisers for time. Our stations also broadcast certain professional sporting events, and our viewership may be adversely affected by player strikes or lockouts which could adversely affect our advertising revenues, results of operations. Further, any changes in the existing labor laws may further the realization of the foregoing risks.
Our operations and business have in the past been, and could in the future be, materially adversely impacted by a pandemic or other health emergency
Pandemics, such as the COVID-19 pandemic, and public health emergencies have affected and may, in the future, adversely affect our businesses. We experienced adverse business impacts relating to advertising sales, the suspension of content production, delays in the creation and availability of our programming, and other negative effects on our business due to the COVID-19 pandemic. Additionally, if portions of our workforce, including key personnel, are unable to work effectively because of illness, government actions or other restrictions in connections with a pandemic or other public health emergency, there may be significant adverse effects on our business. In addition to the risks described above, a pandemic or other public health emergency may heighten other risks described in this section.
If we are unable to protect our domain names, our reputation and brands could be adversely affected
We currently hold various domain name registrations relating to our brands. The registration and maintenance of domain names generally are regulated by governmental agencies and their designees. Governing bodies may establish additional top-level domains, appoint additional domain name registrars or modify the requirements for holding domain names. As a result, we may be unable to register or maintain relevant domain names. We may be unable, without significant cost or at all, to prevent third parties from registering domain names that are similar to, infringe upon or otherwise decrease the value of our trademarks and other proprietary rights. Failure to protect our domain names could adversely affect our reputation and brands, and make it more difficult for users to find our business’s websites and services.
We may face intellectual property infringement claims that could be time-consuming, costly to defend and result in loss of significant rights
Other parties may assert intellectual property infringement claims against us, and our services may infringe the intellectual property rights of third parties. From time to time, our business receives letters alleging infringement of intellectual property rights of others. Intellectual property litigation can be expensive and time-consuming and could divert management’s attention from our business. If there is a successful claim of infringement against us, we may be required to pay substantial damages to the party claiming infringement or enter into royalty or license agreements that may not be available on acceptable or desirable terms, if at all. Our failure to license proprietary rights on a timely basis would harm our business.
We are subject to risks related to our use of Generative Artificial Intelligence (GAI), a new and emerging technology, which is in the early stages of commercial use
We have begun to evaluate the use of GAI in our business processes. In recent years, the use of GAI has come under increased scrutiny. This technology, which is a new and emerging technology in early stages of commercial use, presents a number of risks inherent in its use, including ethical considerations, public perception and reputation concerns, intellectual property protection, regulatory compliance, privacy and data security concerns and reliability and accuracy of the information produced, all of which could have a material adverse effect on our business, results of operations and financial position. Further, new laws, guidance and decisions in this area may limit our ability to use GAI or decrease its usefulness. As a result, we cannot predict future developments in GAI and related impacts to our business and our industry. If we are unable to successfully adapt to new developments related to, and risks and challenges associated with GAI, our business, results of operations and financial position could be negatively impacted.
Risks Related to Ownership of Our Common Stock
Volatility in the U.S. credit markets could significantly impact our ability to obtain new financing to fund our operations or to refinance our existing debt at reasonable rates and terms as it matures
As of December 31, 2024, we had approximately $3.09 billion in debt and approximately $738.2 million of undrawn additional borrowing capacity under our revolving credit facility. On January 25, 2024, the revolving credit facility was amended to, among other things, reduce the Five-Year Commitments (as defined in the Credit Agreement) from $1.51 billion to $750 million and to extend the term, subject to a 91-day springing maturity date if debt in excess of $300 million (subject to certain exceptions) were to mature before the extended maturity date (as further described in Part II, Item 7 below). Our fixed rate term debt matures at various times during the years 2026 - 2029. If our operating results deteriorate significantly, we may not be able to pay amounts when due and a portion of these maturities may need to be refinanced. Access to the capital markets for longer-term financing is generally unpredictable and volatile credit markets could make it harder for us to obtain debt financings. In addition, any amounts borrowed under the revolving credit facility in the future are subject to a variable rate.
The value of our existing intangible assets may become impaired, depending upon future operating results
Goodwill and other intangible assets were approximately $5.33 billion as of December 31, 2024, representing approximately 73% of our total assets. Goodwill and indefinite-lived intangible assets are subject to annual impairment testing and more frequent testing upon the occurrence of certain events or significant changes in circumstances that indicate all or a portion of their carrying values may no longer be recoverable in which case a non-cash charge to earnings may be necessary. We may subsequently experience market pressures that could cause future cash flows to decline below our current expectations, or volatile equity markets could negatively impact market factors used in the impairment analysis, including earnings multiples, discount rates, and long-term growth rates. Any future evaluations requiring an asset impairment charge for goodwill or other intangible assets would adversely affect future reported results of operations and shareholders’ equity, although such charges would not affect our cash flow.
Changes in accounting standards can significantly impact reported operating results
Generally accepted accounting principles, accompanying pronouncements and implementation guidelines for many aspects of our business, including those related to intangible assets and income taxes, are complex and involve significant judgments. Changes in these rules or their interpretation could significantly change our reported operating results.
We may not realize the anticipated benefits of share repurchase activity
On June 2, 2023, we entered into an accelerated share repurchase (ASR) program under which we repurchased $300 million of our common stock. This program was completed in August 2023. On November 9, 2023, we entered into a second ASR program under which we repurchased an additional $325 million of our common stock. This program was completed in February 2024. Both of these ASR programs are in addition to the $650.0 million share repurchase program authorized by our Board of Directors in December 2023 which expires on December 31, 2025. There can be no assurances that the Company will continue to repurchase shares under the current authorization.
Future share repurchase activity under our current authorization, if any, could cause the price of the Company’s common stock to be higher than it otherwise would be and could potentially reduce the market liquidity for our stock. Although share repurchases are intended to enhance long-term stockholder value, there is no assurance they will do so because the market price of our common stock may decline below the levels at which we repurchased shares and short-term stock price fluctuations could reduce the effectiveness of the repurchases.
Repurchasing common stock would reduce the amount of cash we have available to fund capital expenditures, interest payments, dividends, debt retirements, share repurchases, investments in strategic initiatives and other operating requirements and we may fail to realize the anticipated benefits of share repurchases.
Any decrease in our dividend payments or suspension of our dividend payments could cause our stock price to decline
Our common stockholders are only entitled to receive the dividends declared by our Board of Directors. We paid dividends totaling $81.4 million in 2024. In the first quarter of 2024, we announced a 10% increase to our quarterly dividend from 11.375 to 12.5 cents per share. We began paying the increased dividend of 12.5 cents per share on July 1, 2024 to stockholders of record as of the close of business on June 7, 2024. We expect to continue to pay a regular quarterly dividend of 12.5 cents per share. However, future cash dividends, if any, will be at the discretion of our Board of Directors and can be changed or discontinued at any time. Dividend determinations (including the amount of the cash dividend, the record date and date of payment) will depend upon, among other things, our future operations and earnings, targeted future acquisitions, capital requirements and surplus, general financial condition, contractual restrictions and other factors as our Board of Directors may deem relevant. Given these considerations, our Board of Directors may increase or decrease the amount of the dividend at any time and may also decide to suspend or discontinue the payment of cash dividends in the future.
General Risk Factors
Any potential hostilities, terrorist attacks, or similarly newsworthy events leading to broadcast interruptions, may affect our revenues and results of operations
If any existing hostilities escalate, or if the United States experiences a terrorist attack or experiences any similar event resulting in interruptions to regularly scheduled broadcasting, we may lose revenue and/or incur increased expenses. Lost revenue and increased expenses may be due to preemption, delay or cancellation of advertising campaigns, or diminished subscriber fees, as well as increased costs of covering such events. We cannot predict the (i) extent or duration of any future disruption to our programming schedule, (ii) the amount of advertising revenue that would be lost or delayed, (iii) the amount of decline in any subscriber revenue or (iv) the amount by which broadcasting expenses would increase as a result. Any such loss of revenue and increased expenses could negatively affect our business, financial condition and results of operations.
Future acquisitions or business opportunities, including investments in complementary businesses could involve unknown risks that could harm our business and adversely affect our financial condition
From time to time, we have acquired or invested in complementary businesses and entered into joint ventures/investments. In the future we may make other acquisitions, invest in complementary businesses including joint ventures that involve unknown risks, and may involve significant cash expenditures, debt incurrence, operating losses and expenses that could have a material adverse effect on our business, financial condition, and results of operations. Such transactions involve numerous other risks including:
•Difficulties integrating acquired businesses, technologies and personnel into our business and/or achieving expected synergies or increased revenues as a result of an acquisition;
•Difficulties in obtaining and verifying the financial statements and other business information of acquired businesses;
•Inability to obtain required regulatory approvals on favorable terms;
•Potential loss of key employees, key contractual relationships or key customers of either acquired businesses or our business;
•Assumption of the liabilities and exposure to unforeseen or undisclosed liabilities of acquired businesses, as well as exposure to industry risks of the business underlying the acquisition;
•Dilution of interests of holders of our securities through the issuance of equity securities or equity-linked securities; and
•In the case of joint ventures and other investments, interests that diverge from those of our partners without the ability to direct the management and operations of the joint venture or investment in the manner we believe most appropriate, or risks that our partners in strategic investments and infrastructure may encounter financial difficulties that could disrupt investee or partnership activities or impair assets acquired, which would adversely affect future reported results of operations and shareholders’ equity.
Although we intend to conduct extensive business, financial and legal due diligence in connection with the evaluation of future business or acquisition opportunities, there can be no assurance our due diligence investigations will identify every matter that could have a material adverse effect on us. We may be unable to adequately address the financial, legal and operational risks raised by such businesses, acquisitions or joint ventures. The realization of any unknown risks could expose us to unanticipated costs and liabilities and prevent or limit us from realizing the projected benefits of the businesses or acquisitions, which could adversely affect our financial condition and liquidity. In addition, our business, financial condition, results of operations and the ability to service our debt may be adversely impacted depending on specific risks applicable to any business or company we acquire.
Any future transactions could be material in size and scope, and our stockholders and potential investors may have virtually no substantive information about any new business upon which to base a decision whether to invest in our securities. In any event, depending upon the size and structure of any acquisitions or investments, stockholders are generally expected to not have the opportunity to vote on the transaction, and may not have access to any information about any new business until the transaction is completed and we file a report with the SEC disclosing the nature of such transaction and/or business. Similarly, we may effect material dispositions in the future.
We could consume resources in researching acquisitions, business opportunities or financings and capital market transactions that are not consummated, which could materially adversely affect subsequent attempts to locate and acquire or invest in another business
We anticipate that the investigation of each specific acquisition or business opportunity and the negotiation, drafting, and execution of relevant agreements, disclosure documents, and other instruments, with respect to such transaction, will require substantial management time and attention and substantial costs for financial advisors, accountants, attorneys and other advisors. If a decision is made not to consummate a specific acquisition, business opportunities or financings and capital market transactions investment or financing, the costs incurred up to that point for the proposed transaction likely would not be recoverable. Furthermore, even if an agreement is reached relating to a specific acquisition, investment target or financing, we may fail to consummate the investment or acquisition for any number of reasons, including those beyond our control. Any such event could consume significant management time and result in a loss to us of the related costs incurred, which could adversely affect our financial position and our ability to consummate other acquisitions and investments.
Possible strategic initiatives may impact our business
We will continue to evaluate the nature and scope of our operations and various short-term and long-term strategic considerations. There are uncertainties and risks relating to strategic initiatives. Also, prospective competitors may have greater financial resources. These factors may place us at a competitive disadvantage in successfully completing future acquisitions and investments. Future acquisitions or joint ventures may not be available on attractive terms, or at all. If we do make additional acquisitions, we may not be able to successfully integrate the acquired businesses. For example, we could face several challenges in the consolidation and integration of information technology, accounting systems, personnel and operations. In addition, while we believe that there may be target businesses that we could potentially acquire or invest in, our ability to compete with respect to the acquisition of certain target businesses that are sizable will be limited by our available financial resources. We may need to obtain additional financing in order to consummate future acquisitions and investment opportunities. We cannot assure you that any additional financing will be available to us on acceptable terms, if at all. This inherent competitive limitation gives others with greater financial resources an advantage in pursuing acquisition and investment opportunities. Finally, certain acquisitions or divestitures may be subject to governmental approvals, including FCC and DOJ, as well as applicable FCC rules and regulations. If we do not realize the expected benefits or synergies of such transactions, there may be an adverse effect on our business, financial condition and results of operations.
From time to time we may be subject to litigation for which we may be unable to accurately assess our level of exposure and which, if adversely determined, may have a material adverse effect on our consolidated financial condition or results of operations
We and our subsidiaries are or may become parties to legal proceedings that are considered to be either ordinary or routine litigation incidental to our or their current or prior businesses or not material to our consolidated financial position or liquidity. There can be no assurance that we will prevail in any litigation in which we or our subsidiaries may become involved, or that our or their insurance coverage will be adequate to cover any potential losses. To the extent that we or our subsidiaries sustain losses from any pending litigation which are not reserved or otherwise provided for or insured against, our business, financial condition, and results of operations could be materially adversely affected.
Section 404 of the Sarbanes-Oxley Act of 2002 requires us to document and test our internal controls over financial reporting and to report on our assessment as to the effectiveness of these controls. Any delays or difficulty in satisfying these requirements or negative reports concerning our internal controls could have a material adverse effect on our future results of operations and financial condition
The Sarbanes-Oxley Act of 2002 requires, among other things, that we maintain effective internal control over financial reporting and disclosure controls and procedures. We must perform system and process evaluation and testing of our internal control over financial reporting to allow our management to report on the effectiveness of our internal control over financial reporting, as required by Section 404 of the Sarbanes-Oxley Act of 2002. Our testing, or the subsequent testing by our independent registered public accounting firm, may reveal deficiencies in internal control over financial reporting that are deemed to be material weaknesses. Compliance with Section 404 may require that we incur substantial accounting expense and expend significant management time on compliance-related issues. The need to focus on compliance with Section 404 of Sarbanes-Oxley may strain management and finance resources and otherwise present additional administrative and operational challenges as our management seeks to comply with these requirements.
We may in the future discover areas of our internal controls that need improvement, particularly with respect to our existing acquired businesses, businesses that we may acquire in the future and newly formed businesses or entities. We cannot be certain that any remedial measures we take will ensure that we implement and maintain adequate internal controls over our financial reporting processes and reporting in the future.
Any failure to implement required new or improved controls, or difficulties encountered in their implementation, could harm our operating results or cause us to fail to meet our reporting obligations. If we are not able to comply with the requirements of Section 404 in a timely manner, if we fail to remedy any material weakness and maintain effective internal control over our financial reporting in the future, or if our independent registered public accounting firm is unable to provide us with an unqualified report regarding the effectiveness of our internal controls over financial reporting to the extent required by Section 404 of the Sarbanes-Oxley Act of 2002, our financial statements may be inaccurate, our ability to report our financial results on a timely and accurate basis may be adversely affected, investors could lose confidence in the reliability of our financial statements, our access to the capital markets may be restricted, the trading price of our common stock may decline, and we may be subject to sanctions or investigations by regulatory authorities, including the SEC or NYSE. In addition, failure to comply with our reporting obligations with the SEC may cause an event of default to occur under our debt instruments, or similar instruments governing any debt we incur in the future.
Changes in governmental regulation, interpretation or legislative reform could increase our cost of doing business and adversely affect our profitability
Laws and regulations, including in the areas of advertising, consumer affairs, data protection, finance, marketing, privacy, publishing and taxation requirements, are subject to change and differing interpretations. Changes in the political climate or in existing laws or regulations, or their interpretations, or the enactment of new laws or the issuance of new regulations or changes in enforcement priorities or activity could adversely affect us by, among other things:
•Increasing our administrative, compliance, and other costs;
•Increasing our tax obligations, including unfavorable outcomes from audits performed by tax authorities;
•Affecting our ability to continue to serve our customers and to attract new customers;
•Limiting our use of or access to personal information;
•Impacting the economics of creating or distributing content, anti-piracy efforts, or our ability to protect or exploit intellectual property rights;
•Restricting our ability to market our services; and
•Requiring us to implement additional or different programs and systems.
Extreme weather events and climate change could disrupt our broadcast operations and adversely affect our business
Our business is highly dependent on the ability to broadcast programming and maintain operations across a variety of platforms. Extreme weather events, such as hurricanes, floods, wildfires, and severe storms, may disrupt our ability to operate our broadcasting facilities and transmit signals to viewers. These events can damage or destroy our transmission towers, satellite equipment, and data centers, resulting in service interruptions and/or significant repair costs.
Severe weather events can also disrupt the availability of key personnel and impact our production capabilities, delaying or halting the production of scheduled programming. Additionally, these events may impair the physical infrastructure needed to support our distribution network, including cable systems, broadband networks, and transmission lines, thereby affecting our ability to deliver content to our audience.
Changes in weather patterns due to climate change could also have a significant impact on our advertising revenue. For example, extreme weather events may lead to reduced consumer spending or create advertising disruptions, as businesses may cut back on marketing expenditures in the aftermath of such events. Furthermore, regulatory changes related to climate change, including stricter environmental standards for broadcasting and emissions, could increase operational costs or affect our facilities.
Although we maintain business continuity plans and have made investments in infrastructure resilience, there can be no assurance that extreme weather events will not materially disrupt our operations or adversely affect our financial performance.
ITEM 1B. UNRESOLVED STAFF COMMENTS
None.
ITEM 1C. CYBERSECURITY
In today’s digital world, protecting our systems and data from cyberattacks and unintentional or malicious breaches is a priority for our leadership and Board of Directors. Our cybersecurity team is overseen by our Senior Vice President and Chief Technology Officer, who is directly supported by our Vice President of IT and Station Operations and our Senior Director of IT Security and Compliance. This leadership team has decades of experience leading cybersecurity oversight and managing our organization’s cybersecurity risks. Team members who support our information security program have relevant educational, industry experience, and technical certifications. The technical leadership team provides quarterly and annual cybersecurity updates to our Board of Directors, briefing the Board on our cyber program, industry trends and risks, and any incidents the Company has experienced. Directors with experience in cybersecurity and technology play crucial roles in strategy, innovation, and oversight of the Company’s technology investments. The Board oversees our annual enterprise risk assessment, where we assess key risks within the Company, including security and technology risks and cybersecurity threats.
TEGNA uses the National Institute of Standards and Technology (NIST) Cybersecurity Framework and has clearly defined policies and standards for all employees and technical systems. We use external subject matter experts to provide independent assessments of the cybersecurity program. Following the NIST Cybersecurity Framework, TEGNA utilizes internal reporting, policies, software, training programs, secure software development coding practices and hardware solutions to protect and monitor our environment, including multifactor authentication on all critical systems, firewalls, intrusion, detection and prevention systems, vulnerability and penetration testing and identity management systems. Our network is continuously monitored using prevailing industry tools, and our cybersecurity team promptly investigates any anomalies. TEGNA has an extensive patching and software update program, and performance metrics are reported to our Board. All new employees are required to take a cybersecurity training course, and we have mandatory quarterly training modules for all employees.
We maintain third-party vendor policies and practices to identify, prioritize, and mitigate and remediate third party risk. Third-party access is narrowly limited in scope, granting access only to necessary systems with the lowest level of privileges required. Third-party access is monitored, and accounts are reviewed and attested to on a quarterly basis. TEGNA relies on third parties to implement security programs commensurate with their risk, and we cannot ensure in all circumstances that their efforts will be successful.
TEGNA has documented and tested incident response plans, which outline the steps to be followed from incident detection to containment, recovery, and notification, including notifying functional areas, as well as senior leadership and the Board, as appropriate. With assistance from third-party cybersecurity experts, TEGNA regularly conducts cybersecurity tabletop exercises with leadership and technical teams. TEGNA conducts compliance reviews of all cybersecurity policies and procedures at least annually and utilizes an outside cybersecurity firm to evaluate the overall program. Business units are required to attest to applicable TEGNA security controls monthly.
Notwithstanding the extensive approach TEGNA takes to cybersecurity, we face a number of cybersecurity risks in connection with our business. Although to date such risks have not materially affected us, including our business strategy, results of operations or financial condition, we have from time-to-time experienced threats to our information systems and data. For more information about the cybersecurity risks we face, see Item 1A. “Risk Factors”.
ITEM 2. PROPERTIES
The types of properties required to support our television stations include offices, studios, sales offices, tower and transmitter sites. A listing of television station locations can be found on page 13. Our digital and multicast businesses that support our broadcast operations lease their facilities. This includes facilities for executive offices, sales offices and data centers. A listing of our digital businesses locations can be found on page 14. We lease our corporate headquarters facility, which is located in Tysons, VA. We believe that none of our individual properties represents a material amount of the total properties owned or leased.
We believe all of our owned and leased facilities are in satisfactory condition, are well maintained, and are adequate for current use.
ITEM 3. LEGAL PROCEEDINGS
Information regarding legal proceedings may be found in Note 11 of the Notes to consolidated financial statements.
ITEM 4. MINE SAFETY DISCLOSURES
Not applicable.
PART II
ITEM 5. MARKET FOR REGISTRANT’S COMMON EQUITY, RELATED STOCKHOLDER MATTERS AND ISSUER PURCHASES OF EQUITY SECURITIES
Our approximately 159.9 million outstanding shares of common stock were held by 5,230 shareholders of record as of February 19, 2025. Our shares are traded on the New York Stock Exchange (NYSE) with the symbol TGNA.
Purchases of Equity Securities
On June 2, 2023, we entered into an accelerated share repurchase program (the first ASR) with JPMorgan Chase Bank, National Association (JPMorgan). Under the terms of the first ASR, we repurchased $300 million in TEGNA common stock from JPMorgan, with an initial delivery of approximately 15.2 million shares received on June 6, 2023, representing 80% ($240 million) of the value of the first ASR contract. The first ASR program was completed in August 2023 at which time JPMorgan delivered an additional 3.1 million shares to us. The final share settlement was based on the average daily volume-weighted average price of TEGNA shares during the term of the first ASR program, less a discount, less the previously delivered 15.2 million shares.
On November 9, 2023, we entered into a second accelerated share repurchase (the second ASR) program with JPMorgan. Under the terms of the second ASR, we repurchased $325 million in TEGNA common stock from JPMorgan, with an initial delivery of approximately 17.3 million shares received on November 13, 2023, representing 80% ($260 million) of the value of the second ASR contract. The second ASR program was completed in February 2024, at which time JPMorgan delivered an additional 4.0 million shares to us. The share settlement was based on the average daily volume-weighted average price of TEGNA shares during the term of the second ASR program, less a discount, less the previously delivered 17.3 million shares.
In the third quarter of 2023, 1.7 million shares were repurchased at an average share price of $15.96 for an aggregate cost of $27.9 million. These shares were repurchased under the previous share repurchase program that the Board of Directors authorized in December 2020 and expired on December 31, 2023.
The following table presents stock repurchases by the Company during the three-month period ended December 31, 2024 (in thousands, except per share amount):
| | | | | | | | | | | | | | | | | |
Period | | Total
Number
of Shares
Purchased | | | Average
Price Paid
per Share | | | Total Number
of Shares
Purchased as
Part of
Publicly
Announced
Plans or
Programs | | | Approximate
Dollar Value
of Shares
that May Yet
be Purchased
Under the
Plans or
Programs | | |
| | | | | | | | | | | | | |
October 1, 2024 - October 31, 2024 | | | 1,442 | | | $ | 16.07 | | | | 1,442 | | | | 400,839 | | |
November 1, 2024 - November 30, 2024 | | | 1,105 | | | | 18.11 | | | | 1,105 | | | | 380,835 | | |
December 1, 2024 - December 31, 2024 | | | 303 | | | $ | 18.72 | | | | 303 | | | | 375,173 | | |
Total Fourth Quarter 2024 | | | 2,850 | | | | | | | 2,850 | | | | | |
In December 2023, our Board of Directors authorized a new share repurchase program for up to $650.0 million of our common stock through December 31, 2025. The shares may be repurchased at management’s discretion, either on the open market or in privately negotiated block transactions. Management’s decision to repurchase shares will depend on price, blackout periods and other corporate developments. Purchases may occur from time to time and no maximum purchase price has been set. In 2024, we repurchased 18.6 million shares under this program at an average share price of $14.79 for an aggregate cost of $274.8 million. As of the end of 2024, $375.2 million of common shares may still be repurchased under this program. See Part II, Item 7. “Management’s Discussion and Analysis of Financial Condition and Results of Operations” herein for additional information about our share repurchase program.
Dividend Policy
Since 2017, we have been paying a regular quarterly cash dividend. We paid dividends totaling $81.4 million in 2024 and $83.5 million in 2023. In the second quarter of 2024, we announced a 10% increase to our quarterly dividend from 11.375 to 12.5 cents per share. This increase builds on a 20 percent increase to TEGNA’s dividend in 2023. The most recent increase to the dividend took effect beginning with the July 1, 2024 dividend payment. See Part II, Item 7. “Management’s Discussion and Analysis of Financial Condition and Results of Operations” herein for additional information about our dividend policy.
Comparison of Shareholder Return – 2020 to 2024
The following graph compares the performance of our common stock during the period December 31, 2019, to December 31, 2024, with the S&P 500 Index, and a peer group index we selected.
Our peer group includes E.W. Scripps Company, Gray Television Inc., Nexstar Media Group, Inc., and Sinclair, Inc. (collectively, the Peer Group). The Peer Group includes the largest publicly traded pure-play and diversified television broadcasting companies with meaningful television station assets and broadcast exposure. No such company of relevant scale is excluded from the Peer Group, except for the television networks, which are part of much larger entities in which television stations are a relatively small part of the aggregate enterprise.
The S&P 500 Index includes 500 U.S. companies in the industrial, utilities and financial sectors and is weighted by market capitalization. The total returns of our Peer Group index is also weighted by market capitalization.
The graph depicts representative results of investing $100 in our common stock, the S&P 500 Index, and the Peer Group index as of closing on December 31, 2019. It assumes that dividends were reinvested monthly with respect to our common stock, daily with respect to the S&P 500 Index and monthly with respect to the Peer Group companies.
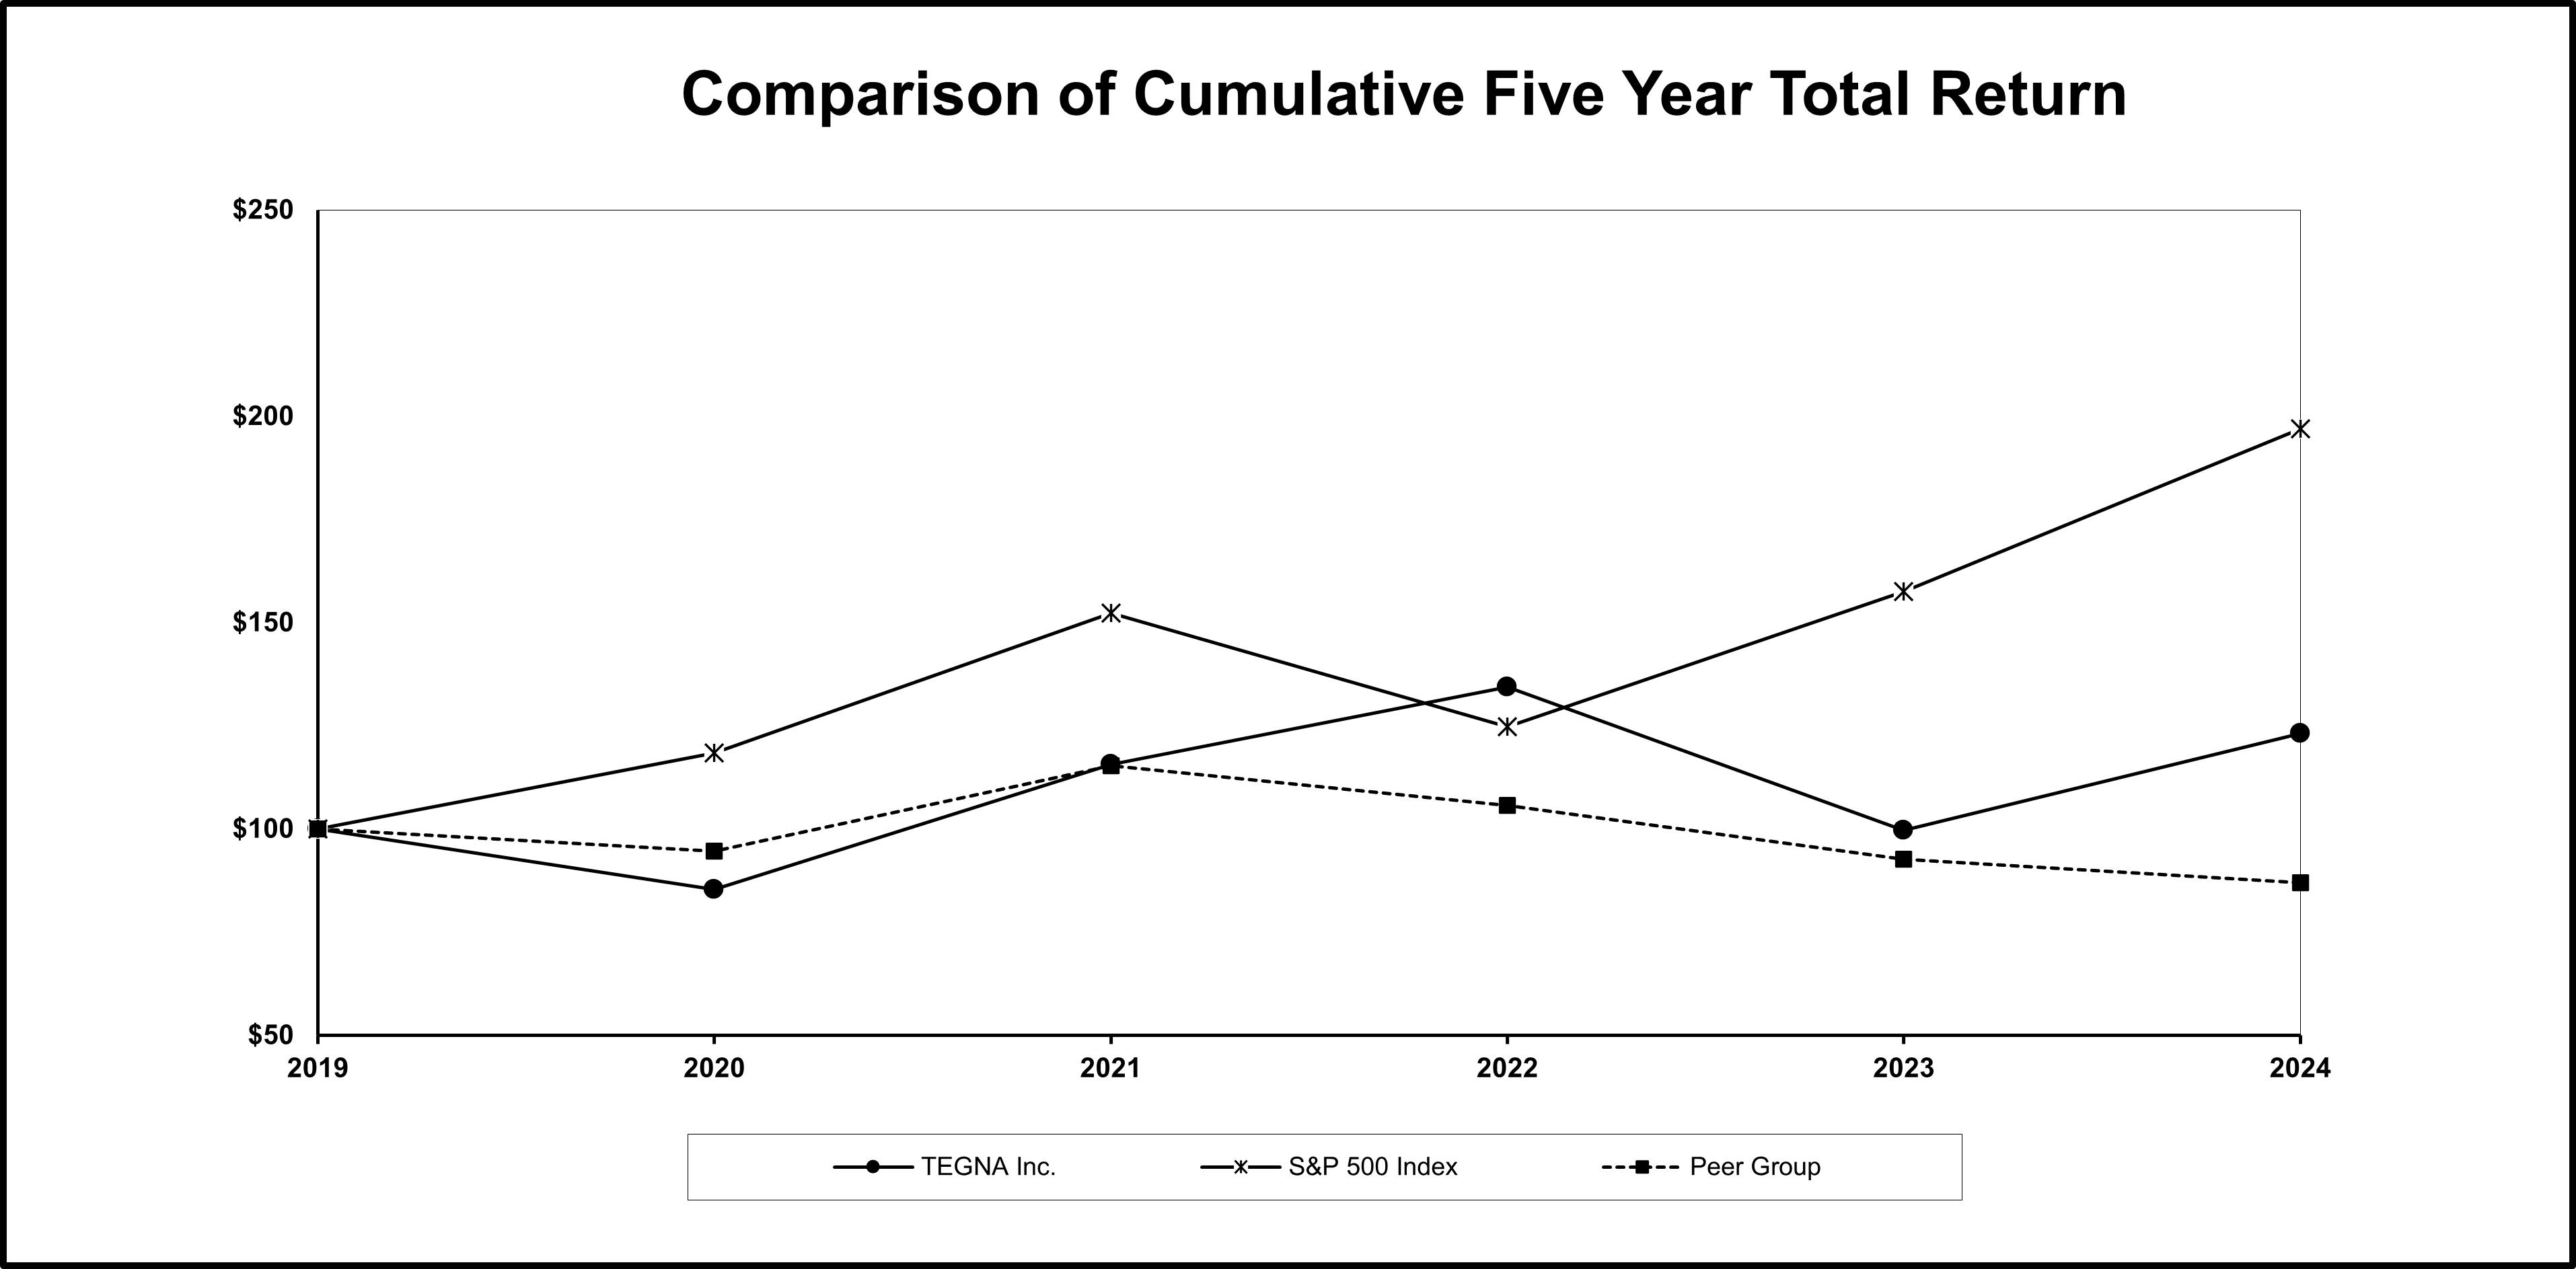
| | | | | | | | | | | | | | | | | | | | | | | | |
| | | | | INDEXED RETURNS | |
| | | | | Year Ended | |
Company Name / Index | | | 2019 | | | 2020 | | | 2021 | | | 2022 | | | 2023 | | | 2024 | |
TEGNA Inc. | | | 100 | | | $ | 85.36 | | | $ | 115.72 | | | $ | 134.49 | | | $ | 99.69 | | | $ | 123.15 | |
S&P 500 Index | | | 100 | | | $ | 118.40 | | | $ | 152.39 | | | $ | 124.79 | | | $ | 157.59 | | | $ | 197.02 | |
Peer Group | | | 100 | | | $ | 94.71 | | | $ | 115.29 | | | $ | 105.70 | | | $ | 92.68 | | | $ | 87.01 | |
ITEM 6. [RESERVED]
ITEM 7. MANAGEMENT’S DISCUSSION AND ANALYSIS OF FINANCIAL CONDITION AND RESULTS OF OPERATIONS
Introduction
TEGNA Inc. serves local communities across the U.S. through trustworthy journalism, engaging content, and tools to help people navigate their daily lives. Through customized marketing solutions, we help businesses grow and thrive. With 64 television stations and two radio stations in 51 U.S. markets, we are the largest owner of top four network affiliates in the top 25 markets among independent station groups, reaching approximately 39% of U.S. television households. We are one of the nation’s largest producers of local news producing more than 1,700 hours of news per week. Additionally, through our network affiliation and local sports rights agreements, we carry popular sports content which includes professional and collegiate sports and the Olympics. We also own leading multicast networks True Crime Network and Quest. Each television station has a robust digital presence across online, mobile, connected television and social platforms, reaching consumers on all devices and platforms they use to consume news content. Our combined local and national sales forces capitalize on the reach provided by these offerings to provide our advertising customers with an extensive customer base. We have been consistently honored with the industry’s top awards, including Edward R. Murrow, George Polk, Alfred I. DuPont and Emmy Awards. We deliver results for advertisers across television, digital, connected TV (CTV) and streaming app and CTV platforms, including Premion, our streaming app advertising network.
We have one operating and reportable segment. The primary sources of our revenues are: 1) subscription revenues, reflecting fees paid by satellite, cable, and streaming apps (services that deliver video content to consumers over the Internet) and telecommunications providers to carry our television signals on their systems; 2) advertising & marketing services (AMS) revenues, which include local and national non-political television advertising, digital marketing services (including Premion), and advertising on stations’ websites, tablet and mobile products and streaming apps; 3) political advertising revenues, which are driven by even-year election cycles at the local and national level (e.g., 2022, 2024, etc.) and particularly in the second half of those years; and 4) other services, such as production of programming, tower rentals and distribution of our local news content.
Seasonality: Our revenues and operating results are subject to seasonal fluctuations, with our second and fourth quarter operating results generally being stronger than those of the first and third quarters, driven by the increases in spring seasonal advertising in second quarter and in advertising for the holiday season in the fourth quarter. In addition, our revenue and operating results are subject to significant fluctuations across yearly periods resulting from political advertising. In even numbered years, political spending is usually significantly higher than in odd numbered years due to advertising for the local and national elections. Additionally, every four years, we typically experience even greater increases in political advertising in connection with the presidential election. The strong demand for advertising from political advertisers in these even years can result in the significant use of our available inventory (leading to a “crowd out” effect), which can diminish our AMS revenue in the even year of a two-year election cycle, particularly in the fourth quarter of those years.
Consolidated Results from Operations
The following discussion is a comparison of our consolidated results on a GAAP basis. The year-to-year comparison of financial results is not necessarily indicative of future results. In addition, see the section on page 32 titled ‘Operating results non-GAAP information’ for additional tables presenting information which supplements our financial information provided on a GAAP basis.
For a comparative discussion of our results of operations for the years ended December 31, 2023 and December 31, 2022, see “Part II, Item 7. Management’s Discussion and Analysis of Financial Condition and Results of Operations” of our annual report on Form 10-K for the year ended December 31, 2023, filed with the SEC on February 29, 2024.
A consolidated summary of our results is presented below (in thousands, except per share amounts):
| | | | | | | | | | |
| | Year ended Dec. 31, |
| | 2024 | | | 2023 | | | Change |
Revenues: | | $ | 3,101,971 | | | $ | 2,910,930 | | | 7% |
| | | | | | | | |
Operating expenses: | | | | | | | | |
Cost of revenues | | | 1,756,115 | | | | 1,718,857 | | | 2% |
Business units - Selling, general and administrative
expenses | | | 394,589 | | | | 412,000 | | | (4%) |
Corporate - General and administrative expenses | | | 51,851 | | | | 65,933 | | | (21%) |
Depreciation | | | 59,935 | | | | 59,769 | | | 0% |
Amortization of intangible assets | | | 53,600 | | | | 53,467 | | | 0% |
Asset impairment and other | | | 1,097 | | | | 3,359 | | | (67%) |
Merger termination fees | | | — | | | | (136,000 | ) | | *** |
Total | | $ | 2,317,187 | | | $ | 2,177,385 | | | 6% |
Operating income | | $ | 784,784 | | | $ | 733,545 | | | 7% |
Non-operating (expense) income: | | | | | | | | |
Interest expense | | $ | (169,238 | ) | | $ | (172,904 | ) | | (2%) |
Interest income | | | 26,991 | | | | 29,292 | | | (8%) |
Other non-operating items, net | | | 130,450 | | | | 16,613 | | | *** |
Total | | | (11,797 | ) | | | (126,999 | ) | | (91%) |
Income before income taxes | | | 772,987 | | | | 606,546 | | | 27% |
Provision for income taxes | | | 173,944 | | | | 130,199 | | | 34% |
Net income | | | 599,043 | | | | 476,347 | | | 26% |
Net loss attributable to redeemable noncontrolling interest | | | 775 | | | | 377 | | | *** |
Net income attributable to TEGNA Inc. | | $ | 599,818 | | | $ | 476,724 | | | 26% |
| | | | | | | | |
Net Income per share - basic | | $ | 3.55 | | | $ | 2.29 | | | 55% |
Net Income per share - diluted | | $ | 3.53 | | | $ | 2.28 | | | 55% |
*** Not meaningful
Revenues
Our Subscription revenue category includes revenue earned from MVPDs and vMVPDs for the right to carry our signals and the distribution of TEGNA stations on their services. Our AMS category includes all sources of our traditional television advertising and digital revenues including Premion and other digital advertising and marketing revenues across our platforms.
The following table summarizes the year-over-year changes in our revenue categories (in thousands):
| | | | | | | | | |
| Year ended Dec. 31, |
| 2024 | | | 2023 | | | Change |
Subscription | $ | 1,455,811 | | | $ | 1,527,563 | | | (5%) |
Advertising & Marketing Services | | 1,226,638 | | | | 1,289,903 | | | (5%) |
Political | | 373,229 | | | | 45,800 | | | *** |
Other | | 46,293 | | | | 47,664 | | | (3%) |
Total revenues | $ | 3,101,971 | | | $ | 2,910,930 | | | 7% |
*** Not meaningful
Total revenues increased $191.0 million in 2024. The increase was primarily due to a $327.4 million increase in political revenue, reflecting the even-year political cycle. Partially offsetting this increase was a $71.8 million decrease in subscription revenue, due to declines in subscribers. These declines were partially offset by contractual rate increases under our retransmission agreements. Additionally, AMS revenue decreased $63.3 million, primarily due to continued softness in the national advertising market and the impacts of the political crowd out effect. These AMS declines were partially offset by increased advertising spending related to the Summer Olympic Games.
Cost of revenues
Cost of revenues increased $37.3 million in 2024. This increase was primarily driven by increases in payroll-related costs of $13.1 million, workforce restructuring costs of $4.9 million, employee stock-based compensation of $3.9 million, programming costs of $2.9 million and employee retention cost of $2.3 million. The remaining increase was primarily driven by outside service costs and digital ad serving and platform fees.
Business units - Selling, general and administrative expenses
Business unit selling, general, and administrative expenses decreased $17.4 million in 2024 compared to 2023. The decrease was primarily due to decreases in professional service costs of $29.7 million as a result of cost saving initiatives, partially offset by increases from workforce restructuring of $9.9 million, employee stock-based compensation of $2.2 million, and employee retention costs of $1.8 million.
Corporate - General and administrative expenses
Our corporate costs are separated from our direct business expenses and are recorded as general and administrative expenses in our Consolidated Statements of Income. This category primarily consists of corporate management and support functions including Legal, Human Resources, and Finance.
Corporate general and administrative expenses decreased $14.1 million in 2024. The decrease was primarily driven by a decline in merger and acquisition (M&A)-related costs of $17.6 million, partially offset by increases in employee retention costs of $2.6 million and workforce restructuring costs of $2.7 million.
Depreciation expense
Depreciation expense increased $0.2 million in 2024.
Amortization of intangible assets
Intangible asset amortization expense increased $0.1 million in 2024. The increase was primarily due to the amortization of intangible assets acquired in the Octillion Media acquisition, offset by a decrease in amortization due to certain intangible assets reaching the end of their assumed useful lives and therefore becoming fully amortized.
Asset impairment and other
We had other expense of $1.1 million in 2024 compared to $3.4 million in 2023. The 2024 activity was due to a contract termination fee. The 2023 activity was due to a $3.4 million impairment charge recognized on certain programming assets.
Merger termination fee
On February 22, 2022, we entered into an Agreement and Plan of Merger (as amended, the Merger Agreement), with Teton Parent Corp. (Parent). On May 22, 2023, after a protracted regulatory review, we terminated the Merger Agreement in accordance with its terms. Per the terms of the Merger Agreement, we received $136.0 million in 2023 as a result of this termination which was satisfied in TEGNA common stock and recorded as a reduction in operating expense in 2023.
Operating income
Operating income increased $51.2 million in 2024 compared to 2023, primarily driven by an increase in political revenue of $327.4 million. This net increase was partially offset by the absence of the $136.0 million Merger termination fee, a $71.8 million decrease in subscription revenue and a $63.3 million decline in AMS revenue. Adjusted operating income, a non-GAAP measure, increased $188.8 million, primarily due to the increases in political revenues, partially offset by declines in subscription and AMS revenues discussed above. For information on the nature and magnitude of items excluded from non-GAAP results, and a reconciliation to the most directly comparable GAAP measure, see the “Operating results non-GAAP information” section below.
Non-operating (expense) income
Interest expense: Interest expense decreased by $3.7 million in 2024 as compared to 2023, due to decreased fees associated with an amendment to our revolving credit facility as a result of reducing the size of the facility to $750 million from $1.5 billion.
A further discussion of our borrowing and financing activities is presented in the “Liquidity and capital resources” section of this report beginning on page 34 and in Note 5 to the consolidated financial statements.
Interest income: Interest income was $27.0 million in 2024, a decrease of $2.3 million as compared to 2023, primarily due to a lower average investable cash balance.
Other non-operating items, net: Other non-operating items, net, increased $113.8 million, primarily from a gain of $152.9 million recognized on the sale of our investment in Broadcast Music, Inc. in 2024. Partially offsetting this increase was the absence of the $25.8 million gain on the partial sale of our MadHive investment in 2023 and a $10.3 million settlement charge recognized in 2024 as a result of lump sum payments made to certain TEGNA retirement plan participants.
Provision for income taxes
We reported pre-tax income of $773.0 million for 2024. The effective tax rate on pre-tax income was 22.5%. The 2024 effective tax rate increased compared to 21.5% in 2023 primarily due to the 2023 tax rate being favorably impacted by the deduction of previously capitalized transaction costs resulting from the termination of the Merger Agreement and a portion of the Merger termination fee being treated as non-taxable. The 2024 effective tax rate benefited from the purchase of federal clean energy tax credits, remeasurement of deferred taxes associated with updating state tax rates after filing of the Company’s 2023 tax returns, and discrete tax benefits as a result of a favorable settlement of an IRS audit related to the 2016 and 2017 tax years.
Further information concerning income tax matters is contained in Note 4 of the consolidated financial statements.
Net income attributable to TEGNA Inc.
Net income attributable to TEGNA Inc. and related per share amounts are presented in the table below (in thousands, except per share amounts):
| | | | | | | | | | |
| | 2024 | | | 2023 | | | Change |
Net income attributable to TEGNA (GAAP basis) | | $ | 599,818 | | | $ | 476,724 | | | 26% |
Per diluted share attributable to TEGNA (GAAP basis) | | $ | 3.53 | | | $ | 2.28 | | | 55% |
| | | | | | | | | | |
| | 2024 | | | 2023 | | | Change |
Net income attributable to TEGNA (non-GAAP basis) | | $ | 520,972 | | | $ | 363,752 | | | 43% |
Per diluted share attributable to TEGNA (non-GAAP basis) | | $ | 3.07 | | | $ | 1.74 | | | 76% |
On a GAAP and non-GAAP basis, 2024 net income attributable to TEGNA Inc. and earnings per share were higher than 2023 due to the factors discussed above. In addition, earnings per share amounts benefited from share repurchases in 2023 and 2024, as discussed below. For information on the nature and magnitude of items excluded from non-GAAP results, and a reconciliation to the most directly comparable GAAP measure, see “Results from Operations-Non-GAAP Information” section.
The weighted average number of diluted common shares outstanding for the year ended 2024 and 2023 were 169.2 million and 207.9 million, respectively. The decline in the number of diluted common shares outstanding was primarily due to share repurchases of 39.5 million under our ASR programs, which began in the second quarter of 2023, the receipt of 8.6 million shares to satisfy the Merger termination fee which occurred in the second quarter of 2023 and share repurchases of 18.6 million that occurred in 2024 under our authorized repurchase program.
Operating results non-GAAP information
Presentation of non-GAAP information: We use non-GAAP financial performance measures to supplement the financial information presented on a GAAP basis. These non-GAAP financial measures should not be considered in isolation from, or as a substitute for, the related GAAP measures, nor should they be considered superior to the related GAAP measures and should be read together with financial information presented on a GAAP basis. Also, our non-GAAP measures may not be comparable to similarly titled measures of other companies.
Our management and our Board of Directors (the Board) regularly use Employee compensation, Corporate – General and administrative expenses, Operating expenses, Operating income, Income before income taxes, Provision for income taxes, Net income attributable to TEGNA Inc., and Diluted earnings per share, each presented on a non-GAAP basis, for purposes of evaluating company performance. Management and the Board also use Adjusted EBITDA to evaluate our performance. The Leadership Development and Compensation Committee of our Board uses non-GAAP measures such as Adjusted EBITDA, non-GAAP net income, non-GAAP EPS to evaluate and compensate senior management. We, therefore believe that each of the non-GAAP measures presented provides useful information to investors and other stakeholders by allowing them to view our business through the eyes of management and our Board, facilitating comparisons of results across historical periods and focus on the underlying ongoing operating performance of our business. We also believe these non-GAAP measures are frequently used by investors, securities analysts and other interested parties in their evaluation of our business and other companies in the broadcast industry.
We discuss in this Form 10-K non-GAAP financial performance measures that exclude from our reported GAAP results the impact of “special items” which are described in detail below in the section titled “Discussion of Special Charges and Credits Affecting Reported Results.” We believe that such expenses and gains are not indicative of normal, ongoing operations. While these items should not be disregarded in evaluation of our earnings performance, it is useful to exclude such items when analyzing current results and trends compared to other periods as these items can vary significantly from period to period depending on specific underlying transactions or events that may occur. Therefore, while we may incur or recognize these types of expenses, charges, and gains in the future, we believe that removing these items for purposes of calculating the non-GAAP financial measures provides investors with a more focused presentation of our ongoing operating performance.
We also discuss Adjusted EBITDA (with and without stock-based compensation expense), a non-GAAP financial performance measure that we believe offers a useful view of the overall operation of its businesses. We define Adjusted EBITDA as net income attributable to TEGNA before (1) net loss attributable to redeemable noncontrolling interest, (2) income taxes, (3) interest expense, (4) interest income, (5) other non-operating items, net, (6) M&A-related costs, (7) employee retention costs, (8) workforce restructuring costs, (9) asset impairment and other, (10) the Merger termination fee, (11) earnout adjustments, (12) depreciation and (13) amortization of intangible assets. We believe these adjustments facilitate company-to-company operating performance comparisons by removing potential differences caused by variations unrelated to operating performance, such as capital structures (interest expense), income taxes, and the age and book appreciation of property and equipment (and related depreciation expense). The most directly comparable GAAP financial measure to Adjusted EBITDA is Net income attributable to TEGNA. Users should consider the limitations of using Adjusted EBITDA, including the fact that this measure does not provide a complete measure of our operating performance. Adjusted EBITDA is not intended to purport to be an alternate to net income as a measure of operating performance or to cash flows from operating activities as a measure of liquidity. In particular, Adjusted EBITDA is not intended to be a measure of cash flow available for management’s discretionary expenditures, as this measure does not consider certain cash requirements, such as working capital needs, capital expenditures, contractual commitments, interest payments, tax payments and other debt service requirements.
Discussion of special charges and credits affecting reported results: Our results during 2024 and 2023 included the following items we consider “special items” that while at times recurring, can vary significantly from period to period:
Results for the year ended December 31, 2024:
•Octillion acquisition earnout adjustments;
•Retention costs, including stock-based compensation (SBC) and cash payments to certain employees to ensure their continued service to the Company;
•Workforce restructuring;
•Asset impairment and other consisting of a contract termination fee;
•Other non-operating item consisting of a gain recognized on the sale of our investment in Broadcast Music Inc. (BMI) and pension settlement charge related to the acceleration of previously deferred pension costs as a result of lump sum TEGNA Retirement Plan (TRP) payments; and
•Tax expense associated with the difference between the tax impact calculated on the BMI gain using the estimated annual effective tax rate at interim quarters and the final full-year tax impact calculated using the statutory tax rate.
Results for the year ended December 31, 2023:
•Retention costs, including stock-based compensation (SBC) and cash payments to certain employees to ensure their continued service to the Company;
•Asset impairment and other consisting of certain programming asset impairments;
•Other non-operating item consisting of a gain recognized on the partial sale of one of our equity investments; and
•Tax benefits associated with previously disallowed transaction costs and the release of a valuation allowance on a deferred tax asset related to an equity method investment.
Below are reconciliations of certain line items impacted by special items to the most directly comparable financial measure calculated and presented in accordance with GAAP on our Consolidated Statements of Income (in thousands, except per share amounts):
| | | | | | | | | | | | | | | | | | | | | | | | | | | | | | | | | | | | | | | | |
| | | | | Special Items | | | | |
Year ended
Dec. 31, 2024 | | GAAP
measure | | | M&A-related costs | | | Earnout adjustments | | | Retention costs - SBC | | | Retention costs - Cash | | | Workforce restructuring | | | Asset impairment and other | | | Other non-operating item | | | Special
tax item | | | Non-GAAP
measure | |
| | | | | | | | | | | | | | | | | | | | | | | | | | | | | | |
Employee compensation | | $ | 752,753 | | | $ | — | | | $ | — | | | $ | (9,955 | ) | | $ | (4,333 | ) | | $ | (18,931 | ) | | $ | — | | | $ | — | | | $ | — | | | $ | 719,534 | |
Corporate - General and administrative expenses | | | 51,851 | | | | (2,290 | ) | | | — | | | | (3,307 | ) | | | (2,227 | ) | | | (2,725 | ) | | | — | | | | — | | | | — | | | | 41,302 | |
Operating expenses | | | 2,317,187 | | | | (2,290 | ) | | | 3,453 | | | | (9,955 | ) | | | (4,333 | ) | | | (18,931 | ) | | | (1,097 | ) | | | — | | | | — | | | | 2,284,034 | |
Operating income | | | 784,784 | | | | 2,290 | | | | (3,453 | ) | | | 9,955 | | | | 4,333 | | | | 18,931 | | | | 1,097 | | | | — | | | | — | | | | 817,937 | |
Income before income taxes | | | 772,987 | | | | 2,290 | | | | (3,453 | ) | | | 9,955 | | | | 4,333 | | | | 18,931 | | | | 1,097 | | | | (142,552 | ) | | | — | | | | 663,588 | |
Provision for income taxes | | | 173,944 | | | | 593 | | | | (887 | ) | | | 1,186 | | | | 748 | | | | 4,129 | | | | 284 | | | | (33,972 | ) | | | (2,634 | ) | | | 143,391 | |
Net income attributable to TEGNA Inc. | | | 599,818 | | | | 1,697 | | | | (2,566 | ) | | | 8,769 | | | | 3,585 | | | | 14,802 | | | | 813 | | | | (108,580 | ) | | | 2,634 | | | | 520,972 | |
Earnings per share - diluted (a) | | $ | 3.53 | | | $ | 0.01 | | | $ | (0.02 | ) | | $ | 0.05 | | | $ | 0.02 | | | $ | 0.09 | | | $ | — | | | $ | (0.64 | ) | | $ | 0.02 | | | $ | 3.07 | |
| | | | | | | | | | | | | | | | | | | | | | | | | | | | | | | | | | | | |
| | | | | Special Items | | | | |
Year ended
Dec. 31, 2023 | | GAAP
measure | | | M&A-related costs | | | Retention costs - SBC | | | Retention costs - Cash | | | Merger termination fee | | | Asset impairment and other | | | Other non-operating item | | | Special
tax item | | | Non-GAAP
measure | |
| | | | | | | | | | | | | | | | | | | | | | | | | | | |
Employee compensation | | $ | 712,155 | | | $ | (1,479 | ) | | $ | (3,904 | ) | | $ | (4,448 | ) | | $ | — | | | $ | — | | | $ | — | | | $ | — | | | $ | 702,324 | |
Corporate - General and administrative expenses | | | 65,933 | | | | (19,848 | ) | | | (1,072 | ) | | | (2,117 | ) | | | — | | | | — | | | | — | | | | — | | | | 42,896 | |
Operating expenses | | | 2,177,385 | | | | (19,848 | ) | | | (3,904 | ) | | | (4,448 | ) | | | 136,000 | | | | (3,359 | ) | | | — | | | | — | | | | 2,281,826 | |
Operating income | | | 733,545 | | | | 19,848 | | | | 3,904 | | | | 4,448 | | | | (136,000 | ) | | | 3,359 | | | | — | | | | — | | | | 629,104 | |
Income before income taxes | | | 606,546 | | | | 19,848 | | | | 3,904 | | | | 4,448 | | | | (136,000 | ) | | | 3,359 | | | | (25,809 | ) | | | — | | | | 476,296 | |
Provision for income taxes | | | 130,199 | | | | 4,552 | | | | 500 | | | | 590 | | | | (24,504 | ) | | | 860 | | | | (6,604 | ) | | | 7,328 | | | | 112,921 | |
Net income attributable to TEGNA Inc. | | | 476,724 | | | | 15,296 | | | | 3,404 | | | | 3,858 | | | | (111,496 | ) | | | 2,499 | | | | (19,205 | ) | | | (7,328 | ) | | | 363,752 | |
Earnings per share - diluted (a) | | $ | 2.28 | | | $ | 0.07 | | | $ | 0.02 | | | $ | 0.02 | | | $ | (0.54 | ) | | $ | 0.01 | | | $ | (0.09 | ) | | $ | (0.04 | ) | | $ | 1.74 | |
(a) Per share amounts do not sum due to rounding.
Adjusted EBITDA
Reconciliations of Adjusted EBITDA (inclusive and exclusive of stock-based compensation expenses) to net income attributable to TEGNA Inc. presented in accordance with GAAP on our Consolidated Statements of Income is presented below (in thousands):
| | | | | | | | | | |
| | 2024 | | | Change | | 2023 | |
Net income attributable to TEGNA Inc. (GAAP basis) | | $ | 599,818 | | | 26% | | $ | 476,724 | |
Less: Net loss attributable to redeemable noncontrolling
interest | | | (775 | ) | | *** | | | (377 | ) |
Less: Interest income | | | (26,991 | ) | | (8%) | | | (29,292 | ) |
Less: Other non-operating items, net | | | (130,450 | ) | | *** | | | (16,613 | ) |
Plus: Provision for income taxes | | | 173,944 | | | 34% | | | 130,199 | |
Plus: Interest expense | | | 169,238 | | | (2%) | | | 172,904 | |
Operating income (GAAP basis) | | $ | 784,784 | | | 7% | | $ | 733,545 | |
Less: Merger termination fee | | | — | | | *** | | | (136,000 | ) |
Less: Octillion Earnout adjustments | | | (3,453 | ) | | *** | | | — | |
Plus: M&A-related costs | | | 2,290 | | | (88%) | | | 19,848 | |
Plus: Retention costs - Employee awards stock-based compensation | | | 9,955 | | | *** | | | 3,904 | |
Plus: Retention costs - Cash | | | 4,333 | | | (3%) | | | 4,448 | |
Plus: Workforce restructuring | | | 18,931 | | | *** | | | — | |
Plus: Asset impairment and other | | | 1,097 | | | (67%) | | | 3,359 | |
Adjusted operating income (non-GAAP basis) | | $ | 817,937 | | | 30% | | $ | 629,104 | |
Plus: Depreciation | | | 59,935 | | | 0% | | | 59,769 | |
Plus: Amortization of intangible assets | | | 53,600 | | | 0% | | | 53,467 | |
Adjusted EBITDA | | $ | 931,472 | | | 25% | | $ | 742,340 | |
Stock-based compensation: | | | | | | | | |
Employee awards | | | 28,579 | | | 39% | | | 20,593 | |
Company stock 401(k) match contributions | | | 18,702 | | | 0% | | | 18,629 | |
Adjusted EBITDA before stock-based compensation costs | | $ | 978,753 | | | 25% | | $ | 781,562 | |
*** Not meaningful
Adjusted EBITDA margin was 30% with stock-based compensation expenses and 32% without those expenses. Our total Adjusted EBITDA increased $189.1 million or 25% in 2024 compared to 2023, due to an increase in political revenue, partially offset by a decrease in subscription and AMS revenue.
FINANCIAL POSITION
Liquidity and capital resources
Our operations generate strong positive operating cash flow which, along with availability under our revolving credit facility and cash and cash equivalents on hand, have been sufficient to fund our capital expenditures, interest payments, dividends, share repurchases, investments in strategic initiatives and other operating requirements.
We paid dividends totaling $81.4 million in 2024 and $83.5 million in 2023. In the first quarter of 2024 we announced a 10% increase to our quarterly dividend from 11.375 to 12.5 cents per share. We paid the previously declared regular quarterly dividend of 11.375 cents per share on April 1, 2024, to stockholders of record as of the close of business on March 8, 2024, and paid the increased dividend of 12.5 cents per share on July 1, 2024 to stockholders of record as of the close of business on June 7, 2024.
As a result of the termination of the Merger Agreement, Parent was required to pay us a $136.0 million termination fee. In lieu of cash payment for the termination fee, we agreed to accept 8.6 million shares of TEGNA common stock.
In February 2024, our Board of Directors approved a comprehensive capital allocation framework to support shareholder value creation that included distribution of free cash flow to shareholders, comprising between 40 and 60 percent of our free cash flow generated in 2024-2025 to shareholders in the form of share repurchases and dividends, with the remaining free cash flow expected to be used for organic investments and/or bolt-on acquisitions and preparing for future debt retirement. In 2024, we returned $356.2 million of capital to shareholders with $274.8 million of share repurchases, representing 18.6 million shares, and we paid $81.4 million in dividends.
Our capital allocation plan is subject to a variety of factors, including our strategic plans, market and economic conditions and the discretion of our Board of Directors.
During 2024, we deployed surplus cash in time deposit and money market investments with several financial institutions. As of December 31, 2024, our cash and cash equivalents totaled $693.2 million.
Contractual obligations
An important use of our liquidity pertains to purchasing programming rights. Most of our stations have network affiliation agreements with major broadcast networks (ABC, CBS, Fox, and NBC). Under these agreements, the television networks produce and distribute programming to us in exchange for our stations’ commitments to air the programming at specified times and to pay the networks monetary compensation and provide other consideration, such as commercial announcement time during the programming. The network affiliation agreements have multi-year terms. In addition, programming rights include acquired syndicated programming (television series and movies that are purchased on a group basis for use by our owned stations) and the rights to carry certain professional sporting events. These contracts cover a period of up to five years. As of December 31, 2024, we had total programming commitments of $2.53 billion, of which $911.4 million will be settled within the next twelve months. See Note 11 to the consolidated financial statements for further details regarding programming commitments.
We also secure our on-air talent and other key personnel at our television stations through multi-year talent and employment agreements. We expect our contracts for talent and other key personnel will be renewed or replaced with similar agreements upon their expiration. As of December 31, 2024, amounts due under these contracts were approximately $227.3 million, of which approximately $136.1 million will be paid within the next twelve months.
Other material contractual obligations include our operating leases (see Note 7 to the consolidated financial statements for further details) as well as our long-term debt and interest payments. Our nearest debt maturity is a $550 million debt maturing in March 2026. Due to a 91-day springing maturity provision in our revolving credit facility, we currently expect to redeem at least $250 million of this maturity in the fourth quarter of 2025 using cash on hand, drawings under the revolving credit facility, or some combination of both. (See ‘Long-term debt’ section below, as well as Note 5 to the consolidated financial statements for further details).
Cash Flows
The following table provides a summary of our cash flow information for the three years ended December 31, 2024 followed by a discussion of the key elements of our cash flows (in thousands):
| | | | | | | | | | | | |
| | 2024 | | | 2023 | | | 2022 | |
Cash and cash equivalents at beginning of the period | | $ | 361,036 | | | $ | 551,681 | | | $ | 56,989 | |
| | | | | | | | | |
Operating activities: | | | | | | | | | |
Net income | | | 599,043 | | | | 476,347 | | | | 631,198 | |
Gain on investment sales | | | (153,626 | ) | | | (25,809 | ) | | | (18,308 | ) |
Depreciation, amortization and other non-cash adjustments | | | 174,101 | | | | 184,034 | | | | 199,087 | |
Merger termination fee | | | — | | | | (136,000 | ) | | | — | |
Pension expense, net of employer contributions | | | 9,514 | | | | 5,559 | | | | (3,487 | ) |
Decrease (increase) in trade receivables | | | 22,071 | | | | 34,726 | | | | (15,365 | ) |
(Decrease) increase in accounts payable | | | (27,613 | ) | | | 38,739 | | | | 3,216 | |
Increase (decrease) in interest and taxes payable | | | 43,550 | | | | (14,977 | ) | | | 15,330 | |
All other operating activities | | | 17,927 | | | | 24,630 | | | | 480 | |
Net cash flow from operating activities | | | 684,967 | | | | 587,249 | | | | 812,151 | |
| | | | | | | | | |
Investing activities: | | | | | | | | | |
Purchase of property and equipment | | | (52,440 | ) | | | (54,694 | ) | | | (51,333 | ) |
Payments for acquisitions of businesses and assets, net of cash acquired | | | (54,249 | ) | | | (1,150 | ) | | | — | |
Proceeds from investments | | | 158,976 | | | | 28,105 | | | | 4,997 | |
All other investing activities | | | (20,518 | ) | | | (250 | ) | | | (4,896 | ) |
Net cash flow provided by (used for) investing activities | | | 31,769 | | | | (27,989 | ) | | | (51,232 | ) |
| | | | | | | | | |
Financing activities: | | | | | | | | | |
Repurchase of common stock | | | (274,827 | ) | | | (652,914 | ) | | | — | |
Payments under revolving credit facilities, net | | | — | | | | — | | | | (166,000 | ) |
Dividends paid | | | (81,364 | ) | | | (83,534 | ) | | | (84,756 | ) |
Payments for tax withholding related to vested stock-based compensation awards and share repurchase excise tax | | | (17,252 | ) | | | (13,457 | ) | | | (15,471 | ) |
All other financing activities | | | (11,115 | ) | | | — | | | | — | |
Net cash flow used for financing activities | | | (384,558 | ) | | | (749,905 | ) | | | (266,227 | ) |
Net change in cash and cash equivalents | | | 332,178 | | | | (190,645 | ) | | | 494,692 | |
Cash and cash equivalents at end of the period | | $ | 693,214 | | | $ | 361,036 | | | $ | 551,681 | |
Operating Activities
Cash flow from operating activities was $685.0 million in 2024, compared to $587.2 million in 2023, an increase of $97.8 million. Net income in 2023 was impacted by the one time-merger termination fee of $136.0 million that was settled in the second quarter of 2023. The merger termination fee was satisfied in the form of TEGNA common stock and therefore did not impact cash flows from operating activities. The increase in operating cash flow in 2024 was primarily driven by a $191.0 million increase in revenue, primarily due to a $327.4 million increase in political revenue, offset by declines in subscription and AMS revenues of $71.8 million and $63.3 million, respectively. This net increase was partially offset by an unfavorable change in accounts payable of $66.4 million due to the timing of payments made to our vendors.
Investing Activities
Cash flow provided by investing activities was $31.8 million in 2024, compared to cash flow used for investing activities of $28.0 million in 2023. The $59.8 million increase in net cash flows from investing activities was primarily driven by a $130.9 million increase in proceeds from the sale of investments in 2024, primarily driven by $152.9 million of proceeds from the sale of our BMI investment during the first quarter of 2024. Proceeds from the sales of investments in 2023 were mainly attributable to $26.4 million of cash received from the sale of a portion of our investment in MadHive in the third quarter of 2023. This increase in cash inflow was partially offset by $54.2 million of cash outflows for the acquisition of Octillion Media in 2024 as well as a $20.4 million increase in payments for debt and equity investments during the year.
Financing Activities
Cash flow used for financing activities was $384.6 million in 2024, a decrease of $365.3 million from $749.9 million in 2023. The decline was primarily attributable to the reduction in share repurchase activity. In 2023, we spent $625.0 million for two accelerated share repurchase (ASR) programs, resulting in the repurchase of 39.5 million shares. No ASR programs were launched in 2024. Additionally, in 2024, we repurchased $274.8 million of common stock under our Board authorized share repurchase program and paid $5.6 million of excise tax on share purchases, as compared to repurchases of $27.9 million in 2023.
For a comparative discussion of changes in our cash flow comparing the years ended December 31, 2023 and December 31, 2022, see “Part II, Item 7. Financial Position” of our annual report on Form 10-K for the year ended December 31, 2023, filed with the SEC on February 29, 2024.
Long-term debt
As of December 31, 2024, $3.09 billion, representing 100% of our debt, had a fixed interest rate. See “Note 5 Long-term debt” to our consolidated financial statements for a table summarizing the components of our long-term debt.
On January 25, 2024, we entered into an amendment to our revolving credit facility (the Credit Agreement). Among other things, the amendment amended the Credit Agreement to:
•Reduce the Five-Year Commitments (as defined in the Credit Agreement) from $1.51 billion to $750 million;
•Extend the term of such Five-Year Commitments from August 15, 2024 to January 25, 2029, subject to a 91-day springing maturity date if debt in excess of $300 million (subject to certain exceptions) were to mature before such date;
•Add the right to obtain a temporary 0.5x step-up in the Total Leverage Ratio (as defined in the Credit Agreement) after consummating a Qualified Acquisition (as defined in the Credit Agreement);
•Increase the amount of Unrestricted Cash (as defined in the Credit Agreement) to $600 million;
•Amend the definition of Consolidated EBITDA to include an add-back for certain professional fees and expenses; and
•Establish a $50 million swingline facility.
Under the amended Credit Agreement, the Company’s maximum Total Leverage Ratio (as defined in the Credit Agreement) remained unchanged at 4.50x. Any amounts borrowed under the Credit Agreement in the future are subject to a variable rate.
As of December 31, 2024, we had $11.8 million of letters of credit outstanding resulting in unused borrowing capacity of $738.2 million under the $750.0 million Credit Agreement.
As of December 31, 2024, we were in compliance with all covenants contained in our debt agreements and Credit Agreement and our leverage ratio, calculated in accordance with our Credit Agreement, was 2.77x, well below the permitted leverage ratio of less than 4.50x. The leverage ratio is calculated using annualized adjusted EBITDA (as defined in the Credit Agreement) for the trailing eight quarters. We believe that we will remain compliant with all covenants for the foreseeable future. Our financial and operating performance, as well as our ability to generate sufficient cash flow to maintain compliance with Credit Agreement covenants, are subject to certain risk factors; see Item 1A. “Risk Factors” for further discussion.
We expect our existing cash and cash equivalents, cash flow from our operations and borrowing capacity under the Credit Agreement will be sufficient to satisfy our debt service obligations, capital expenditure requirements, and working capital needs for the next twelve months and beyond. Interest payments on the senior notes are based on the stated cash coupon rate. As of December 31, 2024, we had future interest payments on our senior notes of $523.5 million, of which $160.3 million will be paid within the next twelve months.
The following schedule discloses future annual maturities of the principal amount of total debt due (in thousands):
| | | |
Repayment schedule of principal long-term debt as of Dec. 31, 2024 | Annual Maturities | |
2025 | $ | — | |
2026 | | 550,000 | |
2027 | | 440,000 | |
2028 | | 1,000,000 | |
2029 | | 1,100,000 | |
Thereafter | | — | |
Total | $ | 3,090,000 | |
Off-Balance Sheet Arrangements
Off-balance sheet arrangements as defined by the Securities and Exchange Commission include the following four categories: obligations under certain guarantee contracts; retained or contingent interests in assets transferred to an unconsolidated entity or similar arrangements that serve as credit, liquidity or market risk support; obligations under certain derivative arrangements classified as equity; and obligations under material variable interests. As of December 31, 2024, we had no off-balance sheet arrangements that have, or are reasonably likely to have, a current or future material effect on our consolidated financial condition, results of operations, liquidity, capital expenditures or capital resources.
Critical accounting policies and estimates
The preparation of financial statements in conformity with generally accepted accounting principles requires management to make estimates and assumptions about future events that affect the amounts reported in the financial statements and accompanying notes. Actual results could differ significantly from those estimates. We believe the following discussion addresses our most critical accounting policies, which are those that are material to the presentation of our financial condition and results of operations and require management’s most subjective and complex judgments. This commentary should be read in conjunction with our consolidated financial statements and the remainder of this Form 10-K.
Goodwill: As of December 31, 2024, our goodwill balance was $3.02 billion and represented approximately 41% of our total assets. Goodwill represents the excess of acquisition cost over the fair value of assets acquired, including identifiable intangible assets, net of liabilities assumed.
Goodwill is tested for impairment at a level referred to as the reporting unit. A reporting unit is a business for which discrete financial information is available and segment management regularly reviews the operating results. The level at which we test goodwill for impairment requires us to determine whether the operations below the operating segment level constitute a reporting unit. We have determined that our one operating segment, Media, consists of a single reporting unit.
Goodwill is tested for impairment on an annual basis (first day of our fourth quarter) or between annual tests if events or changes in circumstances occurred that indicate the fair value of a reporting unit may be below its carrying amount.
When conducting the annual goodwill impairment test, we have the option to perform either a qualitative or quantitative assessment. In 2024, we elected to perform the qualitative assessment, which considers events and circumstances such as macroeconomic conditions, industry and market conditions, cost factors and overall financial performance, as well as company and specific reporting unit specifications. The qualitative approach also considers inputs used in the most recent quantitative analysis, such as stock price, shares outstanding and the control premium and how those inputs have changed since the quantitative test. After performing this analysis, we determined that it was not more likely than not that the carrying value of our reporting unit exceeds its fair value and therefore we did not perform a quantitative analysis.
Impairment assessment inherently involves management judgments regarding the assumptions described above. Fair value of the reporting unit also depends on the future strength of the economy in our principal media markets. New and developing competition as well as technological change could also adversely affect our stock price and future fair value estimates. If the assumptions in our assessment were to experience a significant and sustained deterioration, it is possible that an impairment charge may be recognized in the future. We cannot predict the likelihood, amount or timing of any future goodwill impairment charge.
Indefinite Lived Intangibles: This category consists entirely of FCC broadcast licenses related to our acquisitions of television stations. As of December 31, 2024, indefinite lived intangible assets were $2.12 billion and represented approximately 29% of our total assets.
The FCC broadcast licenses are recorded at their estimated fair value as of the date of the business acquisition. We determine the fair value of each FCC broadcast license using an income approach referred to as the Greenfield method. The Greenfield method utilizes a discounted cash flow model that incorporates several key assumptions, including market revenues, long-term growth projections, estimated market share for a typical market participant, estimated profit margins based on market size and station type, and a discount rate (determined using a weighted average cost of capital). Because these licenses are considered indefinite lived intangible assets we do not amortize them. Instead, they are tested for impairment annually (on the first day of our fourth quarter), or more often if circumstances dictate, for impairment and written down to fair value as required.
We have the option to first perform a qualitative assessment to determine if it is more likely than not that the fair value of the indefinite lived asset is more than its carrying amount. If that is the case, then we do not need to perform the quantitative analysis. The qualitative assessment considers trends in macroeconomic conditions, industry and market conditions, cost factors and overall financial performance of the indefinite lived asset. In 2024, we elected to perform the quantitative assessment for certain FCC licenses that have experienced limited headroom in recent years. The aggregate carrying value of such licenses is $395.9 million. No impairment charges were recorded as a result of this analysis.
We performed the optional qualitative assessment for all of our other FCC licenses, which represented an aggregate carrying value of $1.73 billion. In performing the qualitative impairment analysis, we analyzed trends in the significant inputs used in the fair value determination of the FCC license assets. This included reviewing trends in market revenues, market share, profit margins, long-term expected growth rates, and changes in inputs to the discount rate. The results of our qualitative procedures showed no material adverse change in inputs that would indicate that an impairment exists since the last quantitative test of these assets. As such, we concluded it was more likely than not that the fair value of each of these indefinite lived FCC broadcast licenses was more than its carrying amount and we therefore did not perform a quantitative test on these licenses in 2024.
Changes in key fair value assumptions used in our analysis could result in future non-cash impairment charges, and any related impairment could have a material adverse impact on our results of operations. Changes in key fair value assumptions that could result in a future impairment charge include increases in discount rates and declines in market revenues. A 100 basis point increase in our discount rate or a 10% decline in market revenues (holding all other assumptions in the fair value model constant) would result in an aggregate impairment charge of approximately $7.4 million or less.
Pension Liabilities: Certain employees participate in qualified and non-qualified defined benefit pension plans (see Note 6 to consolidated financial statements). Our principal defined benefit pension plan is TRP. We also sponsor the TEGNA Supplemental Retirement Plan (SERP) for certain employees. Substantially all participants in the TRP and SERP had their benefits frozen before 2009, and in December 2017 we froze all remaining accruing benefits for certain grandfathered SERP participants.
We recognize the net funded status of these postretirement benefit plans as a liability on our Consolidated Balance Sheets. There is a corresponding non-cash adjustment to accumulated other comprehensive loss, net of tax benefits recorded as deferred tax assets, in stockholders’ equity. The funded status represents the difference between the fair value of each plan’s assets and the benefit obligation of the plan. The benefit obligation represents the present value of the estimated future benefits we currently expect to pay to plan participants based on past service.
The plan assets and benefit obligations are measured as of December 31 of each year, or more frequently, upon the occurrence of certain events such as a plan amendment, settlement, or curtailment. The amounts we record are measured using actuarial valuations, which are dependent upon key assumptions such as discount rates, participant mortality rates and the expected long-term rate of return on plan assets. The assumptions we make affect both the calculation of the benefit obligations as of the measurement date and the calculation of net periodic pension expense in subsequent periods. When reassessing these assumptions we consider past and current market conditions and make judgments about future market trends. We also consider factors such as the timing and amounts of expected contributions to the plans and benefit payments to plan participants.
The most important assumptions include the discount rate applied to pension plan obligations and the expected long-term rate of return on plan assets related for the TRP (the SERP is an unfunded plan). The discount rate assumption is based on investment yields available at year-end on corporate bonds rated AA and above with a maturity to match the expected benefit payment stream. A decrease in discount rates would increase pension obligations while an increase in discount rate would reduce pension obligations.
We establish the expected long-term rate of return by developing a forward-looking, long-term return assumption for each pension fund asset class, taking into account factors such as the expected real return for the specific asset class and inflation. A single, long-term rate of return is then calculated as the weighted average of the target asset allocation percentages and the long-term return assumption for each asset class. We apply the expected long-term rate of return to the fair value of its pension assets in determining the dollar amount of its expected return. Changes in the expected long-term return on plan assets would increase or decrease pension plan expense. For 2024, we assumed a rate of 6.0% for our long-term expected return on pension assets used for our TRP plan. As an indication of the sensitivity of pension expense to the long-term rate of return assumption, a plus or minus 50 basis points change in the expected rate of return on pension assets (with all other assumptions held constant) would have decreased or increased estimated pension plan expense for 2024 by approximately $1.8 million. The effects of actual results differing from this assumption is initially accumulated as unamortized gains and losses and later amortized to expense on the Consolidated Statements of Income.
For the December 31, 2024 measurement, the assumption used for the discount rate was 5.60% for our TRP and SERP plans. As an indication of the sensitivity of pension liabilities to the discount rate assumption, a plus or minus 50 basis points change in the discount rate as of the end of 2024 (with all other assumptions held constant) would have decreased or increased plan obligations by approximately $15.1 million. For 2024, the discount rate used to determine the pension expense was 5.20%. A 50 basis points increase or decrease in this discount rate would have decreased or increased total pension plan expense for 2024 by approximately $0.3 million.
Income Taxes: Our annual tax rate is based on our income, statutory tax rates, and tax planning opportunities available in the various jurisdictions in which we operate. Significant judgment is required in determining our annual tax expense and in evaluating our tax positions.
Tax law requires certain items to be included in our tax returns at different times than when the items are reflected in the financial statements. The annual tax expense reflected in the Consolidated Statements of Income is different than that reported in our tax returns. Some of these differences are permanent (for example, expenses recorded for accounting purposes that are not deductible in the returns such as certain entertainment expenses) and some differences are temporary and reverse over time, such as depreciation expense. Temporary differences create deferred tax assets and liabilities. Deferred tax liabilities generally represent tax expense recognized in the financial statements for which payment has been deferred, or expense for which a deduction has been taken already in the tax return but the expense has not yet been recognized in the financial statements. Deferred tax assets generally represent items that can be used as a tax deduction or credit in tax returns in future years for which a benefit has already been recorded in the financial statements, as well as tax losses that can be carried over and used in future years. Valuation allowances are established when necessary to reduce deferred income tax assets to the amounts we believe are more likely than not to be recovered. In evaluating the amount of any such valuation allowance, we consider the existence of cumulative income or losses in recent years, the reversal of existing temporary differences, the existence of taxable income in prior carry back years, available tax planning strategies and estimates of future taxable income for each of our taxable jurisdictions. The latter two factors involve the exercise of significant judgment. As of December 31, 2024, deferred tax asset valuation allowances totaled $23.8 million, primarily related to federal and state interest disallowance carryforwards, minority investments, accrued compensation costs, and state net operating loss carryforwards. Although realization is not assured, we believe it is more likely than not that all other deferred tax assets for which no valuation allowances have been established will be realized. This conclusion is based on our history of cumulative income in recent years and review of historical and projected future taxable income.
We determine whether it is more likely than not that a tax position will be sustained upon examination by the appropriate taxing authorities before any part of the benefit is recorded in our financial statements. A tax position is measured as the portion of the tax benefit that is greater than 50% likely to be realized upon settlement with a taxing authority (that has full knowledge of all relevant information). We may be required to change our provision for income taxes when the ultimate treatment of certain items is challenged or agreed to by taxing authorities, when estimates used in determining valuation allowances on deferred tax assets significantly change, or when receipt of new information indicates the need for adjustment in valuation allowances. Future events, such as changes in tax laws, tax regulations, or interpretations of such laws or regulations, could have an impact on the provision for income tax and the effective tax rate. Any such changes could significantly affect the amounts reported in the consolidated financial statements in the year these changes occur.
ITEM 7A. QUANTITATIVE AND QUALITATIVE DISCLOSURES ABOUT MARKET RISK
Market risk is the potential gain/loss arising from changes in market rates and prices, such as interest rates and changes in the market value of financial instruments. Historically, our main exposure to market risk has related to interest rates.
As of December 31, 2024, we did not have any floating interest obligations outstanding and had unused borrowing capacity of $738.2 million under our $750 million Credit Agreement, which expires in January 2029.
Any amounts borrowed under the Credit Agreement in the future are subject to a variable rate. Refer to Note 8 to the consolidated financial statements for information regarding the fair value of our long-term debt.
We believe that our market risk from financial instruments, such as cash equivalents, accounts receivable, accounts payable and debt, is not material.
ITEM 8. FINANCIAL STATEMENTS AND SUPPLEMENTARY DATA
INDEX TO FINANCIAL STATEMENTS AND SUPPLEMENTARY DATA
Report of Independent Registered Public Accounting Firm
To the Board of Directors and Shareholders of TEGNA Inc.
Opinions on the Financial Statements and Internal Control over Financial Reporting
We have audited the accompanying consolidated balance sheets of TEGNA Inc. and its subsidiaries (the “Company”) as of December 31, 2024 and 2023, and the related consolidated statements of income, of comprehensive income, of equity and redeemable noncontrolling interest and of cash flows for each of the three years in the period ended December 31, 2024, including the related notes (collectively referred to as the “consolidated financial statements”). We also have audited the Company’s internal control over financial reporting as of December 31, 2024, based on criteria established in Internal Control - Integrated Framework (2013) issued by the Committee of Sponsoring Organizations of the Treadway Commission (COSO).
In our opinion, the consolidated financial statements referred to above present fairly, in all material respects, the financial position of the Company as of December 31, 2024 and 2023, and the results of its operations and its cash flows for each of the three years in the period ended December 31, 2024 in conformity with accounting principles generally accepted in the United States of America. Also in our opinion, the Company maintained, in all material respects, effective internal control over financial reporting as of December 31, 2024, based on criteria established in Internal Control - Integrated Framework (2013) issued by the COSO.
Basis for Opinions
The Company’s management is responsible for these consolidated financial statements, for maintaining effective internal control over financial reporting, and for its assessment of the effectiveness of internal control over financial reporting, included in Management’s Report on Internal Control over Financial Reporting appearing under Item 9A. Our responsibility is to express opinions on the Company’s consolidated financial statements and on the Company’s internal control over financial reporting based on our audits. We are a public accounting firm registered with the Public Company Accounting Oversight Board (United States) (PCAOB) and are required to be independent with respect to the Company in accordance with the U.S. federal securities laws and the applicable rules and regulations of the Securities and Exchange Commission and the PCAOB.
We conducted our audits in accordance with the standards of the PCAOB. Those standards require that we plan and perform the audits to obtain reasonable assurance about whether the consolidated financial statements are free of material misstatement, whether due to error or fraud, and whether effective internal control over financial reporting was maintained in all material respects.
Our audits of the consolidated financial statements included performing procedures to assess the risks of material misstatement of the consolidated financial statements, whether due to error or fraud, and performing procedures that respond to those risks. Such procedures included examining, on a test basis, evidence regarding the amounts and disclosures in the consolidated financial statements. Our audits also included evaluating the accounting principles used and significant estimates made by management, as well as evaluating the overall presentation of the consolidated financial statements. Our audit of internal control over financial reporting included obtaining an understanding of internal control over financial reporting, assessing the risk that a material weakness exists, and testing and evaluating the design and operating effectiveness of internal control based on the assessed risk. Our audits also included performing such other procedures as we considered necessary in the circumstances. We believe that our audits provide a reasonable basis for our opinions.
Definition and Limitations of Internal Control over Financial Reporting
A company’s internal control over financial reporting is a process designed to provide reasonable assurance regarding the reliability of financial reporting and the preparation of financial statements for external purposes in accordance with generally accepted accounting principles. A company’s internal control over financial reporting includes those policies and procedures that (i) pertain to the maintenance of records that, in reasonable detail, accurately and fairly reflect the transactions and dispositions of the assets of the company; (ii) provide reasonable assurance that transactions are recorded as necessary to permit preparation of financial statements in accordance with generally accepted accounting principles, and that receipts and expenditures of the company are being made only in accordance with authorizations of management and directors of the company; and (iii) provide reasonable assurance regarding prevention or timely detection of unauthorized acquisition, use, or disposition of the company’s assets that could have a material effect on the financial statements.
Because of its inherent limitations, internal control over financial reporting may not prevent or detect misstatements. Also, projections of any evaluation of effectiveness to future periods are subject to the risk that controls may become inadequate because of changes in conditions, or that the degree of compliance with the policies or procedures may deteriorate.
Critical Audit Matters
The critical audit matter communicated below is a matter arising from the current period audit of the consolidated financial statements that was communicated or required to be communicated to the audit committee and that (i) relates to accounts or disclosures that are material to the consolidated financial statements and (ii) involved our especially challenging, subjective, or complex judgments. The communication of critical audit matters does not alter in any way our opinion on the consolidated
financial statements, taken as a whole, and we are not, by communicating the critical audit matter below, providing a separate opinion on the critical audit matter or on the accounts or disclosures to which it relates.
Quantitative impairment assessments for certain FCC broadcast licenses
As described in Notes 1 and 2 to the consolidated financial statements, the Company’s consolidated FCC broadcast licenses balance was $2.1 billion as of December 31, 2024. Intangible assets with indefinite lives are tested annually, or more often if circumstances dictate, for impairment and written down to fair value as required. In 2024, management elected to perform the quantitative assessment for certain FCC broadcast licenses with an aggregate carrying value of $395.9 million. In performing its quantitative assessment, fair value is estimated by management using an income approach called the Greenfield method. The Greenfield method utilizes a discounted cash flow model that incorporates several key assumptions, including market revenues, long-term growth projections, estimated market share for a typical market participant, estimated profit margins based on market size and station type, and the discount rate (determined by management using a weighted average cost of capital). The principal considerations for our determination that performing procedures relating to the quantitative impairment assessments for certain FCC broadcast licenses is a critical audit matter are (i) the significant judgment by management when developing the fair value estimate of certain FCC broadcast licenses; (ii) a high degree of auditor judgment, subjectivity, and effort in performing procedures and evaluating management’s significant assumptions related to market revenues, estimated profit margins based on market size and station type, and the discount rate; and (iii) the audit effort involved the use of professionals with specialized skill and knowledge. Addressing the matter involved performing procedures and evaluating audit evidence in connection with forming our overall opinion on the consolidated financial statements. These procedures included testing the effectiveness of controls relating to management’s impairment assessments, including controls over the valuation of the Company’s FCC broadcast licenses. These procedures also included, among others, (i) testing management’s process for developing the fair value estimates; (ii) evaluating the appropriateness of the discounted cash flow model; (iii) testing the completeness and accuracy of underlying data used in the discounted cash flow model; and (iv) evaluating the reasonableness of the significant assumptions used by management related to market revenues, estimated profit margins based on market size and station type, and the discount rate. Evaluating management’s assumptions related to market revenues and estimated profit margins based on market size and station type involved evaluating whether the assumptions used by management were reasonable considering (i) the current and past performance of the related business in the market being evaluated, (ii) the consistency with external market and industry data, and (iii) whether these assumptions were consistent with evidence obtained in other areas of the audit. Professionals with specialized skill and knowledge were used to assist in the evaluation of the appropriateness of the Company’s discounted cash flow model and the reasonableness of the discount rate significant assumption.
/s/ PricewaterhouseCoopers LLP
Washington, District of Columbia
February 27, 2025
We have served as the Company’s auditor since 2018.
TEGNA Inc.
CONSOLIDATED BALANCE SHEETS
In thousands of dollars
| | | | | | | | |
| | Dec. 31, | |
| | 2024 | | | 2023 | |
| | | | | | |
ASSETS | | | | | | |
Current assets | | | | | | |
Cash and cash equivalents | | $ | 693,214 | | | $ | 361,036 | |
Accounts receivable, net of allowances of $2,831 and $2,845, respectively | | | 604,300 | | | | 624,445 | |
Other receivables | | | 11,752 | | | | 9,299 | |
Syndicated programming rights | | | 28,097 | | | | 31,530 | |
Prepaid expenses and other current assets | | | 23,049 | | | | 24,008 | |
Total current assets | | | 1,360,412 | | | | 1,050,318 | |
Property and equipment | | | | | | |
Land | | | 86,347 | | | | 86,442 | |
Buildings and improvements | | | 360,492 | | | | 352,546 | |
Equipment, furniture and fixtures | | | 641,024 | | | | 631,444 | |
Construction in progress | | | 6,037 | | | | 7,777 | |
Total | | | 1,093,900 | | | | 1,078,209 | |
Less accumulated depreciation | | | (649,581 | ) | | | (626,029 | ) |
Net property and equipment | | | 444,319 | | | | 452,180 | |
Intangible and other assets | | | | | | |
Goodwill | | | 3,015,944 | | | | 2,981,587 | |
Indefinite-lived and amortizable intangible assets, less accumulated amortization
of $185,175 and $289,949, respectively | | | 2,309,772 | | | | 2,328,972 | |
Right-of-use assets for operating leases | | | 63,535 | | | | 73,479 | |
Investments and other assets | | | 132,537 | | | | 113,521 | |
Total intangible and other assets | | | 5,521,788 | | | | 5,497,559 | |
Total assets | | $ | 7,326,519 | | | $ | 7,000,057 | |
TEGNA Inc.
CONSOLIDATED BALANCE SHEETS
In thousands of dollars, except par value and share amounts
| | | | | | | | |
| | Dec. 31, | |
| | 2024 | | | 2023 | |
| | | | | | |
LIABILITIES, REDEEMABLE NONCONTROLLING INTEREST AND EQUITY | | | | | | |
Current liabilities | | | | | | |
Accounts payable | | $ | 87,338 | | | $ | 114,950 | |
Accrued liabilities | | | | | | |
Compensation | | | 64,343 | | | | 54,929 | |
Interest | | | 44,719 | | | | 45,144 | |
Contracts payable for programming rights | | | 143,095 | | | | 119,562 | |
Other | | | 75,454 | | | | 82,782 | |
Income taxes payable | | | 51,331 | | | | 6,005 | |
Total current liabilities | | | 466,280 | | | | 423,372 | |
Noncurrent liabilities | | | | | | |
Net deferred income tax liabilities | | | 579,213 | | | | 578,219 | |
Long-term debt | | | 3,076,451 | | | | 3,072,801 | |
Pension liabilities | | | 65,956 | | | | 70,483 | |
Operating lease liabilities | | | 63,421 | | | | 73,733 | |
Other noncurrent liabilities | | | 50,167 | | | | 57,765 | |
Total noncurrent liabilities | | | 3,835,208 | | | | 3,853,001 | |
Total liabilities | | $ | 4,301,488 | | | $ | 4,276,373 | |
| | | | | | |
Commitments and contingent liabilities (see Note 11) | | | | | | |
| | | | | | |
Redeemable noncontrolling interest (see Note 1) | | $ | 20,317 | | | $ | 18,812 | |
| | | | | | |
Shareholders’ equity | | | | | | |
Common stock of $1 par value per share, 800,000,000 shares authorized, 324,418,632 shares issued | | | 324,419 | | | | 324,419 | |
Additional paid-in capital | | | 27,941 | | | | 27,941 | |
Retained earnings | | | 8,549,717 | | | | 8,091,245 | |
Accumulated other comprehensive loss | | | (106,644 | ) | | | (119,610 | ) |
Less treasury stock at cost, 164,520,591 shares and 144,502,338 shares, respectively | | | (5,790,719 | ) | | | (5,619,123 | ) |
Total equity | | | 3,004,714 | | | | 2,704,872 | |
Total liabilities, redeemable noncontrolling interest and equity | | $ | 7,326,519 | | | $ | 7,000,057 | |
The accompanying notes are an integral part of these consolidated financial statements.
TEGNA Inc.
CONSOLIDATED STATEMENTS OF INCOME
In thousands of dollars, except per share amounts
| | | | | | | | | | | |
| Year ended Dec. 31, | |
| 2024 | | | 2023 | | | 2022 | |
| | | | | | | | |
Revenues | $ | 3,101,971 | | | $ | 2,910,930 | | | $ | 3,279,245 | |
| | | | | | | | |
Operating expenses: | | | | | | | | |
Cost of revenues1 | | 1,756,115 | | | | 1,718,857 | | | | 1,693,221 | |
Business units - Selling, general and administrative expenses | | 394,589 | | | | 412,000 | | | | 414,530 | |
Corporate - General and administrative expenses | | 51,851 | | | | 65,933 | | | | 60,108 | |
Depreciation | | 59,935 | | | | 59,769 | | | | 61,195 | |
Amortization of intangible assets | | 53,600 | | | | 53,467 | | | | 59,882 | |
Asset impairment and other (see Note 10) | | 1,097 | | | | 3,359 | | | | (323 | ) |
Merger termination fee | | — | | | | (136,000 | ) | | | — | |
Total | | 2,317,187 | | | | 2,177,385 | | | | 2,288,613 | |
Operating income | | 784,784 | | | | 733,545 | | | | 990,632 | |
| | | | | | | | |
Non-operating (expense) income: | | | | | | | | |
Interest expense | | (169,238 | ) | | | (172,904 | ) | | | (174,022 | ) |
Interest income | | 26,991 | | | | 29,292 | | | | 6,922 | |
Other non-operating items, net | | 130,450 | | | | 16,613 | | | | 10,036 | |
Total | | (11,797 | ) | | | (126,999 | ) | | | (157,064 | ) |
| | | | | | | | |
Income before income taxes | | 772,987 | | | | 606,546 | | | | 833,568 | |
Provision for income taxes | | 173,944 | | | | 130,199 | | | | 202,370 | |
Net income | | 599,043 | | | | 476,347 | | | | 631,198 | |
Net loss (income) attributable to redeemable noncontrolling interest | | 775 | | | | 377 | | | | (729 | ) |
Net income attributable to TEGNA Inc. | $ | 599,818 | | | $ | 476,724 | | | $ | 630,469 | |
| | | | | | | | |
Earnings per share: | | | | | | | | |
Basic | $ | 3.55 | | | $ | 2.29 | | | $ | 2.82 | |
Diluted | $ | 3.53 | | | $ | 2.28 | | | $ | 2.81 | |
| | | | | | | | |
Weighted average number of common shares outstanding: | | | | | | | | |
Basic shares | | 168,434 | | | | 207,594 | | | | 223,652 | |
Diluted shares | | 169,165 | | | | 207,947 | | | | 224,486 | |
1Cost of revenues exclude charges for depreciation and amortization expense, which are shown separately above.
The accompanying notes are an integral part of these consolidated financial statements.
TEGNA Inc.
CONSOLIDATED STATEMENTS OF COMPREHENSIVE INCOME
In thousands of dollars
| | | | | | | | | | | |
| Year ended Dec. 31, | |
| 2024 | | | 2023 | | | 2022 | |
| | | | | | | | |
Net income | $ | 599,043 | | | $ | 476,347 | | | $ | 631,198 | |
Other comprehensive income, before tax: | | | | | | | | |
Foreign currency translation adjustments | | — | | | | — | | | | 142 | |
Recognition of previously deferred post-retirement benefit plan costs | | 6,031 | | | | 5,590 | | | | 4,158 | |
Actuarial gain (loss) arising during the period | | 1,108 | | | | 2,387 | | | | (21,892 | ) |
Pension settlement charge | | 10,316 | | | | — | | | | 300 | |
Pension and other postretirement benefit items | | 17,455 | | | | 7,977 | | | | (17,434 | ) |
Realized gain on available for sale investment during the period | | — | | | | — | | | | (20,800 | ) |
Recognition of previously deferred post-retirement benefit plan costs | | 17,455 | | | | 7,977 | | | | (38,092 | ) |
Income tax effect related to components of other comprehensive income | | (4,489 | ) | | | (2,054 | ) | | | 9,775 | |
Other comprehensive income (loss), net of tax | | 12,966 | | | | 5,923 | | | | (28,317 | ) |
Comprehensive income | | 612,009 | | | | 482,270 | | | | 602,881 | |
Comprehensive loss (gain) attributable to redeemable noncontrolling interest | | 775 | | | | 377 | | | | (729 | ) |
Comprehensive income attributable to TEGNA Inc. | $ | 612,784 | | | $ | 482,647 | | | $ | 602,152 | |
The accompanying notes are an integral part of these consolidated financial statements.
TEGNA Inc.
CONSOLIDATED STATEMENTS OF CASH FLOWS
In thousands of dollars
| | | | | | | | | | | |
| Year ended Dec. 31, | |
| 2024 | | | 2023 | | | 2022 | |
| | | | | | | | |
Cash flows from operating activities: | | | | | | | | |
Net income | $ | 599,043 | | | $ | 476,347 | | | $ | 631,198 | |
Adjustments to reconcile net income to net cash flow from operating
activities: | | | | | | | | |
Depreciation | | 59,935 | | | | 59,769 | | | | 61,195 | |
Amortization of intangible assets | | 53,600 | | | | 53,467 | | | | 59,882 | |
Employee stock-based compensation awards | | 38,532 | | | | 24,497 | | | | 30,481 | |
Company stock 401(k) match contributions | | 18,702 | | | | 18,629 | | | | 18,661 | |
Amortization of deferred financing costs, debt discounts and premiums | | 6,193 | | | | 7,058 | | | | 6,919 | |
Gain on investment sales | | (153,626 | ) | | | (25,809 | ) | | | (18,308 | ) |
Provision for deferred income taxes | | (3,807 | ) | | | 19,737 | | | | 17,476 | |
Equity loss in unconsolidated investments, net | | 946 | | | | 877 | | | | 4,473 | |
Merger termination fee | | — | | | | (136,000 | ) | | | — | |
Pension expense, net of employer contributions | | 9,514 | | | | 5,559 | | | | (3,487 | ) |
Change in operating assets and liabilities, net of acquisitions: | | | | | | | | |
Decrease (increase) in trade receivables | | 22,071 | | | | 34,726 | | | | (15,365 | ) |
(Decrease) increase in accounts payable | | (27,613 | ) | | | 38,739 | | | | 3,216 | |
Increase (decrease) in interest and taxes payable | | 43,550 | | | | (14,977 | ) | | | 15,330 | |
(Decrease) increase in deferred revenue | | (2,973 | ) | | | 2,810 | | | | (2,151 | ) |
Changes in other assets and liabilities, net | | 20,900 | | | | 21,820 | | | | 2,631 | |
Net cash flow from operating activities | | 684,967 | | | | 587,249 | | | | 812,151 | |
Cash flows from investing activities: | | | | | | | | |
Purchase of property and equipment | | (52,440 | ) | | | (54,694 | ) | | | (51,333 | ) |
Reimbursements from spectrum repacking | | — | | | | — | | | | 323 | |
Payments for acquisitions of businesses and assets, net of cash
acquired | | (54,249 | ) | | | (1,150 | ) | | | — | |
Payments for investments | | (20,776 | ) | | | (370 | ) | | | (5,691 | ) |
Proceeds from investments | | 158,976 | | | | 28,105 | | | | 4,997 | |
Proceeds from sale of assets | | 258 | | | | 120 | | | | 472 | |
Net cash flow provided by (used for) investing activities | | 31,769 | | | | (27,989 | ) | | | (51,232 | ) |
Cash flows from financing activities: | | | | | | | | |
Repurchase of common stock | | (274,827 | ) | | | (652,914 | ) | | | — | |
Payments under revolving credit facilities, net | | — | | | | — | | | | (166,000 | ) |
Dividends paid | | (81,364 | ) | | | (83,534 | ) | | | (84,756 | ) |
Payments for debt issuance costs | | (6,448 | ) | | | — | | | | — | |
Payments for acquisition-related earnout consideration | | (4,667 | ) | | | — | | | | — | |
Payments for tax withholding related to vested stock-based compensation awards and share repurchase excise tax | | (17,252 | ) | | | (13,457 | ) | | | (15,471 | ) |
Net cash flow used for financing activities | | (384,558 | ) | | | (749,905 | ) | | | (266,227 | ) |
Increase (decrease) in cash and cash equivalents | | 332,178 | | | | (190,645 | ) | | | 494,692 | |
Balance of cash and cash equivalents at beginning of year | | 361,036 | | | | 551,681 | | | | 56,989 | |
Balance of cash and cash equivalents at end of year | $ | 693,214 | | | $ | 361,036 | | | $ | 551,681 | |
| | | | | | | | |
| | | | | | | | |
Supplemental cash flow information: | | | | | | | | |
Cash paid for income taxes, net of refunds | $ | 134,123 | | | $ | 126,138 | | | $ | 171,095 | |
Cash paid for interest | $ | 164,406 | | | $ | 166,132 | | | $ | 167,533 | |
The accompanying notes are an integral part of these consolidated financial statements.
TEGNA Inc.
CONSOLIDATED STATEMENTS OF EQUITY AND REDEEMABLE NONCONTROLLING INTEREST
In thousands of dollars, except per share data
| | | | | | | | | | | | | | | | | | | | | | | | |
| | | | | TEGNA INC. SHAREHOLDERS’ EQUITY | |
| Redeemable noncontrolling interest | | | | Common stock | | Additional paid-in capital | | Retained earnings | | Accumulated other comprehensive loss | | Treasury stock | | | Total Equity | |
Balance as of Dec. 31, 2021 | $ | 16,129 | | | | $ | 324,419 | | $ | 27,941 | | $ | 7,459,380 | | $ | (97,216 | ) | $ | (5,194,618 | ) | | $ | 2,519,906 | |
Net income | | 729 | | | | | — | | | — | | | 630,469 | | | — | | | — | | | | 630,469 | |
Other comprehensive loss, net
of tax | | — | | | | | — | | | — | | | — | | | (28,317 | ) | | — | | | | (28,317 | ) |
Total comprehensive income | | | | | | | | | | | | | | | | | 602,152 | |
Dividends declared: $0.38 per share | | — | | | | | — | | | — | | | (84,756 | ) | | — | | | — | | | | (84,756 | ) |
Company stock 401(k) match
contributions | | — | | | | | — | | | (19,494 | ) | | (22,975 | ) | | — | | | 61,130 | | | | 18,661 | |
Stock-based awards activity | | — | | | | | — | | | (12,296 | ) | | (83,503 | ) | | — | | | 80,328 | | | | (15,471 | ) |
Employee stock-based
compensation awards | | — | | | | | — | | | 30,481 | | | — | | | — | | | — | | | | 30,481 | |
Adjustment of redeemable
noncontrolling interest
to redemption value | | 560 | | | | | — | | | — | | | (560 | ) | | — | | | — | | | | (560 | ) |
Other activity | | — | | | | | — | | | 1,309 | | | — | | | — | | | — | | | | 1,309 | |
Balance as of Dec. 31, 2022 | $ | 17,418 | | | | $ | 324,419 | | $ | 27,941 | | $ | 7,898,055 | | $ | (125,533 | ) | $ | (5,053,160 | ) | | $ | 3,071,722 | |
Net (loss) income | | (377 | ) | | | | — | | | — | | | 476,724 | | | — | | | — | | | | 476,724 | |
Other comprehensive income, net
of tax | | — | | | | | — | | | — | | | — | | | 5,923 | | | — | | | | 5,923 | |
Total comprehensive income | | | | | | | | | | | | | | | | | 482,647 | |
Dividends declared: $0.42 per share | | — | | | | | — | | | — | | | (83,534 | ) | | — | | | — | | | | (83,534 | ) |
Company stock 401(k) match
contributions | | — | | | | | — | | | (23,029 | ) | | (32,008 | ) | | — | | | 73,666 | | | | 18,629 | |
Stock-based awards activity | | — | | | | | — | | | (5,959 | ) | | (89,010 | ) | | — | | | 81,512 | | | | (13,457 | ) |
Employee stock-based
compensation awards | | — | | | | | — | | | 24,497 | | | — | | | — | | | — | | | | 24,497 | |
Repurchase of common stock | | — | | | | | — | | | 3,304 | | | (77,211 | ) | | — | | | (721,141 | ) | | | (795,048 | ) |
Adjustment of redeemable
noncontrolling interest to
redemption value | | 1,771 | | | | | — | | | — | | | (1,771 | ) | | — | | | — | | | | (1,771 | ) |
Other activity | | — | | | | | — | | | 1,187 | | | — | | | — | | | — | | | | 1,187 | |
Balance as of Dec. 31, 2023 | $ | 18,812 | | | | $ | 324,419 | | $ | 27,941 | | $ | 8,091,245 | | $ | (119,610 | ) | $ | (5,619,123 | ) | | $ | 2,704,872 | |
Net (loss) income | | (775 | ) | | | | — | | | — | | | 599,818 | | | — | | | — | | | | 599,818 | |
Other comprehensive income, net
of tax | | — | | | | | — | | | — | | | — | | | 12,966 | | | — | | | | 12,966 | |
Total comprehensive income | | | | | | | | | | | | | | | | | 612,784 | |
Dividends declared: $0.49 per share | | — | | | | | — | | | — | | | (81,364 | ) | | — | | | — | | | | (81,364 | ) |
Company stock 401(k) match
contributions | | — | | | | | — | | | (33,243 | ) | | (26,500 | ) | | — | | | 78,445 | | | | 18,702 | |
Stock-based awards activity | | — | | | | | — | | | (64,776 | ) | | (31,202 | ) | | — | | | 84,328 | | | | (11,650 | ) |
Employee awards stock-based
compensation | | — | | | | | — | | | 38,532 | | | — | | | — | | | — | | | | 38,532 | |
Repurchase of common stock | | — | | | | | — | | | 58,029 | | | — | | | — | | | (334,369 | ) | | | (276,340 | ) |
Adjustment of redeemable
noncontrolling interest
to redemption value | | 2,280 | | | | | — | | | — | | | (2,280 | ) | | — | | | — | | | | (2,280 | ) |
Other activity | | — | | | | | — | | | 1,458 | | | — | | | — | | | — | | | | 1,458 | |
Balance as of Dec. 31, 2024 | $ | 20,317 | | | | $ | 324,419 | | $ | 27,941 | | $ | 8,549,717 | | $ | (106,644 | ) | $ | (5,790,719 | ) | | $ | 3,004,714 | |
The accompanying notes are an integral part of these consolidated financial statements.
NOTES TO CONSOLIDATED FINANCIAL STATEMENTS
NOTE 1 – Description of business, use of estimates, basis of presentation, and summary of significant accounting policies
Description of business: We serve our local communities across the U.S. through trustworthy journalism, engaging content, and tools that help people navigate their daily lives. Through customized marketing solutions, we help businesses grow and thrive. With 64 television stations in 51 U.S. markets, we reach over 100 million people every month across the web, mobile apps, streaming, and linear television. We have been consistently honored with the industry’s top awards, including Edward R. Murrow, George Polk, Alfred I. DuPont and Emmy Awards. We also own leading multicast networks True Crime Network and Quest.
Use of estimates: The financial statements have been prepared in accordance with U.S. generally accepted accounting principles (GAAP). In doing so, we are required to make estimates and assumptions that affect the amounts reported in the consolidated financial statements and accompanying notes. We use the best information available in developing significant estimates inherent in our financial statements. Actual results could differ from these estimates, and these differences resulting from changes in facts and circumstances could be material. Significant estimates include, but are not limited to, evaluation of goodwill and other intangible assets for impairment, fair value measurements including the allocation of purchase price to assets and liabilities in business combinations, post-retirement benefit plans, income taxes including deferred tax assets, and contingencies.
Basis of presentation: The consolidated financial statements include the accounts of subsidiaries we control and variable interest entities if we are the primary beneficiary. We eliminate all intercompany balances, transactions, and profits in consolidation. Investments in entities for which we have significant influence, but do not have control, are accounted for under the equity method. Our share of net earnings and losses from these ventures were previously included in “Equity loss in unconsolidated investments, net” in the Consolidated Statements of Income, however beginning in the first quarter of 2024 such amounts are now included in “Other non-operating items, net”. We have recast the prior year’s amounts to conform to this new presentation.
Segment presentation: We operate one operating and reportable segment, which primarily consists of our 64 television stations and two radio stations operating in 51 markets. Our reportable segment structure has been determined based on our management and internal reporting structure, the nature of products and services we offer, and the financial information that is evaluated regularly by our chief operating decision maker (CODM), who is our Chief Executive Officer. The primary measures of profit or loss that our CODM utilizes to assess performance and allocate resources are Net income attributable to TEGNA and Adjusted EBITDA. Within these measures, the significant expense measures that are regularly provided to our CODM are programming and employee compensation. The tables below provide reconciliations between revenue and the primary measures of profit or loss and include our significant expense measures (in thousands).
| | | | | | | | | | | | |
| | | |
| | 2024 | | | 2023 | | | 2022 | |
Revenue | | $ | 3,101,971 | | | $ | 2,910,930 | | | $ | 3,279,245 | |
Less: | | | | | | | | | |
Programming | | | 998,231 | | | | 995,292 | | | | 952,225 | |
Employee compensation (a) | | | 719,534 | | | | 702,324 | | | | 707,214 | |
Other segment items (b) | | | 452,734 | | | | 470,974 | | | | 487,903 | |
Adjusted EBITDA | | $ | 931,472 | | | $ | 742,340 | | | $ | 1,131,903 | |
Less: All other segment items (c) | | | 332,429 | | | | 265,993 | | | | 500,705 | |
Net income | | $ | 599,043 | | | $ | 476,347 | | | $ | 631,198 | |
(a) Includes the cost associated with salaries, bonuses, stock-based compensation, benefits paid to our employees and adjusted to remove workforce restructuring and retention costs (including stock-based compensation and cash payments).
(b) Primarily includes digital ad serving fees, professional service fees and costs associated with operating our facilities.
(c) Primarily includes taxes, interest expense, other non-operating costs, depreciation and amortization.
Summary of significant accounting policies:
Cash and cash equivalents: Cash and cash equivalents consist of cash and highly liquid short-term investments with original maturities of three months or less. Cash and cash equivalents are carried at cost plus accrued interest, which approximates fair value.
Trade receivables and allowances for doubtful accounts: Trade receivables are recorded at invoiced amounts and generally do not bear interest. The allowance for doubtful accounts reflects our estimate of credit exposure, determined principally on the basis of our collection experience, aging of our receivables and any specific reserves needed for certain customers based on their credit risk. Our allowance also takes into account expected future trends which may impact our customers’ ability to pay, such as economic growth (or declines), unemployment and demand for our products and services. We monitor the credit quality of our customers and their ability to pay through the use of analytics and communication with individual customers. Bad debt expense is included in “Business units - Selling, general and administrative expenses” on our Consolidated Statements of Income. We had bad debt expense of $5.2 million in 2024, $1.7 million in 2023 and $3.1 million in 2022. Write-offs of trade receivables (net of recoveries) were $5.3 million in 2024, $2.5 million in 2023 and $3.8 million in 2022.
Property and equipment: Property and equipment are recorded at cost, and depreciation expense is generally recorded on a straight-line basis over the estimated useful lives of the assets. The estimated useful lives are generally: buildings and improvements, 10 to 40 years; and machinery, equipment and fixtures, 3 to 25 years. Expenditures for maintenance and repairs are expensed as incurred.
Valuation of long-lived assets: We review the carrying amount of long-lived assets (mostly property and equipment and definite-lived intangible assets) for impairment whenever events or changes in circumstances indicate that the carrying amount may not be recoverable. Once an indicator of potential impairment has occurred, the impairment test is based on whether the intent is to hold the asset for continued use or to hold the asset for sale. If the intent is to hold the asset for continued use, the impairment test first requires a comparison of projected undiscounted future cash flows against the carrying amount of the asset group. If the carrying value of the asset group exceeds the estimated undiscounted future cash flows, the asset group would be deemed to be potentially impaired. The impairment, if any, would be measured based on the amount by which the carrying amount exceeds the fair value. Fair value is determined primarily using the projected future cash flows, discounted at a rate commensurate with the risk involved. Losses on long-lived assets to be disposed of are determined in a similar manner, except that fair values are reduced for the cost to dispose.
Goodwill and indefinite-lived intangible assets: The assets and liabilities of acquired businesses are recorded under the acquisition method of accounting at their estimated fair values at the date of acquisition. Goodwill represents the excess of the acquisition cost over the fair value of assets acquired, including identifiable intangible assets, net of liabilities assumed.
Our goodwill balance was $3.02 billion as of December 31, 2024 and $2.98 billion as of December 31, 2023. Goodwill is accounted for at the segment level and allocated to, and tested for impairment at, a level referred to as the reporting unit. We have determined that our one operating segment, Media, consists of a single reporting unit.
Goodwill is tested for impairment on an annual basis (first day of our fourth quarter) or between annual tests if events or changes in circumstances indicate that the fair value of our reporting unit may be below its carrying amount.
When conducting the annual goodwill impairment test, we have the option to perform either a qualitative or quantitative assessment. In 2024, we elected to perform the qualitative assessment which considers events and circumstances such as macroeconomic conditions, industry and market conditions, cost factors and overall financial performance, as well as company and specific reporting unit specifications. The qualitative approach also considers inputs used in the most recent quantitative analysis, such as stock price, shares outstanding and the control premium and how those inputs have changed since the most recent quantitative test. After performing this analysis, we determined that it was not more likely than not that the carrying value of our reporting unit exceeds its fair value and therefore we did not perform a quantitative analysis.
We also have significant intangible assets with indefinite lives associated with FCC broadcast licenses related to our acquisitions of television and radio stations. The FCC broadcast licenses are recorded at their estimated fair value at the date of acquisition. Fair value is estimated using an income approach called the Greenfield method, which utilizes a discounted cash flow model that incorporates several key assumptions, including market revenues, long-term growth projections, estimated market share for a typical market participant, estimated profit margins based on market size and station type, and a discount rate (determined using a weighted average cost of capital). Since these licenses are considered indefinite lived intangible assets we do not amortize them, rather they are tested for impairment annually (first day of our fourth quarter), or more often if circumstances dictate, for impairment and written down to fair value as required. We have the option to first perform a qualitative assessment to determine if it is more likely than not that the fair value of the indefinite lived asset is more than its carrying amount. If that is the case, then we do not need to perform the quantitative analysis. The qualitative assessment considers trends in macroeconomic conditions, industry and market conditions, cost factors and overall financial performance of the indefinite lived asset.
In 2024, we elected to perform the quantitative assessment for certain FCC licenses that have experienced limited headroom in recent years. The aggregate carrying value of such licenses is $395.9 million. No impairment charges were recorded as a result of this analysis. However, material adverse changes in any of the significant valuation inputs could result in future declines in the fair value of these FCC license assets, and could result in non-cash impairment charges which could have a material adverse impact on our future results from operations and financial position.
We performed the optional qualitative assessment for all of our other FCC licenses, which represented an aggregate carrying value of $1.73 billion. In performing the qualitative impairment analysis, we analyzed trends in the significant inputs used in the fair value determination of the FCC license assets. This included reviewing trends in market revenues, market share, profit margins, long-term expected growth rates, and changes in the discount rate. The results of our qualitative procedures showed no material adverse change in inputs that would indicate an impairment exists since the last quantitative test of these assets. As such, we concluded it was more likely than not that the fair value of each of these indefinite lived FCC broadcast licenses was more than its carrying amount and we therefore, did not perform a quantitative test on these licenses in 2024.
Investments and other assets: Investments where we have the ability to exercise significant influence, but do not control, are accounted for under the equity method of accounting. Under this method of accounting, our share of the net earnings or losses of the investee is included in “Other non-operating items, net” on our Consolidated Statements of Income. We evaluate our equity method investments for impairment whenever events or changes in circumstances indicate that the carrying amounts of such investments may be impaired. If a decline in the value of an equity method investment is determined to be other than temporary, a loss is recorded in earnings in the current period. Certain differences exist between our investment carrying value and the underlying equity of the investee companies principally due to fair value measurement at the date of investment acquisition and due to impairment charges we recorded for certain of the investments.
Investments in the equity of non-public businesses that do not have readily determinable pricing, and for which we do not have control and do not exert significant influence, are carried at cost less impairments, if any, plus or minus changes in observable prices for those investments. Gains or losses resulting from changes in the carrying value of these investments are included in “Other non-operating items (net)” on our Consolidated Statements of Income. As of December 31, 2024 and 2023, such investments totaled $29.0 million and $19.5 million, respectively. During 2024 and 2023, we recorded gains of $152.9 million and $25.8 million, respectively, in connection with the sale of such investments. See Note 3 for additional details. During 2022, we recorded a $2.5 million impairment charge on one such investment.
Our television stations are parties to contracts which provide us with rights to broadcast television series and films (syndication contracts). These syndication contracts are recorded at the gross amount of the related liability when the content is available for telecasting. The related assets are recorded at the lower of cost or estimated net realizable value. Syndication assets are classified as current (as a prepaid expense) or noncurrent (as an other asset) in the Consolidated Balance Sheets, based on when the content is expected to air. Expense is recognized on a straight line basis which appropriately matches the cost of the content with the revenues associated with them. During 2024, 2023 and 2022, we incurred syndication expense of $42.7 million, $53.2 million and $68.8 million, respectively. Syndication expense is included in “Cost of revenues” within our Consolidated Statements of Income. Syndication expense, along with network affiliation and sports rights fees, are the primarily components of our programming expense. As of December 31, 2024, $28.1 million of syndication assets existed, which we expect to be expensed within the next twelve months. The liability for syndication contracts is classified as current or noncurrent in accordance with the payment terms of the contracts. The payment period generally coincides with the period of telecast for the content, but may be shorter.
We evaluate the net realizable value of our programming contract assets when a triggering event occurs, such as a change in our intended usage, or sustained lower than expected ratings for the program. Impairment analyses are performed at the syndicated program level (across all stations that utilize the program). We determine the net realizable value based on a projection of the estimated revenues less projected direct costs associated with the syndicated program. If the future direct costs exceed expected revenues, impairment of the programming contract asset may be required. In 2023, we recognized an impairment charge of $3.4 million related to certain programming assets.
Redeemable Noncontrolling interest: Our Premion business operates an advertising network for streaming applications and connected television platforms. In March 2020, we sold a minority interest in Premion to an affiliate of Gray Television (Gray) and entered into a commercial reselling agreement with the affiliate. Gray’s investment allows it to sell its interest to Premion if there is a change in control of TEGNA or if the existing commercial agreement terminates. Since redemption of the minority ownership interest is outside our control, Gray’s equity interest is presented outside of the Equity section on the Consolidated Balance Sheets in the caption “Redeemable noncontrolling interest.” When the redemption or carrying value (the acquisition date fair value adjusted for the noncontrolling interest’s share of net income (loss) and dividends) is less than the recorded redemption value, we adjust the redeemable noncontrolling interest to equal the redemption value with changes recognized as an adjustment to retained earnings. Any such adjustment, when necessary, will be performed as of the applicable balance sheet date.
Treasury Stock: We account for treasury stock under the cost method. When treasury stock is re-issued at a price higher than its cost, the difference is recorded as a component of additional paid-in-capital (APIC) in our Consolidated Balance Sheets. When treasury stock is re-issued at a price lower than its cost, the difference is recorded as a component of APIC to the extent that there are previously recorded gains to offset the losses. If there are no accumulated gains in APIC, the losses upon re-issuance of treasury stock are recorded as a reduction of retained earnings in our Consolidated Balance Sheets.
Revenue recognition: Revenue is recognized upon the transfer of control of promised services to our customers in an amount that reflects the consideration we expect to receive in exchange for those services. Revenue is recognized net of any taxes collected from customers, which are subsequently remitted to governmental authorities. Amounts received from customers in advance of providing services to our customers are recorded as deferred revenue.
Our largest source of revenue is our subscription revenue from retransmission agreements with multichannel video programming distributors (e.g., cable and satellite providers) (MVPDs) and virtual multichannel video programming distributors that deliver a package of linear video content to consumers over the Internet (vMVPDs). Under these multi-year contracts, we grant these providers the right to include our stations’ linear television signals in their packages of video offerings that they make available to consumers in exchange for a fee. Subscription revenue is recognized in accordance with the guidance for licensing intellectual property utilizing a usage based method. The amount of revenue earned is based on the number of subscribers to which the MVPDs and vMVPDs retransmit our signal and is calculated at the negotiated fee per subscriber under each agreement. Our MVPD and vMVPD partners generally submit payments monthly, typically within 60 to 90 days after the month that the service was provided. Our performance obligations are satisfied, and revenue is recognized, as the distributors retransmit our signal. This measure toward satisfaction of our performance obligations and recognition of revenue is the most appropriate as it aligns our revenue recognition with the value that we are delivering to our distribution partners when we provide retransmission consent.
We also earn revenue through the sale of advertising and marketing services (AMS). This revenue stream includes all sources of our traditional television and radio advertising, as well as digital revenues including Premion. Contracts within this revenue stream are short-term in nature (most often three months or less). Contracts generally consist of multiple deliverables, such as television commercials and/or digital advertising solutions, that we have identified as individual performance obligations. Before performing under the contract, we establish the transaction price with our customer based on the agreed upon rates for each performance obligation.
Revenue is recognized as we fulfill our performance obligations to our customers. For our AMS revenue stream, we measure the fulfillment of our performance obligations based on the airing of the individual television commercials or display of digital advertisements. This measure is most appropriate as it aligns our revenue recognition with the value we are providing to our customers. The price to air each individual linear television commercial and digital advertisement is negotiated with our customer and is determined based on multiple factors, including, but not limited to, the programming and day-part selected, supply of available inventory, the applicable station’s viewership ratings and overall market conditions (e.g., timing of the year and strength of U.S. economy). Customers are billed monthly and payment is generally due 30 days after the date of the invoice. Commission costs related to these contracts are expensed as incurred due to the short-term nature of the contracts.
We also generate revenue from the sale of political advertising. Contracts within this revenue stream are short-term in nature (typically weekly or monthly buys during political campaigns). Customers pre-pay these contracts and we therefore defer the associated revenue until the advertising has been delivered, at which time we have satisfied our performance obligations and recognize revenue. Commission costs related to these contracts are expensed as incurred due to the short-term nature of the contracts.
Our remaining revenue is comprised of various other services, primarily production services (for news content and commercials) and tower rental income and distribution of our local news content. Revenue is recognized as these various services are provided to our customers.
In instances where we sell services from more than one revenue stream to the same customer at the same time, we recognize one contract and allocate the transaction price to each deliverable element (e.g., performance obligation) based on the relative fair value of each element.
Revenue earned by categories in 2024, 2023 and 2022 are shown below (amounts in thousands):
| | | | | | | | | | | |
| 2024 | | | 2023 | | | 2022 | |
Subscription | $ | 1,455,811 | | | $ | 1,527,563 | | | $ | 1,530,402 | |
Advertising & Marketing Services | | 1,226,638 | | | | 1,289,903 | | | | 1,363,417 | |
Political | | 373,229 | | | | 45,800 | | | | 341,110 | |
Other | | 46,293 | | | | 47,664 | | | | 44,316 | |
Total revenues | $ | 3,101,971 | | | $ | 2,910,930 | | | $ | 3,279,245 | |
Retirement plans: Certain employees are covered by defined benefit pension plans and we provide certain medical and life insurance benefits to eligible retirees (collectively, postretirement benefit plans). The amounts we record related to our postretirement benefit plans are computed using actuarial valuations that are based in part on certain key economic assumptions we make, including the discount rate, the expected long-term rate of return on plan assets and other actuarial assumptions including mortality estimates, health care cost trend rates and employee turnover, each as appropriate based on the nature of the plans. Depending on the timing of the estimated payments, we recognize the funded status of our postretirement benefit plans as a current or non-current liability within our Consolidated Balance Sheets. When annually adjusting to recognize the funded status of the plan, there is a corresponding non-cash adjustment to accumulated other comprehensive loss, net of tax benefits, recorded in the Consolidated Statements of Equity and Redeemable Noncontrolling Interest. The funded status is measured as the difference between the fair value of the plan’s assets and the benefit obligation of the plan.
Employee awards stock-based employee compensation: We grant restricted stock units (RSUs) and performance share awards (PSAs) to employees as a form of compensation. The expense for the RSUs is based on the grant date fair value of the award and is generally recognized on a straight-line basis. Expense related to PSAs is remeasured monthly to take into account changes in the Company’s stock price over the first two-year performance period, as the award provides the Leadership Development and Compensation Committee with limited discretion to make adjustments to the financial targets to ensure consistent year-to-year comparison for the performance criteria. Expense under these programs is recognized over the requisite service period, which is typically a four-year period for RSUs and a three-year period for PSAs. Performance share expense for participants meeting certain retirement eligible criteria as defined in the plan is recognized using the accelerated attribution method. See Note 9 for further discussion.
Advertising and marketing costs: We expense advertising and marketing costs, such as costs to promote our brands, as they are incurred. Advertising expenses were $12.0 million in 2024, $10.7 million in 2023 and $9.7 million in 2022, and are included in “Business units - Selling, general and administrative expenses” on the Consolidated Statements of Income.
Income taxes: Income taxes are presented on the consolidated financial statements using the asset and liability method, under which deferred tax assets and liabilities are recognized based on the future tax consequences attributable to temporary differences that exist between the financial statement carrying amount of assets and liabilities and their respective tax basis, as well as from tax loss and tax credit carryforwards. Deferred income taxes reflect expected future tax benefits (i.e., assets) and future tax costs (i.e., liabilities). The tax effect of net operating loss, capital loss and general business credit carryovers result in deferred tax assets. We measure deferred tax assets and liabilities using the enacted tax rate expected to apply to taxable income in the years in which those temporary differences are expected to be recoverable or settled. We recognize the effect on deferred taxes of a change in tax rates in income in the period that includes the enactment date. Valuation allowances are established if, based upon the weight of available evidence, management determines it is “more likely than not” that some portion or all of the deferred tax asset will not be realized.
We periodically assess our tax filing exposures related to periods that are open to examination. Based on the latest available information, we evaluate our tax positions to determine whether it is more likely than not the position will be sustained upon examination by the relevant taxing authority. If we cannot reach a more likely than not determination, no benefit is recorded. If we determine the tax position is more likely than not to be sustained, we record the largest amount of benefit that is more likely than not to be realized when the tax position is settled. We record interest and penalties related to income taxes as a component of income tax expense on our Consolidated Statements of Income. Interest and penalties were not material in each year presented.
Loss contingencies: We are subject to various legal proceedings, claims and regulatory matters, the outcomes of which are subject to significant uncertainty. We determine whether to disclose or accrue for loss contingencies based on an assessment of whether the risk of loss is remote, reasonably possible or probable, and whether it can be reasonably estimated. We accrue for loss contingencies when such amounts are probable and reasonably estimable. If a contingent liability is only reasonably possible, we will disclose the potential range of the loss, if material and estimable.
Accounting guidance adopted in 2024: In November 2023, the Financial Accounting Standards Board (FASB) issued Accounting Standard Update (“ASU”) 2023-07 Segment Reporting (Topic 280): Improvements to Reportable Segment Disclosures. This new guidance changes required disclosures related to segment reporting. The guidance requires entities to disclose on a quarterly and annual basis the significant segment expense items that are regularly provided to the entity’s chief operating decision maker (CODM). Entities are also required to disclose the title and position of their CODM. The annual disclosures under this new guidance became effective for us beginning in 2024 and the quarterly disclosure requirements will become effective for us in the first quarter of 2025. New disclosures under this guidance are applied on a retrospective basis.
New accounting guidance not yet adopted: In December 2023, the FASB issued ASU 2023-09 Income Taxes (Topic 740): Improvements to Income Tax Disclosures. This new guidance changes certain disclosure requirements related to income taxes. The guidance requires entities to disclose additional quantitative and qualitative information about the reconciliation between their statutory and effective tax rates. Specifically, the guidance requires disaggregation of the reconciling items using standardized categories. This guidance also requires additional disclosure of income taxes paid to now include disaggregation on a federal, state and foreign basis and to specifically include the amount of income taxes paid to individual jurisdictions when they represent five percent or more of total income tax payments. The new guidance is effective for us beginning in 2025 annual reporting and may be applied on either prospective or retrospective basis. Early adoption of the guidance is permitted. We are currently evaluating the effect this new guidance will have on our disclosures.
In November 2024, the FASB issued ASU 2024-03 Income Statement - Reporting Comprehensive Income - Expense Disaggregation Disclosures (Subtopic 220-40): Disaggregation of Income Statement Expenses. This guidance requires additional disclosure of certain amounts included in the expense captions presented in the Statement of Income as well as disclosures about selling expenses. The new guidance is effective for us beginning in 2027 on an annual basis and the first quarter of 2028 on a quarterly basis, and may be applied on either a prospective or retrospective basis. Early adoption of the guidance is permitted. We are currently evaluating the effect this new guidance will have on our disclosures.
NOTE 2 – Goodwill and other intangible assets
We operate as one operating and reportable segment which includes a goodwill balance of $3.02 billion as of December 31, 2024 and $2.98 billion as of December 31, 2023.
The following table displays indefinite-lived intangible assets and amortizable intangible assets as of December 31, 2024 and 2023 (in thousands):
| | | | | | | | | | | |
| Gross | | | Accumulated Amortization | | | Net | |
Dec. 31, 2024 | | | | | | | | |
Indefinite-lived intangibles: | | | | | | | | |
Television and radio station FCC broadcast licenses | $ | 2,124,731 | | | $ | — | | | $ | 2,124,731 | |
Amortizable intangible assets: | | | | | | | | |
Retransmission agreements | | — | | | | — | | | | — | |
Network affiliation agreements | | 266,018 | | | | (122,539 | ) | | | 143,479 | |
Other | | 104,198 | | | | (62,636 | ) | | | 41,562 | |
Total indefinite-lived and amortizable intangible assets | $ | 2,494,947 | | | $ | (185,175 | ) | | $ | 2,309,772 | |
| | | | | | | | |
Dec. 31, 2023 | | | | | | | | |
Indefinite-lived intangibles: | | | | | | | | |
Television and radio station FCC broadcast licenses | $ | 2,124,731 | | | $ | — | | | $ | 2,124,731 | |
Amortizable intangible assets: | | | | | | | | |
Retransmission agreements | | 113,621 | | | | (95,619 | ) | | | 18,002 | |
Network affiliation agreements | | 309,502 | | | | (144,834 | ) | | | 164,668 | |
Other | | 71,067 | | | | (49,496 | ) | | | 21,571 | |
Total indefinite-lived and amortizable intangible assets | $ | 2,618,921 | | | $ | (289,949 | ) | | $ | 2,328,972 | |
Our retransmission agreements and network affiliation agreements are amortized on a straight-line basis over their estimated useful lives. Other intangibles primarily include distribution agreements from our multicast networks acquisition and acquired technology from our acquisition of Octillion Media, discussed below, which are also amortized on a straight-line basis over their useful lives. In 2024, gross amortizable intangible assets and associated accumulated amortization decreased by $158.4 million, due to certain intangible assets reaching the end of their useful lives.
On January 31, 2024, Premion, LLC acquired substantially all the assets of Octillion Media, a next-generation, demand-side platform focused on Local Connected TV (CTV)/streaming apps advertising. The acquisition expands Premion’s capabilities in the growing CTV marketplace by combining Octillion’s technology with Premion’s local CTV/streaming app advertising solution.
The base purchase price of the acquisition was $56.0 million plus an adjustment for working capital and a maximum earnout of $14.0 million that the sellers are entitled to receive if the Octillion Media business achieves three separate technological and financial milestones during a defined period following the closing. In 2024, the Octillion Media business achieved the performance milestones contemplated by the first earnout, and as a result we paid $4.7 million of additional consideration to the sellers during the third quarter. No earnout was earned under the second milestone and achievement under the third milestone will be determined in 2025. Based on a re-evaluation of the expected achievement of the earnouts as of December 31, 2024, we reduced the earnout liability by $3.5 million related to a failure to achieve the second milestone in the fourth quarter. During 2024, $59.0 million of the purchase price was paid.
The acquisition was funded with available cash on hand.
We accounted for the acquisition as a business combination, which required us to record the assets acquired and liabilities assumed at fair value. The amount by which the purchase price exceeded the fair value of the net assets acquired was recorded as goodwill. Based on our valuations we have recorded $34.4 million of intangible assets related to acquired technology and customer relationships. We also recorded an additional $34.4 million as goodwill, which represents the future economic benefits expected to arise from the acquisition that do not qualify for separate recognition, including assembled workforce, as well as future synergies that we expect to generate. Substantially all of the goodwill and intangible assets are deductible for tax purposes. During the fourth quarter of 2024, we completed our calculation of the fair value of the assets acquired and liabilities assumed for the acquisitions; therefore, these amounts are now final.
The following table shows the projected annual amortization expense related to amortizable intangible assets existing as of December 31, 2024 (in thousands):
| | | |
2025 | $ | 35,348 | |
2026 | | 31,310 | |
2027 | | 21,457 | |
2028 | | 20,524 | |
2029 | | 14,200 | |
Thereafter | | 62,202 | |
Total | $ | 185,041 | |
NOTE 3 – Investments and other assets
Our investments and other assets consisted of the following as of December 31, 2024 and 2023 (in thousands):
| | | | | | | |
| Dec. 31, | |
| 2024 | | | 2023 | |
Cash value life insurance | $ | 51,860 | | | $ | 50,865 | |
Equity method investments | | 16,280 | | | | 16,195 | |
Other equity investments | | 29,020 | | | | 19,526 | |
Deferred financing costs | | 6,137 | | | | — | |
Prepaid assets | | 5,960 | | | | 9,878 | |
Other long-term assets | | 23,280 | | | | 17,057 | |
Total | $ | 132,537 | | | $ | 113,521 | |
Cash value life insurance: We are the beneficiary of life insurance policies on the lives of certain employees/retirees, which are recorded at their cash surrender value as determined by the insurance carrier. These policies are utilized as a partial funding source for deferred compensation and other non-qualified employee retirement plan. Gains and losses on these investments are included in “Other non-operating items, net” within our Consolidated Statements of Income and were not material for all periods presented.
Equity method investments: These are investments in entities in which we have significant influence, but do not have a controlling financial interest. Our share of net earnings and losses from these ventures is included in “Other non-operating items, net” in the Consolidated Statements of Income.
Other equity investments: Represent investments in non-public businesses that do not have readily determinable pricing, and for which we do not have control or do not exert significant influence. These investments are recorded at cost less impairments, if any, plus or minus changes in observable prices for those investments.
In the first quarter of 2024, we received $152.9 million of pre-tax cash proceeds upon the completion of the sale of Broadcast Music, Inc. (BMI) to a private equity firm. The pre-tax gain of $152.9 million associated with this sale is included in “Other non-operating items, net” in the Consolidated Statements of Income. Following this sale we no longer have any ownership interest in BMI.
We own an equity investment in MadHive, Inc (MadHive) that is accounted for as an other equity investment. In the third quarter of 2023 we sold a portion of this investment for $26.4 million, which resulted in a gain of $25.8 million that was recorded in “Other non-operating items, net” within our Consolidated Statements of Income. The sale reduced our ownership in MadHive to 19% on a fully diluted basis.
Deferred financing costs: These costs consist of amounts paid to lenders related to our revolving credit facility. On January 25, 2024, we entered into an amendment of our credit facility that resulted in the capitalization of $6.4 million of fees paid to lenders under the new amendment. Additionally, we reclassified approximately $1.1 million of fees under the previous credit facility as non-current deferred financing costs. See Note 5 for additional details of the revolving credit facility amendment. Financing costs paid for our unsecured notes are accounted for as a reduction in the debt obligation.
Other long-term assets: These amounts primarily consist of an asset related to a long-term services agreement for IT security and debt investments that we made in 2024.
NOTE 4 – Income taxes
The provision (benefit) for income taxes consists of the following (in thousands):
| | | | | | | | | | | | |
2024 | | Current | | | Deferred | | | Total | |
Federal | | $ | 154,621 | | | $ | 120 | | | $ | 154,741 | |
State and other | | | 23,130 | | | | (3,927 | ) | | | 19,203 | |
Total | | $ | 177,751 | | | $ | (3,807 | ) | | $ | 173,944 | |
| | | | | | | | | | | | |
2023 | | Current | | | Deferred | | | Total | |
Federal | | $ | 96,816 | | | $ | 14,240 | | | $ | 111,056 | |
State and other | | | 13,646 | | | | 5,497 | | | | 19,143 | |
Total | | $ | 110,462 | | | $ | 19,737 | | | $ | 130,199 | |
| | | | | | | | | | | | |
2022 | | Current | | | Deferred | | | Total | |
Federal | | $ | 161,438 | | | $ | 13,435 | | | $ | 174,873 | |
State and other | | | 23,456 | | | | 4,041 | | | | 27,497 | |
Total | | $ | 184,894 | | | $ | 17,476 | | | $ | 202,370 | |
Income before income taxes attributable to TEGNA Inc. consists almost entirely of domestic income, with an immaterial amount from foreign sources.
The provision for income taxes varies from the U.S. federal statutory tax rate as a result of the following differences:
| | | | | | | | | | | | |
| | 2024 | | | 2023 | | | 2022 | |
U.S. statutory tax rate | | | 21.0 | % | | | 21.0 | % | | | 21.0 | % |
Increase (decrease) in taxes resulting from: | | | | | | | | | |
State taxes (net of federal income tax benefit) | | | 2.9 | | | | 2.3 | | | | 2.7 | |
Purchase of clean energy federal tax credits | | | (1.0 | ) | | | — | | | | — | |
Uncertain tax positions, settlements and lapse of statutes of limitations | | | (0.3 | ) | | | (0.2 | ) | | | — | |
Valuation allowance on equity method investment | | | 0.1 | | | | (0.7 | ) | | | 0.6 | |
Other valuation allowances, tax rate changes, & deferred adjustments | | | (0.7 | ) | | | 0.8 | | | | (0.6 | ) |
Non-deductible transaction costs | | | — | | | | (0.8 | ) | | | 0.5 | |
Net excess benefits or expense on share-based payments | | | 0.2 | | | | (0.1 | ) | | | (0.3 | ) |
Non-taxable Merger termination fee | | | — | | | | (1.3 | ) | | | — | |
Other, net | | | 0.3 | | | | 0.5 | | | | 0.4 | |
Effective tax rate | | | 22.5 | % | | | 21.5 | % | | | 24.3 | % |
Deferred income taxes reflect temporary differences in the recognition of revenue and expense for tax reporting and financial statement purposes. Deferred tax liabilities and assets are adjusted for changes in tax laws or tax rates of the various tax jurisdictions as of the enacted date.
Deferred tax liabilities and assets were composed of the following as of December 31, 2024 and 2023 (in thousands):
| | | | | | | | |
| | 2024 | | | 2023 | |
Deferred tax liabilities | | | | | | |
Accelerated amortization of deductible intangibles | | $ | 567,009 | | | $ | 561,741 | |
Accelerated depreciation | | | 59,558 | | | | 65,247 | |
Right-of-use assets for operating leases | | | 15,770 | | | | 18,361 | |
Other | | | 4,097 | | | | 4,024 | |
Total deferred tax liabilities | | | 646,434 | | | | 649,373 | |
Deferred tax assets | | | | | | |
Accrued compensation costs | | | 23,081 | | | | 22,450 | |
Pension and post-retirement medical and life | | | 17,804 | | | | 18,839 | |
Loss carryforwards | | | 15,416 | | | | 16,435 | |
Operating lease liabilities | | | 16,656 | | | | 19,443 | |
Other | | | 18,065 | | | | 18,988 | |
Total deferred tax assets | | | 91,022 | | | | 96,155 | |
Deferred tax asset valuation allowance | | | 23,801 | | | | 25,001 | |
Total net deferred tax liabilities | | $ | 579,213 | | | $ | 578,219 | |
As of December 31, 2024, we had approximately $4.3 million of state net operating loss carryovers that, if not utilized, will expire in various amounts beginning in 2028 through 2043 in addition to $3.7 million of federal and $13.3 million of state interest disallowance carryforwards that do not expire.
Included in total deferred tax assets are valuation allowances of approximately $23.8 million as of December 31, 2024, and $25.0 million as of December 31, 2023, primarily related to federal and state interest disallowance carryforwards, minority investments, accrued compensation costs, and state net operating loss carryforwards. This $1.2 million change in valuation allowance is primarily due to the release of a valuation allowance on state net operating loss carryforwards partially offset by additional valuation allowances on state interest disallowance carryforwards. If, in the future, we believe that it is more likely than not that these deferred tax assets will be realized, the valuation allowances will be reversed in the Consolidated Statements of Income.
Realization of deferred tax assets for which valuation allowances have not been established is dependent upon generating sufficient future taxable income. We expect to realize the benefit of these deferred tax assets through future reversals of our deferred tax liabilities, through the recognition of taxable income in the allowable carryback and carryforward periods, and through implementation of future tax planning strategies. Although realization is not assured, we believe it is more likely than not that all deferred tax assets for which valuation allowances have not been established will be realized.
The following table summarizes the activity related to deferred tax asset valuation allowances (in thousands):
| | | | | | | | | | | | |
| | 2024 | | | 2023 | | | 2022 | |
Balance at beginning of year | | $ | 25,001 | | | $ | 26,339 | | | $ | 41,929 | |
Additions to valuation allowance | | | 2,212 | | | | 5,001 | | | | 7,228 | |
Reductions to valuation allowance | | | (3,412 | ) | | | (6,339 | ) | | | (22,818 | ) |
Balance at the end of year | | $ | 23,801 | | | $ | 25,001 | | | $ | 26,339 | |
Uncertain Tax Positions
The following table summarizes the activity related to unrecognized tax benefits, excluding the federal tax benefit of state tax deductions (in thousands):
| | | | | | | | | | | | |
| | 2024 | | | 2023 | | | 2022 | |
Change in unrecognized tax benefits | | | | | | | | | |
Balance at beginning of year | | $ | 6,645 | | | $ | 7,725 | | | $ | 8,196 | |
Additions based on tax positions related to the current year | | | 123 | | | | — | | | | — | |
Additions for tax positions of prior years | | | 123 | | | | 151 | | | | — | |
Reductions of tax positions of prior years | | | (378 | ) | | | (680 | ) | | | — | |
Settlements | | | (1,710 | ) | | | — | | | | (9 | ) |
Reductions due to lapse of statutes of limitations | | | (567 | ) | | | (551 | ) | | | (462 | ) |
Balance as of end of year | | $ | 4,236 | | | $ | 6,645 | | | $ | 7,725 | |
The total amount of unrecognized tax benefits that, if recognized, would impact the effective tax rate was $3.4 million as of December 31, 2024, and $5.6 million as of December 31, 2023. This amount includes the federal tax benefit of state tax deductions.
We recognize interest and penalties related to unrecognized tax benefits as a component of income tax expense. We also recognize interest income attributable to overpayment of income taxes and from the reversal of interest expense previously recorded for uncertain tax positions which are subsequently released as a component of income tax expense. We recorded income from interest and penalties for uncertain tax positions of $0.8 million in 2024 and $0.3 million in 2023 while recognizing an expense of $0.2 million in 2022. The amount of accrued interest expense and penalties payable related to unrecognized tax benefits was zero as of December 31, 2024 and $0.7 million as of December 31, 2023.
We file income tax returns in the U.S. and various state jurisdictions. The 2021 through 2024 tax years remain subject to examination by the Internal Revenue Service, and the 2016 through 2024 tax years remain subject to examination by state authorities.
It is reasonably possible that the amount of unrecognized benefit with respect to certain of our unrecognized tax positions will increase or decrease within the next 12 months. These changes may be the result of settlement of ongoing audits, lapses of statutes of limitations or other regulatory developments. At this time, we estimate the amount of our gross unrecognized tax positions may decrease by up to approximately $0.6 million within the next 12 months primarily due to lapses of statutes of limitations and settlement of ongoing audits in various jurisdictions.
NOTE 5 – Long-term debt
Our long-term debt is summarized below (in thousands):
| | | | | | | |
| Dec. 31, | |
| 2024 | | | 2023 | |
Unsecured notes bearing fixed rate interest at 4.75% due March 2026 | $ | 550,000 | | | $ | 550,000 | |
Unsecured notes bearing fixed rate interest at 7.75% due June 2027 | | 200,000 | | | | 200,000 | |
Unsecured notes bearing fixed rate interest at 7.25% due September 2027 | | 240,000 | | | | 240,000 | |
Unsecured notes bearing fixed rate interest at 4.625% due March 2028 | | 1,000,000 | | | | 1,000,000 | |
Unsecured notes bearing fixed rate interest at 5.00% due September 2029 | | 1,100,000 | | | | 1,100,000 | |
Total principal long-term debt | | 3,090,000 | | | | 3,090,000 | |
Debt issuance costs | | (17,285 | ) | | | (22,226 | ) |
Unamortized premiums and discounts, net | | 3,736 | | | | 5,027 | |
Total long-term debt | $ | 3,076,451 | | | $ | 3,072,801 | |
On January 25, 2024, we entered into an amendment to our revolving credit facility (the Credit Agreement). Among other things, the amendment amended the Credit Agreement to:
•Reduce the Five-Year Commitments (as defined in the Credit Agreement) from $1.51 billion to $750 million;
•Extend the term of such Five-Year Commitments from August 15, 2024 to January 25, 2029, subject to a 91-day springing maturity date if debt in excess of $300 million (subject to certain exceptions) were to mature before such date;
•Add the right to obtain a temporary 0.5x step-up in the Total Leverage Ratio (as defined in the Credit Agreement) after consummating a Qualified Acquisition (as defined in the Credit Agreement);
•Increase the amount of Unrestricted Cash (as defined in the Credit Agreement) to $600 million;
•Amend the definition of Consolidated EBITDA to include an add-back for certain professional fees and expenses; and
•Establish a $50 million swingline facility.
Under the amended Credit Agreement, the Company’s maximum Total Leverage Ratio (as defined in the Credit Agreement) remained unchanged at 4.50x.
As of December 31, 2024, cash and cash equivalents totaled $693.2 million and we had $11.8 million of letters of credit outstanding resulting in unused borrowing capacity of $738.2 million under our $750 million revolving credit facility, which expires in January 2029. As of December 31, 2024, we were in compliance with all covenants contained in our debt agreements and credit facility, including the leverage ratio (our one financial covenant). We believe, based on our current financial forecasts and trends, that we will remain compliant with all covenants for the foreseeable future.
Our debt maturities may be repaid with cash flow from operating activities, accessing capital markets or a combination of both. The following schedule discloses annual maturities of the principal amount of total debt due (in thousands):
| | | |
Repayment schedule of principal long-term debt as of Dec. 31, 2024 | Annual Maturities | |
2025 | $ | — | |
2026 | | 550,000 | |
2027 | | 440,000 | |
2028 | | 1,000,000 | |
2029 | | 1,100,000 | |
Thereafter | | — | |
Total | $ | 3,090,000 | |
NOTE 6 – Retirement plans
We have various defined benefit retirement plans. Our principal defined benefit pension plan is the TEGNA Retirement Plan (TRP). The disclosure tables presented below primarily include the assets and obligations of the TRP and the TEGNA Supplemental Retirement Plan (SERP). We use a December 31 measurement date convention for our retirement plans.
Pension costs, which primarily include costs for our qualified TRP and non-qualified SERP, are presented in the following table (in thousands):
| | | | | | | | | | | | |
| | 2024 | | | 2023 | | | 2022 | |
Interest cost on benefit obligation | | $ | 22,756 | | | $ | 24,183 | | | $ | 16,830 | |
Expected return on plan assets | | | (22,066 | ) | | | (20,940 | ) | | | (19,502 | ) |
Amortization of prior service cost | | | 90 | | | | 90 | | | | 90 | |
Amortization of actuarial loss | | | 5,942 | | | | 6,059 | | | | 4,583 | |
Pension settlement charge | | | 10,316 | | | | — | | | | 300 | |
Expense for (income from) company-sponsored retirement plans | | $ | 17,038 | | | $ | 9,392 | | | $ | 2,301 | |
The amounts provided above for amortization of prior service costs and actuarial loss represent the reclassification of prior service cost and actuarial losses that were previously recorded in Accumulated Comprehensive Loss on the Consolidated Balance Sheet in prior periods. We record pension settlement charges when aggregate lump-sum payments from the plan exceed the sum of service and interest cost components associated with the plan for the year.
Benefits no longer accrue for TRP and SERP participants as a result of amendments to the plans in the past years, and as such we no longer incur a service cost component of pension expense. All other components of our pension expense presented above are included within the “Other non-operating items, net” line item of the Consolidated Statements of Income.
The following table provides a reconciliation of pension benefit obligations (on a projected benefit obligation measurement basis), plan assets and funded status of company-sponsored retirement plans, along with the related amounts that are recognized in the Consolidated Balance Sheets (in thousands).
| | | | | | | | |
| | Dec. 31, | |
| | 2024 | | | 2023 | |
Change in benefit obligations | | | | | | |
Benefit obligations as of beginning of year | | $ | 462,466 | | | $ | 464,309 | |
Interest cost | | | 22,756 | | | | 24,183 | |
Actuarial (gain) loss | | | (14,400 | ) | | | 9,443 | |
Benefits paid | | | (32,666 | ) | | | (35,469 | ) |
Pension settlements (1) | | | (28,334 | ) | | | — | |
Benefit obligations as of end of year | | $ | 409,822 | | | $ | 462,466 | |
Change in plan assets | | | | | | |
Fair value of plan assets as of beginning of year | | $ | 386,108 | | | $ | 385,005 | |
Actual gains experienced by plan assets | | | 5,270 | | | | 32,739 | |
Employer contributions | | | 7,524 | | | | 3,833 | |
Benefits paid | | | (32,666 | ) | | | (35,469 | ) |
Pension settlements (1) | | | (28,334 | ) | | | — | |
Fair value of plan assets as of end of year | | $ | 337,902 | | | $ | 386,108 | |
Funded status as of end of year | | $ | (71,920 | ) | | $ | (76,358 | ) |
Amounts recognized in Consolidated Balance Sheets | | | | | | |
Accrued liabilities other—current | | $ | (5,964 | ) | | $ | (5,875 | ) |
Pension liabilities—non-current | | $ | (65,956 | ) | | $ | (70,483 | ) |
(1) Settlements represent lump sum benefit payments to certain TRP participants. When aggregate lump sums exceed the settlement threshold, pension settlement charges are incurred, and the lump sum payments prompting the charge are shown on a separate line from other benefit payments.
The actuarial gain in 2024 of $14.4 million was primarily due to an increase in the discount rate used to calculate the benefit obligations (which increased from 5.20% at December 31, 2023 to 5.60% as of December 31, 2024), which resulted in an actuarial gain of $13.0 million.
The actuarial loss in 2023 of $9.4 million was primarily due to a decrease in the discount rate used to calculate the benefit obligations (which decreased from 5.50% at December 31, 2022 to 5.20% as of December 31, 2023), which resulted in an actuarial loss of $10.9 million.
The funded status (on a projected benefit obligation basis) of our principal retirement plans as of December 31, 2024, is as follows (in thousands):
| | | | | | | | | | | | |
| | Fair Value of Plan Assets | | | Benefit Obligation | | | Funded Status | |
TRP | | $ | 337,902 | | | $ | 365,381 | | | $ | (27,479 | ) |
SERP (1) | | | — | | | | 44,162 | | | | (44,162 | ) |
All other | | | — | | | | 279 | | | | (279 | ) |
Total | | $ | 337,902 | | | $ | 409,822 | | | $ | (71,920 | ) |
(1) The SERP is an unfunded, unsecured liability.
Cash contributions to the TRP of $3.7 million were made in 2024. No TRP contributions were made in 2023. We made payments to participants of unfunded pension plans, principally the SERP, of $3.7 million and $3.8 million in 2024 and 2023, respectively. During 2025, we are expecting to make no contributions to the TRP and $5.9 million of contributions to the SERP.
The following table presents information for our retirement plans for which accumulated benefit obligation exceed assets (in thousands):
| | | | | | | | |
| | Dec. 31, | |
| | 2024 | | | 2023 | |
Accumulated benefit obligation | | $ | 409,822 | | | $ | 462,466 | |
Fair value of plan assets | | $ | 337,902 | | | $ | 386,108 | |
The following table presents information for our retirement plans for which projected benefit obligations exceed assets (in thousands):
| | | | | | | | |
| | Dec. 31, | |
| | 2024 | | | 2023 | |
Projected benefit obligation | | $ | 409,822 | | | $ | 462,466 | |
Fair value of plan assets | | $ | 337,902 | | | $ | 386,108 | |
The following table summarizes the pre-tax amounts recorded in accumulated other comprehensive loss that have not yet been recognized as a component of pension expense (in thousands):
| | | | | | | | |
| | Dec. 31, | |
| | 2024 | | | 2023 | |
Net actuarial losses | | $ | (145,225 | ) | | $ | (159,086 | ) |
Prior service cost | | | (1,346 | ) | | | (1,436 | ) |
Amounts in accumulated other comprehensive loss | | $ | (146,571 | ) | | $ | (160,522 | ) |
Other changes in plan assets and benefit obligations recognized in other comprehensive income (loss), pre-tax, consist of the following (in thousands):
| | | | | | | | | | | | |
| | 2024 | | | 2023 | | | 2022 | |
Current year net actuarial (loss)/gain | | $ | (2,392 | ) | | $ | 2,356 | | | $ | (23,688 | ) |
Amortization of actuarial loss | | | 5,942 | | | | 6,059 | | | | 4,583 | |
Amortization of previously deferred prior service costs | | | 90 | | | | 90 | | | | 90 | |
Pension settlement charge | | | 10,316 | | | | — | | | | 300 | |
Total | | $ | 13,956 | | | $ | 8,505 | | | $ | (18,715 | ) |
Pension costs: The following assumptions were used to determine net pension costs:
| | | | | | |
| | 2024 | | 2023 | | 2022 |
Discount rate | | 5.20% | | 5.50% | | 2.89% |
Expected return on plan assets | | 6.00% | | 5.75% | | 3.75% |
The expected return on plan assets assumption was determined based on plan asset allocations, a review of historical capital market performance, historical plan asset performance and a forecast of expected future plan asset returns.
Benefit obligations and funded status: The following assumptions were used to determine the year-end benefit obligations:
| | | | |
| | Dec. 31, |
| | 2024 | | 2023 |
Discount rate | | 5.60% | | 5.20% |
Plan assets: The asset allocation for the TRP as of the end of 2024 and 2023, and target allocations for 2024, by asset category, are presented in the table below:
| | | | | | |
| | Target Allocation | | Actual allocation of Plan Assets |
| | 2025 | | 2024 | | 2023 |
Equity securities | | 33% | | 20% | | 17% |
Debt securities | | 67% | | 80% | | 83% |
Total | | 100% | | 100% | | 100% |
The primary objective of company-sponsored retirement plans is to provide eligible employees with scheduled pension benefits. Consistent with standards for preservation of capital and maintenance of liquidity, the goal is to earn the highest possible total rate of return while minimizing risk. The principal means of reducing volatility and exercising prudent investment judgment is diversification by asset class and by investment manager; consequently, portfolios are constructed to attain diversification in the total portfolio, and each asset class. Investment diversification is consistent with the intent to minimize the risk of large losses. All objectives are based upon an investment horizon spanning five years so that interim market fluctuations can be viewed with the appropriate perspective. Risk characteristics are measured and compared with an appropriate benchmark quarterly; periodic reviews are made of the investment objectives and the investment managers. The target asset allocation represents the long-term perspective. Retirement plan assets will be rebalanced periodically to align them with the target asset allocations. Target asset allocations are based on the funded status of the TRP (fair value of pension assets as a percentage of the projected pension obligation). During 2024, the target allocation was 14% for equity securities and 86% for debt securities. Our actual investment return on our TRP assets was 2.4% for 2024, 10.0% for 2023 and (23.0)% for 2022.
Cash flows: We estimate we will make the following benefit payments from either retirement plan assets or directly from our funds (in thousands):
| | | | |
Future Period | | Cash Payments | |
2025 | | $ | 48,697 | |
2026 | | | 41,456 | |
2027 | | | 36,796 | |
2028 | | | 36,465 | |
2029 | | | 35,309 | |
2030 through 2034 | | $ | 159,004 | |
401(k) savings plan
Substantially all our employees (other than those covered by a collective bargaining agreement) are eligible to participate in our principal defined contribution plan, the TEGNA 401(k) Savings Plan. Employees can elect to contribute up to 50% of their compensation to the plan subject to certain limits.
For most participants, the plan’s 2024 matching formula was 100% of the first 4% of compensation that an employee contributes. We also make additional employer contributions on behalf of certain long-term employees. Compensation expense related to 401(k) contributions was $18.7 million in 2024, $18.6 million in 2023 and $18.7 million in 2022. During 2024, 2023 and 2022, we settled the 401(k) employer match obligation by issuing our common stock from treasury stock and depositing it in the participants’ accounts.
Multi-employer plan
We contribute to the AFTRA Retirement Plan (AFTRA Plan), a multi-employer defined benefit pension plan, under the terms of collective-bargaining agreements (CBA) that cover certain union-represented employees. The Employee Identification Number (EIN) and three-digit plan number of the AFTRA Plan is 13-6414972/001.
The AFTRA Plan reports for plan year (December 1, 2022 to November 30, 2023) that the AFTRA Plan was neither in endangered, critical, or critical and declining status in the Plan Year (e.g. approximately 88% funded). A financial improvement plan or a rehabilitation plan is neither pending nor has one been implemented for the AFTRA Plan.
We make all required contributions to the AFTRA plan as determined under the respective CBAs. We contributed $2.9 million in 2024, $2.8 million in 2023 and $2.7 million in 2022. Our contribution to the AFTRA Retirement Plan represented less than 5% of total contributions to the plan. This calculation is based on the plan financial statements issued for the period ending November 30, 2023.
Expiration dates of the SAG-AFTRA CBAs in place range from April 16, 2025 to December 19, 2026. The AFTRA Plan has elected to utilize special amortization provisions provided under the Preservation of Access to Care for Medicare Beneficiaries and Pension Relief Act of 2010.
We incurred no expenses for multi-employer withdrawal liabilities for the years ended December 31, 2024, 2023 and 2022.
NOTE 7 - Leases
We determine if an arrangement contains a lease at the agreement’s inception. Our portfolio of leases primarily consists of leases for the use of corporate offices, station facilities, equipment and for antenna/transmitter sites. Our lease portfolio consists entirely of operating leases, with most of our leases having remaining terms of less than 15 years. Operating lease balances are included in our right-of-use assets, other accrued liabilities and operating lease liabilities on our Consolidated Balance Sheets.
Lease liabilities are calculated as of the lease commencement date based on the present value of lease payments to be made over the term of the lease. Our lease agreements often contain lease and non-lease components (e.g., common-area maintenance or other executory costs). We include the non-lease payments in the calculation of our lease liabilities to the extent they are either fixed or included within the fixed base rental payments. Some of our leases include variable lease components (e.g., rent increases based on the consumer price index) and variable non-lease components, which are expensed as they are incurred. Such variable costs are not material. The interest rate implicit in our lease contracts is typically not readily determinable. As a result, we use our estimated incremental borrowing rate in determining the present value of future payments, which reflects the fixed rate at which we could borrow on a collateralized basis the amount of the lease payments for a similar term.
The operating lease right-of-use asset as of the lease commencement date is calculated based on the amount of the operating lease liability, less any lease incentive. Some of our lease agreements include options to renew for additional terms or provide us with the ability to terminate the lease early. In determining the term of the lease, we consider whether or not we are reasonably certain to exercise these options. Lease expense for fixed lease payments is recognized on a straight-line basis over the lease term.
The following table presents lease related assets and liabilities on the Consolidated Balance Sheets as of December 31, 2024 and 2023 (in thousands):
| | | | | | | | |
| | Dec. 31, | |
| | 2024 | | | 2023 | |
Assets | | | | | | |
Right of use assets for operating leases | | $ | 63,535 | | | $ | 73,479 | |
| | | | | | |
Liabilities | | | | | | |
Operating lease liabilities (current)1 | | $ | 10,483 | | | $ | 11,912 | |
Operating lease liabilities (non-current) | | | 63,421 | | | | 73,733 | |
Total operating lease liabilities | | $ | 73,904 | | | $ | 85,645 | |
(1) Current operating lease liabilities are included within the other accrued liabilities line item of the Consolidated Balance Sheets.
As of December 31, 2024 and 2023, the weighted-average remaining lease term for our lease portfolio was 6.9 and 7.6 years, respectively, and the weighted average discount rate used to calculate the present value of our lease liabilities was 5.2% as of the end of both periods.
For the years ended December 31, 2024, 2023 and 2022, we recognized lease expense of $15.6 million, $16.2 million, and $16.7 million respectively. In addition, in 2024, 2023 and 2022, we made cash payments for operating leases of $16.7 million, $17.1 million and $17.6 million, respectively, which are included in cash flows from operating activities on the Consolidated Statements of Cash Flows.
The table below reconciles future lease payments for each of the next five years and remaining years thereafter, in aggregate, to the lease liabilities recorded on the Consolidated Balance Sheets as of December 31, 2024 (in thousands):
| | | | |
Future Period | | Cash Payments | |
2025 | | $ | 15,616 | |
2026 | | | 13,724 | |
2027 | | | 13,430 | |
2028 | | | 13,094 | |
2029 | | | 12,808 | |
Thereafter | | | 23,702 | |
Total lease payments | | | 92,374 | |
Less: amount of lease payments representing interest | | | 18,470 | |
Present value of lease liabilities | | $ | 73,904 | |
NOTE 8 – Fair value measurement
We measure and record certain assets and liabilities at fair value in the accompanying consolidated financial statements. U.S. GAAP establishes a fair value hierarchy for those instruments measured at fair value that distinguishes between assumptions based on market data (observable inputs) and our own assumptions (unobservable inputs). The hierarchy consists of three levels:
Level 1 – Quoted market prices in active markets for identical assets or liabilities;
Level 2 – Inputs other than Level 1 inputs that are either directly or indirectly observable; and
Level 3 – Unobservable inputs developed using our own estimates and assumptions, which reflect those that a market participant would use.
Equity investments in private companies that we do not significantly influence are recorded at cost, less impairments, if any, plus or minus changes resulting from observable price changes in orderly transactions for the identical or a similar investment. In 2022, we recorded a $2.5 million impairment charge due to the decline in the fair value of one of our investments. The fair value was determined using a market approach which was based on significant inputs not observable in the market, and thus represented a Level 3 fair value measurement.
Additionally, in 2023, we recognized a gain of $25.8 million as a result of the sale of a portion of our MadHive investment. The gain was recorded in “Other non-operating items, net” within our Consolidated Statements of Income. The fair value was based on a transaction price, which was settled in cash, in an inactive market (which is classified as Level 2 in the fair value hierarchy). Also in 2023, we recognized an impairment charge of $3.4 million, in “Asset impairment and other” within our Consolidated Statements of Income, related to certain programming assets. The fair value was determined based on a projection of the estimated revenues less projected direct costs associated with the programming (which is classified as Level 3 in the fair value hierarchy).
We additionally hold other financial instruments, including cash and cash equivalents, receivables, accounts payable and long-term debt. The carrying amounts for cash and cash equivalents, receivables and accounts payable approximated their fair values due to the short-term nature of these instruments. The fair value of our total long-term debt, determined based on the bid and ask quotes for the related debt (Level 2), totaled $2.98 billion as of December 31, 2024 and $2.93 billion as of December 31, 2023.
The below fair value tables relate to our TRP pension plan assets (in thousands):
| | | | | | | | | | | | | | | | |
| | | | | | | | | | | | |
Fair value measurements as of Dec. 31, 2024 | | Level 1 | | | Level 2 | | | Level 3 | | | Total | |
Assets: | | | | | | | | | | | | |
Cash | | $ | 81 | | | $ | — | | | $ | — | | | $ | 81 | |
Pension plan investments valued using net asset value as a practical expedient: | | | | | | | | | | | | |
Common collective trust - equities | | | | | | | | | | | | 68,146 | |
Common collective trust - fixed income | | | | | | | | | | | | 269,665 | |
Partnership/joint venture interests | | | | | | | | | | | | 10 | |
Total fair value of plan assets | | | | | | | | | | | $ | 337,902 | |
| | | | | | | | | | | | | | | | |
| | | | | | | | | | | | |
Fair value measurements as of Dec. 31, 2023 | | Level 1 | | | Level 2 | | | Level 3 | | | Total | |
Assets: | | | | | | | | | | | | |
Cash | | $ | 87 | | | $ | — | | | $ | — | | | $ | 87 | |
Pension plan investments valued using net asset value as a practical expedient: | | | | | | | | | | | | |
Common collective trust - equities | | | | | | | | | | | | 67,314 | |
Common collective trust - fixed income | | | | | | | | | | | | 318,594 | |
Partnership/joint venture interests | | | | | | | | | | | | 113 | |
Total fair value of plan assets | | | | | | | | | | | $ | 386,108 | |
Valuation methodologies used for TRP pension assets measured at fair value in 2024 and 2023 are as follows:
Interest in common/collective trusts are valued using the net asset value as a practical expedient provided monthly by the investment manager or fund company. As of December 31, 2024, there were primarily five investments in collective trusts of which four are fixed income funds, whose strategy is to use individual subfunds to efficiently add a representative sample of securities in individual market sectors to the portfolio. The remaining collective fund is invested in equity securities. The strategy of the fund is to generate returns predominantly from developed equity markets. The collective funds are generally redeemable with a short-term written or verbal notice. There are no unfunded commitments related to these types of funds.
Investments in partnerships are valued at the net asset value as a practical expedient reported by the fund managers. The Plan held an investment in one partnership in 2024. The partnership’s strategy is to generate returns through real estate-related investments. Certain distributions are received from this fund as the underlying assets are liquidated. Future funding commitments to our real estate partnership investment totaled $0.1 million as of December 31, 2024 and $0.7 million as of December 31, 2023.
Our policy is to recognize transfers between levels at the beginning of the reporting period. There were no transfers between levels during the year.
NOTE 9 – Shareholders’ equity
As of December 31, 2024, and 2023, our authorized capital was comprised of 800 million shares of common stock and 2 million shares of preferred stock. No shares of preferred stock were issued or outstanding as of December 31, 2024 or 2023. As of December 31, 2024, shareholders’ equity of TEGNA included 159.9 million common shares that were outstanding (net of 164.5 million shares of common stock held in treasury). As of December 31, 2023, shareholders’ equity of TEGNA included 179.9 million common shares that were outstanding (net of 144.5 million shares of common stock held in treasury).
Capital stock and earnings per share
We report earnings per share on two bases, basic and diluted. All basic earnings per share amounts are based on the weighted average number of common shares outstanding during the year. The calculation of diluted earnings per share includes the dilutive effects for the assumed vesting of outstanding restricted stock units and performance share awards. The diluted earnings per share amounts exclude the effects of approximately 270 thousand stock awards for 2024 as their inclusion would be accretive to earnings per share.
Our earnings per share (basic and diluted) for 2024, 2023, and 2022 are presented below (in thousands, except per share amounts):
| | | | | | | | | | | | |
| | 2024 | | | 2023 | | | 2022 | |
Net income | | $ | 599,043 | | | $ | 476,347 | | | $ | 631,198 | |
Net loss (income) attributable to the noncontrolling interest | | | 775 | | | | 377 | | | | (729 | ) |
Adjustment of redeemable noncontrolling interest to redemption value | | | (2,280 | ) | | | (1,771 | ) | | | (560 | ) |
Earnings available to common shareholders | | $ | 597,538 | | | $ | 474,953 | | | $ | 629,909 | |
| | | | | | | | | |
Weighted average number of common shares outstanding - basic | | | 168,434 | | | | 207,594 | | | | 223,652 | |
Effect of dilutive securities: | | | | | | | | | |
Restricted stock units | | | 603 | | | | 220 | | | | 535 | |
Performance share awards | | | 128 | | | | 133 | | | | 299 | |
Weighted average number of common shares outstanding - diluted | | | 169,165 | | | | 207,947 | | | | 224,486 | |
| | | | | | | | | |
Earnings per share - basic | | $ | 3.55 | | | $ | 2.29 | | | $ | 2.82 | |
| | | | | | | | | |
Earnings per share - diluted | | $ | 3.53 | | | $ | 2.28 | | | $ | 2.81 | |
Share repurchases
On June 2, 2023, we entered into an accelerated share repurchase program (the first ASR) with JPMorgan Chase Bank, National Association (JPMorgan). Under the terms of the first ASR, we repurchased $300 million in TEGNA common stock from JPMorgan, with an initial delivery of approximately 15.2 million shares received on June 6, 2023, representing 80% ($240 million) of the value of the first ASR contract. The first ASR program was completed in August 2023 at which time JPMorgan delivered an additional 3.1 million shares to us. The final share settlement was based on the average daily volume-weighted average price of TEGNA shares during the term of the first ASR program, less a discount, less the previously delivered 15.2 million shares.
On November 9, 2023, we entered into a second accelerated share repurchase (the second ASR) program with JPMorgan. Under the terms of the second ASR, we repurchased $325 million in TEGNA common stock from JPMorgan, with an initial delivery of approximately 17.3 million shares received on November 13, 2023, representing 80% ($260 million) of the value of the second ASR contract. The second ASR program was completed in February 2024, at which time JPMorgan delivered an additional 4.0 million shares to us. The final share settlement was based on the average daily volume-weighted average price of TEGNA shares during the term of the second ASR program, less a discount, less the previously delivered 17.3 million shares.
In December 2023, our Board of Directors authorized a new share repurchase program for up to $650.0 million of our common stock through December 31, 2025. The shares may be repurchased at management’s discretion, either on the open market or in privately negotiated block transactions. Management’s decision to repurchase shares will depend on price, blackout periods and other corporate developments. Purchases may occur from time to time and no maximum purchase price has been set. In 2024, we repurchased 18.6 million shares under this program at an average share price of $14.79 for an aggregate cost of $274.8 million.
In the third quarter of 2023, 1.7 million shares were repurchased at an average share price of $15.96 for an aggregate cost of $27.9 million. These shares were repurchased under the previous share repurchase program that the Board of Directors authorized in December 2020 and expired on December 31, 2023.
Employee Awards Stock-Based Compensation Plans
In April 2020, our shareholders approved the adoption of the TEGNA Inc. 2020 Omnibus Incentive Compensation Plan (the Omnibus Plan). The Omnibus Plan reserved for the issuance of an additional 20.0 million shares of our common stock. The Omnibus Plan provides for the granting of stock options, stock appreciation rights, restricted stock, restricted stock units (RSUs), PSAs, and other equity-based and cash-based awards. Awards may be granted to our employees and members of the Board of Directors. The Omnibus Plan provides that shares of common stock subject to awards granted become available again for issuance if such awards are canceled or forfeited.
Performance share program - The Leadership Development and Compensation Committee (LDCC) of the Board of Directors has established a long-term incentive performance share program for our executives under the Plan. The number of shares earned under the PSAs program is determined based on the achievement of certain financial performance criteria (adjusted EBITDA and free cash flow as a percent of revenue as defined by the PSA agreement) over a two-year cumulative financial performance period. If the financial performance criteria are met and certified by the LDCC, the shares earned under the PSA will be subject to an additional one year service period before the common stock is released to the participating employees. The PSAs do not pay dividends or allow voting rights during the three-year incentive period. Therefore, the fair value of the PSA is the quoted market value of our stock on the grant date less the present value of the expected dividends not received during the relevant performance period. The PSA provides the LDCC with limited discretion to make adjustments to the financial targets to ensure consistent year-to-year comparison for the performance criteria. For expense recognition, in the period it becomes probable that the minimum performance criteria specified in the PSA will be achieved, we recognize expense, net of estimated forfeitures, for the proportionate share of the total fair value of the shares subject to the PSA related to the vesting period that has already lapsed. During each reporting period during the two-year performance period, we adjust the fair value of the PSAs to the quoted market value of our stock price. In the event we determine it is no longer probable that we will achieve the minimum performance criteria specified in the PSA, we reverse all the previously recognized compensation expense in the period such a determination is made.
RSU program - We also issue stock-based compensation to eligible employees in the form of RSUs. These awards generally entitle employees to receive at the end of a specified vesting period one share of common stock for each RSU granted, conditioned on continued employment for the relevant vesting period. In most cases, RSUs vest 25% per year and settle annually. RSUs do not pay dividends or confer voting rights in respect of the underlying common stock during the vesting period. RSUs are valued based on the fair value of our common stock on the date of grant less the present value of the expected dividends not received during the relevant vesting period. The fair value of the RSU, less estimated forfeitures, is recognized as compensation expense ratably over the vesting period.
We generally grant both RSUs and PSAs annually to eligible employees on or about March 1.
Employee Awards Stock-based Compensation Expense: The following table shows the stock-based compensation related amounts recognized in the Consolidated Statements of Income for equity awards (in thousands):
| | | | | | | | | | | | |
| | 2024 | | | 2023 | | | 2022 | |
RSUs | | $ | 29,544 | | | $ | 20,931 | | | $ | 16,182 | |
PSAs | | | 8,988 | | | | 3,566 | | | | 14,299 | |
Total employee awards stock-based compensation | | | 38,532 | | | | 24,497 | | | | 30,481 | |
Total income tax benefit | | | 8,236 | | | | 9,072 | | | | 10,744 | |
Employee awards stock-based compensation net of tax | | $ | 30,296 | | | $ | 15,425 | | | $ | 19,737 | |
RSUs: As of December 31, 2024, there was $32.9 million of unrecognized compensation cost related to unvested restricted stock and RSUs. This amount will be adjusted for future changes in estimated forfeitures and recognized on a straight-line basis over a weighted average period of 2.5 years. A summary of the RSUs activity is presented below:
| | | | | | | | | | | | | | | | | | | | | | | | |
| | 2024 | | | 2023 | | | 2022 | |
RSU | | Shares | | | Weighted average fair value | | | Shares | | | Weighted average fair value | | | Shares | | | Weighted average fair value | |
Unvested at beginning of year | | | 3,465,380 | | | $ | 17.12 | | | | 2,543,732 | | | $ | 17.80 | | | | 2,842,288 | | | $ | 15.11 | |
Granted | | | 2,060,749 | | | | 13.43 | | | | 2,289,278 | | | | 16.09 | | | | 949,022 | | | | 21.90 | |
Vested | | | (1,683,051 | ) | | | 16.44 | | | | (1,122,923 | ) | | | 16.41 | | | | (1,118,395 | ) | | | 14.62 | |
Cancelled | | | (355,844 | ) | | | 15.99 | | | | (244,707 | ) | | | 17.78 | | | | (129,183 | ) | | | 16.39 | |
Unvested at end of year | | | 3,487,234 | | | $ | 15.39 | | | | 3,465,380 | | | $ | 17.12 | | | | 2,543,732 | | | $ | 17.80 | |
PSAs: As of December 31, 2024, there was $8.9 million of unrecognized compensation cost related to non-vested PSAs (holding valuation inputs as of December 31, 2024 constant). This amount will be recognized as expense over a weighted average period of 2.0 years. A summary of the PSAs activity is presented below:
| | | | | | | | | | | | | | | | | | | | | | | | |
| | 2024 | | | 2023 | | | 2022 | |
PSA | | Shares | | | Weighted average fair value | | | Shares | | | Weighted average fair value | | | Shares | | | Weighted average fair value | |
Unvested at beginning of year | | | 948,021 | | | $ | 18.16 | | | | 986,104 | | | $ | 18.18 | | | | 1,015,433 | | | $ | 15.04 | |
Granted | | | 1,132,073 | | | | 12.72 | | | | 642,413 | | | | 16.33 | | | | 484,781 | | | | 21.80 | |
Vested | | | (604,102 | ) | | | 16.72 | | | | (564,159 | ) | | | 16.21 | | | | (503,844 | ) | | | 15.26 | |
Cancelled | | | (140,647 | ) | | | 15.23 | | | | (116,337 | ) | | | 18.25 | | | | (10,266 | ) | | | 17.09 | |
Unvested at end of year | | | 1,335,345 | | | $ | 14.22 | | | | 948,021 | | | $ | 18.16 | | | | 986,104 | | | $ | 18.18 | |
Accumulated other comprehensive loss
The elements of our Accumulated Other Comprehensive Loss (AOCL) principally consisted of pension, retiree medical and life insurance liabilities, foreign currency translation and an unrealized gain on our available-for-sale investment. The following tables summarize the components of, and changes in AOCL, net of tax (in thousands):
| | | | | | | | | | | | |
2024 | | Retirement
Plans | | | Foreign
Currency Translation(1) | | | Total | |
Balance at beginning of year | | $ | (120,142 | ) | | $ | 532 | | | $ | (119,610 | ) |
Other comprehensive income before reclassifications | | | 824 | | | | — | | | | 824 | |
Amounts classified from AOCL | | | 12,142 | | | | — | | | | 12,142 | |
Balance at end of year | | $ | (107,176 | ) | | $ | 532 | | | $ | (106,644 | ) |
| | | | | | | | | | | | |
2023 | | Retirement
Plans | | | Foreign
Currency Translation(1) | | | Total | |
Balance at beginning of year | | $ | (126,065 | ) | | $ | 532 | | | $ | (125,533 | ) |
Other comprehensive income before reclassifications | | | 1,769 | | | | — | | | | 1,769 | |
Amounts classified from AOCL | | | 4,154 | | | | — | | | | 4,154 | |
Balance at end of year | | $ | (120,142 | ) | | $ | 532 | | | $ | (119,610 | ) |
| | | | | | | | | | | | | | | | |
2022 | | Retirement
Plans | | | Foreign
Currency Translation(1) | | | Available-For-Sale Investment | | | Total | |
Balance at beginning of year | | $ | (113,090 | ) | | $ | 455 | | | $ | 15,419 | | | $ | (97,216 | ) |
Other comprehensive loss before reclassifications | | | (16,288 | ) | | | 77 | | | | — | | | | (16,211 | ) |
Amounts classified from AOCL | | | 3,313 | | | | — | | | | (15,419 | ) | | | (12,106 | ) |
Balance at end of year | | $ | (126,065 | ) | | $ | 532 | | | $ | - | | | $ | (125,533 | ) |
(1) Our entire foreign currency translation adjustment is related to our CareerBuilder investment. We previously recorded our share of foreign currency translation adjustments through our equity method investment, however, accounting for this investment has been suspended as its carrying value has declined to $0.
AOCL components are included in the computation of net periodic post-retirement costs which include pension costs discussed in Note 6 and our other post-retirement benefits (health care and life insurance benefits). Reclassifications out of AOCL related to these post-retirement plans and a realized gain on an available-for-sale investment included the following (in thousands):
| | | | | | | | | | | | |
| | 2024 | | | 2023 | | | 2022 | |
Amortization of prior service cost (credit), net | | $ | 90 | | | $ | (464 | ) | | $ | (481 | ) |
Amortization of actuarial loss | | | 5,941 | | | | 6,054 | | | | 4,639 | |
Pension settlement charge | | | 10,316 | | | | — | | | | 300 | |
Realized gain on available-for-sale investment | | | — | | | | — | | | | (20,800 | ) |
Total reclassifications, before tax | | | 16,347 | | | | 5,590 | | | | (16,342 | ) |
Income tax effect | | | (4,205 | ) | | | (1,436 | ) | | | 4,236 | |
Total reclassifications, net of tax | | $ | 12,142 | | | $ | 4,154 | | | $ | (12,106 | ) |
NOTE 10 – Asset impairment and other
As events occur, or circumstances change, we may recognize non-cash impairment charges to reduce the book value of intangible and other long-lived assets or to record charges (gains) related spectrum repacking reimbursements and other efforts, or other unique events.
A summary of these items by year (pre-tax basis) is presented below (in thousands):
| | | | | | | | | | | | |
| | 2024 | | | 2023 | | | 2022 | |
Contractual termination | | $ | 1,097 | | | $ | — | | | $ | — | |
Programming rights impairment | | | — | | | | 3,359 | | | | — | |
Reimbursement of spectrum repacking | | | — | | | | — | | | | (323 | ) |
Total asset impairment and other | | $ | 1,097 | | | $ | 3,359 | | | $ | (323 | ) |
Contract termination: In 2024, we incurred a $1.1 million charge associated with contract termination related to bringing our national sales organization in-house.
Programming rights impairment: In the second quarter of 2023, a $3.4 million impairment charge was recognized on programming assets.
Reimbursement of spectrum repacking: Some of our stations have had to purchase new equipment in order to comply with an FCC spectrum repacking initiative. As part of this initiative, the FCC is reimbursing companies for costs incurred to comply with the new requirements. In 2022, we received $0.3 million of such reimbursements which we have recorded as contra expense. No such reimbursements were received in 2023 or 2024. All of our repacked stations have completed their transitions to their new channels.
NOTE 11 – Other matters
Litigation
Antitrust matters
In the third quarter of 2018, certain national media outlets reported the existence of a confidential investigation by the United States Department of Justice Antitrust Division (DOJ) into the local television advertising sales practices of station owners. We received a Civil Investigative Demand (CID) in connection with the DOJ’s investigation. On November 13 and December 13, 2018, the DOJ and seven other broadcasters settled a DOJ complaint alleging the exchange of competitively sensitive information in the broadcast television industry. In June 2019, we and four other broadcasters entered into a substantially identical agreement with DOJ, which was entered by the court on December 3, 2019. The settlement contained no finding of wrongdoing or liability and carried no penalty. It prohibited us and the other settling entities from sharing certain confidential business information, or using such information pertaining to other broadcasters, except under limited circumstances. The settlement also required the settling parties to make certain enhancements to their antitrust compliance programs, to continue to cooperate with the DOJ’s investigation, and to permit DOJ to verify compliance. To date, the costs of compliance have not been material and we do not expect such costs to be material in the future.
Since the national media reports, numerous putative class action lawsuits were filed against owners of television stations (the Advertising Cases) in different jurisdictions. The plaintiffs are a class consisting of all persons and entities in the United States who paid for all or a portion of advertisement time on local television provided by the defendants. The Advertising Cases assert antitrust and other claims and seek monetary damages, attorneys’ fees, costs and interest, as well as injunctions against the allegedly wrongful conduct.
These cases were consolidated into a single proceeding in the United States District Court for the Northern District of Illinois, captioned In re: Local TV Advertising Antitrust Litigation on October 3, 2018. At the court’s direction, the plaintiffs filed an amended complaint on April 3, 2019, that superseded the original complaints. Although we were named as a defendant in sixteen of the original complaints, the amended complaint did not name TEGNA as a defendant. After TEGNA and four other broadcasters entered into consent decrees with the DOJ in June 2019, the plaintiffs sought leave from the court to further amend the complaint to add TEGNA and the other settling broadcasters to the proceeding. The court granted the plaintiffs’ motion, and the plaintiffs filed the second amended complaint on September 9, 2019. On October 8, 2019, the defendants jointly filed a motion to dismiss the matter. On November 6, 2020, the court denied the motion to dismiss. On March 16, 2022, the plaintiffs filed a third amended complaint, which, among other things, added ShareBuilders, Inc., as a named defendant. ShareBuilders filed a motion to dismiss on April 15, 2022, which was granted by the court without prejudice on August 29, 2022. TEGNA has filed its answer to the third amended complaint denying any violation of law and asserting various affirmative defenses.
On May 26, 2023, the plaintiffs moved for preliminary approval of settlements with four co-defendants – CBS Corp (n/k/a Paramount Global), Fox Corp., certain Cox entities (including Cox Media Group, LLC, Cox Enterprises, Inc., CMG Media Corporation and Cox Reps, Inc.) and ShareBuilders, Inc. Although ShareBuilders prevailed on its motion to dismiss the case, as noted above, because the court had dismissed the claims without prejudice ShareBuilders entered into a zero dollar settlement with the plaintiffs in order to ensure that the plaintiffs do not re-file the claims in the future. In exchange for a release of the plaintiffs’ claims against them, the settling defendants, among other things, collectively agreed to pay $48 million, while expressly denying any liability or wrongdoing. The court approved the settlements in December 2023.
Discovery in the Advertising Cases is ongoing. We believe that the claims asserted in the Advertising Cases are without merit and intend to defend vigorously against them.
Other litigation matters
We, along with a number of our subsidiaries, also are defendants in other judicial and administrative proceedings involving matters incidental to our business. We do not believe that any material liability will be incurred as a result of any of the foregoing matters.
Commitments: The following table summarizes the expected cash outflow related to our commitments on programming contracts that are not recorded on our Consolidated Balance Sheets as of December 31, 2024. Such obligations include future payments related to network affiliation agreements, commitments to purchase syndicated television programming that will be produced in the future, and the rights to carry certain professional sporting events. Certain network affiliation agreements include variable fee components. The table below lists programming contract commitments by year for each of the next five years and all years thereafter in aggregate (in thousands). These amounts are based on current estimates and may change due to changes in inputs such as subscriber counts.
| | | |
Year | Programming
Contracts | |
2025 | $ | 911,447 | |
2026 | | 826,319 | |
2027 | | 409,575 | |
2028 | | 385,020 | |
2029 | | — | |
Thereafter | | — | |
Total | $ | 2,532,361 | |
Major Customers: Customers that purchase our advertising and marketing services are comprised of local, regional, and national advertisers across our markets. Our subscription revenue customers include MVPDs and vMVPDs that pay us to carry our programming. In 2024, one customer purchased both advertising and marketing services and paid us compensation related to retransmission consent agreements, which in the aggregate represented more than 10% of consolidated revenue in 2024. This customer represented $386.9 million of consolidated revenue in the year ended December 31, 2024. In 2023, we had two major customers that each represented more than 10% of our revenue with $415.4 million and $300.5 million. In 2022, we had two customers that each represented more than 10% of our revenue with $416.3 million and $387.3 million.
Related Party Transactions: We have equity investments in MadHive, which is a related party of TEGNA. In addition to our investments, we also had commercial agreements with MadHive under which MadHive supports our Premion business in acquiring streaming app advertising inventory, as well as delivering and tracking the ad impressions. During the year ended December 31, 2024, we incurred expenses of $58.1 million as a result of the commercial agreements with MadHive. During the years ended December 31, 2023 and 2022, we incurred $90.6 million and $121.1 million of expenses, respectively, under the commercial agreements. These expenses are recorded as “Cost of revenue” on our Consolidated Statements of Income. As of December 31, 2024, we had accounts receivable of $0.4 million and in 2023, we had accounts payable and accrued liabilities associated with the MadHive commercial agreements of $5.4 million, respectively.
In December 2021, we renewed our commercial agreements with MadHive. Simultaneously with the commercial agreement renewals, we also amended the terms of our then outstanding available-for-sale convertible debt security investment. In exchange for the convertible debt modifications, we received favorable terms in our renewed commercial agreements. We estimated the fair value of our available-for-sale security at December 31, 2021 using a market fair value approach based on the cash we expect to receive upon maturity of the note and the estimated cash savings that the favorable contract terms will provide over the term of the commercial agreements. In January 2022, we recorded an intangible contract asset for $20.8 million (equal to the estimated cash savings), and amortized this asset on a straight-line basis over the noncancellable term of the commercial agreements of two-years. This non-cash expense is recorded within “Cost of revenues,” within our Consolidated Statements of Income. The debt matured in June 2022 at which time the principal balance of $3.0 million plus accrued interest was paid to us.
In the second quarter of 2023, we further extended the terms of our commercial agreement with MadHive for an additional two-years, through December 31, 2025, subject to certain early termination rights. We terminated one of the MadHive commercial agreements as of December 31, 2024. The other agreement remains in effect.
ITEM 9. CHANGES IN AND DISAGREEMENTS WITH ACCOUNTANTS ON ACCOUNTING AND FINANCIAL DISCLOSURE
None.
ITEM 9A. CONTROLS AND PROCEDURES
Conclusion Regarding the Effectiveness of Disclosure Controls and Procedures
Under the supervision and with the participation of our management, including our principal executive officer and principal financial officer, we conducted an evaluation of our disclosure controls and procedures, as such term is defined under Rule 13a-15(e) promulgated under the Securities Exchange Act of 1934, as amended (the Exchange Act). Based on this evaluation, our principal executive officer and our principal financial officer concluded that our disclosure controls and procedures were effective as of December 31, 2024, the end of the period covered by this annual report.
Management’s Report on Internal Control Over Financial Reporting
Our management is responsible for establishing and maintaining adequate internal control over financial reporting, as such term is defined in Exchange Act Rule 13a-15(f). Under the supervision and with the participation of our management, including our principal executive officer and principal financial officer, we conducted an evaluation of the effectiveness of our internal control over financial reporting based on the framework in Internal Control - Integrated Framework (2013 framework) issued by the Committee of Sponsoring Organizations of the Treadway Commission. Based on our evaluation, our management concluded that our internal control over financial reporting was effective as of December 31, 2024.
The effectiveness of our internal control over financial reporting as of December 31, 2024, has been audited by PricewaterhouseCoopers LLP, an independent registered public accounting firm, as stated in its report which is included herein.
Changes in Internal Control Over Financial Reporting
There have been no material changes in our internal controls or in other factors during our fiscal quarter ended December 31, 2024, that have materially affected, or are reasonably likely to materially affect, our internal controls over financial reporting.
ITEM 9B. OTHER INFORMATION
Rule 10b5-1 Trading Plans
On December 9, 2024, Lynn Beall (Trelstad), Executive Vice President and Chief Operating Officer of Media Operations, entered into a Rule10b5-1 trading arrangement (as defined in Item 408 of Regulation S-K of the Exchange Act) with the intent of selling up to 80,000 shares of the Company’s common stock for diversification purposes. The plan expires upon the earlier of April 11, 2025, or the completion of all authorized transactions under the plan.
ITEM 9C. DISCLOSURE REGARDING FOREIGN JURISDICTIONS THAT PREVENT INSPECTIONS
None.
PART III
ITEM 10. DIRECTORS, EXECUTIVE OFFICERS AND CORPORATE GOVERNANCE
We incorporate by reference the information appearing under “Your Board of Directors,” “The TEGNA Nominees,” “Committees of the Board of Directors,” “Committee Charters,” “Our Executive Officers,” “Insider Trading Policy” and “Ethics Policy” under the heading “Proposal 1 – Election of Directors” and “Delinquent Section 16(a) Reports” under the heading “Additional Information” in our 2025 proxy statement.
ITEM 11. EXECUTIVE COMPENSATION
We incorporate by reference the information appearing under “Executive Compensation,” “Director Compensation,” “Outstanding Director Equity Awards at Fiscal Year-End” and “Related Transactions; Compensation Committee Interlocks and Insider Participation” under the heading “Proposal 1–Election of Directors” in our 2025 proxy statement.
ITEM 12. SECURITY OWNERSHIP OF CERTAIN BENEFICIAL OWNERS AND MANAGEMENT AND RELATED STOCKHOLDER MATTERS
We incorporate by reference the information appearing under “Equity Compensation Plan Information” and “Securities Beneficially Owned by Directors, Executive Officers and Principal Shareholders” in our 2025 proxy statement.
ITEM 13. CERTAIN RELATIONSHIPS AND RELATED TRANSACTIONS, AND DIRECTOR INDEPENDENCE
We incorporate by reference the information appearing under “Director Nominees” under the heading “2025 Proxy Statement Summary: Snapshot of 2025 Director Nominees” and “Related Transactions; Compensation Committee Interlocks and Insider Participation” under the heading “Proposal 1 - Election of Directors” in our 2025 proxy statement.
ITEM 14. PRINCIPAL ACCOUNTANT FEES AND SERVICES
We incorporate by reference the information appearing under “Report of the Audit Committee” in our 2025 proxy statement.
PART IV
ITEM 15. EXHIBITS AND FINANCIAL STATEMENT SCHEDULES
(a)Financial Statements, Financial Statement Schedules and Exhibits.
(2)Financial Statement Schedules.
All schedules are omitted as the required information is not applicable or the information is presented in the consolidated financial statements or related notes.
EXHIBIT INDEX
| | | | |
Exhibit Number | | Exhibit | | Location |
| | | | |
3-1 | | Fifth Restated Certificate of Incorporation of TEGNA Inc. | | Incorporated by reference to Exhibit 3-1 to TEGNA Inc.’s Form 8-K filed on April 25, 2024. |
| | | | |
3-2 | | By-laws, as amended through April 24, 2024. | | Incorporated by reference to Exhibit 3-2 to TEGNA Inc.’s Form 8-K/A filed on October 21, 2024 |
| | | | |
4-1 | | Indenture dated as of March 1, 1983, between TEGNA Inc. and Citibank, N.A., as Trustee. | | Incorporated by reference to Exhibit 4-1 to TEGNA Inc.’s Form 10-K for the fiscal year ended December 31, 2017. |
| | | | |
4-2 | | First Supplemental Indenture dated as of November 5, 1986, among TEGNA Inc., Citibank, N.A., as Trustee, and Sovran Bank, N.A., as Successor Trustee. | | Incorporated by reference to Exhibit 4-2 to TEGNA Inc.’s Form 10-K for the fiscal year ended December 31, 2017. |
| | | | |
4-3 | | Second Supplemental Indenture dated as of June 1, 1995, among TEGNA Inc., NationsBank, N.A., as Trustee, and Crestar Bank, as Trustee. | | Incorporated by reference to Exhibit 4-3 to TEGNA Inc.’s Form 10-K for the fiscal year ended December 31, 2017. |
| | | | |
4-4 | | Thirteenth Supplemental Indenture, dated as of September 13, 2019, between TEGNA Inc. and U.S. Bank National Association, as Trustee. | | Incorporated by reference to Exhibit 4-1 to TEGNA Inc.’s Form 10-Q for the fiscal quarter ended September 30, 2019. |
| | | | |
4-5 | | Fourteenth Supplemental Indenture, dated as of January 9, 2020, between TEGNA Inc. and U.S. Bank National Association, as Trustee. | | Incorporated by reference to Exhibit 4-1 to TEGNA Inc.’s Form 10-Q for the fiscal quarter ended March 31, 2020. |
| | | | |
4-6 | | Fifteenth Supplemental Indenture, dated as of September 10, 2020, between TEGNA Inc. and U.S. Bank National Association, as Trustee. | | Incorporated by reference to Exhibit 4-1 to TEGNA Inc.’s Form 10-Q for the fiscal quarter ended September 30, 2020. |
| | | | |
4-7 | | Description of Securities. | | Incorporated by reference to Exhibit 4-7 to TEGNA Inc.’s Form 10-K for the fiscal year ended December 31, 2023. |
| | | | |
10-1 | | Supplemental Executive Medical Plan Amended and Restated as of January 1, 2011.* | | Incorporated by reference to Exhibit 10-2 to TEGNA Inc.’s Form 10-K for the fiscal year ended December 26, 2010. |
| | | | |
10-1-1 | | Amendment No. 1 to the Supplemental Executive Medical Plan Amended and Restated as of January 1, 2012.* | | Incorporated by reference to Exhibit 10-1-1 to TEGNA Inc.’s Form 10-K for the fiscal year ended December 30, 2012. |
| | | | |
10-1-2 | | Amendment No. 2 to the TEGNA Inc. Supplemental Executive Medical Plan dated as of June 26, 2015.* | | Incorporated by reference to Exhibit 10-6 to TEGNA Inc.’s Form 10-Q for the fiscal quarter ended June 28, 2015. |
| | | | |
10-1-3 | | Amendment No. 3 to the TEGNA Inc. Supplemental Executive Medical Plan effective as of November 1, 2016.* | | Incorporated by reference to Exhibit 10-1-3 to TEGNA Inc.’s Form 10-K for the fiscal year ended December 30, 2016. |
| | | | |
10-1-4 | | Amendment No. 4 to the TEGNA Inc. Supplemental Executive Medical Plan dated as of October 9, 2024.* | | Attached. |
| | | | |
10-2 | | Supplemental Executive Medical Plan for Retired Executives dated December 22, 2010 and effective January 1, 2011.* | | Incorporated by reference to Exhibit 10-2-1 to TEGNA Inc.’s Form 10-K for the fiscal year ended December 26, 2010. |
| | | | |
10-2-1 | | Amendment No. 1 to the TEGNA Inc. Supplemental Executive Medical Plan for Retired Executives dated as of June 26, 2015.* | | Incorporated by reference to Exhibit 10-7 to TEGNA Inc.’s Form 10-Q for the fiscal quarter ended June 28, 2015. |
| | | | |
| | | | |
Exhibit Number | | Exhibit | | Location |
10-2-2 | | Amendment No. 2 to the TEGNA Inc. Supplemental Executive Medical Plan for Retired Executives effective as of November 1, 2016.* | | Incorporated by reference to Exhibit 10-2-2 to TEGNA Inc.’s Form 10-K for the fiscal year ended December 30, 2016. |
| | | | |
10-2-3 | | Amendment No. 3 to the TEGNA Inc. Supplemental Executive Medical Plan for Retired Executives dated as of October 9, 2024.* | | Attached. |
| | | | |
10-3 | | TEGNA Inc. Supplemental Retirement Plan Restatement.* | | Incorporated by reference to Exhibit 10-2 to TEGNA Inc.’s Form 10-Q for the fiscal quarter ended September 30, 2007. |
| | | | |
10-3-1 | | Amendment No. 1 to the TEGNA Inc. Supplemental Retirement Plan dated July 31, 2008 and effective August 1, 2008.* | | Incorporated by reference to Exhibit 10-1 to TEGNA Inc.’s Form 10-Q for the fiscal quarter ended September 28, 2008. |
| | | | |
10-3-2 | | Amendment No. 2 to the TEGNA Inc. Supplemental Retirement Plan dated December 22, 2010.* | | Incorporated by reference to Exhibit 10-3-2 to TEGNA Inc.’s Form 10-K for the fiscal year ended December 26, 2010. |
| | | | |
10-3-3 | | Amendment No. 3 to the TEGNA Inc. Supplemental Retirement Plan dated as of June 26, 2015.* | | Incorporated by reference to Exhibit 10-8 to TEGNA Inc.’s Form 10-Q for the fiscal quarter ended June 28, 2015. |
| | | | |
10-3-4 | | Amendment No. 4 to the TEGNA Inc. Supplemental Retirement Plan dated as of November 7, 2017.* | | Incorporated by reference to Exhibit 10-3-4 to TEGNA Inc.’s Form 10-K for the fiscal year ended December 31, 2017. |
| | | | |
10-3-5 | | Amendment No. 5 to the TEGNA Inc. Supplemental Retirement Plan, dated as of April 26, 2018.* | | Incorporated by reference to Exhibit 10-2 to TEGNA Inc.’s Form 10-Q for the fiscal quarter ended June 30, 2018. |
| | | | |
10-4 | | TEGNA Inc. Deferred Compensation Plan Restatement dated February 1, 2003 (reflects all amendments through July 25, 2006).* | | Incorporated by reference to Exhibit 10-4 to TEGNA Inc.’s Form 10-K for the fiscal year ended December 31, 2006. |
| | | | |
10-4-1 | | TEGNA Inc. Deferred Compensation Plan Rules for Post-2004 Deferrals.* | | Incorporated by reference to Exhibit 10-3 to TEGNA Inc.’s Form 10-Q for the fiscal quarter ended July 1, 2007. |
| | | | |
10-4-2 | | Amendment No. 1 to the TEGNA Inc. Deferred Compensation Plan Rules for Post-2004 Deferrals dated July 31, 2008 and effective August 1, 2008.* | | Incorporated by reference to Exhibit 10-2 to TEGNA Inc.’s Form 10-Q for the fiscal quarter ended September 28, 2008. |
| | | | |
10-4-3 | | Amendment No. 2 to the TEGNA Inc. Deferred Compensation Plan Rules for Post-2004 Deferrals dated December 9, 2008.* | | Incorporated by reference to Exhibit 10-4-3 to TEGNA Inc.’s Form 10-K for the fiscal year ended December 28, 2008. |
| | | | |
10-4-4 | | Amendment No. 3 to the TEGNA Inc. Deferred Compensation Plan Rules for Post-2004 Deferrals dated October 27, 2009.* | | Incorporated by reference to Exhibit 10-4-4 to TEGNA Inc.’s Form 10-K for the fiscal year ended December 27, 2009. |
| | | | |
10-4-5 | | Amendment No. 4 to the TEGNA Inc. Deferred Compensation Plan Rules for Post-2004 Deferrals dated December 22, 2010.* | | Incorporated by reference to Exhibit 10-4-5 to TEGNA Inc.’s Form 10-K for the fiscal year ended December 26, 2010. |
| | | | |
10-4-6 | | Amendment No. 5 to the TEGNA Inc. Deferred Compensation Plan Rules for Post-2004 Deferrals dated as of June 26, 2015.* | | Incorporated by reference to Exhibit 10-10 to TEGNA Inc.’s Form 10-Q for the fiscal quarter ended June 28, 2015. |
| | | | |
10-4-7 | | Amendment No. 6 to the TEGNA Inc. Deferred Compensation Plan Rues for Post-2004 Deferrals dated as of December 8, 2015.* | | Incorporated by reference to Exhibit 10-4-7 to TEGNA Inc.’s Form 10-K for the fiscal year ended December 31, 2015. |
| | | | |
| | | | |
Exhibit Number | | Exhibit | | Location |
10-4-8 | | Amendment No. 7 to the TEGNA Inc. Deferred Compensation Plan Rules for Post-2004 Deferrals, dated as of May 3, 2017.* | | Incorporated by reference to Exhibit 10-11 to TEGNA Inc.’s Form 10-Q for the fiscal quarter ended June 30, 2017. |
| | | | |
10-4-9 | | Amendment No. 8 to the TEGNA Inc. Deferred Compensation Plan Rules for Post-2004 Deferrals, dated as of November 7, 2017.* | | Incorporated by reference to Exhibit 10-4-9 to TEGNA Inc.’s Form 10-K for the fiscal year ended December 31, 2017. |
| | | | |
10-4-10 | | Amendment No. 9 to the TEGNA Inc. Deferred Compensation Plan Rules for Post-2004 Deferrals, dated as of April 26, 2018.* | | Incorporated by reference to Exhibit 10-4 to TEGNA Inc.’s Form 10-Q for the fiscal quarter ended June 30, 2018. |
| | | | |
10-4-11 | | Amendment No. 10 to the TEGNA Inc. Deferred Compensation Plan Rules for Post-2004 Deferrals, dated as of November 16, 2018.* | | Incorporated by reference to Exhibit 10-4-11 to TEGNA Inc.’s Form 10-K for the fiscal year ended December 31, 2018. |
| | | | |
10-4-12 | | Amendment No. 11 to the TEGNA Inc. Deferred Compensation Plan Rules for Post-2004 Deferrals, dated as of June 25, 2024.* | | Incorporated by reference to Exhibit 10-3 to TEGNA Inc.’s Form 10-Q for the fiscal quarter ended June 30, 2024. |
| | | | |
10-4-13 | | Amendment No. 12 to the TEGNA Inc. Deferred Compensation Plan Rules for Post-2004 Deferrals, dated as of October 9, 2024.* | | Attached. |
| | | | |
10-4-14 | | Amendment No. 13 to the TEGNA Inc. Deferred Compensation Plan Rules for Post-2004 Deferrals, dated as of December 9, 2024.* | | Attached. |
| | | | |
10-5 | | Amendment to the TEGNA Inc. Deferred Compensation Plan Restatement Rules for Pre-2005 Deferrals dated as of June 26, 2015.* | | Incorporated by reference to Exhibit 10-9 to TEGNA Inc.’s Form 10-Q for the fiscal quarter ended June 28, 2015. |
| | | | |
10-5-1 | | Amendment No. 2 to the TEGNA Inc. Deferred Compensation Plan Restatement Rules for Pre-2005 Deferrals, dated as of May 3, 2017.* | | Incorporated by reference to Exhibit 10-12 to TEGNA Inc.’s Form 10-Q for the fiscal quarter ended June 30, 2017. |
| | | | |
10-5-2 | | Amendment No. 3 to the TEGNA Inc. Deferred Compensation Plan Restatement Rules for Pre-2005 Deferrals, dated as of April 26, 2018.* | | Incorporated by reference to Exhibit 10-3 to TEGNA Inc.’s Form 10-Q for the fiscal quarter ended June 30 2018. |
| | | | |
10-5-3 | | Amendment No. 4 to the TEGNA Inc. Deferred Compensation Plan Restatement Rules for Pre-2005 Deferrals, dated as of November 16 , 2018.* | | Incorporated by reference to Exhibit 10-5-3 to TEGNA Inc.’s Form 10-K for the fiscal year ended December 31, 2018. |
| | | | |
10-6 | | TEGNA Inc. Transitional Compensation Plan Restatement.* | | Incorporated by reference to Exhibit 10-1 to TEGNA Inc.’s Form 10-Q for the fiscal quarter ended September 30, 2007. |
| | | | |
10-6-1 | | Amendment No. 1 to TEGNA Inc. Transitional Compensation Plan Restatement dated as of May 4, 2010.* | | Incorporated by reference to Exhibit 10-3 to TEGNA Inc.’s Form 10-Q for the fiscal quarter ended March 28, 2010. |
| | | | |
10-6-2 | | Amendment No. 2 to TEGNA Inc. Transitional Compensation Plan Restatement dated as of December 22, 2010.* | | Incorporated by reference to Exhibit 10-5-2 to TEGNA Inc.’s Form 10-K for the fiscal year ended December 26, 2010. |
| | | | |
10-6-3 | | Amendment No. 3 to TEGNA Inc. Transitional Compensation Plan Restatement dated as of June 26, 2015.* | | Incorporated by reference to Exhibit 10-11 to TEGNA Inc.’s Form 10-Q for the fiscal quarter ended June 28, 2015. |
| | | | |
10-6-4 | | Notice to Transitional Compensation Plan Restatement Participants.* | | Incorporated by reference to Exhibit 10-6-4 to TEGNA Inc.’s Form 10-K for the fiscal year ended December 31, 2015. |
| | | | |
| | | | |
Exhibit Number | | Exhibit | | Location |
10-7 | | TEGNA Inc. 2020 Omnibus Incentive Compensation Plan. | | Incorporated by reference to Appendix B to TEGNA Inc.’s Definitive Proxy Statement on Schedule 14A filed on March 25, 2020. |
| | | | |
10-8 | | Form of Director Restricted Stock Unit Award Agreement.* | | Incorporated by reference to Exhibit 10-1 to TEGNA Inc.’s Form 10-Q for the fiscal quarter ended June 30, 2022. |
| | | | |
10-9 | | Form of Executive Officer Restricted Stock Unit Award Agreement.* | | Incorporated by reference to Exhibit 10-1 to TEGNA Inc.’s Form 10-Q for the fiscal quarter ended March 31, 2021. |
| | | | |
10-9-1 | | Form of Executive Officer Restricted Stock Unit Award Agreement.* | | Incorporated by reference to Exhibit 10-2 to TEGNA Inc.’s Form 10-Q for the fiscal quarter ended March 31, 2022. |
| | | | |
10-9-2 | | Form of Executive Officer Restricted Stock Unit Award Agreement.* | | Incorporated by reference to Exhibit 10-1 to TEGNA Inc.’s Form 10-Q for the fiscal quarter ended March 31, 2023. |
| | | | |
10-9-3 | | Form of Executive Officer Restricted Stock Unit Award Agreement.* | | Incorporated by reference to Exhibit 10-3 to TEGNA Inc.’s Form 10-Q for the fiscal quarter ended June 30, 2023. |
| | | | |
10-9-4 | | Form of Executive Officer Restricted Stock Unit Award Agreement.* | | Incorporated by reference to Exhibit 10-1 to TEGNA Inc.’s Form 10-Q for the fiscal quarter ended March 31, 2024. |
| | | | |
10-10 | | Form of Executive Officer Performance Share Award Agreement.* | | Incorporated by reference to Exhibit 10-1 to TEGNA Inc.’s Form 10-Q for the fiscal quarter ended March 31, 2022. |
| | | | |
10-10-1 | | Form of Executive Officer Performance Share Award Agreement.* | | Incorporated by reference to Exhibit 10-3 to TEGNA Inc.’s Form 10-Q for the fiscal quarter ended March 31, 2023. |
| | | | |
10-10-2 | | Form of Executive Officer Performance Share Award Agreement.* | | Incorporated by reference to Exhibit 10-3 to TEGNA Inc.’s Form 10-Q for the fiscal quarter ended March 31, 2024. |
| | | | |
10-11 | | Description of TEGNA Inc.’s Non-Employee Director Compensation.* | | Incorporated by reference to Exhibit 10-15 to TEGNA Inc.’s Form 10-Q for the fiscal quarter ended June 28, 2015. |
| | | | |
10-12 | | Amendment for Section 409A Plans dated December 31, 2008.* | | Incorporated by reference to Exhibit 10-14 to TEGNA Inc.’s Form 10-K for the fiscal year ended December 28, 2008. |
| | | | |
10-13 | | Executive Life Insurance Plan document dated December 31, 2008.* | | Incorporated by reference to Exhibit 10-15 to TEGNA Inc.’s Form 10-K for the fiscal year ended December 28, 2008. |
| | | | |
10-13-1 | | Amendment No. 1 to the TEGNA Inc. Executive Life Insurance Plan Document dated as of June 26, 2015.* | | Incorporated by reference to Exhibit 10-13 to TEGNA Inc.’s Form 10-Q for the fiscal quarter ended June 28, 2015. |
| | | | |
10-14 | | Key Executive Life Insurance Plan dated October 29, 2010.* | | Incorporated by reference to Exhibit 10-1 to TEGNA Inc.’s Form 10-Q for the fiscal quarter ended September 26, 2010. |
| | | | |
10-14-1 | | Amendment No. 1 to the TEGNA Inc. Key Executive Life Insurance Plan dated as of June 26, 2015.* | | Incorporated by reference to Exhibit 10-14 to TEGNA Inc.’s Form 10-Q for the fiscal quarter ended June 28, 2015. |
| | | | |
| | | | |
Exhibit Number | | Exhibit | | Location |
10-14-2 | | Form of Participation Agreement under Key Executive Life Insurance Plan.* | | Incorporated by reference to Exhibit 10-2 to TEGNA Inc.’s Form 10-Q for the fiscal quarter ended September 26, 2010. |
| | | | |
10-15 | | TEGNA Inc. 2015 Change in Control Severance Plan, as amended through May 30, 2017.* | | Incorporated by reference to Exhibit 10-8 to TEGNA Inc.’s Form 10-Q for the fiscal quarter ended June 30, 2017. |
| | | | |
10-15-1 | | Amendment No. 1 to the TEGNA Inc. 2015 Change in Control Severance Plan, as amended through May 30, 2017.* | | Incorporated by reference to Exhibit 10-27-2 to TEGNA Inc.’s Form 10-K for the fiscal year ended December 31, 2018. |
| | | | |
10-15-2 | | Amendment No. 2 to the TEGNA Inc. 2015 Change in Control Severance Plan, as amended through May 30, 2017.* | | Incorporated by reference to Exhibit 10-18-2 to TEGNA Inc.’s Form 10-K for the fiscal year ended December 31, 2023. |
| | | | |
10-15-3 | | Amendment No. 3 to the TEGNA Inc. 2015 Change in Control Severance Plan, as amended through May 30, 2017.* | | Attached. |
| | | | |
10-16 | | TEGNA Inc. Executive Severance Plan, as amended through May 30, 2017.* | | Incorporated by reference to Exhibit 10-9 to TEGNA Inc.’s Form 10-Q for the fiscal quarter ended June 30, 2017. |
| | | | |
10-16-1 | | Amendment No. 1 to the TEGNA Inc. Executive Severance Plan, as amended through May 30, 2017.* | | Incorporated by reference to Exhibit 10-28-2 to TEGNA Inc.’s Form 10-K for the fiscal year ended December 31, 2018. |
| | | | |
10-16-2 | | Amendment No. 2 to the TEGNA Inc. Executive Severance Plan, as amended through May 30, 2017.* | | Incorporated by reference to Exhibit 10-19-2 to TEGNA Inc.’s Form 10-K for the fiscal year ended December 31, 2023. |
| | | | |
10-16-3 | | Amendment No. 3 to the TEGNA Inc. Executive Severance Plan, as amended through May 30, 2017.* | | Attached. |
| | | | |
10-17 | | Offer Letter, dated as of June 17, 2024, by and between TEGNA Inc. and Michael Steib.* | | Incorporated by reference to Exhibit 10-1 to TEGNA Inc.’s Form 8-K filed on June 20, 2024. |
| | | | |
10-18 | | Offer Letter, dated as of October 18, 2024, by and between TEGNA Inc. and Alex J. Tolston.* | | Attached. |
| | | | |
10-19 | | Letter Agreement, dated as of June 17, 2024, by and between TEGNA Inc. and David T. Lougee.* | | Incorporated by reference to Exhibit 10-2 to TEGNA Inc.’s Form 8-K filed on June 20, 2024. |
| | | | |
10-20 | | Letter Agreement, dated as of September 18, 2024, by and between TEGNA Inc. and Lynn Beall.* | | Incorporated by reference to Exhibit 10-1 to TEGNA Inc.’s Form 8-K filed on September 19, 2024. |
| | | | |
10-21 | | Amendment and Restatement Agreement, dated as of August 5, 2013, to each of (i) the Amended and Restated Competitive Advance and Revolving Credit Agreement, dated as of March 11, 2002 and effective as of March 18, 2002, as amended and restated as of December 13, 2004 and effective as of January 5, 2005, as amended by the First Amendment thereto, dated as of February 28, 2007 and effective as of March 15, 2007, as further amended by the Second Amendment thereto, dated as of October 23, 2008 and effective as of October 31, 2008, as further amended by the Third Amendment thereto, dated as of September 28, 2009, as further amended by the Fourth Amendment thereto, dated as of August 25, 2010 and as further amended by the Fifth Amendment and Waiver, dated as of September 30, 2010 (the “2002 Credit Agreement”), among TEGNA Inc., the several banks and other financial institutions | | Incorporated by reference to Exhibit 10-1 to TEGNA Inc.’s Form 10-Q for the fiscal quarter ended September 29, 2013. |
| | | | |
Exhibit Number | | Exhibit | | Location |
| | from time to time parties to the Credit Agreement (the “2002 Lenders”), JPMorgan Chase Bank, N.A., as administrative agent (in such capacity, the “2002 Administrative Agent”), JPMorgan Chase Bank, N.A. and Citibank, N.A., as syndication agents, and Barclays Bank PLC, as documentation agent, (ii) the Competitive Advance and Revolving Credit Agreement, dated as of February 27, 2004 and effective as of March 15, 2004, as amended by the First Amendment thereto, dated as of February 28, 2007 and effective as of March 15, 2007, as further amended by the Second Amendment thereto, dated as of October 23, 2008 and effective as of October 31, 2008, as further amended by the Third Amendment thereto, dated as of September 28, 2009, as further amended by the Fourth Amendment thereto, dated as of August 25, 2010, and as further amended by the Fifth Amendment and Waiver, dated as of September 30, 2010 (the “2004 Credit Agreement”), among TEGNA Inc., the several banks and other financial institutions from time to time parties to the Credit Agreement (the “2004 Lenders”), JPMorgan Chase Bank, N.A., as administrative agent (in such capacity, the “Administrative Agent”), JPMorgan Chase Bank, N.A. and Citibank, N.A., as syndication agents, and Barclays Bank PLC and SunTrust Bank, as documentation agents and (iii) the Competitive Advance and Revolving Credit Agreement, dated as of December 13, 2004 and effective as of January 5, 2005, as amended by the First Amendment thereto, dated as of February 28, 2007 and effective as of March 15, 2007, as further amended by the Second Amendment thereto, dated as of October 23, 2008 and effective as of October 31, 2008, as further amended by the Third Amendment thereto, dated as of September 28, 2009, as further amended by the Fourth Amendment thereto, dated as of August 25, 2010 and as further amended by the Fifth Amendment and Waiver, dated as of September 30, 2010 (the “2005 Credit Agreement” and, together with the 2002 Credit Agreement and the 2004 Credit Agreement, the “Credit Agreements”), among TEGNA Inc., the several banks and other financial institutions from time to time parties to the Credit Agreement (the “2005 Lenders” and, together with the 2002 Lenders and the 2004 Lenders, the “Lenders”), JPMorgan Chase Bank, N.A., as administrative agent (in such capacity, the “2005 Administrative Agent” and, together with the 2002 Administrative Agent and the 2004 Administrative Agent, the “Administrative Agent”), JPMorgan Chase Bank, N.A. and Citibank, N.A., as syndication agents, and Barclays Bank PLC, as documentation agent, by and between TEGNA Inc., the Guarantors under the Credit Agreements as of August 5, 2013, the Administrative Agent, JPMorgan Chase Bank, N.A. and Bank of America, N.A., as issuing lenders and the Lenders party thereto. | | |
| | | | |
10-21-1 | | Master Assignment and Assumption, dated as of August 5, 2013, by and between each of the lenders listed thereon as assignors and/or assignees. | | Incorporated by reference to Exhibit 10-2 to TEGNA Inc.’s Form 10-Q for the fiscal quarter ended September 29, 2013. |
| | | | |
Exhibit Number | | Exhibit | | Location |
| | | | |
10-21-2 | | Amended and Restated Competitive Advance and Revolving Credit Agreement, dated as of August 5, 2013, by and among TEGNA Inc., the several banks and other financial institutions from time to time parties thereto, JPMorgan Chase Bank, N.A., as administrative agent, and JPMorgan Chase Bank, N.A. and Citibank, N.A. as syndication agents. | | Incorporated by reference to Exhibit 10-3 to TEGNA Inc.’s Form 10-Q for the fiscal quarter ended September 29, 2013. |
| | | | |
10-21-3 | | Sixth Amendment, dated as of September 24, 2013, to the Competitive Advance and Revolving Credit Agreement, dated as of December 13, 2004 and effective as of January 5, 2005, as amended by the First Amendment thereto, dated as of February 28, 2007 and effective as of March 15, 2007, as further amended by the Second Amendment thereto, dated as of October 23, 2008 and effective as of October 31, 2008, as further amended by the Third Amendment thereto, dated as of September 28, 2009, as further amended by the Fourth Amendment thereto, dated as of August 25, 2010, as further amended by the Fifth Amendment and Waiver, dated as of September 30, 2010, and as further amended and restated pursuant to the Amended and Restated Competitive Advance and Revolving Credit Agreement, dated as of August 5, 2013, by and among TEGNA Inc., JPMorgan Chase Bank, N.A., as administrative agent, and the several banks and other financial institutions from time to time parties thereto. | | Incorporated by reference to Exhibit 10-4 to TEGNA Inc.’s Form 10-Q for the fiscal quarter ended September 29, 2013. |
| | | | |
10-21-4 | | Seventh Amendment, dated as of February 13, 2015, to the Competitive Advance and Revolving Credit Agreement, dated as of December 13, 2004 and effective as of January 5, 2005, as amended and restated as of August 5, 2013 and as further amended by the Sixth Amendment thereto, dated as of September 24, 2013, among TEGNA Inc., JPMorgan Chase Bank, N.A., as administrative agent, and the several banks and other financial institutions from time to time parties. | | Incorporated by reference to Exhibit 10-1 to TEGNA Inc.’s Form 10-Q for the fiscal quarter ended March 29, 2015. |
| | | | |
10-21-5 | | Eighth Amendment, dated as of June 29, 2015, to the Amended and Restated Competitive Advance and Revolving Credit Agreement, dated as of December 13, 2004 and effective as of January 5, 2005, as amended and restated as of August 5, 2013, and as further amended by the Seventh Amendment thereto dated as of February 13, 2015, and the Sixth Amendment thereto dated September 24, 2013, among TEGNA Inc., JPMorgan Chase Bank N.A., as administrative agent, and the several banks and other financial institutions from time to time parties thereto, as set forth on Exhibit A to the Eight Amendment. | | Incorporated by reference to Exhibit 10-1 to TEGNA Inc.’s Form 10-Q for the fiscal quarter ended June 28, 2015. |
| | | | |
10-21-6 | | Ninth Amendment, dated as of September 30, 2016, to the Amended and Restated Competitive Advance and Revolving Credit Agreement, dated as of December 13, 2004 and effective as of January 5, 2005, as amended and restated as of August 5, 2013, and as further amended by the Eighth Amendment thereto, dated as of June 29, 2015, the Seventh Amendment thereto, dated as of February 13, 2015, and the Sixth Amendment thereto, dated as of September 24, 2013, among TEGNA Inc., JPMorgan Chase Bank, N.A., as administrative agent, and the | | Incorporated by reference to Exhibit 10-2 to TEGNA Inc.’s Form 10-Q for the fiscal quarter ended September 30, 2016. |
| | | | |
Exhibit Number | | Exhibit | | Location |
| | several banks and other financial institutions from time to time parties thereto, as set forth on Exhibit A, to the Ninth Amendment. | | |
| | | | |
10-21-7 | | Tenth Amendment, dated as of August 1, 2017, to the Amended and Restated Competitive Advance and Revolving Credit Agreement, dated as of December 13, 2004 and effective as of January 5, 2005, as amended and restated as of August 5, 2013, and as further amended, among TEGNA Inc., JPMorgan Chase Bank, N.A. as administrative agent, and the several banks and other financial institutions from time to time parties thereto. | | Incorporated by reference to Exhibit 10-1 to TEGNA Inc.’s Form 10-Q for the fiscal quarter ended September 30, 2017. |
| | | | |
10-21-8 | | Eleventh Amendment, dated as of June 21, 2018, to the Amended and Restated Competitive Advance and Revolving Credit Agreement, dated as of December 13, 2004 and effective as of January 5, 2005, as amended and restated as of August 5, 2013, as further amended as of June 29, 2015, as further amended as of August 1, 2017, among TEGNA Inc., JPMorgan Chase Bank, N.A. as administrative agent, and the several banks and other financial institutions from time to time parties thereto. | | Incorporated by reference to Exhibit 10-1 to TEGNA Inc.’s Form 10-Q for the fiscal quarter ended June 30, 2018. |
| | | | |
10-21-9 | | Twelfth Amendment, dated as of August 15, 2019, to the Amended and Restated Competitive Advance and Revolving Credit Agreement, dated as of December 13, 2004 and effective as of January 5, 2015, as amended and restated as of August 5, 2013, as further amended as of June 29, 2015, as further amended as of August 1, 2017, and as further amended as of June 21, 2018, among TEGNA Inc., JPMorgan Chase Bank, N.A. as administrative agent, and the several banks and other financial institutions from time to time parties thereto. | | Incorporated by reference to Exhibit 10-1 to TEGNA Inc.’s Form 10-Q for the fiscal quarter ended September 30, 2019. |
| | | | |
10-21-10 | | Thirteenth Amendment, dated as of June 11, 2020, to the Amended and Restated Competitive Advance and Revolving Credit Agreement, dated as of December 13, 2004 and effective as of January 5, 2005, and as amended and restated as of August 5, 2013, as further amended as of June 29, 2015, as further amended as of September 30, 2016, as further amended as of August 1, 2017, as further amended as of June 21, 2018 and as further amended as of August 15, 2019, among TEGNA Inc., JPMorgan Chase Bank, N.A., as administrative agent, and the several banks and other financial institutions from time to time parties thereto. | | Incorporated by reference to Exhibit 10-1 to TEGNA Inc.’s Form 8-K filed on June 12, 2020. |
| | | | |
10-21-11 | | Fourteenth Amendment, dated as of May 15, 2023 and effective as of May 19, 2023, to the Amended and Restated Competitive Advance and Revolving Credit Agreement, dated as of December 13, 2004 and effective as of January 5, 2005, and as amended and restated as of August 5, 2013, as further amended as of June 29, 2015, as further amended as of September 30, 2016, as further amended as of August 1, 2017, as further amended as of June 21, 2018 and as further amended as of August 15, 2019, among TEGNA Inc., JPMorgan Chase Bank, N.A., as administrative agent, and the several banks and other financial institutions from time to time parties thereto. | | Incorporated by reference to Exhibit 10-1 to TEGNA Inc.’s Form 8-K filed on May 23, 2023. |
| | | | |
Exhibit Number | | Exhibit | | Location |
| | | | |
10-21-12 | | Fifteenth Amendment, dated as of January 25, 2024 and effective as of January 25, 2024, to the Amended and Restated Competitive Advance and Revolving Credit Agreement, dated as of December 13, 2004 and effective as of January 5, 2005, and as amended and restated as of August 5, 2013, as further amended as of June 29, 2015, as further amended as of September 30, 2016, as further amended as of August 1, 2017, as further amended as of June 21, 2018, as further amended as of August 15, 2019, as further amended as of June 11, 2020 and as further amended as of May 14, 2023 among TEGNA Inc., JPMorgan Chase Bank, N.A., as administrative agent, and the several banks and other financial institutions from time to time parties thereto. | | Incorporated by reference to Exhibit 10-1 to TEGNA Inc.’s Form 8-K filed on January 25, 2024. |
| | | | |
10-22 | | Form of CEO Restricted Stock Unit Award Agreement.* | | Incorporated by reference to Exhibit 10-2 to TEGNA Inc.’s Form 10-Q for the fiscal quarter ended March 31, 2023. |
| | | | |
10-22-1 | | Form of CEO Restricted Stock Unit Award Agreement.* | | Incorporated by reference to Exhibit 10-2 to TEGNA Inc.’s Form 10-Q for the fiscal quarter ended March 31, 2024. |
| | | | |
10-23 | | Form of CEO Performance Share Award Agreement.* | | Incorporated by reference to Exhibit 10-4 to TEGNA Inc.’s Form 10-Q for the fiscal quarter ended March 31, 2023. |
| | | | |
10-23-1 | | Form of CEO Performance Share Unit Award Agreement.* | | Incorporated by reference to Exhibit 10-4 to TEGNA Inc.’s Form 10-Q for the fiscal quarter ended March 31, 2024. |
| | | | |
10-24 | | Form of Restricted Stock Unit Award Agreement.* | | Incorporated by reference to Exhibit 10-2 to TEGNA Inc.’s Form 8-K filed on August 9, 2023. |
| | | | |
10-25 | | Form of Cash Retention Award Agreement.* | | Incorporated by reference to Exhibit 10-1 to TEGNA Inc.’s Form 8-K filed on August 9, 2023. |
| | | | |
10-26 | | TEGNA Inc. Executive Officer Cash Severance Policy.* | | Incorporated by reference to Exhibit 10-1 to TEGNA Inc.’s Form 8-K filed on October 26, 2023. |
| | | | |
10-27 | | Offer Letter between TEGNA Inc. and David T. Lougee, dated as of May 3, 2017.* | | Incorporated by reference to Exhibit 10-1 to TEGNA Inc.’s Form 8-K filed on May 9, 2017. |
| | | | |
10-28 | | Offer Letter between TEGNA Inc. and Lauren S. Fisher dated October 18, 2023.* | | Incorporated by reference to Exhibit 10-29 to TEGNA Inc.’s Form 10-K for the fiscal year ended December 31, 2023. |
| | | | |
10-29 | | Letter Agreement, dated as of August 28, 2024, by and between TEGNA Inc. and Lauren S. Fisher.* | | Attached. |
| | | | |
19 | | TEGNA Inc. Insider Trading and Anti-Hedging Policy. | | Attached. |
| | | | |
21 | | Subsidiaries of TEGNA Inc. | | Attached. |
| | | | |
23 | | Consent of Independent Registered Public Accounting Firm. | | Attached. |
| | | | |
31-1 | | Certification Pursuant to Rule 13a-14(a) under the Securities Exchange Act of 1934. | | Attached. |
| | | | |
31-2 | | Certification Pursuant to Rule 13a-14(a) under the Securities Exchange Act of 1934. | | Attached. |
| | | | |
For purposes of the incorporation by reference of documents as Exhibits, all references to Form 10-K, 10-Q and 8-K of TEGNA Inc. refer to Forms 10-K, 10-Q and 8-K filed with the Commission under Commission file number 1-6961.
We agree to furnish to the Commission, upon request, a copy of each agreement with respect to long-term debt not filed herewith in reliance upon the exemption from filing applicable to any series of debt which does not exceed 10% of our total consolidated assets.
* Asterisks identify management contracts and compensatory plans arrangements.
ITEM 16. FORM 10-K SUMMARY
None.
SIGNATURES
Pursuant to the requirements of Section 13 or 15(d) of the Securities Exchange Act of 1934, the registrant has duly caused this report to be signed on its behalf by the undersigned thereunto duly authorized.
| | | |
Dated: February 27, 2025 | TEGNA Inc. (Registrant) |
| | | |
| By: | | /s/ Julie A. Heskett |
| | | Julie A. Heskett |
| | | Senior Vice President and Chief Financial Officer |
| | | (principal financial officer) |
Pursuant to the requirements of the Securities Exchange Act of 1934, this report has been signed below by the following persons on behalf of the registrant in the capacities and on the dates indicated.
| | |
Dated: February 27, 2025 | | /s/ Michael Steib |
| | Michael Steib |
| | President and Chief Executive Officer |
| | (principal executive officer) |
| | |
Dated: February 27, 2025 | | /s/ Julie A. Heskett |
| | Julie A. Heskett |
| | Senior Vice President and Chief Financial Officer |
| | (principal financial officer) |
| | |
Dated: February 27, 2025 | | /s/ Clifton A. McClelland III |
| | Clifton A. McClelland III |
| | Senior Vice President and Controller |
| | (principal accounting officer) |
| | |
Dated: February 27, 2025 | /s/ Gina L. Bianchini | |
| Gina L. Bianchini, Director | |
| | |
Dated: February 27, 2025 | /s/ Catherine Dunleavy | |
| Catherine Dunleavy, Director | |
| | |
Dated: February 27, 2025 | /s/ Howard D. Elias | |
| Howard D. Elias, Director, Chairman | |
| | |
Dated: February 27, 2025 | /s/ Stuart J. Epstein | |
| Stuart J. Epstein, Director | |
| | |
Dated: February 27, 2025 | /s/ Karen H. Grimes | |
| Karen H. Grimes, Director | |
| | |
Dated: February 27, 2025 | /s/ Scott K. McCune | |
| Scott K. McCune, Director | |
| | |
Dated: February 27, 2025 | /s/ Henry W. McGee | |
| Henry W. McGee, Director | |
| | |
Dated: February 27, 2025 | /s/ Neal B. Shapiro | |
| Neal B. Shapiro, Director | |
| | |
Dated: February 27, 2025 | /s/ Michael Steib | |
| Michael Steib, Director | |
| | |
Dated: February 27, 2025 | /s/ Denmark West | |
| Denmark West, Director | |
| | |
Dated: February 27, 2025 | /s/ Melinda C. Witmer | |
| Melinda C. Witmer, Director | |
GLOSSARY OF FINANCIAL TERMS
Presented below are definitions of certain key financial and operational terms that we hope will enhance the reading and understanding of our 2024 Form 10-K.
ADJUSTED EBITDA – Net income attributable to the Company before (1) net loss (income) attributable to redeemable noncontrolling interest, (2) income taxes, (3) interest expense, (4) interest income, (5) other non-operating items, net, (6) M&A related costs, (7) employee retention costs, (8) workforce restructuring costs, (9) asset impairment and other, (10) the Merger termination fee, (11) earnout adjustments, (12) depreciation and (13) amortization of intangible assets.
AMORTIZATION – A non-cash charge against our earnings that allocates the cost of definite-lived intangible assets over the projected life of the assets.
BALANCE SHEET – A summary statement that reflects our assets, liabilities and equity at a particular point in time.
BUSINESS ACQUISITION – The acquiring company records the assets and liabilities assumed from the business being acquired at their fair value, with any excess of the purchase price over such fair value recorded to goodwill. If the purchase price is less than the fair value of the assets and liabilities acquired, the difference is recognized as a bargain purchase.
CURRENT ASSETS – Cash and cash equivalents and other assets that are expected to be converted to cash or amortized within one year.
CURRENT LIABILITIES – Amounts owed that will be paid within one year.
DEPRECIATION – A non-cash charge against our earnings that allocates the cost of property and equipment over the estimated useful lives of the assets.
DIVIDEND – A payment we make to our shareholders from a portion of our earnings on a pro-rata basis.
EARNINGS PER SHARE (basic) – Our earnings available to our common stockholders divided by the weighted average number of shares outstanding for the period.
EARNINGS PER SHARE (diluted) – Our earnings available to our common stockholders divided by the weighted average number of shares outstanding for the period, giving effect to assumed dilution from outstanding performance share awards and restricted stock units.
EMPLOYEE AWARDS STOCK-BASED COMPENSATION – The expense recognized in our Consolidated Statements of Income related to employees for services received as a result of granting equity instruments such as restricted stock units and performance share awards.
EMPLOYEE COMPENSATION – The cost associated with salaries, bonuses, stock-based compensation and benefits paid to our employees.
GAAP – Generally accepted accounting principles in the United States.
GOODWILL – In a business acquisition, this represents the excess of consideration over the fair value of tangible and other identified intangible assets acquired net of liabilities assumed.
NET LOSS (INCOME) ATTRIBUTABLE TO NONCONTROLLING INTERESTS – The portion of equity and net earnings in consolidated subsidiaries that is owned by others.
PERFORMANCE SHARE AWARD – An equity award that gives key employees the right to earn a number of shares of common stock over an incentive period based on how our actual adjusted EBITDA and free cash flow (as defined by the PSA agreement) performs as compared to targets.
PROGRAMMING EXPENSE – The cost to obtain third party content that is broadcast by our stations.
RESTRICTED STOCK UNIT – An award that gives employees the right to shares of our common stock, pursuant to a vesting schedule with certain service criterion.
RETAINED EARNINGS – Our cumulative earnings not paid out as dividends to shareholders.
STATEMENTS OF CASH FLOWS – A financial statement that reflects cash flows from operating, investing and financing activities, providing a comprehensive view of changes in our cash and cash equivalents.
STATEMENTS OF COMPREHENSIVE INCOME – A financial statement that reflects our changes in equity from transactions and other events from non-owner sources. Comprehensive income comprises net income and other items reported directly in shareholders’ equity, principally funded status of postretirement plans and the foreign currency translation adjustment.
STATEMENTS OF EQUITY AND REDEEMABLE NONCONTROLLING INTEREST – A financial statement that reflects changes in our common stock, retained earnings and other equity accounts.
STATEMENTS OF INCOME – A financial statement that reflects our profit by measuring revenues and expenses.
STREAMING APPS – Services that delivers video content to consumers over the Internet.