UNITED STATES SECURITIES AND EXCHANGE COMMISSION Washington, D.C. 20549
Form 10-K | | | | | |
| ☑ | ANNUAL REPORT PURSUANT TO SECTION 13 OR 15(d) OF THE SECURITIES EXCHANGE ACT OF 1934 |
For the fiscal year ended December 31, 2024 or | | | | | |
| ☐ | TRANSITION REPORT PURSUANT TO SECTION 13 OR 15(d) OF THE SECURITIES EXCHANGE ACT OF 1934 |
Commission File Number 1-2328 GATX Corporation
(Exact name of registrant as specified in its charter) | | | | | |
| New York | 36-1124040 |
| (State or Other Jurisdiction of incorporation or Organization) | (I.R.S. Employer Identification No.) |
233 South Wacker Drive Chicago, IL 60606-7147
(Address of principal executive offices, including zip code)
(312) 621-6200
(Registrant's telephone number, including area code)
Securities Registered Pursuant to Section 12(b) of the Act: | | | | | | | | |
| Title of Each Class | Trading Symbol(s) | Name of Each Exchange on Which Registered |
| Common Stock | GATX | New York Stock Exchange |
| | Chicago Stock Exchange |
Securities Registered Pursuant to Section 12(g) of the Act:
None
Indicate by check mark if the registrant is a well-known seasoned issuer, as defined in Rule 405 of the Securities Act. Yes þ No o
Indicate by check mark if the registrant is not required to file reports pursuant to Section 13 or Section 15(d) of the Act. Yes o No þ
Indicate by check mark whether the registrant (1) has filed all reports required to be filed by Section 13 or 15 (d) of the Securities Exchange Act of 1934 during the preceding 12 months (or for such shorter period that the registrant was required to file such reports), and (2) has been subject to such filing requirements for the past 90 days. Yes þ No o
Indicate by check mark whether the registrant has submitted electronically every Interactive Data File required to be submitted pursuant to Rule 405 of Regulation S-T (§232.405 of this chapter) during the preceding 12 months (or for such shorter period that the registrant was required to submit such files). Yes þ No ¨
Indicate by check mark whether the registrant is a large accelerated filer, an accelerated filer, a non-accelerated filer, a smaller reporting company, or an emerging growth company. See the definitions of “large accelerated filer”, “accelerated filer”, “smaller reporting company” and "emerging growth company" in Rule 12b-2 of the Exchange Act.
| | | | | | | | | | | | | | | | | |
| Large accelerated filer | þ | Accelerated filer | ☐ | Emerging growth company | ☐ |
| Non-accelerated filer | ☐ | Smaller reporting company | ☐ | | |
If an emerging growth company, indicate by check mark if the registrant has elected not to use the extended transition period for complying with any new or revised financial accounting standards provided pursuant to Section 13(a) of the Exchange Act. o
Indicate by check mark whether the registrant has filed a report on and attestation to its management’s assessment of the effectiveness of its internal control over financial reporting under Section 404(b) of the Sarbanes-Oxley Act (15 U.S.C. 7262(b)) by the registered public accounting firm that prepared or issued its audit report. ☑
If securities are registered pursuant to Section 12(b) of the Act, indicate by check mark whether the financial statements of the registrant included in the filing reflect the correction of an error to previously issued financial statements. o
Indicate by check mark whether any of those error corrections are restatements that required a recovery analysis of incentive-based compensation received by any of the registrant’s executive officers during the relevant recovery period pursuant to §240.10D-1(b). o
Indicate by check mark whether the registrant is a shell company (as defined in Rule 12b-2 of the Act). Yes o No þ
The aggregate market value of the voting and non-voting stock held by non-affiliates of the registrant was approximately $4.7 billion as of June 28, 2024.
There were 35.6 million common shares outstanding at January 31, 2025.
DOCUMENTS INCORPORATED BY REFERENCE
| | | | | |
| GATX’s definitive Proxy Statement to be filed on or about March 14, 2025 | PART III |
GATX CORPORATION
2024 FORM 10-K
INDEX | | | | | | | | |
| Item No. | | Page |
| | |
| Part I |
| Item 1. | | |
| Item 1A. | | |
| Item 1B. | | |
| Item 1C. | | |
| Item 2. | | |
| Item 3. | | |
| Item 4. | | |
| Part II |
| Item 5. | | |
| Item 6. | | |
| Item 7. | | |
| | |
| | |
| | |
| | |
| | |
| | |
| | |
| Item 7A. | | |
| Item 8. | | |
| Item 9. | | |
| Item 9A. | | |
| Item 9B. | | |
| Item 9C. | | |
| Part III |
| Item 10. | | |
| Item 11. | | |
| Item 12. | | |
| Item 13. | | |
| Item 14. | | |
| Part IV |
| Item 15. | | |
| Item 16. | | |
| | |
FORWARD-LOOKING STATEMENTS
Statements in this report not based on historical facts are "forward-looking statements" within the meaning of the Private Securities Litigation Reform Act of 1995 and, accordingly, involve known and unknown risks and uncertainties that are difficult to predict and could cause our actual results, performance, or achievements to differ materially from those discussed. Forward-looking statements include statements as to our future expectations, beliefs, plans, strategies, objectives, events, conditions, financial performance, prospects, or future events. In some cases, forward-looking statements can be identified by the use of words such as "may," "could," "expect," "intend," "plan," "seek," "anticipate," "believe," "estimate," "predict," "potential," "outlook," "continue," "likely," "will," "would," and similar words and phrases. Forward-looking statements are necessarily based on estimates and assumptions that, while considered reasonable by us and our management, are inherently uncertain. Accordingly, you should not place undue reliance on forward-looking statements, which speak only as of the date they are made, and are not guarantees of future performance. We do not undertake any obligation to publicly update or revise these forward-looking statements.
The following factors, in addition to those discussed under "Risk Factors" and elsewhere in this report and in our other filings with the U.S. Securities and Exchange Commission, could cause actual results to differ materially from our current expectations expressed in forward-looking statements:
| | | | | | | | |
•a significant decline in customer demand for our transportation assets or services, including as a result of: ◦prolonged inflation or deflation ◦high interest rates ◦weak macroeconomic conditions and world trade policies ◦weak market conditions in our customers' businesses ◦adverse changes in the price of, or demand for, commodities ◦changes in railroad operations, efficiency, pricing and service offerings, including those related to "precision scheduled railroading" or labor strikes or shortages ◦changes in, or disruptions to, supply chains ◦availability of pipelines, trucks, and other alternative modes of transportation ◦changes in conditions affecting the aviation industry, including global conflicts, geographic exposure and customer concentrations ◦customers' desire to buy, rather than lease, our transportation assets ◦other operational or commercial needs or decisions of our customers •inability to maintain our transportation assets on lease at satisfactory rates and term length due to oversupply of assets in the market or other changes in supply and demand •competitive factors in our primary markets, including existing or new competitors with significantly lower costs of capital •higher costs associated with increased assignments of our transportation assets following non-renewal of leases, customer defaults, and compliance maintenance programs or other maintenance initiatives •events having an adverse impact on assets, customers, or regions where we have a concentrated investment exposure •financial and operational risks associated with long-term purchase commitments for transportation assets •reduced opportunities to generate asset remarketing income •inability to successfully consummate and manage ongoing acquisition and divestiture activities
| |
•reliance on Rolls-Royce in connection with our aircraft spare engine leasing businesses, and the risks that certain factors that adversely affect Rolls-Royce could have an adverse effect on our businesses •potential obsolescence of our assets •risks related to our international operations and expansion into new geographic markets, including laws, regulations, tariffs, taxes, treaties or trade barriers affecting our activities in the countries where we do business •failure to successfully negotiate collective bargaining agreements with the unions representing a substantial portion of our employees •inability to attract, retain, and motivate qualified personnel, including key management personnel •inability to maintain and secure our information technology infrastructure from cybersecurity threats and related disruption of our business •exposure to damages, fines, criminal and civil penalties, and reputational harm arising from a negative outcome in litigation, including claims arising from an accident involving transportation assets •changes in, or failure to comply with, laws, rules, and regulations •environmental liabilities and remediation costs •operational, functional and regulatory risks associated with climate matters, severe weather events and natural disasters •U.S. and global political conditions and the impact of increased geopolitical tension and wars on domestic and global economic conditions in general, including supply chain challenges and disruptions •prolonged inflation or deflation •fluctuations in foreign exchange rates •deterioration of conditions in the capital markets, reductions in our credit ratings, or increases in our financing costs •inability to obtain cost-effective insurance •changes in assumptions, increases in funding requirements or investment losses in our pension and post-retirement plans •inadequate allowances to cover credit losses in our portfolio •asset impairment charges we may be required to recognize •inability to maintain effective internal control over financial reporting and disclosure controls and procedures •the occurrence of a widespread health crisis and the impact of measures taken in response |
PART I
Item 1. Business
GENERAL
GATX Corporation ("GATX", "we," "us," "our," and similar terms), a New York corporation founded in 1898, is a leading global railcar lessor, owning fleets in North America, Europe, and India. In addition, through GATX Engine Leasing ("GEL"), our wholly owned aircraft spare engine leasing business, and our joint ventures with Rolls-Royce plc (or affiliates thereof, collectively “Rolls-Royce”), we own one of the largest aircraft spare engine lease portfolios in the world. We report our financial results through three primary business segments: Rail North America, Rail International, and Engine Leasing (previously named Portfolio Management). Financial results for our tank container leasing business ("Trifleet") are reported in the Other segment.
In 2024, we changed the name of our Portfolio Management business segment to Engine Leasing to reflect the prospective operations of this business segment. Historically, this business segment included marine operations from our liquefied gas-carrying vessels (the "Specialized Gas Vessels"). As of December 31, 2023, we had sold all of our marine assets and no longer have any marine operations. The segment is now almost entirely composed of our engine leasing operations, which include our ownership interest in the Rolls-Royce & Partners Finance ("RRPF") affiliates, a group of joint ventures with Rolls-Royce that lease aircraft spare engines, and GEL, our business that directly owns aircraft spare engines that are leased to airline customers or employed in an engine capacity agreement.
The following description of our business should be read in conjunction with the information contained in our Management’s Discussion and Analysis of Financial Condition and Results of Operations included in Item 7 and the consolidated financial statements included in Part II, Item 8 of this Form 10-K.
At December 31, 2024, we had total assets of $12.3 billion, composed largely of railcars.
OPERATIONS
GATX RAIL BUSINESS OVERVIEW
Our wholly owned fleet of approximately 152,000 railcars is one of the largest railcar lease fleets in the world. We lease tank cars, freight cars, and locomotives in North America, tank cars and freight cars in Europe, and freight cars in India. The following table sets forth our worldwide rail fleet data as of December 31, 2024:
| | | | | | | | | | | | | | | | | | | | | | | | | | | | | | | | | | | |
| Tank
Railcars | | Freight
Railcars | | Total Fleet | | Managed
Railcars | | Total Railcars | | Locomotives |
| Rail North America | 64,068 | | | 47,293 | | | 111,361 | | | 288 | | | 111,649 | | | 661 | |
| Rail International | 23,913 | | | 16,697 | | | 40,610 | | | 7 | | | 40,617 | | | — | |
| Total | 87,981 | | | 63,990 | | | 151,971 | | | 295 | | | 152,266 | | | 661 | |
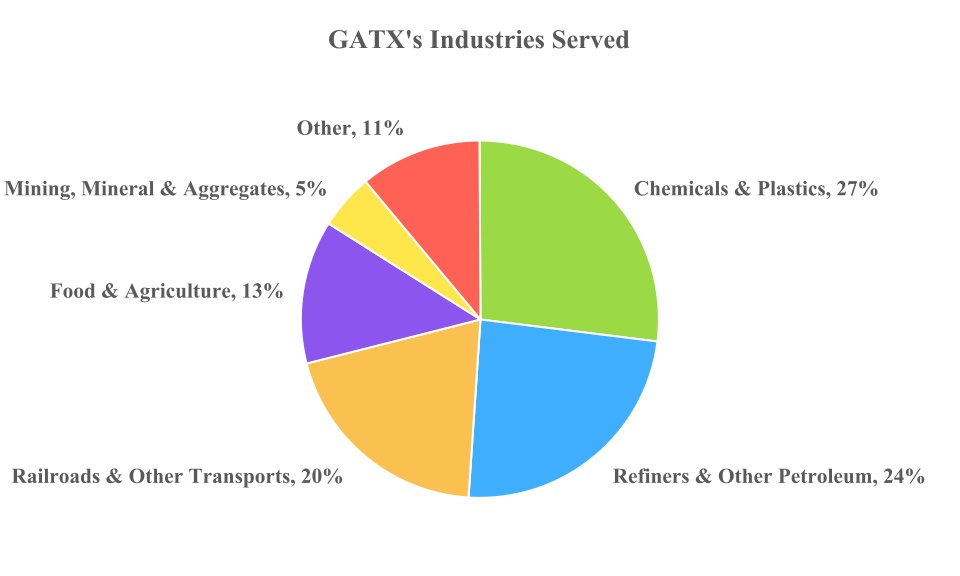
Our rail customers primarily operate in the transportation, chemical, petroleum, and food/agriculture industries. Our worldwide railcar fleet consists of diverse railcar types that our customers use to ship nearly 550 different commodities. The following table presents an overview of our railcar types as well as the industries of our customers and the commodities they ship.
| | | | | | | | | | | | | | | | | | | | | | | | | | |
| General-Service Tank Cars | High-Pressure Tank Cars | Specialty Tank Cars | Specialty/Pneumatic Covered Hoppers | Gravity Covered Hoppers | Open-Top Cars | Boxcars | Flatcars/Intermodal Railcars |
| Principal Industries Served | Petroleum/Bio-fuels | Petroleum | Chemical | Plastics | Agriculture | Energy | Food | Automotive |
| Chemical | Chemical | Petroleum | Food | Energy | Steel | Consumer Goods | Manufactured Goods |
| Food | | Mining | Industrial | Industrial | Construction | Forest Products | Consumer Goods |
| Agriculture | | | | Construction | Forest Products | Packaging | Energy |
| Construction | | | | Food | | Construction | Steel |
| | | | | | | | |
| Principal Commodities | Petroleum Products | Liquefied Petroleum Gas Products | Sulfuric Acid | Plastics | Fertilizer | Coal | Packaged Food and Beverages | Vehicles |
| Fertilizer Products | Propylene | Molten Sulfur | Flour | Grain | Metals and Related | Paper and Packaging | Packaged Goods |
Ethanol/
Bio-fuels | Vinyl Chloride Monomer | Hydrochloric Acid | Sugar | Sand | Aggregates | Lumber and Building Products | Lumber |
| Edible Oils and Syrups | Miscellaneous Chemicals | Caustic Soda | Starch | Cement, Granules | Coke | Mixed Freight | Steel Products |
| Chemicals | | Phosphoric Acid | Carbon Black | Soda Ash | Waste | | Mixed Freight |
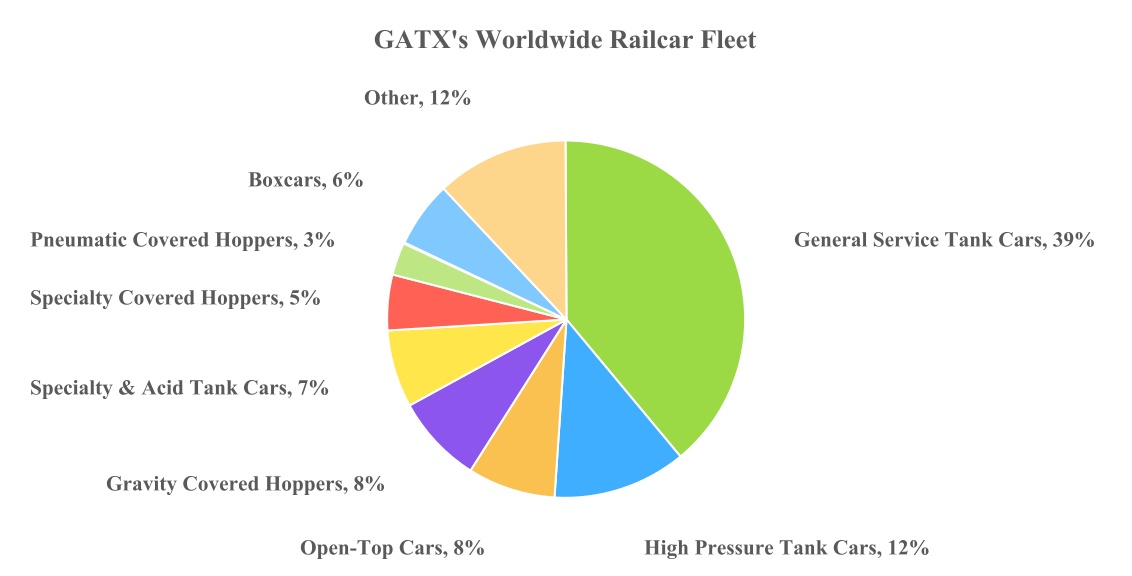
Approximately 152,000 Railcars as of 12/31/2024
Based on 2024 Combined Rail North America and Rail International Revenues
RAIL NORTH AMERICA
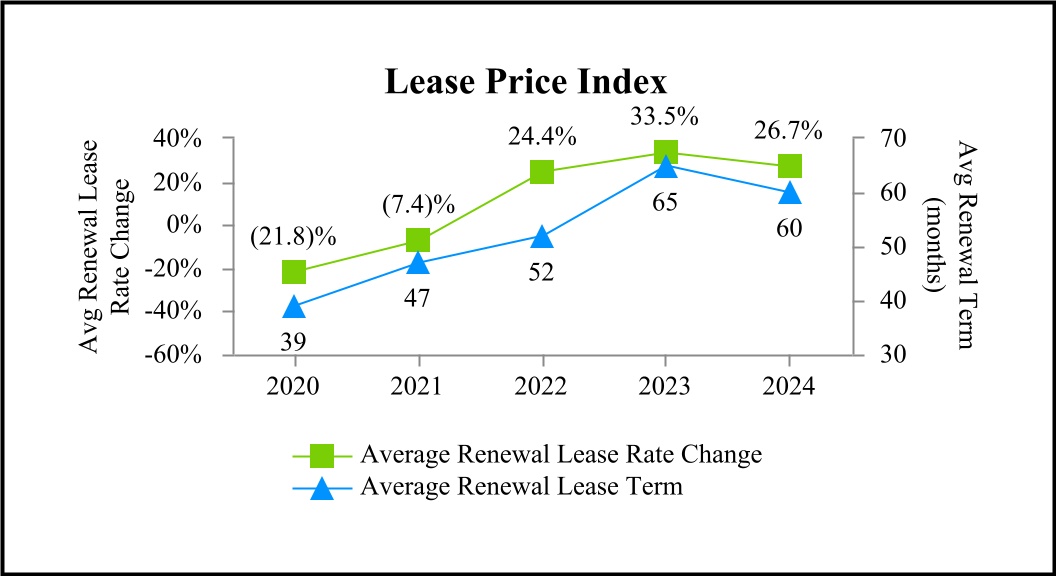
Rail North America is composed of our operations in the United States, Canada, and Mexico. Rail North America primarily provides railcars pursuant to full-service leases under which it maintains the railcars, pays ad valorem taxes, and provides other ancillary services. These railcars have estimated economic useful lives of 27 to 45 years and an average age of approximately 18 years. Rail North America has a large and diverse customer base, serving approximately 830 customers. In 2024, one customer accounted for more than 5% of Rail North America’s total lease revenue, and the top ten customers combined accounted for approximately 25% of Rail North America’s total lease revenue. Rail North America leases railcars for terms that generally range from one to ten years, which vary based on railcar type, lease structure, and market conditions. The average remaining lease term of the North American fleet was approximately 41 months as of December 31, 2024. Rail North America’s primary competitors in railcar leasing are Union Tank Car Company, Wells Fargo Rail, CIT Rail, Trinity Industries Leasing Company, and American Industrial Transport. Rail North America competes primarily on the basis of availability of railcars, maintenance capabilities, lease rate, lease structures, customer relationships, and engineering expertise.
Rail North America purchases new railcars from a number of manufacturers, including Trinity Rail Group, LLC ("Trinity"), a subsidiary of Trinity Industries, Inc., The Greenbrier Companies, Inc. (“Greenbrier”) and its subsidiaries, National Steel Car Ltd., and FreightCar America, Inc. We also acquire new and used railcars in the secondary market.
In 2022, we entered into a long-term railcar supply agreement with Trinity to purchase 15,000 newly built railcars through 2028, with an option to order up to an additional 500 railcars each year from 2023 to 2028. The agreement enables us to order a broad mix of tank and freight cars. Trinity is scheduled to deliver 6,000 tank cars (1,200 per year) from 2024 through 2028. The remaining 9,000 railcars, which can be a mix of freight and tank cars, are expected to be ordered at a rate of 1,500 railcars per order year from 2023 to 2028 and delivered under a schedule to be determined. At December 31, 2024, 5,392 railcars have been ordered pursuant to the terms of the agreement, of which 3,458 have been delivered.
Rail North America also owns a fleet of locomotives, consisting of 593 four-axle and 68 six-axle locomotives as of December 31, 2024. In 2024, we acquired a fleet of 156 locomotives from Progress Rail Services Corporation. The acquisition was an opportunity to grow the locomotive fleet and add a mix of favorable model types. Locomotive customers are primarily regional and short-line railroads and industrial users. Lease terms vary from month-to-month to ten years. As of December 31, 2024, the average remaining lease term of the locomotive fleet was approximately 23 months. Rail North America's primary competitors in locomotive leasing are Wells Fargo Rail, CIT Rail, and LTEX Rail. Competitive factors in the market include availability of locomotives, lease rates, customer service, and maintenance.
Maintenance
Rail North America operates an extensive network of maintenance facilities in the United States and Canada dedicated to performing safe, timely, efficient, and high-quality railcar maintenance services for customers. Services include interior cleaning of railcars, routine maintenance and general repairs to the car body and safety appliances, regulatory compliance work, wheelset replacements, interior blast and lining, exterior blast and painting, and car stenciling. To the extent possible, railcar maintenance is scheduled in a manner that minimizes the amount of time the car is out of service.
At December 31, 2024, Rail North America’s maintenance network consisted of:
•Six major maintenance facilities that can complete nearly all types of maintenance services;
•One smaller maintenance facility with more limited capabilities;
•One customer-dedicated site operating within a customer facility that offers services tailored to the needs of our customer's fleet; and
•Two locations with mobile units that travel to field locations to provide services tailored to the needs of our customers' fleets.
The maintenance network is supplemented by a number of preferred third-party maintenance providers and railroads. In 2024, third-party maintenance network expenses accounted for approximately 18% of Rail North America’s total maintenance network expenses, excluding repairs performed by the railroads. In 2024, wholly owned and third-party maintenance facilities performed approximately 29,000 service events, including in some cases multiple independent service events for the same railcar.
Our maintenance activities are primarily dedicated to servicing our wholly owned railcar fleet pursuant to the provisions of our lease contracts. This may include services that are not included in the full-service lease agreement, such as repairs of railcar damage or other customer-specific requirements. Revenue earned from these types of maintenance services is recorded in other revenue. We also perform maintenance and repair activities on railcars owned by third parties.
Affiliates
GATX is a co-founder of and, as of December 31, 2024, owns a 10.0% share in the RailPulse LLC ("RailPulse") joint venture. RailPulse's owners consist of a coalition of North American railcar owners, including leasing companies, shippers, short lines, and Class I railroads. The RailPulse joint venture was formed to create an industry-wide telematics platform to enable the use of telematics devices to gather data and enhance rail safety and the value proposition for rail shippers across North America. The financial results of RailPulse are not material to GATX.
RAIL INTERNATIONAL
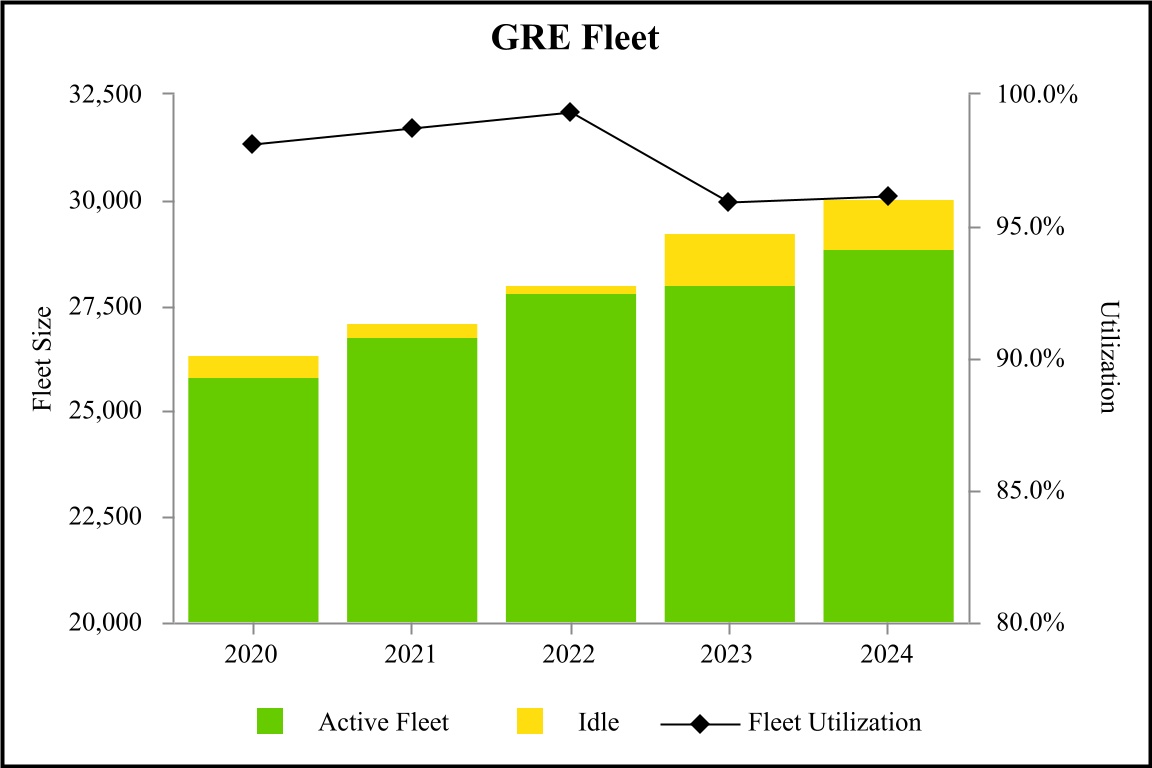
Rail International is composed of our operations in Europe ("GATX Rail Europe" or "GRE"), India ("Rail India"), and until January 31, 2023, Russia ("Rail Russia"). GRE primarily leases railcars to customers throughout Europe pursuant to full-service leases under which it maintains the railcars and provides value-added services according to customer requirements. As of December 31, 2024, GRE owned 30,027 railcars with estimated useful lives of 32 to 40 years and an average age of approximately 17 years. GRE has a diverse customer base with approximately 270 customers. In 2024, one customer accounted for approximately 18% of GRE's total lease revenue and the top ten customers combined accounted for approximately 46% of GRE's total lease revenue. GRE's lease terms generally range from one to ten years and, as of December 31, 2024, the average remaining lease term of the European fleet was approximately 20 months. GRE's primary competitors are VTG Aktiengesellschaft, the Ermewa Group, Wascosa AG, and Touax. GRE competes principally on the basis of availability of railcars, customer relationships, lease rate, lease structure, engineering, and maintenance expertise.
GRE acquires new railcars primarily from Gök Yapi San. Tic. a.s., Greenbrier-Astra Rail (Wagony Swidnica sp. z.o.o and Astra Rail Industries S.A.), Duro Dakovic, and Tatravagonka a.s. Additionally, GRE's Ostróda, Poland maintenance facility assembles tank cars each year. As of December 31, 2024, GRE had commitments to acquire from third parties, primarily from Gök Yapi San. Tic. a.s., Greenbrier-Astra Rail, Duro Dakovic and Tatravagonka a.s., 1,804 newly manufactured railcars scheduled to be delivered in 2025.
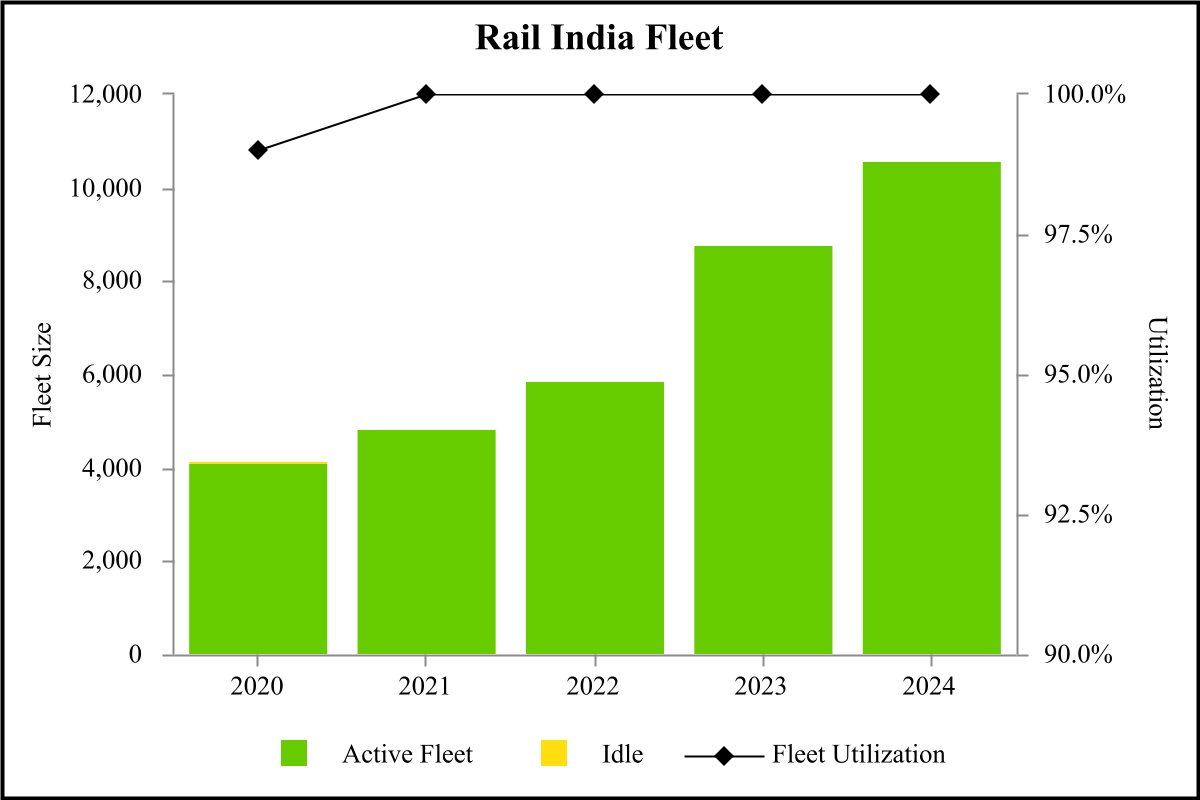
As of December 31, 2024, Rail India owned 10,583 railcars with estimated useful lives of 15 to 30 years. Rail India's leases are net leases, under which the lessee assumes responsibility for maintenance of the railcars, and have terms generally ranging from five to fifteen years. As of December 31, 2024, the average remaining lease term of the Indian fleet was approximately 75 months. Rail India has a customer base of 18 customers in the automotive, container, steel, cement, and bulk commodities transport sector, as well as one
customer in the public sector. As of December 31, 2024, Rail India had entered into contracts to acquire 682 railcars to be delivered in 2025, the majority of which have committed leases in place with customers.
In 2022, we decided to exit Rail Russia due to the impacts of the Russia/Ukraine conflict on our business and the business risks associated with the geopolitical environment resulting from that conflict. In the first quarter of 2023, we sold Rail Russia. See "Note 10. Asset Impairments and Assets Held for Sale" in Part II, Item 8 of this Form 10-K for further information.
Maintenance
GRE operates a maintenance facility in Ostróda, Poland that performs significant repairs, regulatory compliance, and modernization work for our owned railcars and assembles railcars for GRE's fleet. This facility is supplemented by an extensive network of third-party repair facilities. The third-party facilities accounted for approximately 66% of GRE's total maintenance network expenses in 2024.
Similar to our Rail North America segment, GRE's customers periodically require maintenance services that are not included in the full-service lease agreement. These services are generally related to the repair of railcar damage caused by customers and railways, as well as customer-specific requirements. Revenue earned from these maintenance activities is recorded in other revenue.
In India, all railcar maintenance is performed by Indian Railways or third-parties authorized by Indian Railways, in accordance with regulatory requirements.
ENGINE LEASING
Engine Leasing is composed primarily of the Rolls-Royce & Partners Finance joint ventures (collectively, the "RRPF affiliates") that lease aircraft spare engines and GATX Engine Leasing ("GEL"), our wholly owned aircraft spare engine leasing business.
Affiliates
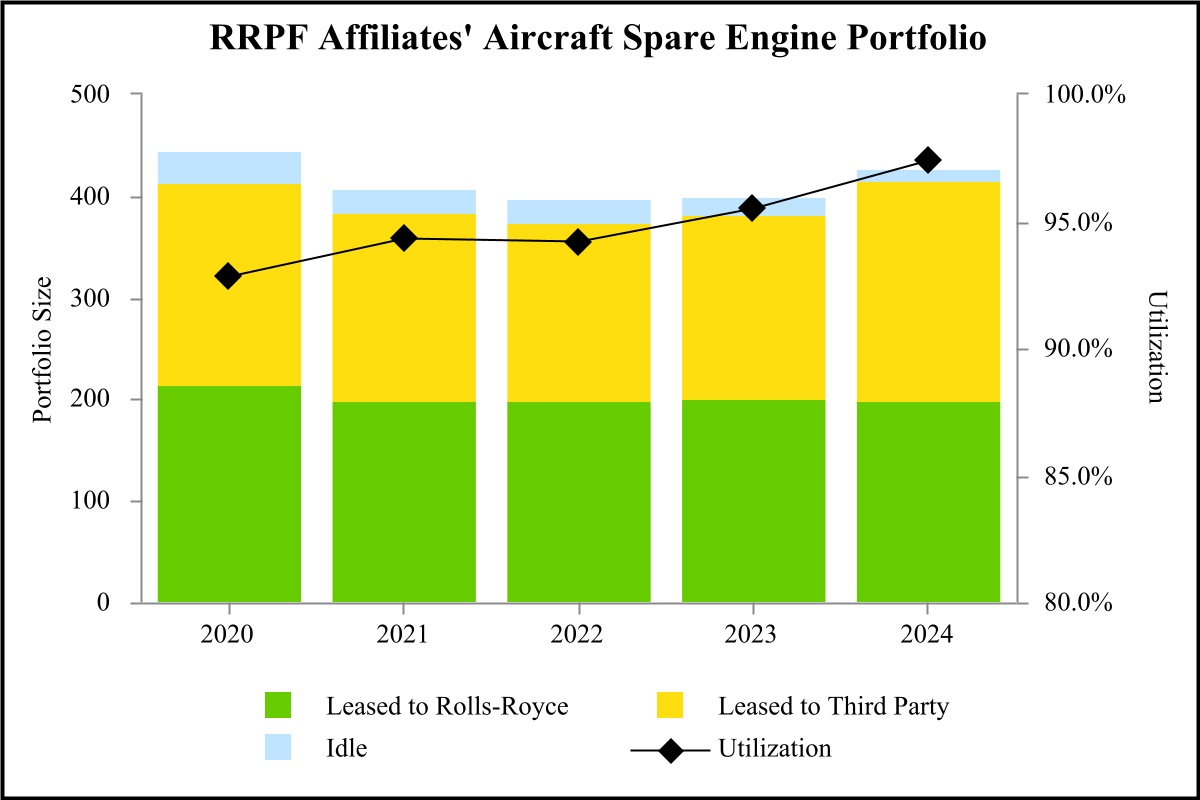
The RRPF affiliates are a group of 50% owned domestic and foreign joint ventures with Rolls-Royce plc, a leading manufacturer of commercial aircraft jet engines. The RRPF affiliates are primarily engaged in two business activities: leasing of aircraft spare engines to a diverse group of commercial aircraft operators worldwide and leasing of aircraft spare engines to Rolls-Royce for use in their engine maintenance programs. As of December 31, 2024, the RRPF affiliates, in aggregate, owned 427 engines, of which 198 were on lease to Rolls-Royce. Aircraft engines have an estimated economic useful life of 20 to 30 years. As of December 31, 2024, the average age of these engines was approximately 12 years. Lease terms vary, but typically range from 5 to 12 years. The RRPF affiliates are staffed and managed by seconded Rolls-Royce employees, who also oversee any required maintenance activities.
Owned Assets
GEL is our wholly owned entity that invests directly in aircraft spare engines. As of December 31, 2024, GEL owned 39 aircraft spare engines, with 14 on long-term leases with airline customers and 25 that are employed in an engine capacity agreement with Rolls-Royce for use in its engine maintenance programs. These aircraft spare engines have an estimated economic useful life of 20 to 30 years. As of December 31, 2024, the average age of these engines was approximately 4 years. The average remaining lease term of engines on long-term leases as of December 31, 2024 was approximately 6 years. All engines owned by GEL are managed by the RRPF affiliates.
Historically, Engine Leasing had marine assets (the "Specialized Gas Vessels") that were utilized to transport pressurized gases and chemicals, such as liquefied petroleum gas and ethylene, primarily on short-term spot contracts and medium-term charters and contracts of affreightment for major oil and chemical customers worldwide. As of December 31, 2023, we had sold all of our marine assets.
OTHER
Trifleet owns and manages tank containers that are leased to a diverse base of approximately 300 customers in the chemical, industrial gas, energy, food, cryogenic and pharmaceutical industries, and transport and logistics operators. These tank containers have estimated useful lives of 15 to 25 years and an average age of approximately 8 years. Trifleet's lease terms generally range from one to five years and, as of December 31, 2024, the average remaining lease term was approximately 23 months. Trifleet manages tank containers on behalf of a limited number of third-party container investors under long-term agreements. Under these agreements, Trifleet earns fees for managing these investor-owned fleets, and provides various services, including the sourcing of new containers and customers, leasing and remarketing of tank containers, and arranging inspection and maintenance services. Trifleet's primary competitors are Exsif, Eurotainer, Seaco, Raffles, Peacock, and CS Leasing.
Trifleet acquires new tank containers primarily from China International Marine Containers (Group) Ltd. ("CIMC"), Jingjiang Asian-Pacific Logistics Equipment Co., Ltd. ("JJAP"), and Nantong Tank Container Co., Ltd. ("NT Tank"). As of December 31, 2024, Trifleet had commitments to acquire from third-parties, primarily from CIMC, 485 newly manufactured tank containers to be delivered in 2025.
TRADEMARKS AND PATENTS
Patents, trademarks, and licenses are not material to our businesses taken as a whole.
SEASONAL NATURE OF BUSINESS
GATX's business is not materially impacted by seasonality of operations.
CUSTOMER BASE
GATX, taken as a whole, is not dependent upon a single customer nor does it have any significant customer concentrations. Segment concentrations, if material, are described above.
See "Note 14. Concentrations" in Part II, Item 8 of this Form 10-K for additional information.
HUMAN CAPITAL
The strength of our workforce is a significant contributor to our success. To facilitate talent attraction and retention, we endeavor to make GATX an inclusive and safe workplace that recognizes and fosters innovation and a variety of viewpoints while providing employees with opportunities to grow and develop in their careers. This is supported by fair compensation, a range of benefits, health and wellness offerings, and programs that build connections between our employees and their communities.
Employees and Employee Relations
As of December 31, 2024, we employed 2,150 persons globally, of whom approximately 39% were union workers covered by collective bargaining agreements. The hourly employees at our U.S. service centers are represented by the United Steelworkers. Employees at three of Rail North America's Canadian service centers are represented by Unifor and the Employee Shop Committee of Rivière-des-Prairies. Certain employees of GATX Rail Europe are represented by one union in Poland.
See "Note 14. Concentrations" in Part II, Item 8 of this Form 10-K for additional information about our employees and concentration of labor force.
Our People
GATX is committed to fostering an inclusive environment where employees feel valued and welcomed to be their best personally and professionally. In recent years, GATX has committed to strengthening its culture through a variety of projects and processes, including:
•aiming to cultivate an inclusive environment where everyone can contribute their full range of knowledge, experiences, and perspectives to attract and retain top-tier talent, and by embracing such varied viewpoints, we seek to drive innovation and enhance business outcomes;
•utilizing structured and transparent hiring practices that seek to attract top-tier talent;
•conducting annual compensation reviews for professional, managerial, and executive level positions;
•regularly conducting employee engagement surveys; and
•supporting our employees' learning and career growth through a comprehensive approach that includes organization-wide training, specialized programs for emerging leaders and people managers, and an extensive selection of e-learning opportunities.
Talent Development and Retention
We champion learning and career growth for our employees, as we believe the talent and efforts of our employees drive the success of our business. We believe the long tenure of many GATX employees is an attestation to the organization's culture and career opportunities. Employees are supported with a multi-tiered approach to learning. For example, managers receive training on topics such as managing in a hybrid work environment, performance management, and goal-setting, while employees in our maintenance facilities have access to certification programs that enable their career progression. Career success profiles provide transparency into what it takes to be successful at GATX as an individual contributor and also as a leader. Our talent development programs are designed to provide employees with the resources they need to help achieve their career goals, build management skills, and lead their organizations, as well as to facilitate readiness for potential successors within our leadership pipelines.
Compensation and Benefits
GATX provides comprehensive compensation and benefits programs to support our employees’ overall well-being. In addition to offering competitive salaries, GATX provides employees with annual bonuses, stock awards, a matched 401(k) plan, comprehensive health insurance, prescription drug coverage, health savings accounts, and paid time off. Our retirement program includes pension plans, a health reimbursement account, and pre-65 medical plan for employees retiring from the company. Other benefits include life, disability, and accident insurance, paid parental leave, identity theft coverage, flexible time off, adoption assistance, tuition reimbursement, and telecommuting flexibility.
Safety
GATX strives to maintain the highest levels of safety by fostering a culture that makes safety a top priority. GATX utilizes a continuous improvement methodology to identify environment, health, and safety hazards, evaluate the risks, implement control measures, and drive improvement initiatives.
We continue to strive to ensure that our railcar maintenance facility employees, who are essential workers in the rail industry, can safely perform their jobs every day.
GATX continues to be recognized as a Responsible Care Partner by the American Chemistry Council ("ACC") and the Chemistry Industry Association of Canada ("CIAC") and is an active participant in the Transportation Community Awareness and Emergency Response ("TRANSCAER") initiative, a national outreach effort assisting communities to prepare for and respond to possible hazardous materials transportation incidents. In 2024, GATX received several Responsible Care awards, including the CIAC’s 2023 Responsible Care Excellence in Partnership Award, 2023 President's Award for an employee’s long-standing dedication to TRANSCAER Canada and the development of a new TRANSCAER Tank Trainer Car, and two ACC Facility Safety Awards for Terre Haute's and Waycross’ achievements in the prevention of occupational injuries and illnesses. Additionally, GATX offers training on the proper use of our equipment and on regulations that impact our business. We hold training events at customer locations across North America through the use of our TankTrainer™ mobile classroom.
Community Commitment
We believe that building connections between our employees and their communities creates a more meaningful, fulfilling, and productive workplace. GATX has a long history of supporting causes in communities where our employees live and work, establishing a company culture that values strong corporate citizenship. Every year, our local offices organize and encourage employees to volunteer and give back through programs that focus on addressing the needs of underserved populations and building vibrant communities. Highlights from 2024 included:
•Employees in Chicago, Illinois and Hearne, Texas helped create life-changing wishes in partnership with their local Make-A-Wish chapters. Further, for over 25 years, GATX and its employees have donated nearly $6 million to Make-A-Wish Illinois through corporate contributions and employee giving and fundraising.
•In Chicago, Illinois, employees participated in a service day with Big Shoulders Fund, which provides support to inner-city schools, to clean, beautify, and prepare schools for the new school year. Further, GATX employees mentor students year-round.
•Employees across Europe cleaned natural areas, revitalized garden spaces, donated blood, and more as part of GATX Rail Europe's "You Care - We Care" initiative.
•In Moose Jaw, Saskatchewan, employees collected and donated more than 750 pounds of food to the community food bank, helping nourish their neighbors in need.
•In Galena Park, Texas, GATX employees helped ensure students were prepared for the new school year by donating backpacks, school supplies, and a specialty printer to a school. In recognition of these efforts, GATX received the "Stand Up for Texas Public Schools" honor from the Texas Association of School Boards and Galena Park Independent School District.
SUSTAINABILITY
We are committed to growing our business in a sustainable and socially responsible manner, and we demonstrate our commitment through our programs and initiatives. A multi-functional team meets periodically to develop, assess, and prioritize topics that are important to our business and our stakeholders and to continually improve both the measurement and transparency of our disclosures and practices. The Governance Committee of GATX’s Board of Directors has primary oversight responsibility for our ongoing and developing sustainability efforts. We maintain a Sustainability page on our website (www.gatx.com) to highlight our environmental and social accomplishments and provide key performance data to our stakeholders. For example, in 2024, GATX received the Energy Efficiency Award from the ACC in recognition of the Colton, California facility's flare optimization project. Further, GRE and Trifleet both received the Gold rating from EcoVadis, a global provider of business sustainability ratings, placing them in the top 5 percent of all rated companies. GATX issues an annual Sustainability Accounting Standards Board ("SASB") report, which can be found on our website, that discloses metrics related to relevant sustainability factors. Nothing on our website shall be deemed incorporated by reference into this Form 10-K.
ENVIRONMENTAL MATTERS
Our operations, facilities, and properties are subject to extensive federal, state, local, and foreign environmental laws and regulations. These laws cover discharges to waters, air emissions, toxic substances, the generation, handling, storage, transportation, and disposal of waste and hazardous materials, and the investigation and remediation of contamination. These laws have the effect of increasing the cost and liability associated with leasing and operating assets, and violations can result in significant fines, penalties, or other liabilities. Environmental risks and compliance with applicable environmental laws and regulations are inherent in the use of rail and other transportation assets, which can involve transporting chemicals and other hazardous materials.
We are subject to, and may from time to time continue to be subject to, environmental cleanup and enforcement actions in the United States and in the foreign countries in which we operate. In particular, the federal Comprehensive Environmental Response, Compensation and Liability Act (“CERCLA”), also known as the Superfund law, generally imposes joint and several liability for investigation, cleanup, and enforcement costs on current and former owners and operators of a site, without regard to fault or the legality of the original conduct. Accordingly, we have been and may, in the future, be named as a potentially responsible party under CERCLA and other federal, state, local, and foreign laws or regulations for all or a portion of the costs to investigate and clean up sites at which certain contaminants may have been discharged or released by us, our current lessees, former owners or lessees of properties, or other third parties. Environmental remediation and other environmental costs are accrued when considered probable and amounts can be reasonably estimated. As of December 31, 2024, environmental costs were not material to our financial position, results of operations, or cash flows. For further discussion, see "Note 23. Legal Proceedings and Other Contingencies" in Part II, Item 8 of this Form 10-K.
We recognize that climate matters, including related regulatory action, have the potential to impact our leasing businesses and maintenance operations. GATX continues to evaluate and assess business, operational, and strategic risks associated with climate matters and reports on key environmental data. We publish Scope 1 and Scope 2 greenhouse gas emissions and continue to work on assessing our full value chain impacts on the environment in an effort to identify opportunities to reduce those impacts.
INFORMATION ABOUT OUR EXECUTIVE OFFICERS
The following information regarding our executive officers is included in Part I in lieu of inclusion in our definitive Proxy Statement:
| | | | | | | | | | | | | | |
Name | Offices Held | Position Held Since | | Age |
| Robert C. Lyons | President and Chief Executive Officer | 2022 | | 61 |
| Thomas A. Ellman | Executive Vice President and Chief Financial Officer | 2018 | | 56 |
| Brian L. Glassberg | Executive Vice President, General Counsel and Secretary | 2022 | | 50 |
| Kim Nero | Executive Vice President and Chief Human Resources Officer | 2021 | | 50 |
| Paul F. Titterton | Executive Vice President and President, Rail North America | 2022 | | 49 |
| Niyi A. Adedoyin | Senior Vice President and Chief Information Officer | 2016 | | 57 |
| Kevin J. Hillesland | Senior Vice President, Structured Finance | 2023 | | 61 |
| Christopher M. LaHurd | Senior Vice President, International | 2024 | | 42 |
| Jennifer M. McManus | Senior Vice President, Controller and Chief Accounting Officer | 2020 | | 45 |
| Geoffrey D. Phillips | Senior Vice President, Operations | 2023 | | 56 |
| John M. Sbragia | Senior Vice President, Engineering and Quality | 2023 | | 54 |
| Jennifer L. Van Aken | Senior Vice President, Treasurer and Chief Risk Officer | 2020 | | 50 |
| Jeffery R. Young | Senior Vice President and Chief Tax Officer | 2018 | | 62 |
| Robert A. Zmudka | Senior Vice President and Chief Commercial Officer | 2018 | | 57 |
•Mr. Lyons was elected President and Chief Executive Officer and as a director effective April 2022. Previously, Mr. Lyons served as Executive Vice President and President, Rail North America from 2018 to April 2022, Executive Vice President and Chief Financial Officer from 2012 to August 2018, Senior Vice President and Chief Financial Officer from 2007 to 2012, Vice President and Chief Financial Officer from 2004 to 2007, Vice President, Investor Relations from 2000 to 2004, Project Manager, Corporate Finance from 1998 to 2000, and Director of Investor Relations from 1996 to 1998. Mr. Lyons has served as a director of Packaging Corporation of America since 2011.
•Mr. Ellman was elected Executive Vice President and Chief Financial Officer effective August 2018. Previously, Mr. Ellman served as Executive Vice President and President, Rail North America from 2013 to August 2018, Senior Vice President and Chief Commercial Officer from 2011 to 2013, and Vice President and Chief Commercial Officer from 2006 to 2011. Prior to re-joining GATX in 2006, Mr. Ellman served as Senior Vice President and Chief Risk Officer and Senior Vice President, Asset Management of GE Equipment Services, Railcar Services and held various positions at GATX in the GATX Rail Finance Group.
•Mr. Glassberg was elected Executive Vice President, General Counsel and Secretary effective December 2022. Since joining GATX in October 2011, Mr. Glassberg has served in various leadership roles within the law department, including as Deputy General Counsel from April 2021 to November 2022 and Associate General Counsel from March 2015 to March 2021. Prior to joining GATX, Mr. Glassberg was an associate in the corporate department of the Washington, DC and Chicago, IL offices of Latham & Watkins, LLP.
•Ms. Nero was elected Executive Vice President and Chief Human Resources Officer effective May 2021. Prior to joining GATX, Ms. Nero served as Vice President, Human Resources at Ferrara Candy Company from May 2017 to April 2021. Prior to that, she held positions in sales and then went on to lead global human resources functions in the financial, pharmaceutical, consumer packaged goods, and manufacturing industries at Discover, EVRAZ, Eli Lilly, and SC Johnson Wax.
•Mr. Titterton was elected Executive Vice President and President, Rail North America effective April 2022. Previously, Mr. Titterton served as Senior Vice President and Chief Operating Officer, Rail North America from 2018 to April 2022, Senior Vice President and Chief Commercial Officer, Rail North America from 2015 to 2018, Vice President and Chief Commercial Officer from 2013 to 2015, Vice President and Group Executive, Fleet Management, Marketing and Government Affairs from 2011 to 2013, Vice President and Executive Director, Fleet Management from 2008 to 2011, and in a variety of positions of increasing responsibility since joining the company in 1997.
•Mr. Adedoyin was elected Senior Vice President and Chief Information Officer effective January 2016. Previously, Mr. Adedoyin served as Vice President and Chief Information Officer from 2013 to January 2016 and Senior Director, IT Strategy and Project Management Office from 2008 to 2013.
•Mr. Hillesland was elected Senior Vice President, Structured Finance, effective August 2023. Previously, Mr. Hillesland served as Vice President and Executive Director, Structured Finance from November 2017 to August 2023. Since joining GATX in 1994, Mr. Hillesland has held leadership positions with increasing responsibility across corporate finance, rail, portfolio investments, and structured finance.
•Mr. LaHurd was elected Senior Vice President, International, effective August 2024. Previously, Mr. LaHurd was Vice President, International Business Development from May 2017 to August 2024. Since joining GATX in 2008, Mr. LaHurd has held leadership positions with increasing responsibility across finance and international business development.
•Ms. McManus was elected Senior Vice President, Controller and Chief Accounting Officer effective January 2020. Previously Ms. McManus served as Senior Director, Investor Relations and Accounting Research, Policy & Planning since May 2017 and Director, Accounting Research, Policy & Planning from June 2015 to May 2017. Prior to joining GATX, Ms. McManus held various positions of increasing responsibility with Hyatt Hotels Corporation, Tribune Company, and in public accounting.
•Mr. Phillips was elected Senior Vice President, Operations, effective August 2023. Previously Mr. Phillips served as Vice President and Group Executive, Operations from April 2022 to August 2023 and as Vice President and Executive Director, North American Rail Services & Logistics from January 2016 to March 2022. Since joining GATX in 1996, Mr. Phillips has held leadership positions with increasing responsibility across finance, business development, customer experience, operations, and rail services and logistics.
•Mr. Sbragia was elected Senior Vice President, Engineering and Quality, effective August 2023. Previously, Mr. Sbragia served as Vice President and Group Executive, Engineering and Quality from April 2022 to August 2023 and as Vice President, Railcar Engineering & Quality Assurance from March 2012 to March 2022. Since joining GATX in 1998, Mr. Sbragia has held leadership positions in engineering and quality with increasing responsibility.
•Ms. Van Aken was elected Senior Vice President, Treasurer, and Chief Risk Officer effective September 2020. Previously Ms. Van Aken served as Vice President, Financial Planning & Analysis from 2019 to 2020, Senior Director, Financial Planning & Analysis from 2018 to 2019, Assistant Treasurer, Corporate Finance from 2016 to 2018, Director, Investment Risk Management from 2015 to 2016, Director, Investor Relations from 2010 to 2015, Director, Corporate Finance from 2009 to 2010, and Manager, Corporate Finance from 2006 to 2009. Prior to joining GATX, Ms. Van Aken held a number of positions of increasing responsibility in the financial services industry.
•Mr. Young was elected Senior Vice President and Chief Tax Officer effective August 2018. Previously, Mr. Young served as Vice President and Chief Tax Officer from 2015 to August 2018, Vice President of Tax from 2007 to 2015, and as Director of Tax from 2003 to 2007. Prior to joining GATX, Mr. Young spent twenty years in a variety of tax related positions of increasing responsibility in public accounting and the financial services industry.
•Mr. Zmudka was elected Senior Vice President and Chief Commercial Officer effective August 2018. Previously, Mr. Zmudka served as Vice President and Group Executive, North American Sales & Marketing from 2010 to August 2018, Vice President and Executive Director, Strategic Sales from 2007 to 2010, and Vice President, National Accounts from 2006 to 2007. Mr. Zmudka joined GATX in 1989 and worked in various sales and fleet portfolio roles before being promoted to Vice President, Regional Sales in 2001.
AVAILABLE INFORMATION
We make available free of charge at our website, www.gatx.com, our most recent annual report on Form 10-K, quarterly reports on Form 10-Q, current reports on Form 8-K, and any amendments to those reports filed or furnished pursuant to the Securities Exchange Act of 1934, as amended (the “1934 Act”), as soon as reasonably practicable after such reports are electronically filed with, or furnished to, the U.S. Securities and Exchange Commission (“SEC”). The SEC maintains a website that contains reports, proxy, and other information that we have filed with the SEC. The SEC website may be found at http://www.sec.gov. Charters for the Audit Committee, Compensation Committee and Governance Committee of the Board of Directors, the Corporate Governance Guidelines, the Code of Business Conduct and Ethics and the Code of Ethics for Senior Company Officers are posted under Governance in the Investor Relations section of our website, and are available in print upon request by any shareholder. Within the time period prescribed by SEC and New York Stock Exchange regulations, we will post on our website any amendment to the Code of Ethics for Senior Company Officers and the Code of Business Conduct and Ethics or any waivers thereof. The information on our website is not incorporated by reference into this report.
Item 1A. Risk Factors
Investors should consider the risk factors described below as well as other information contained in this filing or our other filings with the U.S. Securities and Exchange Commission before investing in our securities. If any of the events described in the risk factors below occur, our business, financial condition and results of operations could be materially adversely affected.
Business, Operational and Industry Risks
We depend on continued demand from our customers to lease or use our transportation assets and services at satisfactory rates. A significant decline in customer demand could negatively impact our business and financial performance.
Our profitability depends on our ability to lease assets at satisfactory rates and to re-lease assets upon lease expiration. Customer demand for our transportation assets and services can be adversely affected by various economic and other factors, including:
•Prolonged inflation or deflation;
•High interest rates;
•Weak macroeconomic conditions and world trade policies, including tariffs, embargoes and sanctions;
•Weak market conditions in our customers’ businesses;
•Adverse changes in the price of, or demand for, commodities;
•Changes in railroad operations, efficiency, safety, pricing and service offerings, including those related to “precision scheduled railroading” or labor strikes or shortages;
•Changes in, or disruptions to, supply chains;
•Availability of pipelines, trucks, and other alternative modes of transportation;
•Changes in conditions affecting the aviation industry, including geographic exposure, global conflict and customer concentrations; and
•Other operational or commercial needs or decisions of our customers.
Demand for our railcars and other transportation assets is dependent on the strength and growth of our customers’ businesses. Some of our customers operate in cyclical or fluctuating markets, such as the steel, energy, chemical, transportation, and construction industries, which are susceptible to macroeconomic downturns and may experience significant changes in demand over time. Weakness in certain sectors of the economy in the United States and other parts of the world may make it more difficult for us to lease our transportation assets or to lease them on profitable terms.
Adverse changes in commodity prices or reduced demand for commodities could reduce customer demand for various types of assets in our fleet. A significant decrease in the price of a commodity may cause producers of that commodity to reduce their production levels. A significant increase in the price of a commodity could cause our customers to switch to less expensive alternatives. In either case, these changes in customer behavior can reduce demand for the portions of our fleet that are used to transport the commodity. In addition, demand for transportation assets used to transport certain commodities, including ethanol and other renewable fuels, may be affected by government subsidies and mandates, which may be enacted, changed, or eliminated from time to time, while demand for transportation assets used to transport fossil fuels or that directly or indirectly require consumption of fossil fuels for operation may be affected by government policies and mandates with respect to climate matters and carbon emissions.
The availability and relative cost of alternative modes of transportation and changes in customer transportation preferences also could reduce demand for our assets. For example, technological innovations in the trucking industry and patterns in U.S. economic
growth that favor truck over rail could result in a modal shift away from rail and reduce customer demand for our rail assets. Demand for our other transportation assets and related services is also influenced by many of the factors discussed above. For example, aircraft spare engine leasing is influenced by airline and lessee profitability, patterns in global air travel, reliability and durability of engine types, world trade policies, widespread health crises, geopolitical tensions or conflict, technological advances, and price and other competitive factors. A significant decline in customer demand for our assets and services could adversely affect our financial performance.
In many cases, demand for our transportation assets also depends on our customers’ desire to lease, rather than buy, the assets. Tax and accounting considerations, interest rates, and operational flexibility, among other factors, may influence a customer’s decision to lease or buy assets. We have no control over these external considerations, and changes in these factors could negatively impact demand for our transportation assets held for lease.
A significant change in pricing and/or service offerings by North American railroads or poor operating conditions could reduce demand for our rail assets and negatively impact our financial performance.
Our North American rail asset leasing business is impacted by the operations of the railroads, particularly the largest rail systems known as the “Class I railroads”, most of which are operating under a philosophy known as “precision scheduled railroading” or “PSR”. If PSR results in substantial increases in train velocity or decreases in dwell time for rail assets, the resulting excess supply of railcars and/or locomotives may adversely impact the demand for our rail assets. Alternatively, if PSR results in increased pricing and/or reduced service frequency, decreased reliability, safety and/or quality, the value proposition of rail freight for shippers relative to alternative modes of transportation could be reduced. Apart from PSR, other factors such as adverse weather conditions, railroad mergers, labor strikes or shortages, poor service to shippers, other disruptions to railroad operations, and increases in rail traffic could result in slower transit times making rail transportation less attractive to shippers versus other modes of transport. Each of these cases could reduce demand for our rail assets and decreased fleet utilization due to modal shift away from rail, all of which could negatively impact revenue and our results of operations.
Competition could result in decreased profitability.
We operate in a highly competitive business environment. In certain cases, our competitors are larger than we are and have greater financial resources, higher credit ratings, and a lower cost of capital, while some of our competitors manufacture railcars for their own leasing businesses. These factors may enable our competitors to offer leases or services to customers at lower rates than we can provide, thus negatively impacting our profitability, asset utilization, and investment volume. In addition, decreasing interest rates may invite new competition.
A significant decrease in lease renewals of our transportation assets by our customers or a significant increase in the number of compliance-based maintenance events could negatively impact operations and substantially increase our costs.
Decreases in customer demand for our transportation assets could increase the number of leases that are not renewed upon expiration, resulting in the return of such assets by our customers. Returned transportation assets often must undergo maintenance and service work before being leased to new customers. A significant increase in the number of leased assets requiring maintenance may negatively affect our operations and substantially increase maintenance and other related costs.
We also perform a variety of government or industry-mandated maintenance programs on our fleet of transportation assets. These compliance programs are cyclical in nature, and as a result, we can face significant increases in the number of maintenance events in any given year. A significant increase in maintenance events or severe constraints in the repair networks may negatively impact our operations and substantially increase maintenance and other related costs as a result of increased volume or the need to utilize higher cost third party maintenance providers. In addition, while we rely on third party maintenance providers to assist with these compliance procedures for our transportation assets, high demand faced by these providers from other asset owners may constrain our access to the providers or may substantially increase our costs.
Events that negatively affect certain assets, customers, or geographic regions could have a negative impact on our results of operations.
We generally derive our revenues from a variety of asset types, customers, industries, and geographic locations. However, from time to time we could have a large investment in a particular asset type, a large revenue stream associated with a particular customer or industry, or a large number of customers located in a particular geographic region. Decreased demand from a discrete event impacting a specific asset type, customer, industry, or region in which we have a concentrated exposure could negatively impact our results of operations.
Our long-term railcar purchase commitments could subject us to material operational and financial risks.
Unlike some of our competitors in the railcar leasing market, we do not manufacture railcars. In order to obtain committed access to a supply of newly built railcars on competitive terms, we periodically enter into long-term supply agreements with manufacturers to purchase significant numbers of newly built railcars over a multi-year period. Some of these agreements may provide for flexibility in the pricing, timing, and quantity of our purchasing commitments, while other agreements may provide no such flexibility. Therefore, if economic conditions weaken during the term of a long-term supply agreement, it is possible that we may be required to continue to accept delivery of, and pay for, new railcars at times when it may be difficult for us to lease such railcars at reasonable rates, or at all. Furthermore, we may be required to take delivery of railcars at points when our financing costs may be high. These factors could negatively affect our revenues and profitability. In addition, if tariffs, labor interruptions or shortages, trade disputes, commodity prices, geopolitical tensions, inflation, supply chain disruptions, or other factors lead to higher prices for steel or other raw materials used to manufacture railcars or components utilized in such railcars, we may be required to pay higher prices to purchase new railcars, which could adversely affect our ability to profitably lease those railcars to customers.
Soft market conditions and declines in asset values may reduce opportunities for us to generate remarketing income.
We utilize our extensive knowledge and experience to remarket transportation assets in order to optimize the composition of our fleets, and these activities generate income that contributes significantly to segment profit. Reduced demand for our assets could reduce opportunities for us to generate remarketing income. A significant or prolonged decline in the secondary market for our assets could adversely affect our financial performance.
We may not be able to successfully consummate and manage ongoing acquisition and divestiture activities, which could have an adverse impact on our financial statements.
From time to time, we may acquire other businesses and, based on an evaluation of our business portfolio, divest existing businesses. These transactions may present financial, managerial, and operational challenges, including diversion of management attention from existing businesses, difficulty with integrating or separating personnel and financial and other systems, increased expenses and costs, assumption of liabilities and indemnities, increased compliance risks, and potential disputes with the buyers or sellers or third parties. In addition, we may be required to incur asset impairment charges (including charges related to goodwill and other intangible assets) in connection with acquired businesses, which may reduce our profitability. If we are unable to consummate such transactions, we will not receive the expected benefits, and alternative favorable opportunities to invest or divest may not be available to us. If we cannot successfully integrate and grow acquisitions and achieve contemplated revenue synergies and cost savings, or are unable to complete a divestiture, our financial results could be adversely affected.
We rely on Rolls-Royce in connection with our aircraft spare engine leasing businesses, and certain factors that adversely affect Rolls-Royce could have an adverse effect on those businesses.
GATX and Rolls-Royce plc. (“Rolls-Royce”) each own 50% of domestic and foreign joint venture entities (collectively, the “RRPF affiliates” or “RRPF”) that own and lease aircraft spare engines to Rolls-Royce and owners and operators of commercial aircraft. In addition, GATX directly invests in aircraft spare engines through its wholly owned subsidiary, GATX Engine Leasing Ltd. (“GEL”), and places some of these engines on long-term leases with airline operators, with RRPF serving as the asset manager. For other engines, GEL also provides Rolls-Royce with access to aircraft spare engine capacity to support Rolls-Royce’s engine maintenance program for its customers. Rolls-Royce is therefore a major customer of the RRPF affiliates and of GEL, as well as a critical supplier of aircraft spare engines and commercial, technical, and maintenance services to GATX and the RRPF affiliates. A deterioration in (1) the performance of services provided by Rolls-Royce or RRPF, or (2) the durability and reliability of the engines, or (3) the financial condition, creditworthiness or liquidity of Rolls-Royce or RRPF could negatively impact GATX’s financial performance or, in the case of GEL, its operational performance.
Our transportation assets may become obsolete.
In addition to changes in laws, rules, and regulations that may make transportation assets obsolete, changes in the preferred method our customers use to ship their products, changes in demand for particular products, or a shift by customers toward purchasing assets rather than leasing them may adversely impact us. Our customers’ industries are driven by dynamic market forces and trends, which are influenced by economic and political factors. Changes in our customers' markets may significantly affect demand for our transportation assets.
Risks related to our international operations and expansion into new geographic markets could adversely affect our business, financial condition, and operating results.
We generate a significant amount of our net income outside the United States. In recent years, we have increased our focus on international growth and expansion into select emerging markets as a means to grow and diversify earnings.
Our foreign operations and international expansion strategy are subject to the following risks associated with international operations:
•Unforeseen developments and conditions, including terrorism, war, and international tensions and conflicts;
•Supply chain disruptions;
•Imposition of additional or new tariffs, quotas, trade barriers, embargoes, regulations, and similar restrictions on operations outside the United States;
•Inability to access railcar, tank container or component supply;
•Imposition of sanctions against countries where we operate or specific companies or individuals with whom we do business, or retaliatory sanctions by such countries on companies in the U.S. or in other countries in which we operate;
•Nationalization or confiscation of assets by foreign governments;
•Inflation or deflation;
•Fluctuations in currency values;
•Sudden changes in foreign currency exchange controls;
•Noncompliance with U.S. laws affecting operations outside of the United States, such as the Foreign Corrupt Practices Act;
•Noncompliance with a variety of foreign laws and regulations;
•Failure to properly implement changes in tax laws and the interpretation of those laws;
•Failure to develop and maintain data management practices that comply with laws related to cybersecurity, privacy, artificial intelligence, data localization, and data protection;
•Discriminatory or conflicting fiscal or trade policies;
•Difficulties enforcing contractual rights or foreclosing to obtain the return of our assets in certain jurisdictions;
•Uncollectible accounts and longer collection cycles that may be more prevalent in foreign countries; and
•Ineffective or delayed implementation of appropriate controls, policies, and processes across our diverse operations and employee base.
Many of our employees are represented by unions, and failure to successfully negotiate collective bargaining agreements may result in strikes, work stoppages, or substantially higher labor costs.
A significant portion of our employees are represented by labor unions and work under collective bargaining agreements that cover a range of workplace matters, such as wages, health and welfare benefits, and work rules. If we fail to negotiate acceptable labor agreements, our business could be disrupted by strikes or lockouts. We could also incur increased operating costs due to higher wages or benefits paid to union workers. Business disruptions or higher operating costs could both have an adverse effect on our financial position, results of operations, or cash flows.
We operate in a challenging market for talent, and our failure to attract, retain and motivate qualified personnel, including key management personnel, could adversely impact our ability to execute our strategy.
Our success depends on the strength of our workforce (many of whom are longstanding GATX employees) and therefore on our ability to attract, develop, engage and retain employee talent, including successors to members of senior management. Achieving this objective may be difficult due to many factors, including fluctuations in global economic and industry conditions, competitors’ hiring practices and the effectiveness of our compensation programs. The market for both hourly and professional employees has been, and remains, very competitive. Difficulties in recruiting and motivating qualified personnel, including skilled labor, the unexpected loss of such individuals resulting in the depletion of our institutional knowledge base, or our inability to successfully transition key roles could hinder our ability to execute our strategy and adversely impact our business and results of operations.
Information Technology Risks
We rely on technology in all aspects of our business operations. If we are unable to adequately maintain and secure our information technology (“IT”) infrastructure from cybersecurity threats and related disruptions, our business could be negatively impacted.
We rely on our IT Infrastructure (defined below) in all aspects of our business operations. We own and manage certain aspects of our IT infrastructure, but we also rely on third parties for a range of IT systems and related products and services, including but not limited to, cloud computing services (such third-party systems and our IT infrastructure, collectively, our “IT Infrastructure”). We and certain of our third-party providers collect, maintain and process data about customers, employees, business partners and others, including personally identifiable information, as well as confidential and proprietary information belonging to our business, including trade secrets (such data and information, collectively, “Confidential Information”). We face numerous and evolving cybersecurity risks that threaten the confidentiality, integrity and availability of our IT Infrastructure and Confidential Information. These risks have continued to increase in recent years in their frequency and levels of sophistication and intensity by sophisticated and organized groups and individuals with a wide range of motives and expertise. The implementation of remote and hybrid work options for our employees and employees of our third-party IT suppliers has led to a substantial increase in remote access to our networks and systems. All IT systems are vulnerable to cybersecurity threats and other unlawful attempts to disrupt or gain access to these systems, and these vulnerabilities may be increased by remote computing assets and additional security vulnerabilities that are present in many public, non-corporate and home networks. We and our third-party providers are regularly subject to attempted cyber intrusions, hacks and ransomware attacks, and we expect these incidents to accelerate and become increasingly sophisticated in using techniques and tools, including artificial intelligence, that circumvent security controls, evade detection and remove forensic evidence. While we have invested significant expense and effort in the protection of our Confidential Information and IT Infrastructure, the steps we have taken to mitigate these risks may not be effective to prevent breaches of our IT Infrastructure. Breaches of our IT Infrastructure could lead to disruptions in our business, potentially including the theft, destruction, loss, misappropriation, or release of Confidential Information stored on our IT Infrastructure and subject us to potential lawsuits, including class actions, other material legal liabilities, reputational damage, lost customers or significant costs associated with incident response, system restoration or remediation, applicable filings and notifications, and future compliance. These disruptions could adversely affect our operations, financial position, and results of operations. There can be no assurance that our cybersecurity risk management program and processes, including our policies, controls, or procedures, will be fully implemented, complied with, or effective in protecting our systems and information. While we maintain insurance to mitigate our exposure to these risks, our insurance policies, which carry retention and coverage limits, may not be adequate to reimburse us for losses caused by security breaches or other cybersecurity events, and we cannot guarantee that applicable insurance will be available to us in the future on economically reasonable terms or at all.
We also are subject to an evolving body of federal, state and foreign laws, regulations, guidelines and principles regarding data privacy, data protection, data security, and artificial intelligence. Many jurisdictions in which we conduct business have passed or proposed laws and regulations dealing with the collection, processing, storage, transfer and/or use of personal information, some of which include potential fines and penalties based on worldwide revenue. We could incur substantial costs related to ongoing compliance with, and substantial penalties or litigation or reputational damage related to violations of, such laws and regulations.
Legal and Regulatory Risks
We have been, and may continue to be, involved in various types of litigation, including claims for personal injury, property damage, environmental damage, and other claims arising from an accident involving our railcars or other transportation assets.
The nature of our business and assets potentially exposes us to significant personal injury and property damage claims and litigation, environmental claims, or other types of lawsuits inside and outside the U.S. For example, some of our customers use certain types of our transportation assets to transport flammable liquids and other hazardous materials, and an accident involving such transportation assets could lead to litigation and subject us to significant liability. Similarly, if we fail to meet our obligations to maintain our assets in compliance with governmental regulations and industry rules, we could be subject to fines, penalties, and claims for such failure as well as any resulting personal injury or property damage. In some jurisdictions, an accident can give rise to both civil and criminal liabilities for us and, in some cases, our employees. In the event of an unfavorable outcome, we could be subject to substantial penalties or monetary damages, including criminal penalties and fines, and our employees who are named as criminal defendants in any such litigation may be subject to incarceration and fines. A substantial adverse judgment against us could have a material effect on our financial position, results of operations, cash flows, and reputation.
Our transportation assets and operations are subject to various laws, rules, and regulations. If these laws, rules, and regulations change or we fail to comply with them, it could have a significant negative effect on our business and profitability.
Our fleets of transportation assets and related operations are subject to various U.S. and non-U.S. laws, rules, and regulations administered by authorities in jurisdictions where we do business, including the Association of American Railroads. Such laws, rules, and regulations could be changed in ways that would require us to modify our business models and objectives, impose requirements for additional maintenance or substantial modification or refurbishment of our assets, or otherwise affect our returns on investments by restricting existing activities and products, subjecting them to escalating costs or prohibiting them outright. Violations of these laws, rules, and regulations can result in substantial fines and penalties, including potential limitations on operations or forfeiture of assets, and reputational damage.
We are subject to extensive environmental regulations and the costs of remediation may be material.
We are subject to extensive federal, foreign, state, and local environmental laws and regulations concerning, among other things, the discharge of hazardous materials and remediation of contaminated sites. In addition, some of our properties, including those previously owned or leased, have been used for industrial purposes, which may have resulted in discharges onto these properties. Environmental liability can extend to previously owned or operated properties in addition to properties we currently own or use. Additionally, we could incur substantial costs, including cleanup costs, fines, and costs arising out of third-party claims for property or natural resource damage and personal injury as a result of violations of or liabilities under environmental laws and regulations in connection with our or our lessees’ current or historical operations. Under some environmental laws in the United States and certain other countries, the owner of a leased asset may be liable for environmental damage, cleanup or other costs in the event of a spill or discharge of material from such asset without regard to the owner’s fault. Governments or regulators may change the legislative or regulatory frameworks within which we operate, including environmental laws and regulations, without providing us any recourse to address any adverse effects such changes may have on our business. Due to the regulatory complexities, risk of unidentified contaminants on our properties, and the potential liability for our operations as well as those of our lessees, it is possible environmental and remediation costs may be materially greater than the costs we have estimated.
We may be affected by climate matters or market or regulatory responses to climate matters.
Regulatory focus on climate matters and greenhouse gas (“GHG”) emissions has increased across the globe. New government regulations could increase our operating costs and compliance with those regulations could be costly. New disclosure rules and regulations related to climate matters and mitigation efforts, such as the Corporate Sustainability Reporting Directive and related European Sustainability Reporting Standards in the European Union and climate disclosure laws and regulations in California, will require us to design and implement additional internal and disclosure controls. If the cost of such controls is significant, it could adversely affect our financial condition and result of operations. Moreover, failure of such controls to provide accurate and complete information could result in violation of such rules or regulations, which could have a material effect on our financial position, results of operations, cash flows, and reputation.
Climate matters may also pose regulatory and environmental risks that could harm our results of operations and affect the way we conduct business. Severe weather, climate matters, and natural disasters, such as tornadoes, flooding, hurricanes, fires and earthquakes, could cause significant business interruptions and result in increased costs and liabilities and decreased revenues. We are subject to the risks associated with natural disasters and the physical effects of climate matters, which may increase in frequency and severity over time and may have a material adverse effect on our assets, operations and business. In addition, changes in laws, rules, and regulations, or actions by authorities or other third parties to address GHG and climate matters could negatively impact our customers and business. For example, restrictions on GHG emissions could significantly increase costs for our customers whose production processes require significant amounts of energy, which could reduce demand for the lease of our assets, while rail and other transportation assets in our fleet that are used to carry fossil fuels, such as coal and petroleum, or that directly or indirectly require fossil fuel consumption for operation of the assets could see reduced demand or be rendered obsolete depending on the extent to which government regulations mandate a reduction in fossil fuel consumption or customer preferences change. Any of these factors, individually or in operation with one or more of the other factors, or other unforeseen impacts of climate matters, could reduce the demand for and value of our assets, and could have an adverse effect on our financial position, results of operations, and cash flows.
Economic and Credit Risks
United States and global political conditions and increased geopolitical tension, civil unrest and armed conflict could adversely affect our business, financial condition and results of operations.
We may be adversely affected by national and international political developments, instability, and uncertainties, including political unrest and threats of terrorist attacks or war, which could lead to the following:
•Legislation or regulatory action directed toward improving the security of transportation assets against acts of terrorism, which could affect the construction or operation of transportation assets and increase costs;
•A decrease in demand for transportation assets and services;
•Lower utilization of transportation equipment;
•Lower transportation asset lease rates;
•Impairments and loss of transportation assets;
•Supply chain challenges and disruptions;
•Capital market disruption, which may raise our financing costs or limit our access to capital;
•Trade wars and imposition of new and retaliatory tariffs;
•Liability or losses resulting from acts of terrorism involving our assets;
•Increased risk of cybersecurity attacks;
•Higher insurance costs, reduced coverage amounts or limited access to insurance; and
•A significant deterioration of global growth, and related decreases in confidence or investment activity in the global markets, arising from political or economic tensions, changes, and trends and/or an increase in trade conflict and protectionism.
Depending upon the severity, scope, and duration of these circumstances, the impact on our business, financial position, results of operations, and cash flows could be material.
Geopolitical conflicts can also result in the imposition of economic and trade sanctions and countermeasures, and our business must be conducted in compliance with applicable economic and trade sanctions laws and regulations, including those administered and enforced by the U.S. Department of Treasury’s Office of Foreign Assets Control, the U.S. Department of State, the U.S. Department of Commerce, the United Nations Security Council and other relevant governmental authorities. Failure to comply with the sanctions, laws and regulations could result in monetary fines or other penalties, which could have an adverse impact on our reputation, business, financial condition and results of operations.
Prolonged inflation, as well as interest rate increases, or deflation could have an adverse impact on our business and financial results.
The timing and duration of the effects of inflation are unpredictable and depend on market conditions, the magnitude of the inflation and other economic factors. While inflation in lease rates as well as inflation in residual values for rail and other transportation assets may benefit our financial results, prolonged inflation could result in reduced demand for our transportation assets. Moreover, any benefits may be offset by increases in the costs for goods and services we purchase, including salaries and wages, health care costs, supplies, utilities, maintenance and repair services, transportation assets or components thereof, and materials, as well as increased financing costs. Significant increases in our cost of goods and services could adversely impact our financial performance. Conversely, a period of prolonged deflation could negatively impact our lease rate pricing, residual values, and asset remarketing opportunities. These negative impacts of deflation may be offset by decreases to our costs for goods and services, including those listed above.
As noted below, rising interest rates could increase our borrowing costs, potentially decreasing our profitability. In addition, increased borrowing costs faced by our customers could also result in decreased demand for our transportation assets and services and have a dampening effect on overall economic activity, which could have a negative impact on our business and results of operations.
Fluctuations in foreign exchange rates could negatively impact our results of operations.
Upon consolidation, we translate the financial results of certain subsidiaries from their local currency to the U.S. dollar, which exposes us to foreign exchange rate fluctuations. As exchange rates vary, the translated operating results of foreign subsidiaries may differ materially from period to period. We also have gains and losses on foreign currency transactions, which could vary based on fluctuations in exchange rates and the timing of the transactions and their settlement. In addition, fluctuations in foreign exchange rates can affect the demand and price for services we provide both domestically and internationally, and could negatively impact our results of operations. We may seek to limit our exposure to foreign exchange rate risk with currency derivatives, which may or may not be effective. A material and unexpected change in foreign exchange rates could negatively affect our financial performance.
Deterioration of conditions in the global capital markets, or negative changes in our credit ratings or increased interest rates may limit our ability to obtain financing and may increase our borrowing costs.
We rely largely on the capital markets and banks to fund our operations and contractual commitments. Typical funding sources include public debt issuances, bank term loans, private placement loans, commercial paper, and a variety of other unsecured and secured financing structures. These markets can experience high levels of volatility and access to capital can be limited for an extended period of time. In addition to conditions in the capital markets, negative changes in our financial performance or credit ratings or ratings outlook, as determined by rating agencies such as Standard & Poor’s, Moody’s Investors Service, and Fitch Ratings, Inc., or continuing increased interest rates could cause us to incur increased borrowing costs or to have greater difficulty accessing public and private markets for secured and unsecured debt. Financial and market dynamics and volatility may heighten these risks. If we are unable to obtain financing on acceptable terms, our other sources of funds, including available cash, bank facilities, cash flow from operations, and portfolio proceeds, may not be adequate to fund our operations and contractual commitments.
Risks Related to our Common Stock
There can be no assurance that we will continue to pay dividends or repurchase shares of our common stock at current levels.
The timing, amount and payment of future dividends to shareholders and repurchases of our common stock fall within the discretion of our Board of Directors (the “Board”). The Board’s decisions regarding the payment of dividends and repurchase of shares depend on many factors such as our financial condition, earnings, capital requirements, debt service obligations, legal requirements, regulatory constraints, and other factors that our Board may deem relevant. We cannot guarantee that we will continue to pay dividends or repurchase shares in the future, and our payment of dividends and repurchase of shares could vary from historical practices and our stated expectations.
A small number of shareholders could significantly influence our business.
As of the most recent public filings, six shareholders collectively control more than 60% of our outstanding common stock. Accordingly, a small number of shareholders could affect matters that require shareholder approval, such as the election of directors and the approval of significant business transactions.
General Risk Factors
We may not be able to obtain cost-effective insurance.
We manage our exposure to risk, in part, by purchasing insurance. There is no guarantee that cost-effective insurance will consistently be available. If insurance coverage becomes prohibitively expensive or unavailable, we could be forced to reduce our coverage amount and increase the amount of self-insured risk we retain, thereby increasing our exposure to uninsured adverse judgments and other losses and liabilities that could have a material effect on our financial position, results of operations, and cash flows.
Changes to assumptions used to calculate post-retirement costs, increases in funding requirements, and investment losses in pension funds could adversely affect our results of operations.
We calculate our pension and other post-retirement costs using various assumptions, such as discount rates, long-term return on plan assets, salary increases, health care cost trend rates, and other factors. Changes to any of these assumptions could adversely affect our financial position and results of operations. Periods of low interest rates reduce the discount rate we use to calculate our funding obligations, which may increase our funding requirements. Additionally, changes to laws, regulations, or rules could require us to increase funding requirements or to compensate for investment losses in pension plan assets. If we were forced to increase contributions to our pension plans, our financial position, results of operations, and cash flows could be negatively affected.
Changes in the mix of earnings in the U.S. and foreign countries and in tax rates and laws could adversely affect our financial results.
As a global company, we are subject to taxation in the U.S. and numerous other non-U.S. jurisdictions. Significant judgment is required to determine our consolidated income tax position and related liabilities. Our effective tax rate, cash flows and operating results could be affected by changes in the mix of earnings in countries with different statutory tax rates, or material audit assessments, as well as by changes in the local tax laws, regulations and treaties, or the interpretations thereof.
Our allowance for losses may be inadequate.
Our allowance for losses on reservable assets may not be adequate to cover credit losses in our portfolio if unexpected adverse changes occur in macroeconomic conditions or if discrete events adversely affect specific customers, industries, or markets. If the credit quality of our customer base materially deteriorates, it may require us to incur additional credit losses and our financial position or results of operations could be negatively impacted.
We may incur future asset impairment charges.
We review long-lived assets and joint venture investments for impairment annually, or when circumstances indicate the carrying value of an asset or investment may not be recoverable. Among other circumstances, the following may change our estimates of the cash flows we expect our long-lived assets or joint venture investments will generate, which could require us to recognize asset impairment charges:
•A weak economic environment or challenging market conditions;
•New laws, rules or regulations affecting our assets or the commodities that they carry, or changes to existing laws, rules or regulations;
•Events related to particular customers or asset types or geographic markets; and
•Asset or portfolio sale decisions by management.
The fair market value of our long-lived assets may differ from the value of those assets reflected in our financial statements.
Our assets primarily consist of long-lived transportation assets such as rail assets, aircraft spare engines and tank containers. The carrying value of these assets on our financial statements may sometimes differ from their fair market value. These valuation differences may be positive or negative and could be material based on market conditions and demand for certain assets.
Our internal control over financial accounting and reporting may not detect all errors or omissions in the financial statements.
If we fail to maintain adequate internal controls over financial accounting, we may not be able to conclude on an ongoing basis that we have effective internal control over financial reporting in accordance with Section 404 of the Sarbanes-Oxley Act of 2002 and related regulations. No system of internal control provides absolute assurance that the financial statements are accurate and free of material error.
The occurrence of a widespread health crisis and measures taken in response could have an adverse impact on our operations, commercial activity, asset values, financial position or liquidity.
The occurrence of a widespread health crisis and governmental action or inaction taken in response thereto could cause or contribute to a slowdown in economic activity, disruptions in global supply chains, a dramatic reduction in air travel, and volatility and disruption of financial markets. Such a crisis could also result in operational and labor disruptions, employee attrition and difficulty securing future labor needs, as well as impacts the broader employment market and supply chains, our suppliers, and our customers. These impacts could materially and adversely affect our business, costs, operations, financial performance, and liquidity, as well as our ability to successfully execute our business strategy.
Item 1B. Unresolved Staff Comments
None.
Item 1C. Cybersecurity
The Company’s Board of Directors (“Board”) recognizes the critical importance of maintaining the trust and confidence of our employees, customers, shareholders and other stakeholders. Among other areas of responsibility, the Board has oversight responsibilities in relation to the Company’s risk management program, and cybersecurity represents an important component of the Company’s overall approach to enterprise risk management (“ERM”). The Company’s cybersecurity policies and practices are integrated into the Company’s ERM program and our risk goals are guided by internationally recognized standards and frameworks that help us to identify, assess, and manage risks relevant to our business. In general, the Company manages our cybersecurity risk using an evidence- and risk-based approach designed to reduce risks and thereby protect the Company’s mission, business, and stakeholders, rather than focusing upon meeting any specific technical specifications.
Risk Management and Strategy
The Company’s cybersecurity program is focused on the following key areas:
•Governance: As discussed in more detail below, the Board’s oversight of cybersecurity risk management is supported by its Audit Committee, which interacts with the Company’s ERM function, the Company’s Senior Vice President and Chief Information Officer (“CIO”), the Global Head of IT Security, who reports directly to the CIO, and other relevant members of management.
•Collaborative Approach: We have implemented a cross-functional approach to identifying, mitigating, and managing cybersecurity risks, threats, and incidents through a broad range of controls and supporting processes.
•Technical Safeguards: We deploy various technical safeguards that are designed to protect the Company’s information systems and information from identified cybersecurity threats.
•Incident Response and Recovery Planning: We have established, and maintain, an incident response plan that addresses the Company’s planned responses to a potential or actual cybersecurity incident. This plan is periodically reviewed, tested, and evaluated. The incident response plan also includes consideration of disclosure requirements and communication to appropriate parties within the Company.
•Third-Party Risk Management: We take a risk-based approach to identifying the cybersecurity risks presented by third-party service providers and encourage our service providers to reduce cybersecurity risks using commercially available safeguards.
•Education and Awareness: We provide training for our employees regarding cybersecurity threats as a means to build awareness and equip them with effective tools to identify and address cybersecurity threats, as well as to communicate the Company’s evolving information security policies and practices.
We engage in the periodic assessment and testing of our cybersecurity policies and practices. These efforts include a range of activities focused on evaluating the effectiveness of our cybersecurity measures and planning. We engage third parties to perform assessments on various aspects of our cybersecurity measures, including information security maturity assessments, audits, and reviews of our information security control environment and operating effectiveness. The results of such assessments, audits, and reviews are reported to senior management and the Audit Committee, and we adjust our cybersecurity processes as necessary based on the information provided by these assessments, audits, and reviews.
We have not identified risks from known cybersecurity threats, including as a result of previous cybersecurity incidents, that have materially affected or are reasonably likely to materially affect the Company, including its operations, business strategy, results of operations, or financial condition.
Governance
Through its Audit Committee, the Board oversees the Company’s ERM program, including risks arising from cybersecurity threats. The Audit Committee receives periodic presentations and reports on cybersecurity risks addressing recent developments, evolving standards, third-party and independent reviews, the threat environment, technological trends, and information security considerations arising with respect to the Company’s peers and third parties. The Audit Committee also receives information regarding cybersecurity incidents impacting the Company that are deemed more significant under the cybersecurity incident response plan, as well as ongoing updates regarding any such incidents until they have been addressed. The Audit Committee discusses the Company’s approach to cybersecurity risk management with GATX senior management, including the CIO and the Global Head of IT Security, who reports to the CIO and has responsibility for assessing and managing material risks from cybersecurity threats.
A cybersecurity group within GATX’s IT department, led by the Global Head of IT Security, works collaboratively across the Company to administer a program designed to protect the Company’s information systems and information from cybersecurity threats and to execute processes in accordance with the Company’s incident response plan. To facilitate the Company’s cybersecurity risk management program, multidisciplinary teams are deployed to address cybersecurity threats and to respond to cybersecurity incidents. Through ongoing communications with these teams and the cybersecurity group, the Global Head of IT Security monitors the prevention, detection, mitigation, and remediation of cybersecurity threats and incidents and reports such threats and incidents to the Audit Committee when appropriate. The CIO has over 25 years of experience in information technology, including over 17 years managing the cybersecurity function and resources. The Global Head of IT Security has over 15 years of experience in information technology and information security, including 10 years of leadership roles within the information security domain, and holds certifications in cybersecurity and risk management.
Item 2. Properties
Information regarding the general character of our properties is included in Item 1, “Business” of this Form 10-K.
As of December 31, 2024, the locations of our operations were as follows:
| | | | | | | | |
| GATX Headquarters | |
| | |
| Chicago, Illinois | |
| | |
| Rail North America |
| | |
| Business Offices | Major Maintenance Facilities | Customer Site Locations |
| Chicago, Illinois | Colton, California | Clarkson, Ontario |
| Calgary, Alberta | Hearne, Texas | |
| Mexico City, Mexico | Waycross, Georgia | |
| Montreal, Quebec | |
| Moose Jaw, Saskatchewan | |
| | Red Deer, Alberta | |
| | |
| | |
| | Maintenance Facilities | |
| Terre Haute, Indiana | |
| | |
| Mobile Units | |
| Edmonton, Alberta | |
| La Porte, Texas | |
| | |
| Rail International |
| | |
| Business Offices | Major Maintenance Facilities | Customer Site Locations |
| Dordrecht, Netherlands | Ostróda, Poland | Płock, Poland |
| Baar, Switzerland | | |
| Düsseldorf, Germany | | |
| Hamburg, Germany | | |
| Gurgaon, India | | |
| Paris, France | | |
| Vienna, Austria | | |
| Warsaw, Poland | | |
| | |
| Engine Leasing | |
| | |
| Chicago, Illinois | |
| | |
| Other | |
| | |
| Dordrecht, Netherlands | |
| Houston, Texas | |
| Singapore | |
| Shanghai, China | |
Item 3. Legal Proceedings
Information concerning litigation and other contingencies is described in "Note 23. Legal Proceedings and Other Contingencies" in Part II, Item 8 of this Form 10-K and is incorporated herein by reference.
Item 4. Mine Safety Disclosures
None.
PART II
Item 5. Market for Registrant’s Common Equity, Related Stockholder Matters, and Issuer Purchases of Equity Securities
Our common stock is listed on the New York and Chicago Stock Exchanges under ticker symbol "GATX". We had approximately 1,272 common shareholders of record as of January 31, 2025. We have a long history of paying quarterly cash dividends. While we currently expect a cash dividend to be paid in the future, dividend payments will depend on our earnings, capital requirements, financial condition, and other factors considered by our Board of Directors.
Issuer Purchases of Equity Securities
On January 25, 2019, our board of directors approved a $300.0 million share repurchase program, pursuant to which we are authorized to purchase shares of our common stock in the open market, in privately negotiated transactions, or otherwise, including pursuant to Rule 10b5-1 plans. The share repurchase program does not have an expiration date, does not obligate the Company to repurchase any dollar amount or number of shares of common stock, and may be suspended or discontinued at any time. The timing of share repurchases will be dependent on market conditions and other factors.
During 2024, we repurchased 167,452 shares for $21.9 million under the share repurchase program. As of December 31, 2024, $65.1 million remained available under the repurchase authorization.
The following is a summary of common stock repurchases completed by month during the fourth quarter of 2024:
| | | | | | | | | | | | | | | | | | | | | | | | | | | | | | | | | | | | | | |
| Issuer Purchases of Equity Securities |
| Period | | Total Number of Shares Purchased | | Average Price Paid per Share | | Total Number of Shares Purchased as Part of Publicly Announced Program | | Approximate Dollar Value of Shares that May Yet Be Purchased Under the Program (in millions) |
| October 1, 2024 - October 31, 2024 | | 300 | | | $ | 136.95 | | | 300 | | | $ | 65.2 | |
| November 1, 2024 - November 30, 2024 | | 752 | | | $ | 149.92 | | | 752 | | | $ | 65.1 | |
| December 1, 2024 - December 31, 2024 | | — | | | $ | — | | | — | | | $ | 65.1 | |
| Total | | 1,052 | | | $ | 146.22 | | | 1,052 | | | |
Common Stock Performance Graph
The performance graph below compares the cumulative total shareholder return on our common stock for the five-year period ended December 31, 2024, with the cumulative total return of the S&P 500 Index, the S&P MidCap 400 Index, and the Russell 3000 Index. We are not aware of any peer companies whose businesses are directly comparable to ours and, therefore, the graph displays the returns of the indices noted above as those include companies with market capitalizations similar to ours. The graph and table assume that $100 was invested in our common stock and each of the indices on December 31, 2019, and that all dividends were reinvested.
| | | | | | | | | | | | | | | | | | | | | | | | | | | | | | | | | | | |
| 12/31/19 | | 12/31/20 | | 12/31/21 | | 12/31/22 | | 12/31/23 | | 12/31/24 |
| GATX | $ | 100.00 | | | $ | 103.22 | | | $ | 132.05 | | | $ | 137.55 | | | $ | 158.44 | | | $ | 207.68 | |
| S&P 500 | 100.00 | | | 118.39 | | | 152.34 | | | 124.73 | | | 157.48 | | | 196.85 | |
| S&P MidCap 400 | 100.00 | | | 113.65 | | | 141.76 | | | 123.19 | | | 143.38 | | | 163.30 | |
| Russell 3000 | 100.00 | | | 120.88 | | | 151.87 | | | 122.68 | | | 154.48 | | | 191.24 | |
Item 6. [Reserved]
Item 7. Management’s Discussion and Analysis of Financial Condition and Results of Operations
OVERVIEW
We lease, operate, manage, and remarket long-lived, widely used assets, primarily in the rail market. We report our financial results through three primary business segments: Rail North America, Rail International, and Engine Leasing (previously named Portfolio Management). Financial results for our tank container leasing business ("Trifleet") are reported in the Other segment.
In 2024, we changed the name of our Portfolio Management business segment to Engine Leasing to reflect the prospective operations of this business segment. Historically, this business segment included marine operations from our liquefied gas-carrying vessels (the "Specialized Gas Vessels"). As of December 31, 2023, we had sold all of our marine assets and no longer have any marine operations. The segment is now almost entirely composed of our engine leasing operations, which include our ownership interest in the Rolls-Royce & Partners Finance ("RRPF") affiliates, a group of joint ventures with Rolls-Royce plc (or affiliates thereof, collectively "Rolls-Royce") that lease aircraft spare engines, and GATX Engine Leasing ("GEL"), our business that directly owns aircraft spare engines that are leased to airline customers or employed in an engine capacity agreement.
In 2023, we sold our rail business in Russia ("Rail Russia"). See "Note 10. Asset Impairments and Assets Held for Sale" in Part II, Item 8 of this Form 10-K for further information.
In 2023, we sold the three remaining liquefied gas-carrying vessels (the "Specialized Gas Vessels") within the Engine Leasing segment. We sold two vessels in 2022.
The following discussion and analysis of our financial condition and results of operations should be read in conjunction with the audited financial statements included in "Item 8. Financial Statements and Supplementary Data" in this Form 10-K. We based the discussion and analysis that follows on financial data we derived from the financial statements prepared in accordance with U.S. generally accepted accounting principles ("GAAP") and on certain other financial data that we prepared using non-GAAP components. For a reconciliation of these non-GAAP measures to the most comparable GAAP measures, see “Non-GAAP Financial Measures” at the end of this item. This discussion does not include the comparison of prior year 2023 to 2022 financial results, which can be found in the Management's Discussion and Analysis of Financial Condition and Results of Operations in Part II, Item 7 of our Annual Report on Form 10-K for the year ended December 31, 2023, as filed with the SEC on February 16, 2024.
DISCUSSION OF OPERATING RESULTS
The following table shows a summary of our reporting segments and consolidated financial results for the years ended December 31 (dollars in millions, except per share data):
| | | | | | | | | | | | | | | | | |
| 2024 | | 2023 | | 2022 |
| Segment Revenues | | | | | |
| Rail North America | $ | 1,099.0 | | | $ | 982.7 | | | $ | 908.0 | |
| Rail International | 350.3 | | | 309.5 | | | 275.3 | |
| Engine Leasing | 97.1 | | | 77.2 | | | 53.6 | |
| Other | 39.1 | | | 41.5 | | | 36.1 | |
| $ | 1,585.5 | | | $ | 1,410.9 | | | $ | 1,273.0 | |
| Segment Profit (Loss) | | | | | |
| Rail North America | $ | 356.0 | | | $ | 307.3 | | | $ | 321.3 | |
| Rail International | 119.8 | | | 113.4 | | | 85.9 | |
| Engine Leasing | 117.3 | | | 106.4 | | | 14.7 | |
| Other | 12.9 | | | 29.2 | | | (3.9) | |
| | 606.0 | | | 556.3 | | | 418.0 | |
| Less: | | | | | |
| Selling, general and administrative expense | 236.3 | | | 212.7 | | | 195.0 | |
| Income taxes ($25.5, $25.7 and $12.3 related to affiliates' earnings) | 85.5 | | | 84.4 | | | 67.1 | |
| Net Income (GAAP) | $ | 284.2 | | | $ | 259.2 | | | $ | 155.9 | |
| | | | | |
| Net income, excluding tax adjustments and other items (non-GAAP) (1) | $ | 288.1 | | | $ | 257.6 | | | $ | 217.7 | |
| Diluted earnings per share (GAAP) | $ | 7.78 | | | $ | 7.12 | | | $ | 4.35 | |
| Diluted earnings per share, excluding tax adjustments and other items (non-GAAP) (1) | $ | 7.89 | | | $ | 7.07 | | | $ | 6.07 | |
| | | | | |
| Return on equity (GAAP) | 12.1 | % | | 12.0 | % | | 7.7 | % |
| Return on equity, excluding tax adjustments and other items (non-GAAP) (1) | 12.2 | % | | 12.0 | % | | 10.8 | % |
| | | | | |
| Investment Volume | $ | 1,674.4 | | | $ | 1,665.0 | | | $ | 1,255.8 | |
_________
(1) See "Non-GAAP Financial Measures" at the end of this item for further details.
2024 Summary
Net income was $284.2 million, or $7.78 per diluted share, for 2024 compared to $259.2 million, or $7.12 per diluted share, for 2023, and $155.9 million, or $4.35 per diluted share, for 2022. Results for 2024 included a net negative impact of $3.9 million ($0.11 per diluted share) from tax adjustments and other items, compared to a net positive impact of $1.6 million ($0.05 per diluted share) from tax adjustments and other items in 2023 and a net negative impact of $61.8 million ($1.72 per diluted share) from tax adjustments and other items in 2022 (see "Non-GAAP Financial Measures" at the end of this item for further details).
•At Rail North America, segment profit in 2024 was higher than prior year. The increase was primarily attributable to higher lease revenue, higher net gain on asset dispositions, and higher repair revenue, partially offset by higher interest and maintenance expense.
•At Rail International, segment profit in 2024 was higher than prior year, due to more railcars on lease and higher lease rates, partially offset by higher maintenance and interest expense.
•At Engine Leasing, segment profit in 2024 increased compared to prior year, a result of higher earnings at the RRPF affiliates, higher earnings from GEL operations, and the absence of impairments recorded in 2023 for the Specialized Gas Vessels, partially offset by the absence of the gain on the sale of natural gas holdings recorded in 2023.
•Within Other, Trifleet's segment profit decreased, largely due to lower lease revenue, resulting from lower utilization, as well as higher interest expense and higher bad debt expense resulting from a settlement and restructuring agreement with a customer in the current year.
Total investment volume was $1,674.4 million in 2024, compared to $1,665.0 million in 2023, and $1,255.8 million in 2022.
2025 Outlook
Conditions in the North American railcar leasing market remained strong in 2024, and we expect favorable conditions to continue in 2025. At Rail International, we expect favorable demand for our railcars in both our European and Indian businesses. The operating environment for our engine leasing businesses at RRPF and GEL is strong, as global air travel continues to recover to pre-pandemic levels and beyond. We have a strong balance sheet and adequate access to capital, which we believe positions us well to manage our transportation assets based on current market conditions.
•We expect Rail North America's segment profit in 2025 to increase slightly from 2024. Lease rates for railcars scheduled to renew in 2025 will likely be higher than expiring rates for most car types as the lease rate environment for existing railcars is expected to remain favorable. The increasing lease rates, along with new additions to the fleet, should generate higher lease revenue in 2025. We anticipate remarketing income to be slightly lower than 2024, but we continue to see a strong secondary market. We expect the impact of slightly higher regulatory compliance work, partially offset by a benefit from efficiencies in our owned maintenance network to result in modestly higher maintenance expense in 2025 compared to the prior year. Finally, we anticipate interest expense and depreciation to be higher in 2025 compared to 2024.
•Rail International's segment profit in 2025 is expected to increase from 2024, driven by continued growth of the fleet sizes in Europe and India. Demand for railcars in Europe should continue to be solid across most car types, and we plan to continue to invest in the fleet. Lease revenue is expected to be higher in 2025, resulting from more railcars on lease and higher lease rates. In India, we anticipate significant growth again in our fleet this coming year, which will also contribute to an increase in segment profit.
•We anticipate Engine Leasing's segment profit in 2025 to be higher than 2024. We expect an increase in segment profit from GEL as a result of additional aircraft spare engines acquired during 2024. In addition, RRPF results are expected to be higher as a result of continued improvement in global air travel.
Segment Operations
Segment profit is an internal performance measure reported to GATX's President and Chief Executive Officer for purposes of assessing performance and allocating capital and resources to each segment. Segment profit includes all revenues, expenses, pre-tax earnings from affiliates, and net gains on asset dispositions that are directly attributable to each segment. We allocate interest expense to the segments based on what we believe to be the appropriate risk-adjusted borrowing costs for each segment. Segment profit excludes selling, general and administrative expenses, income taxes, and certain other amounts not allocated to the segments.
RAIL NORTH AMERICA
Segment Summary
The railcar leasing environment was favorable as demand for existing railcars remained steady. Rail North America continued to extend lease renewal terms at attractive rates while maintaining high fleet utilization and a strong renewal success rate. Utilization of our non-boxcar fleet was 99.1% at the end of the year.
The following table shows Rail North America's segment results for the years ended December 31 (in millions):
| | | | | | | | | | | | | | | | | |
| 2024 | | 2023 | | 2022 |
| Revenues | | | | | |
| Lease revenue | $ | 983.5 | | | $ | 888.8 | | | $ | 826.0 | |
| Other revenue | 115.5 | | | 93.9 | | | 82.0 | |
| Total Revenues | 1,099.0 | | | 982.7 | | | 908.0 | |
| | | | | |
| Expenses | | | | | |
| Maintenance expense | 306.9 | | | 276.6 | | | 238.5 | |
| Depreciation expense | 271.1 | | | 265.9 | | | 258.6 | |
| Operating lease expense | 33.9 | | | 36.0 | | | 36.1 | |
| Other operating expense | 26.4 | | | 25.9 | | | 24.5 | |
| Total Expenses | 638.3 | | | 604.4 | | | 557.7 | |
| | | | | |
| Other Income (Expense) | | | | | |
| Net gain on asset dispositions | 132.8 | | | 120.5 | | | 119.7 | |
| Interest expense, net | (232.1) | | | (182.9) | | | (144.6) | |
| Other expense | (5.4) | | | (8.0) | | | (4.6) | |
| Share of affiliates' pre-tax (loss) earnings | — | | | (0.6) | | | 0.5 | |
| Segment Profit | $ | 356.0 | | | $ | 307.3 | | | $ | 321.3 | |
| | | | | |
| Investment Volume | $ | 1,162.4 | | | $ | 976.9 | | | $ | 815.9 | |
The following table shows the components of Rail North America's lease revenue for the years ended December 31 (in millions):
| | | | | | | | | | | | | | | | | |
| 2024 | | 2023 | | 2022 |
| Railcars | $ | 888.9 | | | $ | 805.5 | | | $ | 740.7 | |
| Boxcars | 64.7 | | | 57.2 | | | 59.5 | |
| Locomotives | 29.9 | | | 26.1 | | | 25.8 | |
| Total | $ | 983.5 | | | $ | 888.8 | | | $ | 826.0 | |
Rail North America Fleet Data
The following table shows fleet activity and statistics for Rail North America railcars, excluding boxcars, for the years ended December 31:
| | | | | | | | | | | | | | | | | |
| 2024 | | 2023 | | 2022 |
| Beginning balance | 101,167 | | | 100,954 | | | 101,570 | |
| Railcars added | 5,359 | | | 4,653 | | | 3,712 | |
| Railcars scrapped | (1,433) | | | (1,286) | | | (2,133) | |
| Railcars sold | (2,127) | | | (3,154) | | | (2,195) | |
| Ending balance | 102,966 | | | 101,167 | | | 100,954 | |
| Utilization rate at year end (1) | 99.1 | % | | 99.3 | % | | 99.5 | % |
| Renewal success rate (2) | 85.3 | % | | 84.1 | % | | 85.5 | % |
| Active railcars at year end (3) | 102,003 | | | 100,498 | | | 100,396 | |
| Average active railcars (4) | 101,392 | | | 100,217 | | | 100,444 | |
_______
(1) Utilization is calculated as the number of railcars on lease as a percentage of total railcars in the fleet.
(2) The renewal success rate represents the percentage of railcars on expiring leases that were renewed with the existing lessee. The renewal success rate is an important metric because railcars returned by our customers may remain idle or incur additional maintenance and freight costs prior to being leased to new customers.
(3) Active railcars refers to the number of railcars on lease to customers. Changes in railcars on lease compared to prior years are impacted by the utilization of new railcars purchased from builders or in the secondary market and the disposition of railcars that were sold or scrapped, as well as the fleet utilization rate.
(4) Average active railcars for the year is calculated using the number of active railcars at the end of each month.
As of December 31, 2024, leases for approximately 21,500 tank and freight cars and approximately 1,200 boxcars are scheduled to expire in 2025. These amounts exclude railcars on leases expiring in 2025 that have already been renewed or assigned to a new lessee.
In 2022, we entered into a long-term railcar supply agreement with a subsidiary of Trinity Industries, Inc. ("Trinity") to purchase 15,000 newly built railcars through 2028, with an option to order up to an additional 500 railcars each year from 2023 to 2028. The agreement enables us to order a broad mix of tank and freight cars. Trinity is scheduled to deliver 6,000 tank cars (1,200 per year) from 2024 through 2028. The remaining 9,000 railcars, which can be a mix of freight and tank cars, are expected to be ordered at a rate of 1,500 railcars per order year from 2023 to 2028 and delivered under a schedule to be determined. At December 31, 2024, 5,392 railcars have been ordered pursuant to the terms of the agreement, of which 3,458 have been delivered.
Lease Price Index
Our Lease Price Index ("LPI") is an internally-generated business indicator that measures renewal activity for our North American railcar fleet, excluding boxcars. The LPI calculation includes all renewal activity based on a 12-month trailing average, and the renewals are weighted by the count of all renewals over the 12-month period. The average renewal lease rate change is reported as the percentage change between the average renewal lease rate and the average expiring lease rate. The average renewal lease term is reported in months and reflects the average renewal lease term in the LPI.
During 2024, the renewal rate change of the LPI was positive 26.7%, compared to positive 33.5% in 2023. Lease terms on renewals for railcars in the LPI averaged 60 months in 2024 compared to 65 months in 2023.
The following table shows fleet activity and statistics for Rail North America boxcars for the years ended December 31:
| | | | | | | | | | | | | | | | | |
| 2024 | | 2023 | | 2022 |
| Beginning balance | 9,311 | | | 8,663 | | | 12,946 | |
| Boxcars added | 587 | | | 1,248 | | | 543 | |
| Boxcars scrapped | (1,343) | | | (459) | | | (230) | |
| Boxcars sold | (160) | | | (141) | | | (4,596) | |
| Ending balance | 8,395 | | | 9,311 | | | 8,663 | |
| Utilization rate at year end (1) | 99.8 | % | | 100.0 | % | | 99.9 | % |
| Active boxcars at year end (2) | 8,376 | | | 9,310 | | | 8,657 | |
| Average active boxcars (3) | 9,059 | | | 8,944 | | | 10,060 | |
_______
(1) Utilization is calculated as the number of boxcars on lease as a percentage of total boxcars in the fleet.
(2) Active boxcars refers to the number of boxcars on lease to customers. Changes in boxcars on lease compared to prior years are impacted by the utilization of new boxcars purchased from builders or in the secondary market and the disposition of boxcars that were sold or scrapped, as well as the fleet utilization rate.
(3) Average active boxcars for the year is calculated using the number of active boxcars at the end of each month.
The following table shows fleet activity and statistics for Rail North America locomotives for the years ended December 31:
| | | | | | | | | | | | | | | | | |
| 2024 | | 2023 | | 2022 |
| Beginning balance | 523 | | | 544 | | | 577 | |
| Locomotives added | 156 | | | — | | | — | |
| Locomotives scrapped or sold | (18) | | | (21) | | | (33) | |
| Ending balance | 661 | | | 523 | | | 544 | |
| Utilization rate at year end (1) | 89.1 | % | | 88.3 | % | | 89.3 | % |
| Active locomotives at year end (2) | 589 | | | 462 | | | 486 | |
| Average active locomotives (3) | 509 | | | 472 | | | 496 | |
_______
(1) Utilization is calculated as the number of locomotives on lease as a percentage of total locomotives in the fleet.
(2) Active locomotives refers to the number of locomotives on lease to customers. Changes in locomotives on lease compared to prior years are impacted by locomotives that were sold or scrapped, as well as the fleet utilization rate.
(3) Average active locomotives for the year is calculated using the number of active locomotives at the end of each month.
Comparison of Reported Results
Segment Profit
In 2024, segment profit of $356.0 million increased 15.8% compared to $307.3 million in 2023. The increase was primarily due to higher lease revenue, higher net gain on asset dispositions, and higher repair revenue, partially offset by higher interest expense and higher maintenance expense. The amount and timing of disposition gains is dependent on a number of factors and may vary materially from year to year.
Revenues
In 2024, lease revenue increased $94.7 million, or 10.7%, driven by higher lease rates and more railcars on lease. Other revenue increased $21.6 million, primarily due to higher repair revenue.
Expenses
In 2024, maintenance expense increased $30.3 million, driven by higher costs of repairs, more regulatory compliance events, and more repairs performed by the railroads. Depreciation expense increased $5.2 million, due to the timing of new railcar investments and dispositions, partially offset by a change in the useful lives of certain railcars. Other operating expense increased $0.5 million, due to higher insurance and storage costs, partially offset by lower switching and freight costs.
Other Income (Expense)
In 2024, net gain on asset dispositions increased $12.3 million, driven by higher net gains on railcars sold and higher net scrapping gains. The amount and timing of disposition gains is dependent on a number of factors and may vary materially from year to year. Net interest expense increased $49.2 million, due to a higher average interest rate and a higher average debt balance. Other expense was favorable $2.6 million, driven by lower legal costs, partially offset by lower customer settlement proceeds received in 2024.
Investment Volume
During 2024, investment volume was $1,162.4 million compared to $976.9 million in 2023. We acquired 3,812 newly built railcars, purchased 2,279 railcars in the secondary market, and purchased 156 locomotives in the secondary market in 2024, compared to 3,835 newly built railcars, 1,934 railcars in the secondary market, and no locomotives in 2023.
Our investment volume is predominantly composed of acquired railcars, but also includes the acquisition of locomotives, certain capitalized repairs and improvements to owned railcars and our maintenance facilities. As a result, the dollar value of investment volume does not necessarily correspond to the number of railcars acquired in any given period. In addition, the comparability of amounts invested and the number of railcars acquired in each period is impacted by the mix of railcars purchased, which may include tank cars and freight cars, as well as newly manufactured railcars or those purchased in the secondary market.
RAIL INTERNATIONAL
Segment Summary
Rail International, composed primarily of GATX Rail Europe ("GRE"), produced solid operating results in 2024 and continued to grow its fleet, exceeding 30,000 railcars during the current year. GRE experienced renewal lease rate increases for a majority of railcar types in 2024. Utilization was 96.1% at the end of the year.
The fleet size of our rail business in India ("Rail India") surpassed 10,000 railcars in 2024, and Rail India continued to focus on investment opportunities, diversification of its fleet, and developing relationships with customers, suppliers and the Indian Railways. Demand for railcars in India remained strong, driven by continued growth in the economy and infrastructure development. Utilization was 100.0% at the end of the year.
In 2023, we sold Rail Russia. Financial results were not material to Rail International's segment profit.
The following table shows Rail International's segment results for the years ended December 31 (in millions):
| | | | | | | | | | | | | | | | | | | |
| 2024 | | 2023 | | 2022 | | |
| Revenues | | | | | | | |
| Lease revenue | $ | 333.6 | | | $ | 296.6 | | | $ | 266.2 | | | |
| Other revenue | 16.7 | | | 12.9 | | | 9.1 | | | |
| Total Revenues | 350.3 | | | 309.5 | | | 275.3 | | | |
| | | | | | | |
| Expenses | | | | | | | |
| Maintenance expense | 70.7 | | | 64.1 | | | 51.4 | | | |
| Depreciation expense | 78.7 | | | 68.2 | | | 69.1 | | | |
| Other operating expense | 17.4 | | | 10.4 | | | 8.3 | | | |
| Total Expenses | 166.8 | | | 142.7 | | | 128.8 | | | |
| | | | | | | |
| Other Income (Expense) | | | | | | | |
| Net gain (loss) on asset dispositions | 4.5 | | | 7.0 | | | (11.2) | | | |
| Interest expense, net | (71.4) | | | (56.2) | | | (45.6) | | | |
| Other income (expense) | 3.2 | | | (4.2) | | | (3.8) | | | |
| | | | | | | |
| Segment Profit | $ | 119.8 | | | $ | 113.4 | | | $ | 85.9 | | | |
| | | | | | | |
| Investment Volume | $ | 232.9 | | | $ | 382.4 | | | $ | 243.9 | | | |
GRE Fleet Data
The following table shows fleet activity and statistics for GRE railcars for the years ended December 31:
| | | | | | | | | | | | | | | | | |
| 2024 | | 2023 | | 2022 |
| Beginning balance | 29,216 | | | 28,005 | | | 27,109 | |
| Railcars added | 1,316 | | | 1,695 | | | 1,211 | |
| Railcars scrapped or sold | (505) | | | (484) | | | (315) | |
| Ending balance | 30,027 | | | 29,216 | | | 28,005 | |
| Utilization rate at year end (1) | 96.1 | % | | 95.9 | % | | 99.3 | % |
| Active railcars at year end (2) | 28,849 | | | 28,004 | | | 27,801 | |
| Average active railcars (3) | 28,410 | | | 27,947 | | | 27,288 | |
_______
(1) Utilization is calculated as the number of railcars on lease as a percentage of total railcars in the fleet.
(2) Active railcars refers to the number of railcars on lease to customers. Changes in railcars on lease compared to prior years are impacted by the utilization of newly built railcars, railcars purchased in the secondary market, and the disposition of railcars that were sold or scrapped, as well as the fleet utilization rate.
(3) Average active railcars for the year is calculated using the number of active railcars at the end of each month.
As of December 31, 2024, leases for approximately 10,300 railcars are scheduled to expire in 2025. This amount excludes railcars on leases expiring in 2025 that have already been renewed or assigned to a new lessee.
Rail India Fleet Data
The following table shows fleet activity and statistics for Rail India railcars for the years ended December 31:
| | | | | | | | | | | | | | | | | |
| 2024 | | 2023 | | 2022 |
| Beginning balance | 8,805 | | | 5,872 | | | 4,830 | |
| Railcars added | 1,783 | | | 2,933 | | | 1,042 | |
| Railcars scrapped or sold | (5) | | | — | | | — | |
| Ending balance | 10,583 | | | 8,805 | | | 5,872 | |
| Utilization rate at year end (1) | 100.0 | % | | 100.0 | % | | 100.0 | % |
| Active railcars at year end (2) | 10,583 | | | 8,805 | | | 5,872 | |
| Average active railcars (3) | 9,841 | | | 7,082 | | | 5,395 | |
_______
(1) Utilization is calculated as the number of railcars on lease as a percentage of total railcars in the fleet.
(2) Active railcars refers to the number of railcars on lease to customers. Changes in railcars on lease compared to prior years are impacted by the utilization of railcars purchased and the disposition of railcars that were sold or scrapped, as well as the fleet utilization rate.
(3) Average active railcars for the year is calculated using the number of active railcars at the end of each month.
Comparison of Reported Results
Foreign Currency
Rail International's reported results of operations are impacted by fluctuations in the exchange rates of the U.S. dollar versus the foreign currencies in which it conducts business, primarily the euro. In 2024, fluctuations in the value of the euro, relative to the U.S. dollar, positively impacted lease revenue by approximately $0.6 million and negatively impacted segment profit, excluding other income (expense), by approximately $1.7 million compared to 2023.
Segment Profit
In 2024, segment profit of $119.8 million increased 5.6% compared to $113.4 million in 2023. Segment profit in 2023 included a $0.3 million disposition gain recorded as a result of the decision to exit the Rail Russia business. Excluding this item, results for Rail International were $6.7 million higher than 2023. The increase was primarily due to more railcars on lease and higher lease rates at both GRE and Rail India, partially offset by higher interest expense and higher maintenance expense at GRE.
Revenues
In 2024, lease revenue increased $37.0 million, or 12.5%, due to more railcars on lease and higher lease rates at GRE and Rail India.
Expenses
In 2024, maintenance expense increased $6.6 million, primarily due to more repairs performed, and the impact of foreign exchange rates, partially offset by lower wheelset costs. Depreciation expense increased $10.5 million, due to the impact of new railcars added to the fleet and the impact of foreign exchange rates.
Other Income (Expense)
In 2024, net gain (loss) on asset dispositions decreased $2.5 million, driven by fewer railcars sold, partially offset by higher net scrapping gains due to more railcars scrapped. Net interest expense increased $15.2 million, due to a higher average interest rate and a higher average debt balance. Other income (expense) was favorable by $7.4 million, driven by the positive impact of changes in foreign exchange rates, primarily euro-zloty fluctuations.
Investment Volume
During 2024, investment volume was $232.9 million, compared to $382.4 million in 2023. In 2024, GRE acquired 1,316 newly built railcars compared to 1,695 newly built railcars in 2023, and Rail India acquired 1,783 newly built railcars in 2024 compared to 2,933 newly built railcars in 2023.
Our investment volume is predominantly composed of acquired railcars, but may also include certain capitalized repairs and improvements to owned railcars. As a result, the dollar value of investment volume does not necessarily correspond to the number of railcars acquired in any given period. In addition, the comparability of amounts invested and the number of railcars acquired in each period is impacted by the mix of the various railcar types acquired, as well as fluctuations in the exchange rates of the foreign currencies in which Rail International conducts business.
ENGINE LEASING
Segment Summary
As disclosed previously, we had sold all of our marine assets as of December 31, 2023 and no longer have any marine operations. As a result, we have changed the name of this business segment from Portfolio Management to Engine Leasing to reflect the prospective operations of the segment.
Engine Leasing includes the RRPF affiliates, a group of 50% owned domestic and foreign joint ventures with Rolls-Royce, a leading manufacturer of commercial aircraft jet engines. Segment profit included earnings from the RRPF affiliates of $108.3 million for 2024, $98.7 million for 2023, and $45.4 million for 2022. In 2022, RRPF recorded an impairment charge associated with aircraft spare engines in Russia that RRPF does not expect to recover. GATX's 50% share of this net impairment was $15.3 million ($11.5 million after tax). GATX did not make any additional investment in the RRPF affiliates in 2024, 2023, or 2022. Dividend distributions from the RRPF affiliates totaled $50.0 million in 2024, $25.0 million in 2023, and $46.2 million in 2022. The operating environment for the RRPF affiliates was strong, as international air passenger travel was robust in 2024. High demand, combined with production and maintenance constraints in the aviation industry, resulted in a very strong market for aircraft spare engines.
Engine Leasing also includes GEL, our wholly owned entity that invests directly in aircraft spare engines. In 2024, GEL acquired 10 engines for approximately $261 million. As of December 31, 2024, GEL owned 39 aircraft spare engines, with 14 on long-term leases with airline customers and 25 that are employed in an engine capacity agreement with Rolls-Royce for use in its engine maintenance programs. All engines at GEL are managed by the RRPF affiliates, for which we paid them a fee of $4.1 million in 2024, $2.7 million in 2023 and $1.0 million in 2022.
Engine Leasing previously owned the Specialized Gas Vessels. In 2022, we made the decision to sell the Specialized Gas Vessels and recorded impairment losses totaling $34.3 million and sold two vessels. In 2023, we sold the remaining three vessels and recorded net losses of $4.0 million. In 2024, we recorded final gains of $0.6 million associated with the Specialized Gas Vessels.
In 2023, Engine Leasing sold its natural gas holdings and recorded a gain of $5.7 million.
The following table shows Engine Leasing’s segment results for the years ended December 31 (in millions):
| | | | | | | | | | | | | | | | | |
| 2024 | | 2023 | | 2022 |
| Revenues | | | | | |
| Lease revenue | $ | 32.4 | | | $ | 32.6 | | | $ | 33.0 | |
| Non-dedicated engine revenue | 64.6 | | | 37.6 | | | 1.5 | |
| Marine operating revenue | — | | | 6.9 | | | 18.9 | |
| Other revenue | 0.1 | | | 0.1 | | | 0.2 | |
| Total Revenues | 97.1 | | | 77.2 | | | 53.6 | |
| | | | | |
| Expenses | | | | | |
| Depreciation expense | 37.8 | | | 28.3 | | | 17.8 | |
| Marine operating expense | — | | | 6.5 | | | 14.1 | |
| Other operating expense | 9.6 | | | 7.3 | | | 2.3 | |
| Total Expenses | 47.4 | | | 42.1 | | | 34.2 | |
| | | | | |
| Other Income (Expense) | | | | | |
| Net gain (loss) on asset dispositions | 0.6 | | | 2.2 | | | (31.1) | |
| Interest expense, net | (41.9) | | | (29.8) | | | (19.0) | |
| Other income | 0.6 | | | 0.2 | | | — | |
| Share of affiliates' pre-tax earnings | 108.3 | | | 98.7 | | | 45.4 | |
| Segment Profit | $ | 117.3 | | | $ | 106.4 | | | $ | 14.7 | |
| | | | | |
| Investment Volume | $ | 260.8 | | | $ | 267.3 | | | $ | 149.7 | |
The following table shows the net book value of Engine Leasing’s assets as of December 31 (in millions):
| | | | | | | | | | | |
| 2024 | | 2023 |
| Investment in RRPF Affiliates | $ | 663.1 | | | $ | 626.8 | |
| GEL owned aircraft spare engines | 937.0 | | | 714.0 | |
| Other owned assets | 53.3 | | | 14.3 | |
| Total assets | $ | 1,653.4 | | | $ | 1,355.1 | |
RRPF Affiliates Portfolio Data
The following table shows portfolio activity and statistics for the RRPF affiliates' aircraft spare engines for the years ended December 31:
| | | | | | | | | | | | | | | | | |
| 2024 | | 2023 | | 2022 |
| Beginning balance | 399 | | | 398 | | | 407 | |
| Engine acquisitions | 47 | | | 14 | | | 9 | |
| Engine dispositions | (19) | | | (13) | | | (18) | |
| Ending balance | 427 | | | 399 | | | 398 | |
| Utilization rate at year end (1) | 97.4 | % | | 95.5 | % | | 94.2 | % |
| Average leased engines (2) | 398 | | | 376 | | | 372 | |
| Net book value of engines (in millions) | $ | 4,716.0 | | | $ | 4,067.2 | | | $ | 4,176.5 | |
________
(1) Utilization is calculated as the number of engines on lease as a percentage of total engines in the fleet.
(2) Average leased engines for the year is calculated using the number of leased engines at the end of each month.
GEL Portfolio Data
The following table shows portfolio activity for GEL's aircraft spare engines for the years ended December 31:
| | | | | | | | | | | | | | | | | |
| 2024 | | 2023 | | 2022 |
| Beginning balance | 29 | | | 19 | | | 14 | |
| Engines added | 10 | | | 10 | | | 5 | |
| Ending balance | 39 | | | 29 | | | 19 | |
Comparison of Reported Results
Segment Profit
In 2024, segment profit was $117.3 million compared to $106.4 million in 2023. Segment profit included $0.6 million of gains in 2024 and $4.0 million of losses in 2023 associated with the Specialized Gas Vessels. Excluding the impact of these items, results for Engine Leasing were $6.3 million higher than 2023, driven by higher earnings at the RRPF affiliates and GEL, partially offset by the absence of the gain on the sale of natural gas holdings recorded in the prior year.
Revenues
In 2024, lease revenue was comparable to the prior year. Non-dedicated engine revenue increased $27.0 million, primarily due to aircraft spare engines acquired in 2023 and 2024 and utilized in the engine capacity agreement with Rolls-Royce. Marine operating revenue decreased $6.9 million, driven by the final sales of the Specialized Gas Vessels in 2023.
Expenses
In 2024, marine operating expense decreased $6.5 million, due to sale of the Specialized Gas Vessels in 2023. Depreciation expense increased $9.5 million, due to aircraft spare engines acquired in 2023 and 2024.
Other Income (Expense)
In 2024, net gain (loss) on asset dispositions was unfavorable by $1.6 million, driven by the absence of gains recorded in 2023 for the sale of natural gas holdings, partially offset by net gains in 2024 and net losses in 2023 associated with the Specialized Gas Vessels. Net interest expense increased $12.1 million, due to a higher average debt balance and a higher average interest rate.
In 2024, income from our share of affiliates' earnings increased $9.6 million, driven by higher income from operations, partially offset by lower remarketing income. The amount and timing of remarketing income is dependent on a number of factors and may vary materially from year to year.
Investment Volume
Investment volume was $260.8 million in 2024, compared to $267.3 million in 2023. In both 2024 and 2023, GEL acquired ten aircraft spare engines.
OTHER
Other comprises our Trifleet business, as well as selling, general and administrative expenses ("SG&A"), unallocated interest expense, miscellaneous income and expense not directly associated with the reporting segments, and certain eliminations.
In 2024, GATX recorded settlement expenses of $3.3 million for litigation claims arising out of legacy business operations and reserves of $10.7 million for its share of anticipated environmental remediation costs arising out of prior operations and legacy businesses. The majority of the recorded reserves relate to a facility that GATX sold in 1974, while the remainder of the amount relates to a landfill that GATX entities previously utilized, which was closed in 1986.
In 2022, GATX executed a multi-party amended and restated settlement agreement related to its share of estimated environmental remediation costs to be incurred at a facility that GATX sold in 1974. As a result, GATX recorded $5.9 million of expense to establish a reserve for its share of the remaining anticipated remediation and related costs.
The following table shows components of Other for the years ended December 31 (in millions):
| | | | | | | | | | | | | | | | | | |
| 2024 | | 2023 | | 2022 | |
| Trifleet revenue | $ | 39.1 | | | $ | 41.5 | | | $ | 36.1 | | |
| | | | | | |
| Trifleet segment profit | $ | 8.3 | | | $ | 13.4 | | | $ | 13.8 | | |
| Unallocated interest income | 12.8 | | | 12.7 | | | 1.1 | | |
| Other (expense) income, including eliminations | (8.2) | | | 3.1 | | | (18.8) | | |
| Segment Profit (Loss) | $ | 12.9 | | | $ | 29.2 | | | $ | (3.9) | | |
| | | | | | |
| Selling, general and administrative expense | $ | 236.3 | | | $ | 212.7 | | | $ | 195.0 | | |
| | | | | | |
| Investment Volume | $ | 18.3 | | | $ | 38.4 | | | $ | 46.3 | | |
Trifleet Summary
The tank container leasing market remained challenging in 2024. Utilization was 84.7% at December 31, 2024.
Trifleet Tank Container Data
The following table shows fleet statistics for Trifleet's owned and managed tank containers for the years ended December 31:
| | | | | | | | | | | | | | | | | |
| 2024 | | 2023 | | 2022 |
| Ending balance | 25,041 | | | 23,931 | | | 21,999 | |
| Utilization rate at year-end (1) | 84.7 | % | | 87.3 | % | | 93.1 | % |
_______
(1) Utilization is calculated as the number of tank containers on lease as a percentage of total tank containers in the fleet.
SG&A, Unallocated Interest and Other
SG&A increased $23.6 million in 2024, driven by higher employee-related expenses, including higher share-based compensation expense, and higher information technology expenses.
Unallocated interest income (the difference between external interest expense and interest expense allocated to the reporting segments) in any year is affected by our consolidated leverage position, the timing of debt issuances and investing activities, and intercompany allocations.
Other (expense) income, including eliminations, was unfavorable by $11.3 million in 2024 compared to 2023. The variance was driven by environmental reserves recorded and expenses related to litigation claims settlements, as noted above, partially offset by the absence of pension settlement charges recorded in 2023.
Consolidated Income Taxes
See "Note 13. Income Taxes" in Part II, Item 8 of this Form 10-K for additional information on income taxes.
CHANGE IN NET OPERATING ASSETS AND FACILITIES
The following table shows changes in net operating assets and facilities as of December 31 (in millions):
| | | | | | | | | | | | |
| 2024 | | 2023 | |
| Beginning balance | $ | 9,411.2 | | | $ | 8,250.3 | | |
| Investments | 1,665.3 | | | 1,622.2 | | |
| Purchase of assets previously leased | 29.4 | | | — | | |
| Depreciation expense | (414.2) | | | (385.6) | | |
| Asset dispositions | (129.6) | | | (149.9) | | |
| Transfers to assets held for sale | (2.6) | | | (1.7) | | |
| Foreign exchange rate effects | (120.9) | | | 87.1 | | |
| Other | 11.1 | | | (11.2) | | |
| Ending balance | $ | 10,449.7 | | | $ | 9,411.2 | | |
CASH FLOW DISCUSSION
We generate a significant amount of cash from operating activities and investment portfolio proceeds. We also access domestic and international capital markets by issuing unsecured or secured debt. We use these resources, along with available cash balances, to fulfill our debt, lease, and dividend obligations, to support our share repurchase programs, and to fund portfolio investments and capital additions. We primarily use cash from operations to fund daily operations. The timing of asset dispositions and changes in working capital impact cash flows from portfolio proceeds and operations. As a result, these cash flow components may vary materially from year to year.
As of December 31, 2024, we had an unrestricted cash balance of $401.6 million. We also have a $600 million, 5-year unsecured revolving credit facility in the United States that matures in 2029 and a $350 million 3-year unsecured revolving credit facility in the United States that matures in 2027, both of which were fully available as of December 31, 2024. In addition, we have a €210 million, 3-year unsecured revolving credit facility in Europe that matures in 2027, which was fully available as of December 31, 2024.
The following table shows our cash flows from operating, investing and financing activities for the years ended December 31 (in millions):
| | | | | | | | | | | | | | | | | |
| 2024 | | 2023 | | 2022 |
| Net cash provided by operating activities | $ | 602.1 | | | $ | 520.4 | | | $ | 533.5 | |
| Net cash used in investing activities | (1,416.7) | | | (1,219.3) | | | (1,073.5) | |
| Net cash provided by financing activities | 770.5 | | | 844.1 | | | 504.4 | |
| Effect of exchange rate changes on cash, cash equivalents, and restricted cash | (4.9) | | | 1.6 | | | (4.9) | |
| Net (decrease) increase in cash, cash equivalents, and restricted cash during the year | $ | (49.0) | | | $ | 146.8 | | | $ | (40.5) | |
Net Cash Provided by Operating Activities
Net cash provided by operating activities in 2024 of $602.1 million increased $81.7 million compared to 2023. Comparability among reporting periods is impacted by the timing of changes in working capital items. Specifically, higher cash receipts from revenue, higher affiliate dividends received, and lower payments for operating leases were partially offset by higher cash payments for maintenance, interest, and other operating expenses, as well as higher payments for income taxes.
Net Cash Used in Investing Activities
The following table shows our principal sources and uses of cash flows from investing activities for the years ended December 31 (in millions):
| | | | | | | | | | | | | | | | | |
| 2024 | | 2023 | | 2022 |
| Portfolio investments and capital additions (1) | $ | (1,674.4) | | | $ | (1,665.0) | | | $ | (1,255.8) | |
| Portfolio proceeds (2) | 230.6 | | | 272.8 | | | 269.6 | |
| Short-term investments (3) | — | | | 150.0 | | | (148.5) | |
| Proceeds from sales of other assets (4) | 24.9 | | | 20.2 | | | 31.1 | |
| Other investing activity | 2.2 | | | 2.7 | | | 30.1 | |
| Net cash used in investing activities | $ | (1,416.7) | | | $ | (1,219.3) | | | $ | (1,073.5) | |
_______
(1) Portfolio investments and capital additions primarily consist of purchases of operating assets and capitalized asset improvements. See the discussions of segment operating results sections in this Item for more detail.
(2) Portfolio proceeds primarily consist of proceeds from sales of operating assets.
(3) Short-term U.S. Treasury obligations with an original maturity date of over 90 days.
(4) Proceeds from sales of other assets for all periods were primarily related to railcar scrapping.
The following table shows portfolio investments and capital additions by segment for the years ended December 31 (in millions):
| | | | | | | | | | | | | | | | | |
| 2024 | | 2023 | | 2022 |
| Rail North America | $ | 1,162.4 | | | $ | 976.9 | | | $ | 815.9 | |
| Rail International | 232.9 | | | 382.4 | | | 243.9 | |
| Engine Leasing | 260.8 | | | 267.3 | | | 149.7 | |
| Other | 18.3 | | | 38.4 | | | 46.3 | |
| Total | $ | 1,674.4 | | | $ | 1,665.0 | | | $ | 1,255.8 | |
The increase in portfolio investments and capital additions of $9.4 million in the year ended December 31, 2024 was primarily due to more railcars and locomotives acquired at Rail North America, partially offset by fewer railcars acquired at GRE and Rail India, and fewer tank containers acquired at Trifleet. The timing of investments depends on purchase commitments, transaction opportunities, and market conditions.
Portfolio proceeds decreased $42.2 million in 2024 compared to 2023, resulting from the absence of proceeds from the sale of three Specialized Gas Vessels at Engine Leasing and the sale of Rail Russia at Rail International in 2023.
Net Cash Provided by Financing Activities
The following table shows our principal sources and uses of cash flows provided by financing activities for the years ended December 31 (in millions):
| | | | | | | | | | | | | | | | | |
| 2024 | | 2023 | | 2022 |
| Net proceeds from issuances of debt with original maturities longer than 90 days | $ | 1,295.6 | | | $ | 1,420.0 | | | $ | 848.3 | |
| Repayments of debt with original maturities longer than 90 days | (413.5) | | | (500.0) | | | (250.0) | |
| Net decrease in debt with original maturities of 90 days or less | — | | | (7.1) | | | — | |
| | | | | |
| Purchases of assets previously leased (1) | (30.4) | | | — | | | (1.5) | |
| Stock repurchases (2) | (21.9) | | | (2.6) | | | (47.2) | |
| Dividends | (84.8) | | | (80.6) | | | (76.6) | |
| Other | 25.5 | | | 14.4 | | | 31.4 | |
| Net cash provided by financing activities | $ | 770.5 | | | $ | 844.1 | | | $ | 504.4 | |
________
(1) In 2024, we purchased 728 railcars that were previously leased, compared to zero railcars in 2023.
(2) During 2024, we repurchased 167,452 shares of common stock for $21.9 million, compared to 24,520 shares of common stock for $2.6 million in 2023.
The following table shows the activity on our long-term debt principal in 2024 (in millions):
| | | | | | | | | | | | | | | | | | | | | | | | | | | | | | | |
| Balance at 12/31/23 | | Issuances | | Payments | | Impact of Foreign Exchange Rates | | | | Balance at 12/31/24 |
| U.S. debt | $ | 6,450.0 | | | $ | 950.0 | | | $ | (300.0) | | | $ | — | | | | | $ | 7,100.0 | |
| Europe debt (1) | 899.6 | | | 305.3 | | | (113.5) | | | (65.3) | | | | | 1,026.1 | |
| India debt (2) | 101.0 | | | 48.0 | | | — | | | (4.2) | | | | | 144.8 | |
| | | | | | | | | | | |
| Total debt principal | $ | 7,450.6 | | | $ | 1,303.3 | | | $ | (413.5) | | | $ | (69.5) | | | | | $ | 8,270.9 | |
__________
(1) Denominated in euros, but presented in U.S. dollars in this table.
(2) Denominated in Indian rupees, but presented in U.S. dollars in this table.
See "Note 8. Debt" in Part II, Item 8 of this Form 10-K for information regarding the terms of our outstanding debt.
LIQUIDITY AND CAPITAL RESOURCES
General
We fund our investments and meet our debt, lease, and dividend obligations using our available cash balances, as well as cash generated from operating activities, sales of assets, distributions from affiliates, issuances of unsecured and secured debt, commercial paper issuances, and committed revolving credit facilities. We primarily use cash from operations to fund daily operations. We use both domestic and international capital markets and banks to meet our debt financing needs.
Material Cash Obligations
The following table shows our material cash obligations, including debt principal and related interest payments, lease payments, and purchase commitments at December 31, 2024 (in millions):
| | | | | | | | | | | | | | | | | | | | | | | | | | | | | | | | | | | | | | | | | |
| Material Cash Obligations by Period |
| Total | | 2025 | | 2026 | | 2027 | | 2028 | | 2029 | | Thereafter |
| Recourse debt | $ | 8,270.9 | | | $ | 632.4 | | | $ | 602.3 | | | $ | 836.1 | | | $ | 730.7 | | | $ | 674.4 | | | $ | 4,795.0 | |
| Interest on recourse debt (1) | 3,365.2 | | | 357.9 | | | 340.5 | | | 307.7 | | | 275.9 | | | 237.1 | | | 1,846.1 | |
| Borrowings under bank credit facilities | 10.4 | | | 10.4 | | | — | | | — | | | — | | | — | | | — | |
| Operating lease obligations | 203.5 | | | 35.6 | | | 35.8 | | | 32.8 | | | 25.6 | | | 18.4 | | | 55.3 | |
| Purchase commitments (2) | 2,057.8 | | | 651.9 | | | 446.2 | | | 437.1 | | | 397.2 | | | 125.4 | | | — | |
| Total | $ | 13,907.8 | | | $ | 1,688.2 | | | $ | 1,424.8 | | | $ | 1,613.7 | | | $ | 1,429.4 | | | $ | 1,055.3 | | | $ | 6,696.4 | |
__________
(1) For floating rate debt, future interest payments are based on the applicable interest rate as of December 31, 2024.
(2) Primarily railcar purchase commitments. The amounts shown for all years are based on management's estimates of the timing, anticipated railcar types, and related costs of railcars to be purchased under its agreements. For additional details on our purchase agreements, refer to the discussion of Rail North America operating results within this Item.
Liquidity Outlook
In addition to our contractual obligations, expenditures in 2025 may also include the purchase of railcars, tank containers, and aircraft spare engines and other discretionary capital spending for opportunistic asset purchases or strategic investments. We plan to fund these expenditures in 2025 using available cash at December 31, 2024 in combination with cash from operations, portfolio proceeds, and long-term debt issuances. We also have access to our revolving credit facilities if needed. Based on the available sources of liquidity, we also expect to meet our funding needs beyond 2025.
Contractual Cash Receipts
Information regarding our contractual cash receipts arising from future rental receipts from noncancelable operating leases and from our finance leases as of December 31, 2024 is presented in "Note 6. Leases" within Item 8 of this Form 10-K.
Debt
The following table shows the carrying value of our debt and lease obligations by major component as of December 31 (in millions):
| | | | | | | | | | | | | | | | | | | | | | | |
| 2024 | | 2023 |
| Secured | | Unsecured | | Total | | Total |
| Borrowings under bank credit facilities | $ | — | | | $ | 10.4 | | | $ | 10.4 | | | $ | 11.0 | |
| Recourse debt | — | | | 8,215.3 | | | 8,215.3 | | | 7,388.1 | |
| Operating lease obligations | 180.0 | | | — | | | 180.0 | | | 226.8 | |
| Total | $ | 180.0 | | | $ | 8,225.7 | | | $ | 8,405.7 | | | $ | 7,625.9 | |
As of December 31, 2024, our outstanding debt had a weighted-average remaining term of 8.6 years and a weighted-average interest rate of 4.59%, compared to 8.4 years and 4.08% at December 31, 2023. See "Note 8. Debt" in Part II, Item 8 of this Form 10-K.
Short-Term Borrowings and Credit Lines and Facilities
We use short-term borrowings as a source of working capital and to temporarily fund differences between our operating cash flows and portfolio proceeds, and our capital investments and debt maturities. We do not maintain or target any particular level of short-term borrowings on a permanent basis. Rather, we will temporarily utilize short-term borrowings at levels we deem appropriate until we decide to pay down these balances.
In 2024, we entered into a $600 million, 5-year unsecured revolving credit facility in the United States, expiring in May 2029. The facility contains two one-year extension options. This replaced our prior $600 million, 5-year unsecured revolving credit facility. As of December 31, 2024, the full $600 million was available under this facility. We also entered into a $350 million 3-year unsecured revolving credit facility in the United States, expiring in May 2027. This facility contains two one-year extension options. This replaced our prior $250 million 3-year unsecured revolving credit facility. As of December 31, 2024, the full $350 million was available under this facility.
In 2024, we entered into a new €210 million, 3-year unsecured revolving credit facility in Europe, expiring in December 2027. As of December 31, 2024, the full €210 million was available under this facility. In addition, our European subsidiaries have smaller unsecured credit facilities with an aggregate limit of €35.0 million. As of December 31, 2024, €25.0 million was available under these credit facilities, as €10.0 million ($10.4 million) was drawn. The weighted-average interest rate of these outstanding borrowings during 2024 was 4.24%.
Delayed Draw Term Loans
As of December 31, 2024, we had INR 2.0 billion ($23.4 million) available under an outstanding delayed draw term loan in India.
Restrictive Covenants
Our credit facilities and certain other debt agreements contain various restrictive covenants. See "Note 8. Debt" in Part II, Item 8 of this Form 10-K.
Credit Ratings
The global capital market environment and outlook may affect our funding options and our financial performance. Our access to capital markets at competitive rates depends on our credit rating and rating outlook, as determined by rating agencies.
The following table shows our credit rating and rating outlook as of December 31, 2024:
| | | | | | | | | | | | | | | | | |
| Rating Agency |
| Standard & Poor's | | Moody's Investor Service | | Fitch Ratings, Inc |
| Long-term unsecured debt | BBB | | Baa2 | | BBB+ |
| Short-term unsecured debt | A-2 | | P-2 | | F2 |
| Rating outlook | Stable | | Positive | | Stable |
Leverage
Leverage is expressed as a ratio of debt (including debt and lease obligations, net of unrestricted cash and short-term investments) to equity. The following table shows the components of recourse leverage as of December 31 (in millions, except recourse leverage ratio):
| | | | | | | | | | | | | | | | | |
| 2024 | | 2023 | | 2022 |
| Debt and lease obligations, net of unrestricted cash and short-term investments: | |
| Unrestricted cash and short-term investments | $ | (401.6) | | | $ | (450.7) | | | $ | (452.2) | |
| Borrowings under bank credit facilities | 10.4 | | | 11.0 | | | 17.3 | |
| Recourse debt | 8,215.3 | | | 7,388.1 | | | 6,431.5 | |
| Operating lease obligations | 180.0 | | | 226.8 | | | 257.9 | |
| | | | | |
| Total debt and lease obligations, net of unrestricted cash and short-term investments | $ | 8,004.1 | | | $ | 7,175.2 | | | $ | 6,254.5 | |
| | | | | |
| Total recourse debt (1) | $ | 8,004.1 | | | $ | 7,175.2 | | | $ | 6,254.5 | |
| Shareholders' Equity | $ | 2,438.9 | | | $ | 2,273.0 | | | $ | 2,029.6 | |
| Recourse Leverage (2) | 3.3 | | 3.2 | | 3.1 |
________
(1) Includes recourse debt, borrowings under bank credit facilities, and operating and finance lease obligations, net of unrestricted cash and short-term investments.
(2) Calculated as total recourse debt / shareholders' equity.
Shelf Registration Statement
During 2022, we filed an automatic shelf registration statement that enables us to issue debt securities and pass-through certificates. The registration statement is effective for three years and does not limit the amount of debt securities and pass-through certificates we can issue.
Commercial Commitments
We have entered into various commercial commitments, including standby letters of credit, performance bonds, and guarantees related to certain transactions. These commercial commitments require us to fulfill specific obligations in the event of third-party demands. Similar to our balance sheet investments, these commitments expose us to credit, market, and equipment risk. Accordingly, we evaluate these commitments and other contingent obligations using techniques similar to those we use to evaluate funded transactions.
We are parties to standby letters of credit and performance bonds, which primarily relate to contractual obligations and general liability insurance coverages. No material claims have been made against these obligations, and no material losses are anticipated.
Our commercial commitments at December 31, 2024 are presented in "Note 15. Commercial Commitments" within Item 8 of this Form 10-K.
Defined Benefit Plan Contributions
In 2024, we contributed $2.9 million to our defined benefit pension plans and other post-retirement benefit plans. In 2025, we expect to contribute approximately $4.2 million. As of December 31, 2024, our funded pension plans in the aggregate were 106.8% funded. Additional contributions will depend primarily on plan asset investment returns and actuarial experience, and subject to the impact of these factors, we may make additional material plan contributions.
GATX Common Stock Repurchases
On January 25, 2019, our board of directors approved a $300.0 million share repurchase program, pursuant to which we are authorized to purchase shares of our common stock in the open market, in privately negotiated transactions, or otherwise, including pursuant to Rule 10b5-1 plans. The share repurchase program does not have an expiration date, does not obligate the Company to repurchase any dollar amount or number of shares of common stock, and may be suspended or discontinued at any time. The timing of share repurchases will be dependent on market conditions and other factors. During 2024, we repurchased 167,452 shares of common stock for $21.9 million, excluding commissions, compared to 24,520 shares repurchased for $2.6 million, excluding commissions, in 2023. As of December 31, 2024, $65.1 million remained available under the repurchase authorization.
CRITICAL ACCOUNTING POLICIES AND ESTIMATES
We prepare our consolidated financial statements in conformity with GAAP, which requires us to use judgment in making estimates and assumptions that affect reported amounts of assets, liabilities, revenues, and expenses, as well as information in the related disclosures. We regularly evaluate our estimates and judgments based on historical experience, market indicators, and other relevant factors and circumstances. Actual results may differ from these estimates under different assumptions or conditions.
Operating Assets
We state operating assets, including assets acquired under finance leases, at cost and depreciate them over their estimated economic useful lives to an estimated residual value using the straight-line method. We determine the economic useful life based on our estimate of the period over which the asset will generate revenue. For the majority of our operating assets, the economic useful life is greater than 30 years. We periodically review the appropriateness of our estimates of useful lives based on changes in economic circumstances and other factors. Changes in these estimates would result in a change in future depreciation expense.
Lease Classification
We analyze all new and modified leases to determine whether we should classify the lease as an operating or finance lease. Our lease classification analysis relies on certain assumptions that require judgment, such as the asset's fair value, the asset's estimated residual value, the interest rate implicit in the lease, and the asset's economic useful life. While most of our leases are classified as operating leases, changes in the assumptions we use could result in a different lease classification, which could change the impacts of the lease transactions on our results of operations and financial position. See "Note 6. Leases" in Part II, Item 8 of this Form 10-K.
Impairment of Long-Lived Assets
We review long-lived assets, such as operating assets, right-of-use assets, and facilities, for impairment annually, or whenever circumstances indicate that the carrying amount of those assets may not be recoverable. We evaluate the recoverability of assets to be held and used by comparing the carrying amount of the asset to the undiscounted future net cash flows we expect the asset to generate. We base estimated future cash flows on a number of assumptions, including lease rates, lease term (including renewals), operating costs, the life of the asset, and final disposition proceeds. If we determine an asset is impaired, we recognize an impairment loss equal to the amount by which the carrying amount exceeds the asset’s fair value. We classify assets we plan to sell or otherwise dispose of as held for sale, provided they meet specified accounting criteria, and we record those assets at the lower of their carrying amount or fair value less costs to sell. See "Note 10. Asset Impairments and Assets Held for Sale" in Part II, Item 8 of this Form 10-K.
Impairment of Investments in Affiliated Companies
We review the carrying amount of our investments in affiliates annually, or whenever circumstances indicate that their value may have declined. If management determines that indicators of impairment are present for an investment, we perform an analysis to estimate the fair value of that investment. Active markets do not typically exist for our affiliate investments and as a result, we may estimate fair value using a discounted cash flow analysis at the investee level, price-earnings ratios based on comparable businesses, or other valuation techniques that are appropriate for the particular circumstances of the affiliate. For all fair value estimates, we use observable inputs whenever possible and appropriate.
Once we make an estimate of fair value, we compare the estimate of fair value to the investment’s carrying value. If the investment’s estimated fair value is less than its carrying value, then we consider the investment impaired. If an investment is impaired, we assess whether the impairment is other-than-temporary. We consider factors such as the expected operating results for the near future, the length of the economic life cycle of the underlying assets of the investee, and our ability to hold the investment through the end of the underlying assets’ useful life to determine if the impairment is other-than-temporary. We may also consider actions we anticipate the investee will take to improve its business prospects if it seems probable the investee will take those actions. If we determine an investment to be only temporarily impaired, we do not record an impairment loss. Alternatively, if we determine an impairment is other-than-temporary, we record a loss equal to the difference between the estimated fair value of the investment and its carrying value. See "Note 7. Investments in Affiliated Companies."
Impairment of Goodwill
We review the carrying amount of our goodwill annually, or if circumstances indicate an impairment may have occurred. We perform the impairment review at the reporting unit level, which is one level below an operating segment. The goodwill impairment test performed is a two-tiered approach and requires us to make certain judgments to determine the assumptions we use in the calculation. We first complete a qualitative assessment to determine if it is more likely than not that the fair value of the reporting unit exceeds its carrying value. If necessary, the fair value is then compared to its carrying value, including goodwill. When estimating the fair value of the reporting unit, we use a discounted cash flow model and base our estimates of future cash flows on revenue and expense forecasts and include assumptions for future growth. We also consider observable multiples of book value and earnings for companies that we believe are comparable to the applicable reporting units. If the estimated fair value is less than the carrying amount, we record an impairment loss for the difference. See "Note 17. Goodwill" in Part II, Item 8 of this Form 10-K.
Pension and Post-Retirement Benefits Assumptions
We use actuarial assumptions to calculate pension and other post-retirement benefit obligations and related costs. The discount rate and the expected return on plan assets are two assumptions that influence the plan expense and liability measurement. Other assumptions involve demographic factors such as expected retirement age, mortality, employee turnover, health care cost trends, and the rate of compensation increases.
We use a discount rate to calculate the present value of expected future pension and post-retirement cash flows as of the measurement date. The discount rate is based on yields for high-quality, long-term bonds with durations similar to the projected benefit obligation. We base the expected long-term rate of return on plan assets on current and expected asset allocations, as well as historical and expected returns on various categories of plan assets. We evaluate these assumptions annually and make adjustments as required in accordance with changes in underlying market conditions, valuation of plan assets, or demographics. Changes in these assumptions may increase or decrease periodic benefit plan expense as well as the carrying value of benefit plan obligations. See "Note 11. Pension and Other Post-Retirement Benefits" in Part II, Item 8 of this Form 10-K.
Share-Based Compensation
We grant equity awards to certain employees and non-employee directors in the form of non-qualified stock options, stock appreciation rights, restricted stock, performance shares, and phantom stock. We recognize compensation expense for our equity awards over the applicable service period for each award, based on the award’s grant date fair value. We use the Black-Scholes options valuation model to calculate the grant date fair value of stock options and stock appreciation rights. This model requires us to make certain assumptions that affect the amount of compensation expense we will record. The assumptions we use in the model include the expected stock price volatility (based on the historical volatility of our stock price), the risk-free interest rate (based on the treasury yield curve), the expected life of the equity award (based on historical exercise patterns and post-vesting termination behavior), and the dividend equivalents we expect to pay during the estimated life of the equity award since our stock options and stock appreciation rights are dividend participating. We base the fair value of other equity awards on our stock price on the grant date. We recognize forfeitures when they occur. See "Note 12. Share-Based Compensation" in Part II, Item 8 of this Form 10-K.
Income Taxes
Our operations are subject to taxes in the United States, various states, and foreign countries, and as a result, we may be subject to audit in all of these jurisdictions. Tax audits may involve complex issues and disagreements with taxing authorities that could require several years to resolve. GAAP requires that we presume the relevant tax authority will examine uncertain income tax positions. We must determine whether, based on the technical merits of our position, it is more likely than not that our uncertain income tax positions will be sustained by taxing authorities upon examination, which may include related appeals or litigation processes. We must then evaluate income tax positions that meet the "more likely than not" recognition threshold to determine the probable amount of benefit we would recognize in the financial statements. Establishing accruals for uncertain tax benefits requires us to make estimates and assessments with respect to the ultimate outcome of tax audit issues for amounts recorded in the financial statements. The ultimate resolution of uncertain tax benefits may differ from our estimates, potentially impacting our financial position, results of operations, or cash flows.
We evaluate the need for a deferred tax asset valuation allowance by assessing the likelihood that we will realize tax assets, including net operating loss and tax credit carryforward benefits. Our assessment of whether a valuation allowance is required involves judgment, including forecasting future taxable income and evaluating tax planning initiatives, if applicable.
We expect to continue to reinvest foreign earnings outside the United States indefinitely. If future earnings are repatriated to the United States, or if we expect such earnings to be repatriated, a provision for additional taxes may be required. Under provisions of the territorial tax system, repatriated earnings are generally exempt from United States income taxation, however, incremental income taxes may occur from withholding taxes, foreign exchange gains, or other taxable gains recognized in connection with tax basis differences in our foreign investments. The ultimate tax cost of repatriating such earnings will depend on tax laws in effect and other circumstances at that time. See "Note 13. Income Taxes" in Part II, Item 8 of this Form 10-K.
NEW ACCOUNTING PRONOUNCEMENTS
See "Note 2. Accounting Changes" in Part II, Item 8 of this Form 10-K for a summary of new accounting pronouncements that may impact our business.
NON-GAAP FINANCIAL MEASURES
In addition to financial results reported in accordance with GAAP, we compute certain financial measures using non-GAAP components, as defined by the U.S. Securities and Exchange Commission ("SEC"). These measures are not in accordance with, or a substitute for, GAAP, and our financial measures may be different from non-GAAP financial measures used by other companies. We have provided a reconciliation of our non-GAAP measures to the most directly comparable GAAP measures.
Reconciliation of Non-GAAP Components Used in the Computation of Certain Financial Measures
We exclude the effects of certain tax adjustments and other items for purposes of presenting net income, diluted earnings per share, and return on equity because we believe these items are not attributable to our business operations. Management utilizes net income, excluding tax adjustments and other items, when analyzing financial performance because such amounts reflect the underlying operating results that are within management’s ability to influence. Accordingly, we believe presenting this information provides investors and other users of our financial statements with meaningful supplemental information for purposes of analyzing year-to-year financial performance on a comparable basis and assessing trends.
The following tables show our net income, diluted earnings per share, and return on equity, excluding tax adjustments and other items for the years ended December 31 (in millions, except per share data):
| | | | | | | | | | | | | | | | | |
| Impact of Tax Adjustments and Other Items on Net Income: | | | | | |
| 2024 | | 2023 | | 2022 |
| Net income (GAAP) | $ | 284.2 | | | $ | 259.2 | | | $ | 155.9 | |
| Adjustments attributable to consolidated pre-tax income: | | | | | |
| Litigation claims settlements (1) | $ | 3.3 | | | $ | — | | | $ | — | |
| Environmental reserves (2) | 10.7 | | | — | | | 5.9 | |
| Net (gain) loss on Specialized Gas Vessels at Engine Leasing (3) | (0.6) | | | 4.0 | | | 34.3 | |
| Net (gain) loss on Rail Russia at Rail International (4) | — | | | (0.3) | | | 14.6 | |
| | | | | |
| | | | | |
| Total adjustments attributable to consolidated pre-tax income | $ | 13.4 | | | $ | 3.7 | | | $ | 54.8 | |
| Income taxes thereon, based on applicable effective tax rate | $ | (3.5) | | | $ | — | | | $ | (1.5) | |
| Other income tax adjustments attributable to consolidated income: | | | | | |
| Income tax rate changes (5) | $ | (6.0) | | | $ | (3.0) | | | $ | (3.0) | |
| Net operating loss valuation allowance adjustment (6) | — | | | (2.3) | | | — | |
| Total other income tax adjustments attributable to consolidated income | $ | (6.0) | | | $ | (5.3) | | | $ | (3.0) | |
| Adjustments attributable to affiliates' earnings, net of taxes: | | | | | |
| Aircraft spare engine impairment at RRPF (7) | $ | — | | | $ | — | | | $ | 11.5 | |
| | | | | |
| Total adjustments attributable to affiliates' earnings, net of taxes | $ | — | | | $ | — | | | $ | 11.5 | |
| Net income, excluding tax adjustments and other items (non-GAAP) | $ | 288.1 | | | $ | 257.6 | | | $ | 217.7 | |
| | | | | | | | | | | | | | | | | |
| Impact of Tax Adjustments and Other Items on Diluted Earnings per Share: |
| 2024 | | 2023 | | 2022 |
| Diluted earnings per share (GAAP) | $ | 7.78 | | | $ | 7.12 | | | $ | 4.35 | |
| Adjustments attributable to consolidated income, net of taxes: | | | | | |
| Litigation claims settlements (1) | $ | 0.07 | | | $ | — | | | $ | — | |
| Environmental reserves (2) | 0.22 | | | — | | | 0.12 | |
| Net (gain) loss on Specialized Gas Vessels at Engine Leasing (3) | (0.02) | | | 0.11 | | | 0.96 | |
| Net (gain) loss on Rail Russia at Rail International (4) | — | | | (0.01) | | | 0.41 | |
| | | | | |
| Other income tax adjustments attributable to consolidated income: | | | | | |
| Income tax rate changes (5) | (0.16) | | | (0.08) | | | (0.08) | |
| Net operating loss valuation allowance adjustment (6) | — | | | (0.06) | | | — | |
| Adjustments attributable to affiliates' earnings, net of taxes: | | | | | |
| Aircraft spare engine impairment at RRPF (7) | — | | | — | | | 0.32 | |
| | | | | |
| Diluted earnings per share, excluding tax adjustments and other items (non-GAAP)* | $ | 7.89 | | | $ | 7.07 | | | $ | 6.07 | |
(*) Sum of individual components may not be additive due to rounding.
_______
(1) Expenses recorded for the settlements of litigation claims arising out of legacy business operations.
(2) Reserves recorded in 2024 for our share of anticipated environmental remediation costs arising out of prior operations and legacy businesses and reserves recorded in 2022 as part of an executed agreement for anticipated remediation costs at a previously owned property, sold in 1974.
(3) In 2022, we made the decision to sell the Specialized Gas Vessels. We have recorded gains and losses associated with the subsequent impairments and sales of these assets. As of December 31, 2023, all vessels had been sold.
(4) In 2022, we made the decision to exit Rail Russia and recorded losses in 2022 associated with the impairment of the net assets. In 2023, we sold Rail Russia and recorded a gain on the final sale of this business.
(5) Deferred income tax adjustments attributable to state tax rate reductions in 2024 and 2023 and an enacted corporate income tax rate reduction in Austria in 2022.
(6) Valuation allowance adjustment associated with the realizability of state net operating losses in future tax years.
(7) Impairment losses related to aircraft spare engines in Russia that RRPF does not expect to recover.
| | | | | | | | | | | | | | | | | |
| 2024 | | 2023 | | 2022 |
| Return on Equity (GAAP) | 12.1 | % | | 12.0 | % | | 7.7 | % |
| Return on Equity, excluding tax adjustments and other items (non-GAAP) | 12.2 | % | | 12.0 | % | | 10.8 | % |
Item 7A. Quantitative and Qualitative Disclosures About Market Risk
In the normal course of business, we are exposed to interest rate and foreign currency exchange rate risks that could impact our financial results. To manage these risks we may enter into certain derivative transactions, principally interest rate swaps, Treasury rate locks, options and currency forwards and swaps. These instruments and other derivatives are entered into only for hedging existing underlying exposures. We do not hold or issue derivative financial instruments for speculative purposes.
Interest Rate Exposure — Our reported interest expense is affected by changes in interest rates as a result of the issuance of floating rate debt instruments. We generally manage the amount of floating rate debt exposure in order to reduce interest expense volatility. Based on our floating rate debt instruments at December 31, 2024, and giving effect to related derivatives, a hypothetical increase in market interest rates of 100 basis points would cause an increase in after-tax interest expense of $5.3 million in 2024. Comparatively, at December 31, 2023, a hypothetical 100 basis point increase in interest rates would have resulted in a $4.2 million increase in after-tax interest expense in 2024. Our earnings are also exposed to interest rate changes from affiliates' earnings. Certain affiliates issue floating rate debt instruments to finance their investments.
Foreign Currency Exchange Rate Exposure — Certain of our foreign subsidiaries conduct business in currencies other than the U.S. dollar, principally those operating in Austria, Canada, Germany, Poland, India, and the Netherlands. As a result, we are exposed to foreign currency risk attributable to changes in the exchange value of the U.S. dollar in terms of the euro, Canadian dollar, Polish zloty, and Indian rupee. Based on 2024 local currency earnings and considering non-functional currency assets and liabilities recorded as of December 31, 2024, and giving effect to related derivatives, a uniform and hypothetical 10% strengthening in the U.S. dollar versus applicable foreign currencies would decrease after-tax income in 2024 by $9.6 million. Comparatively, based on 2023 local currency earnings and considering non-functional currency assets and liabilities recorded as of December 31, 2023, a uniform and hypothetical 10% strengthening in the U.S. dollar versus applicable foreign currencies would have decreased after-tax income in 2024 by $9.7 million.
Item 8. Financial Statements and Supplementary Data
INDEX TO CONSOLIDATED FINANCIAL STATEMENTS AND NOTES
Report of Independent Registered Public Accounting Firm
To the Shareholders and the Board of Directors of GATX Corporation
Opinion on the Financial Statements
We have audited the accompanying consolidated balance sheets of GATX Corporation and subsidiaries (the Company) as of December 31, 2024 and 2023, the related consolidated statements of comprehensive income, changes in shareholders’ equity and cash flows for each of the three years in the period ended December 31, 2024, and the related notes (collectively referred to as the “consolidated financial statements”). In our opinion, the consolidated financial statements present fairly, in all material respects, the financial position of the Company at December 31, 2024 and 2023, and the results of its operations and its cash flows for each of the three years in the period ended December 31, 2024, in conformity with U.S. generally accepted accounting principles.
We also have audited, in accordance with the standards of the Public Company Accounting Oversight Board (United States) (PCAOB), the Company’s internal control over financial reporting as of December 31, 2024, based on criteria established in Internal Control – Integrated Framework issued by the Committee of Sponsoring Organizations of the Treadway Commission (2013 framework), and our report dated February 19, 2025 expressed an unqualified opinion thereon.
Basis for Opinion
These financial statements are the responsibility of the Company’s management. Our responsibility is to express an opinion on the Company’s financial statements based on our audits. We are a public accounting firm registered with the PCAOB and are required to be independent with respect to the Company in accordance with the U.S. federal securities laws and the applicable rules and regulations of the Securities and Exchange Commission and the PCAOB.
We conducted our audits in accordance with the standards of the PCAOB. Those standards require that we plan and perform the audit to obtain reasonable assurance about whether the financial statements are free of material misstatement, whether due to error or fraud. Our audits included performing procedures to assess the risks of material misstatement of the financial statements, whether due to error or fraud, and performing procedures that respond to those risks. Such procedures included examining, on a test basis, evidence regarding the amounts and disclosures in the financial statements. Our audits also included evaluating the accounting principles used and significant estimates made by management, as well as evaluating the overall presentation of the financial statements. We believe that our audits provide a reasonable basis for our opinion.
Critical Audit Matter
The critical audit matter communicated below is a matter arising from the current period audit of the financial statements that was communicated or required to be communicated to the audit committee and that: (1) relates to accounts or disclosures that are material to the financial statements and (2) involved our especially challenging, subjective or complex judgments. The communication of the critical audit matter does not alter in any way our opinion on the consolidated financial statements, taken as a whole, and we are not, by communicating the critical audit matter below providing a separate opinion on the critical audit matter or on the account or disclosures to which it relates.
| | | | | |
| Impairment of Long-Lived Assets within the Rail North America Segment |
| |
| Description of the Matter | As described in Notes 3 and 10 to the consolidated financial statements, the Company reviews long-lived assets for impairment annually, or if circumstances indicate that the carrying amount of those assets may not be recoverable. The Company evaluates the recoverability of assets to be held and used by comparing the carrying amount of the asset to the undiscounted future net cash flows the asset is expected to generate. If the Company determines that an asset is impaired, an impairment loss is recognized equal to the excess of the asset’s carrying amount over its fair value.
Auditing management’s evaluation of long-lived assets for impairment involved subjectivity due to the significant estimation required to determine the undiscounted future net cash flows for assets with indicators of potential impairment. In particular, the estimated lease revenue is a significant assumption, which can be affected by changes to the Company’s business and industry factors.
|
| How We Addressed the Matter in Our Audit | We obtained an understanding, evaluated the design and tested the operating effectiveness of controls over the Company’s long-lived asset impairment review process, including controls over management’s review of the significant assumption discussed above.
To test the Company’s long-lived asset impairment review process, we performed audit procedures that included, among others, assessing the methodology used, evaluating the significant assumptions discussed above and testing the completeness and accuracy of the underlying data used by the Company in its analysis. We assessed the historical accuracy of management’s estimates used in their analysis and compared the estimated lease revenue used by management to current year lease rates. In addition, we evaluated whether changes to the Company’s business and industry factors would affect the reasonableness of the estimated lease revenues. |
/s/ Ernst & Young LLP
We have served as the Company’s auditor since 1916.
Chicago, Illinois
February 19, 2025
GATX CORPORATION AND SUBSIDIARIES
CONSOLIDATED BALANCE SHEETS
(In millions, except share data) | | | | | | | | | | | |
| December 31 |
| 2024 | | 2023 |
| Assets | | | |
| Cash and Cash Equivalents | $ | 401.6 | | | $ | 450.7 | |
| Restricted Cash | 0.2 | | | 0.1 | |
| | | |
| Receivables | | | |
| Rent and other receivables | 86.5 | | | 87.9 | |
| Finance leases (as lessor) | 118.3 | | | 136.4 | |
| Less: allowance for losses | (5.7) | | | (5.9) | |
| 199.1 | | | 218.4 | |
| | | |
| Operating Assets and Facilities | 14,330.6 | | | 13,081.9 | |
| Less: allowance for depreciation | (3,880.9) | | | (3,670.7) | |
| 10,449.7 | | | 9,411.2 | |
| Lease Assets (as lessee) | | | |
| Right-of-use assets, net of accumulated depreciation | 165.4 | | | 212.0 | |
| | | |
| | | |
| | | |
| Investments in Affiliated Companies | 663.3 | | | 627.0 | |
| Goodwill | 114.1 | | | 120.0 | |
| Other Assets | 303.1 | | | 286.6 | |
| Total Assets | $ | 12,296.5 | | | $ | 11,326.0 | |
| | | |
| Liabilities and Shareholders’ Equity | | | |
| Accounts Payable and Accrued Expenses | $ | 217.1 | | | $ | 239.6 | |
| Debt | | | |
| Borrowings under bank credit facilities | 10.4 | | | 11.0 | |
| Recourse | 8,215.3 | | | 7,388.1 | |
| 8,225.7 | | | 7,399.1 | |
| Lease Obligations (as lessee) | | | |
| Operating leases | 180.0 | | | 226.8 | |
| | | |
| | | |
| | | |
| Deferred Income Taxes | 1,127.3 | | | 1,081.1 | |
| Other Liabilities | 107.5 | | | 106.4 | |
| Total Liabilities | 9,857.6 | | | 9,053.0 | |
| Shareholders’ Equity | | | |
Common stock, $0.625 par value: Authorized shares — 120,000,000 Issued shares — 69,075,329 and 68,797,027 Outstanding shares — 35,575,691 and 35,464,841 | 42.7 | | | 42.5 | |
| Additional paid in capital | 847.1 | | | 816.1 | |
| Retained earnings | 3,208.1 | | | 3,009.5 | |
| Accumulated other comprehensive loss | (209.6) | | | (167.6) | |
| Treasury stock at cost (33,499,638 and 33,332,186 shares) | (1,449.4) | | | (1,427.5) | |
| Total Shareholders’ Equity | 2,438.9 | | | 2,273.0 | |
| Total Liabilities and Shareholders’ Equity | $ | 12,296.5 | | | $ | 11,326.0 | |
See accompanying notes to consolidated financial statements.
GATX CORPORATION AND SUBSIDIARIES
CONSOLIDATED STATEMENTS OF COMPREHENSIVE INCOME
(In millions, except per share data)
| | | | | | | | | | | | | | | | | |
| Year Ended December 31 |
| 2024 | | 2023 | | 2022 |
| Revenues | | | | | |
| Lease revenue | $ | 1,381.1 | | | $ | 1,251.4 | | | $ | 1,154.6 | |
| Non-dedicated engine revenue | 64.6 | | | 37.6 | | | 1.5 | |
| Marine operating revenue | — | | | 6.9 | | | 18.9 | |
| Other revenue | 139.8 | | | 115.0 | | | 98.0 | |
| Total Revenues | 1,585.5 | | | 1,410.9 | | | 1,273.0 | |
| Expenses | | | | | |
| Maintenance expense | 381.6 | | | 344.8 | | | 292.7 | |
| Depreciation expense | 402.4 | | | 376.3 | | | 357.5 | |
| Operating lease expense | 33.9 | | | 36.0 | | | 36.1 | |
| Marine operating expense | — | | | 6.5 | | | 14.1 | |
| Other operating expense | 57.7 | | | 46.6 | | | 37.4 | |
| Selling, general and administrative expense | 236.3 | | | 212.7 | | | 195.0 | |
| Total Expenses | 1,111.9 | | | 1,022.9 | | | 932.8 | |
| Other Income (Expense) | | | | | |
| Net gain on asset dispositions | 138.3 | | | 130.3 | | | 77.9 | |
| Interest expense, net | (341.0) | | | (263.4) | | | (214.0) | |
| Other expense | (9.5) | | | (9.4) | | | (27.0) | |
| Income before Income Taxes and Share of Affiliates’ Earnings | 261.4 | | | 245.5 | | | 177.1 | |
| Income taxes | (60.0) | | | (58.7) | | | (54.8) | |
| Share of affiliates’ earnings, net of taxes | 82.8 | | | 72.4 | | | 33.6 | |
| Net Income | $ | 284.2 | | | $ | 259.2 | | | $ | 155.9 | |
| Other Comprehensive Income, Net of Taxes | | | | | |
| Foreign currency translation adjustments | $ | (53.8) | | | $ | 45.8 | | | $ | (56.7) | |
| Unrealized gain on derivative instruments | 1.0 | | | 1.3 | | | 1.4 | |
| Post-retirement benefit plans | 10.8 | | | (3.1) | | | 4.3 | |
| Other comprehensive (loss) income | (42.0) | | | 44.0 | | | (51.0) | |
| Comprehensive Income | $ | 242.2 | | | $ | 303.2 | | | $ | 104.9 | |
| | | | | |
| Share Data | | | | | |
| Basic earnings per share | $ | 7.80 | | | $ | 7.13 | | | $ | 4.41 | |
| Average number of common shares | 35.8 | | | 35.7 | | | 35.4 | |
| | | | | |
| Diluted earnings per share | $ | 7.78 | | | $ | 7.12 | | | $ | 4.35 | |
| Average number of common shares and common share equivalents | 35.9 | | | 35.7 | | | 35.9 | |
See accompanying notes to consolidated financial statements.
GATX CORPORATION AND SUBSIDIARIES
CONSOLIDATED STATEMENTS OF CASH FLOWS
(In millions)
| | | | | | | | | | | | | | | | | |
| Year Ended December 31 |
| 2024 | | 2023 | | 2022 |
| Operating Activities | | | | | |
| Net income | $ | 284.2 | | | $ | 259.2 | | | $ | 155.9 | |
| Adjustments to reconcile net income to net cash provided by operating activities: | | | | | |
| Depreciation and amortization | 421.4 | | | 392.1 | | | 371.3 | |
| Net gains on sales of assets | (137.8) | | | (130.9) | | | (121.2) | |
| Asset impairments | — | | | 1.5 | | | 48.9 | |
| Employee benefit plans | (0.8) | | | (4.3) | | | 1.8 | |
| Share-based compensation | 23.0 | | | 18.3 | | | 12.7 | |
| Deferred income taxes | 45.8 | | | 38.3 | | | 36.3 | |
| Share of affiliates’ earnings, net of dividends | (32.8) | | | (47.4) | | | 12.7 | |
| Changes in working capital items | (0.9) | | | (6.4) | | | 15.1 | |
| Net cash provided by operating activities | 602.1 | | | 520.4 | | | 533.5 | |
| Investing Activities | | | | | |
| | | | | |
| | | | | |
| | | | | |
| Portfolio investments and capital additions | (1,674.4) | | | (1,665.0) | | | (1,255.8) | |
| | | | | |
| Portfolio proceeds | 230.6 | | | 272.8 | | | 269.6 | |
| Proceeds from sales of other assets | 24.9 | | | 20.2 | | | 31.1 | |
| | | | | |
| Short-term investments | — | | | 150.0 | | | (148.5) | |
| Other | 2.2 | | | 2.7 | | | 30.1 | |
| Net cash used in investing activities | (1,416.7) | | | (1,219.3) | | | (1,073.5) | |
| Financing Activities | | | | | |
| Net proceeds from issuances of debt with original maturities longer than 90 days | 1,295.6 | | | 1,420.0 | | | 848.3 | |
| Repayments of debt with original maturities longer than 90 days | (413.5) | | | (500.0) | | | (250.0) | |
| Net decrease in debt with original maturities of 90 days or less | — | | | (7.1) | | | — | |
| Purchases of assets previously leased | (30.4) | | | — | | | (1.5) | |
| | | | | |
| Stock repurchases | (21.9) | | | (2.6) | | | (47.2) | |
| Dividends | (84.8) | | | (80.6) | | | (76.6) | |
| Other | 25.5 | | | 14.4 | | | 31.4 | |
| Net cash provided by financing activities | 770.5 | | | 844.1 | | | 504.4 | |
| Effect of Exchange Rate Changes on Cash, Cash Equivalents, and Restricted Cash | (4.9) | | | 1.6 | | | (4.9) | |
| Net (decrease) increase in Cash, Cash Equivalents, and Restricted Cash during the year | (49.0) | | | 146.8 | | | (40.5) | |
| Cash, Cash Equivalents, and Restricted Cash at beginning of year | 450.8 | | | 304.0 | | | 344.5 | |
| Cash, Cash Equivalents, and Restricted Cash at end of year | $ | 401.8 | | | $ | 450.8 | | | $ | 304.0 | |
| | | | | |
| | | | | |
| | | | | |
See accompanying notes to consolidated financial statements.
GATX CORPORATION AND SUBSIDIARIES
CONSOLIDATED STATEMENTS OF CHANGES IN SHAREHOLDERS’ EQUITY
(In millions)
| | | | | | | | | | | | | | | | | | | | | | | | | | | | | | | | | | | |
| 2024 | | 2024 | | 2023 | | 2023 | | 2022 | | 2022 |
| | Shares | | Dollars | | Shares | | Dollars | | Shares | | Dollars |
| Common Stock | | | | | | | | | | | |
| Balance at beginning of year | 68.8 | | | $ | 42.5 | | | 68.6 | | | $ | 42.4 | | | 68.3 | | | $ | 42.2 | |
| Issuance of common stock | 0.3 | | | 0.2 | | | 0.2 | | | 0.1 | | | 0.3 | | | 0.2 | |
| Balance at end of year | 69.1 | | | 42.7 | | | 68.8 | | | 42.5 | | | 68.6 | | | 42.4 | |
| Treasury Stock | | | | | | | | | | | |
| Balance at beginning of year | (33.3) | | | (1,427.5) | | | (33.3) | | | (1,424.9) | | | (32.8) | | | (1,377.7) | |
| Stock repurchases | (0.2) | | | (21.9) | | | — | | | (2.6) | | | (0.5) | | | (47.2) | |
| Balance at end of year | (33.5) | | | (1,449.4) | | | (33.3) | | | (1,427.5) | | | (33.3) | | | (1,424.9) | |
| Additional Paid In Capital | | | | | | | | | | | |
| Balance at beginning of year | | | 816.1 | | | | | 792.2 | | | | | 763.8 | |
| Share-based compensation effects | | | 31.0 | | | | | 23.9 | | | | | 28.4 | |
| | | | | | | | | | | |
| Balance at end of year | | | 847.1 | | | | | 816.1 | | | | | 792.2 | |
| Retained Earnings | | | | | | | | | | | |
| Balance at beginning of year | | | 3,009.5 | | | | | 2,831.5 | | | | | 2,751.5 | |
| Net income | | | 284.2 | | | | | 259.2 | | | | | 155.9 | |
| Dividends declared per share ($2.32 in 2024, $2.20 in 2023 and $2.08 in 2022) | | | (85.6) | | | | | (81.2) | | | | | (75.9) | |
| | | | | | | | | | | |
| Balance at end of year | | | 3,208.1 | | | | | 3,009.5 | | | | | 2,831.5 | |
| Accumulated Other Comprehensive Loss | | | | | | | | | | | |
| Balance at beginning of year | | | (167.6) | | | | | (211.6) | | | | | (160.6) | |
| Other comprehensive (loss) income | | | (42.0) | | | | | 44.0 | | | | | (51.0) | |
| | | | | | | | | | | |
| Balance at end of year | | | (209.6) | | | | | (167.6) | | | | | (211.6) | |
| Total Shareholders’ Equity | | | $ | 2,438.9 | | | | | $ | 2,273.0 | | | | | $ | 2,029.6 | |
See accompanying notes to consolidated financial statements.
GATX CORPORATION AND SUBSIDIARIES
NOTES TO CONSOLIDATED FINANCIAL STATEMENTS
NOTE 1. Description of Business
As used herein, "GATX," "we," "us," "our," and similar terms refer to GATX Corporation and its subsidiaries, unless indicated otherwise.
We lease, operate, manage, and remarket long-lived, widely used assets, primarily in the rail market. We report our financial results through three primary business segments: Rail North America, Rail International, and Engine Leasing (previously named Portfolio Management). Financial results for our tank container leasing business ("Trifleet") are reported in the Other segment.
In 2024, we changed the name of our Portfolio Management business segment to Engine Leasing to reflect the prospective operations of this business segment. Historically, this business segment included marine operations from our liquefied gas-carrying vessels (the "Specialized Gas Vessels"). As of December 31, 2023, we had sold all of our marine assets and no longer have any marine operations. The segment is now almost entirely composed of our engine leasing operations, which include our ownership interest in the Rolls-Royce & Partners Finance ("RRPF") affiliates, a group of joint ventures with Rolls-Royce plc (or affiliates thereof, collectively "Rolls-Royce") that lease aircraft spare engines, and GATX Engine Leasing ("GEL"), our business that directly owns aircraft spare engines that are leased to airline customers or employed in an engine capacity agreement.
NOTE 2. Accounting Changes
New Accounting Pronouncements Adopted
| | | | | | | | |
| Standard/Description | Effective Date and Adoption Considerations | Effect on Financial Statements or Other Significant Matters |
Segment Reporting
In November 2023, the FASB issued ASU 2023-07, Segment Reporting (Topic 280): Improvements to Reportable Segment Disclosures, to improve reportable segment disclosure requirements, particularly around the disclosure of segment expenses that are regularly reported to the chief operating decision maker ("CODM") and included within each reported measure of segment profit.
|
The company adopted this standard in 2024. |
The application of this guidance did not have a significant impact on the Company's consolidated financial statement disclosures on Segment Reporting as presented in "Note 24. Financial Data of Business Segments". |
GATX CORPORATION AND SUBSIDIARIES
NOTES TO CONSOLIDATED FINANCIAL STATEMENTS (Continued)
New Accounting Pronouncements Not Yet Adopted
| | | | | | | | |
| Standard/Description | Effective Date and Adoption Considerations | Effect on Financial Statements or Other Significant Matters |
Income Taxes
In December 2023, the FASB issued ASU 2023-09, Income Taxes (Topic 740): Improvements to Income Tax Disclosures, to enhance disclosures for the effective rate reconciliation and income taxes paid. |
The new guidance will be effective for the Company's Annual Report on Form 10-K for the year-ended December 31, 2025. Early adoption is permitted. |
We continue to assess the effect the new guidance will have on our disclosures. We expect the primary impact to be the level of disaggregation disclosed in the effective rate reconciliation table and the addition of income taxes paid by jurisdiction. |
Disaggregation of Income Statement Expenses
In November 2024, the FASB issued ASU 2024-03, Income Statement - Reporting Comprehensive Income - Expense Disaggregation Disclosures to require public companies to disclose a disaggregation of certain expenses that are presented on the face of the income statement including amounts of purchased inventory, employee compensation, depreciation, amortization, and other related costs and expenses. |
The new guidance will be effective for the Company’s Annual Report on Form 10-K for the year ended December 31, 2027 and subsequent interim periods. Early adoption is permitted. |
We are currently assessing the requirements and the level of disclosure that will be required for our income statement expenses. |
NOTE 3. Significant Accounting Policies
Basis of Presentation
We prepared the accompanying consolidated financial statements in accordance with U.S. generally accepted accounting principles ("GAAP").
Consolidation
Our consolidated financial statements include our assets, liabilities, revenues, and expenses, as well as the assets, liabilities, revenues, and expenses of subsidiaries in which we had a controlling financial interest. We have eliminated intercompany transactions and balances.
Use of Estimates
Preparing financial statements in accordance with GAAP requires us to make estimates and assumptions that affect the amounts we report. We regularly evaluate our estimates and judgments based on historical experience and other relevant facts and circumstances. Actual amounts could differ from our estimates.
Lease Classification
We determine the classification of a lease at its inception. If the provisions of the lease subsequently change, we evaluate whether the modification requires a reassessment of the classification per the guidance around lease modifications within ASC Topic 842, Leases ("Topic 842") and will reassess lease classification, if required. See "Note 6. Leases."
Revenue Recognition
Revenue is recognized when control of the promised goods or services is transferred to our customers, in an amount that reflects the consideration we expect to be entitled to in exchange for those goods and services.
GATX CORPORATION AND SUBSIDIARIES
NOTES TO CONSOLIDATED FINANCIAL STATEMENTS (Continued)
We disaggregate revenue into four categories as presented on our statements of comprehensive income:
Lease Revenue
Lease revenue, which includes operating lease revenue and finance lease revenue, is our primary source of revenue.
Operating Lease Revenue
We lease railcars, locomotives, aircraft spare engines, and tank containers under full-service and net operating leases. We price full-service leases as an integrated service that includes amounts related to maintenance, insurance, and ad valorem taxes. We do not offer stand-alone maintenance service contracts. Operating lease revenue is within the scope of Topic 842, and we have elected not to separate non-lease components from the associated lease component for qualifying leases. Operating lease revenue is recognized on a straight-line basis over the term of the underlying lease. As a result, lease revenue may not be recognized in the same period as maintenance and other costs, which we expense as incurred. Variable rents are recognized when applicable contingencies are resolved. Revenue is not recognized if collectability is not reasonably assured. See "Note 6. Leases."
Finance Lease Revenue
In certain cases, we lease railcars and tank containers that, at lease inception, are classified as finance leases. In accordance with Topic 842, finance lease revenue is recognized using the effective interest method, using the interest rate implicit in the lease. See "Note 6. Leases."
Non-Dedicated Engine Revenue
Certain of our owned aircraft spare engines are part of a pool of non-dedicated spare engines managed under a capacity agreement with Rolls-Royce. Revenue is earned based on our ability to meet engine capacity requirements under the agreement, which requires us to enroll a minimum number of engines in a pool of non-dedicated spare engines for short-term lease to Rolls-Royce customers. We recognize revenue based on our right to receive a portion of the revenue earned by the pool, which is calculated based on the average engine flight hours reported for each type of engine enrolled into the pool.
Marine Operating Revenue
Historically, we generated marine operating revenue through shipping services completed by our marine vessels. As of 2024, we no longer have marine operating revenue, as all marine vessels were sold as of December 31, 2023.
Other Revenue
Other revenue is comprised of customer repair revenue, termination fees, interest income, and other miscellaneous revenues. Select components of other revenue are within the scope of ASC Topic 606, Revenue from Contracts with Customers. Revenue attributable to terms provided in our lease contracts are variable lease components that are recognized when earned, in accordance with Topic 842.
Earnings Per Share
We compute basic and diluted earnings per share using the two-class method, which is an earnings allocation calculation that determines Earnings Per Share ("EPS") for each class of common stock and participating security. Our vested and exercisable stock options contain non-forfeitable rights to dividends or dividend equivalents and are classified as participating securities in the calculation of EPS. Our unvested stock options, restricted stock units, performance shares and non-employee director awards do not contain nonforfeitable rights to dividends or dividend equivalents and are therefore not classified as participating securities. Vested non-employee director awards are treated as shares outstanding for basic and diluted earnings per share because these awards are guaranteed to be settled in shares upon the passage of time.
GATX CORPORATION AND SUBSIDIARIES
NOTES TO CONSOLIDATED FINANCIAL STATEMENTS (Continued)
Under the two-class method, net income is allocated between shares of common stock and participating securities based on their participating rights. Basic EPS is computed by dividing net income, adjusted for earnings allocated to participating securities, by the weighted-average number of common shares outstanding. We weight shares issued or reacquired for the portion of the period that they were outstanding. Diluted EPS is calculated by dividing net income, adjusted for earnings allocated to participating securities, by the weighted-average number of common shares outstanding adjusted for the dilutive effect of unvested stock options, restricted stock units and performance shares. The dilutive effect of participating securities is calculated using the more dilutive of the treasury stock method or the two-class method. Earnings allocated to participating securities include their portion of dividends declared and undistributed earnings during the period.
Cash and Cash Equivalents and Short-Term Investments
We classify all highly liquid investments with a maturity of three months or less at the date of purchase as cash equivalents. Investments with maturities greater than three months but less than one year at the date of purchase are classified as short-term investments.
Restricted Cash
Restricted cash is cash and cash equivalents that are restricted as to withdrawal and use. Our restricted cash primarily relates to cash received from a specific customer and held to pay for potential repairs.
Finance Lease Receivables
We record a gross lease payment receivable and an estimated residual value, net of unearned income for our finance leases. For sales-type leases, we may also recognize a gain or loss in the period the lease is recorded. Lease payment receivables represent the present value of the rents we expect to receive through the end of the lease term for a leased asset. Estimated residual values are our estimates of value of an asset at the end of a finance lease term. The combination of these is considered the net investment in a lease. Over the lease term, the net investment in these leases is reduced and finance lease income is recognized in our consolidated statements of comprehensive income. We evaluate our net investment in finance leases for impairment based on current conditions and reasonable and supportable forecasts of future conditions under ASC Topic 326, Financial Instruments - Credit Losses. See the “Allowance for Losses” section within this Note for more information.
Allowance for Losses
The allowance for losses is our estimate of credit losses associated with receivable balances. Receivables include rent and other receivables and finance lease receivables.
Our loss reserves for rent and other receivables are based on historical loss experience and judgments about the impact of economic conditions, the state of the markets we operate in, and collateral values, if applicable. In addition, we may establish specific reserves for known troubled accounts.
We evaluate reserve estimates for finance lease receivables under ASC 326, on a customer-specific basis, considering each customer's particular credit situation, current economic conditions, and expected value of the underlying collateral upon its repossession, to adjust the allowance when necessary. We also consider the factors we use to evaluate rent and other receivables, which are outlined above.
We record charges against the allowance when we deem them uncollectable. We made no material changes in our estimation methods or assumptions for the allowance during 2024. We believe that the allowance is adequate to cover losses inherent in our receivables balances as of December 31, 2024. Since the allowance is based on judgments and estimates, it is possible that actual losses incurred will differ from the estimate. See "Note 18. Allowance for Losses."
GATX CORPORATION AND SUBSIDIARIES
NOTES TO CONSOLIDATED FINANCIAL STATEMENTS (Continued)
Operating Assets and Facilities
We record operating assets, facilities, and capitalized improvements at cost. We depreciate operating assets and facilities over their estimated useful lives to estimated residual values using the straight-line method. We depreciate leasehold improvements over the shorter of their useful lives or the lease term. Our estimated depreciable lives of operating assets and facilities are as follows:
| | | | | |
| Railcars | 15–45 years |
| Aircraft spare engines | 20–30 years |
| Locomotives | 10–20 years |
| Tank containers | 15–25 years |
| Buildings | 40–50 years |
| Leasehold improvements | 5–15 years |
| Other equipment | 3–30 years |
We review our operating assets and facilities for impairment annually, or if circumstances indicate that the carrying amount of those assets may not be recoverable. We evaluate the recoverability of assets to be held and used by comparing the carrying amount of the asset to the undiscounted future net cash flows we expect the asset to generate. If we determine an asset is impaired, we recognize an impairment loss equal to the amount the carrying amount exceeds the asset’s fair value. We classify assets we plan to sell or otherwise dispose of as held for sale, provided they meet specified accounting criteria, and we record those assets at the lower of their carrying amount or fair value less costs to sell. See "Note 10. Asset Impairments and Assets Held for Sale" for further information about asset impairment losses and assets held for sale.
Leased Assets as a Lessee
We record right-of-use assets for operating leases and finance leases as a lessee and we record the related obligations as liabilities. We amortize the leased assets over the lease terms. We review our right-of-use assets for impairment annually, or if circumstances indicate that the carrying amount of those assets may not be recoverable.
Investments in Affiliates
We use the equity method to account for investments in joint ventures and other unconsolidated entities if we have the ability to exercise significant influence over the financial and operating policies of those investees. Under the equity method, we record our initial investments in these entities at cost and subsequently adjust the investment for our share of the affiliates’ earnings (losses), and distributions. We review the carrying amount of our investments in affiliates annually, or whenever circumstances indicate that the value of these investments may have declined. If we determine an investment is impaired on an other-than-temporary basis, we record a loss equal to the difference between the fair value of the investment and its carrying amount. See "Note 7. Investments in Affiliated Companies."
Goodwill and Intangible Assets
We recognize goodwill when the consideration paid to acquire a business exceeds the fair value of the net assets acquired. We assign goodwill to the same reporting unit as the net assets of the acquired business and we assess our goodwill for impairment on an annual basis in the fourth quarter, or if impairment indicators are present. Goodwill is initially assessed for impairment by performing a qualitative assessment to determine if it was more likely than not that the fair value of the reporting unit exceeded its carrying value. If necessary, the fair value of the reporting unit is then compared to its carrying value, including goodwill. If the carrying amount of the applicable reporting unit exceeds its fair value, we record an impairment loss for the difference. The fair values of our reporting units are determined using discounted cash flow models. See "Note 17. Goodwill."
We recognize intangible assets acquired in a business combination at their estimated fair value at the time of the business combination. Intangible assets consist of customer relationships and trade names and are amortized on a straight-line basis over their estimated useful lives ranging from 10 years to 25 years. We review intangible assets for potential impairment if circumstances indicate that the carrying amount of those assets may not be recoverable. Intangible assets are included in other assets on the balance sheet.
GATX CORPORATION AND SUBSIDIARIES
NOTES TO CONSOLIDATED FINANCIAL STATEMENTS (Continued)
Income Taxes
We calculate provisions for federal, state, and foreign income taxes on our reported income before income taxes. We base our calculations of deferred tax assets and liabilities on the differences between the financial statement and tax bases of assets and liabilities, using enacted rates in effect for the year we expect the differences will reverse. We reflect the cumulative effect of changes in tax rates from those we previously used to determine deferred tax assets and liabilities in the provision for income taxes in the period the change is enacted. Provisions for income taxes in any given period can differ from those currently payable or receivable because certain items of income and expense are recognized in different periods for financial reporting purposes than for income tax purposes. We may deduct expenses or defer income attributable to uncertain tax positions for tax purposes, and include those items in our liability for uncertain tax positions in other liabilities on the balance sheet. See "Note 13. Income Taxes."
Fair Value Measurements
Fair value is the price that a market participant would receive to sell an asset or pay to transfer a liability in an orderly transaction at the measurement date. We classify fair value measurements according to the three-level hierarchy defined by GAAP, and those classifications are based on our judgment about the reliability of the inputs we use in the fair value measurement. Level 1 inputs are quoted prices available in active markets for identical assets or liabilities. Level 2 inputs are observable, either directly or indirectly, and may include quoted prices for similar assets or liabilities, quoted prices in markets that are not active, or other inputs that are observable or can be corroborated by observable market data. For assets or liabilities with a specified contractual term, Level 2 inputs must be observable for substantially the full term of that asset or liability. Level 3 inputs are unobservable, meaning they are supported by little or no market activity. Fair value measurements classified as Level 3 typically rely on pricing models and discounted cash flow methodologies, both of which require significant judgment. See "Note 9. Fair Value."
Derivatives
We use derivatives, such as interest rate swap agreements, treasury rate locks, options, cross currency swaps, and currency forwards, to hedge our exposure to interest rate and foreign currency exchange rate risk on existing and anticipated transactions. We formally designate derivatives that meet specific accounting criteria as qualifying hedges at inception. These criteria require us to have the expectation that the derivative will be highly effective at offsetting changes in the fair value or expected cash flows of the hedged exposure, both at the inception of the hedging relationship and on an ongoing basis.
We recognize all derivative instruments at fair value and classify them on the balance sheet as either other assets or other liabilities. We generally base the classification of derivative activity in the statements of comprehensive income and cash flows on the nature of the hedged item. For derivatives we designate as fair value hedges, we recognize changes in the fair value of both the derivative and the hedged item in interest expense, and we include the related cash flows in the cash flow section corresponding to the hedged item. For derivatives we designate as cash flow hedges, we record the effective portion of the change in the fair value of the derivative as part of other comprehensive (loss) income, and we recognize those changes in earnings in the period the hedged transaction affects earnings. We recognize any ineffective portion of the change in the fair value of the derivative immediately in earnings. Cash flows from derivatives designated as cash flow hedges are included in the cash flow section corresponding to the hedged item. Although we do not hold or issue derivative financial instruments for purposes other than hedging, we may not designate certain derivatives as accounting hedges. We recognize changes in the fair value of these derivatives in earnings immediately. We classify gains and losses on derivatives that are not designated as hedges as other expenses, and we include the related cash flows in cash flows from operating activities. See "Note 9. Fair Value."
Foreign Currency
We translate the assets and liabilities of our operations that have non-US dollar functional currencies at exchange rates in effect at year-end. Revenue, expenses, and cash flows are translated monthly using average exchange rates. We defer gains and losses resulting from foreign currency translation and record those gains and losses as a separate component of accumulated other comprehensive loss. Gains and losses resulting from foreign currency transactions and from the remeasurement of non-functional currency assets and liabilities are recognized in other expense during the periods in which they occur. Net gains (losses) recognized were $0.6 million, $6.9 million and $(4.6) million for 2024, 2023, and 2022.
GATX CORPORATION AND SUBSIDIARIES
NOTES TO CONSOLIDATED FINANCIAL STATEMENTS (Continued)
Environmental Liabilities
We record accruals for environmental remediation costs at applicable sites when they are probable and when we can reasonably estimate the expected costs. We record adjustments to initial estimates as necessary. Since these accruals are based on estimates, actual environmental remediation costs may differ. We expense or capitalize environmental remediation costs related to current or future operations as appropriate. See "Note 23. Legal Proceedings and Other Contingencies."
Defined Benefit Pension and Other Post-Retirement Plans
Our balance sheet reflects the funded status of our pension and post-retirement plans, which is the difference between the fair value of the plan assets and the projected benefit obligation. We recognize the aggregate overfunding of any plans in other assets, the aggregate underfunding of any plans in other liabilities, and the corresponding adjustments for unrecognized actuarial gains (losses) and prior service cost (credits) in accumulated other comprehensive loss. We record the service cost component of net periodic cost in selling, general, and administrative expense in the statements of comprehensive income and the non-service components in other expense. See "Note 11. Pension and Other Post-Retirement Benefits."
Maintenance and Repair Costs
We expense maintenance and repair costs as incurred. We capitalize certain costs incurred in connection with planned major maintenance activities if those activities improve the asset or extend its useful life. We depreciate those capitalized costs over the estimated useful life of the improvement.
Operating Lease Expense
We classify leases of certain railcars and other equipment as operating leases. We record the lease expense associated with these leases in operating lease expense on a straight-line basis. We also classify our leases of office facilities and related administrative assets as operating leases, and we record the associated expense in selling, general and administrative expense. See "Note 6. Leases."
Share-Based Compensation
We base our measurement of share-based compensation expense on the grant date fair value of an award, and we recognize the expense over the requisite service period. Forfeitures are recorded when they occur. For awards accounted for as liability awards, the liability and related compensation expense is adjusted to reflect the fair value of the underlying shares at the end of each reporting period. We recognize compensation expense for these awards over the applicable vesting period. See "Note 12. Share-Based Compensation."
Net Gain on Asset Dispositions
Net gain on dispositions includes gains and losses on sales of operating assets and residual sharing income, which we also refer to as asset remarketing income; non-remarketing disposition gains, primarily from scrapping of railcars; and asset impairment losses. We recognize disposition gains, including non-remarketing gains, upon completion of the sale or scrapping of operating assets. Residual sharing income includes fees we receive from the sale of managed assets, and we recognize these fees upon completion of the underlying transactions.
The following table presents the net gain on asset dispositions for the years ended December 31 (in millions):
| | | | | | | | | | | | | | | | | |
| 2024 | | 2023 | | 2022 |
| Net disposition gains | $ | 122.0 | | | $ | 119.8 | | | $ | 104.1 | |
| Residual sharing income | 0.5 | | | 0.9 | | | 5.6 | |
| Non-remarketing net disposition gains | 15.8 | | | 11.1 | | | 17.1 | |
| Asset impairments (1) | — | | | (1.5) | | | (48.9) | |
| Net gain on asset dispositions | $ | 138.3 | | | $ | 130.3 | | | $ | 77.9 | |
__________
(1) See "Note 10. Asset Impairments and Assets Held for Sale" for further information about asset impairment losses.
GATX CORPORATION AND SUBSIDIARIES
NOTES TO CONSOLIDATED FINANCIAL STATEMENTS (Continued)
Interest Expense, net
Interest expense is the interest we accrue on indebtedness and the amortization of debt issuance costs and debt discounts and premiums. We defer debt issuance costs and debt discounts and premiums and amortize them over the term of the related debt. We report interest expense net of interest income on bank deposits. Interest income on bank deposits was $24.3 million in 2024, $15.2 million in 2023, and $6.4 million in 2022.
Other Expense
We include fair value adjustments on certain financial instruments, gains and/or losses on foreign currency transactions, legal defense costs and litigation settlements, along with other miscellaneous income and expense items in other expense.
NOTE 4. Supplemental Cash Flow Information
The following table shows supplemental cash flow information for the years ended December 31 (in millions):
| | | | | | | | | | | | | | | | | |
| 2024 | | 2023 | | 2022 |
| | | | | |
| Interest paid (1) | $ | 350.1 | | | $ | 260.1 | | | $ | 202.7 | |
| Income taxes paid, net | 23.0 | | | 17.3 | | | 18.7 | |
________
(1) Interest paid consisted of interest on debt obligations and interest rate swaps (net of interest received).
NOTE 5. Operating Assets and Facilities
The following table shows the components of our operating assets and facilities as of December 31 (in millions):
| | | | | | | | | | | |
| 2024 | | 2023 |
| Railcars and locomotives | $ | 12,702.9 | | | $ | 11,700.8 | |
| Aircraft spare engines | 1,030.4 | | | 769.7 | |
| Tank containers | 241.4 | | | 237.7 | |
| Buildings, leasehold improvements, and other equipment | 265.3 | | | 253.0 | |
| Other | 90.6 | | | 120.7 | |
| $ | 14,330.6 | | | $ | 13,081.9 | |
| Less: allowance for depreciation | (3,880.9) | | | (3,670.7) | |
| Net operating assets and facilities | $ | 10,449.7 | | | $ | 9,411.2 | |
The following table shows the components of our total depreciation expense for the years ended December 31 (in millions):
| | | | | | | | | | | | | | | | | |
| 2024 | | 2023 | | 2022 |
| Operating assets and facilities, included in depreciation expense | $ | 402.4 | | | $ | 376.3 | | | $ | 357.5 | |
| Maintenance operating assets and facilities, included in maintenance expense | 11.8 | | | 9.3 | | | 7.5 | |
| Depreciation on operating assets and facilities | $ | 414.2 | | | $ | 385.6 | | | $ | 365.0 | |
| Non-operating assets, included in SG&A | 6.7 | | | 5.9 | | | 6.3 | |
| Total depreciation expense | $ | 420.9 | | | $ | 391.5 | | | $ | 371.3 | |
GATX CORPORATION AND SUBSIDIARIES
NOTES TO CONSOLIDATED FINANCIAL STATEMENTS (Continued)
NOTE 6. Leases
GATX as Lessor
We lease railcars, locomotives, aircraft spare engines, and tank containers under full-service and net operating leases. We price full-service leases as an integrated service that includes amounts related to maintenance, insurance, and ad valorem taxes. In accordance with applicable guidance, we do not separate lease and non-lease components when reporting revenue for our full-service operating leases. In some cases, we lease railcars and tank containers that, at commencement, are classified as finance leases. For certain operating leases, revenue is based on equipment usage and is recognized when earned. Typically, our leases do not provide customers with renewal options or options to purchase the asset. Our lease agreements do not generally have residual value guarantees. We collect reimbursements from customers for damage to our railcars, as well as additional rental payments for usage above specified levels, as provided in the lease agreements.
The following table shows the components of our lease revenue for the years ended December 31 (in millions):
| | | | | | | | | | | | | | | | | |
| 2024 | | 2023 | | 2022 |
| Operating lease revenue: | | | | | |
| Fixed lease revenue | $ | 1,263.5 | | | $ | 1,145.1 | | | $ | 1,058.3 | |
| Variable lease revenue | 104.1 | | | 93.7 | | | 86.5 | |
| Total operating lease revenue | $ | 1,367.6 | | | $ | 1,238.8 | | | $ | 1,144.8 | |
| Finance lease revenue | 13.5 | | | 12.6 | | | 9.8 | |
| Total lease revenue | $ | 1,381.1 | | | $ | 1,251.4 | | | $ | 1,154.6 | |
In accordance with the terms of our leases with customers, we may earn additional revenue, primarily for customer repairs. This additional revenue is reported in other revenue in the statements of comprehensive income and was $115.8 million, $94.6 million and $81.5 million in 2024, 2023 and 2022.
The following table shows the components of our finance leases as of December 31 (in millions):
| | | | | | | | | | | |
| 2024 | | 2023 |
| Total contractual lease payments receivable | $ | 160.0 | | | $ | 171.8 | |
| Estimated unguaranteed residual value of leased assets | 17.2 | | | 17.2 | |
| Unearned income | (58.9) | | | (52.6) | |
| Finance leases | $ | 118.3 | | | $ | 136.4 | |
The following table shows our future contractual receipts from our noncancelable operating and finance leases as of December 31, 2024 (in millions):
| | | | | | | | | | | | | | | | | |
| Operating Leases (1) | | Finance Leases | | Total |
| 2025 | $ | 1,157.5 | | | $ | 35.9 | | | $ | 1,193.4 | |
| 2026 | 915.0 | | | 33.3 | | | 948.3 | |
| 2027 | 720.9 | | | 23.7 | | | 744.6 | |
| 2028 | 565.8 | | | 20.7 | | | 586.5 | |
| 2029 | 400.5 | | | 12.8 | | | 413.3 | |
| Thereafter | 1,048.0 | | | 33.6 | | | 1,081.6 | |
| $ | 4,807.7 | | | $ | 160.0 | | | $ | 4,967.7 | |
__________
(1) The future contractual receipts due under our full-service operating leases include executory costs such as maintenance, car taxes, and insurance.
We recorded gains on finance leases of $8.5 million, $12.9 million and $1.0 million in 2024, 2023 and 2022. The gains are reported in net gain on asset dispositions in the statements of comprehensive income.
GATX CORPORATION AND SUBSIDIARIES
NOTES TO CONSOLIDATED FINANCIAL STATEMENTS (Continued)
GATX as Lessee
We lease assets, including railcars at North America, as well as other assets such as offices, maintenance facilities, and other general purpose equipment. Railcars are subleased to customers as part of our normal course of operations. Certain leases have options to purchase the underlying assets early, renew the lease, or purchase the underlying assets at the end of the lease term. The specific terms of the renewal and purchase options vary, and we did not include these amounts in our future contractual rental payments. Additionally, the contractual rental payments do not include amounts we are required to pay for licenses, taxes, insurance, and maintenance. Our lease agreements do not contain any material residual value guarantees. At December 31, 2024, we leased 4,432 railcars at Rail North America, all of which are accounted for as operating leases.
To calculate the right-of-use asset and lease liability for our leases, we use the implicit rate if readily determinable or when the implicit rate is not readily determinable, we use our incremental borrowing rate. Our incremental borrowing rate is the interest rate we estimate we would have to pay to borrow on a collateralized basis over a similar term of the lease payments. The implicit rate was measurable for railcars leased at Rail North America. For our other operating leases, we used our incremental borrowing rate. Leases with an initial term of 12 months or less are not recorded on the balance sheet. Operating lease expense is recognized on a straight-line basis over the lease term.
The following table shows the components of lease expense for the years ended December 31 (in millions): | | | | | | | | | | | | | | | | | |
| 2024 | | 2023 | | 2022 |
| Operating lease cost (1): | | | | | |
| Fixed lease cost - operating leases | $ | 40.0 | | | $ | 41.6 | | | $ | 41.4 | |
| | | | | |
| Finance lease cost: | | | | | |
| Amortization of right-of-use assets | 0.2 | | | — | | | — | |
| Interest on lease liabilities | 0.3 | | | — | | | — | |
| Total lease cost | $ | 40.5 | | | $ | 41.6 | | | $ | 41.4 | |
________ (1) Total operating lease cost includes amounts recorded in operating lease expense and selling, general and administrative expense. Operating lease cost also includes short-term leases, which are immaterial.
Operating lease cost includes amounts attributable to sale lease-back financing transactions for railcars we lease to customers. Lease revenue of $41.9 million for 2024 was recognized in connection with these operating leases compared to $41.3 million for 2023 and $40.1 million for 2022.
The following table shows the maturities of our lease liabilities as of December 31, 2024 (in millions):
| | | | | | | | | |
| Operating Leases | | | | |
| 2025 | $ | 35.6 | | | | | |
| 2026 | 35.8 | | | | | |
| 2027 | 32.8 | | | | | |
| 2028 | 25.6 | | | | | |
| 2029 | 18.4 | | | | | |
| Thereafter | 55.3 | | | | | |
| Total undiscounted lease payments | $ | 203.5 | | | | | |
| Less: amounts representing interest | (23.5) | | | | | |
| Total discounted lease liabilities | $ | 180.0 | | | | | |
GATX CORPORATION AND SUBSIDIARIES
NOTES TO CONSOLIDATED FINANCIAL STATEMENTS (Continued)
The following table shows the lease terms and discount rates related to leases as of December 31:
| | | | | | | | | | | |
| 2024 | | 2023 |
| Weighted-average remaining lease term (in years): | | | |
| Operating leases | 6.5 | | 7.0 |
| | | |
| Weighted-average discount rate: | | | |
| Operating leases | 3.66 | % | | 3.61 | % |
| | | |
The following table shows other information related to leases for the years ended December 31 (in millions):
| | | | | | | | | | | | | | | | | |
| 2024 | | 2023 | | 2022 |
| Cash paid for amounts included in the measurement of lease liabilities: | | | | | |
| Operating cash flows for operating leases | $ | 40.0 | | | $ | 41.2 | | | $ | 42.4 | |
| | | | | |
| Financing cash flows for finance leases | 30.4 | | | — | | | 1.5 | |
| Total cash for leases | $ | 70.4 | | | $ | 41.2 | | | $ | 43.9 | |
| | | | | |
| Non-cash financing lease transactions (1) | $ | 30.1 | | | $ | — | | | $ | — | |
| | | | | |
| | | | | |
| | | | | |
| | | | | |
__________
(1) Non-cash financing lease transactions are a result of the reclassification from operating lease liability to finance lease liability upon notice of the intent to exercise an early buy-out option.
In 2024, we exercised options to acquire 728 railcars previously recorded on the balance sheet as a finance lease for $30.4 million, compared to no activity in 2023 and 21 railcars for $1.5 million in 2022.
NOTE 7. Investments in Affiliated Companies
Investments in affiliated companies is composed of investments in domestic and foreign affiliates, and primarily include entities that lease aircraft spare engines.
The following table presents our investments in affiliated companies and our ownership percentage in those companies by segment as of December 31 (in millions):
| | | | | | | | | | | | | | | | | | | | | | | |
| Segment | | 2024 | | 2023 | | Percentage
Ownership |
| Rolls-Royce & Partners Finance (1) | Engine Leasing | | $ | 663.1 | | | $ | 626.8 | | | 50.0 | % |
| RailPulse LLC | Rail North America | | 0.2 | | | 0.2 | | | 10.0 | % |
| Investments in Affiliated Companies | | | $ | 663.3 | | | $ | 627.0 | | | |
__________
(1) Combined investment balances of a group of 50% owned domestic and foreign joint ventures with Rolls-Royce.
The following table shows our share of affiliates’ earnings (losses) by segment for the years ended December 31 (in millions): | | | | | | | | | | | | | | | | | |
| 2024 | | 2023 | | 2022 |
| Rail North America | $ | — | | | $ | (0.6) | | | $ | 0.5 | |
| | | | | |
| Engine Leasing | 108.3 | | | 98.7 | | | 45.4 | |
| Share of affiliates' pre-tax earnings | 108.3 | | | 98.1 | | | 45.9 | |
| Income taxes | (25.5) | | | (25.7) | | | (12.3) | |
| Share of affiliates' earnings, net of taxes | $ | 82.8 | | | $ | 72.4 | | | $ | 33.6 | |
GATX CORPORATION AND SUBSIDIARIES
NOTES TO CONSOLIDATED FINANCIAL STATEMENTS (Continued)
There were no cash investments in affiliates in any of the periods presented. The following table shows distributions received from affiliates, by segment, for the years ended December 31 (in millions):
| | | | | | | | | | | | | | | | | | | | | | | | | |
| | | Cash Distributions |
| | | | | | | 2024 | | 2023 | | 2022 |
| | | | | | | | | | | |
| Engine Leasing | | | | | | | $ | 50.0 | | | $ | 25.0 | | | $ | 46.3 | |
| Total | | | | | | | $ | 50.0 | | | $ | 25.0 | | | $ | 46.3 | |
Summarized Financial Data of Affiliates
The following table shows the aggregated operating results for the years ended December 31 for the affiliated companies we held at December 31 (in millions):
| | | | | | | | | | | | | | | | | |
| 2024 | | 2023 | | 2022 |
| Revenues | $ | 514.0 | | | $ | 487.2 | | | $ | 417.7 | |
| Net gains on sales of assets | 75.2 | | | 91.7 | | | 22.9 | |
| Net income | 164.0 | | | 150.6 | | | 73.9 | |
The following table shows aggregated summarized balance sheet data for our affiliated companies as of December 31 (in millions):
| | | | | | | | | | | |
| 2024 | | 2023 |
| Current assets | $ | 610.5 | | | $ | 495.9 | |
| Noncurrent assets | 4,709.1 | | | 4,108.3 | |
| Total assets | $ | 5,319.6 | | | $ | 4,604.2 | |
| | | |
| Current liabilities | $ | 618.4 | | | $ | 351.5 | |
| Noncurrent liabilities | 3,405.1 | | | 3,024.1 | |
| Shareholders’ equity | 1,296.1 | | | 1,228.6 | |
| Total liabilities and shareholders' equity | $ | 5,319.6 | | | $ | 4,604.2 | |
Summarized Financial Data for the RRPF Affiliates
Our affiliate investments include interests in each of the RRPF affiliates, a group of 50% owned domestic and foreign joint ventures with Rolls-Royce plc, a leading manufacturer of commercial aircraft jet engines. The RRPF affiliates are primarily engaged in two business activities: lease financing of aircraft spare engines to a diverse group of commercial aircraft operators worldwide and lease financing of aircraft spare engines to Rolls-Royce for use in its engine maintenance programs. In aggregate, the RRPF affiliates owned 427 aircraft engines at December 31, 2024, of which 198 were on lease to Rolls-Royce. Aircraft engines are generally depreciated over a useful life of 20 to 30 years to their estimated residual value. Lease terms vary but typically range from 5 to 12 years. Seconded Rolls-Royce employees act as manager for each of the RRPF affiliates and also perform substantially all required maintenance activities. In addition, the RRPF affiliates manage all of GEL's aircraft spare engines, for which we paid them a fee of $4.1 million in 2024, $2.7 million in 2023, and $1.0 million in 2022. Our share of affiliates' earnings (after-tax) from the RRPF affiliates was $82.8 million in 2024, $72.8 million in 2023, and $33.2 million in 2022. In 2022, financial results included $11.5 million (after-tax) of impairment losses related to aircraft spare engines in Russia that RRPF does not expect to recover.
GATX CORPORATION AND SUBSIDIARIES
NOTES TO CONSOLIDATED FINANCIAL STATEMENTS (Continued)
We derived the following financial information from the combined financial statements of the RRPF affiliates.
The following table shows condensed income statements of the RRPF affiliates for the years ending December 31 (in millions):
| | | | | | | | | | | | | | | | | |
| 2024 | | 2023 | | 2022 |
| Lease revenue from third parties | $ | 268.1 | | | $ | 224.8 | | | $ | 192.8 | |
| Lease revenue from Rolls-Royce | 225.3 | | | 253.0 | | | 222.8 | |
| Other revenue | 18.9 | | | 6.0 | | | — | |
| Depreciation expense | (206.2) | | | (223.7) | | | (230.6) | |
| Interest expense | (127.3) | | | (135.9) | | | (110.1) | |
| Other expenses | (37.7) | | | (19.3) | | | (7.0) | |
| Other income, including net gains on sales of assets | 75.5 | | | 92.6 | | | 22.9 | |
| Income before income taxes | 216.6 | | | 197.5 | | | 90.8 | |
| Income taxes (1) | (49.4) | | | (42.5) | | | (17.5) | |
| Net income | $ | 167.2 | | | $ | 155.0 | | | $ | 73.3 | |
_________
(1)Represents income taxes directly attributable to the RRPF affiliates in the United Kingdom. Certain of the RRPF affiliates are disregarded entities for income tax purposes and, as a result, income taxes are incurred at the shareholder level.
The following table shows the condensed balance sheets of the RRPF affiliates as of December 31 (in millions):
| | | | | | | | | | | |
| | 2024 | | 2023 |
| Current assets | $ | 607.9 | | | $ | 493.2 | |
| Noncurrent assets, including operating assets, net of accumulated depreciation of $1,618.4 and $1,646.3 (1) | 4,709.1 | | | 4,108.3 | |
| Total assets | $ | 5,317.0 | | | $ | 4,601.5 | |
| | | |
| Accounts payable and accrued expenses | $ | 239.6 | | | $ | 170.0 | |
| Debt: | | | |
| Current | 378.2 | | | 181.5 | |
| Noncurrent, net of adjustments for hedges | 2,673.7 | | | 2,451.1 | |
| Other liabilities | 731.3 | | | 571.9 | |
| Shareholders’ equity | 1,294.2 | | | 1,227.0 | |
| Total liabilities and shareholders' equity | $ | 5,317.0 | | | $ | 4,601.5 | |
_________
(1) $3,954.7 million of operating assets were pledged as collateral for long-term debt obligations at December 31, 2024.
The following table shows contractual future lease receipts from noncancelable leases of the RRPF affiliates as of December 31, 2024 (in millions):
| | | | | | | | | | | | | | | | | |
| Rolls-Royce | | Third Parties | | Total |
| 2025 | $ | 188.0 | | | $ | 329.1 | | | $ | 517.1 | |
| 2026 | 190.8 | | | 323.8 | | | 514.6 | |
| 2027 | 134.8 | | | 264.2 | | | 399.0 | |
| 2028 | 61.3 | | | 234.4 | | | 295.7 | |
| 2029 | 49.0 | | | 218.1 | | | 267.1 | |
| Thereafter | 142.1 | | | 700.5 | | | 842.6 | |
| Total | $ | 766.0 | | | $ | 2,070.1 | | | $ | 2,836.1 | |
GATX CORPORATION AND SUBSIDIARIES
NOTES TO CONSOLIDATED FINANCIAL STATEMENTS (Continued)
The following table shows the scheduled principal payments of debt obligations of the RRPF affiliates as of December 31, 2024 (in millions):
| | | | | |
| 2025 | $ | 366.0 | |
| 2026 | 465.6 | |
| 2027 | 427.9 | |
| 2028 | 438.0 | |
| 2029 | 75.0 | |
| Thereafter | 1,024.0 | |
| Total debt principal (1) | $ | 2,796.5 | |
__________
(1) All debt obligations are nonrecourse to the shareholders.
NOTE 8. Debt
Debt Obligations
The following table shows the outstanding balances of our debt obligations and the applicable interest rates as of December 31 (in millions):
| | | | | | | | | | | |
| | | |
| 2024 | | 2023 |
| Unsecured Recourse Fixed Rate Debt: | | | |
| U.S. | | | |
| 3.25% Notes due March 2025 | $ | 300.0 | | | $ | 300.0 | |
| 3.25% Notes due September 2026 | 350.0 | | | 350.0 | |
| 5.40% Notes due March 2027 | 350.0 | | | — | |
| 3.85% Notes due March 2027 | 300.0 | | | 300.0 | |
| 3.50% Notes due March 2028 | 300.0 | | | 300.0 | |
| 4.55% Notes due November 2028 | 300.0 | | | 300.0 | |
| 4.70% Notes due April 2029 | 500.0 | | | 500.0 | |
| 4.00% Notes due June 2030 | 500.0 | | | 500.0 | |
| 1.90% Notes due June 2031 | 400.0 | | | 400.0 | |
| 3.50% Notes due June 2032 | 400.0 | | | 400.0 | |
| 4.90% Notes due March 2033 | 400.0 | | | 400.0 | |
| 5.45% Notes due September 2033 | 400.0 | | | 400.0 | |
| | | |
| 6.05% Notes due March 2034 | 500.0 | | | 300.0 | |
| 6.90% Notes due May 2034 | 400.0 | | | 400.0 | |
| 5.20% Notes due March 2044 | 300.0 | | | 300.0 | |
| 4.50% Notes due March 2045 | 250.0 | | | 250.0 | |
| 3.10% Notes due June 2051 | 550.0 | | | 550.0 | |
| 6.05% Notes due May 2054 | 400.0 | | | — | |
| 4.35% Notes due February 2024 | — | | | 300.0 | |
| $ | 6,900.0 | | | $ | 6,250.0 | |
| Europe (1) | | | |
| 1.00% Notes due March 2025 | $ | 103.5 | | | $ | 110.4 | |
| 1.13% Notes due August 2025 | 103.5 | | | 110.4 | |
| 0.90% Schuldschein loan due October 2026 | 23.8 | | | 25.4 | |
| 1.07% Notes due November 2026 | 77.7 | | | 82.8 | |
GATX CORPORATION AND SUBSIDIARIES
NOTES TO CONSOLIDATED FINANCIAL STATEMENTS (Continued)
| | | | | | | | | | | |
| | | |
| 2024 | | 2023 |
| 5.23% Schuldschein loan due November 2026 | 38.8 | | | 41.4 | |
| 4.37% Schuldschein loan due May 2027 | 36.2 | | | — | |
| 1.17% Schuldschein loan due October 2028 | 53.8 | | | 57.4 | |
| 1.56% Schuldschein loan due October 2031 | 77.7 | | | 82.8 | |
| 3.62% Loan due December 2031 (3) | 103.5 | | | 110.4 | |
| 0.85% Notes due May 2024 | — | | | 115.8 | |
| $ | 618.5 | | | $ | 736.8 | |
| India (2) | | | |
| 8.39% - 8.83% Term loan due June 2027 (4) | $ | 47.9 | | | $ | 49.4 | |
| 8.13% - 8.53% Term loan due February 2028 (4) | 26.9 | | | 27.6 | |
| 8.43% - 8.94% Term loan due February 2029 (4) | 46.7 | | | 24.0 | |
| 8.51% - 8.88% Term loan due January 2030 (4) | 23.4 | | | — | |
| $ | 144.9 | | | $ | 101.0 | |
| | | |
| Total unsecured fixed rate debt | $ | 7,663.4 | | | $ | 7,087.8 | |
| | | |
| Unsecured Recourse Floating Rate Debt (5): | | | |
| U.S. | | | |
| 6.47% Notes due January 2026 | $ | 100.0 | | | $ | 100.0 | |
| 6.30% Notes due January 2028 | 50.0 | | | 50.0 | |
| 7.14% Notes due September 2029 | 50.0 | | | 50.0 | |
| $ | 200.0 | | | $ | 200.0 | |
| Europe (1) | | | |
| 4.32% Loan due December 2025 | $ | 125.3 | | | $ | — | |
| 4.84% Notes due December 2027 | 113.9 | | | 121.4 | |
| 5.36% Loan due May 2029 | 77.7 | | | — | |
| 6.05% Loan due November 2030 | 38.8 | | | 41.4 | |
| 5.02% Loan due March 2031 | 51.8 | | | — | |
| $ | 407.5 | | | $ | 162.8 | |
| | | |
| Total recourse floating rate debt | $ | 607.5 | | | $ | 362.8 | |
| | | |
| Total debt principal | $ | 8,270.9 | | | $ | 7,450.6 | |
| Unamortized debt discount and debt issuance costs | (51.6) | | | (54.5) | |
| Debt adjustment for fair value hedges | (4.0) | | | (8.0) | |
| Total Debt | $ | 8,215.3 | | | $ | 7,388.1 | |
__________
(1) Denominated in euros, but presented in U.S. dollars in this table.
(2) Denominated in Indian rupees, but presented in U.S. dollars in this table.
(3) The loan was originally set to mature in November 2024 but was extended to December 2031 at a new rate of 3.62%.
(4) Term loans were drawn against delayed draw term loans in multiple tranches, resulting in various interest rates for each tranche.
(5) For floating rate debt, the interest disclosed is the applicable interest rate as of December 31, 2024.
GATX CORPORATION AND SUBSIDIARIES
NOTES TO CONSOLIDATED FINANCIAL STATEMENTS (Continued)
The following table shows the weighted-average interest rate and term of our recourse debt as of December 31:
| | | | | | | | | | | |
| 2024 | | 2023 |
| Weighted-average interest rate | 4.59 | % | | 4.08 | % |
| Weighted-average term, in years | 8.6 | | 8.4 |
The following table shows the scheduled principal payments of our debt obligations as of December 31, 2024 (in millions):
| | | | | |
| 2025 | $ | 632.4 | |
| 2026 | 602.3 | |
| 2027 | 836.1 | |
| 2028 | 730.7 | |
| 2029 | 674.4 | |
| Thereafter | 4,795.0 | |
| Total debt principal | $ | 8,270.9 | |
Borrowings Under Bank Credit Facilities
The following table shows the balance and weighted-average interest rate of our borrowings under bank credit facilities as of December 31 (in millions):
| | | | | | | | | | | |
| 2024 | | 2023 |
| Balance | $ | 10.4 | | | $ | 11.0 | |
| Weighted-average interest rate | 4.24 | % | | 3.86 | % |
Credit Lines and Facilities
In 2024, we entered into a $600 million, 5-year unsecured revolving credit facility in the United States, expiring in May 2029. The facility contains two one-year extension options. This replaced our prior $600 million, 5-year unsecured revolving credit facility. As of December 31, 2024, the full $600 million was available under this facility. We also entered into a $350 million 3-year unsecured revolving credit facility in the United States, expiring in May 2027. This facility contains two one-year extension options. This replaced our prior $250 million 3-year unsecured revolving credit facility. As of December 31, 2024, the full $350 million was available under this facility.
In 2024, we entered into a new €210 million, 3-year unsecured revolving credit facility in Europe, expiring in December 2027. In total, our European subsidiaries have unsecured credit facilities with an aggregate limit of €245.0 million. As of December 31, 2024, €235.0 million was available under these credit facilities.
Annual commitment fees for GATX's credit facilities were $1.3 million for 2024, $1.1 million for 2023, and $1.2 million for 2022.
Delayed Draw Term Loans
As of December 31, 2024, we had INR 2.0 billion ($23.4 million) available under an outstanding delayed draw term loan in India.
GATX CORPORATION AND SUBSIDIARIES
NOTES TO CONSOLIDATED FINANCIAL STATEMENTS (Continued)
Restrictive Covenants
Our $600 million and $350 million revolving credit facilities in the United States, and our €210 million revolving credit facility in Europe, contain various restrictive covenants, including requirements to maintain a fixed charge coverage ratio and an asset coverage test. Our ratio of earnings to fixed charges, as defined in this facility, was 2.0 for the period ended December 31, 2024, which is in excess of the minimum covenant ratio of 1.2. Some of our bank term loans have the same financial covenants as these facilities.
The indentures for our public debt also contain various restrictive covenants, including limitations on liens provisions that restrict the amount of additional secured indebtedness that we may incur. As of December 31, 2024, this limit was $2.4 billion. Additionally, certain exceptions to the covenants permit us to incur an unlimited amount of purchase money and nonrecourse indebtedness.
At December 31, 2024, our European subsidiaries had outstanding term loans, public debt, and private placement debt balances totaling €991.0 million. The loans are guaranteed by GATX Corporation and are subject to similar restrictive covenants as the revolving credit facility noted above.
At December 31, 2024, we were in compliance with all covenants and conditions of all of our credit agreements, indentures and loans. We do not anticipate any covenant violations nor do we expect that any of these covenants will restrict our operations or our ability to obtain additional financing.
NOTE 9. Fair Value
The assets and liabilities that GATX records at fair value on a recurring basis consisted entirely of derivatives at December 31, 2024 and December 31, 2023.
In addition, we review long-lived assets, such as operating assets and facilities, investments in affiliates, and goodwill, for impairment whenever circumstances indicate that the carrying amount of these assets may not be recoverable or when assets may be classified as held for sale. We determine the fair value of the respective assets using Level 3 inputs, including estimates of discounted future cash flows, independent appraisals, and market comparables, as applicable.
Certain assets were subject to non-recurring Level 3 fair value measurements during 2024 and 2023 and continue to be held at December 31, 2024 and 2023. The fair value of such assets at the time of their measurement was $0.4 million at December 31, 2024 and $0.8 million at December 31, 2023 and primarily consisted of railcars in both periods. See "Note 10. Asset Impairments and Assets Held for Sale" for further information.
Derivative Instruments
Fair Value Hedges
We use interest rate swaps to manage the fixed-to-floating rate mix of our debt obligations by converting a portion of our fixed rate debt to floating rate debt. For fair value hedges, we recognize changes in fair value of both the derivative and the hedged item as interest expense. We had four instruments outstanding with an aggregate notional amount of $200.0 million as of December 31, 2024 with maturities ranging from 2025 to 2027 and four instruments outstanding with an aggregate notional amount of $200.0 million as of December 31, 2023 with maturities ranging from 2025 to 2027.
Cash Flow Hedges
We use Treasury rate locks and swap rate locks to hedge our exposure to interest rate risk on anticipated transactions. We also use currency swaps, forwards, and put/call options to hedge our exposure to fluctuations in the exchange rates of foreign currencies for certain loans and operating expenses denominated in non-functional currencies. There were no instruments outstanding as of December 31, 2024 and one instrument outstanding with an aggregate notional amount of $131.0 million as of December 31, 2023 that matured in 2024. Within the next 12 months, we expect to reclassify $1.1 million ($0.8 million after-tax) of net losses on previously terminated derivatives from accumulated other comprehensive loss to interest expense. We reclassify these amounts when interest and operating lease expense on the related hedged transactions affect earnings.
Non-Designated Derivatives
We do not hold derivative financial instruments for purposes other than hedging, although certain of our derivatives are not designated as accounting hedges. We recognize changes in the fair value of these derivatives in other expense immediately.
GATX CORPORATION AND SUBSIDIARIES
NOTES TO CONSOLIDATED FINANCIAL STATEMENTS (Continued)
Certain of our derivative instruments contain credit risk provisions that could require us to make immediate payment on net liability positions in the event that we default on certain outstanding debt obligations. The aggregate fair value of our derivative instruments with credit risk related contingent features that were in a liability position was $4.0 million as of December 31, 2024 and $8.0 million as of December 31, 2023. We are not required to post any collateral on our derivative instruments and do not expect the credit risk provisions to be triggered.
In the event that a counterparty fails to meet the terms of an interest rate swap agreement or a foreign exchange contract, our exposure is limited to the fair value of the swap, if in our favor. We manage the credit risk of counterparties by transacting with institutions that we consider financially sound and by avoiding concentrations of risk with a single counterparty. We believe that the risk of non-performance by any of our counterparties is remote.
The following tables show our derivative assets and liabilities that are measured at fair value (in millions):
| | | | | | | | | | | | | | | | | |
| | | Significant Observable Inputs (Level 2) |
| Balance Sheet Location | | Fair Value
December 31, 2024 | | Fair Value
December 31, 2023 |
| Derivative Assets | | | | | |
| | | | | |
| Foreign exchange contracts (1) | Other assets | | $ | — | | | $ | 0.5 | |
| | | | | |
| | | | | |
| Total derivative assets | | | $ | — | | | $ | 0.5 | |
| Derivative Liabilities | | | | | |
| Interest rate contracts (1) | Other liabilities | | $ | 4.0 | | | $ | 8.0 | |
| | | | | |
| Foreign exchange contracts (2) | Other liabilities | | 8.1 | | | 10.5 | |
| Total derivative liabilities | | | $ | 12.1 | | | $ | 18.5 | |
_________(1) Designated as hedges.
(2) Not designated as hedges.
We value derivatives using a pricing model with inputs (such as yield curves and foreign currency rates) that are observable in the market or that can be derived principally from observable market data. As of December 31, 2024 and December 31, 2023, all derivatives were classified as Level 2 in the fair value hierarchy. There were no derivatives classified as Level 1 or Level 3.
The following table shows the amounts recorded on the balance sheet related to cumulative basis adjustments for fair value hedges as of December 31 (in millions):
| | | | | | | | | | | | | | | | | | | | | | | | | | |
| | Carrying Amount of the Hedged Assets/(Liabilities) | | Cumulative Amount of Fair Value Hedging Adjustment Included in the Carrying Amount of the Hedged Assets/(Liabilities) |
| Line Item in the Balance Sheet in Which the Hedged Item is Included | | 2024 | | 2023 | | 2024 | | 2023 |
| Recourse debt | | $ | (198.9) | | | $ | (196.8) | | | $ | (4.0) | | | $ | (8.0) | |
The following tables show the impact of our derivative instruments on our statements of comprehensive income for the years ended December 31 (in millions):
| | | | | | | | | | | | | | | | | | | | |
| | Amount of (Gain) Loss Recognized in Other Comprehensive (Loss) Income |
| Derivative Designation | | 2024 | | 2023 | | 2022 |
| Derivatives in cash flow hedging relationships: |
| | | | | | |
| Foreign exchange contracts | | $ | (3.4) | | | $ | 3.6 | | | $ | (5.7) | |
| Total | | $ | (3.4) | | | $ | 3.6 | | | $ | (5.7) | |
GATX CORPORATION AND SUBSIDIARIES
NOTES TO CONSOLIDATED FINANCIAL STATEMENTS (Continued)
| | | | | | | | | | | | | | | | | | | | |
| Location of Loss (Gain) Reclassified from Accumulated Other Comprehensive Loss into Earnings | | Amount of Loss (Gain) Reclassified from Accumulated Other Comprehensive Loss into Earnings |
| 2024 | | 2023 | | 2022 |
| Interest expense | | $ | 1.6 | | | $ | 1.6 | | | $ | 1.7 | |
| Other expense | | (3.7) | | | 3.7 | | | (5.7) | |
| Total | | $ | (2.1) | | | $ | 5.3 | | | $ | (4.0) | |
The following tables show the impact of our fair value and cash flow hedge accounting relationships, as well as the impact of our non-designated derivatives, on the statements of comprehensive income for the years ended December 31 (in millions):
| | | | | | | | | | | | | | | | | |
| Amount of Gain (Loss) Recognized in Interest Expense on Fair Value and Cash Flow Hedging Relationships |
| 2024 | | 2023 | | 2022 |
| Total interest expense | $ | (341.0) | | | $ | (263.4) | | | $ | (214.0) | |
| Gain (loss) on fair value hedging relationships | | | | | |
| Interest rate contracts: | | | | | |
| Hedged items | (4.0) | | | (3.6) | | | 14.1 | |
| Derivatives designated as hedging instruments | 4.0 | | | 3.6 | | | (14.1) | |
| Gain (loss) on cash flow hedging relationships | | | | | |
| Interest rate contracts: | | | | | |
| Amount of loss reclassified from accumulated other comprehensive loss into earnings | (1.6) | | | (1.6) | | | (1.7) | |
| | | | | | | | | | | | | | | | | |
| Amount of Gain (Loss) Recognized in Other Expense on Cash Flow Hedging Relationships and Non-Designated Derivative Contracts |
| 2024 | | 2023 | | 2022 |
| Total other expense | $ | (9.5) | | | $ | (9.4) | | | $ | (27.0) | |
| Gain (loss) on cash flow hedging relationships | | | | | |
| Foreign exchange contracts: | | | | | |
| Amount of gain (loss) reclassified from accumulated other comprehensive loss into earnings (1) | 3.7 | | | (3.7) | | | 5.7 | |
| Gain (Loss) on non-designated foreign exchange derivative contracts (2) | 1.7 | | | (11.3) | | | 0.7 | |
_________
(1) These amounts are substantially offset by foreign currency remeasurement adjustments on related hedged instruments, also recognized in other expense.
(2) Foreign exchange contracts.
Other Financial Instruments
Except for derivatives, as disclosed above, GATX has no other assets and liabilities measured at fair value on a recurring basis. The carrying amounts of cash and cash equivalents, restricted cash, rent and other receivables, accounts payable, and borrowings under bank credit facilities with maturities under one year approximate fair value due to the short maturity of those instruments.
We estimate the fair values of fixed and floating rate debt using discounted cash flow analyses that are based on interest rates currently offered for loans with similar terms to borrowers of similar credit quality. The inputs we use to estimate each of these values are classified in Level 2 of the fair value hierarchy because they are directly or indirectly observable inputs.
GATX CORPORATION AND SUBSIDIARIES
NOTES TO CONSOLIDATED FINANCIAL STATEMENTS (Continued)
The following table shows the carrying amounts and fair values of our other financial instruments as of December 31 (in millions):
| | | | | | | | | | | | | | | | | | | | | | | |
| 2024 | | 2023 |
| Carrying
Amount | | Fair
Value | | Carrying
Amount | | Fair
Value |
| Liabilities | | | | | | | |
| Recourse fixed rate debt | $ | 7,609.5 | | | $ | 7,243.9 | | | $ | 7,026.6 | | | $ | 6,614.6 | |
| Recourse floating rate debt | 605.8 | | | 617.3 | | | 361.5 | | | 362.9 | |
| Total | $ | 8,215.3 | | | $ | 7,861.2 | | | $ | 7,388.1 | | | $ | 6,977.5 | |
NOTE 10. Asset Impairments and Assets Held for Sale
In 2022, we made the decision to exit Rail Russia, which was historically reported within the Rail International segment. The net assets of Rail Russia were classified as held for sale and adjusted to the lower of carrying amount or fair value less costs to dispose. As a result, we recorded impairment losses totaling $14.6 million in 2022. The impairment charges included $1.2 million for the anticipated liquidation of the cumulative translation adjustment. We sold Rail Russia in 2023.
In 2022, we made the decision to sell our five Specialized Gas Vessels within the Engine Leasing segment. The Specialized Gas Vessels were classified as held for sale and adjusted to the lower of their respective carrying amounts or fair value less costs to dispose. As a result, we recorded impairment losses of $34.3 million in 2022 and $1.2 million in 2023. All vessels were sold as of December 31, 2023.
The following table summarizes the components of asset impairments for the years ended December 31 (in millions):
| | | | | | | | | | | | | | | | | |
| | 2024 | | 2023 | | 2022 |
| Attributable to Consolidated Assets | | | | | |
| | | | | |
| Rail International | $ | — | | | $ | 0.3 | | | $ | 14.6 | |
| Engine Leasing | — | | | 1.2 | | | 34.3 | |
| | | | | |
| Total | $ | — | | | $ | 1.5 | | | $ | 48.9 | |
| | | | | |
| | | | | |
| | | | | |
| | | | | |
We had no asset impairments in 2024. Impairment losses at Rail International in 2023 were due to declines in value of railcars from functional obsolescence and to the decision to sell Rail Russia in 2022, as noted above. Impairment losses at Engine Leasing in 2023 and 2022 were due to the decision to sell the Specialized Gas Vessels, as noted above.
In the consolidated statements of comprehensive income, impairment losses related to consolidated assets were included in net gain on asset dispositions.
Assets held for sale, all at Rail North America, were $0.4 million as of December 31, 2024 and $0.8 million as of December 31, 2023. All assets held for sale at December 31, 2024 are expected to be sold within one year and are included in Other Assets on the balance sheet.
NOTE 11. Pension and Other Post-Retirement Benefits
We maintain both funded and unfunded noncontributory defined benefit pension plans covering our domestic employees and the employees of our subsidiaries. We also have a funded noncontributory defined benefit pension plan related to a former business in the United Kingdom that has no active employees. The plans base benefits payable on years of service and/or final average salary. We base our funding policies for the pension plans on actuarially determined cost methods allowable under IRS regulations and statutory requirements in the United Kingdom.
In addition to the pension plans, we have other post-retirement plans that provide health care, life insurance, and other benefits for certain retired domestic employees who meet established criteria. Most domestic employees that retire with immediate benefits under our pension plan are eligible for health care and life insurance benefits. The other post-retirement plans are either contributory or noncontributory, depending on various factors.
GATX CORPORATION AND SUBSIDIARIES
NOTES TO CONSOLIDATED FINANCIAL STATEMENTS (Continued)
Certain lump sum distributions paid to retirees triggered settlement accounting, resulting in the recognition of $1.4 million of expense in 2023.
We use a December 31 measurement date for all of our plans. The following tables show pension obligations, plan assets, and other post-retirement obligations as of December 31 (in millions):
| | | | | | | | | | | | | | | | | | | | | | | |
| 2024 Pension
Benefits | | 2023 Pension
Benefits | | 2024 Retiree
Health
and Life | | 2023 Retiree
Health
and Life |
| Change in Benefit Obligation | | | | | | | |
| Benefit obligation at beginning of year | $ | 346.9 | | | $ | 341.8 | | | $ | 14.9 | | | $ | 15.6 | |
| Service cost | 6.1 | | | 5.3 | | | 0.1 | | | 0.1 | |
| Interest cost | 16.4 | | | 16.6 | | | 0.7 | | | 0.8 | |
| Plan amendments | — | | | 0.5 | | | — | | | — | |
| Actuarial loss (gain) | (14.9) | | | 12.4 | | | (1.0) | | | 0.2 | |
| Benefits paid | (24.3) | | | (30.8) | | | (1.6) | | | (1.8) | |
| Effect of foreign exchange rate changes | (0.5) | | | 1.1 | | | — | | | — | |
| Benefit obligation at end of year | $ | 329.7 | | | $ | 346.9 | | | $ | 13.1 | | | $ | 14.9 | |
| Change in Fair Value of Plan Assets | | | | | | | |
| Plan assets at beginning of year | $ | 328.8 | | | $ | 323.8 | | | $ | — | | | $ | — | |
| Actual return on plan assets | 19.6 | | | 29.1 | | | — | | | — | |
| Effect of exchange rate changes | (0.4) | | | 1.4 | | | — | | | — | |
| Company contributions | 1.3 | | | 5.3 | | | 1.6 | | | 1.8 | |
| Benefits paid | (24.3) | | | (30.8) | | | (1.6) | | | (1.8) | |
| Plan assets at end of year | $ | 325.0 | | | $ | 328.8 | | | $ | — | | | $ | — | |
| Funded Status at end of year | $ | (4.7) | | | $ | (18.1) | | | $ | (13.1) | | | $ | (14.9) | |
| Amount Recognized | | | | | | | |
| Other liabilities | $ | (4.7) | | | $ | (18.1) | | | $ | (13.1) | | | $ | (14.9) | |
| Accumulated other comprehensive loss (income): | | | | | | | |
| Net actuarial loss (gain) | 58.0 | | | 72.0 | | | (7.1) | | | (6.7) | |
| Prior service cost (credit) | 0.5 | | | 0.6 | | | — | | | (0.2) | |
| Accumulated other comprehensive loss (income) | 58.5 | | | 72.6 | | | (7.1) | | | (6.9) | |
| Total recognized | $ | 53.8 | | | $ | 54.5 | | | $ | (20.2) | | | $ | (21.8) | |
| After-tax amount recognized in accumulated other comprehensive loss (income) | $ | 46.2 | | | $ | 56.8 | | | $ | (5.6) | | | $ | (5.4) | |
| | | | | | | |
The aggregate accumulated benefit obligation for the defined benefit pension plans was $316.1 million at December 31, 2024 and $334.0 million at December 31, 2023.
GATX CORPORATION AND SUBSIDIARIES
NOTES TO CONSOLIDATED FINANCIAL STATEMENTS (Continued)
The following table shows our pension plans that have a projected benefit obligation in excess of plan assets as of December 31 (in millions):
| | | | | | | | | | | |
| 2024 | | 2023 |
| Projected benefit obligations | $ | 25.4 | | | $ | 259.4 | |
| Fair value of plan assets | — | | | 227.3 | |
The following table shows our pension plans that have an accumulated benefit obligation in excess of plan assets as of December 31 (in millions):
| | | | | | | | | | | |
| 2024 | | 2023 |
| Accumulated benefit obligations | $ | 22.0 | | | $ | 22.8 | |
| Fair value of plan assets | — | | | — | |
The following table shows the components of net periodic cost for the years ended December 31 (in millions):
| | | | | | | | | | | | | | | | | | | | | | | | | | | | | | | | | | | | |
| 2024
Pension
Benefits | | 2023
Pension
Benefits | | 2022
Pension
Benefits | | 2024
Retiree Health and Life | | 2023
Retiree Health and Life | | 2022
Retiree Health and Life | |
| Service cost | $ | 6.1 | | | $ | 5.3 | | | $ | 7.7 | | | $ | 0.1 | | | $ | 0.1 | | | $ | 0.2 | | |
| Interest cost | 16.4 | | | 16.6 | | | 10.1 | | | 0.7 | | | 0.8 | | | 0.4 | | |
| Expected return on plan assets | (21.6) | | | (21.4) | | | (15.6) | | | — | | | — | | | — | | |
| Settlement accounting adjustment | — | | | 1.4 | | | 7.1 | | | — | | | — | | | — | | |
| Amortization of (1): | | | | | | | | | | | | |
| Unrecognized prior service cost (credit) | 0.1 | | | — | | | — | | | (0.2) | | | (0.3) | | | (0.2) | | |
| Unrecognized net actuarial loss (gain) | 1.0 | | | 0.9 | | | 8.6 | | | (0.5) | | | (0.5) | | | (0.3) | | |
| Net periodic cost | $ | 2.0 | | | $ | 2.8 | | | $ | 17.9 | | | $ | 0.1 | | | $ | 0.1 | | | $ | 0.1 | | |
_________
(1) Amounts reclassified from accumulated other comprehensive loss.
The service cost component of net periodic cost was $6.2 million in 2024, $5.4 million in 2023, and $7.9 million in 2022 and is recorded in selling, general and administrative expense. The non-service components totaled income of $4.1 million in 2024, income of $2.5 million in 2023, and expense of $10.1 million in 2022 and are recorded in other expense in the statements of comprehensive income.
We amortize the unrecognized prior service credit using a straight-line method over the average remaining service period of the employees we expect to receive benefits under the plan. We amortize the unrecognized net actuarial loss (gain), which is subject to certain averaging conventions, over the average remaining service period of active employees.
GATX CORPORATION AND SUBSIDIARIES
NOTES TO CONSOLIDATED FINANCIAL STATEMENTS (Continued)
We use the following assumptions to measure the benefit obligation, compute the expected long-term return on assets, and measure the periodic cost for our defined benefit pension plans and other post-retirement benefit plans for the years ended December 31:
| | | | | | | | | | | |
| 2024 | | 2023 |
| Domestic defined benefit pension plans | | | |
| Benefit Obligation at December 31: | | | |
| Discount rate — salaried funded plans | 5.59 | % | | 4.95 | % |
| Discount rate — salaried unfunded plans | 5.11% - 5.55% | | 4.74% - 4.92% |
| Discount rate — hourly funded plan | 5.74 | % | | 5.06 | % |
| Cash balance interest crediting rate — salaried funded plan | 4.54% - 4.78% | | 4.14% - 4.66% |
| Rate of compensation increases — salaried funded and unfunded plans | 3.00 | % | | 3.00 | % |
| Rate of compensation increases — hourly funded plans | n/a | | n/a |
| Net Periodic Cost (Benefit) for the years ended December 31: | | | |
| Discount rate — salaried funded and unfunded plans | 4.95 | % | | 5.15 | % |
| Discount rate — hourly funded plan | 5.06 | % | | 5.24 | % |
| Expected return on plan assets — salaried funded plan | 6.40 | % | | 6.30 | % |
| Expected return on plan assets — hourly funded plan | 5.60 | % | | 5.60 | % |
| Rate of compensation increases — salaried funded and unfunded plans | 3.00 | % | | 3.00 | % |
| Rate of compensation increases — hourly funded plan | n/a | | n/a |
| Foreign defined benefit pension plan | | | |
| Benefit Obligation at December 31: | | | |
| Discount rate | 5.40 | % | | 4.50 | % |
| Rate of pension-in-payment increases | 3.00 | % | | 2.80 | % |
| Net Periodic Cost (Benefit) for the years ended December 31: | | | |
| Discount rate | 4.50 | % | | 4.90 | % |
| Expected return on plan assets | 4.80 | % | | 4.70 | % |
| Rate of pension-in-payment increases | 2.80 | % | | 3.00 | % |
| Other post-retirement benefit plans | | | |
| Benefit Obligation at December 31: | | | |
| Discount rate — combined health | 5.41 | % | | 4.85 | % |
| Discount rate — combined life insurance | 5.61 | % | | 4.97 | % |
| Rate of compensation increases | n/a | | n/a |
| Net Periodic Cost (Benefit) for the years ended December 31: | | | |
| | | |
| | | |
| Discount rate — combined health | 4.84 | % | | 5.04 | % |
| | | |
| | | |
| Discount rate — combined life insurance | 4.97 | % | | 5.16 | % |
| Rate of compensation increases | n/a | | n/a |
GATX CORPORATION AND SUBSIDIARIES
NOTES TO CONSOLIDATED FINANCIAL STATEMENTS (Continued)
We calculate the present value of expected future pension and post-retirement cash flows as of the measurement date using a discount rate. We base the discount rate on yields for high-quality, long-term bonds with durations similar to that of our projected benefit obligation. We base the expected return on our plan assets on current and expected asset allocations, as well as historical and expected returns on various categories of plan assets. We routinely review our historical returns along with current market conditions to ensure our expected return assumption is reasonable and appropriate.
| | | | | | | | | | | |
| 2024 | | 2023 |
| Assumed Health Care Cost Trend Rates at December 31: | | | |
| Health care cost trend assumed for next year | | | |
| Medical claims — pre age 65 | 7.50 | % | | 6.75 | % |
| Medical claims — post age 65 | 6.00 | % | | 6.25 | % |
| Prescription drugs claims — pre age 65 | 13.00 | % | | 8.25 | % |
| Prescription drugs claims — post age 65 | 12.00 | % | | 8.25 | % |
| Post age 65 Medicare Advantage Part D | 18.75 | % | | 17.95 | % |
| Rate to which the cost trend is expected to decline (the ultimate trend rate) | | | |
| Medical claims | 4.50 | % | | 4.50 | % |
| Prescription drugs claims | 4.50 | % | | 4.50 | % |
| Year that rate reaches the ultimate trend rate | | | |
| Medical claims | 2034 | | 2033 |
| Prescription drugs claims | 2034 | | 2033 |
Our investment policies require that asset allocations of domestic and foreign funded pension plans be maintained at certain targets. The following table shows our weighted-average asset allocations of our domestic funded pension plans at December 31, 2024 and 2023, and current target asset allocation for 2024, by asset category:
| | | | | | | | | | | | | | | | | |
| |
| | Plan Assets for Salaried Employees at
December 31 |
| Target | | 2024 | | 2023 |
| Asset Category | | | | | |
| Equity securities | 43.7 | % | | 44.4 | % | | 49.7 | % |
| Debt securities | 53.0 | % | | 51.3 | % | | 46.1 | % |
| Real estate | 3.3 | % | | 2.4 | % | | 2.5 | % |
| Cash | — | % | | 1.9 | % | | 1.7 | % |
| 100.0 | % | | 100.0 | % | | 100.0 | % |
| | | | | | | | | | | | | | | | | |
|
| | Plan Assets for Hourly Employees at
December 31 |
| Target | | 2024 | | 2023 |
| Asset Category | | | | | |
| Equity securities | 9.3 | % | | 9.2 | % | | 16.5 | % |
| Debt securities | 90.0 | % | | 87.5 | % | | 78.7 | % |
| Real estate | 0.7 | % | | 1.3 | % | | 1.5 | % |
| Cash | — | % | | 2.0 | % | | 3.3 | % |
| 100.0 | % | | 100.0 | % | | 100.0 | % |
GATX CORPORATION AND SUBSIDIARIES
NOTES TO CONSOLIDATED FINANCIAL STATEMENTS (Continued)
The following table shows the weighted-average asset allocations of our foreign funded pension plan at December 31, 2024 and 2023, and current target asset allocation for 2023, by asset category:
| | | | | | | | | | | | | | | | | |
|
| | Plan Assets at
December 31 |
| Target | | 2024 | | 2023 |
| Asset Category | | | | | |
| | | | | |
| Debt securities | 50.0 | % | | 47.4 | % | | 99.8 | % |
| Cash | 50.0 | % | | 52.6 | % | | 0.2 | % |
| 100.0 | % | | 100.0 | % | | 100.0 | % |
The following table sets forth the fair value of our pension plan assets as of December 31 (in millions):
| | | | | | | | | | | |
| 2024 | | 2023 |
| Assets measured at net asset value (1): | | | |
| Short-term investment collective trust fund | $ | 18.5 | | | $ | 0.7 | |
| Common stock collective trust funds | 107.5 | | | 127.4 | |
| Fixed-income collective trust funds | 192.6 | | | 193.7 | |
| Real estate collective trust funds | 6.4 | | | 7.0 | |
| Total | $ | 325.0 | | | $ | 328.8 | |
_______
(1) In accordance with the relevant accounting standards, investments measured at fair value using the net asset value per share (or its equivalent) practical expedient are not recorded in any specific category of the fair value hierarchy.
The following is a description of the valuation techniques and inputs used as of December 31, 2024 and 2023.
Short-term investment collective trust fund
We value the short-term investment collective trust fund based on the closing net asset values ("NAV") quoted by the funds. The short-term investment collective trust fund is a highly liquid investment in obligations of the U.S. Government, or its agencies or instrumentalities, and the related money market instruments. The short-term investment fund has no restrictions on redemption frequency or advance notice periods required for redemption. The fund seeks to provide safety of principal, daily liquidity, and a competitive yield over the long term.
Common stock collective trust funds and fixed-income collective trust funds
We value common stock collective trust funds and fixed-income collective trust funds based on the closing NAV prices quoted by the funds. None of the collective trust funds have restrictions on redemption frequency or advance notice periods required for redemption. The investment objective of each of the common stock funds is long-term total return through capital appreciation and current income. The fixed-income funds are each designed to deliver safety and stability by preserving principal and accumulated earnings. The fixed-income fund seeks to achieve, over an extended period of time, total returns comparable or superior to broad measures of the long-term domestic investment grade credit bond market.
Real estate collective trust funds
We value real estate collective trust funds based on the NAV provided by the funds' administrators. A lack of liquidity in the funds may limit or delay redemptions. The investment objective of the real estate funds, which are diversified by location and property type, is long-term return through property appreciation, current income, and timely sales.
The primary investing objective of the pension plans is to provide benefits to plan participants and their beneficiaries. To achieve this goal, we invest in a diversified portfolio of equities, debt, and real estate investments to maximize return and to keep long-term investment risk at a reasonable level. Equity investments are diversified across U.S. and non-U.S. stocks, growth and value stocks, and small cap and large cap stocks. Debt securities are predominately investments in long-term, investment-grade corporate bonds. Real estate investments include investments in funds that are diversified by location and property type.
GATX CORPORATION AND SUBSIDIARIES
NOTES TO CONSOLIDATED FINANCIAL STATEMENTS (Continued)
On a timely basis, but not less than twice a year, we formally review pension plan investments to ensure we adhere to investment guidelines and our stated investment approach. Our review also evaluates the reasonableness of our investment decisions and risk positions. We compare our investments' performance to indices and peers to determine if investment performance has been acceptable.
In 2025, we expect to contribute approximately $4.2 million to our pension and other post-retirement benefit plans. Additional contributions to the domestic funded pension plans will depend on investment returns on plan assets and actuarial experience.
The following table shows expected future benefit payments, which reflect expected future service (in millions):
| | | | | | | | | | | | | | | | | |
| Funded Plans | | Unfunded Plans | | Retiree Health and Life |
| 2025 | $ | 28.8 | | | $ | 2.6 | | | $ | 1.6 | |
| 2026 | 28.9 | | | 2.7 | | | 1.6 | |
| 2027 | 28.0 | | | 2.8 | | | 1.5 | |
| 2028 | 27.8 | | | 2.8 | | | 1.4 | |
| 2029 | 26.8 | | | 2.7 | | | 1.3 | |
| Years 2030-2034 | 125.8 | | | 11.7 | | | 5.0 | |
| Total | $ | 266.1 | | | $ | 25.3 | | | $ | 12.4 | |
In addition to our defined benefit plans, we have two 401(k) retirement savings plans available to substantially all salaried employees and certain other employee groups. We may contribute to the plans as specified by their respective terms and as our Board of Directors determines. Contributions to our 401(k) retirement plans were $4.0 million for 2024, $2.6 million for 2023, and $2.3 million for 2022.
NOTE 12. Share-Based Compensation
We provide equity awards to our employees under the GATX Corporation 2012 Incentive Award Plan, including grants of non-qualified employee stock options, restricted stock units, performance shares, and phantom stock awards and restricted stock units to non-employee directors. As of December 31, 2024, 4.9 million shares were authorized under the 2012 Plan and 1.7 million shares were available for future issuance. We recognize compensation expense for our equity awards in selling, general and administrative expenses over the applicable service period of each award. Share-based compensation expense was $23.0 million for 2024, $18.3 million for 2023, and $12.7 million for 2022, and the related tax benefits were $5.8 million for 2024, $4.6 million for 2023, and $3.2 million for 2022.
Stock Options
Stock options entitle the holder to purchase shares of common stock for periods up to seven years from the grant date. Stock options entitle the holder to purchase shares of our common stock at a specified exercise price. The dividends that accrue on all stock options are paid upon vesting and continue to be paid until the stock options are exercised, canceled, or expire. The exercise price for stock options is equal to the average of the high and low trading prices of our common stock on the date of grant. We recognize compensation expense on a straight-line basis over the vesting period of the award, which is generally three years.
The estimated fair value of a stock option is the sum of the value we derive using the Black-Scholes option pricing model and the present value of dividends we expect to pay over the expected term of the award. The Black-Scholes valuation incorporates various assumptions, including expected term, expected volatility, and risk free interest rates. We base the expected term on historical exercise patterns and post-vesting terminations, and we base the expected volatility on the historical volatility of our stock price over a period equal to the expected term. We use risk-free interest rates that are based on the implied yield on recently-issued U.S. Treasury zero-coupon bonds with a term comparable to the expected term.
GATX CORPORATION AND SUBSIDIARIES
NOTES TO CONSOLIDATED FINANCIAL STATEMENTS (Continued)
The following table shows the weighted-average fair value for our stock options and the assumptions we used to estimate fair value:
| | | | | | | | | | | | | | | | | |
| 2024 | | 2023 | | 2022 |
| Weighted-average estimated fair value | $ | 45.22 | | | $ | 41.06 | | | $ | 34.77 | |
| Quarterly dividend rate | $ | 0.58 | | | $ | 0.55 | | | $ | 0.52 | |
| Expected term of stock options, in years | 4.2 | | 4.2 | | 4.3 |
| Risk-free interest rate | 4.0 | % | | 3.7 | % | | 1.6 | % |
| Dividend yield | 1.8 | % | | 1.9 | % | | 2.0 | % |
| Expected stock price volatility | 34.7 | % | | 35.4 | % | | 35.0 | % |
| Present value of dividends | $ | 8.87 | | | $ | 8.57 | | | $ | 8.58 | |
The following table shows information about outstanding stock options for the year ended December 31, 2024:
| | | | | | | | | | | | | | |
| | Number of Stock Options
(in thousands) | | Weighted-Average Exercise Price |
| Outstanding at beginning of the year | | 997 | | $ | 89.85 | |
| Granted | | 194 | | 126.47 | |
| Exercised | | (241) | | 78.61 | |
| Forfeited/Cancelled | | (2) | | 122.15 | |
| | | | |
| Outstanding at end of the year | | 948 | | 100.13 | |
| Vested and exercisable at end of the year | | 569 | | 87.98 | |
The following table shows the aggregate intrinsic value of stock options exercised in 2024, 2023, and 2022, and the weighted-average remaining contractual term and aggregate intrinsic value of stock options outstanding and vested as of December 31, 2024:
| | | | | | | | | | | | | | |
| Stock Options | | Weighted-Average Remaining Contractual Term (in years) | | Aggregate Intrinsic Value
(in millions) |
| | | | |
| Exercised in 2022 | | | | $ | 13.4 |
| Exercised in 2023 | | | | 9.0 | |
| Exercised in 2024 | | | | 13.6 | |
| | | | |
| Outstanding at December 31, 2024 (a) | | 3.8 | | 52.0 |
| Vested and exercisable at December 31, 2024 | | 2.8 | | 38.1 | |
_______
(a) As of December 31, 2024, 948,100 stock options were outstanding.
Total cash received from employees for exercises of stock options during the years ended December 31, 2024, 2023, and 2022 was $32.1 million, $22.3 million, and $30.9 million. As of December 31, 2024, we had $8.8 million of unrecognized compensation expense related to nonvested stock options, which we expect to recognize over a weighted-average period of 1.7 years.
Restricted Stock Units and Performance Shares
Restricted stock units entitle the recipient to receive a specified number of restricted shares of common stock upon vesting. Restricted stock units do not carry voting rights and are not transferable prior to the expiration of a specified restriction period, which is generally three years, as determined by the Compensation Committee of the Board of Directors ("Compensation Committee"). We accrue dividends on all restricted stock units and pay those dividends when the awards vest. We recognize compensation expense for these awards over the applicable vesting period.
GATX CORPORATION AND SUBSIDIARIES
NOTES TO CONSOLIDATED FINANCIAL STATEMENTS (Continued)
Performance shares are restricted shares that we grant to key employees for achieving certain strategic objectives. The shares convert to common stock at the end of a specified performance period if predetermined performance goals are achieved, as determined by the Compensation Committee. We estimate the number of shares we expect will vest as a result of actual performance against the performance criteria at the time of grant to determine total compensation expense to be recognized. We reevaluate the estimate annually and adjust total compensation expense for any changes to the estimate of the number of shares we expect to vest. The performance shares granted include an option to settle shares earned in cash upon vesting for certain eligible employees. As a result, these awards are accounted for as liability awards and recorded in other liabilities. The liability and related compensation expense is adjusted to reflect the fair value of the underlying shares at the end of each reporting period. We recognize compensation expense for these awards over the applicable vesting period, which is generally three years.
We value our restricted stock units and performance share awards using the average of the high and low values of our common stock on the grant date of the awards. As of December 31, 2024, there was $10.9 million of unrecognized compensation expense related to these awards, which we expect to be recognized over a weighted-average period of 1.7 years.
The following table shows information about restricted stock units and performance shares for the year ended December 31, 2024:
| | | | | | | | | | | |
| Number of Share Units Outstanding (in thousands) | | Weighted-Average Grant-Date Fair Value |
| Restricted Stock Units: | | | |
| Nonvested at beginning of the year | 100 | | | $ | 103.19 | |
| Granted | 32 | | | 126.52 | |
| Vested | (30) | | | 91.52 | |
| Forfeited | — | | | 124.41 | |
| Nonvested at end of the year | 102 | | | 113.79 | |
| Performance Shares: | | | |
| Nonvested at beginning of the year | 97 | | | $ | 106.89 | |
| Granted | 39 | | | 126.47 | |
| Net increase due to estimated performance | 5 | | | 115.81 | |
| Vested | (52) | | | 101.03 | |
| | | |
| Nonvested at end of the year | 89 | | | 119.39 | |
The total fair value of restricted stock units and performance shares that vested during the year was $11.9 million in 2024, $9.7 million in 2023, and $7.7 million in 2022. Cash paid to settle performance share awards was $4.7 million in 2024, $4.1 million in 2023, and $5.5 million in 2022.
Non-Employee Director Awards
We grant awards to non-employee directors as a component of their compensation for service on our board of directors. Currently, these awards are in the form of restricted stock units. Previously, these awards were in the form of phantom stock, which are units that equate to, but are not common shares. Restricted stock unit awards and phantom stock awards are both dividend participating and, for awards that are deferred, dividends are reinvested in additional shares at the average of the high and low trading prices of our stock on the dividend payment date. At the expiration of each director’s service on the board of directors, or in accordance with the deferral election, whole units of both restricted stock units and phantom stock will be settled with shares of common stock, and fractional units will be paid in cash. In 2024, we granted 14,213 units of restricted stock and there were a total of 250,464 restricted stock units and phantom stock outstanding as of December 31, 2024.
GATX CORPORATION AND SUBSIDIARIES
NOTES TO CONSOLIDATED FINANCIAL STATEMENTS (Continued)
NOTE 13. Income Taxes
The following table shows the components of income before income taxes, excluding affiliates, for the years ended December 31 (in millions):
| | | | | | | | | | | | | | | | | |
| 2024 | | 2023 | | 2022 |
| Income before Income Taxes | | | | | |
| Domestic | $ | 80.6 | | | $ | 82.9 | | | $ | 55.8 | |
| Foreign | 180.8 | | | 162.6 | | | 121.3 | |
| Total | $ | 261.4 | | | $ | 245.5 | | | $ | 177.1 | |
The following table shows income taxes, excluding domestic and foreign affiliates, for the years ended December 31 (in millions):
| | | | | | | | | | | | | | | | | |
| 2024 | | 2023 | | 2022 |
| Income Tax Expense | | | | | |
| Current | | | | | |
| Domestic: | | | | | |
| Federal | $ | — | | | $ | 2.9 | | | $ | 0.2 | |
| State and local | 0.7 | | | 0.2 | | | — | |
| $ | 0.7 | | | $ | 3.1 | | | $ | 0.2 | |
| Foreign | 13.5 | | | 17.3 | | | 18.3 | |
| Total current | $ | 14.2 | | | $ | 20.4 | | | $ | 18.5 | |
| Deferred | | | | | |
| Domestic: | | | | | |
| Federal | $ | 18.4 | | | $ | 13.5 | | | $ | 11.1 | |
| State and local | (6.4) | | | (1.8) | | | 2.7 | |
| $ | 12.0 | | | $ | 11.7 | | | $ | 13.8 | |
| Foreign | 33.8 | | | 26.6 | | | 22.5 | |
| Total deferred | $ | 45.8 | | | $ | 38.3 | | | $ | 36.3 | |
| Income taxes | $ | 60.0 | | | $ | 58.7 | | | $ | 54.8 | |
The following table is a reconciliation between the federal statutory income tax rate and our effective income tax rate for the years ended December 31 (in millions):
| | | | | | | | | | | | | | | | | |
| 2024 | | 2023 | | 2022 |
| Income taxes at federal statutory rate | $ | 54.9 | | | $ | 51.6 | | | $ | 37.2 | |
| Adjust for effect of: | | | | | |
| | | | | |
| Foreign earnings taxed at applicable statutory rates | 9.3 | | | 9.8 | | | 18.0 | |
| Foreign deferred tax rate change impact | — | | | — | | | (2.9) | |
| Nondeductible compensation | 4.3 | | | 2.7 | | | 2.6 | |
| Share-based compensation | (2.2) | | | (1.7) | | | (2.3) | |
| State income taxes | 3.0 | | | 3.7 | | | 2.6 | |
| State income tax rate change impact | (6.0) | | | (3.0) | | | (8.3) | |
| State net operating loss valuation allowance | (1.8) | | | (2.3) | | | 9.9 | |
| Other | (1.5) | | | (2.1) | | | (2.0) | |
| Income taxes | $ | 60.0 | | | $ | 58.7 | | | $ | 54.8 | |
| Effective income tax rate | 23.0 | % | | 23.9 | % | | 30.9 | % |
In 2024, our effective tax rate was 23.0% compared to 23.9% in 2023 and 30.9% in 2022.
GATX CORPORATION AND SUBSIDIARIES
NOTES TO CONSOLIDATED FINANCIAL STATEMENTS (Continued)
The adjustment for foreign earnings in each year reflected the impact of applicable statutory tax rates on income earned at our foreign subsidiaries. Compensation is adjusted for the difference between the deductibility of these expenses under the U.S. tax law versus U.S. GAAP. State income taxes are recognized on domestic pretax income or loss. The amount of our domestic income subject to state taxes relative to our total worldwide income impacts the effect state income tax has on our overall income tax rate.
Separately, our affiliates incurred income taxes of $25.5 million, $25.7 million, and $12.3 million respectively in 2024, 2023, and 2022.
The following table shows the significant components of our deferred tax liabilities and assets as of December 31 (in millions):
| | | | | | | | | | | |
| 2024 | | 2023 |
| Deferred Tax Liabilities | | | |
| Book/tax basis difference due to depreciation | $ | 1,327.9 | | | $ | 1,263.5 | |
| Right-of-use assets | 41.3 | | | 52.9 | |
| Investments in affiliated companies | 4.5 | | | 16.8 | |
| Lease accounting | 18.0 | | | 17.2 | |
| Intangible amortization | 1.5 | | | 1.7 | |
| Other | 4.9 | | | 4.5 | |
| Total deferred tax liabilities | $ | 1,398.1 | | | $ | 1,356.6 | |
| Deferred Tax Assets | | | |
| Lease liability | $ | 44.4 | | | $ | 56.6 | |
| Federal net operating loss | 82.6 | | | 75.0 | |
| Foreign tax credit | 0.8 | | | 0.8 | |
| Valuation allowance on foreign tax credit | (0.8) | | | (0.8) | |
| Federal interest limitation carryforward | 72.5 | | | 77.3 | |
| State net operating loss | 37.4 | | | 40.1 | |
| Valuation allowance on state net operating loss | (20.4) | | | (20.3) | |
| State interest limitation carryforward | 11.4 | | | 13.0 | |
| Foreign net operating loss | 4.4 | | | 4.1 | |
| Accruals not currently deductible for tax purposes | 32.3 | | | 21.0 | |
| Allowance for losses | 1.3 | | | 1.0 | |
| Pension and post-retirement benefits | 2.1 | | | 5.8 | |
| Other | 2.8 | | | 1.9 | |
| Total deferred tax assets | $ | 270.8 | | | $ | 275.5 | |
| Net deferred tax liabilities | $ | 1,127.3 | | | $ | 1,081.1 | |
Deferred income taxes are the net tax effects of temporary differences between the carrying amounts of assets and liabilities for financial reporting purposes and the amounts used for income tax purposes. We expect at this time to continue reinvestment of foreign earnings outside the U.S. indefinitely. Consequently, our tax provision does not include any deferred tax costs that might arise due to book versus tax basis differences in investments in foreign subsidiaries. Under provisions of the territorial tax system, future dividend distributions from foreign subsidiaries and affiliates are generally exempt from U.S. income tax. Taxes may arise from withholding taxes or on foreign exchange or other gains recognized in connection with the basis differences in our investments in foreign subsidiaries. The ultimate tax cost of repatriating these earnings depends on tax laws in effect and other circumstances at the time of distribution.
At December 31, 2024, we had a U.S. federal tax net operating loss carryforward of $393.2 million that can be carried forward indefinitely until the loss is fully recovered. The utilization of net operating losses carried forward are limited to 80% of future taxable income. We also had foreign tax credits of $0.8 million that expire after 2027. We have recorded a $0.8 million valuation allowance related to these credits, as we believe it is more likely than not that we will be unable to utilize them.
GATX CORPORATION AND SUBSIDIARIES
NOTES TO CONSOLIDATED FINANCIAL STATEMENTS (Continued)
At December 31, 2024, due to a provision of the Tax Cuts and Jobs Act of 2017 (the "Tax Act"), the deductibility of interest expense may be limited on our federal tax return. Disallowed amounts can be carried forward indefinitely until the expense is fully utilized. As a result of this limitation, we have a federal interest expense carryforward amount of $356.5 million.
At December 31, 2024, we had state tax net operating losses of $37.4 million, net of federal benefits that are scheduled to expire at various times beginning in 2025. We have recorded a $20.4 million valuation allowance related to state net operating losses, as we believe it is more likely than not that we will be unable to use all of these losses. Also, as a result of the provision in the Tax Act limiting the deductibility of interest expense on our federal tax return, as referenced above, we had a corresponding state interest limitation of $11.4 million that can be carried forward indefinitely until the expense is fully utilized.
At December 31, 2024, we had foreign net operating losses of $4.4 million, with various carryforward periods. It is more likely than not that we will be able to use these losses in the future, and therefore, no valuation allowance is required at this time.
At December 31, 2024, our gross liability for unrecognized tax benefits was $8.3 million. Of this amount, $8.1 million is attributed to our foreign operations. We recognize interest and penalties related to unrecognized tax benefits as income tax expense. To the extent interest is not assessed or is otherwise reduced with respect to uncertain tax positions, we will record any required adjustment as a reduction of income tax expense.
We file one separate federal income tax return and one consolidated federal income tax return with our domestic subsidiaries in the U.S. jurisdiction, as well as tax returns in various state and foreign jurisdictions. As of December 31, 2024, all audits or statutes of limitations with respect to our federal tax returns for years prior to 2021 have been closed or expired. Additionally, we currently have no open federal income tax audits, no open state income tax audits, and three of our foreign jurisdictions have open income tax audits.
NOTE 14. Concentrations
Concentration of Revenues
We derived revenue from a wide range of industries and companies. In 2024, we generated approximately 25% of our total revenues from customers in the transportation industry, 24% from the chemical industry, 22% from the petroleum industry, 12% from food/agriculture industries and 5% from the mining, minerals and aggregates industry. Our foreign identifiable revenues were primarily derived in Canada, Germany, United Kingdom, Poland and India.
Concentration of Credit Risk
We did not have revenue concentrations greater than 10% from any particular customer for any of the years ended December 31, 2024, 2023, and 2022. Under our lease agreements with customers, we typically retain legal ownership of the assets unless such assets have been financed by sale-leasebacks. We perform a credit evaluation prior to approval of a lease contract. Subsequently, we monitor the creditworthiness of the customer and the value of the collateral on an ongoing basis. We maintain an allowance for losses to provide for credit losses inherent in our receivables balances.
Concentration of Labor Force
As of December 31, 2024, collective bargaining agreements covered approximately 39% of our employees, of which agreements covering 2% of employees will expire within the next year. The hourly employees at our U.S. service centers are represented by the United Steelworkers. Employees at three of Rail North America's Canadian service centers are represented by Unifor and the Employee Shop Committee of Rivière-des-Prairies. Certain employees of GATX Rail Europe are represented by one union in Poland.
NOTE 15. Commercial Commitments
We have entered into various commercial commitments, including standby letters of credit, performance bonds, and guarantees related to certain transactions. These commercial commitments require us to fulfill specific obligations in the event of third-party demands. Similar to our balance sheet investments, these commitments expose us to credit, market, and equipment risk. Accordingly, we evaluate these commitments and other contingent obligations using techniques similar to those we use to evaluate funded transactions.
GATX CORPORATION AND SUBSIDIARIES
NOTES TO CONSOLIDATED FINANCIAL STATEMENTS (Continued)
As of December 31, 2024 and December 31, 2023, we had commercial commitments of $8.7 million, consisting of standby letters of credit and performance bonds. There were no liabilities recorded on the balance sheet for commercial commitments at December 31, 2024 and December 31, 2023. As of December 31, 2024, our outstanding commitments expire in 2025 through 2028. We are not aware of any event that would require us to satisfy any of our commitments.
We are parties to standby letters of credit and performance bonds, which primarily relate to contractual obligations and general liability insurance coverages. No material claims have been made against these obligations, and no material losses are anticipated.
NOTE 16. Earnings per Share
We compute basic and diluted earnings per share using the two-class method, which is an earnings allocation calculation that determines EPS for each class of common stock and participating security. Our vested and exercisable stock options contain non-forfeitable rights to dividends or dividend equivalents and are classified as participating securities in the calculation of EPS. Our unvested stock options, restricted stock units, performance shares and non-employee director awards do not contain nonforfeitable rights to dividends or dividend equivalents and are therefore not classified as participating securities. See "Note 3. Significant Accounting Policies" for more detail of our EPS calculation methodology.
The following table shows the computation of our basic and diluted earnings per common share for the years ended December 31 (in millions, except per share amounts):
| | | | | | | | | | | | | | | | | |
| 2024 | | 2023 | | 2022 |
| Basic earnings per share: | | | | | |
| Net income | $ | 284.2 | | | $ | 259.2 | | | $ | 155.9 | |
| Less: Net income allocated to participating securities | (4.9) | | | (4.9) | | | — | |
| Net income available to common shareholders | $ | 279.3 | | | $ | 254.3 | | | $ | 155.9 | |
| Weighted-average shares outstanding - basic | 35.8 | | | 35.7 | | | 35.4 | |
| Basic earnings per share | $ | 7.80 | | | $ | 7.13 | | | $ | 4.41 | |
| | | | | |
| Diluted earnings per share: | | | | | |
| Net income | $ | 284.2 | | | $ | 259.2 | | | $ | 155.9 | |
| Less: Net income allocated to participating securities | (4.9) | | | (4.9) | | | — | |
| Net income available to common shareholders | $ | 279.3 | | | $ | 254.3 | | | $ | 155.9 | |
| Weighted-average shares outstanding - basic | 35.8 | | | 35.7 | | | 35.4 | |
| Effect of dilutive securities: | | | | | |
| Equity compensation plans | 0.1 | | | 0.1 | | | 0.5 | |
| Weighted-average shares outstanding - diluted * | 35.9 | | | 35.7 | | | 35.9 | |
| Diluted earnings per share | $ | 7.78 | | | $ | 7.12 | | | $ | 4.35 | |
________
(*) Sum of individual components may not be additive due to rounding.
GATX CORPORATION AND SUBSIDIARIES
NOTES TO CONSOLIDATED FINANCIAL STATEMENTS (Continued)
NOTE 17. Goodwill
Our goodwill was $114.1 million as of December 31, 2024 and $120.0 million as of December 31, 2023. In the fourth quarter of 2024, we performed a review for impairment of goodwill, and concluded that goodwill was not impaired. The following table summarizes the components of goodwill by segment for the years ended December 31 (in millions):
| | | | | | | | | | | |
| 2024 | | 2023 |
| Rail North America | $ | 23.8 | | | $ | 23.8 | |
| Rail International (1) | 53.3 | | | 56.8 | |
| Other (1) | 37.0 | | | 39.4 | |
| Total | $ | 114.1 | | | $ | 120.0 | |
________(1) Goodwill relates to our rail operations in Europe at the Rail International segment and Trifleet at the Other segment.
The changes in the carrying amount of our goodwill for 2024 resulted from fluctuations in foreign currency exchange rates.
NOTE 18. Allowance for Losses
The following table shows changes in the allowance for losses at December 31 (in millions):
| | | | | | | | | | | |
| 2024 | | 2023 |
| Beginning balance | $ | 5.9 | | | $ | 5.9 | |
| Provision for losses | 2.0 | | | 0.4 | |
| Charges to allowance | (1.9) | | | (0.4) | |
| Recoveries and other, including foreign exchange adjustments | (0.3) | | | — | |
| Ending balance | $ | 5.7 | | | $ | 5.9 | |
NOTE 19. Other Assets and Other Liabilities
The following table shows the components of other assets reported on our balance sheets as of December 31 (in millions):
| | | | | | | | | | | |
| 2024 | | 2023 |
| Inventory | $ | 71.8 | | | $ | 74.0 | |
| Office furniture, fixtures and other equipment, net of accumulated depreciation | 26.8 | | | 28.5 | |
| Utilization asset | 26.5 | | | 24.1 | |
| Prepaid pension | 20.7 | | | 14.0 | |
| Prepaid items | 18.4 | | | 14.3 | |
| | | |
| Deferred financing costs | 3.5 | | | 2.0 | |
| Assets held for sale | 0.4 | | | 0.8 | |
| Derivatives | — | | | 0.5 | |
| Other | 135.0 | | | 128.4 | |
| Total | $ | 303.1 | | | $ | 286.6 | |
The following table shows the components of other liabilities reported on our balance sheets as of December 31 (in millions):
| | | | | | | | | | | |
| 2024 | | 2023 |
| Accrued pension and other post-retirement benefits | $ | 38.5 | | | $ | 47.0 | |
| Derivatives | 12.1 | | | 18.5 | |
| Environmental accruals | 12.0 | | | 2.8 | |
| | | |
| | | |
| Other | 44.9 | | | 38.1 | |
| Total | $ | 107.5 | | | $ | 106.4 | |
GATX CORPORATION AND SUBSIDIARIES
NOTES TO CONSOLIDATED FINANCIAL STATEMENTS (Continued)
NOTE 20. Shareholders’ Equity
On January 25, 2019, our board of directors ("Board") approved a $300 million share repurchase program, pursuant to which we are authorized to purchase shares of our common stock in the open market, in privately negotiated transactions, or otherwise, including pursuant to Rule 10b5-1 plans. The share repurchase program does not have an expiration date, does not obligate the Company to repurchase any dollar amount or number of shares of common stock, and may be suspended or discontinued at any time. The timing of share repurchases will be dependent on market conditions and other factors. During 2024, we repurchased 167,452 shares of common stock for $21.9 million. In 2023, we purchased 24,520 shares of common stock for $2.6 million. In 2022, we repurchased 472,609 shares of common stock for $47.2 million.
In accordance with our certificate of incorporation, 120 million shares of common stock are authorized, at a par value of $0.625 per share. As of December 31, 2024, 69.1 million shares were issued and 35.6 million shares were outstanding.
The following shares of common stock were reserved as of December 31, 2024 (in millions):
| | | | | |
| |
| GATX Corporation 2004 Equity Incentive Compensation Plan | 2.1 | |
| GATX Corporation 2012 Incentive Award Plan | 4.9 | |
| Total | 7.0 | |
Our certificate of incorporation also authorizes five million shares of preferred stock at a par value of $1.00 per share. We had no outstanding shares of preferred stock as of December 31, 2024 or December 31, 2023.
NOTE 21. Accumulated Other Comprehensive Loss
The following table shows the change in components for accumulated other comprehensive loss (in millions):
| | | | | | | | | | | | | | | | | | | | | | | |
| Foreign Currency Translation Adjustments | | Unrealized Loss on Derivative Instruments | | Post-Retirement Benefit Plans Adjustments | | Total |
| Accumulated other comprehensive loss at December 31, 2021 | $ | (95.4) | | | $ | (12.6) | | | $ | (52.6) | | | $ | (160.6) | |
| Change in component | (56.7) | | | 5.8 | | | (1.6) | | | (52.5) | |
| Reclassification adjustments into earnings (1) | — | | | (4.0) | | | 8.1 | | | 4.1 | |
| Income tax effect | — | | | (0.4) | | | (2.2) | | | (2.6) | |
| Accumulated other comprehensive loss at December 31, 2022 | $ | (152.1) | | | $ | (11.2) | | | $ | (48.3) | | | $ | (211.6) | |
| Change in component | 45.8 | | | (3.6) | | | (4.1) | | | 38.1 | |
| Reclassification adjustments into earnings (1) | — | | | 5.3 | | | 0.1 | | | 5.4 | |
| Income tax effect | — | | | (0.4) | | | 0.9 | | | 0.5 | |
| Accumulated other comprehensive loss at December 31, 2023 | $ | (106.3) | | | $ | (9.9) | | | $ | (51.4) | | | $ | (167.6) | |
| Change in component | (53.8) | | | 3.4 | | | 13.9 | | | (36.5) | |
| Reclassification adjustments into earnings (1) | — | | | (2.1) | | | 0.4 | | | (1.7) | |
| Income tax effect | — | | | (0.3) | | | (3.5) | | | (3.8) | |
| Accumulated other comprehensive loss at December 31, 2024 | $ | (160.1) | | | $ | (8.9) | | | $ | (40.6) | | | $ | (209.6) | |
________
(1) See "Note 9. Fair Value" and "Note 11. Pension and Other Post-Retirement Benefits" for impacts of the reclassification adjustments on the statements of comprehensive income.
GATX CORPORATION AND SUBSIDIARIES
NOTES TO CONSOLIDATED FINANCIAL STATEMENTS (Continued)
NOTE 22. Foreign Operations
For the years ended December 31, 2024, 2023, and 2022, we did not derive revenues in excess of 10% of our consolidated revenues from any one foreign country. At December 31, 2024 and December 31, 2023, the United Kingdom was the only foreign country that held more than 10% of our identifiable assets.
The following table shows our domestic and foreign revenues and identifiable assets for the years ended or as of December 31 (in millions):
| | | | | | | | | | | | | | | | | |
| 2024 | | 2023 | | 2022 |
| Revenues | | | | | |
| Foreign | $ | 637.3 | | | $ | 548.1 | | | $ | 466.9 | |
| United States | 948.2 | | | 862.8 | | | 806.1 | |
| Total | $ | 1,585.5 | | | $ | 1,410.9 | | | $ | 1,273.0 | |
| | | | | |
| Identifiable Assets | | | | | |
| Foreign | $ | 5,167.2 | | | $ | 4,718.5 | | | $ | 3,910.2 | |
| United States | 7,129.3 | | | 6,607.5 | | | 6,161.8 | |
| Total | $ | 12,296.5 | | | $ | 11,326.0 | | | $ | 10,072.0 | |
NOTE 23. Legal Proceedings and Other Contingencies
Various legal actions, claims, assessments, and other contingencies arising in the ordinary course of business are pending against GATX and certain of our subsidiaries. These matters are subject to many uncertainties, and it is possible that some of these matters could ultimately be decided, resolved, or settled adversely.
Norfolk Southern Train Derailment in East Palestine, Ohio
On June 30, 2023, a third-party complaint was filed by Norfolk Southern Railway Company and Norfolk Southern Corporation (collectively, “Norfolk Southern”) against GATX and several other parties in the Northern District of Ohio (Eastern Division) for contribution and recovery of environmental damages related to the derailment of a Norfolk Southern train in East Palestine, Ohio that included railcars owned by GATX Corporation. The Company filed a motion to dismiss Norfolk Southern's third-party complaint on September 15, 2023. On March 6, 2024, the Court granted GATX's and the other third-party defendants’ motions and dismissed all Comprehensive Environmental Response, Compensation and Liability Act ("CERCLA") claims. The Court also dismissed all state law claims, declining to exercise supplemental jurisdiction over them in light of its dismissal of the CERCLA claims. On March 26, 2024, Norfolk Southern moved the Court for entry of partial final judgment as to the order dismissing the third-party complaint in order to appeal before final judgment the Court’s dismissal order as to GATX and the other third-party defendants. The Court has not yet ruled on Norfolk Southern’s motion. In the interim, on May 23, 2024, Norfolk Southern entered into a Consent Decree settling claims with the United States Department of Justice and Environmental Protection Agency (but not the State of Ohio) to which GATX is not a party.
GATX CORPORATION AND SUBSIDIARIES
NOTES TO CONSOLIDATED FINANCIAL STATEMENTS (Continued)
On July 25, 2023, a separate third-party complaint was filed by Norfolk Southern against GATX and two other defendants in the Northern District of Ohio (Eastern Division) for contribution to personal injury and property damages class claims related to the derailment of the Norfolk Southern train in East Palestine, Ohio. The plaintiffs who had originally filed the complaint against Norfolk Southern ("Plaintiffs") themselves subsequently filed direct claims against GATX and the two other third-party defendants alleging many of the same facts as Norfolk Southern. On September 15, 2023, the Company filed a motion to dismiss Norfolk Southern's third-party complaint, and on September 26, 2023, filed a motion to dismiss the Plaintiffs' complaint. Briefing was completed on October 30, 2023, and the Court issued an order on March 13, 2024, denying in part, and granting in part, the Company’s motion against Norfolk Southern and Plaintiffs. The Court held that Norfolk Southern’s contribution action was premature and dismissed the claim without prejudice but otherwise allowed the remaining claims against GATX to proceed. The Court also dismissed Plaintiffs’ claim for medical monitoring but held that Plaintiffs could seek such damages through their other claims, which could proceed. The Court also consolidated an additional action filed against GATX and others titled Almasy, et al. v. Norfolk Southern Corp., et al. by over 40 individual residents, employees and property owners in East Palestine, Ohio. Plaintiffs and Norfolk Southern reached a settlement for $600 million to resolve the consolidated class action claims of those within a 20-mile radius from the derailment, and, for those residents who choose to participate, personal injury claims within a 10-mile radius from the derailment. On September 25, 2024, the Court held a final approval hearing and two days later issued its final approval order for the settlement. To date, a handful of appeals challenging the fairness, reasonableness and adequacy of the settlement have been filed with the Sixth Circuit Court of Appeals. On October 9, 2024, all parties to the litigation filed motions for summary judgment for the pending claims. All motions have been fully briefed and are pending. The Court has indicated that rulings are imminent. Norfolk Southern has requested and has been granted leave to reinstate its contribution claims against GATX and others. Trial is currently scheduled for March 31, 2025.
On December 8, 2023, GATX and three other defendants were named as additional defendants in a putative class action lawsuit originally filed in federal court in Pennsylvania against Norfolk Southern by four Pennsylvania school districts and their students. The allegations largely mirror those in the action filed in federal court in Ohio. The amended complaint seeks monetary damages for the Pennsylvania plaintiffs for personal injury and property damage allegedly related to the derailment. The Company and other defendants filed a motion to dismiss on February 23, 2024. Briefing has been completed and the motions remain pending and undecided. The Court has not set any further deadlines.
GATX recently learned of two new lawsuits filed on February 3, 2025, in the Court of Common Pleas, Franklin County, Ohio on behalf of approximately 750 plaintiffs, of whom approximately 184 have opted out of the prior settlement agreements with Norfolk Southern or were not included and are now suing GATX and approximately 30 other defendants. The remaining plaintiffs who opted into the settlement with Norfolk Southern (approximately 550) are not suing GATX.
The Company is vigorously defending itself against each of these lawsuits. At this time, the Company cannot reasonably estimate the loss or range of loss, if any, that may ultimately be incurred in connection with any of these lawsuits and has not established any accruals for potential liability related to this incident.
Other Litigation
GATX and its subsidiaries have been named as defendants in various legal actions and claims, governmental proceedings, and private civil suits arising in the ordinary course of business, including environmental matters, workers’ compensation claims, and other personal injury claims. Some of these proceedings include claims for punitive as well as compensatory damages. Several of our subsidiaries have also been named as defendants or co-defendants in cases alleging injury caused by exposure to asbestos. The plaintiffs seek an unspecified amount of damages based on common law, statutory, or premises liability. In addition, demand has been made against GATX for asbestos-related claims under limited indemnities given in connection with the sale of certain of our former subsidiaries. These matters are subject to many uncertainties, and it is possible that some of these matters could ultimately be decided, resolved, or settled adversely.
Litigation Accruals
We have recorded accruals totaling $4.9 million at December 31, 2024 for losses related to those litigation matters that we believe to be probable and for which an amount of loss can be reasonably estimated. However, we cannot determine a reasonable estimate of the maximum possible loss or range of loss for these matters given that they are at various stages of the litigation process and each case is subject to the inherent uncertainties of litigation (such as the strength of our legal defenses and the availability of insurance recovery). Although the maximum amount of liability that may ultimately result from any of these matters cannot be predicted with absolute certainty, management expects that none of the matters for which we have recorded an accrual, when ultimately resolved, will have a material adverse effect on our consolidated financial position or liquidity. It is possible, however, that the ultimate resolution of one or more of these matters could have a material adverse effect on our results of operations in a particular quarter or year if such resolution results in liability that materially exceeds the accrued amount.
GATX CORPORATION AND SUBSIDIARIES
NOTES TO CONSOLIDATED FINANCIAL STATEMENTS (Continued)
In addition, we have other litigation matters pending for which we have not recorded any accruals because our potential liability for those matters is not probable or cannot be reasonably estimated based on currently available information. For those matters where we have not recorded an accrual but a loss is reasonably possible, we cannot determine a reasonable estimate of the maximum possible loss or range of loss for these matters given that they are at various stages of the litigation process and each case is subject to the inherent uncertainties of litigation (such as the strength of our legal defenses and the availability of insurance recovery). Although the maximum amount of liability that may ultimately result from any of these matters cannot be predicted with absolute certainty, management expects that none of the matters for which we have not recorded an accrual, when ultimately resolved, will have a material adverse effect on our consolidated financial position or liquidity. It is possible, however, that the ultimate resolution of one or more of these matters could have a material adverse effect on our results of operations in a particular quarter or year if such resolution results in a significant liability for GATX.
Environmental
Our operations are subject to extensive federal, state, and local environmental regulations. Our operating procedures include practices to protect the environment from the risks inherent in full service railcar leasing, which involves maintaining railcars used by customers to transport chemicals and other hazardous materials. Under some environmental laws in the U.S. and certain other countries, the owner of a leased transportation asset may be liable for environmental damage and cleanup or other costs in the event of a spill or discharge of material from such asset without regard to the owner’s fault. While our standard forms of lease agreements require the lessee to indemnify us against environmental claims and to carry liability insurance coverage, such indemnities and insurance may not fully protect us against claims for environmental damage. Additionally, some of our real estate holdings, including previously owned properties, are or have been used for industrial or transportation-related purposes or leased to commercial or industrial companies whose activities might have resulted in discharges on the property. As a result, we are subject to environmental cleanup and enforcement actions. In particular, CERCLA, also known as the Superfund law, as well as similar state laws, impose joint and several liability for cleanup and enforcement costs on current and former owners and operators of a site without regard to fault or the legality of the original conduct. If there are other potentially responsible parties (“PRPs”), we generally contribute to the cleanup of these sites through cost-sharing agreements with terms that vary from site to site. Costs are typically allocated based on the relative volumetric contribution of material, the period of time the site was owned or operated, and/or the portion of the site owned or operated by each PRP.
At the time a potential environmental issue is identified, initial accruals for environmental liability are established when such liability is determined to be probable and a reasonable estimate of the associated costs can be made. Costs are estimated based on the type and level of investigation and/or remediation activities that our internal environmental staff (and where appropriate, independent consultants) have advised to be necessary to comply with applicable laws and regulations. Activities include surveys and environmental studies of potentially contaminated sites as well as costs for remediation and restoration of sites determined to be contaminated. In addition, we have provided indemnities for potential environmental liabilities to buyers of divested companies. In these instances, accruals are based on the scope and duration of the respective indemnities together with the extent of known contamination. Estimates are periodically reviewed and adjusted as required to reflect additional information about facility or site characteristics or changes in regulatory requirements. We conduct a quarterly environmental contingency analysis, which considers a combination of factors including independent consulting reports, site visits, legal reviews, analysis of the likelihood of participation in and the ability of other PRPs to pay for cleanup, and historical trend analyses.
We are involved in administrative and judicial proceedings and other voluntary and mandatory cleanup efforts at 9 sites, including Superfund sites, for which we are contributing to the cost of performing the study or cleanup, or both, of alleged environmental contamination. As of December 31, 2024, we have recorded accruals of $12.0 million for remediation and restoration costs that we believe to be probable and for which the amount of loss can be reasonably estimated. These amounts are included in other liabilities on our balance sheet. Our environmental liabilities are not discounted.
We did not materially change our methodology for identifying and calculating environmental liabilities in the last three years. Currently, no known trends, demands, commitments, events or uncertainties exist that are reasonably likely to occur and materially affect the methodology or assumptions described above.
The recorded accruals represent our best estimate of all costs for remediation and restoration of affected sites, without reduction for anticipated recoveries from third parties, and include both asserted and unasserted claims. However, we are unable to provide a reasonable estimate of the maximum potential loss associated with these sites because cleanup costs cannot be predicted with certainty. Various factors beyond our control can impact the amount of loss GATX will ultimately incur with respect to these sites, including the extent of corrective actions that may be required; evolving environmental laws and regulations; advances in environmental technology, the extent of other parties' participation in cleanup efforts; developments in periodic environmental
GATX CORPORATION AND SUBSIDIARIES
NOTES TO CONSOLIDATED FINANCIAL STATEMENTS (Continued)
analyses related to sites determined to be contaminated, and developments in environmental surveys and studies of potentially contaminated sites. As a result, future charges associated with these sites could have a significant effect on results of operations in a particular quarter or year if the costs materially exceed the accrued amount as individual site studies and remediation and restoration efforts proceed. However, management believes it is unlikely that the ultimate cost to GATX for any of these sites, either individually or in the aggregate, will have a material adverse effect on our consolidated financial position or liquidity.
NOTE 24. Financial Data of Business Segments
The financial data presented below depicts the profitability, financial position, and capital expenditures of each of our business segments.
We lease, operate, manage, and remarket long-lived, widely used assets, primarily in the rail market. We report our financial results through three primary business segments: Rail North America, Rail International, and Engine Leasing (previously named Portfolio Management). Financial results for Trifleet are reported in the Other segment.
Rail North America is composed of our operations in the United States, Canada, and Mexico. Rail North America primarily provides railcars pursuant to full-service leases under which it maintains the railcars, pays ad valorem taxes and insurance, and provides other ancillary services.
Rail International is an aggregation of our operating segments in Europe ("GATX Rail Europe" or "GRE"), India ("Rail India") and, until January 31, 2023, Rail Russia. In 2023, we completed the sale of Rail Russia. GRE primarily leases railcars to customers throughout Europe pursuant to full-service leases under which it maintains the railcars and provides value-added services according to customer requirements. Rail India primarily leases railcars to customers in India pursuant to net leases, under which the lessee assumes responsibility for maintenance of the railcars.
As previously disclosed, we changed the name of our Portfolio Management business segment to Engine Leasing in 2024 to reflect the prospective operations of the segment. Historically, this business segment included marine operations from our Specialized Gas Vessels. As of December 31, 2023, we had sold all of our marine assets and no longer have any marine operations.
Engine Leasing is now almost entirely composed our engine leasing operations, which include our ownership interest in the RRPF affiliates, a group of joint ventures with Rolls-Royce that lease aircraft spare engines, and GEL, our business that directly owns aircraft spare engines that are leased to airline customers or employed in engine capacity agreements.
Other includes Trifleet operations, as well as selling, general and administrative expenses, income taxes, and certain other amounts not allocated to the segments.
Segment profit is an internal performance measure reported to GATX's President and Chief Executive Officer, our chief operating decision maker ("CODM"), for purposes of assessing performance and allocating capital and resources to each segment. Segment profit includes all revenues, expenses, pre-tax earnings from affiliates, and net gains on asset dispositions that are directly attributable to each segment. We allocate interest expense to the segments based on what we believe to be the appropriate risk-adjusted borrowing costs for each segment. Segment profit excludes selling, general and administrative expenses, income taxes, and certain other amounts not allocated to the segments. We have disclosed in each segment the significant expense categories that are reviewed by the CODM, and there are no additional significant expenses within the expense categories presented in the segment tables. The CODM uses segment profit during the annual budget and forecasting processes and considers comparisons of actual segment profit against budget, forecast, and prior periods to assess current period performance and when making decisions about allocating capital and resources to each segment.
GATX CORPORATION AND SUBSIDIARIES
NOTES TO CONSOLIDATED FINANCIAL STATEMENTS (Continued)
The following tables show certain segment data for the years ended December 31, 2024, 2023, and 2022 (in millions):
| | | | | | | | | | | | | | | | | | | | | | | | | | | | | |
|
Rail North
America | |
Rail International | |
Engine Leasing | | Other | | GATX Consolidated |
| 2024 Profitability | | | | | | | | | |
| Revenues | | | | | | | | | |
| Lease revenue | $ | 983.5 | | | $ | 333.6 | | | $ | 32.4 | | | $ | 31.6 | | | $ | 1,381.1 | |
| Non-dedicated engine revenue | — | | | — | | | 64.6 | | | — | | | 64.6 | |
| | | | | | | | | |
| Other revenue | 115.5 | | | 16.7 | | | 0.1 | | | 7.5 | | | 139.8 | |
| Total Revenues | 1,099.0 | | | 350.3 | | | 97.1 | | | 39.1 | | | 1,585.5 | |
| Expenses | | | | | | | | | |
| Maintenance expense | 306.9 | | | 70.7 | | | — | | | 4.0 | | | 381.6 | |
| Depreciation expense | 271.1 | | | 78.7 | | | 37.8 | | | 14.8 | | | 402.4 | |
| Operating lease expense | 33.9 | | | — | | | — | | | — | | | 33.9 | |
| | | | | | | | | |
| Other operating expense | 26.4 | | | 17.4 | | | 9.6 | | | 4.3 | | | 57.7 | |
| Total Expenses | 638.3 | | | 166.8 | | | 47.4 | | | 23.1 | | | 875.6 | |
| Other Income (Expense) | | | | | | | | | |
| Net gain on asset dispositions | 132.8 | | | 4.5 | | | 0.6 | | | 0.4 | | | 138.3 | |
| Interest (expense) income, net | (232.1) | | | (71.4) | | | (41.9) | | | 4.4 | | | (341.0) | |
| Other (expense) income | (5.4) | | | 3.2 | | | 0.6 | | | (7.9) | | | (9.5) | |
| Share of affiliates' pre-tax earnings | — | | | — | | | 108.3 | | | — | | | 108.3 | |
| Segment profit | $ | 356.0 | | | $ | 119.8 | | | $ | 117.3 | | | $ | 12.9 | | | $ | 606.0 | |
| Less: | | | | | | | | | |
| Selling, general and administrative expense | 236.3 | |
| Income taxes (includes $25.5 related to affiliates' earnings) | 85.5 | |
| Net income | $ | 284.2 | |
| | | | | | | | | |
| Net Gain on Asset Dispositions | | | | | | | | | |
| Asset Remarketing Income: | | | | | | | | | |
| Net gains on dispositions of owned assets | $ | 119.4 | | | $ | 1.7 | | | $ | 0.6 | | | $ | 0.3 | | | $ | 122.0 | |
| Residual sharing income | 0.5 | | | — | | | — | | | — | | | 0.5 | |
| Non-remarketing net gains (1) | 12.9 | | | 2.8 | | | — | | | 0.1 | | | 15.8 | |
| | | | | | | | | |
| $ | 132.8 | | | $ | 4.5 | | | $ | 0.6 | | | $ | 0.4 | | | $ | 138.3 | |
| | | | | | | | | |
| Capital Expenditures | | | | | | | | | |
| Portfolio investments and capital additions | $ | 1,162.4 | | | $ | 232.9 | | | $ | 260.8 | | | $ | 18.3 | | | $ | 1,674.4 | |
| | | | | | | | | |
| Selected Balance Sheet Data | | | |
| Investments in affiliated companies | $ | 0.2 | | | $ | — | | | $ | 663.1 | | | $ | — | | | $ | 663.3 | |
| Identifiable assets | $ | 7,751.6 | | | $ | 2,233.3 | | | $ | 1,653.4 | | | $ | 658.2 | | | $ | 12,296.5 | |
| | | | | | | | | |
__________
(1) Includes net gains from scrapping of railcars.
GATX CORPORATION AND SUBSIDIARIES
NOTES TO CONSOLIDATED FINANCIAL STATEMENTS (Continued)
| | | | | | | | | | | | | | | | | | | | | | | | | | | | | |
|
Rail North
America | |
Rail International | | Engine Leasing | | Other | | GATX Consolidated |
| 2023 Profitability | | | | | | | | | |
| Revenues | | | | | | | | | |
| Lease revenue | $ | 888.8 | | | $ | 296.6 | | | $ | 32.6 | | | $ | 33.4 | | | $ | 1,251.4 | |
| Non-dedicated engine revenue | — | | | — | | | 37.6 | | | — | | | 37.6 | |
| Marine operating revenue | — | | | — | | | 6.9 | | | — | | | 6.9 | |
| Other revenue | 93.9 | | | 12.9 | | | 0.1 | | | 8.1 | | | 115.0 | |
| Total Revenues | 982.7 | | | 309.5 | | | 77.2 | | | 41.5 | | | 1,410.9 | |
| Expenses | | | | | | | | | |
| Maintenance expense | 276.6 | | | 64.1 | | | — | | | 4.1 | | | 344.8 | |
| Depreciation expense | 265.9 | | | 68.2 | | | 28.3 | | | 13.9 | | | 376.3 | |
| Operating lease expense | 36.0 | | | — | | | — | | | — | | | 36.0 | |
| Marine operating expense | — | | | — | | | 6.5 | | | — | | | 6.5 | |
| Other operating expense | 25.9 | | | 10.4 | | | 7.3 | | | 3.0 | | | 46.6 | |
| Total Expenses | 604.4 | | | 142.7 | | | 42.1 | | | 21.0 | | | 810.2 | |
| Other Income (Expense) | | | | | | | | | |
| Net gain on asset dispositions | 120.5 | | | 7.0 | | | 2.2 | | | 0.6 | | | 130.3 | |
| Interest (expense) income, net | (182.9) | | | (56.2) | | | (29.8) | | | 5.5 | | | (263.4) | |
| Other (expense) income | (8.0) | | | (4.2) | | | 0.2 | | | 2.6 | | | (9.4) | |
| Share of affiliates' pre-tax (loss) earnings | (0.6) | | | — | | | 98.7 | | | — | | | 98.1 | |
| Segment profit | $ | 307.3 | | | $ | 113.4 | | | $ | 106.4 | | | $ | 29.2 | | | $ | 556.3 | |
| Less: | | | | | | | | | |
| Selling, general and administrative expense | 212.7 | |
| Income taxes (includes $25.7 related to affiliates' earnings) | 84.4 | |
| Net income | $ | 259.2 | |
| | | | | | | | | |
| Net Gain on Asset Dispositions | | | | | | | | | |
| Asset Remarketing Income: | | | | | | | | | |
| Net gains on dispositions of owned assets | $ | 111.7 | | | $ | 4.9 | | | $ | 2.9 | | | $ | 0.3 | | | $ | 119.8 | |
| Residual sharing income | 0.4 | | | — | | | 0.5 | | | — | | | 0.9 | |
| Non-remarketing net gains (1) | 8.4 | | | 2.4 | | | — | | | 0.3 | | | 11.1 | |
| Asset impairments | — | | | (0.3) | | | (1.2) | | | — | | | (1.5) | |
| $ | 120.5 | | | $ | 7.0 | | | $ | 2.2 | | | $ | 0.6 | | | $ | 130.3 | |
| | | | | | | | | |
| Capital Expenditures | | | | | | | | | |
| Portfolio investments and capital additions | $ | 976.9 | | | $ | 382.4 | | | $ | 267.3 | | | $ | 38.4 | | | $ | 1,665.0 | |
| | | | | | | | | |
| Selected Balance Sheet Data | | | |
| Investments in affiliated companies | $ | 0.2 | | | $ | — | | | $ | 626.8 | | | $ | — | | | $ | 627.0 | |
| Identifiable assets | $ | 6,993.8 | | | $ | 2,175.2 | | | $ | 1,355.1 | | | $ | 801.9 | | | $ | 11,326.0 | |
__________
(1) Includes net gains from scrapping of railcars.
GATX CORPORATION AND SUBSIDIARIES
NOTES TO CONSOLIDATED FINANCIAL STATEMENTS (Continued)
| | | | | | | | | | | | | | | | | | | | | | | | | | | | | |
|
Rail North
America | |
Rail International | | Engine Leasing | | Other | | GATX Consolidated |
| 2022 Profitability | | | | | | | | | |
| Revenues | | | | | | | | | |
| Lease revenue | $ | 826.0 | | | $ | 266.2 | | | $ | 33.0 | | | $ | 29.4 | | | $ | 1,154.6 | |
| Non-dedicated engine revenue | — | | | — | | | 1.5 | | | — | | | 1.5 | |
| Marine operating revenue | — | | | — | | | 18.9 | | | — | | | 18.9 | |
| Other revenue | 82.0 | | | 9.1 | | | 0.2 | | | 6.7 | | | 98.0 | |
| Total Revenues | 908.0 | | | 275.3 | | | 53.6 | | | 36.1 | | | 1,273.0 | |
| Expenses | | | | | | | | | |
| Maintenance expense | 238.5 | | | 51.4 | | | — | | | 2.8 | | | 292.7 | |
| Depreciation expense | 258.6 | | | 69.1 | | | 17.8 | | | 12.0 | | | 357.5 | |
| Operating lease expense | 36.1 | | | — | | | — | | | — | | | 36.1 | |
| Marine operating expense | — | | | — | | | 14.1 | | | — | | | 14.1 | |
| Other operating expense | 24.5 | | | 8.3 | | | 2.3 | | | 2.3 | | | 37.4 | |
| Total Expenses | 557.7 | | | 128.8 | | | 34.2 | | | 17.1 | | | 737.8 | |
| Other Income (Expense) | | | | | | | | | |
| Net gain (loss) on asset dispositions | 119.7 | | | (11.2) | | | (31.1) | | | 0.5 | | | 77.9 | |
| Interest expense, net | (144.6) | | | (45.6) | | | (19.0) | | | (4.8) | | | (214.0) | |
| Other expense | (4.6) | | | (3.8) | | | — | | | (18.6) | | | (27.0) | |
| Share of affiliates' pre-tax earnings | 0.5 | | | — | | | 45.4 | | | — | | | 45.9 | |
| Segment profit (loss) | $ | 321.3 | | | $ | 85.9 | | | $ | 14.7 | | | $ | (3.9) | | | $ | 418.0 | |
| Less: | | | | | | | | | |
| Selling, general and administrative expense | 195.0 | |
| Income taxes (includes $12.3 related to affiliates' earnings) | 67.1 | |
| Net income | $ | 155.9 | |
| | | | | | | | | |
| Net Gain (Loss) on Asset Dispositions | | | | | | | | | |
| Asset Remarketing Income: | | | | | | | | | |
| Net gains on dispositions of owned assets | $ | 102.2 | | | $ | 1.6 | | | $ | — | | | $ | 0.3 | | | $ | 104.1 | |
| Residual sharing income | 2.4 | | | — | | | 3.2 | | | — | | | 5.6 | |
| Non-remarketing net gains (1) | 15.1 | | | 1.8 | | | — | | | 0.2 | | | 17.1 | |
| Asset impairments | — | | | (14.6) | | | (34.3) | | | — | | | (48.9) | |
| $ | 119.7 | | | $ | (11.2) | | | $ | (31.1) | | | $ | 0.5 | | | $ | 77.9 | |
| | | | | | | | | |
| Capital Expenditures | | | | | | | | | |
| Portfolio investments and capital additions | $ | 815.9 | | | $ | 243.9 | | | $ | 149.7 | | | $ | 46.3 | | | $ | 1,255.8 | |
| | | | | | | | | |
| Selected Balance Sheet Data | | | |
| Investments in affiliated companies | $ | 0.8 | | | $ | — | | | $ | 574.3 | | | $ | — | | | $ | 575.1 | |
| Identifiable assets | $ | 6,445.7 | | | $ | 1,774.4 | | | $ | 1,106.6 | | | $ | 745.3 | | | $ | 10,072.0 | |
| | | | | | | | | |
__________
(1) Includes net gains from scrapping of railcars.
Item 9. Changes in and Disagreements with Accountants on Accounting and Financial Disclosure
None.
Item 9A. Controls and Procedures
Management’s Report Regarding the Effectiveness of Disclosure Controls and Procedures
Our management, with the participation of our Chief Executive Officer and Chief Financial Officer, has conducted an evaluation of our disclosure controls and procedures (as defined in Rules 13a-15(e) and 15d-15(e) of the Securities Exchange Act of 1934 (the “Exchange Act”)). Based on such evaluation, our Chief Executive Officer and Chief Financial Officer have concluded that, as of the end of the period covered by this annual report, our disclosure controls and procedures were effective.
Management’s Annual Report on Internal Control Over Financial Reporting
Our management is responsible for establishing and maintaining adequate internal control over financial reporting as defined in Rules 13a-15(f) and 15d-15(f) of the Exchange Act for us. Our internal control over financial reporting is designed to provide reasonable assurance regarding the reliability of financial reporting and the preparation of financial statements for external purposes in accordance with generally accepted accounting principles. Our internal control over financial reporting includes those policies and procedures that:
(i) pertain to the maintenance of records that, in reasonable detail, accurately and fairly reflect the transactions and dispositions of our assets;
(ii) provide reasonable assurance that transactions are recorded as necessary to permit preparation of financial statements in accordance with generally accepted accounting principles, and that our receipts and expenditures are being made only in accordance with authorizations of our management and directors; and
(iii) provide reasonable assurance regarding prevention or timely detection of unauthorized acquisition, use or disposition of our assets that could have a material effect on the financial statements.
Because of its inherent limitations, internal control over financial reporting may not prevent or detect misstatements. In addition, projections of any evaluation of effectiveness to future periods are subject to the risk that controls may become inadequate as a result of changes in conditions, or that the degree of compliance with the applicable policies and procedures may deteriorate.
Our management, with the participation of our Chief Executive Officer and Chief Financial Officer, has conducted an evaluation of our internal control over financial reporting as of the end of the period covered by this annual report based on the framework in Internal Control-Integrated Framework issued by the Committee of Sponsoring Organizations of the Treadway Commission (2013 framework). Such evaluation included reviewing the documentation of our internal controls, evaluating the design effectiveness of the internal controls and testing their operating effectiveness.
Based on such evaluation, our management has concluded that as of the end of the period covered by this annual report, our internal control over financial reporting was effective. Management reviewed the results of its assessment with the Audit Committee of our Board of Directors.
Ernst & Young LLP, the independent registered public accounting firm that audited the financial statements included in this annual report, has issued a report on our internal control over financial reporting. That report follows.
Report of Independent Registered Public Accounting Firm
To the Shareholders and the Board of Directors of GATX Corporation
Opinion on Internal Control Over Financial Reporting
We have audited GATX Corporation and subsidiaries’ internal control over financial reporting as of December 31, 2024, based on criteria established in Internal Control – Integrated Framework issued by the Committee of Sponsoring Organizations of the Treadway Commission (2013 framework) (the COSO criteria). In our opinion, GATX Corporation and subsidiaries (the Company) maintained, in all material respects, effective internal control over financial reporting as of December 31, 2024, based on the COSO criteria.
We also have audited, in accordance with the standards of the Public Company Accounting Oversight Board (United States) (PCAOB), the consolidated balance sheets of the Company as of December 31, 2024 and 2023, the related consolidated statements of comprehensive income, changes in shareholders' equity and cash flows for each of the three years in the period ended December 31, 2024, and the related notes and our report dated February 19, 2025 expressed an unqualified opinion thereon.
Basis for Opinion
The Company’s management is responsible for maintaining effective internal control over financial reporting and for its assessment of the effectiveness of internal control over financial reporting included in the accompanying Management’s Annual Report on Internal Control Over Financial Reporting. Our responsibility is to express an opinion on the Company’s internal control over financial reporting based on our audit. We are a public accounting firm registered with the PCAOB and are required to be independent with respect to the Company in accordance with the U.S. federal securities laws and the applicable rules and regulations of the Securities and Exchange Commission and the PCAOB.
We conducted our audit in accordance with the standards of the PCAOB. Those standards require that we plan and perform the audit to obtain reasonable assurance about whether effective internal control over financial reporting was maintained in all material respects.
Our audit included obtaining an understanding of internal control over financial reporting, assessing the risk that a material weakness exists, testing and evaluating the design and operating effectiveness of internal control based on the assessed risk, and performing such other procedures as we considered necessary in the circumstances. We believe that our audit provides a reasonable basis for our opinion.
Definition and Limitations of Internal Control Over Financial Reporting
A company’s internal control over financial reporting is a process designed to provide reasonable assurance regarding the reliability of financial reporting and the preparation of financial statements for external purposes in accordance with generally accepted accounting principles. A company’s internal control over financial reporting includes those policies and procedures that (1) pertain to the maintenance of records that, in reasonable detail, accurately and fairly reflect the transactions and dispositions of the assets of the company; (2) provide reasonable assurance that transactions are recorded as necessary to permit preparation of financial statements in accordance with generally accepted accounting principles, and that receipts and expenditures of the company are being made only in accordance with authorizations of management and directors of the company; and (3) provide reasonable assurance regarding prevention or timely detection of unauthorized acquisition, use, or disposition of the company’s assets that could have a material effect on the financial statements.
Because of its inherent limitations, internal control over financial reporting may not prevent or detect misstatements. Also, projections of any evaluation of effectiveness to future periods are subject to the risk that controls may become inadequate because of changes in conditions, or that the degree of compliance with the policies or procedures may deteriorate.
/s/ Ernst & Young LLP
Chicago, Illinois
February 19, 2025
Changes in Internal Control Over Financial Reporting
No changes in our internal control over financial reporting (as defined in Exchange Act Rules 13a-15(f) and 15d-15(f)) occurred during the fiscal quarter ended December 31, 2024, that materially affected, or is reasonably likely to materially affect, our internal control over financial reporting.
Item 9B. Other Information
Insider Trading Plans
None of the Company's directors or officers adopted or terminated a "Rule 10b5-1 trading arrangement" or "non-Rule 10b5-1 trading arrangement", as each term is defined in Item 408(a) of Regulation S-K, during the quarter ended December 31, 2024.
Item 9C. Disclosure Regarding Foreign Jurisdictions that Prevent Inspections
Not Applicable.
PART III
Item 10. Directors, Executive Officers and Corporate Governance
Information required by this item regarding our directors, our Code of Business Conduct and Ethics, Code of Ethics for Senior Company Officers, Audit Committee Financial Experts, compliance with Section 16(a) of the Exchange Act, corporate governance, and policies and procedures regarding insider trading is contained in sections entitled "Board of Directors", "Board Independence", "Board Leadership Structure", "Board Committees", "Insider Trading Policy", "Director and Officer Indemnification and Insurance Arrangements", "Communication with the Board", "Director Criteria and Nomination Process", "Nominees for Election to the Board of Directors", and "Audit Committee Report" in our definitive Proxy Statement to be filed with the SEC on or about March 14, 2025, which sections are incorporated herein by reference.
Information regarding executive officers is included after Item 1 in Part I of this Form 10-K.
Item 11. Executive Compensation
Information required by this item regarding compensation of our directors and executive officers, as well as our policies and practices on the timing of awards of stock options in relation to the disclosure of material nonpublic information, is contained in sections entitled “Director Compensation”, “Compensation Discussion and Analysis”, “Compensation Committee Report”, and “Executive Compensation Tables”, in our definitive Proxy Statement to be filed with the SEC on or about March 14, 2025, which sections are incorporated herein by reference.
Item 12. Security Ownership of Certain Beneficial Owners and Management and Related Stockholder Matters
Equity Compensation Plan Information as of December 31, 2024:
| | | | | | | | | | | | | | | | | | | | |
| | | Number of Securities to be Issued Upon Exercise of Outstanding Options, Warrants and Rights | | Weighted-Average Exercise Price of Outstanding Options, Warrants and Rights | | Number of Securities Remaining Available for Future Issuance Under Equity Compensation Plans (excluding securities reflected in Column (a)) |
| Plan Category | | (a) | | (b) | | (c) |
| Equity Compensation Plans Approved by Shareholders | | 1,441,484 | | (1) | $ | 118.34 | | (2) | 1,745,998 | |
| Equity Compensation Plans Not Approved by Shareholders | | — | | | | | — | |
| Total | | 1,441,484 | | | | | 1,745,998 | |
________
(1) Consists of 948,100 non-qualified stock options, 141,094 performance shares, 101,826 restricted stock units and 250,464 non-employee directors awards, which consist of a mix of phantom shares and restricted stock units.
(2) The weighted-average exercise price does not include performance shares, restricted stock or phantom stock units.
For additional information about issuable securities under our equity compensation plans and the related weighted-average exercise price, see "Note 12. Share-Based Compensation" in Part II, Item 8 of this Form 10-K.
Other information required by this item regarding security ownership of certain beneficial owners and management is contained in sections entitled “Security Ownership of Directors and Executive Officers” and “Principal Shareholders” in our definitive Proxy Statement to be filed with the SEC on or about March 14, 2025, which sections are incorporated herein by reference.
Item 13. Certain Relationships and Related Transactions, and Director Independence
Information required by this item regarding transactions with related persons and director independence is contained in the sections entitled “Related Party Transactions” and “Board Independence” in our definitive Proxy Statement to be filed with the SEC on or about March 14, 2025, which sections are incorporated herein by reference.
Item 14. Principal Accountant Fees and Services
Information required by this item regarding fees paid to Ernst & Young LLP is contained in sections entitled "Pre-Approval Policy" and “Audit and Other Related Fees” in our definitive Proxy Statement to be filed with the SEC on or about March 14, 2025, which sections are incorporated herein by reference.
PART IV
Item 15. Exhibits, Financial Statement Schedules
(a) 1. Financial Statements | | | | | |
| Page |
| Documents Filed as Part of this Report: | |
| |
| |
| |
| |
| |
| |
| |
2. Financial Statement Schedules:
Schedules for which provision is made in the applicable accounting regulations of the U.S. Securities and Exchange Commission are not required under the related instructions or are inapplicable, and, therefore, have been omitted.
3. Exhibits.
EXHIBIT INDEX
| | | | | | | | |
Exhibit Number | Exhibit Description |
| Filed with this Report: |
| 10.1 | |
| 10.2 | |
| 19 | |
| 21 | |
| 23 | |
| 31.1 | |
| 31.2 | |
| 32 | |
| 101 | The following materials from GATX Corporation’s Annual Report on Form 10-K for the year ended December 31, 2024, are formatted in Inline XBRL (eXtensible Business Reporting Language): (i) Consolidated Balance Sheets at December 31, 2024 and December 31, 2023, (ii) Consolidated Statements of Comprehensive Income for the years ended December 31, 2024, 2023, and 2022, (iii) Consolidated Statements of Cash Flows for the years ended December 31, 2024, 2023, and 2022, (iv) Consolidated Statements of Changes in Shareholders' Equity for the years ended December 31, 2024, 2023, and 2022, and (v) Notes to the Consolidated Financial Statements. |
| 104 | Cover Page Interactive Data File (embedded within the Inline XBRL document). |
| | |
| Incorporated by Reference: |
| 3.1 | |
| 3.2 | |
| 4.1 | |
| 4.2 | |
| | | | | | | | |
| 4.3 | |
| 10.1 | Five Year Credit Agreement dated as of May 21, 2024, among GATX Corporation, as borrower, Citibank, N.A. and BofA Securities, Inc., as joint lead arrangers and joint book managers, Bank of America, N.A., as syndication agent, BMO Bank N.A., CIBC Bank USA, KeyBank National Association, Morgan Stanley MUFG Loan Partners, LLC, PNC Bank, National Association and U.S. Bank, National Association, as co-documentation agents, Citibank, N.A., as administrative agent, and the lenders party thereto is incorporated by reference to Exhibit 10.1 to GATX’s Form 8-K dated May 22, 2024, file number 1-2328. |
| 10.2 | |
| 10.3 | |
| i. | |
| 10.4 | |
| 10.5 | |
| 10.6 | |
| 10.7 | Form of Agreement for Employment following a Change of Control between GATX Corporation and Niyi Adedoyin (dated as of January 29, 2016), Jennifer McManus (dated as of October 30, 2020), Jennifer Van Aken (dated as of October 30, 2020), Jeffery R. Young (dated as of February 1, 2015), and Robert A. Zmudka (dated as of August 9, 2018) is incorporated by reference to Exhibit 10.2 to GATX’s Quarterly Report on Form 10-Q for the quarterly period ended March 31, 2015, file number 1-2328.* |
| 10.8 | |
| 10.9 | |
| 10.10 | |
| 10.11 | |
| 10.12 | |
| 10.13 | |
| 10.14 | |
| 10.15 | |
| 10.16 | |
| | | | | | | | |
| 10.17 | |
| 10.18 | |
| 10.19 | Undertakings to the GATX Corporation Salaried Employees’ Retirement Savings Plan is incorporated herein by reference to GATX’s Annual Report on Form 10-K for the fiscal year ended December 31, 1982, file number 1-2328.* (Paper copy). |
| 97 | |
_______
(*) Compensatory Plans or Arrangements.
Certain instruments evidencing long-term indebtedness of GATX Corporation are not being filed as exhibits to this Report because the total amount of securities authorized under any such instrument does not exceed 10% of GATX Corporation’s total assets. GATX Corporation will furnish copies of any such instruments upon request of the U.S. Securities and Exchange Commission.
Item 16. Form 10-K Summary
Not Applicable.
SIGNATURES
Pursuant to the requirements of Section 13 or 15(d) of the Securities Exchange Act of 1934, the registrant has duly caused this report to be signed on its behalf by the undersigned, thereunto duly authorized.
| | | | | | | | | | | | | | |
| GATX CORPORATION | |
| | Registrant | | |
| | /s/ ROBERT C. LYONS | | |
| | Robert C. Lyons | | |
| | President and Chief Executive Officer | | |
| | February 19, 2025 | | |
Power of Attorney. KNOW ALL PERSONS BY THESE PRESENTS, that each person whose signature appears below hereby constitutes and appoints Thomas A. Ellman, Brian L. Glassberg, and Jennifer M. McManus, and each of them, his or her true and lawful attorneys-in-fact and agents, with full power of substitution and resubstitution, for him or her and in his or her name, place and stead, in any and all capacities, to sign any and all amendments to this Annual Report on Form 10-K, and to file the same, with any and all exhibits thereto, and other documents in connection therewith, with the U.S. Securities and Exchange Commission, and hereby grants to such attorneys-in-fact and agents, and each of them, full power and authority to do and perform each and every act and thing requisite and necessary to be done in connection therewith, as fully to all intents and purposes as he or she might or could do in person, hereby ratifying and confirming all that said attorneys-in-fact and agents, or any of them, or their or his or her substitute or substitutes, may lawfully do or cause to be done by virtue hereof.
Pursuant to the requirements of the Securities Exchange Act of 1934, this report has been signed below by the following persons on behalf of the registrant and in the capacities and on the dates indicated.
| | | | | | | | |
| /s/ ROBERT C. LYONS | | President and
Chief Executive Officer and Director
(Principal Executive Officer) |
| Robert C. Lyons | |
| February 19, 2025 | |
| | |
| /s/ THOMAS A. ELLMAN | | Executive Vice President
and Chief Financial Officer
(Principal Financial Officer) |
| Thomas A. Ellman | |
| February 19, 2025 | |
| | |
| /s/ JENNIFER M. MCMANUS | | Senior Vice President, Controller and Chief Accounting Officer
(Principal Accounting Officer) |
| Jennifer M. McManus | |
| February 19, 2025 | |
| | |
| /s/ DIANE M. AIGOTTI | | Director |
| Diane M. Aigotti | |
| February 19, 2025 | |
| | |
| /s/ ANNE L. ARVIA | | Director |
| Anne L. Arvia | |
| February 19, 2025 | |
| | |
| /s/ SHELLEY J. BAUSCH | | Director |
| Shelley J. Bausch | |
| February 19, 2025 | |
| | |
| /s/ JOHN M. HOLMES | | Director |
| John M. Holmes | |
| February 19, 2025 | |
| | |
| /s/ JAMES B. REAM | | Director |
| James B. Ream | |
| February 19, 2025 | |
| | |
| /s/ ADAM L. STANLEY | | Director |
| Adam L. Stanley | |
| February 19, 2025 | |
| | |
| /s/ DAVID S. SUTHERLAND | | Director |
| David S. Sutherland | |
| February 19, 2025 | |
| | |
| /s/ PAUL G. YOVOVICH | | Director |
| Paul G. Yovovich | |
| February 19, 2025 | |