United States Securities and Exchange Commission
WASHINGTON, D.C. 20549
FORM 10-K
☑ Annual Report Pursuant to Section 13 or 15(d) of the Securities Exchange Act of 1934
For the fiscal year ended December 31, 2024
Commission file number 001-00035
GENERAL ELECTRIC COMPANY
(Exact name of registrant as specified in its charter)
| | | | | | | | | | | | | | |
| New York | | 14-0689340 |
| (State or other jurisdiction of incorporation or organization) | | (I.R.S. Employer Identification No.) |
| | | | |
| 1 Neumann Way | Evendale | OH | | 45215 |
| (Address of principal executive offices) | | (Zip Code) |
(Registrant’s telephone number, including area code) (617) 443-3000
Securities Registered Pursuant to Section 12(b) of the Act: | | | | | | | | |
| Title of each class | Trading Symbol(s) | Name of each exchange on which registered |
| Common stock, par value $0.01 per share | GE | New York Stock Exchange |
| 0.875% Notes due 2025 | GE 25 | New York Stock Exchange |
| 1.875% Notes due 2027 | GE 27E | New York Stock Exchange |
| 1.500% Notes due 2029 | GE 29 | New York Stock Exchange |
| 7 1/2% Guaranteed Subordinated Notes due 2035 | GE /35 | New York Stock Exchange |
| 2.125% Notes due 2037 | GE 37 | New York Stock Exchange |
| | |
| Securities Registered Pursuant to Section 12(g) of the Act: |
| (Title of class) |
Indicate by check mark if the registrant is a well-known seasoned issuer, as defined in Rule 405 of the Securities Act. Yes ☑ No ¨
Indicate by check mark if the registrant is not required to file reports pursuant to Section 13 or Section 15(d) of the Act. Yes ¨ No ☑
Indicate by check mark whether the registrant (1) has filed all reports required to be filed by Section 13 or 15(d) of the Securities Exchange Act of 1934 during the preceding 12 months (or for such shorter period that the registrant was required to file such reports), and (2) has been subject to such filing requirements for the past 90 days. Yes ☑ No ¨
Indicate by check mark whether the registrant has submitted electronically every Interactive Data File required to be submitted pursuant to Rule 405 of Regulation S-T during the preceding 12 months (or for such shorter period that the registrant was required to submit such files). Yes ☑ No ¨
Indicate by check mark whether the registrant is a large accelerated filer, an accelerated filer, a non-accelerated filer, a smaller reporting company or an emerging growth company. See definitions of “large accelerated filer,” “accelerated filer,” “smaller reporting company” and "emerging growth company" in Rule 12b-2 of the Exchange Act. (Check one):
| | | | | | | | | | | |
| Large accelerated filer | ☑ | Accelerated filer | ☐ |
| Non-accelerated filer | ☐ | Smaller reporting company | ☐ |
| Emerging growth company | ☐ | | |
If an emerging growth company, indicate by check mark if the registrant has elected not to use the extended transition period for complying with any new or revised financial accounting standards provided pursuant to Section 13(a) of the Exchange Act. ¨
Indicate by check mark whether the registrant has filed a report on and attestation to its management's assessment of the effectiveness of its internal control over financial reporting under Section 404(b) of the Sarbanes-Oxley Act (15 U.S.C. 7262(b)) by the registered public accounting firm that prepared or issued its audit report.☑
If securities are registered pursuant to Section 12(b) of the Act, indicate by check mark whether the financial statements of the registrant included in the filing reflect the correction of an error to previously issued financial statements. ¨
Indicate by check mark whether any of those error corrections are restatements that required a recovery analysis of incentive-based compensation received by any of the registrant’s executive officers during the relevant recovery period pursuant to §240.10D-1(b). ¨
Indicate by check mark whether the registrant is a shell company (as defined in Rule 12b-2 of the Act). Yes ☐ No ☑
The aggregate market value of the outstanding common equity of the registrant not held by affiliates as of the last business day of the registrant’s most recently completed second fiscal quarter was at least $170.0 billion. There were 1,073,290,505 shares of common stock with a par value of $0.01 outstanding at January 15, 2025.
DOCUMENTS INCORPORATED BY REFERENCE
The definitive proxy statement relating to the registrant’s Annual Meeting of Shareholders, to be held May 6, 2025, is incorporated by reference into Part III to the extent described therein.
TABLE OF CONTENTS | | | | | |
| Page |
| |
| |
| |
| |
| |
| |
| |
| |
| |
| |
| |
| |
| |
| |
| |
| |
| |
| |
| |
| |
| |
| |
| |
| |
| |
| |
| |
| |
| |
| |
| |
| |
| |
| |
| |
| |
| |
| |
| |
| |
| |
| |
| |
| |
| |
| |
| |
| |
| |
| |
| |
Note 25 Segment and Geographic Information & Remaining Performance Obligation | |
| |
| |
| |
| |
| |
| |
| |
| |
| |
FORWARD-LOOKING STATEMENTS. Our public communications and filings we make with the U.S. Securities and Exchange Commission (SEC) may contain statements related to future, not past, events. These forward-looking statements often address our expected future business and financial performance and financial condition, and often contain words such as "expect," "anticipate," "intend," "plan," "believe," "seek," "see," "will," "would," "estimate," "forecast," "target," "preliminary" or "range." Forward-looking statements by their nature address matters that are, to different degrees, uncertain, such as statements about the impacts of macroeconomic and market conditions and volatility on our business operations, financial results and financial position; conditions affecting the aerospace and defense industry, including our customers and suppliers; our expected financial performance, including cash flows, revenue, margins, earnings and earnings per share; planned and potential transactions; our credit ratings and outlooks; our funding and liquidity; our cost structures and plans to reduce costs; restructuring, impairment or other financial charges; or tax rates.
For us, particular areas where risks or uncertainties could cause our actual results to be materially different than those expressed in our forward-looking statements include:
•changes in macroeconomic and market conditions and market volatility (including risks related to recession, inflation, supply chain constraints or disruptions, interest rates, values of financial assets, oil, jet fuel and other commodity prices and exchange rates), and the impact of such changes and volatility on our business operations and financial results;
•global economic trends, competition and geopolitical risks, including impacts from the ongoing conflict between Russia and Ukraine and related sanctions and risks related to conflict in the Middle East; demand or supply shocks from events such as a major terrorist attack, war, natural disasters or actual or threatened public health pandemics or other emergencies; or an escalation of sanctions, tariffs or other trade tensions between the U.S. and China or other countries;
•market or other developments that may affect demand or the financial strength and performance of airframers, airlines, suppliers and other key aerospace and defense industry participants, such as demand for air travel, supply chain or other production constraints, shifts in U.S. or foreign government defense programs and other industry dynamics;
•pricing, cost, volume and the timing of sales, investment and production by us and our customers, suppliers or other industry participants;
•the impact of actual or potential safety or quality issues or failures of our products or third-party products with which our products are integrated, including design, production, performance, durability or other issues, and related costs and reputational effects;
•operational execution on our business plans, including our performance amidst market growth and ramping newer product platforms, meeting delivery and other contractual obligations, improving turnaround times in our services businesses and reducing costs over time;
•the amount and timing of our earnings and cash flows, which may be impacted by macroeconomic, customer, supplier, competitive, contractual, financial or accounting (including changes in estimates) and other dynamics and conditions;
•our capital allocation plans, including the timing and amount of dividends, share repurchases, acquisitions, organic investments and other priorities;
•our decisions about investments in research and development or new products, services and platforms, and our ability to launch new products in a cost-effective manner, as well as technology developments and other dynamics that could shift the demand or competitive landscape for our products and services;
•our success in executing planned and potential transactions, including the timing for such transactions, the ability to satisfy any applicable pre-conditions and the expected benefits;
•downgrades of our credit ratings or ratings outlooks, or changes in rating application or methodology, and the related impact on our funding profile, costs, liquidity and competitive position;
•capital or liquidity needs associated with our run-off insurance operations or mortgage portfolio in Poland (Bank BPH), the amount and timing of any required future capital contributions and any strategic options that we may consider;
•changes in law, regulation or policy that may affect our businesses, such as trade policy and tariffs; government defense priorities or budgets; regulation, incentives and emissions offsetting or trading regimes related to climate change; and the effects of tax law changes;
•the impact of regulation; government investigations; regulatory, commercial and legal proceedings or disputes; environmental, health and safety matters; or other legal compliance risks, including the impact of shareholder and related lawsuits, Bank BPH and other proceedings that are described in our SEC filings;
•the impact related to information technology, cybersecurity or data security breaches at GE Aerospace or third parties; and
•the other factors that are described in the "Risk Factors" section in this Annual Report on Form 10-K for the year ended December 31, 2024, as such descriptions may be updated or amended in future reports we file with the SEC.
These or other uncertainties may cause our actual future results to be materially different than those expressed in our forward-looking statements. We do not undertake to update our forward-looking statements. This document includes certain forward-looking projected financial information that is based on current estimates and forecasts. Actual results could differ materially.
ABOUT GE AEROSPACE. General Electric Company operates as GE Aerospace (GE Aerospace or the Company). GE Aerospace is a global aerospace leader with the industry's largest and growing commercial propulsion fleet. The Company’s installed base of approximately 45,000 commercial and 25,000 military engines drives our aftermarket services business, which represents approximately 70% of revenue, reflecting the strength of customer demand across our business. Through FLIGHT DECK, the Company's proprietary lean operating model, GE Aerospace is prioritizing safety, quality, delivery and cost, to drive focused execution and bridge strategy to results. We are focused on delivering against our strategic priorities for today (services and readiness), tomorrow (delivering the production and services ramp for new engines) and the future (inventing next generation flight technology for our commercial and defense customers). Our global team is building on more than a century of innovation and learning, as we invent the future of flight, lift people up and bring them home safely.
On January 3, 2023, the Company completed the separation of its healthcare business into an independent publicly traded company, GE HealthCare Technologies Inc. (GE HealthCare), and on April 2, 2024, the Company completed the separation of its GE Vernova business into an independent publicly traded company, GE Vernova, Inc. (GE Vernova). In connection with these separations, the historical results of GE HealthCare and GE Vernova, and certain assets and liabilities included in the separations, are reported in our consolidated financial statements as discontinued operations. See Note 2 for further information.
We serve customers in approximately 120 countries. Manufacturing and service operations are carried out at 67 facilities located in 22 states in the United States and Puerto Rico, of which 24 are owned, and at 67 facilities located in 24 other countries, of which 34 are owned.
SEGMENTS. GE Aerospace operates through two reportable segments: Commercial Engines & Services and Defense & Propulsion Technologies.
COMMERCIAL ENGINES & SERVICES. Commercial Engines & Services (CES) designs, develops, manufactures and services jet engines for commercial airframes, as well as business aviation and aeroderivative applications. Services include maintenance, repair and overhaul (MRO) of engines and the sale of spare parts, and we offer services under a variety of arrangements such as long-term service agreements or time and material contracts. CES was approximately 70% of total revenue for the year ended December 31, 2024, with services representing 74% of total CES revenue.
Our CES customers for equipment and services consist primarily of airframers and airlines, including both Boeing and Airbus, and third-party MRO shops, to whom we sell equipment and license MRO technology. CES engines power aircraft in all commercial categories—narrowbody, widebody and regional—and this includes engines sold by joint venture partners, the most significant of which is CFM International, a 50-50 non-consolidated joint venture with Safran Aircraft Engines, a subsidiary of Safran Group of France. Depending on the aircraft model, airline customers may have a choice between our engines and those of other manufacturers or, as in the case of some Boeing models, our engines may be the sole source engine for a particular aircraft.
Commercial and financial dynamics for major engine platforms often play out over the course of many years, as new product development cycles are long and, after initial sale, commercial engines can operate for decades with services in the aftermarket. In the narrowbody aircraft segment, we are in the midst of a significant ramp in production of the LEAP engine, which entered into service in 2016 and is expected in the coming years to overtake the mature CFM56 as the industry’s most utilized narrowbody engine. This is expected to also drive a significant increase in shop visits and need for MRO capacity as LEAP engines come due for services. In the widebody aircraft segment, we have a range of engine platforms that are in different stages of their lifecycles. These include the more mature CF6 and GE90 engines, as well as the GEnx engine that entered into service in 2011 and the GE9X engine that will power the Boeing 777X when that aircraft enters into service. We also have engines that power regional and business aircraft.
We have been and remain committed to investing in developing and maturing technologies that enable a more sustainable future of flight. Notably, CFM International's Revolutionary Innovation for Sustainable Engines (RISE) program is a suite of pioneering technologies including Open Fan, compact core and hybrid electric systems for compatibility with alternative fuels. We recently completed more than 250 tests on developing a full-scale Open Fan engine. This is one of several initiatives underway to help invent the future of flight.
DEFENSE & PROPULSION TECHNOLOGIES. Defense & Propulsion Technologies (DPT) is a leading provider of defense engines and critical aircraft systems, and it consists of our Defense & Systems and Propulsion & Additive Technologies businesses. DPT was approximately 25% of total revenue for the year ended December 31, 2024, with services representing 56% of total DPT revenue.
Defense & Systems – Defense & Systems designs, develops, manufactures and services jet engines and avionics and power systems for governments, militaries and commercial airframers. Services include MRO of engines and the sale of spare parts.
Our product performance and dedication to innovation have earned long-standing relationships with airframers, shipyards, government agencies and other customers globally. We also regularly work with government customers on the development of classified and unclassified advanced products, including combat engines, hypersonics and unmanned applications. Recently, our team successfully demonstrated a hybrid electric propulsion system rated at one megawatt with the U.S. Army.
Our defense engines power a wide variety of fighters, bombers, tankers, transport, helicopters and surveillance aircraft, as well as aeroderivative engines for marine applications. Significant product platforms include the F110, F404 and F414 for combat engines, the T408, T700 and T901 for rotorcraft engines and the LM2500 for mobility and marine engines.
Propulsion & Additive Technologies – Propulsion & Additive Technologies (P&AT) businesses primarily design, develop, manufacture and support aircraft components and systems for both commercial and military end users under the Avio Aero, Unison, Dowty Propellers and Colibrium Additive brands. These P&AT products include small turboprop engines, aeroengine mechanical transmissions, turbines, combustors and controls, additive manufacturing, propeller systems, ignition systems, sensors and engine accessories for both fixed wing and rotorcraft applications. Avio Aero is a strategic partner in Europe supporting the development of indigenous, classified engine technology and a core member of Clean Aviation, significantly contributing to and benefiting from the European Union sustainability roadmap.
HUMAN CAPITAL. The strength and talent of our workforce are critical to the success of our purpose to invent the future of flight, lift people up and bring them home safely. We strive to attract, develop and retain a workforce that can deliver for our global customer base. The Company’s human capital management priorities are aligned to our business strategy and support the execution of operational results, financial results and the development of technologies that we believe will define the future of the aerospace and defense industry. We continue to monitor a broad set of human capital priorities as a part of our business operating reviews and with oversight by our Board of Directors and the Board’s Management Development and Compensation Committee. The following are our human capital priorities:
•Protecting the health and safety of our workforce: We encourage all employees at every level of the organization to take responsibility for creating a safe and healthy work environment, including the importance of speaking up when a safety concern arises. We have robust procedures and standards that our employees and contractors must follow when performing high risk activities that are designed to prevent potential accidents and injuries. We have established stringent environmental, health and safety standards, often more rigorous than local regulations. For the past four years, our annual bonus program has included a modifier based on the Company’s safety performance.
•Sustaining a Company culture based in Respect for People through leadership behaviors of humility, transparency and focus, with a commitment to unyielding integrity: This culture is an essential part of GE Aerospace’s proprietary lean operating model, FLIGHT DECK. It is through FLIGHT DECK that we are bridging strategy to deliver results for our customers and our shareholders. GE Aerospace’s organizational culture supports talent attraction, engagement and retention and promotes ways of working that are strongly connected to our goals. In 2024, GE Aerospace conducted its first annual enterprise-wide culture survey as an independent company. This survey is part of a commitment to have a strong employee listening strategy. Results showed that overall our employees feel their safety is prioritized and that the Company maintains high ethical standards. Our performance management system, “People, Performance, and Growth,” directly links individual performance outcomes to incentive compensation. Supporting our culture of integrity, The Spirit & The Letter, GE Aerospace’s employee code of conduct, sets forth the Company’s integrity and compliance standards.
•Developing and managing our talent to best support our organizational goals: GE Aerospace’s approach to talent management aims to ensure strong individual and company performance, and our employee training and development offerings are designed to support these goals. As a key pillar of our talent strategy, GE Aerospace’s senior management leads an annual organization and talent review for each business to support a strong leadership pipeline and succession planning process. In 2024, our leadership development programs continued to elevate high potential talent and accelerate a continued career path with GE Aerospace.
•Promoting fairness and opportunity across the enterprise: At GE Aerospace, we are committed to building a culture and environment where every employee has the opportunity to achieve their ultimate potential. Fostering an environment centered on Respect for People is core to FLIGHT DECK and is intended to ensure that every employee feels empowered and has the opportunity to contribute to improve our performance. Our long-standing commitment to pay practices that are fair and competitive is core to Respect for People and is reflected in the fact that men and women performing similar work were paid within 1% of each other in our most recent analysis.
At December 31, 2024, GE Aerospace and consolidated affiliates employed approximately 53,000 people, of whom approximately 28,000 were employed in the United States.
At December 31, 2024, GE Aerospace had approximately 3,700 union-represented manufacturing and service employees in the United States. In 2023, the Company negotiated or extended collective bargaining agreements with the majority of its U.S. unions (including the IUE-CWA, UAW and IAM), and these agreements are scheduled to expire between June and August of 2025. GE Aerospace will hold negotiations to enter into new agreements prior to their respective expiration dates. While the outcome of the 2025 negotiations cannot be predicted, the Company’s recent past negotiations have resulted in agreements that we believe provide employees with fair wages and benefits while addressing the competitive realities facing GE Aerospace, and were completed without a work stoppage. GE Aerospace’s relationship with employee-representative organizations outside the U.S. takes many forms, including in Europe where GE Aerospace engages employees’ representatives’ bodies such as works councils (at both European level and locally) and trade unions in accordance with local law.
RESEARCH AND DEVELOPMENT. We have long research and development (R&D) cycles for many of our products, with product safety, quality and efficiency being critical to success. We conduct R&D activities, leveraging FLIGHT DECK, to enhance our existing products and services, develop new products and services to meet our customers’ changing needs and requirements, address new market opportunities and support regulatory certifications. For example, our past and ongoing investments in advanced technologies such as ceramic matrix composites and additive manufacturing for components have applications across a range of narrowbody and widebody engine applications. In addition, we are making significant investments in the RISE program suite of technologies to enable a more sustainable future of flight. And in DPT, leveraging government funding, our investments include the development of advanced propulsion solutions such as adaptive cycle combat engines.
In addition to funding R&D internally, we also receive funding externally from our customers and partners, which contributes to the overall R&D for the Company. See Note 1 for further information on our accounting policies for development agreements and R&D cost share arrangements.
| | | | | | | | | | | |
| (In millions) | 2024 | 2023 | 2022 |
| GE Aerospace funded | $ | 1,286 | | $ | 1,011 | | $ | 808 | |
| Customer and partner funded(a) | 1,413 | | 1,465 | | 1,295 | |
| Total Research and development | $ | 2,699 | | $ | 2,476 | | $ | 2,103 | |
(a) Customer funded is principally U.S. Government funded.
INTELLECTUAL PROPERTY. The development and protection of intellectual property rights are a source of competitive advantage within our industry, and protection of key design, manufacturing, repair and product upgrade technologies is important to our business. We maintain, continue to grow, and curate a portfolio of patents, trade secrets and other intellectual property rights stemming from our research and development activities. In some circumstances we license intellectual property to commercial customers, such as to support the maintenance and repair of our products to keep them in safe and airworthy condition. Government customers may also have licenses to some of our intellectual property that is developed or used in the performance of government contracts. While our intellectual property rights in the aggregate are important to our business, we do not believe that our business is materially dependent on the preservation of any singular intellectual property right or patent license. The “GE” name and logo are licensed to various former businesses, including GE HealthCare and GE Vernova, pursuant to agreements governing their use.
SUPPLY CHAIN. We rely on a global supply chain for a wide range of raw materials, commodities, components, parts, MRO services and other indirect spend. Our supply chain is complex and extends into many different countries and regions around the world. We depend on the ability of our suppliers and partners to meet quality standards, performance specifications and delivery schedules at our anticipated costs. In some cases, we also must comply with specific procurement requirements that limit the suppliers and subcontractors we may utilize. Some of our suppliers or their sub-suppliers are limited- or sole-source suppliers, and our ability to meet our obligations to customers depends on the product quality, performance, continued product availability and stability of such suppliers. We employ a number of strategies focused on continuity of supply of raw materials, including monitoring geopolitical and geographical changes and developing counteractions in response to identified risks, evaluating alternate materials and sources and working with suppliers to secure both short- and long-term capacity. Partnering with suppliers, leveraging FLIGHT DECK, we are working to improve material input, supporting our deliveries across internal shop visits, spare part sales and equipment. We operate in a supply-constrained environment that has impacted our industry for the past several years. See the MD&A section for additional discussion of these dynamics.
COMPETITION. The markets in which we operate are highly competitive in terms of pricing, product and service quality, durability and reliability, product development and introduction time, intellectual property, customer service, financing terms, the ability to respond to shifts in market demand and the ability to attract and retain skilled talent. We compete with other global engine manufacturers in sales of commercial and defense engines and services. Key competitors in commercial engine services also include third-party MRO shops. In DPT, we compete against a range of U.S. and non-U.S. companies or groups for contract and subcontract awards by governments and their prime contractors. Customer selections for aircraft engines, components and systems can also have a significant impact on future sales of parts and services over the life of an engine platform. Competitors may offer substantial discounts and other financial incentives, performance and operating cost guarantees and participation in financing arrangements in an effort to secure an installed base that establishes aftermarket sales associated with these products.
REGULATORY MATTERS. As an aerospace and defense company, we are subject to a wide range of U.S. federal, state and non-U.S. laws and regulations related to our products, services and business operations, including the significant areas of law and regulation summarized below that can apply to our business directly and indirectly. Like other industrial manufacturing companies that operate globally in high-tech sectors, we face significant scrutiny from both U.S. and foreign governmental authorities with respect to regulatory compliance. We regularly engage with our regulators and work to comply with existing, new and changing requirements across relevant jurisdictions, as compliance (or failure to properly comply) with any of these requirements can pose costs and impact our operations. For additional information about government regulation applicable to our business, see Risk Factors and Note 24.
Commercial aviation. The design and production of our commercial aircraft engines are regulated by the U.S. Federal Aviation Administration (FAA) and the European Aviation Safety Agency (EASA). To obtain and maintain design approvals for commercial engines, called type certificates, we must meet stringent certification requirements and maintain ongoing responsibility for the continued operational safety and airworthiness of our engines. We also hold an FAA authorization to produce commercial engines, called a production certificate, pursuant to which engines that we produce must meet the approved type design. GE Aerospace also operates commercial engine MRO facilities around the world, and each of these facilities holds repair station certificates from multiple aviation regulators, depending upon the regulatory jurisdictions of our airline customers that use the facility. All of our certified operations are subject to regulatory oversight, and violations may result in government enforcement action that can include fines, suspension of privileges under the certificates or revocation of the certificates. In addition, global aviation authorities regulate aviation safety and have the authority to mandate that our customers take required actions, such as required inspection, maintenance, modification or removal of our products or their components. These regulators also have the authority to order the grounding of entire fleets of aircraft in the interests of aviation safety.
International Trade Controls and Sanctions Compliance. We are subject to various international trade controls and sanctions regulations from governments and regulatory bodies around the world. These include export controls (including the U.S. Export Administration Regulations (EAR) and the International Traffic in Arms Regulations (ITAR)), import controls, sanctions compliance (including sanctions administered by the U.S. Department of the Treasury's Office of Foreign Assets Control (OFAC)) and anti-boycott regulations. These regulations are intended to align business practices with national security and foreign policy objectives. Our international trade controls and sanctions compliance program includes employee training, screening and due diligence reviews of customers, suppliers and business partners and other controls and procedures designed to operate in compliance with these complex requirements.
Government Contracts. The U.S. government and our other government customers often have the ability to modify, curtail or terminate their contracts and subcontracts with us either at their convenience or for default based on performance. In the event of termination for convenience, we typically would be entitled to payment for work completed and allowable termination or cancellation costs. In the event of termination for default, typically the government customer would pay only for the work that has been accepted and could require us to pay the net cost to re-procure the contract items, in addition to seeking damages. Our U.S. government contracts are subject to the Federal Acquisition Regulation (FAR), as well as department-specific implementing regulations such as the U.S. Department of Defense’s Defense Federal Acquisition Regulation Supplement (DFARS) and other applicable laws and regulations, which set forth policies, procedures and requirements for the acquisition of goods and services by the U.S. government. These regulations impose a broad range of requirements, many of which are unique to government contracting, including various procurement, import and export, security, contract pricing and cost, contract termination and adjustment, audit, product integrity and government accounting requirements. Failure to comply with these requirements can result in contract withholds, cost or price reductions, civil and criminal penalties, contract modifications or terminations and loss of eligibility to perform government contracts.
Environmental. Our operations are subject to various federal, state, local and non-U.S. laws and regulations relating to environmental protection, including the discharge, treatment, storage, disposal and remediation of hazardous substances and wastes. These laws and regulations require ongoing environmental compliance expenditures and over time can lead to increased energy and raw materials costs and new or additional investment in designs and technologies. We regularly assess our compliance status and management of environmental matters, and the investigation, remediation and operation and maintenance costs associated with environmental compliance and management of sites are a normal, recurring part of our operations. In addition to our ongoing business operations, environmental laws and regulations apply to the legacy portfolio of environmental remediation sites that GE Aerospace retained following the separations of GE Vernova and GE HealthCare. Laws and regulations in response to climate change that relate to emissions from air travel can also have direct or indirect impacts on our business, including from increased costs to airlines that fly aircraft powered by our engines.
LEGACY BUSINESSES. We retain some legacy business operations related to the Company’s long history across many different industries. These include operations related to the Company’s former financial services business, including continued exposure to the run-off insurance operations, the mortgage portfolio in Poland (Bank BPH) and certain U.S. tax equity investments. For further information, see Note 2, Note 12, Note 24, the MD&A section (Insurance) and Risk Factors.
ADDITIONAL INFORMATION ABOUT GE AEROSPACE. GE Aerospace’s principal executive offices are at 1 Neumann Way, Evendale, OH 45215; we also maintain executive offices in Washington, DC and Norwalk, CT. GE Aerospace’s Internet address at www.geaerospace.com and Investor Relations website at www.geaerospace.com/investor-relations, as well as GE Aerospace’s LinkedIn and other social media accounts, contain a significant amount of information about GE Aerospace, including financial and other information for investors. GE Aerospace encourages investors to visit these websites as information is updated and new information is posted, as we may use our Investor Relations website and these other channels as means of disclosing material information in compliance with Regulation FD. Additional information on non-financial matters, including our Sustainability Report and other matters related to aviation, safety, environment, people and governance, is available at www.geaerospace.com/sustainability. All of such additional information referenced in this report (including the information contained in, or available through, other reports and websites) is provided as a convenience and is not incorporated by reference herein. Therefore, such information should not be considered part of this report.
Our Annual Report on Form 10-K, quarterly reports on Form 10-Q, current reports on Form 8-K, and amendments to those reports are available, without charge, on our website, www.geaerospace.com/investor-relations/events-reports, as soon as reasonably practicable after they are filed electronically with the SEC. Copies are also available, without charge, from GE Aerospace Investor Relations. Reports filed with the SEC may be viewed at www.sec.gov.
MANAGEMENT’S DISCUSSION AND ANALYSIS OF FINANCIAL CONDITION AND RESULTS OF OPERATIONS (MD&A). The consolidated financial statements of GE Aerospace are prepared in conformity with U.S. generally accepted accounting principles (GAAP). Unless otherwise noted, tables are presented in U.S. dollars in millions. Certain columns and rows within tables may not add due to the use of rounded numbers. Percentages presented in this report are calculated from the underlying numbers in millions. Discussions throughout this MD&A are based on continuing operations unless otherwise noted. The MD&A should be read in conjunction with the Financial Statements and Notes to the consolidated financial statements.
In the accompanying analysis of financial information, we sometimes use information derived from consolidated financial data but not presented in our financial statements prepared in accordance with GAAP. Certain of these data are considered “non-GAAP financial measures” under SEC rules. See the Non-GAAP Financial Measures section for the reasons we use these non-GAAP financial measures and the reconciliations to their most directly comparable GAAP financial measures.
BUSINESS OVERVIEW AND ENVIRONMENT. As a global aerospace company, our worldwide operations can be affected by industrial, economic, and political factors on both a regional and global level. Demand for our equipment and services is demonstrated by our backlog of engine orders and services and growth in our installed base, and tends to follow commercial air travel and freight demand and government funding for defense budgets. We also expect a significant ramp in our delivery of engine units and services for newer product platforms in the years ahead to meet this demand. Refer to the Segment Operations sections for Commercial Engines & Services and Defense & Propulsion Technologies below for additional detail about these dynamics for our commercial and defense businesses, respectively.
Global material availability and supplier delivery performance continue to cause disruptions and have impacted our production and delivery of equipment and services to our customers. We are investing in our manufacturing facilities, overhaul facilities and our supply chain to increase production and strengthen yield in order to improve delivery to our customers. We continue to partner with our suppliers to improve material input, and work with our customers to calibrate future production rates. We are leveraging FLIGHT DECK and partnering with suppliers to improve material input and proactively manage the impact of inflationary pressure by driving cost productivity and adjusting the pricing of our products and services. We expect the impact of supply chain constraints and inflation will continue, and we are continuing to take action to mitigate the impacts.
Given the significant business we have with airframers and many airlines, challenges affecting the commercial aviation industry or key participants can adversely impact the demand for our products and services, the timing of orders, deliveries and related payments and other factors. We are monitoring the production and other challenges at The Boeing Company, and we continue to align with them on production expectations and assess potential impacts to our business. The Boeing worker's strike, resolved in the fourth quarter of 2024, had no significant impact to our revenue, earnings and cash flows for the year ended December 31, 2024.
CONSOLIDATED RESULTS
| | | | | | | | | | | | | | |
| | | | |
| REVENUE | | | | 2024 | 2023 | 2022 |
| Equipment revenue | | | | $ | 10,274 | | $ | 9,318 | | $ | 7,837 | |
| Services revenue | | | | 24,847 | | 22,641 | | 18,345 | |
| Insurance revenue | | | | 3,581 | | 3,389 | | 2,957 | |
| Total revenue | | | | $ | 38,702 | | $ | 35,348 | | $ | 29,139 | |
For the year ended December 31, 2024, total revenue increased $3.4 billion, or 9%, compared to the year ended December 31, 2023. Equipment revenue increased, driven by improved pricing and favorable customer and product mix. Services revenue increased, primarily due to higher spare parts volume, improved pricing and increased internal shop visit workscope.
For the year ended December 31, 2023, total revenue increased $6.2 billion, or 21%, compared to the year ended December 31, 2022. Equipment revenue increased, driven by higher commercial install and spare engine unit shipments. Services revenue increased, primarily due to increased commercial spare part shipments, higher internal shop visit volume, increased internal shop visit workscope and improved pricing.
| | | | | | | | | | | | | | |
| EARNINGS (LOSS) AND EARNINGS (LOSS) PER SHARE | | | | |
| (Per-share in dollars and diluted) | | | | 2024 | 2023 | 2022 |
| Continuing earnings (loss) attributable to common shareholders | | | | $ | 6,670 | | $ | 9,154 | | $ | 1,061 | |
| Continuing earnings (loss) per share | | | | $ | 6.09 | | $ | 8.33 | | $ | 0.97 | |
For the year ended December 31, 2024, continuing earnings decreased $2.5 billion compared to the year ended December 31, 2023, driven by a decrease in gains on retained and sold ownership interests of $5.2 billion, primarily related to our GE HealthCare and AerCap investments, an increase in restructuring and other charges of $0.3 billion and a goodwill impairment loss related to our Colibrium Additive reporting unit of $0.3 billion. These decreases were partially offset by an increase in segment profit of $1.6 billion, an increase in profit from our run-off insurance operations of $0.7 billion, an increase in gains on sales of business interests of $0.5 billion, primarily related to the sale of our non-core licensing business, the nonrecurrence of prior year preferred stock dividends of $0.3 billion, and a reduction in separation costs of $0.2 billion. Adjusted earnings* were $5.0 billion, an increase of $1.8 billion, due to an increase in segment profit of $1.6 billion and lower Adjusted Corporate & Other operating costs*.
*Non-GAAP Financial Measure
Profit was $7.6 billion, a decrease of $2.8 billion. Profit margin was 19.7%, a decrease from 29.5%. Operating profit* was $7.3 billion, an increase of $1.7 billion. Operating profit margin* was 20.7%, an increase of 330 basis points. Continuing earnings (loss) per share was $6.09. Excluding the results from our run-off insurance operations, separation costs, restructuring and other costs, non-operating benefit (cost) income, gains on retained and sold ownership interests, gains (losses) on purchases and sales of business interests and goodwill impairments, adjusted earnings per share* was $4.60, an increase of 56%.
For the year ended December 31, 2023, continuing earnings increased $8.1 billion, primarily due to an increase in gains on retained and sold ownership interests of $5.7 billion, primarily related to our GE HealthCare and AerCap investments, an increase in segment profit of $1.4 billion, an increase in non-operating benefit income of $0.9 billion, the nonrecurrence of debt extinguishment costs of $0.5 billion, a decrease in interest and other financial charges of $0.3 billion, a decrease in restructuring and other charges of $0.3 billion and an increase in profit from our run-off insurance operations of $0.1 billion. These increases were partially offset by an increase in provision for income taxes of $1.1 billion. Adjusted earnings* were $3.2 billion, an increase of $1.1 billion, primarily due to an increase in segment profit.
Profit was $10.4 billion, an increase of $8.9 billion. Profit margin was 29.5%, an increase from 5.2%. Operating profit* was $5.6 billion, an increase of $1.3 billion. Operating profit margin* was 17.4%, an increase of 130 basis points. Continuing earnings (loss) per share was $8.33. Excluding the results from our run-off insurance operations, separation costs, restructuring and other costs, non-operating benefit (cost) income, gains on retained and sold ownership interests, and gains (losses) on purchases and sales of business interests, adjusted earnings per share* was $2.95, and increase of 54%.
Remaining performance obligation (RPO) is unfilled customer orders for products and product services (expected life of contract sales for product services) excluding any purchase order that provides the customer with the ability to cancel or terminate without incurring a substantive penalty. See Note 25 for further information.
| | | | | | | | | | | |
| RPO | December 31, 2024 | December 31, 2023 | December 31, 2022 |
| | | |
| Equipment | $ | 22,509 | | $ | 16,247 | | $ | 13,748 | |
| Services | 149,127 | | 137,756 | | 121,640 | |
| Total RPO | $ | 171,635 | | $ | 154,003 | | $ | 135,388 | |
As of December 31, 2024, RPO increased $17.6 billion, or 11%, from December 31, 2023, at Commercial Engines & Services, as a result of contract modifications and engines contracted under long-term service agreements that have now been put into service and from equipment orders outpacing revenue recognized, and at Defense & Propulsion Technologies, driven by Defense & Systems equipment orders outpacing revenue recognized.
As of December 31, 2023, RPO increased $18.6 billion, or 14%, from December 31, 2022, primarily at Commercial Engines & Services as a result of engines contracted under long-term service agreements that have now been put into service and contract modifications, and an increase in equipment orders since December 31, 2022.
SEGMENT OPERATIONS
COMMERCIAL ENGINES & SERVICES. Our results in 2024 reflect robust demand for commercial air travel with departures up high-single digits during the year. We are in frequent communication with our airline, airframe and maintenance, repair and overhaul (MRO) customers about the outlook for commercial air travel, new aircraft production, fleet retirements and after-market services, including shop visit and spare parts demand.
Total engineering investments, both company and partner-funded, increased compared to prior year. Internal shop visit output increased in 2024 compared to 2023, while total engine deliveries and LEAP engine deliveries decreased primarily due to supply chain constraints. We are investing in our manufacturing and overhaul facilities and are deploying engineering and supply chain resources to increase production, expand capacity and strengthen yield.
| | | | | | | | | | | | | | |
| | | |
| Sales in units, except where noted | | | | 2024 | 2023 | 2022 |
| Commercial Engines | | | | 1,911 | | 2,075 | 1,663 |
| LEAP Engines(a) | | | | 1,407 | | 1,570 | 1,136 |
| Internal Shop Visit Growth %(b) | | | | 3 | % | 10 | % | 22 | % |
(a) LEAP engines, which are in a significant production ramp, are a subset of Commercial Engines. (b) Internal shop visit growth represents the change in shop visits completed for the period for customer-owned engines covered by a GE Aerospace or joint venture services agreement where GE Aerospace fulfills the shop visit maintenance activity. In 2024, LEAP shop visits greater than 500 hours are included in our shop visit count. The growth rates in 2024, 2023 and 2022 exclude LEAP quick turn events. |
| | | | | | | | | | | | | | | | | | | | | | | | | |
| | | |
| SEGMENT REVENUE AND PROFIT | | | | | | 2024 | | 2023 | | 2022 | |
| | | | | | | | | | | |
| | | | | | | | | | | |
| | | | | | | | | | | |
| Equipment | | | | | | $ | 7,106 | | | $ | 6,169 | | | $ | 5,125 | | |
| Services | | | | | | 19,775 | | | 17,686 | | | 13,688 | | |
| Total segment revenue | | | | | | $ | 26,881 | | | $ | 23,855 | | | $ | 18,813 | | |
| | | | | | | | | | | |
| Segment profit | | | | | | $ | 7,055 | | | $ | 5,643 | | | $ | 4,164 | | |
| Segment profit margin | | | | | | 26.2 | | % | 23.7 | | % | 22.1 | | % |
*Non-GAAP Financial Measure
For the year ended December 31, 2024, segment revenue was up $3.0 billion, or 13%, and segment profit was up $1.4 billion, or 25%, compared to the year ended December 31, 2023.
Revenue increased primarily due to higher spare parts volume, increased internal shop visit workscope, improved pricing and favorable customer mix. These increases were partially offset by lower deliveries of new engines due to supply chain constraints and an unfavorable change in estimated profitability of our long-term service agreements of $0.1 billion.
Profit increased primarily due to increased spare parts volume, increased internal shop visit workscope, improved pricing and favorable equipment and services mix. These increases were partially offset by inflation, higher growth investment and an unfavorable change in estimated profitability of our long-term service agreements of $0.1 billion.
For the year ended December 31, 2023, segment revenue was up $5.0 billion, or 27%, and segment profit was up $1.5 billion, or 36%, compared to the year ended December 31, 2022.
Revenue increased primarily due to additional commercial install and spare engine unit shipments, higher spare part shipments, higher internal shop visit volume, increased internal shop visit workscope and improved pricing.
Profit increased primarily due to benefits from increased commercial spare part shipments, higher internal shop visit volume, increased workscope and improved pricing. These increases in profit were partially offset by additional growth investment, inflation in our supply chain and product mix.
| | | | | | | | | | | |
| RPO | December 31, 2024 | December 31, 2023 | December 31, 2022 |
| Equipment | $ | 11,462 | | $ | 6,508 | | $ | 4,818 | |
| Services | 142,182 | | 131,028 | | 115,902 | |
| Total RPO | $ | 153,644 | | $ | 137,535 | | $ | 120,720 | |
As of December 31, 2024, RPO increased $16.1 billion, or 12%, from December 31, 2023, due to increases in both equipment and services. Equipment increased primarily due to an increase in engine orders outpacing revenue recognized, primarily for LEAP engines. Services increased primarily as a result of contract modifications and engines contracted under long-term service agreements that have now been put into service.
As of December 31, 2023, RPO increased $16.8 billion, or 14%, from December 31, 2022, due to increases in both equipment and services. Equipment increased primarily due to an increase in engine orders outpacing revenue recognized. Services increased primarily as a result of engines contracted under long-term service agreements that have now been put into service and contract modifications.
DEFENSE & PROPULSION TECHNOLOGIES. Our results in 2024 reflect domestic and international government defense departments’ focus on modernizing and scaling their forces while continuing flight operations, driving services demand. A key underlying driver of our business is government funding, as most of the revenue in Defense & Systems is derived from funding that flows through the U.S. Department of Defense (DoD) budget, or equivalent international budgets. National defense budgets grew in the U.S. in the low-single digits and internationally in the mid-single digits in 2024. In March 2024, Congress passed its defense funding bill for fiscal year 2024, which included funding that supports our advanced engine development research, classified programs and product procurement and maintenance in other engine lines.
Additionally, the DoD is focused on advanced combat, enhancing platform capability and groundbreaking technology primarily in classified programs, including support for the next generation T901 turboshaft engine and advanced engine architectures. In June 2024, GE Aerospace delivered two T901-GE-900 engines to Sikorsky for integration and testing aboard a UH-60 Black Hawk as part of the U.S. Army upgrade program. In addition, GE Aerospace was awarded a $1.1 billion contract to provide T700 series turbine engines to the U.S. Army through the first half of 2029.
| | | | | | | | | | | | | | |
| | | | |
| Sales in units, except where noted | | | | 2024 | 2023 | 2022 |
| Defense engines | | | | 490 | | 556 | | 632 | |
| | | | | | | | | | | | | | | | | | | | | | | | | |
| | | |
| SEGMENT REVENUE AND PROFIT | | | | | | 2024 | | 2023 | | 2022 | |
| | | | | | | | | | | |
| | | | | | | | | | | |
| | | | | | | | | | | |
| Defense & Systems (D&S) | | | | | | $ | 6,109 | | | $ | 5,927 | | | $ | 5,426 | | |
| Propulsion & Additive Technologies (P&AT) | | | | | | 3,370 | | | 3,034 | | | 2,563 | | |
| Total segment revenue | | | | | | $ | 9,478 | | | $ | 8,961 | | | $ | 7,989 | | |
| | | | | | | | | | | |
| Equipment | | | | | | $ | 4,208 | | | $ | 4,000 | | | $ | 3,405 | | |
| Services | | | | | | 5,270 | | | 4,961 | | | 4,584 | | |
| Total segment revenue | | | | | | $ | 9,478 | | | $ | 8,961 | | | $ | 7,989 | | |
| | | | | | | | | | | |
| Segment profit | | | | | | $ | 1,061 | | | $ | 908 | | | $ | 976 | | |
| Segment profit margin | | | | | | 11.2 | | % | 10.1 | | % | 12.2 | | % |
For the year ended December 31, 2024, segment revenue was up $0.5 billion, or 6%, and segment profit was up $0.2 billion, or 17%, compared to the year ended December 31, 2023.
Revenue increased in both D&S and P&AT. D&S revenue increased primarily due to services growth, improved pricing and additional volume in aircraft systems products. This increase was partially offset by lower engine deliveries. P&AT revenue increased, primarily due to higher output at Avio Aero and Unison and improved pricing.
Profit increased primarily due to services growth, improved pricing and prior year impacts from program costs. This increase was partially offset by incremental investments to support next generation products, inflation in our supply chain and lower deliveries of new engines.
For the year ended December 31, 2023, segment revenue was up $1.0 billion, or 12%, and segment profit was down $0.1 billion, or 7%, compared to the year ended December 31, 2022.
D&S revenue increased due to product mix, higher prices, and growth in development contracts and aircraft systems products. P&AT revenue also increased, primarily due to higher output at Avio Aero and Unison and improved pricing.
Profit decreased primarily due to inflationary pressures within our supply chain, impacts from program costs and lower engine shipments.
| | | | | | | | | | | |
| RPO | December 31, 2024 | December 31, 2023 | December 31, 2022 |
| Equipment | $ | 11,046 | | $ | 9,739 | | $ | 8,930 | |
| Services | 6,944 | | 6,729 | | 5,738 | |
| Total RPO | $ | 17,991 | | $ | 16,468 | | $ | 14,668 | |
As of December 31, 2024, RPO increased $1.5 billion, or 9%, from December 31, 2023, primarily due to increases in equipment from D&S orders outpacing revenue recognized. Equipment growth was primarily driven by engine and flight management system orders.
As of December 31, 2023, RPO increased $1.8 billion, or 12%, from December 31, 2022, primarily due to increases in equipment and services orders outpacing revenue recognized.
CORPORATE & OTHER. Corporate & Other revenue include our run-off insurance operations revenue and the elimination of intersegment activities. Corporate & Other operating profit includes Corporate functions and operations costs, certain costs of our principal retirement plans, significant, higher-cost restructuring programs, separation costs, profit (loss) of our run-off insurance operations, U.S. tax equity profit (loss), transition services agreements, environmental health and safety (EHS) impacts and other costs, as well as certain amounts that are not included in operating segment results because they are excluded from measurement of their operating performance for internal and external purposes.
| | | | | | | | | | | | | | |
| | | | |
| REVENUE AND OPERATING PROFIT (COST) | | | | 2024 | 2023 | 2022 |
| Insurance revenue (Note 12) | | | | $ | 3,581 | | $ | 3,389 | | $ | 2,957 | |
| Eliminations and other | | | | (1,239) | | (857) | | (620) | |
| Corporate & Other revenue | | | | $ | 2,343 | | $ | 2,532 | | $ | 2,337 | |
| Gains (losses) on purchases and sales of business interests | | | | $ | 398 | | $ | (104) | | $ | 35 | |
| Gains (losses) on retained and sold ownership interests and other equity securities (Note 19) | | | | 532 | | 5,776 | | 100 | |
| Restructuring and other charges (Note 20)(a) | | | | (525) | | (246) | | (514) | |
| Separation costs (Note 20) | | | | (492) | | (692) | | (625) | |
| Insurance profit (loss) (Note 12) | | | | 1,022 | | 332 | | 205 | |
| Russia & Ukraine charges | | | | — | | — | | (75) | |
| U.S. tax equity profit (loss) | | | | (160) | | (132) | | (90) | |
| Goodwill impairments (Note 7) | | | | (251) | | — | | — | |
| Adjusted Corporate & Other operating costs (Non-GAAP) | | | | (864) | | (990) | | (912) | |
| Corporate & Other operating profit (cost) (GAAP) | | | | $ | (339) | | $ | 3,943 | | $ | (1,876) | |
| Less: gains (losses), impairments, Insurance, and restructuring & other | | | | 524 | | 4,933 | | (964) | |
| Adjusted Corporate & Other operating costs (Non-GAAP) | | | | $ | (864) | | $ | (990) | | $ | (912) | |
| | | | | | |
| Corporate & Other costs | | | | (396) | | (623) | | (600) | |
| Eliminations | | | | (467) | | (367) | | (312) | |
| Adjusted Corporate & Other operating costs (Non-GAAP) | | | | $ | (864) | | $ | (990) | | $ | (912) | |
(a) Included costs of $363 million for the settlement of the Sjunde AP-Fonden shareholder lawsuit for the year ended December 31, 2024. See Note 24 for further information.
Adjusted Corporate & Other operating costs* excludes gains (losses) on purchases and sales of business interests, gains (losses) on retained and sold ownership interests and other equity securities, higher-cost restructuring programs, separation costs, our run-off insurance operations, Russia and Ukraine charges, U.S. tax equity profit (loss) and goodwill impairments. We believe that adjusting Corporate & Other costs to exclude the effects of items that are not closely associated with ongoing operations provides management and investors with a meaningful measure that increases the period-to-period comparability of our ongoing corporate costs.
For the year ended December 31, 2024, revenue decreased by $0.2 billion compared to the year ended December 31, 2023, primarily due to higher intercompany eliminations, partially offset by an increase in our run-off insurance operations revenue. Corporate & Other operating profit decreased by $4.3 billion due to $5.2 billion of lower gains on retained and sold ownership interests and other equity securities, primarily related to our GE HealthCare and AerCap investments, $0.3 billion of higher restructuring and other charges, and $0.3 billion of goodwill impairments, related to our Colibrium Additive reporting unit, partially offset by $0.7 billion of higher profit in our run-off insurance operations primarily from improved investment results, positive claims experience and higher premium rate increases, $0.5 billion of higher gains on sales of business interests, primarily related to the sale of our non-core licensing business and prior year valuation allowance losses related to the planned sale of the Electric Insurance business and $0.2 billion of lower separation costs.
Adjusted Corporate & Other operating costs* decreased primarily due to a reduction in our functional costs and favorability from higher
bank interest, partially offset by higher intercompany eliminations, primarily resulting from additional intercompany engine parts sales
volume in our Propulsion & Additive Technologies business.
For the year ended December 31, 2023, revenue increased by $0.2 billion compared to the year ended December 31, 2022, primarily due to a $0.4 billion increase in our run-off insurance operations revenue, partially offset by $0.2 billion of higher intercompany eliminations. Corporate & Other operating profit increased by $5.8 billion due to $5.7 billion of higher gains on retained and sold ownership interests, primarily related to our GE HealthCare and AerCap investments, partially offset by the nonrecurrence of prior year gains on our Baker Hughes investment. Corporate & Other operating profit also increased as a result of $0.3 billion of lower restructuring and other charges, $0.1 billion of higher profit in our run-off insurance operations, and $0.1 billion of lower charges from contracts and recoverability of assets in connection with the conflict between Russia and Ukraine, partially offset by $0.1 billion of higher valuation allowance losses related to the planned sale of the Electric Insurance business and $0.1 billion higher separation costs.
Adjusted Corporate & Other operating costs* increased primarily due to higher EHS costs and higher intercompany eliminations primarily resulting from additional intercompany engine part sales volume in our Propulsion & Additive Technologies business partially offset by a reduction in our functional costs and favorability from higher bank interest.
OTHER CONSOLIDATED INFORMATION
RESTRUCTURING AND SEPARATION COSTS. Significant, higher-cost restructuring programs, primarily related to the separations, are excluded from measurement of segment operating performance for internal and external purposes; those excluded amounts are reported in Restructuring and other charges for Corporate. In addition, we incur costs associated with separation activities, which are also excluded from measurement of segment operating performance for internal and external purposes. See Note 20 for further information on restructuring and separation costs.
INTEREST AND OTHER FINANCIAL CHARGES were $1.0 billion, $1.0 billion and $1.3 billion for the years ended December 31, 2024, 2023 and 2022, respectively. The decrease was primarily due to lower average borrowing balances. The primary component of interest and other financial charges is interest on short- and long-term borrowings.
DEBT EXTINGUISHMENT COSTS were zero, zero, and $0.5 billion, for the years ended December 31, 2024, 2023 and 2022 respectively. There were no debt tenders in 2024 and 2023.
POSTRETIREMENT BENEFIT PLANS. Refer to Note 13 for information about our pension and retiree benefit plans.
| | | | | | | | | | | |
| INCOME TAXES | 2024 | 2023 | 2022 |
| Effective tax rate (ETR) | 12.6 | % | 9.5 | % | 11.1 | % |
| Provision (benefit) for income taxes | $ | 962 | | $ | 994 | | $ | 169 | |
| Cash income taxes paid(a) | 852 | | 994 | | 1,128 | |
(a) Included taxes paid to taxing authorities including those related to discontinued operations.
For the year ended December 31, 2024, the effective income tax rate was 12.6% compared to 9.5% for the year ended December 31, 2023. The tax rates for both 2024 and 2023 reflect a tax provision on pre-tax income.
The provision (benefit) for income taxes was $1.0 billion and $1.0 billion for the years ended December 31, 2024 and 2023, respectively. There was a decrease in tax primarily due to an increase in tax benefits associated with separation activities, earnings of global activities, and equity compensation, largely offset by the tax effect of the increase in pre-tax income excluding gains and losses on our retained and sold ownership interests. There was an insignificant tax on the net gains in GE HealthCare and AerCap equity in both periods because of the tax-free disposition of GE HealthCare shares and because of available capital losses.
*Non-GAAP Financial Measure
For the year ended December 31, 2024, the adjusted effective income tax rate* was 20.1% compared to 23.9% for the year ended December 31, 2023. The adjusted provision for income taxes* was $1.3 billion in 2024 and $1.1 billion in 2023. The increase in tax was primarily due to the tax effect of the increase in adjusted earnings before taxes*, partially offset by an increase in tax benefit associated with earnings of global activities and equity compensation.
For the year ended December 31, 2023, the effective income tax rate was 9.5% compared to 11.1% for the year ended December 31, 2022. The tax rates for both 2023 and 2022 reflect a tax provision on pre-tax income.
The provision (benefit) for income tax was $1.0 billion and $0.2 billion for the years ended December 31, 2023 and 2022, respectively. The increase in tax was primarily due to the tax effect of the increase in pre-tax income excluding gains and losses on our retained and sold ownership interests, partially offset by a decrease in tax expense related to separation-related entity restructuring. There was an insignificant tax on the net gains in GE HealthCare, AerCap and Baker Hughes equity in both periods because of the tax-free disposition of GE HealthCare shares and because of available capital losses.
For the year ended December 31, 2023, the adjusted effective income tax rate* was 23.9% compared to 17.6% for the year ended December 31, 2022. The adjusted provision for income taxes* was $1.1 billion in 2023 and $0.5 billion in 2022. The increase in tax was primarily due to the tax effect of the increase in adjusted earnings before taxes* and a decrease in favorable audit resolutions.
The rate of tax on our profitable non-U.S. earnings is below the U.S. statutory rate because we have significant business operations subject to tax in countries where the tax rate on that income is lower than the U.S. statutory rate. Most of these earnings have been reinvested in active non-U.S. business operations. Due to U.S. tax reform, substantially all of our unrepatriated net earnings have been subject to U.S. tax and accordingly we expect to have the ability to repatriate available non-U.S. cash without significant additional tax cost. We reassess reinvestment of earnings on an ongoing basis.
A substantial portion of the benefit for lower-taxed non-U.S. earnings related to business operations subject to tax in countries where the tax on that income is lower than the U.S. statutory rate is derived from our operations located in Singapore, where the earnings are primarily taxed at a rate of 8.5% in 2024 and 2023, and 8.0% in 2022.
The U.S. has enacted a minimum tax on foreign earnings (global intangible low taxed income) as part of the Tax Cuts and Jobs Act of 2017 (U.S. tax reform). We pay significant foreign tax which substantially reduces the U.S. liability on these earnings. In addition, the rate of tax on non-U.S. operations has increased from losses in foreign jurisdictions where it is not likely that such losses can be utilized and therefore no tax benefit is provided for those losses. Non-U.S. losses also limit our ability to claim U.S. foreign tax credits on certain operations, increasing the rate of tax on non-U.S. operations. Overall, these factors reduce the benefit associated with our non-U.S. operations.
A more detailed analysis of differences between the U.S. federal statutory rate and the consolidated effective rate, as well as other information about our income tax provisions, is provided in Critical Accounting Estimates and Note 15.
DISCONTINUED OPERATIONS primarily comprise our former GE Vernova and GE HealthCare businesses, our mortgage portfolio in Poland (Bank BPH) and other trailing assets and liabilities associated with prior dispositions. Results of operations, financial position and cash flows for these businesses are reported as discontinued operations for all periods presented and the notes to the financial statements have been adjusted on a retrospective basis. See Note 2 for further information regarding our businesses in discontinued operations.
CAPITAL RESOURCES AND LIQUIDITY
FINANCIAL POLICY. GE Aerospace is committed to maintaining strong investment grade ratings with a disciplined capital allocation strategy. The Company will continue to invest in future growth and innovation through research and development and capital expenditures. We intend to return a majority of our free cash flow* to shareholders through dividends and share repurchases. Merger and acquisition investments will be pursued in a disciplined way and focused on those that offer strategic, operational and financial synergies.
LIQUIDITY POLICY. We maintain a strong focus on liquidity and define our liquidity risk tolerance based on sources and uses to maintain a sufficient liquidity position to meet our business needs and financial obligations under both normal and stressed conditions. We believe that our consolidated liquidity and availability under our revolving credit facilities will be sufficient to meet our liquidity needs.
CONSOLIDATED LIQUIDITY. Our primary sources of liquidity consist of cash and cash equivalents, free cash flow* from our operating businesses, and access to capital markets. If needed, we can also draw from short-term borrowing facilities, including revolving credit facilities. Cash generation can be subject to variability based on many factors, including receipt of down payments on large equipment orders, timing of billings on long-term contracts, timing of customer allowances and market conditions. Total cash, cash equivalents and restricted cash was $13.6 billion at December 31, 2024, of which $4.4 billion was held in the U.S. and $9.2 billion was held outside the U.S.
Cash held in non-U.S. entities has generally been reinvested in active foreign business operations; however, substantially all of our unrepatriated earnings were subject to U.S. federal tax and, if there is a change in reinvestment, we would expect to be able to repatriate available cash (excluding amounts held in countries with currency controls) without significant tax cost.
*Non-GAAP Financial Measure
Cash, cash equivalents and restricted cash at December 31, 2024 included $0.4 billion of cash held in countries with currency control restrictions. Cash held in countries with currency controls represents amounts held in countries that may restrict the transfer of funds to the U.S. or limit our ability to transfer funds to the U.S. without incurring substantial costs. Excluded from cash, cash equivalents and restricted cash was $0.9 billion of cash in our run-off insurance operations, which was classified as All other assets in the Statement of Financial Position.
As part of the spin-off of GE HealthCare completed in the first quarter of 2023, we retained 19.9% stake of GE HealthCare common stock upon the spin. During the year ended December 31, 2024, we sold all of our remaining GE Healthcare shares and received total proceeds of $5.2 billion from the disposition of 61.6 million shares. See Notes 3 and 19 for further information.
Following approval of a statutory permitted accounting practice in 2018 by our primary insurance regulator, the Kansas Insurance Department (KID), we have since provided a total of $15.0 billion of capital contributions to our insurance subsidiaries, including the final contribution of $1.8 billion in the first quarter of 2024. See Note 12 for further information.
On March 7, 2024, the Company announced that the Board of Directors had authorized the repurchase of up to $15.0 billion of our common stock, which replaced our previous $3.0 billion share repurchase authorization. Under this program, shares may be repurchased on the open market, via various strategies, including plans complying with rules 10b5-1 and 10b-18 as well as plans using accelerated share repurchases. In connection with this new authorization, we repurchased 28.8 million shares for $4.9 billion from April 2024 through December 31, 2024. This included repurchases of 12.5 million shares for $2.2 billion using accelerated stock repurchases, which were utilized as a mechanism to achieve planned repurchase volumes within a quarter during closed windows.
BORROWINGS. Consolidated total borrowings were $19.3 billion and $20.5 billion at December 31, 2024 and December 31, 2023, respectively, a decrease of $1.2 billion, mainly due to maturities. In April 2024, the Company replaced its previous $10.0 billion syndicated credit facility with a five-year unsecured revolving credit facility in an aggregate committed amount of $3.0 billion. The total interest payments on consolidated borrowings are estimated to be $0.8 billion, $0.8 billion, $0.7 billion, $0.7 billion and $0.7 billion for 2025, 2026, 2027, 2028 and 2029, respectively.
CREDIT RATINGS AND CONDITIONS. We have relied, and may continue to rely, on the short- and long-term debt capital markets to fund, among other things, a significant portion of our operations. The cost and availability of debt financing is influenced by our credit ratings. Moody’s Investors Service (Moody’s) and Standard and Poor’s Global Ratings (S&P) currently issue ratings on our short- and long-term debt. Fitch, which previously issued ratings on us, affirmed our BBB+ long term rating and F1 short-term rating and subsequently withdrew its ratings on us on September 13, 2024, at our request. Our credit ratings as of the date of this filing are set forth in the table below.
| | | | | | | | |
| Moody's | S&P |
| Outlook | Positive | Stable |
| Short term | P-2 | A-2 |
| Long term | Baa1 | BBB+ |
Our ratings may be subject to a revision or withdrawal at any time by the assigning rating organization, and each rating should be evaluated independently of any other rating.
Substantially all of the Company's debt agreements in place at December 31, 2024 do not contain material credit rating covenants. Our unused back-up revolving syndicated credit facility contains a customary net debt-to-EBITDA financial covenant, which we satisfied at December 31, 2024.
FOREIGN EXCHANGE RISK AND INTEREST RATE RISK. As a result of our global operations, we generate and incur a small portion of our revenue and expenses in currencies other than the U.S. dollar. Such principal currencies include the euro, the British Sterling pound, and Brazilian real. The effect of foreign currency fluctuations on earnings was immaterial for the year ended December 31, 2024. See Note 22 for further information about our risk exposures, our use of derivatives, and the effects of this activity on our financial statements.
Exchange rate and interest rate risks are managed with a variety of techniques, including selective use of derivatives. We apply policies to manage each of these risks, including prohibitions on speculative activities. It is our policy to minimize currency exposures by conducting operations in the U.S. dollar if possible or by utilizing the protection of hedge strategies. To assess exposure to interest rate risk, we apply a +/- 100 basis points change in interest rates and keep that in place for the next 12 months. To assess exposure to currency risk of assets and liabilities denominated in other than their functional currencies, we evaluate the effect of a 10% shift in exchange rates against the U.S. dollar (USD). The analyses indicated that our 2024 consolidated net earnings would decline by $0.1 billion for interest rate risk and $0.1 billion for foreign exchange risk.
STATEMENT OF CASH FLOWS
CASH FLOWS FROM CONTINUING OPERATIONS. The most significant source of cash flows from operating activities (CFOA) is customer-related activities, the largest of which is collecting cash resulting from equipment or services sales. The most significant operating use of cash is to pay our suppliers, employees, tax authorities and postretirement plans. GE Aerospace measures itself on a free cash flow* basis. This metric includes CFOA plus investments in property, plant and equipment and additions to internal-use software, and this metric excludes any cash received from dispositions of property, plant and equipment.
Cash from operating activities was $5.8 billion in 2024, an increase of $1.2 billion compared to 2023, primarily due to: an increase in net income (after adjusting for depreciation of property, plant and equipment, amortization of intangible assets, goodwill impairments and non-cash (gains) losses related to our retained and sold ownership interests in GE HealthCare, AerCap and Baker Hughes) driven by all segments, a decrease in income tax payments, partially offset by working capital growth and decrease in All other operating activities. The components of All other operating activities were as follows:
| | | | | | | | | |
| Years ended December 31 | 2024 | 2023 |
| Increase (decrease) in employee benefit liabilities | $ | 356 | | $ | 582 | |
| Net restructuring and other charges/(cash expenditures) | (112) | | 46 | |
| (Gains) Losses on purchases and sales of business interests | (399) | | 105 | |
| | | |
| Net interest and other financial charges/(cash paid) | 31 | | 46 | |
| Other deferred assets | (84) | | 201 | |
| | | |
| Other | (118) | | (237) | |
| All other operating activities | $ | (326) | | $ | 743 | |
The cash impacts from changes in working capital were $(0.4) billion, a decrease of $1.1 billion compared to 2023, due to: current receivables of $(0.9) billion, driven by higher volume partially offset by higher collections, including increased collections from CFM International; inventories, including deferred inventory, of $(0.2) billion, driven by higher material purchases and lower liquidations primarily due to output challenges; current contract assets, contract liabilities and current deferred income of $(0.2) billion, driven by higher revenue recognition, partially offset by billings and net unfavorable changes in estimated profitability; progress collections of $0.3 billion, driven by higher collections offset by higher liquidations; accounts payable was flat, driven by higher disbursements related to purchases of materials in prior periods, partially offset by higher volume.
Cash from operating activities was $4.6 billion in 2023, an increase of $0.6 billion compared to 2022, primarily due to: an increase in net income (after adjusting for depreciation of property, plant, and equipment, amortization of intangible assets and non-cash (gains) losses related to our retained and sold ownership interests in GE HealthCare, AerCap and Baker Hughes) primarily in our Commercial Engines & Services business; partially offset by an increase in income tax payments and working capital growth. The components of All other operating activities were as follows:
| | | | | | | | |
| Years ended December 31 | 2023 | 2022 |
| Increase (decrease) in employee benefit liabilities | $ | 582 | | $ | 385 | |
| Net restructuring and other charges/(cash expenditures) | 46 | | 268 | |
| (Gains) Losses on purchases and sales of business interests | 105 | | (38) | |
| | |
| Net interest and other financial charges/(cash paid) | 46 | | (73) | |
| Other deferred assets | 201 | | 22 | |
| | |
| Other | (237) | | (147) | |
| All other operating activities | $ | 743 | | $ | 418 | |
The cash impacts from changes in working capital were $0.6 billion, a decrease of $0.5 billion compared to 2022, due to: current receivables of $1.7 billion, driven by higher collections partially offset by higher volume; inventories, including deferred inventory, of $(0.3) billion, driven by higher material purchases outpacing liquidations primarily due to output challenges; current contract assets, contract liabilities and current deferred income was flat, driven by higher billings offset by higher revenue recognition; progress collections of $(0.9) billion, driven by lower collections and higher liquidations; accounts payable of $(0.9) billion, driven by higher disbursements related to purchases of materials in prior periods partially offset by higher volume.
Cash used for investing activities was $0.6 billion in 2024, a decrease of $8.2 billion compared to 2023, primarily due to: higher cash paid related to net settlements between our continuing operations and businesses in discontinued operations of $4.6 billion, primarily related to the separation of GE Vernova of $3.0 billion in 2024 and lower cash received of $1.1 billion related to the separation of GE HealthCare in 2023 (components of All other investing activities); a decrease in proceeds of $3.8 billion from the disposition of our remaining retained ownership interests in AerCap and Baker Hughes of $6.8 billion in 2023, partially offset by an increase in proceeds of $3.1 billion from the disposition of our remaining retained ownership interest in GE HealthCare in 2024. These increases in cash used were partially offset by proceeds received from the dispositions of our non-core licensing business and Electric Insurance Company of $0.5 billion. Cash used for additions to property, plant and equipment and internal-use software, which are components of free cash flow*, was $1.0 billion and $0.9 billion in 2024 and 2023, respectively.
*Non-GAAP Financial Measure
Cash from investing activities was $7.7 billion in 2023, a decrease of $2.7 billion compared with 2022, primarily due to: higher cash paid related to net settlements between our continuing operations and businesses in discontinued operations of $6.3 billion, primarily related to lower cash received of $7.6 billion related to the separation of GE Healthcare partially offset by higher cash received of $0.8 billion from the separation of GE Vernova and an increase in cash paid for derivatives settlements of $0.4 billion (components of All other investing activities); partially offset by an increase in proceeds of $4.3 billion from the disposition of our retained ownership interests in GE HealthCare, AerCap and Baker Hughes. Cash used for additions to property, plant and equipment and internal-use software, which are components of free cash flow*, was $0.9 billion and $0.7 billion in 2023 and 2022, respectively.
Cash used for financing activities was $6.6 billion in 2024, a decrease of $3.9 billion compared to 2023, primarily due to: cash paid for redemption of GE preferred stock of $5.8 billion in 2023; lower net debt maturities of $2.6 billion and an increase in cash received of $0.9 billion from stock option exercises (a component of All other financing activities); partially offset by an increase in treasury stock repurchases of $4.6 billion and higher dividends paid to shareholders of $0.4 billion.
Cash used for financing activities was $10.5 billion in 2023, a decrease of $3.0 billion compared with 2022, primarily due to: cash paid to repurchase long-term debt of $6.9 billion, including debt extinguishment costs in 2022, lower other net debt maturities of $0.5 billion, lower cash paid on derivatives hedging foreign currency debt of $0.7 billion, an increase in cash received of $0.5 billion from stock option exercises, the settlement of Concept Laser GmbH's interest of $0.2 billion in 2022 (components of All other financing activities); partially offset by higher cash paid for redemption of GE preferred stock of $5.7 billion.
Free cash flow* (FCF) was $6.1 billion and $4.7 billion for the years ended December 31, 2024 and 2023, respectively. FCF* increased primarily due to higher net income and lower income tax payments, partially offset by a decrease in All other operating activities and working capital growth, after adjusting for an increase in Corporate & Other restructuring cash expenditures, which are excluded from FCF*.
Free cash flow* was $4.7 billion and $3.5 billion for the years ended December 31, 2023 and 2022, respectively. FCF* increased primarily due to higher net income, partially offset by higher income tax payments and working capital growth, after adjusting for increases in separation cash and Corporate & Other restructuring cash expenditures, which are excluded from FCF*.
CASH FLOWS FROM DISCONTINUED OPERATIONS
Cash used for operating activities of discontinued operations was $1.1 billion in 2024, an increase of $1.7 billion compared to 2023, primarily driven by down payments received on equipment orders at our former GE Vernova business and disbursements for purchases of materials incurred by our former GE HealthCare business in 2023.
Cash from operating activities of discontinued operations was $0.6 billion in 2023, a decrease of $1.3 billion compared to 2022, primarily driven by higher disbursements related to purchases of materials in prior periods and higher separation costs related to our former GE HealthCare business, partially offset by down payments received on equipment orders at our former GE Vernova business and tax receipts from our trailing operations.
Cash used for investing activities of discontinued operations was $1.1 billion in 2024, a decrease of $2.6 billion compared to 2023, primarily driven by higher cash received of $4.6 billion from net settlements between our discontinued operations and businesses in continuing operations, due to cash received of $3.0 billion in 2024 related to the separation of our former GE Vernova business and cash paid of $1.1 billion in 2023 related to the separation of our former GE HealthCare business. In addition, there was a decrease in cash used due to the prior year separation of GE HealthCare cash and cash equivalents of $1.8 billion. These decreases in cash used were partially offset by a reduction of cash and cash equivalents of $4.2 billion due to the separation of GE Vernova in 2024.
Cash used for investing activities of discontinued operations was $3.7 billion in 2023, a decrease of $4.4 billion compared to 2022, primarily driven by higher cash received of $6.3 billion from net settlements between our discontinued operations and businesses in continuing operations, due to cash received of $7.6 billion related to the separation of our former GE HealthCare business and cash paid of $0.8 billion related to the separation of our former GE Vernova business; partially offset by a reduction in cash due to the separation of GE HealthCare cash and cash equivalents of $1.8 billion in 2023.
Cash used for financing activities of discontinued operations was $0.1 billion in 2024, a decrease of $2.0 billion compared to 2023, driven by GE HealthCare's long-term debt issuance of $2.0 billion in connection with the spin-off in 2023.
Cash from financing activities of discontinued operations was $1.9 billion in 2023, a decrease of $6.1 billion compared to 2022, primarily driven by lower long-term debt issuances of $6.3 billion at GE HealthCare in connection with the spin-off in 2022.
CRITICAL ACCOUNTING ESTIMATES. Accounting estimates and assumptions discussed in this section are those that we consider to be the most critical to an understanding of our financial statements because they involve significant judgments and uncertainties. Actual results in these areas could differ from management's estimates. See Note 1 for further information on our most significant accounting policies.
*Non-GAAP Financial Measure
REVENUE RECOGNITION ON LONG-TERM SERVICES AGREEMENTS. We enter into long-term services agreements with our customers, predominantly within the CES segment, that require us to maintain the customers’ assets over the contract terms, which generally range from 5 to 25 years. Contract modifications that extend or revise contracts are not uncommon. We recognize revenue as we perform under the arrangements using the percentage of completion method which is based on our costs incurred to date relative to our estimate of total expected costs. This requires us to make estimates of customer payments expected to be received over the current contract term as well as the costs to perform required maintenance services.
Our rights to consideration for these arrangements are generally based on the utilization of the asset (e.g., per hour of usage) and contractual payment terms are based on either periodic billing schedules or upon the occurrence of a maintenance event, such as an overhaul. As a result, a significant estimate in determining expected revenue of a contract is estimating how customers will utilize their assets over the term of the agreement. The estimate of utilization, which can change over the contract life, impacts both the amount of customer payments we expect to receive and our estimate of future contract costs. Customers' asset utilization will influence the timing and extent of overhauls and other service events over the life of the contract. We generally use a combination of both historical utilization trends as well as forward-looking information such as market conditions and potential asset retirements in developing our revenue estimates.
To develop our cost estimates, we consider the timing and extent of future maintenance and overhaul events, including the frequency of maintenance events and cost of labor, spare parts and other resources required to perform the maintenance. In developing our cost estimates, we utilize a combination of our historical cost experience and expected cost improvements. Cost improvements are only included in future cost estimates after savings have been observed in actual results or proven effective through an extensive regulatory or engineering approval process.
We routinely review estimates and revise them to adjust for changes in outlook. Changes in estimates are recognized on a cumulative catch-up basis with an adjustment to revenue in the current period. These revisions are based on objectively verifiable information that is available at the time of the review. Contract modifications that change the rights and obligations, as well as the nature, timing and extent of future cash flows, are evaluated for potential price concessions, contract asset impairments and significant financing to determine if adjustments of earnings are required before effectively accounting for a modified contract as a new contract.
We regularly assess expected billings adjustments and customer credit risk inherent in the carrying amounts of receivables and contract assets, including the risk that contractual penalties may not be sufficient to offset our accumulated investment in the event of customer termination. We gain insight into future utilization and cost trends, as well as credit risk, through our knowledge of the installed base of equipment and fleet management strategies through close interaction with our customers that comes with supplying critical services and parts over extended periods. Revisions may affect a long-term services agreement’s total estimated profitability resulting in an adjustment of earnings.
On December 31, 2024, our long-term service agreements net liability balance of $6.6 billion represents approximately 4.1% of our total estimated life of contract billings of $162 billion. Our contracts (on average) are approximately 18.4% complete based on costs incurred to date and our estimate of future costs. Revisions to our estimates of future billings or costs that increase or decrease total estimated contract profitability by one percentage point would increase or decrease the long-term service agreements balance by $0.4 billion. Billings collected on these contracts were $8.6 billion and $8.1 billion during the years ended December 31, 2024 and 2023, respectively. See Notes 1 and 8 for further information.
NONRECURRING ENGINEERING COSTS. We incur contract fulfillment costs for engineering and development of products directly related to existing or anticipated contracts with customers, primarily in our Defense & Propulsion Technologies segment. Contract fulfillment costs are capitalized to the extent recoverable from the customer contract, and subsequently amortized as the products are delivered to the customer. We periodically assess the recoverability of capitalized contract fulfillment costs, which requires significant judgement. Specifically, we estimate program volumes, contract revenue based on negotiated prices, and product costs based on input costs, inflation and productivity. See Note 8 for further information.
IMPAIRMENT OF GOODWILL AND OTHER IDENTIFIED INTANGIBLE ASSETS. Goodwill is subject to annual, or more frequent, if necessary, impairment testing. In the impairment test, the fair value is estimated utilizing a discounted cash flow approach utilizing cash flow forecasts, including strategic and annual operating plans, adjusted for terminal value assumptions, or a market approach, when available and appropriate, utilizing market observable pricing multiples of similar businesses and comparable transactions, or both. These impairment tests involve the use of accounting estimates and assumptions, and changes to those assumptions could materially impact our financial condition or operating performance if actual results differ from such estimates and assumptions. To address this uncertainty, we perform sensitivity analyses on key estimates and assumptions. Once the fair value is determined, if the carrying amount exceeds the fair value, it is impaired. In the fourth quarter of each year, we perform our annual impairment test. See Note 7 for further information.
We review identified intangible assets with defined useful lives and subject to amortization for impairment whenever events or changes in circumstances indicate that the related carrying amounts may not be recoverable. Determining whether an impairment loss has occurred requires the use of our internal forecast to estimate future cash flows and the useful life over which these cash flows will occur. To determine fair value, we use our internal cash flow estimates discounted at an appropriate discount rate. See Notes 1 and 7 for further information.
INSURANCE AND INVESTMENT CONTRACTS. Refer to the Other Items - Insurance section for further discussion of the accounting estimates and assumptions in our insurance reserves and their sensitivity to change. See Notes 1 and 12 for further information.
PENSION ASSUMPTIONS. Refer to Note 13 for our accounting estimates and assumptions related to our postretirement benefit plans.
INCOME TAXES. Our annual tax rate is based on our income, statutory tax rates and tax planning opportunities available to us in the various jurisdictions in which we operate. Tax laws are complex and subject to different interpretations by the taxpayer and respective governmental taxing authorities. Significant judgment is required in determining our tax expense and in evaluating our tax positions, including evaluating uncertainties. We review our tax positions quarterly and adjust the balances as new information becomes available. Our income tax rate is significantly affected by the tax rate on our global operations. In addition to local country tax laws and regulations, this rate can depend on the extent earnings are indefinitely reinvested outside the U.S. Historically U.S. taxes were due upon repatriation of foreign earnings. Due to the enactment of U.S. tax reform in 2017, substantially all of our unrepatriated net earnings have been subject to U.S. tax and accordingly we expect to have the ability to repatriate available non-U.S. cash without significant additional tax cost. Indefinite reinvestment is determined by management’s judgment about and intentions concerning the future operations of the Company. Most of these earnings have been reinvested in active non-U.S. business operations. We reassess reinvestment of earnings on an ongoing basis.
We evaluate the recoverability of deferred income tax assets by assessing the adequacy of future expected taxable income from all sources, including reversal of taxable temporary differences, forecasted operating earnings and available tax planning strategies, which rely on reasonable estimates. We use our historical experience and our short- and long-range business forecasts to provide insight. Further, our global and diversified business portfolio gives us the opportunity to employ various prudent and feasible tax planning strategies to facilitate the recoverability of future deductions. Amounts recorded for deferred tax assets related to non-U.S. net operating losses, net of valuation allowances, were $0.5 billion and $1.0 billion at December 31, 2024 and 2023, respectively. Of this, an insignificant amount and $0.6 billion at December 31, 2024 and 2023 respectively, were associated with losses reported in discontinued operations, primarily related to our GE Vernova, GE HealthCare and legacy financial services businesses. See Other Consolidated Information – Income Taxes section and Notes 1 and 15 for further information.
LOSS CONTINGENCIES. Loss contingencies are existing conditions, situations or circumstances involving uncertainty as to possible loss that will ultimately be resolved when future events occur or fail to occur. Such contingencies include, but are not limited to, environmental, health and safety matters, litigation, regulatory investigations and proceedings, government contracts, employee benefit plans, product quality guarantees and losses resulting from other events and developments. In particular, the design, development, production and support of aerospace products is inherently complex and subject to risk. Technical issues associated with these products may arise in the normal course and may result in financial impacts, including increased warranty provisions, customer contract settlements, and changes in contract performance estimates. When a loss is considered probable and reasonably estimable, we record a liability in the amount of our best estimate for the ultimate loss. When there appears to be a range of possible costs with equal likelihood, liabilities are based on the low-end of such range. However, the likelihood of a loss with respect to a particular contingency is often difficult to predict and determining a meaningful estimate of the loss or a range of loss may not be practicable based on the information available and the potential effect of future events and negotiations with or decisions by third parties that will determine the ultimate resolution of the contingency. Moreover, it is not uncommon for such matters to be resolved over many years, during which time relevant developments and new information must be continuously evaluated to determine both the likelihood of potential loss and whether it is possible to reasonably estimate a range of possible loss. Disclosure is provided for material loss contingencies when a loss is probable but a reasonable estimate cannot be made, and when it is reasonably possible that a loss will be incurred or the amount of a loss will exceed the recorded provision. We regularly review contingencies to determine whether the likelihood of loss has changed and to assess whether a reasonable estimate of the loss or range of loss can be made. See Note 24 for further information.
OTHER ITEMS
INSURANCE. Our run-off insurance operations include Employers Reassurance Corporation (ERAC) and Union Fidelity Life Insurance Company (UFLIC). ERAC primarily assumed long-term care insurance and life insurance from numerous cedents under various types of reinsurance treaties and stopped accepting new policies after 2008. UFLIC primarily assumed long-term care insurance, structured settlement annuities with and without life contingencies and variable annuities from Genworth Financial Inc. (Genworth) and has been closed to new business since 2004.
Key Portfolio Characteristics
Long-term care insurance contracts. The long-term care insurance contracts we reinsure provide coverage at varying levels of benefits to policyholders and may include attributes (e.g., lifetime benefit periods, inflation protection options, and joint life policies) that could result in claimants being on claim for longer periods or at higher daily claim costs, or alternatively limiting the premium paying period, compared to contracts with a lower level of benefits. Presented in the table below are reserve balances and key attributes of our long-term care insurance portfolio.
| | | | | | | | | | | |
| December 31, 2024 | ERAC | UFLIC | Total |
| GAAP: Ending balance of reserves at locked-in rate | $ | 18,488 | | $ | 4,970 | | $ | 23,458 | |
| Gross statutory reserves(a) | 24,208 | | 5,956 | | 30,164 | |
| Number of policies in force | 167,500 | | 44,300 | | 211,800 | |
| Number of covered lives in force | 221,400 | | 44,300 | | 265,700 | |
| Average policyholder attained age | 78 | | 85 | | 79 | |
| GAAP: Ending balance of reserves at locked-in rate per policy (in actual dollars) | $ | 110,406 | | $ | 112,078 | | $ | 110,756 | |
| GAAP: Ending balance of reserves at locked-in rate per covered life (in actual dollars) | 83,496 | | 112,078 | | 88,265 | |
| Statutory: Gross reserves per policy (in actual dollars)(a) | 144,522 | | 134,463 | | 142,418 | |
| Statutory: Gross reserves per covered life (in actual dollars)(a) | 109,338 | | 134,463 | | 113,527 | |
| Percentage of policies with: | | | |
| Lifetime benefit period | 69 | % | 32 | % | 63 | % |
| Inflation protection option | 76 | % | 83 | % | 77 | % |
| Joint lives | 32 | % | — | % | 26 | % |
| Percentage of policies that are premium paying | 64 | % | 72 | % | 65 | % |
| Policies on claim | 11,200 | | 7,500 | | 18,700 | |
(a) Pending completion of our December 31, 2024 statutory reporting process.
Structured settlement annuities. We reinsure approximately 23,400 structured settlement annuities with an average attained age of 57. Approximately 27% of these structured settlement annuities were underwritten on impaired lives (i.e., shorter-than-average life expectancies) at origination and have projected payments extending decades into the future. Our primary risks associated with these contracts include mortality (i.e., life expectancy or longevity), mortality improvement (i.e., assumed rate that mortality is expected to reduce over time), which may extend the duration of payments on life contingent contracts beyond our estimates, and reinvestment risk (i.e., a low interest rate environment). Unlike long-term care insurance, structured settlement annuities offer no ability to require additional premiums or reduce benefits.
Life Insurance contracts. Our life reinsurance business typically covers the mortality risk associated with various types of life insurance policies that we reinsure from approximately 150 ceding company relationships where we pay a benefit based on the death of a covered life. At December 31, 2024, across our U.S. and Canadian life insurance portfolio, we reinsure approximately $45 billion of net amount at risk (i.e., difference between the death benefit and any accrued cash value) from approximately 1.1 million policies with an average attained age of 63. In 2024, our incurred claims were approximately $0.4 billion with an average individual claim of approximately $46,100. The covered products primarily include permanent life insurance and 20- and 30-year level term insurance. We anticipate a significant portion of the 20- and 30-year level term policies, which represent approximately 7% and 43% of the net amount of risk, to lapse through 2026 and 2035 as the policies reach the end of their 20- and 30-year level premium period, respectively.
Critical Accounting Estimates. Our insurance reserves include the following key accounting estimates and assumptions described below.
Future policy benefit reserves. Future policy benefit reserves represent the present value of future benefits to be paid to or on behalf of policyholders and related expenses less the present value of future net premiums and are estimated based on actuarial assumptions such as mortality, morbidity, terminations, and expenses. The liability is measured for each group of contracts (i.e., cohorts) using current cash flow assumptions.
We regularly monitor emerging experience in our run-off insurance operations and industry developments to identify trends that may help us refine our reserve assumptions. We review at least annually in the third quarter, future policy benefit reserves cash flow assumptions, except related claim expenses which remain locked-in, and if the review concludes that the assumptions need to be updated, future policy benefit reserves are adjusted retroactively based on the revised net premium ratio using actual historical experience, updated cash flow assumptions, and the locked-in discount rate with the effect of those changes recognized in current period earnings. Our annual review procedures include updating certain experience studies since our last completed review, independent actuarial analysis (principally on long-term care insurance exposures) and review of industry benchmarks. The review of experience and assumptions is a comprehensive and complex process that depends on a number of factors, many of which are interdependent and require evaluation individually and in the aggregate across all insurance products. The vast majority of our run-off insurance operations consists of reinsurance from multiple ceding insurance entities pursuant to treaties having complex terms and conditions. The review relies on claim and policy information provided by these ceding entities and considers the reinsurance treaties and underlying policies. In order to utilize that information for purposes of completing experience studies covering all key assumptions, we perform detailed procedures to conform and validate the data received from the ceding entities. Our long-term care insurance portfolio includes coverage where credible claim experience for higher attained ages is still emerging, and to the extent future experience deviates from current expectations, new projections of claim costs extending over the expected life of the policies may be required. Significant uncertainties exist in making projections for these long-term care insurance contracts, which requires that we consider a wide range of possible outcomes.
The primary cash flow assumptions used in the annual review include:
Morbidity. Morbidity assumptions used in estimating future policy benefit reserves are based on estimates of expected incidences of disability among policyholders and the costs associated with these policyholders asserting claims under their contracts, and these estimates account for any expected future morbidity improvement. For long-term care insurance exposures, estimating expected future costs includes assessments of incidence (probability of a claim), utilization (amount of available benefits expected to be incurred) and continuance (how long the claim will last, including claim terminations due to death or recovery).
Rate of Change in Morbidity. Our review incorporates our best estimates of projected future changes in the morbidity rates reflected in our base claim incidence rates. These estimates draw upon a number of inputs, some of which are subjective, and all of which are interpreted and applied in the exercise of professional actuarial judgment in the context of the characteristics specific to our portfolios. This exercise of actuarial judgment considers factors such as the work performed by internal and external independent actuarial experts engaged to advise us in our annual review, the observed actual experience in our portfolios measured against our base assumptions, industry developments, and other trends, including advances in the state of medical care and healthcare technology development.
Terminations. Terminations include active life mortality and lapse. Mortality assumptions used in estimating future policy benefit reserves are based on published mortality tables as adjusted for the results of our experience studies and estimates of expected future mortality improvement. Lapse refers to the rate at which the underlying policies are cancelled due to non-payment of premiums by a policyholder. Lapse rate assumptions used in estimating the present value of future policy benefit reserves are based on the results of our experience studies and reflect actuarial judgment.
Future long-term care premium rate increases. Substantially all long-term care insurance policies that are currently premium paying allow the issuing insurance entity to increase premiums, or alternatively allow the policyholder the option to decrease benefits, with approval by state regulators, should actual experience emerge worse than what was projected when such policies were initially underwritten. As a reinsurer, we rely upon the primary insurers that issued the underlying policies to file proposed premium rate increases on those policies with the relevant state insurance regulators. While we have no direct ability to seek or to institute such premium rate increases, we often collaborate with the primary insurers in accordance with reinsurance contractual terms to file proposed premium rate increases. The amount of times that rate increases have occurred varies by ceding company. We consider recent experience of rate increase filings made by our ceding companies along with state insurance regulatory processes and precedents in establishing our current expectations.
Included in Insurance losses and annuity benefits in our Statement of Earnings (Loss) for the years ended December 31, 2024 and 2023, are favorable and unfavorable pre-tax adjustments of $196 million and $(155) million, respectively, from updating the net premium ratio (i.e., the percentage of projected gross premiums required to cover expected policy benefits and related expenses) after updating for actual historical experience each quarter and updating of future cash flow assumptions in the third quarter of each year.
Sensitivities. The following table provides sensitivities with respect to the impact of changes of key cash flow assumptions underlying our future policy benefit reserves using the locked-in discount rate assumption and have been estimated across the entire product line rather than at an individual cohort level. As our insurance operations are in run-off, the locked-in discount rate is used for the computation of interest accretion on future policy benefit reserves. Many of our assumptions, which are based on our credible experience, are interdependent and require evaluation individually and in the aggregate across all insurance products. Small changes in the amounts used in the sensitivities could result in materially different outcomes from those reflected below. In addition, the effects of changes to cash flow assumptions underlying our future policy benefit reserves may be partially or wholly reflected in the period in which the assumptions are changed and/or over future periods and may vary across cohorts.
| | | | | | | | |
| Assumption | Hypothetical change in 2024 assumption | Estimated adverse impact to projected present value of future cash flows (In millions, pre-tax) |
| Morbidity: | | |
| Long-term care insurance incidence rates | 5% increase in incidence rates | $600 |
| Long-term care insurance claim continuance | 5% reduction in disabled life deaths | $1,200 |
| Long-term care insurance utilization | 5% increase in utilization | $1,200 |
| Long-term care insurance morbidity improvement | 25 basis point reduction by age with 0% floor
No morbidity improvement | $300 $1,300 |
| Active life terminations: | | |
| Long-term care insurance mortality | 5% reduction in mortality | $300 |
| Long-term care insurance future premium rate increases | 25% adverse change in success rate on premium rate increase actions not yet approved | $300 |
| Life insurance mortality | 5% increase in mortality | $200 |
| Structured settlement annuity mortality | Impaired life mortality grades to standard ten years earlier | $300 |
While higher assumed inflation, holding all other assumptions constant, would result in unfavorable impacts to the projected present value of future cash flows in the table above, it would be expected to be mitigated by more long-term care insurance policies reaching contractual daily or monthly benefit caps and by increased investment income from higher portfolio yields.
Our run-off insurance subsidiaries are required to prepare statutory financial statements in accordance with statutory accounting practices. Statutory accounting practices are set forth by the National Association of Insurance Commissioners as well as state laws, regulation and general administrative rules and can differ in certain respects from GAAP and would result in several of the sensitivities described in the table above being less impactful on our statutory reserves.
See Capital Resources and Liquidity and Notes 1, 3 and 12 for further information related to our run-off insurance operations.
NEW ACCOUNTING STANDARDS. In December 2023, the Financial Accounting Standards Board (FASB) issued ASU No. 2023-09, Income Taxes (Topic 740): Improvements to Income Tax Disclosures. The amendments require disclosure of specific categories in the rate reconciliation and provide additional information for reconciling items that meet a quantitative threshold and further disaggregation of income taxes paid for individually significant jurisdictions. The ASU is effective for fiscal years beginning after December 15, 2024, with early adoption permitted. We are currently evaluating the impact that this guidance will have on the disclosures within our consolidated financial statements.
In November 2024, the FASB issued ASU No. 2024-03, Income Statement—Reporting Comprehensive Income—Expense Disaggregation Disclosures (Subtopic 220-40). The amendments increase disclosure requirements primarily through enhanced disclosures about types of expenses (including purchases of inventory, employee compensation, depreciation, and amortization) in commonly presented expense captions. The ASU is effective for fiscal years beginning after December 15, 2026, and is required to be applied prospectively with the option for retrospective application. We are currently evaluating the impact that this guidance will have on the disclosures within our consolidated financial statements.
GE VERNOVA PARENT COMPANY GUARANTEES. To support GE Vernova in selling products and services globally, the Company often entered into contracts on behalf of GE Vernova or issued parent company guarantees or trade finance instruments supporting the performance of what were subsidiary legal entities transacting directly with customers, in addition to providing similar credit support for non-customer related activities of GE Vernova (collectively, “GE Aerospace credit support”). Prior to the spin-off in the second quarter of 2024, GE Vernova had been working to seek novation or assignment of GE Aerospace credit support, the majority of which relates to parent company guarantees, associated with GE Vernova legal entities from GE Aerospace to GE Vernova. For GE Aerospace credit support that remains outstanding post-spin, GE Vernova is obligated to use reasonable best efforts to terminate or replace and obtain a full release of the Company’s obligations and liabilities under, all such credit support. Beginning in 2025, GE Vernova will pay a quarterly fee to the Company based on amounts related to the GE Aerospace credit support, for which we have recorded a stand ready to perform obligation. GE Vernova will face other contractual restrictions and requirements while the Company continues to be obligated under such credit support on behalf of GE Vernova. While the Company will remain obligated under the contract or instrument, GE Vernova will be obligated to indemnify the Company for credit support related payments that the Company is required to make.
As of December 31, 2024, we estimated GE Vernova RPO and other obligations that relate to GE Aerospace credit support to be approximately $17 billion, an over 73% reduction since December 31, 2023. We expect, approximately $10 billion of the RPO related to GE Aerospace credit support obligations to contractually mature by the end of 2029. The Company’s maximum aggregate exposure under the GE Aerospace credit support cannot be reasonably estimated given the breadth of the portfolio across each of the GE Vernova businesses. The underlying obligations are predominantly customer contracts that GE Vernova performs in the course of its business. We have no known instances historically where payments or performance from us were required under parent company guarantees relating to GE Vernova customer contracts. See Note 24 for additional details regarding guarantees.
NON-GAAP FINANCIAL MEASURES. We believe that presenting non-GAAP financial measures provides management and investors useful measures to evaluate performance and trends of the total company and its businesses. This includes adjustments in recent periods to GAAP financial measures to increase period-to-period comparability following actions to strengthen our overall financial position and how we manage our business. In addition, management recognizes that certain non-GAAP terms may be interpreted differently by other companies under different circumstances. In various sections of this report we have made reference to the following non-GAAP financial measures in describing our (1) revenue, specifically, Adjusted revenue, (2) profit, specifically, Operating profit and Operating profit margin; Adjusted earnings (loss); Adjusted earnings (loss) per share (EPS) and Adjusted effective income tax rate, and (3) cash flows, specifically free cash flow (FCF). The reasons we use these non-GAAP financial measures and the reconciliations to their most directly comparable GAAP financial measures follow.
| | | | | | | | | | | | | | | |
| | | |
| ADJUSTED REVENUE, OPERATING PROFIT AND PROFIT MARGIN (NON-GAAP) | | | | | 2024 | 2023 | 2022 |
| Total revenue (GAAP) | | | | | $ | 38,702 | $ | 35,348 | $ | 29,139 |
| Less: Insurance revenue (Note 12) | | | | | 3,581 | 3,389 | 2,957 |
| Adjusted revenue (Non-GAAP) | | | | | $ | 35,121 | $ | 31,959 | $ | 26,181 |
| | | | | | | |
| Total costs and expenses (GAAP) | | | | | $ | 33,346 | $ | 31,625 | $ | 28,428 |
| Less: Insurance cost and expenses (Note 12) | | | | | 2,560 | 3,057 | 2,753 |
| Less: U.S. tax equity cost and expenses | | | | | 14 | — | — |
| Less: interest and other financial charges(a) | | | | | 986 | 1,029 | 1,339 |
| Less: non-operating benefit cost (income) | | | | | (842) | (978) | (60) |
| Less: restructuring & other(a) | | | | | 525 | 246 | 514 |
| Less: goodwill impairments(a) | | | | | 251 | — | — |
| Less: separation costs(a) | | | | | 492 | 692 | 625 |
| Less: Russia & Ukraine charges(a) | | | | | — | — | 75 |
| Less: debt extinguishment costs(a) | | | | | — | — | 465 |
| Add: noncontrolling interests | | | | | (13) | (1) | 2 |
| Adjusted costs (Non-GAAP) | | | | | $ | 29,348 | $ | 27,577 | $ | 22,720 |
| | | | | | | |
| Other income (loss) (GAAP) | | | | | $ | 2,264 | $ | 6,718 | $ | 811 |
| Less: U.S. tax equity | | | | | (146) | (132) | (89) |
| Less: gains (losses) on retained and sold ownership interests and other equity securities(a) | | | | | 532 | 5,776 | 100 |
| Less: gains (losses) on purchases and sales of business interests(a) | | | | | 398 | (104) | 35 |
| Adjusted other income (loss) (Non-GAAP) | | | | | $ | 1,480 | $ | 1,179 | $ | 766 |
| | | | | | | |
| Profit (loss) (GAAP) | | | | | $ | 7,620 | $ | 10,441 | $ | 1,522 |
| Profit (loss) margin (GAAP) | | | | | 19.7% | 29.5% | 5.2% |
| | | | | | | |
| Operating profit (loss) (Non-GAAP) | | | | | $ | 7,253 | $ | 5,561 | $ | 4,227 |
| Operating profit (loss) margin (Non-GAAP) | | | | | 20.7% | 17.4% | 16.1% |
| | | | | | | |
| (a) See the Corporate & Other and Other Consolidated Information sections for further information. |
| We believe that adjusting revenue provides management and investors with a more complete understanding of underlying operating results and trends of established, ongoing operations by excluding the effect of revenue from our run-off insurance operations. We believe that adjusting profit to exclude the effects of items that are not closely associated with ongoing operations provides management and investors with a meaningful measure that increases the period-to-period comparability. Gains (losses) and restructuring and other items are impacted by the timing and magnitude of gains associated with dispositions, and the timing and magnitude of costs associated with restructuring and other activities. We also use Adjusted revenue* and Operating profit* as performance metrics at the company level for our annual executive incentive plan for 2024. |
*Non-GAAP Financial Measure
| | | | | | | | | | | | | | | | | | | | | | | | | | | | | |
| | | | | |
| ADJUSTED EARNINGS (LOSS) AND ADJUSTED EFFECTIVE INCOME TAX RATE (NON-GAAP) | | | | | | | 2024 | | 2023 | 2022 |
| (Per-share amounts in dollars) | | | | | | | Earnings | EPS | | Earnings | EPS | Earnings | EPS |
| Earnings (loss) from continuing operations (GAAP) (Note 18) | | | | | | | $ | 6,670 | $ | 6.09 | | $ | 9,151 | $ | 8.33 | $ | 1,065 | $ | 0.97 |
| Insurance earnings (loss) (pre-tax) | | | | | | | 1,025 | 0.94 | | 334 | 0.30 | 210 | 0.19 |
| Tax effect on Insurance earnings (loss) | | | | | | | (219) | (0.20) | | (74) | (0.07) | (52) | (0.05) |
| Less: Insurance earnings (loss) (net of tax) (Note 12) | | | | | | | 806 | 0.74 | | 260 | 0.24 | 159 | 0.14 |
| U.S. tax equity earnings (loss) (pre-tax) | | | | | | | (191) | (0.17) | | (176) | (0.16) | (124) | (0.11) |
| Tax effect on U.S. tax equity earnings (loss) | | | | | | | 235 | 0.21 | | 217 | 0.20 | 184 | 0.17 |
| Less: U.S. tax equity earnings (loss) (net of tax) | | | | | | | 44 | 0.04 | | 41 | 0.04 | 60 | 0.05 |
| Non-operating benefit (cost) income (pre-tax) (GAAP) | | | | | | | 842 | 0.77 | | 978 | 0.89 | 60 | 0.05 |
| Tax effect on non-operating benefit (cost) income | | | | | | | (177) | (0.16) | | (205) | (0.19) | (13) | (0.01) |
| Less: Non-operating benefit (cost) income (net of tax) | | | | | | | 665 | 0.61 | | 772 | 0.70 | 47 | 0.04 |
| Gains (losses) on purchases and sales of business interests (pre-tax)(a) | | | | | | | 398 | 0.36 | | (104) | (0.10) | 35 | 0.03 |
| Tax effect on gains (losses) on purchases and sales of business interests | | | | | | | (2) | — | | (3) | — | 59 | 0.05 |
| Less: Gains (losses) on purchases and sales of business interests (net of tax) | | | | | | | 396 | 0.36 | | (108) | (0.10) | 94 | 0.09 |
| Gains (losses) on retained and sold ownership interests and other equity securities (pre-tax)(a) | | | | | | | 532 | 0.49 | | 5,776 | 5.26 | 100 | 0.09 |
| Tax effect on gains (losses) on retained and sold ownership interests and other equity securities(b)(c) | | | | | | | (3) | — | | — | — | (23) | (0.02) |
| Less: Gains (losses) on retained and sold ownership interests and other equity securities (net of tax) | | | | | | | 529 | 0.48 | | 5,776 | 5.26 | 77 | 0.07 |
| Restructuring & other (pre-tax)(a) | | | | | | | (525) | (0.48) | | (246) | (0.22) | (514) | (0.47) |
| Tax effect on restructuring & other | | | | | | | 110 | 0.10 | | 52 | 0.05 | 108 | 0.10 |
| Less: Restructuring & other (net of tax) | | | | | | | (415) | (0.38) | | (194) | (0.18) | (406) | (0.37) |
| Goodwill impairments (pre-tax)(a) | | | | | | | (251) | (0.23) | | — | — | — | — |
| Tax effect on goodwill impairments | | | | | | | 3 | — | | — | — | — | — |
| Less: goodwill impairments (net of tax) | | | | | | | (248) | (0.23) | | — | — | — | — |
| Separation costs (pre-tax)(a) | | | | | | | (492) | (0.45) | | (692) | (0.63) | (625) | (0.57) |
| Tax effect on separation costs | | | | | | | 349 | 0.32 | | 113 | 0.10 | 4 | — |
| Less: Separation costs (net of tax) | | | | | | | (143) | (0.13) | | (579) | (0.53) | (621) | (0.56) |
| Russia & Ukraine charges (pre-tax)(a) | | | | | | | — | — | | — | — | (75) | (0.07) |
| Tax effect on Russia & Ukraine charges | | | | | | | — | — | | — | — | 16 | 0.01 |
| Less: Russia & Ukraine charges (net of tax) | | | | | | | — | — | | — | — | (59) | (0.05) |
| Debt extinguishment costs (pre-tax)(a) | | | | | | | — | — | | — | — | (465) | (0.42) |
| Tax effect on debt extinguishment costs | | | | | | | — | — | | — | — | 68 | 0.06 |
| Less: debt extinguishment costs (net of tax) | | | | | | | — | — | | — | — | (397) | (0.36) |
| Less: Excise tax and accretion of preferred share redemption | | | | | | | — | — | | (58) | (0.05) | 4 | — |
| Less: U.S. and foreign tax law change enactment | | | | | | | — | — | | — | — | (5) | — |
| Adjusted earnings (loss) (Non-GAAP) | | | | | | | $ | 5,035 | $ | 4.60 | | $ | 3,241 | $ | 2.95 | $ | 2,112 | $ | 1.92 |
| | | | | | | | | | | | | |
| Earnings (loss) from continuing operations before taxes (GAAP) | | | | | | | $ | 7,620 | | | $ | 10,441 | | $ | 1,522 | |
| Less: Total adjustments above (pre-tax) | | | | | | | 1,338 | | | 5,869 | | (1,397) | |
| Adjusted earnings before taxes (Non-GAAP) | | | | | | | $ | 6,282 | | | $ | 4,572 | | $ | 2,919 | |
| | | | | | | | | | | | | |
| Provision (benefit) for income taxes (GAAP) | | | | | | | $ | 962 | | | $ | 994 | | $ | 169 | |
| Less: Tax effect on adjustments above | | | | | | | (297) | | | (99) | | (346) | |
| Adjusted provision (benefit) for income taxes (Non-GAAP) | | | | | | | $ | 1,260 | | | $ | 1,093 | | $ | 515 | |
| | | | | | | | | | | | | |
| Effective income tax rate (GAAP) | | | | | | | 12.6% | | | 9.5% | | 11.1% | |
| Adjusted effective income tax rate (Non-GAAP) | | | | | | | 20.1% | | | 23.9% | | 17.6% | |
| | | | | | | | | | | | | |
| (a) See the Corporate & Other and Other Consolidated Information sections for further information. |
| (b) Includes tax benefits available to offset the tax on gains (losses) on equity securities. |
| (c) Includes related tax valuation allowances. |
| Earnings-per-share amounts are computed independently. As a result, the sum of per-share amounts may not equal the total. |
| We believe that Adjusted earnings* and the Adjusted effective income tax rate* provide management and investors with useful measures to evaluate the performance of the total company and increased period-to-period comparability, as well as a more complete understanding of underlying operating results and trends of established, ongoing operations by excluding items that are not closely related with ongoing operations. We also use Adjusted EPS* as a performance metric at the company level for our performance stock units granted in 2024. |
*Non-GAAP Financial Measure
| | | | | | | | | | | |
| | |
| FREE CASH FLOW (FCF) (NON-GAAP) | 2024 | 2023 | 2022 |
| Cash flows from operating activities (CFOA) (GAAP) | $ | 5,817 | | $ | 4,609 | | $ | 4,027 | |
| Add: gross additions to property, plant and equipment and internal-use software | (1,032) | | (862) | | (662) | |
| Less: separation cash expenditures | (800) | | (820) | | (134) | |
| Less: Corporate & Other restructuring cash expenditures(a) | (504) | | (177) | | (38) | |
| Free cash flow (FCF) (Non-GAAP) | $ | 6,089 | | $ | 4,744 | | $ | 3,538 | |
(a) Included cash payment of $363 million for the final settlement of the Sjunde AP-Fonden shareholder lawsuit for the year ended December 31, 2024. See Note 24 for further information. |
| | | |
| We believe investors may find it useful to compare free cash flow* performance without the effects of separation cash expenditures and Corporate & Other restructuring cash expenditures (associated with the separation-related program announced in the fourth quarter of 2022). We believe this measure will better allow management and investors to evaluate the capacity of our operations to generate free cash flow. We also use FCF* as a performance metric at the company level for our annual executive incentive plan and performance stock units granted in 2024. |
OTHER FINANCIAL DATA.
| | |
| FIVE-YEAR PERFORMANCE GRAPH |
|
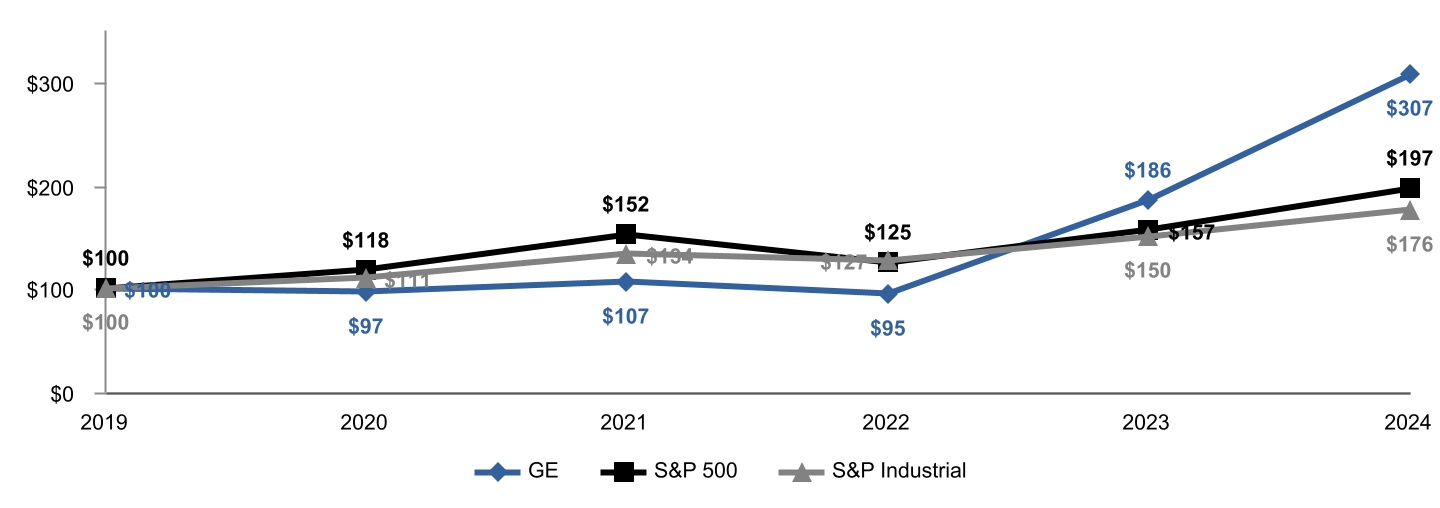
The annual changes for the five-year period shown in the above graph are based on the assumption that $100 had been invested in GE Aerospace common stock, the Standard & Poor’s 500 Stock Index (S&P 500) and the Standard & Poor’s 500 Industrials Stock Index (S&P Industrial) on December 31, 2019, and that all quarterly dividends were reinvested. The cumulative dollar returns shown on the graph represent the value that such investments would have had on December 31 for each year indicated.
With respect to “Market Information,” GE Aerospace common stock is listed on the New York Stock Exchange under the ticker symbol "GE" (its principal market).
As of January 15, 2025, there were approximately 246,000 shareholder accounts of record.
PURCHASES OF EQUITY SECURITIES BY THE ISSUER AND AFFILIATED PURCHASERS. On March 7, 2024, the Company announced that the Board of Directors had provided a new authorization for up to $15 billion of common share repurchases. We repurchased 9,172 thousand shares for $1,669 million during the three months ended December 31, 2024 under this authorization.
| | | | | | | | | | | | | | |
| Period | Total number of shares purchased | Average price paid per share | Total number of shares purchased as part of our share repurchase authorization | Approximate dollar value of shares that may yet be purchased under our share repurchase authorization |
| (Shares in thousands) | | | | |
| | | | |
| 2024 | | | | |
| October | 1,836 | | $ | 183.89 | | 1,836 | | |
| November | 5,411 | | 185.84 | | 5,411 | | |
| December | 1,924 | | 169.48 | | 1,924 | | |
| Total | 9,172 | | $ | 182.02 | | 9,172 | | $ | 10,074 | |
CYBERSECURITY. The description in this section reflects GE Aerospace’s approach as of December 31, 2024, following the spin-off of GE Vernova in April 2024.
CYBERSECURITY RISK MANAGEMENT AND STRATEGY. GE Aerospace has developed and implemented a cybersecurity framework intended to assess, identify and manage risks from threats to the security of our information, systems, products and network using a risk-based approach. The framework is informed in part by the National Institute of Standards and Technology (NIST) Cybersecurity Framework and International Organization for Standardization 27001 (ISO 27001) Framework, although this does not imply that we meet all technical standards, specifications or requirements under the NIST or ISO 27001. We are also guided by applicable cybersecurity rules, regulations and contractual commitments related to our role as a defense contractor, such as auditing by the Defense Contract Management Agency’s Defense Industrial Base Cybersecurity Assessment Center (DIBCAC), the UK Ministry of Defense, and Certified Third Party Assessor Organizations (C3PAO).
Our key cybersecurity processes include the following:
•Risk-based controls for information systems and information on GE Aerospace’s networks: We seek to maintain an information technology infrastructure that implements physical, administrative and technical controls that are calibrated based on risk and designed to protect the confidentiality, integrity and availability of our information systems and information stored on GE Aerospace’s networks, including customer information, personal information, intellectual property and proprietary information.
•Cybersecurity incident response plan and testing: We have a cybersecurity incident response plan and dedicated teams to respond to cybersecurity incidents. When a cybersecurity incident occurs or we identify a vulnerability, we have cross-functional teams that are responsible for leading the initial assessment of priority and severity, and external experts may also be engaged as appropriate. GE Aerospace’s cybersecurity teams assist in responding to incidents depending on severity levels and seek to improve our cybersecurity incident management plan through periodic tabletops or simulations.
•Training: We provide security awareness training to help our employees understand their information protection and cybersecurity responsibilities. We also provide additional role-based training to some employees based on customer requirements, regulatory obligations and industry risks.
•Supplier risk assessments: We have implemented a third-party risk management process that includes expectations regarding information and cybersecurity. That process, among other things, provides for GE Aerospace to perform cybersecurity assessments on certain suppliers based on an assessment of their risk profile and a related rating process. GE Aerospace also seeks contractual commitments from key suppliers to appropriately secure and maintain their information technology systems and protect any GE Aerospace information and network access that is provided to them.
•Third-party assessments of GE Aerospace: We have third-party cybersecurity companies engaged to periodically assess GE Aerospace’s cybersecurity posture, to assist in identifying and remediating risks from cybersecurity threats.
We also consider cybersecurity, along with other top risks for GE Aerospace, within our enterprise risk management framework. The enterprise risk management framework includes internal reporting at the business and enterprise levels, with consideration of key risk indicators, trends and countermeasures for cybersecurity and other types of significant risks. In the last fiscal year, we have not identified risks from known cybersecurity threats, including as a result of any prior cybersecurity incidents, that have materially affected us, including our operations, business strategy, results of operations, cash flow or financial condition. We face certain ongoing risks from cybersecurity threats—including heightened threats in connection with the separation of GE HealthCare and GE Vernova—that, if realized, are reasonably likely to materially affect us, including our operations, business strategy, results of operations, financial condition or cash flows. Refer to the Risk Factors section (Cybersecurity - Increased cybersecurity requirements, vulnerabilities, threats and more sophisticated and targeted computer crime, as well as cybersecurity failures, pose risk to our systems, networks, products, solutions, services and data.) for additional information about these risks.
CYBERSECURITY GOVERNANCE. The Audit Committee of the GE Aerospace Board of Directors is responsible for board-level oversight of cybersecurity risk, and the Audit Committee reports back to the full Board about this and other areas within its responsibility. As part of its oversight role, the Audit Committee receives reporting about GE Aerospace’s practices, programs, notable threats or incidents and other developments related to cybersecurity throughout the year, including through periodic updates from GE Aerospace’s Chief Information Officer (CIO) and Chief Information Security Officer (CISO) on cyber threats and our cybersecurity risk management strategy. The Audit Committee also receives information about cybersecurity risks as part of GE Aerospace’s enterprise risk management framework and reporting.
GE Aerospace’s management team is ultimately responsible for assessing and managing risks from cybersecurity threats, and in this regard, the CIO and CISO lead the Company’s overall cybersecurity function and cybersecurity leadership team. The CIO has over 25 years of experience in the information technology (IT) field and leads the IT strategy and services supporting the Company’s global operation. The CISO has over 25 years of experience focused on global information assurance and cyber security programs. The cybersecurity leadership team meets with senior management to review and discuss GE Aerospace’s cybersecurity program, including emerging cyber risks, threats and industry trends. The cybersecurity leadership team also assists management in supervising efforts to prevent, detect, mitigate, and remediate cybersecurity risks and incidents through various means, including by collaborating with internal security personnel and business stakeholders, and incorporating threat intelligence and other information obtained from governmental, public or private sources to inform our cybersecurity technologies and processes.
RISK FACTORS. The following discussion of the material factors, events and uncertainties that may make an investment in the Company speculative or risky contains “forward-looking statements," as discussed in the Forward-Looking Statements section. These risk factors may be important to understanding any statement in this report or elsewhere. The risks described below should not be considered a complete list of potential risks that we face, and additional risks not currently known to us or that we currently consider immaterial may also negatively impact us. The following information should be read in conjunction with the MD&A section and the consolidated financial statements and related notes. The risks we describe in this report or in our other SEC filings could, in ways we may not be able to accurately predict, recognize or control, have a material adverse effect on our business, reputation, financial position, results of operations, cash flows and stock price, and they could cause our future results to be materially different than we presently anticipate.
STRATEGIC RISKS. Strategic risk relates to the Company’s future business plans and strategies, including the risks associated with the global macro-environment; dynamics in the commercial aviation sector; competitive threats; the demand for our products and services and the success of our investments in technology and innovation; impacts of government spending, programs and contracts; climate change; our recent spin-offs; capital allocation decisions; acquisitions, dispositions, joint ventures and other inorganic investments; intellectual property; and other risks.
Global macro-environment - Our financial performance and growth are subject to risks related to global economic, political and geopolitical developments or other disruptions to the economy or our business sectors. We serve customers in many countries around the world and receive a significant portion of our revenue from outside the United States. Accordingly, our operations and execution are subject to the effects of global economic trends, geopolitical risks and demand or supply shocks from events such as war or international conflict, a major terrorist attack, natural disasters or actual or threatened public health pandemics or other emergencies. Our operations and performance are also affected by local and regional economic environments, supply chain constraints and policies in the U.S. and other markets that we serve, including factors such as inflationary pressures in many markets, interest rates, economic growth rates, the availability of skilled labor, monetary policy, exchange rates, currency volatility, commodity prices and sovereign debt levels. For example, inflationary or other pressures that cause our material or labor costs to increase can adversely affect our profitability and cash flows, particularly when we are unable to increase customer contract values or pricing to offset those pressures. Deterioration of economic conditions or outlooks, such as lower rates of investment, lower economic growth, recession or fears of recession in the U.S., China, Europe or other key markets, may adversely affect the demand for or profitability of our products and services, and the impact from developments outside the U.S. on our business performance can be significant given the extent of our global activities. Increased geopolitical tensions and outbreaks of armed conflict can also adversely impact our business, both directly or by adversely affecting economic activity globally or in particular regions or countries. For example, Russia’s invasion of Ukraine in early 2022 and related political and economic consequences, such as sanctions and other measures imposed by the European Union, the U.S. and other countries and organizations in response, have caused and may continue to cause disruption and instability in global markets, supply chains and industries that negatively impact our business, financial condition, results of operations and cash flows and pose reputational risks. More recently, there is risk of wider conflict in the Middle East that could have significant adverse impacts on the region and business activity in addition to the humanitarian and other consequences of the current conflict. Further, political changes and trends such as populism, protectionism, economic nationalism and sentiment toward multinational companies, as well as tariffs, export controls, restrictions on outbound investment or other trade barriers, sanctions, technical or local content regulations, currency controls or changes to tax or other laws and policies, have been and may continue to be disruptive and costly to our business. These can interfere with our global operating model, supply chain, production costs, customer relationships and competitive position. Escalation of tariffs or any other specific trade tensions, including intensified decoupling between the U.S. and China, or in global trade conflict more broadly could be harmful to global economic growth or to our business in or with China or other countries. In addition, market uncertainty and volatility in various geographies may be magnified as a result of potential shifts in U.S. and foreign trade, economic and other policies following the recent U.S. elections. We also do business in emerging market jurisdictions where economic, political and legal risks are heightened and the operating environments are complex.
Commercial aviation sector - Our financial performance is dependent on the condition of the commercial aviation sector and our partners, suppliers and customers in that sector. A substantial portion of our business is directly tied to economic conditions in the commercial aviation sector, which has historically been cyclical in nature. Capital spending and demand for aircraft engines, aviation products and aftermarket parts and services by commercial airlines, lessors, other aircraft owners or operators and airframers are influenced by a wide variety of factors, including current and predicted traffic levels, passenger and cargo load factors, aircraft fuel prices, labor costs and other issues, airline consolidation, bankruptcies and restructuring activities, competition, the retirement of older aircraft, changes in production schedules, production capabilities and capacities of airframers, regulatory oversight and changes, environmental regulations, terrorism and related security concerns, aircraft safety incidents, general economic conditions, tightening of credit in financial markets, corporate profitability, cost reduction efforts and remaining performance obligations levels. Any of these factors could have a negative impact on new orders or on our agreements for the sale of our products and services given the long-term nature of those arrangements and could reduce our sales and profit margins. Other factors, including future terrorist actions, aviation safety concerns, public health crises or major natural disasters, could also dramatically reduce the demand for commercial air travel, which could negatively impact our sales and profit margins. Supply chain capacity shortfalls and disruptions, including for new parts and services, continue to pose challenges and risks for our business as well as other industry participants. Developments that reduce the flying public’s demand for travel could adversely affect future growth in commercial air traffic capacity and the demand for or profitability of our products and services. Additionally, because a substantial portion of product deliveries to commercial aviation customers are scheduled for delivery in the future, changes in economic conditions can cause customers to request that orders be rescheduled or canceled. Spare parts sales and aftermarket service trends are affected by similar factors, including usage, pricing, technological improvements, regulatory changes and the retirement of older aircraft. Furthermore, because of the lengthy research and development cycle involved in bringing new engine platforms and other products to market, we cannot predict the economic conditions that will exist
when any new product is ready to enter into service. We also have dependencies on our suppliers and partners for commercial engine programs to develop, manufacture and service their share of an engine, and on the major airframers that we supply to timely and successfully develop, certify and commercialize aircraft that utilize our engines as well as to successfully sell those aircraft against aircraft powered by our competitors. A reduction in spending in the commercial aviation sector, or challenges for key industry participants, could have a significant effect on the demand for our products and services, which could have a material adverse effect on our competitive position, results of operations, financial condition or cash flows.
Competitive environment - We are dependent on the maintenance of existing product lines and service relationships, acceptance by our customers of new product and service introductions, competitive pricing and other terms, and technology and innovation leadership for revenue and earnings growth. The segments in which we operate are highly competitive in terms of pricing, product and service quality, product development and entry into service, product durability, customer service, financing terms, the ability to respond to shifts in market demand and the ability to attract and retain skilled talent. Our long-term operating results and competitive position also depend substantially upon our ability to continue to improve or upgrade current products and services, to maintain long-term customer relationships and to increase our productivity over time as we perform on long-term service agreements, as well as our ability to develop, introduce, and market new and innovative technology, products, services and platforms, such as the RISE program suite of technologies. In addition, the research and development cycle involved in bringing new products to market is often lengthy, it is inherently difficult to predict the economic conditions or competitive dynamics that will exist when any new product is complete, and our investments, to the extent they result in bringing a product to market, may generate weaker returns than we anticipated at the outset. Our capacity to invest in research and development efforts to advance our technologies, products and services also depends on the financial resources that we have available for such investment relative to other capital allocation priorities. Under-investment in research and development, or investment in technologies that prove to be less competitive in the future (at the expense of alternative investment opportunities not pursued), could lead to loss of sales of our products or services in the future due to the long product development cycles in our business. The amounts that we do invest in research and development efforts may not lead to the development of new technologies or products on a timely basis or meet the needs of our customers as fully as competitive offerings, and we may face impairment charges for contract fulfillment costs that are capitalized as nonrecurring engineering costs if we determine recovery of the costs is not probable (see Note 1).
Our business is also subject to technological change and advances, such as growth in industrial automation and increased digitization of the operations, infrastructure and solutions that customers demand. In addition, our use of emerging and evolving technologies such as artificial intelligence and machine learning, which we expect to increase over time, presents business, reputational, legal and compliance risks related to data sourcing, design flaws, integration issues, security threats, privacy protections and the ability to develop sufficient protection measures. Artificial intelligence technologies have rapidly developed and our business may be adversely affected if we cannot successfully integrate these technologies into our business processes and product and service offerings in a timely, cost-effective, compliant and responsible manner. The introduction of innovative and disruptive technologies in the segments in which we operate also poses risks in the form of new competitors, market consolidation, substitutions of existing products, services or solutions, niche players, new business models and competitors that are faster to market with new or more cost-effective products or services. Existing and new competitors offer parts or services for our installed base, and if the customers that purchase our products and services select our competitors or we otherwise fail to maintain or renew service relationships, this can erode our revenue and profitability.
Government programs and contracts - Our defense business is subject to risks from changes in government spending that can adversely affect our business strategy or financial performance, in addition to risks related to regulations and compliance with government contracts. Our defense business is heavily influenced by the spending and policy actions of the U.S. federal government, as well as allied governments that rely on U.S. suppliers to provide products and services important to their national defense. Changes in U.S. or other government defense spending, including as a result of potential changes in policy or budgetary positions or priorities, in connection with the recent U.S. elections or otherwise, can negatively impact the results and growth prospects of our defense business. U.S. defense spending levels are difficult to predict and may be impacted by numerous factors such as the evolving nature of the national security threat environment, U.S. national security strategy, U.S. foreign policy, the domestic political environment, macroeconomic conditions and the ability of the U.S. government to enact relevant legislation such as authorization and appropriations bills. Changes in government priorities and funding related to the future of combat, such as greater reliance on uncrewed aircraft systems, could also adversely affect the demand for our defense products and services. In addition, government customers often may modify, curtail or terminate their contracts and subcontracts with us either at their convenience or for default based on performance. The termination of one or more of our government contracts, or the occurrence of performance delays, cost overruns (due to inflation or otherwise), product failures, shortages in materials, components or labor, or other failures to perform to customer expectations and contract requirements could negatively impact our reputation, competitive position and financial results. In addition, our government contracts are subject to extensive procurement regulations, and new regulations or changes to existing requirements could increase our compliance costs. We are also subject to U.S. and other government inquiries and investigations, including periodic audits of our quality systems, manufacturing operations, and costs that we determine are allowable or reimbursable under government contracts. Failure to comply with provisions of our government contracts or other applicable laws and regulations could lead to civil or criminal enforcement under the U.S. False Claims Act or similar enforcement legislation, including potentially significant financial penalties, suspension or debarment against new business and reputational harm.
Climate change - Our business and financial performance may be adversely affected by climate change impacts, including changes in regulations, customer demand, technologies and extreme weather. Our business may be impacted by climate change and governmental and industry actions taken in response, which present a variety of risks to our business and financial results. Changes in environmental and climate-related laws or regulations, including regulations on greenhouse gas emissions caps, carbon
pricing and taxes, energy taxes, product fuel efficiency standards, mandatory disclosure obligations, including U.S. government procurement-related contractual climate disclosures, could increase our operational and compliance expenditures and those of our customers and suppliers, including increased energy and raw materials costs and costs associated with manufacturing changes, and could require new or additional investments in product designs and facility upgrades. In addition, we face, along with others across the aerospace and defense sector, increasing demand for transitioning to lower emission technologies, including low to no carbon products and services, the use of alternative energy sources and other sustainable aviation technologies and climate adaptation products and services. Customers, regulators, institutional investors, the flying public and other stakeholders also continue to focus on environmental, social and governance issues, including our environmental sustainability practices and commitments with respect to our operations, products and suppliers. We anticipate that over time we will make additional investments in new technologies and capabilities and devote additional management and other resources in connection with these dynamics.
The achievement of aerospace and defense sector climate goals over the coming decades is likely to depend in part on technologies that are not yet developed, deployed or widely adopted today. For example, emissions reduction over time will likely require a combination of changes such as continued technological innovation in the fuel efficiency of engines, expanded use of low carbon fuels and the development of electric flight and hydrogen-based aviation technologies. The risk of insufficient availability, or higher cost, of low carbon fuels (such as sustainable aviation fuels or hydrogen) may compromise the pace and degree of emissions reduction. Our success in advancing climate objectives will depend in part on the actions of governments, regulators and other market participants to invest in infrastructure, create appropriate market incentives and to otherwise support the development of new technologies. The process of developing new high-technology products and enhancing existing products to mitigate climate change impacts is often complex, costly and uncertain, and we may pursue strategies or make investments that do not prove to be commercially successful in the time frames expected or at all. Moreover, we rely on our suppliers to adapt and meet our evolving technological supply needs, and they may be unable to fully respond to our requirements in a timely manner or at all. We also face risks as our competitors respond to advancing low-emissions technologies. Our competitors may develop these in-demand technologies before we do, their new technologies may be deemed by our customers to be superior to technologies we may develop, and their technologies may otherwise gain industry acceptance in advance of or instead of our products. In addition, as we and our competitors develop increasingly low-emissions technologies, demand for our older offerings may decrease or become nonexistent. Our reputation may also be damaged if we or others in our sector fail, or are perceived to fail, to achieve climate goals or commitments or to comply with evolving climate-related regulations. In addition, climate-related litigation and government investigations could be commenced against us, could be costly to defend and could adversely affect our business. Furthermore, our business, the businesses of our partners, suppliers, subcontractors, service providers, distributors and customers and our sector could be negatively impacted by increasing frequency and severity of acute extreme weather events caused by climate change, including hurricanes, tornadoes, floods, snow and ice storms, fires, heat waves and mud slides, and by chronic changes in weather patterns, such as temperature increases, drought and sea level rise. These events could damage our and our suppliers’ facilities, products and other assets, and cause disruptions to our business and operations, supply chain and distribution networks, and the businesses of our customers, and could require an increase in expenditures to improve climate resiliency of our operations. Any of the foregoing could materially decrease our revenue and materially increase our costs and expenses.
Inorganic investments - Our success in meeting strategic, operational and financial objectives can depend on our performance in evaluating and executing on acquisitions, integrations, dispositions, joint ventures and other inorganic investments. With respect to acquisitions and business integrations, dispositions, separations, joint ventures and other inorganic investments, we may not complete announced transactions on a timely basis or at all, including as a result of regulatory approvals, achieve expected returns, financial or operational synergies or other benefits on a timely basis or at all as a result of changes in strategy, integration challenges, investment risk or other factors. Acquisitions may require us to use more financial, operational and other resources on integration and implementation activities than we expect, and we may not be able to successfully integrate the businesses or assets acquired into our existing operations or realize the expected economic or operational benefits of the acquisition. Further, acquired businesses may present risks and unforeseen difficulties that can arise in integrating operations and systems and in retaining and assimilating employees. Declines in the value of equity interests or other assets that we sell can diminish the cash proceeds that we realize, and our ability and timing to sell can depend on market conditions, the liquidity of the relevant asset or other restrictions. We may dispose of businesses or assets at a price or on terms that are less favorable than we had anticipated, or with purchase price adjustments or the exclusion of assets or liabilities that must be divested, managed or run off separately. Dispositions or other business separations also often involve continued financial or operational involvement in the divested business, such as through continuing equity ownership, retained assets or liabilities, transition services agreements, commercial agreements, guarantees, indemnities or other current or contingent financial or operational obligations or liabilities. Under these arrangements, performance by the divested businesses or other conditions outside our control could materially affect our future financial results. Evaluating or executing on all types of potential or planned portfolio transactions can divert senior management time and resources from other pursuits. We also participate in a number of joint ventures with other companies or government enterprises in various markets around the world, including joint ventures where we have a lesser or minimal degree of control over the business operations, which expose us to additional operational, financial, reputational, legal or compliance risks. Furthermore, as our and our joint venture partners’ strategies change or general conditions involving a joint venture and its intended purposes evolve, we may not be able to exit or wind down any unfavorable joint ventures on acceptable terms, without financial or other concessions to our joint venture partners or at all.
Recent spin-offs - The completed GE HealthCare and GE Vernova separations entail certain risks and potential liabilities, including the risk that one or both is determined to be a taxable transaction. The GE HealthCare and GE Vernova separations were effected through spin-offs that were intended to be tax-free for the Company and its shareholders for U.S. federal income tax purposes. If either of the GE HealthCare or GE Vernova separation transactions were ultimately determined to be taxable, the Company would incur a significant tax liability, and the distributions to the Company’s shareholders would become taxable and the new
independent companies might incur income tax liabilities. In addition, the Company may not achieve the anticipated benefits of the GE Vernova and GE HealthCare separations and may be exposed to additional risks, including potential liabilities pursuant to agreements entered into in connection with the spin-offs, the credit support provided to GE Vernova (see the Other Items – GE Vernova Parent Company Guarantees section within MD&A) and the various restructuring and business transformation actions that have brought changes across the Company’s organizational structure, senior leadership, functional alignment, outsourcing and other areas. Any of these risks could result in a material adverse effect on the Company’s business, reputation, results of operations, financial condition and cash flows.
Intellectual property - Our intellectual property portfolio may not prevent others from independently developing products and services comparable or competitive to ours, and we may be negatively impacted by intellectual property enforcement or external dependencies. Our patents and other intellectual property may not prevent others from independently developing or selling products and services comparable or competitive to ours, and there can be no assurance that the resources invested by us to protect our intellectual property will be sufficient to adequately deter infringement, misappropriation or other improper use of our technology, particularly in certain markets outside the U.S. where strong intellectual property protection mechanisms are lacking. Trademark licenses of the GE brand in connection with dispositions, including in connection with the separations of GE HealthCare and GE Vernova into independent companies, may negatively impact the overall value of the brand in the future. We also face potential competition in countries where we have not invested in a patent portfolio. If we are not able to protect our intellectual property, the value of our brand and other intangible assets may be diminished, and our business may be adversely affected. We also face attempts, both internally from insider threats and externally from cyber-attacks, to gain unauthorized access to our IT systems or products for the purpose of improperly acquiring our trade secrets or confidential business information. In addition, we have observed an increase in the use of social engineering tactics by bad actors attempting to access systems storing certain of our trade secrets and other confidential business information. The theft or unauthorized use or publication of our trade secrets or other confidential business information as a result of such incidents could adversely affect our competitive position and the value of certain of our investments in research and development. In addition, we are subject to the enforcement of patents and other apparent intellectual property rights by third parties, including aggressive and opportunistic enforcement claims by non-practicing entities. Regardless of their merit, responding to such claims can be expensive and time-consuming. We also may be found to infringe third-party rights, which could result in us being enjoined from offering some of our products and services or bringing to market new products and services, and require us to pay substantial damages. The value of, or our ability to use, our intellectual property may also be negatively impacted by dependencies on third parties, such as our ability to obtain or renew on reasonable terms, or at all, licenses that we need in the future, or our ability to secure or retain ownership or rights to use data in certain software analytics or services offerings.
OPERATIONAL RISKS. Operational risk relates to risks arising from systems, processes, people and external events that affect the operation of our business. It includes risks related to product safety, quality and performance; supply chain and business disruption; operational execution across product and service life cycles; and information management and data protection and security, including cybersecurity.
Product safety and quality - Our products and services are highly sophisticated and specialized, and a major failure or quality issue affecting our products or third-party products with which our products are integrated can adversely affect our business, reputation, financial position, results of operations and cash flows. We produce highly sophisticated products, including commercial and defense aircraft engines, integrated engine components and electric power and aircraft systems, and we provide specialized services for products that incorporate or use complex or leading-edge technology, including both hardware and software. Accordingly, the adverse impact of product quality issues can be significant. Actual or perceived design, production, performance, durability or other quality issues related to new product introductions or existing product lines can result in reputational harm to our business, in addition to the potential need for increased inspections and shop visits, and direct warranty, maintenance and other costs that may arise. In addition, a catastrophic product failure or similar event resulting in injuries or death, a fleet grounding or similar systemic consequences could have a material adverse effect on our business, reputation, financial position, cash flows and results of operations. Even when there have not been significant or widespread product failures in the field, many of our products and services must function under demanding operating conditions and meet exacting and evolving certification, performance, reliability and durability standards that we, our customers or regulators adopt. Developing and maintaining products that meet or exceed these standards can be costly and technologically challenging, and may also involve extensive coordination of suppliers and highly skilled labor from thousands of workers; a failure to deliver products and services that meet these standards could have significant adverse financial, competitive or reputational effects. Technical, mechanical and other failures occur from time to time, whether as a result of human factors, manufacturing or design defects, or operational process or production issues attributable to us, our customers, suppliers, third-party integrators or others.
In some circumstances we have also incurred, and in the future we may incur, increased costs, delayed payments or lost equipment or services revenue in connection with a significant issue with a third-party product with which our products are integrated, or if parts or other components that we incorporate in our products have defects or other quality issues. For example, a prolonged aircraft grounding, certification or production delays or other adverse developments with aircraft powered by our engines can pose risks to our business. There can be no assurance that the operational processes around sourcing, product design, manufacture, performance and servicing that we or our customers or other third parties have designed to meet rigorous regulatory and quality standards will be sufficient to prevent us or our customers or other third parties from experiencing operational process or product failures and other problems, including through human factors, manufacturing or design defects, process or other failures of contractors or third-party suppliers, cyber-attacks or other intentional acts, software vulnerabilities or malicious software, that could result in potential product, safety, quality, regulatory or environmental risks.
Supply chain - Significant input shortages, supplier capacity constraints, supplier or customer production disruptions, supplier quality and sourcing issues or price increases have increased, and may continue to increase, our operating costs and can adversely impact the competitive positions of our products. Our reliance on third-party suppliers, partners, contract manufacturers and service providers and on commodity markets to secure raw materials, parts, components and sub-systems used in our products exposes us to volatility in the prices and availability of these materials, parts, components, systems and services. As our supply chains are complex and extend into many different countries and regions around the world, we are also subject to global economic and geopolitical dynamics and risks associated with exporting components manufactured in particular countries for incorporation into finished products completed in other countries. We operate in a supply-constrained environment and are facing, and may continue to face, supply-chain shortages, inflationary pressures, shortages of skilled labor, transportation and logistics challenges and manufacturing disruptions that impact our revenue, profitability and timeliness in fulfilling customer orders. We anticipate supply chain pressures across our business will continue to challenge and adversely affect our operations and financial performance for some period of time. For example, successfully executing the significant production and delivery ramp efforts in connection with the growth of newer engine platforms such as the LEAP depends in part on our suppliers having access to the materials, skilled labor and production capacity they require and making timely deliveries to us, as well as meeting the required safety, quality and performance standards for commercial and military aviation. In addition, some of our suppliers or their sub-suppliers are limited- or sole-source suppliers, and our ability to meet our obligations to customers depends on the performance, product quality, continued product availability and stability of such suppliers. We also have dependencies on certain key internal manufacturing or other facilities. Disruptions in deliveries, capacity constraints, production disruptions up- or down-stream, price increases, or decreased availability of raw materials or commodities, including as a result of war, natural disasters (including the effects of climate change such as sea level rise, drought, flooding, wildfires and more intense weather events), actual or threatened public health pandemics or emergencies, governmental, legislative or regulatory actions, or other business continuity events, adversely affect our operations and, depending on the length and severity of the disruption, can limit our ability to meet our commitments to customers or significantly impact our operating profit or cash flows. Further, a prolonged disruption at a significant supplier or discontinuation of an important material, part, component or system can require us to identify and qualify a new supplier or develop other manufacturing or production alternatives; this can require substantial time to implement, particularly if it involves new regulatory certifications, and can lead to costs or delays that adversely impact our production timelines, fulfillment of customer contracts, revenue, profitability, cash flows and reputation. Quality, capability, compliance and sourcing issues experienced by third-party providers can also adversely affect our costs, profitability and the quality and effectiveness of our products and services and result in liability and reputational harm. The harm to us could be significant if, for example, a quality issue at a supplier or with components that we integrate into our products results in a widespread quality issue across one of our product lines or our installed base of equipment. In addition, our suppliers may experience cyber-related attacks, which could negatively impact their ability to meet their delivery obligations to us and in turn have an adverse effect on our ability to meet our commitments to customers.
Operational execution - Operational challenges could have a material adverse effect on our business, reputation, financial position, results of operations and cash flows. Our financial results depend on the successful execution of our business plans and commercial arrangements across all steps of the product and service life cycle. We seek to improve our operations and execution on an ongoing basis, and our ability to make the desired improvements is an important factor in our profitability and overall financial performance. For example, we often enter into long-term service agreements in connection with significant contracts for the sale of our products and services (see Note 1). In connection with these agreements, we must accurately estimate our costs associated with delivering the products, product durability and reliability, and the provision of services over time in order to be competitive and profitable and to generate acceptable returns on our investments. A failure to appropriately estimate, plan for or execute our business plans may adversely affect our delivery of products and services in line with our projected financial performance or cost estimates, and ultimately may result in excess costs, build-up of inventory that becomes obsolete, lower profit margins and an erosion of our competitive position. We also face operational risks in connection with launching or ramping newer product platforms, such as the LEAP or GE9X engines. Particularly with newer product platforms and technologies, we seek to reduce the costs of these products over time through experience and other measures, including the introduction of new designs, technologies, manufacturing methods and suppliers. Risks related to engineering, our supply chain, the availability of skilled labor, product quality, product durability, the cost of producing complex materials or components, regulatory approvals, timely delivery or other aspects of operational execution can adversely affect our ability to achieve those cost reductions and to meet contract obligations and customers’ expectations, as well as our business plan objectives. A strike or other labor disruption could also adversely affect our production, delivery, financial performance and reputation, and we are due in 2025 to renegotiate expiring labor union contracts. In addition, many of our customer contracts are complex and contain provisions that could cause us to incur penalties, be liable for liquidated or actual damages and incur unanticipated expenses with respect to the timely delivery, functionality, deployment, operation and durability of our products, solutions and services. Operational failures that result in product safety or quality problems or potential environmental, health or other risks could have a material adverse effect on our business, reputation, financial position, cash flows and results of operations.
Cybersecurity - Increased cybersecurity requirements, vulnerabilities, threats and more sophisticated and targeted attacks, as well as failures, pose risk to our and many critical third parties' systems, networks, products, solutions, services and data. Increased global cybersecurity requirements, vulnerabilities, threats, computer viruses and more sophisticated and targeted cyber-related attacks such as ransomware, as well as cybersecurity failures resulting from human or technological errors, pose risk to the security of our and our customers', partners', suppliers' and third-party service providers' infrastructure, products, systems and networks and the confidentiality, availability and integrity of GE Aerospace and customers' data, as well as associated financial and reputational risks. The perpetrators of such attacks include sophisticated malicious actors, including states and state-affiliated actors targeting critical infrastructure. The risks in this area continue to grow, and we expect cyberattacks will continue to accelerate on a global basis in frequency and impact as threat actors increasingly use artificial intelligence and other techniques to circumvent security controls, evade detection and remove forensic evidence. As a result, there can be no assurance that our cybersecurity risk management processes,
including our policies and controls, will be effective in promptly or effectively detecting, containing or remediating cybersecurity attacks, which may result in material harm to our systems, information or business.
We have experienced, and expect to continue to experience, cyberattacks of varying degrees of sophistication and various cybersecurity incidents, such as distributed denial of service attacks and phishing attacks. It may take considerable time for us to investigate and evaluate the full impact of incidents, particularly for sophisticated attacks. This may inhibit our ability to provide prompt, full and reliable information about the incident to our customers, suppliers, regulators and the public. A significant cyber-related attack against us, a key third-party system or a network that we use, or in our sector, such as an attack on commercial aircraft (even if such an attack does not involve our products, services or systems), could adversely affect our business. The large number of suppliers that we work with requires significant effort for the initial and ongoing verification of the effective implementation of cybersecurity requirements by suppliers. The increasing degree of interconnectedness that we have with our partners, suppliers and customers also poses a risk to the security of our network as well as the larger ecosystem in which we operate. Our risk mitigation efforts may fail to prevent, detect and limit the impact of cyber-related attacks, and we remain vulnerable to known and unknown cybersecurity threats.
The continued adoption of new technologies across our business and by our suppliers, including emerging technologies, system migrations and network transitions, also increases our exposure to cybersecurity threats. Any unknown vulnerability or compromise in our or a third-party product (for example, open source software) exposes our systems, networks, software or connected products to malicious actors that seek to misuse our products, steal intellectual property, misappropriate sensitive, confidential or personal data, or create safety risks or unavailability of equipment. In addition, given the nature of complex systems, software and services like ours, and the scanning tools that we deploy in relation to our networks, infrastructure and products, we regularly identify and track security vulnerabilities. We are not always able to comprehensively apply patches or mitigating measures or ensure that patches are applied before vulnerabilities can be exploited. We also have access to sensitive, classified, confidential or personal data or information that is subject to privacy and security laws, regulations or customer-imposed controls. We are vulnerable to security breaches, theft, misplaced, lost or corrupted data, programming errors and misconfigurations, employee errors (including as a result of social engineering/phishing) and/or malfeasance (including misappropriation by insiders or departing employees) that may compromise sensitive, classified, confidential or personal data or information, improper use of our systems, software solutions or networks, unauthorized access, use, disclosure, modification or destruction of or denial of access to information, defective products, production downtimes and operational disruptions. In addition, a cybersecurity incident that impacts our partners, suppliers or customers could compromise our systems and impact our intellectual property, personal data or other confidential information, or result in production downtimes and operational disruptions that could cause us to breach our commitments to customers. Any security vulnerability or malicious software in a product used by a partner or supplier to deliver a service or embedded in a product that is later integrated into a GE Aerospace product could lead to a vulnerability in the security of GE Aerospace’s product or, if used internally in our network environment, to a compromise of the GE Aerospace network, which may lead to the loss of information or operational disruptions.
Cybersecurity-related and data privacy and protection laws and regulatory regimes are evolving, can vary significantly by country and present increasing compliance challenges, and we from time to time receive, and in the future will likely receive, regulatory inquiries about specific incidents or aspects of our cybersecurity framework; these dynamics increase our costs, affect our competitiveness and can expose us to fines or other penalties and reputational risks. In addition, cybersecurity incidents can result in other negative consequences, regardless of whether the direct effects of an incident are significant, including damage to our reputation or competitiveness, restoration and remediation costs, increased digital infrastructure or related costs that are not covered by insurance, and costs or fines arising from litigation or regulatory investigations or actions. While we carry cyber insurance, we cannot be certain that our coverage will be adequate for liabilities actually incurred, that insurance will continue to be available to us on economically reasonable terms, or at all, or that any insurer will not deny coverage as to any future claim.
FINANCIAL RISKS. Financial risk relates to our ability to meet financial goals and obligations and mitigate exposure to broad market risks. In addition to the risks to financial performance that most of the items described throughout our risk factors pose, financial risks include credit risk; funding and liquidity risks; and volatility in foreign currency exchange rates, interest rates and commodity prices. We also face financial risks associated with our run-off insurance and banking operations. Credit risk is the risk of financial loss arising from a customer or counterparty failure to meet its contractual obligations. Liquidity risk refers to the potential inability to meet contractual or contingent financial obligations (whether on- or off-balance sheet) as they arise, and could potentially impact our financial condition, cash flow or overall safety and soundness.
Customers and counterparties - Global economic, industry-specific or other developments that weaken the financial condition, soundness or continuity of significant customers, governments, government programs or other parties we deal with can adversely affect our business, results of operations and cash flows. Our business and operating results have been, and will continue to be, affected by worldwide economic conditions, including conditions in the aerospace and defense sector. Activity in our sector is also particularly influenced by the actions of a small group of large original equipment manufacturers, as well as large airlines in various geographies. We have significant business with, and credit exposure to, some of our largest customers and accordingly our performance can be adversely affected by challenges that individual customers or the industry faces related to factors such as competition, regulatory oversight and certifications, the need for cost reduction, financial stability and soundness, supply chain or labor shortages or disruptions, the cost of jet fuel, the availability of aircraft leasing and financing alternatives, interest rates, the retirement of older aircraft and other dynamics affecting the original equipment and aftermarket service markets, or by a significant disruption of air travel demand. Further, changes in the relative value of various national currencies (especially the reduction in the valuation of a home currency against the value of currencies used to purchase and maintain aircraft and aircraft engines) may impact our customers and other industry participants. Existing or potential customers may delay or cancel plans to purchase our products and services and may not be able to fulfill their obligations to us in a timely fashion or at all as a result of business deterioration, cash flow shortages or difficulty obtaining funding or due to macroeconomic conditions, geopolitical disruptions, changes in law or other challenges that they
face. The airline industry has historically been highly cyclical, and sustained economic growth and political stability in both developed and emerging markets are principal factors underlying long-term air traffic growth; the current macroeconomic and geopolitical environment and the potential for recession or armed conflict pose risks to the rate of that growth. A potential future disruption in connection with a terrorist incident, war, cyberattack, actual or threatened public health pandemic or emergency or recessionary economic environment that results in the loss of business and leisure traffic could also adversely affect our customers, their ability to fulfill their obligations to us in a timely fashion or at all, demand for our products and services and the viability of a customer’s business. (See also Risk Factors - Commercial aviation sector.) In addition, our customers include governmental entities within and outside the U.S., including the U.S. federal government. Sustained and increased funding from government customers supports research, new product development, production and aftermarket business for our defense business, and a variety of domestic and international political, macroeconomic and geopolitical factors, including recession, can materially affect our customers’ ability to secure budget support and fund these activities year after year. We also at times face greater challenges collecting on receivables with customers that are sovereign governments or located in emerging markets. If there is significant deterioration in the global economy, in our sector, in financial markets or with particular significant counterparties, our results of operations, financial position and cash flows could be materially adversely affected.
Run-off insurance and banking operations - We continue to have exposure to our run-off insurance operations and Bank BPH mortgage portfolio in Poland. While in recent years we have greatly reduced the scope of GE's former financial services operations, we continue to retain significant exposure to legacy insurance and other financial services operations that will run off over a long period of time and, in the event of future adverse developments, could cause funding or liquidity stress. For example, it is possible that results of our statutory testing of insurance reserves in future years will require additional capital contributions to our insurance subsidiaries, even after the capital contribution made in the first quarter of 2024 that completed the contributions in connection with the statutory permitted practice approved in 2018 by the Kansas Insurance Department (KID). Our statutory testing of insurance reserves is subject to a variety of assumptions, including assumptions about the discount rate (which is sensitive to changes in market interest rates), morbidity, mortality and future long-term care premium increases. Future adverse changes to these assumptions (to the extent not offset by any favorable changes to these assumptions) could result in an increase to future policy benefit reserves and, potentially, to the amount of capital we are required to contribute to our insurance subsidiaries (as discussed in the Other Items - Insurance section within the MD&A). In addition, we have exposure to various financial counterparties that pose credit and other risks in the event of insolvency or other default. For example, a portion of our run-off insurance operations’ assets are held in trust accounts associated with reinsurance contracts. For our UFLIC subsidiary, such trust assets are currently held in trusts for the benefit of insurance company subsidiaries of Genworth, which has stated in the past that it will not bolster the capital position of its insurance subsidiaries. Solvency or other concerns about Genworth or its insurance company subsidiaries may cause those subsidiaries or their regulators to take or attempt to take actions that could adversely affect UFLIC, including control over assets in the relevant trusts. It is also possible that additional contingent liabilities and loss estimates for Bank BPH, in connection with the ongoing litigation in Poland related to its portfolio of residential mortgage loans denominated in or indexed to foreign currencies (see Note 24), will need to be recognized (or loss estimates may increase in the future) and will require additional capital contributions. Regulatory requirements and agreements with respect to our run-off insurance operations and Bank BPH require us to maintain adequate levels of capital and could require additional infusion of capital if the required levels are not maintained. Though we may consider strategic options to accelerate the further reduction in the size of these remaining financial services operations, such options may not be viable or attractive because of the associated cash payments, financial charges or other adverse effects. There can be no assurance that future liabilities, losses or impairments to the carrying value of assets within our financial services operations would not materially and adversely affect our business, financial position, cash flows or results of operations.
Borrowings & liquidity - We may face risks related to the refinancing of our debt, particularly in severely adverse market conditions, and future credit downgrades could adversely affect our liquidity, funding costs and related margins. We intend to maintain a sustainable investment-grade long-term credit rating, but there can be no assurance that we will not face future credit rating downgrades as a result of factors such as a change in business strategy or performance, or changes in rating application or methodology. Future downgrades could adversely affect our cost of funds, liquidity and competitive position, and external conditions in the financial and credit markets may limit our availability to refinance our debt at particular times or on commercially reasonable terms. In addition, if we are unable to generate cash flows in accordance with our plans or face unforeseen needs for capital, we may adopt changes to our capital allocation plans (such as plans related to the timing or amounts of investments or capital expenditures, share repurchases or dividends) or take other actions. Further, our pension and other post-retirement benefit obligations are exposed to economic factors, such as changes in interest rates, investment performance of plan assets, and health care costs, which could adversely impact our leverage and liquidity. For additional discussion about our credit ratings, financial conditions and related considerations, refer to the Capital Resources and Liquidity section within MD&A. For discussion regarding how our financial statements have been and can be affected by our pension and healthcare benefit obligations, see Note 13.
LEGAL AND COMPLIANCE RISKS. Legal and compliance risk relates to risks arising from the government and regulatory environment, legal proceedings and compliance with integrity policies and procedures, including matters relating to financial reporting and the environment, health and safety. Government and regulatory risk includes the risk that government or regulatory actions will impose additional cost on us or require us to make adverse changes to our business models or practices.
Regulatory - We are subject to a wide variety of laws, regulations and government policies that require ongoing compliance efforts and may change in significant ways. Our business is subject to regulation under a wide variety of U.S. federal and state and non-U.S. laws, regulations and policies that require ongoing compliance efforts. There can be no assurance that laws, regulations and policies will not be changed or interpreted or enforced in ways that will require us to modify our business models and objectives or affect our returns on investments by restricting existing activities and products, subjecting them to escalating costs or prohibiting them
outright. In particular, recent trends globally toward increased protectionism, import and export controls, required licenses or authorizations to engage in business with certain countries or entities, the use of tariffs, restrictions on outbound investment and other trade barriers can result in actions by governments around the world that have been and may continue to be disruptive and costly to our business, and can interfere with our global operating model and weaken our competitive position. In addition, changes in environmental and climate change laws, regulations or policies (including emissions pricing and taxes, emissions standards or sustainable finance, among others) affecting the aerospace and defense sector could lead to additional costs or compliance requirements, a need for additional investment in product designs, require carbon offset investments or otherwise negatively impact our business or competitive position. Other legislative and regulatory areas of significance for our business that U.S. and non-U.S. governments have focused and continue to focus on include cybersecurity, data privacy and sovereignty, artificial intelligence, anti-corruption, competition law, public procurement law, compliance with complex trade controls and economic sanctions laws, technical regulations or local content requirements that could result in market access criteria that our products cannot or do not meet, restrictions related to per- and polyfluoroalkyl substances (PFAS), foreign exchange intervention in response to currency volatility and currency controls that could restrict the movement of liquidity from particular jurisdictions. Potential changes to tax laws, including changes to taxation of global income, may have an effect on our subsidiaries’ structure, operations, sales, liquidity, cash flows, capital requirements, effective tax rate and performance. For example, legislative or regulatory measures by U.S. federal, state or non-U.S. governments, or rules, interpretations or audits under new or existing tax laws such as global minimum taxes or other changes to the treatment of global income, could increase our cash tax costs and effective tax rate. Regulation or government scrutiny may impact the requirements for marketing our products and slow our ability to introduce new products, resulting in an adverse impact on our business. Furthermore, we make sales to U.S. and non-U.S. governments and other public sector customers, and we participate in various governmental financing programs, that require us to comply with strict governmental regulations. As a U.S. government contractor, we are also subject to risks relating to U.S. government audits and investigations that in the past have led, and in the future may lead, to cash withholds, fines, damages or other penalties under civil or criminal laws. Inability to comply with applicable regulations could adversely affect our status with government customers or our ability to participate in projects and could have collateral consequences such as suspension or debarment. Suspension or debarment, depending on the entity involved and length of time, can limit our ability to bid for new U.S. government contracts or business with other government-related customers, and this could adversely affect our results of operations, financial position and cash flows.
Legal proceedings - We are subject to a variety of legal proceedings, disputes, investigations and legal compliance risks, including contingent liabilities from businesses that we have exited or are inactive. We are subject to a variety of legal proceedings, commercial disputes, legal compliance risks and environmental, health and safety compliance risks in virtually every part of the world. We, our representatives and our industry are subject to continuing scrutiny by regulators, other governmental authorities and private sector entities or individuals in the U.S., the European Union and other jurisdictions, which have led or may, in certain circumstances, lead to enforcement actions, adverse changes to our business practices, fines and penalties, required remedial actions such as contaminated site clean-up or other environmental claims, or the assertion of private litigation claims and damages that could be material. For example, we remain subject to shareholder lawsuits related to the Company’s financial performance, accounting and disclosure practices and related legacy matters from several years ago. These types of proceedings involving claims about past financial performance and reporting, as well as any future claims that may arise about past or current misconduct, even if unfounded, may have a significant impact on our reputation and how we are viewed by investors, customers and others. We also from time to time are involved in commercial discussions, disputes or proceedings in which, given the nature of our business that often involves large equipment and service orders and long-term commercial relationships, the claims asserted can be for significant amounts. The estimation of legal reserves or possible losses involves significant judgment and may not reflect the full range of uncertainties and unpredictable outcomes inherent in litigation, disputes and investigations, and the actual losses arising from particular matters may exceed our current estimates and adversely affect our financial results. The risk management and compliance programs we have adopted and related actions that we take may not fully mitigate legal and compliance risks that we face, particularly in light of the global and diverse nature of our operations and the current enforcement environments in many jurisdictions. For example, when we investigate potential noncompliance under U.S. and non-U.S. law involving our employees, partners or third parties we work with, in some circumstances we make self-disclosures about our findings to the relevant authorities who may pursue or decline to pursue enforcement proceedings against us in connection with those matters. We are also subject to material trailing legal liabilities from businesses that we have exited or are inactive. We also expect that additional legal proceedings and other contingencies will arise from time to time. Moreover, we sell products and services in growth markets where claims arising from alleged violations of law, product failures or other incidents involving our products and services are adjudicated within legal systems that are less developed and less reliable than those of the U.S. or other more developed markets, and this can create additional uncertainty about the outcome of proceedings before courts or other governmental bodies in those markets. See Note 24 for further information about legal proceedings and other loss contingencies.
LEGAL PROCEEDINGS. Refer to Legal Matters and Environmental, Health and Safety Matters in Note 24 to the consolidated financial statements for further information relating to our legal matters.
MANAGEMENT AND AUDITOR’S REPORTS
MANAGEMENT’S DISCUSSION OF FINANCIAL RESPONSIBILITY. Management is responsible for the preparation of the consolidated financial statements and related information that are presented in this report. The consolidated financial statements, which include amounts based on management’s estimates and judgments, have been prepared in conformity with U.S generally accepted accounting principles.
The Company designs and maintains accounting and internal control systems to provide reasonable assurance that assets are safeguarded against loss from unauthorized use or disposition, and that the financial records are reliable for preparing consolidated financial statements and maintaining accountability for assets. These systems are enhanced by policies and procedures, an organizational structure providing division of responsibilities, careful selection and training of qualified personnel, and a program of internal audits.
The Company engaged Deloitte and Touche LLP, an independent registered public accounting firm, to audit and render an opinion on the consolidated financial statements and internal control over financial reporting in accordance with the standards of the Public Company Accounting Oversight Board (PCAOB).
The Board of Directors, through its Audit Committee, which consists entirely of independent directors, meets periodically with management, internal auditors and our independent registered public accounting firm to ensure that each is meeting its responsibilities and to discuss matters concerning internal controls and financial reporting. Deloitte and Touche LLP and the internal auditors each have full and free access to the Audit Committee.
MANAGEMENT’S ANNUAL REPORT ON INTERNAL CONTROL OVER FINANCIAL REPORTING. Management is responsible for establishing and maintaining adequate internal control over financial reporting for the Company. With our participation, an evaluation of the effectiveness of our internal control over financial reporting was conducted as of December 31, 2024, based on the framework and criteria established in Internal Control – Integrated Framework (2013) issued by the Committee of Sponsoring Organizations of the Treadway Commission.
Based on this evaluation, our management has concluded that our internal control over financial reporting was effective as of December 31, 2024.
Our independent registered public accounting firm has issued an audit report on our internal control over financial reporting. Their report follows.
| | | | | | | | |
| /s/ H. Lawrence Culp, Jr. | | /s/ Rahul Ghai |
| H. Lawrence Culp, Jr. | | Rahul Ghai |
| Chairman and Chief Executive Officer | | Chief Financial Officer |
| February 3, 2025 | | |
DISCLOSURE CONTROLS. Under the direction of our Chief Executive Officer and Chief Financial Officer, we evaluated our disclosure controls and procedures and internal control over financial reporting and concluded that our disclosure controls and procedures were effective as of December 31, 2024. There have been no changes in the Company’s internal control over financial reporting during the quarter ended December 31, 2024, that have materially affected, or are reasonably likely to materially affect, its internal control over financial reporting.
REPORT OF INDEPENDENT REGISTERED PUBLIC ACCOUNTING FIRM
To the shareholders and the Board of Directors of General Electric Company (operating as GE Aerospace)
Opinion on the Financial Statements
We have audited the accompanying consolidated statements of financial position of General Electric Company (operating as GE Aerospace) and subsidiaries (the "Company") as of December 31, 2024, and 2023, the related consolidated statements of earnings (loss), comprehensive income (loss), changes in shareholders’ equity, and cash flows for each of the three years in the period ended December 31, 2024, and the related notes (collectively referred to as the “financial statements”). In our opinion, the financial statements present fairly, in all material respects, the financial position of the Company as of December 31, 2024, and 2023, and the results of its operations and its cash flows for each of the three years in the period ended December 31, 2024, in conformity with accounting principles generally accepted in the United States of America.
We have also audited, in accordance with the standards of the Public Company Accounting Oversight Board (United States) (PCAOB), the Company's internal control over financial reporting as of December 31, 2024, based on criteria established in Internal Control — Integrated Framework (2013) issued by the Committee of Sponsoring Organizations of the Treadway Commission and our report dated February 3, 2025, expressed an unqualified opinion on the Company's internal control over financial reporting.
Basis for Opinion
These financial statements are the responsibility of the Company's management. Our responsibility is to express an opinion on the Company's financial statements based on our audits. We are a public accounting firm registered with the PCAOB and are required to be independent with respect to the Company in accordance with the U.S. federal securities laws and the applicable rules and regulations of the Securities and Exchange Commission and the PCAOB.
We conducted our audits in accordance with the standards of the PCAOB. Those standards require that we plan and perform the audit to obtain reasonable assurance about whether the financial statements are free of material misstatement, whether due to error or fraud. Our audits included performing procedures to assess the risks of material misstatement of the financial statements, whether due to error or fraud, and performing procedures that respond to those risks. Such procedures included examining, on a test basis, evidence regarding the amounts and disclosures in the financial statements. Our audits also included evaluating the accounting principles used and significant estimates made by management, as well as evaluating the overall presentation of the financial statements. We believe that our audits provide a reasonable basis for our opinion.
Critical Audit Matters
The critical audit matters communicated below are matters arising from the current-period audit of the financial statements that were communicated or required to be communicated to the audit committee and that (1) relate to accounts or disclosures that are material to the financial statements and (2) involved our especially challenging, subjective, or complex judgments. The communication of critical audit matters does not alter in any way our opinion on the financial statements, taken as a whole, and we are not, by communicating the critical audit matters below, providing separate opinions on the critical audit matters or on the accounts or disclosures to which they relate.
Sales of services - Revenue recognition on certain Aerospace long-term service agreements - Refer to Notes 1 and 8 to the financial statements.
Critical Audit Matter Description
The Company enters into long-term service agreements with certain customers. These agreements require the Company to provide maintenance services for customer assets over the contract term, which generally range from 10 to 25 years. Revenue for these agreements is recognized using the percentage of completion method, based on costs incurred relative to total estimated costs over the contract term. As part of the revenue recognition process, the Company estimates both customer payments that are expected to be received and costs to perform maintenance services over the contract term. Key assumptions within those estimates that require significant judgment from management include: (a) how the customer will utilize the assets covered over the contract term; (b) the expected timing and extent of future overhaul services; (c) the future cost of materials, labor, and other resources; and (d) forward looking information concerning market conditions.
Given the complexity involved with evaluating the key estimates, which includes significant judgment necessary to estimate future costs, auditing these assumptions required a high degree of auditor judgment and extensive audit effort, including the involvement of professionals with specialized skills and industry knowledge.
How the Critical Audit Matter Was Addressed in the Audit
Our auditing procedures over the key estimates described above related to the amount and timing of revenue recognition of the long-term service agreements included the following, among others:
•We tested the effectiveness of controls over the revenue recognition process for the long-term service agreements, including controls over management’s key estimates.
•We evaluated management’s risk assessment process through observation of key meetings and processes, including inspection of documentation, addressing contract status and current market conditions including the timely incorporation of changes that affect total estimated costs to complete the contract.
•We evaluated the appropriateness and consistency of management’s methods and key assumptions applied in recognizing revenue and developing cost estimates.
•We tested management’s utilization assumptions for the assets covered over the contract term, which impact the estimated timing and extent of future maintenance and overhaul services by comparing current estimates to historical information and forward-looking market conditions.
•We tested management’s process for estimating the timing and amount of costs associated with overhaul and other maintenance events throughout the contract term, including comparing estimates to historical cost experience, performing a retrospective review, performing analytical procedures, and utilized specialists to evaluate statistical models used by the Company to estimate the useful life of certain components of the applicable engine platform.
Future Policy Benefits - refer to Note 12 to the financial statements
Critical Audit Matter Description
The liability for future policy benefits as of December 31, 2024 is measured under ASU 2018-12 “Targeted Improvements to the Accounting for Long Duration Contracts” (LDTI) based on current assumptions applied to the underlying policy cash flows. The liability for future policy benefits includes $24,675 million for long term care policies.
Significant uncertainties exist in evaluating future cash flow projections, including consideration of a wide range of possible outcomes of future events over the life of the insurance contracts that can extend for long periods of time.
A key assumption impacting the cash flow projections used in the measurement of such liabilities that is sensitive and more subjective, requiring significant judgment by management, is the rate of change in morbidity.
Given the significant judgments required by management, auditing the liability for future policy benefits required a high degree of auditor judgment and an increased extent of effort, including the involvement of actuarial specialists.
How the Critical Audit Matter was Addressed in the Audit
Our audit procedures, including those performed by our actuarial specialists, included the following, among others:
•We tested the effectiveness of controls related to the determination of the liability for future policy benefits.
•We evaluated judgments applied by management in setting key assumptions by considering actual experience, sensitivity analysis and relevant industry data, when available. We performed retrospective reviews of certain assumptions to evaluate for management bias.
•We tested the underlying data for completeness and accuracy, including historical cash flows that served as a basis for the actuarial estimates.
•We performed policy level testing to assess that management’s intended assumptions were used and the model accurately calculated the cash flow projections.
•We validated the levels of aggregation of the liability calculations determined by the Company were in accordance with their policy and performed recalculations on a sample basis to validate the appropriateness of the discount rate assumptions used and tested the application of the net premium ratio used to measure the liability for future policy benefits.
| | |
| /s/ DELOITTE & TOUCHE LLP |
|
| Cincinnati, Ohio |
| February 3, 2025 |
| We have served as the Company's auditor since 2020. |
REPORT OF INDEPENDENT REGISTERED PUBLIC ACCOUNTING FIRM
To the shareholders and the Board of Directors of General Electric Company (operating as GE Aerospace)
Opinion on Internal Control over Financial Reporting
We have audited the internal control over financial reporting of General Electric Company (operating as GE Aerospace) and subsidiaries (the “Company”) as of December 31, 2024, based on criteria established in Internal Control — Integrated Framework (2013) issued by the Committee of Sponsoring Organizations of the Treadway Commission (COSO). In our opinion, the Company maintained, in all material respects, effective internal control over financial reporting as of December 31, 2024, based on criteria established in Internal Control — Integrated Framework (2013) issued by COSO.
We have also audited, in accordance with the standards of the Public Company Accounting Oversight Board (United States) (PCAOB), the consolidated financial statements as of and for the year ended December 31, 2024, of the Company and our report dated February 3, 2025, expressed an unqualified opinion on those financial statements.
Basis for Opinion
The Company’s management is responsible for maintaining effective internal control over financial reporting and for its assessment of the effectiveness of internal control over financial reporting, included in the accompanying Management’s Annual Report on Internal Control over Financial Reporting. Our responsibility is to express an opinion on the Company’s internal control over financial reporting based on our audit. We are a public accounting firm registered with the PCAOB and are required to be independent with respect to the Company in accordance with the U.S. federal securities laws and the applicable rules and regulations of the Securities and Exchange Commission and the PCAOB.
We conducted our audit in accordance with the standards of the PCAOB. Those standards require that we plan and perform the audit to obtain reasonable assurance about whether effective internal control over financial reporting was maintained in all material respects. Our audit included obtaining an understanding of internal control over financial reporting, assessing the risk that a material weakness exists, testing and evaluating the design and operating effectiveness of internal control based on the assessed risk, and performing such other procedures as we considered necessary in the circumstances. We believe that our audit provides a reasonable basis for our opinion.
Definition and Limitations of Internal Control over Financial Reporting
A company’s internal control over financial reporting is a process designed to provide reasonable assurance regarding the reliability of financial reporting and the preparation of financial statements for external purposes in accordance with generally accepted accounting principles. A company’s internal control over financial reporting includes those policies and procedures that (1) pertain to the maintenance of records that, in reasonable detail, accurately and fairly reflect the transactions and dispositions of the assets of the company; (2) provide reasonable assurance that transactions are recorded as necessary to permit preparation of financial statements in accordance with generally accepted accounting principles, and that receipts and expenditures of the company are being made only in accordance with authorizations of management and directors of the company; and (3) provide reasonable assurance regarding prevention or timely detection of unauthorized acquisition, use, or disposition of the company’s assets that could have a material effect on the financial statements.
Because of its inherent limitations, internal control over financial reporting may not prevent or detect misstatements. Also, projections of any evaluation of effectiveness to future periods are subject to the risk that controls may become inadequate because of changes in conditions, or that the degree of compliance with the policies or procedures may deteriorate.
| | |
| /s/ DELOITTE & TOUCHE LLP |
|
| Cincinnati, Ohio |
| February 3, 2025 |
| | | | | | | | | | | | | | |
| STATEMENT OF EARNINGS (LOSS) | | | | | |
| For the years ended December 31 (In millions; per-share amounts in dollars) | | | | 2024 | 2023 | 2022 |
| Sales of equipment | | | | $ | 10,274 | | $ | 9,318 | | $ | 7,837 | |
| Sales of services | | | | 24,847 | | 22,641 | | 18,345 | |
| Insurance revenue (Note 12) | | | | 3,581 | | 3,389 | | 2,957 | |
| Total revenue | | | | 38,702 | | 35,348 | | 29,139 | |
| | | | | | |
| Cost of equipment sold | | | | 10,341 | | 9,900 | | 8,151 | |
| Cost of services sold | | | | 13,967 | | 13,039 | | 10,836 | |
| Selling, general and administrative expenses | | | | 4,437 | | 4,045 | | 3,672 | |
| Separation costs | | | | 492 | | 692 | | 625 | |
| Research and development | | | | 1,286 | | 1,011 | | 808 | |
| Interest and other financial charges | | | | 986 | | 1,029 | | 1,339 | |
| Debt extinguishment costs | | | | — | | — | | 465 | |
| Insurance losses, annuity benefits and other costs (Note 12) | | | | 2,429 | | 2,886 | | 2,592 | |
| Goodwill impairments (Note 7) | | | | 251 | | — | | — | |
| Non-operating benefit cost (income) | | | | (842) | | (978) | | (60) | |
| | | | | | |
| Total costs and expenses | | | | 33,346 | | 31,625 | | 28,428 | |
| | | | | | |
| Other income (loss) (Note 19) | | | | 2,264 | | 6,718 | | 811 | |
| | | | | | |
| Earnings (loss) from continuing operations before income taxes | | | | 7,620 | | 10,441 | | 1,522 | |
| Benefit (provision) for income taxes (Note 15) | | | | (962) | | (994) | | (169) | |
| Earnings (loss) from continuing operations | | | | 6,657 | | 9,448 | | 1,353 | |
| Earnings (loss) from discontinued operations, net of taxes (Note 2) | | | | (91) | | (3) | | (949) | |
| Net earnings (loss) | | | | 6,566 | | 9,445 | | 403 | |
| Less net earnings (loss) attributable to noncontrolling interests | | | | 11 | | (37) | | 67 | |
| Net earnings (loss) attributable to the Company | | | | 6,556 | | 9,482 | | 336 | |
| Preferred stock dividends and other | | | | — | | (295) | | (289) | |
| Net earnings (loss) attributable to common shareholders | | | | $ | 6,556 | | $ | 9,188 | | $ | 48 | |
| | | | | | |
| Amounts attributable to common shareholders | | | | | | |
| Earnings (loss) from continuing operations | | | | $ | 6,657 | | $ | 9,448 | | $ | 1,353 | |
| Less net earnings (loss) attributable to noncontrolling interests, | | | | | | |
| continuing operations | | | | (13) | | (1) | | 2 | |
| Earnings (loss) from continuing operations attributable to the Company | | | | 6,670 | | 9,449 | | 1,350 | |
| Preferred stock dividends and other | | | | — | | (295) | | (289) | |
| Earnings (loss) from continuing operations attributable | | | | | | |
| to common shareholders | | | | 6,670 | | 9,154 | | 1,061 | |
| | | | | | |
| | | | | | |
| | | | | | |
| Earnings (loss) from discontinued operations attributable | | | | | | |
| to common shareholders | | | | (114) | | 33 | | (1,014) | |
| Net earnings (loss) attributable to common shareholders | | | | $ | 6,556 | | $ | 9,188 | | $ | 48 | |
| | | | | | |
| Earnings (loss) per share from continuing operations (Note 18) | | | | | | |
| Diluted earnings (loss) per share | | | | $ | 6.09 | | $ | 8.33 | | $ | 0.97 | |
| Basic earnings (loss) per share | | | | $ | 6.15 | | $ | 8.41 | | $ | 0.97 | |
| | | | | | |
| Net earnings (loss) per share (Note 18) | | | | | | |
| Diluted earnings (loss) per share | | | | $ | 5.99 | | $ | 8.36 | | $ | 0.05 | |
| Basic earnings (loss) per share | | | | $ | 6.04 | | $ | 8.44 | | $ | 0.05 | |
| | | | | | | | |
| |
| STATEMENT OF FINANCIAL POSITION | | |
| December 31 (In millions) | 2024 | 2023 |
| | |
| Cash, cash equivalents and restricted cash | $ | 13,619 | | $ | 15,204 | |
| Investment securities (Note 3) | 982 | | 5,706 | |
| Current receivables (Note 4) | 9,327 | | 8,703 | |
| | |
| Inventories, including deferred inventory costs (Note 5) | 9,763 | | 8,284 | |
| | |
| | |
| Current contract assets (Note 8) | 2,982 | | 2,875 | |
| All other current assets (Note 9) | 962 | | 1,244 | |
| Assets of businesses held for sale (Note 2) | — | | 541 | |
| Current assets | 37,635 | | 42,556 | |
| | |
| Investment securities (Note 3) | 37,741 | | 38,000 | |
| | |
| | |
| Property, plant and equipment – net (Note 6) | 7,277 | | 7,246 | |
| | |
| Goodwill (Note 7) | 8,538 | | 8,948 | |
| Other intangible assets – net (Note 7) | 4,257 | | 4,642 | |
| Contract and other deferred assets (Note 8) | 4,831 | | 4,785 | |
| All other assets (Note 9) | 13,910 | | 11,695 | |
| Deferred income taxes (Note 15) | 7,111 | | 7,502 | |
| Assets of discontinued operations (Note 2) | 1,841 | | 47,927 | |
| Total assets | $ | 123,140 | | $ | 173,300 | |
| | |
| Short-term borrowings (Note 10) | $ | 2,039 | | $ | 1,108 | |
| | |
| Accounts payable (Note 11) | 7,909 | | 7,516 | |
| Progress collections (Note 8) | 6,695 | | 6,177 | |
| Contract liabilities and deferred income (Note 8) | 9,353 | | 8,322 | |
| Sales discounts and allowances (Note 14) | 3,475 | | 3,741 | |
| All other current liabilities (Note 14) | 4,920 | | 4,860 | |
| Liabilities of businesses held for sale (Note 2) | — | | 378 | |
| Current liabilities | 34,392 | | 32,103 | |
| | |
| Deferred income (Note 8) | 1,013 | | 975 | |
| Long-term borrowings (Note 10) | 17,234 | | 19,417 | |
| | |
| Insurance liabilities and annuity benefits (Note 12) | 36,209 | | 39,576 | |
| Non-current compensation and benefits | 7,035 | | 7,656 | |
| All other liabilities (Note 14) | 6,376 | | 5,756 | |
| Liabilities of discontinued operations (Note 2) | 1,317 | | 39,213 | |
| Total liabilities | 103,576 | | 144,695 | |
| | |
| | |
Common stock (1,073,692,183 and 1,088,415,995 shares outstanding at December 31, 2024 and 2023, respectively) (Note 16) | 15 | | 15 | |
| Accumulated other comprehensive income (loss) – net attributable to the Company (Note 16) | (3,861) | | (6,150) | |
| Other capital | 24,266 | | 26,962 | |
| Retained earnings | 80,488 | | 86,553 | |
| Less common stock held in treasury | (81,566) | | (79,976) | |
| Total shareholders’ equity | 19,342 | | 27,403 | |
| Noncontrolling interests | 223 | | 1,202 | |
| Total equity | 19,564 | | 28,605 | |
| Total liabilities and equity | $ | 123,140 | | $ | 173,300 | |
| | | | | | | | | | | |
| STATEMENT OF CASH FLOWS | | | |
| | |
| For the years ended December 31 (In millions) | 2024 | 2023 | 2022 |
| | | |
| Net earnings (loss) | $ | 6,566 | | $ | 9,445 | | $ | 403 | |
| | | |
| | | |
| (Earnings) loss from discontinued operations activities | 91 | | 3 | | 949 | |
| Adjustments to reconcile net earnings (loss) to cash from (used for) operating activities: | | | |
| Depreciation and amortization of property, plant and equipment | 834 | | 797 | | 846 | |
| Amortization of intangible assets (Note 7) | 350 | | 382 | | 338 | |
| Goodwill impairments (Note 7) | 251 | | — | | — | |
| | | |
| (Gains) losses on equity securities (Note 19) | (719) | | (5,846) | | 56 | |
| Debt extinguishment costs | — | | — | | 465 | |
| Principal pension plans (benefit) cost (Note 13) | (653) | | (755) | | 305 | |
| Principal pension plans employer contributions | (210) | | (184) | | (173) | |
| Other postretirement benefit plans (net) | (299) | | (348) | | (332) | |
| Provision (benefit) for income taxes (Note 15) | 962 | | 994 | | 169 | |
| Cash recovered (paid) during the year for income taxes | (334) | | (1,041) | | (547) | |
| Changes in operating working capital: | | | |
| Decrease (increase) in current receivables | (1,076) | | (210) | | (1,875) | |
| Decrease (increase) in inventories, including deferred inventory costs | (1,528) | | (1,321) | | (980) | |
| Decrease (increase) in current contract assets | (112) | | (27) | | 36 | |
| Increase (decrease) in contract liabilities and current deferred income | 1,066 | | 1,226 | | 1,075 | |
| Increase (decrease) in progress collections | 531 | | 242 | | 1,187 | |
| Increase (decrease) in accounts payable | 688 | | 713 | | 1,639 | |
| Increase (decrease) in sales discounts and allowances | (266) | | (203) | | 47 | |
| | | |
| All other operating activities | (326) | | 743 | | 418 | |
| Cash from (used for) operating activities – continuing operations | 5,817 | | 4,609 | | 4,027 | |
| Cash from (used for) operating activities – discontinued operations | (1,107) | | 580 | | 1,889 | |
| Cash from (used for) operating activities | 4,710 | | 5,189 | | 5,917 | |
| | | |
| Additions to property, plant and equipment and internal-use software | (1,032) | | (862) | | (662) | |
| Dispositions of property, plant and equipment | 114 | | 60 | | 153 | |
| | | |
| | | |
| Proceeds from principal business dispositions | 499 | | — | | 15 | |
| Net cash from (payments for) principal businesses purchased | (135) | | (41) | | (30) | |
| Sales of retained ownership interests | 5,250 | | 9,004 | | 4,717 | |
| Net (purchases) dispositions of insurance investment securities | (963) | | (986) | | (876) | |
| All other investing activities | (4,289) | | 519 | | 7,053 | |
| Cash from (used for) investing activities – continuing operations | (556) | | 7,693 | | 10,369 | |
| Cash from (used for) investing activities – discontinued operations | (1,110) | | (3,726) | | (8,099) | |
| Cash from (used for) investing activities | (1,666) | | 3,967 | | 2,270 | |
| | | |
| Net increase (decrease) in borrowings (maturities of 90 days or less) | 2 | | (71) | | 42 | |
| Newly issued debt (maturities longer than 90 days) | — | | — | | — | |
| Repayments and other debt reductions (maturities longer than 90 days) | (788) | | (3,282) | | (11,088) | |
| Dividends paid to shareholders | (1,008) | | (589) | | (639) | |
| Cash received (paid) for debt extinguishment costs | — | | — | | 338 | |
| Redemption of preferred stock | — | | (5,795) | | (144) | |
| Purchases of common stock for treasury | (5,827) | | (1,233) | | (1,048) | |
| All other financing activities | 992 | | 459 | | (1,000) | |
| Cash from (used for) financing activities – continuing operations | (6,628) | | (10,511) | | (13,540) | |
| Cash from (used for) financing activities – discontinued operations | (98) | | 1,899 | | 7,955 | |
| Cash from (used for) financing activities | (6,726) | | (8,613) | | (5,585) | |
| Effect of currency exchange rate changes on cash, cash equivalents and restricted cash | (193) | | 120 | | (369) | |
| Increase (decrease) in cash, cash equivalents and restricted cash | (3,875) | | 664 | | 2,232 | |
| Cash, cash equivalents and restricted cash at beginning of year | 19,755 | | 19,092 | | 16,859 | |
| Cash, cash equivalents and restricted cash at December 31 | 15,880 | | 19,755 | | 19,092 | |
| Less cash, cash equivalents and restricted cash of discontinued operations at December 31 | (1,327) | | (3,762) | | (4,868) | |
| Cash, cash equivalents and restricted cash of continuing operations at December 31 | $ | 14,553 | | $ | 15,993 | | $ | 14,223 | |
| Supplemental disclosure of cash flows information | | | |
| Cash paid during the year for interest | $ | (969) | | $ | (1,067) | | $ | (1,561) | |
| | | |
| | | |
| | | |
| | | |
| | | | | | | | | | | | | | |
| STATEMENT OF COMPREHENSIVE INCOME (LOSS) | | | | | | |
| | | | |
| | | | | | |
| For the years ended December 31 (In millions) | | | | 2024 | 2023 | 2022 |
| Net earnings (loss) | | | | $ | 6,566 | | $ | 9,445 | | $ | 403 | |
| Less: net earnings (loss) attributable to noncontrolling interests | | | | 11 | | (37) | | 67 | |
| Net earnings (loss) attributable to the Company | | | | $ | 6,556 | | $ | 9,482 | | $ | 336 | |
| | | | | | |
| Currency translation adjustments | | | | 2,131 | | 2,274 | | (1,326) | |
| Benefit plans | | | | (1,128) | | (4,747) | | 2,889 | |
| Investment securities and cash flow hedges | | | | (1,016) | | 968 | | (7,099) | |
| Long-duration insurance contracts | | | | 2,284 | | (2,371) | | 8,126 | |
| | | | | | |
| | | | | | |
| Less: other comprehensive income (loss) attributable to noncontrolling interests | | | | (17) | | 2 | | 1 | |
| Other comprehensive income (loss) attributable to the Company | | | | $ | 2,289 | | $ | (3,878) | | $ | 2,589 | |
| | | | | | |
| Comprehensive income (loss) | | | | $ | 8,838 | | $ | 5,569 | | $ | 2,993 | |
| Less: comprehensive income (loss) attributable to noncontrolling interests | | | | (7) | | (35) | | 68 | |
| Comprehensive income (loss) attributable to the Company | | | | $ | 8,845 | | $ | 5,604 | | $ | 2,925 | |
| | | | | | |
| | | | | | |
| | | | | | |
| | | | | | | | | | | | | | |
| STATEMENT OF CHANGES IN SHAREHOLDERS' EQUITY | | |
| | | | |
| | | | | | |
| For the years ended December 31 (In millions) | | | | 2024 | 2023 | 2022 |
| Preferred stock issued | | | | $ | — | | $ | — | | $ | 6 | |
| Common stock issued | | | | $ | 15 | | $ | 15 | | $ | 15 | |
| | | | | | |
| Beginning balance | | | | (6,150) | | (2,272) | | (4,860) | |
| Currency translation adjustments | | | | 2,151 | | 2,270 | | (1,324) | |
| Benefit plans | | | | (1,120) | | (4,745) | | 2,886 | |
| Investment securities and cash flow hedges | | | | (1,026) | | 968 | | (7,099) | |
| Long-duration insurance contracts | | | | 2,284 | | (2,371) | | 8,126 | |
| | | | | | |
| Accumulated other comprehensive income (loss) | | | | $ | (3,861) | | $ | (6,150) | | $ | (2,272) | |
| Beginning balance | | | | 26,962 | | 34,173 | | 34,691 | |
| Gains (losses) on treasury stock dispositions | | | | (3,028) | | (1,845) | | (741) | |
| Stock-based compensation | | | | 361 | | 355 | | 362 | |
| Other changes(a) | | | | (29) | | (5,721) | | (139) | |
| Other capital | | | | $ | 24,266 | | $ | 26,962 | | $ | 34,173 | |
| Beginning balance | | | | 86,553 | | 83,001 | | 83,229 | |
| Net earnings (loss) attributable to the Company | | | | 6,556 | | 9,482 | | 336 | |
| Dividends and other transactions with shareholders(b) | | | | (12,599) | | (5,937) | | (642) | |
| Other | | | | (21) | | 6 | | 77 | |
| Retained earnings | | | | $ | 80,488 | | $ | 86,553 | | $ | 83,001 | |
| Beginning balance | | | | (79,976) | | (81,209) | | (81,093) | |
| Purchases | | | | (5,826) | | (1,244) | | (1,048) | |
| Dispositions | | | | 4,236 | | 2,477 | | 931 | |
| Common stock held in treasury | | | | $ | (81,566) | | $ | (79,976) | | $ | (81,209) | |
| GE Aerospace shareholders' equity balance | | | | 19,342 | | 27,403 | | 33,714 | |
| Noncontrolling interests balance(c) | | | | 223 | | 1,202 | | 1,216 | |
| Total equity balance at December 31 | | | | $ | 19,564 | | $ | 28,605 | | $ | 34,930 | |
(a) Included decreases of $5,795 million and $144 million, substantially all in Other capital related to our redemption of GE preferred stock in the years ended December 31, 2023 and 2022, respectively.
(b) Included a $5,300 million decrease in Retained earnings reflecting a pro-rata distribution of approximately 80.1% of the shares of GE HealthCare on January 3, 2023. Included a $11,375 million decrease in Retained earnings reflecting a distribution of all the shares of GE Vernova on April 2, 2024.
(c) Included a reclassification of $1,007 million of noncontrolling interests attributable to GE Vernova to Retained earnings as a result of the separation on April 2, 2024.
NOTE 1. BASIS OF PRESENTATION AND SUMMARY OF SIGNIFICANT ACCOUNTING POLICIES
FINANCIAL STATEMENT PRESENTATION. Our financial statements are prepared in conformity with U.S. generally accepted accounting principles (GAAP), which requires us to make estimates based on assumptions about current, and for some estimates, future, economic and market conditions which affect reported amounts and related disclosures in our financial statements. Although our current estimates contemplate current and expected future conditions, as applicable, it is reasonably possible that actual conditions could differ from our expectations, which could materially affect our results of operations, financial position and cash flows. Such changes could result in future impairments of goodwill, intangibles, long-lived assets, contract assets and investment securities, revisions to estimated profitability on long-term product service agreements, incremental credit losses on receivables and debt securities, incremental losses related to our contingencies, a change in the carrying amount of our tax assets and liabilities, or a change in our insurance liabilities and pension obligations as of the time of a relevant measurement event.
In preparing our Statement of Cash Flows, we make certain adjustments to reflect cash flows that cannot otherwise be calculated by changes in our Statement of Financial Position. These adjustments may include, but are not limited to, the effects of currency exchange, acquisitions and dispositions of businesses, businesses classified as held for sale, the timing of settlements to suppliers for property, plant and equipment, non-cash gains/losses and other balance sheet reclassifications.
We have reclassified certain prior-year amounts to conform to the current-year’s presentation. Unless otherwise noted, tables are presented in U.S. dollars in millions. Certain columns and rows may not add due to the use of rounded numbers. Percentages presented are calculated from the underlying numbers in millions. Earnings per share amounts are computed independently for earnings from continuing operations, earnings from discontinued operations and net earnings. As a result, the sum of per-share amounts may not equal the total. Unless otherwise indicated, information in these notes to consolidated financial statements relates to continuing operations. Certain of our operations have been presented as discontinued. We present businesses whose disposal represents a strategic shift that has, or will have, a major effect on our operations and financial results as discontinued operations when the components meet the criteria for held for sale, are sold, or spun-off.
On April 2, 2024 and January 3, 2023, General Electric Company, now operating as GE Aerospace, completed the previously announced separation of GE Vernova and its separation of GE HealthCare, respectively, which resulted in three independent, publicly traded companies – GE Aerospace, GE Vernova and GE HealthCare. We are organized into two business segments that are aligned with the industries we serve: Commercial Engines & Services and Defense & Propulsion Technologies. The historical results of GE Vernova and GE HealthCare are presented as discontinued operations and, as such, have been excluded from both continuing operations and segment results for all periods presented. See Notes 2 and 25 for further information.
CONSOLIDATION. Our financial statements consolidate all of our affiliates, entities where we have a controlling financial interest, most often because we hold a majority voting interest, or where we are required to apply the variable interest entity (VIE) model and we have the power to direct the most economically significant activities of entities. We reevaluate whether we have a controlling financial interest in all entities when our rights and interests change. All intercompany balances and transactions have been eliminated.
REVENUE FROM THE SALE OF EQUIPMENT. We recognize revenue for equipment including commercial install and spare aircraft engines, defense aircraft engines, and other products we manufacture at the point in time that the customer obtains control of the product, which is generally no earlier than when the customer has physical possession. We use proof of delivery for certain large equipment with more complex logistics, whereas the delivery of other equipment is estimated based on historical averages of in-transit periods (time between shipment and delivery).
Where arrangements include customer acceptance provisions based on seller or customer-specified objective criteria, we recognize revenue when we have concluded that the customer has control of the equipment, and that acceptance is likely to occur. We do not provide for anticipated losses on point-in-time transactions prior to transferring control of the equipment to the customer.
Our billing terms for these contracts generally coincide with delivery to the customer. We sometimes offer our customers financing discounts for the purchase of certain equipment when sold in contemplation of long-term service agreements. These sales are accounted for as financing arrangements when payments for the equipment are collected through higher usage-based fees from servicing the equipment. In some contracts, we receive progress collections from customers for large equipment purchases. Progress collections are not considered a significant financing component as they are used to meet working capital demands and protect us from the other party failing to adequately complete some or all of its obligations under the contract. For certain commercial engine programs, we make payments to airlines when the aircraft with our engines are delivered by the airframers (aircraft allowances). We record aircraft allowances as a reduction in revenue when control of the engine is transferred to our airframer customer.
Some of our contracts require us to make payments to customers related to failure to deliver our equipment on-time or meeting certain performance specifications, which is factored into our estimate of variable consideration using the expected value method taking into consideration performance relative to our contractual obligations, specified liquidated damages rates, if applicable, and history of paying damages to the customer or similar customers.
REVENUE FROM THE SALE OF SERVICES. Spare Parts. We sell certain tangible products, largely spare parts, through our services businesses. We recognize revenue and bill our customers at the point in time that the customer obtains control of the good, which is when we deliver the spare part to the customer. In some cases, our contracts give rise to variable consideration in the form of volume or product durability discounts, which we incorporate into our estimate of transaction price using the expected value method. Delivery is measured using either proof of delivery or estimated based on historical averages of in-transit periods (time between shipment and delivery).
Long-term Services Agreements. We enter into long-term services agreements with our customers primarily within our Commercial Engines and Services segment. These agreements require us to provide maintenance, overhauls and standby "warranty-type" services, which generally range from 5 to 25 years. We account for items that are integral to the maintenance of the equipment as part of our performance obligation, unless the customer has a substantive right to make a separate purchasing decision.
We recognize revenue as we perform under the arrangements using the percentage of completion method which is based on our costs incurred to date relative to our estimate of total expected costs. Throughout the life of a contract, this measure of progress captures the nature, timing and extent of our underlying performance activities as our stand-ready services often fluctuate between routine inspections and maintenance, unscheduled service events and major overhauls at predetermined usage intervals. We provide for potential losses on these agreements when it is probable that we will incur the loss.
Our rights to consideration for these arrangements are generally based on the utilization of the asset (e.g., per hour of usage) and contractual payment terms are based on either periodic billing schedules or upon the occurrence of a maintenance event, such as an overhaul. The differences between the timing of our revenue recognized (based on costs incurred) and customer billings results in changes to our contract asset or contract liability positions. Contract assets and contract liabilities for long-term service agreements are classified as current based on our contract operating cycle and include amounts that may be billed and collected beyond one year due to the long-cycle nature of our contracts. See Note 8 for further information.
Contracts are often modified to account for changes in contract specifications or requirements. Contract modifications in our long-term service agreements are predominantly accounted for on a prospective basis. Changes in estimates for existing contracts are accounted for on a cumulative catchup basis. See Note 8 for further information.
Other Services Revenue Contracts. We enter into contracts to perform other services, including time and material service contracts and component repairs, where we enhance the value of a customer asset and the customer pays us on a per event basis. For time and material overhauls, the contract duration and transaction price are limited to the individual maintenance event and we recognize revenue on an over time basis as the services are rendered, in proportion to cost incurred. Labor costs are recognized as incurred and costs of replacement parts are recognized when we can reliably determine that the parts are non-fungible. For component repairs, we recognize revenue when the services are completed.
Development Agreements. We enter into long-term development agreements primarily within our Defense & Propulsion Technologies segment. The majority of these agreements are with the U.S. Government for the research and design of defense products. Our contracts with the U.S. government are typically subject to the Federal Acquisition Regulation (FAR) and are either fixed-priced or based on estimated or actual costs of providing services. Certain contracts include incentive and award fees, based on achievement of specified targets, which we consider as variable consideration. The amount included in the transaction price represents our estimate of the most likely amount we expect to collect to the extent that it is probable that a significant reversal in the amount of cumulative revenue recognized will not occur. Revenue is recognized on an over time basis because of continuous transfer of control to the customer using percentage of completion based on costs incurred to date relative to total estimated costs. Changes in estimates for existing contracts are accounted for on a cumulative catchup basis.
NONRECURRING ENGINEERING COSTS. We incur contract fulfillment costs for engineering and development of products directly related to existing contracts with customers, primarily in our Defense & Propulsion Technologies segment. If we determine the costs are for development of products for a specific customer and there is a high probability of recovery from future sales to that customer, we capitalize the costs we incur, excluding early-stage costs which are expensed as research and development. Capitalized nonrecurring engineering costs are included in Contract and other deferred assets in our accompanying Statement of Financial Position and are amortized to Cost of equipment sold ratably over each unit sold. We periodically assess the recoverability of capitalized nonrecurring engineering costs and if we determine the costs are no longer probable of recovery, the asset is impaired. See Note 8 for further information.
RESEARCH AND DEVELOPMENT. Research and development includes costs incurred for experimentation, design, development and testing, as well as bid and proposal efforts related to government products and services, which are expensed as incurred unless the costs are related to certain contractual arrangements with customers. We enter certain research and development arrangements that meet the requirement for best efforts research and development accounting. Accordingly, the amounts funded by third parties are recognized as an offset to our research and development expense rather than as revenue.
COLLABORATIVE ARRANGEMENTS. We enter into collaborative arrangements with manufacturers and suppliers of components used to build and maintain certain engines. Under these arrangements, we and our collaborative partners share in the risks and rewards of these programs through various revenue, cost and profit-sharing payment structures. We recognize revenue and costs for these arrangements based on the scope of work we are responsible for transferring to our customers. Our net payments to participants are primarily recorded as either cost of services sold ($4,144 million, $3,781 million and $2,890 million for the years ended December 31, 2024, 2023 and 2022, respectively) or as cost of equipment sold ($784 million, $663 million and $658 million for the years ended December 31, 2024, 2023 and 2022, respectively).
EQUITY METHOD INVESTMENTS. Equity method investments are investments in entities in which we do not have a controlling financial interest, but over which we have significant influence. Significant influence typically exists if we have a 20% to 50% ownership interest in the investee. Equity method investments are assessed for other-than-temporary impairment when events occur, or circumstances change that indicate it is more likely than not the fair value of the asset is below its carrying value. If a decline in the value of an equity method investment is determined to be other than temporary, a loss is recorded in earnings in the current period. Equity method investments are recognized within All other assets in our Statement of Financial Position. Our share of the results of equity method investments is recognized within Other income (loss) in our Statement Earnings (Loss) since the activities of the investee are closely aligned with our operations. See Notes 9 and 26 for further information.
We enter into related party transactions with certain equity method investments, of which, the most significant are with CFM International, a non-consolidated company jointly owned with Safran Aircraft Engines, a subsidiary of Safran Group of France. We make substantial sales of parts and services to CFM International. Related party transactions with other equity method investees primarily consist of purchases of engine parts or maintenance services, which are not significant with any single related party.
GOVERNMENT INCENTIVES. We receive grants and incentives from various federal, state, local, and foreign governments in exchange for compliance with certain conditions relating to our activities in a specific jurisdiction which encourage investment, job creation and retention, and environmental objectives including emissions reductions. We recognize government grants as a reduction to the related expense or asset when there is reasonable assurance that the Company will comply with the conditions of the grant, the grant is received or is probable of receipt and the amount is determinable. Government grants resulted in reductions of $117 million, $99 million and $100 million to research and development expense in 2024, 2023 and 2022, respectively.
CASH, CASH EQUIVALENTS AND RESTRICTED CASH. Cash, cash equivalents and restricted cash include cash on hand, demand deposits and short-term cash investment that are highly liquid in nature and have original maturities of three months or less, including
debt securities and money market instruments unless classified as available-for-sale investment securities. Restricted cash primarily comprised funds restricted in connection with certain ongoing litigation matters and amounted to an insignificant amount at both December 31, 2024 and 2023, respectively.
INVESTMENT SECURITIES. We report investments in available-for-sale debt securities and certain equity securities at fair value. Unrealized gains and losses on available-for-sale debt securities are recorded to other comprehensive income, net of applicable taxes. Unrealized gains and losses on equity securities with readily determinable fair values are recorded to earnings.
Although we generally do not have the intent to sell any specific debt securities in the ordinary course of managing our portfolio, we may sell debt securities prior to their maturities for a variety of reasons, including diversification, credit quality, yield and liquidity requirements and the funding of claims and obligations to policyholders.
We regularly review investment securities for impairment. For debt securities, if we do not intend to sell the security or it is not more likely than not that we will be required to sell the security before recovery of our amortized cost, we evaluate qualitative criteria, such as the financial health of and specific prospects for the issuer, to determine whether we do not expect to recover the amortized cost basis of the security. We also evaluate quantitative criteria including determining whether there has been an adverse change in expected future cash flows. If we do not expect to recover the entire amortized cost basis of the security, we consider the security to contain an expected credit loss, and we record the difference between the security’s amortized cost basis and its recoverable amount in earnings as an allowance for credit loss and the difference between the security’s recoverable amount and fair value in other comprehensive income. If we intend to sell the security or it is more likely than not we will be required to sell the security before recovery of its amortized cost basis, the security is considered impaired, and we recognize the entire difference between the security’s amortized cost basis and its fair value in earnings. See Note 3 for further information.
CURRENT RECEIVABLES. Amounts due from customers arising from the sales of equipment and services are recorded at the outstanding amount, less allowance for losses. We regularly monitor the recoverability of our receivables. See Note 4 for further information.
ALLOWANCE FOR CREDIT LOSSES. When we record customer receivables and contract assets arising from revenue transactions, as well as commercial mortgage loans and reinsurance recoverables in our run-off insurance operations, financial guarantees and certain commitments, we record an allowance for credit losses for the current expected credit losses (CECL) inherent in the asset over its expected life. The allowance for credit losses is a valuation account deducted from the amortized cost basis of the assets to present their net carrying value at the amount expected to be collected. Each period, the allowance for credit losses is adjusted through earnings to reflect expected credit losses over the remaining lives of the assets. We evaluate debt securities with unrealized losses to determine whether any of the losses arise from concerns about the issuer’s credit or the underlying collateral and record an allowance for credit losses, if required.
We estimate expected credit losses based on relevant information about past events, including historical experience, current conditions, and reasonable and supportable forecasts that affect the collectability of the reported amount. When measuring expected credit losses, we pool assets with similar country risk and credit risk characteristics. Changes in the relevant information may significantly affect the estimates of expected credit losses.
INVENTORIES. All inventories are stated at lower of cost or realizable values. Cost of inventories is primarily determined using the average cost method. See Note 5 for further information.
PROPERTY, PLANT AND EQUIPMENT. The cost of property, plant and equipment is generally depreciated on a straight-line basis over its estimated economic life. See Note 6 for further information.
LEASE ACCOUNTING FOR LESSEE ARRANGEMENTS. We evaluate whether our contractual arrangements contain leases at the inception of such arrangements. Specifically, we consider whether we can control the underlying asset and have the right to obtain substantially all of the economic benefits or outputs from the asset. At lease commencement, we record a lease liability and corresponding right-of-use (ROU) asset. Options to extend or terminate the lease are included as part of the ROU lease asset and liability when it is reasonably certain the Company will exercise the option. We have elected to include lease and non-lease components in determining our lease liability for all leased assets except our vehicle leases. Non-lease components are generally services that the lessor performs for the Company associated with the leased asset. As most of our leases do not provide an implicit rate, the present value of our lease liability is determined using our incremental collateralized borrowing rate at lease inception. We determine our incremental borrowing rate through market sources including relevant industry rates. For leases with an initial term of 12 months or less, an ROU asset and lease liability is not recognized and lease expense is recognized on a straight-line basis over the lease term. We test ROU assets whenever events or changes in circumstance indicate that the asset may be impaired.
GOODWILL AND OTHER INTANGIBLE ASSETS. We test goodwill at least annually for impairment at the reporting unit level. When testing goodwill for impairment, the Company may first assess qualitative factors. If an initial qualitative assessment identifies that it is more likely than not that the fair value of a reporting unit is less than its carrying value, additional quantitative testing is performed. The Company may also elect to forego the qualitative assessment and proceed directly to quantitative testing.
We recognize an impairment charge if the carrying amount of a reporting unit exceeds its fair value. When a portion of a reporting unit is disposed, goodwill is allocated to the gain or loss on disposition based on the relative fair values of the business or businesses disposed and the portion of the reporting unit that will be retained.
For other intangible assets that are not deemed indefinite-lived, cost is generally amortized on a straight-line basis over the asset’s estimated economic life, except for individually significant customer-related intangible assets that are amortized in relation to total related sales. Amortizable intangible assets are reviewed for impairment whenever events or changes in circumstances indicate that the related carrying amounts may not be recoverable. In these circumstances, they are tested for impairment based on undiscounted cash flows and, if impaired, written down to estimated fair value based on either discounted cash flows or appraised values. See Note 7 for further information.
DERIVATIVES AND HEDGING. We use derivatives to manage a variety of risks, including risks related to interest rates, foreign exchange, certain equity investments and commodity prices. We enter into derivative and other financial instruments with major investment grade financial institutions and have policies to monitor the credit risk of those counterparties. We limit counterparty exposure and concentration of risk by diversifying counterparties. While there can be no assurance, we do not anticipate any material non-performance by any of these counterparties.
Accounting for derivatives as hedges requires that, at inception and over the term of the arrangement, the hedged item and related derivative meet the requirements for hedge accounting. In evaluating whether a particular relationship qualifies for hedge accounting, we test effectiveness at inception and each reporting period thereafter by determining whether changes in the fair value of the derivative offset, within a specified range, changes in the fair value of the hedged item. If fair value changes fail this test, we discontinue applying hedge accounting to that relationship prospectively. Fair values of both the derivative instrument and the hedged item are calculated using internal valuation models incorporating market-based assumptions, subject to third-party confirmation, as applicable. See Note 22 for further information.
INCOME TAXES. Provisions for U.S. federal, state and local, and non-U.S. income taxes are calculated on reported earnings before income taxes based on current tax law and also include, in the current period, the cumulative effect of any changes in tax rates from those used previously in determining deferred tax assets and liabilities. Such provisions differ from the amounts currently receivable or payable because certain items of income and expense are recognized in different time periods for financial reporting purposes than for income tax purposes.
Deferred income tax balances reflect the effects of temporary differences between the carrying amounts of assets and liabilities and their tax bases, as well as from net operating loss and tax credit carryforwards, and are stated at enacted tax rates expected to be in effect when those taxes are paid or recovered. Deferred income tax assets represent amounts available to reduce income taxes payable on taxable income in future years. We evaluate the recoverability of these future tax deductions and credits by assessing the adequacy of future expected taxable income from all sources, including reversal of taxable temporary differences, forecasted operating earnings and available tax planning strategies. To the extent we consider it more likely than not that a deferred tax asset will not be recovered, a valuation allowance is established. Deferred taxes, as needed, are provided for our investment in affiliates and associated companies when we plan to remit those earnings. See Note 15 for further information.
Significant judgment is required when assessing our income tax positions and determining our tax expense and benefits and management evaluates the positions based on the facts, circumstances, and information available at the reporting date. The tax benefits recognized in the financial statements are based on the largest benefit that has a greater than 50% likelihood of being realized upon ultimate settlement with a taxing authority that has full knowledge of all relevant information. For those income tax positions where it is not more likely than not that a tax benefit will be sustained, no tax benefit has been recognized in the financial statements.
INSURANCE. Our run-off insurance operations include providing insurance and reinsurance for life and health risks and providing certain annuity products. Primary product types include long-term care, structured settlement annuities, life and disability insurance contracts and investment contracts. Insurance contracts are contracts with significant mortality and/or morbidity risks, while investment contracts are contracts without such risks. Insurance revenue is comprised primarily of premiums and investment income. For traditional long-duration insurance contracts, we report premiums as revenue when due. Premiums received on non-traditional long-duration insurance contracts and investment contracts, including annuities without significant mortality risk, are not reported as revenue but rather as deposit liabilities. We recognize revenue for charges and assessments on these contracts, mostly for mortality, administration and surrender. Interest credited to policyholder accounts is charged to expense.
Future policy benefit reserves represent the present value of future benefits to be paid to or on behalf of policyholders and related expenses less the present value of future net premiums. The liability is measured for each group of contracts (i.e., cohorts) using current cash flow assumptions. As a run-off insurance operation consisting substantially all of reinsurance, contracts are grouped into cohorts by legal entity and product type, based on the date the reinsurance contract was consummated. Future policy benefit reserves are adjusted each period as a result of updating lifetime net premium ratios for differences between actual and expected experience with the retroactive effect of those variances recognized in current period earnings. We review at least annually in the third quarter, future policy benefit reserves cash flow assumptions, except related claim expenses which remain locked-in, and if the review concludes that the assumptions need to be updated, future policy benefit reserves are adjusted retroactively based on the revised net premium ratio using actual historical experience, updated cash flow assumptions, and the locked-in discount rate with the effect of those changes recognized in current period earnings.
As our insurance operations are in run-off, the locked-in discount rate is used for the computation of interest accretion on future policy benefit reserves recognized in earnings. However, cash flows used to estimate future policy benefit reserves are also discounted using an upper-medium grade (i.e., low credit risk) fixed-income instrument yield reflecting the duration characteristics of the liabilities and is updated each reporting period with changes recorded in Accumulated other comprehensive income (loss) (AOCI). As a result, changes in the current discount rate at each reporting period are recognized as an adjustment to AOCI and not earnings each period, whereas, changes relating to cash flow assumptions are recognized in the Statement of Earnings (Loss).
Liabilities for investment contracts equal the account value, that is, the amount that accrues to the benefit of the contract or policyholder including credited interest and assessments through the financial statement date. See Note 12 for further information.
POSTRETIREMENT BENEFIT PLANS. We sponsor a number of pension and retiree health and life insurance benefit plans that we present in three categories, principal pension plans, other pension plans and principal retiree benefit plans. We use a December 31 measurement date for these plans. On our Statement of Financial Position, we measure our plan assets at fair value and the obligations at the present value of the estimated payments to plan participants. Participants earn benefits based on their service and pay. Those estimated future payment amounts are determined based on assumptions. Differences between our actual results and what we assumed are recorded in a separate component of equity each period. These differences are amortized into earnings over the remaining average future service of active employees or the expected life of inactive participants, as applicable, who participate in the plan. See Note 13 for further information.
LOSS CONTINGENCIES. Loss contingencies are existing conditions, situations or circumstances involving uncertainty as to possible loss that will ultimately be resolved when future events occur or fail to occur. Such contingencies include, but are not limited to environmental obligations, litigation, regulatory investigations and proceedings, product quality and losses resulting from other events and developments. When a loss is considered probable and reasonably estimable, we record a liability in the amount of our best estimate for the ultimate loss. When there appears to be a range of possible costs with equal likelihood, liabilities are based on the low-end of such range. Disclosure is provided for material loss contingencies when a loss is probable but a reasonable estimate cannot be made, and when it is reasonably possible that a loss will be incurred or the amount of a loss will exceed the recorded provision. We regularly review contingencies to determine whether the likelihood of loss has changed and to assess whether a reasonable estimate of the loss or range of loss can be made. See Note 24 for further information.
SUPPLY CHAIN FINANCE PROGRAMS. We evaluate supply chain finance programs to ensure where we use a third-party intermediary to settle our trade payables, their involvement does not change the nature, existence, amount or timing of our trade payables and does not provide the Company with any direct economic benefit. If any characteristics of the trade payables change or we receive a direct economic benefit, we reclassify the trade payables as borrowings.
FAIR VALUE MEASUREMENTS. The following sections describe the valuation methodologies we use to measure financial and non-financial instruments accounted for at fair value including certain assets within our pension plans and retiree benefit plans. Observable inputs reflect market data obtained from independent sources, while unobservable inputs reflect our market assumptions. These inputs establish a fair value hierarchy: Level 1 – Quoted prices for identical instruments in active markets; Level 2 – Quoted prices for similar instruments in active markets; quoted prices for identical or similar instruments in markets that are not active; and model-derived valuations whose inputs are observable or whose significant value drivers are observable; and Level 3 – Significant inputs to the valuation model are unobservable.
RECURRING FAIR VALUE MEASUREMENTS. For financial assets and liabilities measured at fair value on a recurring basis, primarily investment securities and derivatives, fair value is the price we would receive to sell an asset or pay to transfer a liability in an orderly transaction with a market participant at the measurement date. In the absence of active markets for the identical assets or liabilities, such measurements involve developing assumptions based on market observable data and, in the absence of such data, internal information that is consistent with what market participants would use in a hypothetical transaction that occurs at the measurement date. See Note 21 for further information.
Debt Securities. When available, we use quoted market prices to determine the fair value of debt securities which are included in Level 1. For our remaining debt securities, we obtain pricing information from an independent pricing vendor. The inputs and assumptions to the pricing vendor’s models are derived from market observable sources including benchmark yields, reported trades, broker/dealer quotes, issuer spreads, benchmark securities, bids, offers and other market-related data. These investments are included in Level 2. Our pricing vendors may also provide us with valuations that are based on significant unobservable inputs, and in those circumstances, we classify the investment securities in Level 3.
Annually, we conduct reviews of our primary pricing vendor to validate that the inputs used in that vendor’s pricing process are deemed to be market observable as defined in the standard. We believe that the prices received from our pricing vendor are representative of prices that would be received to sell the assets at the measurement date (exit prices) and are classified appropriately in the hierarchy. We use non-binding broker quotes and other third-party pricing services as our primary basis for valuation when there is limited, or no, relevant market activity for a specific instrument or for other instruments that share similar characteristics. Debt securities priced in this manner are included in Level 3.
Equity securities with readily determinable fair values. These publicly traded equity securities are valued using quoted prices and are included in Level 1.
Derivatives. The majority of our derivatives are valued using internal models. The models maximize the use of market observable inputs including interest rate curves and both forward and spot prices for currencies and commodities. Derivative assets and liabilities included in Level 2 primarily represent interest rate swaps, cross-currency swaps and foreign currency and commodity forward and option contracts.
Investments in private equity, real estate and collective funds held within our pension plans or run-off insurance operations. Most investments are generally valued using the net asset value (NAV) per share as a practical expedient for fair value provided certain criteria are met. The NAVs are determined based on the fair values of the underlying investments in the funds. Investments that are measured at fair value using the NAV practical expedient are not required to be classified in the fair value hierarchy. Investments classified within Level 3 primarily relate to real estate and private equities which are valued using unobservable inputs, primarily by discounting expected future cash flows, using comparative market multiples, third-party pricing sources, or a combination of these approaches as appropriate. See Notes 3 and 13 for further information.
NONRECURRING FAIR VALUE MEASUREMENTS. Certain assets are measured at fair value on a nonrecurring basis. These assets may include loans and long-lived assets reduced to fair value upon classification as held for sale, impaired loans based on the fair value of the underlying collateral, impaired equity securities without readily determinable fair value, equity method investments and long-lived assets and remeasured retained investments in formerly consolidated subsidiaries upon a change in control that results in the deconsolidation of that subsidiary and retention of a noncontrolling stake in the entity. Assets written down to fair value when impaired and retained investments are not subsequently adjusted to fair value unless further impairment occurs.
Equity investments without readily determinable fair value and Associated companies. Equity investments without readily determinable fair value and associated companies are valued using market observable data such as transaction prices when available. When market observable data is unavailable, investments are valued using either a discounted cash flow model, comparative market multiples, third-party pricing sources or a combination of these approaches as appropriate. These investments are generally included in Level 3.
Long-lived Assets. Fair values of long-lived assets are primarily derived internally and are based on observed sales transactions for similar assets or discounted cash flow estimates. In other instances for which we do not have comparable observed sales transaction data, collateral values are developed internally and corroborated by external appraisal information. Adjustments to third-party valuations may be performed in circumstances where market comparables are not specific to the attributes of the specific collateral or appraisal information may not be reflective of current market conditions due to the passage of time and the occurrence of market events since receipt of the information.
ADOPTIONS OF NEW ACCOUNTING STANDARDS. On January 1, 2023, we adopted ASU 2022-04, Liabilities—Supplier Finance Programs (Subtopic 405-50) Disclosure of Supplier Finance Program Obligations. This guidance requires disclosures for supply chain finance programs using a retrospective approach, except for the annual roll-forward which is applicable prospectively in the period beginning January 1, 2024. The adoption of this standard did not have a material impact on the Company’s consolidated financial statements.
In 2024, we adopted ASU No. 2023-07, Segment Reporting (Topic 280): Improvements to Reportable Segment Disclosures, on a retrospective basis. The amendments are intended to increase reportable segment disclosure requirements primarily through enhanced disclosures about significant segment expenses. Refer to Note 25 for further information.
NOTE 2. BUSINESSES HELD FOR SALE AND DISCONTINUED OPERATIONS. In the fourth quarter of 2022, we classified our captive industrial insurance subsidiary, Electric Insurance Company, domiciled in Massachusetts, into held for sale. In the second quarter of 2024, we completed the sale to Riverstone International Holdings Inc. for cash proceeds of $120 million.
In the second quarter of 2024, we classified our non-core licensing business into business held for sale. In the third quarter of 2024, we completed the sale to Dolby Laboratories, Inc. for cash proceeds of $441 million. GE Aerospace will retain intellectual property related to its core aerospace and defense technologies, as well as the trademark portfolio for the GE brand.
| | | | | | | | |
| ASSETS AND LIABILITIES OF BUSINESSES HELD FOR SALE | December 31, 2024 | December 31, 2023 |
| | |
| | |
| Non-current captive insurance investment securities | $ | — | | $ | 570 | |
| Property, plant and equipment and intangible assets - net | — | | 17 | |
| Valuation allowance on disposal group classified as held for sale | — | | (124) | |
| All other assets | — | | 77 | |
| Assets of businesses held for sale | $ | — | | $ | 541 | |
| | |
| | |
| Insurance liabilities and annuity benefits | $ | — | | $ | 376 | |
| Accounts payable and all other liabilities | — | | 1 | |
| Liabilities of businesses held for sale | $ | — | | $ | 378 | |
DISCONTINUED OPERATIONS primarily comprise our former GE Vernova and GE HealthCare businesses, our mortgage portfolio in Poland (Bank BPH) and other trailing assets and liabilities associated with prior dispositions. Results of operations, financial position and cash flows for these businesses are reported as discontinued operations for all periods presented and the notes to the financial statements have been adjusted on a retrospective basis.
GE Vernova. On April 2, 2024, we completed the previously announced separation of GE Vernova. The separation was structured as a tax-free spin-off and was achieved through the Company's pro-rata distribution of all the outstanding shares of GE Vernova to holders of the Company's common stock. In connection with the GE Vernova separation, the historical results of GE Vernova and certain assets and liabilities included in the separation are reported in GE Aerospace consolidated financial statements as discontinued operations. In addition, the Company contributed $515 million of cash to fund GE Vernova’s future operations such that GE Vernova’s cash balance on the date of separation was $4,242 million.
We have continuing involvement with GE Vernova primarily through ongoing sales of products, a transition services agreement, through which GE Aerospace and GE Vernova continue to provide certain services to each other for a period of time following the separation, a separation and distribution agreement, including performance and financial guarantees, a tax matters agreement and a trademark licensing agreement. For the nine months (post separation) ended December 31, 2024, we had direct and indirect sales of $248 million to GE Vernova, primarily related to engine sales and parts. We collected net cash of $943 million related to the transition services agreement and sales of engines and parts in 2024.
GE HealthCare. On January 3, 2023, we completed the previously announced separation of our HealthCare business, into a separate, independent, publicly traded company, GE HealthCare Technologies Inc. (GE HealthCare). The separation was structured as a tax-free spin-off and was achieved through the Company's pro-rata distribution of approximately 80.1% of the outstanding shares of GE HealthCare to holders of the Company's common stock. In connection with the separation, the historical results of GE HealthCare and certain assets and liabilities included in the separation are reported in GE Aerospace consolidated financial statements as discontinued operations.
We have continuing involvement with GE HealthCare primarily through a transition services agreement, through which GE Aerospace and GE HealthCare continue to provide certain services to each other for a period of time following the separation, a tax matters agreement and a trademark licensing agreement. For the year ended December 31, 2024, we collected net cash of $230 million related to these activities. As of December 31, 2024, the transition services agreement was completed.
Bank BPH. As previously reported, Bank BPH, along with other Polish banks, has been subject to ongoing litigation in Poland related to its portfolio of floating rate residential mortgage loans, with cases brought by individual borrowers seeking relief related to their foreign currency indexed or denominated mortgage loans in various courts throughout Poland. As previously reported, a settlement program was adopted and we recorded a charge of $1,014 million in the quarter ended June 30, 2023. The estimate of total losses for borrower litigation at Bank BPH was $2,461 million and $2,669 million as of December 31, 2024 and 2023, respectively. In order to maintain appropriate regulatory capital levels, in the quarter ended June 30, 2023, we made the previously reported non-cash capital contributions in the form of intercompany loan forgiveness of $1,797 million; no incremental contributions from GE Aerospace were required in 2024. For further information about factors that are relevant to the estimate of total losses for borrower litigation at Bank BPH, see Note 24. Future changes or adverse developments could increase our estimate of total losses and potentially require future cash contributions to Bank BPH.
The Bank BPH financing receivable portfolio is recorded at the lower of cost or fair value, less cost to sell, which reflects market yields and estimates with respect to ongoing borrower litigation. At December 31, 2024, the total portfolio had no carrying value, net of a valuation allowance. Earnings (loss) related to ongoing borrower litigation included zero, $1,189 million and $720 million in pre-tax charges for the years ended December 31, 2024, 2023 and 2022, respectively.
| | | | | | | | | | | | | | | |
RESULTS OF DISCONTINUED OPERATIONS For the year ended December 31, 2024 | GE Vernova | GE HealthCare | | Bank BPH & Other | Total |
| Total revenue | $ | 7,244 | | $ | — | | | $ | — | | $ | 7,244 | |
| Cost of equipment and services sold | (6,074) | | — | | | — | | (6,074) | |
| Other income, costs and expenses | (1,299) | | 21 | | | (41) | | (1,320) | |
| | | | | |
| Earnings (loss) of discontinued operations before income taxes | (129) | | 21 | | | (41) | | (150) | |
| Benefit (provision) for income taxes | 27 | | (5) | | | 17 | | 40 | |
| Earnings (loss) of discontinued operations, net of taxes | (102) | | 16 | | | (24) | | (110) | |
| | | | | |
| Gain (loss) on disposal before income taxes | — | | — | | | 21 | | 21 | |
| Benefit (provision) for income taxes | — | | — | | | (1) | | (1) | |
| Gain (loss) on disposal, net of taxes | — | | — | | | 19 | | 19 | |
| | | | | |
| Earnings (loss) from discontinued operations, net of taxes | $ | (102) | | $ | 16 | | | $ | (4) | | $ | (91) | |
| | | | | | | | | | | | | | | |
| For the year ended December 31, 2023 | GE Vernova | GE HealthCare | | Bank BPH & Other | Total |
| Total revenue | $ | 33,265 | | $ | — | | | $ | — | | $ | 33,265 | |
| Cost of equipment and services sold | (28,205) | | — | | | — | | (28,205) | |
| Other income, costs and expenses | (5,306) | | (50) | | | (1,252) | | (6,607) | |
| | | | | |
| Earnings (loss) of discontinued operations before income taxes | (246) | | (50) | | | (1,252) | | (1,547) | |
| Benefit (provision) for income taxes | (171) | | 1,706 | | | 4 | | 1,539 | |
| Earnings (loss) of discontinued operations, net of taxes | (417) | | 1,656 | | | (1,248) | | (8) | |
| | | | | |
| Gain (loss) on disposal before income taxes | — | | — | | | 6 | | 6 | |
| Benefit (provision) for income taxes | — | | — | | | — | | — | |
| Gain (loss) on disposal, net of taxes | — | | — | | | 6 | | 6 | |
| | | | | |
| Earnings (loss) from discontinued operations, net of taxes | $ | (417) | | $ | 1,656 | | | $ | (1,242) | | $ | (3) | |
| | | | | | | | | | | | | | | |
| For the year ended December 31, 2022 | GE Vernova | GE HealthCare | | Bank BPH & Other | Total |
| Total revenue | $ | 29,645 | | $ | 18,457 | | | $ | — | | $ | 48,102 | |
| Cost of equipment and services sold | (25,981) | | (11,265) | | | — | | (37,246) | |
| Other income, costs and expenses | (5,985) | | (4,842) | | | (808) | | (11,636) | |
| | | | | |
| Earnings (loss) of discontinued operations before income taxes | (2,322) | | 2,350 | | | (808) | | (780) | |
| Benefit (provision) for income taxes | 171 | | (521) | | | (32) | | (382) | |
| Earnings (loss) of discontinued operations, net of taxes | (2,151) | | 1,829 | | | (841) | | (1,163) | |
| | | | | |
| Gain (loss) on disposal before income taxes | — | | 6 | | | 58 | | 64 | |
| Benefit (provision) for income taxes | — | | 11 | | | 139 | | 150 | |
| Gain (loss) on disposal, net of taxes | — | | 17 | | | 196 | | 213 | |
| | | | | |
| Earnings (loss) from discontinued operations, net of taxes | $ | (2,151) | | $ | 1,846 | | | $ | (644) | | $ | (949) | |
The tax benefit for the year ended December 31, 2023 for GE HealthCare relates to retroactive 2023 Internal Revenue Service (IRS) guidance concerning foreign tax credits and accounting method changes and completion of the 2022 U.S. federal tax return, as well as net tax benefit resulting from preparatory steps for the spin-off.
| | | | | | | | |
| ASSETS AND LIABILITIES OF DISCONTINUED OPERATIONS | December 31, 2024 | December 31, 2023 |
| Cash, cash equivalents and restricted cash(a) | $ | 1,327 | | $ | 3,762 | |
| Current receivables | 13 | | 7,324 | |
| Inventories, including deferred inventory costs | — | | 8,245 | |
| Goodwill | — | | 4,437 | |
| Other intangible assets - net | — | | 1,053 | |
| Contract and other deferred assets | — | | 8,959 | |
| | |
| Property, plant, and equipment - net | 40 | | 5,306 | |
| All other assets | 438 | | 5,750 | |
| Deferred income taxes | 24 | | 3,093 | |
| Assets of discontinued operations(b)(c) | $ | 1,841 | | $ | 47,927 | |
| | |
| Accounts payable | $ | 30 | | $ | 8,475 | |
| Contract liabilities, progress collections & deferred income | — | | 15,255 | |
| Long-term borrowings | — | | 294 | |
| Non-current compensation and benefits | 33 | | 3,589 | |
| All other liabilities | 1,254 | | 11,600 | |
| Liabilities of discontinued operations(b)(c) | $ | 1,317 | | $ | 39,213 | |
(a) Included $1,324 million and $1,391 million of cash, cash equivalents and restricted cash related to Bank BPH as of December 31, 2024 and 2023, respectively.
(b) Included $1,594 million and $1,963 million of valuation allowances against financing receivables held for sale, of which $1,517 million and $1,712 million related to estimated borrower litigation losses, and $944 million and $957 million in All other liabilities, related to estimated borrower litigation losses for Bank BPH’s foreign currency-denominated mortgage portfolio, as of December 31, 2024 and 2023, respectively. Accordingly, total estimated losses related to borrower litigation were $2,461 million and $2,669 million as of December 31, 2024 and 2023, respectively. As a result of the settlement program, the valuation allowance completely offsets the financing receivables balance as of December 31, 2024.
(c) Included $102 million and $46,233 million of assets and $148 million and $38,021 million of liabilities for GE Vernova as of December 31, 2024 and 2023, respectively.
NOTE 3. INVESTMENT SECURITIES. The majority of our investment securities are held within our run-off insurance operations and are classified as non-current as they support the long-duration insurance liabilities and include debt securities all classified as available-for-sale, substantially all of which are investment-grade.
We sold our remaining equity shares in GE HealthCare during the fourth quarter of 2024. Our senior note from AerCap, for which we have adopted the fair value option and matures in the fourth quarter of 2025, is still outstanding as of December 31, 2024.
| | | | | | | | | | | | | | | | | | | | | | | | | | | | | |
| December 31, 2024 | | December 31, 2023 |
| Amortized
cost | Gross
unrealized
gains | Gross
unrealized
losses | Estimated
fair value | | Amortized
cost | Gross
unrealized
gains | Gross
unrealized
losses | Estimated
fair value |
| Equity (GE HealthCare) | $ | — | | $ | — | | $ | — | | $ | — | | | $ | — | | $ | — | | $ | — | | $ | 4,761 | |
| Equity note (AerCap) | — | | — | | — | | 982 | | | — | | — | | — | | 944 | |
| | | | | | | | | |
| Current investment securities | $ | — | | $ | — | | $ | — | | $ | 982 | | | $ | — | | $ | — | | $ | — | | $ | 5,706 | |
| Debt | | | | | | | | | |
| U.S. corporate | $ | 28,456 | | $ | 546 | | $ | (2,309) | | $ | 26,692 | | | $ | 27,495 | | $ | 1,034 | | $ | (1,606) | | $ | 26,923 | |
| Non-U.S. corporate | 2,970 | | 23 | | (302) | | 2,691 | | | 2,529 | | 34 | | (209) | | 2,353 | |
| State and municipal | 2,409 | | 22 | | (235) | | 2,196 | | | 2,828 | | 79 | | (185) | | 2,723 | |
| Mortgage and asset-backed | 5,007 | | 47 | | (183) | | 4,870 | | | 4,827 | | 34 | | (291) | | 4,571 | |
| Government and agencies | 1,180 | | 4 | | (118) | | 1,066 | | | 1,213 | | 3 | | (116) | | 1,100 | |
| Other equity | 225 | | — | | — | | 225 | | | 331 | | — | | — | | 331 | |
| Non-current investment securities | $ | 40,248 | | $ | 641 | | $ | (3,148) | | $ | 37,741 | | | $ | 39,222 | | $ | 1,183 | | $ | (2,406) | | $ | 38,000 | |
| | | | | | | | | |
The amortized cost of debt securities excludes accrued interest of $473 million and $466 million at December 31, 2024 and 2023, respectively, which is reported in All other current assets.
The estimated fair value of investment securities at December 31, 2024 decreased since December 31, 2023, primarily due to share sales of our GE HealthCare equity interest and lower investment values due to higher market yields partially offset by new investments at our run-off insurance operations.
Total estimated fair value of debt securities in an unrealized loss position were $21,876 million and $18,730 million, of which $14,011 million and $17,146 million had gross unrealized losses of $(2,795) million and $(2,370) million and had been in a loss position for 12 months or more at December 31, 2024 and 2023, respectively. Gross unrealized losses at December 31, 2024 included $(119) million related to commercial mortgage-backed securities (CMBS) collateralized by pools of commercial mortgage loans on real estate, and $(52) million related to asset-backed securities. The majority of our CMBS and asset-backed securities in an unrealized loss position have received investment-grade credit ratings from the major rating agencies. The majority of our U.S. and non-U.S. corporate securities' gross unrealized losses were in the consumer, electric, technology and energy industries. For our securities in an unrealized loss position, the losses are not indicative of credit losses, we currently do not intend to sell the investments, and it is not more likely than not that we will be required to sell the investments before recovery of their amortized cost basis.
| | | | | | | | | | | | | | |
| | | | |
| For the years ended December 31 | | | | 2024 | 2023 | 2022 |
| Net unrealized gains (losses) for equity securities with readily determinable fair value (RDFV) | | | | $ | 320 | | $ | 6,413 | | $ | (42) | |
| Proceeds from debt/equity securities sales and early redemptions | | | | 9,099 | | 12,595 | | 7,240 | |
| Gross realized gains on debt securities | | | | 75 | | 52 | | 34 | |
| Gross realized losses on debt securities | | | | (66) | | (66) | | (42) | |
Cash flows associated with purchases, dispositions and maturities of insurance investment securities are as follows:
| | | | | | | | |
| For the years ended December 31 | 2024 | 2023 |
| Purchases of investment securities | $ | (7,132) | | $ | (5,163) | |
| Dispositions and maturities of investment securities | 6,168 | | 4,176 | |
| Net (purchases) dispositions of insurance investment securities | $ | (963) | | $ | (986) | |
Contractual maturities of our debt securities (excluding mortgage and asset-backed securities) at December 31, 2024 are as follows:
| | | | | | | | |
| Amortized cost | Estimated fair value |
| Within one year | $ | 814 | | $ | 814 | |
| After one year through five years | 4,003 | | 4,065 | |
| After five years through ten years | 5,160 | | 5,160 | |
| After ten years | 25,039 | | 22,607 | |
We expect actual maturities to differ from contractual maturities because borrowers have the right to call or prepay certain obligations.
In addition to the equity securities described above, we held $1,439 million and $974 million of equity securities without RDFV including $1,410 million and $939 million at our run-off insurance operations at December 31, 2024 and 2023, respectively, that are classified within All other assets in our Statement of Financial Position. Fair value adjustments, including impairments, recorded in earnings were $159 million and $70 million for the years ended December 31, 2024 and 2023, respectively, and insignificant for December 31, 2022. These are primarily limited partnership investments in private equity, infrastructure and real estate funds that are measured at net asset value per share (or equivalent) as a practical expedient to estimated fair value and are excluded from the fair value hierarchy. These limited partnership investments are generally not eligible for redemption and generally cannot be sold without approval of the general partner. Distribution from each fund will be received as the underlying investments of the funds are liquidated at the discretion of the general partner. These investments are generally considered illiquid and our ability to receive the most recent net asset value in a sale would be determined by external market factors.
Our run-off insurance operations have approximately $700 million of assets held by states or other regulatory bodies in statutorily required deposit accounts, and approximately $29,800 million of assets held in trust accounts associated with reinsurance contracts and reinsurance security trust agreements in place between either Employers Reassurance Corporation (ERAC) or Union Fidelity Life Insurance Company (UFLIC) as the reinsuring entity and a number of ceding insurers. Assets in these trusts are held by an independent trustee for the benefit of the ceding insurer, and are subject to various investment guidelines as set forth in the respective reinsurance contracts and trust agreements. Some of these trust agreements may allow a ceding company to withdraw trust assets from the trust and hold these assets on its balance sheet, in an account under its control for the benefit of ERAC or UFLIC which might allow the ceding company to exercise investment control over such assets.
NOTE 4. CURRENT AND LONG-TERM RECEIVABLES
| | | | | | | | |
| CURRENT RECEIVABLES | |
| December 31 | 2024 | 2023 |
| | |
| | |
| | |
| | |
| | |
| | |
| Customer receivables | $ | 7,385 | | $ | 6,397 | |
| Revenue sharing and other partner receivables(a) | 1,113 | | 1,252 | |
| Non-income based tax receivables | 128 | | 129 | |
| Supplier advances | 546 | | 401 | |
| Receivables from disposed businesses | 99 | | 121 | |
| Other sundry receivables | 162 | | 534 | |
| Allowance for credit losses | (106) | | (132) | |
| Total current receivables | $ | 9,327 | | $ | 8,703 | |
| | |
(a) Revenue sharing and other partner receivables are primarily amounts due from revenue sharing partners who participate in engine programs by developing and supplying certain engine components through the life of the program or other partners who support our production or aftermarket activities. The revenue sharing partners share in program revenue, receive a share of customer progress payments and share costs related to discounts and warranties.
Sales of customer receivables. From time to time, the Company sells current or long-term receivables to third parties in response to customer-sponsored requests or programs, to facilitate sales, or for risk mitigation purposes. The Company sold current customer receivables to third parties and subsequently collected $494 million and $520 million in the years ended December 31, 2024 and 2023, respectively, related primarily to our participation in customer-sponsored supply chain finance programs. Within these programs, primarily in the Commercial Engines & Services business, the Company has no continuing involvement; fees associated with the transferred receivables are covered by the customer and cash is received at the original invoice value and due date.
| | | | | | | | | | | |
| LONG-TERM RECEIVABLES | | | | |
| | | | | |
| December 31 | 2024 | 2023 | | | |
| Long-term customer receivables | $ | 122 | | $ | 163 | | | | |
| Supplier advances | 50 | | 32 | | | | |
| Sundry receivables | 106 | | 158 | | | | |
| Allowance for credit losses | (85) | | (4) | | | | |
| | | | | |
| Total long-term receivables | $ | 194 | | $ | 349 | | | | |
NOTE 5. INVENTORIES, INCLUDING DEFERRED INVENTORY COSTS
| | | | | | | | |
| | |
| December 31 | 2024 | 2023 |
| Raw materials and work in process | $ | 7,372 | | $ | 6,531 | |
| Finished goods | 1,459 | | 1,209 | |
| Deferred inventory costs(a) | 932 | | 544 | |
| | |
| Inventories, including deferred inventory costs | $ | 9,763 | | $ | 8,284 | |
(a) Represents deferred labor and overhead costs on time and material service contracts and other costs of products and services for which the criteria for revenue recognition has not yet been met.
NOTE 6. PROPERTY, PLANT AND EQUIPMENT AND OPERATING LEASES
| | | | | | | | | | | | | | | | | | | | | | | |
| Depreciable lives | Original Cost | | | | Net Carrying Value |
| December 31 | (in years) | 2024 | 2023 | | | | | 2024 | 2023 |
| Land and improvements | 8 | $ | 131 | | $ | 128 | | | | | | $ | 129 | | $ | 126 | |
| Buildings, structures and related equipment | 8 - 40 | 3,146 | | 3,062 | | | | | | 1,369 | | 1,358 | |
| Machinery and equipment | 4 - 20 | 11,533 | | 11,160 | | | | | | 3,851 | | 3,876 | |
| Leasehold costs and manufacturing plant under construction | 1 - 10 | 1,084 | | 989 | | | | | | 872 | | 727 | |
| ROU operating lease assets | | | | | | | | 1,057 | | 1,160 | |
| Property, plant and equipment - net | | $ | 15,894 | | $ | 15,338 | | | | | | $ | 7,277 | | $ | 7,246 | |
| | | | | | | | | | | | | | | | | | | | | | | |
| Property, plant and
equipment additions | | Depreciation and amortization |
| December 31 | 2024 | 2023 | 2022 | | 2024 | 2023 | 2022 |
| Commercial Engines & Services | $ | 431 | | $ | 343 | | $ | 160 | | | $ | 370 | | $ | 356 | | $ | 362 | |
| Defense & Propulsion Technologies | 135 | | 145 | | 149 | | | 150 | | 147 | | 144 | |
| Corporate and Other (including supply chain) | 353 | | 278 | | 265 | | | 314 | | 294 | | 341 | |
| Total | $ | 920 | | $ | 766 | | $ | 574 | | | $ | 834 | | $ | 797 | | $ | 846 | |
Operating Lease Liabilities. Our current operating lease liabilities, included in All other current liabilities in our Statement of Financial Position were $283 million and $308 million, as of December 31, 2024 and 2023, respectively. Our non-current operating lease liabilities, included in All other liabilities in our Statement of Financial Position, were $822 million and $931 million, as of December 31, 2024 and 2023, respectively. Substantially all of our operating leases have remaining lease terms of 10 years or less, some of which may include options to extend.
| | | | | | | | | | | |
| OPERATING LEASE EXPENSE | 2024 | 2023 | 2022 |
| Long-term (fixed) | $ | 326 | | $ | 364 | | $ | 428 | |
| Long-term (variable) | 111 | | 26 | | 13 | |
| Short-term | 45 | | 115 | | 88 | |
| Total operating lease expense | $ | 482 | | $ | 506 | | $ | 529 | |
| | | | | | | | | | | | | | | | | | | | | | | | |
| MATURITY OF LEASE LIABILITIES | | 2025 | 2026 | 2027 | 2028 | 2029 | Thereafter | Total |
| Undiscounted lease payments | | $ | 276 | | $ | 239 | | $ | 185 | | $ | 143 | | $ | 128 | | $ | 398 | | $ | 1,369 | |
| Less: imputed interest | | | | | | | | (247) | |
| Total lease liability as of December 31, 2024 | | | | | | | | $ | 1,122 | |
| | | | | | | | | | | |
| SUPPLEMENTAL INFORMATION RELATED TO OPERATING LEASES | 2024 | 2023 | 2022 |
| Operating cash flows used for operating leases | $ | 352 | | $ | 427 | | $ | 456 | |
| Right-of-use assets obtained in exchange for new lease liabilities | 196 | | 275 | | 264 | |
| Weighted-average remaining lease term | 7.8 years | 7.7 years | 8.4 years |
| Weighted-average discount rate | 4.6 | % | 4.5 | % | 4.4 | % |
NOTE 7. GOODWILL AND OTHER INTANGIBLE ASSETS
In conjunction with the GE Vernova separation, we changed our segment reporting structure. As a result, all prior period balances for those segments were updated to reflect this change.
Changes in the carrying value of Goodwill for years ending December 31, 2024, 2023 and 2022 were as follows:
| | | | | | | | | | | |
| Commercial Engines & Services | Defense & Propulsion Technologies | Total |
| Balance at December 31, 2022 | $ | 6,386 | | $ | 2,449 | | $ | 8,835 | |
| | | |
| Goodwill adjustments(a) | 86 | | 26 | | 113 | |
| Balance at December 31, 2023 | $ | 6,472 | | $ | 2,476 | | $ | 8,948 | |
| Goodwill impairment | — | | (251) | | (251) | |
| Goodwill adjustments(a) | (131) | | (28) | | (159) | |
| Balance at December 31, 2024 | $ | 6,341 | | $ | 2,197 | | $ | 8,538 | |
(a) Goodwill adjustments are primarily related to foreign currency exchange.
Also in conjunction with the GE Vernova separation, the composition of our reporting units for evaluation of goodwill impairment has changed. As a result, we allocated goodwill among new and realigned reporting units using a relative fair value approach and performed assessments for the new reporting units. We assess the possibility that a reporting unit’s fair value has been reduced below its carrying amount due to the occurrence of events or circumstances between annual impairment testing dates. In the third quarter of 2024, we performed an interim impairment test at our Colibrium Additive reporting unit within our Defense & Propulsion Technologies segment given declines in the additive manufacturing industry due to slower adoption of technology, which incorporated a combination of income and market valuation approaches. The results of the analysis indicated that the carrying value of the reporting unit was in excess of fair value and, therefore, we recorded a non-cash impairment loss of $251 million in Goodwill impairments in our Statement of Earnings (Loss). After the impairment charges there is no remaining goodwill in the reporting unit. Colibrium Additive is a critical business for current and future technology at GE Aerospace as we continue to focus on where it can create the most value.
In the fourth quarter of 2024, we performed our annual impairment test. Based on the results of this test, the fair values of each of our reporting units exceeded their carrying values.
| | | | | | | | | | | | | | | | | | | | | | | | | | |
| | 2024 | | 2023 |
INTANGIBLE ASSETS SUBJECT TO AMORTIZATION December 31 | Useful lives
(in years) | Gross carrying
amount | Accumulated
amortization | Net | | Gross carrying
amount | Accumulated
amortization | Net |
| Customer-related(a) | 3-15 | $ | 3,850 | | $ | (2,083) | | $ | 1,767 | | | $ | 3,845 | | $ | (1,898) | | $ | 1,947 | |
| Patents and technology | 5-15 | 2,744 | | (759) | | 1,985 | | | 3,000 | | (814) | | 2,186 | |
| Capitalized software | 5 | 1,296 | | (803) | | 493 | | | 1,287 | | (796) | | 491 | |
| Trademarks & other | 13 | 70 | | (58) | | 13 | | | 73 | | (55) | | 18 | |
| Total | | $ | 7,960 | | $ | (3,703) | | $ | 4,257 | | | $ | 8,205 | | $ | (3,563) | | $ | 4,642 | |
(a) Balance includes payments made to our customers, primarily within our Commercial Engines & Services segment.
Intangible assets decreased $385 million in 2024, primarily as a result of amortization. Consolidated amortization expense was $350 million, $382 million and $338 million for the years ended December 31, 2024, 2023 and 2022, respectively.
Estimated consolidated annual pre-tax amortization for intangible assets over the next five calendar years are as follows:
| | | | | | | | | | | | | | | | | |
| ESTIMATED 5 YEAR CONSOLIDATED AMORTIZATION | 2025 | 2026 | 2027 | 2028 | 2029 |
| Estimated annual pre-tax amortization | $ | 348 | | $ | 343 | | $ | 329 | | $ | 322 | | $ | 323 | |
During 2024, we recorded additions to intangible assets subject to amortization of $136 million with a weighted-average amortizable period of 6.38 years, including capitalized software of $118 million, with a weighted-average amortizable period of 5 years.
NOTE 8. CONTRACT AND OTHER DEFERRED ASSETS, CONTRACT LIABILITIES AND DEFERRED INCOME & PROGRESS COLLECTIONS
Contract assets (liabilities) and other deferred assets (income), on a net basis, increased the net liability position by $915 million for the year ended December 31, 2024, primarily due to an increase in long-term service agreements liabilities of $1,092 million, partially offset by an increase in equipment and other service agreements of $111 million. In aggregate, the net liability for long-term service agreements increased primarily due to billings of $8,594 million and net unfavorable changes in estimated profitability of $56 million, primarily in Commercial Engines & Services, partially offset by revenue recognized of $7,668 million. Revenue recognized for contracts included in a liability position at the beginning of the year were $6,336 million and $5,717 million for the years ended December 31, 2024 and 2023, respectively.
| | | | | | | | | |
| CONTRACT ASSETS, LIABILITIES AND OTHER DEFERRED ASSETS AND INCOME | | December 31, 2024 | December 31, 2023 |
| Long-term service agreements | | $ | 2,374 | | $ | 2,377 | |
| Equipment and other service agreements | | 609 | | 498 | |
| Current contract assets | | $ | 2,982 | | $ | 2,875 | |
| | | |
| Nonrecurring engineering costs(a) | | $ | 2,438 | | $ | 2,444 | |
| Customer advances and other(b) | | 2,393 | | 2,342 | |
| Contract and other deferred assets | | 4,831 | | 4,785 | |
| Total contract and other deferred assets | | $ | 7,814 | | $ | 7,660 | |
| | | |
| Long-term service agreement liabilities | | $ | 8,994 | | $ | 7,902 | |
| Current deferred income | | 359 | | 420 | |
| Contract liabilities and current deferred income | | $ | 9,353 | | $ | 8,322 | |
| Non-current deferred income | | 1,013 | | 975 | |
| Total contract liabilities and deferred income | | $ | 10,366 | | $ | 9,297 | |
| Contract assets (liabilities) and other deferred assets (income) | | $ | (2,552) | | $ | (1,637) | |
(a) Includes contract fulfillment costs for engineering and development incurred prior to production for equipment production contracts, primarily within our DPT segment, which are amortized ratably over each unit produced. We assess the recoverability of these costs and if we determine the costs are no longer probable of recovery, the asset is impaired.
(b) Includes amounts due from customers within our CES segment for the sales of engines, spare parts and services, which we collect through fixed or usage-based billings from the sale of spare parts and servicing of equipment under long-term service agreements.
Progress collections increased $519 million in the year ended December 31, 2024 primarily due to collections received in excess of settlements at CES.
NOTE 9. ALL OTHER ASSETS. All other current assets and All other assets primarily include equity method investments, Insurance cash and cash equivalents, receivables and other investments in our run-off insurance operations, pension surplus and prepaid taxes and other deferred charges. All other non-current assets increased $2,215 million in the year ended December 31, 2024, primarily due to an increase in equity method and other investments of $1,122 million, an increase in indemnity assets of $421 million, primarily related to GE Vernova, an increase in prepaid taxes and deferred charges of $214 million, an increase in Insurance receivables of $196 million, an increase in pension surplus of $157 million and an increase in Insurance cash and cash equivalents of $151 million. Insurance cash and cash equivalents was $934 million and $784 million at December 31, 2024 and December 31, 2023, respectively.
NOTE 10. BORROWINGS
| | | | | | | | | | | | | | | | | |
| | | | | |
| December 31 | | 2024 | 2023 |
| Maturities | Amount | Average Rate | Amount | Average Rate |
| Current portion of long-term borrowings | | | | | |
| Senior unsecured | 2025 | $ | 1,952 | | 4.03 | % | $1,044 | 3.99 | % |
| Subordinated notes and other | 2025 | 87 | | | 27 | | |
| | | | | |
| Other short-term | | — | | | 37 | | |
| Total short-term borrowings | | $ | 2,039 | | | $ | 1,108 | | |
| | | | | |
| Maturities | Amount | Average Rate | Amount | Average Rate |
| Senior unsecured | 2026 - 2055 | $ | 15,467 | | 4.03 | % | $ | 17,509 | | 3.99 | % |
| Subordinated notes | 2035 - 2037 | 1,330 | | 4.43 | % | 1,383 | | 4.43 | % |
| | | | | |
| Other | | 437 | | | 525 | | |
| Total long-term borrowings | | $ | 17,234 | | | $ | 19,417 | | |
| Total borrowings | | $ | 19,273 | | | $ | 20,525 | | |
Long-term debt maturities are below:
| | | | | | | | | | | | | | | | | | | | | | | | | | | | |
| | | 2025 | | 2026 | 2027 | 2028 | 2029 | Thereafter | Total |
| | | | | | | | | | |
| | | | | | | | | | |
| Long-term debt maturities | | | 2,039 | | (a) | 1,304 | | 1,493 | | 452 | | 1,445 | | 12,540 | | 19,273 | |
(a) Fixed and floating rate notes of $315 million contain put options with exercise dates in 2025, which contractually mature after 2025.
NOTE 11. ACCOUNTS PAYABLE
| | | | | | | | |
| December 31 | 2024 | 2023 |
| | |
| Trade payables | $ | 6,254 | | $ | 5,290 | |
| Supply chain finance programs | 1,259 | | 1,472 | |
| Sundry payables | 397 | | 754 | |
| | |
| Accounts payable | $ | 7,909 | | $ | 7,516 | |
We facilitate voluntary supply chain finance programs with third parties, which provide participating suppliers the opportunity to sell their GE Aerospace receivables to third parties at the sole discretion of both the suppliers and the third parties. Total supplier invoices paid through these third-party programs were $3,798 million and $3,110 million for the years ended December 31, 2024 and 2023, respectively. GE Aerospace has no costs associated with this program.
NOTE 12. INSURANCE LIABILITIES AND ANNUITY BENEFITS. Insurance liabilities and annuity benefits comprise substantially all obligations to annuitants and insureds in our run-off insurance operations. Our insurance operations (net of eliminations) generated revenue of $3,581 million, $3,389 million and $2,957 million, profit was $1,022 million, $332 million and $205 million and net earnings was $806 million, $260 million and $159 million, for the years ended December 31, 2024, 2023 and 2022, respectively. These operations were primarily supported by investment securities of $37,352 million and $37,592 million, limited partnerships of $4,321 million and $3,300 million, a diversified commercial mortgage loan portfolio substantially all collateralized by first liens on U.S. commercial real estate properties of $1,887 million and $1,947 million (net of allowance for credit losses of $46 million and $48 million), and residential mortgage loans of $251 million and $0 million (net of allowance for credit losses of an insignificant amount), as of December 31, 2024 and 2023, respectively. As of December 31, 2024, the commercial mortgage loan portfolio had one delinquent loan, no non-accrual loans and about one-third of the portfolio was held in the office sector, which had a weighted average loan-to-value ratio of 69%, debt service coverage of 1.7, and no scheduled maturities through 2025. A summary of our insurance liabilities and annuity benefits is presented below.
| | | | | | | | | | | | | | | | | |
| December 31, 2024 | Long-term care | Structured settlement annuities | Life | Other contracts | Total |
| Future policy benefit reserves | $ | 24,675 | | $ | 8,426 | | $ | 1,018 | | $ | 357 | | $ | 34,476 | |
| Investment contracts | — | | 719 | | — | | 621 | | 1,340 | |
| Other | — | | — | | 116 | | 277 | | 394 | |
| | | | | |
| | | | | |
| Total | $ | 24,675 | | $ | 9,145 | | $ | 1,134 | | $ | 1,254 | | $ | 36,209 | |
| | | | | | | | | | | | | | | | | |
| December 31, 2023 | | | | | |
| Future policy benefit reserves | $ | 26,832 | | $ | 9,357 | | $ | 1,117 | | $ | 382 | | $ | 37,689 | |
| Investment contracts | — | | 793 | | — | | 694 | | 1,487 | |
| Other | — | | — | | 116 | | 285 | | 400 | |
| | | | | |
| | | | | |
| Total | $ | 26,832 | | $ | 10,150 | | $ | 1,233 | | $ | 1,361 | | $ | 39,576 | |
The following tables summarize balances of and changes in future policy benefit reserves.
| | | | | | | | | | | | | | | | | | | | | | | | | | | |
| December 31, 2024 | | | | December 31, 2023 | | |
| Present value of expected net premiums | Long-term care | Structured settlement annuities | Life | | | | Long-term care | Structured settlement annuities | Life | | |
| Balance, beginning of year | $ | 4,063 | | $ | — | | $ | 4,803 | | | | | $ | 4,059 | | $ | — | | $ | 4,828 | | | |
| Beginning balance at locked-in discount rate | 3,745 | | — | | 4,773 | | | | | 3,958 | | — | | 5,210 | | | |
| Effect of changes in cash flow assumptions | 465 | | — | | (1) | | | | | (4) | | — | | (77) | | | |
| Effect of actual variances from expected experience | (26) | | — | | 8 | | | | | (22) | | — | | (300) | | | |
| Adjusted beginning of year balance | 4,184 | | — | | 4,780 | | | | | 3,932 | | — | | 4,833 | | | |
| Interest accrual | 209 | | — | | 177 | | | | | 207 | | — | | 192 | | | |
| Net premiums collected | (403) | | — | | (309) | | | | | (394) | | — | | (315) | | | |
| Effect of foreign currency | — | | — | | (234) | | | | | — | | — | | 64 | | | |
| Ending balance at locked-in discount rate | 3,991 | | — | | 4,415 | | | | | 3,745 | | — | | 4,773 | | | |
| Effect of changes in discount rate assumptions | 154 | | — | | (97) | | | | | 318 | | — | | 30 | | | |
| Balance, end of year | $ | 4,144 | | $ | — | | $ | 4,318 | | | | | $ | 4,063 | | $ | — | | $ | 4,803 | | | |
| | | | | | | | | | | |
| Present value of expected future policy benefits | | | | | | | | | | | |
| Balance, beginning of year | $ | 30,895 | | $ | 9,357 | | $ | 5,921 | | | | | $ | 28,316 | | $ | 8,860 | | $ | 5,868 | | | |
| Beginning balance at locked-in discount rate | 27,144 | | 8,561 | | 5,847 | | | | | 27,026 | | 8,790 | | 6,247 | | | |
| Effect of changes in cash flow assumptions | 238 | | — | | 24 | | | | | (45) | | (16) | | 49 | | | |
| Effect of actual variances from expected experience | 25 | | (36) | | (1) | | | | | (13) | | 19 | | (241) | | | |
| Adjusted beginning of year balance | 27,406 | | 8,525 | | 5,870 | | | | | 26,968 | | 8,793 | | 6,055 | | | |
| Interest accrual | 1,485 | | 441 | | 218 | | | | | 1,454 | | 454 | | 232 | | | |
| Benefit payments | (1,443) | | (664) | | (430) | | | | | (1,278) | | (687) | | (508) | | | |
| Effect of foreign currency | — | | — | | (246) | | | | | — | | — | | 67 | | | |
| Ending balance at locked-in discount rate | 27,448 | | 8,301 | | 5,411 | | | | | 27,144 | | 8,561 | | 5,847 | | | |
| Effect of changes in discount rate assumptions | 1,371 | | 125 | | (76) | | | | | 3,752 | | 797 | | 74 | | | |
| Balance, end of year | $ | 28,820 | | $ | 8,426 | | $ | 5,336 | | | | | $ | 30,895 | | $ | 9,357 | | $ | 5,921 | | | |
| Net future policy benefit reserves | $ | 24,675 | | $ | 8,426 | | $ | 1,018 | | | | | $ | 26,832 | | $ | 9,357 | | $ | 1,117 | | | |
| Less: Reinsurance recoverables, net of allowance for credit losses | (169) | | — | | (32) | | | | | (166) | | — | | (33) | | | |
| Net future policy benefit reserves, after reinsurance recoverables | $ | 24,507 | | $ | 8,426 | | $ | 985 | | | | | $ | 26,666 | | $ | 9,357 | | $ | 1,084 | | | |
| Weighted-average duration of liability (years)(a) | 11.7 | 10.3 | 5.3 | | | | 12.8 | 11.3 | 5.3 | | |
| Weighted-average interest accretion rate | 5.6% | 5.4% | 5.1% | | | | 5.5% | 5.4% | 5.0% | | |
| Current discount rate | 5.6% | 5.5% | 5.1% | | | | 4.9% | 4.8% | 4.7% | | |
| Gross premiums or assessments recognized during period | $ | 479 | | $ | — | | $ | 353 | | | | | $ | 496 | | $ | — | | $ | 363 | | | |
| Expected future gross premiums, undiscounted | 7,548 | | — | | 11,343 | | | | | 7,379 | | — | | 12,388 | | | |
| Expected future gross premiums, discounted(a) | 4,745 | | — | | 5,205 | | | | | 4,895 | | — | | 5,800 | | | |
| Expected future benefit payments, undiscounted | 62,001 | | 18,589 | | 10,336 | | | | | 63,126 | | 19,291 | | 11,202 | | | |
| Expected future benefit payments, discounted(a) | 28,820 | | 8,426 | | 5,336 | | | | | 30,895 | | 9,357 | | 5,921 | | | |
(a) Determined using the current discount rate as of December 31, 2024 and 2023.
Our 2024 and 2023 annual reviews of future policy benefit reserves cash flow assumptions resulted in immaterial charges to net earnings, indicating claims experience continues to develop consistently with our models.
Included in Insurance losses and annuity benefits in our Statement of Earnings (Loss) for the years ended December 31, 2024 and 2023 are favorable and unfavorable pre-tax adjustments of $196 million and $(155) million, respectively, from updating the net premium ratio (i.e., the percentage of projected gross premiums required to cover expected policy benefits and related expenses) after updating for actual historical experience each quarter and updating of future cash flow assumptions. Included in these amounts for the years ended December 31, 2024 and 2023, are unfavorable adjustments of $109 million and $335 million, respectively, due to insufficient gross premiums (i.e., net premium ratio exceeded 100%), related to certain cohorts in our long-term care and life insurance portfolios. These adjustments are primarily attributable to increases in the net premium ratio as a result of updating future cash flow assumptions on cohorts where the beginning of the period net premium ratio exceeded 100%.
As of December 31, 2024 and 2023, policyholders account balances totaled $1,574 million and $1,725 million, respectively. As our insurance operations are in run-off, changes in policyholder account balances for the years ended December 31, 2024 and 2023 are primarily attributed to surrenders, withdrawals, and benefit payments of $432 million and $489 million, partially offset by net additions from separate accounts and interest credited of $276 million and $245 million, respectively. Interest on policyholder account balances is generally credited at minimum guaranteed rates, primarily between 3.0% and 6.0% at both December 31, 2024 and 2023.
Reinsurance recoveries are recorded as a reduction of Insurance losses, annuity benefits and other costs in our Statement of Earnings (Loss) and amounted to $104 million, $108 million and $321 million for the years ended December 31, 2024, 2023 and 2022, respectively. Reinsurance recoverables, net of allowances of insignificant amounts, are included in non-current All other assets in our Statement of Financial Position, and amounted to $216 million and $213 million as of December 31, 2024 and 2023, respectively.
Statutory accounting practices, not GAAP, determine the required statutory capital levels of our insurance legal entities. Statutory accounting practices are set forth by the National Association of Insurance Commissioners as well as state laws, regulation and general administrative rules and differ in certain respects from GAAP. We annually perform statutory asset adequacy testing, the results of which may affect the amount or timing of capital contributions from GE Aerospace to the insurance legal entities.
Following approval of a statutory permitted accounting practice in 2018 by our primary regulator, the Kansas Insurance Department, we have since provided a total of $15,035 million of capital contributions to our run-off insurance subsidiaries, including the final contribution of $1,820 million in the first quarter of 2024. GE Aerospace is a party to capital maintenance agreements with its run-off insurance subsidiaries under which GE Aerospace is required to maintain their statutory capital levels at 300% of their year-end Authorized Control Level risk-based capital requirements as defined from time to time by the NAIC.
In June 2024, we signed an agreement to exit our Canadian life and health insurance portfolio, which had reserves of $213 million at December 31, 2024, via an assumption reinsurance transaction. We received regulatory approval in December 2024 and expect the transaction to close in the first quarter of 2025.
See Notes 1, 3 and 9 for further information related to our run-off insurance operations.
NOTE 13. POSTRETIREMENT BENEFIT PLANS
PENSION BENEFITS AND RETIREE HEALTH AND LIFE BENEFITS. We sponsor a number of pension and retiree health and life insurance benefit plans that we present in three categories, principal pension plans, other pension plans and principal retiree benefit plans. Smaller pension plans with pension assets or obligations that have not reached $50 million and other retiree benefit plans are not presented.
Effective January 1, 2023, certain postretirement benefit plans and liabilities were legally split or allocated between GE HealthCare, GE Vernova and GE Aerospace. In connection with the separations, net liabilities associated with GE's postretirement benefit plans, including a portion of the principal pension plans, other pension plans and the principal retiree benefit plans, were transferred to GE HealthCare and GE Vernova and are now reported in discontinued operations. See Note 2 for more information regarding the separations. The amounts that remain with GE Aerospace following the separations are shown as continuing operations in the aggregate rather than for each remaining split plan. Assumptions used in calculations, estimates of future benefit payments and funding, and other forward looking statements are for continuing operations unless otherwise noted.
| | | | | | | | | | | | | | |
| DESCRIPTION OF OUR PLANS | | |
| Plan Category | Participants | Funding | Comments |
| Principal Pension Plans | GE Aerospace Pension Plan | Covers U.S. GE Aerospace participants: ~79,000 retirees and beneficiaries, ~34,000 vested former employees and ~9,000 active employees | Our funding policy is to contribute amounts sufficient to meet minimum funding requirements under employee benefit and tax laws. We may decide to contribute additional amounts beyond this level. | Closed to new participants since 2012. Benefits for employees with salaried benefits were frozen effective January 1, 2021, and thereafter these employees receive increased company contributions in the company sponsored defined contribution plan in lieu of participation in a defined benefit plan (announced October 2019). |
| GE Aerospace Supplementary Pension Plan | Provides supplementary benefits to higher-level, longer-service U.S. employees | Unfunded. We pay benefits on a pay-as-you-go basis from company cash. | The annuity benefit has been closed to new participants since 2011 and has been replaced by an installment benefit (which was closed to new executives after 2020). Benefits for employees who became executives before 2011 were frozen effective January 1, 2021, and thereafter these employees accrue the installment benefit. |
| Other Pension Plans(a) | 9 U.S. and non-U.S. pension plans with pension assets or obligations that have reached $50 million | Covers ~10,500 retirees and beneficiaries, ~10,300 vested former employees and ~600 active employees | Our funding policy is to contribute amounts sufficient to meet minimum funding requirements under employee benefit and tax laws in each country. We may decide to contribute additional amounts beyond this level. We pay benefits for some plans from company cash. | In certain countries, benefit accruals have ceased and/or have been closed to new hires as of various dates. |
| Principal Retiree Benefit Plans | Provides health and life insurance benefits to certain eligible participants | Covers U.S. GE Aerospace participants: ~45,800 retirees and dependents and ~10,000 active employees | We fund retiree benefit plans on a pay-as-you-go basis and the retiree benefit insurance trust at our discretion. | Participants share in the cost of the healthcare benefits. |
(a) Plans for GE Aerospace that reach $50 million are not removed from the presentation unless part of a disposition or plan termination.
| | | | | | | | | | | | | | | | | | | | | | | | | | |
| FUNDING STATUS BY PLAN TYPE | Benefit Obligation | | Fair Value of Assets | | Deficit/(Surplus) |
| 2024 | 2023 | | 2024 | 2023 | | 2024 | 2023 |
| Principal Pension Plans: | | | | | | | | |
| GE Aerospace Pension Plan (subject to regulatory funding) | $ | 21,010 | | $ | 22,437 | | | $ | 19,020 | | $ | 20,253 | | | $ | 1,990 | | $ | 2,184 | |
| GE Aerospace Supplementary Pension Plan | 2,814 | | 3,000 | | | — | | — | | | 2,814 | | 3,000 | |
| | 23,824 | | 25,437 | | | 19,020 | | 20,253 | | | 4,804 | | 5,184 | |
| Other Pension Plans: | | | | | | | | |
| Subject to regulatory funding | 2,736 | | 3,225 | | | 3,592 | | 3,913 | | | (856) | | (688) | |
| Not subject to regulatory funding | 404 | | 440 | | | — | | — | | | 404 | | 440 | |
| Principal retiree benefit plans for GE Aerospace | 1,202 | | 1,289 | | | 6 | | 8 | | | 1,196 | | 1,281 | |
| | | | | | | | |
| Total plans subject to regulatory funding | 23,746 | | 25,662 | | | 22,612 | | 24,166 | | | 1,134 | | 1,496 | |
| Total plans not subject to regulatory funding | 4,420 | | 4,729 | | | 6 | | 8 | | | 4,414 | | 4,721 | |
| Total plans | 28,166 | | 30,391 | | | 22,618 | | 24,174 | | | 5,548 | | 6,217 | |
Due to the spin-off of Vernova on April 2, 2024, as discussed in Note 1, we have excluded 2023 GE Vernova benefit obligations of $18,258, assets of $16,342, and a deficit of $1,916 from the above funding status by plan type chart.
FUNDING. The Employee Retirement Income Security Act (ERISA) determines minimum funding requirements in the U.S. No contributions were required or made for the GE Aerospace Pension Plan during 2024 and based on our current assumptions, we do not anticipate having to make additional required contributions in the near future. On an ERISA basis, our estimate for 2024 is that the GE Aerospace Pension Plan was 85% funded and the U.S. GAAP funded status is 91%.
In 2025, we expect to make payments of approximately $210 million for our GE Aerospace Supplementary Pension Plan benefits and remaining principal pension plans administrative costs. We also expect to contribute approximately $40 million to other pension plans in 2025. We fund retiree benefit plans on a pay-as-you-go basis and the retiree benefit insurance trust at our discretion. We expect to contribute approximately $120 million to fund such benefits in 2025.
| | | | | | | | | | | | | | | | | | | | | | | | | | | | | | | | | | | |
|
| COST OF OUR BENEFITS PLANS AND ASSUMPTIONS | 2024 | | 2023 | | 2022 |
| Principal pension | Other pension | Principal retiree benefit | | Principal pension | Other pension | Principal retiree benefit | | Principal pension | Other pension | Principal retiree benefit |
| Components of expense (income) | | | | | | | | | | | |
| Service cost - operating | $ | 71 | | $ | 22 | | $ | 13 | | | $ | 94 | | $ | 37 | | $ | 17 | | | $ | 221 | | $ | 86 | | $ | 39 | |
| Interest cost | 1,401 | | 227 | | 71 | | | 1,892 | | 422 | | 111 | | | 2,069 | | 398 | | 108 | |
| Expected return on plan assets | (1,751) | | (310) | | — | | | (2,376) | | (587) | | — | | | (3,142) | | (967) | | — | |
| Amortization of net loss (gain) | (468) | | 41 | | (82) | | | (723) | | 20 | | (124) | | | 1,422 | | 101 | | (115) | |
| Amortization of prior service cost (credit) | 6 | | (1) | | (103) | | | 5 | | (4) | | (148) | | | 5 | | (8) | | (235) | |
| Curtailment / settlement loss (gain) | — | | | — | | | — | | (6) | | — | | | — | | (6) | | — | |
| Non-operating | $ | (812) | | $ | (43) | | $ | (114) | | | $ | (1,202) | | $ | (155) | | $ | (161) | | | $ | 354 | | $ | (482) | | $ | (242) | |
| Net periodic expense (income) | $ | (741) | | $ | (21) | | $ | (101) | | | $ | (1,108) | | $ | (118) | | $ | (144) | | | $ | 575 | | $ | (396) | | $ | (203) | |
| Less: discontinued operations | (88) | | (12) | | (15) | | | (377) | | (78) | | (57) | | | 270 | | (320) | | (134) | |
| Continuing operations - net periodic expense (income) | $ | (653) | | $ | (9) | | $ | (86) | | | $ | (731) | | $ | (40) | | $ | (87) | | | $ | 305 | | $ | (76) | | $ | (69) | |
| Weighted-average benefit obligations assumptions | | | | | | | | | | | |
| Discount rate | 5.67 | % | 5.48 | % | 5.51 | % | | 5.18 | % | 3.93 | % | 5.09 | % | | 5.53 | % | 4.59 | % | 5.43 | % |
| Compensation increases | 6.00 | | 3.10 | | 6.00 | | | 3.86 | | 2.24 | | 3.25 | | | 3.07 | | 2.44 | | 3.12 | |
| Initial healthcare trend rate(a) | N/A | N/A | 7.00 | | | N/A | N/A | 6.50 | | | N/A | N/A | 6.40 | |
| Weighted-average benefit cost assumptions | | | | | | | | | | | |
| Discount rate | 5.18 | | 3.93 | | 5.09 | | | 5.53 | | 4.59 | | 5.43 | | | 2.94 | | 1.93 | | 2.64 | |
| Expected rate of return on plan assets | 7.00 | | 5.34 | | — | | | 7.00 | | 5.66 | | — | | | 6.00 | | 4.80 | | — | |
(a) Current forecast is 7%, but is estimated to decline to 5% for 2034 and thereafter.
Net periodic benefit income from continuing operations in 2025 is estimated to be approximately $725 million, which is a decrease of approximately $25 million as compared to 2024. The decrease is primarily due to investment performance offset by the impact of discount rates.
The components of net periodic benefit costs, other than the service cost component, are included in Non-operating benefit cost (income) in our Statement of Earnings (Loss).
| | | | | | | | | | | | | | | | | | | | | | | | | | | | | | | | | | | |
| PLAN FUNDED STATUS AND AMOUNTS RECORDED IN ACCUMULATED OTHER COMPREHENSIVE LOSS (INCOME) |
| 2024 | | 2023 |
| Principal pension | | Other pension | | Principal retiree benefit | | Principal pension | | Other pension | | Principal retiree benefit |
| Change in benefit obligations | | | | | | | | | | | |
| Balance at January 1 | $ | 36,217 | | | $ | 10,377 | | | $ | 2,055 | | | $ | 53,591 | | | $ | 13,916 | | | $ | 3,304 | |
| Service cost | 71 | | | 22 | | | 13 | | | 94 | | | 37 | | | 17 | |
| Interest cost | 1,401 | | | 227 | | | 71 | | | 1,892 | | | 422 | | | 111 | |
| Participant contributions | 8 | | | 4 | | | 21 | | | 10 | | | 19 | | | 31 | |
| Plan amendments | — | | | — | | | — | | | 49 | | | — | | | — | |
| Actuarial loss (gain) - net | (1,049) | | (a) | (435) | | (a) | (15) | | (a) | 1,081 | | (a) | 526 | | (a) | (5) | |
| Benefits paid | (1,957) | | | (305) | | | (192) | | | (2,503) | | | (618) | | | (254) | |
| | | | | | | | | | | |
| | | | | | | | | | | |
| Dispositions/acquisitions/other - net | (10,867) | | | (6,548) | | | (751) | | | (17,997) | | | (4,387) | | | (1,149) | |
| Exchange rate adjustments | — | | | (202) | | | — | | | — | | | 462 | | | — | |
| Balance at December 31 | $ | 23,824 | | (b) | $ | 3,140 | | | $ | 1,202 | | (c) | $ | 36,217 | | | $ | 10,377 | | | $ | 2,055 | |
| Change in plan assets | | | | | | | | | | | |
| Balance at January 1 | $ | 29,744 | | | $ | 10,764 | | | $ | 8 | | | $ | 44,993 | | | $ | 14,663 | | | $ | 10 | |
| Actual return on plan assets | 440 | | | (109) | | | — | | | 1,869 | | | 442 | | | — | |
| Employer contributions | 216 | | | 60 | | | 169 | | | 212 | | | 161 | | | 221 | |
| Participant contributions | 8 | | | 4 | | | 21 | | | 10 | | | 19 | | | 31 | |
| Benefits paid | (1,957) | | | (305) | | | (192) | | | (2,503) | | | (618) | | | (254) | |
| | | | | | | | | | | |
| Dispositions/acquisitions/other - net | (9,431) | | | (6,611) | | | — | | | (14,837) | | | (4,439) | | | — | |
| Exchange rate adjustments | — | | | (211) | | | — | | | — | | | 536 | | | — | |
| Balance at December 31 | $ | 19,020 | | | $ | 3,592 | | | $ | 6 | | | $ | 29,744 | | | $ | 10,764 | | | $ | 8 | |
| Funded status - surplus (deficit) | $ | (4,804) | | | $ | 452 | | | $ | (1,196) | | | $ | (6,473) | | | $ | 387 | | | $ | (2,047) | |
Amounts recorded in
Statement of Financial Position | | | | | | | | | | | |
| Continuing operations: | | | | | | | | | | | |
| Non-current assets - other | $ | — | | | $ | 876 | | | $ | — | | | $ | — | | | $ | 714 | | | $ | — | |
| Current liabilities - other | (199) | | | (34) | | (118) | | | (194) | | | (35) | | | (128) | |
| Non-current liabilities - compensation and benefits | (4,605) | | | (390) | | | (1,078) | | | (4,990) | | | (431) | | | (1,153) | |
| Discontinued operations: | | | | | | | | | | | |
| Non-current assets | — | | | — | | | — | | | — | | | 775 | | | — | |
| Current and non-current liabilities | — | | | — | | | — | | | (1,289) | | | (636) | | | (766) | |
| Net amount recorded | $ | (4,804) | | | $ | 452 | | | $ | (1,196) | | | $ | (6,473) | | | $ | 387 | | | $ | (2,047) | |
| Amounts recorded in Accumulated other comprehensive loss (income) | | | | | | | | | | | |
| Prior service cost (credit) | $ | (40) | | | $ | 9 | | | $ | (455) | | | $ | (25) | | | $ | (16) | | | $ | (909) | |
| Net loss (gain) | (530) | | | 803 | | (559) | | | (1,454) | | | 1,680 | | | (990) | |
| Total recorded in Accumulated other comprehensive loss (income) | $ | (570) | | | $ | 812 | | | $ | (1,014) | | | $ | (1,479) | | | $ | 1,664 | | | $ | (1,899) | |
(a)Principally due to impact of discount rates.
(b)The benefit obligation for the GE Aerospace Supplementary Pension Plan, which is unfunded, was $2,814 million at December 31, 2024.
(c)The benefit obligation for retiree health plans for GE Aerospace was $716 million at December 31, 2024.
ASSUMPTIONS USED IN CALCULATIONS. Our defined benefit pension plans are accounted for on an actuarial basis, which requires the selection of various assumptions, including a discount rate, a compensation assumption, an expected return on assets, mortality rates of participants and expectation of mortality improvement.
Projected benefit obligations are measured as the present value of expected benefit payments. We discount those cash payments using a discount rate. We determine the discount rate using the weighted-average yields on high-quality fixed-income securities with maturities that correspond to the payment of benefits. Lower discount rates increase present values and generally increase subsequent-year pension expense; higher discount rates decrease present values and generally reduce subsequent-year pension expense.
The compensation assumption is used to estimate the annual rate at which pay of plan participants will grow. If the rate of growth assumed increases, the size of the pension obligations will increase, as will the amount recorded in AOCI in our Statement of Financial Position and amortized into earnings in subsequent periods.
The expected return on plan assets is the estimated long-term rate of return that will be earned on the investments used to fund the benefit obligations. To determine the expected long-term rate of return on pension plan assets, we consider our asset allocation as well as historical and expected returns on various categories of plan assets. In developing future long-term return expectations for our principal benefit plans’ assets, we formulate views on the future economic environment, both in the U.S. and abroad. We evaluate general market trends and historical relationships among a number of key variables that impact asset class returns such as expected earnings growth, inflation, valuations, yields and spreads, using both internal and external sources. We also take into account expected volatility by asset class and diversification across classes to determine expected overall portfolio results given our asset allocation. Based on our analysis, we have assumed a 7.00% long-term expected return on the GE Aerospace Pension Plan assets for cost recognition in 2024 and 2023. For 2025 cost recognition, based on GE Aerospace Pension Plan assets at December 31, 2024, we have assumed a 7.00% long-term expected return.
The healthcare trend assumptions primarily apply to our pre-65 retiree medical plans. Most participants in our post-65 retiree plan have a fixed subsidy and therefore are not subject to healthcare inflation.
We evaluate these critical assumptions at least annually on a plan and country-specific basis. We periodically evaluate other assumptions involving demographics factors such as retirement age and turnover, and update them to reflect our actual experience and expectations for the future. Actual results in any given year will often differ from actuarial assumptions because of economic and other factors. Differences between our actual results and what we assumed are recorded in AOCI each period. These differences are amortized into earnings over the remaining average future service of active participating employees or the expected life of inactive participants, as applicable. For the principal pension plans, gains and losses are amortized using a straight-line method with a separate layer for each year’s gains and losses. For most other pension plans and principal retiree benefit plans, gains and losses are amortized using a straight-line or a corridor amortization method.
SENSITIVITIES TO KEY ASSUMPTIONS. Fluctuations in discount rates can significantly impact pension cost and obligations. We would expect that a 25 basis point decrease in discount rate would increase our GE Aerospace principal pension plan cost in the following year by approximately $50 million and would also expect an increase in the GE Aerospace principal pension plan projected benefit obligation at year-end by approximately $550 million. The deficit sensitivity to the discount rate would be lower than the projected benefit obligation sensitivity as a result of the liability hedging program incorporated in the asset allocation. A 25 basis point decrease in the expected return on assets would increase GE Aerospace principal pension plan cost in the following year by approximately $50 million.
THE COMPOSITION OF OUR PLAN ASSETS. The fair value of our pension plans' investments is presented below. The inputs and valuation techniques used to measure the fair value of these assets are described in Note 1 and have been applied consistently.
| | | | | | | | | | | | | | | | | | | | | | | |
| 2024 | | 2023 |
| Principal pension | | Other pension | | Principal pension | | Other pension |
| Global equities | $ | 1,142 | | | $ | 217 | | | $ | 1,985 | | | $ | 1,152 | |
| Debt securities | | | | | | | |
| Fixed income and cash investment funds | 1,412 | | | 1,463 | | | 1,764 | | | 4,188 | |
| U.S. corporate(a) | 3,091 | | | 34 | | | 6,599 | | | 145 | |
| Other debt securities(b) | 3,106 | | | 46 | | | 6,064 | | | 218 | |
| Real estate | 535 | | | 6 | | | 775 | | | 18 | |
| Private equities and other investments | 299 | | | 118 | | | 600 | | | 259 | |
| Total | 9,585 | | | 1,884 | | | 17,787 | | | 5,980 | |
| Plan assets measured at net asset value | | | | | | | |
| Global equities | $ | 1,695 | | | $ | 217 | | | $ | 3,169 | | | $ | 612 | |
| Debt securities | 1,158 | | | 693 | | | 1,907 | | | 2,224 | |
| Real estate | 715 | | | 280 | | | 1,067 | | | 1,074 | |
| Private equities and other investments | 5,867 | | | 518 | | | 5,814 | | | 874 | |
| Total plan assets at fair value | 19,020 | | | 3,592 | | | 29,744 | | | 10,764 | |
| Less: discontinued operations | — | | | — | | | 9,491 | | | 6,851 | |
| Total plan assets - continuing operations | $ | 19,020 | | | $ | 3,592 | | | $ | 20,253 | | | $ | 3,913 | |
(a)Primarily represented investment-grade bonds of U.S. issuers from diverse industries.
(b)Primarily represented investments in residential and commercial mortgage-backed securities, non-U.S. corporate and government bonds and U.S. government, federal agency, state and municipal debt.
Plan assets that were measured at fair value using NAV as a practical expedient were excluded from the fair value hierarchy. Principal Pension Plans' investments with a fair value of $844 million and $1,203 million at December 31, 2024 and 2023, respectively, were classified within Level 3 and primarily relate to private equities and real estate. The remaining investments were substantially all considered Level 1 and 2. Investments with a fair value of $2,288 million and $4,034 million at December 31, 2024 and 2023, respectively, were classified within Level 1 and primarily relate to global equities and cash. Investments with a fair value of $6,235 million and $12,703 million at December 31, 2024 and 2023, respectively, were classified within Level 2 and primarily relate to debt securities. Other pension plans investments with a fair value of $9 million and $26 million at December 31, 2024 and 2023, respectively, were classified within Level 3 and primarily relate to private equities and real estate. The remaining investments were substantially all considered Level 1 and 2. Investments with a fair value of $28 million and $786 million at December 31, 2024 and 2023, respectively, were classified within Level 1 and primarily relate to global equities and cash. Investments with a fair value of $1,713 million and $4,913 million at December 31, 2024 and 2023, respectively, were classified within Level 2 and primarily relate to debt securities. Principal retiree benefit plan investments have a fair value of $6 million and $8 million at December 31, 2024 and 2023, respectively. There were no Level 3 principal retiree benefit plan investments held in 2024 and 2023.
| | | | | | | | | | | | | | | | | | | | | | | | | | | | | | | | | | | |
| ASSET ALLOCATION OF PENSION PLANS | 2024 Target allocation | | 2024 Actual allocation |
| Principal Pension | | | Other Pension (weighted average) | | | Principal Pension | | | Other Pension (weighted average) | |
| Global equities | 10.0 - 30.0 | % | | 10 | | % | | 15 | | % | | 12 | | % |
| Debt securities (including cash equivalents) | 19.0 - 87.5 | | | 69 | | | | 46 | | | | 62 | | |
| Real estate | 1.0 - 10.0 | | | 7 | | | | 7 | | | | 8 | | |
| Private equities & other investments | 12.0 - 40.0 | | | 14 | | | | 32 | | | | 18 | | |
Plan fiduciaries set investment policies and strategies for the principal pension plans and oversee their investment allocation, which includes selecting investment managers and setting long-term strategic targets. The plan fiduciaries' primary strategic investment objectives are balancing investment risk and return and monitoring the plan’s liquidity position in order to meet near-term benefit payment and other cash needs. The plan has incorporated de-risking objectives and liability hedging programs as part of its long-term investment strategy and utilizes a combination of long-dated corporate bonds, treasuries, strips and derivatives to implement its investment strategies as well as for hedging asset and liability risks. Target allocation percentages are established at an asset class level by plan fiduciaries. Target allocation ranges are guidelines, not limitations, and occasionally plan fiduciaries will approve allocations above or below a target range.
GE Aerospace and GE securities represented 0.8% and 0.5% of the Principal Pension Plans' assets at December 31, 2024 and 2023, respectively.
| | | | | | | | | | | | | | |
| ANNUALIZED RETURNS(a) | 1 year | 5 years | 10 years | 25 years |
| GE Aerospace Pension Plan | 2.3 | % | 2.2 | % | 4.3 | % | 4.7 | % |
(a) Prior to 2023, the annualized returns represent the GE Pension Plan's returns.
| | | | | | | | | | | | | | | | | |
| EXPECTED FUTURE BENEFIT PAYMENTS OF OUR BENEFIT PLANS(a) | Principal pension | | Other pension | | Principal retiree benefit |
| 2025 | $ | 1,800 | | | $ | 175 | | | $ | 130 | |
| 2026 | 1,815 | | | 175 | | | 125 | |
| 2027 | 1,825 | | | 180 | | | 120 | |
| 2028 | 1,830 | | | 190 | | | 120 | |
| 2029 | 1,830 | | | 195 | | | 120 | |
| 2030-2034 | 8,960 | | | 1,045 | | | 510 | |
(a) As of the measurement date of December 31, 2024.
DEFINED CONTRIBUTION PLAN. We have a defined contribution plan for eligible U.S. employees that provides employer contributions which were $265 million, $342 million and $444 million for the years ended December 31, 2024, 2023 and 2022, respectively. Employer contributions for continuing operations were $230 million, $213 million and $207 million for the years ended December 31, 2024, 2023 and 2022, respectively.
| | | | | | | | | | | | | | | | | | | | | | | | | | | | | | | | | | | |
| COST OF POSTRETIREMENT BENEFIT PLANS AND CHANGES IN OTHER COMPREHENSIVE INCOME | |
| For the years ended December 31 | 2024 | | 2023 | | 2022 |
| (Pre-tax) | Principal pension | Other pension | Principal retiree benefit | | Principal pension | Other pension | Principal retiree benefit | | Principal pension | Other pension | Principal retiree benefit |
| Cost (income) of postretirement benefit plans | $ | (741) | | $ | (21) | | $ | (101) | | | $ | (1,108) | | $ | (118) | | $ | (144) | | | $ | 575 | | $ | (396) | | $ | (203) | |
| Changes in other comprehensive loss (income) | | | | | | | | | | | |
| Prior service cost (credit) - current year | — | | — | | — | | | 49 | | — | | — | | | — | | — | | — | |
| Net loss (gain) - current year (a) | 262 | | (52) | | (15) | | | 1,588 | | 721 | | (5) | | | (1,533) | | (128) | | (778) | |
| Reclassifications out of AOCI | | | | | | | | | | | |
| Curtailment/settlement gain (loss) | — | | — | | — | | | — | | 6 | | — | | | — | | 6 | | — | |
| Dispositions | 185 | | (761) | | 715 | | | 1,989 | | (792) | | 1,216 | | | — | | — | | — | |
| Amortization of net gain (loss) | 468 | | (41) | | 82 | | | 723 | | (20) | | 124 | | | (1,422) | | (101) | | 115 | |
| Amortization of prior service credit (cost) | (6) | | 1 | | 103 | | | (5) | | 4 | | 148 | | | (5) | | 8 | | 235 | |
| Total changes in other comprehensive loss (income) | 909 | | (853) | | 885 | | | 4,344 | | (81) | | 1,483 | | | (2,960) | | (215) | | (428) | |
| Cost (income) of postretirement benefit plans and changes in other comprehensive loss (income) | $ | 168 | | $ | (874) | | $ | 784 | | | $ | 3,236 | | $ | (199) | | $ | 1,339 | | | $ | (2,385) | | $ | (611) | | $ | (631) | |
(a) Primarily due to impact of discount rates and investment performance.
NOTE 14. SALES DISCOUNTS AND ALLOWANCES & ALL OTHER LIABILITIES.
Sales discounts and allowances decreased $266 million in the year ended December 31, 2024, primarily due to higher payments from an increase in aircraft deliveries, partially offset by higher spare part shipments in Commercial Engines & Services.
All other current liabilities and All other liabilities primarily includes employee compensation and benefits, equipment project and commercial liabilities, income taxes payable and uncertain tax positions, environmental, health and safety remediations, operating lease liabilities (see Note 6) and product warranties (see Note 24). All other current liabilities increased $60 million in the year ended December 31, 2024, primarily due to an increase in dividends payable of $211 million, an increase in other sundry liabilities at Commercial Engines and Services of $136 million, and an increase in equipment projects and other commercial liabilities of $99 million, partially offset by a decrease in employee compensation and benefits of $355 million. All other liabilities increased $620 million in the year ended December 31, 2024, primarily due to increases in uncertain and other income taxes and related liabilities of $494 million, Environmental, health and safety liabilities of $146 million and indemnity liabilities of $146 million, primarily related to GE Vernova, partially offset by a decrease in operating lease liabilities of $109 million.
NOTE 15. INCOME TAXES. GE Aerospace files a consolidated U.S. federal income tax return which enables the company to use tax deductions and credits of one member of the group to reduce the tax that otherwise would have been payable by another member of the group. The effective tax rate reflects the benefit of these tax reductions in the consolidated return. Cash payments are made within the company for tax increases or reductions.
Our businesses are subject to a wide variety of U.S. federal, state and foreign tax laws, regulations and policies. Changes to these laws or regulations may affect our tax liability, return on investments and business operations. On August 16, 2022, the U.S. enacted the Inflation Reduction Act that includes a new corporate alternative minimum tax based upon financial statement income (book minimum tax), and an excise tax on stock buybacks, among other provisions. The new book minimum tax is expected to slow but not eliminate the favorable tax impact of our deferred tax assets, resulting in higher cash tax in some years that would generate future tax credits. The impact of the book minimum tax will depend on our facts in each year and final guidance from the U.S. Department of the Treasury.
The OECD (Organisation for Economic Co-operation and Development) has proposed a global minimum tax of 15% of reported profits (Pillar 2) that has been agreed upon in principle by over 140 countries. During 2023, many countries took steps to incorporate Pillar 2 model rule concepts into their domestic laws. Although the model rules provide a framework for applying the minimum tax, countries may enact Pillar 2 slightly differently than the model rules and on different timelines and may adjust domestic tax incentives in response to Pillar 2. In addition, in January 2025, the United States issued an executive order announcing opposition to aspects of these rules. Accordingly, we are still evaluating the potential consequences of Pillar 2 on our longer-term financial position. During 2024, we have incurred insignificant tax expenses in connection with Pillar 2.
| | | | | | | | | | | |
| EARNINGS (LOSS) FROM CONTINUING OPERATIONS BEFORE INCOME TAXES | 2024 | 2023 | 2022 |
| U.S. earnings (loss) | $ | 4,809 | | $ | 7,195 | | $ | (249) | |
| Non-U.S. earnings (loss) | 2,811 | | 3,246 | | 1,771 | |
| Total | $ | 7,620 | | $ | 10,441 | | $ | 1,522 | |
| | | | | | | | | | | |
| PROVISION (BENEFIT) FOR INCOME TAXES | 2024 | 2023 | 2022 |
| Current | | | |
| U.S. Federal | $ | 310 | | $ | (588) | | $ | (117) | |
| Non-U.S. | 423 | | 314 | | 307 | |
| U.S. State | 48 | | 134 | | (48) | |
| Deferred | | | |
| U.S. Federal | 250 | | 622 | | (382) | |
| Non-U.S. | 59 | | 453 | | 493 | |
| U.S. State | (128) | | 59 | | (84) | |
| Total | $ | 962 | | $ | 994 | | $ | 169 | |
Income taxes paid were $852 million, $994 million and $1,128 million for the years ended December 31, 2024, 2023 and 2022, respectively, including payments reported in discontinued operations.
| | | | | | | | | | | | | | | | | | | | | | | | | | |
| RECONCILIATION OF U.S. FEDERAL STATUTORY INCOME TAX RATE TO ACTUAL INCOME TAX RATE | 2024 | | 2023 | | 2022 |
| Amount | Rate | | Amount | Rate | | Amount | Rate |
| U.S. federal statutory income tax rate | $ | 1,600 | | 21.0 | % | | $ | 2,193 | | 21.0 | % | | $ | 320 | | 21.0 | % |
| State Taxes, net of federal benefit | 123 | | 1.6 | | | 152 | | 1.5 | | | (114) | | (7.5) | |
| Tax on global activities including exports(a) | (92) | | (1.2) | | | 78 | | 0.7 | | | (29) | | (1.9) | |
| U.S. business credits(b) | (242) | | (3.2) | | | (254) | | (2.4) | | | (198) | | (13.0) | |
| | | | | | | | |
| | | | | | | | |
| | | | | | | | |
| Retained and sold ownership interests | (110) | | (1.4) | | | (1,215) | | (11.6) | | | 2 | | 0.1 | |
| All other – net(c) | (317) | | (4.2) | | | 40 | | 0.3 | | | 188 | | 12.4 | |
| (638) | | (8.4) | | | (1,199) | | (11.5) | | | (151) | | (9.9) | |
| Actual income tax rate | $ | 962 | | 12.6 | % | | $ | 994 | | 9.5 | % | | $ | 169 | | 11.1 | % |
(a)For the years ended December 31, 2024, 2023 and 2022, respectively, the tax expense (benefit) related to the negotiated tax rate in Singapore was $(136) million, $(136) million and $(112) million, and the tax expense (benefit) related to cross-border tax payments and U.S. tax on non-U.S. subsidiaries was $88 million, $121 million and $15 million.
(b)Primarily the credit for energy produced from renewable sources from tax equity investments and the credit for research performed in the U.S.
(c)For the years ended December 31, 2024, 2023 and 2022, respectively, included $(246) million, $35 million and $127 million for separation income tax costs (benefits) of which zero, $38 million and $66 million was due to the repatriation of previously reinvested earnings.
UNRECOGNIZED TAX POSITIONS. Annually, we file over 1,700 income tax returns in over 260 global taxing jurisdictions. As a multinational with operations around the world, we are under examination in many taxing jurisdictions and in some cases engaged in litigation, including our legacy businesses. The IRS is currently auditing our consolidated U.S. income tax returns for 2016-2020.
A summary and reconciliation of our unrecognized tax benefits are as follows:
| | | | | | | | | | | |
UNRECOGNIZED TAX BENEFITS December 31 | 2024 | 2023 | 2022 |
| Unrecognized tax benefits | $ | 2,824 | | $ | 3,399 | | $ | 3,951 | |
| Portion that, if recognized, would reduce tax expense and effective tax rate(a) | 2,110 | | 2,708 | | 3,072 | |
| Accrued interest on unrecognized tax benefits | 609 | | 635 | | 614 | |
| Accrued penalties on unrecognized tax benefits | 14 | | 111 | | 111 | |
Reasonably possible reduction to the balance of unrecognized tax benefits in succeeding 12 months | 0-300 | 0-610 | 0-650 |
| Portion that, if recognized, would reduce tax expense and effective tax rate(a) | 0-270 | 0-550 | 0-600 |
(a) Some portion of such reduction may be reported as discontinued operations.
| | | | | | | | | | | |
| UNRECOGNIZED TAX BENEFITS RECONCILIATION | 2024 | 2023 | 2022 |
| Balance at January 1 | $ | 3,399 | | $ | 3,951 | | $ | 4,224 | |
| Additions for tax positions of the current year | 68 | | 109 | | 62 | |
| Additions for tax positions of prior years | 77 | | 156 | | 120 | |
| Reductions for tax positions of prior years(a) | (649) | | (710) | | (393) | |
| Settlements with tax authorities | (14) | | (56) | | (8) | |
| Expiration of the statute of limitations | (57) | | (51) | | (54) | |
| Balance at December 31 | $ | 2,824 | | $ | 3,399 | | $ | 3,951 | |
(a) Included $(612) million due to the spin of GE Vernova for 2024 and $(577) million due to the spin of GE HealthCare for 2023.
We classify interest on tax deficiencies as interest expense; we classify income tax penalties as provision for income taxes. For the years ended December 31, 2024, 2023 and 2022, we recognized $137 million, $28 million and $36 million, respectively of interest expense (income) related to tax deficiencies. We also recognized an insignificant amount, $7 million and $(26) million of tax expense (income) related to income tax penalties for the years ended December 31, 2024, 2023 and 2022, respectively.
DEFERRED INCOME TAXES. We have not recorded a provision for the deferred taxes related to the U.S. tax on foreign earnings enacted in the Tax Cuts and Jobs Act of 2017 ("global intangible low tax income"). We also have not provided deferred taxes on cumulative net earnings of non-U.S. affiliates and associated companies of approximately $10.2 billion that have been reinvested indefinitely. Due to U.S. tax reform, substantially all of our unrepatriated net earnings have been subject to U.S. tax and accordingly we expect to have the ability repatriate available non-U.S. cash without significant additional tax cost. Most of these earnings have been reinvested in active non-U.S. business operations and it is not practicable to determine the income tax liability that would be payable if such earnings were not reinvested indefinitely. We reassess reinvestment of earnings on an ongoing basis. In 2024, 2023 and 2022 in connection with the execution of the Company’s plans to prepare for the spin-off of GE HealthCare and GE Vernova, we incurred zero, $38 million and $66 million of tax, respectively, due to repatriation of previously reinvested earnings.
The following table presents our net deferred tax assets and net deferred tax liabilities attributable to different tax jurisdictions or different tax paying components.
| | | | | | | | |
DEFERRED INCOME TAXES December 31 | 2024 | 2023 |
| Total assets | $ | 7,479 | | $ | 7,891 | |
| Total liabilities | (368) | | (389) | |
| Net deferred income tax asset (liability) | $ | 7,111 | | $ | 7,502 | |
| | | | | | | | |
COMPONENTS OF THE NET DEFERRED INCOME TAX ASSET (LIABILITY) December 31 | 2024 | 2023 |
| Deferred tax assets | | |
| Insurance company loss reserves | $ | 2,349 | | $ | 3,185 | |
| Progress collections, Contract assets, Contract liabilities and deferred items | 1,435 | | 1,632 | |
| Accrued expenses and reserves | 1,231 | | 1,241 | |
| Deferred expenses | 1,398 | | 1,235 | |
| Other compensation and benefits | 510 | | 521 | |
| Principal pension plans | 1,009 | | 1,146 | |
| Non-U.S. loss carryforwards(a) | 1,891 | | 1,879 | |
| Capital losses carryforward | 849 | | 582 | |
| State deferred tax assets(b) | 762 | | 813 | |
| | |
| Other | 1,514 | | 1,490 | |
| Total deferred tax assets | $ | 12,948 | | $ | 13,724 | |
| Valuation allowance(a)(b)(c) | (3,216) | | (3,416) | |
| Total deferred tax assets after valuation allowance | 9,732 | | 10,308 | |
| Deferred tax liabilities | | |
| Intangibles | $ | (1,049) | | $ | (1,129) | |
| Depreciation | (712) | | (635) | |
| Investment in securities | (661) | | (645) | |
| Other | (199) | | (397) | |
| Total deferred tax liabilities | (2,621) | | (2,806) | |
| Net deferred income tax asset (liability) | $ | 7,111 | | $ | 7,502 | |
(a)Included valuation allowances for non-U.S. loss carryforwards of $1,362 million and $1,465 million as of December 31, 2024 and 2023, respectively. The net deferred tax asset as of December 31, 2024 of $529 million relates to net operating losses that may be carried forward indefinitely.
(b) Included valuation allowances for U.S. state losses and credit carryforwards of $490 million and $639 million as of December 31, 2024 and 2023, respectively. Of the $142 million of net deferred tax assets for U.S. state losses and credit carryforwards as of December 31, 2024, $33 million relates to state attributes that expire in various year ending from December 31, 2025 through December 31, 2027, $104 million relates to state attributes that expire various years ending from December 31, 2028 through December 31, 2044, and $5 million relates to state attributes that may be carried forward indefinitely.
(c) Included valuation allowances related to assets other than non-U.S. loss carryforwards and U.S. state loss and credit carryforwards of $1,364 million and $1,312 million as of December 31, 2024 and 2023, respectively, related primarily to excess U.S. federal capital loss and foreign tax credit carryforwards.
| | | | | |
| DEFERRED TAX ASSETS VALUATION ALLOWANCE | |
| Balance at December 31, 2021 | $ | (3,348) | |
| Additions charged to income tax expense | (10) | |
| Reductions credited to income tax expense | — | |
| Other adjustments(a) | (1,806) | |
| Balance at December 31, 2022 | $ | (5,164) | |
| Additions charged to income tax expense | — | |
| Reductions credited to income tax expense | 102 | |
| Other adjustments(b) | 1,646 | |
| Balance at December 31, 2023 | $ | (3,416) | |
| Additions charged to income tax expense | (2) | |
| Reductions credited to income tax expense | 184 | |
| Other adjustments | 18 | |
| Balance at December 31, 2024 | $ | (3,216) | |
(a) Primarily related to excess capital losses generated during the year.
(b) Primarily related to utilization of losses against capital gains, including gains reported in discontinued operations. See Note 2 for further information.
NOTE 16. SHAREHOLDERS’ EQUITY
| | | | | | | | | | | | | | | | |
| | | | |
| | | | | | |
ACCUMULATED OTHER COMPREHENSIVE INCOME (LOSS) (Dividends per share in dollars) | | | | 2024 | 2023 | 2022 |
| | | | | | |
| | | | | | |
| | | | | | |
| | | | | | |
| | | | | | |
| | | | | | |
| Beginning balance | | | | $ | (3,623) | | $ | (5,893) | | $ | (4,569) | |
| AOCI before reclasses – net of taxes of $5, $74 and $144 | | | | 36 | | 12 | | (1,326) | |
| Reclasses from AOCI – net of taxes of $103, $(626) and $—(a) | | | | 2,093 | | 2,262 | | — | |
| AOCI | | | | 2,129 | | 2,274 | | (1,326) | |
| Less AOCI attributable to noncontrolling interests | | | | (22) | | 4 | | (2) | |
| Currency translation adjustments AOCI | | | | $ | (1,472) | | $ | (3,623) | | $ | (5,893) | |
| Beginning balance | | | | $ | 1,786 | | $ | 6,531 | | $ | 3,646 | |
| AOCI before reclasses – net of taxes of $22, $(497) and $597 | | | | (8) | | (1,874) | | 2,117 | |
| Reclasses from AOCI – net of taxes of $(269), $(778), and $216(a) | | | | (1,119) | | (2,873) | | 772 | |
| AOCI | | | | (1,127) | | (4,747) | | 2,889 | |
| Less AOCI attributable to noncontrolling interests | | | | (7) | | (2) | | 3 | |
| Benefit plans AOCI | | | | $ | 665 | | $ | 1,786 | | $ | 6,531 | |
| Beginning balance | | | | $ | (959) | | $ | (1,927) | | $ | 5,172 | |
| AOCI before reclasses – net of taxes of $(271), $248 and $(1,861) | | | | (1,017) | | 1,046 | | (7,135) | |
| Reclasses from AOCI – net of taxes of $4, $(7) and $(20) | | | | 1 | | (78) | | 36 | |
| AOCI | | | | (1,016) | | 968 | | (7,099) | |
| Less AOCI attributable to noncontrolling interests | | | | 12 | | — | | — | |
| Investment securities and cash flow hedges AOCI | | | | $ | (1,985) | | $ | (959) | | $ | (1,927) | |
| Beginning balance | | | | $ | (3,354) | | $ | (983) | | $ | (9,109) | |
| AOCI before reclasses – net of taxes of $607, $(630) and $2,160 | | | | 2,284 | | (2,371) | | 8,126 | |
| | | | | | |
| AOCI | | | | 2,284 | | (2,371) | | 8,126 | |
| Long-duration insurance contracts AOCI | | | | $ | (1,070) | | $ | (3,354) | | $ | (983) | |
| | | | | | |
| AOCI at December 31 | | | | $ | (3,861) | | $ | (6,150) | | $ | (2,272) | |
| | | | | | |
| Dividends declared per common share | | | | $ | 1.12 | | $ | 0.32 | | $ | 0.32 | |
(a)Includes reclassifications from AOCI related to the separations of GE Vernova and GE HealthCare. In the second quarter of 2024, reclassifications of $1,590 million, net of taxes, included currency translation of $2,174 million and benefit plans of $(584) million, related to GE Vernova. In the first quarter of 2023, reclassifications of $195 million, net of taxes, included currency translation of $2,234 million and benefit plans of $(2,030) million, related to GE HealthCare.
Preferred stock. In September 2023, we redeemed the remaining $5,795 million of outstanding GE preferred stock. We redeemed $144 million of GE preferred stock in the year ended December 31, 2022. Dividends on GE preferred stock totaled $237 million and $289 million, including cash dividends of $236 million and $284 million, for the years ended December 31, 2023 and 2022, respectively.
Common stock. GE Aerospace's authorized common consists of 1,650 million shares having a par value of $0.01 each, with 1,462 million shares issued. Common stock shares outstanding were 1,073,692,183 and 1,088,415,995 at December 31, 2024 and December 31, 2023, respectively. We repurchased 32.0, 11.0 and 13.6 million shares for a total of $5,414 million, $1,135 million and $1,000 million for the years ended December 31, 2024, 2023 and 2022, respectively. This included repurchases of 12.5 million shares for $2,170 million using accelerated stock repurchases in 2024, which were utilized as a mechanism to achieve planned repurchase volumes within a quarter during closed windows. The Company's share repurchase program does not obligate it to acquire any specific number of shares. Under this program, shares may be purchased in the open market, in privately negotiated transactions, under accelerated share repurchase programs or under plans complying with Rules 10b5-1 and 10b-18 under the Securities Exchange Act of 1934, as amended.
NOTE 17. SHARE-BASED COMPENSATION. We grant stock options, restricted stock units and performance share units to employees under the 2022 Long-Term Incentive Plan. Grants made under all plans must be approved by the Management Development and Compensation Committee of GE Aerospace’s Board of Directors, which is composed entirely of independent directors. We record compensation expense for awards expected to vest over the vesting period. We estimate forfeitures based on experience and adjust expense to reflect actual forfeitures. When options are exercised, restricted stock units vest and performance share awards are earned, we issue shares from treasury stock.
Stock options provide employees the opportunity to purchase GE Aerospace shares in the future at the market price of our stock on the date the award is granted (the strike price). The options become exercisable over the vesting period, typically three years, and expire 10 years from the grant date if not exercised. Restricted stock units (RSU) provide an employee with the right to receive one share of GE Aerospace stock when the restrictions lapse over the vesting period. Upon vesting, each RSU is converted into one share of GE Aerospace common stock for each unit. Performance stock units (PSU) and performance shares provide an employee with the right to receive shares of GE Aerospace stock based upon achievement of certain performance or market metrics. Upon vesting, each PSU earned is converted into shares of GE Aerospace common stock. We value stock options using a Black-Scholes option pricing model, RSUs using market price on grant date, and PSUs and performance shares using market price on grant date and a Monte Carlo simulation as needed based on performance metrics.
In connection with the separation of GE Aerospace and GE Vernova, outstanding awards held by participants under the 2007 and 2022 Long-Term Incentive Plans were equitably converted into shares of GE Aerospace or GE Vernova Inc. awards as required, to
preserve the intrinsic value of the awards prior to the separation. Adjustments to the stock-based compensation awards resulted in
incremental compensation expense of $39 million.
| | | | | | | | | | | | | | |
| WEIGHTED AVERAGE GRANT DATE FAIR VALUE | | 2024 | 2023 | 2022 |
| Stock options | | $ | 65.16 | | $ | 36.10 | | $ | 34.03 | |
| RSUs | | 160.70 | | 89.60 | | 87.68 | |
| PSUs | | 150.05 | | 89.44 | | 95.40 | |
Key assumptions used in the Black-Scholes valuation for stock options include: risk free rates of 4.6%, 4.2%, and 1.6%, dividend yields of 0.7%, 0.4%, and 0.4%, expected volatility of 36%, 36%, and 37%, expected lives of 6.1 years, 6.8 years, and 6.8 years, and strike prices of $160.51, $88.15, and $92.33 for 2024, 2023 and 2022, respectively.
| | | | | | | | | | | | | | | | | | | | | | | | | | | | | |
| STOCK-BASED COMPENSATION ACTIVITY | Stock options | | RSUs |
| Shares (in thousands) | Weighted average exercise price | Weighted average contractual term (in years) | Intrinsic value (in millions) | | Shares (in thousands) | Weighted average grant date fair value | Weighted average contractual term (in years) | Intrinsic value (in millions) |
| Outstanding at January 1, 2024 | 22,573 | | $ | 122.35 | | | | | 8,103 | | $ | 76.52 | | | |
| Spin-off adjustment(a) | 1,941 | | N/A | | | | (2,224) | | N/A | | |
| Granted | 995 | | 160.51 | | | | | 1,503 | | 160.70 | | | |
| Exercised | (13,401) | | 111.31 | | | | | (3,452) | | 67.89 | | | |
| Forfeited | (125) | | 98.68 | | | | | (324) | | 91.53 | | | |
| Expired | (1,066) | | 152.97 | | | | | N/A | N/A | | |
| Outstanding at December 31, 2024 | 10,917 | | $ | 91.78 | | 3.6 | $ | 819 | | | 3,607 | | $ | 103.70 | | 1.6 | $ | 602 | |
| Exercisable at December 31, 2024 | 9,829 | | $ | 85.52 | | 3.0 | $ | 799 | | | N/A | N/A | N/A | N/A |
| Expected to vest | 887 | | $ | 146.70 | | 9.2 | $ | 18 | | | 3,199 | | $ | 100.77 | | 1.5 | $ | 534 | |
(a) The spin-off adjustment represents the net of shares converted into new GE Aerospace awards and shares converted and transferred to GE Vernova Inc. as a result of the April 2, 2024 separation of GE Vernova.
Total outstanding target PSUs at December 31, 2024 were 1,104 thousand shares with a weighted average fair value of $129.79. The intrinsic value and weighted average contractual term of target PSUs outstanding were $184 million and 2.1 years, respectively.
| | | | | | | | | | | |
| 2024 | 2023 | 2022 |
| Compensation expense (after-tax)(a) | $ | 286 | | $ | 192 | | $ | 143 | |
| Cash received from stock options exercised | 1,492 | | 565 | | 62 | |
| Intrinsic value of stock options exercised and RSU/PSU/Performance shares vested | 1,754 | | 561 | | 170 | |
(a)Unrecognized compensation cost related to unvested equity awards as of December 31, 2024 was $365 million, which will be amortized over a weighted average period of 1.2 years. Income tax benefit recognized in earnings on stock-based compensation was $152 million, $29 million and $(3) million in 2024, 2023 and 2022, respectively.
NOTE 18. EARNINGS PER SHARE INFORMATION
| | | | | | | | | | | | | | | | | | | | | | | | | | |
| 2024 | | 2023 | | 2022 |
| (Earnings for per-share calculation, shares in millions, per-share amounts in dollars) | Diluted | Basic | | Diluted | Basic | | Diluted | Basic |
| | | | | |
| | | | | | | | |
| Earnings (loss) from continuing operations | $ | 6,670 | | $ | 6,670 | | | $ | 9,446 | | $ | 9,449 | | | $ | 1,350 | | $ | 1,350 | |
| Preferred stock dividends and other and accretion of preferred share repurchase(a) | — | | — | | | (295) | | (295) | | | (285) | | (285) | |
| | | | | | | | |
| | | | | | | | |
| Earnings (loss) from continuing operations attributable to common shareholders | 6,670 | | 6,670 | | | 9,151 | | 9,154 | | | 1,065 | | 1,065 | |
| Earnings (loss) from discontinued operations | (114) | | (114) | | | 33 | | 33 | | | (1,014) | | (1,014) | |
| Net earnings (loss) attributable to common shareholders | 6,556 | | 6,556 | | | 9,184 | | 9,187 | | | 51 | | 51 | |
| | | | | | | | |
| Shares of common stock outstanding | 1,085 | | 1,085 | | | 1,089 | | 1,089 | | | 1,096 | | 1,096 | |
| Employee compensation-related shares (including stock options) | 10 | | — | | | 10 | | — | | | 6 | | — | |
| Total average equivalent shares | 1,094 | | 1,085 | | | 1,099 | | 1,089 | | | 1,101 | | 1,096 | |
| | | | | | | | |
| Earnings (loss) from continuing operations | $ | 6.09 | | $ | 6.15 | | | $ | 8.33 | | $ | 8.41 | | | $ | 0.97 | | $ | 0.97 | |
| Earnings (loss) from discontinued operations | (0.10) | | (0.11) | | | 0.03 | | 0.03 | | | (0.92) | | (0.93) | |
| Net earnings (loss) per share | 5.99 | | 6.04 | | | 8.36 | | 8.44 | | | 0.05 | | 0.05 | |
| | | | | | | | |
| Potentially dilutive securities(b) | 6 | | | | 24 | | | | 44 | | |
(a) For the year ended December 31, 2023, included $(58) million related to excise tax on preferred share redemptions.
(b) Outstanding stock awards are not included in the computation of diluted earnings (loss) per share because their effect was antidilutive.
Our unvested restricted stock unit awards that contain non-forfeitable rights to dividends or dividend equivalents are considered participating securities and historically have been included in the calculation pursuant to the two-class method. For the year ended December 31, 2024, such participating securities had an insignificant effect. Effective the second quarter of 2024, the Company calculates earnings per share using the treasury stock method. For the years ended December 31, 2023 and 2022, application of two-class method treatment had an insignificant effect.
NOTE 19. OTHER INCOME (LOSS)
| | | | | | | | | | | | | | |
| | | | |
| | | | | | |
| | | | 2024 | 2023 | 2022 |
| Investment in GE HealthCare realized and unrealized gain (loss) | | | | $ | 480 | | $ | 5,639 | | $ | — | |
| Investment in and note with AerCap realized and unrealized gain (loss) | | | | 38 | | 129 | | (865) | |
| Investment in Baker Hughes realized and unrealized gain (loss) | | | | — | | 10 | | 912 | |
| Gains (losses) on retained and sold ownership interests | | | | $ | 518 | | $ | 5,778 | | $ | 47 | |
| Other net interest and investment income (loss)(a) | | | | 813 | | 637 | | 466 | |
| Licensing and royalty income | | | | 210 | | 148 | | 115 | |
| Equity method income | | | | 173 | | 169 | | 70 | |
| Purchases and sales of business interests(b) | | | | 399 | | (105) | | 38 | |
| Other items | | | | 151 | | 92 | | 74 | |
| Total other income (loss) | | | | $ | 2,264 | | $ | 6,718 | | $ | 811 | |
(a) Included interest income associated with customer advances of $132 million, $127 million and $129 million in 2024, 2023 and 2022, respectively. See Note 8 for further information.
(b) Included a pre-tax gain of $347 million related to the sale of our non-core licensing business in Corporate in 2024.
During the year ended December 31, 2024, we received total proceeds of $5,242 million from the disposition of 61.6 million shares of GE HealthCare and have now fully monetized our position.
NOTE 20. RESTRUCTURING CHARGES AND SEPARATION COSTS
RESTRUCTURING AND OTHER CHARGES. This table is inclusive of all restructuring charges in our segments and at Corporate & Other. Separately, in our reported segment results, significant, higher-cost restructuring programs, primarily related to the separations, are excluded from measurement of segment operating performance for internal and external purposes; those excluded amounts are reported in Restructuring and other charges for Corporate & Other.
| | | | | | | | | | | | | | |
| | | | |
| RESTRUCTURING AND OTHER CHARGES | | | | 2024 | 2023 | 2022 |
| Workforce reductions | | | | $ | 107 | | $ | 166 | | $ | 162 | |
| Plant closures & associated costs and other asset write-downs | | | | 74 | | 84 | | 368 | |
| Acquisition/disposition net charges and other | | | | 366 | | 10 | | — | |
| | | | $ | 546 | | $ | 260 | | $ | 530 | |
| Cost of equipment/services | | | | $ | 27 | | $ | 10 | | $ | 15 | |
| Selling, general and administrative expenses | | | | 519 | | 250 | | 516 | |
| | | | | | |
| Total restructuring and other charges(a) | | | | $ | 546 | | $ | 260 | | $ | 530 | |
| Restructuring and other cash expenditures(b) | | | | $ | 507 | | $ | 204 | | $ | 116 | |
(a) In the second quarter of 2024, included income of $81 million, as a result of a change in estimate of the post-employment severance benefit reserve in connection with the separation of GE Vernova.
(b) Primarily related to the final settlement payment of $363 million for the Sjunde AP-Fonden shareholder lawsuit in the fourth quarter of 2024 and employee severance payments.
The restructuring liability as of December 31, 2024, 2023 and 2022 was $242 million, $311 million and $273 million, respectively.
Restructuring and other charges for new and ongoing programs primarily included exit activities announced in the fourth quarter of 2022 reflecting lower Corporate & Other shared-service and footprint needs as a result of the GE HealthCare and GE Vernova spin-offs. Additionally, in 2024, restructuring and other charges included costs of $363 million for the settlement of the Sjunde AP-Fonden shareholder lawsuit. See Note 24 for additional information.
SEPARATION COSTS. In November 2021, the Company announced its plan to form three industry-leading, global public companies focused on the growth sectors of aerospace, healthcare and energy. As discussed in Note 2, we completed this plan with the spin of GE Vernova in the second quarter of 2024. Post-separation, we expect to continue to incur operational and transition costs related to ongoing separation activities, including employee costs, professional fees, costs to establish certain stand-alone functions and information technology systems, and other transformation and transaction costs to transition to a stand-alone public company. These costs are presented as separation costs in our Statement of Earnings (Loss).
For the years ended December 31, 2024, 2023 and 2022, we incurred pre-tax separation expense of $492 million, $692 million and $625 million, and paid $800 million, $820 million and $134 million in cash, respectively. We recognized $349 million, $113 million and $4 million of net tax benefits for the years ended December 31, 2024, 2023 and 2022, respectively, including deferred tax benefits associated with state tax attributes and the tax benefit of losses on separation-related entity restructuring.
The pre-tax separation costs specifically identifiable to GE HealthCare and GE Vernova are now reflected in discontinued operations. For the year ended December 31, 2024, we recognized $15 million in pre-tax income, $3 million of net tax expense, and spent $16 million in cash, respectively, related to GE HealthCare. In addition, we recognized pre-tax separation costs of $96 million, recognized $20 million of net tax benefit and spent $199 million in cash, respectively, related to GE Vernova.
For the year ended December 31, 2023, we incurred $22 million in pre-tax costs, recognized $5 million of net tax benefit and spent $182 million in cash, respectively, related to GE HealthCare. Related to GE Vernova, we incurred $286 million pre-tax separation costs, recognized $86 million of net tax benefit and spent $239 million in cash for the year ended December 31, 2023.
For the year ended December 31, 2022, we incurred $258 million in pre-tax costs, recognized $54 million of net tax benefit and spent $103 million in cash, respectively, related to GE HealthCare. Related to GE Vernova, we incurred $90 million pre-tax separation costs, recognized $19 million of net tax benefit and spent $24 million in cash for the year ended December 31, 2022.
NOTE 21. FAIR VALUE MEASUREMENTS Our assets and liabilities measured at fair value on a recurring basis include debt securities mainly supporting obligations to annuitants and policyholders in our run-off insurance operations, our equity interests in AerCap and derivatives.
| | | | | | | | | | | | | | | | | | | | | | | | | | | | | | | | |
| ASSETS AND LIABILITIES MEASURED AT FAIR VALUE ON A RECURRING BASIS | |
| Level 1 | Level 2 | Level 3(a) | Netting
adjustment(b) | Net balance(c) |
| December 31 | 2024 | 2023 | 2024 | 2023 | 2024 | 2023 | 2024 | 2023 | 2024 | 2023 |
| Investment securities | $ | 14 | | $ | 4,767 | | $ | 33,635 | | $ | 32,098 | | $ | 5,074 | | $ | 6,841 | | $ | — | | $ | — | | $ | 38,723 | | $ | 43,706 | |
| Derivatives | — | | — | | 243 | | 270 | | — | | — | | (55) | | (28) | | 188 | | 243 | |
| Total assets | $ | 14 | | $ | 4,767 | | $ | 33,878 | | $ | 32,368 | | $ | 5,074 | | $ | 6,841 | | $ | (55) | | $ | (28) | | $ | 38,911 | | $ | 43,949 | |
| | | | | | | | | | |
| Derivatives | $ | — | | $ | — | | $ | 131 | | $ | 78 | | $ | — | | $ | — | | $ | (54) | | $ | (26) | | $ | 77 | | $ | 53 | |
| Other(d) | — | | — | | 367 | | 311 | | — | | — | | — | | — | | 367 | | 311 | |
| Total liabilities | $ | — | | $ | — | | $ | 498 | | $ | 389 | | $ | — | | $ | — | | $ | (54) | | $ | (26) | | $ | 444 | | $ | 364 | |
(a)Included $1,627 million of U.S. corporate debt securities, $1,935 million of Mortgage and asset-backed debt securities, and the $982 million AerCap note at December 31, 2024. Included $3,873 million of U.S. corporate debt securities, $1,491 million of Mortgage and asset-backed debt securities, and the $944 million AerCap note at December 31, 2023.
(b)The netting of derivative receivables and payables is permitted when a legally enforceable master netting agreement exists. Amounts include fair value adjustments related to our own and counterparty non-performance risk.
(c)Included investment securities in our run-off insurance operations of $37,352 million and $37,592 million as of December 31, 2024 and 2023, respectively, which are Level 2 and 3. See Notes 3 and 22 for further information on the composition of our investment securities and derivative portfolios.
(d)Primarily represents the liabilities associated with certain of our deferred incentive compensation plans.
LEVEL 3 INSTRUMENTS. The majority of our Level 3 balances comprised debt securities classified as available-for-sale with changes in fair value recorded in Other comprehensive income.
| | | | | | | | | | | | | | | | | | | | | | | |
| Balance at
January 1 | Net realized/unrealized gains(losses)(a) | Purchases(b) | Sales & Settlements | Transfers
into
Level 3 | Transfers
out of
Level 3(c) | Balance at
December 31 |
| 2024 | | | | | | | |
| Investment securities | $ | 6,841 | | $ | 20 | | $ | 1,505 | | $ | (768) | | $ | 12 | | $ | (2,536) | | $ | 5,074 | |
| | | | | | | |
| | | | | | | |
| | | | | | | |
| | | | | | | |
| 2023 | | | | | | | |
| Investment securities | $ | 6,421 | | $ | 195 | | $ | 617 | | $ | (398) | | $ | 37 | | $ | (30) | | $ | 6,841 | |
| | | | | | | |
| | | | | | | |
| | | | | | | |
(a)Primarily included net unrealized gains (losses) of $(29) million and $134 million in Other comprehensive income for the years ended December 31, 2024 and 2023, respectively.
(b)Included $491 million of U.S. corporate debt securities and $600 million of Mortgage and asset-backed debt securities for the year ended December 31, 2024. Included $379 million of U.S. corporate debt securities and $177 million of Mortgage and asset-backed debt securities for the year ended December 31, 2023.
(c)Transfers out of Level 3 during the year ended December 31, 2024, related to increases in the observability of external information used in determining fair value. These transfers were in our run-off insurance operations and primarily included certain investments in private placement U.S. and non-U.S. corporate debt securities.
The majority of these Level 3 securities are fair valued using non-binding broker quotes or other third-party sources that utilize a number of different unobservable inputs not subject to meaningful aggregation.
NOTE 22. FINANCIAL INSTRUMENTS. The following table provides information about assets and liabilities not carried at fair value and excludes finance leases, equity securities without readily determinable fair value and non-financial assets and liabilities. Substantially all of these assets are considered to be Level 3 and the vast majority of our liabilities’ fair value are considered Level 2.
| | | | | | | | | | | | | | | | | | | | |
| | December 31, 2024 | | December 31, 2023 |
| | Carrying
amount
(net) | Estimated
fair value | | Carrying
amount
(net) | Estimated
fair value |
| Assets | Loans and other receivables | $ | 2,261 | | $ | 1,981 | | | $ | 2,110 | | $ | 2,055 | |
| | | | | | |
| Liabilities | Borrowings (Note 10) | 19,273 | | 18,805 | | | 20,525 | | 20,218 | |
| Investment contracts(a) | 1,375 | | 1,432 | | | 1,535 | | 1,616 | |
(a) Primarily related to our run-off insurance operations. See Note 12 for further information.
Assets and liabilities that are reflected in the accompanying financial statements at fair value are not included in the above disclosures; such items include cash and cash equivalents, investment securities (Note 3) and derivative financial instruments below.
DERIVATIVES AND HEDGING. Our policy requires that derivatives are used solely for managing risks and not for speculative purposes. We use derivatives to manage risks related to foreign currency exchange (including foreign equity investments), interest rates and commodity prices.
We use currency exchange contracts (including cross-currency swaps) for net investment hedges to hedge investments in our foreign operations, or for cash flow hedges primarily to reduce or eliminate the effects of foreign exchange rate changes. Gains and losses on derivatives used in qualified hedges are initially recognized in our Statement of Other Comprehensive Income (Loss) except for interest on cross-currency swaps. For cross-currency swaps, we recognize the periodic interest settlements within Interest and other financial charges in the Statement of Earnings (Loss), and the cash flows associated with these periodic interest settlements are classified as operating activities in the Statement of Cash Flows. Settlements from termination of all qualified hedges are classified in the Statement of Cash Flows following the nature of the hedged items (e.g., investing activities for derivatives used to hedge investments in our foreign operations).
We also use derivatives for economic hedges when we have exposures to currency exchange risk for which we are unable to meet the requirements for hedge accounting or when changes in the carrying amount of the hedged item are already recorded in earnings in the same period as the derivative making hedge accounting unnecessary. Even though the derivative is an effective economic hedge, there may be a net effect on earnings in each period due to differences in the timing of earnings recognition between the derivative and the hedged item.
| | | | | | | | | | | | | | | | | | | | | | | |
| FAIR VALUE OF DERIVATIVES | December 31, 2024 | | December 31, 2023 |
| Gross Notional | All other current assets | All other current liabilities | | Gross Notional | All other current assets | All other current liabilities |
| | | | | | | |
| | | | | | | |
| Qualifying currency exchange contracts(a) | $ | 2,289 | | $ | 44 | | $ | 40 | | | $ | 1,613 | | $ | 26 | | $ | 22 | |
| | | | | | | |
| | | | | | | |
| | | | | | | |
| | | | | | | |
| Non-qualifying currency exchange contracts and other(b) | 6,759 | | 199 | | 91 | | | 16,277 | | 245 | | 56 | |
| | | | | | | |
| Gross derivatives | $ | 9,047 | | $ | 243 | | $ | 131 | | | $ | 17,890 | | $ | 271 | | $ | 78 | |
| | | | | | | |
| Netting and credit adjustments | | $ | (55) | | $ | (54) | | | | $ | (28) | | $ | (26) | |
| | | | | | | |
| Net derivatives recognized in statement of financial position | | $ | 188 | | $ | 77 | | | | $ | 243 | | $ | 53 | |
| | | | | | | |
| | | | | | | |
| | | | | | | |
| | | | | | | |
(a) Gains (losses) on interest settlements related to cross-currency swaps included in our Statement of Earnings (Loss) are $2 million and $0 million for the years ended December 31, 2024 and 2023, respectively.
(b) Gains (losses) included in our Statement of Earnings (Loss) are $105 million and $136 million for the years ended December 31, 2024 and 2023, respectively, primarily in SG&A, driven by hedges of deferred incentive compensation and foreign exchange fluctuation. These amounts are offset by the remeasurement of the underlying exposure through earnings.
CASH FLOW HEDGES AND NET INVESTMENT HEDGES
| | | | | | | | | | | | | | | | | | | | |
| | | | Amount of Gain (Loss) Recognized in Other Comprehensive Income (Loss) on Derivatives | Amount of Gain (Loss) Reclassified from AOCI into Net income |
| | | | | | |
| | | | | | | 2024 | 2023 | 2024 | 2023 |
| Cash flow hedges(a) | | | | | | | $ | (64) | | $ | 49 | | $ | 16 | | $ | 53 | |
| Net investment hedges(b) | | | | | | | 348 | | (150) | | — | | — | |
(a) Primarily currency exchange contracts, and recognized in Costs of equipment or services sold in the Statement of Earnings (Loss). We expect to reclassify a $30 million loss from AOCI to earnings in the next 12 months contemporaneously with the earnings effects of the related forecasted transactions.
(b) The carrying value of foreign currency debt designated as net investment hedges was $5,199 million and $4,726 million at December 31, 2024 and 2023, respectively.
FAIR VALUE HEDGES. We used fair value hedges to hedge the effects of interest rate and currency changes on debt we issued. All fair value hedges were terminated in 2022 due to exposure management actions. The cumulative net gains related to hedging adjustments of $1,037 million and $1,162 million on discontinued hedges were included primarily in long-term borrowings of $8,387 and $9,253 million as of December 31, 2024 and 2023, respectively, and will continue to amortize into interest expense until the borrowings mature.
COUNTERPARTY CREDIT RISK. Our exposures to counterparties (including accrued interest) was $188 and $241 million at December 31, 2024 and 2023, respectively. Counterparties' exposures to our derivative liability (including accrued interest), was $77 million and $53 million at December 31, 2024 and 2023, respectively.
NOTE 23. VARIABLE INTEREST ENTITIES. In our Statement of Financial Position, we have assets of $141 million and $115 million and liabilities of $131 million and $140 million at December 31, 2024 and December 31, 2023, respectively, in consolidated Variable Interest Entities (VIEs). These VIEs are primarily associated with a legacy business in Corporate & Other and have no features that could expose us to losses that would significantly exceed the difference between the consolidated assets and liabilities.
Our investments in unconsolidated VIEs were $8,131 million and $6,577 million at December 31, 2024 and December 31, 2023, respectively. Of these investments, $1,280 million and $1,205 million were owned for U.S. tax equity, comprising equity method investments primarily related to onshore renewable energy projects, at December 31, 2024 and December 31, 2023, respectively. In addition, $6,665 million and $5,151 million were owned by our run-off insurance operations, primarily comprised of equity method investments at December 31, 2024 and December 31, 2023, respectively. The increase in investments in unconsolidated VIEs in our run-off insurance operations reflects strategic initiatives to invest in higher-yielding asset classes. Our maximum exposure to loss in respect of unconsolidated VIEs is increased by our commitments to make additional investments in these entities described in Note 24.
NOTE 24. COMMITMENTS, GUARANTEES, PRODUCT WARRANTIES AND OTHER LOSS CONTINGENCIES
COMMITMENTS. As of December 31, 2024, we had total investment commitments of $3,670 million, of which $3,539 million are related to investments by our run-off insurance operations in investment securities and other assets. Included within these commitments are obligations to make investments in unconsolidated VIEs of $3,439 million. We also have unfunded commitments, primarily for U.S. tax equity, of $631 million. Additionally, we have committed to provide financing assistance of $2,657 million for future customer acquisitions of aircraft equipped with our engines. We believe there is a low probability of utilization of this financing assistance based on the terms under which the financing would be provided. See Note 23 for further information regarding VIEs.
GUARANTEES. Credit support and indemnification agreements - Continuing Operations. Following the separation of GE Vernova, we have remaining performance and bank guarantees on behalf of GE Vernova. To support GE Vernova in selling products and services globally, we often entered into contracts on behalf of GE Vernova or issued parent company guarantees or trade finance instruments supporting the performance of what were subsidiary legal entities transacting directly with customers, in addition to providing similar credit support for non-customer related activities of GE Vernova (collectively, "GE Aerospace credit support"). Under the Separation and Distribution Agreement (SDA), GE Vernova is obligated to use reasonable best efforts to replace us as the guarantor on or terminate all such credit support instruments. Until such termination or replacement, in the event of non-fulfillment of contractual obligations by the relevant obligor(s), we could be obligated to make payments under the applicable instruments. Under the SDA, GE Vernova is obligated to reimburse and indemnify us for any such payments. Beginning in 2025, GE Vernova will pay us a quarterly fee based on amounts related to the GE Aerospace credit support. We have recorded a reserve of $115 million for our stand ready to perform obligation. Our maximum aggregate exposure under the GE Aerospace credit support cannot be reasonably estimated given the breadth of the portfolio across each of the GE Vernova businesses except for certain financial guarantees and trade finance instruments with a maximum exposure of approximately $366 million. The underlying obligations are predominantly customer contracts that GE Vernova performs in the normal course of its business. We have no known instances historically where payments or performance were required by us under parent company guarantees relating to GE Vernova customer contracts. In connection with the spin-off of GE Vernova, under terms of the SDA, Transition Service Agreement (TSA) and Tax Matters Agreement (TMA), we have an obligation to indemnify GE Vernova for certain of its severance costs, environmental matters and tax matters of $177 million, of which $129 million is reserved.
We also have remaining obligations under the TMA with GE HealthCare to indemnify them for certain tax costs and other indemnifications of $55 million, which are fully reserved.
In addition, we have $187 million of other indemnification commitments, including representations and warranties in sales of business assets, for which we recorded a liability of $53 million.
Credit support and indemnification agreements- Discontinued Operations. Following the separation of GE Vernova, we also have performance obligations related to GE Vernova nuclear decommissioning with a maximum aggregate exposure of $738 million for which we are fully indemnified. Also, under the SDA, TSA and TMA agreements we have obligations to indemnify GE Vernova for costs of certain environmental matters and tax matters of $33 million, which are fully reserved.
GE Aerospace also has obligations under the TSA and TMA to indemnify GE HealthCare for certain technology and tax costs of $49 million, which are fully reserved.
We also have provided specific indemnities to other buyers of assets of our business that, in the aggregate, represent a maximum potential claim of $446 million with related reserves of $52 million.
PRODUCT WARRANTIES. We provide for estimated product warranty expenses when we sell the related products. Because warranty estimates are forecasts that are based on the best available information, mostly historical claims experience, claims costs may differ from amounts provided. An analysis of changes in the liability for product warranties follows.
| | | | | | | | | | | |
| 2024 | 2023 | 2022 |
| Balance at January 1 | $ | 639 | | $ | 528 | | $ | 517 | |
| Current-year provisions | 275 | | 277 | | 180 | |
| Expenditures | (321) | | (167) | | (162) | |
| Other changes | (1) | | — | | (6) | |
| Balance at December 31 | $ | 592 | | $ | 639 | | $ | 528 | |
LEGAL MATTERS. In the normal course of our business, we are involved from time to time in various arbitrations, class actions, commercial litigation, investigations and other legal, regulatory or governmental actions, including the significant matters described below that could have a material impact on our results of operations. In many proceedings, including the specific matters described below, it is inherently difficult to determine whether any loss is probable or even reasonably possible or to estimate the size or range of the possible loss, and accruals for legal matters are not recorded until a loss for a particular matter is considered probable and reasonably estimable. Given the nature of legal matters and the complexities involved, it is often difficult to predict and determine a meaningful estimate of loss or range of loss until we know, among other factors, the particular claims involved, the likelihood of success of our defenses to those claims, the damages or other relief sought, how discovery or other procedural considerations will affect the outcome, the settlement posture of other parties and other factors that may have a material effect on the outcome. For these matters, unless otherwise specified, we do not believe it is possible to provide a meaningful estimate of loss at this time. Moreover, it is not uncommon for legal matters to be resolved over many years, during which time relevant developments and new information must be continuously evaluated.
Shareholder and related lawsuits. Since November 2017, several putative shareholder class actions under the federal securities laws were filed against GE and certain affiliated individuals and consolidated into a single action currently pending in the U.S. District Court for the Southern District of New York (the Hachem case, also referred to as the Sjunde AP-Fonden case). The complaint against defendants GE and current and former GE executive officers alleged violations of Sections 10(b) and 20(a) and Rule 10b-5 of the Securities Exchange Act of 1934 related to insurance reserves and accounting for long-term service agreements and seeks damages on behalf of shareholders who acquired GE stock between February 27, 2013 and January 23, 2018. GE filed a motion to dismiss in December 2019. In January 2021, the court granted the motion to dismiss as to the majority of the claims. Specifically, the court dismissed all claims related to insurance reserves, as well as all claims related to accounting for long-term service agreements, with the exception of certain claims about historic disclosures related to factoring in the Power business that survive as to GE and its former CFO Jeffrey S. Bornstein. All other individual defendants have been dismissed from the case. In April 2022, the court granted the plaintiffs' motion for class certification for shareholders who acquired stock between February 26, 2016 and January 23, 2018. In September 2022, GE filed a motion for summary judgment on the plaintiffs' remaining claims, which the court denied in September 2023, except as to claims arising from disclosures made between November 2017 and January 2018. In April 2024, the court scheduled a trial date for November 2024. Consistent with the settlement in principle that we reported in October 2024, we signed an agreement with the plaintiffs in December 2024 to settle the matter for $362.5 million, which we have deposited into an escrow account controlled by plaintiffs’ counsel. Final settlement of the matter is subject to court approval, and the court granted preliminary approval of the settlement in January 2025.
Since February 2018, multiple shareholder derivative lawsuits were filed against current and former GE executive officers and members of GE’s Board of Directors and GE (as nominal defendant). These lawsuits have alleged violations of securities laws, breaches of fiduciary duties, unjust enrichment, waste of corporate assets, abuse of control and gross mismanagement, although the specific matters underlying the allegations in the lawsuits have varied. Two shareholder derivative lawsuits are currently pending: the Lindsey and Priest/Tola cases, which were filed in New York state court. The allegations in these two cases relate to substantially the same facts as those underlying the Sjunde AP-Fonden case. The plaintiffs seek unspecified damages and improvements in GE’s corporate governance and internal procedures. The Lindsey case has been stayed by agreement of the parties, and GE filed a motion to dismiss the Priest/Tola complaint in March 2021. In August 2024, the plaintiffs in the Priest/Tola case filed an amended consolidated complaint asserting substantially the same claims as in the prior derivative actions, and the Company filed a motion to dismiss this amended complaint in October 2024.
In July 2018, a putative class action (the Mahar case) was filed in New York state court naming as defendants GE, former GE executive officers, a former member of GE’s Board of Directors and KPMG. It alleged violations of Sections 11, 12 and 15 of the Securities Act of 1933 based on alleged misstatements related to insurance reserves and performance of GE’s business segments in GE Stock Direct Plan registration statements and documents incorporated therein by reference and seeks damages on behalf of shareholders who acquired GE stock between July 20, 2015 and July 19, 2018 through the GE Stock Direct Plan. In February 2019, this case was dismissed. In April 2019, GE filed a motion to dismiss. In October 2019, the court denied GE's motion to dismiss and stayed the case pending the outcome of the Sjunde AP-Fonden case. In November 2019, the plaintiffs moved to re-argue to challenge the stay, and GE cross-moved to re-argue the denial of the motion to dismiss and filed a notice of appeal. The court denied both motions for re-argument, and in November 2020, the Appellate Division First Department affirmed the court's denial of GE's motion to dismiss. In January 2021, GE filed a motion for leave to appeal to the New York Court of Appeals, and that motion was denied in March 2021.
Bank BPH. As previously reported, Bank BPH, along with other Polish banks, has been subject to ongoing litigation in Poland related to its portfolio of floating rate residential mortgage loans, with cases brought by individual borrowers seeking relief related to their foreign currency indexed or denominated mortgage loans in various courts throughout Poland. For a number of years, we have observed an increase in the total number of lawsuits being brought against Bank BPH and other banks in Poland by current and former borrowers, and we expect this to continue in future reporting periods. As previously reported, GE and Bank BPH approved the adoption of a settlement program and recorded an additional charge of $1,014 million in the quarter ended June 30, 2023. The estimate of total losses for borrower litigation at Bank BPH was $2,461 million and $2,669 million as of December 31, 2024 and 2023, respectively.
This estimate accounts for the costs associated with borrowers who we estimate will participate in the settlement program, as well as estimates for the results of litigation with other borrowers, which in either case can exceed the value of the current loan balance, and represents our best estimate of the total losses we expect to incur over time informed by experience since adopting the program. However, there are a number of factors that could affect the estimate in the future, including: future judicial decisions or binding resolutions by the European Court of Justice (ECJ) or the Polish Supreme Court that could increase the cost to banks of loans invalidated by Polish courts and encourage more borrower lawsuits; the impact of any such decisions or resolutions on how Polish courts will interpret and apply the law in particular cases; the receptivity of borrowers over time to Bank BPH’s settlement program; the number of active and inactive borrowers who sue Bank BPH; the ability of Bank BPH to recover from borrowers the original principal amount of loans invalidated by Polish courts; and the impact of potential future legislation in Poland to expedite the court process for borrowers or otherwise relating to foreign currency indexed or denominated mortgage loans. While we are unable at this time to develop a meaningful estimate of reasonably possible losses beyond the amount currently recorded, future changes related to any of the foregoing or in Bank BPH’s settlement approach, or other adverse developments such as actions by regulators, legislators or other governmental authorities (including consumer protection regulators), could increase our estimate of total losses and potentially require future cash contributions to Bank BPH. See Note 2 for further information.
ENVIRONMENTAL, HEALTH AND SAFETY MATTERS. Our operations involve or have involved the use, disposal and cleanup of substances regulated under environmental protection laws, including activities for a variety of matters related to GE businesses that have been discontinued or exited. We record reserves for obligations for ongoing and future environmental remediation activities, such as the Housatonic River cleanup, and for additional liabilities we expect to incur in connection with previously remediated sites, such as natural resource damages for the Hudson River where GE completed dredging in 2019. Additionally, like many other industrial companies, we and our subsidiaries are defendants in various lawsuits related to alleged exposure by workers and others to asbestos or other hazardous materials. Liabilities for environmental remediation and worker exposure claims exclude possible insurance recoveries. It is reasonably possible that our exposure will exceed amounts accrued. However, due to uncertainties about the status of laws, regulations, technology and information related to individual sites and lawsuits, such amounts are not reasonably estimable. Total reserves related to environmental remediation and worker exposure claims were $2,003 million and $1,819 million at December 31, 2024 and 2023, respectively.
Expenditures for site remediation and worker exposure claims amounted to approximately $175 million, $246 million and $195 million for the years ended December 31, 2024, 2023 and 2022, respectively. We presently expect that such expenditures will be approximately $225 million and $225 million in 2025 and 2026, respectively.
NOTE 25. SEGMENT AND GEOGRAPHIC INFORMATION & REMAINING PERFORMANCE OBLIGATION
SEGMENT INFORMATION. On April 2, 2024, and in conjunction with the GE Vernova separation, we implemented an organizational change to align our reportable segments more closely with our business structure. In connection with our segment reporting change, we have recast previously reported amounts across all reportable segments to conform to current segment presentation.
We have two reportable segments and three operating segments. Operating segments are aggregated into a reportable segment if the operating segments have similar quantitative economic characteristics and if the operating segments are similar in the following qualitative characteristics: (i) nature of products and services; (ii) nature of production processes; (iii) type or class of customer for their products and services; (iv) methods used to distribute the products or provide services; and (v) if applicable, the nature of the regulatory environment. We have aggregated Defense & Systems and Propulsion & Additive Technology into one reportable segment (Defense & Propulsion Technologies) based on similarity in economic characteristics, other qualitative factors and the objectives and principals of ASC 280, Segment Reporting. This is consistent with how our chief operating decision maker (CODM), who is our Chief Executive Officer (CEO), allocates resources and makes decisions. Segment accounting policies are the same as described and referenced in Note 1. See About GE Aerospace for a description of our reporting segments as of December 31, 2024.
Segment revenue includes sales of equipment and services by our segments. Segment profit is determined based on performance measures used by our CODM. Our CODM uses segment profit or loss to assess performance and allocate resources to each segment, primarily through periodic budgeting and segment performance reviews. In connection with that assessment, our CODM may exclude matters, such as charges for impairments, significant, higher-cost restructuring programs, costs associated with separation activities, manufacturing footprint rationalization and other similar expenses, acquisition costs and other related charges, certain gains and losses from acquisitions or dispositions and certain litigation settlements. Segment profit excludes results reported as discontinued operations and the portion of earnings or loss attributable to noncontrolling interests of consolidated subsidiaries, and as such only includes the portion of earnings or loss attributable to our share of the consolidated earnings or loss of consolidated subsidiaries. Certain corporate costs, including those related to shared services, employee benefits and information technology, are allocated to our segments based on usage or their relative net cost of operations. See the Corporate & Other section within MD&A for further information about costs excluded from segment profit.
The Company does not report total assets by segment for internal or external reporting purposes as the Company’s CODM does not assess performance, make strategic decisions, or allocate resources based on assets.
| | | | | | | | | | | | | | | | | | | | | | | | | | | | | | | | | | | |
| REVENUE | Total revenue | | Intersegment revenue | | External revenue |
| Years ended December 31 | 2024 | 2023 | 2022 | | 2024 | 2023 | 2022 | | 2024 | 2023 | 2022 |
| Commercial Engines & Services | $ | 26,881 | | $ | 23,855 | | $ | 18,813 | | | $ | 216 | | $ | 559 | | $ | 451 | | | $ | 26,666 | | $ | 23,296 | | $ | 18,362 | |
| Defense & Propulsion Technologies | 9,478 | | 8,961 | | 7,989 | | | 1,453 | | 1,253 | | 1,017 | | | 8,025 | | 7,708 | | 6,972 | |
| Corporate & Other | 2,343 | | 2,532 | | 2,337 | | | (1,669) | | (1,812) | | (1,468) | | | 4,011 | | 4,344 | | 3,805 | |
| Total revenue | $ | 38,702 | | $ | 35,348 | | $ | 29,139 | | | $ | — | | $ | — | | $ | — | | | $ | 38,702 | | $ | 35,348 | | $ | 29,139 | |
| | | | | | | | | | | | | | | | | | | | | | | | | | | | | | | | | | | |
| |
| 2024 | | 2023 | | 2022 |
| Years ended December 31 | Equipment | Services | Total | | Equipment | Services | Total | | Equipment | Services | Total |
| Commercial Engines & Services | $ | 7,106 | | $ | 19,775 | | $ | 26,881 | | | $ | 6,169 | | $ | 17,686 | | $ | 23,855 | | | $ | 5,125 | | $ | 13,688 | | $ | 18,813 | |
| Defense & Propulsion Technologies | 4,208 | | 5,270 | | 9,478 | | | 4,000 | | 4,961 | | 8,961 | | | 3,405 | | 4,584 | | 7,989 | |
| Total segment revenue | $ | 11,315 | | $ | 25,045 | | $ | 36,360 | | | $ | 10,170 | | $ | 22,647 | | $ | 32,816 | | | $ | 8,530 | | $ | 18,272 | | $ | 26,802 | |
Total sales of equipment and services to agencies of the U.S. Government were 12%, 14% and 15% of total revenue for the years ended December 31, 2024, 2023 and 2022, respectively.
| | | | | | | | | | | |
EXPENSES, PROFIT AND EARNINGS For the years ended December 31 | 2024 | 2023 | 2022 |
| Commercial Engines & Services | | | |
| Cost of revenue | $ | 17,703 | | $ | 16,575 | | $ | 13,329 | |
| Selling, general and administrative expenses | 1,678 | | 1,386 | | 1,119 | |
| Research and development | 993 | | 736 | | 543 | |
| Other segment expenses (income)(a) | (548) | | (484) | | (342) | |
| Total Commercial Engines & Services expenses | 19,826 | | 18,213 | | 14,649 | |
| Defense & Propulsion Technologies | | | |
| Cost of revenue | 7,237 | | 6,929 | | 5,971 | |
| Selling, general and administrative expenses | 954 | | 893 | | 810 | |
| Research and development | 301 | | 277 | | 271 | |
| Other segment expenses (income)(a) | (75) | | (46) | | (39) | |
| Total Defense & Propulsion Technologies expenses | 8,417 | | 8,053 | | 7,013 | |
| | | |
| Commercial Engines & Services | 7,055 | | 5,643 | | 4,164 | |
| Defense & Propulsion Technologies | 1,061 | | 908 | | 976 | |
| Total segment profit (loss) | 8,116 | | 6,551 | | 5,139 | |
| Corporate & Other | (89) | | 3,943 | | (1,876) | |
| Interest and other financial charges | (986) | | (1,029) | | (1,339) | |
| Debt extinguishment costs | — | | — | | (465) | |
| Non-operating benefit income (cost) | 842 | | 978 | | 60 | |
| Goodwill impairments | (251) | | — | | — | |
| Benefit (provision) for income taxes | (962) | | (994) | | (169) | |
| Preferred stock dividends | — | | (295) | | (289) | |
| Earnings (loss) from continuing operations attributable to common shareholders | 6,670 | | 9,154 | | 1,061 | |
| | | |
| | | |
| Earnings (loss) from discontinued operations attributable to common shareholders | (114) | | 33 | | (1,014) | |
| Net earnings (loss) attributable to common shareholders | $ | 6,556 | | $ | 9,188 | | $ | 48 | |
(a) Other segment expenses (income) primarily includes equity method income, interest income and licensing and royalty income.
GEOGRAPHIC INFORMATION
| | | | | | | | | | | |
| Years ended December 31 | 2024 | 2023 | 2022 |
| U.S. | $ | 17,340 | | $ | 17,105 | | $ | 15,540 | |
| Non-U.S. | | | |
| Europe | 7,800 | | 7,248 | | 5,029 | |
| China region | 3,634 | | 2,625 | | 1,919 | |
| Asia (excluding China region) | 3,602 | | 3,109 | | 2,254 | |
| Americas | 2,593 | | 1,862 | | 1,803 | |
| Middle East and Africa | 3,734 | | 3,399 | | 2,594 | |
| Total Non-U.S. | $ | 21,363 | | $ | 18,243 | | $ | 13,599 | |
| Total geographic revenue | $ | 38,702 | | $ | 35,348 | | $ | 29,139 | |
| Non-U.S. revenue as a % of total revenue | 55 | % | 52 | % | 47 | % |
| | | | | | | | |
| December 31 | 2024 | 2023 |
| U.S. | $ | 5,166 | | $ | 5,215 | |
| Non-U.S. | | |
| Europe | 1,171 | | 1,194 | |
| Asia | 497 | | 500 | |
| Americas | 431 | | 332 | |
| Other Global | 12 | | 4 | |
| Total Non-U.S. | $ | 2,111 | | $ | 2,031 | |
| Property, plant and equipment – net (Note 6) | $ | 7,277 | | $ | 7,246 | |
REMAINING PERFORMANCE OBLIGATION. As of December 31, 2024, the aggregate amount of the contracted revenue allocated to our unsatisfied (or partially unsatisfied) performance obligations was $171,635 million. We expect to recognize revenue as we satisfy our remaining performance obligations as follows: 1) equipment-related remaining performance obligation of $22,509 million of which 43%, 64% and 94% is expected to be recognized within 1, 2 and 5 years, respectively, and the remaining thereafter; and 2) services-related remaining performance obligations of $149,127 million of which 12%, 41%, 68% and 85% is expected to be recognized within 1, 5, 10 and 15 years, respectively, and the remaining thereafter. Contract modifications could affect both the timing to complete as well as the amount to be received as we fulfill the related remaining performance obligations.
NOTE 26. SUMMARIZED FINANCIAL INFORMATION
Equity method investments. Unconsolidated entities over which we have significant influence are accounted for as equity method investments and presented on a one-line basis in All other assets on our Statement of Financial Position. Equity method income includes our share of the results of unconsolidated entities, gains (loss) from sales and impairments of investments, which is included in Other income and in Insurance revenue in our Statement of Earnings (Loss). See Notes 1, 9 and 19 for further information.
| | | | | | | | | | | | | | | | | |
| Equity method investment | | | |
| balance (Note 9) | Equity method income (loss) (Note 19) |
| December 31 | 2024 | 2023 | 2024 | 2023 | 2022 |
| Commercial Engines & Services | $ | 1,610 | | $ | 1,551 | | $ | 301 | | $ | 276 | | $ | 139 | |
| Defense & Propulsion Technologies | 186 | | 175 | | 8 | | 8 | | 8 | |
| Corporate & Other(a) | 4,451 | | 3,863 | | 147 | | 61 | | 75 | |
| Total | $ | 6,247 | | $ | 5,590 | | $ | 456 | | $ | 345 | | $ | 223 | |
| | | | | |
(a) Equity method investments within Corporate & Other include investments held by run-off insurance operations of $2,933 million and $2,383 million and U.S. tax equity of $1,280 million and $1,227 million as of December 31, 2024 and 2023, respectively.
Summarized financial information of these equity method investments is as follows.
| | | | | | | | | | | |
| For the years ended December 31 | 2024 | 2023(a) | 2022(a) |
| Revenue | $ | 35,342 | | $ | 41,403 | | $ | 31,454 | |
| Gross profit (loss) | 1,229 | | 4,093 | | 107 | |
| Net income (loss) | 3,243 | | 4,768 | | 210 | |
| Net income (loss) attributable to the entity | 3,199 | | 4,731 | | 188 | |
| | | |
(a) Includes AerCap Gross profit (loss) of $3,096 million and $(447) million and Net income (loss) attributable to the entity of $2,525 million and $(1,132) million for the years ended December 31, 2023 and 2022, respectively. On November 16, 2023, we sold our remaining equity interest in AerCap and only the note remains outstanding.
| | | | | | | | | |
| As of December 31 | 2024 | 2023 | |
| Current assets | $ | 19,688 | | $ | 18,565 | | |
| Total assets | $ | 54,116 | | $ | 48,281 | | |
| | | |
| Current liabilities | $ | 17,437 | | $ | 16,468 | | |
| Total liabilities | $ | 23,868 | | $ | 22,266 | | |
| Noncontrolling interests | $ | 200 | | $ | 176 | | |
NOTE 27. QUARTERLY INFORMATION (UNAUDITED)
| | | | | | | | | | | | | | | | | | | | | | | | | | | | | | | | | | | |
| First quarter | | Second quarter | | Third quarter | | Fourth quarter |
| (Per-share amounts in dollars) | 2024 | 2023 | | 2024 | 2023 | | 2024 | 2023 | | 2024 | 2023 |
| Total revenue | $ | 8,955 | | $ | 7,836 | | | $ | 9,094 | | $ | 8,755 | | | $ | 9,842 | | $ | 9,302 | | | $ | 10,812 | | $ | 9,456 | |
| Sales of equipment and services | 8,076 | | 7,044 | | | 8,223 | | 7,907 | | | 8,943 | | 8,461 | | | 9,879 | | 8,547 | |
| Cost of equipment and services sold | 5,747 | | 4,998 | | | 5,574 | | 5,693 | | | 6,226 | | 5,992 | | | 6,761 | | 6,256 | |
| Earnings (loss) from continuing operations | 1,744 | | 6,709 | | | 1,322 | | 1,256 | | | 1,695 | | 307 | | | 1,897 | | 1,176 | |
| Earnings (loss) from discontinued operations | (178) | | 772 | | | (54) | | (1,218) | | | 147 | | 31 | | | (6) | | 413 | |
| Net earnings (loss) | 1,565 | | 7,481 | | | 1,268 | | 37 | | | 1,842 | | 338 | | | 1,891 | | 1,588 | |
Less net earnings (loss) attributable to noncontrolling interests | 27 | | (27) | | | 2 | | 4 | | | (10) | | (14) | | | (8) | | — | |
| Net earnings (loss) attributable to the Company | $ | 1,539 | | $ | 7,508 | | | $ | 1,266 | | $ | 33 | | | $ | 1,852 | | $ | 352 | | | $ | 1,899 | | $ | 1,589 | |
Per-share amounts – earnings (loss) from continuing operations | | | | | | | | | | | |
| Diluted earnings (loss) per share | $ | 1.58 | | $ | 5.98 | | | $ | 1.20 | | $ | 1.09 | | | $ | 1.56 | | $ | 0.20 | | | $ | 1.75 | | $ | 1.08 | |
| Basic earnings (loss) per share | 1.59 | | 6.02 | | | 1.21 | | 1.10 | | | 1.57 | | 0.20 | | | 1.77 | | 1.09 | |
Per-share amounts – earnings (loss) from discontinued operations | | | | | | | | | | | |
| Diluted earnings (loss) per share | (0.18) | | 0.73 | | | (0.05) | | (1.11) | | | 0.13 | | 0.04 | | | (0.01) | | 0.37 | |
| Basic earnings (loss) per share | (0.18) | | 0.74 | | | (0.05) | | (1.12) | | | 0.14 | | 0.04 | | | (0.01) | | 0.37 | |
| Per-share amounts – net earnings (loss) | | | | | | | | | | | |
| Diluted earnings (loss) per share | 1.40 | | 6.71 | | | 1.15 | | (0.02) | | | 1.70 | | 0.24 | | | 1.75 | | 1.44 | |
| Basic earnings (loss) per share | 1.41 | | 6.76 | | | 1.16 | | (0.02) | | | 1.71 | | 0.24 | | | 1.76 | | 1.46 | |
| Dividends declared(a) | — | | 0.08 | | | 0.56 | | 0.08 | | | 0.28 | | 0.08 | | | 0.28 | | 0.08 | |
(a) Following the separation of GE Vernova, the Board of Directors declared a dividend of $0.28 per share in April 2024, which reflects our dividend as a standalone company, that was paid in April 2024. In June 2024, the Board of Directors declared a dividend of $0.28 per share that was paid in July 2024.
Earnings-per-share amounts are computed independently each quarter for earnings (loss) from continuing operations, earnings (loss) from discontinued operations and net earnings (loss). As a result, the sum of each quarter’s per-share amount may not equal the total per-share amount for the respective year; and the sum of per-share amounts from continuing operations and discontinued operations may not equal the total per-share amounts for net earnings (loss) for the respective quarters.
DIRECTORS, EXECUTIVE OFFICERS AND CORPORATE GOVERNANCE
Information about our Executive Officers (As of February 3, 2025)
| | | | | | | | | | | | | | | | | | | | |
| | | | | | Date assumed |
| | | | | | Executive |
| Name | | Position | | Age | | Officer Position |
| | | | | | |
| H. Lawrence Culp, Jr. | | Chairman of the Board & Chief Executive Officer | | 61 | | October 2018 |
| |
| | | | |
| Rahul Ghai | | Senior Vice President & Chief Financial Officer | | 53 | | September 2023 |
| | | | | | |
| Mohamed Ali | | Senior Vice President & Chief Technology & Operations Officer | | 55 | | January 2025 |
| | | | | | |
| Christian Meisner | | Senior Vice President & Chief Human Resources Officer | | 55 | | April 2024 |
| | | | | | |
| John R. Phillips III | | Senior Vice President, General Counsel & Secretary | | 47 | | April 2024 |
| | | | | | |
| Russell Stokes | | Senior Vice President & CEO, Commercial Engines & Services | | 53 | | September 2018 |
| |
| | | | |
| Amy Gowder | | Senior Vice President & CEO, Defense & Systems | | 49 | | April 2024 |
| |
| | | | |
| Ricardo Procacci | | Senior Vice President & CEO, Propulsion & Additive Technologies | | 57 | | April 2024 |
| | | | | | |
| Robert Giglietti | | Vice President, Chief Accounting Officer, Controller and Treasurer | | 54 | | April 2024 |
Executive Officers are elected by the Board of Directors for an initial term that continues until the Board meeting immediately preceding the next annual statutory meeting of shareholders, and thereafter are elected for one-year terms or until their successors have been elected. Mr. Culp and Mr. Stokes have been Executive Officers of the Company for at least five years.
Prior to joining the Company in August 2022, Mr. Ghai had been Executive Vice President and Chief Financial Officer of Otis Worldwide Corporation, an elevator and escalator manufacturing, installation and service company, since 2019 after serving as Senior Vice President and Chief Financial Officer of Harris Corporation from 2016 until 2019.
Prior to becoming Chief Technology & Operations Officer in January 2025, Mr. Ali served as Senior Vice President (and prior to that, Vice President), Engineering since 2021 and in other engineering and systems leadership roles with the Company, originally joining in 1997. On November 21, 2024, Mr. Ali adopted a Rule 10b5-1 trading arrangement that is intended to satisfy the affirmative defense of Rule 10b5-1(c) for the sale of up to 9,815 shares of the Company’s common stock until November 13, 2026.
Prior to joining the Company in October 2023, Mr. Meisner had been Chief Human Resources Officer at Kaiser Permanente, an integrated managed care consortium, since 2020 after serving as Corporate Vice President, Talent and Integration at United Technologies from 2019 until 2020 and Vice President and Chief Human Resources Officer at Otis Elevator Company from 2015 until 2019.
Prior to joining the Company in October 2023, Mr. Phillips had been Deputy Counsel to the President of the United States and Legal Adviser to the National Security Council since 2022, after serving 13 years in various legal leadership roles at Boeing, including Vice President, Corporate Secretary and Assistant General Counsel from 2021 until 2022, and Vice President and Assistant General Counsel from 2016 until 2021.
Prior to joining the Company in April 2022, Ms. Gowder was Chief Operating Officer at Aerojet Rocketdyne, an aerospace and defense company, since 2020, after serving 14 years at Lockheed Martin including as Vice President and General Manager from 2017 until 2020.
Prior to becoming CEO, Propulsion and Additive Technologies in 2022, Mr. Procacci served as Chief Executive Officer of Avio Aero, a General Electric Company affiliate, since 2014.
Prior to becoming Vice President, Chief Accounting Officer, Controller and Treasurer in 2024, Mr. Giglietti served in a number of senior finance and accounting leadership roles with the Company, including most recently as Treasurer for GE Aerospace, since July 2023, and Chief Financial Officer - GE Capital and Corporate, since January 2021, and Operational Leader for the GE separations, originally joining in 2002.
The remaining information called for by this item is incorporated by reference to “Election of Directors,” “Other Governance Policies & Practices”, “Board Committees”, “Board Operations” and "Other Executive Compensation Policies & Practices" in our definitive proxy statement for our 2025 Annual Meeting of Shareholders to be held May 6, 2025, which will be filed within 120 days of the end of our fiscal year ended December 31, 2024 (the 2025 Proxy Statement).
EXHIBITS AND FINANCIAL STATEMENT SCHEDULES
(a)1. Financial Statements
Included in the “Financial Statements and Supplementary Data” section of this report:
Management’s Annual Report on Internal Control Over Financial Reporting
Reports of Independent Registered Public Accounting Firm
Statement of Earnings (Loss) for the years ended December 31, 2024, 2023 and 2022
Statement of Financial Position at December 31, 2024 and 2023
Statement of Cash Flows for the years ended December 31, 2024, 2023 and 2022
Statement of Comprehensive Income (Loss) for the years ended December 31, 2024, 2023 and 2022
Statement of Changes in Shareholders' Equity for the years ended December 31, 2024, 2023 and 2022
Notes to consolidated financial statements
Management’s Discussion and Analysis of Financial Condition and Results of Operations - Summary of Operating Segments
(a)2. Financial Statement Schedules
The schedules listed in Reg. 210.5-04 have been omitted because they are not applicable or the required information is shown in the consolidated financial statements or notes thereto.
(a)3. Exhibit Index
| | | | | |
3(i) The Restated Certificate of Incorporation of General Electric Company (incorporated by reference to Exhibit 3(i) to the Company’s Annual Report on Form 10-K for the fiscal year ended December 31, 2013), as amended by the Certificate of Amendment, dated December 2, 2015 (incorporated by reference to Exhibit 3.1 to the Company’s Current Report on Form 8-K, dated December 3, 2015), as further amended by the Certificate of Amendment, dated January 19, 2016 (incorporated by reference to Exhibit 3.1 to the Company’s Current Report on Form 8-K, dated January 20, 2016), as further amended by the Certificate of Change of General Electric Company (incorporated by reference to Exhibit 3(1) to the Company’s Current Report on Form 8-K, dated September 1, 2016), as further amended by the Certificate of Amendment, dated May 13, 2019 (incorporated by reference to Exhibit 3.1 to the Company’s Current Report on Form 8-K, dated May 13, 2019), as further amended by the Certificate of Change of General Electric Company (incorporated by reference to Exhibit 3.1 to the Company’s Current Report on Form 8-K, dated December 9, 2019), as further amended by the Certificate of Amendment, dated July 30, 2021 (incorporated by reference to Exhibit 3.1 to the Company's Current Report on Form 8-K, dated July 30, 2021), as further amended by the Certificate of Change of General Electric Company, dated May 15, 2023 (incorporated by reference to Exhibit 3.1 to the Company's Current Report on Form 8-K, dated May 17, 2023), as further amended by the Certificate of Change of General Electric Company, dated April 1, 2024 (incorporated by reference to Exhibit 3.1 to the Company’s Current Report on Form 8-K dated April 2, 2024). |
|
4(a) Amended and Restated General Electric Capital Corporation Standard Global Multiple Series Indenture Provisions dated as of February 27, 1997 (incorporated by reference to Exhibit 4(a) to General Electric Capital Corporation’s Registration Statement on Form S-3, File No. 333-59707). |
4(b) Third Amended and Restated Indenture dated as of February 27, 1997, between General Electric Capital Corporation and The Bank of New York Mellon, as successor trustee (incorporated by reference to Exhibit 4(c) to General Electric Capital Corporation’s Registration Statement on Form S-3, File No. 333-59707). |
|
4(d) Second Supplemental Indenture dated as of July 2, 2001, supplemental to Third Amended and Restated Indenture dated as of February 27, 1997 (incorporated by reference to Exhibit 4(f) to General Electric Capital Corporation’s Post-Effective Amendment No.1 to Registration Statement on Form S-3, File No. 333-40880). |
4(e) Third Supplemental Indenture dated as of November 22, 2002, supplemental to Third Amended and Restated Indenture dated as of February 27, 1997 (incorporated by reference to Exhibit 4(cc) to General Electric Capital Corporation’s Post-Effective Amendment No. 1 to the Registration Statement on Form S-3, File No. 333‑100527). |
4(f) Fourth Supplemental Indenture dated as of August 24, 2007, supplemental to Third Amended and Restated Indenture dated as of February 27, 1997 (incorporated by reference to Exhibit 4(g) to General Electric Capital Corporation’s Registration Statement on Form S-3, File number 333-156929). |
4(g) Senior Note Indenture, dated October 9, 2012, by and between the Company and The Bank of New York Mellon, as trustee (incorporated by reference to Exhibit 4.1 of the Company’s Current Report on Form 8-K dated October 9, 2012). |
4(h) Indenture dated as of October 26, 2015, among GE Capital International Funding Company, as issuer, General Electric Company and General Electric Capital Corporation, as guarantors and The Bank of New York Mellon, as trustee (incorporated by reference to Exhibit 99 to the Company’s Current Report on Form 8-K dated October 26, 2015). |
4(i) Global Supplemental Indenture dated as of April 10, 2015, among General Electric Capital Corporation, General Electric Company and The Bank of New York Mellon, as trustee (incorporated by reference to Exhibit 4(i) to the Company’s Annual Report on Form 10-K for the fiscal year ended December 31, 2015). |
4(j) Second Global Supplemental Indenture dated as of December 2, 2015, among General Electric Capital Corporation, General Electric Company and The Bank of New York Mellon, as successor trustee (incorporated by reference to Exhibit 4.2 to the Company’s Current Report on Form 8-K dated December 3, 2015). |
|
|
(10) Except for 10(oo), (pp), (qq), (rr) and (ss) below, all of the following exhibits consist of Executive Compensation Plans or Arrangements: |
| |
| |
| (c) General Electric Directors’ Charitable Gift Plan, as amended through December 2002 (incorporated by reference to Exhibit 10(i) to the Company’s Annual Report on Form 10-K for the fiscal year ended December 31, 2002). |
| |
| |
| (f) General Electric 2003 Non-Employee Director Compensation Plan, Amended and Restated as of December 7, 2018 (incorporated by reference to Exhibit 10(g) to the Company’s Annual Report on Form 10-K for the fiscal year ended December 31, 2018). |
| |
| |
| | | | | |
| (i) Form of Director Indemnification Agreement (incorporated by reference to Exhibit 10(cc) to the Company’s Annual Report on Form 10-K for the fiscal year ended December 31, 2018). |
| (j) Amendment to Nonqualified Deferred Compensation Plans, dated as of December 14, 2004 (incorporated by reference to Exhibit 10(w) to the Company’s Annual Report on Form 10-K for the fiscal year ended December 31, 2004). |
| |
| |
| |
| |
| (o) GE 2007 Long-Term Incentive Plan as amended and restated April 26, 2017, as further amended and restated February 15, 2019, and as further amended and restated July 30, 2021 (incorporated by reference to Exhibit 10(a) to the Company’s Quarterly Report on Form 10-Q for the quarter ended September 30, 2021). |
| (p) Amendment, dated August 18, 2020, to the GE 2007 Long-Term Incentive Plan (as amended and restated April 26, 2017, and as further amended and restated February 15, 2019) (incorporated by reference to Exhibit 10(c) to the Company’s Quarterly Report on Form 10-Q for the quarter ended September 30, 2020). |
| |
| |
| |
| (t) Form of Agreement for Stock Option Grants to Executive Officers under the General Electric Company 2007 Long-Term Incentive Plan, as of March 2022 (incorporated by reference to Exhibit 10(a) to the Company’s Quarterly Report on Form 10-Q for the quarter ended March 31, 2022). |
| (u) Form of Agreement for Stock Option Grants to Executive Officers under the General Electric Company 2007 Long-Term Incentive Plan, as of March 2021 (incorporated by reference to Exhibit 10(a) to the Company’s Quarterly Report on Form 10-Q for the quarter ended March 30, 2021). |
| |
| |
| |
| |
| (z) Form of Agreement for Restricted Stock Unit Grants to Executive Officers under the General Electric Company 2007 Long-Term Incentive Plan, as of March 2022 (incorporated by reference to Exhibit 10(b) to the Company’s Quarterly Report on Form 10-Q for the quarter ended March 31, 2022). |
| (aa) Form of Agreement for Leadership Restricted Stock Unit Grants to Executive Officers under the General Electric Company 2007 Long-Term Incentive Plan, as of September 2020 (incorporated by reference to Exhibit 10(t) to the Company’s Annual Report on Form 10-K for the fiscal year ended December 31, 2020). |
| |
| |
| |
| |
| |
| (gg) Employment Agreement between H. Lawrence Culp, Jr. and General Electric Company, effective October 1, 2018 (incorporated by reference to Exhibit 10(z) to the Company’s Annual Report on Form 10-K for the fiscal year ended December 31, 2018). |
| (hh) Amendment No. 1, effective August 18, 2020, to the Employment Agreement between H. Lawrence Culp, Jr. and General Electric Company, effective October 1, 2018 (incorporated by reference to Exhibit 10.1 to the Company’s Current Report on Form 8-K dated August 20, 2020). |
| (ii) Amendment No. 2, dated as of March 15, 2022, to the Employment Agreement between H. Lawrence Culp, Jr. and General Electric Company, dated as of October 1, 2018 (incorporated by reference to Exhibit 10.1 to the Company’s Current on Form 8-K dated March 17, 2022). |
| | | | | |
| |
| (kk) Performance Share Grant Agreement for H. Lawrence Culp, Jr., dated August 18, 2020 (incorporated by reference to Exhibit 10.2 to the Company’s Current Report on Form 8-K dated August 20, 2020). |
| (ll) Notice of Adjustment to the Performance Share Grant Agreement for H. Lawrence Culp, Jr., effective July 30, 2021 (incorporated by reference to Exhibit 10(c) to the Company’s Quarterly Report on Form 10-Q for the quarter ended September 30, 2021). |
| |
| |
| (oo) Amended and Restated Agreement, dated April 10, 2015, between General Electric Company and General Electric Capital Corporation (incorporated by reference to Exhibit 10 to the Company’s Current Report on Form 8-K dated April 10, 2015). |
| |
| |
| |
| (ss) Tax Matters Agreement, dated as of January 2, 2023, by and between GE and GE HealthCare Technologies Inc. (Incorporated by reference to Exhibit 10.1 to the Company’s Current Report on Form 8-K dated January 4, 2023). |
|
|
|
|
|
|
|
|
|
|
|
(101) The following materials from General Electric Company's Annual Report on Form 10-K for the year ended December 31, 2024, formatted as Inline XBRL (eXtensible Business Reporting Language); (i) Statement of Earnings (Loss) for the years ended December 31, 2024, 2023 and 2022, (ii) Statement of Financial Position at December 31, 2024 and 2023, (iii) Statement of Cash Flows for the years ended December 31, 2024, 2023 and 2022, (iv) Statement of Comprehensive Income (Loss) for the years ended December 31, 2024, 2023 and 2022, (v) Statement of Changes in Shareholders' Equity for the years ended December 31, 2024, 2023 and 2022, and (vi) the Notes to Consolidated Financial Statements.* |
(104) Cover Page Interactive Data File (formatted as Inline XBRL and contained in Exhibit 101). |
* Filed electronically herewith |
** Information required to be presented in Exhibit 11 is provided in Note 18 to the consolidated financial statements in this Form 10-K Report in accordance with the provisions of Financial Accounting Standards Board Accounting Standards Codification 260, Earnings Per Share. |
| | | | | | | | | | | | | | |
| FORM 10-K CROSS REFERENCE INDEX | | Page(s) |
| Part I | | | | |
| Item 1. | | Business | | 4-7, 9-11, 74-75 |
| | | | |
| Item 1A. | | Risk Factors | | 26-33 |
| | | | |
| Item 1B. | | Unresolved Staff Comments | | Not applicable |
| Item 1C. | | Cybersecurity | | 25 |
| Item 2. | | Properties | | 4 |
| | | | |
| Item 3. | | Legal Proceedings | | 73-74 |
| | | | |
| Item 4. | | Mine Safety Disclosures | | Not applicable |
| Part II | | | | |
| Item 5. | | Market for Registrant’s Common Equity, Related Stockholder Matters and Issuer Purchases of Equity Securities | | 24 |
| | | | |
| Item 6. | | [Reserved] | | Not applicable |
| | | | |
| Item 7. | | Management’s Discussion and Analysis of Financial Condition and Results of Operations | | 8-24 |
| | | | |
| Item 7A. | | Quantitative and Qualitative Disclosures About Market Risk | | 14, 70-71 |
| | | | |
| Item 8. | | Financial Statements and Supplementary Data | | 38-77 |
| | | | |
| Item 9. | | Changes in and Disagreements With Accountants on Accounting and Financial Disclosure | | Not applicable |
| | | | |
| Item 9A. | | Controls and Procedures | | 34 |
| | | | |
| Item 9B. | | Other Information | | 78 |
| | | | |
| Item 9C. | | Disclosure Regarding Foreign Jurisdictions that Prevent Inspections | | Not applicable |
| Part III | | | | |
| Item 10. | | Directors, Executive Officers and Corporate Governance | | 77-78, (a) |
| | | | |
| Item 11. | | Executive Compensation | | (b) |
| | | | |
| Item 12. | | Security Ownership of Certain Beneficial Owners and Management and Related Stockholder Matters | | (c) |
| | | | |
| Item 13. | | Certain Relationships and Related Transactions, and Director Independence | | (d) |
| | | | |
| Item 14. | | Principal Accountant Fees and Services | | (e) |
| Part IV | | | | |
| Item 15. | | Exhibits and Financial Statement Schedules | | 78-81 |
| | | | |
| Item 16. | | Form 10-K Summary | | Not applicable |
| | | | |
| Signatures | | | 83 |
(a)Incorporated by reference to "Governance" and “Other Executive Compensation Policies & Practices” in the 2025 Proxy Statement.
(b)Incorporated by reference to "Compensation Discussion & Analysis", “Other Executive Compensation Policies & Practices” and "Management Development & Compensation Committee Report" in the 2025 Proxy Statement.
(c)Incorporated by reference to “Stock Ownership Information” and "Equity Compensation Plan Information" in the 2025 Proxy Statement.
(d)Incorporated by reference to “Related Person Transactions” and “How We Assess Director Independence” in the 2025 Proxy Statement.
(e)Incorporated by reference to “Independent Auditor” in the 2025 Proxy Statement for Deloitte and Touche LLP (PCAOB ID No. 34) .
SIGNATURES
Pursuant to the requirements of Section 13 or 15(d) of the Securities Exchange Act of 1934, the registrant has duly caused this annual report on Form 10-K for the fiscal year ended December 31, 2024, to be signed on its behalf by the undersigned, and in the capacities indicated, thereunto duly authorized in the Village of Evendale and State of Ohio on the 3rd day of February 2025.
General Electric Company
(Registrant)
| | | | | |
| By | /s/ Robert Giglietti |
| Robert Giglietti
Vice President, Chief Accounting Officer, Controller and Treasurer
(Principal Accounting Officer) |
Pursuant to the requirements of the Securities Exchange Act of 1934, this report has been signed below by the following persons on behalf of the registrant and in the capacities and on the dates indicated.
| | | | | | | | | | | | | | | | | |
| Signer | | Title | | Date |
| | | | | |
| /s/ Rahul Ghai | | Principal Financial Officer | | February 3, 2025 |
| Rahul Ghai Senior Vice President and Chief Financial Officer | | | | |
| | | | | |
| /s/ Robert Giglietti | | Principal Accounting Officer | | February 3, 2025 |
| Robert Giglietti
Vice President, Chief Accounting Officer, Controller and Treasurer | | | | |
| | | | | |
| /s/ H. Lawrence Culp, Jr. | | Principal Executive Officer | | February 3, 2025 |
| H. Lawrence Culp, Jr.*
Chairman of the Board of Directors | | | | |
| | | | | |
| Stephen Angel* | | Director | | |
| Sébastien M. Bazin* | | Director | | |
| Margaret Billson* | | Director | | |
| Thomas Enders* | | Director | | |
| Edward P. Garden* | | Director | | |
| Isabella Goren* | | Director | | |
| Thomas W. Horton* | | Director | | |
| Catherine A. Lesjak* | | Director | | |
| Darren McDew* | | Director | | |
| | | | | |
| | | | | |
| A majority of the Board of Directors | | | | |
| | | | | |
| | | | | |
| *By | /s/ Brandon Smith | | | | |
| Brandon Smith
Attorney-in-fact | | | | |
| February 3, 2025 | | | | |