UNITED STATES SECURITIES AND EXCHANGE COMMISSION
Washington, D.C. 20549
FORM 10-K
☒ ANNUAL REPORT PURSUANT TO SECTION 13 OR 15(d) OF THE SECURITIES EXCHANGE ACT OF 1934
for the fiscal year ended December 31, 2024
☐ TRANSITION REPORT PURSUANT TO SECTION 13 OR 15(d) OF THE SECURITIES EXCHANGE ACT OF 1934
for the transition period from ___________ to___________
Commission File Number 1-8339
NORFOLK SOUTHERN CORPORATION
(Exact name of registrant as specified in its charter)
| | | | | | | | |
| Virginia | 52-1188014 |
| (State or other jurisdiction of incorporation or organization) | (I.R.S. Employer Identification No.) |
| 650 West Peachtree Street NW | 30308-1925 |
| Atlanta, | Georgia |
| (Address of principal executive offices) | (Zip Code) |
| (855) | 667-3655 |
| (Registrant’s telephone number, including area code) |
Securities registered pursuant to Section 12(b) of the Act: | | | | | | | | |
| Title of each class | Trading Symbol(s) | Name of each exchange on which registered |
| Norfolk Southern Corporation Common Stock (Par Value $1.00) | NSC | New York Stock Exchange |
Securities registered pursuant to Section 12(g) of the Act: NONE
Indicate by check mark if the registrant is a well-known seasoned issuer, as defined in Rule 405 of the Securities Act. Yes ☒ No ☐
Indicate by check mark if the registrant is not required to file reports pursuant to Section 13 or Section 15(d) of the Act. Yes ☐ No ☒
Indicate by check mark whether the registrant (1) has filed all reports required to be filed by Section 13 or 15(d) of the Securities Exchange Act of 1934 during the preceding 12 months (or for such shorter period that the registrant was required to file such reports), and (2) has been subject to such filing requirements for the past 90 days. Yes ☒ No ☐
Indicate by check mark whether the registrant has submitted electronically every Interactive Data File required to be submitted pursuant to Rule 405 of Regulation S-T (§ 232.405 of this chapter) during the preceding 12 months (or for such shorter period that the registrant was required to submit such files). Yes ☒ No ☐
Indicate by check mark whether the registrant is a large accelerated filer, an accelerated filer, a non-accelerated filer, a smaller reporting company, or an emerging growth company. See the definitions of "large accelerated filer," "accelerated filer," "smaller reporting company," and "emerging growth company" in Rule 12b-2 of the Exchange Act.
Large accelerated filer ☒ Accelerated filer ☐ Non-accelerated filer ☐ Smaller reporting company ☐ Emerging growth company ☐
If an emerging growth company, indicate by check mark if the registrant has elected not to use the extended transition period for complying with any new or revised financial accounting standards provided pursuant to Section 13(a) of the Exchange Act. ☐
Indicate by check mark whether the registrant has filed a report on and attestation to its management’s assessment of the effectiveness of its internal control over financial reporting under Section 404(b) of the Sarbanes-Oxley Act (15 U.S.C. 7262(b)) by the registered public accounting firm that prepared or issued its audit report. ☒
If securities are registered pursuant to Section 12(b) of the Act, indicate by check mark whether the financial statements of the registrant included in the filing reflect the correction of an error to previously issued financial statements. ☐
Indicate by check mark whether any of those error corrections are restatements that required a recovery analysis of incentive-based compensation received by any of the registrant’s executive officers during the relevant recovery period pursuant to §240.10D-1(b). ☐
Indicate by check mark whether the registrant is a shell company (as defined in Rule 12b-2 of the Act). Yes ☐ No ☒
The aggregate market value of the voting common equity held by non-affiliates at June 30, 2024 was $48,522,427,121 (based on the closing price as quoted on the New York Stock Exchange on June 30, 2024).
The number of shares outstanding of each of the registrant’s classes of common stock, at January 31, 2025: 226,434,128 (excluding 20,320,777 shares held by the registrant’s consolidated subsidiaries).
DOCUMENTS INCORPORATED BY REFERENCE: Portions of the Registrant’s definitive proxy statement to be filed electronically pursuant to Regulation 14A not later than 120 days after the end of the fiscal year, are incorporated herein by reference in Part III.
TABLE OF CONTENTS
NORFOLK SOUTHERN CORPORATION AND SUBSIDIARIES
PART I
NORFOLK SOUTHERN CORPORATION AND SUBSIDIARIES
Item 1. Business and Item 2. Properties
GENERAL – Norfolk Southern Corporation (Norfolk Southern) is an Atlanta, Georgia-based company that owns a major freight railroad, Norfolk Southern Railway Company (NSR). We were incorporated on July 23, 1980, under the laws of the Commonwealth of Virginia. Our common stock (Common Stock) is listed on the New York Stock Exchange (NYSE) under the symbol “NSC.”
Unless indicated otherwise, Norfolk Southern Corporation and its subsidiaries, including NSR, are referred to collectively as NS, we, us, and our.
We are primarily engaged in the rail transportation of raw materials, intermediate products, and finished goods primarily in the Southeast, East, and Midwest and, via interchange with rail carriers, to and from the rest of the United States (U.S.). We also transport overseas freight through several Atlantic and Gulf Coast ports. We offer the most extensive intermodal network in the eastern half of the U.S.
We make available free of charge through our website, www.norfolksouthern.com, our annual report on Form 10-K, quarterly reports on Form 10-Q, current reports on Form 8-K, and all amendments to those reports as soon as reasonably practicable after such material is electronically filed with or furnished to the U.S. Securities and Exchange Commission (SEC). In addition, the following documents are available on our website and in print to any shareholder who requests them:
•Norfolk Southern Corporation Bylaws
•Charters of the Committees of the Board of Directors
•Corporate Governance Guidelines
•Categorical Independence Standards
•The Thoroughbred Code of Ethics
•Code of Ethical Conduct for Senior Financial Officers
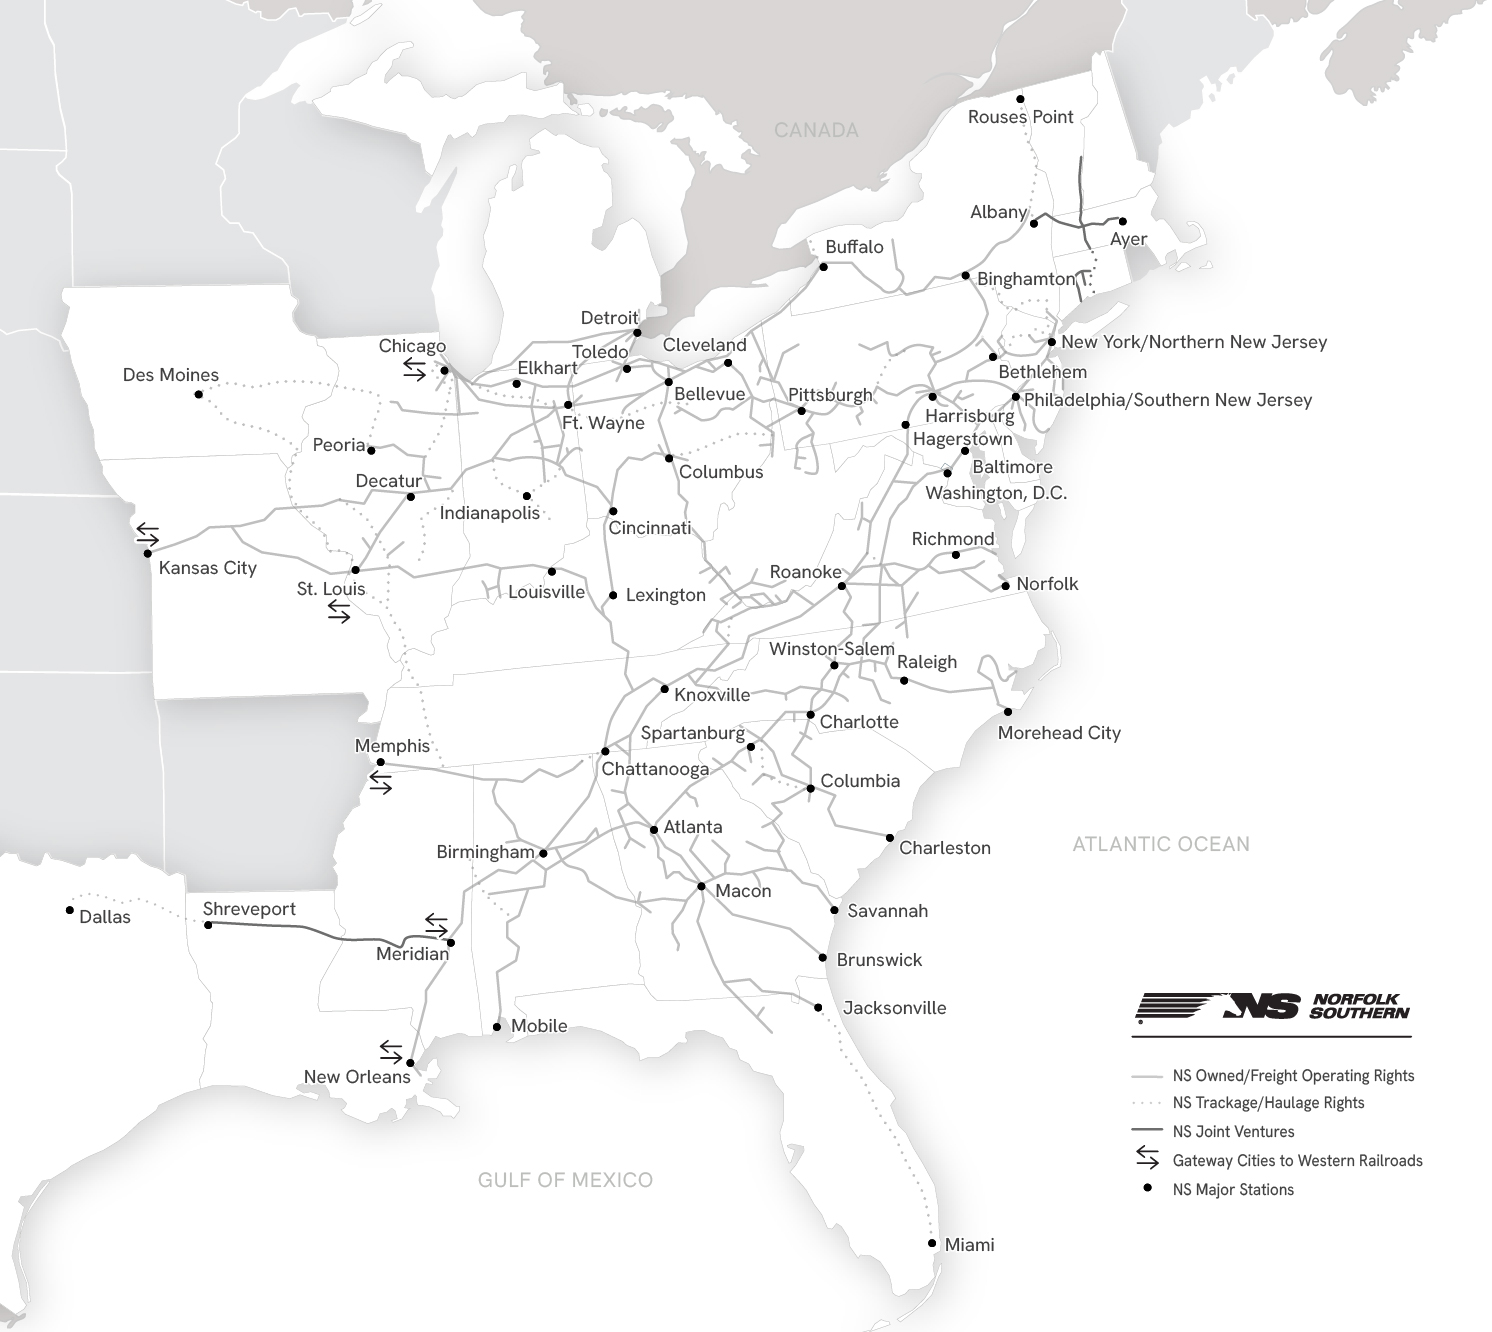
RAILROAD OPERATIONS – At December 31, 2024, we operated approximately 19,200 route miles in 22 states and the District of Columbia.
Our system reaches many manufacturing plants, electric generating facilities, mines, distribution centers, transload facilities, and other businesses located in our service area.
Corridors with heaviest freight volume:
•New York City area to Chicago (via Allentown and Pittsburgh)
•Chicago to Macon (via Cincinnati, Chattanooga, and Atlanta)
•Central Ohio to Norfolk (via Columbus and Roanoke)
•Cleveland to Kansas City
•Birmingham to Meridian
•Memphis to Chattanooga
The miles operated, which include an exclusive operating agreement for trackage rights over property owned by North Carolina Railroad Company, were as follows:
| | | | | | | | | | | | | | | | | | | | | | | | | | | | | |
| | Mileage Operated at December 31, 2024 |
| Route Miles | | Second
and
Other
Main
Track | | Passing
Track,
Crossovers,
and
Turnouts | | Way and Yard Switching | | Total |
| | | | | | | | | |
| Owned | 14,629 | | | 2,826 | | | 1,983 | | | 8,241 | | | 27,679 | |
| Operated under lease, contract, or trackage | | | | | | | | | |
| rights | 4,525 | | | 1,735 | | | 373 | | | 720 | | | 7,353 | |
| | | | | | | | | |
| Total | 19,154 | | | 4,561 | | | 2,356 | | | 8,961 | | | 35,032 | |
In March 2024, we completed the acquisition of a 337 mile railway line that extends from Cincinnati, Ohio to Chattanooga, Tennessee from the Cincinnati Southern Railway (CSR), which we previously operated under a lease. See further discussion in Item 7 “Management's Discussion and Analysis of Financial Condition and Results of Operations” and Item 8 “Notes to Consolidated Financial Statements.”
We operate freight service over lines with significant ongoing Amtrak and commuter passenger operations and conduct freight operations over trackage owned or leased by Amtrak, New Jersey Transit, Southeastern Pennsylvania Transportation Authority, Metro-North Commuter Railroad Company, Virginia Passenger Rail Authority (VPRA), and Michigan Department of Transportation.
The following table sets forth certain statistics relating to our operations for the past five years:
| | | | | | | | | | | | | | | | | | | | | | | | | | | | | | | | |
| | Years ended December 31, | |
| | 2024 | | 2023 | | 2022 | | 2021 | | 2020 | |
| | | | | | | | | | |
| Revenue ton miles (billions) | 178 | | | 176 | | | 179 | | | 178 | | | 164 | | |
| Revenue per thousand revenue ton miles | $ | 68.09 | | | $ | 69.05 | | | $ | 71.35 | | | $ | 62.56 | | | $ | 59.67 | | |
| Revenue ton miles (thousands) per railroad employee | 8,846 | | | 8,719 | | | 9,513 | | | 9,694 | | | 8,191 | | |
| Ratio of railway operating expenses to railway | | | | | | | | | | |
| operating revenues (railway operating ratio) | 66.4% | | 76.5% | | 62.3% | | 60.1% | | 69.3% | |
RAILWAY OPERATING REVENUES – Total railway operating revenues were $12.1 billion in 2024. Following is an overview of our three commodity groups. See the discussion of merchandise revenues by major commodity group, intermodal revenues, and coal revenues and tonnage in Item 7 “Management’s Discussion and Analysis of Financial Condition and Results of Operations.”
MERCHANDISE – Our merchandise commodity group is composed of four groupings:
•Agriculture, forest and consumer products includes soybeans, wheat, corn, fertilizer, livestock and poultry feed, food products, food oils, flour, sweeteners, ethanol, lumber and wood products, pulp board and paper products, wood fibers, wood pulp, beverages, and canned goods.
•Chemicals includes sulfur and related chemicals, petroleum products (including crude oil), chlorine and bleaching compounds, plastics, rubber, industrial chemicals, chemical wastes, sand, and natural gas liquids.
•Metals and construction includes steel, aluminum products, machinery, scrap metals, cement, aggregates, minerals, clay, transportation equipment, and items for the U.S. military.
•Automotive includes finished motor vehicles and automotive parts.
In 2024, we handled 2.3 million merchandise carloads, which accounted for 62% of our total railway operating revenues.
INTERMODAL – Our intermodal commodity group consists of shipments moving in domestic and international containers and trailers. These shipments are handled on behalf of intermodal marketing companies, international steamship lines, premium customers, and asset-owning companies. In 2024, we handled 4.1 million intermodal units, which accounted for 25% of our total railway operating revenues.
COAL – Coal revenues accounted for 13% of our total railway operating revenues in 2024. We handled 76.7 million tons, or 0.7 million carloads, most of which originated on our lines from major eastern coal basins with the balance from major western coal basins received via the Memphis and Chicago gateways. Our coal franchise supports the electric generation market, directly serving 18 coal-fired power plants, as well as the export, domestic metallurgical, and industrial markets, primarily through direct rail and river, lake, and coastal facilities, including various terminals on the Ohio River, at Lamberts Point in Norfolk, Virginia, at the Port of Baltimore, and on Lake Erie.
FREIGHT RATES – Our predominant pricing mechanisms, private contracts and exempt price quotes, are not subject to regulation. In general, market forces are the primary determinant of rail service prices.
RAILWAY PROPERTY
Our railroad infrastructure makes us capital intensive with net properties of approximately $36 billion on a historical cost basis.
Property Additions – Property additions for the past five years were as follows:
| | | | | | | | | | | | | | | | | | | | | | | | | | | | | |
| | 2024 | | 2023 | | 2022 | | 2021 | | 2020 |
| | ($ in millions) |
| | | | | | | | | |
| Road and other property | $ | 1,711 | | | $ | 1,525 | | | $ | 1,345 | | | $ | 1,041 | | | $ | 1,046 | |
| Acquisition of assets of CSR | 1,643 | | | 22 | | | — | | | — | | | — | |
| Equipment | 670 | | | 802 | | | 603 | | | 429 | | | 448 | |
| | | | | | | | | |
| Total | $ | 4,024 | | | $ | 2,349 | | | $ | 1,948 | | | $ | 1,470 | | | $ | 1,494 | |
Our capital spending and replacement programs are and have been designed to support our ability to provide safe, efficient, and reliable rail transportation services.
Equipment – Our equipment includes owned and leased locomotives and railcars; maintenance of way equipment and machinery; other equipment and tools used in our shops, offices, and facilities; and vehicles and other equipment used for maintenance, transportation, and other activities. Our equipment includes both owned equipment acquired by us and equipment held under lease arrangements. At December 31, 2024, we owned or leased the following revenue generating equipment:
| | | | | | | | | | | | | | | | | | | | | | | |
| Owned | | Leased | | Total | | Capacity of
Equipment |
| Locomotives: | | | | | | | (Horsepower) |
| Multiple purpose | 3,101 | | | — | | | 3,101 | | | 12,073,500 | |
| Auxiliary units | 140 | | | — | | | 140 | | | — | |
| Switching | 4 | | | — | | | 4 | | | 4,400 | |
| | | | | | | |
| Total locomotives | 3,245 | | | — | | | 3,245 | | | 12,077,900 | |
| | | | | | | |
| Freight cars: | | | | | | | (Tons) |
| Gondola | 17,007 | | | 3,739 | | | 20,746 | | | 2,346,243 | |
| Hopper | 6,875 | | | — | | | 6,875 | | | 787,764 | |
| Covered hopper | 5,107 | | | 310 | | | 5,417 | | | 602,841 | |
| Box | 1,743 | | | 513 | | | 2,256 | | | 211,489 | |
| Flat | 1,038 | | | 670 | | | 1,708 | | | 122,369 | |
| Other | 121 | | | — | | | 121 | | | — | |
| | | | | | | |
| Total freight cars | 31,891 | | | 5,232 | | | 37,123 | | | 4,070,706 | |
| | | | | | | |
| Intermodal equipment: | | | | | | | |
| Chassis | 39,037 | | | — | | | 39,037 | | | |
| Containers | 17,443 | | | — | | | 17,443 | | | |
| | | | | | | |
| | | | | | | |
| | | | | | | |
| | | | | | | |
| | | | | | | |
| Total intermodal equipment | 56,480 | | | — | | | 56,480 | | | |
The following table indicates the number and year built for locomotives and freight cars owned at December 31, 2024:
| | | | | | | | | | | | | | | | | | | | | | | | | | | | | | | | | | | | | | | | | | | | | | | | | | | | | |
| 2024 | | 2023 | | 2022 | | 2021 | | 2020 | | 2015-
2019 | | 2010-
2014 | | 2009 &
Before | | Total |
| Locomotives: | | | | | | | | | | | | | | | | | |
| No. of units | — | | — | | — | | 1 | | 10 | | 178 | | 325 | | 2,731 | | 3,245 |
| % of fleet | — | % | | — | % | | — | % | | — | % | | — | % | | 6 | % | | 10 | % | | 84 | % | | 100 | % |
| | | | | | | | | | | | | | | | | |
| Freight cars: | | | | | | | | | | | | | | | | | |
| No. of units | 254 | | 1,059 | | 236 | | — | | — | | 3,505 | | 6,745 | | 20,092 | | 31,891 |
| % of fleet | 1 | % | | 3 | % | | 1 | % | | — | % | | — | % | | 11 | % | | 21 | % | | 63 | % | | 100 | % |
The following table shows the average age of our owned locomotive and freight car fleets at December 31, 2024 and information regarding 2024 retirements:
| | | | | | | | | | | | | | | | | |
| | Locomotives | | Freight Cars |
| Average age – in service | 29.6 | years | | 24.2 | years |
| Retirements | 61 | units | | 3,937 | units |
| Average age – retired | 23.9 | years | | 42.4 | years |
Track Maintenance – Of the 35,000 total miles of track on which we operate, we are responsible for maintaining 28,300 miles, with the remainder being operated under trackage rights from other parties responsible for maintenance.
Over 85% of the main line trackage (including first, second, third, and branch main tracks, all excluding rail operated pursuant to trackage rights) has rail ranging from 131 to 155 pounds per yard with the standard installation currently at 136 pounds per yard. Approximately 40% of our lines, excluding rail operated pursuant to trackage rights, carried 20 million or more gross tons per track mile during 2024.
The following table summarizes several measurements regarding our track roadway additions and replacements during the past five years: | | | | | | | | | | | | | | | | | | | | | | | | | | | | | |
| | 2024 | | 2023 | | 2022 | | 2021 | | 2020 |
| Track miles of rail installed | 559 | | | 584 | | | 541 | | | 458 | | | 418 | |
| Miles of track surfaced | 3,957 | | | 4,013 | | | 4,155 | | | 4,225 | | | 4,785 | |
| Crossties installed (millions) | 2.1 | | | 2.1 | | | 2.2 | | | 2.0 | | | 1.8 | |
Traffic Control – Of the 16,200 route miles we dispatch, 11,300 miles are equipped with signalization. This includes 8,500 miles governed by Centralized Traffic Control (CTC) and 2,800 miles utilizing Automatic Block Signals. Within the 8,500 CTC miles, 7,600 miles are controlled wirelessly through our data radio network and other infrastructure.
ENVIRONMENTAL MATTERS – Compliance with laws and regulations relating to the protection of the environment is one of our principal goals. With the exception of our response to the Eastern Ohio Incident (the “Incident” as defined in Note 18) such compliance has not had a material effect on our financial position, results of operations, or liquidity. For further information on the Incident and environmental matters, see Note 18 in Item 8 “Notes to Consolidated Financial Statements.”
HUMAN CAPITAL MANAGEMENT
Workforce – We employed an average of 20,200 employees during 2024 and 19,600 employees at the end of 2024. Approximately 80% of our railroad employees are covered by collective bargaining agreements with various labor unions and referred to as “craft” employees. See the discussion of “Labor Agreements” in Item 7 “Management’s Discussion and Analysis of Financial Condition and Results of Operations.” The remainder of our workforce is composed of management employees.
Safety – Safety is a core value at Norfolk Southern. We are dedicated to providing employees with a safe workplace and the knowledge and tools they need to work safely and return home safely every day. Our commitment to an injury-free workplace is outlined in our Risk Reduction Program, which focuses on safety policies and procedures, risk-based hazard management program, safety outreach and communications, technology analysis and implementation, and collaboration with craft employees. Our safety programs, practices, and messaging further reinforce the importance of working safely including the imperative to speak up with ideas and concerns as well as reinforce the universal authority to stop work if ever unsure or detect a risk that is not adequately safeguarded. We measure employee safety performance through internal metrics such as accidents, injuries, and serious injuries per 200,000 employee-hours. We also use metrics established by the Federal Railroad
Administration (FRA) to measure FRA-reportable accidents per million train miles and injuries per 200,000 employee-hours. Given that safety continues to be a top priority, and the importance of safety among our workforce and to our business, our Board of Directors (Board) has a standing Safety Committee that, among other duties, reviews, monitors, and evaluates our compliance with our safety programs and practices.
Craft Workforce Levels and Productivity – Maintaining appropriate headcount levels for our craft-employee workforce is critical to our on-time and consistent delivery of customers’ goods and operational efficiency goals. We manage this human capital metric through forecasting tools designed to ensure the optimal level of staffing to meet business demands. We measure and monitor employee productivity based on various factors, including gross ton miles per train and engine employee.
Attracting and Retaining Management Employees – Our talent strategy for management employees is essential to attracting strong candidates in a competitive talent environment. We evaluate the effectiveness of that strategy by studying market trends, benchmarking the attractiveness of our employee value proposition, maintaining a competitive compensation package, and analyzing retention data.
We also focus on driving employee engagement, which is key to increasing employee productivity, retention, and safety. We take a data-centric approach, including the use of periodic surveys among employees, to identify new initiatives that will help boost engagement and drive business results.
Employee Development and Training – We provide a range of developmental programs, opportunities, skills, and resources for our employees to be successful in their careers. We provide classroom instruction, hands-on training and simulation-based training designed to improve on-the-job effectiveness and safety outcomes.
We also use modern learning and performance technologies to offer robust professional growth opportunities. Through on-demand digital course offerings, custom-built learning paths, and in-person facilitated content, our programs provide a holistic and inclusive approach to professional development throughout an employee's career.
Workplace Experience – As a leading transportation service company, we recognize that success in the global marketplace relies on the recruitment and retention of top-tier talent, as well as leveraging the expertise and experiences of individuals from all backgrounds.
In pursuit of this goal, we are dedicated to establishing a workplace where a broad spectrum of identities, perspectives, and experiences is not only represented but also valued and empowered to thrive.
GOVERNMENT REGULATION – In addition to environmental, safety, securities, and other regulations generally applicable to all business, our railroads are subject to regulation by the U.S. Surface Transportation Board (STB). The STB has jurisdiction to varying extents over rates, routes, customer access provisions, fuel surcharges, conditions of service, and the extension or abandonment of rail lines. The STB has jurisdiction to determine whether we are “revenue adequate” on an annual basis based on the results of the prior year. A railroad is “revenue adequate” on an annual basis under the applicable law when its return on net investment exceeds the rail industry’s composite cost of capital. This determination is made pursuant to a statutory requirement. The STB also has jurisdiction over the consolidation, merger, or acquisition of control of and by rail common carriers.
The relaxation of economic regulation of railroads, following the Staggers Rail Act of 1980, included exemption from STB regulation of the rates and most service terms for intermodal business (trailer-on-flat-car, container-on-flat-car), rail boxcar shipments, lumber, manufactured steel, automobiles, and certain bulk commodities such as sand, gravel, pulpwood, and wood chips for paper manufacturing. Further, all shipments that we have under contract are effectively removed from commercial regulation for the duration of the contract. Approximately 90% of our revenues comes from either exempt shipments or shipments moving under transportation contracts; the remainder comes from shipments moving under public tariff rates.
Efforts have been made over the past several years to increase federal economic regulation of the rail industry, and such efforts may continue in 2025. The Staggers Rail Act of 1980 substantially balanced the interests of shippers and rail carriers, and encouraged and enabled rail carriers to innovate, invest in their infrastructure, and compete for business, thereby contributing to the economic health of the nation and to the revitalization of the industry. Accordingly, we will continue to oppose efforts to reimpose increased economic regulation.
Railroads are also subject to the enactment of laws by Congress and regulation by the U.S. Department of Transportation (DOT) (including the FRA) and the U.S. Department of Homeland Security (DHS) (including the Transportation Security Administration (TSA)), which regulate most aspects of our operations related to safety, security, and cybersecurity.
Government regulations are further discussed within Item 1A “Risk Factors,” and the safety and security of our railroads are discussed within the “Security of Operations” section contained herein.
COMPETITION – There is continuing strong competition among rail, water, and highway carriers. Price is usually only one factor of importance as shippers and receivers choose a transport mode and specific hauling company. Inventory carrying costs, service reliability, ease of handling, and the desire to avoid loss and damage during transit are also important considerations, especially for higher-valued finished goods, machinery, and consumer products. Even for raw materials, semi-finished goods, and work-in-progress, users are increasingly sensitive to transport arrangements that minimize problems at successive production stages.
Our primary rail competitor is CSX Corporation (CSX); both we and CSX operate throughout much of the same territory. Other railroads also operate in parts of the territory. We also compete with motor carriers, water carriers, and with shippers who have the additional options of handling their own goods in private carriage, sourcing products from different geographic areas, and using substitute products.
Certain marketing strategies to expand reach and shipping options among railroads and between railroads and motor carriers enable railroads to compete more effectively in specific markets.
SECURITY OF OPERATIONS – We continue to enhance the security of our rail system. Our comprehensive security plan is modeled on and was developed in conjunction with the security plan prepared by the Association of American Railroads (AAR) post September 11, 2001. The AAR Security Plan defines four Alert Levels and details the actions and countermeasures that are being applied across the railroad industry as the risk of terrorist, extremist, or seriously disruptive cyber-attack increases or decreases. The Alert Level actions include countermeasures that will be applied in three general areas: (1) operations (including transportation, engineering, and mechanical); (2) information technology and communications; and, (3) railroad police. All of our Operations Division employees are advised by their supervisors or train dispatchers, as appropriate, of any change in Alert Level and any additional responsibilities they may incur due to such change.
Our security plan also complies with DOT security regulations pertaining to training and security plans with respect to the transportation of hazardous materials. As part of the plan, security awareness training is given to all railroad employees who directly affect hazardous material transportation safety and is integrated into hazardous material training programs. Additionally, location-specific security plans are in place for rail corridors in certain metropolitan areas referred to as High Threat Urban Areas (HTUA). Particular attention is aimed at reducing risk in a HTUA by: (1) the establishment of secure storage areas for rail cars carrying toxic-by-inhalation (TIH) materials; (2) the expedited movement of trains transporting rail cars carrying TIH materials; (3) reducing the number of unattended loaded tank cars carrying TIH materials; and (4) cooperation with federal, state, local, and tribal governments to identify those locations where security risks are the highest.
We also operate four facilities that are under U.S. Coast Guard (USCG) Maritime Security Regulations. With respect to these facilities, each facility’s security plan has been approved by the applicable Captain of the Port and remains subject to inspection by the USCG.
Additionally, we continue to engage in close and regular coordination with numerous federal and state agencies, including the DHS, the TSA, the Federal Bureau of Investigation, the FRA, the USCG, U.S. Customs and Border Protection, the Department of Defense, and various state Homeland Security offices.
In 2024, through the Norfolk Southern Operation Awareness and Response Program as well as participation in the Transportation Community Awareness and Emergency Response Program, we provided rail accident response training to more than 5,500 emergency responders, such as local police and fire personnel, utilizing a combination of online training and face-to-face training sessions as well as the Norfolk Southern Safety Train. We also have ongoing programs to sponsor local emergency responders at the Security and Emergency Response Training Center.
We also continually evaluate ourselves for appropriate business continuity and disaster recovery planning, with test scenarios that include cybersecurity attacks. Our risk-based information security program helps ensure our defenses and resources are aligned to address the most likely and most damaging potential attacks, to provide support for our organizational mission and operational objectives, and to keep us in the best position to detect, mitigate, and recover from a wide variety of potential attacks in a timely fashion.
Item 1A. Risk Factors
The risks set forth in the following risk factors could have a material adverse effect on our financial position, results of operations, or liquidity in a particular year or quarter, and could cause those results to differ materially from those expressed or implied in our forward-looking statements. The information set forth in this Item 1A “Risk Factors” should be read in conjunction with the rest of the information included in this annual report, including
Item 7 “Management’s Discussion and Analysis of Financial Condition and Results of Operations” and Item 8 “Financial Statements and Supplementary Data.” We have experienced a number of the risks described below in connection with the Incident and the Incident Proceedings (defined below). The risks described below should be read in conjunction with the information regarding the Incident and Incident Proceedings provided in Note 18 in Item 8 “Notes to Consolidated Financial Statements.”
INCIDENT RISKS
As defined and as further described in Note 18 in Item 8 “Notes to Consolidated Financial Statements,” there was an Incident that occurred in the first quarter of 2023 that consisted of a February 3, 2023 train derailment in East Palestine, Ohio that included 11 non-Company-owned tank cars containing hazardous materials, fires associated with the derailment that threatened certain of the tank cars, and a controlled vent and burn procedure conducted on February 6, 2023 on five of the derailed tank cars, all of which contained vinyl chloride. As a result of the Incident, we became subject to numerous legal, regulatory, legislative, and other proceedings related thereto, including but not limited to, the National Transportation Safety Board (NTSB) Investigation, the FRA Incident Investigation, the FRA Safety Assessment, the U.S. Department of Justice (DOJ) Complaint, the Ohio Complaint, the Incident Lawsuits, the Shareholder Matters, and the Incident Inquiries and Investigations (each as defined in Note 18 in Item 8 “Notes to Consolidated Financial Statements”) in addition to other proceedings, actions, or potential changes in response to the Incident, including but not limited to those related to, among other items, train size, train length, train composition, crew size, or detection systems (collectively, the “Incident Proceedings”). Set forth below are additional risks pertaining to an investment in the Company that are related to the Incident and the Incident Proceedings.
The costs, liabilities, fines, penalties, and/or financial impact resulting from or related to the Incident or the Incident Proceedings have been significant to date, may exceed expected or accrued amounts, and have and can be expected to continue to negatively affect our financial results. We have incurred and will continue to remain subject to incurring significant costs, liabilities, fines, and penalties related to the Incident and the Incident Proceedings, including amounts that may have a material adverse effect on our financial position, results of operations, or liquidity.
While we have accrued estimates of probable and reasonably estimable liabilities with respect to the Incident and the Incident Proceedings, we cannot predict the final outcome or estimate the reasonably possible range of loss with certainty, and such estimates may change over time due to a variety of factors, including but not limited to those set forth in Note 18 in Item 8 “Notes to Consolidated Financial Statements” or other unfavorable or unexpected developments or outcomes which could result in our current estimates being insufficient. These estimated amounts also do not include any estimate of loss for specific items for which we believe a loss is either not probable or not reasonably estimable for the reasons set forth in Note 18 in Item 8 “Notes to Consolidated Financial Statements.” As a result, our currently accrued amounts of estimated liabilities may be insufficient, and any additional, new or updated accruals could have a material adverse effect on our results of operations or financial position.
New or additional governmental regulation and/or operational changes resulting from or related to the Incident or the Incident Proceedings may negatively impact us, our customers, the rail industry, or the markets we serve. The legislative, regulatory, operational, or other actions taken, protocols adopted (including by us), or changes resulting from the Incident or any of the Incident Proceedings may, either individually or in the aggregate, have a material adverse effect on us, our customers, the rail industry, or the markets we serve. We also face risks from requirements that may be imposed by the government in resolution of government actions, including, for example, restrictions on our methods of operations. Our inability to comply with the requirements of any new or additional laws, regulations, or operating protocols resulting from or related to the Incident or the Incident Proceedings may have a material adverse effect on our financial position, results of operations, liquidity, or operations.
REGULATORY AND LEGISLATIVE RISKS
Governmental legislation, regulation, and Executive Orders over commercial, operational, tax, safety, security, or cybersecurity matters could negatively affect us, our customers, the rail industry, or the markets we serve. Congress can enact laws, agencies can promulgate regulations, and Executive Orders can be issued that increase or alter regulation in a way that negatively affects us, our customers, the rail industry, or the markets we serve. Railroads presently are subject to commercial and operational regulation by the STB, which has jurisdiction to varying extents over rates, routes, customer access provisions, fuel surcharges, conditions of service, and the extension or abandonment of rail lines.
The STB also has jurisdiction over the consolidation, merger, or acquisition of control of and by rail common carriers. Additional or updated regulation of the rail industry by Congress or the STB, whether under new, existing or amended laws or regulations, could have a significant negative impact on our ability to negotiate prices for rail services, on our railway operating revenues, and on the efficiency, conduct, or complexity of our operations. Such additional or updated industry regulation, as well as enactment of any new or updated tax laws, could also negatively impact cash flows from our operating activities and, therefore, result in reduced capital spending on our rail network or abandonment of lines.
Railroads are also subject to the enactment of laws by Congress and regulation by the DOT (including the FRA) and the DHS (including the TSA), which regulate many aspects of our operations related to safety, security, and cybersecurity. Additional or updated safety, security, or cybersecurity regulation by Congress, the DOT, or DHS could have a negative impact on our business and the efficiency, conduct, or complexity of our operations including (but not limited to) increased operating costs, capital expenditures, claims, and litigation.
Our inability to comply with, or operational practices and costs necessary to adhere to, the requirements of existing or updated laws, regulations, or Executive Orders that govern our operations or the rail industry, including but not limited to those pertaining to commercial, operational, tax, safety, security, or cybersecurity matters, as such requirements may be interpreted or enforced from time to time (such as in connection with a pending regulatory or other legal proceedings or lawsuits), could have a material adverse effect on our financial position, results of operations, or liquidity.
We are addressing multiple governmental actions as a result of the Incident, as noted in “Incident Risks” above.
Federal and state environmental laws and regulations could negatively impact us and our operations. Our operations are subject to extensive federal, state and local environmental laws and regulations concerning, among other things: emissions to the air; discharges to waterways or groundwater supplies; handling, storage, transportation, use, and disposal of waste and other materials; and, the cleanup of hazardous material or petroleum releases. The risk of incurring environmental liability, for acts and omissions, past, present, and future, is inherent in the railroad business. This risk includes property owned by us, whether currently or in the past, that is or has been subject to a variety of uses, including our railroad operations and other industrial activity by past owners or our past and present tenants.
Environmental problems that are latent or undisclosed may exist on these properties, and we could incur environmental liabilities or costs, the amount and materiality of which cannot be estimated reliably at this time, with respect to one or more of these properties. Moreover, lawsuits and claims involving other unidentified environmental sites and matters are likely to arise from time to time.
Our inability to comply with the extensive federal, state and local environmental laws and regulations to which we are subject could result in significant liabilities, fines, or sanctions, including those related to the investigation or remediation of known and unknown environmental contamination, or otherwise adversely impact our operations.
As noted in “Incident Risks” above, in connection with the Incident, we are experiencing negative impacts related to environmental matters, including extensive cleanup costs and litigation related to alleged environmental impacts of the Incident.
U.S. international trade relationships may adversely impact our customers, our industry, and our business. We transport a significant number of shipments that have either been imported into the U.S. or are destined for export from the U.S. Trade discussions and arrangements between the U.S. and various of its trading partners are fluid, and existing and future trade agreements are, and are expected to continue to be, subject to a number of uncertainties, including the imposition of new tariffs or adjustments and changes to the products covered by existing tariffs. Any decision by the U.S. government to adopt actions such as border taxes on imports, an increase in customs duties or tariffs, or the renegotiation of U.S. trade agreements, or any other action that could have a negative impact on international trade, including corresponding actions taken by other countries in response to U.S. governmental actions, could cause a reduction in the volume of shipments by many of our customers. Any changes in tax and trade policies in the U.S. and corresponding actions by other countries could adversely impact our financial performance.
In addition, compliance with any new laws, regulations, or policies with regard to any of the foregoing may increase our operating costs or require significant capital expenditures. Any failure to comply with applicable laws, regulations or policies in the U.S. or other countries could result in substantial fines or possible revocation of our authority to conduct our operations, which could materially adversely affect us.
OPERATIONAL RISKS
A significant adverse event on our network may significantly impede our ability to operate and serve our customers. The nature of our operations inherently comes with the risk that one or more significant adverse events or outages may occur on or impact our network resulting in our inability or restricted ability to provide rail transportation services to our customers. These events include but are not limited to, a mainline accident, a hazardous material discharge, a climate-related network outage, or a technology-related network outage. Any one or more of these incidents could expose us to significant operational and managerial challenges, as well as reputational damage, requiring a significant amount of time and focus of our Board and management team, as well as significant lost revenues, expenses, liabilities, fines, and penalties, including amounts that may have a material adverse effect on our financial position, results of operations, or liquidity. One or more of these events may also result in subsequent legislative, regulatory, operational or other responsive actions taken, changes or protocols adopted (including by us), or requirements imposed that may, either individually or in the aggregate, have a material adverse effect on our financial position, results of operations, liquidity, or operations, or on our customers, the rail industry, or the markets we serve.
If we are unable to successfully execute on our strategic initiatives, our business and future results of operations may suffer. Our growth strategy includes increasing the volume of shipments moving through our railway networks. We are reliant on the success of our strategic plans and initiatives to execute on this growth strategy, as well as to help offset increasing costs. These strategic plans include marketing, service, growth, and productivity initiatives. The timely and effective execution of our strategies are dependent upon, among other factors, (i) our ability to maintain satisfactory relations with our customers, employees, and other key stakeholders, (ii) our ability to effectively control costs, (iii) the progress and success of our safety programs and inspection technologies, and (iv) our ability to timely and effectively maintain and upgrade technology systems and other infrastructure for our railway networks. Our failure to successfully execute on our strategic initiatives may expose us to a number of risks, including, that our projected volume growth may differ from actual results, and prior capital investments based on our projections may contribute to excess capacity that could negatively impact our profitability.
As a common carrier by rail, we must offer to transport hazardous materials, which exposes us to significant costs and claims. Transportation of certain hazardous materials or third party-owned equipment (typically used to transport such materials) creates risks of significant losses in terms of personal injury and property (including environmental) damage and compromises critical parts of our rail network. The costs of a catastrophic rail accident involving hazardous materials or third party-owned equipment could exceed our insurance coverage. We have obtained insurance for potential losses for third-party liability and first-party property damages (see Note 18 in Item 8 “Notes to Consolidated Financial Statements”); however, insurance is available from a limited number of insurers and may not continue to be available or, if available, may not be obtainable on terms acceptable to us. Any future legislation preventing the transportation of hazardous materials through specific cities could have negative impacts including increased network congestion and operating costs, reduced operating efficiency, and increased risk of an accident involving hazardous materials.
With regard to the risks arising from the transportation of hazardous materials, the Incident and the Incident Proceedings have given rise to significant costs to us and impacts on our rail network, as noted in “Incident Risks” above. With respect to third party-owned equipment, the primary risk arises from the potential for a latent defect we are unable to identify despite robust safety inspection protocols.
We face competition from other transportation providers. We are subject to competition from motor carriers, railroads and, to a lesser extent, ships, barges, and pipelines, on the basis of transit time, pricing, and quality and reliability of service. While we have primarily used internal resources to build or acquire and maintain our rail system, trucks and barges have been able to use public rights-of-way maintained by public entities. Any future improvements, expenditures, legislation, or regulation changing or materially increasing the efficiency or reducing the cost of one or more alternative modes of transportation in the regions in which we operate (such as granting materially greater latitude for motor carriers with respect to size or weight limitations or adoption and utilization of
autonomous commercial vehicles) could have a material adverse effect on our ability to compete with other modes of transportation. In addition, our industry continues to evolve, including customer demands for faster transit times and increased visibility, and the potential for increased competition (due to growth in the market, competitors with improved financial capacity or technology, or business combinations resulting in one or more competitors providing a wider variety of services and products at competitive prices) which may, either individually or in the aggregate, have a material adverse effect on our business or results of operations.
Capacity constraints could negatively impact our service and operating efficiency. We have experienced and may again experience capacity constraints on our rail network related to employee or equipment shortages, increased demand for rail services, severe weather, congestion on other railroads, including passenger activities, or impacts from changes to our network structure or composition. Such constraints could result in operational inefficiencies or adversely affect our operations.
Significant increases in demand for rail services could result in the unavailability of qualified personnel and resources like locomotives. Changes in workforce demographics, training requirements, and availability of qualified personnel, particularly for engineers and conductors, have negatively impacted and may again negatively impact our ability to meet short-term demand for rail service. Unpredicted increases in demand for rail services may exacerbate such risks and could negatively impact our operational efficiency.
Constraints on the supply chain or the operations of carriers with which we interchange may adversely affect our operations. Our ability to provide rail service to our customers depends in large part upon a functioning global supply chain and our ability to maintain collaborative relationships with connecting carriers (including shortlines and regional railroads) with respect to, among other matters, freight rates, revenue division, car supply and locomotive availability, data exchange and communications, reciprocal switching, interchange, and trackage rights. Deterioration in the supply chain or service provided by connecting carriers, or in our relationship with those connecting carriers, could result in our inability to meet our customers’ demands or require us to use alternate train routes, which could result in significant additional costs and network inefficiencies. Additionally, any significant consolidations, mergers, or operational changes among other railroads may alter our market access and reach.
We may be negatively affected by terrorism or war. Any terrorist attack, or other similar event, any government response thereto, and war or risk of war could cause significant business interruption or other operational challenges. Because we play a critical role in the nation’s transportation system, we could become the target of such an attack or have a significant role in the government’s preemptive approach or response to an attack or war.
Although we currently maintain insurance coverage for third-party liability arising out of war and acts of terrorism, we maintain only limited insurance coverage for first-party property damage and damage to property in our care, custody, or control caused by certain acts of terrorism. In addition, premiums for some or all of our current insurance programs covering these losses could increase dramatically, or insurance coverage for certain losses could be unavailable to us in the future.
We may be negatively affected by supply constraints resulting from disruptions in our fuel markets or supplier markets. We consumed approximately 373 million gallons of diesel fuel in 2024. Fuel availability could be affected by limitation in the fuel supply or by imposition of mandatory allocation or rationing regulations. A severe fuel supply shortage arising from production curtailments, increased demand in existing or emerging foreign markets, disruption of oil imports, disruption of domestic refinery production, damage to refinery or pipeline infrastructure, political unrest, war, or other factors could impact us as well as our customers and other transportation companies.
Due to the capital-intensive nature, as well as the industry-specific requirements of the rail industry, high barriers of entry exist for potential new suppliers of core railroad items, such as locomotives and rolling stock equipment. As a result, we are dependent on certain key suppliers and manufacturers of locomotive and railroad items. Disruption to one or more of our key suppliers or manufacturers, including as a result of stopped or restricted production, labor stoppage or restriction, or significant supply shortage or outage could negatively impact our operating efficiency
and increase costs. Additionally, we compete with other industries for available capacity and raw materials used in the production of locomotives and certain track and rolling stock materials. Changes in the competitive landscapes of these limited supplier markets could also result in significantly increased prices or material shortages.
We may be negatively affected by energy prices. Fuel and energy costs have a significant impact on our operations. Volatility in energy prices could have a significant effect on a variety of items including, but not limited to: the economy; demand for transportation services; business related to the energy sector, including crude oil, natural gas, and coal; fuel prices; and, fuel surcharges, each of which could have a material impact on our business and results of operations. In addition, we may also experience a disruption in energy supplies as a result of new or increased regulation, as a result of war or geopolitical conflicts, weather-related events or natural disasters, or other factors beyond our control, which could have a material adverse effect on our business.
Pandemics, epidemics, or endemic diseases could further negatively impact us, our customers, our supply chain, and our operations. The magnitude and duration of a pandemic, epidemic, or endemic disease, and its impact on our customers and general economic conditions can influence the demand for our services and affect our revenues. In addition, such outbreaks could affect our operations and business continuity if a significant number of our essential employees, overall or in a key location, are unable to work from contraction of or exposure to the disease or if governmental orders prevent our employees or critical suppliers from working. To the extent such diseases adversely affect our business and financial results, they may also have the effect of heightening many of the other risks described in the risk factors included herein or may affect our operating and financial results in a manner that is not presently known to us.
Our business is capital intensive, and we must make capital decisions based upon expectations of future usage of our assets. We make significant investments in our railroad infrastructure, including railroad property, track infrastructure, locomotives, freight cars, intermodal equipment, technology, and other assets to support our network, much of which is costly and requires significant capital outlay. The amount and timing of capital investments depend on various factors, including expectations of future carload traffic. In many cases, we must make advance commitments to purchase or modify equipment prior to such equipment being needed. As a result, we must predict volume levels and other requirements and make commitments based on those projections. A significant variance in our expectations or projections could result in too much or too little equipment relative to our actual needs and volumes, thereby negatively impacting our operations or financial results.
TECHNOLOGY RISKS
A significant cybersecurity incident or other disruption to our technology infrastructure resulting from internal and external threats could disrupt our business operations. To conduct business, we extensively rely on information and operational technology systems. The threat landscape is vast, with potential attacks from cybercriminals, nation-states, state-sponsored actors and others including, but not limited to, service denials, unauthorized access, compromised equipment or rolling stock, extortion, or theft of data or money. As a result, our business continuity and disaster recovery plans and activities may not be sufficient for all eventualities, resulting in the potential for a data breach or significant service or operational disruption or failure involving one or more information or operational technology systems operated by us or under control of third parties, including computer hardware, software, cloud services and transportation and communications equipment. Such failures or disruptions can adversely impact our business by, among other things, preventing intercompany communications and disrupting operations that may result in direct or indirect monetary losses, damage to equipment or property, or loss of confidence in corporate competency. Any one or more of these events could have a material adverse effect on our results of operations, financial position, or operations. Although we maintain security programs designed to protect our information and operational technology systems, we are continually targeted by threat actors attempting to access our networks and we may be unable to detect or prevent a breach of our systems or disruption to our service in the future. In addition, while we have previously experienced technology outages and cybersecurity events that have impacted our systems and service, future events may result in more significant impacts to our operations, reputation or financial results. These potentially impactful future events could include service disruptions, unauthorized access to our systems, viruses, ransomware, and/or the compromise, acquisition, or destruction of our
data. We also could be impacted by cybersecurity events targeting third parties that we rely on for business operations, including third party vendors that have access to our systems or data and third parties who provide services and are in our supply chain. Such a direct or indirect cybersecurity incident could interrupt our service, cause safety failures or operational difficulties, decrease revenues, increase operating costs, impact our efficiency, damage our corporate reputation, and/or expose us to litigation or government action or increased regulation, which could result in penalties, fines or judgments. In addition, our failure to comply with or adhere to privacy-related or data protection laws and regulations could result in government investigations and proceedings against us, or litigation, resulting in adverse reputational impacts, penalties, and legal liability.
Our business may be seriously harmed if we fail to develop, implement, maintain, upgrade, enhance, protect and integrate our information or operational technology systems. If we fail to develop, acquire or implement new technology, or otherwise fail to maintain, protect or integrate our information or operational technology systems, we may suffer a competitive disadvantage within the rail industry and with companies providing alternative modes of transportation service. The techniques used by cybersecurity threat actors to obtain unauthorized access, disable or degrade service or sabotage systems change frequently, as data breaches and other cybersecurity events have become increasingly commonplace. Consequently, these techniques may be difficult to detect and cybersecurity events are therefore increasingly difficult to prevent. The rapid evolution and increased adoption of emerging technologies, such as artificial intelligence and machine learning, may make it more difficult to anticipate cybersecurity threats and implement adequate protective countermeasures. If we fail to adequately develop or maintain our information or operational technology systems or cybersecurity infrastructure, we may become increasingly vulnerable to cybersecurity events, or other breaches or disruptions to our information or operational technology systems.
LITIGATION RISKS
We may be subject to various claims and lawsuits that could result in significant expenditures. The nature of our business exposes us to the potential for various claims and litigation related to labor and employment, personal injury, commercial disputes, freight loss and other property damage, and other matters. Job-related personal injury and occupational claims are subject to the Federal Employer’s Liability Act (FELA), which is applicable only to railroads. FELA’s fault-based tort system produces results that are unpredictable and inconsistent as compared with a no-fault worker’s compensation system. The variability inherent in this system could result in actual costs being different from the liability recorded.
A catastrophic rail accident, whether on our lines or another carrier’s, involving any or all of release of hazardous materials, freight loss, property damage, personal injury, and environmental liability could compromise critical parts of our rail network. Losses associated with such an accident involving us could exceed our insurance coverage, resulting in a material adverse effect on our financial position or liquidity. Any material changes to current litigation trends could also have a material adverse effect on our financial position or liquidity to the extent not covered by insurance.
We have obtained insurance for potential losses for third-party liability and first-party property damages; however, insurance is available from a limited number of insurers and may not continue to be available or, if available, may not be obtainable on terms acceptable to us.
We are incurring significant expenditures as a result of claims and lawsuits arising from the Incident and the related Incident Proceedings, as described in “Incident Risks” above.
HUMAN CAPITAL RISKS
Failure to attract, retain, and transition key executive officers, or skilled professional or technical employees could adversely impact our business and operations. Our success depends on our ability to attract and retain skilled employees, including key executive officers to oversee our operational, productivity, marketing, and technological initiatives, as well as a sufficient number of skilled professional and craft employees to enable us to
efficiently conduct our operations. Difficulties in recruiting and retaining skilled employees, including train and engine workers, key executives, and other skilled professional and technical employees; the loss of such individuals; and/or our inability to successfully transition key executive, professional, technical, or skilled roles could each have a material adverse effect on our financial position, results of operations, and operations. The loss of one or more key employees could also result in the depletion of our institutional knowledge base and may result in our inability or increased difficulty in successfully transitioning key roles, which could materially adversely impact our business.
The vast majority of our employees belong to labor unions, and the renegotiation of labor agreements or any provisions thereof, or any strikes or work stoppages (including any entered into in connection with any such negotiations), could adversely affect our operations. Approximately 80% of our railroad employees are covered by collective bargaining agreements with various labor unions. In the third and fourth quarters of 2024, the Company reached tentative collective bargaining agreements with ten of these labor unions, a majority of which were subsequently ratified by union membership and became effective January 1, 2025. Future national labor agreements, or renegotiation of labor agreements or provisions of labor agreements, could significantly increase our costs for health care, wages, and other benefits. In addition, if our craft employees were to engage in or threaten a strike, work stoppage, or other slowdown, including in connection with the renegotiation of any collective bargaining agreements or any provisions thereof, we could experience a significant disruption in our operations, customer base, or belief in our ability to provide consistent service, thereby adversely affecting our operations or ability to provide services.
CLIMATE CHANGE RISKS
Severe weather and disasters have caused, and could again cause, significant business interruptions and expenditures. Severe weather conditions and other natural phenomena resulting from changing weather patterns and rising sea levels or other causes, including hurricanes, floods, fires, landslides, extreme temperatures, significant precipitation, and earthquakes, have caused, and may again cause damage to our network, our workforce to be unavailable, and us to be unable to use our equipment, or otherwise cause significant interruptions to our operations. Additionally, shifts in weather patterns caused by climate change are expected to increase the frequency, severity, or duration of certain adverse weather conditions, which could cause more significant business interruptions that result in increased costs, increased liabilities, and decreased revenues. Our inability to quickly and effectively restore operations following adverse weather and disasters could materially impact our business and results of operations. To the extent such weather events or natural disasters become more frequent or severe, disruptions to our business and those of our customers and costs to repair damaged property and equipment or maintain or resume operations could increase. Furthermore, climate change may contribute to an increase in the incidence and severity of natural disasters and adverse weather conditions and reduce the availability or increase the cost of insurance for such events.
Concern over climate change has led to significant federal, state, and international legislative and regulatory efforts to limit greenhouse gas (GHG) emissions. Restrictions, caps, taxes, or other legislative or regulatory controls on GHG emissions, including diesel exhaust, could significantly increase our operating costs and decrease the amount of traffic we handle.
In addition, legislation and regulation related to climate change or GHG emissions could negatively affect the markets we serve and our customers. Even without legislation or regulation, government incentives and adverse publicity relating to climate change or GHG emissions could negatively affect the markets for certain of the commodities we carry, or our customers that use commodities we carry to produce energy (including coal), use significant amounts of energy in producing or delivering the commodities we carry, or manufacture or produce goods that consume significant amounts of energy associated with GHG emissions.
MACROECONOMIC AND MARKET RISKS
We may be negatively impacted by changes in general economic conditions. Because our business is dependent on the rail shipping needs of our customers, negative changes in domestic and global economic conditions,
including reduced import and export volumes, could affect the producers and consumers of the freight we carry. Recessionary economic cycles and downturns in customers’ business cycles, especially in market segments and industries where we have a significant concentration of customers, may substantially reduce our volumes, and lead to excess capacity in the industry, resulting in pressure on rates we are able to obtain for our services. Economic conditions could also result in bankruptcies of one or more of our customers. Changes in general economic conditions are beyond our control, and it may be difficult for us to adjust our business model. We are impacted by industrial production, inflation, unemployment, and consumer spending. We have been and may in the future be, materially impacted by adverse developments in these aspects of the economy.
The state of capital markets could adversely affect our liquidity. We rely on the capital markets to provide some of our capital requirements, including the issuance of debt instruments and the sale of certain receivables. Significant instability or disruptions of the capital markets, including the credit markets, or deterioration of our financial position due to internal or external factors could restrict or eliminate our access to, and/or significantly increase the cost of, various financing sources, including bank credit facilities and issuance of corporate bonds. Instability or disruptions of the capital markets and deterioration of our financial position, alone or in combination, could also result in a reduction of our credit rating to below investment grade, which could prohibit or restrict us from accessing external sources of short- and long-term debt financing and/or significantly increase the associated costs.
Item 1B. Unresolved Staff Comments
None.
Item 1C. Cybersecurity
CYBERSECURITY RISK MANAGEMENT AND STRATEGY
Process
We use a multi-layered defensive cybersecurity strategy based on the cyber security framework drafted by the U.S. Department of Commerce's National Institute of Standards and Technology (NIST). The NIST Cybersecurity Framework (NIST CSF) is a voluntary framework of best practices to identify, protect, detect, respond to, and recover from cybersecurity matters. Based on the NIST CSF, our processes to identify, assess, and manage material risks from cybersecurity threats includes the following:
Identify
We identify risks from cybersecurity threats by first developing and maintaining an understanding of those assets essential to our operation and reputation, as well as assets that could provide value to threat actors. Any cyber act is considered a potential risk if a threat actor can use it to reduce the value of an asset, reduce our ability to utilize or otherwise access the value of an asset, or surreptitiously gain or increase their access to an asset or its value.
Assess
We assess risks from cybersecurity threats by evaluating exposure of our assets to identified cyber risks, as well as potential impacts to our operations or reputation from our inability to access or utilize an asset or realize its value, or a threat actor’s ability to gain access to an asset or its value. We further evaluate the potential materiality of these risks based on the potential impact to our operations or reputation.
Manage
We mitigate risks from cybersecurity threats by applying multiple layers of defense to ensure we have the continued ability to access or utilize an asset or its value, and deny threat actors the ability to gain or increase their access to an asset or its value. We prioritize defensive mechanisms, including administrative, procedural, and technical controls, according to their relative cost and reduction in risk based on the NIST CSF.
We further monitor, test, assess, and update these processes, including working with government agencies and peers to implement practices to guard against an evolving threat environment and to ensure we remain compliant with relevant regulatory requirements.
Integration into our Risk Management Framework
Our processes to assess, identify, and manage cybersecurity risks are expressly incorporated into our enterprise risk management (ERM) framework. Technology is one of the five primary risk categories addressed by the ERM framework, and cybersecurity is identified as a subcategory of the technology risk. Our ERM leadership team works with the Chief Information and Digital Officer (CIDO), the Senior Director of Information Security (SDIS) and other technology leaders to identify, define, and assess top areas of technology and cybersecurity risks, which are included in our ERM risk framework and mapped to the NIST CSF. Our internal ERM leadership meets regularly with our technology leadership team to review developments in our technology risk profile and works with the cybersecurity team to monitor key risk indicators linked to our cybersecurity risks. Any changes to the threat landscape are discussed and considered as adjustments to our risk profile.
Third-Party Engagement
We employ multiple service providers from time to time to perform periodic reviews and evaluations of our cybersecurity framework, the results of which are provided to and reviewed with management, with appropriate reporting to the Finance and Risk Management Committee (F&RM Committee) of the Board. These reviews encompass a broad range of areas, including information technology system resilience, cybersecurity risk assessments, information security program assessments, external threat environment reviews, internal cybersecurity policy compliance, and near-term incident response to identify or disconfirm potential involvement of a threat actor.
Oversight of Third-Party Providers
Within our purchasing and third-party vendor management programs, we require all vendors who handle our data as well as vendors who provide technology and data services – including hardware, software, staffing, and support – to maintain certain security protections including, but not limited to, compliance with applicable data protection laws and implementation of administrative, physical, and technical safeguards to protect our data, including how our data is stored, accessed, and transmitted. In addition, all providers within these service categories must execute a data security addendum that articulates specific security standards, cybersecurity insurance, and mandatory incident reporting protocols applicable to the underlying provision of services.
Risks
Please see Item 1A. Risk Factors – Technology Risks – “A significant cybersecurity incident or other disruption to our technology infrastructure resulting from internal and external threats could disrupt our business operations” for our disclosures regarding the most pertinent risks we may experience from cybersecurity threats.
As noted therein, regardless of the cause, a significant disruption or failure of one or more information or operational technology systems operated by us or under control of third parties can result in service disruptions, unauthorized access to our systems, viruses, ransomware, and/or compromise, acquisition, or destruction of our data.
Such a direct or indirect cybersecurity incident could interrupt our service, cause safety failures or operational difficulties, decrease revenues, increase operating costs, impact our efficiency, damage our corporate reputation, and/or expose us to litigation, government action, increased regulation, penalties, fines or judgments, any or all which may ultimately have a materially adverse effect on our results of operations, financial condition, reputation, and business (including our strategy of operating a resilient freight railroad).
While we have previously experienced technology outages and cybersecurity events that have impacted our systems and service, future events may result in more significant impacts to our operations, reputation, or financial results. As a result of these prior events, and given the potential risks that a technology outage or cybersecurity event would result in a materially adverse effect on our results of operations, financial condition, reputation, or business, we have conducted and will continue conducting, internal and third-party assessments of information technology and cybersecurity vulnerabilities, information technology resiliency, and our related processes and procedures, so that we can continue to identify and address key cybersecurity risks.
CYBERSECURITY GOVERNANCE
Board Oversight
The Norfolk Southern Board, both directly itself and indirectly through the F&RM Committee, has oversight of cybersecurity risks. The F&RM Committee receives periodic reports from the CIDO regarding the primary technology risks impacting the company, including risks impacting our information and operational systems, service resiliency, cybersecurity risks, and the related threat environment. Agendas for these periodic updates may be further adjusted to address any emerging risks or key topics in greater detail, including emerging regulations, best practices, cyber readiness, and third-party assessment results. Regular updates are also provided to the F&RM Committee regarding all material or potentially material cybersecurity incidents, including root causes, and identification of and progress towards, remediation activities through completion.
The Board receives a periodic update from the Chair of the F&RM Committee regarding the matters addressed by the F&RM Committee, as well as an annual report from the CIDO highlighting the emerging threat landscape, our progress executing on our defensive cybersecurity strategy, and a review of our cybersecurity incident investigation and response processes.
Management's Role
Our SDIS, reporting to the CIDO, is directly responsible for the assessment, oversight, and management of our enterprise-wide cybersecurity strategy and governance. Such individual has significant relevant experience in the area, including over 27 years of technology experience in various industries with 17 years focused on information security, as well as significant experience working closely with government agencies including the Federal Bureau of Investigation, the Transportation Security Agency, and the Department of Homeland Security. As noted above, our technology risk working group, comprised of leaders across the information technology, information security, and law departments, including our CIDO, SDIS, and Data Privacy Officer (DPO), among others, further monitor developments in the threat landscape so that key cybersecurity threats impacting the Company continue to be identified and prioritized.
Management and Board Reporting
Cybersecurity incidents are reported directly to the SDIS in accordance with the applicable incident response plan. The SDIS, together with the DPO, determine incident severity and response, and in turn report material or potentially material incidents to our internal 8-K subcommittee (comprised of senior leaders from the law, accounting, finance, investor relations, and communications departments), our CEO, and our Chief Legal Officer, who in turn notify the Chairs of the Board and the F&RM Committee. The Board is promptly notified prior to filing any 8-K disclosing any material or potentially material cybersecurity incidents, with the F&RM Committee provided further updates regarding root causes and remediation efforts.
We also have a cybersecurity incident response plan including specific responsive protocols administered by a predesignated incident response team, led by the SDIS and DPO and comprised of other members of management. This incident response team also conducts periodic table-top exercises with management to ensure adherence to our cybersecurity incident response plan.
In an effort to deter and detect cyber threats, we also periodically provide all employees with a data protection and cybersecurity awareness training program, which covers timely and relevant topics, including phishing, password protection, confidential data protection, asset use, and mobile security and further educates employees on the importance of and process for reporting all potential incidents immediately. We also use technology-based tools to mitigate cybersecurity risks and to bolster employee-based cybersecurity programs.
Item 3. Legal Proceedings
For information on our legal proceedings, see Note 18 “Commitments and Contingencies” in Item 8 “Notes to Consolidated Financial Statements.”
Item 4. Mine Safety Disclosures
Not applicable.
Information About Our Executive Officers
Our executive officers generally are elected and designated annually by the Board at its first meeting held after the annual meeting of stockholders, and they hold office until their successors are elected. Executive officers also may be elected and designated throughout the year as the Board considers appropriate. There are no family relationships among our officers, nor any arrangement or understanding between any officer and any other person pursuant to which the officer was selected. The following table sets forth certain information, at February 1, 2025, relating to our officers.
| | | | | |
| Name, Age, Present Position | Business Experience During Past Five Years |
| | |
Mark R. George, 57, President and Chief Executive Officer | Present position since September 11, 2024. Served as Executive Vice President and Chief Financial Officer from November 1, 2019 to September 11, 2024. |
| |
Ann A. Adams, 54,
Chief Human Resources Officer | Present position since December 9, 2024. Served as Special Advisor to CEO from March 17, 2024 to December 9, 2024, and as Executive Vice President & Chief Transformation Officer from April 1, 2019 to March 16, 2024. |
| | |
Anil Bhatt, 50,
Executive Vice President and
Chief Information and Digital Officer | Present position since August 19, 2024. Prior to joining Norfolk Southern, served in various positions at Elevance Health. Served as Global Chief Information Officer from December 2020 through August 2024 and Senior Vice President & Chief Technology Officer from August 2018 to December 2020. |
| |
John F. Orr, 61, Executive Vice President and Chief Operating Officer | Present position since March 20, 2024. Prior to joining Norfolk Southern, served as Executive Vice President, Chief Transformation Officer for Canadian Pacific Kansas City (CPKC) from April 2023 to March 2024 and Executive Vice President of Operations at Kansas City Southern from April 2021 to April 2023. Served more than three decades at Canadian National in various positions of increasing responsibility across Canada and North America, concluding career as Senior Vice President and Chief Transportation Officer. |
| |
Claude E. Elkins, Jr., 59, Executive Vice President and Chief Marketing Officer | Present position since December 1, 2021. Served as Vice President Industrial Products from April 1, 2018 to December 1, 2021. |
| |
Jason A. Zampi, 50, Executive Vice President and Chief Financial Officer | Present position since September 24, 2024. Served as Senior Vice President Finance and Treasurer from August 20, 2024 to September 24, 2024. Served as Vice President of Financial Planning and Analysis from June 1, 2020 to September 24, 2024. Served as Vice President and Controller from December 16, 2018 to June 1, 2020. |
| | |
Claiborne L. Moore, 45, Vice President and Controller | Present position since March 1, 2022. Served as Assistant Vice President Corporate Accounting from March 15, 2019 to March 1, 2022. |
PART II
NORFOLK SOUTHERN CORPORATION AND SUBSIDIARIES
Item 5. Market for Registrant’s Common Equity, Related Stockholder Matters and Issuer Purchases of Equity Securities
STOCK INFORMATION
Common Stock is owned by 18,025 stockholders of record as of December 31, 2024, and is traded on the New York Stock Exchange under the symbol “NSC.”
ISSUER PURCHASES OF EQUITY SECURITIES
| | | | | | | | | | | | | | | | | | | | | | | | | | |
| Period | | Total Number of Shares (or Units) Purchased(1) | | Average
Price Paid
per Share
(or Unit) | | Total Number of Shares (or Units) Purchased as Part of Publicly Announced Plans or Programs(2) | | Approximate Dollar Value of Shares that may yet be Purchased under Publicly Announced Plans or Programs(2) |
| | | | | | | | |
| October 1-31, 2024 | | — | | | $ | — | | | — | | | $ | 6,868,152,575 | |
| November 1-30, 2024 | | 143 | | | 275.52 | | | — | | | 6,868,152,575 | |
| December 1-31, 2024 | | 335 | | | 233.35 | | | — | | | 6,868,152,575 | |
| | | | | | | | |
| Total | | 478 | | | | | — | | | |
(1)Of this amount, 478 represent shares tendered by employees in connection with the exercise of stock options under the stockholder-approved Long-Term Incentive Plan (LTIP).
(2)On March 29, 2022, our Board of Directors authorized a new program for the repurchase of up to $10.0 billion of Common Stock beginning April 1, 2022. As of December 31, 2024, $6.9 billion remains authorized for repurchase, until such amount is exhausted.
Item 6. [Reserved]
Item 7. Management’s Discussion and Analysis of Financial Condition and Results of Operations
The following discussion and analysis should be read in conjunction with the Consolidated Financial Statements and Notes. Refer to Item 8 “Notes to Consolidated Financial Statements” for all “Note” references.
OVERVIEW
Since 1827, Norfolk Southern Corporation and its predecessor companies have safely moved the goods and materials that drive the U.S. economy. Our dedicated team members deliver a wide variety of commodities annually for our customers, from agriculture products to consumer goods, and help them reduce carbon emissions by shipping via rail. We have the most extensive intermodal network in the eastern U.S. Our network serves a majority of the country's population and manufacturing base, with connections to every major container port on the Atlantic coast as well as major ports in the Gulf of Mexico and Great Lakes.
In 2024, we executed on various initiatives to operate our network more safely and efficiently, better serve our customers, and increase productivity in order to deliver improved financial performance. We enhanced our executive leadership team and continued to execute on our strategy of providing high-quality service to our customers to enable smart, sustainable growth and delivering on productivity initiatives. Additionally, we executed on several strategic initiatives, including the purchase of the Cincinnati Southern Railway, sales of certain railway lines, and completion of targeted rationalization and restructuring efforts, to further advance our organizational objectives. Furthermore, we continued our efforts related to the Eastern Ohio Incident (as defined and further described in Note 18 in the Notes to the Consolidated Financial Statements), including the pursuit of recoveries under our insurance programs.
Our operational improvements during the year, while handling 5% higher volumes, helped drive improvements to income from railway operations, diluted earnings per share, and railway operating ratio (a measure of the amount of operating revenues consumed by operating expenses). For the full year, we achieved an operating ratio of 66.4%, and an adjusted operating ratio of 65.8% (see our non-GAAP reconciliations beginning on page K26), both of which improved on a year-over-year basis. We remain committed to being a safe, productive, resilient, and efficient railroad with industry-competitive margins.
SUMMARIZED RESULTS OF OPERATIONS
| | | | | | | | | | | | | | | | | | | | | | | | | | | | | | | | |
| | | | | | | 2024 | | 2023 | |
| 2024 | | 2023 | | 2022 | | vs. 2023 | | vs. 2022 | |
| | ($ in millions, except per share amounts) | | (% change) | |
| | | | | | | | | | |
| Railway operating revenues | $ | 12,123 | | | $ | 12,156 | | | $ | 12,745 | | | — | % | | (5 | %) | |
| Railway operating expenses | $ | 8,052 | | | $ | 9,305 | | | $ | 7,936 | | | (13 | %) | | 17 | % | |
| Income from railway operations | $ | 4,071 | | | $ | 2,851 | | | $ | 4,809 | | | 43 | % | | (41 | %) | |
| Net income | $ | 2,622 | | | $ | 1,827 | | | $ | 3,270 | | | 44 | % | | (44 | %) | |
| Diluted earnings per share | $ | 11.57 | | | $ | 8.02 | | | $ | 13.88 | | | 44 | % | | (42 | %) | |
| Railway operating ratio (percent) | 66.4 | | | 76.5 | | | 62.3 | | | (13 | %) | | 23 | % | |
Income from railway operations, net income and diluted earnings per share increased in 2024 compared to 2023, primarily as a result of lower railway operating expenses. The reduction in our operating expenses includes lower net expenses related to the Eastern Ohio Incident and $433 million of gains on the sale of railway lines. Railway operating revenues were slightly lower as decreased fuel surcharge revenue, an adverse mix of traffic, and decreased pricing were nearly offset by increased volumes. Our railway operating ratio improved to 66.4 percent.
Income from railway operations, net income and diluted earnings per share declined in 2023 compared to 2022, driven by expenses incurred with our response efforts to the Incident, lower railway operating revenues, and higher
non-Incident-related railway operating expenses. Railway operating revenues declined 5% due to lower average revenue per unit, the result of lower fuel surcharge revenue and decreased intermodal storage service revenues partially offset by favorable pricing and mix. Additionally, lower volumes contributed to the decline in revenues. Net expenses associated with the Incident for the year 2023 were $1.1 billion. In addition to costs resulting from the Incident, railway operating expenses increased due to inflationary pressures, investments in operational resiliency, and higher service-related costs, offset partially by lower fuel prices. The decline in net income and diluted earnings per share also reflects the absence of a prior year $136 million deferred tax benefit, a result of an enactment of a change in the corporate income tax rate in the Commonwealth of Pennsylvania in 2022. Railway operating ratio deteriorated to 76.5 percent.
The following tables adjust our 2024 and 2023 U.S. Generally Accepted Accounting Principles (GAAP) financial results to exclude gains on railway line sales, restructuring and other charges (including the curtailment gain on our other postretirement benefit plan which is included in “Other income – net”), shareholder advisory costs, and a deferred income tax adjustment, all which occurred in 2024, as well as the effects of the Incident that were present in both years. The income tax effects of these non-GAAP adjustments were calculated based on the applicable tax rates to which the non-GAAP adjustments related. We use these non-GAAP financial measures internally and believe this information provides useful supplemental information to investors to facilitate making period-to-period comparisons by excluding these items. While we believe that these non-GAAP financial measures are useful in evaluating our business, this information should be considered as supplemental in nature and is not meant to be considered in isolation from, or as a substitute for, the related financial information prepared in accordance with GAAP. In addition, these non-GAAP financial measures may not be the same as similar measures presented by other companies.
| | | | | | | | | | | | | | | | | | | | | | | | | | | | | | | | | | | | | | | | | | | | |
| Non-GAAP Reconciliation for 2024 |
| Reported
(GAAP) | | | Gains on Railway Line Sales | | Restructuring and Other Charges | | | | Eastern Ohio Incident | | Shareholder Advisory Costs | | Deferred Income Tax Adjustment | | Adjusted
(non-GAAP) |
| ($ in millions, except per share amounts) |
| | | | | | | | | | | | | | | | |
| Railway | | | | | | | | | | | | | | | | |
| operating | $ | 8,052 | | | | $ | 433 | | | $ | (183) | | | | | $ | (325) | | | $ | — | | | $ | — | | | $ | 7,977 | |
| expenses | | | | | | | | | | | | | | | | |
| | | | | | | | | | | | | | | | |
| Income from | | | | | | | | | | | | | | | | |
| railway | $ | 4,071 | | | | $ | (433) | | | $ | 183 | | | | | $ | 325 | | | $ | — | | | $ | — | | | $ | 4,146 | |
| operations | | | | | | | | | | | | | | | | |
| | | | | | | | | | | | | | | | |
| | | | | | | | | | | | | | | | |
| | | | | | | | | | | | | | | | |
| Net income | $ | 2,622 | | | | $ | (327) | | | $ | 125 | | | | | $ | 247 | | | $ | 44 | | | $ | (27) | | | $ | 2,684 | |
| | | | | | | | | | | | | | | | |
| Diluted earnings | $ | 11.57 | | | | $ | (1.44) | | | $ | 0.55 | | | | | $ | 1.09 | | | $ | 0.20 | | | $ | (0.12) | | | $ | 11.85 | |
| per share | | | | | | | | | |
| | | | | | | | | | | | | | | | |
| Railway | | | | | | | | | | | | | | | | |
| operating ratio | 66.4 | | | | 3.6 | | | (1.5) | | | | | (2.7) | | | — | | | — | | | 65.8 | |
| (percent) | | | | | | | | | | | | | | | | |
| | | | | | | | | | | | | | | | |
| | | | | | | | | | | | | | | | | | |
| Non-GAAP Reconciliation for 2023 |
| Reported
(GAAP) | | | Eastern Ohio Incident | | Adjusted
(non-GAAP) |
| ($ in millions, except per share amounts) |
| | | | | | |
| Railway operating expenses | $ | 9,305 | | | | $ | (1,116) | | | $ | 8,189 | |
| Income from railway operations | $ | 2,851 | | | | $ | 1,116 | | | $ | 3,967 | |
| | | | | | |
| | | | | | |
| Net income | $ | 1,827 | | | | $ | 846 | | | $ | 2,673 | |
| Diluted earnings per share | $ | 8.02 | | | | $ | 3.72 | | | $ | 11.74 | |
| Railway operating ratio (percent) | 76.5 | | | | (9.1) | | | 67.4 | |
| | | | | | |
In the table below, references to 2024 and 2023 results and related comparisons use the adjusted, non-GAAP results from the reconciliations in the tables above.
| | | | | | | | | | | | | | | | | | | | | | | | | | | | | |
| Adjusted 2024 (Non-GAAP) | | Adjusted 2023 (Non-GAAP) | | 2022 | | Adjusted 2024 (Non-GAAP) vs. Adjusted 2023 (Non-GAAP) | | Adjusted 2023 (Non-GAAP) vs. 2022 |
| | ($ in millions, except per share amounts) | | (% change) |
| | | | | | | | | |
| Railway operating expenses | $ | 7,977 | | | $ | 8,189 | | | $ | 7,936 | | | (3 | %) | | 3 | % |
| Income from railway operations | $ | 4,146 | | | $ | 3,967 | | | $ | 4,809 | | | 5 | % | | (18 | %) |
| | | | | | | | | |
| | | | | | | | | |
| Net income | $ | 2,684 | | | $ | 2,673 | | | $ | 3,270 | | | — | % | | (18 | %) |
| Diluted earnings per share | $ | 11.85 | | | $ | 11.74 | | | $ | 13.88 | | | 1 | % | | (15 | %) |
| Railway operating ratio (percent) | 65.8 | | | 67.4 | | | 62.3 | | | (2 | %) | | 8 | % |
On an adjusted basis, income from railway operations in 2024 increased due to lower adjusted railway operating expenses, with lower fuel prices, decreased costs of purchased services, and lower other expenses contributing significantly to the overall decline, and more than offsetting the decline in revenue. Lower other income-net and higher interest expense on debt contributed to net income and diluted earnings per share that were only up slightly compared to the prior year.
In 2023, on a non-GAAP basis excluding the impact of direct costs resulting from the Incident, income from railway operations decreased due to lower railway operating revenues and higher railway operating expenses. Railway operating revenues declined due to decreased fuel surcharge revenue, decreased intermodal storage revenues, and lower volume, partially offset by increased pricing and favorable mix compared to the prior year. Railway operating expenses increased due to inflationary pressures, investments in operational resiliency, and higher service-related costs, partially offset by lower fuel prices.
DETAILED RESULTS OF OPERATIONS
Railway Operating Revenues
The following tables present a three-year comparison of revenues, volumes (units), and average revenue per unit by commodity group. | | | | | | | | | | | | | | | | | | | | | | | | | | | | | | | | |
| Revenues | | 2024 | | 2023 | |
| 2024 | | 2023 | | 2022 | | vs. 2023 | | vs. 2022 | |
| ($ in millions) | | (% change) | |
| Merchandise: | | | | | | | | | | |
Agriculture, forest and consumer
products | $ | 2,521 | | | $ | 2,530 | | | $ | 2,493 | | | — | % | | 1 | % | |
| Chemicals | 2,123 | | | 2,054 | | | 2,148 | | | 3 | % | | (4 | %) | |
| Metals and construction | 1,682 | | | 1,634 | | | 1,652 | | | 3 | % | | (1 | %) | |
| Automotive | 1,144 | | | 1,135 | | | 1,038 | | | 1 | % | | 9 | % | |
| Merchandise | 7,470 | | | 7,353 | | | 7,331 | | | 2 | % | | — | % | |
| Intermodal | 3,042 | | | 3,090 | | | 3,681 | | | (2 | %) | | (16 | %) | |
| Coal | 1,611 | | | 1,713 | | | 1,733 | | | (6 | %) | | (1 | %) | |
| Total | $ | 12,123 | | | $ | 12,156 | | | $ | 12,745 | | | — | % | | (5 | %) | |
| | | | | | | | | | | | | | | | | | | | | | | | | | | | | | | | |
| | | | | | | | | | |
| Units | | 2024 | | 2023 | |
| 2024 | | 2023 | | 2022 | | vs. 2023 | | vs. 2022 | |
| (in thousands) | | (% change) | |
| Merchandise: | | | | | | | | | | |
Agriculture, forest and consumer
products | 741.7 | | | 734.3 | | | 723.0 | | | 1 | % | | 2 | % | |
| Chemicals | 518.3 | | | 515.0 | | | 540.1 | | | 1 | % | | (5 | %) | |
| Metals and construction | 641.6 | | | 634.1 | | | 634.6 | | | 1 | % | | — | % | |
| Automotive | 362.7 | | | 361.5 | | | 339.1 | | | — | % | | 7 | % | |
| Merchandise | 2,264.3 | | | 2,244.9 | | | 2,236.8 | | | 1 | % | | — | % | |
| Intermodal | 4,107.7 | | | 3,822.4 | | | 3,913.1 | | | 7 | % | | (2 | %) | |
| Coal | 684.8 | | | 677.1 | | | 684.6 | | | 1 | % | | (1 | %) | |
| Total | 7,056.8 | | | 6,744.4 | | | 6,834.5 | | | 5 | % | | (1 | %) | |
| | | | | | | | | | | | | | | | | | | | | | | | | | | | | | | | |
| | | | | | | | | | |
| Revenue per Unit | | 2024 | | 2023 | |
| 2024 | | 2023 | | 2022 | | vs. 2023 | | vs. 2022 | |
| ($ per unit) | | (% change) | |
| Merchandise: | | | | | | | | | | |
Agriculture, forest and consumer
products | $ | 3,399 | | | $ | 3,445 | | | $ | 3,448 | | | (1 | %) | | — | % | |
| Chemicals | 4,096 | | | 3,989 | | | 3,978 | | | 3 | % | | — | % | |
| Metals and construction | 2,621 | | | 2,577 | | | 2,604 | | | 2 | % | | (1 | %) | |
| Automotive | 3,155 | | | 3,140 | | | 3,059 | | | — | % | | 3 | % | |
| Merchandise | 3,299 | | | 3,275 | | | 3,277 | | | 1 | % | | — | % | |
| Intermodal | 740 | | | 808 | | | 941 | | | (8 | %) | | (14 | %) | |
| Coal | 2,352 | | | 2,530 | | | 2,532 | | | (7 | %) | | — | % | |
| Total | 1,718 | | | 1,802 | | | 1,865 | | | (5 | %) | | (3 | %) | |
Revenues decreased $33 million in 2024 and $589 million in 2023 compared to the prior years. Revenues decreased in 2024 as a result of lower average revenue per unit, driven by lower fuel surcharge revenue, adverse mix, and decreased pricing, partially offset by higher volume. Revenues declined in 2023 as a result of lower average revenue per unit, driven by decreases in fuel surcharge and intermodal storage revenues, and volume declines.
The table below reflects the components of the revenue change by major commodity group.
| | | | | | | | | | | | | | | | | | | | | | | | | | | | | | | | | | | |
| 2024 vs. 2023 | | 2023 vs. 2022 |
| Increase (Decrease) | | Increase (Decrease) |
| ($ in millions) |
| Merchandise | | Intermodal | | Coal | | Merchandise | | Intermodal | | Coal |
| | | | | | | | | | | |
| Volume | $ | 64 | | | $ | 231 | | | $ | 19 | | | $ | 26 | | | $ | (85) | | | $ | (19) | |
| Fuel surcharge | | | | | | | | | | | |
| revenue | (131) | | | (101) | | | (29) | | | (119) | | | (208) | | | (23) | |
| Rate, mix and | | | | | | | | | | | |
| other | 184 | | | (178) | | | (92) | | | 115 | | | (298) | | | 22 | |
| | | | | | | | | | | |
| Total | $ | 117 | | | $ | (48) | | | $ | (102) | | | $ | 22 | | | $ | (591) | | | $ | (20) | |
Approximately 95% of our revenue base is covered by contracts that include negotiated fuel surcharges. Fuel surcharge revenues totaled $962 million, $1.2 billion, and $1.6 billion in 2024, 2023, and 2022, respectively. The decline in fuel surcharge revenues in each period was primarily driven by fluctuations in fuel commodity prices.
For 2025, we expect that revenue will increase driven by higher volumes.
MERCHANDISE revenues increased in both 2024 and 2023 compared with the prior years. In 2024, revenues rose as volume was higher for all commodity groups and pricing gains more than offset lower fuel surcharge revenue. In 2023, revenues were slightly higher as pricing and volume gains were nearly offset by lower fuel surcharge revenue and unfavorable mix. Increased volumes in automotive and agriculture, forest and consumer shipments were partially offset by decreased chemicals shipments.
Agriculture, forest and consumer products revenues decreased slightly in 2024 but increased in 2023 compared with the prior years. In 2024, the decrease was the result of lower average revenue per unit driven by lower fuel surcharge revenue, partially offset by increased price, and increased volume. Increased volume in soybeans, corn, and feed were partially offset by lower volume in fertilizers and ethanol. Soybean volume increased due to spot opportunities. Increased corn and feed volumes were the result of customers shifting from truck to rail service to meet market demands. The decrease in fertilizer volume was driven by lower potash shipments due to customer operational issues and cost pressures. Ethanol volume declined primarily as a result of decreased demand. In 2023, higher revenues were the result of increased volume. Average revenue per unit was flat, the result of lower fuel surcharge revenue offset by pricing gains. Increases in ethanol and fertilizer shipments more than offset declines in shipments of wood chips and graphic paper. Increased market demand led to volume gains in ethanol and fertilizer. Volume declines in wood chips were due to customer mill closures, while lower market demand led to the decline in graphic paper.
Chemicals revenues increased in 2024 but decreased in 2023 compared with the prior years. In 2024, the increase in revenues was driven by higher average revenue per unit driven by increased price, partially offset by lower fuel surcharge revenue, and volume growth. Solid waste and organic chemicals volume increased due to stronger demand. These increases were slightly offset by declines in crude oil and petroleum products. Volume declines in crude oil were due to a market share shift, while declines in petroleum were related to the conclusion of a spot opportunity handled last year to support a customer during a refinery outage. In 2023, the decrease was as a result
of volume declines. Reduced shipments of crude oil, organic chemicals, and natural gas liquids, more than offset the increases in solid waste and other petroleum products. Volume declines for crude oil were driven by soft demand in the energy markets. Organic chemicals and natural gas liquids volume declined as a result of lower demand. Volume gains in solid waste were due to growth with existing customers, while the gains in petroleum products were due to growth with existing customers and new business opportunities.
Metals and construction revenues were higher in 2024 but lower in 2023 compared with the prior years. In 2024, the increase was driven by higher average revenue per unit due to favorable price, partially offset by lower fuel surcharge revenue, and higher volume. Increased volume was due to higher demand in aggregates, kaolin, miscellaneous construction, and scrap metal, partially offset by lower demand for coil steel shipments. In 2023, the decline in revenue was driven by lower average revenue per unit, the result of decreased fuel surcharge revenue partially offset by increased price. Volumes were nearly unchanged as reduced shipments of kaolin and construction materials were offset by volume gains in coil steel and scrap metal. The volume declines in kaolin were largely driven by lower demand, while the declines in construction materials were due to lower demand, extended cycle times and service challenges. Gains in coil steel volume were due to increased equipment available to handle demand, while scrap metal volume increased due to higher demand.
Automotive revenues rose in both 2024 and 2023 compared with the prior years. The increase in revenues in 2024 was driven by slightly higher average revenue per unit driven by increased price, partially offset by lower fuel surcharge revenue, and slightly higher volume. Volume increases were due to improvements in equipment availability and their cycle time paired with higher demand, mostly offset by reduced production and quality holds at certain manufacturers, and extended plant shutdowns. The increase in revenues in 2023 was driven by increased volume and higher average revenue per unit, driven by favorable price. Volume increases were due to higher finished vehicle inventory levels available for rail transportation and improved equipment cycle times.
INTERMODAL revenues decreased in both 2024 and 2023 compared with the prior years. The decrease in 2024 was the result of lower average revenue per unit, driven by decreased pricing, lower fuel surcharge revenue, adverse mix, and declines in storage service revenues, partially offset by higher volume. The decrease in 2023 was the result of lower average revenue per unit, driven by reduced storage service revenues and lower fuel surcharge revenue, and decreased volume.
Intermodal units by market were as follows: | | | | | | | | | | | | | | | | | | | | | | | | | | | | | | | | |
| | | | | | | 2024 | | 2023 | |
| 2024 | | 2023 | | 2022 | | vs. 2023 | | vs. 2022 | |
| | (units in thousands) | | (% change) | |
| | | | | | | | | | |
| Domestic | 2,500.0 | | | 2,371.6 | | | 2,573.6 | | | 5 | % | | (8 | %) | |
| International | 1,607.7 | | | 1,450.8 | | | 1,339.5 | | | 11 | % | | 8 | % | |
| | | | | | | | | | |
| Total | 4,107.7 | | | 3,822.4 | | | 3,913.1 | | | 7 | % | | (2 | %) | |
Domestic volume increased in 2024 but decreased in 2023 compared with the prior years. In 2024, volume increased due to growth in new and existing customers and improved service, partially offset by reduced demand for premium shipments. In 2023, volume declined due to a decrease in freight demand as a result of reduced consumer consumption combined with high inventories, and increased truck competition.
International volume increased in both 2024 and 2023. The increase in 2024 was driven by increased demand, growth in existing customers, and increased movements of empty containers. The increase in 2023 was driven by ocean carriers favoring inland point intermodal traffic, partially offset by a decrease in imports.
COAL revenues decreased in 2024 and 2023 compared with the prior years. The decrease in 2024 was a result of lower average revenue per unit, driven by decreased pricing and lower fuel surcharge revenue, partially offset by positive mix and increased volume. The decrease in 2023 was a result of decreased volumes. Average revenue per unit was flat as lower fuel surcharge revenue and pricing declines were offset by positive mix.
As shown in the following table, total tonnage increased in 2024 but decreased in 2023 compared to prior years.
| | | | | | | | | | | | | | | | | | | | | | | | | | | | | | | | |
| | | | | | | | 2024 | | 2023 | |
| 2024 | | 2023 | | 2022 | | vs. 2023 | | vs. 2022 | |
| | (tons in thousands) | | (% change) | |
| | | | | | | | | | |
| Utility | 29,577 | | | 30,419 | | | 35,705 | | | (3 | %) | | (15 | %) | |
| Export | 33,309 | | | 31,005 | | | 25,887 | | | 7 | % | | 20 | % | |
| Domestic metallurgical | 10,088 | | | 11,096 | | | 11,307 | | | (9 | %) | | (2 | %) | |
| Industrial | 3,728 | | | 3,372 | | | 3,765 | | | 11 | % | | (10 | %) | |
| | | | | | | | | | |
| Total | 76,702 | | | 75,892 | | | 76,664 | | | 1 | % | | (1 | %) | |
Utility coal tonnage decreased in both 2024 and 2023 compared with the prior years. The decline in 2024 was due to reduced demand from continued low natural gas prices and high stockpiles. The decrease in 2023 was due to low natural gas prices, high stockpiles, and unplanned customer outages.
Export coal tonnage increased in both 2024 and 2023 compared with the prior years. The increase in 2024 was due to growth with our customers and increased production. The increase in 2023 was a result of increased demand and coal supply.
Domestic metallurgical coal tonnage decreased in both 2024 and 2023 compared with the prior years. The decrease in 2024 was as a result of reduced customer demand. The decrease in 2023 was due to reduced coke shipments resulting from idled customer facilities.
Industrial coal tonnage increased in 2024 but decreased in 2023 compared with the prior years. The growth in 2024 was due to higher demand. The decrease in 2023 was due to reduced coal shipments related to customer sourcing changes.
Railway Operating Expenses
Railway operating expenses summarized by major classifications were as follows:
| | | | | | | | | | | | | | | | | | | | | | | | | | | | | | | | |
| | | | | | | 2024 | | 2023 | |
| 2024 | | 2023 | | 2022 | | vs. 2023 | | vs. 2022 | |
| | ($ in millions) | | (% change) | |
| | | | | | | | | | |
| Compensation and benefits | $ | 2,823 | | | $ | 2,819 | | | $ | 2,621 | | | — | % | | 8 | % | |
| Purchased services | 1,655 | | | 1,683 | | | 1,565 | | | (2 | %) | | 8 | % | |
| Equipment rents | 393 | | | 387 | | | 357 | | | 2 | % | | 8 | % | |
| Fuel | 987 | | | 1,170 | | | 1,459 | | | (16 | %) | | (20 | %) | |
| Depreciation | 1,353 | | | 1,298 | | | 1,221 | | | 4 | % | | 6 | % | |
| Materials | 369 | | | 364 | | | 283 | | | 1 | % | | 29 | % | |
| Claims | 237 | | | 242 | | | 270 | | | (2 | %) | | (10 | %) | |
| Other | (273) | | | 226 | | | 160 | | | (221 | %) | | 41 | % | |
| Restructuring and other charges | 183 | | | — | | | — | | | | | | |
| Eastern Ohio incident | 325 | | | 1,116 | | | — | | | (71 | %) | | | |
| | | | | | | | | | |
| Total | $ | 8,052 | | | $ | 9,305 | | | $ | 7,936 | | | (13 | %) | | 17 | % | |
In 2024, the decline in railway operating expenses reflects lower net expenses related to the Eastern Ohio incident (Note 18), higher gains on operating property sales, including certain gains on railway line sales (Note 8), and lower fuel prices, partially offset by restructuring and other charges (Note 3), and increased depreciation on our higher asset base. In 2023, expenses increased as we incurred $1.1 billion of costs related to environmental matters and legal proceedings resulting from the Incident (Note 18). Additionally, railway operating expenses reflected higher costs due to inflationary pressures, investments in operational resiliency, and higher service-related costs. Partially offsetting these increases were the impacts of lower fuel prices and the absence of retroactive wage increases recorded in 2022.
Compensation and benefits increased in 2024, reflecting changes in:
•pay rates (up $91 million),
•incentive and stock-based compensation (up $56 million),
•overtime (down $37 million),
•employee activity levels (down $68 million), and
•other (down $38 million).
In 2023, compensation and benefits increased, a result of changes in:
•employee activity levels (up $138 million),
•pay rates (up $86 million),
•overtime (up $9 million),
•incentive and stock-based compensation (down $30 million), and
•other (down $5 million).
Our employment averaged 20,200 in 2024, compared with 20,300 in 2023, and 18,900 in 2022.
Purchased services includes the costs of services purchased from external vendors and contractors, including the net costs of operating joint facilities with other railroads. The decrease in purchased services in 2024 was due to lower lease costs and declines in technology-related and operational expenses, partially offset by higher volume-related expenses and Conrail-related activity. The increase in purchased services in 2023 was due to higher technology-related costs, increased operational and transportation expenses, and higher engineering activity.
Equipment rents, which includes our cost of using equipment (mostly freight cars) owned by other railroads or private owners less the rent paid to us for the use of our equipment, increased in both periods. In 2024, the increase was due to increased automotive and intermodal equipment expenses as a result of higher volumes. In 2023, the increase was due to increased intermodal equipment expenses, higher freight car lease costs, and decreased equity in TTX Company's (TTX) earnings.
Fuel expense, which includes the cost of locomotive fuel as well as other fuel used in railway operations, decreased in both 2024 and 2023. The decrease in both periods was due to lower locomotive fuel prices (down 15% in 2024 and 20% in 2023), which decreased fuel expense by $159 million and $275 million in 2024 and 2023, respectively. Locomotive fuel consumption was down in 2024 and nearly flat in 2023 compared to prior periods. We consumed 373 million gallons of diesel fuel in 2024, compared with 377 million gallons in 2023 and 376 million gallons in 2022.
Depreciation expense increased in both periods compared to the prior years, reflecting reinvestment in our infrastructure, rolling stock, and technology.
Materials expense increased in both 2024 and 2023. The increase in 2024 was due to higher freight car repairs expense, partially offset by lower locomotive materials spending. The increase in 2023 was due to increased locomotive, freight car, and track materials costs.
Claims expense includes costs related to personal injury, property damage, and environmental matters. Claims expense decreased in both 2024 and 2023 compared to the prior years. The decrease in 2024 is the result of lower personal injury case development and declines in lading and property damage expenses. These were partially offset by the absence of a prior-year claims-related recovery and higher insurance costs. The decrease in 2023 was primarily the result of lower personal injury case development, lower costs related to environmental remediation matters unrelated to the Incident, and a claims-related recovery.
Other expense decreased in 2024 primarily due to increased gains from operating property sales, lower non-income-based taxes, and lower relocation and travel-related expenses. Gains from operating property sales includes $433 million of gains on the sale of railway lines in the states of Virginia and North Carolina. These transactions are described further in Note 8 in the Notes to Consolidated Financial Statements. The increase in 2023 was primarily due to lower gains from operating property sales and increased travel-related expenses. Gains from operating property sales amounted to $490 million, $43 million, and $76 million in 2024, 2023, and 2022, respectively.
Restructuring and other charges
In 2024, we recorded $183 million in restructuring and other charges. During the year, we completed voluntary and involuntary separation programs that reduced our management workforce. Additionally, we ceased development of certain technology projects that had not been placed into service. We also wrote down certain specialized equipment to its net realizable value, reflecting the planned disposition of that asset class. Additionally, we incurred costs associated the appointment of our chief operating officer. See Notes 3 and 13 in the Notes to Consolidated Financial Statements for additional information.
Eastern Ohio incident
During 2024, we incurred net expenses of $325 million associated with the Incident, including additional costs associated with environmental matters and legal proceedings. The total amount recorded in 2024 is net of $650 million of insurance recoveries, resulting from claims made under our insurance policies in effect at the time of the Incident. During 2023, we recorded $1.1 billion for costs primarily associated with environmental matters and legal proceedings. We recorded $101 million of recoveries from claims made under our insurance policies, which are included in the total amount recorded in 2023. Our cash expenditures attributable to the Incident, net of insurance proceeds received, were $119 million and $652 million in 2024 and 2023, respectively, and which are presented in “Net cash provided by operating activities” on the Consolidated Statements of Cash Flows. For further details regarding the Incident, see Note 18 in Notes to Consolidated Financial Statements.
Other Income – Net
Other income – net decreased in 2024 but increased in 2023. The decrease in 2024 reflects costs associated with shareholder matters, lower returns on corporate-owned life insurance (COLI), and higher pension and other postretirement benefits expense, partially offset by a $20 million curtailment gain on our other postretirement benefit plan as a result of our voluntary and involuntary separation programs (Note 3). The increase in 2023 was the result of higher net returns on COLI and increased interest income, partially offset by lower gains from non-operating property sales.
Income Taxes
The effective income tax rate was 21.2% in 2024, compared with 21.3% in 2023 and 20.8% in 2022. The current year reflects a $15 million deferred income tax benefit due to a change in a state corporate income tax rate and a $27 million deferred income tax benefit from subsidiary restructuring. These benefits were partially offset by the absence of certain business tax credits recognized in the prior year. The 2023 effective rate benefited from tax credits and higher COLI returns offset by reduced benefits from stock-based compensation. The effective income tax rate in 2022 reflects favorable benefits associated with stock-based compensation and various state law changes (Note 5).
For 2025, we expect an effective income tax rate between 23% and 24%.
FINANCIAL CONDITION, LIQUIDITY, AND CAPITAL RESOURCES
Cash provided by operating activities, our principal source of liquidity, was $4.1 billion in 2024, $3.2 billion in 2023, and $4.2 billion in 2022. The increase in 2024 reflects improved operating results. The decrease in 2023 reflects lower operating results, offset in part by changes in working capital. We had negative working capital of $357 million at December 31, 2024 and working capital of $639 million at December 31, 2023. Cash and cash equivalents totaled $1.6 billion at both December 31, 2024, and December 31, 2023. We expect that cash on hand combined with cash provided by operating activities will be sufficient to meet our ongoing obligations. In addition, we believe our currently-available borrowing capacity, access to additional financing, ability to reduce shareholder distributions, and ability to moderate or defer property additions provide additional flexibility to meet our ongoing obligations in the short- and long-term.
Contractual obligations at December 31, 2024, including those that may have material cash requirements, include interest on fixed-rate long-term debt, long-term debt (Note 10), unconditional purchase obligations (Note 18), long-term advances from Conrail Inc. (Conrail) (Note 7), operating leases (Note 11), agreements with Consolidated Rail Corporation (CRC) (Note 7), and unrecognized tax benefits (Note 5).
| | | | | | | | | | | | | | | | | | | | | | | | | | | | | |
| Total | | 2025 | | 2026 -
2027 | | 2028 -
2029 | | 2030 and
Subsequent |
| | ($ in millions) |
| | | | | | | | | |
| Interest on fixed-rate long-term debt | $ | 19,413 | | | $ | 776 | | | $ | 1,472 | | | $ | 1,383 | | | $ | 15,782 | |
| Long-term debt principal | 18,108 | | | 555 | | | 1,223 | | | 1,212 | | | 15,118 | |
| Unconditional purchase obligations | 1,225 | | | 519 | | | 455 | | | 95 | | | 156 | |
| Long-term advances from Conrail | 534 | | | — | | | — | | | — | | | 534 | |
| Operating leases | 314 | | | 89 | | | 116 | | | 62 | | | 47 | |
| Agreements with CRC | 209 | | | 47 | | | 94 | | | 68 | | | — | |
| Unrecognized tax benefits* | 82 | | | — | | | — | | | — | | | 82 | |
| | | | | | | | | |
| Total | $ | 39,885 | | | $ | 1,986 | | | $ | 3,360 | | | $ | 2,820 | | | $ | 31,719 | |
* This amount is shown in the 2030 and Subsequent column because the year of settlement cannot be reasonably estimated.
Off balance sheet arrangements consist primarily of unrecognized obligations, including future interest payments on fixed-rate long-term debt and unconditional purchase obligations, which are included in the table above. Additionally, in connection with our ownership of an equity method investment, we have the option to acquire an intermodal terminal located in the southern U.S. for an amount that will be determined subsequent to the potential exercise of that option. Our option to purchase the terminal expires in the second quarter of 2025.
Cash used in investing activities was $2.8 billion in 2024, $2.2 billion in 2023, and $1.6 billion in 2022. The increase in 2024 was driven by the acquisition of the assets of the CSR, partially offset by higher borrowings against our COLI policies and increased proceeds from property sales. Please see Note 8 in the Notes to Consolidated Financial Statements for additional details on certain railway line sales and a discussion of the acquisition of the CSR assets. In 2023, the increase was primarily driven by higher property additions and lower proceeds from property sales.
Capital spending and track and equipment statistics can be found within the “Railway Property” section of Part I of this report on Form 10-K. For 2025, we expect property additions to approximate $2.2 billion.
Cash used in financing activities was $1.2 billion in 2024, while cash provided by financing activities was $115 million in 2023, and cash used in financing activities was $3.0 billion in 2022. The increase in cash used in financing activities in 2024 reflects lower proceeds from borrowing partially offset by the absence of repurchases of Common Stock. In 2023, the increase in cash provided by financing activities reflects lower repurchases of Common Stock and increased proceeds from borrowings, partially offset by higher debt repayments.
We did not repurchase any Common Stock during 2024, while we repurchased $622 million in 2023 and $3.1 billion in 2022, which resulted in the retirement of 2.8 million and 12.6 million shares in 2023 and 2022, respectively. As of December 31, 2024, $6.9 billion remains authorized by our Board of Directors for repurchase. The timing and volume of future share repurchases will be guided by our assessment of market conditions and other pertinent factors. Repurchases may be executed in the open market, through derivatives, accelerated repurchase and other negotiated transactions and through plans designed to comply with Rule 10b5-1(c) and Rule 10b-18 under the
Securities and Exchange Act of 1934. Any near-term purchases under the program are expected to be made with internally-generated cash, cash on hand, or proceeds from borrowings.
In June 2024, we entered into an agreement that provides us the ability to issue up to $800 million of unsecured commercial paper and is backed by our credit agreement. The unsecured short-term commercial paper program provides for borrowing at prevailing rates and includes covenants. At December 31, 2024, we had no outstanding commercial paper.
In May 2024, we renewed our accounts receivable securitization program with a maximum borrowing capacity of $400 million. Amounts under our accounts receivable securitization program are borrowed and repaid from time to time in the ordinary course for general corporate and cash management purposes. The term of our accounts receivable securitization program expires in May 2025. We had no amounts outstanding under this program and our available borrowing capacity was $400 million at both December 31, 2024 and December 31, 2023.
In January 2024, we renewed and amended our $800 million credit agreement. The amended agreement expires in January 2029, and provides for borrowings at prevailing rates and includes covenants. We had no amounts outstanding under this facility at either December 31, 2024 or December 31, 2023, and we are in compliance with all of its covenants.
In January 2024, we also entered into a term loan credit agreement that established a 364-day, $1.0 billion, unsecured delayed draw term loan facility under which we could borrow for general corporate purposes. The term loan credit agreement provided for borrowing at prevailing rates and included covenants that align with the $800 million credit agreement. The term loan expired undrawn in October 2024.
In addition, we have investments in general purpose COLI policies and had the ability to borrow against these policies. We had borrowed $605 million against these policies at December 31, 2024 and no amounts borrowed at December 31, 2023. Our remaining borrowing capacity was $40 million and $640 million at December 31, 2024 and December 31, 2023, respectively. In January 2025, we repaid all amounts that were borrowed against these policies at December 31, 2024.
Our debt-to-total capitalization ratio was 54.6% at December 31, 2024, compared with 57.3% at December 31, 2023. We discuss our credit agreement and our accounts receivable securitization program in Note 10. Upcoming annual debt maturities are also disclosed in Note 10. Overall, our goal is to maintain a capital structure with appropriate leverage to support our business strategy and provide flexibility through business cycles.
CRITICAL ACCOUNTING ESTIMATES
The preparation of financial statements in accordance with GAAP requires us to make estimates and assumptions that affect the reported amounts of assets and liabilities, the disclosure of contingent assets and liabilities at the date of the financial statements, and the reported amounts of revenues and expenses during the reporting period. These estimates and assumptions may require judgment about matters that are inherently uncertain, and future events are likely to occur that may require us to make changes to these estimates and assumptions. Accordingly, we regularly review these estimates and assumptions based on historical experience, changes in the business environment, and other factors we believe to be reasonable under the circumstances.
Incident Contingencies
We are currently involved in certain environmental response and remediation activities and subject to numerous legal proceedings and regulatory inquiries and investigations relating to the Incident. We have accrued estimates of the probable and reasonably estimable costs for the resolution of these matters. Our environmental estimates are based upon types of remediation efforts currently anticipated, the volume of contaminants in the impacted areas, and governmental oversight and other costs, amongst other factors. Estimates associated with the legal proceedings to
which we are subject are based on information that is currently available, including but not limited to an assessment of the proceedings and the potential and likely results of such proceedings.
Our current estimates of future environmental cleanup and remediation liabilities related to the Incident may change over time due to various factors, including but not limited to, the nature and extent of required future cleanup and removal activities (including those resulting from soil, water, sediment, and air assessment and investigative activities conducted at the site), and the extent and duration of governmental oversight, amongst other factors. Additionally, the final outcome of any of the legal proceedings and regulatory inquiries and investigations cannot be predicted with certainty, and developments related to the progress of such legal proceedings, inquiries, or investigations or other unfavorable or unexpected outcomes could result in additional costs or new or additionally accrued amounts that could be material to our results of operations in any particular year. Furthermore, certain costs may be recoverable under our insurance policies in effect at the date of the Incident or from third parties. Any amounts that are recoverable under our insurance policies or from third parties will be reflected in the period in which recovery is considered probable.
See Note 18 for more detailed information as it pertains to these contingencies.
Pensions and Other Postretirement Benefits
Accounting for pensions and other postretirement benefit plans requires us to make several estimates and assumptions (Note 13). These include the expected rate of return from investment of the plans’ assets and the expected retirement age of employees as well as their projected earnings and mortality. In addition, the amounts recorded are affected by changes in the interest rate environment because the associated liabilities are discounted to their present value. We make these estimates based on our historical experience and other information we deem pertinent under the circumstances (for example, expectations of future stock market performance). We utilize an independent actuarial consulting firm’s studies to assist us in selecting appropriate actuarial assumptions and valuing related liabilities.
For 2024, we assumed a long-term investment rate of return of 8.0%, which was supported by our long-term total rate of return on pension plan assets since inception, as well as our expectation of future returns. A one-percentage point decrease to this rate of return assumption would result in a $24 million increase in annual pension expense. We review assumptions related to our defined benefit plans annually, and while changes are likely to occur in assumptions concerning retirement age, projected earnings, and mortality, they are not expected to have a material effect on our net pension expense or net pension liability in the future. The net pension liability is recorded at net present value using discount rates that are based on the current interest rate environment in light of the timing of expected benefit payments. We utilize analyses in which the projected annual cash flows from the pension and postretirement benefit plans are matched with yield curves based on an appropriate universe of high-quality corporate bonds. We use the results of the yield curve analyses to select the discount rates that match the payment streams of the benefits in these plans. A one-percentage point decrease to this discount rate assumption would result in a $14 million increase in annual pension expense.
Properties and Depreciation
Most of our assets are long-lived railway properties (Note 8). “Properties” are stated principally at cost and are depreciated using the group method whereby assets with similar characteristics, use, and expected lives are grouped together in asset classes and depreciated using a composite depreciation rate. See Note 1 for a more detailed discussion of assumptions and estimates.
Expenditures, including those on leased assets, that extend an asset’s useful life or increase its utility are capitalized. Expenditures capitalized include those that are directly related to a capital project and may include materials, labor, and other direct costs, in addition to an allocable portion of indirect costs that relate to a capital project. A significant portion of our annual capital spending relates to self-constructed assets. Costs related to repairs and
maintenance activities that, in our judgment, do not extend an asset’s useful life or increase its utility are expensed when such repairs are performed.
Depreciation expense for 2024 totaled $1.4 billion. Our composite depreciation rates for 2024 are disclosed in Note 8; a one-year increase (or decrease) in the estimated average useful lives of depreciable assets would have resulted in an approximate $51 million decrease (or increase) to annual depreciation expense.
Personal Injury
Claims expense, included in “Materials and other” in the Consolidated Statements of Income, includes our estimate of costs for personal injuries.
To aid in valuing our personal injury liability and determining the amount to accrue with respect to such claims during the year, we utilize studies prepared by an independent actuarial consulting firm. The actuarial firm studies our historical patterns of reserving for claims and subsequent settlements, taking into account relevant outside influences. We adjust the liability quarterly based upon our assessment and the results of the study. The accuracy of our estimate of the liability is subject to inherent limitation given the difficulty of predicting future events and, as such, the ultimate loss sustained may vary from the estimated liability recorded.
See Note 18 for a more detailed discussion of the assumptions and estimates we use for personal injury.
Income Taxes
Our net deferred tax liability totaled $7.4 billion at December 31, 2024 (Note 5). This liability is estimated based on the expected future tax consequences of items recognized in the financial statements. After application of the federal statutory tax rate to book income, judgment is required with respect to the timing and deductibility of expenses in our income tax returns. For state income and other taxes, judgment is also required with respect to the apportionment among the various jurisdictions. A valuation allowance is recorded if we expect that it is more likely than not that deferred tax assets will not be realized. We have a $42 million valuation allowance on $467 million of deferred tax assets as of December 31, 2024, reflecting the expectation that substantially all of these assets will be realized.
OTHER MATTERS
Labor Agreements
Approximately 80% of our railroad employees are covered by collective bargaining agreements with various labor unions. Pursuant to the Railway Labor Act (RLA), these agreements remain in effect until new agreements are reached, or until the bargaining procedures mandated by the RLA are completed. Moratorium provisions in the labor agreements govern when the railroads and unions may propose changes to the agreements. We largely bargain nationally in concert with other major railroads, represented by the National Carriers’ Conference Committee (NCCC).
Under current moratorium provisions, neither party was permitted to serve notice to compel a new round of mandatory collective bargaining until November 1, 2024. In the months prior to the opening of the current national bargaining round, we engaged in voluntary local discussions with our labor unions and, as a result, reached local tentative agreements with ten of our thirteen unions. A majority of those tentative agreements were subsequently ratified by union membership and became effective January 1, 2025, foreclosing the parties from serving new notices to compel mandatory bargaining until November 1, 2029.
For those unions with whom we have not yet reached a ratified agreement, the NCCC, on behalf of Norfolk Southern, sent bargaining notices on November 1, 2024, to commence mandatory direct negotiations as prescribed under the RLA. Even if the parties are unable to reach voluntary agreement during this first phase of RLA
bargaining, self-help (e.g., a strike or other work stoppage) related to this collective-bargaining process remains prohibited by law until a lengthy series of additional procedures mandated by the RLA, including federal mediation, are exhausted.
Market Risks
We manage overall exposure to fluctuations in interest rates by issuing both fixed- and floating- rate debt instruments. At December 31, 2024, we have no outstanding debt subject to interest rate fluctuations. Market risk for fixed-rate debt is estimated as the potential increase in fair value resulting from a one-percentage point decrease in interest rates as of December 31, 2024 and amounts to an increase of approximately $1.5 billion to the fair value of our debt at December 31, 2024. We consider it unlikely that interest rate fluctuations applicable to these instruments will result in a material adverse effect on our financial position, results of operations, or liquidity.
New Accounting Pronouncements
For a detailed discussion of new accounting pronouncements, see Note 1.
Inflation
In preparing financial statements, GAAP requires the use of historical cost that disregards the effects of inflation on the replacement cost of property. As a capital-intensive company, we have most of our capital invested in long-lived assets. The replacement cost of these assets, as well as the related depreciation expense, would be substantially greater than the amounts reported on the basis of historical cost.
FORWARD-LOOKING STATEMENTS
Certain statements in this report, including in Management’s Discussion and Analysis of Financial Condition and Results of Operations, are “forward-looking statements” within the meaning of the “safe harbor” provisions of the Private Securities Litigation Reform Act of 1995, as amended. These statements relate to future events or our future financial performance and involve known and unknown risks, uncertainties, and other factors that may cause our actual results, levels of activity, performance, or our achievements or those of our industry to be materially different from those expressed or implied by any forward-looking statements. In some cases, forward-looking statements can be identified by terminology such as “may,” “will,” “could,” “would,” “should,” “expect,” “plan,” “anticipate,” “intend,” “believe,” “estimate,” “project,” “consider,” “predict,” “potential,” “feel,” or other comparable terminology. We have based these forward-looking statements on our current expectations, assumptions, estimates, beliefs, and projections. While we believe these expectations, assumptions, estimates, beliefs, and projections are reasonable, such forward-looking statements are only predictions and involve known and unknown risks and uncertainties, many of which involve factors or circumstances that are beyond our control. The following important
factors, including those discussed in Item 1A “Risk Factors,” may cause actual results, performance, or achievements to differ materially from those expressed or implied by these forward-looking statements:
•our ability to successfully implement our operational, productivity, and strategic initiatives;
•changes in domestic or international economic, political or business conditions, including those impacting the transportation industry;
•a significant adverse event on our network, including but not limited to a mainline accident, discharge of hazardous material, or climate-related or other network outage;
•the outcome of claims, litigation, governmental proceedings, and investigations involving the Company, including but not limited to the Incident Proceedings;
•the nature and extent of the Company's environmental remediation obligations with respect to the Incident;
•new or additional governmental regulation and/or operational changes resulting from or related to the Incident or the Incident Proceedings; and
•a significant cybersecurity incident or other disruption to our technology infrastructure.
The forward-looking statements herein are made only as of the date they were first issued, and unless otherwise required by applicable securities laws, we disclaim any intention or obligation to update or revise any forward-looking statements, whether as a result of new information, future events, or otherwise.
Additional Information
Investors and others should note that we routinely use the Investor Relations, Performance Metrics and Sustainability sections of our website (norfolksouthern.investorroom.com/key-investor-information, norfolksouthern.investorroom.com/weekly-performance-reports & www.norfolksouthern.com/sustainability) to post presentations to investors and other important information, including information that may be deemed material to investors. Information about us, including information that may be deemed material, may also be announced by posts on our social media channels, including X (formerly known as Twitter) (x.com/nscorp) and LinkedIn (www.linkedin.com/company/norfolk-southern). We may also use our website and social media channels for the purpose of complying with our disclosure obligations under Regulation FD. As a result, we encourage investors, the media, and others interested in Norfolk Southern to review the information posted on our website and social media channels. The information posted on our website and social media channels is not incorporated by reference in this Annual Report on Form 10-K.
Item 7A. Quantitative and Qualitative Disclosures About Market Risk
The information required by this item is included in Item 7 “Management’s Discussion and Analysis of Financial Condition and Results of Operations” under the heading “Market Risks.”
Item 8. Financial Statements and Supplementary Data
INDEX TO FINANCIAL STATEMENTS
Report of Management
February 10, 2025
To the Stockholders
Norfolk Southern Corporation:
Management is responsible for establishing and maintaining adequate internal control over financial reporting. In order to ensure that Norfolk Southern’s internal control over financial reporting is effective, management regularly assesses such controls and did so most recently as of December 31, 2024. This assessment was based on criteria for effective internal control over financial reporting described in Internal Control – Integrated Framework (2013) issued by the Committee of Sponsoring Organizations of the Treadway Commission. Based on this assessment, management has concluded that we maintained effective internal control over financial reporting as of December 31, 2024.
KPMG LLP, independent registered public accounting firm, has audited our financial statements and issued an opinion on our internal control over financial reporting as of December 31, 2024.
| | | | | | | | | | | | | | |
| /s/ Mark R. George | | /s/ Jason A. Zampi | | /s/ Claiborne L. Moore |
| Mark R. George | | Jason A. Zampi | | Claiborne L. Moore |
| President and | | Executive Vice President and Chief | | Vice President and |
| Chief Executive Officer | | Financial Officer | | Controller |
Report of Independent Registered Public Accounting Firm
To the Stockholders and Board of Directors
Norfolk Southern Corporation:
Opinions on the Consolidated Financial Statements and Internal Control Over Financial Reporting
We have audited the accompanying consolidated balance sheets of Norfolk Southern Corporation and subsidiaries (the Company) as of December 31, 2024 and 2023, the related consolidated statements of income, comprehensive income, cash flows, and changes in stockholders’ equity for each of the years in the three-year period ended December 31, 2024, and the related notes and financial statement schedule of valuation and qualifying accounts as listed in Item 15(A)2 (collectively, the consolidated financial statements). We also have audited the Company’s internal control over financial reporting as of December 31, 2024, based on criteria established in Internal Control – Integrated Framework (2013) issued by the Committee of Sponsoring Organizations of the Treadway Commission.
In our opinion, the consolidated financial statements referred to above present fairly, in all material respects, the financial position of the Company as of December 31, 2024 and 2023, and the results of its operations and its cash flows for each of the years in the three-year period ended December 31, 2024, in conformity with U.S. generally accepted accounting principles. Also in our opinion, the Company maintained, in all material respects, effective internal control over financial reporting as of December 31, 2024 based on criteria established in Internal Control – Integrated Framework (2013) issued by the Committee of Sponsoring Organizations of the Treadway Commission.
Basis for Opinions
The Company’s management is responsible for these consolidated financial statements, for maintaining effective internal control over financial reporting, and for its assessment of the effectiveness of internal control over financial reporting, included in the accompanying Management's Annual Report on Internal Control Over Financial Reporting. Our responsibility is to express an opinion on the Company’s consolidated financial statements and an opinion on the Company’s internal control over financial reporting based on our audits. We are a public accounting firm registered with the Public Company Accounting Oversight Board (United States) (PCAOB) and are required to be independent with respect to the Company in accordance with the U.S. federal securities laws and the applicable rules and regulations of the Securities and Exchange Commission and the PCAOB.
We conducted our audits in accordance with the standards of the PCAOB. Those standards require that we plan and perform the audits to obtain reasonable assurance about whether the consolidated financial statements are free of material misstatement, whether due to error or fraud, and whether effective internal control over financial reporting was maintained in all material respects.
Our audits of the consolidated financial statements included performing procedures to assess the risks of material misstatement of the consolidated financial statements, whether due to error or fraud, and performing procedures that respond to those risks. Such procedures included examining, on a test basis, evidence regarding the amounts and disclosures in the consolidated financial statements. Our audits also included evaluating the accounting principles used and significant estimates made by management, as well as evaluating the overall presentation of the consolidated financial statements. Our audit of internal control over financial reporting included obtaining an understanding of internal control over financial reporting, assessing the risk that a material weakness exists, and testing and evaluating the design and operating effectiveness of internal control based on the assessed risk. Our audits also included performing such other procedures as we considered necessary in the circumstances. We believe that our audits provide a reasonable basis for our opinions.
Definition and Limitations of Internal Control Over Financial Reporting
A company’s internal control over financial reporting is a process designed to provide reasonable assurance regarding the reliability of financial reporting and the preparation of financial statements for external purposes in accordance with generally accepted accounting principles. A company’s internal control over financial reporting includes those policies and procedures that (1) pertain to the maintenance of records that, in reasonable detail, accurately and fairly reflect the transactions and dispositions of the assets of the company; (2) provide reasonable assurance that transactions are recorded as necessary to permit preparation of financial statements in accordance with generally accepted accounting principles, and that receipts and expenditures of the company are being made only in accordance with authorizations of management and directors of the company; and (3) provide reasonable assurance regarding prevention or timely detection of unauthorized acquisition, use, or disposition of the company’s assets that could have a material effect on the financial statements.
Because of its inherent limitations, internal control over financial reporting may not prevent or detect misstatements. Also, projections of any evaluation of effectiveness to future periods are subject to the risk that controls may become inadequate because of changes in conditions, or that the degree of compliance with the policies or procedures may deteriorate.
Critical Audit Matter
The critical audit matter communicated below is a matter arising from the current period audit of the consolidated financial statements that was communicated or required to be communicated to the audit committee and that: (1) relates to accounts or disclosures that are material to the consolidated financial statements and (2) involved our especially challenging, subjective, or complex judgments. The communication of a critical audit matter does not alter in any way our opinion on the consolidated financial statements, taken as a whole, and we are not, by communicating the critical audit matter below, providing a separate opinion on the critical audit matter or on the accounts or disclosures to which it relates.
Sufficiency of audit evidence related to the capitalization of property expenditures
As discussed in Note 1 to the consolidated financial statements, expenditures that extend an asset’s useful life or increase its utility are capitalized. The Company has recorded $35,831 million in net book value of properties at December 31, 2024 and has recorded $2,381 million in property additions for the year ended December 31, 2024. Expenditures capitalized include those that are directly related to a capital project and may include materials, labor and other direct costs, in addition to an allocable portion of indirect costs that relate to a capital project. A significant portion of the Company’s annual capital spending relates to self-constructed assets. Costs related to repair and maintenance activities, that in the Company’s judgment, do not extend an asset’s useful life or increase its utility are expensed when such repairs are performed.
We identified the evaluation of the sufficiency of audit evidence related to capitalization of property expenditures as a critical audit matter. Subjective auditor judgment was required in determining procedures and evaluating audit results related to the capitalization of purchased services and compensation due to their usage for both self-constructed assets and repairs and maintenance.
The following are the primary procedures we performed to address the critical audit matter. We applied auditor judgment to determine the nature and extent of procedures to be performed over capitalized property expenditures. We evaluated the design and tested the operating effectiveness of certain internal controls over the Company’s process to capitalize property expenditures, including controls over the determination of whether purchased services and compensation expenditures extend an asset’s useful life or increase its utility. For a sample of property additions expenditures, we inquired and inspected support to evaluate that the expenditure extended an asset’s useful life or increased its utility. We evaluated the sufficiency of audit evidence obtained by assessing the results of the procedures performed, including the appropriateness of the nature of such evidence.
/s/ KPMG LLP
KPMG LLP
We have served as the Company's auditor since 1982.
Atlanta, Georgia
February 10, 2025
Norfolk Southern Corporation and Subsidiaries
Consolidated Statements of Income
| | | | | | | | | | | | | | | | | |
| | Years ended December 31, |
| | 2024 | | 2023 | | 2022 |
| | ($ in millions, except per share amounts) |
| | | | | |
| Railway operating revenues | $ | 12,123 | | | $ | 12,156 | | | $ | 12,745 | |
| | | | | |
| Railway operating expenses | | | | | |
| Compensation and benefits | 2,823 | | | 2,819 | | | 2,621 | |
| Purchased services and rents | 2,048 | | | 2,070 | | | 1,922 | |
| Fuel | 987 | | | 1,170 | | | 1,459 | |
| Depreciation | 1,353 | | | 1,298 | | | 1,221 | |
| Materials and other | 333 | | | 832 | | | 713 | |
| Restructuring and other charges | 183 | | | — | | | — | |
| Eastern Ohio incident | 325 | | | 1,116 | | | — | |
| | | | | |
| Total railway operating expenses | 8,052 | | | 9,305 | | | 7,936 | |
| | | | | |
| Income from railway operations | 4,071 | | | 2,851 | | | 4,809 | |
| | | | | |
| Other income – net | 65 | | | 191 | | | 13 | |
| Interest expense on debt | 807 | | | 722 | | | 692 | |
| | | | | |
| Income before income taxes | 3,329 | | | 2,320 | | | 4,130 | |
| | | | | |
| Income taxes | 707 | | | 493 | | | 860 | |
| | | | | |
| Net income | $ | 2,622 | | | $ | 1,827 | | | $ | 3,270 | |
| | | | | |
| Earnings per share | | | | | |
| Basic | $ | 11.58 | | | $ | 8.04 | | | $ | 13.92 | |
| Diluted | 11.57 | | | 8.02 | | | 13.88 | |
See accompanying notes to consolidated financial statements.
K46
Norfolk Southern Corporation and Subsidiaries
Consolidated Statements of Comprehensive Income
| | | | | | | | | | | | | | | | | |
| | Years ended December 31, |
| | 2024 | | 2023 | | 2022 |
| | ($ in millions) |
| | | | | |
| Net income | $ | 2,622 | | | $ | 1,827 | | | $ | 3,270 | |
| Other comprehensive income, before tax: | | | | | |
| Pension and other postretirement benefits | 70 | | | 36 | | | 51 | |
| Other comprehensive income of equity investees | 7 | | | 4 | | | 17 | |
| | | | | |
| Other comprehensive income, before tax | 77 | | | 40 | | | 68 | |
| Income tax expense related to items of | | | | | |
| other comprehensive income | (19) | | | (9) | | | (17) | |
| | | | | |
| Other comprehensive income, net of tax | 58 | | | 31 | | | 51 | |
| | | | | |
| Total comprehensive income | $ | 2,680 | | | $ | 1,858 | | | $ | 3,321 | |
See accompanying notes to consolidated financial statements.
K47
Norfolk Southern Corporation and Subsidiaries
Consolidated Balance Sheets | | | | | | | | | | | |
| | At December 31, |
| | 2024 | | 2023 |
| | ($ in millions) |
| Assets | | | |
| Current assets: | | | |
| Cash and cash equivalents | $ | 1,641 | | | $ | 1,568 | |
| | | |
| Accounts receivable – net | 1,069 | | | 1,147 | |
| Materials and supplies | 277 | | | 264 | |
| Other current assets | 201 | | | 292 | |
| Total current assets | 3,188 | | | 3,271 | |
| | | |
| Investments | 3,370 | | | 3,839 | |
| Properties less accumulated depreciation of $13,957 and | | | |
| $13,265, respectively | 35,831 | | | 33,326 | |
| Other assets | 1,293 | | | 1,216 | |
| | | |
| Total assets | $ | 43,682 | | | $ | 41,652 | |
| | | |
| Liabilities and stockholders’ equity | | | |
| Current liabilities: | | | |
| Accounts payable | $ | 1,704 | | | $ | 1,638 | |
| | | |
| Income and other taxes | 337 | | | 262 | |
| Other current liabilities | 949 | | | 728 | |
| Current maturities of long-term debt | 555 | | | 4 | |
| Total current liabilities | 3,545 | | | 2,632 | |
| | | |
| Long-term debt | 16,651 | | | 17,175 | |
| Other liabilities | 1,760 | | | 1,839 | |
| Deferred income taxes | 7,420 | | | 7,225 | |
| | | |
| Total liabilities | 29,376 | | | 28,871 | |
| | | |
| Stockholders’ equity: | | | |
| Common Stock $1.00 per share par value, 1,350,000,000 shares | | | |
| authorized; outstanding 226,320,894 and 225,681,254 shares, | | | |
| respectively, net of treasury shares | 228 | | | 227 | |
| Additional paid-in capital | 2,247 | | | 2,179 | |
| Accumulated other comprehensive loss | (262) | | | (320) | |
| Retained income | 12,093 | | | 10,695 | |
| | | |
| Total stockholders’ equity | 14,306 | | | 12,781 | |
| | | |
| Total liabilities and stockholders’ equity | $ | 43,682 | | | $ | 41,652 | |
See accompanying notes to consolidated financial statements.
K48
Norfolk Southern Corporation and Subsidiaries
Consolidated Statements of Cash Flows | | | | | | | | | | | | | | | | | |
| Years ended December 31, |
| | 2024 | | 2023 | | 2022 |
| | ($ in millions) |
| Cash flows from operating activities | | | | | |
| Net income | $ | 2,622 | | | $ | 1,827 | | | $ | 3,270 | |
| Reconciliation of net income to net cash provided by operating activities: | | | | | |
| Depreciation | 1,353 | | | 1,298 | | | 1,221 | |
| Deferred income taxes | 176 | | | (49) | | | 83 | |
| Gains and losses on properties | (490) | | | (49) | | | (82) | |
| | | | | |
| | | | | |
| Changes in assets and liabilities affecting operations: | | | | | |
| Accounts receivable | 85 | | | (2) | | | (171) | |
| Materials and supplies | (13) | | | (11) | | | (35) | |
| Other current assets | 5 | | | (54) | | | (18) | |
| Current liabilities other than debt | 548 | | | 435 | | | 23 | |
| Other – net | (234) | | | (216) | | | (69) | |
| | | | | |
| Net cash provided by operating activities | 4,052 | | | 3,179 | | | 4,222 | |
| | | | | |
| Cash flows from investing activities | | | | | |
| Property additions | (2,381) | | | (2,327) | | | (1,948) | |
| Acquisition of assets of CSR | (1,643) | | | (22) | | | — | |
| Property sales and other transactions | 558 | | | 86 | | | 263 | |
| Investment purchases | (319) | | | (124) | | | (12) | |
| Investment sales and other transactions | 1,005 | | | 205 | | | 94 | |
| | | | | |
| Net cash used in investing activities | (2,780) | | | (2,182) | | | (1,603) | |
| | | | | |
| Cash flows from financing activities | | | | | |
| Dividends | (1,221) | | | (1,225) | | | (1,167) | |
| Common Stock transactions | 26 | | | 3 | | | (4) | |
| Purchase and retirement of Common Stock | — | | | (622) | | | (3,110) | |
| Proceeds from borrowings | 1,051 | | | 3,293 | | | 1,832 | |
| Debt repayments | (1,055) | | | (1,334) | | | (553) | |
| | | | | |
| Net cash provided by (used in) financing activities | (1,199) | | | 115 | | | (3,002) | |
| | | | | |
| Net increase (decrease) in cash and cash equivalents | 73 | | | 1,112 | | | (383) | |
| | | | | |
| Cash and cash equivalents | | | | | |
| At beginning of year | 1,568 | | | 456 | | | 839 | |
| | | | | |
| At end of year | $ | 1,641 | | | $ | 1,568 | | | $ | 456 | |
| | | | | |
| Supplemental disclosures of cash flow information | | | | | |
| Cash paid during the year for: | | | | | |
| Interest (net of amounts capitalized) | $ | 764 | | | $ | 653 | | | $ | 619 | |
| Income taxes (net of refunds) | 305 | | | 681 | | | 750 | |
| | | | | |
See accompanying notes to consolidated financial statements.
K49
Norfolk Southern Corporation and Subsidiaries
Consolidated Statements of Changes in Stockholders’ Equity | | | | | | | | | | | | | | | | | | | | | | | | | | | | | |
| Common
Stock | | Additional
Paid-in
Capital | | Accum. Other
Comprehensive
Loss | | Retained
Income | | Total |
| | ($ in millions, except per share amounts) |
| | | | | | | | | |
| Balance at December 31, 2021 | $ | 242 | | | $ | 2,215 | | | $ | (402) | | | $ | 11,586 | | | $ | 13,641 | |
| | | | | | | | | |
| Comprehensive income: | | | | | | | | | |
| Net income | | | | | | | 3,270 | | | 3,270 | |
| Other comprehensive income | | | | | 51 | | | | | 51 | |
| Total comprehensive income | | | | | | | | | 3,321 | |
| Dividends on Common Stock, | | | | | | | | | |
| $4.96 per share | | | | | | | (1,167) | | | (1,167) | |
| Share repurchases | (13) | | | (108) | | | | | (2,989) | | | (3,110) | |
| Stock-based compensation | 1 | | | 50 | | | | | (3) | | | 48 | |
| | | | | | | | | |
| | | | | | | | | |
| | | | | | | | | |
| Balance at December 31, 2022 | 230 | | | 2,157 | | | (351) | | | 10,697 | | | 12,733 | |
| | | | | | | | | |
| Comprehensive income: | | | | | | | | | |
| Net income | | | | | | | 1,827 | | | 1,827 | |
| Other comprehensive income | | | | | 31 | | | | | 31 | |
| Total comprehensive income | | | | | | | | | 1,858 | |
| Dividends on Common Stock, | | | | | | | | | |
| $5.40 per share | | | | | | | (1,225) | | | (1,225) | |
| Share repurchases | (3) | | | (24) | | | | | (600) | | | (627) | |
| Stock-based compensation | | | 46 | | | | | (4) | | | 42 | |
| | | | | | | | | |
| Balance at December 31, 2023 | 227 | | | 2,179 | | | (320) | | | 10,695 | | | 12,781 | |
| | | | | | | | | |
| Comprehensive income: | | | | | | | | | |
| Net income | | | | | | | 2,622 | | | 2,622 | |
| Other comprehensive income | | | | | 58 | | | | | 58 | |
| Total comprehensive income | | | | | | | | | 2,680 | |
| Dividends on Common Stock, | | | | | | | | | |
| $5.40 per share | | | | | | | (1,221) | | | (1,221) | |
| | | | | | | | | |
| Stock-based compensation | 1 | | | 68 | | | | | (3) | | | 66 | |
| | | | | | | | | |
| Balance at December 31, 2024 | $ | 228 | | | $ | 2,247 | | | $ | (262) | | | $ | 12,093 | | | $ | 14,306 | |
See accompanying notes to consolidated financial statements.
K50
Norfolk Southern Corporation and Subsidiaries
Notes to Consolidated Financial Statements
The following Notes are an integral part of the Consolidated Financial Statements. Certain prior year information has been reclassified to conform to current year presentation.
1. Summary of Significant Accounting Policies
Description of Business and Operating Segments
Norfolk Southern Corporation is a Georgia-based holding company engaged principally in the rail transportation business, operating 19,200 route miles primarily in the Southeast, East, and Midwest. These consolidated financial statements include Norfolk Southern and its majority-owned and controlled subsidiaries (collectively, NS, we, us, and our). Norfolk Southern’s major subsidiary is NSR. All significant intercompany balances and transactions have been eliminated in consolidation.
NSR and its railroad subsidiaries transport raw materials, intermediate products, and finished goods classified in the following commodity groups (percent of total railway operating revenues in 2024): intermodal (25%); agriculture, forest and consumer products (21%); chemicals (18%); metals and construction (14%); coal (13%); and automotive (9%). Although most of our customers are domestic, ultimate points of origination or destination for some of the products transported (particularly coal bound for export and some intermodal shipments) may be outside the U.S. Approximately 80% of our railroad employees are covered by collective bargaining agreements with various labor unions.
We manage our company as one reportable operating segment, railway operations, providing rail transportation to customers. We define our operating segment based on the way in which internally reported financial information is regularly reviewed by the chief operating decision maker, our chief executive officer, to analyze financial performance and allocate resources. Although we provide and analyze revenues by commodity group, the overall financial and operational performance of the railroad is analyzed as one operating segment due to the nature of our integrated rail network. Financial information and annual operating budgets and forecasts are prepared and reviewed by the chief operating decision maker at a consolidated level, making operational decisions to maximize consolidated financial results. The accounting policies of our railway operations segment are the same as those described in the summary of significant accounting policies herein.
The chief operating decision maker assesses performance for the railway operations segment and decides how to allocate resources based on “Net income” that is reported on the Consolidated Statements of Income. Net income is used to monitor budget versus actual results of the organization. Our consolidated financial results are used in assessing the performance of the segment and in establishing management’s compensation. The measure of segment assets is reported on the Consolidated Balance Sheets as “Total assets.” The chief operating decision maker uses net income generated from our railroad operations in determining capital allocations decisions, such as whether to reinvest profits into the rail network or into other parts of the entity or utilize them for other purposes, including paying dividends or repurchasing Common Stock.
Railway operations segment revenue, expenses, and profit and loss are disclosed below as reviewed and used by the chief operating decision maker. There are no other significant segment items or reconciling items to segment profit.
| | | | | | | | | | | | | | | | | |
| 2024 | | 2023 | | 2022 |
| ($ in millions) |
| | | | | |
Railway operating revenues (Note 2) | $ | 12,123 | | | $ | 12,156 | | | $ | 12,745 | |
| | | | | |
| Railway operating expenses | | | | | |
| Compensation and benefits | 2,823 | | | 2,819 | | | 2,621 | |
| Purchased services | 1,655 | | | 1,683 | | | 1,565 | |
| Equipment rents | 393 | | | 387 | | | 357 | |
| Fuel | 987 | | | 1,170 | | | 1,459 | |
| Depreciation | 1,353 | | | 1,298 | | | 1,221 | |
| Materials | 369 | | | 364 | | | 283 | |
| Claims | 237 | | | 242 | | | 270 | |
| Other (Note 8) | (273) | | | 226 | | | 160 | |
| Restructuring and other charges (Note 3) | 183 | | | — | | | — | |
| Eastern Ohio incident (Note 18) | 325 | | | 1,116 | | | — | |
| | | | | |
| Total railway operating expenses | 8,052 | | | 9,305 | | | 7,936 | |
| | | | | |
| Income from railway operations | 4,071 | | | 2,851 | | | 4,809 | |
| | | | | |
| Other income – net (Note 4) | 65 | | | 191 | | | 13 | |
| Interest expense on debt | 807 | | | 722 | | | 692 | |
| | | | | |
| Income before income taxes | 3,329 | | | 2,320 | | | 4,130 | |
| | | | | |
| Income taxes (Note 5) | 707 | | | 493 | | | 860 | |
| | | | | |
| Net income | $ | 2,622 | | | $ | 1,827 | | | $ | 3,270 | |
Total equity method investments are disclosed in Note 7 “Investments,” and total expenditures for long-lived assets are disclosed as “Property additions” on the Consolidated Statement of Cash Flows.
Use of Estimates
The preparation of financial statements in accordance with GAAP requires us to make estimates and assumptions that affect the reported amounts of assets and liabilities, the disclosure of contingent assets and liabilities at the date of the financial statements, and the reported amounts of revenues and expenses during the reporting period. We periodically review our estimates, including those related to the recoverability and useful lives of assets, as well as liabilities for litigation, environmental remediation, casualty claims, income taxes and pension and other postretirement benefits. Changes in facts and circumstances may result in revised estimates.
Revenue Recognition
Transportation revenues are recognized proportionally as a shipment moves from origin to destination, and related expenses are recognized as incurred. Certain of our contract refunds (which are primarily volume-based incentives) are recorded as a reduction to revenues on the basis of our best estimate of projected liability, which is based on historical activity, current shipment counts and expectation of future activity. Certain ancillary services, such as switching, demurrage and other incidental activities, may be provided to customers under their transportation contracts. The revenues associated with these distinct performance obligations are recognized when the services are performed or as contractual obligations are met.
Cash Equivalents
“Cash equivalents” are highly liquid investments purchased three months or less from maturity.
Allowance for Doubtful Accounts
Our allowance for doubtful accounts was $8 million and $7 million at December 31, 2024 and 2023, respectively. To determine our allowance for doubtful accounts, we evaluate historical loss experience (which has not been significant), the characteristics of current accounts, and general economic conditions and trends.
Materials and Supplies
“Materials and supplies,” consisting mainly of items for maintenance of property and equipment, are stated at the lower of average cost or net realizable value. The cost of materials and supplies expected to be used in property additions or improvements is included in “Properties.”
Investments
Investments in entities over which we have the ability to exercise significant influence but do not control the entity are accounted for using the equity method, whereby the investment is carried at the cost of the acquisition plus our equity in undistributed earnings or losses since acquisition.
Properties
“Properties” are stated principally at cost and are depreciated using the group method whereby assets with similar characteristics, use, and expected lives are grouped together in asset classes and depreciated using a composite depreciation rate. This methodology treats each asset class as a pool of resources, not as singular items. We use approximately 75 depreciable asset classes.
Depreciation expense is based on our assumptions concerning expected service lives of our properties as well as the expected net salvage that will be received upon their retirement. In developing these assumptions, we utilize periodic depreciation studies that are performed by an independent outside firm of consulting engineers and approved by the STB. Our depreciation studies are conducted about every three years for equipment and every six years for track assets and other roadway property. The frequency of these studies is consistent with guidelines established by the STB. We adjust our rates based on the results of these studies and implement the changes prospectively. The studies may also indicate that the recorded amount of accumulated depreciation is deficient (or in excess) of the amount indicated by the study. Any such deficiency (or excess) is amortized as a component of depreciation expense over the remaining service lives of the affected class of property, as determined by the study.
Key factors that are considered in developing average service life and salvage estimates include:
•statistical analysis of historical retirement data and surviving asset records,
•review of historical salvage received and current market rates,
•review of our operations including expected changes in technology, customer demand, maintenance practices and asset management strategies,
•review of accounting policies and assumptions, and
•industry review and analysis.
The composite depreciation rate for rail in high density corridors is derived based on consideration of annual gross tons as compared to the total or ultimate capacity of rail in these corridors. Our experience has shown that traffic density is a leading factor in the determination of the expected service life of rail in high density corridors. In developing the respective depreciation rate, consideration is also given to several rail characteristics including age, weight, condition (new or second-hand), and type (curved or straight).
We capitalize interest on major projects during the period of their construction. Expenditures, including those on leased assets, that extend an asset’s useful life or increase its utility are capitalized. Expenditures capitalized include those that are directly related to a capital project and may include materials, labor, and other direct costs, in addition to an allocable portion of indirect costs that relate to a capital project. A significant portion of our annual capital spending relates to self-constructed assets. Removal activities occur in conjunction with replacement and are estimated based on the average percentage of time employees replacing assets spend on removal functions. Costs related to repairs and maintenance activities that, in our judgment, do not extend an asset’s useful life or increase its utility are expensed when such repairs are performed.
When depreciable operating road and equipment assets are sold or retired in the ordinary course of business, the cost of the assets, net of sales proceeds or salvage, is charged to accumulated depreciation, and no gain or loss is recognized in earnings. Actual historical cost values are retired when available, such as with most equipment assets. The use of estimates in recording the retirement of certain roadway assets is necessary based on the impracticality of tracking individual asset costs. When retiring rail, ties, and ballast, we use statistical curves that indicate the relative distribution of the age of the assets retired. The historical cost of other roadway assets is estimated using a combination of inflation indices specific to the rail industry and those published by the U.S. Bureau of Labor Statistics. The indices are applied to the replacement value based on the age of the retired assets. These indices are used because they closely correlate with the costs of roadway assets. Gains and losses on disposal of operating land are included in “Materials and other” expenses. Gains and losses on disposal of non-operating land and non-rail assets are included in “Other income – net” since such income is not a product of our railroad operations.
A retirement is considered abnormal if it does not occur in the ordinary course of business, if it relates to disposition of a large segment of an asset class, and if the retirement varies significantly from the retirement profile identified through our depreciation studies, which inherently consider the impact of normal retirements on expected service lives and depreciation rates. Gains or losses from abnormal retirements are recognized in income from railway operations.
We review the carrying amount of properties whenever events or changes in circumstances indicate that such carrying amount may not be recoverable based on future undiscounted cash flows. Assets that are deemed impaired as a result of such review are recorded at the lower of carrying amount or fair value.
New Accounting Pronouncements
In November 2023, the Financial Accounting Standards Board (FASB) issued Accounting Standards Update (ASU) 2023-07, “Segment Reporting (Topic 280): Improvements to Reportable Segment Disclosures.” This update requires additional reportable segment disclosures, primarily through enhanced disclosures about significant segment expenses and information used to assess performance. The ASU is effective for fiscal years beginning after December 15, 2023 and interim periods within fiscal years beginning after December 15, 2024. We adopted the ASU on January 1, 2024 and updated our segment disclosures in Note 1.
In December 2023, the FASB issued ASU 2023-09, “Income Taxes (Topic 740): Improvements to Income Tax Disclosures.” This update requires additional disclosures including greater disaggregation of information in the reconciliation of the statutory rate to the effective rate and income taxes paid disaggregated by jurisdiction. The ASU is effective for fiscal years beginning after December 15, 2024. We did not adopt the standard early and are currently evaluating the effect on our financial statements.
In November 2024, the FASB issued ASU 2024-03, “Income Statement - Reporting Comprehensive Income - Expense Disaggregation Disclosures (Subtopic 220-40).” This update requires an entity to disclose specific information about certain costs and expenses in the notes to its financial statements for interim and annual reporting periods. Entities are required to provide disaggregated information about expenses to help investors better understand performance, better assess prospects for future cash flows, and compare performance over time and with that of other entities. The ASU is effective for fiscal years beginning after December 15, 2026 and interim periods within fiscal years beginning after December 15, 2027. We will not early adopt the standard and are currently evaluating the effect on our financial statements.
2. Railway Operating Revenues
The following table disaggregates our revenues by major commodity group: | | | | | | | | | | | | | | | | | | | | |
| | 2024 | | 2023 | | 2022 |
| | ($ in millions) |
| Merchandise: | | | | |
| Agriculture, forest and consumer products | | $ | 2,521 | | | $ | 2,530 | | | $ | 2,493 | |
| Chemicals | | 2,123 | | | 2,054 | | | 2,148 | |
| Metals and construction | | 1,682 | | | 1,634 | | | 1,652 | |
| Automotive | | 1,144 | | | 1,135 | | | 1,038 | |
| Merchandise | | 7,470 | | | 7,353 | | | 7,331 | |
| Intermodal | | 3,042 | | | 3,090 | | | 3,681 | |
| Coal | | 1,611 | | | 1,713 | | | 1,733 | |
| | | | | | |
| Total | | $ | 12,123 | | | $ | 12,156 | | | $ | 12,745 | |
We recognize the amount of revenues to which we expect to be entitled for the transfer of promised goods or services to customers. A performance obligation is created when a customer under a transportation contract or public tariff submits a bill of lading to us for the transport of goods. These performance obligations are satisfied as the shipments move from origin to destination. As such, transportation revenues are recognized proportionally as a shipment moves, and related expenses are recognized as incurred. These performance obligations are generally short-term in nature with transit days averaging approximately one week or less for each commodity group. The customer has an unconditional obligation to pay for the service once the service has been completed. Estimated revenues associated with in-process shipments at period-end are recorded based on the estimated percentage of service completed. We had no material remaining performance obligations at December 31, 2024 and 2023.
We may provide customers ancillary services, such as switching, demurrage, and other incidental activities, under their transportation contracts. The revenues associated with these distinct performance obligations are recognized when the services are performed or as contractual obligations are met. These revenues are included within each of the commodity groups and represent approximately 4%, 5%, and 7%, respectively, of total “Railway operating revenues” on the Consolidated Statements of Income for the years ended December 31, 2024, 2023, and 2022.
Revenues related to interline transportation services that involve another railroad are reported on a net basis. Therefore, the portion of the amount that relates to another party is not reflected in revenues.
Under the typical terms of our freight contracts, payment for services is due within fifteen days of billing the customer, thus there are no significant financing components. “Accounts receivable – net” on the Consolidated Balance Sheets includes both customer and non-customer receivables as follows:
| | | | | | | | | | | | | | |
| | December 31, |
| | 2024 | | 2023 |
| | ($ in millions) |
| | | | |
| Customer | | $ | 787 | | | $ | 882 | |
| Non-customer | | 282 | | | 265 | |
| | | | |
| Accounts receivable – net | | $ | 1,069 | | | $ | 1,147 | |
Non-customer receivables include non-revenue-related amounts due from other railroads, governmental entities, insurers, and others. We do not have any material contract assets or liabilities at December 31, 2024 and 2023.
3. Restructuring and Other Charges
In 2024, we initiated voluntary and involuntary separation programs to reduce our management workforce. Through these programs, approximately 350 management employees were separated from service by May 2024. “Restructuring and other charges” reflects separation payments and other benefits to the impacted management employees and amounted to $69 million. Additionally, we evaluated the impact of these separation programs on our pension and other postretirement benefit plans, as further discussed in Note 13.
During 2024, we made strategic decisions to cease development of certain technology projects that had not been placed into service and which resulted in a write-down of these assets. Additionally, we discontinued the use of our Triple Crown Road Railer assets, and, with a planned disposition of the entire asset class, we incurred expenses to reflect these assets at their net realizable value. As a result, “Restructuring and other charges” includes an additional $79 million of expenses related to these efforts.
In March 2024, we appointed John Orr as Executive Vice President and Chief Operating Officer of the Company. “Restructuring and other charges” in 2024 also includes $35 million of costs related to this appointment, including an agreement with his previous employer, CPKC, that resulted in a $25 million payment and certain commercial considerations to CPKC in exchange for a waiver of his non-compete provisions.
4. Other Income – Net
| | | | | | | | | | | | | | | | | |
| | 2024 | | 2023 | | 2022 |
| | ($ in millions) |
| | | | | |
| Pension and other postretirement benefits (Note 13) | $ | 120 | | | $ | 117 | | | $ | 126 | |
| COLI – net | 17 | | | 65 | | | (77) | |
| Shareholder advisory costs | (59) | | | — | | | — | |
| Other | (13) | | | 9 | | | (36) | |
| | | | | |
| Total | $ | 65 | | | $ | 191 | | | $ | 13 | |
5. Income Taxes
| | | | | | | | | | | | | | | | | |
| | 2024 | | 2023 | | 2022 |
| | ($ in millions) |
| Current: | | | | | |
| Federal | $ | 445 | | | $ | 437 | | | $ | 645 | |
| State | 86 | | | 105 | | | 132 | |
| Total current taxes | 531 | | | 542 | | | 777 | |
| | | | | |
| Deferred: | | | | | |
| Federal | 198 | | | (27) | | | 206 | |
| State | (22) | | | (22) | | | (123) | |
| Total deferred taxes | 176 | | | (49) | | | 83 | |
| | | | | |
| Income taxes | $ | 707 | | | $ | 493 | | | $ | 860 | |
During 2024, we recorded a $27 million deferred income tax benefit as a result of a subsidiary restructuring.
Reconciliation of Statutory Rate to Effective Rate
“Income taxes” on the Consolidated Statements of Income differs from the amounts computed by applying the statutory federal corporate tax rate as follows:
| | | | | | | | | | | | | | | | | | | | | | | | | | | | | | | | | | | |
| | 2024 | | 2023 | | 2022 |
| | Amount | | % | | Amount | | % | | Amount | | % |
| | ($ in millions) |
| | | | | | | | | | | |
| Federal income tax at statutory rate | $ | 699 | | | 21.0 | | | $ | 487 | | | 21.0 | | | $ | 867 | | | 21.0 | |
| State income taxes, net of federal tax effect | 66 | | | 2.0 | | | 65 | | | 2.9 | | | 143 | | | 3.5 | |
| Tax credits | (14) | | | (0.4) | | | (27) | | | (1.2) | | | (10) | | | (0.2) | |
| State law changes | (15) | | | (0.4) | | | — | | | — | | | (136) | | | (3.3) | |
| Other, net | (29) | | | (1.0) | | | (32) | | | (1.4) | | | (4) | | | (0.2) | |
| | | | | | | | | | | |
| Income taxes | $ | 707 | | | 21.2 | | | $ | 493 | | | 21.3 | | | $ | 860 | | | 20.8 | |
On July 8, 2022, House Bill 1342 was signed into law in the Commonwealth of Pennsylvania, which reduced its corporate income tax rate from 9.99% to 4.99%, through a series of phased reductions beginning each tax year from January 1, 2023 through January 1, 2031. GAAP requires companies to recognize the effect of tax law changes in the period of enactment. As a result, in 2022, we recognized a $136 million benefit in “Income taxes” with a corresponding reduction in “Deferred income taxes.”
Deferred Tax Assets and Liabilities
Certain items are reported in different periods for financial reporting and income tax purposes. Deferred tax assets and liabilities are recorded in recognition of these differences. The tax effects of temporary differences that give rise to significant portions of the deferred tax assets and deferred tax liabilities are as follows:
| | | | | | | | | | | |
| | December 31, |
| | 2024 | | 2023 |
| | ($ in millions) |
| Deferred tax assets: | | | |
| Accruals, including casualty and other claims | $ | 289 | | | $ | 360 | |
| Compensation and benefits, including postretirement benefits | 21 | | | 55 | |
| Other | 157 | | | 155 | |
| Total gross deferred tax assets | 467 | | | 570 | |
| Less valuation allowance | (42) | | | (31) | |
| Net deferred tax assets | 425 | | | 539 | |
| | | |
| Deferred tax liabilities: | | | |
| Property | (7,397) | | | (7,218) | |
| Other | (448) | | | (546) | |
| Total deferred tax liabilities | (7,845) | | | (7,764) | |
| | | |
| Deferred income taxes | $ | (7,420) | | | $ | (7,225) | |
Except for amounts for which a valuation allowance has been provided, we believe that it is more likely than not that the results of future operations will generate sufficient taxable income to realize the deferred tax assets. The valuation allowance at the end of each year primarily relates to subsidiary state income tax net operating losses and state investment tax credits that may not be utilized prior to their expiration. The total valuation allowance increased by $11 million in 2024, decreased by $10 million in 2023, and decreased by $19 million in 2022.
Uncertain Tax Positions
A reconciliation of the beginning and ending amount of unrecognized tax benefits is as follows:
| | | | | | | | | | | |
| | December 31, |
| | 2024 | | 2023 |
| | ($ in millions) |
| | | |
| Balance at beginning of year | $ | 55 | | | $ | 22 | |
| | | |
| Additions based on tax positions related to the current year | 26 | | | 30 | |
| Additions for tax positions of prior years | 3 | | | 9 | |
| Reductions for tax positions of prior years | (1) | | | (1) | |
| | | |
| Lapse of statutes of limitations | (1) | | | (5) | |
| | | |
| Balance at end of year | $ | 82 | | | $ | 55 | |
Included in the balance of unrecognized tax benefits at December 31, 2024 are potential benefits of $66 million that would affect the effective tax rate if recognized. Unrecognized tax benefits are adjusted in the period in which new information about a tax position becomes available or the final outcome differs from the amount recorded.
The statute of limitations on Internal Revenue Service examinations has expired for all years prior to 2019. Our consolidated federal income tax returns for 2019 through 2021 are currently being audited by the IRS. We anticipate that the IRS will complete its examination in 2025. State income tax returns are generally subject to examination for a period of three to four years after the return. In addition, we are generally obligated to report changes in taxable income arising from federal income tax examinations to the states within a period of up to two years from the date the federal examination is final. We have various state income tax returns either under examination, administrative appeal, or litigation.
6. Fair Value Measurements
FASB Accounting Standards Codification (ASC) 820-10, “Fair Value Measurements,” established a framework for measuring fair value and a fair value hierarchy that prioritizes the inputs to valuation techniques used to measure fair value into three broad levels, as follows:
| | | | | |
| Level 1 | Inputs to the valuation methodology are unadjusted quoted prices for identical assets or liabilities in active markets that we have the ability to access. |
| |
| Level 2 | Inputs to the valuation methodology include: |
| | • quoted prices for similar assets or liabilities in active markets, • quoted prices for identical or similar assets or liabilities in inactive markets, • inputs other than quoted prices that are observable for the asset or liability, and • inputs that are derived principally from or corroborated by observable market data by correlation or other means. |
| |
| | If the asset or liability has a specified (contractual) term, the Level 2 input must be observable for substantially the full term of the asset or liability. |
| |
| Level 3 | Inputs to the valuation methodology are unobservable and significant to the fair value measurement. |
The asset or liability’s fair value measurement level within the hierarchy is based on the lowest level of any input that is significant to the fair value measurement.
Fair Values of Financial Instruments
The fair values of “Cash and cash equivalents,” “Accounts receivable – net,” and “Accounts payable,” approximate carrying values because of the short maturity of these financial instruments. The carrying value of COLI is recorded at cash surrender value and, accordingly, approximates fair value. There are no other assets or liabilities measured at fair value on a recurring basis at December 31, 2024 or 2023. The carrying amounts and estimated fair values, based on Level 1 inputs, of long-term debt consist of the following at December 31:
| | | | | | | | | | | | | | | | | | | | | | | |
| | 2024 | | 2023 |
| Carrying
Amount | | Fair
Value | | Carrying
Amount | | Fair
Value |
| | ($ in millions) |
| | | | | | | |
| Long-term debt, including current maturities | $ | (17,206) | | | $ | (15,656) | | | $ | (17,179) | | | $ | (16,631) | |
7. Investments
| | | | | | | | | | | |
| | December 31, |
| | 2024 | | 2023 |
| | ($ in millions) |
| Long-term investments: | | | |
| Equity method investments: | | | |
| Conrail | $ | 1,748 | | | $ | 1,656 | |
| TTX | 1,013 | | | 964 | |
| Other | 423 | | | 428 | |
| Total equity method investments | 3,184 | | | 3,048 | |
| | | |
| COLI at net cash surrender value | 161 | | | 774 | |
| Other investments | 25 | | | 17 | |
| | | |
| Total long-term investments | $ | 3,370 | | | $ | 3,839 | |
We had $605 million of borrowings against our COLI policies outstanding at December 31, 2024, with no amounts outstanding at December 31, 2023, which are included in the “Investment sales and other transactions” line item within investing activities in the Consolidated Statements of Cash Flows. In January 2025, we repaid all amounts that were borrowed against these policies at December 31, 2024.
Investment in Conrail
Through a limited liability company, we and CSX jointly own Conrail, whose primary subsidiary is CRC. We have a 58% economic and 50% voting interest in the jointly-owned entity, and CSX has the remainder of the economic and voting interests. We are amortizing the excess of the purchase price over Conrail’s net equity using the principles of purchase accounting, based primarily on the estimated useful lives of Conrail’s depreciable property and equipment, including the related deferred tax effect of the differences in book and tax accounting bases for such assets, as all of the purchase price at acquisition was allocable to Conrail’s tangible assets and liabilities. At December 31, 2024, our investment in Conrail exceeds our share of Conrail’s underlying net equity by $469 million.
CRC owns and operates certain properties (the Shared Assets Areas) for the joint and exclusive benefit of NSR and CSX Transportation, Inc. (CSXT). The costs of operating the Shared Assets Areas are borne by NSR and CSXT based on usage. In addition, NSR and CSXT pay CRC a fee for access to the Shared Assets Areas. “Purchased services and rents” and “Fuel” include expenses payable to CRC for operation of the Shared Assets Areas totaling $198 million in 2024, $164 million in 2023, and $156 million in 2022. Future payments for access fees due to CRC under the Shared Assets Areas agreements are as follows: $47 million in each of 2025 through 2028 and $21 million thereafter. We provide certain general and administrative support functions to Conrail, the fees for which are billed in accordance with several service-provider arrangements and approximate $7 million annually.
“Accounts payable” includes $243 million at December 31, 2024, and $198 million at December 31, 2023, due to Conrail for the operation of the Shared Assets Areas. “Other liabilities” includes $534 million at December 31, 2024 and 2023, respectively, for long-term advances from Conrail, maturing in 2050 that bear interest at an average rate of 1.31%.
Our equity in Conrail’s earnings, net of amortization, was $89 million for 2024, $70 million for 2023, and $58 million for 2022. These amounts partially offset the costs of operating the Shared Assets Areas and are included in “Purchased services and rents.” Equity in Conrail’s earnings is included in the “Other – net” line item within operating activities in the Consolidated Statements of Cash Flows.
Investment in TTX
We and six other North American railroads collectively own TTX, a railcar pooling company that provides its owner-railroads with standardized fleets of intermodal, automotive, and general use railcars at stated rates. We have a 19.78% ownership interest in TTX.
Expenses incurred for use of TTX equipment are included in “Purchased services and rents.” This amounted to $295 million, $274 million, and $256 million, respectively, for the years ended December 31, 2024, 2023 and 2022. Our equity in TTX’s earnings partially offsets these costs and totaled $48 million for 2024, $47 million for 2023 and $53 million for 2022. Equity in TTX’s earnings is included in the “Other – net” line item within operating activities in the Consolidated Statements of Cash Flows.
8. Properties
| | | | | | | | | | | | | | | | | | | | | | | |
| | | | Accumulated | | Net Book | | Depreciation |
| December 31, 2024 | Cost | | Depreciation | | Value | | Rate (1) |
| | ($ in millions) | | |
| | | | | | | |
| Land | $ | 4,125 | | | $ | — | | | $ | 4,125 | | | — |
| | | | | | | |
| Roadway: | | | | | | | |
| Rail and other track material | 8,402 | | | (2,098) | | | 6,304 | | | 2.44 | % |
| Ties | 6,450 | | | (1,860) | | | 4,590 | | | 3.35 | % |
| Ballast | 3,339 | | | (1,005) | | | 2,334 | | | 2.73 | % |
| Construction in process | 680 | | | — | | | 680 | | | — |
| Other roadway | 15,038 | | | (4,589) | | | 10,449 | | | 2.73 | % |
| Total roadway | 33,909 | | | (9,552) | | | 24,357 | | | |
| | | | | | | |
| Equipment: | | | | | | | |
| Locomotives | 6,242 | | | (2,180) | | | 4,062 | | | 3.66 | % |
| Freight cars | 2,733 | | | (1,021) | | | 1,712 | | | 2.45 | % |
| Computers and software | 1,149 | | | (570) | | | 579 | | | 9.88 | % |
| Construction in process | 236 | | | — | | | 236 | | | — |
| Other equipment | 1,304 | | | (558) | | | 746 | | | 4.60 | % |
| Total equipment | 11,664 | | | (4,329) | | | 7,335 | | | |
| | | | | | | |
| Other property | 90 | | | (76) | | | 14 | | | 2.48 | % |
| | | | | | | |
| Total properties | $ | 49,788 | | | $ | (13,957) | | | $ | 35,831 | | | |
| | | | | | | | | | | | | | | | | | | | | | | |
| | | | Accumulated | | Net Book | | Depreciation |
| December 31, 2023 | Cost | | Depreciation | | Value | | Rate (1) |
| | ($ in millions) | | |
| | | | | | | |
| Land | $ | 2,439 | | | $ | — | | | $ | 2,439 | | | — |
| | | | | | | |
| Roadway: | | | | | | | |
| Rail and other track material | 8,011 | | | (2,006) | | | 6,005 | | | 2.41 | % |
| Ties | 6,205 | | | (1,773) | | | 4,432 | | | 3.42 | % |
| Ballast | 3,224 | | | (937) | | | 2,287 | | | 2.80 | % |
| Construction in process | 522 | | | — | | | 522 | | | — |
| Other roadway | 14,663 | | | (4,290) | | | 10,373 | | | 2.72 | % |
| Total roadway | 32,625 | | | (9,006) | | | 23,619 | | | |
| | | | | | | |
| Equipment: | | | | | | | |
| Locomotives | 6,091 | | | (2,105) | | | 3,986 | | | 3.64 | % |
| Freight cars | 2,792 | | | (1,037) | | | 1,755 | | | 2.42 | % |
| Computers and software | 1,042 | | | (542) | | | 500 | | | 9.36 | % |
| Construction in process | 271 | | | — | | | 271 | | | — |
| Other equipment | 1,241 | | | (501) | | | 740 | | | 4.61 | % |
| Total equipment | 11,437 | | | (4,185) | | | 7,252 | | | |
| | | | | | | |
| Other property | 90 | | | (74) | | | 16 | | | 2.48 | % |
| | | | | | | |
| Total properties | $ | 46,591 | | | $ | (13,265) | | | $ | 33,326 | | | |
(1)Composite annual depreciation rate for the underlying assets, excluding the effects of the amortization of any deficiency (or excess) that resulted from our depreciation studies.
Acquisition of Assets of Cincinnati Southern Railway
On March 15, 2024, we completed the acquisition of a 337 mile railway line that extends from Cincinnati, Ohio to Chattanooga, Tennessee from the CSR for $1.7 billion. We previously operated this line subject to an operating lease agreement, which was terminated upon the close of the transaction. Lease expense associated with the prior operating lease agreement totaled $5 million, $26 million, and $25 million in 2024, 2023, and 2022, respectively. The purchase price was allocated to the assets acquired in the transaction. The asset purchase is reflected in “Properties less accumulated depreciation” on the Consolidated Balance Sheet and is distinctly identified in the “Cash flows from investing activities” section of the Consolidated Statement of Cash Flows.
Sales of Railway Lines
On September 5, 2024, we consummated a transaction with the VPRA to sell a railway line (“Manassas Line”) to support the expansion of passenger rail service in the Commonwealth of Virginia. The total purchase price to be paid by the VPRA is $357 million and we received $315 million in cash proceeds at closing. The remainder of the proceeds are expected to be received by the end of 2027. The total gain recognized as a result of the transaction was $323 million. Additionally, the VPRA also agreed to exchange a railway line (“V-Line”) in consideration for the land and above ground assets described as the “Seminary Passage.” This transaction closed in November 2024 and
the gain recognized as a result of the transaction was $53 million.
On September 6, 2024, we consummated an agreement with the City of Charlotte to sell a railway line between Charlotte and Mecklenburg County, NC in exchange for $74 million. The cash proceeds from the transaction were received at closing and the transaction resulted in a gain of $57 million.
The gains from these transactions are reflected in “Gains and losses on properties” and cash proceeds are included in “Property sales and other transactions” on the Consolidated Statement of Cash Flows.
Capitalized Interest
Total interest cost incurred on debt was $833 million, $743 million, and $708 million during 2024, 2023, and 2022, respectively, of which $26 million, $21 million, and $16 million was capitalized during 2024, 2023, and 2022, respectively.
9. Current Liabilities
| | | | | | | | | | | |
| | December 31, |
| | 2024 | | 2023 |
| | ($ in millions) |
| Accounts payable: | | | |
| Accounts and wages payable | $ | 985 | | | $ | 997 | |
| Due to Conrail (Note 7) | 243 | | | 198 | |
| Casualty and other claims (Note 18) | 216 | | | 186 | |
| Vacation liability | 146 | | | 144 | |
| Other | 114 | | | 113 | |
| | | |
| Total | $ | 1,704 | | | $ | 1,638 | |
| | | |
| Other current liabilities: | | | |
| Current Eastern Ohio incident liability (Note 18) | $ | 585 | | | $ | 346 | |
| Interest payable | 204 | | | 193 | |
| Current operating lease liability (Note 11) | 81 | | | 105 | |
| Pension benefit obligations (Note 13) | 21 | | | 21 | |
| Other | 58 | | | 63 | |
| | | |
| Total | $ | 949 | | | $ | 728 | |
10. Debt
Debt maturities are presented below:
| | | | | | | | | | | |
| | December 31, |
| | 2024 | | 2023 |
| | ($ in millions) |
| Notes and debentures, with weighted-average interest rates as of December 31, 2024: | | | |
| 4.08% maturing to 2029 | $ | 2,981 | | | $ | 2,981 | |
| 4.33% maturing 2030 to 2034 | 2,883 | | | 2,883 | |
| 4.28% maturing 2037 to 2064 | 10,847 | | | 10,847 | |
| 5.22% maturing 2097 to 2121 | 1,384 | | | 1,384 | |
| Finance leases | 13 | | | 17 | |
| Discounts, premiums, and debt issuance costs | (902) | | | (933) | |
| Total debt | 17,206 | | | 17,179 | |
| | | |
| Less current maturities and short-term debt | (555) | | | (4) | |
| | | |
| Long-term debt excluding current maturities and short-term debt | $ | 16,651 | | | $ | 17,175 | |
| | | | | | | | | | | |
| Long-term debt maturities subsequent to 2025 are as follows: | | | |
| 2026 | | | $ | 602 | |
| 2027 | | | 621 | |
| 2028 | | | 602 | |
| 2029 | | | 610 | |
| 2030 and subsequent years | | | 14,216 | |
| | | | |
| Total | | | $ | 16,651 | |
In June 2024, we entered into an agreement that provides us the ability to issue up to $800 million of unsecured commercial paper and is backed by our credit agreement. The unsecured short-term commercial paper program provides for borrowing at prevailing rates and includes covenants. At December 31, 2024, we had no outstanding commercial paper.
In May 2024, we renewed our accounts receivable securitization program with a maximum borrowing capacity of $400 million. Amounts under our accounts receivable securitization program are borrowed and repaid from time to time in the ordinary course for general corporate and cash management purposes. The term of our accounts receivable securitization program expires in May 2025. Amounts received under this facility are accounted for as borrowings. We had no amounts outstanding under this program and our available borrowing capacity was $400 million at both December 31, 2024, and December 31, 2023. Our accounts receivable securitization program was supported by $790 million and $903 million in receivables at December 31, 2024 and December 31, 2023, respectively, which are included in “Accounts receivable – net.”
Credit Agreement and Debt Covenants
In January 2024, we renewed and amended our $800 million credit agreement. The amended agreement expires in January 2029, and provides for borrowings at prevailing rates and includes covenants. We had no amounts outstanding under this facility at either December 31, 2024 or December 31, 2023, and we are in compliance with all of its covenants.
In January 2024, we entered into a term loan credit agreement that established a 364-day, $1.0 billion, unsecured delayed draw term loan facility under which we could borrow for general corporate purposes. The term loan credit agreement provided for borrowing at prevailing rates and included covenants that align with the $800 million credit agreement. The term loan expired undrawn in October 2024.
11. Leases
We are committed under long-term lease agreements for equipment, lines of road, and other property. We combine lease and non-lease components for new and reassessed leases. Some of these agreements are variable lease agreements that include usage-based payments. These agreements contain payment provisions that depend on an index or rate, initially measured using the index or rate at the lease commencement date, and are therefore not included in our future minimum lease payments. Our long-term lease agreements do not contain any material restrictive covenants.
Our equipment leases have remaining terms of less than 1 year to 7 years and our lines of road and land leases have remaining terms of less than 1 year to 133 years. Some of these leases include options to extend the leases for up to 99 years and some include options to terminate the leases within 30 days. Because we are not reasonably certain to exercise these renewal options, the options are not considered in determining the lease term, and associated payments are excluded from future minimum lease payments.
Leases with an initial term of twelve months or less are not recorded on the balance sheet. We recognize lease expense for these leases on a straight-line basis over the lease term.
Operating lease amounts included on the Consolidated Balance Sheets are as follows:
| | | | | | | | | | | | | | |
| | December 31, |
| | 2024 | | 2023 |
| | ($ in millions) |
| Classification | | | |
| Assets | | | | |
| Right-of-use (ROU) assets | Other assets | $ | 271 | | | $ | 390 | |
| | | | |
| Liabilities | | | | |
| Current lease liabilities | Other current liabilities | $ | 81 | | | $ | 105 | |
| Non-current lease liabilities | Other liabilities | 191 | | | 287 | |
| | | | |
| Total lease liabilities | | $ | 272 | | | $ | 392 | |
The components of total lease expense, primarily included in “Purchased services and rents,” are as follows:
| | | | | | | | | | | | | | | | | |
| 2024 | | 2023 | | 2022 |
| ($ in millions) |
| | | | | |
| Operating lease expense | $ | 102 | | | $ | 115 | | | $ | 101 | |
| Variable lease expense | 84 | | | 84 | | | 55 | |
| Short-term lease expense | 10 | | | 15 | | | 18 | |
| | | | | |
| Total lease expense | $ | 196 | | | $ | 214 | | | $ | 174 | |
In March 2019, we entered into a non-cancellable lease for an office building. In 2021, the construction of the office building was completed, and the lease commenced. The initial lease term is five years with options to renew, purchase, or sell the office building at the end of the lease term. The lease contains a residual value guarantee of up to eighty-three percent of the total construction cost of $499 million.
Other information related to operating leases is as follows:
| | | | | | | | | | | |
| December 31, |
| 2024 | | 2023 |
| | | |
| Weighted-average remaining lease term (years) on operating leases | 6.64 | | 6.12 |
| | | |
| Weighted-average discount rates on operating leases | 3.96 | % | | 3.78 | % |
As the rates implicit in most of our leases are not readily determinable, we use a collateralized incremental borrowing rate based on the information available at the lease commencement date in determining the present value of future payments. We use the portfolio approach and group leases into short-, medium-, and long-term categories, applying the corresponding incremental borrowing rates to these categories.
During 2024 and 2023, respectively, ROU assets obtained in exchange for new operating lease liabilities were $21 million and $65 million, respectively. Cash paid for amounts included in the measurement of lease liabilities was $102 million and $117 million in 2024 and 2023, respectively, and is included in operating cash flows.
Future minimum lease payments under non-cancellable operating leases are as follows:
| | | | | |
| December 31, 2024 |
| ($ in millions) |
| |
| 2025 | $ | 89 | |
| 2026 | 69 | |
| 2027 | 47 | |
| 2028 | 35 | |
| 2029 | 27 | |
| 2030 and subsequent years | 47 | |
| Total lease payments | 314 | |
| Less: Interest | 42 | |
| |
| Present value of lease liabilities | $ | 272 | |
| | | | | |
| December 31, 2023 |
| ($ in millions) |
| |
| 2024 | $ | 116 | |
| 2025 | 105 | |
| 2026 | 85 | |
| 2027 | 42 | |
| 2028 | 30 | |
| 2029 and subsequent years | 66 | |
| Total lease payments | 444 | |
| Less: Interest | 52 | |
| |
| Present value of lease liabilities | $ | 392 | |
12. Other Liabilities
| | | | | | | | | | | |
| | December 31, |
| | 2024 | | 2023 |
| | ($ in millions) |
| | | |
| Long-term advances from Conrail (Note 7) | $ | 534 | | | $ | 534 | |
| Net pension obligations (Note 13) | 252 | | | 279 | |
| Casualty and other claims (Note 18) | 229 | | | 221 | |
| Non-current operating lease liability (Note 11) | 191 | | | 287 | |
| Net other postretirement benefit obligations (Note 13) | 133 | | | 172 | |
| Non-current Eastern Ohio incident liability (Note 18) | 103 | | | 118 | |
| Deferred compensation | 90 | | | 80 | |
| Other | 228 | | | 148 | |
| | | |
| Total | $ | 1,760 | | | $ | 1,839 | |
13. Pensions and Other Postretirement Benefits
We have both funded and unfunded defined benefit pension plans covering eligible employees. We also provide specified health care benefits to eligible retired employees; these plans can be amended or terminated at our option. Under our self-insured retiree health care plan, for those participants who are not Medicare-eligible, certain health care expenses are covered for retired employees and their dependents, reduced by any deductibles, coinsurance, and, in some cases, coverage provided under other group insurance policies. Eligible retired participants and their spouses who are Medicare-eligible are not covered under the self-insured retiree health care plan, but instead are provided with an employer-funded health reimbursement account which can be used for reimbursement of health insurance premiums or eligible out-of-pocket medical expenses.
Pension and Other Postretirement Benefit Obligations and Plan Assets
| | | | | | | | | | | | | | | | | | | | | | | |
| Pension Benefits | | Other Postretirement
Benefits |
| | 2024 | | 2023 | | 2024 | | 2023 |
| | ($ in millions) |
| Change in benefit obligations: | | | | | | | |
| Benefit obligation at beginning of year | $ | 2,151 | | | $ | 2,051 | | | $ | 310 | | | $ | 326 | |
| Service cost | 26 | | | 25 | | | 4 | | | 4 | |
| Interest cost | 107 | | | 108 | | | 15 | | | 17 | |
| Actuarial (gains) losses | (91) | | | 122 | | | (21) | | | 1 | |
| Plan amendments | — | | | — | | | — | | | (5) | |
| Benefits paid | (155) | | | (155) | | | (32) | | | (33) | |
| Curtailment | — | | | — | | | 2 | | | — | |
| Benefit obligation at end of year | 2,038 | | | 2,151 | | | 278 | | | 310 | |
| | | | | | | |
| Change in plan assets: | | | | | | | |
| Fair value of plan assets at beginning of year | 2,503 | | | 2,260 | | | 138 | | | 122 | |
| Actual return on plan assets | 181 | | | 375 | | | 21 | | | 21 | |
| Employer contributions | 22 | | | 23 | | | 18 | | | 28 | |
| Benefits paid | (155) | | | (155) | | | (32) | | | (33) | |
| Fair value of plan assets at end of year | 2,551 | | | 2,503 | | | 145 | | | 138 | |
| | | | | | | |
| Funded status at end of year | $ | 513 | | | $ | 352 | | | $ | (133) | | | $ | (172) | |
| | | | | | | |
| Amounts recognized in the Consolidated Balance Sheets: | | | | | | | |
| Other assets | $ | 786 | | | $ | 652 | | | $ | — | | | $ | — | |
| Other current liabilities | (21) | | | (21) | | | — | | | — | |
| Other liabilities | (252) | | | (279) | | | (133) | | | (172) | |
| | | | | | | |
| Net amount recognized | $ | 513 | | | $ | 352 | | | $ | (133) | | | $ | (172) | |
| | | | | | | |
| Amounts included in accumulated other comprehensive | | | | | | | |
| loss (before tax): | | | | | | | |
| Net (gain) loss | $ | 488 | | | $ | 574 | | | $ | (56) | | | $ | (28) | |
| Prior service benefit | (4) | | | (5) | | | (113) | | | (156) | |
Our accumulated benefit obligation for our defined benefit pension plans is $1.9 billion and $2.0 billion at December 31, 2024 and 2023, respectively. Our unfunded pension plans, included above, which in all cases have no assets, had projected benefit obligations of $273 million and $300 million at December 31, 2024 and 2023, respectively, and had accumulated benefit obligations of $256 million and $273 million at December 31, 2024 and 2023, respectively.
Pension and Other Postretirement Benefit Cost Components
| | | | | | | | | | | | | | | | | |
| | 2024 | | 2023 | | 2022 |
| | ($ in millions) |
| | | | | |
| Pension benefits: | | | | | |
| Service cost | $ | 26 | | | $ | 25 | | | $ | 40 | |
| Interest cost | 107 | | | 108 | | | 67 | |
| Expected return on plan assets | (203) | | | (208) | | | (213) | |
| Amortization of net losses | 17 | | | 4 | | | 49 | |
| Amortization of prior service benefit | (1) | | | (1) | | | — | |
| | | | | |
| Net benefit | $ | (54) | | | $ | (72) | | | $ | (57) | |
| | | | | |
| Other postretirement benefits: | | | | | |
| Service cost | $ | 4 | | | $ | 4 | | | $ | 6 | |
| Interest cost | 15 | | | 17 | | | 9 | |
| Expected return on plan assets | (11) | | | (11) | | | (13) | |
| Amortization of net gains | (1) | | | — | | | — | |
| Amortization of prior service benefit | (23) | | | (26) | | | (25) | |
| Curtailment gain | (20) | | | — | | | — | |
| | | | | |
| Net benefit | $ | (36) | | | $ | (16) | | | $ | (23) | |
The service cost component of defined benefit pension cost and other postretirement benefit cost are reported within “Compensation and benefits” and all other components are presented in “Other income – net” on the Consolidated Statements of Income.
During 2024, we commenced voluntary and involuntary separation programs to reduce our nonagreement workforce. Through these programs, approximately 350 employees were separated from service by May 2024. In accordance with FASB ASC Topic 715, “Compensation-Retirement Benefits,” we evaluated whether a curtailment of our pension and other postretirement benefit plans had occurred. While the reduction in our workforce did not result in a curtailment to our pension benefit plans, a curtailment to our other postretirement benefit plan did occur as the future years of service of plan participants were reduced in excess of 10%. As a result, we recognized a curtailment gain of $20 million in 2024 for the impacted portion of the prior service benefit previously recorded within accumulated other comprehensive loss.
Other Changes in Plan Assets and Benefit Obligations Recognized in Other Comprehensive Income
| | | | | | | | | | | |
| | 2024 |
| Pension
Benefits | | Other
Postretirement
Benefits |
| | ($ in millions) |
| | | |
| Net gains arising during the year | $ | (69) | | | $ | (31) | |
| Amortization of net gains (losses) | (17) | | | 1 | |
| | | |
| Amortization of prior service benefit | 1 | | | 23 | |
| Prior service benefit due to curtailment | — | | | 20 | |
| Effect of curtailment | — | | | 2 | |
| | | |
| Total recognized in other comprehensive income | $ | (85) | | | $ | 15 | |
| | | |
| Total recognized in net periodic cost and other comprehensive income | $ | (139) | | | $ | (21) | |
Net gains arising during the year for both pension benefits and other postretirement benefits were due primarily to an increase in discount rates, in addition to higher actual returns on plan assets for our other postretirement benefit plan assets.
The estimated net losses and prior service credits for the pension plans that will be amortized from accumulated other comprehensive loss into net periodic cost over the next year are $22 million. The estimated prior service benefit and net gains for the other postretirement benefit plans that will be amortized from accumulated other comprehensive loss into net periodic benefit over the next year is $24 million.
Pension and Other Postretirement Benefits Assumptions
Costs for pension and other postretirement benefits are determined based on actuarial valuations that reflect appropriate assumptions as of the measurement date, ordinarily the beginning of each year. The funded status of the plans is determined using appropriate assumptions as of each year end. A summary of the major assumptions follows:
| | | | | | | | | | | | | | | | | |
| | 2024 | | 2023 | | 2022 |
| Pension funded status: | | | | | |
| Discount rate | 5.73 | % | | 5.23 | % | | 5.56 | % |
| Future salary increases | 4.44 | % | | 4.44 | % | | 4.44 | % |
| Other postretirement benefits funded status: | | | | | |
| Discount rate | 5.52 | % | | 5.11 | % | | 5.45 | % |
| Pension cost: | | | | | |
| Discount rate - service cost | 5.41 | % | | 5.75 | % | | 3.25 | % |
| Discount rate - interest cost | 5.10 | % | | 5.40 | % | | 2.45 | % |
| Return on assets in plans | 8.00 | % | | 8.00 | % | | 8.00 | % |
| Future salary increases | 4.44 | % | | 4.44 | % | | 4.44 | % |
| Other postretirement benefits cost: | | | | | |
Discount rate - service cost | 5.81 | % | | 5.56 | % | | 3.01 | % |
| Discount rate - interest cost | 5.58 | % | | 5.23 | % | | 2.13 | % |
| Return on assets in plans | 7.75 | % | | 7.75 | % | | 7.75 | % |
| Health care trend rate | 6.50 | % | | 7.00 | % | | 6.50 | % |
To determine the discount rates used to measure our benefit obligations, we utilize analyses in which the projected annual cash flows from the pension and other postretirement benefit plans were matched with yield curves based on an appropriate universe of high-quality corporate bonds. We use the results of the yield curve analyses to select the discount rates that match the payment streams of the benefits in these plans.
We use a spot rate approach to estimate the service cost and interest cost components of net periodic benefit cost for our pension and other postretirement benefit plans.
Health Care Cost Trend Assumptions
For measurement purposes at December 31, 2024, increases in the per capita cost of pre-Medicare covered health care benefits were assumed to be 6.5% for 2025. We assume the rate will ratably decrease to an ultimate rate of 5.0% for 2031 and remain at that level thereafter.
Asset Management
Twelve investment firms manage our defined benefit pension plan’s assets under investment guidelines approved by our Benefits Investment Committee that is composed of members of our management. Investments are restricted to domestic and international equity securities, domestic and international fixed income securities, and unleveraged exchange-traded options and financial futures. Limitations restrict investment concentration and use of certain derivative investments. The target asset allocation for equity is 75% of the pension plan’s assets. Fixed income investments must consist predominantly of securities rated investment grade or higher. Equity investments must be in liquid securities listed on national exchanges. No investment is permitted in our securities (except through commingled pension trust funds).
Our pension plan’s weighted-average asset allocations, by asset category, were as follows:
| | | | | | | | | | | |
| Percentage of Plan
Assets at December 31, |
| | 2024 | | 2023 |
| | | |
| Domestic equity securities | 52 | % | | 50 | % |
| Debt securities | 25 | % | | 24 | % |
| International equity securities | 22 | % | | 24 | % |
| Cash and cash equivalents | 1 | % | | 2 | % |
| | | |
| Total | 100 | % | | 100 | % |
The other postretirement benefit plan assets consist primarily of trust-owned variable life insurance policies with an asset allocation at December 31, 2024 of 65% in equity securities and 35% in debt securities compared with 66% in equity securities and 34% in debt securities at December 31, 2023. The target asset allocation for equity is between 50% and 75% of the plan’s assets.
The plans’ assumed future returns are based principally on the asset allocations and historical returns for the plans’ asset classes determined from both actual plan returns and, over longer time periods, expected market returns for those asset classes. For 2025, we assume an 8.00% return on pension plan assets.
Fair Value of Plan Assets
The following is a description of the valuation methodologies used for pension plan assets measured at fair value.
Common stock: Shares held by the plan at year end are valued at the official closing price as defined by the exchange or at the most recent trade price of the security at the close of the active market.
Common collective trusts: The readily determinable fair value is based on the published fair value per unit of the trusts. The common collective trusts hold equity securities, fixed income securities and cash and cash equivalents.
Fixed income securities: Valued based on quotes received from independent pricing services or at an estimated price at which a dealer would pay for the security at year end using observable market-based inputs.
Commingled funds: The readily determinable fair value is based on the published fair value per unit of the funds. The commingled funds hold equity securities.
Cash and cash equivalents: Short-term Treasury bills or notes are valued at an estimated price at which a dealer would pay for the security at year end using observable market-based inputs; money market funds are valued at the closing price reported on the active market on which the funds are traded.
The following table sets forth the pension plan’s assets by valuation technique level, within the fair value hierarchy. There were no level 3 valued assets at December 31, 2024 or 2023.
| | | | | | | | | | | | | | | | | |
| | December 31, 2024 |
| | Level 1 | | Level 2 | | Total |
| | ($ in millions) |
| | | | | |
| Common stock | $ | 1,054 | | | $ | — | | | $ | 1,054 | |
| Common collective trusts: | | | | | |
| International equity securities | — | | | 362 | | | 362 | |
| Debt securities | — | | | 637 | | | 637 | |
| Domestic equity securities | — | | | 346 | | | 346 | |
| Fixed income securities: | | | | | |
| Government and agencies securities | — | | | 4 | | | 4 | |
| | | | | |
| | | | | |
| Commingled funds | — | | | 123 | | | 123 | |
| Cash and cash equivalents | 25 | | | — | | | 25 | |
| | | | | |
| | | | | |
| Total investments | $ | 1,079 | | | $ | 1,472 | | | $ | 2,551 | |
| | | | | | | | | | | | | | | | | |
| | December 31, 2023 |
| | Level 1 | | Level 2 | | Total |
| | ($ in millions) |
| | | | | |
| Common stock | $ | 1,192 | | | $ | — | | | $ | 1,192 | |
| Common collective trusts: | | | | | |
| International equity securities | — | | | 371 | | | 371 | |
| Debt securities | — | | | 310 | | | 310 | |
| Domestic equity securities | — | | | 166 | | | 166 | |
| Fixed income securities: | | | | | |
| Government and agencies securities | — | | | 170 | | | 170 | |
| Corporate bonds | — | | | 93 | | | 93 | |
| Mortgage and other asset-backed securities | — | | | 32 | | | 32 | |
| | | | | |
| Commingled funds | — | | | 122 | | | 122 | |
| Cash and cash equivalents | 47 | | | — | | | 47 | |
| | | | | |
| | | | | |
| Total investments | $ | 1,239 | | | $ | 1,264 | | | $ | 2,503 | |
The following is a description of the valuation methodologies used for other postretirement benefit plan assets measured at fair value.
Trust-owned life insurance: Valued at our interest in trust-owned life insurance issued by a major insurance company. The underlying investments owned by the insurance company consist of a U.S. stock account and a U.S. bond account but may retain cash at times as well. The U.S. stock account and U.S. bond account are valued based on readily determinable fair values.
The other postretirement benefit plan assets consisted of trust-owned life insurance with fair values of $145 million and $138 million at December 31, 2024 and 2023, respectively, and are valued under level 2 of the fair value hierarchy. There were no level 1 or level 3 valued assets.
Contributions and Estimated Future Benefit Payments
In 2025, we expect to contribute approximately $21 million to our unfunded pension plans for payments to pensioners and approximately $30 million to our other postretirement benefit plans for retiree health and death benefits. We do not expect to contribute to our funded pension plan in 2025.
Benefit payments, which reflect expected future service, as appropriate, are expected to be paid as follows:
| | | | | | | | | | | |
| Pension
Benefits | | Other Postretirement Benefits |
| | ($ in millions) |
| | | |
| 2025 | $ | 153 | | | $ | 30 | |
| 2026 | 152 | | | 29 | |
| 2027 | 150 | | | 27 | |
| 2028 | 149 | | | 26 | |
| 2029 | 148 | | | 25 | |
| Years 2030 – 2034 | 738 | | | 119 | |
Other Postretirement Coverage
Under collective bargaining agreements, Norfolk Southern and certain subsidiaries participate in a multi-employer benefit plan, which provides certain postretirement health care and life insurance benefits to eligible craft employees. Premiums under this plan are expensed as incurred and totaled $9 million, $11 million, and $13 million in 2024, 2023, and 2022, respectively.
Section 401(k) Plans
Norfolk Southern and certain subsidiaries provide Section 401(k) savings plans for employees. Under the plans, we match a portion of employee contributions, subject to applicable limitations. Our matching contributions, recorded as an expense, totaled $25 million in both 2024 and 2023, and $22 million in 2022.
14. Stock-Based Compensation
Under the stockholder-approved LTIP, the Human Capital Management and Compensation Committee (Committee), which is made up of nonemployee members of the Board, or the Chief Executive Officer (when delegated authority by such Committee), may grant stock options, stock appreciation rights (SARs), restricted stock units (RSUs), restricted shares, performance share units (PSUs), and performance shares, up to a maximum of 104,125,000 shares of our Common Stock, of which 7,438,613 remain available for future grants as of December 31, 2024.
The number of shares remaining for issuance under the LTIP is reduced (i) by 1 for each award granted as a stock option or stock-settled SAR, or (ii) by 1.61 for an award made in the form other than a stock option or stock-settled SAR. Under the Board-approved Thoroughbred Stock Option Plan (TSOP), the Committee may grant stock options up to a maximum of 6,000,000 shares of Common Stock. We use newly issued shares to satisfy any exercises and awards under the LTIP and the TSOP.
The LTIP also permits the payment, on a current or a deferred basis and in cash or in stock, of dividend equivalents on shares of Common Stock covered by stock options, RSUs, or PSUs in an amount commensurate with regular quarterly dividends paid on Common Stock. With respect to stock options, if employment of the participant is terminated for any reason, including retirement, disability, or death, we have no further obligation to make any
dividend equivalent payments. Regarding RSUs, we have no further obligation to make any dividend equivalent payments unless employment of the participant is terminated as a result of qualifying retirement or disability. Should an employee terminate employment, they are not required to forfeit dividend equivalent payments already received. Outstanding PSUs do not receive dividend equivalent payments.
The Committee granted stock options, RSUs, and PSUs pursuant to the LTIP for the last three years as follows:
| | | | | | | | | | | | | | | | | | | | | | | | | | | | | | | | | | | |
| 2024 | | 2023 | | 2022 |
| Granted | | Weighted- Average Grant-Date Fair Value | | Granted | | Weighted- Average Grant-Date Fair Value | | Granted | | Weighted- Average Grant-Date Fair Value |
| Stock options | 107,620 | | $ | 77.38 | | | 69,580 | | $ | 77.60 | | | 140,080 | | $ | 61.32 | |
| RSUs | 280,111 | | 238.28 | | | 214,936 | | 230.12 | | | 180,306 | | 265.21 | |
| PSUs | 64,990 | | 258.60 | | | 59,200 | | 236.16 | | | 58,945 | | 272.22 | |
Recipients of certain RSUs and PSUs pursuant to the LTIP who retire prior to December 31st will forfeit a portion of awards received in the current year. Receipt of certain LTIP awards is contingent on the recipient having executed a non-compete agreement with the company. Forfeitures are recognized as they occur.
We account for our grants of stock options, RSUs, PSUs, and dividend equivalent payments in accordance with FASB ASC 718, “Compensation - Stock Compensation.” Accordingly, all awards result in charges to net income while dividend equivalent payments, which are all related to equity classified awards, are charged to retained income. Compensation cost for the awards is recognized on a straight-line basis over the requisite service period for the entire award. Related compensation costs and tax benefits during the years were:
| | | | | | | | | | | | | | | | | |
| | 2024 | | 2023 | | 2022 |
| | ($ in millions) |
| | | | | |
| Stock-based compensation expense | $ | 40 | | | $ | 40 | | | $ | 53 | |
| Total tax benefit | 11 | | | 15 | | | 27 | |
Stock Options
Option exercise prices will be at least the higher of (i) the average of the high and low prices at which Common Stock is traded on the grant date, or (ii) the closing price of Common Stock on the grant date. All options are subject to a vesting period of at least one year, and the term of the option will not exceed ten years. Holders of the options granted under the LTIP who remain actively employed receive cash dividend equivalent payments for four years in an amount equal to the regular quarterly dividends paid on Common Stock.
For all years prior to 2024, options granted under the LTIP and the TSOP may not be exercised prior to the fourth and third anniversaries of the date of grant, respectively, or if the optionee retires or dies before that anniversary date, may not be exercised before the later of one year after the grant date or the date of the optionee’s retirement or death. Beginning in 2024, a prorated portion of the total LTIP award will vest on the first anniversary of the grant date continuing annually through the fourth anniversary of the grant date.
The fair value of each option awarded was measured on the date of grant using the Black-Scholes valuation model. Expected volatility is based on implied volatility from traded options on, and historical volatility of, Common Stock. Historical data is used to estimate option exercises and employee terminations within the valuation model. Historical exercise data is used to estimate the average expected option term. The average risk-free interest rate is based on the U.S. Treasury yield curve in effect at the time of grant. A dividend yield of zero was used for the LTIP
options during the vesting period. For 2024, 2023, and 2022, a dividend yield of 2.25%, 2.24%, and 1.85%, respectively, was used for the vested period during the remaining expected option term for LTIP options.
The assumptions for the LTIP grants for the last three years are shown in the following table:
| | | | | | | | | | | | | | | | | |
| | 2024 | | 2023 | | 2022 |
| | | | | |
| | | | | |
| Average expected volatility | 28 | % | | 27 | % | | 27 | % |
| Average risk-free interest rate | 3.93 | % | | 3.54 | % | | 1.80 | % |
| Average expected option term | 6.7 years | | 7.0 years | | 6.5 years |
| | | | | |
A summary of changes in stock options is presented below:
| | | | | | | | | | | |
| Stock
Options | | Weighted- Average Exercise Price |
| | | |
| Outstanding at December 31, 2023 | 743,397 | | | $ | 155.17 | |
| Granted | 107,620 | | | 242.06 | |
| Exercised | (348,533) | | | 120.95 | |
| Forfeited | (129,820) | | | 250.29 | |
| | | |
| Outstanding at December 31, 2024 | 372,664 | | | 179.14 | |
The aggregate intrinsic value of options outstanding at December 31, 2024 was $25 million with a weighted-average remaining contractual term of 4.5 years. Of these options outstanding, 247,725 were exercisable and had an aggregate intrinsic value of $25 million with a weighted-average exercise price of $141.19 and a weighted-average remaining contractual term of 2.7 years.
The following table provides information related to options exercised for the last three years:
| | | | | | | | | | | | | | | | | |
| | 2024 | | 2023 | | 2022 |
| | ($ in millions) |
| | | | | |
| Options exercised | 348,533 | | | 206,016 | | | 307,660 | |
| Total intrinsic value | $ | 46 | | | $ | 27 | | | $ | 54 | |
| Cash received upon exercise | 41 | | | 19 | | | 25 | |
| Related tax benefits realized | 8 | | | 6 | | | 12 | |
At December 31, 2024, total unrecognized compensation related to options granted under the LTIP was $3 million, and is expected to be recognized over a weighted-average period of approximately 2.6 years.
Restricted Stock Units
RSUs granted primarily have a four-year ratable restriction period and will be settled through the issuance of shares of Common Stock. Certain RSU grants include cash dividend equivalent payments during the restriction period in an amount equal to regular quarterly dividends paid on Common Stock. The fair value of each RSU was measured on the date of grant as the average of the high and low prices at which Common Stock is traded on the grant date, adjusted for the impact of dividend equivalent payments as applicable.
| | | | | | | | | | | | | | | | | |
| | 2024 | | 2023 | | 2022 |
| | ($ in millions) |
| | | | | |
| RSUs vested | 171,620 | | | 157,417 | | | 249,138 | |
| Common Stock issued net of tax withholding | 118,365 | | | 110,069 | | | 175,781 | |
| Related tax benefits realized | $ | 1 | | | $ | 1 | | | $ | 5 | |
A summary of changes in RSUs is presented below:
| | | | | | | | | | | |
| RSUs | | Weighted-
Average
Grant-Date
Fair Value |
| | | |
| Nonvested at December 31, 2023 | 433,858 | | | $ | 239.21 | |
| Granted | 280,111 | | | 238.28 | |
| Vested | (171,620) | | | 234.80 | |
| Forfeited | (73,480) | | | 235.84 | |
| | | |
| Nonvested at December 31, 2024 | 468,869 | | | 240.80 | |
At December 31, 2024, total unrecognized compensation related to RSUs was $52 million and is expected to be recognized over a weighted-average period of approximately 2.6 years.
Performance Share Units
PSUs provide for awards based on the achievement of certain predetermined corporate performance goals at the end of a three-year cycle and are settled through the issuance of shares of Common Stock. All PSUs will earn out based on the achievement of performance conditions and some will also earn out based on a market condition. The market condition fair value was measured on the date of grant using a Monte Carlo simulation model.
| | | | | | | | | | | | | | | | | |
| | 2024 | | 2023 | | 2022 |
| | ($ in millions) |
| | | | | |
| PSUs earned | 41,580 | | | 58,599 | | | 86,420 | |
| Common Stock issued net of tax withholding | 26,056 | | | 40,255 | | | 54,651 | |
| Related tax benefits realized | $ | — | | | $ | — | | | $ | 1 | |
A summary of changes in PSUs is presented below:
| | | | | | | | | | | |
| PSUs | | Weighted-
Average
Grant-Date
Fair Value |
| | | |
| Balance at December 31, 2023 | 136,709 | | | $ | 247.28 | |
| Granted | 64,990 | | | 258.60 | |
| Earned | (41,580) | | | 240.64 | |
| Forfeited | (85,095) | | | 251.40 | |
| | | |
| Balance at December 31, 2024 | 75,024 | | | 256.08 | |
At December 31, 2024, total unrecognized compensation related to PSUs granted under the LTIP was $2 million and is expected to be recognized over a weighted-average period of approximately 1.9 years.
Shares Available and Issued
Shares of Common Stock available for future grants and issued in connection with all features of the LTIP and the TSOP at December 31, were as follows:
| | | | | | | | | | | | | | | | | |
| | 2024 | | 2023 | | 2022 |
| Available for future grants: | | | | | |
| LTIP | 7,438,613 | | | 7,731,573 | | | 8,238,993 | |
| TSOP | 437,746 | | | 436,571 | | | 436,402 | |
| Issued: | | | | | |
| LTIP | 444,189 | | | 315,700 | | | 503,090 | |
| TSOP | 48,765 | | | 40,640 | | | 35,002 | |
15. Stockholders’ Equity
Common Stock
Common Stock is reported net of shares held by our consolidated subsidiaries (Treasury Shares). Treasury Shares at December 31, 2024 and 2023 amounted to 20,320,777, with a cost of $19 million at both dates.
Accumulated Other Comprehensive Loss
The components of “Other comprehensive income” reported in the Consolidated Statements of Comprehensive Income and changes in the cumulative balances of “Accumulated other comprehensive loss” reported in the Consolidated Balance Sheets consisted of the following:
| | | | | | | | | | | | | | | | | | | | | | | |
| Balance
at Beginning
of Year | | Net Income | | Reclassification
Adjustments | | Balance
at End
of Year |
| | ($ in millions) |
| Year ended December 31, 2024 | | | | | | | |
| | | | | | | |
| Pensions and other postretirement liabilities | $ | (292) | | | $ | 74 | | | $ | (22) | | | $ | (240) | |
| Other comprehensive income of equity investees | (28) | | | 6 | | | — | | | (22) | |
| | | | | | | |
| Accumulated other comprehensive loss | $ | (320) | | | $ | 80 | | | $ | (22) | | | $ | (262) | |
| | | | | | | |
| Year ended December 31, 2023 | | | | | | | |
| | | | | | | |
| Pensions and other postretirement liabilities | $ | (319) | | | $ | 44 | | | $ | (17) | | | $ | (292) | |
| Other comprehensive income of equity investees | (32) | | | 4 | | | — | | | (28) | |
| | | | | | | |
| Accumulated other comprehensive loss | $ | (351) | | | $ | 48 | | | $ | (17) | | | $ | (320) | |
Other Comprehensive Income
“Other comprehensive income” reported in the Consolidated Statements of Comprehensive Income consisted of the following:
| | | | | | | | | | | | | | | | | |
| Pretax
Amount | | Tax
(Expense)
Benefit | | Net-of-Tax
Amount |
| | ($ in millions) |
| Year ended December 31, 2024 | | | | | |
| Net gain arising during the year: | | | | | |
| Pensions and other postretirement benefits | $ | 98 | | | $ | (24) | | | $ | 74 | |
| Reclassification adjustments for costs included in net income | (28) | | | 6 | | | (22) | |
| | | | | |
| Subtotal | 70 | | | (18) | | | 52 | |
| | | | | |
| Other comprehensive income of equity investees | 7 | | | (1) | | | 6 | |
| | | | | |
| Other comprehensive income | $ | 77 | | | $ | (19) | | | $ | 58 | |
| | | | | |
| Year ended December 31, 2023 | | | | | |
| Net gain arising during the year: | | | | | |
| Pensions and other postretirement benefits | $ | 59 | | | $ | (15) | | | $ | 44 | |
| Reclassification adjustments for costs included in net income | (23) | | | 6 | | | (17) | |
| | | | | |
| Subtotal | 36 | | | (9) | | | 27 | |
| | | | | |
| Other comprehensive income of equity investees | 4 | | | — | | | 4 | |
| | | | | |
| Other comprehensive income | $ | 40 | | | $ | (9) | | | $ | 31 | |
| | | | | |
| Year ended December 31, 2022 | | | | | |
| Net gain arising during the year: | | | | | |
| Pensions and other postretirement benefits | $ | 27 | | | $ | (7) | | | $ | 20 | |
| Reclassification adjustments for costs included in net income | 24 | | | (7) | | | 17 | |
| | | | | |
| Subtotal | 51 | | | (14) | | | 37 | |
| | | | | |
| Other comprehensive income of equity investees | 17 | | | (3) | | | 14 | |
| | | | | |
| Other comprehensive income | $ | 68 | | | $ | (17) | | | $ | 51 | |
16. Stock Repurchase Programs
We did not repurchase any shares of Common Stock under our stock repurchase program in 2024, while we repurchased and retired 2.8 million and 12.6 million shares of Common Stock under our stock repurchase programs in 2023 and 2022, respectively, at a cost of $627 million and $3.1 billion, respectively, inclusive of excise taxes.
On March 29, 2022, our Board of Directors authorized a new program for the repurchase of up to $10.0 billion of
Common Stock beginning April 1, 2022. As of December 31, 2024, $6.9 billion remains authorized for repurchase. Our previous share repurchase program terminated on March 31, 2022.
17. Earnings Per Share
The following table sets forth the calculation of basic and diluted earnings per share:
| | | | | | | | | | | | | | | | | | | | | | | | | | | | | | | | | | | |
| | Basic | | Diluted |
| | 2024 | | 2023 | | 2022 | | 2024 | | 2023 | | 2022 |
| | ($ in millions except per share amounts, shares in millions) |
| | | | | | | | | | | |
| Net income | $ | 2,622 | | | $ | 1,827 | | | $ | 3,270 | | | $ | 2,622 | | | $ | 1,827 | | | $ | 3,270 | |
| Dividend equivalent payments | (3) | | | (3) | | | (2) | | | (2) | | | (3) | | | (1) | |
| | | | | | | | | | | |
| Income available to common stockholders | $ | 2,619 | | | $ | 1,824 | | | $ | 3,268 | | | $ | 2,620 | | | $ | 1,824 | | | $ | 3,269 | |
| | | | | | | | | | | |
| Weighted-average shares outstanding | 226.1 | | | 226.9 | | | 234.8 | | | 226.1 | | | 226.9 | | | 234.8 | |
| Dilutive effect of outstanding options | | | | | | | | | | | |
| and share-settled awards | | | | | | | 0.3 | | | 0.5 | | | 0.8 | |
| Adjusted weighted-average shares outstanding | | | | | | | 226.4 | | | 227.4 | | | 235.6 | |
| | | | | | | | | | | |
| Earnings per share | $ | 11.58 | | | $ | 8.04 | | | $ | 13.92 | | | $ | 11.57 | | | $ | 8.02 | | | $ | 13.88 | |
In each year, dividend equivalent payments were made to certain holders of stock options and RSUs. For purposes of computing basic earnings per share, dividend equivalent payments made to holders of stock options and RSUs were deducted from net income to determine income available to common stockholders. For purposes of computing diluted earnings per share, we evaluate on a grant-by-grant basis those stock options and RSUs receiving dividend equivalent payments under the two-class and treasury stock methods to determine which method is more dilutive for each grant. For those grants for which the two-class method was more dilutive, net income was reduced by dividend equivalent payments to determine income available to common stockholders. The dilution calculations exclude options having exercise prices exceeding the average market price of Common Stock as follows: 0.1 million for the years ended December 31, 2024, 2023, and 2022.
18. Commitments and Contingencies
Eastern Ohio Incident
Summary
On February 3, 2023, a train operated by us derailed in East Palestine, Ohio. The derailed equipment included 38 railcars, 11 of which were non-Company-owned tank cars containing hazardous materials. Fires associated with the derailment threatened certain tank cars. There was concern that the pressure inside of the tank cars carrying vinyl chloride was rising and that the pressure relief devices were no longer functioning properly, which would have
posed the risk of a catastrophic explosion. As a consequence, on February 6, 2023, the local incident commander (the East Palestine Fire Chief)—in consultation with the incident command that included, among others, federal, state and local officials and Norfolk Southern—opted to conduct a controlled vent and burn of five derailed tank cars, all of which contained vinyl chloride. This procedure involved creating holes in the five tank cars to drain the vinyl chloride into adjacent trenches that had been dug into the ground where the vinyl chloride was ignited and burned. Any remaining materials released from the derailment or during the vent and burn have been or are being remediated. The February 3rd derailment, the associated fire, and the resulting vent and burn of the tank cars containing vinyl chloride on February 6th is hereinafter referred to as the “Incident.”
In response to the Incident, we have been working to clean the site safely and thoroughly, including those activities described in the Environmental Matters section below with respect to potentially impacted air, soil, and water and to monitor for any impact on public health and the environment. We are working with federal, state, and local officials to mitigate impacts from the Incident, including, among other efforts, conducting environmental monitoring and clean-up activities (as more fully described below), and operating a field office to provide support to members of East Palestine and the surrounding communities.
Financial Impact
Although we cannot predict the final outcome or estimate the reasonably possible range of loss related to the Incident with certainty, we have accrued amounts for probable and reasonably estimable liabilities for those environmental and non-environmental matters described below. Certain costs incurred thus far and related to the Incident may be recoverable under our insurance policies in effect at the date of the Incident or from third parties. For additional information about our insurance coverage, see “Insurance” below. Any additional amounts recoverable under our insurance policies or from third parties will be reflected in future periods when recovery is considered probable.
Amounts recorded related to the Incident, including outstanding liabilities at the end of each year, are summarized in the table below. Our current estimates of probable and reasonably estimable liabilities principally associated with environmental matters and legal proceedings are discussed in further detail below.
| | | | | | | | | | | | | | | | | | | | | | | | | | | | | | | | |
| | Environmental Matters | | Legal Contingencies and Other | | Total | | Insurance Recoveries | | Total - Net of Recoveries |
| | ($ in millions) |
| At December 31, 2022 | | $ | — | | | $ | — | | | $ | — | | | $ | — | | | $ | — | |
| Expense/(Recoveries) | | 836 | | | 381 | | | 1,217 | | | (101) | | | 1,116 | |
| (Payments)/Receipts | | (517) | | | (236) | | | (753) | | | 101 | | | (652) | |
| At December 31, 2023 | | $ | 319 | | | $ | 145 | | | $ | 464 | | | $ | — | | | $ | 464 | |
| Expense/(Recoveries) | | 190 | | | 785 | | | 975 | | | (650) | | | 325 | |
| (Payments)/Receipts | | (265) | | | (486) | | | (751) | | | 632 | | | (119) | |
| At December 31, 2024 | | $ | 244 | | | $ | 444 | | | $ | 688 | | | $ | (18) | | | $ | 670 | |
At December 31, 2024 and December 31, 2023, we have also recorded a deferred tax asset (Note 5) of $211 million and $249 million, respectively, related to the Incident expecting that certain expenses will be deductible for tax purposes in future periods or offset with insurance recoveries.
Environmental Matters – In response to the Incident, we have been working with federal, state, and local officials such as the U.S. Environmental Protection Agency (EPA), the Ohio EPA, the Pennsylvania Department of Environmental Protection (DEP), and the Columbiana County Health District to conduct environmental response and remediation activities, some of which have concluded and some which are continuing, including but not limited to, excavating and disposing of potentially affected soil (based on
sampling results), air monitoring, indoor air quality screenings, municipal water and private water well testing, residential, commercial, and agricultural soil sampling, surface water and groundwater sampling, re-routing a local waterway around the affected site, and capturing and shipping stormwater that enters the impacted derailment site to proper disposal facilities. The EPA issued a Unilateral Administrative Order (UAO) on February 21, 2023, containing various requirements, including the submission of numerous work plans to assess and remediate various environmental media and performance of certain removal actions at the affected site. On February 24, 2023, we submitted to the EPA our Notice of Intent to Comply with the UAO. We continue to conduct environmental assessment and remediation activities pursuant to the UAO and the directives issued thereunder, including sampling and excavating soil (if needed based on sampling results) at the affected site, including areas beneath our tracks. On October 18, 2023, the U.S. EPA issued a second unilateral order under Section 311(c) of the Clean Water Act (CWA Order), requiring preparation of additional environmental work plans to address local waterways. We timely submitted our Notice of Intent to Comply with the CWA Order and continue to complete environmental assessment and remediation as required by the EPA, as well as state agencies, in compliance with the CWA Order. Once approved by the court, the proposed Consent Decree (discussed below) will supersede the UAO and CWA Order.
We are also subject to the following legal proceedings that principally relate to the environmental impact of the Incident:
•The U.S. DOJ filed a civil complaint on behalf of the U.S. EPA (the DOJ Complaint) in the Northern District of Ohio (Eastern Division) seeking injunctive relief and civil penalties for alleged violations of the CWA and cost recovery under the Comprehensive Environmental Response, Compensation, and Liability Act (CERCLA). The Ohio Attorney General (AG) also filed a lawsuit (the Ohio Complaint) in the Northern District of Ohio (Eastern Division) seeking damages for a variety of common law and environmental statutory claims under CERCLA and various state laws. The DOJ and Ohio AG cases have been consolidated for discovery purposes. We have filed an answer, and discovery is ongoing in the Ohio AG case. On June 30, 2023, we filed third-party claims against certain railcar defendants and shippers involved in the Incident. The Court dismissed the third party claims on March 6, 2024, and on March 26, 2024, we filed a motion requesting the Court to enter partial final judgment as to the third party claims. On May 23, 2024, DOJ and the Company reached a settlement to resolve all of the government’s civil claims against the Company related to the Incident, and jointly lodged a proposed Consent Decree with the court. As proposed, the Consent Decree will require the Company to pay for the federal government’s oversight costs of $57 million through November 30, 2023 as well as additional oversight costs from December 1, 2023 until the remediation is complete. The proposed Consent Decree also requires the Company to pay a civil penalty of $15 million for alleged violations of the CWA. Other provisions of the proposed Consent Decree relate to injunctive relief for safety, community support including medical and mental health programs, and environmental support, which provisions, if approved by the court, will be in effect between five years to twenty years. The proposed Consent Decree was subject to a mandatory public comment period, which ended on August 2, 2024, and DOJ filed a motion on October 10, 2024 seeking entry of the Consent Decree. The Ohio AG did not join this settlement and its claims remain outstanding and are proceeding.
In accordance with FASB ASC 410-30 “Environmental Liabilities,” we have recognized probable and reasonably estimable liabilities in connection with the foregoing environmental matters. Our current estimate includes ongoing and future environmental cleanup activities and remediation efforts, governmental oversight costs (including those incurred by the EPA and the Ohio EPA), and other related costs, including those in connection with the proposed DOJ Consent Decree (including civil penalties related to alleged violations of the CWA). Our current estimates of future environmental cleanup and remediation liabilities related to the Incident may change over time due to various factors, including but not limited to, the nature and extent of required future cleanup and removal activities (including those resulting from soil, water, and sediment remediation activities that are currently being, and will continue to be, conducted at the site), and the extent and duration of governmental oversight, amongst other factors. As
clean-up efforts progress and more information is available, we will review these estimates and revise as appropriate.
Legal Proceedings and Claims (Non-Environmental) – To date, numerous non-environmental legal actions have commenced with respect to the Incident, including those more specifically set forth below.
•There is a consolidated putative class action pending in the Northern District of Ohio (Eastern Division) (the Ohio Class Action) in which plaintiffs allege various claims, including negligence, gross negligence, strict liability, and nuisance, and seeking as relief compensatory and punitive damages, medical monitoring and business losses. On July 12, 2023, we filed a third-party complaint bringing in multiple parties involved in the Incident. Fact discovery ended on February 5, 2024. The Court denied in part and granted in part all motions to dismiss, as to the plaintiffs’ case and as to our third-party complaint, on March 13, 2024. On April 26, 2024, we entered into a class action settlement with the plaintiffs to resolve the Ohio Class Action for $600 million. The settlement agreement resolves all class action claims within a 20-mile radius from the derailment and, for those residents who choose to participate, personal injury claims within a 10-mile radius from the derailment. The settlement agreement does not resolve, and expressly preserves, our third-party claims in the third-party complaint. The district court granted final approval of the settlement on September 27, 2024, which was subsequently appealed. We made a partial payment of the settlement in 2024, in the amount of $315 million. Payment of the remaining balance, including timing, is dependent upon resolution of any appeals to the settlement.
Another putative class action is pending in the Western District of Pennsylvania, brought by Pennsylvania school districts and students. On August 22, 2023, six Pennsylvania school districts and students filed a putative class action lawsuit alleging negligence, strict liability, nuisance, and trespass, and seeking damages and health monitoring. On December 8, 2023, the school districts amended their complaint to add additional companies as defendants in the action. On February 23, 2024, we and the other defendants filed motions to dismiss and those motions are fully briefed and currently pending before the court. Combined with the Ohio Class Action, these lawsuits are collectively referred to herein as the Incident Lawsuits.
In accordance with FASB ASC 450, “Contingencies,” as of December 31, 2024 and December 31, 2023, we had accruals for probable and reasonably estimable liabilities principally associated with the Incident Lawsuits and related contingencies of $369 million and $82 million, respectively. For the reasons set forth below, our estimated loss or range of loss with respect to the Incident Lawsuits may change from time to time, and it is reasonably possible that we will incur actual losses in excess of the amounts currently accrued and such additional amounts may be material. While we continue to work with parties with respect to potential resolution, no assurance can be given that we will be successful in doing so and we cannot predict the outcome of these matters.
•We have received securities and derivative litigation and multiple shareholder document and litigation demand letters, including a securities class action lawsuit under the Securities Exchange Act of 1934 (Exchange Act) initially filed in the Southern District of Ohio alleging multiple securities law violations but since transferred to the Northern District of Georgia, a securities class action lawsuit under the Securities Act of 1933 (Securities Act) filed in the Southern District of New York alleging misstatements in association with our debt offerings, and six shareholder derivative complaints filed in Virginia state court asserting claims for breach of fiduciary duties, waste of corporate assets, and unjust enrichment in connection with safety of the Company’s operations, among other claims (collectively, the Shareholder Matters). On February 2, 2024, defendants filed a motion to dismiss the complaint in the Securities Act lawsuit, and on July 26, 2024, the magistrate judge issued a Report and Recommendation to the district judge, recommending that the defendants’ motion to dismiss be granted in part and denied in part. Defendants’ objections to the Report and Recommendation were filed on August 9, 2024, and
plaintiffs’ response to defendants’ objections were filed on August 23, 2024. A decision on the motion to dismiss remains pending. The plaintiffs filed an amended complaint in the Exchange Act lawsuit on April 25, 2024, and the defendants filed a motion to dismiss on June 24, 2024. A decision on the motion to dismiss remains pending. No responsive pleadings have been filed yet with respect to the other Shareholder Matters.
•We are also named as a defendant in various other Incident-related lawsuits involving other potentially affected third parties, some of which were filed on or around February 3, 2025. We are continuing to assess the claims and any potential impact on the Company.
With respect to the Incident-related litigation and regulatory matters, we record a liability for loss contingencies through a charge to earnings when we conclude that it is probable that a liability has been incurred and the amount of the liability can be reasonably estimated and disclose such liability if we conclude it to be material. Any adjustments to the recorded liability will be reflected in earnings in the periods in which such adjustments become known. Because the final outcome of any of these legal proceedings cannot be predicted with certainty, developments related to the progress of such legal proceedings or other unfavorable or unexpected developments or outcomes could result in additional costs or new or additionally accrued amounts that could be material to our results of operations in a particular year or quarter. In addition, if it is reasonably possible that we will incur Incident-related losses in excess of the amounts currently recorded as a loss contingency, we disclose the potential range of loss, if reasonably estimable, or we disclose that we cannot reasonably estimate such an amount at this time. For Incident-related litigation and regulatory matters where a loss may be reasonably possible, but not probable, or probable but not reasonably estimable, no accrual is established but the matter, if potentially material, is disclosed.
Our estimates of probable losses and reasonably possible losses are based upon currently available information and involve significant judgement and a variety of assumptions, given that (1) certain legal and regulatory proceedings are in early stages; (2) discovery may not be completed; (3) damages sought in these legal and regulatory proceedings can be unsubstantiated or indeterminate; (4) there are often significant facts in dispute; and/or (5) there is a wide range of possible outcomes. Accordingly, our estimated range of loss with respect to these matters may change from time to time, and actual losses may exceed current estimates. At this time, we are unable to estimate the possible loss or range of loss in excess of the amounts accrued with respect to the matters described above.
The amounts recorded do not include any estimate of loss for which we believe a loss is either not probable or not reasonably estimable for any fines or penalties (in excess of the liabilities established for CWA-related civil penalties) that may be imposed as a result of the Incident Inquiries and Investigations, as more specifically set forth and defined below (the outcome of which are uncertain at this time).
Inquiries and Investigations
As set forth above, we are subject to inquiries and investigations by numerous federal, state, and local government authorities and regulatory agencies regarding the Incident, including but not limited to, the NTSB, the FRA, the Occupational Safety and Health Administration, the Ohio AG, and the Pennsylvania AG. Further details regarding the NTSB and FRA investigations are set forth below. We are cooperating with all pending inquiries and investigations, including responding to civil and criminal subpoenas and other requests for information (the aforementioned inquiries and investigations, as well as the civil and criminal subpoenas are collectively referred to herein as the Incident Inquiries and Investigations). Aside from the FRA Safety Assessment (defined and described below), the outcome of any current or future Incident Inquiries and Investigations is uncertain at this time, including any related fines, penalties or settlements. Therefore, our accruals for probable and reasonably estimable liabilities related to the Incident do not include estimates of the total amount that we may incur for any such fines, penalties or settlements.
Subsequent to the Incident, investigators from the NTSB examined railroad equipment and track conditions; reviewed data from the signal system, wayside defect detectors, local surveillance cameras, and the lead locomotive’s event recorder and forward-facing and inward-facing image recorders; and completed certain interviews (the NTSB Investigation). The NTSB concluded its investigation and adopted a final investigative report on June 25, 2024, then issued the final public report on July 12, 2024. The NTSB found that the probable cause of the derailment was the failure of a bearing which overheated and caused the axle to separate, derailing the train and leading to a post-derailment fire. The NTSB issued over 30 recommendations, of which four were issued to Norfolk Southern. The NTSB continues to work on a safety culture investigation, and a report on this part of the investigation is expected to be issued in the spring of 2025.
Concurrent with the NTSB Investigation, the FRA also investigated the Incident. Similar in scope to the NTSB Investigation, the FRA examined railroad equipment, track conditions, hazardous materials train placement and routing, and emergency response (the FRA Incident Investigation). The FRA Incident Investigation will likely result in the assessment of civil penalties, though the amount and materiality of these penalties cannot be reasonably estimated at this time. In addition to the FRA Incident Investigation, the FRA completed a 60-day supplemental safety assessment (the FRA Safety Assessment). The FRA Safety Assessment included a review of findings from a previously completed 2022 system audit and an assessment of operational elements including, but not limited to: track, signal, and rolling stock maintenance, inspection and repair practices; protection of employees; communications between transportation departments and mechanical and engineering staff; operation control center procedures and dispatcher training. The overall scope of the FRA Safety Assessment was to examine our safety culture. The FRA issued a public report in early August 2023 which included its findings and related corrective actions. We have launched initiatives to implement all of these items, and will monitor progress on these initiatives going forward.
Other Commitments and Contingencies
Lawsuits
We and/or certain subsidiaries are defendants in numerous lawsuits and other claims relating principally to railroad operations. When we conclude that it is probable that a liability has been incurred and the amount of the liability can be reasonably estimated, it is accrued through a charge to earnings and, if material, disclosed below. While the ultimate amount of liability incurred in any of these lawsuits and claims is dependent on future developments, in our opinion, the recorded liability is adequate to cover the future payment of such liability and claims. However, the final outcome of any of these lawsuits and claims cannot be predicted with certainty, and unfavorable or unexpected outcomes could result in additional accruals that could be significant to results of operations in a particular year or quarter. Any adjustments to the recorded liability will be reflected in earnings in the periods in which such adjustments become known. For lawsuits and other claims where a loss may be reasonably possible, but not probable, or is probable but not reasonably estimable, no accrual is established but the matter, if potentially material, is disclosed below. We routinely review relevant information with respect to our lawsuits and other claims and update our accruals, disclosures and estimates of reasonably possible loss based on such reviews.
In 2007, various antitrust class actions filed against us and other Class I railroads in various Federal district courts regarding fuel surcharges were consolidated in the District of Columbia by the Judicial Panel on Multidistrict Litigation. In 2012, the court certified the case as a class action. The defendant railroads appealed this certification, and the Court of Appeals for the District of Columbia vacated the District Court’s decision and remanded the case for further consideration. On October 10, 2017, the District Court denied class certification. The decision was upheld by the Court of Appeals on August 16, 2019. Since that decision, various individual cases have been filed in multiple jurisdictions and also consolidated in the District of Columbia. We intend to vigorously defend the cases and we believe that we will prevail. However, given that litigation is inherently unpredictable and subject to uncertainties, there can be no assurances that the final resolution of the litigation will not be material. At this time, we cannot reasonably estimate the potential loss or range of loss associated with this matter.
In 2018, a lawsuit was filed against one of our subsidiaries by the minority owner in a jointly-owned terminal railroad company in which our subsidiary has the majority ownership. The lawsuit alleged violations of various state laws and federal antitrust laws. On January 3, 2023, the court granted summary judgment to us on all of the compensatory claims but denied summary judgment for all equitable relief claims. On January 18, 2023, the court dismissed the federal equitable relief claims, leaving the state equitable relief claims as the sole remaining issue under consideration. On April 19, 2023, the court disposed of all remaining state equitable relief claims. On August 29, 2024, the United States Court of Appeals for the Fourth Circuit affirmed the opinion of the lower court. We will continue to vigorously defend the lawsuit and, although it is reasonably possible we could incur a loss in the case, we believe that we will prevail. However, given that litigation is inherently unpredictable and subject to uncertainties, there can be no assurances that the final outcome of the litigation (including the related appeal) will not be material. Until such appeal is final, we cannot reasonably estimate the potential loss or range of loss associated with this matter.
Casualty Claims
Casualty claims include employee personal injury and occupational claims as well as third-party claims, all exclusive of legal costs. To aid in valuing our personal injury liability and determining the amount to accrue with respect to such claims during the year, we utilize studies prepared by an independent consulting actuarial firm. Job-related personal injury and occupational claims are subject to the FELA, which is applicable only to railroads. The variability inherent in FELA’s fault-based tort system could result in actual costs being different from the liability recorded. While the ultimate amount of claims incurred is dependent on future developments, in our opinion, the recorded liability is adequate to cover the future payments of claims and is supported by the most recent actuarial study. In all cases, we record a liability when the expected loss for the claim is both probable and reasonably estimable.
Employee personal injury claims – Other than Incident-related matters noted above, the largest component of claims expense is employee personal injury costs. The independent actuarial firm we engage provides quarterly studies to aid in valuing our employee personal injury liability and estimating personal injury expense. The actuarial firm studies our historical patterns of reserving for claims and subsequent settlements, taking into account relevant outside influences. The actuarial firm provides the results of these analyses to aid in our estimate of the ultimate amount of liability. We adjust the liability quarterly based upon our assessment and the results of the study. The accuracy of our estimate of the liability is subject to inherent limitation given the difficulty of predicting future events such as jury decisions, court interpretations, or legislative changes. As a result, actual claim settlements may vary from the estimated liability recorded.
Occupational claims – Occupational claims include injuries and illnesses alleged to be caused by exposures which occur over time as opposed to injuries or illnesses caused by a specific accident or event. Types of occupational claims commonly seen allege exposure to asbestos and other claimed toxic substances resulting in respiratory diseases or cancer. Many such claims are being asserted by former or retired employees, some of whom have not been employed in the rail industry for decades. The independent actuarial firm provides an estimate of the occupational claims liability based upon our history of claim filings, severity, payments, and other pertinent facts. The liability is dependent upon judgments we make as to the specific case reserves as well as judgments of the actuarial firm in the quarterly studies. Our estimate of ultimate loss includes a provision for those claims that have been incurred but not reported. This provision is derived by analyzing industry data and projecting our experience. We adjust the liability quarterly based upon our assessment and the results of the study. However, it is possible that the recorded liability may not be adequate to cover the future payment of claims. Adjustments to the recorded liability are reflected in operating expenses in the periods in which such adjustments become known.
Third-party claims – We record a liability for third-party claims including those for highway crossing accidents, trespasser and other injuries, property damage, and lading damage. The actuarial firm assists us with the calculation of potential liability for third-party claims, except lading damage, based upon our experience including the number and timing of incidents, amount of payments, settlement rates, number of open claims, and legal defenses. We adjust the liability quarterly based upon our assessment and the results of the study. Given the inherent uncertainty
in regard to the ultimate outcome of third-party claims, it is possible that the actual loss may differ from the estimated liability recorded.
Environmental Matters
We are subject to various jurisdictions’ environmental laws and regulations. We record a liability where such liability or loss is probable and reasonably estimable. Environmental specialists regularly participate in ongoing evaluations of all known sites and in determining any necessary adjustments to liability estimates.
In addition to environmental claims associated with the Incident, our Consolidated Balance Sheets include liabilities for other environmental exposures of $65 million at December 31, 2024, and $60 million at December 31, 2023, of which $15 million is classified as a current liability at the end of both periods. At December 31, 2024, the liability represents our estimates of the probable cleanup, investigation, and remediation costs based on available information at 74 known locations and projects compared with 81 locations and projects at December 31, 2023. At December 31, 2024, twenty sites accounted for $56 million of the liability, and no individual site was considered to be material. We anticipate that most of this liability will be paid out over five years; however, some costs will be paid out over a longer period.
At eight locations, one or more of our subsidiaries in conjunction with a number of other parties have been identified as potentially responsible parties under CERCLA or comparable state statutes that impose joint and several liability for cleanup costs. We calculate our estimated liability for these sites based on facts and legal defenses applicable to each site and not solely on the basis of the potential for joint liability.
As set forth above, with respect to known environmental sites (whether identified by us or by the U.S. EPA or comparable state authorities), estimates of our ultimate potential financial exposure for a given site or in the aggregate for all such sites can change over time because of the widely varying costs of currently available cleanup techniques, unpredictable contaminant recovery and reduction rates associated with available cleanup technologies, the likely development of new cleanup technologies, the difficulty of determining in advance the nature and full extent of contamination and each potential participant’s share of any estimated loss (and that participant’s ability to bear it), and evolving statutory and regulatory standards governing liability.
The risk of incurring environmental liability for acts and omissions, past, present, and future, is inherent in the railroad business. Some of the commodities we transport, particularly those classified as hazardous materials, pose special risks that we work diligently to reduce. In addition, several of our subsidiaries own, or have owned, land used as operating property, or which is leased and operated by others, or held for sale. Because environmental problems that are latent or undisclosed may exist on these properties, there can be no assurance that we will not incur environmental liabilities or costs with respect to one or more of them, the amount and materiality of which cannot be estimated reliably at this time. Moreover, lawsuits and claims involving these and potentially other unidentified environmental sites and matters are likely to arise from time to time. The resulting liabilities could have a significant effect on financial position, results of operations, or liquidity in a particular year or quarter.
Based on our assessment of the facts and circumstances now known, we believe we have recorded the probable and reasonably estimable costs for dealing with those environmental matters of which we are aware. Further, we believe that it is unlikely that any known matters, either individually or in the aggregate, will have a material adverse effect on our financial position, results of operations, or liquidity.
Labor Agreements
Approximately 80% of our railroad employees are covered by collective bargaining agreements with various labor unions. Pursuant to the RLA, these agreements remain in effect until new agreements are reached, or until the bargaining procedures mandated by the RLA are completed. Moratorium provisions in the labor agreements govern
when the railroads and unions may propose changes to the agreements. We largely bargain nationally in concert with other major railroads, represented by the NCCC.
Under current moratorium provisions, neither party was permitted to serve notice to compel a new round of mandatory collective bargaining until November 1, 2024. In the months prior to the opening of the current national bargaining round, we engaged in voluntary local discussions with our labor unions and, as a result, reached local tentative agreements with ten of our thirteen unions. A majority of those tentative agreements were subsequently ratified by union membership and became effective January 1, 2025, foreclosing the parties from serving new notices to compel mandatory bargaining until November 1, 2029.
For those unions with whom we have not yet reached a ratified agreement, the NCCC, on behalf of Norfolk Southern, sent bargaining notices on November 1, 2024, to commence mandatory direct negotiations as prescribed under the RLA. Even if the parties are unable to reach voluntary agreement during this first phase of RLA bargaining, self-help (e.g., a strike or other work stoppage) related to this collective-bargaining process remains prohibited by law until a lengthy series of additional procedures mandated by the RLA, including federal mediation, are exhausted.
Insurance
We purchase insurance covering legal liabilities for bodily injury and property damage to third parties. Our current liability insurance provides limits for approximately 83% of covered losses above $75 million and below $734 million per occurrence and/or policy year. Above $800 million per occurrence and/or policy year, we maintain approximately $43 million additional liability insurance limits for certain types of pollution releases. We also purchase insurance for property damage to property owned by us or in our care, custody, or control. Our current property insurance provides limits for approximately 82% of covered losses above $75 million and below $275 million per occurrence and/or policy year. With respect to the Incident, our insurance in effect at such time provided coverage above $75 million and below $800 million (or up to $1.1 billion for specified types of pollution releases) per occurrence and/or policy year, and with respect to property owned by us or in our care, custody, or control, our insurance covered approximately 82% of potential losses above $75 million and below $275 million per occurrence and/or policy year.
Insurance coverage with respect to the Incident is subject to certain conditions, including but not limited to our insurers’ reservation of rights to further investigate and contest coverage, the express restrictions and sub-limits of coverage, and various policy exclusions, including those for some governmental fines or penalties. Some (re)insurers have questioned certain payments we have made, for example, as part of our effort to respond to mitigate and compensate for the impact to the community and affected residents and businesses. We are pursuing coverage with respect to the Incident, and we have recognized $650 million and $101 million in insurance recoveries in 2024 and 2023, respectively, principally from excess liability (re)insurers. At December 31, 2024, $18 million was outstanding and is included in “Accounts receivable – net” on the Consolidated Balance Sheets while no amounts were outstanding at December 31, 2023.
With the exception of amounts that have been recognized, potential recoveries under our insurance coverage have not yet been recorded (given the insurers ongoing evaluation of our claims). In addition, no amounts have been recorded related to potential recoveries from other third parties, which may reduce amounts payable by our insurers under our applicable insurance coverage.
Purchase Commitments
At December 31, 2024, we had outstanding purchase commitments totaling $1.2 billion through 2053 for locomotive modernizations, long-term technology support and development contracts, track material, and vehicles.
Change-In-Control Arrangements
We have compensation agreements with certain officers and key employees that become operative only upon a change in control of Norfolk Southern, as defined in those agreements. The agreements provide generally for payments based on compensation at the time of a covered individual’s involuntary or other specified termination and for certain other benefits.
Indemnifications
In a number of instances, we have agreed to indemnify lenders for additional costs they may bear as a result of certain changes in laws or regulations applicable to their loans. Such changes may include impositions or modifications with respect to taxes, duties, reserves, liquidity, capital adequacy, special deposits, and similar requirements relating to extensions of credit by, deposits with, or the assets or liabilities of such lenders. The nature and timing of changes in laws or regulations applicable to our financings are inherently unpredictable, and therefore our exposure in connection with the foregoing indemnifications cannot be quantified. No liability has been recorded related to these indemnifications.
Item 9. Changes in and Disagreements with Accountants on Accounting and Financial Disclosure
Not applicable.
Item 9A. Controls and Procedures
Disclosure Controls and Procedures
Our Chief Executive Officer and Chief Financial Officer, with the assistance of management, evaluated the effectiveness of our disclosure controls and procedures (as such term is defined in Rules 13a-15(e) and 15d-15(e) under the Securities Exchange Act of 1934, as amended (Exchange Act)) at December 31, 2024. Based on such evaluation, our officers have concluded that, at December 31, 2024, our disclosure controls and procedures were effective to ensure that information required to be disclosed in our reports under the Exchange Act is recorded, processed, summarized, and reported, within the time period specified in the SEC’s rules and forms, and that such information is accumulated and communicated to management, including the Chief Executive Officer and the Chief Financial Officer, as appropriate, to allow timely decisions regarding required disclosure.
Management’s Annual Report on Internal Control Over Financial Reporting
We are responsible for establishing and maintaining adequate internal control over financial reporting. Our internal control over financial reporting includes those policies and procedures that pertain to our ability to record, process, summarize, and report reliable financial data. We recognize that there are inherent limitations in the effectiveness of any internal control over financial reporting, including the possibility of human error and the circumvention or overriding of internal control. Accordingly, even effective internal control over financial reporting can provide only reasonable assurance with respect to financial statement preparation. Further, because of changes in conditions, the effectiveness of internal control over financial reporting may vary over time.
Our Board of Directors, acting through its Audit Committee, is responsible for the oversight of our accounting policies, financial reporting, and internal control. The Audit Committee of our Board of Directors is comprised of outside directors who are independent of management. The independent registered public accounting firm and our internal auditors have full and unlimited access to the Audit Committee, with or without management, to discuss the adequacy of internal control over financial reporting, and any other matters which they believe should be brought to the attention of the Audit Committee.
We have issued a report of our assessment of internal control over financial reporting, and our independent registered public accounting firm has issued an opinion on our internal control over financial reporting at December 31, 2024. These reports appear in Item 8 of this report on Form 10-K.
Changes in Internal Control Over Financial Reporting
During the fourth quarter of 2024, we have not identified any changes in internal control over financial reporting that have materially affected, or are reasonably likely to materially effect, our internal control over financial reporting.
Item 9B. Other Information
Director and Officer Trading Arrangements
None of our directors or officers (as defined in Rule 16a-1(f) of the Exchange Act) adopted or terminated a contract, instruction or written plan for the purchase or sale of our securities intended to satisfy the affirmative defense conditions of Rule 10b5-1(c) or a non-Rule 10b5-1 trading arrangement (as defined in Item 408(c) of Regulation S-K) during the fourth quarter of 2024.
Item 9C. Disclosure Regarding Foreign Jurisdictions that Prevent Inspections
Not applicable.
PART III
NORFOLK SOUTHERN CORPORATION AND SUBSIDIARIES
Item 10. Directors, Executive Officers and Corporate Governance
In accordance with General Instruction G(3), information called for by Part III, Item 10, is incorporated herein by reference to our definitive Proxy Statement for our 2025 Annual Meeting of Stockholders, which definitive Proxy Statement will be filed electronically with the SEC pursuant to Regulation 14A. The information regarding executive officers called for by Item 401 of Regulation S-K is included in Part I hereof beginning under “Information about our Executive Officers.”
Item 11. Executive Compensation
In accordance with General Instruction G(3), information called for by Part III, Item 11, is incorporated herein by reference to our definitive Proxy Statement for our 2025 Annual Meeting of Stockholders, which definitive Proxy Statement will be filed electronically with the SEC pursuant to Regulation 14A.
Item 12. Security Ownership of Certain Beneficial Owners and Management and Related Stockholder Matters
In accordance with General Instruction G(3), information on security ownership of certain beneficial owners and management called for by Part III, Item 12, is incorporated herein by reference to our definitive Proxy Statement for our 2025 Annual Meeting of Stockholders, which definitive Proxy Statement will be filed electronically with the SEC pursuant to Regulation 14A.
Equity Compensation Plan Information (at December 31, 2024)
| | | | | | | | | | | | | | | | | | | | | | | |
Plan
Category | | Number of
securities
to be issued upon
exercise of
outstanding options,
warrants and rights | | Weighted-
average
exercise price
of outstanding
options, warrants
and rights | | Number of securities remaining available for future issuance under equity compensation plans (1) | |
| | | (a) | | (b) | | (c) | |
| Equity compensation plans | | | | | | | |
approved by securities holders(2) | | 929,041 | | (3) | $ | 194.78 | | (5) | 7,438,613 | | |
| | | | | | | |
| Equity compensation plans | | | | | | | |
| not approved by securities holders | | 59,266 | | (4) | 96.39 | | | 437,746 | | (6) |
| | | | | | | |
| Total | | 988,307 | | | | | 7,876,359 | | |
(1)Excludes securities reflected in column (a).
(2)LTIP.
(3)Includes options, RSUs, and PSUs granted under LTIP that will be settled in shares of Common Stock.
(4)TSOP.
(5)Calculated without regard to 615,643 outstanding RSUs and PSUs at December 31, 2024.
(6)Reflects shares remaining available for grant under TSOP.
Norfolk Southern Corporation Long-Term Incentive Plan
Established on June 28, 1983, and approved by our stockholders at their Annual Meeting held on May 10, 1984, LTIP was adopted to promote the success of our company by providing an opportunity for non-employee Directors, officers, and other key employees to acquire a proprietary interest in Norfolk Southern Corporation (the Corporation). The Board of Directors amended LTIP on January 23, 2015, which amendment was approved by shareholders on May 14, 2015, to include the reservation for issuance of an additional 8,000,000 shares of authorized but unissued Common Stock.
The amended LTIP adopted a fungible share reserve ratio so that, for awards granted after May 13, 2010, the number of shares remaining for issuance under the amended LTIP will be reduced (i) by 1 for each award granted as an option or stock-settled SAR, or (ii) by 1.61 for an award made in the form other than an option or stock-settled SAR. Any shares of Common Stock subject to options, PSUs, restricted shares, or RSUs which are not issued as Common Stock will again be available for award under LTIP after the expiration or forfeiture of an award.
Non-employee Directors, officers, and other key employees residing in the U.S. or Canada are eligible for selection to receive LTIP awards. Under LTIP, the Committee, or the Corporation’s chief executive officer to the extent the Committee delegates award-making authority pursuant to LTIP, may grant incentive stock options, nonqualified stock options, SARs, RSUs, restricted shares, PSUs and performance shares. In addition, dividend equivalent payments may be awarded for options, RSUs and PSUs. Awards under LTIP may be made subject to forfeiture under certain circumstances and the Committee may establish such other terms and conditions for the awards as provided in LTIP.
The option price is at least the higher of (i) the average of the high and low prices at which Common Stock is traded on the date of grant, or (ii) the closing price of Common Stock on the date of the grant. All options are subject to a vesting period of at least one year, and the term of the option will not exceed ten years. LTIP specifically prohibits option repricing without stockholder approval, except that adjustments may be made in the event of changes in our capital structure or Common Stock.
PSUs entitle a recipient to receive performance-based compensation at the end of a three-year cycle based on our performance during that period. For the 2024 PSU awards, corporate performance will be based directly on return on average capital invested, with total return to stockholders and revenue growth serving as modifiers, and will be settled in shares of Common Stock.
RSUs are payable in cash or in shares of Common Stock at the end of a restriction period. During the restriction period, the holder of the RSUs has no beneficial ownership interest in the Common Stock represented by the RSUs and has no right to vote the shares represented by the units or to receive dividends (except for dividend equivalent payment rights that may be awarded with respect to the RSUs). The Committee at its discretion may waive the restriction period, but settlement of any RSUs will occur on the same settlement date as would have applied absent a waiver of restrictions, if no performance goals were imposed. RSUs will be settled in shares of Common Stock.
Norfolk Southern Corporation Thoroughbred Stock Option Plan
Our Board of Directors adopted TSOP on January 26, 1999, to promote the success of our company by providing an opportunity for management employees to acquire a proprietary interest in our company and thereby to provide an additional incentive to management employees to devote their maximum efforts and skills to the advancement, betterment, and prosperity of our company and our stockholders. Under TSOP there were 6,000,000 shares of authorized but unissued Common Stock reserved for issuance. TSOP has not been and is not required to have been approved by our stockholders.
Active full-time management employees residing in the U.S. or Canada are eligible for selection to receive TSOP awards. Under TSOP, the Committee, or the Corporation’s chief executive officer to the extent the Committee delegates award-making authority pursuant to TSOP, may grant nonqualified stock options subject to such terms and conditions as provided in TSOP.
The option price may not be less than the average of the high and low prices at which Common Stock is traded on the date of the grant. All options are subject to a vesting period of at least one year, and the term of the option will not exceed ten years. TSOP specifically prohibits repricing without stockholder approval, except for capital adjustments.
Norfolk Southern Corporation Directors’ Restricted Stock Plan
The Plan was adopted on January 1, 1994, and was designed to increase ownership of Common Stock by our non-employee Directors so as to further align their ownership interest in our company with that of our stockholders. The Plan has not been and is not required to have been approved by our stockholders.
Effective January 23, 2015, the Board amended the Plan to provide that no additional awards will be made under the Plan. Prior to that amendment, only non-employee Directors who are not and never have been employees of our company were eligible to participate in the Plan. Upon becoming a Director, each eligible Director received a one-time grant of 3,000 restricted shares of Common Stock. No additional shares may be granted under the Plan. No individual member of the Board exercised discretion concerning the eligibility of any Director or the number of shares granted.
The restriction period applicable to restricted shares granted under the Plan begins on the date of the grant and ends on the earlier of the recipient’s death or the day after the recipient ceases to be a Director by reason of disability or retirement. During the restriction period, shares may not be sold, pledged, or otherwise encumbered. Directors forfeit the restricted shares if they cease to serve as a Director of our company for reasons other than their disability, retirement, or death.
Item 13. Certain Relationships and Related Transactions, and Director Independence
In accordance with General Instruction G(3), information called for by Part III, Item 13, is incorporated herein by reference to our definitive Proxy Statement for our 2025 Annual Meeting of Stockholders, which definitive Proxy Statement will be filed electronically with the SEC pursuant to Regulation 14A.
Item 14. Principal Accountant Fees and Services
Our independent registered public accounting firm is KPMG LLP, Atlanta, GA, Auditor Firm ID: 185.
In accordance with General Instruction G(3), information called for by Part III, Item 14, is incorporated herein by reference to our definitive Proxy Statement for our 2025 Annual Meeting of Stockholders, which definitive Proxy Statement will be filed electronically with the SEC pursuant to Regulation 14A.
PART IV
NORFOLK SOUTHERN CORPORATION AND SUBSIDIARIES
Item 15. Exhibits and Financial Statement Schedules | | | | | | | | | | | |
| | | | Page |
| (A) | The following documents are filed as part of this report: | |
| | | |
| | 1. | | |
| | | |
| | | | |
| | | | |
| | | | |
| | | | |
| | | | |
| | | | |
| | | | |
| | | | |
| | | |
| | 2. | Financial Statement Schedules: | |
| | | |
| | | The following consolidated financial statement schedule should be read in connection with the consolidated financial statements: | |
| | | |
| | | Index to Consolidated Financial Statement Schedules | |
| | | |
| | | |
| | | |
| | | Schedules other than the one listed above are omitted either because they are not required or are inapplicable, or because the information is included in the consolidated financial statements or related notes. | |
| | | |
| | 3. | Exhibits | |
| | | |
| Exhibit Number | | Description | |
| 2.1 | | Distribution Agreement, dated as of July 26, 2004, by and among CSX Corporation, CSX Transportation, Inc., CSX Rail Holding Corporation, CSX Northeast Holdings Corporation, Norfolk Southern Corporation, Norfolk Southern Railway Company, CRR Holdings LLC, Green Acquisition Corp., Conrail Inc., Consolidated Rail Corporation, New York Central Lines LLC, Pennsylvania Lines LLC, NYC Newco, Inc., and PRR Newco, Inc., is incorporated by reference to Exhibit 2.1 to Norfolk Southern Corporation’s Form 8-K filed on September 2, 2004. (SEC File No. 001-08339) | |
| | | |
| 3 | | Articles of Incorporation and Bylaws – | |
| | | |
| (i)(a) | | | |
| (i)(b) | | | |
| | | |
| (i)(c) | | | |
| (ii) | | | |
| | | | | | | | |
| 4 | | Instruments Defining the Rights of Security Holders, Including Indentures: |
| | |
| (a) | | Indenture, dated as of January 15, 1991, from Norfolk Southern Corporation to First Trust of New York, National Association, as Trustee, is incorporated by reference to Exhibit 4.1 to Norfolk Southern Corporation’s Registration Statement on Form S-3 (SEC File No. 33-38595) |
| | |
| (b) | | |
| | |
| (c) | | |
| | |
| (d) | | Indenture, dated August 27, 2004, among PRR Newco, Inc., as Issuer, and Norfolk Southern Railway Company, as Guarantor, and The Bank of New York, as Trustee, is incorporated by reference to Exhibit 4(1) to Norfolk Southern Corporation’s Form 10-Q filed on October 28, 2004. (SEC File No. 001-08339) |
| | |
| (e) | | First Supplemental Indenture, dated August 27, 2004, among PRR Newco, Inc., as Issuer, and Norfolk Southern Railway Company, as Guarantor, and The Bank of New York, as Trustee, related to the issuance of notes in the principal amount of approximately $451.8 million, is incorporated by reference to Exhibit 4(m) to Norfolk Southern Corporation’s Form 10-Q filed on October 28, 2004. (SEC File No. 001-08339) |
| | |
| (f) | | |
| | |
| (g) | | |
| | |
| (h) | | |
| | |
| (i) | | |
| | |
| (j) | | |
| | |
| (k) | | |
| | |
| (l) | | |
| | |
| (m) | | |
| | |
| | | | | | | | |
| (n) | | |
| | |
| (o) | | |
| | |
| (p) | | |
| | |
| (q) | | |
| | |
| (r) | | |
| | |
| (s) | | |
| | |
| (t) | | |
| | |
| (u) | | |
| | |
| (v) | | |
| | |
| (w) | | |
| | |
| (x) | | |
| | |
| (y) | | |
| | |
| (z) | | |
| | |
| (aa) | | |
| | |
| (bb) | | |
| | |
| (cc) | | |
| | |
| | | | | | | | |
| (dd) | | |
| | |
| (ee) | | |
| | |
| (ff) | | |
| | |
| (gg) | | |
| | |
| (hh) | | |
| | |
| (ii) | | |
| | |
| (jj) | | |
| | |
| (kk) | | |
| | |
| (ll) | | |
| | |
| | In accordance with Item 601(b)(4)(iii) of Regulation S-K, copies of other instruments of Norfolk Southern Corporation and its subsidiaries with respect to the rights of holders of long-term debt are not filed herewith, or incorporated by reference, but will be furnished to the Commission upon request. |
| | |
| 10 | | Material Contracts - |
| | |
| (a) | | The Transaction Agreement, dated as of June 10, 1997, by and among CSX and CSX Transportation, Inc., Registrant, Norfolk Southern Railway Company, Conrail Inc., Consolidated Rail Corporation, and CRR Holdings LLC, with certain schedules thereto, previously filed, is incorporated by reference to Exhibit 10(a) to Norfolk Southern Corporation’s Form 10-K filed on February 24, 2003. (SEC File No. 001-08339) |
| | |
| (b) | | Amendment No. 1 dated as of August 22, 1998, to the Transaction Agreement, dated as of June 10, 1997, by and among CSX Corporation, CSX Transportation, Inc., Norfolk Southern Corporation, Norfolk Southern Railway Company, Conrail, Inc., Consolidated Rail Corporation, and CRR Holdings LLC, is incorporated by reference from Exhibit 10.1 to Norfolk Southern Corporation’s Form 10-Q filed on August 11, 1999. (SEC File No. 001-08339) |
| | |
| (c) | | Amendment No. 2 dated as of June 1, 1999, to the Transaction Agreement, dated June 10, 1997, by and among CSX Corporation, CSX Transportation, Inc., Norfolk Southern Corporation, Norfolk Southern Railway Company, Conrail, Inc., Consolidated Rail Corporation, and CRR Holdings LLC, is incorporated by reference from Exhibit 10.2 to Norfolk Southern Corporation’s Form 10-Q filed on August 11, 1999. (SEC File No. 001-08339) |
| | |
| | | | | | | | |
| (d) | | Amendment No. 3 dated as of June 1, 1999, and executed in April 2004, to the Transaction Agreement, dated June 10, 1997, by and among CSX Corporation, CSX Transportation, Inc., Norfolk Southern Corporation, Norfolk Southern Railway Company, Conrail, Inc., Consolidated Rail Corporation, and CRR Holdings LLC, is incorporated by reference from Exhibit 10(dd) to Norfolk Southern Corporation’s Form 10-Q filed on July 30, 2004. (SEC File No. 001-08339) |
| | |
| (e) | | Amendment No. 5 to the Transaction Agreement, dated as of August 27, 2004, by and among CSX Corporation, CSX Transportation, Inc., Norfolk Southern Corporation, Norfolk Southern Railway Company, Conrail, Inc., Consolidated Rail Corporation, and CRR Holdings LLC, is incorporated by reference to Exhibit 10.1 to Norfolk Southern Corporation’s Form 8-K filed on September 2, 2004. (SEC File No. 001-08339) |
| | |
| (f) | | Amendment No. 6 dated as of April 1, 2007, to the Transaction Agreement, dated June 10, 1997, by and among CSX Corporation, CSX Transportation, Inc., Norfolk Southern Railway Company, Conrail, Inc., Consolidated Rail Corporation, and CRR Holdings LLC, is incorporated by reference to Exhibit 10.5 to Norfolk Southern Corporation’s Form 10-Q filed on July 27, 2007. (SEC File No. 001-08339) |
| | |
| (g) | | |
| | |
| (h) | | |
| | |
| (i) | | |
| | |
| (j) | | Amendment No. 1, dated as of June 1, 2000, to the Shared Assets Area Operating Agreements for North Jersey, South Jersey/Philadelphia, and Detroit, dated as of June 1, 1999, by and among Consolidated Rail Corporation, CSX Transportation, Inc., and Norfolk Southern Railway Company, with exhibits thereto, is incorporated by reference to Exhibit 10(h) to Norfolk Southern Corporation’s Form 10-K filed on March 5, 2001. (SEC File No. 001-08339) |
| | |
| (k) | | Amendment No. 2, dated as of January 1, 2001, to the Shared Assets Area Operating Agreements for North Jersey, South Jersey/Philadelphia, and Detroit, dated as of June 1, 1999, by and among Consolidated Rail Corporation, CSX Transportation, Inc., and Norfolk Southern Railway Company, with exhibits thereto, is incorporated by reference to Exhibit 10(j) to Norfolk Southern Corporation’s Form 10-K filed on February 21, 2002. (SEC File No. 001-08339) |
| | |
| (l) | | Amendment No. 3, dated as of June 1, 2001, and executed in May of 2002, to the Shared Assets Area Operating Agreements for North Jersey, South Jersey/Philadelphia, and Detroit, dated as of June 1, 1999, by and among Consolidated Rail Corporation, CSX Transportation, Inc., and Norfolk Southern Railway Company, with exhibits thereto, is incorporated by reference to Exhibit 10(k) to Norfolk Southern Corporation’s Form 10-K filed on February 24, 2003. (SEC File No. 001-08339) |
| | |
| (m) | | Amendment No. 4, dated as of June 1, 2005, and executed in late June 2005, to the Shared Assets Area Operating Agreements for North Jersey, South Jersey/Philadelphia, and Detroit, dated as of June 1, 1999, by and among Consolidated Rail Corporation, CSX Transportation, Inc., and Norfolk Southern Railway Company, with exhibits thereto, is incorporated by reference to Exhibit 99 to Norfolk Southern Corporation’s Form 8-K filed on July 1, 2005. (SEC File No. 001-08339) |
| | |
| (n) | | Monongahela Usage Agreement, dated as of June 1, 1999, by and among CSX Transportation, Inc., Norfolk Southern Railway Company, Pennsylvania Lines LLC, and New York Central Lines LLC, with exhibit thereto, is incorporated by reference from -Exhibit 10.7 to Norfolk Southern Corporation’s Form 10-Q filed on August 11, 1999. (SEC File No. 001-08339) |
| | |
| (o) | | |
| | |
| | | | | | | | |
| (p) | | |
| | |
| (q) | | |
| | |
| (r)* | | Norfolk Southern Corporation Executive Management Incentive Plan, as approved by shareholders May 14, 2015, and as amended effective March 27, 2018, November 17, 2020, November 17, 2023, and April 2, 2024 is incorporated by reference to Exhibit 10.4 to Norfolk Southern Corporation's 10-Q filed on April 24, 2024. (SEC File No. 001-08339) |
| | |
| (s)* | | |
| | |
| (t)* | | |
| | |
| (u)* | | |
| | |
| (v)* | | |
| | |
| (w)* | | |
| | |
| (x)* | | The Norfolk Southern Corporation Long-Term Incentive Plan, as approved by shareholders May 14, 2015, and as amended July 29, 2016, November 29, 2016, November 28, 2017, November 27, 2018, and November 19, 2019, November 17, 2023, and December 20, 2023 is incorporated by reference to Exhibit 10(x) to Norfolk Southern Corporation's Form 10-K filed on February 5, 2024. (SEC File No. 001-08339) |
| | |
| (y) | | |
| | |
| (z) | | |
| | |
| (aa) | | |
| | |
| (bb) | | |
| | |
| (cc) | | |
| | |
| | | | | | | | |
| (dd) | | |
| | |
| (ee) | | |
| | |
| (ff)* | | |
| | |
| (gg)* | | |
| | |
| (hh)* | | |
| | |
| (ii)*,** | | |
| | |
| (jj)*,** | | |
| | |
| (kk)*,** | | |
| | |
| (ll)* | | |
| | |
| (mm) | | |
| | |
| (nn)* | | |
| | |
| (oo)* | | |
| | |
| (pp)* | | |
| | |
| (qq)* | | |
| | |
| (rr)* | | |
| | |
| | | | | | | | |
| (ss)* | | |
| | |
| (tt) | | |
| | |
| (uu) | | |
| | |
| (vv) | | |
| | |
| (ww) | | |
| | |
| (xx) | | |
| | |
| (yy) | | |
| | |
| (zz) | | |
| | |
| (aaa)* | | |
| | |
| (bbb) | | |
| | |
| 19 ** | | |
| | |
| 21** | | |
| | |
| 23** | | |
| | |
| 31-A** | | |
| | |
| 31-B** | | |
| | |
| 32** | | |
| | |
| 97* | | |
| | |
| | | | | | | | |
| 101** | | The following financial information from Norfolk Southern Corporation’s Annual Report on Form 10-K for the year ended December 31, 2024, formatted in Inline Extensible Business Reporting Language (iXBRL) includes: (i) the Consolidated Statements of Income for each of the years ended December 31, 2024, 2023, and 2022; (ii) the Consolidated Statements of Comprehensive Income for each of the years ended December 31, 2024, 2023, and 2022; (iii) the Consolidated Balance Sheets at December 31, 2024 and 2023; (iv) the Consolidated Statements of Cash Flows for each of the years ended December 31, 2024, 2023, and 2022; (v) the Consolidated Statements of Changes in Stockholders’ Equity for each of the years ended December 31, 2024, 2023, and 2022; and (vi) the Notes to Consolidated Financial Statements. |
| | |
| 104** | | Cover Page Interactive Data File (formatted as Inline XBRL and contained in Exhibit 101). |
| | |
| | * Management contract or compensatory arrangement. |
| | ** Filed herewith. |
| | | | | | | | |
| | |
| (B) | | Exhibits. |
| | |
| | | The Exhibits required by Item 601 of Regulation S-K as listed in Item 15(A)3 are filed herewith or incorporated by reference. |
| | |
| (C) | | Financial Statement Schedules. |
| | |
| | Financial statement schedules and separate financial statements specified by this Item are included in Item 15(A)2 or are otherwise not required or are not applicable. |
| | |
| | Exhibits 23, 31, and 32 are included in copies assembled for public dissemination. All exhibits are included in the 2024 Form 10-K posted on our website at www.norfolksouthern.com under “Investors” “Financial Reports” and “SEC Filings” or you may request copies by writing to: |
| | |
| | Office of Corporate Secretary
Norfolk Southern Corporation
650 West Peachtree Street NW
Atlanta, Georgia 30308-1925 |
Item 16. Form 10-K Summary
Not applicable.
POWER OF ATTORNEY
Each person whose signature appears on the next page under SIGNATURES hereby authorizes Jason M. Morris and Jason A. Zampi, or any one of them, to execute in the name of each such person, and to file, any amendments to this report, and hereby appoints Jason M. Morris and Jason A. Zampi, or any one of them, as attorneys-in-fact to sign on her or his behalf, individually and in each capacity stated below, and to file, any and all amendments to this report.
SIGNATURES
Pursuant to the requirements of Section 13 or 15(d) of the Securities Exchange Act of 1934, Norfolk Southern Corporation has duly caused this report to be signed on its behalf by the undersigned, thereunto duly authorized, on this 10th day of February, 2025.
| | | | | |
| /s/ Mark R. George |
| By: | Mark R. George |
| (President and Chief Executive Officer) |
Pursuant to the requirements of the Securities Exchange Act of 1934, this report has been signed below on this 10th day of February, 2025, by the following persons on behalf of Norfolk Southern Corporation and in the capacities indicated.
| | | | | |
| Signature | Title |
| |
/s/ Mark R. George (Mark R. George) | President and Chief Executive Officer
(Principal Executive Officer) |
| |
/s/ Jason A. Zampi (Jason A. Zampi) | Executive Vice President and Chief Financial Officer
(Principal Financial Officer) |
| |
/s/ Claiborne L. Moore (Claiborne L. Moore) | Vice President and Controller
(Principal Accounting Officer) |
| |
/s/ Claude Mongeau (Claude Mongeau) | Independent Chair and Director |
| |
/s/ Richard H. Anderson (Richard H. Anderson) | Director |
| |
/s/ William Clyburn, Jr. (William Clyburn, Jr.) | Director |
| |
/s/ Philip S. Davidson (Philip S. Davidson) | Director |
| |
/s/ Francesca A. DeBiase (Francesca A. DeBiase) | Director |
| |
/s/ Marcela E. Donadio (Marcela E. Donadio) | Director |
| |
/s/ Sameh Fahmy (Sameh Fahmy) | Director |
| |
/s/ Mary Kathryn Heitkamp (Mary Kathryn Heitkamp) | Director |
| |
/s/ John C. Huffard, Jr. (John C. Huffard, Jr.) | Director |
| |
/s/ Christopher T. Jones (Christopher T. Jones) | Director |
| |
/s/ Thomas C. Kelleher (Thomas C. Kelleher) | Director |
| |
/s/ Gilbert H. Lamphere (Gilbert H. Lamphere) | Director |
| |
/s/ Lori J. Ryerkerk (Lori J. Ryerkerk) | Director |
Schedule II
Norfolk Southern Corporation and Subsidiaries
Valuation and Qualifying Accounts
Years ended December 31, 2024, 2023, and 2022
($ in millions)
| | | | | | | | | | | | | | | | | | | | | | | | | | | | | |
| | | | Additions charged to: | | | | |
| Beginning
Balance | | Expenses | | Other Accounts | | Deductions | | Ending
Balance |
| | | | | | | | | |
| Year ended December 31, 2024 | | | | | | | | | |
| Current portion of casualty and | | | | | | | | | |
| other claims included in | | | | | | | | | |
| accounts payable | $ | 186 | | | $ | 72 | | | $ | 109 | | (2) | $ | (151) | | (3) | $ | 216 | |
| Casualty and other claims | | | | | | | | | |
| included in other liabilities | 221 | | | 152 | | (1) | — | | | (144) | | (4) | 229 | |
| | | | | | | | | |
| Year ended December 31, 2023 | | | | | | | | | |
| Current portion of casualty and | | | | | | | | | |
| other claims included in | | | | | | | | | |
| accounts payable | $ | 170 | | | $ | 51 | | | $ | 84 | | (2) | $ | (119) | | (3) | $ | 186 | |
| Casualty and other claims | | | | | | | | | |
| included in other liabilities | 218 | | | 153 | | (1) | — | | | (150) | | (4) | 221 | |
| | | | | | | | | |
| Year ended December 31, 2022 | | | | | | | | | |
| Current portion of casualty and | | | | | | | | | |
| other claims included in | | | | | | | | | |
| accounts payable | $ | 166 | | | $ | 43 | | | $ | 88 | | (2) | $ | 127 | | (3) | $ | 170 | |
| Casualty and other claims | | | | | | | | | |
| included in other liabilities | 170 | | | 147 | | (1) | — | | | 99 | | (4) | 218 | |
(1)Includes adjustments for changes in estimates for prior years’ claims.
(2)Includes revenue refunds and overcharges provided through deductions from operating revenues and transfers
from other accounts.
(3)Payments and reclassifications to/from accounts payable.
(4)Payments and reclassifications to/from other liabilities.