UNITED STATES SECURITIES AND EXCHANGE COMMISSION
WASHINGTON, D.C. 20549
FORM 10-K
| x | ANNUAL REPORT PURSUANT TO SECTION 13 OR 15(d) OF THE SECURITIES EXCHANGE ACT OF 1934 |
| | For the fiscal year ended: December 31, 2007 |
| OR | |
| | TRANSITION REPORT PURSUANT TO SECTION 13 OR 15(d) OF THE SECURITIES EXCHANGE ACT OF 1934 |
| o | For the transition period from __________ to __________ |
Commission File Number 0-11244
| GERMAN AMERICAN BANCORP, INC. |
| (Exact name of registrant as specified in its charter) |
| INDIANA | | 35-1547518 |
| (State or other jurisdiction of incorporation or organization) | | (I.R.S. Employer Identification No.) |
| 711 Main Street, Box 810, Jasper, Indiana | | 47546 |
| (Address of Principal Executive Offices) | | (Zip Code) |
Registrant’s telephone number, including area code: (812) 482-1314
Securities registered pursuant to Section 12 (b) of the Act
| Title of Each Class | | Name of each exchange on which registered |
| Common Shares, No Par Value | | |
| Preferred Stock Purchase Rights | | The NASDAQ Stock Market LLC |
Securities registered pursuant to Section 12(g) of the Act: None
| Indicate by check mark if the registrant is a well-known seasoned issuer, as defined in Rule 405 of the Securities Act. | o Yes | x No |
| | | |
| Indicate by check mark if the registrant is not required to file reports pursuant to Section 13 or Section 15(d) of the Act. | o Yes | x No |
| | | |
| Indicate by check mark whether the registrant (1) has filed all reports required to be filed by Section 13 or 15(d) of the Securities Exchange Act of 1934 during the preceding 12 months (or for such shorter period that the registrant was required to file such reports), and (2) has been subject to such filing requirements for the past 90 days. | x Yes | o No |
Indicate by check mark if disclosure of delinquent filers pursuant to Item 405 Regulation S-K is not contained herein, and will not be contained, to the best of registrant’s knowledge, in definitive proxy or information statements incorporated by reference in Part III of this Form 10-K or any amendment to this Form 10-K: o
Indicate by check mark whether the registrant is a large accelerated filer, an accelerated filer or a non-accelerated filer, or a smaller reporting company:
Large accelerated filer o Accelerated filer x Non-accelerated filer o Smaller reporting company o
Indicate by check mark whether the registrant is a shell company (as defined in Rule 12b-2 of the Act). o Yes x No
The aggregate market value of the registrant’s common shares held by non-affiliates of the registrant, computed by reference to the price at which the common shares were last sold, as of June 30, 2007 (the last business day of the registrant’s most recently completed second fiscal quarter) was approximately $142,378,000. This calculation does not reflect a determination that persons are affiliates for any other purposes.
As of March 1, 2008, there were outstanding 11,029,484 common shares, no par value, of the registrant.
DOCUMENTS INCORPORATED BY REFERENCE
Portions of the Proxy Statement of German American Bancorp, Inc., for the Annual Meeting of its Shareholders to be held April 24, 2008, to the extent stated herein, are incorporated by reference into Part III.
GERMAN AMERICAN BANCORP, INC.
ANNUAL REPORT ON FORM 10-K
For Fiscal Year Ended December 31, 2007
Table of Contents
PART I | | |
| Item 1. | Business | 3-6 |
| Item 1A. | Risk Factors | 6-8 |
| Item 1B. | Unresolved Staff Comments | 8 |
| Item 2. | Properties | 8 |
| Item 3. | Legal Proceedings | 8 |
| Item 4. | Submission of Matters to a Vote of Security Holders | 8 |
| | | |
PART II | | |
| Item 5. | Market for Registrant’s Common Equity, Related Stockholder Matters and Issuer Purchases of Equity Securities | 9-10 |
| Item 6. | Selected Financial Data | 11 |
| Item 7. | Management’s Discussion and Analysis of Financial Condition and Results of Operations | 12-28 |
| Item 7A. | Quantitative and Qualitative Disclosures About Market Risk | 29 |
| Item 8. | Financial Statements and Supplementary Data | 30-64 |
| Item 9. | Changes in and Disagreements with Accountants on Accounting and Financial Disclosure | 65 |
| Item 9A. | Controls and Procedures | 65 |
| Item 9B. | Other Information | 65 |
| | | |
PART III | | |
| Item 10. | Directors and Executive Officers of the Registrant | 66 |
| Item 11. | Executive Compensation | 66 |
| Item 12. | Security Ownership of Certain Beneficial Owners and Management and Related Stockholder Matters | |
| Item 13. | Certain Relationships and Related Transactions | 67 |
| Item 14. | Principal Accountant Fees and Services | 67 |
| | | |
PART IV | | |
| Item 15. | Exhibits and Financial Statement Schedules | 68 |
| | | |
| SIGNATURES | 69 |
| | |
| INDEX OF EXHIBITS | 70-72 |
Information included in or incorporated by reference in this Annual Report on Form 10-K, our other filings with the Securities and Exchange Commission and our press releases or other public statements, contain or may contain “forward-looking statements” within the meaning of the Private Securities Litigation Reform Act of 1995. Please refer to a discussion of our forward- looking statements and associated risks in Item 1, “Business – Forward-Looking Statements and Associated Risks” and our discussion of risk factors in Item 1A, “Risk Factors” in this Annual Report on Form 10-K.
PART I
Item 1. Business.
General.
German American Bancorp, Inc. is a financial services holding company based in Jasper, Indiana. The Company’s Common Stock is traded on NASDAQ’s Global Select Market under the symbol GABC. The principal subsidiary of German American Bancorp, Inc., is its banking subsidiary, German American Bancorp which operates through six community banking affiliates with 28 retail banking offices in the ten contiguous Southern Indiana counties of Daviess, Dubois, Gibson, Knox, Lawrence, Martin, Monroe, Perry, Pike, and Spencer. German American Bancorp, Inc., also owns a trust, brokerage, and financial planning subsidiary, which operates from the banking offices of the bank subsidiary and a full line property and casualty insurance agency with six insurance agency offices throughout its market area.
Throughout this report, when we use the term “Company”, we will usually be referring to the business and affairs (financial and otherwise) of the Company and its consolidated subsidiaries as a whole. Occasionally, we will refer to the term “parent company” or “holding company” when we mean to refer to only German American Bancorp, Inc.
The Company’s lines of business include retail and commercial banking, mortgage banking, comprehensive financial planning, full service brokerage and trust administration, and a full range of personal and corporate insurance products. Financial and other information by segment is included in Note 16 – Segment Information of the Notes to the Consolidated Financial Statements included in Item 8 of this Report and is incorporated into this Item 1 by reference. Substantially all of the Company’s revenues are derived from customers located in, and substantially all of its assets are located in, the United States.
Subsidiaries.
The Company’s principal operating subsidiaries are described in the following table:
1) Name | | 2) Type of Business | | 3) Principal Office Location |
| German American Bancorp | | Commercial Bank | | Jasper, IN |
| German American Insurance, Inc. | | Multi-Line Insurance Agency | | Jasper, IN |
| German American Financial Advisors & Trust Company | | Trust, Brokerage, Financial Planning | | Jasper, IN |
Two of these subsidiaries (German American Bancorp and German American Insurance, Inc.) do business in the various communities served by the Company under distinctive trade names that relate to the names under which the Company (or a predecessor) has done banking or insurance business with the public in those communities in prior years.
Competition.
The industries in which the Company operates are highly competitive. The Company’s subsidiary bank competes for commercial and retail banking business within its core banking segment not only with financial institutions that have offices in the same counties but also with financial institutions that compete from other locations in Southern Indiana and elsewhere. The Company’s subsidiaries compete with commercial banks, savings and loan associations, savings banks, credit unions, production credit associations, federal land banks, finance companies, credit card companies, personal loan companies, investment brokerage firms, insurance agencies, insurance companies, lease finance companies, money market funds, mortgage companies, and other non-depository financial intermediaries. Many of these banks and other organizations have substantially greater resources than the Company.
Employees.
At March 1, 2008 the Company and its subsidiaries employed approximately 365 full-time equivalent employees. There are no collective bargaining agreements, and employee relations are considered to be good.
Effectiveness Plan.
Management of the Company embarked during the last half of 2007 upon a formal study of the operating effectiveness and efficiency of its financial services operations. This effectiveness study has resulted in the preparation by management of an action plan (“Effectiveness Plan”), which has been approved in principle by the Company’s Board of Directors. This Effectiveness Plan identifies certain tactical steps (including steps that are designed to enhance non-interest income and to reduce non-interest expense) that the Company’s Board of Directors believes must be taken if the Company is to achieve its goal of achieving financial performance that would fall within the top 25% of publicly-traded Midwest banking companies of similar size or larger.
For purposes of measuring its progress toward achieving top-quartile financial performance, the Company’s Board of Directors has established a peer group of larger bank holding companies in the Midwest. The members of this peer group are subject to change from time to time, and were most recently publicly identified (as the group was constituted in 2006 for purposes of 2006 executive compensation) by the Company’s proxy statement for its 2007 annual meeting. The Company intends to identify the members of this peer group (as it was constituted in 2007 for purposes of 2007 executive compensation) in its proxy statement for its 2008 annual meeting.
Full implementation of the plan initiatives is scheduled to be completed by the end of 2008. While the Company expects that it will begin to achieve during 2008 some of the benefits from the operating and other efficiencies that the Company hopes to achieve as a result of the implementation of the Plan, the Company also expects that its implementation of certain plan initiatives will result in certain non-routine charges to non-interest expense during 2008. Accordingly, the Company anticipates that 2009 will be the earliest fiscal year in which the intended benefits of the Plan might be realized by the Company.
Regulation and Supervision.
The Company is subject to regulation and supervision by the Board of Governors of the Federal Reserve System (“FRB”) under the Bank Holding Company Act of 1956, as amended (“BHC Act”), and is required to file with the FRB annual reports and such additional information as the FRB may require. The FRB may also make examinations or inspections of the Company. Under FRB policy, the Company is expected to act as a source of financial strength to its bank subsidiary and to commit resources to support that subsidiary even in circumstances where the Company might not do so absent such an FRB policy.
The Company’s subsidiary bank is under the supervision of and subject to examination by the Indiana Department of Financial Institutions (“DFI”), and the Federal Deposit Insurance Corporation (“FDIC”). Regulation and examination by banking regulatory agencies are primarily for the benefit of depositors rather than shareholders.
With certain exceptions, the BHC Act prohibits a bank holding company from engaging in (or acquiring direct or indirect control of more than 5 percent of the voting shares of any company engaged in) nonbanking activities. One of the principal exceptions to this prohibition is for activities deemed by the FRB to be “closely related to banking.” Under current regulations, bank holding companies and their subsidiaries are permitted to engage in such banking-related business ventures as consumer finance; equipment leasing; credit life insurance; computer service bureau and software operations; mortgage banking; and securities brokerage.
Under the BHC Act, certain well-managed and well-capitalized bank holding companies may elect to be treated as a “financial holding company” and, as a result, be permitted to engage in a broader range of activities that are “financial in nature” and in activities that are determined to be incidental or complementary to activities that are financial in nature. These activities include underwriting, dealing in and making a market in securities; insurance underwriting and agency activities; and merchant banking. Banks may also engage through financial subsidiaries in certain of the activities permitted for financial holding companies, subject to certain conditions. The Company has not elected to become a financial holding company and its subsidiary bank has not elected to form financial subsidiaries.
The Company's bank subsidiary and that bank’s subsidiaries may generally engage in activities that are permissible activities for state chartered banks under Indiana banking law, without regard to the limitations that might apply to such activities under the BHC Act if the Company were to engage directly in such activities at the parent company level or through parent company subsidiaries that were not also bank subsidiaries.
Indiana law and the BHC Act restrict certain types of expansion by the Company and its bank subsidiary. The Company and its subsidiaries may be required to apply for prior approval from (or give prior notice and an opportunity for review to) the FRB, the DFI, and/or other bank regulatory or other regulatory agencies, as a condition to the acquisition or establishment of new offices, or the acquisition (by merger or consolidation, purchase or otherwise) of the stock, business or properties of other banks or other companies.
The earnings of commercial banks and their holding companies are affected not only by general economic conditions but also by the policies of various governmental regulatory authorities. In particular, the FRB regulates money and credit conditions and interest rates in order to influence general economic conditions, primarily through open-market operations in U.S. Government securities, varying the discount rate on bank borrowings, and setting reserve requirements against bank deposits. These policies have a significant influence on overall growth and distribution of bank loans, investments and deposits, and affect interest rates charged on loans and earned on investments or paid for time and savings deposits. FRB monetary policies have had a significant effect on the operating results of commercial banks in the past and this is expected to continue in the future. The general effect, if any, of such policies upon the future business and earnings of the Company cannot accurately be predicted.
The Company and its bank subsidiary are required by law to maintain minimum levels of capital. These required capital levels are expressed in terms of capital ratios, known as the leverage ratio and the capital to risk-based assets ratios. The Company and its bank subsidiary each exceeded the minimum required capital levels for each measure of capital adequacy as of December 31, 2007. See Note 9 to the Company's consolidated financial statements that are presented in Item 8 of this Report, which Note 9 is incorporated herein by reference.
Also, federal regulations define five categories of financial institutions for purposes of implementing prompt corrective action and supervisory enforcement requirements of the Federal Deposit Insurance Corporation Improvements Act of 1991. The category to which the most highly capitalized institutions are assigned is termed “well-capitalized.” Institutions falling into this category must have a total risk-based capital ratio (the ratio of total capital to risk-weighted assets) of at least 10%, a Tier 1 risk-based capital ratio (the ratio of Tier 1, or “core”, capital to risk-weighted assets) of at least 6%, a leverage ratio (the ratio of Tier 1 capital to total assets) of at least 5%, and must not be subject to any written agreement, order or directive from its regulator relative to meeting and maintaining a specific capital level. On December 31, 2007, the Company had a total risk-based capital ratio of 10.63%, a Tier 1 risk-based capital ratio of 8.69% (based on Tier 1 capital of $82,335,000 and total risk-weighted assets of $947,987,000), and a leverage ratio of 7.41%. The Company’s affiliate bank met all of the requirements of the “well-capitalized” category. In addition the Company meets the requirements of the FRB to be considered a “well-capitalized” bank holding company. Accordingly, the Company does not expect these regulations to significantly impact operations.
Our parent company is a corporation separate and distinct from its bank and other subsidiaries. Most of the parent company’s revenues historically have been comprised of dividends, fees, and interest paid to it by its bank subsidiary, and this is expected to continue in the future. This subsidiary is subject to statutory restrictions on its ability to pay dividends. The FRB possesses enforcement powers over bank holding companies and their non-bank subsidiaries that enable it to prevent or remedy actions that in its view may represent unsafe or unsound practices or violations of applicable statutes and regulations. Among these powers is the ability in appropriate cases to proscribe the payment of dividends by banks and bank holding companies. The FDIC and DFI possess similar enforcement powers over the bank subsidiary. The “prompt corrective action” provisions of federal banking law impose further restrictions on the payment of dividends by insured banks which fail to meet specified capital levels and, in some cases, their parent bank holding companies.
Internet Address; Internet Availability of SEC Reports.
The Company's Internet address is www.germanamericanbancorp.com.
Forward-Looking Statements and Associated Risks.
The Company from time to time in its oral and written communications makes statements relating to its expectations regarding the future. These types of statements are considered "forward-looking statements" within the meaning of the Private Securities Litigation Reform Act of 1995. Such forward-looking statements can include statements about the Company’s net interest income or net interest margin; adequacy of allowance for loan losses, and the quality of the Company’s loans, investment securities and other assets; simulations of changes in interest rates; litigation results; dividend policy; estimated cost savings, plans and objectives for future operations; and expectations about the Company’s financial and business performance and other business matters as well as economic and market conditions and trends. They often can be identified by the use of words like “expect,” “may,” “will,” “would,” “could,” “should,” “intend,” “project,” “estimate,” “believe” or “anticipate,” or similar expressions.
The Company may include forward-looking statements in filings with the SEC, such as this Form 10-K, in other written materials, and in oral statements made by senior management to analysts, investors, representatives of the media, and others. It is intended that these forward-looking statements speak only as of the date they are made, and the Company undertakes no obligation to update any forward-looking statement to reflect events or circumstances after the date on which the forward-looking statement is made.
The descriptions of the Company’s intent to take certain steps by the end of 2008 pursuant to its Effectiveness Plan described above in Item 1, “Business,” of this report, and of the Company’s anticipation that implementation of the plan may improve its financial performance toward top-quartile levels (as measured against a peer group of larger Midwest banking companies) within certain time periods, are "forward-looking statements" within the meaning of the Private Securities Litigation Reform Act of 1995. The Company’s financial performance in past periods, including its most recent fiscal year, has not been within the top quartile of this peer group. The Company cautions readers that they should not construe the above disclosure as constituting a projection by management that an improvement in the Company’s future performance or earnings, for the years 2008, 2009 or any interim or subsequent period, will in fact occur, regardless of the degree of success experienced in implementation of the Effectiveness Plan. Further, the peer group’s performance may improve in future periods, thus making achievement of this goal difficult even if the Company’s financial performance in fact improves in future periods when measured solely against the Company’s prior performance.
Readers are further cautioned that, by their nature, all forward-looking statements are based on assumptions and are subject to risks, uncertainties, and other factors. Among the assumptions that underlie the Company’s plan to improve its financial performance through the Effectiveness Plan are assumptions that (a) the Effectiveness Plan will be supported by officers, employees and customers of the Company and (b) the Company’s business and affairs, financial and otherwise, will not be adversely affected by unrelated trends, conditions, or events. Actual results may differ materially and adversely from the expectations of the Company that are expressed or implied by any forward-looking statement. The discussions in Item 1A, “Risk Factors,” and in Item 7 of this Form 10-K, “Management's Discussion and Analysis of Financial Condition and Results of Operations,” list some of the factors that could cause the Company's actual results to vary materially from those expressed or implied by any forward-looking statements. Other risks, uncertainties, and factors that could cause the Company’s actual results to vary materially from those expressed or implied by any forward-looking statement include the ability of the Company to affect the tactical steps contemplated by the action plan as currently planned by management without significant delay or unplanned expense; the unknown future direction of interest rates and the timing and magnitude of any changes in interest rates; the effects of changes in competitive conditions; of the possibility that the Company may acquire other businesses or intangible customer relationships of other companies and the costs of integrations of such acquired businesses and intangible customer relationships; the introduction, withdrawal, success, and timing of business initiatives and strategies; changes in customer borrowing, repayment, investment, and deposit practices; changes in fiscal, monetary, and tax policies; changes in financial and capital markets including those arising from the continuing uncertainties commonly associated with the mortgage-backed securities markets and the auction-rate securities markets, and those arising from uncertainties concerning the financial stability of bond insurers; the possibility of a recession or other adverse change in general economic conditions, either nationally or regionally, resulting in, among other things, credit quality deterioration; the impact, extent and timing of technological changes; capital management activities; actions of the Federal Reserve Board and legislative and regulatory actions and reforms; changes in accounting principles and interpretations; the inherent uncertainties involved in litigation and regulatory proceedings which could result in the Company’s incurring loss or damage regardless of the merits of the Company’s claims or defenses; and the continued availability of earnings and excess capital sufficient for the lawful and prudent declaration and payment of cash dividends. Investors should consider these risks, uncertainties, and other factors in addition to those mentioned by the Company in its other SEC filings from time to time when considering any forward-looking statement.
Item 1A. Risk Factors.
While we a have a history of profitability and operate in mature industries with capital that exceeds the requirements of bank regulatory agencies, an investment in our common stock (like an investment in the equity securities of any business enterprise) is subject to investment risks and uncertainties. The following describes some of the principal risks and uncertainties to which we and our assets and businesses are subject; other risks are briefly identified in our cautionary statement that is included “Forward-Looking Statements and Associated Risks” in Part I, Item 1, “Business.” Although we seek ways to manage these risks and uncertainties and to develop programs to control those that we can, we ultimately cannot predict the future. Future results may differ materially from past results, and from our expectations and plans.
If our actual loan losses exceed our estimates, our earnings and financial condition will be impacted.
A significant source of risk for any bank or other enterprise that lends money arises from the possibility that losses will be sustained because borrowers, guarantors and related parties may fail (because of financial difficulties or other reasons) to perform in accordance with the terms of their loan agreements. In our case, we originate many loans that are secured, but some loans are unsecured depending on the nature of the loan. With respect to secured loans, the collateral securing the repayment of these loans includes a wide variety of real and personal property that may be insufficient to cover the obligations owed under such loans. Collateral values may be adversely affected by changes in prevailing economic, environmental and other conditions, including declines in the value of real estate, changes in interest rates, changes in monetary and fiscal policies of the federal government, wide-spread disease, terrorist activity, environmental contamination, natural disasters, and other external events. We have adopted underwriting and credit monitoring procedures and policies, including the establishment and review of the allowance for loan losses and regular review of appraisals and borrower financial statements, that we believe are appropriate to mitigate the risk of loss by assessing the likelihood of nonperformance and the value of available collateral, monitoring loan performance and diversifying our credit portfolio. Such policies and procedures, however, may not prevent unexpected losses that could have a material adverse effect on our business, financial condition, results of operations or liquidity. For additional information regarding our asset quality, see Part II, Item 7 (“Management’s Discussion and Analysis of Financial Condition and Results of Operations.”)
We could be adversely affected by changes in interest rates.
Our earnings depend largely on the relationship between the yield on earning assets, primarily loans and investments, and the cost of funds, primarily deposits and borrowings. This relationship, known as the interest rate spread, is subject to fluctuation and is affected by economic and competitive factors which influence interest rates, the volume and mix of interest-earning assets and interest-bearing liabilities and the level of non-performing assets. Fluctuations in interest rates affect the demand of customers for our products and services. We are subject to interest rate risk to the degree that our interest-bearing liabilities reprice or mature more slowly or more rapidly or on a different basis than its interest-earning assets. Significant fluctuations in interest rates could have a material adverse effect on our business, financial condition, results of operations or liquidity. For additional information regarding interest rate risk, see Part II, Item 7A, (“Quantitative and Qualitative Disclosures About Market Risk.”)
Our success is tied to the economic vitality of our Southern Indiana markets.
We conduct business from offices that are exclusively located in ten contiguous counties of Southern Indiana, from which substantially our entire customer base is drawn. Because of the geographic concentration of our operations and customer base, our results depend largely upon economic conditions in this area. Deterioration in economic conditions in this area could adversely affect the quality of our loan portfolio and the demand for our products and services, and accordingly, could have a material adverse effect on our business, financial condition, results of operations or liquidity. See also Part I, Item 1, “Business — Competition.”
We face substantial competition.
The banking and financial services business in our markets is highly competitive. We compete with much larger regional, national, and international competitors. In addition, new banks could be organized in our market area which might bid aggressively for new business to capture market share in these markets. Developments increasing the nature or level of our competition, or decreasing the effectiveness by which we compete, could have a material adverse effect on our business, financial condition, results of operations or liquidity. See also “Competition,” and “Regulation and Supervision.”
Our business expansion and capital management strategies may be less successful than planned.
We from time to time consider opportunities to expand our business including strategies for launching new internal business initiatives and buying or investing in other businesses or business assets. Our earnings and financial condition could be adversely affected to the extent that the acquisitions or other business initiatives and strategies are not successful (or take longer than expected to achieve expected results) and such initiative or strategies could even result in losses. We also from time to time engage in activities (such as repurchasing and issuing our capital stock or other securities, and utilizing the borrowing capacity of our parent company to borrow funds from third party lenders on short and long term bases) in order to manage our capital structure and to finance acquisitions in a manner that we believe is most advantageous. These capital management activities and financing activities, however, also carry risks in the event that our business does not develop as expected or there are changes in the market for our common stock or in the capital and financial markets generally.
We operate in a highly regulated environment and changes in laws and regulations to which we are subject may adversely affect our results of operations.
The banking industry in which we operate is subject to extensive regulation and supervision under federal and state laws and regulations. The restrictions imposed by such laws and regulations limit the manner in which we conduct our business, undertake new investments and activities and obtain financing. These regulations are designed primarily for the protection of the deposit insurance funds and consumers and not to benefit our shareholders. Financial institution regulation has been the subject of significant legislation in recent years and may be the subject of further significant legislation, none of which is in our control. Significant new laws or changes in, or repeals of, existing laws (including changes in federal or state laws affecting corporate taxpayers generally or financial institutions specifically) could have a material adverse effect on our business, financial condition, results of operations or liquidity. Further, federal monetary policy, particularly as implemented through the Federal Reserve System, significantly affects credit conditions, and any unfavorable change in these conditions could have a material adverse effect on our business, financial condition, results of operations or liquidity. See also Part I, Item 1, “Business -- Supervision and Regulation of Banking Activities."
The manner in which we report our financial condition and results of operations may be affected by accounting changes.
Our financial condition and results of operations that are presented in the Consolidated Financial Statements, accompanying Notes to the Consolidated Financial Statements, and selected financial data appearing elsewhere within this report, are, to a large degree, dependent upon our accounting policies. The selection of and application of these policies involve estimates, judgments and uncertainties that are subject to change, and the effect of any change in estimates or judgments that might be caused by future developments or resolution of uncertainties could be materially adverse to our reported financial condition and results of operations. See the discussion of critical accounting policies and estimates that we have determined to be the most susceptible to change in the near term that is included in the section captioned “Critical Accounting Policies and Estimates” in Part II, Item 7 (“Management’s Discussion and Analysis of Financial Condition and Results of Operations”) for a complete discussion. In addition, authorities that prescribe accounting principles and standards for public companies from time to time change those principles or standards or adopt formal or informal interpretations of existing principles or standards, which changes or interpretations (to the extent applicable to us) could result in changes that would be materially adverse to our reported financial condition and results of operations.
Item 1B. Unresolved Staff Comments.
None.
Item 2. Properties.
The Company’s executive offices are located in the main office building of its bank subsidiary, German American Bancorp, at 711 Main Street, Jasper, Indiana. The main office building contains approximately 23,600 square feet of office space. The Company’s subsidiaries conduct their operations from 34 other locations in Southern Indiana.
Item 3. Legal Proceedings.
There are no material pending legal proceedings, other than routine litigation incidental to the business of the Company’s subsidiaries, to which the Company or any of its subsidiaries is a party or of which any of their property is the subject.
Item 4. Submission of Matters to a Vote of Security Holders.
There were no matters submitted during the fourth quarter of 2007 to a vote of security holders, by solicitation of proxies or otherwise.
PART II
Item 5. Market for Registrant’s Common Equity, Related Stockholder Matters and Issuer Purchases of Equity Securities.
Market and Dividend Information
German American Bancorp, Inc.’s stock is traded on NASDAQ’s Global Select Market under the symbol GABC. The quarterly high and low closing prices for the Company’s common stock as reported by NASDAQ and quarterly cash dividends declared and paid are set forth in the table below.
| | | 2007 | | 2006 | |
| | | | | | | Cash | | | | | | Cash | |
| | | High | | Low | | Dividend | | High | | Low | | Dividend | |
| | | | | | | | | | | | | | |
Fourth Quarter | | $ | 14.00 | | $ | 12.12 | | $ | 0.140 | | $ | 14.41 | | $ | 13.59 | | $ | 0.140 | |
Third Quarter | | $ | 14.09 | | $ | 11.91 | | $ | 0.140 | | $ | 14.39 | | $ | 12.89 | | $ | 0.140 | |
Second Quarter | | $ | 14.45 | | $ | 13.10 | | $ | 0.140 | | $ | 13.65 | | $ | 12.90 | | $ | 0.140 | |
First Quarter | | $ | 14.50 | | $ | 13.22 | | $ | 0.140 | | $ | 13.70 | | $ | 12.83 | | $ | 0.140 | |
| | | | | | | | | $ | 0.560 | | | | | | | | $ | 0.560 | |
The Common Stock was held of record by approximately 3,641 shareholders at March 1, 2008.
Cash dividends paid to the Company’s shareholders are primarily funded from dividends received by the parent company from its bank subsidiary. The declaration and payment of future dividends will depend upon the earnings and financial condition of the Company and its subsidiaries, general economic conditions, compliance with regulatory requirements affecting the ability of the bank subsidiary to declare dividends, and other factors.
Transfer Agent: | | Computershare | Shareholder | | Terri A. Eckerle |
| | | Priority Processing | Information and | | German American Bancorp, Inc |
| | | 250 Royall St | Corporate Office: | | P. O. Box 810 |
| | | Canton, MA 02021 | | | Jasper, Indiana 47547-0810 |
| | | Contact: Shareholder Relations | | | (812) 482-1314 |
| | | (800) 884-4225 | | | (800) 482-1314 |
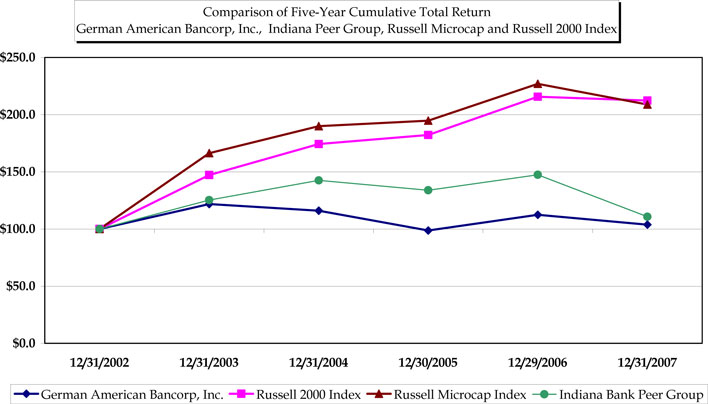
Stock Performance Graph
The following graph compares the Company’s five-year cumulative total returns with those of the Russell 2000 Stock Index, Russell Microcap Stock Index, and the Indiana Bank Peer Group. The Indiana Bank Peer Group (which is a custom peer group identified by Company management) includes all Indiana-based commercial bank holding companies (excluding companies owning thrift institutions that are not regulated as bank holding companies) that have been in existence as commercial bank holding companies throughout the five-year period ended December 2007, the stocks of which have been traded on an established securities market (NYSE, AMEX, NASDAQ) throughout that five-year period. The returns of each company in the Indiana Bank Peer Group have been weighted to reflect the company’s market capitalization. The Russell 2000® Stock Index, which is designed to measure the performance of the small-cap segment of the U.S. equity universe, is a subset of the Russell 3000® Index (which measures the performance of the largest 3000 U.S. companies) that includes approximately 2,000 of the smallest securities in that index based on a combination of their market cap and current index membership, and is annually reconstituted at the end of each June. The Company’s stock was included in the Russell 2000 through June 2005. The Russell Microcap® Stock Index is an index representing the smallest 1,000 securities in the small-cap Russell 2000 Index plus the next 1,000 securities, which is also annually reconstituted at the end of each June. The Company’s stock is currently included in the Russell Microcap Index.
| Return based on $100 invested on December 31, 2002 and the reinvestment of dividends |
Stock Repurchase Program Information
The following table sets forth information regarding the Company's purchases of its common shares during each of the three months ended December 31, 2007.
| | | Total | | | | | | Maximum Number | |
| | | Number | | | | Total Number of Shares | | (or Approximate Dollar | |
| | | Of Shares | | Average Price | | (or Units) Purchased as Part | | Value) of Shares (or Units) | |
| | | (or Units) | | Paid Per Share | | of Publicly Announced Plans | | that May Yet Be Purchased | |
Period | | Purchased | | (or Unit) | | or Programs | | Under the Plans or Programs (1) | |
| | | | | | | | | | |
| October 2007 | | | — | | | — | | | — | | | 272,789 | |
| November 2007 | | | — | | | — | | | — | | | 272,789 | |
| December 2007 | | | — | | | — | | | — | | | 272,789 | |
(1) On April 26, 2001, the Company announced that its Board of Directors had approved a stock repurchase program for up to 607,754 of its outstanding common shares, of which the Company had purchased 334,965 common shares through December 31, 2007 (both such numbers adjusted for subsequent stock dividends). The Board of Directors established no expiration date for this program. The Company purchased no shares under this program during the quarter ended December 31, 2007.
Item 6. Selected Financial Data.
The following selected data should be read in conjunction with the consolidated financial statements and related notes that are included in Item 8 of this Report, and “Management's Discussion and Analysis of Financial Condition and Results of Operations,” which is included in Item 7 of this Report (dollars in thousands, except per share data).
| | | 2007 | | 2006 | | 2005 | | 2004 | | 2003 | |
Summary of Operations: | | | | | | | | | | | |
| Interest Income | | $ | 72,261 | | $ | 63,594 | | $ | 50,197 | | $ | 47,710 | | $ | 50,619 | |
| Interest Expense | | | 33,646 | | | 27,398 | | | 17,984 | | | 16,471 | | | 21,084 | |
| Net Interest Income | | | 38,615 | | | 36,196 | | | 32,213 | | | 31,239 | | | 29,535 | |
| Provision for Loan Losses | | | 3,591 | | | 925 | | | 1,903 | | | 2,015 | | | 811 | |
| Net Interest Income after Provision | | | | | | | | | | | | | | | | |
| For Loan Losses | | | 35,024 | | | 35,271 | | | 30,310 | | | 29,224 | | | 28,724 | |
| Non-interest Income | | | 15,704 | | | 15,993 | | | 14,502 | | | 9,620 | | | 12,934 | |
| Non-interest Expense | | | 37,221 | | | 37,059 | | | 31,756 | | | 30,609 | | | | (2) |
| Income before Income Taxes | | | 13,507 | | | 14,205 | | | 13,056 | | | 8,235 | | | 9,439 | |
| Income Tax Expense | | | 4,102 | | | 3,984 | | | 3,335 | | | 996 | | | 1,271 | |
| Net Income | | $ | 9,405 | | $ | 10,221 | | $ | 9,721 | | $ | 7,239 | | $ | 8,168 | |
| | | | | | | | | | | | | | | | | |
Year-end Balances: | | | | | | | | | | | | | | | | |
| Total Assets | | $ | 1,131,710 | | $ | 1,093,424 | | $ | 946,467 | | $ | 942,094 | | $ | 925,946 | |
| Total Loans, Net of Unearned Income | | | 867,721 | | | 796,259 | | | 651,956 | | | 629,793 | | | 611,866 | |
| Total Deposits | | | 877,421 | | | 867,618 | | | 746,821 | | | 750,383 | | | 717,133 | |
| Total Long-term Debt | | | 86,786 | | | 68,333 | | | 66,606 | | | 69,941 | | | | (2) |
| Total Shareholders’ Equity | | | 97,116 | | | 92,391 | | | 82,255 | | | 83,669 | | | 83,126 | |
| | | | | | | | | | | | | | | | | |
Average Balances: | | | | | | | | | | | | | | | | |
| Total Assets | | $ | 1,114,140 | | $ | 1,029,838 | | $ | 925,851 | | $ | 927,528 | | $ | 938,992 | |
| Total Loans, Net of Unearned Income | | | 840,849 | | | 715,260 | | | 634,526 | | | 622,240 | | | 618,340 | |
| Total Deposits | | | 889,736 | | | 814,440 | | | 730,220 | | | 731,467 | | | 711,310 | |
| Total Shareholders’ Equity | | | 93,677 | | | 88,451 | | | 84,479 | | | 82,558 | | | 87,703 | |
| | | | | | | | | | | | | | | | | |
Per Share Data (3): | | | | | | | | | | | | | | | | |
| Net Income | | $ | 0.85 | | $ | 0.93 | | $ | 0.89 | | $ | 0.66 | | $ | 0.73 | |
| Cash Dividends | | | 0.56 | | | 0.56 | | | 0.56 | | | 0.56 | | | 0.53 | |
| Book Value at Year-end | | | 8.81 | | | 8.39 | | | 7.73 | | | 7.68 | | | 7.60 | |
| | | | | | | | | | | | | | | | | |
Other Data at Year-end: | | | | | | | | | | | | | | | | |
| Number of Shareholders | | | 3,647 | | | 3,438 | | | 3,494 | | | 3,219 | | | 3,198 | |
| Number of Employees | | | 371 | | | 397 | | | 367 | | | 372 | | | 383 | |
Weighted Average Number of Shares (3) | | | 11,009,536 | | | 10,994,739 | | | 10,890,987 | | | 10,914,622 | | | 11,176,766 | |
| | | | | | | | | | | | | | | | | |
Selected Performance Ratios: | | | | | | | | | | | | | | | | |
| Return on Assets | | | 0.84 | % | | 0.99 | % | | 1.05 | % | | 0.78 | % | | 0.87 | % |
| Return on Equity | | | 10.04 | % | | 11.56 | % | | 11.51 | % | | 8.77 | % | | 9.31 | % |
| Equity to Assets | | | 8.58 | % | | 8.45 | % | | 8.69 | % | | 8.88 | % | | 8.98 | % |
| Dividend Payout | | | 65.65 | % | | 60.29 | % | | 62.83 | % | | 84.46 | % | | 73.26 | % |
| Net Charge-offs to Average Loans | | | 0.32 | % | | 0.50 | % | | 0.26 | % | | 0.24 | % | | 0.14 | % |
| Allowance for Loan Losses to Loans | | | 0.93 | % | | 0.90 | % | | 1.42 | % | | 1.40 | % | | 1.35 | % |
| Net Interest Margin | | | 3.83 | % | | 3.96 | % | | 3.92 | % | | 3.86 | % | | 3.61 | % |
(1) | In 2004, the Company recognized a $3.7 million non-cash pre-tax charge (which reduced Non-interest Income) for the other-than-temporary decline in value of its FHLMC and FNMA preferred stock portfolio. In 2006, the Company sold these same FHLMC and FNMA preferred stocks and recognized a pre-tax gain of $951. |
(2) | In 2003, the Company prepaid $40.0 million of FHLB borrowings within its mortgage banking segment. The prepayment fees associated with the extinguishment of these borrowings totaled $1.9 million. |
(3) | Share and Per Share Data excludes the dilutive effect of stock options. |
Year to year financial information comparability is affected by the purchase accounting treatment for mergers and acquisitions. See Note 18 to the Company’s consolidated financial statements included in Item 8 of this Report.
Item 7. Management’s Discussion and Analysis of Financial Condition and Results of Operations.
German American Bancorp, Inc. is a financial services holding company based in Jasper, Indiana. The Company’s Common Stock is traded on NASDAQ’s Global Select Market, under the symbol GABC. The principal subsidiary of German American Bancorp, Inc., is its banking subsidiary, German American Bancorp, which operates through six community banking affiliates with 28 retail banking offices in the ten contiguous Southern Indiana counties of Daviess, Dubois, Gibson, Knox, Lawrence, Martin, Monroe, Perry, Pike, and Spencer. German American Bancorp, Inc., also owns a trust, brokerage, and financial planning subsidiary, which operates from the banking offices of the bank subsidiary, and full line property and casualty insurance agency with six insurance agency offices throughout its market area.
Throughout this Management’s Discussion and Analysis, as elsewhere in this report, when we use the term “Company”, we will usually be referring to the business and affairs (financial and otherwise) of the Company and its subsidiaries and affiliates as a whole. Occasionally, we will refer to the term “parent company” or “holding company” when we mean to refer to only German American Bancorp, Inc.
The information in this Management’s Discussion and Analysis is presented as an analysis of the major components of the Company’s operations for the years 2005 through 2007 and its financial condition as of December 31, 2007 and 2006. This information should be read in conjunction with the accompanying consolidated financial statements and footnotes contained elsewhere in this report and with the description of business included in Item 1 of this Report (including the cautionary disclosure regarding “Forward Looking Statements and Associated Risks”). Financial and other information by segment is included in Note 16 to the Company’s consolidated financial statements included in Item 8 of this Report and is incorporated into this Item 7 by reference.
The statements of management's expectations and goals concerning the Company's future operations and performance that are set forth in the following Management Overview and in other sections of this Item 7 (including but not limited to statements regarding the Company’s Effectiveness Plan described in Item 1 of the report) are forward-looking statements, and readers are cautioned that these forward-looking statements are based on assumptions and are subject to risks, uncertainties, and other factors. Actual results may differ materially from the expectations of the Company that is expressed or implied by any forward-looking statement. This Item 7, as well as the discussions in Item 1 ("Business") entitled "Forward-Looking Statements and Associated Risks" and in Item 1A (“Risk Factors”) (which discussions are incorporated in this Item 7 by reference) list some of the factors that could cause the Company's actual results to vary materially from those expressed or implied by any such forward-looking statements.
MANAGEMENT OVERVIEW
The Company’s net income declined 8% in 2007 compared with 2006. The Company’s 2007 net income totaled $9,405,000, or $0.85 per share, compared with $10,221,000, or $0.93 per share, for 2006. The Company's results for 2007 have been adversely affected by higher levels of provisions for loan losses, as discussed below, attributable largely to the resolution of certain specific credits (discussed below) during 2007 and to additional provision necessary in connection with the growth in the Company's loans. Also contributing to the lower level of earnings was an other-than-temporary impairment charge on the Company’s equity securities portfolio during 2007 compounded by a gain the Company recognized on the sale of its agency-issued preferred stocks during 2006. Current year earnings were positively affected by increases within the Company’s net interest income and non-interest income, exclusive of securities gains and losses. The improvement in the level of net interest income was largely attributable to strong loan growth. Loans outstanding grew by $72.0 million or 9% during 2007 following an increase of $145.1 million or 22% during 2006. The Company experienced double digit percentage growth in trust and investment product fees, service charges on deposit accounts, and insurance revenues during 2007.
Management also continues to focus on the control of the Company's operating expenses, and believes that the fact that operating expenses declined in the second half of 2007 and increased by less than one percent during 2007 compared to 2006 has contributed to an increase in the Company's overall operating efficiency. As discussed in Item 1 of this Report, “Business”, under “Effectiveness Plan” (which discussion is incorporated into this Management Overview by reference), the Company intends to take by the end of 2008 certain tactical steps (including steps that are designed to enhance non-interest income and to reduce non-interest expense) to improve its operating effectiveness and efficiency. Future results of operations may be impacted by non-routine charges to non-interest expense that may be recorded as a result of the implementation of the Effectiveness Plan during 2008, and by the expected longer-term benefits of the Effectiveness Plan that the Company anticipates realizing as early as 2009 in the areas of non-interest income and non-interest expense. Readers are cautioned to review the cautionary statements concerning the Effectiveness Plan that are included in the discussion entitled "Forward-Looking Statements and Associated Risks" that is included in Item 1 of this report and has already been incorporated into this Item 7 by reference.
MERGERS AND ACQUISITIONS
On October 1, 2005 PCB Holding Company (“PCB”) merged with and into the Company. PCB’s sole banking subsidiary, Peoples Community Bank, operated two banking offices in Tell City, Indiana. PCB’s assets and equity (unaudited) as of September 30, 2005 totaled $34.6 million and $4.8 million, respectively. Under the terms of the merger, the shareholders of PCB received an aggregate of 257,029 shares of common stock of the Company valued at approximately $3.5 million and approximately $3.2 million of cash, representing a total transaction value of $6.7 million. This merger was accounted for under the purchase method of accounting.
On January 1, 2006, Stone City Bancshares, Inc. (“Stone City”) merged with and into the Company, and as a result the Company acquired all of the stock of Stone City’s sole banking subsidiary, Stone City Bank of Bedford, Indiana, which operated two banking offices in Bedford, Indiana. Stone City’s assets and equity as of December 31, 2005 totaled $61.2 million and $5.4 million, respectively. Under the terms of the merger, the shareholders of Stone City received aggregate cash payments of approximately $6.4 million and 349,468 common shares of the Company valued during a pre-closing valuation period of approximately $4.6 million, representing a total transaction value of approximately $11.0 million. This merger was accounted for under the purchase method of accounting.
On October 1, 2006 the Company acquired substantially all of the assets, net of certain assumed liabilities of Keach and Grove Insurance, Inc. of Bedford, Indiana. The agency operations became a part of German American Insurance, Inc., the Company’s property and casualty insurance entity. The purchase price for this transaction was $2.26 million in cash. This merger was accounted for under the purchase method of accounting.
CRITICAL ACCOUNTING POLICIES AND ESTIMATESINTRODUCTION |
The financial condition and results of operations for German American Bancorp, Inc. presented in the Consolidated Financial Statements, accompanying Notes to the Consolidated Financial Statements, and selected financial data appearing elsewhere within this report, are, to a large degree, dependent upon the Company’s accounting policies. The selection of and application of these policies involve estimates, judgments and uncertainties that are subject to change. The critical accounting policies and estimates that the Company has determined to be the most susceptible to change in the near term relate to the determination of the allowance for loan losses, the valuation of securities available for sale, and the valuation allowance on deferred tax assets.
Allowance for Loan Losses
The Company maintains an allowance for loan losses to cover probable incurred credit losses at the balance sheet date. Loan losses are charged against the allowance when management believes the uncollectibility of a loan balance is confirmed. Subsequent recoveries, if any, are credited to the allowance. Allocations of the allowance may be made for specific loans, but the entire allowance is available for any loan that, in management’s judgment, should be charged-off. A provision for loan losses is charged to operations based on management's periodic evaluation of the necessary allowance balance. Evaluations are conducted at least quarterly and more often if deemed necessary. The ultimate recovery of all loans is susceptible to future market factors beyond the Company's control.
The Company has an established process to determine the adequacy of the allowance for loan losses. The determination of the allowance is inherently subjective, as it requires significant estimates, including the amounts and timing of expected future cash flows on impaired loans, estimated losses on other classified loans and pools of homogeneous loans, and consideration of past loan loss experience, the nature and volume of the portfolio, information about specific borrower situations and estimated collateral values, economic conditions, and other factors, all of which may be susceptible to significant change. The allowance consists of two components of allocations, specific and general. These two components represent the total allowance for loan losses deemed adequate to cover losses inherent in the loan portfolio.
Commercial and agricultural loans are subject to a standardized grading process administered by an internal loan review function. The need for specific reserves is considered for credits when graded substandard or special mention, or when: (a) the customer’s cash flow or net worth appears insufficient to repay the loan; (b) the loan has been criticized in a regulatory examination; (c) the loan is on non-accrual; or, (d) other reasons where the ultimate collectibility of the loan is in question, or the loan characteristics require special monitoring. Specific allowances are established in cases where management has identified significant conditions or circumstances related to an individual credit that we believe indicates the loan is impaired. Specific allocations on impaired loans are determined by comparing the loan balance to the present value of expected cash flows or expected collateral proceeds. Allocations are also applied to categories of loans not considered individually impaired but for which the rate of loss is expected to be greater than historical averages, including those graded substandard or special mention and non-performing consumer or residential real estate loans. Such allocations are based on past loss experience and information about specific borrower situations and estimated collateral values.
General allocations are made for other pools of loans, including non-classified loans, homogeneous portfolios of consumer and residential real estate loans, and loans within certain industry categories believed to present unique risk of loss. General allocations of the allowance are primarily made based on a five-year historical average for loan losses for these portfolios, judgmentally adjusted for economic factors and portfolio trends.
Due to the imprecise nature of estimating the allowance for loan losses, the Company’s allowance for loan losses includes a minor unallocated component. The unallocated component of the allowance for loan losses incorporates the Company’s judgmental determination of inherent losses that may not be fully reflected in other allocations, including factors such as economic uncertainties, lending staff quality, industry trends impacting specific portfolio segments, and broad portfolio quality trends. Therefore, the ratio of allocated to unallocated components within the total allowance may fluctuate from period to period.
Securities Valuation
Securities available-for-sale are carried at fair value, with unrealized holding gains and losses reported separately in accumulated other comprehensive income (loss), net of tax. The Company obtains market values from a third party on a monthly basis in order to adjust the securities to fair value. Equity securities that do not have readily determinable fair values are carried at cost. Additionally, all securities are required to be written down to fair value when a decline in fair value is other than temporary; therefore, future changes in the fair value of securities could have a significant impact on the Company’s operating results. In determining whether a market value decline is other than temporary, management considers the reason for the decline, the extent of the decline and the duration of the decline. As of December 31, 2007, gross unrealized losses on the securities available-for-sale portfolio totaled approximately $422,000.
Income Tax Expense
Income tax expense involves estimates related to the valuation allowance on deferred tax assets and loss contingencies related to exposure from tax examinations.
A valuation allowance reduces deferred tax assets to the amount management believes is more likely than not to be realized. In evaluating the realization of deferred tax assets, management considers the likelihood that sufficient taxable income of appropriate character will be generated within carryback and carryforward periods, including consideration of available tax planning strategies. As of December 31, 2007, the Company had a deferred tax asset of $649,000 which includes tax credit carryforwards of $403,000. Based on the long carryforward periods available, management has assessed it more likely than not that these credits will be realized and no valuation allowance has been established on this asset.
Tax related loss contingencies, including assessments arising from tax examinations and tax strategies, are recorded as liabilities when the likelihood of loss is probable and an amount or range of loss can be reasonably estimated. In considering the likelihood of loss, management considers the nature of the contingency, the progress of any examination or related protest or appeal, the views of legal counsel and other advisors, experience of the Company or other enterprises in similar matters, if any, and management’s intended response to any assessment.
Net income declined $816,000 or 8% to $9,405,000 or $0.85 per share in 2007 compared to $10,221,000 or $0.93 per share in 2006. The decline in earnings during 2007 was largely the result of a $2,666,000 increase in the provision for loan losses. Partially mitigating the increased provision was an increase in net interest income of $2,419,000. Non-interest income declined $289,000 or 2% during 2007 while non-interest expense increased by $162,000 or less than 1% during 2007.
Net income increased $500,000 or 5% to $10,221,000 or $0.93 per share in 2006 compared to $9,721,000 or $0.89 per share during 2005. The increase in net income during 2006 compared with 2005 was attributable principally to an increase in net interest income of $3,983,000, a reduction in provision for loan losses of $978,000, and a gain on the sale of the Company’s portfolio of agency preferred stock of $951,000, which were partially mitigated by an increase of $5,303,000 in non-interest expense. The increases in net interest income and non-interest expenses were largely attributable to acquisitions of PCB Holding Company and Stone City Bancshares, Inc., which are discussed in Note 18 to the consolidated financial statements included in Item 8 of this Report.
NET INTEREST INCOME
Net interest income is the Company’s single largest source of earnings, and represents the difference between interest and fees realized on earning assets, less interest paid on deposits and borrowed funds. Several factors contribute to the determination of net interest income and net interest margin, including the volume and mix of earning assets, interest rates, and income taxes. Many factors affecting net interest income are subject to control by management policies and actions. Factors beyond the control of management include the general level of credit and deposit demand, Federal Reserve Board monetary policy, and changes in tax laws.
Net interest income increased $2,419,000 or 7% (an increase of $1,953,000 or 5% on a tax-equivalent basis) for the year ended 2007 compared with 2006. The increase in net interest income was primarily attributable to an increased level of average earning assets for the year ended 2007 compared with 2006. The higher level of earning assets was primarily attributable to an increase in the average level of loans outstanding, and in particular a higher level of average commercial and agricultural loans. Average earning assets totaled $1.023 billion during 2007 compared with $941.6 million during 2006.
For 2007, the net interest margin decreased to 3.83% compared to 3.96% during 2006. Net interest margin is tax equivalent net interest income expressed as a percentage of average earning assets. The Company’s yield on earning assets totaled 7.12% compared with a cost of funds (expressed as a percentage of average earning assets) of 3.29% netting to a net interest margin of 3.83% for the year ended December 31, 2007. The Company’s yield on earning assets was 6.87% compared with a cost of funds of 2.91% netting to a net interest margin of 3.96% for the year ended December 31, 2006.
Net interest income increased $3,983,000 or 12% (an increase of $3,809,000 or 11% on a tax-equivalent basis) for the year ended 2006 compared with 2005. The increase in net interest income was primarily attributable to an increased level of average earning assets and an increased net interest margin for the year ended 2006 compared with 2005. The higher level of earning assets was primarily attributable to an increase in the average level of loans outstanding that resulted from new loan activity and from the previously discussed banking acquisitions completed effective October 1, 2005 and effective January 1, 2006. Average earning assets totaled $941.6 million during 2006 compared with $853.3 million during 2005.
For 2006, the net interest margin increased to 3.96% compared to 3.92% during 2005. The Company’s yield on earning assets totaled 6.87% compared with a cost of funds (expressed as a percentage of average earning assets) of 2.91% producing the net interest margin of 3.96% for the year ended December 31, 2006. The Company’s yield on earning assets was 6.03% compared with a cost of funds of 2.11% netting to a net interest margin of 3.92% for the year ended December 31, 2005.
The following table summarizes net interest income (on a tax-equivalent basis) for each of the past three years. For tax-equivalent adjustments, an effective tax rate of 34% was used for all years presented (1).
| | | Average Balance Sheet | | | | | | | |
| | | (Tax-equivalent basis / dollars in thousands) | | | | | | | |
| | | Twelve Months Ended | | Twelve Months Ended | | Twelve Months Ended | |
| | | December 31, 2007 | | December 31, 2006 | | December 31, 2005 | |
| | | Principal | | Income/ | | Yield / | | Principal | | Income/ | | Yield / | | Principal | | Income/ | | Yield / | |
| | | Balance | | Expense | | Rate | | Balance | | Expense | | Rate | | Balance | | Expense | | Rate | |
| | | | | | | | | | | | | | | | | | | | |
ASSETS | | | | | | | | | | | | | | | | | | | |
Federal Funds Sold and Other Short-term Investments | | $ | 9,626 | | $ | 478 | | | 4.96% | | $ | 10,971 | | $ | 545 | | | 4.97 | % | $ | 10,632 | | $ | 316 | | | 2.97 | % |
| | | | | | | | | | | | | | | | | | | | | | | | | | | | | |
| Securities: | | | | | | | | | | | | | | | | | | | | | | | | | | | | |
| Taxable | | | 149,108 | | | 6,992 | | | 4.69% | | | 174,007 | | | 7,763 | | | 4.46 | % | | 161,499 | | | 5,954 | | | 3.69 | % |
| Non-taxable | | | 23,913 | | | 1,423 | | | 5.95% | | | 41,312 | | | 2,721 | | | 6.59 | % | | 46,666 | | | 3,297 | | | 7.07 | % |
Total Loans and Leases (2) | | | 840,849 | | | 63,958 | | | 7.61% | | | 715,260 | | | 53,621 | | | 7.50 | % | | 634,526 | | | 41,860 | | | 6.60 | % |
| | | | | | | | | | | | | | | | | | | | | | | | | | | | | |
| TOTAL INTEREST EARNING ASSETS | | | 1,023,496 | | | 72,851 | | | 7.12% | | | 941,550 | | | 64,650 | | | 6.87 | % | | 853,323 | | | 51,427 | | | 6.03 | % |
| | | | | | | | | | | | | | | | | | | | | | | | | | | | | |
| Other Assets | | | 98,389 | | | | | | | | | 97,570 | | | | | | | | | 81,771 | | | | | | | |
| Less: Allowance for Loan Losses | | | (7,745 | ) | | | | | | | | (9,282 | ) | | | | | | | | (9,243 | ) | | | | | | |
| | | | | | | | | | | | | | | | | | | | | | | | | | | | | |
| TOTAL ASSETS | | $ | 1,114,140 | | | | | | | | $ | 1,029,838 | | | | | | | | $ | 925,851 | | | | | | | |
| | | | | | | | | | | | | | | | | | | | | | | | | | | | | |
LIABILITIES AND SHAREHOLDERS’ EQUITY | | | | | | | | | | | | | | | | | | | | | | | | | | | | |
| Interest-Bearing Demand Deposits | | $ | 153,033 | | $ | 3,280 | | | 2.14% | | $ | 140,786 | | $ | 2,625 | | | 1.86 | % | $ | 137,318 | | $ | 1,436 | | | 1.05 | % |
| Savings Deposits | | | 177,001 | | | 4,858 | | | 2.74% | | | 174,095 | | | 4,263 | | | 2.45 | % | | 156,820 | | | 2,212 | | | 1.41 | % |
| Time Deposits | | | 425,878 | | | 19,151 | | | 4.50% | | | 369,800 | | | 14,441 | | | 3.91 | % | | 314,420 | | | 9,741 | | | 3.10 | % |
| FHLB Advances and Other Borrowings | | | 117,084 | | | 6,357 | | | 5.43% | | | 113,559 | | | 6,069 | | | 5.34 | % | | 98,932 | | | 4,595 | | | 4.64 | % |
| | | | | | | | | | | | | | | | | | | | | | | | | | | | | |
| TOTAL INTEREST-BEARING LIABILITIES | | | 872,996 | | | 33,646 | | | 3.85% | | | 798,240 | | | 27,398 | | | 3.43 | % | | 707,490 | | | 17,984 | | | 2.54 | % |
| | | | | | | | | | | | | | | | | | | | | | | | | | | | | |
| Demand Deposit Accounts | | | 133,824 | | | | | | | | | 129,759 | | | | | | | | | 121,662 | | | | | | | |
| Other Liabilities | | | 13,643 | | | | | | | | | 13,388 | | | | | | | | | 12,220 | | | | | | | |
| TOTAL LIABILITIES | | | 1,020,463 | | | | | | | | | 941,387 | | | | | | | | | 841,372 | | | | | | | |
| | | | | | | | | | | | | | | | | | | | | | | | | | | | | |
| Shareholders’ Equity | | | 93,677 | | | | | | | | | 88,451 | | | | | | | | | 84,479 | | | | | | | |
| | | | | | | | | | | | | | | | | | | | | | | | | | | | | |
| TOTAL LIABILITIES AND SHAREHOLDERS’ EQUITY | | $ | 1,114,140 | | | | | | | | $ | 1,029,838 | | | | | | | | $ | 925,851 | | | | | | | |
| NET INTEREST INCOME | | | | | $ | 39,205 | | | | | | | | $ | 37,252 | | | | | | | | $ | 33,443 | | | | |
| NET INTEREST MARGIN | | | | | | | | | 3.83% | | | | | | | | | 3.96 | % | | | | | | | | 3.92 | % |
(1) | | Effective tax rates were determined as though interest earned on the Company’s investments in municipal bonds and loans was fully taxable. |
| (2) | | Loans held-for-sale and non-accruing loans have been included in average loans. Interest income on loans includes loan fees of $806, $1,727, and $1,326 for 2007, 2006, and 2005, respectively. |
The following table sets forth for the periods indicated a summary of the changes in interest income and interest expense resulting from changes in volume and changes in rates:
Net Interest Income – Rate/Volume Analysis:
(Tax-Equivalent basis, dollars in thousands)
| | | 2007 compared to 2006 | | 2006 compared to 2005 | |
| | | Increase / (Decrease) Due to (1) | | Increase / (Decrease) Due to (1) | |
| | | Volume | | Rate | | Net | | Volume | | Rate | | Net | |
| Interest Income: | | | | | | | | | | | | | |
| Federal Funds Sold and Other Short-term Investments | | $ | (67 | ) | $ | — | | $ | (67 | ) | $ | 10 | | $ | 219 | | $ | 229 | |
| Taxable Securities | | | (1,153 | ) | | 382 | | | (771 | ) | | 487 | | | 1,322 | | | 1,809 | |
| Non-taxable Securities | | | (1,056 | ) | | (242 | ) | | (1,298 | ) | | (362 | ) | | (214 | ) | | (576 | ) |
| Loans and Leases | | | 9,542 | | | 795 | | | 10,337 | | | 5,677 | | | 6,084 | | | 11,761 | |
| Total Interest Income | | | 7,266 | | | 935 | | | 8,201 | | | 5,812 | | | 7,411 | | | 13,223 | |
| | | | | | | | | | | | | | | | | | | | |
| Interest Expense: | | | | | | | | | | | | | | | | | | | |
| Savings and Interest-bearing Demand | | | 344 | | | 906 | | | 1,250 | | | 274 | | | 2,966 | | | 3,240 | |
| Time Deposits | | | 2,356 | | | 2,354 | | | 4,710 | | | 1,896 | | | 2,804 | | | 4,700 | |
| FHLB Advances and Other Borrowings | | | 190 | | | 98 | | | 288 | | | 730 | | | 744 | | | 1,474 | |
| Total Interest Expense | | | 2,890 | | | 3,358 | | | 6,248 | | | 2,900 | | | 6,514 | | | 9,414 | |
| | | | | | | | | | | | | | | | | | | | |
| Net Interest Income | | $ | 4,376 | | $ | (2,423 | | $ | 1,953 | | $ | 2,912 | | $ | 897 | | $ | 3,809 | |
| (1) | The change in interest due to both rate and volume has been allocated to volume and rate changes in proportion to the relationship of the absolute dollar amounts of the change in each. |
See the Company’s Average Balance Sheet and the discussions headed USES OF FUNDS, SOURCES OF FUNDS, and “RISK MANAGEMENT – Liquidity and Interest Rate Risk Management” for further information on the Company’s net interest income, net interest margin, and interest rate sensitivity position.
PROVISION FOR LOAN LOSSES
The Company provides for loan losses through regular provisions to the allowance for loan losses. The provision is affected by net charge-offs on loans and changes in specific and general allocations required on the allowance for loan losses. Provisions for loan losses totaled $3,591,000, $925,000, and $1,903,000 in 2007, 2006 and 2005, respectively.
The increased level of provision for loan losses during 2007 was largely attributable to a write-down of a single non-performing credit facility secured by two hotel properties at the time the properties were acquired by deed in lieu of foreclosure and moved into other real estate owned during the first quarter of 2007. During the first quarter of 2007, the write-down and additional provision for loan loss on this credit totaled $1,300,000 with an additional $160,000 in indirect provision charges recognized due to the impact of this write-down on the Company’s historical loss ratios and resulting required reserve levels. Also contributing to the elevated level of provision during 2007 was the Company’s loan growth.
Finally, another contributing factor to the elevated levels of provision during the year ended December 31, 2007 compared with 2006 was the finalization of settlement of a large non-performing credit in the second quarter of 2006. The Company recognized a charge-off of approximately $393,000 on this individual credit facility. The specific allocation as of year end 2005 was for considerably more than the level of charge-off allowing the Company to recover the balance of the specific allocation assigned to the credit during 2006, impacting the comparability of 2006 and 2007 provision for loan losses.
The Company’s provision for loan losses declined during 2006 in conjunction with a decline in the Company’s level of non-performing loans. The largest factor in the Company’s ability to recognize the reduced level of provision for loan losses was the finalization of settlement of a previously identified large nonperforming credit in the second quarter of 2006 that was previously discussed.
These provisions were made at a level deemed necessary by management to absorb estimated, probable incurred losses in the loan portfolio. A detailed evaluation of the adequacy of the allowance for loan losses is completed quarterly by management, the results of which are used to determine provisions for loan losses. Management estimates the allowance balance required using past loan loss experience, the nature and volume of the portfolio, information about specific borrower situations and estimated collateral values, economic conditions, and other factors. Refer also to the sections entitled CRITICAL ACCOUNTING POLICIES AND ESTIMATES and “RISK MANAGEMENT – Lending and Loan Administration” for further discussion of the provision and allowance for loan losses.
NON-INTEREST INCOME
During 2007, Non-interest Income declined $289,000 or 2% compared with 2006. The decline was primarily attributable to Net Gain / (Loss) on Securities largely offset by increases in Trust and Investment Product Fees, Service Charges on Deposit Accounts, and Insurance Revenues. During 2006, Non-interest Income totaled $15,993,000, an increase of 10% compared with 2005. The increase during 2006 was largely attributable to the gain on the sale of the Company’s FHLMC and FNMA preferred stock portfolio and an increase in revenues generated by the Company’s insurance operations.
| | | | | % Change From | |
Non-interest Income (dollars in thousands) | | Years Ended December 31, | | Prior Year | |
| | | 2007 | | 2006 | | 2005 | | 2007 | | 2006 | |
| Trust and Investment Product Fees | | $ | 2,590 | | $ | 2,210 | | $ | 2,081 | | | 17 | % | | 6 | % |
| Service Charges on Deposit Accounts | | | 4,361 | | | 3,901 | | | 3,723 | | | 12 | | | 5 | |
| Insurance Revenues | | | 5,794 | | | 5,094 | | | 4,703 | | | 14 | | | 8 | |
| Other Operating Income | | | 2,817 | | | 2,920 | | | 3,068 | | | (4 | ) | | (5 | ) |
| Subtotal | | | 15,562 | | | 14,125 | | | 13,575 | | | 10 | | | 4 | |
| Net Gains on Sales of Loans and Related Assets | | | 822 | | | 917 | | | 927 | | | (10 | ) | | (1 | ) |
| Net Gain / (Loss) on Securities | | | (680 | ) | | 951 | | | — | | | n/m | (1) | | n/m | (1) |
| TOTAL NON-INTEREST INCOME | | $ | 15,704 | | $ | 15,993 | | $ | 14,502 | | | (2 | ) | | 10 | |
(1) n/m = not meaningful
Trust and Investment Product Fees increased $380,000 or 17% during 2007 as compared to 2006. These increases were driven by increased levels of brokerage commission revenue. Service Charges on Deposit Accounts increased $460,000 or 12% during 2007 as compared to 2006. These increases were largely attributable to increased usage and fees associated with the Company’s overdraft protection service program.
Insurance Revenues increased $700,000 or 14% during 2007 as compared 2006. The increase in Insurance Revenues during 2007 was attributable primarily to commission income from Keach and Grove Insurance, Inc. which was acquired October 1, 2006 and thereby not included in the Company results during the first nine months of 2006. Insurance Revenues increased 8% for 2006 as compared 2005. The increased Insurance Revenues were primarily the result of a higher level of contingency revenues during 2006 compared with 2005, and the revenues generated from the previously mentioned insurance agency acquisition completed in the fourth quarter of 2006. For more information on the business combination, see Note 18 to the Company’s consolidated financial statements included in Item 8 of this Report.
Net Gains on Sales of Loans and Related Assets declined $95,000 or 10% during 2007 compared with 2006. The decline was attributable to the sale of the Company’s mortgage servicing rights portfolio during the second quarter of 2006. The Company sold its mortgage servicing rights relating to approximately $344.5 million of mortgage loans serviced for others for a total sales price of $3.6 million resulting in a net gain of $198,000. The gain on the sale of residential mortgage loans increased by $103,000 or 14% during 2007 due to an increase in the level of loans sold in the secondary market. Loan sales for 2007, 2006, and 2005 were $67.0 million, $55.6 million, and $64.1 million, respectively.
The Net Gain / (Loss) on Securities declined by $1,631,000 during 2007 compared with 2006. During 2007 the Company recognized a $680,000 net loss on securities related to the Company’s portfolio of non-controlling investments in other banking organizations. The net loss resulted from the sale of one of the investment holdings at a modest gain and the recognition of an other-than-temporary impairment expense in connection with the valuation of other holdings within the portfolio. The Company recognized a gain on the sale of its portfolio of FHLMC and FNMA preferred stock during 2006. The gain from the sale of this agency preferred stock portfolio totaled $951,000. The portfolio had a book value at the time of the sale of approximately $12.1 million. The Company had previously recorded a non-cash other-than-temporary impairment charge of $3.7 million on this portfolio during 2004.
NON-INTEREST EXPENSE
During 2007, Non-interest Expense remained stable with a less than 1% increase as compared with 2006. The modest increase during 2007 occurred despite the acquisition of Keach and Grove Insurance, Inc. in the fourth quarter of 2006 and the opening of a new branch banking facility in Bloomington, Indiana during the first quarter of 2007. Non-interest expenses at Keach and Grove Insurance, Inc. and the new branch facility totaled approximately $2,220,000 during 2007 compared with expenses for Keach and Grove Insurance, Inc. of approximately $283,000 during 2006. Absent these expenses, Non-interest Expense would have declined $1,774,000 or 5% during 2007 compared with 2006. For the year ended 2006, Non-interest Expense increased 17%. These increases in non-interest expense were largely attributable to the acquisitions of PCB Holding Company as of October 1, 2005 and Stone City Bancshares, Inc. as of January 1, 2006.
| | | | | % Change From | |
Non-interest Expense (dollars in thousands) | | Years Ended December 31, | | Prior Year | |
| | | 2007 | | 2006 | | 2005 | | 2007 | | 2006 | |
| Salaries and Employee Benefits | | $ | 21,671 | | $ | 21,491 | | $ | 18,511 | | | 1 | % | | 16 | % |
| Occupancy, Furniture and Equipment Expense | | | 5,379 | | | 4,988 | | | 4,404 | | | 8 | | | 13 | |
| FDIC Premiums | | | 103 | | | 108 | | | 101 | | | (5 | ) | | 7 | |
| Data Processing Fees | | | 1,370 | | | 1,646 | | | 1,322 | | | (17 | ) | | 25 | |
| Professional Fees | | | 1,418 | | | 1,786 | | | 1,703 | | | (21 | ) | | 5 | |
| Advertising and Promotion | | | 957 | | | 940 | | | 784 | | | 2 | | | 20 | |
| Supplies | | | 625 | | | 619 | | | 544 | | | 1 | | | 14 | |
| Other Operating Expenses | | | 5,698 | | | 5,481 | | | 4,387 | | | 4 | | | 25 | |
| TOTAL NON-INTEREST EXPENSE | | $ | 37,221 | | $ | 37,059 | | $ | 31,756 | | | 1 | | | 17 | |
Salaries and Employee Benefits Expense increased $180,000 or 1% during 2007 compared with 2006. This modest increase was related to the previously discussed insurance agency acquisition and branch facility opening. The costs associated with these increased $1,212,000 during 2007 compared with 2006. Absent these expenses, Salaries and Benefits Expense would have declined approximately 5% during 2007 compared with 2006 due primarily to a lower level of full-time equivalent employees. Salaries and Employee Benefits Expense increased 16% during 2006. The increase in Salaries and Employee Benefits Expense was primarily due to an increase in full-time equivalent employees attributable to the banking acquisitions completed effective October 1, 2005 and January 1, 2006. Also contributing to the increase in Salaries and Employee Benefits Expense to a lesser degree during 2006 compared with 2005 was the adoption of FAS 123R, “Share Based Payments,” as of January 1, 2006.
Occupancy, Furniture and Equipment Expense increased $391,000 or 8% during 2007 compared with 2006. This increase was primarily attributable to the previously discussed opening of the branch bank facility in Bloomington and the insurance agency acquisition. Occupancy, Furniture and Equipment Expense increased 13% during 2006 compared with 2005. The increase was primarily attributable to the acquisition activity during 2005 and 2006.
Data Processing Fees declined by $276,000 or 17% during 2007 compared with 2006. The decline was the result of a core processing computer conversion which occurred during the third quarter of 2006. Data Processing Fees increased 25% during 2006 compared with 2005. These increases were largely attributable to the banking acquisition activity completed during 2005 and 2006. Advertising and Promotion expense increased 2% during 2007 following an increase of 20% in 2006. The increase in 2006 compared with 2005 was largely attributable to the acquisition activity during 2006.
Other Operating Expenses increased $217,000 or 4% during 2007 compared to 2006. Included in the higher level of costs was increased collection costs associated primarily with the previously discussed non-performing hotel loans that were acquired by deed-in-lieu of foreclosure during the first quarter of 2007, increased intangible amortization resulting from the Keach and Grove Insurance, Inc. acquisition, and increased losses associated with fraudulent ATM and debit card transactions. These increases were partially offset by lower telephone costs and costs associated with the Company’s investment in affordable housing limited partnerships. Other Operating Expenses increased 25% during 2006. The increase was primarily attributable to a higher level of intangible amortization which resulted from the Company’s banking and insurance acquisitions during 2005 and 2006 and increased amortization and impairment charges during 2006 associated with one of the Company’s affordable housing limited partnership investments.
PROVISION FOR INCOME TAXES
The Company records a provision for current income taxes payable, along with a provision for deferred taxes payable in the future. Deferred taxes arise from temporary differences, which are items recorded for financial statement purposes in a different period than for income tax returns. The Company’s effective tax rate was 30.4%, 28.0%, and 25.5%, respectively, in 2007, 2006, and 2005. The higher effective tax rate in 2007 compared with 2006 was the result of a lower level of tax-exempt investment income. The higher effective tax rate in 2006 compared with 2005 was the result of higher levels of before tax net income combined with a lower level of tax-exempt investment income and a lower level of tax credits generated by investments in affordable housing projects. The effective tax rate in all periods is lower than the blended statutory rate of 39.6%. The lower effective rate in all periods primarily resulted from the Company’s tax-exempt investment income on securities and loans, income tax credits generated by investments in affordable housing projects, and income generated by subsidiaries domiciled in a state with no state or local income tax. See Note 11 to the Company’s consolidated financial statements included in Item 8 of this Report for additional details relative to the Company’s income tax provision.
The Company and its affiliate bank are subject to regulatory capital requirements administered by federal banking agencies. Capital adequacy guidelines and prompt corrective action regulations involve quantitative measures of assets, liabilities, and certain off-balance sheet items calculated under regulatory accounting practices. The prompt corrective action regulations provide five classifications, including well-capitalized, adequately capitalized, undercapitalized, significantly undercapitalized and critically undercapitalized, although these terms are not used to represent overall financial condition. The Company and its affiliate bank at year-end 2007 were categorized as well-capitalized as that term is defined by applicable regulations. See Note 9 to the Company’s consolidated financial statements included in Item 8 of this Report for actual and required capital ratios and for additional information regarding capital adequacy.
The Company continues to maintain a strong capital position. Shareholders’ equity totaled $97.1 million and $92.4 million at December 31, 2007 and 2006, respectively. Total equity represented 8.6% and 8.5%, respectively, of year-end total assets. The Company paid cash dividends of $6.2 million or $0.56 per share in 2007 and 2006. The increase in shareholders’ equity during 2007 compared with 2006 was primarily the result of increased retained earnings of $3.2 million and a change in the unrealized gain on available securities of $1.8 million.
LOANS
Total loans at year-end 2007 increased $72.0 million or 9% compared with year-end 2006. Commercial and industrial loans increased $54.8 million or 14%, agricultural loans increased $16.7 million or 11%, and residential mortgage loans increased $2.2 million or 2% during 2007 while consumer loans declined $1.7 million or 1% during 2007. A majority of the total loan growth during 2007 was generated through the Company’s branch office in Bloomington, Indiana which was opened during the first quarter of 2007.
Total loans at year-end 2006 increased $145.1 million or 22% compared with year-end 2005 including increases in each category of loans. The Company’s commercial and industrial loans increased $82.6 million or 26% and agricultural based loans increased $47.5 million or 47% during 2006. Consumer loans increased $3.2 million or 2% and residential mortgage loans increased $11.8 million or 11% during 2006. The growth during 2006 was generated from a variety of sources, including approximately $55.0 million of internally generated growth, $48.0 million related to the acquisition of Stone City Bancshares, Inc., and $42.1 million from the purchase of a Southern Indiana-based agricultural loan portfolio of a regional banking company in December 2006.
The composition of the loan portfolio remained relatively stable at year-end 2007 compared with year-end 2006 with the heaviest concentration in commercial and industrial loans which comprised 53% of the total loan portfolio at year-end 2007, compared with 50% in 2006. The Company’s commercial lending is extended to various industries, including hotel, agribusiness and manufacturing, as well as health care, wholesale, and retail services.
Loan Portfolio | | December 31, | |
(dollars in thousands) | | 2007 | | 2006 | | 2005 | | 2004 | | 2003 | |
| | | | | | | | | | | | |
| Residential Mortgage Loans | | $ | 116,908 | | $ | 114,687 | | $ | 102,891 | | $ | 94,800 | | $ | 110,325 | |
| Agricultural Loans | | | 165,592 | | | 148,872 | | | 101,355 | | | 99,557 | | | 92,095 | |
| Commercial and Industrial Loans | | | 457,033 | | | 402,285 | | | 319,681 | | | 314,354 | | | 296,661 | |
| Consumer Loans | | | 131,110 | | | 132,791 | | | 129,587 | | | 122,888 | | | 114,816 | |
| Total Loans | | | 870,643 | | | 798,635 | | | 653,514 | | | 631,599 | | | 613,897 | |
| Less: Unearned Income | | | (2,922 | ) | | (2,376 | ) | | (1,558 | ) | | (1,806 | ) | | (2,031 | ) |
| Subtotal | | | 867,721 | | | 796,259 | | | 651,956 | | | 629,793 | | | 611,866 | |
| Less: Allowance for Loan Losses | | | (8,044 | ) | | (7,129 | ) | | (9,265 | ) | | (8,801 | ) | | (8,265 | ) |
| Loans, Net | | $ | 859,677 | | $ | 789,130 | | $ | 642,691 | | $ | 620,992 | | $ | 603,601 | |
| | | | | | | | | | | | | | | | | |
Ratio of Loans to Total Loans: | | | | | | | | | | | | | | | | |
| Residential Mortgage Loans | | | 13 | % | | 14 | % | | 16 | % | | 15 | % | | 18 | % |
| Agricultural Loans | | | 19 | % | | 19 | % | | 15 | % | | 16 | % | | 15 | % |
| Commercial and Industrial Loans | | | 53 | % | | 50 | % | | 49 | % | | 50 | % | | 48 | % |
| Consumer Loans | | | 15 | % | | 17 | % | | 20 | % | | 19 | % | | 19 | % |
| Totals | | | 100 | % | | 100 | % | | 100 | % | | 100 | % | | 100 | % |
The Company’s policy is generally to extend credit to consumer and commercial borrowers in its primary geographic market area in Southern Indiana. Commercial extensions of credit outside this market area are generally concentrated in real estate loans within a 120 mile radius of the Company’s primary market and are granted on a selective basis. These out-of-market credits include participations that the Company may purchase from time to time in loans that are originated by three banks in which the Company owns non-controlling common stock investments. These banks operate from headquarters in Indianapolis, Indiana, Evansville, Indiana and Louisville, Kentucky.
The following table indicates the amounts of loans (excluding residential mortgages on 1-4 family residences and consumer loans) outstanding as of December 31, 2007, which, based on remaining scheduled repayments of principal, are due in the periods indicated (dollars in thousands).
| | | Within | | One to Five | | After | | | |
| | | One Year | | Years | | Five Years | | Total | |
| Commercial and Agricultural | | $ | 259,127 | | $ | 250,245 | | $ | 113,253 | | $ | 622,625 | |
| | | Interest Sensitivity | |
| | | Fixed Rate | | Variable Rate | |
| | | | | | |
| Loans maturing after one year | | $ | 129,228 | | $ | 234,270 | |
INVESTMENTS
The investment portfolio is a principal source for funding the Company’s loan growth and other liquidity needs of its subsidiaries. The Company’s securities portfolio consists of money market securities, uncollateralized federal agency securities, municipal obligations of state and political subdivisions, asset- / mortgage-backed securities issued by U.S. government agencies and other intermediaries, and corporate investments. Money market securities include federal funds sold, interest-bearing balances with banks, and other short-term investments. The composition of the year-end balances in the investment portfolio is presented in Note 2 to the Company’s consolidated financial statements included in Item 8 of this Report and in the table below:
Investment Portfolio, at Amortized Cost | December 31, | |
(dollars in thousands) | | 2007 | | % | | 2006 | | % | | 2005 | | % | |
| | | | | | | | | | | | | | | | | | | | |
| Federal Funds Sold and Short-term Investments | | $ | 2,631 | | | 2 | % | $ | 5,935 | | | 3 | % | $ | 5,287 | | | 3 | % |
| U.S. Treasury and Agency Securities | | | 25,306 | | | 16 | | | 28,083 | | | 15 | | | 13,631 | | | 7 | |
| Obligations of State and Political Subdivisions | | | 15,851 | | | 10 | | | 25,788 | | | 13 | | | 31,759 | | | 16 | |
| Asset- / Mortgage-backed Securities | | | 105,302 | | | 69 | | | 125,340 | | | 66 | | | 128,602 | | | 65 | |
| Corporate Securities | | | — | | | — | | | — | | | — | | | 500 | | | n/m | (1) |
| Equity Securities | | | 4,557 | | | 3 | | | 6,236 | | | 3 | | | 17,350 | | | 9 | |
| Total Securities Portfolio | | $ | 153,647 | | | 100 | % | $ | 191,382 | | | 100 | % | $ | 197,129 | | | 100 | % |
(1) n/m = not meaningful
The amortized cost of investment securities, including federal funds sold and short-term investments, decreased $37.7 million at year-end 2007 compared with year-end 2006. The decline in the portfolio during 2007 was largely the result of a strategic decision by the Company to utilize cash flows generated by the securities portfolio to fund loan growth.
The largest concentration in the investment portfolio continues to be in mortgage related securities representing 69% of the total securities portfolio at December 31, 2007. The Company’s level of obligations of state and political subdivisions declined $9.9 million or 39% during 2007 and $5.9 million or 19% during 2006. The decline in obligations of state and political subdivisions has been primarily the result of the Company’s strategy to not invest in these traditionally longer-term securities during periods of relatively low longer-term interest rates. The Company continues to believe that at the proper time, investment in tax-advantaged obligations of state and political subdivisions is prudent.
The Company’s equity securities portfolio at year-end 2007 consisted of non-controlling common stock investments in four unaffiliated banking companies. In 2005 the equity securities portfolio also included the Company’s portfolio of floating rate preferred stock issued by FHLMC and FNMA. The Company sold its portfolio of FHLMC and FNMA preferred stock during the third quarter of 2006. The gain from the sale of this agency preferred stock portfolio totaled $951,000. The portfolio had a book value at the time of the sale of approximately $12.1 million. The Company had previously recorded a non-cash other-than-temporary impairment charge of $3.7 million on this portfolio during 2004.
Investment Securities, at Carrying Value
(dollars in thousands)
| | | December 31, | |
Securities Held-to-Maturity: | | 2007 | | 2006 | | 2005 | |
| Obligations of State and Political Subdivisions | | $ | 4,464 | | $ | 6,135 | | $ | 8,684 | |
| | | | | | | | | | | |
Securities Available-for-Sale: | | | | | | | | | | |
| U.S. Treasury and Agency Securities | | $ | 25,739 | | $ | 28,133 | | $ | 13,492 | |
| Obligations of State and Political Subdivisions | | | 11,602 | | | 19,928 | | | 23,527 | |
| Asset- / Mortgage-backed Securities | | | 105,489 | | | 123,859 | | | 125,844 | |
| Corporate Securities | | | — | | | — | | | 500 | |
| Equity Securities | | | 5,470 | | | 7,302 | | | 17,787 | |
| Subtotal of Securities Available-for-Sale | | | 148,300 | | | 179,222 | | | 181,150 | |
| | | | | | | | | | | |
| Total Securities | | $ | 152,764 | | $ | 185,357 | | $ | 189,834 | |
The Company’s $148.3 million available-for-sale portion of the investment portfolio provides an additional funding source for the liquidity needs of the Company’s subsidiaries and for asset/liability management requirements. Although management has the ability to sell these securities if the need arises, their designation as available-for-sale should not be interpreted as an indication that management anticipates such sales.
The amortized cost of debt securities at December 31, 2007 are shown in the following table by expected maturity. Asset- / mortgage-backed securities are based on estimated average lives. Expected maturities will differ from contractual maturities because issuers may have the right to call or prepay obligations. Equity securities do not have contractual maturities, and are excluded from the table below.
Maturities and Average Yields of Securities at December 31, 2007
(dollars in thousands)
| | | Within | | After One But | | After Five But | | After Ten | |
| | | One Year | | Within Five Years | | Within Ten Years | | Years | |
| | | Amount | | Yield | | Amount | | Yield | | Amount | | Yield | | Amount | | Yield | |
| | | | | | | | | | | | | | | | | | |
| U.S. Treasuries and Agencies | | $ | 1,239 | | | 5.20 | % | $ | 24,067 | | | 5.04 | % | $ | — | | | N/A | | $ | — | | | N/A | |
| State and Political Subdivisions | | | 1,655 | | | 5.74 | % | | 6,328 | | | 7.64 | % | | 6,049 | | | 7.50 | % | | 1,819 | | | 8.29 | % |
| Asset- / Mortgage-backed Securities | | | 13,847 | | | 3.76 | % | | 75,477 | | | 4.83 | % | | 15,831 | | | 5.52 | % | | 147 | | | 3.06 | % |
| Corporate Securities | | | — | | | N/A | | | — | | | N/A | | | — | | | N/A | | | — | | | N/A | |
| | | | | | | | | | | | | | | | | | | | | | | | | | |
| Totals | | $ | 16,741 | | | 4.06 | % | $ | 105,872 | | | 5.05 | % | $ | 21,880 | | | 6.07 | % | $ | 1,966 | | | 7.90 | % |
A tax-equivalent adjustment using a tax rate of 34 percent was used in the above table.
In addition to the other uses of funds discussed previously, the Company had certain long-term contractual obligations as of December 31, 2007. These contractual obligations primarily consisted of long-term borrowings with the FHLB and JPMorgan Chase Bank, N.A., time deposits, and lease commitments for certain office facilities. Scheduled principal payments on long-term borrowings, time deposits, and future minimum lease payments are outlined in the table below.
Contractual Obligations | | Payments Due By Period | |
(dollars in thousands) | | Total | | Less Than 1 Year | | 1-3 Years | | 3-5 Years | | More than 5 Years | |
| Long-Term Borrowings | | $ | 86,056 | | $ | 4,664 | | $ | 53,810 | | $ | 13,063 | | $ | 14,519 | |
| Time Deposits | | | 387,566 | | | 218,723 | | | 155,104 | | | 13,562 | | | 177 | |
| Capital Lease Obligation | | | 1,590 | | | 81 | | | 162 | | | 162 | | | 1,185 | |
| Operating Lease Commitments | | | 2,204 | | | 274 | | | 461 | | | 271 | | | 1,198 | |
| Total | | $ | 477,416 | | $ | 223,742 | | $ | 209,537 | | $ | 27,058 | | $ | 17,079 | |
The Company’s primary source of funding is its base of core customer deposits. Core deposits consist of demand deposits, savings, interest-bearing checking, money market accounts, and certificates of deposit of less than $100,000. Other sources of funds are certificates of deposit of $100,000 or more, brokered deposits, overnight borrowings from other financial institutions and securities sold under agreement to repurchase. The membership of the Company’s affiliate bank in the Federal Home Loan Bank System (FHLB) provides a significant additional source for both long and short-term collateralized borrowings. In addition, the Company, as a separate and distinct corporation from its bank and other subsidiaries, also has the ability to borrow funds from other financial institutions. The following pages contain a discussion of changes in these areas.
The table below illustrates changes between years in the average balances of all funding sources:
Funding Sources - Average Balances | | | |
(dollars in thousands) | | December 31, | | % Change From Prior Year | |
| | | 2007 | | 2006 | | 2005 | | 2007 | | 2006 | |
| | | | | | | | | | | | |
| Demand Deposits | | | | | | | | | | | |
| Non-interest Bearing | | $ | 133,824 | | $ | 129,759 | | $ | 121,662 | | | 3 | % | | 7 | % |
| Interest Bearing | | | 153,033 | | | 140,786 | | | 137,318 | | | 9 | | | 3 | |
| Savings Deposits | | | 57,266 | | | 61,453 | | | 66,091 | | | (7 | ) | | (7 | ) |
| Money Market Accounts | | | 119,735 | | | 112,642 | | | 90,729 | | | 6 | | | 24 | |
| Other Time Deposits | | | 283,994 | | | 276,815 | | | 242,887 | | | 3 | | | 14 | |
| Total Core Deposits | | | 747,852 | | | 721,455 | | | 658,687 | | | 4 | | | 10 | |
| Certificates of Deposits of $100,000 or more and Brokered Deposits | | | 141,884 | | | 92,985 | | | 71,533 | | | 53 | | | 30 | |
| FHLB Advances and Other Borrowings | | | 117,084 | | | 113,559 | | | 98,932 | | | 3 | | | 15 | |
| Total Funding Sources | | $ | 1,006,820 | | $ | 927,999 | | $ | 829,152 | | | 8 | | | 12 | |
Maturities of certificates of deposit of $100,000 or more are summarized as follows:
(dollars in thousands)
| | | 3 Months | | 3 thru | | 6 thru | | Over | | | |
| | | Or Less | | 6 Months | | 12 Months | | 12 Months | | Total | |
| | | | | | | | | | | | |
| December 31, 2007 | | $ | 26,768 | | $ | 19,151 | | $ | 16,428 | | $ | 47,370 | | $ | 109,717 | |
CORE DEPOSITS
The Company’s overall level of average core deposits increased approximately 4% during 2007 following a 10% increase during 2006. The Company’s ability to attract core deposits continues to be influenced by competition and the interest rate environment, as well as the increased availability of alternative investment products. Management believes that core deposits continue to represent a stable and viable funding source for the Company’s operations. Core deposits represented 74% of average total funding sources during 2007 compared with 78% during 2006 and 79% during 2005.
Demand, savings and money market deposits have provided a growing source of funding for the Company in each of the periods reported. Average demand, savings, and money market deposits increased 4% during 2007 following a 7% increase in 2006. Average demand, savings and money market deposits totaled $463.9 million or 62% of core deposits in 2007 compared with $444.6 million or 62% in 2006 and $415.8 million or 63% in 2005.
Other time deposits consist of certificates of deposits in denominations of less than $100,000. These deposits increased by 3% during 2007 following an increase of 14% in 2006. Other time deposits comprised 38% of core deposits in 2007 and 2006 and 37% in 2005.
OTHER FUNDING SOURCES
Federal Home Loan Bank advances and other borrowings represent the Company’s most significant source of other funding. Average borrowed funds increased $3.5 million or 3% during 2007 following an increase of $14.6 million or 15% in 2006. Borrowings comprised approximately 12% of average total funding sources in 2007, 2006, and 2005. The increase in average borrowed funds during 2006 was largely attributable to parent company borrowings that resulted from the banking acquisition activity during late 2005 and early 2006.
Certificates of deposits in denominations of $100,000 or more and brokered deposits are an additional source of other funding for the Company’s bank subsidiary. Large denomination certificates and brokered deposits increased $48.9 million or 53% during 2007 following an increase of $21.5 million or 30% in 2006. Large certificates and brokered deposits comprised approximately 14% of average total funding sources in 2007, 10% in 2006 and 9% in 2005. This type of funding is used as both long-term and short-term funding sources. The increase in this type of funding was used primarily as a funding source for the Company’s significant loan growth during 2007 and 2006.
The bank subsidiary of the Company also utilizes short-term funding sources from time to time. These sources consist of overnight federal funds purchased from other financial institutions, secured repurchase agreements that generally mature within one day of the transaction date, and secured overnight variable rate borrowings from the FHLB. These borrowings represent an important source of short-term liquidity for the Company’s bank subsidiary. Long-term debt at the Company’s bank subsidiary is in the form of FHLB advances, which are secured by the pledge of certain investment securities and residential and housing-related mortgage loans. See Note 8 to the Company’s consolidated financial statements included in Item 8 of this Report for further information regarding borrowed funds.
PARENT COMPANY FUNDING SOURCES
The parent company is a corporation separate and distinct from its bank and other subsidiaries. For information regarding the financial condition, result of operations, and cash flows of the Company, presented on a parent-company-only basis, see Note 17 to the Company’s consolidated financial statements included in Item 8 of this Report.
The Company uses funds at the parent company level to pay dividends to its shareholders, to acquire or make other investments in other businesses or their securities or assets, to repurchase its stock from time to time, and for other general corporate purposes. The parent company does not have access at the parent-company level to the deposits and certain other sources of funds that are available to its bank subsidiary to support its operations. Instead, the parent company has historically derived most of its revenues from dividends paid to the parent company by its bank subsidiary. The Company’s banking subsidiary is subject to statutory restrictions on its ability to pay dividends to the parent company. The parent company has in recent years supplemented the dividends received from its subsidiaries with borrowings, which are discussed in detail below.
On December 29, 2006, the Company and JPMorgan Chase Bank, N.A. (the “Lender”) executed and delivered to each other a Second Amended and Restated Loan and Subordinated Debenture Purchase Agreement (“Restated Agreement”), and the Company executed and delivered to the Lender a $10 million Subordinated Debenture, a $10 million Term Note and a $15 million Revolving Note pursuant to the Restated Agreement to evidence its obligations for amounts that may from time to time be borrowed thereunder. The Company's obligations under the Term Note and Revolving Note are secured by a pledge of all of the Company's stock in its sole depository institution subsidiary, German American Bancorp, pursuant to a pledge agreement. The Restated Agreement established new credit facilities that replace the Company’s prior credit facilities with the Lender.
The term loan established under the Restated Agreement is evidenced by a term note in the principal amount of $10 million, which matures on the following schedule: $1.0 million principal amount was payable on January 1, 2008 and $1.5 million payable on January 1 of each of the years 2009 through 2014, inclusive. Interest is payable quarterly on the outstanding principal balance, and the balance was $9.0 million at year-end 2007.
The subordinated loan established under the Restated Agreement is evidenced by a subordinated debenture in the principal amount of $10 million, and matures in a single installment of principal on January 1, 2014. Interest is payable quarterly on the outstanding principal balance.
The revolving loan established under the Restated Agreement was evidenced by a revolving note in the principal amount of $15 million, and was scheduled to mature on January 1, 2008, at which time all amounts borrowed under the revolving loan were scheduled to become due and payable. Interest was payable quarterly on the outstanding principal balance. On September 28, 2007, the Company and the Lender executed and delivered to each other an amendment to the Restated Agreement, pursuant to which the Lender extended the $15 million revolving line of credit established by the Restated Agreement (of which $3.25 million had been borrowed by the Company as of December 31, 2007) through September 30, 2008, and modified the capital maintenance covenant of the Company specified by the Restated Agreement in certain respects for the interim periods through December 31, 2008. Please refer to the Form 8-K filed by the Company on October 1, 2007 for additional information regarding changes to its lending relationship with JPMorgan Chase Bank, N.A which is herein incorporated by reference.
Pursuant to the Restated Agreement, the Company made certain representations and warranties to the Lender, and agreed to comply with certain affirmative and negative covenants with the Lender, which are substantially the same as the representations, warranties, and covenants that were included in the Prior Agreement. Among the affirmative covenants are provisions requiring that (a) the Company maintain the capital ratios of the Company and of its subsidiary bank(s) at levels that would be considered “well-capitalized” under the prompt corrective action regulations of the federal banking agencies (these capital maintenance covenants were modified by the amendment to the Restated Agreement dated September 28, 2007 for the interim periods through December 31, 2008), and (b) the Company maintain a consolidated ratio of (i) the sum of its non-performing loans plus other real estate owned (real estate that is neither used in the ordinary course of the business of the Company or its subsidiaries nor held for future use) (OREO) to (ii) the sum of the Company's loans plus OREO, of not greater than 3.25%. At December 31, 2007, this ratio was 0.68%.
See Note 8 to the Company’s consolidated financial statements included in Item 8 of this Report for further information regarding the parent company borrowed funds.
The Company is exposed to various types of business risk on an on-going basis. These risks include credit risk, liquidity risk and interest rate risk. Various procedures are employed at the Company’s affiliate banks to monitor and mitigate risk in the loan and investment portfolios, as well as risks associated with changes in interest rates. Following is a discussion of the Company’s philosophies and procedures to address these risks.
LENDING AND LOAN ADMINISTRATION
Primary responsibility and accountability for day-to-day lending activities rests with the Company’s subsidiary bank. Loan personnel at the subsidiary bank have the authority to extend credit under guidelines approved by the bank’s board of directors. The executive loan committee serves as a vehicle for communication and for the pooling of knowledge, judgment and experience of its members. The committee provides valuable input to lending personnel, acts as an approval body, and monitors the overall quality of the bank’s loan portfolio. The Corporate Credit Risk Management Committee, comprised of members of the Company’s and its subsidiary bank’s executive officers and board of directors, strives to ensure a consistent application of the Company’s lending policies. The Company also maintains a comprehensive risk-grading and loan review program, which includes quarterly reviews of problem loans, delinquencies and charge-offs. The purpose of this program is to evaluate loan administration, credit quality, loan documentation and the adequacy of the allowance for loan losses.
The Company maintains an allowance for loan losses to cover probable, incurred credit losses identified during its loan review process. Management estimates the required level of allowance for loan losses using past loan loss experience, the nature and volume of the portfolio, information about specific borrower situations and estimated collateral values, economic conditions, and other factors. Allocations of the allowance may be made for specific loans, but the entire allowance is available for any loan that, in management’s judgement, should be charged-off. Loan losses are charged against the allowance when management believes the uncollectibility of a loan balance is confirmed.
The allowance for loan losses is comprised of: (a) specific reserves on individual credits; (b) general reserves for certain loan categories and industries, and overall historical loss experience; and (c) unallocated reserves based on performance trends in the loan portfolios, current economic conditions, and other factors that influence the level of estimated probable losses. The need for specific reserves are considered for credits when: (a) the customer’s cash flow or net worth appears insufficient to repay the loan; (b) the loan has been criticized in a regulatory examination; (c) the loan is on non-accrual; or, (d) other reasons where the ultimate collectibility of the loan is in question, or the loan characteristics require special monitoring.
Allowance for Loan Losses | | | |
(dollars in thousands) | | Years Ended December 31, | |
| | | 2007 | | 2006 | | 2005 | | 2004 | | 2003 | |
| Balance of Allowance for Possible Losses at Beginning of Period | | $ | 7,129 | | $ | 9,265 | | $ | 8,801 | | $ | 8,265 | | $ | 8,301 | |
| Loans Charged-off: | | | | | | | | | | | | | | | | |
| Residential Mortgage Loans | | | 269 | | | 184 | | | 238 | | | 292 | | | 360 | |
| Agricultural Loans | | | 361 | | | — | | | 3 | | | — | | | 42 | |
| Commercial and Industrial Loans | | | 2,107 | | | 3,059 | | | 1,278 | | | 904 | | | 571 | |
| Consumer Loans | | | 507 | | | 705 | | | 624 | | | 654 | | | 658 | |
| Total Loans Charged-off | | | 3,244 | | | 3,948 | | | 2,143 | | | 1,850 | | | 1,631 | |
| | | | | | | | | | | | | | | | | |
| Recoveries of Previously Charged-off Loans: | | | | | | | | | | | | | | | | |
| Residential Mortgage Loans | | | 18 | | | 35 | | | 58 | | | 24 | | | 220 | |
| Agricultural Loans | | | 55 | | | 30 | | | 53 | | | 11 | | | 56 | |
| Commercial and Industrial Loans | | | 323 | | | 98 | | | 205 | | | 118 | | | 316 | |
| Consumer Loans | | | 172 | | | 240 | | | 149 | | | 218 | | | 192 | |
| Total Recoveries | | | 568 | | | 403 | | | 465 | | | 371 | | | 784 | |
| | | | | | | | | | | | | | | | | |
| Net Loans Recovered / (Charged-off) | | | (2,676 | ) | | (3,545 | ) | | (1,678 | ) | | (1,479 | ) | | (847 | ) |
| Additions to Allowance Charged to Expense | | | 3,591 | | | 925 | | | 1,903 | | | 2,015 | | | 811 | |
| Allowance from Acquired Subsidiary | | | — | | | 484 | | | 239 | | | — | | | — | |
| Balance at End of Period | | $ | 8,044 | | $ | 7,129 | | $ | 9,265 | | $ | 8,801 | | $ | 8,265 | |
| | | | | | | | | | | | | | | | | |
| Net Charge-offs to Average Loans Outstanding | | | 0.32 | % | | 0.50 | % | | 0.26 | % | | 0.24 | % | | 0.14 | % |
| Provision for Loan Losses to Average Loans Outstanding | | | 0.43 | % | | 0.13 | % | | 0.30 | % | | 0.32 | % | | 0.13 | % |
| Allowance for Loan Losses to Total Loans at Year-end | | | 0.93 | % | | 0.90 | % | | 1.42 | % | | 1.40 | % | | 1.35 | % |
The following table indicates the breakdown of the allowance for loan losses for the periods indicated (dollars in thousands):
| Residential Mortgage Loans | | $ | 320 | | $ | 341 | | $ | 710 | | $ | 790 | | $ | 839 | |
| Agricultural Loans | | | 1,349 | | | 1,001 | | | 822 | | | 982 | | | 704 | |
| Commercial and Industrial Loans | | | 5,892 | | | 5,134 | | | 6,486 | | | 5,906 | | | 5,358 | |
| Consumer Loans | | | 483 | | | 602 | | | 1,127 | | | 1,043 | | | 1,158 | |
| Unallocated | | | — | | | 51 | | | 120 | | | 80 | | | 206 | |
| | | | | | | | | | | | | | | | | |
| Total Allowance for Loan Losses | | $ | 8,044 | | $ | 7,129 | | $ | 9,265 | | $ | 8,801 | | $ | 8,265 | |
The allowance for loan losses at year-end 2007 increased to $8.0 million or 0.93% of total loans compared to $7.1 million or 0.90% of total loans at year 2006. The increase in the allowance for loan losses was largely attributable to the Company’s commercial and industrial loan portfolio growth during 2007 and the required provision for loan losses that resulted from that growth in accordance with the Company’s standard methodology for determining the adequacy of its allowance for loan losses. Also contributing to the increased level of allowance for loan losses was an elevated level of net charge-offs during 2006 and 2007 and the effect of those charge-offs on the Company’s historic loss ratios and the resulting required level of loan loss reserves. Net charge-offs totaled $2.7 million in 2007 or 0.32% of average loans outstanding during 2007. This compares to net charge-offs of $3.5 million or 0.50% of average loans outstanding during 2006 and $1.7 million or 0.26% of average loans outstanding in 2005. A significant portion of the elevated net charge-offs during 2007 was largely attributable to a single hotel credit facility. See “RESULTS OF OPERATIONS – Provision for Loan Losses” and “RISK MANAGEMENT – Non-performing Assets” for detailed discussion of this credit facility and net charge-off.
The allowance for loan losses at year-end 2006 declined to $7.1 million or 0.90% of total loans compared to $9.3 million or 1.42% of total loans at year-end 2005. The decline in the allowance for loan losses was largely attributable to a higher level of net charge-offs, primarily related to three commercial credit facilities, during 2006 as compared with previous years. The increased level of net charge-offs during 2006 and to a lesser degree in 2005 had been provided for during 2004 and 2005. Therefore, the provision for loan loss declined by $978,000 in 2006 compared with 2005.
Please see “RESULTS OF OPERATIONS – Provision for Loan Losses” and “CRITICAL ACCOUNTING POLICIES AND ESTIMATES – Allowance for Loan Losses” for additional information regarding the allowance.
NON-PERFORMING ASSETS
Non-performing assets consist of: (a) non-accrual loans; (b) loans which have been renegotiated to provide for a reduction or deferral of interest or principal because of deterioration in the financial condition of the borrower; (c) loans past due 90 days or more as to principal or interest; and, (d) other real estate owned. Loans are placed on non-accrual status when scheduled principal or interest payments are past due for 90 days or more or when the borrower’s ability to repay becomes doubtful. Uncollected accrued interest is reversed against income at the time a loan is placed on non-accrual. Loans are typically charged-off at 120 days past due, or earlier if deemed uncollectible. Exceptions to the non-accrual and charge-off policies are made when the loan is well secured and in the process of collection. The following table presents an analysis of the Company’s non-performing assets.
Non-performing Assets | | December 31, | |
(dollars in thousands) | | 2007 | | 2006 | | 2005 | | 2004 | | 2003 | |
| | | | | | | | | | | | | | | | | |
| Non-accrual Loans | | $ | 4,356 | | $ | 9,652 | | $ | 14,763 | | $ | 5,750 | | $ | 1,817 | |
| Past Due Loans (90 days or more) | | | 8 | | | — | | | 944 | | | 831 | | | 962 | |
| Restructured Loans | | | — | | | — | | | — | | | — | | | — | |
| Total Non-performing Loans | | | 4,364 | | | 9,652 | | | 15,707 | | | 6,581 | | | 2,779 | |
| Other Real Estate | | | 1,517 | | | 845 | | | 506 | | | 213 | | | 749 | |
| Total Non-performing Assets | | $ | 5,881 | | $ | 10,497 | | $ | 16,213 | | $ | 6,794 | | $ | 3,528 | |
| | | | | | | | | | | | | | | | | |
| Non-performing Loans to Total Loans | | | 0.50 | % | | 1.21 | % | | 2.41 | % | | 1.04 | % | | 0.45 | % |
| Allowance for Loan Losses to Non-performing Loans | | | 184.33 | % | | 73.86 | % | | 58.99 | % | | 133.73 | % | | 297.41 | % |
The Company’s level of overall non-performing assets declined by approximately $4.6 million and non-performing loans declined by approximately $5.3 million during 2007 compared with year-end 2006. These changes were primarily related to one credit facility which is discussed in detail below.
At December 31, 2006, a single credit facility, which was extended to a borrower that owned and operated two hotel facilities, was largely responsible for the elevated level of non-performing loans compared with year-end 2007. This facility included extensions of credit in the approximate amount of $3.5 million (after a partial charge-off during 2006) that were secured by a first priority lien on the hotel properties.
In late March, 2007, the Company acquired deeds in lieu of foreclosure of these two hotel properties and placed the hotels under control of an independent management company pending their sale. On April 16, 2007, the Company agreed to sell the two hotels, subject to conventional financing by the Company, to an unaffiliated purchaser for a sales price of approximately $2.2 million, net of the costs of sale. The sale of the properties closed on April 20, 2007. The net effect of these activities was to decrease the level of the Company’s non-performing assets at year-end 2007 by the entire $3.5 million year-end carrying value of the credit secured by the hotel facilities. During the first quarter of 2007, the Company charged the difference of $1.3 million against its allowance for loan losses and recorded a corresponding expense to provision for loan losses.
In connection with the Company’s agreement with its borrower under which the deeds to the hotels were acquired in lieu of foreclosure, one of the principals of the borrower executed and delivered to the Company’s subsidiary bank a ten-year monthly installment personal promissory note in the principal amount of $1.1 million. Due to substantial uncertainty about the personal financial ability of the obligor under the note to pay it in accordance with its terms, the Company has not recognized any value for this personal note in its financial statements. If, and to the extent that, this obligor continues to pay installments under the note in accordance with its terms, or the note is otherwise sold or liquidated for value by the Company, the Company could recover some of this charge-off in future periods. Through December 31, 2007, all payments have been made in accordance with the terms of the note.
The largest remaining credit facility included in non-performing assets is an approximately $784,000 loan (after a partial charge-off during 2006) to a manufacturing entity which has ceased operations. During the third quarter of 2005, the real estate and equipment of the manufacturing entity were sold at auction to an unrelated third party. The closing of this auction sale has been delayed on a number of instances as various covenants and conditions included in the sales agreement have not been fully performed or satisfied. Based on current information available, the Company expects that this sale will be completed in the first half of 2008. The preceding is a forward-looking statement, however, which is subject to certain risks and uncertainties, and the closing of the expected sale could be delayed further or terminated if the covenants and conditions of the parties to the sale are not performed by the parties to the sale (over which the Company has no control) in a timely manner. The indebtedness owed the Company on this credit is secured by a first priority lien on substantially all of the borrower’s assets, including those sold at auction.
The Company’s level of overall non-performing assets declined by approximately $5.7 million and non-performing loans declined by approximately $6.1 million during 2006 compared with year-end 2005. The decline in the level of non-accrual loans largely resulted from the resolution of an approximately $4.2 million credit facility, which was extended to a borrower operating a retail grocery store chain. Under an approved bankruptcy plan, the Company was paid approximately 90% of the amount owed to it during April 2006. The remaining decline in non-accrual loans was principally the result of partial charge-offs that totaled $2.1 million on two other commercial credit facilities that were previously discussed in this section.
Loan impairment is reported when full repayment under the terms of the loan is not expected. If a loan is impaired, a portion of the allowance is allocated so that the loan is reported net, at the present value of estimated future cash flows using the loan’s existing rate, or at the fair value of collateral if repayment is expected solely from the collateral. Commercial and industrial loans and agricultural loans are evaluated individually for impairment. Smaller balance homogeneous loans are evaluated for impairment in total. Such loans include real estate loans secured by one-to-four family residences and loans to individuals for household, family and other personal expenditures. Individually evaluated loans on non-accrual are generally considered impaired. Impaired loans, or portions thereof, are charged off when deemed uncollectible. The total dollar amount of impaired loans at December 31, 2007 was $4,303,000. For additional detail on impaired loans, see Note 3 to the Company’s consolidated financial statements included in Item 8 of this Report.
Interest income recognized on non-performing loans for 2007 was $386,000. The gross interest income that would have been recognized in 2007 on non-performing loans if the loans had been current in accordance with their original terms was $764,000. Loans are typically placed on non-accrual status when scheduled principal or interest payments are past due for 90 days or more, unless the loan is well secured and in the process of collection.
LIQUIDITY AND INTEREST RATE RISK MANAGEMENT
Liquidity is a measure of the ability of the Company’s subsidiary bank to fund new loan demand, existing loan commitments and deposit withdrawals. The purpose of liquidity management is to match sources of funds with anticipated customer borrowings and withdrawals and other obligations to ensure a dependable funding base, without unduly penalizing earnings. Failure to properly manage liquidity requirements can result in the need to satisfy customer withdrawals and other obligations on less than desirable terms. The liquidity of the parent company is dependent upon the receipt of dividends from its bank subsidiary, which are subject to certain regulatory limitations explained in Note 9 to the Company’s consolidated financial statements included in Item 8 of this Report, as enhanced by its ability to draw upon term financing arrangements and a line of credit established by the parent company with a correspondent bank lender as described under “SOURCES OF FUNDS – Parent Company Funding Sources”, above. The affiliate bank’s source of funding is predominately core deposits, time deposits in excess of $100,000 and brokered certificates of deposit, maturities of securities, repayments of loan principal and interest, federal funds purchased, securities sold under agreements to repurchase and borrowings from the Federal Home Loan Bank.
Interest rate risk is the exposure of the Company’s financial condition to adverse changes in market interest rates. In an effort to estimate the impact of sustained interest rate movements to the Company’s earnings, the Company monitors interest rate risk through computer-assisted simulation modeling of its net interest income. The Company’s simulation modeling monitors the potential impact to net interest income under various interest rate scenarios. The Company’s objective is to actively manage its asset/liability position within a one-year interval and to limit the risk in any of the interest rate scenarios to a reasonable level of tax-equivalent net interest income within that interval. The Company’s Asset/Liability Committee monitors compliance within established guidelines of the Funds Management Policy. See Item 7A. Quantitative and Qualitative Disclosures About Market Risk section for further discussion regarding interest rate risk.
OFF-BALANCE SHEET ARRANGEMENTS
The Company has no off-balance sheet arrangements other than stand-by letters of credit as disclosed in Note 14 to the Company’s consolidated financial statements included in Item 8 of this Report.
Item 7A. Quantitative and Qualitative Disclosures About Market Risk.
The Company’s exposure to market risk is reviewed on a regular basis by the Asset/Liability Committee and Board of Directors. Primary market risks, which impact the Company’s operations, are liquidity risk and interest rate risk, as discussed above.
As discussed previously, the Company monitors interest rate risk by the use of computer simulation modeling to estimate the potential impact on its net interest income under various interest rate scenarios. Another method by which the Company’s interest rate risk position can be estimated is by computing estimated changes in its net portfolio value (“NPV”). This method estimates interest rate risk exposure from movements in interest rates by using interest rate sensitivity analysis to determine the change in the NPV of discounted cash flows from assets and liabilities. NPV represents the market value of portfolio equity and is equal to the estimated market value of assets minus the estimated market value of liabilities. Computations are based on a number of assumptions, including the relative levels of market interest rates and prepayments in mortgage loans and certain types of investments. These computations do not contemplate any actions management may undertake in response to changes in interest rates, and should not be relied upon as indicative of actual results. In addition, certain shortcomings are inherent in the method of computing NPV. Should interest rates remain or decrease below current levels, the proportion of adjustable rate loans could decrease in future periods due to refinancing activity. In the event of an interest rate change, prepayment levels would likely be different from those assumed in the table. Lastly, the ability of many borrowers to repay their adjustable rate debt may decline during a rising interest rate environment.
The following table provides an assessment of the risk to NPV in the event of sudden and sustained 1% and 2% increases and decreases in prevailing interest rates. The table indicates that as of December 31, 2007 the Company’s estimated NPV might be expected to decrease under both an increase or decrease in prevailing interest rates (dollars in thousands).
Interest Rate Sensitivity as of December 31, 2007
| | | | | Net Portfolio Value | |
| | | Net Portfolio | | as a % of Present Value | |
| | | Value | | of Assets | |
Changes | | | | | | | |
in Rates | | $ Amount | | % Change | | NPV Ratio | | Change | |
| +2% | | $ | 120,652 | | | -6.25 | % | | 10.89 | % | | (41) | b.p. |
| +1% | | | 125,332 | | | -2.61 | % | | 11.15 | % | | (15) | b.p. |
| Base | | | 128,694 | | | — | | | 11.30 | % | | | |
| -1% | | | 126,724 | | | -1.53 | % | | 11.02 | % | | (28) | b.p. |
| -2% | | | 120,870 | | | -6.08 | % | | 10.44 | % | | (86) | b.p. |
The above discussion, and the portions of MANAGEMENT’S DISCUSSION AND ANALYSIS in Item 7 of this Report that are referenced in the above discussion contain statements relating to future results of the Company that are considered “forward-looking statements” within the meaning of the Private Securities Litigation Reform Act of 1995. These statements relate to, among other things, simulation of the impact on net interest income from changes in interest rates. Actual results may differ materially from those expressed or implied therein as a result of certain risks and uncertainties, including those risks and uncertainties expressed above, those that are described in MANAGEMENT’S DISCUSSION AND ANALYSIS in Item 7 of this Report, and those that are described in Item 1 of this Report, “Business,” under the caption “Forward-Looking Statements and Associated Risks,” which discussions are incorporated herein by reference.
Item 8. Financial Statements and Supplementary Data.
Report of Independent Registered Public Accounting Firm
Board of Directors and Shareholders
German American Bancorp, Inc.
Jasper, Indiana
We have audited the accompanying consolidated balance sheets of German American Bancorp, Inc. as of December 31, 2007 and 2006 and the related consolidated statements of income, changes in shareholders’ equity, and cash flows for each of the three years in the period ended December 31, 2007. We also have audited German American Bancorp, Inc.’s internal control over financial reporting as of December 31, 2007, based on criteria established in Internal Control – Integrated Framework issued by the Committee of Sponsoring Organizations of the Treadway Commission (COSO). German American Bancorp, Inc.’s management is responsible for these financial statements, for maintaining effective internal control over financial reporting, and for its assessment of the effectiveness of internal control over financial reporting, included in the accompanying Management’s Report on Internal Control over Financial Reporting. Our responsibility is to express an opinion on these financial statements and an opinion on the company's internal control over financial reporting based on our audits.
We conducted our audits in accordance with the standards of the Public Company Accounting Oversight Board (United States). Those standards require that we plan and perform the audit to obtain reasonable assurance about whether the financial statements are free of material misstatement and whether effective internal control over financial reporting was maintained in all material respects. Our audits of the financial statements included examining, on a test basis, evidence supporting the amounts and disclosures in the financial statements, assessing the accounting principles used and significant estimates made by management, and evaluating the overall financial statement presentation. Our audit of internal control over financial reporting included obtaining an understanding of internal control over financial reporting, assessing the risk that a material weakness exists, and testing and evaluating the design and operating effectiveness of internal control based on the assessed risk. Our audits also included performing such other procedures as we considered necessary in the circumstances. We believe that our audits provide a reasonable basis for our opinions.
A company's internal control over financial reporting is a process designed to provide reasonable assurance regarding the reliability of financial reporting and the preparation of financial statements for external purposes in accordance with generally accepted accounting principles. A company's internal control over financial reporting includes those policies and procedures that (1) pertain to the maintenance of records that, in reasonable detail, accurately and fairly reflect the transactions and dispositions of the assets of the company; (2) provide reasonable assurance that transactions are recorded as necessary to permit preparation of financial statements in accordance with generally accepted accounting principles, and that receipts and expenditures of the company are being made only in accordance with authorizations of management and directors of the company; and (3) provide reasonable assurance regarding prevention or timely detection of unauthorized acquisition, use, or disposition of the company's assets that could have a material effect on the financial statements.
Because of its inherent limitations, internal control over financial reporting may not prevent or detect misstatements. Also, projections of any evaluation of effectiveness to future periods are subject to the risk that controls may become inadequate because of changes in conditions, or that the degree of compliance with the policies or procedures may deteriorate.
In our opinion, the consolidated financial statements referred to above present fairly, in all material respects, the financial position of German American Bancorp, Inc. as of December 31, 2007 and 2006, and the results of its operations and its cash flows for each of the three years in the period ended December 31, 2007, in conformity with accounting principles generally accepted in the United States of America. Also in our opinion German American Bancorp, Inc. maintained, in all material respects, effective internal control over financial reporting as of December 31, 2007, based on criteria established in Internal Control - Integrated Framework issued by the COSO.
| Louisville, Kentucky | /s/ Crowe Chizek and Company LLC |
February 29, 2008 | Crowe Chizek and Company LLC |
Consolidated Balance Sheets
Dollars in thousands, except per share data
| | | December 31, | |
| | | 2007 | | 2006 | |
ASSETS | | | | | |
| Cash and Due from Banks | | $ | 25,283 | | $ | 23,960 | |
| Federal Funds Sold and Other Short-term Investments | | | 2,631 | | | 5,735 | |
| Cash and Cash Equivalents | | | 27,914 | | | 29,695 | |
| | | | | | | | |
| Interest-bearing Time Deposits with Banks | | | — | | | 200 | |
| Securities Available-for-Sale, at Fair Value | | | 148,300 | | | 179,222 | |
Securities Held-to-Maturity, at Cost (Fair value of $4,496 and $6,192 on December 31, 2007 and 2006, respectively) | | | 4,464 | | | 6,135 | |
| | | | | | | | |
| Loans Held-for-Sale | | | 5,697 | | | 1,601 | |
| | | | | | | | |
| Loans | | | 870,643 | | | 798,635 | |
| Less: Unearned Income | | | (2,922 | ) | | (2,376 | ) |
| Allowance for Loan Losses | | | (8,044 | ) | | (7,129 | ) |
| Loans, Net | | | 859,677 | | | 789,130 | |
| | | | | | | | |
| Stock in FHLB of Indianapolis and Other Restricted Stock, at Cost | | | 10,621 | | | 10,621 | |
| Premises, Furniture and Equipment, Net | | | 22,783 | | | 23,245 | |
| Other Real Estate | | | 1,517 | | | 845 | |
| Goodwill | | | 9,655 | | | 9,655 | |
| Intangible Assets | | | 4,030 | | | 4,924 | |
| Company Owned Life Insurance | | | 22,533 | | | 21,710 | |
| Accrued Interest Receivable and Other Assets | | | 14,519 | | | 16,441 | |
| | | | | | | | |
| TOTAL ASSETS | | $ | 1,131,710 | | $ | 1,093,424 | |
| | | | | | | | |
LIABILITIES | | | | | | | |
| Non-interest-bearing Demand Deposits | | $ | 136,212 | | $ | 137,671 | |
| Interest-bearing Demand, Savings, and Money Market Accounts | | | 353,643 | | | 329,690 | |
| Time Deposits | | | 387,566 | | | 400,257 | |
| Total Deposits | | | 877,421 | | | 867,618 | |
| | | | | | | | |
| FHLB Advances and Other Borrowings | | | 144,170 | | | 119,889 | |
| Accrued Interest Payable and Other Liabilities | | | 13,003 | | | 13,526 | |
| | | | | | | | |
| TOTAL LIABILITIES | | | 1,034,594 | | | 1,001,033 | |
| | | | | | | | |
| Commitments and Contingencies (Note 14) | | | | | | | |
| | | | | | | | |
SHAREHOLDERS’ EQUITY | | | | | | | |
| Preferred Stock, $10 par value; 500,000 shares authorized, no shares issued | | | — | | | — | |
| Common Stock, no par value, $1 stated value; 20,000,000 shares authorized | | | 11,029 | | | 11,008 | |
| Additional Paid-in Capital | | | 68,408 | | | 68,216 | |
| Retained Earnings | | | 16,681 | | | 13,450 | |
| Accumulated Other Comprehensive Income (Loss) | | | 998 | | | (283 | ) |
| | | | | | | | |
| TOTAL SHAREHOLDERS’ EQUITY | | | 97,116 | | | 92,391 | |
| TOTAL LIABILITIES AND SHAREHOLDERS’ EQUITY | | $ | 1,131,710 | | $ | 1,093,424 | |
| End of period shares issued and outstanding | | | 11,029,484 | | | 11,008,562 | |
See accompanying notes to consolidated financial statements.
Consolidated Statements of Income
Dollars in thousands, except per share data
| | | Years Ended December 31, | |
| | | 2007 | | 2006 | | 2005 | |
INTEREST INCOME | | | | | | | |
| Interest and Fees on Loans | | $ | 63,852 | | $ | 53,490 | | $ | 41,751 | |
| Interest on Federal Funds Sold and Other Short-term Investments | | | 478 | | | 545 | | | 316 | |
| Interest and Dividends on Securities: | | | | | | | | | | |
| Taxable | | | 6,992 | | | 7,763 | | | 5,954 | |
| Non-taxable | | | 939 | | | 1,796 | | | 2,176 | |
| TOTAL INTEREST INCOME | | | 72,261 | | | 63,594 | | | 50,197 | |
| | | | | | | | | | | |
INTEREST EXPENSE | | | | | | | | | | |
| Interest on Deposits | | | 27,289 | | | 21,329 | | | 13,389 | |
| Interest on FHLB Advances and Other Borrowings | | | 6,357 | | | 6,069 | | | 4,595 | |
| TOTAL INTEREST EXPENSE | | | 33,646 | | | 27,398 | | | 17,984 | |
NET INTEREST INCOME | | | 38,615 | | | 36,196 | | | 32,213 | |
| Provision for Loan Losses | | | 3,591 | | | 925 | | | 1,903 | |
NET INTEREST INCOME AFTER PROVISION FOR LOAN LOSSES | | | 35,024 | | | 35,271 | | | 30,310 | |
| | | | | | | | | | | |
NON-INTEREST INCOME | | | | | | | | | | |
| Trust and Investment Product Fees | | | 2,590 | | | 2,210 | | | 2,081 | |
| Service Charges on Deposit Accounts | | | 4,361 | | | 3,901 | | | 3,723 | |
| Insurance Revenues | | | 5,794 | | | 5,094 | | | 4,703 | |
| Other Operating Income | | | 2,817 | | | 2,920 | | | 3,068 | |
| Net Gains on Sales of Loans and Related Assets | | | 822 | | | 917 | | | 927 | |
| Net Gain / (Loss) on Securities | | | (680 | ) | | 951 | | | — | |
| TOTAL NON-INTEREST INCOME | | | 15,704 | | | 15,993 | | | 14,502 | |
| | | | | | | | | | | |
NON-INTEREST EXPENSE | | | | | | | | | | |
| Salaries and Employee Benefits | | | 21,671 | | | 21,491 | | | 18,511 | |
| Occupancy Expense | | | 3,144 | | | 2,797 | | | 2,396 | |
| Furniture and Equipment Expense | | | 2,235 | | | 2,191 | | | 2,008 | |
| Data Processing Fees | | | 1,370 | | | 1,646 | | | 1,322 | |
| Professional Fees | | | 1,418 | | | 1,786 | | | 1,703 | |
| Advertising and Promotion | | | 957 | | | 940 | | | 784 | |
| Supplies | | | 625 | | | 619 | | | 544 | |
| Other Operating Expenses | | | 5,801 | | | 5,589 | | | 4,488 | |
| TOTAL NON-INTEREST EXPENSE | | | 37,221 | | | 37,059 | | | 31,756 | |
| | | | | | | | | | | |
| Income before Income Taxes | | | 13,507 | | | 14,205 | | | 13,056 | |
| Income Tax Expense | | | 4,102 | | | 3,984 | | | 3,335 | |
NET INCOME | | $ | 9,405 | | $ | 10,221 | | $ | 9,721 | |
| | | | | | | | | | | |
| Earnings per Share | | $ | 0.85 | | $ | 0.93 | | $ | 0.89 | |
| | | | | | | | | | | |
| Diluted Earnings per Share | | $ | 0.85 | | $ | 0.93 | | $ | 0.89 | |
See accompanying notes to consolidated financial statements.
Consolidated Statements of Changes in Shareholders’ Equity
Dollars in thousands, except per share data
| | | | | | | | | | | Accumulated | | | |
| | | | | | | Additional | | | | Other | | Total | |
| | | Common Stock | | Paid-in | | Retained | | Comprehensive | | Shareholders’ | |
| | | Shares | | Amount | | Capital | | Earnings | | Income / (Loss) | | Equity | |
| | | | | | | | | | | | | | |
Balances, January 1, 2005 | | | 10,898,241 | | $ | 10,898 | | $ | 66,817 | | $ | 5,778 | | $ | 176 | | $ | 83,669 | |
| | | | | | | | | | | | | | | | | | | | |
| Comprehensive Income: | | | | | | | | | | | | | | | | | | | |
| Net Income | | | | | | | | | | | | 9,721 | | | | | | 9,721 | |
| Changes in Unrealized Gain/(Loss) on Securities Available for Sale, net | | | | | | | | | | | | | | | (1,711 | ) | | (1,711 | ) |
| Change in Minimum Pension Liability | | | | | | | | | | | | | | | (28 | ) | | (28 | ) |
| Total Comprehensive Income | | | | | | | | | | | | | | | | | | 7,982 | |
| Cash Dividends ($.56 per share) | | | | | | | | | | | | (6,108 | ) | | | | | (6,108 | ) |
| Issuance of Common Stock for: | | | | | | | | | | | | | | | | | | | |
| Exercise of Stock Options | | | 11,991 | | | 12 | | | 36 | | | | | | | | | 48 | |
| Mergers and Acquisitions | | | 257,029 | | | 257 | | | 3,241 | | | | | | | | | 3,498 | |
| Employee Stock Purchase Plan | | | | | | | | | (63 | ) | | | | | | | | (63 | ) |
| Purchase and Retirement of Common Stock | | | (523,747 | ) | | (524 | ) | | (6,247 | ) | | | | | | | | (6,771 | ) |
| | | | | | | | | | | | | | | | | | | | |
Balances, December 31, 2005 | | | 10,643,514 | | | 10,643 | | | 63,784 | | | 9,391 | | | (1,563 | ) | | 82,255 | |
| | | | | | | | | | | | | | | | | | | | |
| Comprehensive Income: | | | | | | | | | | | | | | | | | | | |
| Net Income | | | | | | | | | | | | 10,221 | | | | | | 10,221 | |
Changes in Unrealized Gain/(Loss) on Securities Available for Sale, net | | | | | | | | | | | | | | | 1,242 | | | 1,242 | |
| Change in Minimum Pension Liability | | | | | | | | | | | | | | | 38 | | | 38 | |
| Total Comprehensive Income | | | | | | | | | | | | | | | | | | 11,501 | |
| Cash Dividends ($.56 per share) | | | | | | | | | | | | (6,162 | ) | | | | | (6,162 | ) |
| Issuance of Common Stock for: | | | | | | | | | | | | | | | | | | | |
| Exercise of Stock Options | | | 1,704 | | | 2 | | | 15 | | | | | | | | | 17 | |
| Mergers and Acquisitions | | | 349,468 | | | 349 | | | 4,252 | | | | | | | | | 4,601 | |
| Employee Stock Purchase Plan | | | | | | | | | (30 | ) | | | | | | | | (30 | ) |
| Restricted Share Grants | | | 13,876 | | | 14 | | | 166 | | | | | | | | | 180 | |
| Stock Option Grants | | | | | | | | | 29 | | | | | | | | | 29 | |
| | | | | | | | | | | | | | | | | | | | |
Balances, December 31, 2006 | | | 11,008,562 | | | 11,008 | | | 68,216 | | | 13,450 | | | (283 | ) | | 92,391 | |
| | | | | | | | | | | | | | | | | | | | |
| Comprehensive Income: | | | | | | | | | | | | | | | | | | | |
| Net Income | | | | | | | | | | | | 9,405 | | | | | | 9,405 | |
Changes in Unrealized Gain/(Loss) on Securities Available for Sale, net | | | | | | | | | | | | | | | 1,210 | | | 1,210 | |
Change in Unrecognized Loss in Postretirement Benefit Obligation | | | | | | | | | | | | | | | 30 | | | 30 | |
| Change in Unrecognized Amounts in Pension | | | | | | | | | | | | | | | 41 | | | 41 | |
| Total Comprehensive Income | | | | | | | | | | | | | | | | | | 10,686 | |
| Cash Dividends ($.56 per share) | | | | | | | | | | | | (6,174 | ) | | | | | (6,174 | ) |
| Employee Stock Purchase Plan | | | | | | | | | (70 | ) | | | | | | | | (70 | ) |
| Restricted Share Grants | | | 20,922 | | | 21 | | | 262 | | | | | | | | | 283 | |
Balances, December 31, 2007 | | | 11,029,484 | | $ | 11,029 | | $ | 68,408 | | $ | 16,681 | | $ | 998 | | $ | 97,116 | |
See accompanying notes to consolidated financial statements.
Consolidated Statements of Cash Flows
Dollars in thousands
| | | Years Ended December 31, | |
| | | 2007 | | 2006 | | 2005 | |
CASH FLOWS FROM OPERATING ACTIVITIES | | | | | | | |
| Net Income | | $ | 9,405 | | $ | 10,221 | | $ | 9,721 | |
| Adjustments to Reconcile Net Income to Net Cash from Operating Activities: | | | | | | | | | | |
| Net (Accretion) / Amortization on Securities | | | (383 | ) | | (180 | ) | | 524 | |
| Depreciation and Amortization | | | 3,140 | | | 2,818 | | | 2,578 | |
| Amortization and Impairment of Mortgage Servicing Rights | | | — | | | 271 | | | 301 | |
| Loans Originated for Sale | | | (71,091 | ) | | (55,281 | ) | | (62,886 | ) |
| Proceeds from Sales of Loans Held-for-Sale | | | 67,817 | | | 55,985 | | | 64,327 | |
| Loss in Investment in Limited Partnership | | | 178 | | | 397 | | | 83 | |
| Provision for Loan Losses | | | 3,591 | | | 925 | | | 1,903 | |
| Gain on Sale of Loans and Mortgage Servicing Rights, net | | | (822 | ) | | (917 | ) | | (927 | ) |
| Loss / (Gain) on Securities, net | | | 680 | | | (951 | ) | | — | |
| Loss / (Gain) on Sales of Other Real Estate and Repossessed Assets | | | (52 | ) | | 23 | | | (73 | ) |
Loss / (Gain) on Disposition and Impairment of Premises and Equipment | | | 120 | | | 23 | | | (312 | ) |
| FHLB Stock Dividends | | | — | | | — | | | (287 | ) |
| Increase in Cash Surrender Value of Company Owned Life Insurance | | | (823 | ) | | (865 | ) | | (527 | ) |
| Equity Based Compensation | | | 331 | | | 284 | | | — | |
| Change in Assets and Liabilities: | | | | | | | | | | |
Interest Receivable and Other Assets | | | 1,070 | | | (1,298 | ) | | 905 | |
| Interest Payable and Other Liabilities | | | (406 | ) | | 633 | | | (865 | ) |
Net Cash from Operating Activities | | | 12,755 | | | 12,088 | | | 14,465 | |
| | | | | | | | | | | |
CASH FLOWS FROM INVESTING ACTIVITIES | | | | | | | | | | |
| Proceeds from Maturity of Other Short-term Investments | | | 200 | | | — | | | — | |
| Proceeds from Maturities of Securities Available-for-Sale | | | 41,899 | | | 60,033 | | | 54,565 | |
| Proceeds from Sales of Securities Available-for-Sale | | | 998 | | | 13,001 | | | — | |
| Purchase of Securities Available-for-Sale | | | (10,434 | ) | | (62,006 | ) | | (57,004 | ) |
| Proceeds from Maturities of Securities Held-to-Maturity | | | 1,671 | | | 2,558 | | | 4,639 | |
| Proceeds from Redemption of Federal Home Loan Bank Stock | | | — | | | 3,862 | | | — | |
| Purchase of Loans | | | (23,065 | ) | | (22,043 | ) | | (8,490 | ) |
| Proceeds from Sales of Loans | | | 3,953 | | | 30,520 | | | 12,260 | |
| Loans Made to Customers, net of Payments Received | | | (58,503 | ) | | (109,862 | ) | | 345 | |
| Proceeds from Sale of Mortgage Servicing Rights | | | — | | | 3,554 | | | — | |
| Proceeds from Sales of Other Real Estate | | | 2,987 | | | 890 | | | 1,014 | |
| Property and Equipment Expenditures | | | (1,372 | ) | | (3,461 | ) | | (1,441 | ) |
Proceeds from Sales of Property and Equipment | | | 62 | | | 292 | | | 446 | |
| Acquire Capitalized Lease | | | (13 | ) | | — | | | — | |
| Acquire Banking Entities | | | — | | | (4,111 | ) | | 1,000 | |
Acquire Insurance Agencies | | | — | | | (2,260 | ) | | — | |
Net Cash from Investing Activities | | | (41,617 | ) | | (89,033 | ) | | 7,334 | |
| | | | | | | | | | | |
CASH FLOWS FROM FINANCING ACTIVITIES | | | | | | | | | | |
Change in Deposits | | | 9,862 | | | 73,366 | | | (31,420 | ) |
| Change in Short-term Borrowings | | | 5,828 | | | 12,623 | | | 13,115 | |
| Advances in Long-term Debt | | | 30,000 | | | 26,500 | | | 36,500 | |
| Repayments of Long-term Debt | | | (12,317 | ) | | (32,530 | ) | | (41,835 | ) |
| Issuance of Common Stock | | | — | | | 17 | | | 48 | |
Purchase / Retire Common Stock | | | — | | | — | | | (6,771 | ) |
| Employee Stock Purchase Plan | | | (118 | ) | | (105 | ) | | (63 | ) |
| Dividends Paid | | | (6,174 | ) | | (6,162 | ) | | (6,108 | ) |
Net Cash from Financing Activities | | | 27,081 | | | 73,709 | | | (36,534 | ) |
| | | | | | | | | | | |
Net Change in Cash and Cash Equivalents | | | (1,781 | ) | | (3,236 | ) | | (14,735 | ) |
| Cash and Cash Equivalents at Beginning of Year | | | 29,695 | | | 32,931 | | | 47,666 | |
| Cash and Cash Equivalents at End of Year | | $ | 27,914 | | $ | 29,695 | | $ | 32,931 | |
| | | | | | | | | | | |
Cash Paid During the Year for: | | | | | | | | | | |
| Interest | | $ | 33,781 | | $ | 25,805 | | $ | 17,625 | |
| Income Taxes | | | 2,395 | | | 3,605 | | | 3,210 | |
See accompanying notes to consolidated financial statements.
Notes to the Consolidated Financial Statements
Dollars in thousands, except per share data
NOTE 1 – Summary of Significant Accounting Policies
Description of Business and Basis of Presentation
German American Bancorp, Inc. operations are primarily comprised of three business segments: core banking, trust and investment advisory services, and insurance operations. The accounting and reporting policies of German American Bancorp, Inc. and its subsidiaries conform to U.S. generally accepted accounting principles. The more significant policies are described below. The consolidated financial statements include the accounts of the Company and its subsidiaries after elimination of all material intercompany accounts and transactions. Certain prior year amounts have been reclassified to conform with current classifications. The preparation of financial statements in conformity with U.S. generally accepted accounting principles requires management to make estimates and assumptions that affect the reported amounts and disclosures. Actual results could differ from those estimates. Estimates susceptible to change in the near term include the allowance for loan losses, other-than-temporary impairment of securities, the valuation allowance on deferred tax assets, and loss contingencies.
Securities
Securities classified as available-for-sale are securities that the Company intends to hold for an indefinite period of time, but not necessarily until maturity. These include securities that management may use as part of its asset/liability strategy, or that may be sold in response to changes in interest rates, changes in prepayment risk, or similar reasons. Equity securities with readily determinable fair values are classified as available-for-sale. Equity securities that do not have readily determinable fair values are carried at historical cost and evaluated for impairment on a periodic basis. Securities classified as available-for-sale are reported at market value with unrealized gains or losses included as a separate component of equity, net of tax. Securities classified as held-to-maturity are securities that the Company has both the ability and positive intent to hold to maturity. Securities held-to-maturity are carried at amortized cost.
Premium amortization is deducted from, and discount accretion is added to, interest income using the level yield method without anticipating prepayments, except for mortgage-backed securities where prepayments are anticipated. Gains and losses on sales are recorded on trade date and are computed on the identified securities method. Securities are written down to fair value when a decline in fair value is not considered temporary. In estimating other-than-temporary losses, management considers: (1) the length of time and extent that fair value has been less than cost, (2) the financial condition and near term prospects of the issuer, and (3) the Company’s ability and intent to hold the security for a period sufficient to allow for any anticipated recovery in fair value.
Loans Held for Sale
Mortgage loans originated and intended for sale in the secondary market are carried at the lower of cost or market value, in aggregate. Net unrealized losses, if any, are recorded as a valuation allowance and charged to earnings.
Mortgage loans held for sale are generally sold on a servicing released basis. Gains and losses on sales of mortgage loans are based on the difference between the selling price and the carrying value of the related loan sold.
Loans
Loans that management has the intent and ability to hold for the foreseeable future or until maturity or pay-off are reported at the principal balance outstanding, net of unearned interest, deferred loan fees and costs, and an allowance for loan losses. Interest income is accrued on unpaid principal balance and includes amortization of net deferred loan fees and costs over the loan term without anticipating prepayments.
Interest income is discontinued on impaired loans and loans past due 90 days or more, unless the loan is well secured and in process of collection. All interest accrued but not received for loans placed on non-accrual is reversed against interest income. Interest received on such loans is accounted for on the cash-basis or cost-recovery method, until qualifying for return to accrual. Loans are returned to accrual status when all the principal and interest amounts contractually due are brought current and future payments are reasonably assured.
Purchased Loans: The Company purchases individual loans and groups of loans. Purchased loans that show evidence of credit deterioration since origination are recorded at the amount paid (or allocated fair value in a purchase business combination), such that there is no carryover of the seller’s allowance for loan losses. After acquisition, incurred losses are recognized by an increase in the allowance for loan losses.
Purchased loans are accounted for individually or aggregated into pools of loans based on common risk characteristics (e.g., credit score, loan type, and date of origination). The Company estimates the amount and timing of expected cash flows for each purchased loan or pool, and the expected cash flows in excess of amount paid is recorded as interest income over the remaining life of the loan or pool (accretable yield). The excess of the loan’s or pool’s contractual principal and interest over expected cash flows is not recorded (nonaccretable difference).
Notes to the Consolidated Financial Statements
Dollars in thousands, except per share data
NOTE 1 – Summary of Significant Accounting Policies (continued)
Over the life of the loan or pool, expected cash flows continue to be estimated. If the present value of expected cash flows is less than the carrying amount, a loss is recorded. If the present value of expected cash flows is greater than the carrying amount, it is recognized as part of future interest income.
Allowance for Loan Losses
The allowance for loan losses is a valuation allowance for probable incurred credit losses. Loan losses are charged against the allowance when management believes the uncollectibility of a loan balance is confirmed. Subsequent recoveries, if any, are credited to the allowance. Management estimates the allowance balance required using past loan loss experience, the nature and volume of the portfolio, information about specific borrower situations and estimated collateral values, economic conditions, and other factors. Allocations of the allowance may be made for specific loans, but the entire allowance is available for any loan that, in management’s judgment, should be charged-off. The allowance consists of specific and general components. The specific component relates to loans that are individually classified as impaired or loans otherwise classified as substandard or special mention. The general component covers non-classified loans and is based on historical loss experience adjusted for current factors.
Loan impairment is reported when full repayment under the terms of the loan is not expected. If a loan is impaired, a portion of the allowance is allocated so that the loan is reported net, at the present value of estimated future cash flows using the loan’s existing rate, or at the fair value of collateral if repayment is expected solely from the collateral. Commercial and agricultural loans are evaluated individually for impairment. Smaller balance homogeneous loans are evaluated for impairment in total. Such loans include real estate loans secured by one-to-four family residences and loans to individuals for household, family and other personal expenditures. Individually evaluated loans on non-accrual are generally considered impaired. Impaired loans, or portions thereof, are charged off when deemed uncollectible.
Federal Home Loan Bank (FHLB) Stock
The Bank is a member of the FHLB system. Members are required to own a certain amount of stock based on the level of borrowings and other factors, and may invest in additional amounts. FHLB stock is carried at cost, classified as a restricted security, and periodically evaluated for impairment based on ultimate recovery of par value. Both cash and stock dividends are reported as income.
Premises, Furniture and Equipment
Land is carried at cost. Premises, furniture, and equipment are stated at cost less accumulated depreciation. Buildings and related components are depreciated using the straight-line method with useful lives ranging from 10 to 40 years. Furniture, fixtures, and equipment are depreciated using the straight-line method with useful lives ranging from 3 to 10 years.
Other Real Estate
Other Real Estate is carried at the lower of cost or fair value, less estimated selling costs. Expenses incurred in carrying Other Real Estate are charged to operations as incurred.
Goodwill and Other Intangible Assets
Goodwill results from prior business acquisitions and represents the excess of the purchase price over the fair value of acquired tangible assets and liabilities and identifiable intangible assets. Goodwill is not amortized, but is assessed at least annually for impairment with any such impairment recognized in the period identified.
Other intangible assets consist of core deposit and acquired customer relationship intangible assets. They are initially measured at fair value and then are amortized over their estimated useful lives, which range from 7 to 10 years.
Company Owned Life Insurance
The Company has purchased life insurance policies on certain directors and executives. This life insurance is recorded at its cash surrender value or the amount that can be realized.
Notes to the Consolidated Financial Statements
Dollars in thousands, except per share data
NOTE 1 – Summary of Significant Accounting Policies (continued)
Servicing Rights
During the second quarter of 2006, the Company sold its mortgage loan servicing rights portfolio and commenced selling all secondary market residential mortgage loans on a servicing-released basis. Prior to the second quarter of 2006 servicing rights were recognized and included with other assets for purchased rights and for the allocated value of retained servicing rights on loans sold. Servicing rights were expensed in proportion to, and over the period of, estimated net servicing revenues. Impairment was evaluated based on the fair value of the rights, using groupings of the underlying loans as to type and age, with any impairment of a grouping reported as a valuation allowance. Fair value was determined based upon discounted cash flows using market based assumptions.
Loss Contingencies
Loss contingencies, including claims and legal actions arising in the ordinary course of business, are recorded as liabilities when the likelihood of loss is probable and an amount or range of loss can be reasonably estimated.
Stock Based Compensation
Effective January 1, 2006, the Company adopted Statement of Financial Accounting Standards (“SFAS”) No. 123R, “Share Based Payment.” The Company elected to utilize the modified prospective transition method, therefore, prior period results have not been restated. Prior to the adoption of SFAS 123R, stock-based compensation expense related to stock options was not recognized in the results of operations if the exercise price was at least equal to the market value of the common stock on the grant date, in accordance with Accounting Principles Board Opinion No. 25, “Accounting for Stock Issued to Employees.” Additional information related to stock based compensation is included in Note 9 to the Consolidated Financial Statements.
Compensation expense under stock options was reported, if applicable, using the intrinsic value method. Under this method, no compensation expense was recognized for stock options granted at or above fair market value. Compensation expense was recognized for stock option modifications, if applicable. Financial Accounting Standard No. 123 required pro forma disclosures for companies that did not adopt its fair value accounting method for stock-based employee compensation. Accordingly, the following pro forma information presents net income and earnings per share had the Standard’s fair value method been used to measure compensation cost for stock option plans in periods prior to 2006.
| | | 2005 | |
| | | | |
| Net Income as Reported | | $ | 9,721 | |
| Compensation Expense Under Fair Value Method, Net of Tax | | | 317 | |
| Pro forma Net Income | | $ | 9,404 | |
| Pro forma Earnings per Share and Diluted Earnings per Share | | $ | 0.86 | |
| Earnings per Share and Diluted Earnings per Share as Reported | | $ | 0.89 | |
For options granted during 2005, the weighted-average fair value at grant date was $1.65. The fair value of options granted during 2005 was estimated using the following weighted-average information: risk-free interest rate of 3.41%, expected life of 3.4 years, expected volatility of stock price of 17%, and expected dividends of 3.56% per year.
Comprehensive Income
Comprehensive income consists of net income and other comprehensive income. Other comprehensive income includes unrealized gains and losses on securities available for sale and changes in unrecognized amounts in pension and other post-retirement benefits, which are also recognized as a separate component of equity.
Income Taxes
Deferred tax liabilities and assets are determined at each balance sheet date and are the result of differences in the financial statement and tax bases of assets and liabilities. Income tax expense is the amount due on the current year tax returns plus or minus the change in deferred taxes. A valuation allowance, if needed, reduces deferred tax assets to the amount expected to be realized.
Retirement Plans
Pension expense under the suspended defined benefit plan is the net of interest cost, return on plan assets and amortization of gains and losses not immediately recognized. Employee 401(k) and profit sharing plan expense is the amount of matching contributions. Deferred compensation and supplemental retirement plan expense allocates the benefits over years of service.
Notes to the Consolidated Financial Statements
Dollars in thousands, except per share data
NOTE 1 – Summary of Significant Accounting Policies (continued)
Earnings Per Share
Earnings per share are based on net income divided by the weighted average number of shares outstanding during the period. Diluted earnings per share show the potential dilutive effect of additional common shares issuable under the Company’s stock based compensation plans. Earnings per share are retroactively restated for stock dividends.
Cash Flow Reporting
The Company reports net cash flows for customer loan transactions, deposit transactions and deposits made with other financial institutions. Cash and cash equivalents are defined to include cash on hand, demand deposits in other institutions and Federal Funds Sold.
Fair Values of Financial Instruments
Fair values of financial instruments are estimated using relevant market information and other assumptions, as more fully disclosed in Note 19. Fair value estimates involve uncertainties and matters of significant judgment regarding interest rates, credit risk, prepayments, and other factors, especially in the absence of broad markets for particular items. Changes in assumptions or in market conditions could significantly affect the estimates. The fair value estimates of existing on- and off-balance sheet financial instruments do not include the value of anticipated future business, or the values of assets and liabilities not considered financial instruments.
New Accounting Pronouncements
In February 2006, the FASB issued Statement of Financial Accounting Standards No. 155, Accounting for Certain Hybrid Financial Instruments (SFAS No. 155), which permits fair value remeasurement for hybrid financial instruments that contain an embedded derivative that otherwise would require bifurcation. Additionally, SFAS No. 155 clarifies the accounting guidance for beneficial interests in securitizations. Under SFAS No. 155, all beneficial interests in a securitization will require an assessment in accordance with SFAS No. 133 to determine if an embedded derivative exists within the instrument. In January 2007, the FASB issued Derivatives Implementation Group Issue B40, Application of Paragraph 13(b) to Securitized Interests in Prepayable Financial Assets (DIG Issue B40). DIG Issue B40 provides an exemption from the embedded derivative test of paragraph 13(b) of SFAS No. 133 for instruments that would otherwise require bifurcation if the test is met solely because of a prepayment feature included within the securitized interest and prepayment is not controlled by the security holder. SFAS No. 155 and DIG Issue B40 became effective for the Company on January 1, 2007. The adoption of SFAS No. 155 and DIG Issue B40 had no impact on the Company's consolidated financial position or results of operations.
In March 2006, the FASB issued Statement No. 156, Accounting for Servicing of Financial Assets-an amendment of FASB Statement No. 140. This Statement provides the following: 1) revised guidance on when a servicing asset and servicing liability should be recognized; 2) requires all separately recognized servicing assets and servicing liabilities to be initially measured at fair value, if practicable; 3) permits an entity to elect to measure servicing assets and servicing liabilities at fair value each reporting date and report changes in fair value in earnings in the period in which the changes occur; 4) upon initial adoption, permits a onetime reclassification of available-for-sale securities to trading securities for securities which are identified as offsetting the entity's exposure to changes in the fair value of servicing assets or liabilities that a servicer elects to subsequently measure at fair value; and 5) requires separate presentation of servicing assets and servicing liabilities subsequently measured at fair value in the statement of financial position and additional footnote disclosures. This standard was effective for the Company on January 1, 2007. The adoption of this Statement had no impact on the Company's consolidated financial position or results of operations.
In July 2006, the FASB issued FASB Interpretation No. 48, Accounting for Uncertainty in Income Taxes - an interpretation of FASB Statement No. 109 (“FIN 48”), which prescribes a recognition threshold and measurement attribute for a tax position taken or expected to be taken in a tax return. FIN 48 also provides guidance on derecognition, classification, interest and penalties, accounting in interim periods, disclosure and transition. The Company adopted the provisions of FIN 48 on January 1, 2007. The adoption of FIN 48 had no effect on the Company’s financial statements.
Notes to the Consolidated Financial Statements
Dollars in thousands, except per share data
NOTE 1 – Summary of Significant Accounting Policies (continued)
In September 2006, the FASB Emerging Issues Task Force finalized Issue No. 06-5, Accounting for Purchases of Life Insurance - Determining the Amount That Could Be Realized in Accordance with FASB Technical Bulletin No. 85-4 (Accounting for Purchases of Life Insurance). This issue requires that a policyholder consider contractual terms of a life insurance policy in determining the amount that could be realized under the insurance contract. It also requires that if the contract provides for a greater surrender value if all individual policies in a group are surrendered at the same time, that the surrender value be determined based on the assumption that policies will be surrendered on an individual basis. Lastly, the issue discusses whether the cash surrender value should be discounted when the policyholder is contractually limited in its ability to surrender a policy. This issue became effective for the Company on January 1, 2007. The adoption of this issue had no impact on the Company’s financial statements.
Effect of Newly Issued but Not Yet Effective Accounting Standards
In September 2006, the FASB issued Statement No. 157, Fair Value Measurements. This Statement defines fair value, establishes a framework for measuring fair value and expands disclosures about fair value measurements. This Statement establishes a fair value hierarchy about the assumptions used to measure fair value and clarifies assumptions about risk and the effect of a restriction on the sale or use of an asset. The standard became effective for the Company on January 1, 2008. The Company does not expect the adoption of this statement will have a material impact on its consolidated financial position or results of operations. The Company is continuing its evaluation of the impact of adoption of this statement
In February 2007, the FASB issued Statement No. 159 – The Fair Value Option for Financial Assets and Financial Liabilities (SFAS No. 159). The standard provides companies with an option to report selected financial assets and liabilities at fair value and establishes presentation and disclosure requirements designed to facilitate comparisons between companies that choose different measurement attributes for similar types of assets and liabilities. The new standard became effective for the Company on January 1, 2008. The Company did not elect the fair value option for any financial assets or financial liabilities as of January 1, 2008.
In September 2006, the FASB Emerging Issues Task Force finalized Issue No. 06-4, Accounting for Deferred Compensation and Postretirement Benefit Aspects of Endorsement Split-Dollar Life Insurance Arrangements. This issue requires that a liability be recorded during the service period when a split-dollar life insurance agreement continues after participants’ employment or retirement. The required accrued liability will be based on either the post-employment benefit cost for the continuing life insurance or based on the future death benefit depending on the contractual terms of the underlying agreement. This issue became effective for the Company on January 1, 2008. The impact of adoption of this issue was not material to the Company’s financial statements.
On November 5, 2007, the SEC issued Staff Accounting Bulletin No. 109, Written Loan Commitments Recorded at Fair Value through Earnings (“SAB 109”). Previously, SAB 105, Application of Accounting Principles to Loan Commitments, stated that in measuring the fair value of a derivative loan commitment, a company should not incorporate the expected net future cash flows related to the associated servicing of the loan. SAB 109 supersedes SAB 105 and indicates that the expected net future cash flows related to the associated servicing of the loan should be included in measuring fair value for all written loan commitments that are accounted for at fair value through earnings. SAB 105 also indicated that internally-developed intangible assets should not be recorded as part of the fair value of a derivative loan commitment, and SAB 109 retains that view. SAB 109 is effective for derivative loan commitments issued or modified in fiscal quarters beginning after December 15, 2007. The Company does not expect the impact of this standard to be material.
Notes to the Consolidated Financial Statements
Dollars in thousands, except per share data
NOTE 2 – Securities
The amortized cost, unrealized gross gains and losses recognized in accumulated other comprehensive income (loss), and fair value of Securities Available-for-Sale were as follows:
| | | | | Gross | | Gross | | | |
| | | Amortized | | Unrealized | | Unrealized | | Fair | |
| | | Cost | | Gains | | Losses | | Value | |
Securities Available-for-Sale: | | | | | | | | | |
| | | | | | | | | | |
2007 | | | | | | | | | |
| U.S. Treasury and Agency Securities | | $ | 25,306 | | $ | 433 | | $ | — | | $ | 25,739 | |
| Obligations of State and Political Subdivisions | | | 11,387 | | | 216 | | | (1 | ) | | 11,602 | |
| Asset- / Mortgage-backed Securities | | | 105,302 | | | 608 | | | (421 | ) | | 105,489 | |
| Equity Securities | | | 4,557 | | | 913 | | | — | | | 5,470 | |
| Total | | $ | 146,552 | | $ | 2,170 | | $ | (422 | ) | $ | 148,300 | |
| | | | | | | | | | | | | | |
2006 | | | | | | | | | | | | | |
| U.S. Treasury and Agency Securities | | $ | 28,083 | | $ | 155 | | $ | (105 | ) | $ | 28,133 | |
| Obligations of State and Political Subdivisions | | | 19,653 | | | 278 | | | (3 | ) | | 19,928 | |
| Asset- / Mortgage-backed Securities | | | 125,340 | | | 350 | | | (1,831 | ) | | 123,859 | |
| Equity Securities | | | 6,236 | | | 1,066 | | | — | | | 7,302 | |
| Total | | $ | 179,312 | | $ | 1,849 | | $ | (1,939 | ) | $ | 179,222 | |
The carrying amount, unrecognized gains and losses and fair value of Securities Held-to-Maturity were as follows:
| | | | | Gross | | Gross | | | |
| | | Carrying | | Unrecognized | | Unrecognized | | Fair | |
| | | Amount | | Gains | | Losses | | Value | |
Securities Held-to-Maturity: | | | | | | | | | |
2007 | | | | | | | | | |
| Obligations of State and Political Subdivisions | | $ | 4,464 | | $ | 32 | | $ | — | | $ | 4,496 | |
| | | | | | | | | | | | | | |
2006 | | | | | | | | | | | | | |
| Obligations of State and Political Subdivisions | | $ | 6,135 | | $ | 57 | | $ | — | | $ | 6,192 | |
The amortized cost and fair value of Securities at December 31, 2007 by contractual maturity are shown below. Expected maturities may differ from contractual maturities because some issuers have the right to call or prepay certain obligations with or without call or prepayment penalties. Asset-backed, Mortgage-backed and Equity Securities are not due at a single maturity date and are shown separately.
| | | Amortized | | Fair | |
| | | Cost | | Value | |
Securities Available-for-Sale: | | | | | |
| Due in one year or less | | $ | 2,459 | | $ | 2,466 | |
| Due after one year through five years | | | 28,528 | | | 29,003 | |
| Due after five years through ten years | | | 4,913 | | | 5,066 | |
| Due after ten years | | | 793 | | | 806 | |
| Asset- / Mortgage-backed Securities | | | 105,302 | | | 105,489 | |
| Equity Securities | | | 4,557 | | | 5,470 | |
| Totals | | $ | 146,552 | | $ | 148,300 | |
| | | Carrying | | Fair | |
| | | Amount | | Value | |
Securities Held-to-Maturity: | | | | | |
| Due in one year or less | | $ | 435 | | $ | 436 | |
| Due after one year through five years | | | 1,867 | | | 1,880 | |
| Due after five years through ten years | | | 1,136 | | | 1,149 | |
| Due after ten years | | | 1,026 | | | 1,031 | |
| Totals | | $ | 4,464 | | $ | 4,496 | |
Notes to the Consolidated Financial Statements
Dollars in thousands, except per share data
NOTE 2 – Securities (continued)
Proceeds from the Sales of Securities are summarized below:
| | | 2007 | | 2006 | | 2005 | |
| | | Available- | | Available- | | Available- | |
| | | for-Sale | | for-Sale | | for-Sale | |
| | | | | | | | |
| Proceeds from Sales and Calls | | $ | 998 | | $ | 13,001 | | $ | — | |
| Gross Gains on Sales and Calls | | | 62 | | | 951 | | | — | |
| Gross Losses on Sales and Calls | | | — | | | — | | | — | |
| | | | | | | | | | | |
| Income Taxes on Gross Gains | | | 25 | | | 323 | | | — | |
| Income Taxes on Gross Losses | | | — | | | — | | | — | |
The carrying value of securities pledged to secure repurchase agreements, public and trust deposits, and for other purposes as required by law was $102,829 and $105,798 as of December 31, 2007 and 2006, respectively.
Below is a summary of securities with unrealized losses as of year-end 2007 and 2006, presented by length of time the securities have been in a continuous unrealized loss position:
| | | Less than 12 Months | | 12 Months or More | | Total | |
| | | Fair | | Unrealized | | Fair | | Unrealized | | Fair | | Unrealized | |
| | | Value | | Loss | | Value | | Loss | | Value | | Loss | |
| | | | | | | | | | | | | |
| | | | | | | | | | | | | | | | | | | | |
U.S. Treasury Securities and Obligations of Government Corporations and Agencies | | $ | — | | $ | — | | $ | — | | $ | — | | $ | — | | $ | — | |
| Obligations of State and Political Subdivisions | | | — | | | — | | | 230 | | | (1 | ) | | 230 | | | (1 | ) |
| Asset- / Mortgage-backed Securities | | | 1,544 | | | (1 | ) | | 56,647 | | | (420 | ) | | 58,191 | | | (421 | ) |
| Equity Securities | | | — | | | — | | | — | | | — | | | — | | | — | |
| Total | | $ | 1,544 | | $ | (1 | ) | $ | 56,877 | | $ | (421 | ) | $ | 58,421 | | $ | (422 | ) |
| | | Less than 12 Months | | 12 Months or More | | Total | |
| | | Fair | | Unrealized | | Fair | | Unrealized | | Fair | | Unrealized | |
| | | Value | | Loss | | Value | | Loss | | Value | | Loss | |
At December 31, 2006: | | | | | | | | | | | | | |
| | | | | | | | | | | | | | |
U.S. Treasury Securities and Obligations of Government Corporations and Agencies | | $ | 5,835 | | $ | (19 | ) | $ | 6,511 | | $ | (86 | ) | $ | 12,346 | | $ | (105 | ) |
| Obligations of State and Political Subdivisions | | | 1,232 | | | (3 | ) | | — | | | — | | | 1,232 | | | (3 | ) |
| Asset- / Mortgage-backed Securities | | | 7,123 | | | (33 | ) | | 84,439 | | | (1,798 | ) | | 91,562 | | | (1,831 | ) |
| Equity Securities | | | — | | | — | | | — | | | — | | | — | | | — | |
| Total | | $ | 14,190 | | $ | (55 | ) | $ | 90,950 | | $ | (1,884 | ) | $ | 105,140 | | $ | (1,939 | ) |
Securities are written down to fair value when a decline in fair value is not considered temporary. In estimating other-than-temporary losses, management considers the length of time and extent that fair value has been less than cost, the financial condition and near term prospects of the issuer, and the Company’s ability and intent to hold the security for a period sufficient to allow for any anticipated recovery in fair value. At December 31, 2007 and 2006, the Company had the intent and ability to hold these securities for the foreseeable future, and the decline in fair value was largely due to changes in market interest rates, therefore, the Company does not consider these securities to be other-than-temporarily impaired.
The Company’s equity securities consist of non-controlling investments in other banking organizations. As a result of a valuation of this portfolio during the fourth quarter of 2007, the Company recognized a $742 pre-tax charge for an other-than-temporary decline in fair value of this portfolio. As required by SFAS 115, when a decline in fair value below cost is deemed to be other-than-temporary, the unrealized loss must be recognized as a charge to earnings. Accordingly, the other-than-temporary impairment was recognized in the income statement as an investment securities loss during 2007.
Notes to the Consolidated Financial Statements
Dollars in thousands, except per share data
NOTE 3 – Loans
Loans were comprised of the following classifications at December 31:
| | | 2007 | | 2006 | |
| | | | | | |
| Residential Mortgage Loans | | $ | 116,908 | | $ | 114,687 | |
| Agricultural Loans | | | 165,592 | | | 148,872 | |
| Commercial and Industrial Loans | | | 457,033 | | | 402,285 | |
| Consumer Loans | | | 131,110 | | | 132,791 | |
| Totals | | $ | 870,643 | | $ | 798,635 | |
Nonperforming loans were as follows at December 31:
| Loans past due over 90 days and accruing and Restructured Loans | | $ | 8 | | $ | — | |
| Non-accrual Loans | | | 4,356 | | | 9,652 | |
| Totals | | $ | 4,364 | | $ | 9,652 | |
| | | 2007 | | 2006 | |
| Information regarding impaired loans: | | | | | | | |
| | | | | | | | |
| Year-end impaired loans with no allowance for loan losses allocated | | $ | 1,919 | | $ | 5,672 | |
| Year-end impaired loans with allowance for loan losses allocated | | | 2,384 | | | 2,483 | |
| | | | | | | | |
| Amount of allowance allocated to impaired loans | | | 399 | | | 704 | |
| | | 2007 | | 2006 | | 2005 | |
| Average balance of impaired loans during the year | | $ | 7,376 | | $ | 10,202 | | $ | 10,465 | |
| | | | | | | | | | | |
| Interest income recognized during impairment | | | 314 | | | 157 | | | 62 | |
| Interest income recognized on cash basis | | | 304 | | | 149 | | | 52 | |
The Company purchased a Southern Indiana-based agricultural loan portfolio from a regional banking company in December 2006 totaling $42.1 million. There was no evidence of credit deterioration since origination on these loans as defined in Statement of Position (SOP) 03-3.
Certain directors, executive officers, and principal shareholders of the Company, including their immediate families and companies in which they are principal owners, were loan customers of the Company during 2007. A summary of the activity of these loans follows:
Balance | | | | Changes | | | | | | Balance | |
January 1, | | | | in Persons | | Deductions | | December 31, | |
2007 | | Additions | | Included | | Collected | | Charged-off | | 2007 | |
| $ | 4,923 | | $ | 1,487 | | $ | 445 | | $ | (2,396 | ) | $ | — | | $ | 4,459 | |
NOTE 4 – Allowance for Loan Losses
A summary of the activity in the Allowance for Loan Losses follows:
| | | 2007 | | 2006 | | 2005 | |
| | | | | | | | |
| Balance as of January 1 | | $ | 7,129 | | $ | 9,265 | | $ | 8,801 | |
| Provision for Loan Losses | | | 3,591 | | | 925 | | | 1,903 | |
| Allowance from Acquired Subsidiary | | | — | | | 484 | | | 239 | |
| Recoveries of Prior Loan Losses | | | 568 | | | 403 | | | 465 | |
| Loan Losses Charged to the Allowance | | | (3,244 | ) | | (3,948 | ) | | (2,143 | ) |
| Balance as of December 31 | | $ | 8,044 | | $ | 7,129 | | $ | 9,265 | |
Notes to the Consolidated Financial Statements
Dollars in thousands, except per share data
NOTE 5 – Mortgage Banking
At December 31, 2007 and 2006, no loans were serviced by the Company for the benefit of others.
Activity for capitalized mortgage servicing rights and the related valuation allowance was as follows. The net balance of mortgage servicing rights is included in Other Assets.
| | | 2007 | | 2006 | | 2005 | |
| Servicing Rights: | | | | | | | | | | |
| Beginning of Year | | $ | — | | $ | 3,393 | | $ | 3,399 | |
| Additions | | | — | | | 313 | | | 707 | |
| Amortized to Expense | | | — | | | (316 | ) | | (713 | ) |
| Direct Write-downs | | | — | | | — | | | — | |
| Sale of Servicing | | | — | | | (3,390 | ) | | — | |
| End of Year | | $ | — | | $ | — | | $ | 3,393 | |
| | | | | | | | | | | |
| Valuation Allowance: | | | | | | | | | | |
| Beginning of Year | | $ | — | | $ | 365 | | $ | 777 | |
| Additions Expensed | | | — | | | — | | | 131 | |
| Reductions Credited to Expense | | | — | | | (45 | ) | | (543 | ) |
| Direct Write-downs | | | — | | | — | | | — | |
| Sale of Servicing | | | — | | | (320 | ) | | — | |
| End of Year | | $ | — | | $ | — | | $ | 365 | |
During the second quarter of 2006, the Company sold its mortgage loan servicing rights portfolio and commenced selling all secondary market residential mortgage loans on a servicing released basis. A gain of $198 was recorded on the sale of the mortgage loan servicing rights portfolio.
NOTE 6 – Premises, Furniture, and Equipment
Premises, furniture, and equipment was comprised of the following classifications at December 31:
| | | 2007 | | 2006 | |
| | | | | | |
| Land | | $ | 4,540 | | $ | 4,541 | |
| Buildings and Improvements | | | 28,011 | | | 27,127 | |
| Furniture and Equipment | | | 15,605 | | | 17,191 | |
| Total Premises, Furniture and Equipment | | | 48,156 | | | 48,859 | |
| Less: Accumulated Depreciation | | | (25,373 | ) | | (25,614 | ) |
| Total | | $ | 22,783 | | $ | 23,245 | |
Depreciation expense was $2,368, $2,265 and $2,131 for 2007, 2006 and 2005, respectively.
The Company leases one of its branch buildings under a capital lease. The lease arrangement requires monthly payments through 2027.
The Company has included this lease in buildings and improvements as follows:
| | | 2007 | | 2006 | |
| | | | | | |
| Capital Lease | | $ | 743 | | $ | — | |
| Less: Accumulated Depreciation | | | (36 | ) | | — | |
| Total | | $ | 707 | | $ | — | |
Notes to the Consolidated Financial Statements
Dollars in thousands, except per share data
NOTE 6 – Premises, Furniture, and Equipment (continued)
The following is a schedule of future minimum lease payments under the capital lease, together with the present value of net minimum lease payments at year end 2007:
| 2008 | | $ | 81 | |
| 2009 | | | 81 | |
| 2010 | | | 81 | |
| 2011 | | | 81 | |
| 2012 | | | 81 | |
| Thereafter | | | 1,185 | |
| Total minimum lease payments | | | 1,590 | |
| Less: Amount representing interest | | | (860 | ) |
| Present Value of Net Minimum Lease Payments | | $ | 730 | |
NOTE 7 – Deposits
At year-end 2007, stated maturities of time deposits were as follows:
| 2008 | | $ | 218,723 | |
| 2009 | | | 135,606 | |
| 2010 | | | 19,498 | |
| 2011 | | | 6,419 | |
| 2012 | | | 7,143 | |
| Thereafter | | | 177 | |
| Total | | $ | 387,566 | |
Time deposits of $100 or more at December 31, 2007 and 2006 were $109,717 and $120,547, respectively.
Time deposits originated from outside the geographic area, generally through brokers, totaled $20,099 and $7,079 at December 31, 2007 and 2006, respectively.
NOTE 8 – FHLB Advances and Other Borrowed Money
The Company’s funding sources include Federal Home Loan Bank advances and repurchase agreements. Information regarding each of these types of borrowings is as follows:
| | | December 31, | |
| | | 2007 | | 2006 | |
Long-term Advances from the Federal Home Loan Bank collateralized by qualifying mortgages, investment securities, and mortgage-backed securities | | $ | 67,056 | | $ | 48,333 | |
| Term Loans | | | 9,000 | | | 10,000 | |
| Subordinated Debenture | | | 10,000 | | | 10,000 | |
| Capital Lease Obligation | | | 730 | | | — | |
| Long-term Borrowings | | $ | 86,786 | | $ | 68,333 | |
| | | | | | | | |
Overnight Variable Rate Advances from Federal Home Loan Bank collateralized by qualifying mortgages, investment securities, and mortgage-backed securities | | $ | 29,600 | | $ | 34,600 | |
| Federal Funds Purchased | | | — | | | — | |
| Repurchase Agreements | | | 24,534 | | | 16,956 | |
| Promissory Notes Payable | | | 3,250 | | | — | |
| Short-term Borrowings | | | 57,384 | | | 51,556 | |
| | | | | | | | |
| Total Borrowings | | $ | 144,170 | | $ | 119,889 | |
Notes to the Consolidated Financial Statements
Dollars in thousands, except per share data
NOTE 8 – FHLB Advances and Other Borrowed Money (continued)
Repurchase agreements, which are classified as secured borrowings, generally mature within one day of the transaction date. Repurchase agreements are reflected at the amount of cash received in connection with the transaction. The Company may be required to provide additional collateral based on the value of the underlying securities.
| | | 2007 | | 2006 | |
| Average Daily Balance During the Year | | $ | 23,794 | | $ | 24,903 | |
| Average Interest Rate During the Year | | | 4.23 | % | | 4.25 | % |
| Maximum Month-end Balance During the Year | | $ | 34,235 | | $ | 37,776 | |
| Weighted Average Interest at Year-end | | | 3.54 | % | | 4.53 | % |
At December 31, 2007, interest rates on the fixed rate long-term FHLB advances ranged from 4.18% to 7.22% with a weighted average rate of 5.27%. Of the $67.1 million, $40.0 million or 60% of the advances contained options whereby the FHLB may convert the fixed rate advance to an adjustable rate advance, at which time the company may prepay the advance without penalty. The options on these advances are subject to a variety of terms including LIBOR based strike rates.
At December 31, 2006, interest rates on the fixed rate long-term FHLB advances ranged from 2.65% to 7.22% with a weighted average rate of 5.09%. Of the $48.3 million, $30.0 million or 62% of the advances contained options whereby the FHLB may convert the fixed rate advance to an adjustable rate advance, at which time the company may prepay the advance without penalty. The options on these advances are subject to a variety of terms including LIBOR based strike rates.
The long-term borrowings shown above includes $9 million and $10 million outstanding on a term loan owed by the parent company as of December 31, 2007 and 2006, respectively. Interest on the term loan is based upon 90-day LIBOR plus 1.15%. The term loan matures January 1, 2014. At December 31, 2007, the parent company had a $15 million line of credit with a $3.25 million outstanding balance. The line of credit matures September 9, 2008. At December 31, 2006, the parent company had a $15 million line of credit with no outstanding balance. Interest on the line of credit was based upon 90-day LIBOR plus 1.15%. The line of credit was renewed and extended in September 2007.
At December 31, 2007 and 2006, the long-term borrowings shown above include a $10 million subordinated debenture owed by the parent company. Interest on the subordinated debenture is based upon 90-day LIBOR plus 1.35%. The subordinated debenture matures on January 1, 2014. The entire principal amount of the subordinated debenture was treated as Tier 2 capital for regulatory capital purposes as of December 31, 2007 and 2006.
Scheduled principal payments on long-term borrowings, excluding the capital lease obligation, at December 31, 2007 are as follows:
| 2008 | | $ | 4,664 | |
| 2009 | | | 21,523 | |
| 2010 | | | 32,287 | |
| 2011 | | | 1,530 | |
| 2012 | | | 11,533 | |
| Thereafter | | | 14,519 | |
| Total | | $ | 86,056 | |
See also Note 6 regarding the capital lease obligation.
Notes to the Consolidated Financial Statements
Dollars in thousands, except per share data
NOTE 9 – Stockholders’ Equity
The Company and affiliate bank are subject to regulatory capital requirements administered by federal banking agencies. Capital adequacy guidelines and prompt corrective action regulations involve quantitative measures of assets, liabilities, and certain off-balance sheet items calculated under regulatory accounting practices. Capital amounts and classifications are also subject to qualitative judgments by regulators about components, risk weightings, and other factors, and the regulators can lower classifications in certain cases. Failure to meet various capital requirements can initiate regulatory action that could have a direct material effect on the financial statements.
The prompt corrective action regulations provide five classifications, including well-capitalized, adequately capitalized, undercapitalized, significantly undercapitalized, and critically undercapitalized, although these terms are not used to represent overall financial condition. If adequately capitalized, regulatory approval is required to accept brokered deposits. If undercapitalized, capital distributions are limited, as is asset growth and expansion, and plans for capital restoration are required.
At December 31, 2007, consolidated and affiliate bank actual capital and minimum required levels are presented below:
| | | | | | | | | Minimum Required | |
| | | | | | | | | To Be Well- | |
| | | | | | | Minimum Required | | Capitalized Under | |
| | | | | | | For Capital | | Prompt Corrective | |
| | | Actual | | Adequacy Purposes: | | Action Regulations: | |
| | | Amount | | Ratio | | Amount | | Ratio | | Amount | | Ratio | |
Total Capital | | | | | | | | | | | | | | | | | | | |
(to Risk Weighted Assets) | | | | | | | | | | | | | | | | | | | |
Consolidated | | $ | 100,790 | | | 10.63 | % | $ | 75,839 | | | 8.00 | % | | N/A | | | N/A | |
Bank | | | 103,986 | | | 11.08 | | | 75,111 | | | 8.00 | | $ | 93,889 | | | 10.00 | % |
Tier 1 Capital | | | | | | | | | | | | | | | | | | | |
(to Risk Weighted Assets) | | | | | | | | | | | | | | | | | | | |
Consolidated | | $ | 82,335 | | | 8.69 | % | $ | 37,919 | | | 4.00 | % | | N/A | | | N/A | |
Bank | | | 95,942 | | | 10.22 | | | 37,556 | | | 4.00 | | $ | 56,333 | | | 6.00 | % |
Tier 1 Capital | | | | | | | | | | | | | | | | | | | |
(to Average Assets) | | | | | | | | | | | | | | | | | | | |
Consolidated | | $ | 82,335 | | | 7.41 | % | $ | 44,460 | | | 4.00 | % | | N/A | | | N/A | |
Bank | | | 95,942 | | | 8.72 | | | 44,017 | | | 4.00 | | $ | 55,021 | | | 5.00 | % |
At December 31, 2006, consolidated and affiliate bank actual capital and minimum required levels are presented below:
| | | | | | | | | | | Minimum Required | |
| | | | | | | | | | | To Be Well- | |
| | | | | | | Minimum Required | | Capitalized Under | |
| | | | | | | For Capital | | Prompt Corrective | |
| | | Actual | | Adequacy Purposes: | | Action Regulations: | |
| | | Amount | | Ratio | | Amount | | Ratio | | Amount | | Ratio | |
| Total Capital | | | | | | | | | | | | | | | | | | | |
| (to Risk Weighted Assets) | | | | | | | | | | | | | | | | | | | |
| Consolidated | | $ | 95,535 | | | 10.66 | % | $ | 71,716 | | | 8.00 | % | | N/A | | | N/A | |
| Bank | | | 88,169 | | | 10.05 | | | 70,205 | | | 8.00 | | $ | 87,757 | | | 10.00 | % |
| Tier 1 Capital | | | | | | | | | | | | | | | | | | | |
| (to Risk Weighted Assets) | | | | | | | | | | | | | | | | | | | |
| Consolidated | | $ | 77,926 | | | 8.69 | % | $ | 35,858 | | | 4.00 | % | | N/A | | | N/A | |
| Bank | | | 81,040 | | | 9.23 | | | 35,103 | | | 4.00 | | $ | 52,654 | | | 6.00 | % |
| Tier 1 Capital | | | | | | | | | | | | | | | | | | | |
| (to Average Assets) | | | | | | | | | | | | | | | | | | | |
| Consolidated | | $ | 77,926 | | | 7.41 | % | $ | 42,065 | | | 4.00 | % | | N/A | | | N/A | |
| Bank | | | 81,040 | | | 7.82 | | | 41,476 | | | 4.00 | | $ | 51,845 | | | 5.00 | % |
Notes to the Consolidated Financial Statements
Dollars in thousands, except per share data
NOTE 9 – Stockholders’ Equity (continued)
The Company and the affiliate bank at year-end 2007 and 2006 were categorized as well-capitalized. There have been no conditions or events that management believes have changed the classification of the Company or affiliate bank under the prompt corrective action regulations since the last notification from regulators. Regulations require the maintenance of certain capital levels at the affiliate bank, and may limit the dividends payable by the affiliate to the holding company, or by the holding company to its shareholders. At December 31, 2007, the affiliate bank had $10,100 in retained earnings available for dividends to the parent company without prior regulatory approval.
Equity Plans and Equity Based Compensation
The Company maintains two equity incentive plans under which stock options, restricted stock, and other equity incentive awards can be granted. At December 31, 2007, the Company has reserved 620,144 shares of Common Stock (as adjusted for subsequent stock dividends and subject to further customary anti-dilution adjustments) for the purpose of issuance pursuant to outstanding and future grants of options, restricted stock, and other equity awards to officers, directors and other employees of the Company.
Stock Options
Options may be designated as “incentive stock options” under the Internal Revenue Code of 1986, or as nonqualified options. While the date after which options are first exercisable is determined by the Long-Term Incentive Award Committee of the Company or, in the case of options granted to directors, by the Board of Directors, no stock option may be exercised after ten years from the date of grant (twenty years in the case of nonqualified stock options). The exercise price of stock options granted pursuant to the Plans must be no less than the fair market value of the Common Stock on the date of the grant.
The Plans authorize an optionee to pay the exercise price of options in cash or in common shares of the Company or in some combination of cash and common shares. An optionee may tender already-owned common shares to the Company in exercise of an option. The Company typically issues authorized but unissued common shares upon the exercise of options.
The following table presents activity for stock options under the Company’s equity incentive plan for 2007:
| | | Year Ended December 31, 2007 | |
| | | | | Weighted Avg. | | Weighted Avg. | | Aggregate | |
| | | Number of | | Price of | | Life of Options | | Intrinsic | |
| | | Options | | Options | | (in years) | | Value | |
| | | | | | | | | | |
| Outstanding at beginning of period | | | 370,413 | | $ | 16.38 | | | | | | | |
| Granted | | | — | | | — | | | | | | | |
| Exercised | | | — | | | — | | | | | | | |
| Forfeited | | | (8,729 | ) | | 17.22 | | | | | | | |
| Expired | | | (54,517 | ) | | 15.32 | | | | | | | |
| Outstanding & Exercisable at end of period | | | 307,167 | | $ | 16.55 | | | 4.61 | | $ | 3 | |
The following table presents information related to stock options under the Company’s equity incentive plan during the years ended 2007, 2006, and 2005:
| | | 2007 | | 2006 | | 2005 | |
| | | | | | | | |
| Intrinsic Value of Options Exercised | | $ | — | | $ | 5 | | $ | 130 | |
| Cash Received from Option Exercises | | $ | — | | $ | 17 | | $ | 48 | |
| Tax Benefit of Option Exercises | | $ | — | | $ | — | | $ | — | |
| Weighted Average Fair Value of Options Granted | | $ | — | | $ | 2.68 | | $ | 1.65 | |
Notes to the Consolidated Financial Statements
Dollars in thousands, except per share data
NOTE 9 – Stockholders’ Equity (continued)
The intrinsic value for stock options is calculated based on the exercise price of the underlying awards and the market price of common stock as of the reporting date.
The Company granted no options during 2007, and accordingly, recorded no stock compensation expense related to option grants during 2007. The Company recorded $19 in stock compensation expense, net of an income tax benefit of $10, during the year ended December 31, 2006 related to the granting of 11,000 options in the second quarter of 2006. To calculate the fair value of this option grant, the following assumptions were used as of the grant date: risk free interest rate of 5.11%, expected option life of 10.0 years, expected stock price volatility of 22.4%, and dividend yield of 4.20%. The resulting weighted average fair value of the options granted in the second quarter of 2006 was $2.68 for each option granted. The Company recorded no other stock compensation expense applicable to options during the years ended December 31, 2007 and 2006 because all outstanding options were fully vested prior to 2006.
The fair value of each stock option granted is estimated on the date of grant using the Black-Scholes based stock option valuation model. This model requires the input of subjective assumptions that may have a significant impact on the fair value estimate. Expected volatility is based on historical volatility of the Company’s stock, and other factors. Expected dividends are based on dividend trends and the market price of the Company’s stock price at the time of the grant. The Company uses historical data to estimate option exercises and employee terminations within the valuation model. The risk-free rate for periods within the contractual life of the option is based on the U.S. Treasury yield curve in effect at the time of the grant.
SFAS 123R requires the recognition of stock based compensation for the number of awards that are ultimately expected to vest. The Company did not reduce its compensation expense for estimated forfeitures prior to vesting because all grants made during 2006 were immediately vested. Estimated forfeitures will continue to be reassessed in future periods and may change based on new facts and circumstances.
As of December 31, 2007 and 2006, there was no unrecognized option expense as all outstanding options were fully vested.
Restricted Stock
In years prior to 2006, awards of long-term incentives were granted in the form of incentive stock options. Effective in 2006, the Long-Term Incentive Award Committee determined that future awards of long-term incentives under the plan should generally be made in the form of restricted stock, granted in tandem with cash credit entitlements. The incentive awards will typically be in the form of 50% restricted stock grants and 50% cash credit entitlements. The restricted stock grants and tandem cash credit entitlements are subject to forfeiture in the event that the recipient of the grant does not continue employment with the Company through December 15 of the year of grant, at which time they generally vest 100 percent. For measuring compensation costs, restricted stock awards are valued based upon the market value of the common shares on the date of grant.
The expense recorded for the restricted stock grants totaled $171, net of an income tax benefit of $112, during the year ended December 31, 2007. The expense recorded for the restricted stock grants totaled $109, net of an income tax benefit of $71, during the year ended December 31, 2006. There was no unrecognized expense associated with the restricted stock grants as of December 31, 2007 and 2006.
The following table presents information on restricted stock grants outstanding for the period shown:
| | | Year Ended | |
| | | December 31, 2007 | |
| | | | | Weighted | |
| | | Restricted | | Average Market | |
| | | Shares | | Price at Grant | |
| | | | | | |
| Outstanding at Beginning of Period | | | — | | $ | — | |
| Granted | | | 21,797 | | | 13.55 | |
| Issued | | | (20,922 | ) | | 13.55 | |
| Forfeited | | | (875 | ) | | 13.55 | |
| Outstanding at End of Period | | | — | | | — | |
Notes to the Consolidated Financial Statements
Dollars in thousands, except per share data
NOTE 9 – Stockholders’ Equity (continued)
Employee Stock Purchase Plan
The Company maintains an Employee Stock Purchase Plan whereby eligible employees have the option to purchase the Company’s common stock at a discount. The plan year for the Employee Stock Purchase Plan runs from August 17 through August 16 of the subsequent year. The purchase price of the shares under this plan is determined annually and shall be in the range from 85% to 100% of the fair market value of such stock at either the beginning or end of the plan year. For the plan year ended August 16, 2008, the purchase price of the shares under this Plan will be 95% of the fair market value of the Company’s common stock as of the last day of the plan year. The plan provides for the purchase of up to 542,420 shares of common stock, which the Company may obtain by purchases on the open market or from private sources, or by issuing authorized but unissued common shares. Funding for the purchase of common stock is from employee and Company contributions. The plan was considered non-compensatory under APB No. 25, and as a result no compensation expense was recorded in periods prior to 2006 and Company contributions were a reduction to additional paid-in capital.
As a result of the adoption of SFAS 123R on January 1, 2006, the Company was required to record compensation expense for plan participation beginning January 1, 2006. The fair value of options granted as a part of plan was estimated on the date of grant similarly to those stock options granted under the Company’s equity incentive plans utilizing a Black-Scholes stock option valuation model. The inputs for expected volatility, expected dividends, and risk-free rate are the same as previously discussed. The fair value of options granted was also affected by the estimate of employee participation in the plan, which is based upon historical experience. The grant date fair value of options granted for the plan year ended August 16, 2007 was estimated to be $2.50. The grant date fair value of options granted for the plan year ended August 16, 2006 was estimated to be $3.08. The expense recorded for the employee stock purchase plan totaled $29, net of an income tax benefit of $19, during the year ended December 31, 2007. The expense recorded for the employee stock purchase plan totaled $45, net of an income tax benefit of $30, during the year ended December 31, 2006. Unrecognized compensation expense totaled $0 and $47 as of December 31, 2007 and 2006 for the Employee Stock Purchase Plan. Based on the above referenced setting of the purchase price at 95% of the fair market value of the Company’s common stock for the plan year ended August 16, 2008, the Employee Stock Purchase Plan will not be considered compensatory and no compensation expense will be recorded for the current plan year.
Stock Repurchase Plan
On April 26, 2001, the Company announced that its Board of Directors approved a stock repurchase program for up to 607,754 of the outstanding Common Shares of the Company. Shares may be purchased from time to time in the open market and in large block privately negotiated transactions. The Company is not obligated to purchase any shares under the program, and the program may be discontinued at any time before the maximum number of shares specified by the program are purchased. As of December 31, 2007, the Company had purchased 334,965 shares under the program. No shares were purchased under the program during the year ended December 31, 2007.
NOTE 10 – Employee Benefit Plans
The Company provides a contributory trusteed 401(k) deferred compensation and profit sharing plan, which covers substantially all employees. The Company agrees to match certain employee contributions under the 401(k) portion of the plan, while profit sharing contributions are discretionary and are subject to determination by the Board of Directors. Company contributions were $552, $544 and $465 for 2007, 2006 and 2005, respectively.
The Company self-insures employee health benefits. Stop loss insurance covers annual losses exceeding $85 per covered individual. Management’s policy is to establish a reserve for claims not submitted by a charge to earnings based on prior experience. Charges to earnings were $1,495, $1,895 and $1,642 for 2007, 2006 and 2005, respectively.
Notes to the Consolidated Financial Statements
Dollars in thousands, except per share data
NOTE 10 – Employee Benefit Plans (continued)
The Company maintains deferred compensation plans for the benefit of certain directors and officers. Under the plans, the Company agrees in return for the directors and officers deferring the receipt of a portion of their current compensation, to pay a retirement benefit computed as the amount of the compensation deferred plus accrued interest at a variable rate. Accrued benefits payable totaled $2,842 and $3,110 at December 31, 2007 and 2006. Deferred compensation expense was $121, $115, and $322 2007, 2006 and 2005, respectively. In conjunction with the plans, the Company purchased life insurance on certain directors and officers.
The Company acquired through previous bank mergers a noncontributory defined benefit pension plan with benefits based on years of service and compensation prior to retirement. The benefits under the plan were suspended in 1998. Partial settlements of the plan were $46 and $68 during the years ended 2007 and 2006, respectively. During the year ended 2005, there were no losses incurred on partial settlements of the plan. The Company uses a September 30 measurement date for its plan.
Accumulated plan benefit information for the Company’s plan as of December 31, 2007 and 2006 was as follows:
| | | 2007 | | 2006 | |
| Changes in Benefit Obligation: | | | | | | | |
| Obligation at Beginning of Year | | $ | 743 | | $ | 880 | |
| Service Cost | | | — | | | — | |
| Interest Cost | | | 37 | | | 48 | |
| Benefits Paid | | | (162 | ) | | (221 | ) |
| Actuarial Gain | | | (19 | ) | | (8 | ) |
| Adjustment in Cost of Settlement | | | 16 | | | 44 | |
| Obligation at End of Year | | | 615 | | | 743 | |
| | | | | | | | |
| Changes in Plan Assets: | | | | | | | |
| Fair Value at Beginning of Year | | | 352 | | | 501 | |
| Actual Return on Plan Assets | | | 8 | | | 19 | |
| Employer Contributions | | | 72 | | | 53 | |
| Benefits Paid | | | (162 | ) | | (221 | ) |
| Fair Value at End of Year | | | 270 | | | 352 | |
| | | | | | | | |
| Funded Status: | | | | | | | |
| | | | | | | | |
| Funded Status at End of Year | | $ | (345 | ) | $ | (391 | ) |
Amounts recognized in accumulated other comprehensive income at December 31 consist of:
| Net Loss (Gain) | | $ | 208 | | $ | 280 | |
| Prior Service Cost | | | 5 | | | 2 | |
| Transition Asset | | | (1 | ) | | (2 | ) |
| | | $ | 212 | | $ | 280 | |
The accumulated benefit obligation was $615 and $743 at year-end 2007 and 2006, respectively.
Because the plan has been suspended, the projected benefit obligation and accumulated benefit obligation are the same. The accumulated benefit obligation for the defined benefit pension plan exceeds the fair value of the assets included in the plan.
Notes to the Consolidated Financial Statements
Dollars in thousands, except per share data
NOTE 10 – Employee Benefit Plans (continued)
Components of Net Periodic Benefit Cost and Other Amounts Recognized in Other Comprehensive Income
| | | 2007 | | 2006 | | 2005 | |
| | | | | | | | |
| Interest Cost | | $ | 37 | | $ | 48 | | $ | 50 | |
| Expected Return on Assets | | | (12 | ) | | (20 | ) | | (24 | ) |
| Amortization of Transition Amount | | | (1 | ) | | (1 | ) | | (1 | ) |
| Amortization of Prior Service Cost | | | (3 | ) | | (3 | ) | | (3 | ) |
| Recognition of Net Loss | | | 27 | | | 36 | | | 31 | |
| Net Periodic Benefit Cost | | $ | 48 | | $ | 60 | | $ | 53 | |
| | | | | | | | | | | |
| Net Loss During the Period | | | 2 | | | — | | | — | |
| Amortization of Unrecognized Loss | | | (74 | ) | | — | | | — | |
| Amortization of Transition Cost | | | 1 | | | — | | | — | |
| Amortization of Prior Service Cost | | | 3 | | | — | | | — | |
Total Recognized in Other Comprehensive Income | | | (68 | ) | | — | | | — | |
| | | | | | | | | | | |
Total Recognized in Net Periodic Benefit Cost and Other Comprehensive Income | | $ | (20 | ) | $ | 60 | | $ | 53 | |
The estimated net loss, prior service costs, and net transition obligation (asset) for the defined benefit pension plan that will be amortized from accumulated other comprehensive income into net periodic benefit cost over the next fiscal year are $21, $(3), and $(1), respectively.
Assumptions
Weighted-average assumptions used to determine benefit obligations at year-end:
| | | 2007 | | 2006 | | 2005 | |
| Discount Rate | | | 6.25 | % | | 5.75 | % | | 5.75 | % |
Rate of Compensation Increase (1) | | | N/A | | | N/A | | | N/A | |
Weighted-average assumptions used to determine net periodic pension cost:
| | | 2007 | | 2006 | | 2005 | |
| Discount Rate | | | 5.75 | % | | 5.75 | % | | 6.00 | % |
| Expected Return on Plan Assets | | | 4.75 | % | | 4.25 | % | | 4.50 | % |
Rate of Compensation Increase (1) | | | N/A | | | N/A | | | N/A | |
(1) Benefits under the plan were suspended in 1998; therefore, the weighted-average rate of increase in future compensation levels was not applicable for all years presented.
The expected return on plan assets was determined based upon rates that are expected to be available for future reinvestment of earnings and maturing investments along with consideration given to the current mix of plan assets.
Notes to the Consolidated Financial Statements
Dollars in thousands, except per share data
NOTE 10 – Employee Benefit Plans (continued)
Plan Assets
The Company’s defined benefit pension plan asset allocation at year-end 2007 and 2006 and target allocation for 2008 by asset category are as follows:
| | | Target | | Percentage of Plan Assets | |
| | | Allocation | | at Year-end | |
Asset Category | | | 2008 | | | 2007 | | | 2006 | |
| | | | | | | | | | | |
| Cash | | | 20 | % | | 27 | % | | 9 | % |
| Certificates of Deposit | | | 80 | % | | 73 | % | | 88 | % |
| Equity Securities | | | 0 | % | | 0 | % | | 3 | % |
| Total | | | 100 | % | | 100 | % | | 100 | % |
Plan benefits are suspended. Therefore, the Company has invested predominantly in relatively short-term investments over the past two years. No significant changes to investing strategies are anticipated.
The above mentioned Equity Securities consist of the Company’s stock for all periods presented.
Post-retirement Medical and Life Benefit Plan
The Company has an unfunded post-retirement benefit plan covering substantially all of its employees. The medical plan is contributory with the participants’ contributions adjusted annually; the life insurance plans are noncontributory.
| Changes in Accumulated Post-retirement Benefits Obligations: | | | | | |
| | | | | | |
| | | 2007 | | 2006 | |
| Obligation at the Beginning of Year | | $ | 604 | | $ | 582 | |
| Unrecognized Loss | | | 23 | | | 29 | |
| | | | | | | | |
| Components of Net Periodic Postretirement Benefit Cost: | | | | | | | |
| Service Cost | | | 31 | | | 28 | |
| Interest Cost | | | 33 | | | 32 | |
| | | | | | | | |
| Net Expected Benefit Payments | | | (72 | ) | | (67 | ) |
| Obligation at End of Year | | $ | 619 | | $ | 604 | |
| | | | | | | | |
| Components of Postretirement Benefit Expense: | | | | | | | |
| | | 2007 | | 2006 | |
| Service Cost | | $ | 31 | | $ | 28 | |
| Interest Cost | | | 33 | | | 32 | |
| Expected Return on Assets | | | — | | | — | |
| Amortization of Transition Amount | | | — | | | — | |
| Amortization of Unrecognized Prior Service Cost | | | — | | | — | |
| Amortization of Unrecognized Net (Gain)/Loss | | | — | | | — | |
| Net Postretirement Benefit Expense | | | 64 | | | 60 | |
| | | | | | | | |
| Net Gain During Period Recognized in Other Comprehensive Income | | | (49 | ) | | — | |
| | | | | | | | |
| Total Recognized in Net Postretirement Benefit Expense and Other Comprehensive Income | | $ | 15 | | $ | 60 | |
Notes to the Consolidated Financial Statements
Dollars in thousands, except per share data
NOTE 10 – Employee Benefit Plans (continued)
Assumptions Used to Determine Net Periodic Cost and Benefit Obligations:
| | | 2007 | | 2006 | | 2005 | |
| Discount Rate | | | 5.50 | % | | 5.50 | % | | 5.50 | % |
Assumed Health Care Cost Trend Rates at Year-end:
| | | 2007 | | 2006 | |
| Health Care Cost Trend Rate Assumed for Next Year | | | 7.00 | % | | 7.00 | % |
| Rate that the Cost Trend Rate Gradually Declines to | | | 5.00 | % | | 5.00 | % |
| Year that the Rate Reaches the Rate it is Assumed to Remain at | | | 2010 | | | 2009 | |
Assumed health care cost trend rates have a significant effect on the amounts reported for the health care plans. A one-percentage-point change in assumed health care cost trend rates would have the following effects:
| | | One-Percentage-Point | | One-Percentage-Point | |
| | | Increase | | Decrease | |
| Effect on Total of Service and Interest Cost | | $ | 77 | | $ | 63 | |
| Effect on Postretirement Benefit Obligation | | $ | 667 | | $ | 576 | |
Pension and Other Benefit Plans:
Contributions
The Company expects to contribute $97 to its defined benefit pension plan and $46 to its post-retirement medical and life insurance plan in 2008.
Estimated Future Benefits
The following benefit payments, which reflect expected future service, are expected to be paid:
| | | Pension | | Postretirement | |
Year | | Benefits | | Benefits | |
| 2008 | | $ | 42 | | $ | 64 | |
| 2009 | | | 37 | | | 58 | |
| 2010 | | | 35 | | | 42 | |
| 2011 | | | 33 | | | 45 | |
| 2012 | | | 32 | | | 29 | |
| 2013-2017 | | | 171 | | | 236 | |
Notes to the Consolidated Financial Statements
Dollars in thousands, except per share data
NOTE 11 – Income Taxes
The provision for income taxes consists of the following:
| | | 2007 | | 2006 | | 2005 | |
| Current Federal | | $ | 2,991 | | $ | 2,070 | | $ | 3,137 | |
| Current State | | | 504 | | | 416 | | | 557 | |
| Deferred Federal | | | 634 | | | 1,560 | | | (202 | ) |
| Deferred State | | | (27 | ) | | (62 | ) | | (157 | ) |
| Total | | $ | 4,102 | | $ | 3,984 | | $ | 3,335 | |
Income tax expense is reconciled to the 34% statutory rate applied to pre-tax income as follows:
| | | 2007 | | 2006 | | 2005 | |
| Statutory Rate Times Pre-tax Income | | $ | 4,592 | | $ | 4,830 | | $ | 4,439 | |
| Add/(Subtract) the Tax Effect of: | | | | | | | | | | |
| | | | | | | | | | | |
| Income from Tax-exempt Loans and Investments | | | (346 | ) | | (530 | ) | | (635 | ) |
| State Income Tax, Net of Federal Tax Effect | | | 315 | | | 234 | | | 264 | |
| Low Income Housing Credit | | | (182 | ) | | (182 | ) | | (392 | ) |
| Dividends Received Deduction | | | — | | | (105 | ) | | (128 | ) |
| Company Owned Life Insurance | | | (280 | ) | | (294 | ) | | (216 | ) |
| Other Differences | | | 3 | | | 31 | | | 3 | |
| Total Income Taxes | | $ | 4,102 | | $ | 3,984 | | $ | 3,335 | |
The net deferred tax asset at December 31 consists of the following:
| | | 2007 | | 2006 | |
| Deferred Tax Assets: | | | | | | | |
| Allowance for Loan Losses | | $ | 2,284 | | $ | 1,886 | |
| Deferred Compensation and Employee Benefits | | | 1,557 | | | 1,520 | |
| Intangibles | | | 62 | | | 68 | |
| Unused Tax Credits | | | 403 | | | 1,870 | |
| Pension and Post-retirement Plans | | | 64 | | | 111 | |
| Net Operating Loss Carryforward | | | 23 | | | 146 | |
| Other | | | 613 | | | 404 | |
| Total Deferred Tax Assets | | | 5,006 | | | 6,005 | |
| Deferred Tax Liabilities: | | | | | | | |
| Depreciation | | | (321 | ) | | (508 | ) |
| Leasing Activities, Net | | | (1,926 | ) | | (2,137 | ) |
| Investment in Low Income Housing Partnerships | | | (411 | ) | | (396 | ) |
| Unrealized Appreciation on Securities | | | (652 | ) | | (25 | ) |
| FHLB Stock Dividends | | | (440 | ) | | (449 | ) |
| Business Combination Fair Value Adjustments | | | (402 | ) | | (460 | ) |
| Other | | | (160 | ) | | (55 | ) |
| Total Deferred Tax Liabilities | | | (4,312 | ) | | (4,030 | ) |
| Valuation Allowance | | | (45 | ) | | (45 | ) |
| Net Deferred Tax Asset | | $ | 649 | | $ | 1,930 | |
The Company has $403 of alternative minimum tax credit carryforward, which under current tax law has no expiration period. The Company has federal net operating loss carryforwards (acquired in the PCB Holdings business combination) of $57. This carryforward expires in 2025. The use of this federal carryforward was limited to $285 annually.
Under the Internal Revenue Code, through 1996 two acquired banking companies, which are now a part of the Company’s single banking subsidiary, were allowed a special bad debt deduction related to additions to tax bad debt reserves established for the purpose of absorbing losses. The acquired banks were formerly known as Peoples Community Bank (acquired in October 2005) and First American Bank (acquired in January 1999). Subject to certain limitations, these Banks were permitted to deduct from taxable income an allowance for bad debts based on a percentage of taxable income before such deductions or actual loss experience. The Banks generally computed its annual addition to its bad debt reserves using the percentage of taxable income method; however, due to certain limitations in 1996, the Banks were only allowed a deduction based on actual loss experience.
Notes to the Consolidated Financial Statements
Dollars in thousands, except per share data
NOTE 11 – Income Taxes (continued)
Retained earnings at December 31, 2007, include approximately $2,995 for which no provision for federal income taxes has been made. This amount represents allocations of income for allowable bad debt deductions. Reduction of amounts so allocated for purposes other than tax bad debt losses will create taxable income, which will be subject to the then current corporate income tax rate. It is not contemplated that amounts allocated to bad debt deductions will be used in any manner to create taxable income. The unrecorded deferred income tax liability on the above amount at December 31, 2007 was approximately $1,018.
Unrecognized Tax Benefits
The Company has no unrecognized tax benefits as of January 1, 2007 and did not recognize any increase in unrecognized benefits during 2007 relative to any tax positions taken in 2007. Should the accrual of any interest or penalties relative to unrecognized tax benefits be necessary, it is the Company’s policy to record such accruals in its income tax expense accounts; no such accruals existed as of December 31, 2007. The Company and its corporate subsidiaries file a consolidated U.S. Federal income tax return, which is subject to examination for all years after 2003. The Company and its corporate subsidiaries doing business in Indiana file a combined Indiana unitary return, which is subject to examination for all years after 2002.
NOTE 12 – Per Share Data
The computation of Earnings per Share and Diluted Earnings per Share are provided below:
| | | 2007 | | 2006 | | 2005 | |
| Earnings per Share: | | | | | | | | | | |
| Net Income | | $ | 9,405 | | $ | 10,221 | | $ | 9,721 | |
| Weighted Average Shares Outstanding | | | 11,009,536 | | | 10,994,739 | | | 10,890,987 | |
| Earnings per Share | | $ | 0.85 | | $ | 0.93 | | $ | 0.89 | |
| | | | | | | | | | | |
| Diluted Earnings per Share: | | | | | | | | | | |
| Net Income | | $ | 9,405 | | $ | 10,221 | | $ | 9,721 | |
| | | | | | | | | | | |
| Weighted Average Shares Outstanding | | | 11,009,536 | | | 10,994,739 | | | 10,890,987 | |
| Stock Options, Net | | | 15,690 | | | 10,928 | | | 5,835 | |
| | | | | | | | | | | |
| Diluted Weighted Average Shares Outstanding | | | 11,025,226 | | | 11,005,667 | | | 10,896,822 | |
| Diluted Earnings per Share | | $ | 0.85 | | $ | 0.93 | | $ | 0.89 | |
Stock options for 257,063, 320,309 and 351,085 shares of common stock were not considered in computing diluted earnings per common share for 2007, 2006, and 2005, respectively, because they were anti-dilutive.
NOTE 13 – Lease Commitments
The total rental expense for all operating leases for the years ended December 31, 2007, 2006, and 2005 was $355, $224, and $175, respectively, including amounts paid under short-term cancelable leases.
The following is a schedule of future minimum lease payments:
| Years Ending December 31: | | Premises and Equipment | |
| | | | |
| 2008 | | $ 274 | |
| 2009 | | | 252 | |
| 2010 | | | 209 | |
| 2011 | | | 147 | |
| 2012 | | | 124 | |
| Thereafter | | | 1,198 | |
| Total | | | $ 2,204 | |
| | | | |
Notes to the Consolidated Financial Statements
Dollars in thousands, except per share data
NOTE 14 – Commitments and Off-balance Sheet Items
In the normal course of business, there are various commitments and contingent liabilities, such as commitments to extend credit and commitments to sell loans, which are not reflected in the accompanying consolidated financial statements. The Company’s exposure to credit loss in the event of nonperformance by the other party to the financial instruments for commitments to make loans and standby letters of credit is represented by the contractual amount of those instruments. The Company uses the same credit policy to make commitments as it uses for on-balance sheet items.
The Company’s exposure to credit risk for commitments to sell loans is dependent upon the ability of the counter-party to purchase the loans. This is generally assured by the use of government sponsored entity counterparts. These commitments are subject to market risk resulting from fluctuations in interest rates. Commitments to sell loans are not mandatory (i.e., do not require net settlement with the counter-party to cancel the commitment).
Commitments and contingent liabilities are summarized as follows, at December 31:
| | | 2007 | | 2006 | |
| Commitments to Fund Loans: | | | | | | | |
| Home Equity | | $ | 53,822 | | $ | 49,527 | |
| Credit Card Lines | | | 16,791 | | | 15,061 | |
| Commercial Operating Lines | | | 105,357 | | | 105,944 | |
| Residential Mortgages | | | 4,570 | | | 4,760 | |
| Total Commitments to Fund Loans | | $ | 180,540 | | $ | 175,292 | |
| Commitments to Sell Loans | | $ | 12,876 | | $ | 5,594 | |
| Standby Letters of Credit | | $ | 4,502 | | $ | 9,211 | |
The majority of commitments to fund loans are variable rate. Since many commitments to make loans expire without being used, these amounts do not necessarily represent future cash commitments. Collateral obtained upon exercise of the commitment is determined using management’s credit evaluation of the borrower, and may include accounts receivable, inventory, property, land and other items. The approximate duration of a majority of these commitments is generally one year or less.
At December 31, 2007 and 2006, respectively, the affiliate banks were required to have $1,701 and $350 on deposit with the Federal Reserve, or as cash on hand. These reserves do not earn interest.
NOTE 15 – Non-cash Investing Activities
| | | 2007 | | 2006 | | 2005 | |
| Loans Transferred to Other Real Estate | | $ | 4,919 | | $ | 1,016 | | $ | 1,280 | |
See also Note 18 regarding purchase acquisitions.
NOTE 16 – Segment Information
The Company’s operations include three primary segments: core banking, trust and investment advisory services, and insurance operations. The core banking segment involves attracting deposits from the general public and using such funds to originate consumer, commercial, commercial real estate, and residential mortgage loans, primarily in the Company’s local markets. The core banking segment also involves the sale of residential mortgage loans in the secondary market. The trust and investment advisory services segment involves providing trust, investment advisory, and brokerage services to customers. The insurance segment offers a full range of personal and corporate property and casualty insurance products, primarily in the affiliate banks’ local markets.
Notes to the Consolidated Financial Statements
Dollars in thousands, except per share data
NOTE 16 – Segment Information (continued)
The core banking segment is comprised by the Company’s banking subsidiary, German American Bancorp, which operates through six community banking affiliates with 28 retail banking offices as of December 31, 2007. Net interest income from loans and investments funded by deposits and borrowings is the primary revenue for the core-banking segment. The trust and investment advisory services segment’s revenues are comprised primarily of fees generated by German American Financial Advisors & Trust Company (“GAFA”). These fees are derived by providing trust, investment advisory, and brokerage services to its customers. The insurance segment consists of German American Insurance, Inc., which provides a full line of personal and corporate insurance products as agent under six distinctive insurance agency names from six offices; and German American Reinsurance Company, Ltd. (“GARC”), which reinsures credit insurance products sold by the Company’s affiliate banks. Commissions derived from the sale of insurance products are the primary source of revenue for the insurance segment.
The following segment financial information has been derived from the internal financial statements of German American Bancorp, Inc., which are used by management to monitor and manage the financial performance of the Company. The accounting policies of the three segments are the same as those of the Company. The evaluation process for segments does not include holding company income and expense. Holding company amounts are the primary differences between segment amounts and consolidated totals, and are reflected in the column labeled “Other” below, along with amounts to eliminate transactions between segments.
Year ended December 31, 2007
| | | | | Trust and | | | | | | | |
| | | | | Investment | | | | | | | |
| | | Core | | Advisory | | | | | | Consolidated | |
| | | Banking | | Services | | Insurance | | Other | | Totals | |
| | | | | | | | | | | | |
| Net Interest Income | | $ | 39,677 | | $ | 94 | | $ | 111 | | $ | (1,267 | ) | $ | 38,615 | |
Gain on Sales of Loans and Related Assets | | | 822 | | | — | | | — | | | — | | | 822 | |
| Net Gain / (Loss) on Securities | | | — | | | — | | | — | | | (680 | ) | | (680 | ) |
| Trust and Investment Product Fees | | | 3 | | | 2,690 | | | — | | | (103 | ) | | 2,590 | |
| Insurance Revenues | | | 102 | | | 42 | | | 5,727 | | | (77 | ) | | 5,794 | |
| Noncash Items: | | | | | | | | | | | | | | | | |
| Provision for Loan Losses | | | 3,591 | | | — | | | — | | | — | | | 3,591 | |
| Provision for Income Taxes | | | 4,896 | | | 316 | | | 262 | | | (1,372 | ) | | 4,102 | |
| Segment Profit / (Loss) | | | 10,153 | | | 481 | | | 396 | | | (1,625 | ) | | 9,405 | |
| Segment Assets | | | 1,121,183 | | | 2,201 | | | 9,675 | | | (1,349 | ) | | 1,131,710 | |
Year ended December 31, 2006
| | | | | Trust and | | | | | | | |
| | | | | Investment | | | | | | | |
| | | Core | | Advisory | | | | | | Consolidated | |
| | | Banking | | Services | | Insurance | | Other | | Totals | |
| | | | | | | | | | | | |
| Net Interest Income | | $ | 37,474 | | $ | 75 | | $ | 110 | | $ | (1,463 | ) | $ | 36,196 | |
Gain on Sales of Loans and Related Assets | | | 917 | | | — | | | — | | | — | | | 917 | |
| Net Gain / (Loss) on Securities | | | 951 | | | — | | | — | | | — | | | 951 | |
| Trust and Investment Product Fees | | | 4 | | | 2,295 | | | — | | | (89 | ) | | 2,210 | |
| Insurance Revenues | | | 213 | | | 15 | | | 4,950 | | | (84 | ) | | 5,094 | |
| Noncash Items: | | | | | | | | | | | | | | | | |
| Provision for Loan Losses | | | 1,382 | | | — | | | — | | | (457 | ) | | 925 | |
| Provision for Income Taxes | | | 6,990 | | | 147 | | | 364 | | | (3,517 | ) | | 3,984 | |
| Segment Profit / (Loss) | | | 14,243 | | | 217 | | | 639 | | | (4,878 | ) | | 10,221 | |
| Segment Assets | | | 1,079,212 | | | 2,139 | | | 9,658 | | | 2,415 | | | 1,093,424 | |
Notes to the Consolidated Financial Statements
Dollars in thousands, except per share data
NOTE 16 – Segment Information (continued)
Year ended December 31, 2005
| | | | | Trust and | | | | | | | |
| | | | | Investment | | | | | | | |
| | | Core | | Advisory | | | | | | Consolidated | |
| | | Banking | | Services | | Insurance | | Other | | Totals | |
| | | | | | | | | | | | |
| Net Interest Income | | $ | 32,849 | | $ | 40 | | $ | 38 | | $ | (714 | ) | $ | 32,213 | |
Gain on Sales of Loans and Related Assets | | | 927 | | | — | | | — | | | — | | | 927 | |
| Net Gain / (Loss) on Securities | | | — | | | — | | | — | | | — | | | — | |
| Trust and Investment Product Fees | | | 5 | | | 2,163 | | | — | | | (87 | ) | | 2,081 | |
| Insurance Revenues | | | 213 | | | 29 | | | 4,542 | | | (81 | ) | | 4,703 | |
| Noncash Items: | | | | | | | | | | | | | | | | |
| Provision for Loan Losses | | | 1,053 | | | — | | | — | | | 850 | | | 1,903 | |
| Provision for Income Taxes | | | 6,156 | | | 134 | | | 335 | | | (3,290 | ) | | 3,335 | |
| Segment Profit / (Loss) | | | 13,706 | | | 201 | | | 558 | | | (4,744 | ) | | 9,721 | |
| Segment Assets | | | 930,682 | | | 2,107 | | | 8,103 | | | 5,575 | | | 946,467 | |
Notes to the Consolidated Financial Statements
Dollars in thousands, except per share data
NOTE 17 – Parent Company Financial Statements
The condensed financial statements of German American Bancorp, Inc. are presented below:
CONDENSED BALANCE SHEETS
| | | December 31, | |
| | | 2007 | | 2006 | |
ASSETS | | | | | |
| Cash | | $ | 279 | | $ | 7,459 | |
| Securities Available-for-Sale, at Fair Value | | | 5,470 | | | 7,302 | |
| Investment in Subsidiary Bank | | | 110,147 | | | 94,835 | |
| Investment in Non-banking Subsidiaries | | | 1,662 | | | 2,153 | |
| Other Assets | | | 3,929 | | | 3,723 | |
Total Assets | | $ | 121,487 | | $ | 115,472 | |
| | | | | | | | |
LIABILITIES | | | | | | | |
| Borrowings | | $ | 22,250 | | $ | 20,000 | |
| Other Liabilities | | | 2,121 | | | 3,081 | |
Total Liabilities | | | 24,371 | | | 23,081 | |
| | | | | | | | |
SHAREHOLDERS’ EQUITY | | | | | | | |
| Common Stock | | | 11,029 | | | 11,008 | |
| Additional Paid-in Capital | | | 68,408 | | | 68,216 | |
| Retained Earnings | | | 16,681 | | | 13,450 | |
| Accumulated Other Comprehensive Gain/(Loss) | | | 998 | | | (283 | ) |
Total Shareholders’ Equity | | | 97,116 | | | 92,391 | |
Total Liabilities and Shareholders’ Equity | | $ | 121,487 | | $ | 115,472 | |
CONDENSED STATEMENTS OF INCOME
| | | Years Ended December 31, | |
| | | 2007 | | 2006 | | 2005 | |
INCOME | | | | | | | |
| Dividends from Subsidiaries | | | | | | | |
| Bank | | $ | 2,000 | | $ | 24,325 | | $ | 14,750 | |
| Nonbank | | | 500 | | | — | | | 1,500 | |
| Dividend and Interest Income | | | 101 | | | 164 | | | (46 | ) |
| Fee Income from Subsidiaries | | | — | | | 379 | | | 663 | |
| Net Gain/(Loss) on Securities | | | (680 | ) | | — | | | — | |
| Other Income | | | 66 | | | 185 | | | 49 | |
| Total Income | | | 1,987 | | | 25,053 | | | 16,916 | |
| | | | | | | | | | | |
EXPENSES | | | | | | | | | | |
| Salaries and Benefits | | | 367 | | | 5,025 | | | 4,109 | |
| Professional Fees | | | 309 | | | 896 | | | 937 | |
| Occupancy and Equipment Expense | | | 6 | | | 812 | | | 715 | |
| Interest Expense | | | 1,369 | | | 1,627 | | | 669 | |
| Provision for Loan and Lease Losses | | | — | | | (457 | ) | | 850 | |
| Other Expenses | | | 413 | | | 982 | | | 621 | |
| Total Expenses | | | 2,464 | | | 8,885 | | | 7,901 | |
| INCOME BEFORE INCOME TAXES AND EQUITY IN UNDISTRIBUTED INCOME OF SUBSIDIARIES | | | (477 | ) | | 16,168 | | | 9,015 | |
| Income Tax Benefit | | | 1,364 | | | 3,423 | | | 2,857 | |
INCOME BEFORE EQUITY IN UNDISTRIBUTED INCOME OF SUBSIDIARIES | | | 887 | | | 19,591 | | | 11,872 | |
| Equity in Undistributed Income of Subsidiaries | | | 8,518 | | | (9,370 | ) | | (344 | ) |
NET INCOME (1) | | | 9,405 | | | 10,221 | | | 11,528 | |
| | | | | | | | | | | |
Other Comprehensive Income: | | | | | | | | | | |
| Unrealized Gain/(Loss) on Securities, Net | | | 1,210 | | | 1,242 | | | (1,711 | ) |
| Changes in Unrecognized Amounts in Pension | | | 41 | | | 38 | | | (28 | ) |
| Changes in Unrecognized Loss in Postretirement Benefit Obligation | | | 30 | | | — | | | — | |
TOTAL COMPREHENSIVE INCOME | | $ | 10,686 | | $ | 11,501 | | $ | 9,789 | |
Notes to the Consolidated Financial Statements
Dollars in thousands, except per share data
NOTE 17 – Parent Company Financial Statements (continued)
CONDENSED STATEMENTS OF CASH FLOWS
| | | Years Ended December 31, | |
| | | 2007 | | 2006 | | 2005 | |
CASH FLOWS FROM OPERATING ACTIVITIES | | | | | | | |
| Net Income | | $ | 9,405 | | $ | 10,221 | | $ | 11,528 | |
| Adjustments to Reconcile Net Income to Net Cash from Operations | | | | | | | | | | |
| Depreciation | | | — | | | 430 | | | 388 | |
| Loss on Securities, net | | | 680 | | | — | | | — | |
| Provision for Loan Losses | | | — | | | (457 | ) | | 850 | |
| Change in Other Assets | | | (191 | ) | | (40 | ) | | 427 | |
| Change in Other Liabilities | | | (843 | ) | | 263 | | | 235 | |
| Equity Based Compensation | | | 331 | | | 284 | | | — | |
| Equity in Undistributed Income of Subsidiaries | | | (8,518 | ) | | 9,370 | | | 344 | |
| Net Cash from Operating Activities | | | 864 | | | 20,071 | | | 13,772 | |
| | | | | | | | | | | |
CASH FLOWS FROM INVESTING ACTIVITIES | | | | | | | | | | |
| Capital Contribution to Subsidiaries | | | (5,000 | ) | | (1,881 | ) | | — | |
| Purchase of Securities Available-for-Sale | | | — | | | (937 | ) | | (2,835 | ) |
| Proceeds from Sales of Securities Available-for-Sale | | | 998 | | | 1 | | | — | |
| Property and Equipment Expenditures | | | — | | | (1,320 | ) | | (895 | ) |
| Proceeds from Sale of Property and Equipment | | | — | | | 70 | | | — | |
| Acquire Banking Entities | | | — | | | (6,606 | ) | | (2,956 | ) |
| Purchase of Loans from Subsidiary Bank | | | — | | | — | | | (4,640 | ) |
| Loans Made to Customers, Net of Payments Received | | | — | | | 4,247 | | | — | |
| Net Cash from Investing Activities | | | (4,002 | ) | | (6,426 | ) | | (11,326 | ) |
| | | | | | | | | | | |
CASH FLOWS FROM FINANCING ACTIVITIES | | | | | | | | | | |
| Change in Short-term Borrowings | | | 3,250 | | | (2,500 | ) | | 2,500 | |
| Advances in Long-term Debt | | | — | | | 26,500 | | | 27,000 | |
| Repayment of Long-term Debt | | | (1,000 | ) | | (25,000 | ) | | (19,000 | ) |
| Issuance of Common Stock | | | — | | | 17 | | | 48 | |
| Purchase / Retire Common Stock | | | — | | | — | | | (6,771 | ) |
| Employee Stock Purchase Plan | | | (118 | ) | | (105 | ) | | (63 | ) |
| Dividends Paid | | | (6,174 | ) | | (6,162 | ) | | (6,108 | ) |
| Net Cash from Financing Activities | | | (4,042 | ) | | (7,250 | ) | | (2,394 | ) |
| | | | | | | | | | | |
Net Change in Cash and Cash Equivalents | | | (7,180 | ) | | 6,395 | | | 52 | |
| Cash and Cash Equivalents at Beginning of Year | | | 7,459 | | | 1,064 | | | 1,012 | |
| Cash and Cash Equivalents at End of Year | | $ | 279 | | $ | 7,459 | | $ | 1,064 | |
(1) Parent Company Net Income differs from consolidated Net Income due to an intercompany gain related to the ownership reorganization of German American Insurance among the Company’s banking subsidiaries during 2005.
Notes to the Consolidated Financial Statements
Dollars in thousands, except per share data
NOTE 18 – Business Combinations, Goodwill and Intangible Assets
Information relating to mergers and acquisitions for the three year period ended December 31, 2007, includes:
| | | Date | | Accounting | |
Business Combination | | Acquired | | Method | |
| PCB Holding Company | | 10/01/05 | | Purchase | |
| Stone City Bancshares, Inc. | | 01/01/06 | | Purchase | |
| Keach and Grove Insurance, Inc | | 10/01/06 | | Purchase | |
Certain of the above entities changed their name and/or have been merged into other subsidiaries of the Company.
On October 1, 2005 the Company consummated a merger with PCB Holding Company (“PCB”). PCB was merged with and into the Company. PCB’s sole banking subsidiary, Peoples Community Bank, operated two banking offices in Tell City, Indiana. PCB’s assets and equity (unaudited) as of September 30, 2005 totaled $34.6 million and $4.8 million, respectively. Net loss (unaudited) totaled $586 for the nine-month period ended September 30, 2005.
Under the terms of the merger, the shareholders of PCB received .7143 shares of common stock of the Company and $9.00 of cash for each of their PCB shares, or an aggregate of 257,029 shares of common stock of the Company and approximately $3.2 million of cash.
This merger was accounted for under the purchase method of accounting. The purchase resulted in approximately $2,019 in goodwill and $443 in core deposit intangible. The core deposit intangible is being amortized over 10 years. Goodwill is not being amortized but instead evaluated periodically for impairment. For income tax purposes, the core deposit intangible amortization and goodwill impairment (if any would arise) are non-deductible.
As a result of the PCB acquisition, on October 1, 2005 the Company acquired loans with evidence of credit deterioration since origination (as defined in Statement of Position (SOP) 03-3) with an outstanding principal balance of $982 and a net carrying amount of $826 at the acquisition date. This net carrying amount was believed to approximate fair value and the cash flows expected to be collected, net of accretable yield. At year end 2007, the acquired loans had an outstanding principal balance of $166 and a net carrying amount of $158. Subsequent to the acquisition, the Company increased the allowance for loan losses for the remaining acquired loans by $7 in 2007, $7 in 2006 and $89 in 2005. No allowance for loan losses was reversed in 2007, 2006 or 2005.
On January 1, 2006, the Company consummated a merger with Stone City Bancshares, Inc. (“Stone City”) Stone City was merged with and into the Company. Stone City’s sole banking subsidiary, Stone City Bank of Bedford, Indiana, operated two banking offices in Bedford, Indiana. Stone City’s assets and equity as of December 31, 2005 totaled $61.2 million and $5.4 million, respectively. Net loss totaled $332 for the year ended December 31, 2005. This net loss includes no provision for income taxes as Stone City had elected under Internal Revenue Service Code to be an S Corporation. As such, in lieu of corporate income taxes, the shareholders of Stone City were taxed on their proportionate share of the Company’s taxable income.
Under the terms of the merger, the shareholders of Stone City received aggregate cash payments of approximately $6.4 million and 349,468 common shares of the Company valued during a pre-closing valuation period of approximately $4.6 million, representing a total transaction value of approximately $11.0 million.
This merger was accounted for under the purchase method of accounting. The purchase resulted in approximately $5,576 in goodwill and $1,259 in core deposit intangible. The core deposit intangible is being amortized over 10 years. Goodwill is not being amortized but instead evaluated periodically for impairment. For income tax purposes, the core deposit intangible amortization and goodwill impairment (if any would arise) are non-deductible.
As a result of the Stone City acquisition, on January 1, 2006 the Company acquired loans with evidence of credit deterioration since origination (as defined in Statement of Position (SOP) 03-3) with an outstanding principal balance of $1,238 and a net carrying amount of $1,064 at the acquisition date. This net carrying amount was believed to approximate fair value and the cash flows expected to be collected, net of accretable yield. At year end 2007, the acquired loans had an outstanding principal balance of $724 and a net carrying amount of $660. Subsequent to the acquisition, the Company increased the allowance for loan losses for the remaining acquired loans by $130 in 2007 and $144 in 2006. No allowance for loan losses was reversed in 2007 or 2006.
Notes to the Consolidated Financial Statements
Dollars in thousands, except per share data
NOTE 18 – Business Combinations, Goodwill and Intangible Assets (continued)
On October 1, 2006, the Company acquired substantially all of the assets, net of certain assumed liabilities of Keach and Grove Insurance, Inc. of Bedford, Indiana. The agency operations became a part of German American Insurance, Inc., the Company’s property and casualty insurance entity.
The purchase price for this transaction was $2.26 million in cash. This merger was accounted for under the purchase method of accounting. The purchase resulted in approximately $1,975 in customer list intangible and $266 in goodwill. The customer relationship intangible is being amortized over seven years and deducted for tax purposes over 15 years using the straight line method. Goodwill is not being amortized but instead evaluated periodically for impairment for book purposes and is being amortized over a 15 year period for tax purposes using the straight line method.
The changes in the carrying amount of goodwill for the periods ended December 31, 2007 and 2006 were classified as follows:
| | | 2007 | | 2006 | |
| Beginning of Year | | $ | 9,655 | | $ | 3,813 | |
| Goodwill from acquisitions | | | — | | | 5,842 | |
| End of Year | | $ | 9,655 | | $ | 9,655 | |
Of the $9,655 carrying amount of goodwill, $8,323 is allocated to the core banking segment and $1,332 is allocated to the insurance segment for the periods ended December 31, 2007 and 2006.
Acquired intangible assets were as follows as of year end:
| | | 2007 | |
| | | Gross | | Accumulated | |
| | | Amount | | Amortization | |
| Core Banking | | | | | |
| Core Deposit Intangible | | $ | 2,372 | | $ | 1,067 | |
| Unidentified Branch Acquisition Intangible | | | 257 | | | 226 | |
| Insurance | | | | | | | |
| Customer List | | | 4,813 | | | 2,119 | |
| Total | | $ | 7,442 | | $ | 3,412 | |
| | | 2006 | |
| | | Gross | | Accumulated | |
| | | Amount | | Amortization | |
| Core Banking | | | | | |
| Core Deposit Intangible | | $ | 2,372 | | $ | 877 | |
| Unidentified Branch Acquisition Intangible | | | 257 | | | 209 | |
| Insurance | | | | | | | |
| Customer List | | | 4,813 | | | 1,432 | |
| Total | | $ | 7,442 | | $ | 2,518 | |
Amortization Expense was $894, $698, and $433 for 2007, 2006, and 2005.
Estimated amortization expense for each of the next five years is as follows:
| 2008 | | $ | 889 | |
| 2009 | | | 882 | |
| 2010 | | | 726 | |
| 2011 | | | 457 | |
| 2012 | | | 457 | |
Notes to the Consolidated Financial Statements
Dollars in thousands, except per share data
NOTE 19 Fair Values of Financial Instruments
The estimated fair values of the Company’s financial instruments are provided in the table below. Since not all of the Company’s assets and liabilities are considered financial instruments, some assets and liabilities are not included in the table. Because no active market exists for a significant portion of the Company’s financial instruments, fair value estimates were based on subjective judgments, and therefore cannot be determined with precision.
| | | December 31, 2007 | | December 31, 2006 | |
| | | Carrying | | Fair | | Carrying | | Fair | |
| | | Value | | Value | | Value | | Value | |
| Financial Assets: | | | | | | | | | |
| Cash and Short-term Investments | | $ | 27,914 | | $ | 27,914 | | $ | 29,895 | | $ | 29,895 | |
| Securities Available-for-Sale | | | 148,300 | | | 148,300 | | | 179,222 | | | 179,222 | |
| Securities Held-to-Maturity | | | 4,464 | | | 4,496 | | | 6,135 | | | 6,192 | |
| Loans, including Loans Held-for-Sale, Net | | | 865,374 | | | 873,257 | | | 790,731 | | | 790,638 | |
| Accrued Interest Receivable | | | 8,691 | | | 8,691 | | | 8,747 | | | 8,747 | |
| Financial Liabilities: | | | | | | | | | | | | | |
| Demand, Savings, and Money Market Deposits | | | (489,855 | ) | | (489,855 | ) | | (467,361 | ) | | (467,361 | ) |
| Other Time Deposits | | | (387,566 | ) | | (388,552 | ) | | (400,257 | ) | | (398,037 | ) |
| Short-term Borrowings | | | (57,384 | ) | | (57,384 | ) | | (51,556 | ) | | (51,556 | ) |
| Long-term Debt | | | (86,786 | ) | | (89,359 | ) | | (68,333 | ) | | (69,084 | ) |
| Accrued Interest Payable | | | (3,223 | ) | | (3,223 | ) | | (3,357 | ) | | (3,357 | ) |
| Unrecognized Financial Instruments: | | | | | | | | | | | | | |
| Commitments to Extend Credit | | | — | | | — | | | — | | | — | |
| Standby Letters of Credit | | | — | | | — | | | — | | | — | |
| Commitments to Sell Loans | | | — | | | — | | | — | | | — | |
The fair values of securities are based on quoted market prices or dealer quotes, if available, or by using quoted market prices for similar instruments. The fair value of loans held-for-sale is estimated using commitment prices or market quotes on similar loans. The fair value of loans are estimated by discounting future cash flows using the current rates at which similar loans would be made for the average remaining maturities. The fair value of demand deposits, savings accounts, money market deposits, short-term borrowings and accrued interest payable is the amount payable on demand at the reporting date. The fair value of fixed-maturity time deposits and long-term borrowings are estimated using the rates currently offered on these instruments for similar remaining maturities. Commitments to extend credit and standby letters of credit are generally short-term or variable rate with minimal fees charged. These instruments have no carrying value, and the fair value is not significant. The fair value of commitments to sell loans is the cost or benefit of settling the commitments with the counter-party at the reporting date. At December 31, 2007 and 2006, none of the Company’s commitments to sell loans were mandatory, and there is no cost or benefit to settle these commitments.
Notes to the Consolidated Financial Statements
Dollars in thousands, except per share data
NOTE 20– Other Comprehensive Income
Other comprehensive income components and related taxes were as follows:
| | | 2007 | | 2006 | | 2005 | |
Unrealized Holding Gains (Losses) on Securities Available-for-Sale | | $ | 1,158 | | $ | 2,869 | | $ | (2,551 | ) |
| Reclassification Adjustments for (Gains) Losses Later Realized in Income | | | 680 | | | (951 | ) | | | |
| Net Unrealized Gains (Losses) | | | 1,838 | | | 1,918 | | | (2,551 | ) |
| Change in Minimum Pension Liability | | | | | | 62 | | | (46 | ) |
| Amortization of Amounts Included in Net Periodic Pension Costs | | | 70 | | | — | | | — | |
| Unrecognized Loss on Pension | | | (2 | ) | | | | | | |
| Unrecognized Gain on Postretirement Benefits | | | 49 | | | | | | | |
| Tax Effect | | | (674 | ) | | (700 | ) | | 858 | |
| Other Comprehensive Income (Loss) | | $ | 1,281 | | $ | 1,280 | | $ | (1,739 | ) |
The following is a summary of the accumulated other comprehensive income balances, net of tax:
| | | Balance | | Current | | Balance | |
| | | At | | Period | | at | |
| | | 12/31/2006 | | Change | | 12/31/2007 | |
| Unrealized Gains (Losses) on Securities | | | | | | | |
| Available-for-Sale | | $ | (114 | ) | $ | 1,210 | | $ | 1,096 | |
| Unrecognized Gains (Losses) on Pension Benefits | | | (169 | ) | | 41 | | | (128 | ) |
| Unrecognized Gains on Postretirement Benefits | | | — | | | 30 | | | 30 | |
| Total | | $ | (283 | ) | $ | 1,281 | | $ | 998 | |
NOTE 21– Quarterly Financial Data (Unaudited)
The following table represents selected quarterly financial data for the Company:
| | | Interest | | Net Interest | | Net | | Earnings per Share | |
| | | Income | | Income | | Income | | Basic | | Diluted | |
2007 | | | | | | | | | | | |
| First Quarter | | $ | 17,329 | | $ | 9,375 | | $ | 1,479 | | $ | 0.13 | | $ | 0.13 | |
| Second Quarter | | | 17,958 | | | 9,494 | | | 2,643 | | | 0.24 | | | 0.24 | |
| Third Quarter | | | 18,638 | | | 9,731 | | | 2,508 | | | 0.23 | | | 0.23 | |
| Fourth Quarter | | | 18,336 | | | 10,015 | | | 2,775 | | | 0.25 | | | 0.25 | |
| | | | | | | | | | | | | | | | | |
2006 | | | | | | | | | | | | | | | | |
| First Quarter | | $ | 14,748 | | $ | 8,876 | | $ | 2,563 | | $ | 0.23 | | $ | 0.23 | |
| Second Quarter | | | 15,377 | | | 8,898 | | | 2,488 | | | 0.23 | | | 0.23 | |
| Third Quarter | | | 16,374 | | | 9,109 | | | 2,732 | | | 0.25 | | | 0.25 | |
| Fourth Quarter | | | 17,095 | | | 9,313 | | | 2,438 | | | 0.22 | | | 0.22 | |
Item 9. Changes in and Disagreements with Accountants on Accounting and Financial Disclosure.
Not Applicable.
Item 9A. Controls and Procedures.
Disclosure Controls and Procedures
As of December 31, 2007, the Company carried out an evaluation, under the supervision and with the participation of its principal executive officer and principal financial officer, of the effectiveness of the design and operation of its disclosure controls and procedures. Based on this evaluation, the Company’s principal executive officer and principal financial officer concluded that the Company’s disclosure controls and procedures are effective in timely alerting them to material information required to be included in the Company’s periodic reports filed with the Securities and Exchange Commission. There are inherent limitations to the effectiveness of systems of disclosure controls and procedures, including the possibility of human error and the circumvention or overriding of the controls and procedures. Accordingly, even effective systems of disclosure controls and procedures can provide only reasonable assurances of achieving their control objectives.
Changes in Internal Control Over Financial Reporting in Most Recent Fiscal Quarter
There was no change in the Company’s internal control over financial reporting that occurred during the Company’s fourth fiscal quarter of 2007 that has materially affected, or is reasonably likely to materially affect, the Company’s internal control over financial reporting.
Management’s Report on Internal Control Over Financial Reporting
The management of the Company is responsible for establishing and maintaining adequate internal control over financial reporting as defined in Rules 13a-15(f) and 15d-15(f) under the Securities Exchange Act of 1934. The Company’s internal control over financial reporting is designed to provide reasonable assurance regarding the reliability of financial reporting and the preparation of financial statements for external purposes in accordance with U.S. generally accepted accounting principles. The Company’s internal control over financial reporting includes those policies and procedures that: (i) pertain to the maintenance of records that, in reasonable detail, accurately and fairly reflect the transactions and dispositions of the assets of the Company; (ii) provide reasonable assurance that transactions are recorded as necessary to permit preparation of financial statements in accordance with U.S. generally accepted accounting principles, and that receipts and expenditures of the Company are being made only in accordance with authorizations of management and directors of the Company; and (iii) provide reasonable assurance regarding prevention or timely detection of unauthorized acquisition, use or disposition of the Company’s assets that could have a material effect on the financial statements.
Because of its inherent limitations, internal control over financial reporting may not prevent or detect misstatements. Also, projections of any evaluation of effectiveness to future periods are subject to the risk that controls may become inadequate because of changes in conditions, or that the degree of compliance with the policies or procedures may deteriorate. Management assessed the effectiveness of the Company’s internal control over financial reporting as of December 31, 2007. In making this assessment, management used the criteria set forth by the Committee of Sponsoring Organizations of the Treadway Commission (COSO) in Internal Control-Integrated Framework. Based on our assessment and those criteria, management concluded that the Company maintained effective internal control over financial reporting as of December 31, 2007.
The Company’s independent registered public accounting firm has issued their report on the Company’s internal control over financial reporting. That report is included in Item 8. Financial Statement and Supplementary Data of this Report under the heading, Report of Independent Registered Public Accounting Firm.
Item 9B. Other Information.
Not applicable.
PART III
Item 10. Directors and Executive Officers of the Registrant.
Information relating to directors and executive officers of the Company will be included under the captions “Election of Directors” and “Our Executive Officers” in the Company’s Proxy Statement for the Annual Meeting of Shareholders to be held in April 2008, which will be filed within 120 days of the end of the fiscal year covered by this Report (the “2008 Proxy Statement”), which sections are incorporated herein in partial response to this Item’s informational requirements.
Section 16(a) Compliance. Information relating to Section 16(a) compliance will be included in the 2008 Proxy Statement under the caption of "Section 16(a): Beneficial Ownership Reporting Compliance" and is incorporated herein by reference.
Code of Business Conduct. The Company’s Board of Directors has adopted a Code of Business Conduct, which constitutes a “code of ethics” as that term is defined by SEC rules adopted under the Sarbanes-Oxley Act of 2002 (“SOA”). The Company has posted a copy of the Code of Business Conduct on its Internet website (www.germanamericanbancorp.com). The Company intends to satisfy its disclosure requirements under Item 5.05 of Form 8-K regarding certain amendments to, or waivers of, the Code of Business Conduct, by posting such information on its Internet website, except that waivers that must under NASDAQ rules be filed with the SEC on Form 8-K will be so filed.
Audit Committee Identification. The Board of Directors of the Company has a separately-designated standing audit committee established in accordance with Section 3(a) (58) (A) of the Securities Exchange Act of 1934. The description of the Audit Committee of the Board of Directors, and the identification of its members, will be set forth in the 2008 Proxy Statement under the caption “ELECTION OF DIRECTORS”, which section is incorporated herein by reference.
Audit Committee Financial Expert. The Board of Directors has determined that Richard E. Forbes, a director who serves on the Audit Committee of the Board of Directors and who is an independent director as defined by NASDAQ listing standards, is an “audit committee financial expert” as that term is defined by SEC rules adopted under SOA by reason of his experience as the current chief executive officer and former chief financial officer of a subsidiary of a Fortune 500 company.
Item 11. Executive Compensation.
Information relating to compensation of the Company’s executive officers and directors, (including the required disclosures under the subheadings “Compensation Committee Interlocks and Insider Participation” and “Compensation Committee Report”) will be included under the caption “Executive and Director Compensation” in the 2008 Proxy Statement of the Company, which section is incorporated herein by reference.
Item 12. Security Ownership of Certain Beneficial Owners and Management and Related Stockholder Matters.
Information relating to security ownership of certain beneficial owners and the directors and executive officers of the Company will be included under the captions “Ownership of Our Common Stock by Our Directors and Executive Officers” and “Principal Owners of Common Shares” of the 2008 Proxy Statement of the Company, which sections are incorporated herein by reference.
Equity Compensation Plan Information.
The Company maintains three plans under which it has authorized the issuance of its Common Shares to employees and non-employee directors as compensation: its 1992 Stock Option Plan (under which no new grants may be made), its 1999 Long-Term Equity Incentive Plan, and its 1999 Employee Stock Purchase Plan. Each of these three plans was approved by the requisite vote of the Company's common shareholders in the year of adoption by the Board of Directors. The Company is not a party to any individual compensation arrangement involving the authorization for issuance of its equity securities to any single person, other than option agreements and restricted stock award agreements that have been granted under the terms of one of the three plans identified above. The following table sets forth information regarding these plans as of December 31, 2007:
Plan Category | | Number of Securities to be Issued upon Exercise of Outstanding Options, Warrants or Rights | | Weighted Average Exercise Price of Outstanding Options, Warrants and Rights | | Number of Securities Remaining Available for Future Issuance under Equity Compensation Plans (Excluding Securities Reflected in First Column) | |
| Equity compensation plans approved by security holders | | | 307,167 | (a) | $ | 16.55 | | | 945,101 | (b) |
| | | | | | | | | | | |
| Equity compensation plans not approved by security holders | | | — | | | — | | | — | |
| | | | | | | | | | | |
| Total | | | 307,167 | | $ | 16.55 | | | 945,101 | |
(a) Does not include any shares that employees may have the right to purchase under the Employee Stock Purchase Plan in August 2008 in respect of employee payroll deductions of participating employees that had accumulated as of December 31, 2007 during the plan year that commenced in August 2007. Although these employees have the right under this Plan to have their accumulated payroll deductions applied to the purchase of Common Shares at a discounted price in August 2008, the price at which such shares may be purchased and the number of shares that may be purchased under that Plan at that time is not presently determinable.
(b) Represents 315,366 shares that the Company may in the future issue to employees under the Employee Stock Purchase Plan (although the Company typically purchases the shares needed for sale to participating employees on the open market rather than issuing new issue shares to such employees) and 629,735 shares that were available for grant or issuance at December 31, 2007 under the 1999 Long-Term Equity Incentive Plan. Under the Long-Term Equity Incentive Plan, the aggregate number of Common Shares available for the grant of awards in any given fiscal year is equal to the sum of (i) one percent of the number of Common Shares outstanding as of the last day of the Company's prior fiscal year, plus (ii) the number of Common Shares that were available for the grant of awards, but were not granted, under the Plan in any previous fiscal year. Under no circumstances, however, may the number of Common Shares available for the grant of awards in any fiscal year under the Long-Term Equity Incentive Plan exceed one and one-half percent of the Common Shares outstanding as of the last day of the prior fiscal year. The 629,735 shares available at December 31, 2007 and included in the above table represent only the carryover of shares that may be the subject of grants of awards under the Long-Term Equity Incentive Plan in 2008 and future years; the Company during 2008 and future years (in addition to this carryover amount) may grant an additional 110,295 shares, representing one percent of the number of Common Shares that were outstanding at December 31, 2007, under the Long-Term Equity Incentive Plan.
For additional information regarding the Company’s equity incentive plans and employee stock purchase plan, see Note 9 to the consolidated financial statements in Item 8 of this Report.
Item 13. Certain Relationships and Related Transactions.
Information responsive to this Item 13 will be included under the captions “Election of Directors” and “Transactions with Related Persons” of the 2008 Proxy Statement of the Company, which sections are incorporated herein by reference.
Item 14. Principal Accountant Fees and Services.
Information responsive to this item 14 will be included in the 2008 Proxy Statement under the caption “Principal Accountant Fees and Services,” which section is incorporated herein by reference.
PART IV
Item 15. Exhibits and Financial Statement Schedules.
a) Financial Statements
The following items are included in Item 8 of this report:
| | | Page # |
German American Bancorp, Inc. and Subsidiaries: | | |
| | | |
| Report of Independent Registered Public Accounting Firm on Financial Statements | | 30 |
| | | |
| Consolidated Balance Sheets at December 31, 2007 and December 31, 2006 | | 31 |
| | | |
| Consolidated Statements of Income, years ended December 31, 2007, 2006, and 2005 | | 32 |
| | | |
| Consolidated Statements of Changes in Shareholders’ Equity, years ended December 31, 2007, 2006, and 2005 | | 33 |
| | | |
| Consolidated Statements of Cash Flows, years ended December 31, 2007, 2006, and 2005 | | 34 |
| | | |
| Notes to the Consolidated Financial Statements | | 35-64 |
b) Exhibits
The Exhibits described in the Exhibit List immediately following the “Signatures” page of this report (which Exhibit List is incorporated herein by reference) are hereby filed as part of this report.
c) Financial Statement Schedules
None.
Pursuant to the requirements of Section 13 of the Securities Exchange Act of 1934, the Registrant has duly caused this Report to be signed on its behalf by the undersigned thereunto duly authorized.
| | GERMAN AMERICAN BANCORP, INC |
| | (Registrant) |
| | |
Date: March 10, 2008 | By/s/Mark A. Schroeder |
| | Mark A. Schroeder, President and |
| | Chief Executive Officer |
Pursuant to the requirements of the Securities Exchange Act of 1934, this Report has been signed below by the following persons on behalf of the Registrant and in the capacities and on the dates indicated.
Date: March 10, 2008 | By/s/Mark A. Schroeder |
| | Mark A. Schroeder, President and Chief Executive |
| | Officer (principal executive officer), Director |
| | |
Date: March 6, 2008 | By/s/Douglas A. Bawel |
| | Douglas A. Bawel, Director |
| | |
Date: March 6, 2008 | By/s/Christina M. Ernst |
| | Christina M. Ernst, Director |
| | |
Date: March 6, 2008 | By/s/Richard E. Forbes |
| | Richard E. Forbes, Director |
| | |
Date: March 6, 2008 | By/s/U. Butch Klem |
| | U. Butch Klem, Director |
| | |
Date: March 6, 2008 | By/s/J. David Lett |
| | J. David Lett, Director |
| | |
Date: March 6, 2008 | By/s/Gene C. Mehne |
| | Gene C. Mehne, Director |
| | |
Date: March 6, 2008 | By/s/Larry J. Seger |
| | Larry J. Seger, Director |
| | |
Date: March 6, 2008 | By/s/Michael J. Voyles |
| | Michael J. Voyles, Director |
| | |
Date: March 10, 2008 | By/s/Bradley M. Rust |
| | Bradley M. Rust, Senior Vice President and |
| | Chief Financial Officer (principal accounting officer and principal financial officer) |
INDEX OF EXHIBITS
Exhibit No. | | Description |
| 3.1 | | Restatement of the Articles of Incorporation of the Registrant is incorporated by reference from Exhibit 3 to the Registrant's Current Report on 8-K filed May 22, 2006. |
| | | |
| 3.2 | | Restated Bylaws of the Registrant, as amended through February 12, 2007, is incorporated by reference from Exhibit 3 to the Registrant's Current Report on 8-K filed February 16, 2007. |
| | | |
| 4.1 | | Rights Agreement dated April 27, 2000, is incorporated by reference from Exhibit 4.1 to the Registrant's Quarterly Report on Form 10-Q for the quarter ended March 31, 2005. |
| | | |
| 4.2 | | No long-term debt instrument issued by the Registrant exceeds 10% of consolidated total assets or is registered. In accordance with paragraph 4 (iii) of Item 601(b) of Regulation S-K, the Registrant will furnish the Securities and Exchange Commission copies of long-term debt instruments and related agreements upon request. |
| | | |
| 4.3 | | Terms of Common Shares and Preferred Shares of the Registrant (included in Restatement of Articles of Incorporation) are incorporated by reference from Exhibit 3 to the Registrant's Current Report on 8-K filed May 22, 2006. |
| | | |
| 10.1 | | The Registrant’s 1992 Stock Option Plan, as amended, is incorporated by reference from Exhibit 10.1 to the Registrant’s Registration Statement on Form S-4 filed October 14, 1998.* |
| | | |
| 10.2 | | Form of Director Deferred Compensation Agreement between The German American Bank and certain of its Directors is incorporated herein by reference from Exhibit 10.4 to the Registrant's Registration Statement on Form S-4 filed January 21, 1993 (the Agreement entered into by former director George W. Astrike, a copy of which was filed as Exhibit 10.4 to the Registrant's Registration Statement on Form S-4 filed January 21, 1993, is substantially identical to the Agreements entered into by the other Directors, some of whom remain directors of the Registrant.). The schedule following Exhibit 10.4 lists the Agreements with the other Directors and sets forth the material detail in which such Agreements differ from the Agreement filed as Exhibit 10.4.* |
| | | |
| 10.3 | | The Registrant’s 1999 Long-Term Equity Incentive Plan, as amended through February 22, 2008* |
| | | |
| 10.4 | | Basic Plan Document for the Registrant’s Nonqualified Savings Plan is incorporated by reference from Exhibit 10.4 to the Registrant’s Annual Report on Form 10-K for the year ended December 31, 2004.* |
| 10.5 | | Adoption Agreement for the Registrant’s Nonqualified Savings Plan dated August 17, 2004, is incorporated by reference from Exhibit 10.5 to the Registrant’s Annual Report on Form 10-K for the year ended December 31, 2004.* |
| | | |
| 10.6 | | First Amendment to the Registrant’s Nonqualified Savings Plan dated August 17, 2004, is incorporated by reference from Exhibit 10.6 to the Registrant’s Annual Report on Form 10-K for the year ended December 31, 2004.* |
| | | |
| 10.7 | | Form of Employee Stock Option Agreement (new grant, five-year expiration, five year 20% vesting) typically issued during 2005 and prior periods to executive officers and other key employees as incentives is incorporated by reference from Exhibit 10.7 to the Registrant’s Annual Report on Form 10-K for the year ended December 31, 2004.* |
| | | |
| 10.8 | | Form of Employee Stock Option Agreement (Replacement Grant) typically issued during 2005 and prior periods to persons who exercise other stock options using common shares as payment for the exercise price (one year vesting) is incorporated by reference from Exhibit 10.8 to the Registrant’s Annual Report on Form 10-K for the year ended December 31, 2004.* |
| | | |
| 10.9 | | Form of Non-Employee Director Stock Option Agreement (new grant, ten year expiration, no vesting) that in prior periods was typically issued to non-employee members of the Board of Directors as part of annual director fee retainer (not Incentive Stock Option for tax purposes) is incorporated by reference from Exhibit 10.9 to the Registrant’s Annual Report on Form 10-K for the year ended December 31, 2004.* |
| | | |
| 10.10 | | Form of Employee Director Stock Option Agreement (new grant, ten year expiration, no vesting) that in prior periods was typically issued to employee members of the Board of Directors as part of annual director fee retainer (intended to be Incentive Stock Option for tax purposes) is incorporated by reference from Exhibit 10.10 to the Registrant’s Annual Report on Form 10-K for the year ended December 31, 2004.* |
| | | |
| 10.11 | | Description of Director Compensation Arrangements for the 12 month period ending at 2006 Annual Meeting of Shareholders is incorporated by reference from the description contained in Item 1.01 of the Registrant's Current Report on Form 8-K filed May 4, 2005.* |
| | | |
| 10.12 | | Description of Director Compensation Arrangements for the 12 month period ending at 2007 Annual Meeting of Shareholders is incorporated by reference from the description contained in Item 1.01 of the Registrant's Current Report on Form 8-K filed May 2, 2006.* |
| | | |
| 10.13 | | Description of Director Compensation Arrangements for the 12 month period ending at the 2008 Annual Meeting of Shareholders, is incorporated by reference from the description that will be included in the Company's definitive proxy statement for the 2008 Annual Meeting of Shareholders under the caption "DIRECTOR COMPENSATION."* |
| | | |
| 10.14 | | Description of Executive Management Incentive Plan for 2005 (awards payable in 2006) is incorporated by reference from the description contained in Item 1.01 of the Registrant's Current Report on Form 8-K filed May 4, 2005.* |
| | | |
| 10.15 | | Description of Executive Management Incentive Plan for 2006 (awards payable in 2007) is incorporated by reference from the description contained in Item 1.01 of the Registrant's Current Report on Form 8-K filed February 17, 2006.* |
| | | |
| 10.16 | | Description of Executive Management Incentive Plan for 2007 (awards payable in 2008) is incorporated by reference from the description contained in Item 5.02 of the Registrant's Current Report on Form 8-K filed February 12, 2007.* |
| 10.17 | | Description of Executive Management Incentive Plan for 2008 (awards payable in 2009) is incorporated by reference from the description contained in Item 5.02 of the Registrant's Current Report on Form 8-K filed February 28, 2008.* |
| | | |
| 10.18 | | Executive Supplemental Retirement Income Agreement dated October 1, 1996, between First Federal Bank, F.S.B. and Bradley M. Rust is incorporated by reference from Exhibit 10.13 to the Registrant’s Annual Report on Form 10-K for its fiscal year ended December 31, 2002* |
| | | |
| 10.19 | | Form of Restricted Stock Award Agreement that evidences the terms of awards of restricted stock grants and related cash entitlements granted under the 1999 Long-Term Equity Incentive Plan is incorporated by reference from Exhibit 99 to the Registrant's Current Report on Form 8-K filed February 17, 2006.* |
| | | |
| 10.20 | | Resolutions of Stock Option Committee of Board of Directors of the Registrant amending outstanding stock options by accelerating in full all vesting periods and exercise date restrictions and terminating replacement stock option privileges in connection with future option exercises, adopted by written consent effective December 29, 2005, is incorporated by reference from Exhibit 10.18 to the Registrant’s Annual Report on Form 10-K for its fiscal year ended December 31, 2005.* |
| | | |
| 10.21 | | Second Amended and Restated Loan and Subordinated Debenture Purchase Agreement dated as of December 29, 2006, by and between JPMorgan Chase Bank, N.A., and German American Bancorp, Inc., is incorporated by reference from Exhibit 99.1 to the Registrant's Current Report on 8-K filed January 5, 2007. |
| | | |
| 10.22 | | Agreed Upon Terms and Procedures dated December 29, 2006, executed and delivered by German American Bancorp, Inc. to JPMorgan Chase Bank, N.A., is incorporated by reference from Exhibit 99.2 to the Registrant's Current Report on 8-K filed January 5, 2007. |
| | | |
| 10.23 | | Amendment to Second Amended and Restated Loan and Subordinated Debenture Purchase Agreement dated as of December 29, 2006, by and between JPMorgan Chase Bank, N.A., and German American Bancorp, Inc., dated September 28, 2007, is incorporated by reference from Exhibit 99 to the Registrant's Current Report on 8-K filed October 1, 2007. |
| | | |
| 21 | | Subsidiaries of the Registrant |
| | | |
| 23 | | Consent of Crowe Chizek and Company LLC |
| | | |
| 31.1 | | Sarbanes-Oxley Act of 2002, Section 302 Certification for President and Chief Executive Officer. |
| | | |
| 31.2 | | Sarbanes-Oxley Act of 2002, Section 302 Certification for Senior Vice President (Principal Financial Officer). |
| | | |
| 32.1 | | Sarbanes-Oxley Act of 2002, Section 906 Certification for President and Chief Executive Officer. |
| | | |
| 32.2 | | Sarbanes-Oxley Act of 2002, Section 906 Certification for Senior Vice President (Principal Financial Officer). |
*Exhibits that describe or evidence all management contracts or compensatory plans or arrangements required to be filed as exhibits to this Report are indicated by an asterisk.
GERMAN AMERICAN BANCORP, INC. WILL FURNISH TO ANY SHAREHOLDER AS OF FEBRUARY 29, 2008, A COPY OF ANY OF THE ABOVE-LISTED EXHIBITS UPON THE PAYMENT OF A CHARGE OF $.50 PER PAGE IN ORDER TO DEFRAY ITS EXPENSES IN PROVIDING SUCH EXHIBIT. SUCH REQUEST SHOULD BE ADDRESSED TO GERMAN AMERICAN BANCORP, INC., ATTN: TERRI A. ECKERLE, SHAREHOLDER RELATIONS, P.O. BOX 810, JASPER, INDIANA, 47546.