UNITED STATES SECURITIES AND EXCHANGE COMMISSION
WASHINGTON, D.C. 20549
FORM 10-K
| x | ANNUAL REPORT PURSUANT TO SECTION 13 OR 15(d) OF THE SECURITIES EXCHANGE ACT OF 1934 |
For the fiscal year ended: December 31, 2009
OR
| ¨ | TRANSITION REPORT PURSUANT TO SECTION 13 OR 15(d) OF THE SECURITIES EXCHANGE ACT OF 1934 |
For the transition period from __________ to __________
Commission File Number 001-15877
GERMAN AMERICAN BANCORP, INC.
(Exact name of registrant as specified in its charter)
| INDIANA | | 35-1547518 |
| (State or other jurisdiction of incorporation or organization) | | (I.R.S. Employer Identification No.) |
| 711 Main Street, Box 810, Jasper, Indiana | | 47546 |
| (Address of Principal Executive Offices) | | (Zip Code) |
Registrant’s telephone number, including area code: (812) 482-1314
Securities registered pursuant to Section 12 (b) of the Act
| Title of Each Class | Name of each exchange on which registered |
| Common Shares, No Par Value | The NASDAQ Stock Market LLC |
| Preferred Stock Purchase Rights | |
Securities registered pursuant to Section 12(g) of the Act: None
| Indicate by check mark if the registrant is a well-known seasoned issuer, as defined in Rule 405 of the Securities Act. | ¨ Yes | þ No |
| | | |
| Indicate by check mark if the registrant is not required to file reports pursuant to Section 13 or Section 15(d) of the Act. | ¨ Yes | þ No |
| | | |
| Indicate by check mark whether the registrant (1) has filed all reports required to be filed by Section 13 or 15(d) of the Securities Exchange Act of 1934 during the preceding 12 months (or for such shorter period that the registrant was required to file such reports), and (2) has been subject to such filing requirements for the past 90 days. | þ Yes | ¨ No |
| | | |
Indicate by check mark whether the registrant has submitted electronically and posted on its corporate Web site, if any, every Interactive Data File required to be submitted and posted pursuant to Rule 405 of Regulation S-T (§232.405 of this chapter) during the preceding 12 months (or for such shorter period that the registrant was required to submit and post such files). ¨ | | |
Indicate by check mark if disclosure of delinquent filers pursuant to Item 405 Regulation S-K is not contained herein, and will not be contained, to the best of registrant’s knowledge, in definitive proxy or information statements incorporated by reference in Part III of this Form 10-K or any amendment to this Form 10-K: ¨
Indicate by check mark whether the registrant is a large accelerated filer, an accelerated filer or a non-accelerated filer, or a smaller reporting company:
Large accelerated filer ¨ Accelerated filer þ Non-accelerated filer ¨ Smaller reporting company ¨
| Indicate by check mark whether the registrant is a shell company (as defined in Rule 12b-2 of the Act). | ¨ Yes | þ No |
The aggregate market value of the registrant’s common shares held by non-affiliates of the registrant, computed by reference to the price at which the common shares were last sold, as of June 30, 2009 (the last business day of the registrant’s most recently completed second fiscal quarter) was approximately $149,073,000. This calculation does not reflect a determination that persons are affiliates for any other purposes.
As of March 1, 2010, there were outstanding 11,077,382 common shares, no par value, of the registrant.
DOCUMENTS INCORPORATED BY REFERENCE
Portions of the Proxy Statement of German American Bancorp, Inc., for the Annual Meeting of its Shareholders to be held May 13, 2010, to the extent stated herein, are incorporated by reference into Part III.
GERMAN AMERICAN BANCORP, INC.
ANNUAL REPORT ON FORM 10-K
For Fiscal Year Ended December 31, 2009
Table of Contents
| PART I | | |
| | | |
| Item 1. | Business | 3-7 |
| | | |
| Item 1A. | Risk Factors | 7-11 |
| | | |
| Item 1B. | Unresolved Staff Comments | 11 |
| | | |
| Item 2. | Properties | 11 |
| | | |
| Item 3. | Legal Proceedings | 11 |
| | | |
| Item 4. | Submission of Matters to a Vote of Security Holders | 11 |
| | | |
| PART II | | |
| | | |
| Item 5. | Market for Registrant’s Common Equity, Related Stockholder Matters and Issuer Purchases of Equity Securities | 12-13 |
| | | |
| Item 6. | Selected Financial Data | 14 |
| | | |
| Item 7. | Management’s Discussion and Analysis of Financial Condition and Results of Operations | 15-31 |
| | | |
| Item 7A. | Quantitative and Qualitative Disclosures About Market Risk | 31 |
| | | |
| Item 8. | Financial Statements and Supplementary Data | 32-67 |
| | | |
| Item 9. | Changes in and Disagreements with Accountants on Accounting and Financial Disclosure | 68 |
| | | |
| Item 9A. | Controls and Procedures | 68 |
| | | |
| Item 9B. | Other Information | 68 |
| | | |
| PART III | | |
| | | |
| Item 10. | Directors and Executive Officers of the Registrant | 69 |
| | | |
| Item 11. | Executive Compensation | 69 |
| | | |
| Item 12. | Security Ownership of Certain Beneficial Owners and Management and Related Stockholder Matters | 69-70 |
| | | |
| Item 13. | Certain Relationships and Related Transactions | 70 |
| | | |
| Item 14. | Principal Accountant Fees and Services | 70 |
| | | |
| PART IV | | |
| | | |
| Item 15. | Exhibits and Financial Statement Schedules | 71 |
| | | |
| SIGNATURES | 72 |
| | |
| INDEX OF EXHIBITS | 73-76 |
Information included in or incorporated by reference in this Annual Report on Form 10-K, our other filings with the Securities and Exchange Commission and our press releases or other public statements, contain or may contain “forward-looking statements” within the meaning of the Private Securities Litigation Reform Act of 1995. Please refer to a discussion of our forward- looking statements and associated risks in Item 1, “Business – Forward-Looking Statements and Associated Risks” and our discussion of risk factors in Item 1A, “Risk Factors” in this Annual Report on Form 10-K.
PART I
Item 1. Business.
General.
German American Bancorp, Inc. is a financial services holding company based in Jasper, Indiana. The Company’s Common Stock is traded on NASDAQ’s Global Select Market under the symbol GABC. The principal subsidiary of German American Bancorp, Inc., is its banking subsidiary, German American Bancorp, which operates through 28 retail banking offices in the ten contiguous Southern Indiana counties of Daviess, Dubois, Gibson, Knox, Lawrence, Martin, Monroe, Perry, Pike, and Spencer. The banking subsidiary in February 2010 agreed to purchase two branches of another bank in Vanderburgh and Warrick Counties, which are part of the Evansville (Indiana) metropolitan area. For further information regarding this branch purchase, which is proposed to be completed in the second quarter of 2010, see Note 20 in the Notes to the Consolidated Financial Statements included in Item 8 of this Report and is incorporated into this Item 1 by reference. German American Bancorp, Inc., also owns a trust, brokerage, and financial planning subsidiary, which operates from the banking offices of the bank subsidiary and a full line property and casualty insurance agency with seven insurance agency offices throughout its market area.
Throughout this report, when we use the term “Company”, we will usually be referring to the business and affairs (financial and otherwise) of the Company and its consolidated subsidiaries as a whole. Occasionally, we will refer to the term “parent company” or “holding company” when we mean to refer to only German American Bancorp, Inc.
The Company’s lines of business include retail and commercial banking, mortgage banking, comprehensive financial planning, full service brokerage and trust administration, and a full range of personal and corporate insurance products. Financial and other information by segment is included in Note 15 – Segment Information of the Notes to the Consolidated Financial Statements included in Item 8 of this Report and is incorporated into this Item 1 by reference. Substantially all of the Company’s revenues are derived from customers located in, and substantially all of its assets are located in, the United States.
Subsidiaries.
The Company’s principal operating subsidiaries are described in the following table:
| 1) Name | | 2) Type of Business | | 3) Principal Office Location |
| German American Bancorp | | Commercial Bank | | Jasper, IN |
| German American Insurance, Inc. | | Multi-Line Insurance Agency | | Jasper, IN |
| German American Financial Advisors & Trust Company | | Trust, Brokerage, Financial Planning | | Jasper, IN |
Two of these subsidiaries (German American Bancorp and German American Insurance, Inc.) conducted business during 2009 in the various communities served by the Company under distinctive trade names that relate to the names under which the Company (or a predecessor) has done banking or insurance business with the public in those communities in prior years.
Competition.
The industries in which the Company operates are highly competitive. The Company’s subsidiary bank competes for commercial and retail banking business within its core banking segment not only with financial institutions that have offices in the same counties but also with financial institutions that compete from other locations in Southern Indiana and elsewhere. The Company’s subsidiaries compete with commercial banks, savings and loan associations, savings banks, credit unions, production credit associations, federal land banks, finance companies, credit card companies, personal loan companies, investment brokerage firms, insurance agencies, insurance companies, lease finance companies, money market funds, mortgage companies, and other non-depository financial intermediaries. Many of these banks and other organizations have substantially greater resources than the Company.
Employees.
At March 1, 2010 the Company and its subsidiaries employed approximately 335 full-time equivalent employees. There are no collective bargaining agreements, and employee relations are considered to be good.
Regulation and Supervision.
The Company is subject to regulation and supervision by the Board of Governors of the Federal Reserve System (“FRB”) under the Bank Holding Company Act of 1956, as amended (“BHC Act”), and is required to file with the FRB annual reports and such additional information as the FRB may require. The FRB may also make examinations or inspections of the Company. Under FRB policy, the Company is expected to act as a source of financial strength to its bank subsidiary, and to commit resources to support that subsidiary, even in circumstances where the Company might not do so absent such an FRB policy.
The Company’s subsidiary bank is under the supervision of and subject to examination by the Indiana Department of Financial Institutions (“DFI”), and the Federal Deposit Insurance Corporation (“FDIC”). Regulation and examination by banking regulatory agencies are primarily for the benefit of depositors rather than shareholders.
With certain exceptions, the BHC Act prohibits a bank holding company from engaging in (or acquiring direct or indirect control of more than 5 percent of the voting shares of any company engaged in) nonbanking activities. One of the principal exceptions to this prohibition is for activities deemed by the FRB to be “closely related to banking.” Under current regulations, bank holding companies and their subsidiaries are permitted to engage in such banking-related business ventures as consumer finance; equipment leasing; credit life insurance; computer service bureau and software operations; mortgage banking; and securities brokerage.
Under the BHC Act, certain well-managed and well-capitalized bank holding companies may elect to be treated as a “financial holding company” and, as a result, be permitted to engage in a broader range of activities that are “financial in nature” and in activities that are determined to be incidental or complementary to activities that are financial in nature. These activities include underwriting; dealing in and making a market in securities; insurance underwriting and agency activities; and merchant banking. Banks may also engage through financial subsidiaries in certain of the activities permitted for financial holding companies, subject to certain conditions. The Company has not elected to become a financial holding company and its subsidiary bank has not elected to form financial subsidiaries.
The Company's bank subsidiary and that bank’s subsidiaries may generally engage in activities that are permissible activities for state chartered banks under Indiana banking law, without regard to the limitations that might apply to such activities under the BHC Act if the Company were to engage directly in such activities at the parent company level or through parent company subsidiaries that were not also bank subsidiaries.
Indiana law and the BHC Act restrict certain types of expansion by the Company and its bank subsidiary. The Company and its subsidiaries may be required to apply for prior approval from (or give prior notice and an opportunity for review to) the FRB, the DFI, and/or other bank regulatory or other regulatory agencies, as a condition to the acquisition or establishment of new offices, or the acquisition (by merger or consolidation, purchase or otherwise) of the stock, business or properties of other banks or other companies.
The earnings of commercial banks and their holding companies are affected not only by general economic conditions but also by the policies of various governmental regulatory authorities. In particular, the FRB regulates money and credit conditions and interest rates in order to influence general economic conditions, primarily through open-market operations in U.S. Government securities, varying the discount rate on bank borrowings, and setting reserve requirements against bank deposits. These policies have a significant influence on overall growth and distribution of bank loans, investments and deposits, and affect interest rates charged on loans and earned on investments or paid for time and savings deposits. FRB monetary policies have had a significant effect on the operating results of commercial banks in the past and this is expected to continue in the future. The general effect, if any, of such policies upon the future business and earnings of the Company cannot accurately be predicted.
The Company and its bank subsidiary are required by law to maintain minimum levels of capital. These required capital levels are expressed in terms of capital ratios, known as the leverage ratio and the capital to risk-based assets ratios. The Company and its bank subsidiary each exceeded the minimum required capital levels for each measure of capital adequacy as of December 31, 2009. See Note 8 to the Company's consolidated financial statements that are presented in Item 8 of this Report, which Note 8 is incorporated herein by reference.
Also, federal regulations define five categories of financial institutions for purposes of implementing prompt corrective action and supervisory enforcement requirements of the Federal Deposit Insurance Corporation Improvements Act of 1991. The category to which the most highly capitalized institutions are assigned is termed “well-capitalized.” Institutions falling into this category must have a total risk-based capital ratio (the ratio of total capital to risk-weighted assets) of at least 10%, a Tier 1 risk-based capital ratio (the ratio of Tier 1, or “core”, capital to risk-weighted assets) of at least 6%, a leverage ratio (the ratio of Tier 1 capital to total assets) of at least 5%, and must not be subject to any written agreement, order, or directive from its regulator relative to meeting and maintaining a specific capital level. On December 31, 2009, the Company had a total risk-based capital ratio of 14.09%, a Tier 1 risk-based capital ratio of 10.10% (based on Tier 1 capital of $96,887,000 and total risk-weighted assets of $959,229,000), and a leverage ratio of 7.64%. The Company’s affiliate bank met all of the requirements of the “well-capitalized” category. In addition the Company meets the requirements of the FRB to be considered a “well-capitalized” bank holding company. Accordingly, the Company does not expect these regulations to significantly impact operations.
The parent company is a corporation separate and distinct from its bank and other subsidiaries. Most of the parent company’s revenues historically have been comprised of dividends, fees, and interest paid to it by its bank subsidiary, and this is expected to continue in the future. This subsidiary is subject to statutory restrictions on its ability to pay dividends. The FRB possesses enforcement powers over bank holding companies and their non-bank subsidiaries that enable it to prevent or remedy actions that in its view may represent unsafe or unsound practices or violations of applicable statutes and regulations. Among these powers is the ability in appropriate cases to proscribe the payment of dividends by banks and bank holding companies. During 2009, the FRB advised all bank holding companies that they should inform the FRB reasonably in advance of declaring or paying a dividend that exceeds earnings for the period for which the dividend is being paid or that could result in a material adverse change to the bank holding company’s capital structure. The FDIC and DFI possess similar enforcement powers over the bank subsidiary. The “prompt corrective action” provisions of federal banking law impose further restrictions on the payment of dividends by insured banks which fail to meet specified capital levels and, in some cases, their parent bank holding companies.
Extraordinary Government Programs.
Since October of 2008, the federal government, through the United States Treasury, the federal reserve banking system administered by the FRB and the FDIC, have made a number of programs available to banks and other financial institutions in an effort to ensure a well-functioning U.S. financial system.
During 2009, the Company declined the opportunity to participate in the United States Treasury's Capital Purchase Program, part of the program commonly known as TARP.
The Company's banking subsidiary has elected to participate in the Temporary Liquidity Guarantee Program (“TLGP”), created by the FDIC. Established by final rule of the FDIC in November 2008, the TLGP provides two limited guarantee programs: One, the Debt Guarantee Program, guarantees newly-issued senior unsecured debt, and another, the Transaction Account Guarantee program (“TAG”) guarantees certain non-interest-bearing transaction accounts at insured depository institutions. All insured depository institutions that offer non-interest-bearing transaction accounts had the option to participate in either program. The Company’s bank subsidiary elected to participate in both parts of the TLGP.
Under the TAG, FDIC provides a guarantee for the entire account balance for eligible non-interest-bearing transaction accounts in exchange for an additional insurance premium paid by the depository institution. This additional protection is currently scheduled to terminate on June 30, 2010 (as extended by FDIC). The Company’s subsidiary bank pays an annualized premium for that additional deposit insurance protection of 10-basis points on the aggregate amount of its non-interest bearing transaction accounts.
Federal Deposit Insurance Assessments.
The deposits of the Company’s bank subsidiary are insured up to applicable limits by the Deposit Insurance Fund, or the DIF, of the FDIC and are subject to deposit insurance assessments to maintain the DIF. Like every other insured institution, the Company's bank subsidiary’s assessment rate depends on the capital category and supervisory category to which it is assigned. The FDIC has authority to raise or lower assessment rates on insured deposits in order to achieve statutorily required reserve ratios in the DIF and to impose special additional assessments.
In light of the significant increase in depository institution failures in 2008 and 2009 and the temporary increase of general deposit insurance limits to $250,000 per depositor (scheduled to expire on December 31, 2013), the DIF incurred substantial losses in 2008 and 2009. Accordingly, the FDIC took action during 2009 to revise its risk-based assessment system, to collect certain special assessments, and to accelerate the payment of assessments. Under the new risk-based assessment system, adjusted deposit insurance assessments can range from a low of 7 basis points to a high of 77.5 basis points. The premiums will further increase uniformly by 3 basis points in 2011.
On September 30, 2009, the FDIC collected a special assessment from each insured institution that generally totaled 5 basis points of total assets less Tier 1 Capital. In addition, on December 30, 2009, the FDIC collected 13 quarters of deposit insurance premiums from all insured institutions. Notwithstanding these actions, there is a risk that the bank’s deposit insurance premiums will continue to increase if failures of insured depository institutions continue to deplete the DIF.
In addition, the Deposit Insurance Fund Act of 1996 authorizes the Financing Corporation (“FICO”) to impose assessments on all DIF assessable deposits in order to service the interest on FICO’s bond obligations. The amount assessed each FDIC-insured institution is in addition to the amount, if any, paid for deposit insurance under the FDIC’s risk-related assessment rate schedule. FICO assessment rates may be adjusted quarterly to reflect a change in assessment base. That assessment rate is established quarterly, and during the calendar year ending December 31, 2009, averaged on an annualized basis 1.06 cents per $100 of deposits. These assessments will continue until the FICO bonds mature in 2019.
Any increase in the risk category of the Company’s bank subsidiary or reduction of its capital category as established by the risk-based DIF assessment program, and any adjustments to the base assessment rates or special FDIC assessments, could result in a material increase in our expense for federal deposit insurance.
Internet Address; Internet Availability of SEC Reports.
The Company's Internet address is www.germanamerican.com.
The Company makes available, free of charge through the Shareholder Information section of its Internet website, a link to the Internet website of the Securities and Exchange Commission (SEC) by which the public may view the Company’s annual report on Form 10-K, its quarterly reports on Form 10-Q, its current reports on Form 8-K and any amendments to those reports filed or furnished pursuant to Section 13(a) of the Securities Exchange Act of 1934, as amended, as soon as reasonably practicable after those reports are filed with or furnished to the SEC.
Forward-Looking Statements and Associated Risks.
The Company from time to time in its oral and written communications makes statements relating to its expectations regarding the future. These types of statements are considered “forward-looking statements” within the meaning of the Private Securities Litigation Reform Act of 1995. Such forward-looking statements can include statements about the Company’s net interest income or net interest margin; adequacy of allowance for loan losses, and the quality of the Company’s loans, investment securities and other assets; simulations of changes in interest rates; litigation results; dividend policy; acquisitions or mergers; estimated cost savings, plans and objectives for future operations; and expectations about the Company’s financial and business performance and other business matters as well as economic and market conditions and trends. All statements other than statements of historical fact included in this report, including statements regarding our financial position, business strategy and the plans and objectives of our management for future operations, are forward-looking statements. When used in this report, words such as “anticipate”, “believe”, “estimate”, “expect”, “intend”, and similar expressions, as they relate to us or our management, identify forward-looking statements.
Such forward-looking statements are based on the beliefs of our management, as well as assumptions made by and information currently available to our management, and are subject to risks, uncertainties, and other factors.
Actual results may differ materially and adversely from the expectations of the Company that are expressed or implied by any forward-looking statement. The discussions in Item 1A, “Risk Factors,” and in Item 7 of this Form 10-K, “Management’s Discussion and Analysis of Financial Condition and Results of Operations,” list some of the factors that could cause the Company’s actual results to vary materially from those expressed or implied by any forward-looking statements. Other risks, uncertainties, and factors that could cause the Company’s actual results to vary materially from those expressed or implied by any forward-looking statement include but not limited to:
| | · | the unknown future direction of interest rates and the timing and magnitude of any changes in interest rates; |
| | · | changes in competitive conditions; |
| | · | the introduction, withdrawal, success and timing of asset/liability management strategies or of mergers and acquisitions and other business initiatives and strategies; |
| | · | changes in customer borrowing, repayment, investment and deposit practices; |
| | · | changes in fiscal, monetary and tax policies; |
| | · | changes in financial and capital markets; |
| | · | continued deterioration in general economic conditions, either nationally or locally, resulting in, among other things, credit quality deterioration; |
| | · | capital management activities, including possible future sales of new securities, or possible repurchases or redemptions by the Company of outstanding debt or equity securities; |
| | · | risks of expansion through acquisitions and mergers, such as unexpected credit quality problems of the acquired loans or other assets, unexpected attrition of the customer base of the acquired institution or branches, and difficulties in integration of the acquired operations; |
| | · | factors driving impairment charges on investments; |
| | · | the impact, extent and timing of technological changes; |
| | · | litigation liabilities, including related costs, expenses, settlements and judgments, or the outcome of matters before regulatory agencies, whether pending or commencing in the future; |
| | · | actions of the Federal Reserve Board; |
| | · | changes in accounting principles and interpretations; |
| | · | potential increases of federal deposit insurance premium expense, and possible future special assessments of FDIC premiums, either industry wide or specific to the Company’s banking subsidiary; |
| | · | actions of the Department of the Treasury and the Federal Deposit Insurance Corporation under the Emergency Economic Stabilization Act and the Federal Deposit Insurance Act and other legislative and regulatory actions and reforms; and |
| | · | the continued availability of earnings and excess capital sufficient for the lawful and prudent declaration and payment of cash dividends. |
Such statements reflect our views with respect to future events and are subject to these and other risks, uncertainties and assumptions relating to the operations, results of operations, growth strategy and liquidity of the Company. Readers are cautioned not to place undue reliance on these forward-looking statements. It is intended that these forward-looking statements speak only as of the date they are made. We do not undertake any obligation to release publicly any revisions to these forward-looking statements to reflect future events or circumstances or to reflect the occurrence of unanticipated events.
Item 1A. Risk Factors.
While we have a history of profitability and operate with capital that exceeds the requirements of bank regulatory agencies, the financial services industry in which we operate has been adversely affected by the current weak economic environment. Further, an investment in our common stock (like an investment in the equity securities of any business enterprise) is subject to other investment risks and uncertainties. The following describes some of the principal risks and uncertainties to which our industry in general, and we and our assets and businesses specifically, are subject; other risks are briefly identified in our cautionary statement that is included under the heading “Forward-Looking Statements and Associated Risks” in Part I, Item 1, “Business.” Although we seek ways to manage these risks and uncertainties and to develop programs to control those that we can, we ultimately cannot predict the future. Future results may differ materially from past results, and from our expectations and plans.
Risks Related to the Financial Services Industry
Difficult market conditions have adversely affected our industry.
The U.S. economy entered a recession during the third quarter of 2008, and the housing and real estate markets have been experiencing extraordinary slowdowns since 2007. Additionally, unemployment rates continually rose during these periods. These factors have had a significant negative effect on companies in the financial services industry. As a lending institution, our business is directly affected by the ability of our borrowers to repay their loans, as well as by the value of collateral, such as real estate, that secures many of our loans. Market turmoil has led to an increase in charge-offs and has negatively impacted consumer confidence and the level of business activity. Continued weakness or further deterioration in the economy, real estate markets or unemployment rates, particularly in the markets in which we operate, can place downward pressure on the credit worthiness of bank customers and their inclinations to borrow. A continued or worsening disruption and volatility could negatively impact customers' ability to seek new loans or to repay existing loans, diminish the values of any collateral securing such loans and could cause increases in delinquencies, problem assets, charge-offs and provision for credit losses, all of which could materially adversely affect our financial condition and results of operations. Further, the underwriting and credit monitoring policies and procedures that we have adopted may not prevent losses that could have a material adverse effect on our business, financial condition, results of operations and cash flows. Since our business is concentrated in southern Indiana, declines in the economy of this region could adversely affect our business.
Our FDIC insurance premiums may increase, and special assessments could be made, which could negatively impact our results of operations.
Recent insured institution failures, as well as deterioration in banking and economic conditions, have significantly increased FDIC loss provisions, resulting in a decline of its deposit insurance fund to historical lows. The FDIC expects a higher rate of insured institution failures in the next few years compared to recent years; thus, the reserve ratio may continue to decline. In addition, the Emergency Economic Stabilization Act of 2008, as amended, increased the limit on FDIC coverage to $250,000 through December 31, 2013. These developments have caused our FDIC insurance premiums to increase, and may cause additional increases. On September 30, 2009, the FDIC collected a special assessment from each insured institution, and additional assessments are possible. In addition, the FDIC also collected 13 quarters of prepaid insurance premiums on December 30, 2009.
We operate in a highly regulated environment and changes in laws and regulations to which we are subject may adversely affect our results of operations.
The banking industry in which we operate is subject to extensive regulation and supervision under federal and state laws and regulations. The restrictions imposed by such laws and regulations limit the manner in which we conduct our business, undertake new investments and activities and obtain financing. These regulations are designed primarily for the protection of the deposit insurance funds and consumers and not to benefit our shareholders. Financial institution regulation has been the subject of significant legislation in recent years and may be the subject of further significant legislation, none of which is in our control. Significant new laws or changes in, or repeals of, existing laws (including changes in federal or state laws affecting corporate taxpayers generally or financial institutions specifically) could have a material adverse effect on our business, financial condition, results of operations or liquidity. Further, federal monetary policy, particularly as implemented through the Federal Reserve System, significantly affects credit conditions, and any unfavorable change in these conditions could have a material adverse effect on our business, financial condition, results of operations or liquidity.
Legislative and regulatory actions taken now or in the future regarding the financial services industry may significantly increase our costs or limit our ability to conduct our business in a profitable manner.
As a result of the ongoing financial crisis and challenging market conditions and concerns regarding the consumer lending practices of certain institutions, we expect to face increased regulation and regulatory and political scrutiny of the financial services industry. We are already subject to extensive federal and state regulation and supervision. The cost of compliance with such laws and regulations can be substantial and adversely affect our ability to operate profitably. While we are unable to predict the scope or impact of any potential legislation or regulatory action, bills that would result in significant changes to financial institutions have been introduced in Congress and it is possible that such legislation or implementing regulations could significantly increase our regulatory compliance costs, impede the efficiency of our internal business processes, negatively impact the recoverability of certain of our recorded assets, require us to increase our regulatory capital, interfere with our executive compensation plans, or limit our ability to pursue business opportunities (such as potential opportunities to acquire assets or other institutions or businesses) in an efficient manner.
Additional Risks Related to Our Operations and Business and Financial Strategies
If our actual loan losses exceed our estimates, our earnings and financial condition will be impacted.
A significant source of risk for any bank or other enterprise that lends money arises from the possibility that losses will be sustained because borrowers, guarantors and related parties may fail (because of financial difficulties or other reasons) to perform in accordance with the terms of their loan agreements. In our case, we originate many loans that are secured, but some loans are unsecured depending on the nature of the loan. With respect to secured loans, the collateral securing the repayment of these loans includes a wide variety of real and personal property that may be insufficient to cover the obligations owed under such loans, due to adverse changes in collateral values caused by changes in prevailing economic, environmental and other conditions, including declines in the value of real estate and other external events.
We could be adversely affected by changes in interest rates.
Our earnings and cash flows are largely dependent upon our net interest income. Interest rates are highly sensitive to many factors that are beyond our control, including general economic conditions, demand for loans, securities and deposits, and policies of various governmental and regulatory agencies and, in particular, the monetary policies of the Board of Governors of the Federal Reserve System. If the interest rates paid on deposits and other borrowings increase at a faster rate than the interest rates received on loans and other investments, our net interest income, and therefore earnings, could be adversely affected. Earnings could also be adversely affected if the interest rates received on loans and other investments fall more quickly than the interest rates paid on deposits and other borrowings. Any substantial, unexpected, prolonged change in market interest rates could have a material adverse effect on our financial condition, results of operations, and cash flows.
Our success is tied to the economic vitality of our Southern Indiana markets.
We conduct business from offices that are exclusively located in ten contiguous counties of Southern Indiana, from which substantially all of our customer base is drawn. Because of the geographic concentration of our operations and customer base, our results depend largely upon economic conditions in this area. If current levels of market disruption and volatility worsen in our primary service areas, the quality of our loan portfolio, and the demand for our products and services, could be adversely affected, and this could have a material adverse effect on our business, financial condition, results of operations or liquidity.
We face substantial competition.
The banking and financial services business in our markets is highly competitive. We compete with much larger regional, national, and international competitors, including competitors that have no (or only a limited number of) offices physically located within our markets. In addition, new banks could be organized in our market area which might bid aggressively for new business to capture market share in these markets. Developments increasing the nature or level of our competition, or decreasing the effectiveness by which we compete, could have a material adverse effect on our business, financial condition, results of operations or liquidity. See also Part I, Item 1, of this report, “Business—Competition,” and “Business—Regulation and Supervision.”
The manner in which we report our financial condition and results of operations may be affected by accounting changes.
Our financial condition and results of operations that are presented in our consolidated financial statements, accompanying notes to the consolidated financial statements, and selected financial data appearing in this report, are, to a large degree, dependent upon our accounting policies. The selection of and application of these policies involve estimates, judgments and uncertainties that are subject to change, and the effect of any change in estimates or judgments that might be caused by future developments or resolution of uncertainties could be materially adverse to our reported financial condition and results of operations. In addition, authorities that prescribe accounting principles and standards for public companies from time to time change those principles or standards or adopt formal or informal interpretations of existing principles or standards. Such changes or interpretations (to the extent applicable to us) could result in changes that would be materially adverse to our reported financial condition and results of operations.
Liquidity risk could impair our ability to fund operations and jeopardize our financial condition.
Liquidity is essential to our business. An inability to raise funds through deposits, borrowings, the sale of securities or loans and other sources could have a substantial negative effect on our liquidity. Our access to funding sources in amounts adequate to finance our activities or the terms of which are acceptable to us could be impaired by factors that affect us specifically or the financial services industry or economy in general. Although we have historically been able to replace maturing deposits and borrowings as necessary, we might not be able to replace such funds in the future if, among other things, our results of operations or financial condition or the results of operations or financial condition of our lenders or market conditions were to change.
The value of securities in our investment securities portfolio may be negatively affected by continued disruptions in securities markets.
The market for investment securities has become extremely volatile over the past twelve months. Volatile market conditions may detrimentally affect the value of securities that we hold in our investment portfolio, such as through reduced valuations due to the perception of heightened credit and liquidity risks. There can be no assurance that declines in market value associated with these disruptions will not result in other than temporary impairments of these assets, which would lead to accounting charges that could have a material adverse effect on our net income and capital levels.
The soundness of other financial institutions could adversely affect us.
Our ability to engage in routine funding transactions could be adversely affected by the actions and commercial soundness of other financial institutions. Financial services companies are interrelated as a result of trading, clearing, counterparty, or other relationships. We have exposure to many different industries and counterparties, and we routinely execute transactions with counterparties in the financial services industry, including brokers and dealers, commercial banks, investment banks, mutual and hedge funds, and other institutional clients. As a result, defaults by, or even rumors or questions about, one or more financial services companies, or the financial services industry generally, have led to market-wide liquidity problems and could lead to losses or defaults by us or by other institutions. Many of these transactions expose us to credit risk in the event of default of our counterparty or client. In addition, our credit risk may be exacerbated when the collateral held by us cannot be realized or is liquidated at prices not sufficient to recover the full amount due us.
We are dependent on key personnel and the loss of one or more of those key personnel could harm our business.
Competition for qualified employees and personnel in the financial services industry (including banking personnel, trust and investments personnel, and insurance personnel) is intense and there are a limited number of qualified persons with knowledge of and experience in our local Southern Indiana markets. Our success depends to a significant degree upon our ability to attract and retain qualified loan origination executives, sales executives for our trust and investment products and services, and sales executives for our insurance products and services. We also depend upon the continued contributions of our management personnel, and in particular upon the abilities of our senior executive management, and the loss of the services of one or more of them could harm our business.
Our controls and procedures may fail or be circumvented.
Management regularly reviews and updates our internal controls, disclosure controls and procedures, and corporate governance policies and procedures. Any system of controls, however well designed and operated, is based in part on certain assumptions and can provide only reasonable, not absolute, assurances that the objectives of the system are met. Any failure or circumvention of our controls and procedures or failure to comply with regulations related to controls and procedures could have a material adverse effect on our business, results of operations, cash flows and financial condition.
We are subject to security and operational risks relating to our use of technology that could damage our reputation and our business.
We rely heavily on communications and information systems to conduct our business. Any failure, interruption or breach in security of these systems could result in failures or disruptions in our customer relationship management, general ledger, deposit, loan and other systems. The occurrence of any failures, interruptions or security breaches of information systems used to process customer transactions could damage our reputation, result in a loss of customer business, subject us to additional regulatory scrutiny, or expose us to civil litigation and possible financial liability.
We are exposed to risk of environmental liabilities with respect to properties to which we take title.
In the course of our business, we may own or foreclose and take title to real estate, and could be subject to environmental liabilities with respect to these properties (including liabilities for property damage, personal injury, investigation and clean-up costs incurred by these parties in connection with environmental contamination), or may be required to investigate or clean up hazardous or toxic substances, or chemical releases at a property.
Any acquisitions of banks, bank branches, or loans or other financial service assets pose risks to us.
In the past several years, we have completed several purchases of loan portfolios from other banks and have agreed to expand into the Evansville, Indiana market by buying two branches of another bank. We may continue to buy banks, bank branches and other financial-service-related businesses and assets in the future. Acquiring other banks, businesses, or branches involves various risks commonly associated with acquisitions, including, among other things:
| | · | potential exposure to unknown or contingent liabilities or asset quality issues of the acquired assets, operations or company; |
| | · | potential exposure to unknown or contingent liabilities of the acquired assets, operations or company; |
| | · | exposure to potential asset quality issues of the acquired assets, operations or company; |
| | · | environmental liability with acquired real estate collateral or other real estate; |
| | · | difficulty and expense of integrating the operations, systems and personnel of the acquired assets, operations or company; |
| | · | potential disruption to our ongoing business, including diversion of our management’s time and attention; |
| | · | the possible loss of key employees and customers of the acquired operations or company; |
| | · | difficulty in estimating the value of the acquired assets, operations or company; and |
| | · | potential changes in banking or tax laws or regulations that may affect the acquired assets, operations or company. |
We may not be successful in overcoming these risks or any other problems encountered in connection with mergers or acquisitions.
Acquisitions typically involve the payment of a premium over book and market values, and, therefore, some dilution of the Company's tangible book value and net income per common share may occur in connection with any future transaction. Furthermore, failure to realize the expected revenue increases, cost savings, increases in geographic or product presence, and/or other projected benefits from an acquisition could have a material adverse effect on our financial condition and results of operations.
We may participate in FDIC-assisted acquisitions, which could present additional risks to our financial condition.
We may make opportunistic whole or partial acquisitions of troubled financial institutions in transactions facilitated by the FDIC. In addition to the risks frequently associated with acquisitions, an acquisition of a troubled financial institution may involve a greater risk that the acquired assets underperform compared to our expectations. Because these acquisitions are structured in a manner that would not allow us the time normally associated with preparing for and evaluating an acquisition, including preparing for integration of an acquired institution, we may face additional risks including, among other things, the loss of customers, strain on management resources related to collection and management of problem loans and problems related to integration of personnel and operating systems. Additionally, while the FDIC may agree to assume certain losses in transactions that it facilitates, there can be no assurances that we would not be required to raise additional capital as a condition to, or as a result of, participation in an FDIC-assisted transaction. Any such transactions and related issuances of stock may have dilutive effect on earnings per share and share ownership.
Item 1B. Unresolved Staff Comments. None.
Item 2. Properties.
The Company’s executive offices are located in the main office building of its bank subsidiary, German American Bancorp, at 711 Main Street, Jasper, Indiana. The main office building contains approximately 23,600 square feet of office space. The Company’s subsidiaries conduct their operations from 33 other locations in Southern Indiana.
Item 3. Legal Proceedings.
There are no material pending legal proceedings, other than routine litigation incidental to the business of the Company’s subsidiaries, to which the Company or any of its subsidiaries is a party or of which any of their property is the subject.
Item 4. Submission of Matters to a Vote of Security Holders.
There were no matters submitted during the fourth quarter of 2009 to a vote of security holders, by solicitation of proxies or otherwise.
PART II
Item 5. Market for Registrant’s Common Equity, Related Stockholder Matters and Issuer Purchases of Equity Securities.
Market and Dividend Information
German American Bancorp, Inc.’s stock is traded on NASDAQ’s Global Select Market under the symbol GABC. The quarterly high and low closing prices for the Company’s common stock as reported by NASDAQ and quarterly cash dividends declared and paid are set forth in the table below.
| | | 2009 | | | 2008 | |
| | | | | | | | | Cash | | | | | | | | | Cash | |
| | | High | | | Low | | | Dividend | | | High | | | Low | | | Dividend | |
| | | | | | | | | | | | | | | | | | | |
| Fourth Quarter | | $ | 17.31 | | | $ | 14.24 | | | $ | 0.140 | | | $ | 12.90 | | | $ | 10.65 | | | $ | 0.140 | |
| Third Quarter | | $ | 18.33 | | | $ | 14.25 | | | $ | 0.140 | | | $ | 13.60 | | | $ | 11.00 | | | $ | 0.140 | |
| Second Quarter | | $ | 16.04 | | | $ | 11.33 | | | $ | 0.140 | | | $ | 13.23 | | | $ | 11.39 | | | $ | 0.140 | |
| First Quarter | | $ | 12.50 | | | $ | 10.40 | | | $ | 0.140 | | | $ | 13.29 | | | $ | 11.31 | | | $ | 0.140 | |
| | | | | | | | | | | $ | 0.560 | | | | | | | | | | | $ | 0.560 | |
The Common Stock was held of record by approximately 3,308 shareholders at February 28, 2010.
Cash dividends paid to the Company’s shareholders are primarily funded from dividends received by the parent company from its bank subsidiary. The declaration and payment of future dividends will depend upon the earnings and financial condition of the Company and its subsidiaries, general economic conditions, compliance with regulatory requirements affecting the ability of the bank subsidiary and the Company to declare dividends, and other factors.
| Transfer Agent: | Computershare | Shareholder | Terri A. Eckerle |
| | Priority Processing | Information and | German American Bancorp, Inc. |
| | 250 Royall St | Corporate Office: | P. O. Box 810 |
| | Canton, MA 02021 | | Jasper, Indiana 47547-0810 |
| | Contact: Shareholder Relations | | (812) 482-1314 |
| | (800) 884-4225 | | (800) 482-1314 |
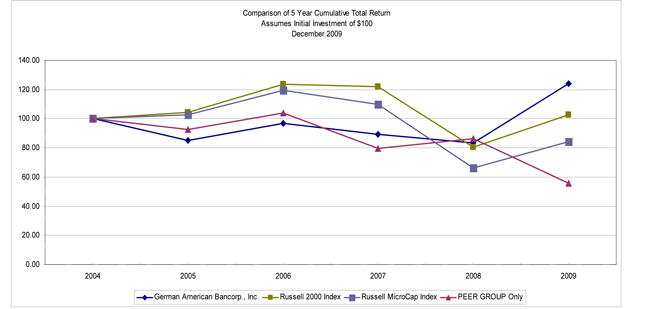
Stock Performance Graph
The following graph compares the Company’s five-year cumulative total returns with those of the Russell 2000 Stock Index, Russell Microcap Stock Index, and the Indiana Bank Peer Group. The Indiana Bank Peer Group (which is a custom peer group identified by Company management) includes all Indiana-based commercial bank holding companies (excluding companies owning thrift institutions that are not regulated as bank holding companies) that have been in existence as commercial bank holding companies throughout the five-year period ended December 2009, the stocks of which have been traded on an established securities market (NYSE, AMEX, NASDAQ) throughout that five-year period. The companies comprising the Indiana Bank Peer Group for purposes of the December 2009 comparison were: 1st Source Corp., Community Bank Shares of IN, First Financial Corp., First Merchants Corp., Integra Bank Corp., Lakeland Financial Corp., MainSource Financial Group, Old National Bancorp, Indiana Community Bancorp, Horizon Bancorp, Monroe Bancorp, and Tower Financial Corp. The returns of each company in the Indiana Bank Peer Group have been weighted to reflect the company’s market capitalization. The Russell 2000 Stock Index, which is designed to measure the performance of the small-cap segment of the U.S. equity universe, is a subset of the Russell 3000 Index (which measures the performance of the largest 3,000 U.S. companies) that includes approximately 2,000 of the smallest securities in that index based on a combination of their market cap and current index membership, and is annually reconstituted at the end of each June. The Russell Microcap Stock Index is an index representing the smallest 1,000 securities in the small-cap Russell 2000 Index plus the next 1,000 securities, which is also annually reconstituted at the end of each June. The Company’s stock is currently included in the Russell 2000 Index and Russell Microcap Index.
Stock Repurchase Program Information
The following table sets forth information regarding the Company's purchases of its common shares during each of the three months ended December 31, 2009.
| | | Total | | | | | | | | | Maximum Number | |
| | | Number | | | | | | Total Number of Shares | | | (or Approximate Dollar | |
| | | Of Shares | | | Average Price | | | (or Units) Purchased as Part | | | Value) of Shares (or Units) | |
| | | (or Units) | | | Paid Per Share | | | of Publicly Announced Plans | | | that May Yet Be Purchased | |
| Period | | Purchased | | | (or Unit) | | | or Programs | | | Under the Plans or Programs (1) | |
| | | | | | | | | | | | | |
| October 2009 | | | — | | | | — | | | | — | | | | 272,789 | |
| November 2009 | | | — | | | | — | | | | — | | | | 272,789 | |
| December 2009 | | | — | | | | — | | | | — | | | | 272,789 | |
(1) On April 26, 2001, the Company announced that its Board of Directors had approved a stock repurchase program for up to 607,754 of its outstanding common shares, of which the Company had purchased 334,965 common shares through December 31, 2008 (both such numbers adjusted for subsequent stock dividends). The Board of Directors established no expiration date for this program. The Company purchased no shares under this program during the quarter ended December 31, 2009.
Item 6. Selected Financial Data.
The following selected data should be read in conjunction with the consolidated financial statements and related notes that are included in Item 8 of this Report, and “Management's Discussion and Analysis of Financial Condition and Results of Operations,” which is included in Item 7 of this Report (dollars in thousands, except per share data).
| | | 2009 | | | 2008 | | | 2007 | | | 2006 | | | 2005 | |
| Summary of Operations: | | | | | | | | | | | | | | | |
| Interest Income | | $ | 63,736 | | | $ | 67,845 | | | $ | 72,261 | | | $ | 63,594 | | | $ | 50,197 | |
| Interest Expense | | | 19,223 | | | | 26,908 | | | | 33,646 | | | | 27,398 | | | | 17,984 | |
| Net Interest Income | | | 44,513 | | | | 40,937 | | | | 38,615 | | | | 36,196 | | | | 32,213 | |
| Provision for Loan Losses | | | 3,750 | | | | 3,990 | | | | 3,591 | | | | 925 | | | | 1,903 | |
| Net Interest Income after Provision | | | | | | | | | | | | | | | | | | | | |
| For Loan Losses | | | 40,763 | | | | 36,947 | | | | 35,024 | | | | 35,271 | | | | 30,310 | |
| Non-interest Income | | | 15,859 | | | | 18,210 | | | | 15,704 | | | | 15,993 | | | | 14,502 | |
| Non-interest Expense | | | 40,391 | | | | 36,716 | | | | 37,221 | | | | 37,059 | | | | 31,756 | |
| Income before Income Taxes | | | 16,231 | | | | 18,441 | | | | 13,507 | | | | 14,205 | | | | 13,056 | |
| Income Tax Expense | | | 4,013 | | | | 5,638 | | | | 4,102 | | | | 3,984 | | | | 3,335 | |
| Net Income | | $ | 12,218 | | | $ | 12,803 | | | $ | 9,405 | | | $ | 10,221 | | | $ | 9,721 | |
| | | | | | | | | | | | | | | | | | | | | |
| Year-end Balances: | | | | | | | | | | | | | | | | | | | | |
| Total Assets | | $ | 1,242,965 | | | $ | 1,190,828 | | | $ | 1,131,710 | | | $ | 1,093,424 | | | $ | 946,467 | |
| Total Loans, Net of Unearned Income | | | 877,822 | | | | 890,436 | | | | 867,721 | | | | 796,259 | | | | 651,956 | |
| Total Deposits | | | 969,643 | | | | 941,750 | | | | 877,421 | | | | 867,618 | | | | 746,821 | |
| Total Long-term Debt | | | 113,320 | | | | 105,608 | | | | 86,786 | | | | 68,333 | | | | 66,606 | |
| Total Shareholders’ Equity | | | 113,549 | | | | 105,174 | | | | 97,116 | | | | 92,391 | | | | 82,255 | |
| | | | | | | | | | | | | | | | | | | | | |
| Average Balances: | | | | | | | | | | | | | | | | | | | | |
| Total Assets | | $ | 1,230,596 | | | $ | 1,174,583 | | | $ | 1,114,140 | | | $ | 1,029,838 | | | $ | 925,851 | |
| Total Loans, Net of Unearned Income | | | 891,322 | | | | 880,630 | | | | 840,849 | | | | 715,260 | | | | 634,526 | |
| Total Deposits | | | 963,928 | | | | 922,137 | | | | 889,736 | | | | 814,440 | | | | 730,220 | |
| Total Shareholders’ Equity | | | 109,887 | | | | 99,711 | | | | 93,677 | | | | 88,451 | | | | 84,479 | |
| | | | | | | | | | | | | | | | | | | | | |
| | | | | | | | | | | | | | | | | | | | |
| Net Income | | $ | 1.10 | | | $ | 1.16 | | | $ | 0.85 | | | $ | 0.93 | | | $ | 0.89 | |
| Cash Dividends | | | 0.56 | | | | 0.56 | | | | 0.56 | | | | 0.56 | | | | 0.56 | |
| Book Value at Year-end | | | 10.25 | | | | 9.54 | | | | 8.81 | | | | 8.39 | | | | 7.73 | |
| | | | | | | | | | | | | | | | | | | | | |
| Other Data at Year-end: | | | | | | | | | | | | | | | | | | | | |
| Number of Shareholders | | | 3,364 | | | | 3,684 | | | | 3,647 | | | | 3,438 | | | | 3,494 | |
| Number of Employees | | | 332 | | | | 348 | | | | 371 | | | | 397 | | | | 367 | |
Weighted Average Number of Shares (1) | | | 11,065,917 | | | | 11,029,519 | | | | 11,009,536 | | | | 10,994,739 | | | | 10,890,987 | |
| | | | | | | | | | | | | | | | | | | | | |
| Selected Performance Ratios: | | | | | | | | | | | | | | | | | | | | |
| Return on Assets | | | 0.99 | % | | | 1.09 | % | | | 0.84 | % | | | 0.99 | % | | | 1.05 | % |
| Return on Equity | | | 11.12 | % | | | 12.84 | % | | | 10.04 | % | | | 11.56 | % | | | 11.51 | % |
| Equity to Assets | | | 9.14 | % | | | 8.83 | % | | | 8.58 | % | | | 8.45 | % | | | 8.69 | % |
| Dividend Payout | | | 50.71 | % | | | 48.25 | % | | | 65.65 | % | | | 60.29 | % | | | 62.83 | % |
| Net Charge-offs to Average Loans | | | 0.25 | % | | | 0.29 | % | | | 0.32 | % | | | 0.50 | % | | | 0.26 | % |
| Allowance for Loan Losses to Loans | | | 1.25 | % | | | 1.07 | % | | | 0.93 | % | | | 0.90 | % | | | 1.42 | % |
| Net Interest Margin | | | 3.95 | % | | | 3.82 | % | | | 3.83 | % | | | 3.96 | % | | | 3.92 | % |
| (1) | Share and Per Share Data excludes the dilutive effect of stock options. |
Year to year financial information comparability is affected by the purchase accounting treatment for mergers and acquisitions.
Item 7. Management’s Discussion and Analysis of Financial Condition and Results of Operations.
German American Bancorp, Inc. is a financial services holding company based in Jasper, Indiana. The Company’s Common Stock is traded on NASDAQ’s Global Select Market, under the symbol GABC. The principal subsidiary of German American Bancorp, Inc., is its banking subsidiary, German American Bancorp, which operates through 28 retail banking offices in the ten contiguous Southern Indiana counties of Daviess, Dubois, Gibson, Knox, Lawrence, Martin, Monroe, Perry, Pike, and Spencer. German American Bancorp, Inc., also owns a trust, brokerage, and financial planning subsidiary, which operates from the banking offices of the bank subsidiary, and full line property and casualty insurance agency with seven insurance agency offices throughout its market area.
Throughout this Management’s Discussion and Analysis, as elsewhere in this report, when we use the term “Company”, we will usually be referring to the business and affairs (financial and otherwise) of the Company and its subsidiaries and affiliates as a whole. Occasionally, we will refer to the term “parent company” or “holding company” when we mean to refer to only German American Bancorp, Inc.
The information in this Management’s Discussion and Analysis is presented as an analysis of the major components of the Company’s operations for the years 2007 through 2009 and its financial condition as of December 31, 2009 and 2008. This information should be read in conjunction with the accompanying consolidated financial statements and footnotes contained elsewhere in this report and with the description of business included in Item 1 of this Report (including the cautionary disclosure regarding “Forward Looking Statements and Associated Risks”). Financial and other information by segment is included in Note 15 to the Company’s consolidated financial statements included in Item 8 of this Report and is incorporated into this Item 7 by reference.
The statements of management’s expectations and goals concerning the Company’s future operations and performance that are set forth in the following Management Overview and in other sections of this Item 7 are forward-looking statements, and readers are cautioned that these forward-looking statements are based on assumptions and are subject to risks, uncertainties, and other factors. Actual results may differ materially from the expectations of the Company that is expressed or implied by any forward-looking statement. This Item 7, as well as the discussions in Item 1 (“Business”) entitled “Forward-Looking Statements and Associated Risks” and in Item 1A (“Risk Factors”) (which discussions are incorporated in this Item 7 by reference) list some of the factors that could cause the Company's actual results to vary materially from those expressed or implied by any such forward-looking statements.
MANAGEMENT OVERVIEW
The Company’s net income decreased $585,000 or 5% to $12,218,000 or $1.10 per share in 2009 compared to $12,803,000 or $1.16 per share in 2008. The level of earnings achieved in 2009 represented the second highest level of financial performance in the Company’s history, while 2008 earnings represented the highest level of earnings in the Company’s history.
The Company’s 2009 performance was positively impacted by an approximately 9% improvement in net interest income. The improvement in net interest income was the result of approximately 6% growth in earning assets driven by core deposit growth and an improved net interest margin. The Company also strengthened its level of loan loss reserves by adding approximately $1.5 million to the allowance for loan losses during 2009. The Company also significantly enhanced its equity and regulatory capital during 2009. Largely the result of strong retained earnings in 2009, the Company’s total shareholder’s equity increased approximately 8%, and the Company’s regulatory capital was augmented by the Company’s issuance during 2009 of $19.3 million of ten-year subordinated redeemable debentures.
In a direct reflection of the weakened economic environment in which the Company operated during 2009, the Company’s earnings were negatively impacted by lower levels of non-interest income and higher levels of operating costs. The lower levels of non-interest income in 2009 were the result of declines of approximately 20% in revenues and fees generated by the Company’s insurance, investment, and trust activities while fees derived from deposit service charges declined by approximately 11%. The higher level of non-interest expenses in 2009 were directly related to significantly higher levels of FDIC insurance premiums (an increase of approximately $1.7 million) and health insurance costs (an increase of approximately $1.0 million).
In the second quarter of 2010, the Company plans to complete its acquisition of two branches (including their related loan assets and deposit liabilities) of another bank in the Evansville, Indiana banking market, which is a new market for the Company. For further information see Note 20 to the Company’s consolidated financial statements included in Item 8 of this Report.
CRITICAL ACCOUNTING POLICIES AND ESTIMATES
The financial condition and results of operations for German American Bancorp, Inc. presented in the Consolidated Financial Statements, accompanying Notes to the Consolidated Financial Statements, and selected financial data appearing elsewhere within this report, are, to a large degree, dependent upon the Company’s accounting policies. The selection of and application of these policies involve estimates, judgments and uncertainties that are subject to change. The critical accounting policies and estimates that the Company has determined to be the most susceptible to change in the near term relate to the determination of the allowance for loan losses, the valuation of securities available for sale, and the valuation allowance on deferred tax assets.
ALLOWANCE FOR LOAN LOSSES
The Company maintains an allowance for loan losses to cover probable incurred credit losses at the balance sheet date. Loan losses are charged against the allowance when management believes the uncollectibility of a loan balance is confirmed. Subsequent recoveries, if any, are credited to the allowance. Allocations of the allowance may be made for specific loans, but the entire allowance is available for any loan that, in management’s judgment, should be charged-off. A provision for loan losses is charged to operations based on management's periodic evaluation of the necessary allowance balance. Evaluations are conducted at least quarterly and more often if deemed necessary. The ultimate recovery of all loans is susceptible to future market factors beyond the Company's control.
The Company has an established process to determine the adequacy of the allowance for loan losses. The determination of the allowance is inherently subjective, as it requires significant estimates, including the amounts and timing of expected future cash flows on impaired loans, estimated losses on other classified loans and pools of homogeneous loans, and consideration of past loan loss experience, the nature and volume of the portfolio, information about specific borrower situations and estimated collateral values, economic conditions, and other factors, all of which may be susceptible to significant change. The allowance consists of two components of allocations, specific and general. These two components represent the total allowance for loan losses deemed adequate to cover losses inherent in the loan portfolio.
Commercial and agricultural loans are subject to a standardized grading process administered by an internal loan review function. The need for specific reserves is considered for credits when graded substandard or special mention, or when: (a) the customer’s cash flow or net worth appears insufficient to repay the loan; (b) the loan has been criticized in a regulatory examination; (c) the loan is on non-accrual; or, (d) other reasons where the ultimate collectibility of the loan is in question, or the loan characteristics require special monitoring. Specific allowances are established in cases where management has identified significant conditions or circumstances related to an individual credit that we believe indicates the loan is impaired. Specific allocations on impaired loans are determined by comparing the loan balance to the present value of expected cash flows or expected collateral proceeds. Allocations are also applied to categories of loans not considered individually impaired but for which the rate of loss is expected to be greater than historical averages, including those graded substandard or special mention and non-performing consumer or residential real estate loans. Such allocations are based on past loss experience and information about specific borrower situations and estimated collateral values.
General allocations are made for other pools of loans, including non-classified loans, homogeneous portfolios of consumer and residential real estate loans, and loans within certain industry categories believed to present unique risk of loss. General allocations of the allowance are primarily made based on a three-year historical average for loan losses for these portfolios, judgmentally adjusted for economic factors and portfolio trends.
Due to the imprecise nature of estimating the allowance for loan losses, the Company’s allowance for loan losses includes a minor unallocated component. The unallocated component of the allowance for loan losses incorporates the Company’s judgmental determination of inherent losses that may not be fully reflected in other allocations, including factors such as economic uncertainties, lending staff quality, industry trends impacting specific portfolio segments, and broad portfolio quality trends. Therefore, the ratio of allocated to unallocated components within the total allowance may fluctuate from period to period.
SECURITIES VALUATION
Securities available-for-sale are carried at fair value, with unrealized holding gains and losses reported separately in accumulated other comprehensive income (loss), net of tax. The Company obtains market values from a third party on a monthly basis in order to adjust the securities to fair value. Equity securities that do not have readily determinable fair values are carried at cost. Additionally, all securities are required to be written down to fair value when a decline in fair value is other than temporary; therefore, future changes in the fair value of securities could have a significant impact on the Company’s operating results. In determining whether a market value decline is other-than-temporary, management considers the reason for the decline, the extent of the decline and the duration of the decline. As of December 31, 2009, gross unrealized losses on the securities available-for-sale portfolio totaled approximately $989,000.
INCOME TAX EXPENSE
Income tax expense involves estimates related to the valuation allowance on deferred tax assets and loss contingencies related to exposure from tax examinations.
A valuation allowance reduces deferred tax assets to the amount management believes is more likely than not to be realized. In evaluating the realization of deferred tax assets, management considers the likelihood that sufficient taxable income of appropriate character will be generated within carryback and carryforward periods, including consideration of available tax planning strategies. Tax related loss contingencies, including assessments arising from tax examinations and tax strategies, are recorded as liabilities when the likelihood of loss is probable and an amount or range of loss can be reasonably estimated. In considering the likelihood of loss, management considers the nature of the contingency, the progress of any examination or related protest or appeal, the views of legal counsel and other advisors, experience of the Company or other enterprises in similar matters, if any, and management’s intended response to any assessment.
NET INCOME
Net income declined $585,000 or 5% to $12,218,000 or $1.10 per share in 2009 compared to $12,803,000 or $1.16 per share in 2008. The decline in earnings during 2009 compared with 2008 was largely the result of lower non-interest revenues and higher levels of non-interest expense partially mitigated by an increase in net interest income.
Net income increased $3,398,000 or 36% to $12,803,000 or $1.16 per share in 2008 compared to $9,405,000 or $0.85 per share in 2007. The increase in earnings in 2008 compared with 2007 was attributable to improvement in net interest income, non-interest income, and non-interest expense, partially offset by a higher provision for loan losses.
NET INTEREST INCOME
Net interest income is the Company’s single largest source of earnings, and represents the difference between interest and fees realized on earning assets, less interest paid on deposits and borrowed funds. Several factors contribute to the determination of net interest income and net interest margin, including the volume and mix of earning assets, interest rates, and income taxes. Many factors affecting net interest income are subject to control by management policies and actions. Factors beyond the control of management include the general level of credit and deposit demand, Federal Reserve Board monetary policy, and changes in tax laws.
Net interest income increased $3,576,000 or 9% (an increase of $3,798,000 or 9% on a tax-equivalent basis) for the year ended December 31, 2009 compared with the year ended 2008. The increase in net interest income was primarily attributable to an increased level of average earning assets and an expanded net interest margin in 2009 compared with 2008. The tax equivalent net interest margin for 2009 was 3.95% compared to 3.82% for 2008. The yield on earning assets totaled 5.62% during 2009 compared to 6.30% in 2008 while the cost of funds (expressed as a percentage of average earning assets) totaled 1.67% during 2009 compared to 2.48% in 2008.
Average earning assets increased by approximately $61.9 million or 6% during 2009 compared with 2008. Average loans outstanding increased by $10.7 million or 1% during 2009 compared with 2008. The remainder of the increase in average earning assets was primarily related to an increased securities portfolio in 2009. The key driver of the increased securities portfolio and overall increased average earnings assets was a higher level of average core deposits (core deposits defined as demand deposits - both interest and non-interest bearing, savings, money market and time deposits in denominations of less than $100,000). During 2009 average core deposits increased $53.5 million or 7%, compared to 2008.
The expansion of the Company’s net interest income and net interest margin during 2009 compared with 2008 was aided by utilization of interest rate floors on adjustable rate commercial and industrial, commercial real estate and agricultural loans. As of December 31, 2009 the Company’s commercial and agricultural loan portfolios totaled $680.1 million of which approximately 67% were adjustable rate loans. Of these adjustable rate loans, approximately 83% contain interest rate floors which range predominantly from 4% to 7%. At year-end 2009, approximately $223.6 million of these loans were at their contractual floor.
Also contributing to the expansion of the Company’s net interest income and net interest margin during 2009 compared with 2008 has been the relative liability sensitive nature of the Company’s balance sheet. The Company was able to effectively lower interest rates on both its interest-bearing non-maturity deposits while continuing to expand its core deposit base. In addition, a significant level of time deposits matured during 2009 allowing the Company to lower its cost of these deposits in a time of historically low interest rates.
Net interest income increased $2,322,000 or 6% (an increase of $2,320,000 or 6% on a tax-equivalent basis) for the year ended 2008 compared with 2007. The increase in net interest income was primarily attributable to an increased level of average earning assets for the year ended 2008 compared with 2007. Average earning assets totaled $1.086 billion during 2008 compared with $1.023 billion during 2007. During 2008, average loans outstanding totaled $880.6 million, an increase of $39.8 million or 5%, compared to the $840.8 million in average loans outstanding during 2007. Average commercial and agricultural loans totaled $639.4 million, an increase of $50.4 million or 9% during 2008 compared with 2007. Average residential mortgage loans and consumer loans totaled $241.2 million during 2008 representing a decline of $10.6 million or 4% from 2007.
For 2008, the net interest margin remained relatively stable at 3.82% compared to 3.83% during 2007. The Company’s yield on earning assets totaled 6.30% compared with a cost of funds of 2.48% netting to a net interest margin of 3.82% for the year ended December 31, 2008. The Company’s yield on earning assets was 7.12% compared with a cost of funds of 3.29% netting to a net interest margin of 3.83% for the year ended December 31, 2007.
The following table summarizes net interest income (on a tax-equivalent basis) for each of the past three years. For tax-equivalent adjustments, an effective tax rate of 34% was used for all years presented (1).
| Average Balance Sheet |
| (Tax-equivalent basis / dollars in thousands) |
| | | | | | | | | | |
| | | Twelve Months Ended | | | Twelve Months Ended | | | Twelve Months Ended | |
| | | December 31, 2009 | | | December 31, 2008 | | | December 31, 2007 | |
| | | | | | | | | | | | | | | | | | | | | | | | | | | | |
| | | Principal | | | Income / | | | Yield / | | | Principal | | | Income / | | | Yield / | | | Principal | | | Income / | | | Yield / | |
| | | Balance | | | Expense | | | Rate | | | Balance | | | Expense | | | Rate | | | Balance | | | Expense | | | Rate | |
| | | | | | | | | | | | | | | | | | | | | | | | | | | | |
| ASSETS | | | | | | | | | | | | | | | | | | | | | | | | | | | |
Federal Funds Sold and Other | | | | | | | | | | | | | | | | | | | | | | | | | | | |
| Short-term Investments | | $ | 41,085 | | | $ | 106 | | | | 0.26 | % | | $ | 35,064 | | | $ | 593 | | | | 1.69 | % | | $ | 9,626 | | | $ | 478 | | | | 4.96 | % |
| | | | | | | | | | | | | | | | | | | | | | | | | | | | | | | | | | | | | |
| Securities: | | | | | | | | | | | | | | | | | | | | | | | | | | | | | | | | | | | | |
| Taxable | | | 192,074 | | | | 8,660 | | | | 4.51 | % | | | 152,710 | | | | 8,007 | | | | 5.24 | % | | | 149,108 | | | | 6,992 | | | | 4.69 | % |
| Non-taxable | | | 23,920 | | | | 1,614 | | | | 6.75 | % | | | 18,061 | | | | 1,164 | | | | 6.44 | % | | | 23,913 | | | | 1,423 | | | | 5.95 | % |
Total Loans and Leases (2) | | | 891,322 | | | | 54,166 | | | | 6.08 | % | | | 880,630 | | | | 58,669 | | | | 6.66 | % | | | 840,849 | | | | 63,958 | | | | 7.61 | % |
| | | | | | | | | | | | | | | | | | | | | | | | | | | | | | | | | | | | | |
| TOTAL INTEREST EARNING ASSETS | | | 1,148,401 | | | | 64,546 | | | | 5.62 | % | | | 1,086,465 | | | | 68,433 | | | | 6.30 | % | | | 1,023,496 | | | | 72,851 | | | | 7.12 | % |
| | | | | | | | | | | | | | | | | | | | | | | | | | | | | | | | | | | | | |
| Other Assets | | | 92,699 | | | | | | | | | | | | 97,275 | | | | | | | | | | | | 98,389 | | | | | | | | | |
| Less: Allowance for Loan Losses | | | (10,504 | ) | | | | | | | | | | | (9,157 | ) | | | | | | | | | | | (7,745 | ) | | | | | | | | |
| | | | | | | | | | | | | | | | | | | | | | | | | | | | | | | | | | | | | |
| TOTAL ASSETS | | $ | 1,230,596 | | | | | | | | | | | $ | 1,174,583 | | | | | | | | | | | $ | 1,114,140 | | | | | | | | | |
| | | | | | | | | | | | | | | | | | | | | | | | | | | | | | | | | | | | | |
| LIABILITIES AND SHAREHOLDERS’ EQUITY | | | | | | | | | | | | | | | | | | | | | | | | | | | | | | | | | | | | |
| Interest-bearing Demand Deposits | | $ | 245,811 | | | $ | 1,710 | | | | 0.70 | % | | $ | 212,467 | | | $ | 3,439 | | | | 1.62 | % | | $ | 153,033 | | | $ | 3,280 | | | | 2.14 | % |
| Savings Deposits | | | 227,403 | | | | 1,531 | | | | 0.67 | % | | | 209,593 | | | | 3,407 | | | | 1.63 | % | | | 177,001 | | | | 4,858 | | | | 2.74 | % |
| Time Deposits | | | 341,041 | | | | 10,254 | | | | 3.01 | % | | | 359,115 | | | | 14,366 | | | | 4.00 | % | | | 425,878 | | | | 19,151 | | | | 4.50 | % |
| FHLB Advances and Other Borrowings | | | 143,332 | | | | 5,728 | | | | 4.00 | % | | | 138,888 | | | | 5,696 | | | | 4.10 | % | | | 117,084 | | | | 6,357 | | | | 5.43 | % |
| | | | | | | | | | | | | | | | | | | | | | | | | | | | | | | | | | | | | |
| TOTAL INTEREST-BEARING LIABILITIES | | | 957,587 | | | | 19,223 | | | | 2.01 | % | | | 920,063 | | | | 26,908 | | | | 2.92 | % | | | 872,996 | | | | 33,646 | | | | 3.85 | % |
| | | | | | | | | | | | | | | | | | | | | | | | | | | | | | | | | | | | | |
| Demand Deposit Accounts | | | 149,673 | | | | | | | | | | | | 140,962 | | | | | | | | | | | | 133,824 | | | | | | | | | |
| Other Liabilities | | | 13,449 | | | | | | | | | | | | 13,847 | | | | | | | | | | | | 13,643 | | | | | | | | | |
| TOTAL LIABILITIES | | | 1,120,709 | | | | | | | | | | | | 1,074,872 | | | | | | | | | | | | 1,020,463 | | | | | | | | | |
| | | | | | | | | | | | | | | | | | | | | | | | | | | | | | | | | | | | | |
| Shareholders’ Equity | | | 109,887 | | | | | | | | | | | | 99,711 | | | | | | | | | | | | 93,677 | | | | | | | | | |
| | | | | | | | | | | | | | | | | | | | | | | | | | | | | | | | | | | | | |
| TOTAL LIABILITIES AND SHAREHOLDERS’ EQUITY | | $ | 1,230,596 | | | | | | | | | | | $ | 1,174,583 | | | | | | | | | | | $ | 1,114,140 | | | | | | | | | |
| | | | | | | | | | | | | | | | | | | | | | | | | | | | | | | | | | | | | |
| COST OF FUNDS | | | | | | | | | | | 1.67 | % | | | | | | | | | | | 2.48 | % | | | | | | | | | | | 3.29 | % |
| | | | | | | | | | | | | | | | | | | | | | | | | | | | | | | | | | | | | |
| NET INTEREST INCOME | | | | | | $ | 45,323 | | | | | | | | | | | $ | 41,525 | | | | | | | | | | | $ | 39,205 | | | | | |
| | | | | | | | | | | | | | | | | | | | | | | | | | | | | | | | | | | | | |
| NET INTEREST MARGIN | | | | | | | | | | | 3.95 | % | | | | | | | | | | | 3.82 | % | | | | | | | | | | | 3.83 | % |
| (1) | Effective tax rates were determined as though interest earned on the Company’s investments in municipal bonds and loans was fully taxable. |
| (2) | Loans held-for-sale and non-accruing loans have been included in average loans. Interest income on loans includes loan fees of $545, $127, and $806 for 2009, 2008, and 2007, respectively. |
The following table sets forth for the periods indicated a summary of the changes in interest income and interest expense resulting from changes in volume and changes in rates:
Net Interest Income – Rate / Volume Analysis
(Tax-Equivalent basis, dollars in thousands)
| | | 2009 compared to 2008 | | | 2008 compared to 2007 | |
| | | Increase / (Decrease) Due to (1) | | | Increase / (Decrease) Due to (1) | |
| | | Volume | | | Rate | | | Net | | | Volume | | | Rate | | | Net | |
| Interest Income: | | | | | | | | | | | | | | | | | | |
| Federal Funds Sold and Other | | | | | | | | | | | | | | | | | | |
| Short-term Investments | | $ | 87 | | | $ | (574 | ) | | $ | (487 | ) | | $ | 597 | | | $ | (482 | ) | | $ | 115 | |
| Taxable Securities | | | 1,876 | | | | (1,223 | ) | | | 653 | | | | 172 | | | | 843 | | | | 1,015 | |
| Non-taxable Securities | | | 393 | | | | 57 | | | | 450 | | | | (370 | ) | | | 111 | | | | (259 | ) |
| Loans and Leases | | | 705 | | | | (5,208 | ) | | | (4,503 | ) | | | 2,922 | | | | (8,211 | ) | | | (5,289 | ) |
| Total Interest Income | | | 3,061 | | | | (6,948 | ) | | | (3,887 | ) | | | 3,321 | | | | (7,739 | ) | | | (4,418 | ) |
| | | | | | | | | | | | | | | | | | | | | | | | | |
| Interest Expense: | | | | | | | | | | | | | | | | | | | | | | | | |
| Savings and Interest-bearing Demand | | | 747 | | | | (4,352 | ) | | | (3,605 | ) | | | 1,921 | | | | (3,212 | ) | | | (1,291 | ) |
| Time Deposits | | | (693 | ) | | | (3,419 | ) | | | (4,112 | ) | | | (2,808 | ) | | | (1,978 | ) | | | (4,786 | ) |
| FHLB Advances and Other Borrowings | | | 180 | | | | (148 | ) | | | 32 | | | | 1,059 | | | | (1,720 | ) | | | (661 | ) |
| Total Interest Expense | | | 234 | | | | (7,919 | ) | | | (7,685 | ) | | | 172 | | | | (6,910 | ) | | | (6,738 | ) |
| | | | | | | | | | | | | | | | | | | | | | | | | |
| Net Interest Income | | $ | 2,827 | | | $ | 971 | | | $ | 3,798 | | | $ | 3,149 | | | $ | (829 | ) | | $ | 2,320 | |
| (1) | The change in interest due to both rate and volume has been allocated to volume and rate changes in proportion to the relationship of the absolute dollar amounts of the change in each. |
See the Company’s Average Balance Sheet and the discussions headed USES OF FUNDS, SOURCES OF FUNDS, and “RISK MANAGEMENT – Liquidity and Interest Rate Risk Management” for further information on the Company’s net interest income, net interest margin, and interest rate sensitivity position.
PROVISION FOR LOAN LOSSES
The Company provides for loan losses through regular provisions to the allowance for loan losses. The provision is affected by net charge-offs on loans and changes in specific and general allocations required on the allowance for loan losses. Provisions for loan losses totaled $3,750,000, $3,990,000, and $3,591,000 in 2009, 2008, and 2007, respectively.
The level of provision for loan losses declined by $240,000 or 6% during 2009 compared with 2008. The decline in provision during 2009 compared with 2008 was largely the result of a lower level of net charge-offs and a relatively stable level of non-performing loans. During 2009, the provision for loan losses totaled 0.42% of average outstanding loans while net charge-offs represented 0.25% of average loans outstanding. As a result, the Company’s allowance for loan losses increased to 1.25% of total loans at year-end 2009 compared with 1.07% at year-end 2008.
The level of provision increased by $399,000 or 11% in 2008 compared with 2007. The increase in provision was largely attributable to an increased level of non-performing loans in 2008 and overall growth in the Company’s loan portfolio. The level of provision for loan losses totaled 0.45% of average outstanding loans during 2008 while net charge-offs represented 0.29% of average loans outstanding during 2008. Accordingly, the Company’s allowance for loan losses increased to 1.07% of total loans at year-end 2008 compared with 0.93% at year-end 2007.
Provisions for loan losses in all periods were made at a level deemed necessary by management to absorb estimated, probable incurred losses in the loan portfolio. A detailed evaluation of the adequacy of the allowance for loan losses is completed quarterly by management, the results of which are used to determine provisions for loan losses. Management estimates the allowance balance required using past loan loss experience, the nature and volume of the portfolio, information about specific borrower situations and estimated collateral values, economic conditions, and other qualitative factors. Refer also to the sections entitled CRITICAL ACCOUNTING POLICIES AND ESTIMATES and “RISK MANAGEMENT – Lending and Loan Administration” for further discussion of the provision and allowance for loan losses.
NON-INTEREST INCOME
During 2009, Non-interest Income decreased $2,351,000 or 13% compared with 2008 and during 2008 increased $2,506,000 or 16% compared with 2007.
| | | | | | | | | | | | % Change From | |
| Non-interest Income (dollars in thousands) | | Years Ended December 31, | | | Prior Year | |
| | | 2009 | | | 2008 | | | 2007 | | | 2009 | | | 2008 | |
| Trust and Investment Product Fees | | $ | 1,617 | | | $ | 2,288 | | | $ | 2,590 | | | | (29 | )% | | | (12 | )% |
| Service Charges on Deposit Accounts | | | 4,395 | | | | 4,920 | | | | 4,361 | | | | (11 | ) | | | 13 | |
| Insurance Revenues | | | 5,296 | | | | 6,306 | | | | 5,794 | | | | (16 | ) | | | 9 | |
| Company Owned Life Insurance | | | 1,104 | | | | 791 | | | | 823 | | | | 40 | | | | (4 | ) |
| Other Operating Income | | | 2,110 | | | | 2,412 | | | | 1,994 | | | | (13 | ) | | | 21 | |
| Subtotal | | | 14,522 | | | | 16,717 | | | | 15,562 | | | | (13 | ) | | | 7 | |
| Net Gains on Sales of Loans and Related Assets | | | 1,760 | | | | 1,399 | | | | 822 | | | | 26 | | | | 70 | |
| Net Gain (Loss) on Securities | | | (423 | ) | | | 94 | | | | (680 | ) | | | n/m | (1) | | | n/m | (1) |
| TOTAL NON-INTEREST INCOME | | $ | 15,859 | | | $ | 18,210 | | | $ | 15,704 | | | | (13 | ) | | | 16 | |
(1) n/m = not meaningful
Trust and Investment Product Fees totaled $1,617,000 during the year ended December 31, 2009 representing a decline of $671,000 or 29% from 2008, following a decline of $302,000 or 12% during 2008 as compared to 2007. These changes were driven by varying levels of brokerage commission revenue. During 2009, the decline in brokerage commission revenue was largely attributable to continued difficult market conditions, changes in customers’ investment preferences, and internal reorganizations including a change in the Company’s broker dealer relationship for retail investment products.
Service Charges on Deposit Accounts totaled $4,395,000 during the year ended December 31, 2009 representing a decline of 11% due in large part to less customer utilization of the Company’s overdraft protection program. During 2008, Service Charges on Deposit Accounts increased of $559,000 or 13% over 2007. The increase was attributable to a combination of increased gross fees and a reduced level of refunded and waived fees.
During the year ended December 31, 2009, Insurance Revenues totaled $5,296,000 which was a decline of $1,010,000 or 16% compared to 2008. The decline was largely attributable to decreases in contingency revenue and lower levels of commercial insurance revenues in the Company’s property and casualty insurance subsidiary. During 2008, Insurance Revenues increased $512,000 or 9% compared to 2007. The increase was primarily the result of an increase in contingency revenue at the Company’s property and casualty insurance subsidiary.
During the year ended December 31, 2009, the net gain on sale of residential loans totaled $1,760,000, an increase of $361,000 or 26% over the gain of $1,399,000 recognized during 2008 following an increase of $577,000 or 70% in 2008 compared with 2007. The increases in both 2009 and 2008 were largely attributable to higher levels of residential loan sales during 2009 compared with 2008 and during 2008 compared with 2007. Loan sales for 2009, 2008, and 2007 totaled $143.6 million, $108.0 million, and $66.9 million, respectively.
During 2009, the Company recognized a net loss on securities of $423,000 related to the recognition of other-than-temporary impairment charges on the Company’s portfolio of non-controlling investments in other banking organizations. The Company recognized a net gain on securities of $94,000 during the year ended December 31, 2008. The Company recognized gains on securities sold of $1,031,000 during 2008 and other-than-temporary impairment expense of $937,000 on its portfolio of non-controlling investments in other banking organizations. During 2007, the Company recognized a $680,000 net loss on securities related to its portfolio of non-controlling investments in other banking organizations. The net loss resulted from the sale of one of the investment holdings at a modest gain and the recognition of an other-than-temporary impairment charge in connection with the valuation of other holdings within the portfolio.
NON-INTEREST EXPENSE
During the year ended December 31, 2009, Non-interest Expense totaled $40,391,000, an increase of $3,675,000 or 10% from the year ended 2008. During 2008, Non-interest Expense declined $505,000 or 1% as compared with 2007.
| | | | | | | | | | | | % Change From | |
| Non-interest Expense (dollars in thousands) | | Years Ended December 31, | | | Prior Year | |
| | | 2009 | | | 2008 | | | 2007 | | | 2009 | | | 2008 | |
| Salaries and Employee Benefits | | $ | 21,961 | | | $ | 20,786 | | | $ | 21,671 | | | | 6 | % | | | (4 | )% |
| Occupancy, Furniture and Equipment Expense | | | 6,035 | | | | 5,677 | | | | 5,379 | | | | 6 | | | | 6 | |
| FDIC Premiums | | | 1,863 | | | | 209 | | | | 103 | | | | 791 | | | | 103 | |
| Data Processing Fees | | | 1,368 | | | | 1,493 | | | | 1,370 | | | | (8 | ) | | | 9 | |
| Professional Fees | | | 1,740 | | | | 1,670 | | | | 1,418 | | | | 4 | | | | 18 | |
| Advertising and Promotion | | | 993 | | | | 1,078 | | | | 957 | | | | (8 | ) | | | 13 | |
| Supplies | | | 528 | | | | 570 | | | | 625 | | | | (7 | ) | | | (9 | ) |
| Intangible Amortization | | | 909 | | | | 889 | | | | 894 | | | | 2 | | | | (1 | ) |
| Other Operating Expenses | | | 4,994 | | | | 4,344 | | | | 4,804 | | | | 15 | | | | (10 | ) |
| TOTAL NON-INTEREST EXPENSE | | $ | 40,391 | | | $ | 36,716 | | | $ | 37,221 | | | | 10 | | | | (1 | ) |
Salaries and Employee Benefits totaled $21,961,000 during the year ended December 31, 2009 representing an increase of $1,175,000 or 6% from the year ended December 31, 2008. The increase was attributable to increased costs associated with the Company’s partially self-insured health insurance plan. Salaries and Employee Benefits expense declined $885,000 or 4% during 2008 compared with 2007. The decline was largely attributable to a decrease of approximately 28 full-time equivalent employees, or 7% of total FTEs, during the year ended December 31, 2008 compared with year ended 2007.
Occupancy, Furniture and Equipment Expense totaled $6,035,000 during the year ended December 31, 2009 representing an increase of $358,000 or 6% from the year ended 2008. The increase was attributable to depreciation expense associated with renovations to existing branch facilities and upgrades to and purchases of information technology systems. Occupancy, Furniture and Equipment Expense increased $298,000 or 6% during 2008 compared with 2007 largely the result of higher levels of furniture, fixtures and equipment depreciation.
The Company’s FDIC deposit insurance assessments totaled $1,863,000 representing an increase of 791% during the year-ended December 31, 2009 compared with 2008. This increase resulted from an industry-wide increase in quarterly assessments as the FDIC began to recapitalize the deposit insurance fund, in addition to an industry wide special assessment in the second quarter of 2009 of approximately $550,000 which represented 5 basis points of the Company’s subsidiary bank’s total assets less Tier 1 Capital. FDIC premiums increased $106,000 or 103% during 2008 compared with 2007.
Other Operating Expenses totaled $4,994,000 during 2009, an increase of $650,000 or 15% from 2008. The increase during 2009 was largely attributable to an increased level of loan collection costs and amortization expense related to a new market tax credit project in which the Company invested in the fourth quarter of 2009. Other Operating Expenses decreased $460,000 or 10% during 2008 compared with 2007. The decline in costs was primarily attributable to a lower level of collection costs and a lower level of losses associated with fraudulent ATM and debit card transactions.
PROVISION FOR INCOME TAXES
The Company records a provision for current income taxes payable, along with a provision for deferred taxes payable in the future. Deferred taxes arise from temporary differences, which are items recorded for financial statement purposes in a different period than for income tax returns. The Company’s effective tax rate was 24.7%, 30.6%, and 30.4%, respectively, in 2009, 2008, and 2007. The effective tax rate in all periods is lower than the blended statutory rate of 39.6%. The lower effective rate in all periods primarily resulted from the Company’s tax-exempt investment income on securities, loans, and company owned life insurance, income tax credits generated by investments in affordable housing projects, and income generated by subsidiaries domiciled in a state with no state or local income tax. In addition, during 2009 the Company’s effective tax rate was reduced as a result of tax credits attributable to a new markets tax credit in which the Company invested in 2009. See Note 10 to the Company’s consolidated financial statements included in Item 8 of this Report for additional details relative to the Company’s income tax provision.
The Company and its affiliate bank are subject to regulatory capital requirements administered by federal banking agencies. Capital adequacy guidelines and prompt corrective action regulations involve quantitative measures of assets, liabilities, and certain off-balance sheet items calculated under regulatory accounting practices. The prompt corrective action regulations provide five classifications, including well-capitalized, adequately capitalized, undercapitalized, significantly undercapitalized and critically undercapitalized, although these terms are not used to represent overall financial condition. The Company and its affiliate bank at year-end 2009 were categorized as well-capitalized as that term is defined by applicable regulations. See Note 8 to the Company’s consolidated financial statements included in Item 8 of this Report for actual and required capital ratios and for additional information regarding capital adequacy.
The Company continues to maintain a strong capital position. Shareholders’ equity totaled $113.5 million and $105.2 million at December 31, 2009 and 2008, respectively. Total equity represented 9.1% and 8.8%, respectively, of year-end 2009 and 2008 total assets. The Company paid cash dividends of $6.2 million or $0.56 per share in 2009 and 2008. The increase in shareholders’ equity during 2009 compared with 2008 was primarily the result of increased retained earnings of $6.0 million and a change in the unrealized gain on available-for-sale securities of $1.9 million.
On April 30, 2009, the Company issued $19.3 million of 8% redeemable subordinated debentures that will mature in a single payment of principal on March 30, 2019 for gross proceeds to the Company (before offering expenses) of $19.3 million. The Company has the right to redeem the debentures without penalty or premium on or after March 30, 2012 subject to prior consultation with the Federal Reserve Board. The entire principal amount was includable in the Company’s Tier 2 regulatory capital under banking agency regulatory standards at December 31, 2009.
LOANS
Total loans at year-end 2009 decreased $13.0 million or 1% compared with year-end 2008. Commercial and industrial loans increased $13.1 million or 7% and commercial real estate loans increased $4.9 million or 1% during 2009 while agricultural loans decreased $3.1 million or 2%, consumer loans decreased $12.6 million or 10%, and residential mortgage loans decreased $15.3 million or 15% during 2009. The decline in the residential loan portfolio was the result of historically low market interest rates during 2009 that spurred refinancing activity. The Company continued to actively originate residential mortgage loans, with the vast majority of production being sold into the secondary market.
Total loans at year-end 2008 increased $21.9 million or 3% compared with year-end 2007. Commercial and industrial loans increased $17.3 million or 11% and commercial real estate loans increased $30.9 million or 10% during 2008, while agricultural loans decreased $5.7 million or 3%, residential mortgage loans decreased $16.8 million or 14%, and consumer loans declined $3.8 million or 3% during 2008. The decrease in residential mortgage loans was the result of a declining interest rate environment during 2008 and the sale of the majority of the Company’s fixed rate residential mortgage production into the secondary market rather than hold in its portfolio.
The composition of the loan portfolio has remained relatively stable over the past several years including 2009. The portfolio is most heavily concentrated in commercial real estate loans at 38% of the portfolio. While this is the largest component of total portfolio, the Company has only limited exposure in construction and development lending with this segment representing approximately 2% of the total loan portfolio. In addition, the Company’s exposure to non-owner occupied commercial real estate is limited to 16% of the total loan portfolio at year-end 2009. The Company’s commercial lending is extended to various industries, including hotel, agribusiness and manufacturing, as well as health care, wholesale, and retail services.
| Loan Portfolio | | December 31, | |
| (dollars in thousands) | | 2009 | | | 2008 | | | 2007 | | | 2006 | | | 2005 | |
| | | | | | | | | | | | | | | | |
| Commercial and Industrial Loans | | $ | 188,962 | | | $ | 175,828 | | | $ | 158,556 | | | $ | 158,502 | | | $ | 157,646 | |
| Commercial Real Estate Loans | | | 334,255 | | | | 329,363 | | | | 298,477 | | | | 243,783 | | | | 162,035 | |
| Agricultural Loans | | | 156,845 | | | | 159,923 | | | | 165,592 | | | | 148,872 | | | | 101,355 | |
| Consumer Loans | | | 114,736 | | | | 127,343 | | | | 131,110 | | | | 132,791 | | | | 129,587 | |
| Residential Mortgage Loans | | | 84,677 | | | | 100,054 | | | | 116,908 | | | | 114,687 | | | | 102,891 | |
| Total Loans | | | 879,475 | | | | 892,511 | | | | 870,643 | | | | 798,635 | | | | 653,514 | |
| Less: Unearned Income | | | (1,653 | ) | | | (2,075 | ) | | | (2,922 | ) | | | (2,376 | ) | | | (1,558 | ) |
| Subtotal | | | 877,822 | | | | 890,436 | | | | 867,721 | | | | 796,259 | | | | 651,956 | |
| Less: Allowance for Loan Losses | | | (11,016 | ) | | | (9,522 | ) | | | (8,044 | ) | | | (7,129 | ) | | | (9,265 | ) |
| Loans, Net | | $ | 866,806 | | | $ | 880,914 | | | $ | 859,677 | | | $ | 789,130 | | | $ | 642,691 | |
| | | | | | | | | | | | | | | | | | | | | |
| Ratio of Loans to Total Loans | | | | | | | | | | | | | | | | | | | | |
| Commercial and Industrial Loans | | | 21 | % | | | 20 | % | | | 18 | % | | | 20 | % | | | 24 | % |
| Commercial Real Estate Loans | | | 38 | % | | | 37 | % | | | 35 | % | | | 30 | % | | | 25 | % |
| Agricultural Loans | | | 18 | % | | | 18 | % | | | 19 | % | | | 19 | % | | | 15 | % |
| Consumer Loans | | | 13 | % | | | 14 | % | | | 15 | % | | | 17 | % | | | 20 | % |
| Residential Mortgage Loans | | | 10 | % | | | 11 | % | | | 13 | % | | | 14 | % | | | 16 | % |
| Total Loans | | | 100 | % | | | 100 | % | | | 100 | % | | | 100 | % | | | 100 | % |
The Company’s policy is generally to extend credit to consumer and commercial borrowers in its primary geographic market area in Southern Indiana. Commercial extensions of credit outside this market area are generally concentrated in real estate loans within a 120 mile radius of the Company’s primary market and are granted on a selective basis. These out-of-market credits include participations that the Company may purchase from time to time in loans that are originated by banks in which the Company owns (or previously owned) non-controlling common stock investments.
The following table indicates the amounts of loans (excluding residential mortgages on 1-4 family residences and consumer loans) outstanding as of December 31, 2009, which, based on remaining scheduled repayments of principal, are due in the periods indicated (dollars in thousands).
| | | Within | | | One to Five | | | After | | | | |
| | | One Year | | | Years | | | Five Years | | | Total | |
| | | | | | | | | | | | | |
| Commercial and Agricultural | | $ | 299,615 | | | $ | 294,346 | | | $ | 86,101 | | | $ | 680,062 | |
| | | Interest Sensitivity | | | | | | | |
| | | Fixed Rate | | | Variable Rate | | | | | | | |
| | | | | | | | | | | | | |
| Loans maturing after one year | | $ | 120,821 | | | $ | 259,626 | | | | | | | | | |
INVESTMENTS
The investment portfolio is a principal source for funding the Company’s loan growth and other liquidity needs of its subsidiaries. The Company’s securities portfolio consists of money market securities, uncollateralized federal agency securities, municipal obligations of state and political subdivisions, and mortgage-backed securities issued by U.S. government agencies. Money market securities include federal funds sold, interest-bearing balances with banks, and other short-term investments. The composition of the year-end balances in the investment portfolio is presented in Note 2 to the Company’s consolidated financial statements included in Item 8 of this Report and in the table below:
| Investment Portfolio, at Amortized Cost | | December 31, | |
| (dollars in thousands) | | 2009 | | | % | | | 2008 | | | % | | | 2007 | | | % | |
| | | | | | | | | | | | | | | | | | | |
| Federal Funds Sold and Short-term Investments | | $ | 12,002 | | | | 5 | % | | $ | 27,791 | | | | 14 | % | | $ | 2,631 | | | | 2 | % |
| U.S. Treasury and Agency Securities | | | 5,000 | | | | 2 | | | | — | | | | — | | | | 25,306 | | | | 16 | |
| Obligations of State and Political Subdivisions | | | 24,285 | | | | 9 | | | | 19,887 | | | | 10 | | | | 15,851 | | | | 10 | |
| Mortgage-backed Securities | | | 214,591 | | | | 83 | | | | 151,499 | | | | 74 | | | | 105,302 | | | | 69 | |
| Equity Securities | | | 2,818 | | | | 1 | | | | 3,620 | | | | 2 | | | | 4,557 | | | | 3 | |
| Total Securities Portfolio | | $ | 258,696 | | | | 100 | % | | $ | 202,797 | | | | 100 | % | | $ | 153,647 | | | | 100 | % |
The amortized cost of investment securities, including federal funds sold and short-term investments, increased $55.9 million at year-end 2009 compared with year-end 2008 and increased $49.2 million at year-end 2008 compared with year-end 2007. The increase in the portfolio during 2009 and 2008 was largely due to the growth of the Company’s core deposit base at a greater pace than the Company’s loan portfolio.
The largest concentration in the investment portfolio continues to be in mortgage related securities representing 83% of the total securities portfolio at December 31, 2009. The Company’s level of obligations of state and political subdivisions increased to $24.3 million or 9% of the portfolio at December 31, 2009.
The Company’s equity securities portfolio at year-end 2009 consisted of non-controlling common stock investments in three unaffiliated banking companies. The decline in the amortized cost of equity securities at December 31, 2009 compared with December 31, 2008 was largely related to $423,000 of other-than-temporary impairment charges recognized on the Company’s equity securities portfolio during 2009. In addition, the decline was attributable to the sale of the holdings in another unaffiliated banking company during 2009.
Investment Securities, at Carrying Value
(dollars in thousands)
| | | December 31, | |
| | | 2009 | | | 2008 | | | 2007 | |
| Securities Held-to-Maturity | | | | | | | | | |
| Obligations of State and Political Subdivisions | | $ | 2,774 | | | $ | 3,326 | | | $ | 4,464 | |
| | | | | | | | | | | | | |
| Securities Available-for-Sale | | | | | | | | | | | | |
| U.S. Treasury and Agency Securities | | $ | 4,970 | | | $ | — | | | $ | 25,739 | |
| Obligations of State and Political Subdivisions | | | 22,378 | | | | 16,868 | | | | 11,602 | |
| Mortgage-backed Securities | | | 221,252 | | | | 155,627 | | | | 105,489 | |
| Equity Securities | | | 2,340 | | | | 3,345 | | | | 5,470 | |
| Subtotal of Securities Available-for-Sale | | | 250,940 | | | | 175,840 | | | | 148,300 | |
| | | | | | | | | | | | | |
| Total Securities | | $ | 253,714 | | | $ | 179,166 | | | $ | 152,764 | |
The Company’s $250.9 million available-for-sale portion of the investment portfolio provides an additional funding source for the liquidity needs of the Company’s subsidiaries and for asset/liability management requirements. Although management has the ability to sell these securities if the need arises, their designation as available-for-sale should not necessarily be interpreted as an indication that management anticipates such sales.
The amortized cost of debt securities at December 31, 2009 are shown in the following table by expected maturity. Mortgage-backed securities are based on estimated average lives. Expected maturities will differ from contractual maturities because issuers may have the right to call or prepay obligations. Equity securities do not have contractual maturities, and are excluded from the table below.
Maturities and Average Yields of Securities at December 31, 2009
(dollars in thousands)
| | | Within | | | After One But | | | After Five But | | | After Ten | |
| | | One Year | | | Within Five Years | | | Within Ten Years | | | Years | |
| | | Amount | | | Yield | | | Amount | | | Yield | | | Amount | | | Yield | | | Amount | | | Yield | |
| U.S. Treasuries and | | | | | | | | | | | | | | | | | | | | | | | | |
| Agencies | | $ | — | | | | N/A | | | $ | 5,000 | | | | 3.20 | % | | $ | — | | | | N/A | | | $ | — | | | | N/A | |
| State and Political | | | | | | | | | | | | | | | | | | | | | | | | | | | | | | | | |
| Subdivisions | | | 2,040 | | | | 8.20 | % | | | 4,065 | | | | 6.82 | % | | | 5,550 | | | | 5.72 | % | | | 12,630 | | | | 7.37 | % |
| Mortgage-backed | | | | | | | | | | | | | | | | | | | | | | | | | | | | | | | | |
| Securities | | | 12,615 | | | | 5.28 | % | | | 171,016 | | | | 4.63 | % | | | 30,735 | | | | 3.64 | % | | | 225 | | | | 3.88 | % |
| | | | | | | | | | | | | | | | | | | | | | | | | | | | | | | | | |
| Total Securities | | $ | 14,655 | | | | 5.69 | % | | $ | 180,081 | | | | 4.64 | % | | $ | 36,285 | | | | 3.96 | % | | $ | 12,855 | | | | 7.31 | % |
A tax-equivalent adjustment using a tax rate of 34 percent was used in the above table.
In addition to the other uses of funds discussed previously, the Company had certain long-term contractual obligations as of December 31, 2009. These contractual obligations primarily consisted of long-term borrowings with the FHLB, JPMorgan Chase Bank N.A., and subordinated debentures issued during 2009 through a shareholders’ rights offering, time deposits, and lease commitments for certain office facilities. Scheduled principal payments on long-term borrowings, time deposits, and future minimum lease payments are outlined in the table below.
| Contractual Obligations | | Payments Due By Period | |
| (dollars in thousands) | | Total | | | Less Than 1 Year | | | 1-3 Years | | | 3-5 Years | | | More Than 5 Years | |
| | | | | | | | | | | | | | | | |
| Long-term Borrowings | | $ | 112,619 | | | $ | 30,787 | | | $ | 23,063 | | | $ | 28,075 | | | $ | 30,694 | |
| Time Deposits | | | 329,676 | | | | 109,685 | | | | 209,160 | | | | 10,466 | | | | 365 | |
| Capital Lease Obligation | | | 1,427 | | | | 81 | | | | 162 | | | | 162 | | | | 1,022 | |
| Operating Lease Commitments | | | 1,745 | | | | 256 | | | | 289 | | | | 166 | | | | 1,034 | |
| Total Contractual Obligations | | $ | 445,467 | | | $ | 140,809 | | | $ | 232,674 | | | $ | 38,869 | | | $ | 33,115 | |
The Company’s primary source of funding is its base of core customer deposits. Core deposits consist of demand deposits, savings, interest-bearing checking, money market accounts, and certificates of deposit of less than $100,000. Other sources of funds are certificates of deposit of $100,000 or more, brokered deposits, overnight borrowings from other financial institutions and securities sold under agreement to repurchase. The membership of the Company’s affiliate bank in the Federal Home Loan Bank System (FHLB) provides a significant additional source for both long and short-term collateralized borrowings. In addition, the Company, as a separate and distinct corporation from its bank and other subsidiaries, also has the ability to borrow funds from other financial institutions and to raise debt or equity capital from the capital markets and other sources. The following pages contain a discussion of changes in these areas.
The table below illustrates changes between years in the average balances of all funding sources:
| Funding Sources - Average Balances | | | | | | | | | | | % Change From | |
| (dollars in thousands) | | December 31, | | | Prior Year | |
| | | 2009 | | | 2008 | | | 2007 | | | 2009 | | | 2008 | |
| Demand Deposits | | | | | | | | | | | | | | | |
| Non-interest-bearing | | $ | 149,673 | | | $ | 140,962 | | | $ | 133,824 | | | | 6 | % | | | 5 | % |
| Interest-bearing | | | 245,811 | | | | 212,467 | | | | 153,033 | | | | 16 | | | | 39 | |
| Savings Deposits | | | 63,182 | | | | 57,948 | | | | 57,266 | | | | 9 | | | | 1 | |
| Money Market Accounts | | | 164,221 | | | | 151,645 | | | | 119,735 | | | | 8 | | | | 27 | |
| Other Time Deposits | | | 251,906 | | | | 258,314 | | | | 283,994 | | | | (2 | ) | | | (9 | ) |
| Total Core Deposits | | | 874,793 | | | | 821,336 | | | | 747,852 | | | | 7 | | | | 10 | |
| Certificates of Deposits of $100,000 or | | | | | | | | | | | | | | | | | | | | |
| more and Brokered Deposits | | | 89,135 | | | | 100,801 | | | | 141,884 | | | | (12 | ) | | | (29 | ) |
| FHLB Advances and | | | | | | | | | | | | | | | | | | | | |
| Other Borrowings | | | 143,332 | | | | 138,888 | | | | 117,084 | | | | 3 | | | | 19 | |
| Total Funding Sources | | $ | 1,107,260 | | | $ | 1,061,025 | | | $ | 1,006,820 | | | | 4 | | | | 5 | |
Maturities of certificates of deposit of $100,000 or more are summarized as follows:
(dollars in thousands)
| | | 3 Months | | | 3 thru | | | 6 thru | | | Over | | | | |
| | | Or Less | | | 6 Months | | | 12 Months | | | 12 Months | | | Total | |
| | | | | | | | | | | | | | | | |
| December 31, 2009 | | $ | 10,059 | | | $ | 6,177 | | | $ | 5,873 | | | $ | 41,167 | | | $ | 63,276 | |
CORE DEPOSITS
The Company’s overall level of average core deposits increased approximately 7% during 2009 following a 10% increase during 2008. The Company’s ability to attract core deposits continues to be influenced by competition and the interest rate environment, as well as the increased availability of alternative investment products. Core deposits continue to represent a stable and viable funding source for the Company’s operations. Core deposits represented 79% of average total funding sources during 2009 compared with 77% during 2008 and 74% during 2007.
Demand, savings, and money market deposits have provided a growing source of funding for the Company in each of the periods reported. Average demand, savings, and money market deposits increased 11% during 2009 following a 21% increase in 2008. Average demand, savings, and money market deposits totaled $622.9 million or 71% of core deposits (56% of total funding sources) in 2009 compared with $563.0 million or 69% of core deposits (53% of total funding sources) in 2008 and $463.9 million or 62% of core deposits (46% of total funding sources) in 2007.
Other time deposits consist of certificates of deposits in denominations of less than $100,000. These deposits declined by 2% during 2009 following a decrease of 9% in 2008. Other time deposits comprised 29% of core deposits in 2009, 31% in 2008 and 38% in 2007.
OTHER FUNDING SOURCES
Federal Home Loan Bank advances and other borrowings represent the Company’s most significant source of other funding. Average borrowed funds increased $4.4 million or 3% during 2009 following an increase of $21.8 million or 19% in 2008. Borrowings comprised approximately 13% of average total funding sources in 2009 and 2008 and 12% in 2007.
Certificates of deposits in denominations of $100,000 or more and brokered deposits are an additional source of other funding for the Company’s bank subsidiary. Large denomination certificates and brokered deposits decreased $11.7 million or 12% during 2009 following a decline of $41.1 million or 29% during 2008. Large certificates and brokered deposits comprised approximately 8% of average total funding sources in 2009, 10% in 2008 and 14% in 2007. This type of funding is used as both long-term and short-term funding sources.
The bank subsidiary of the Company also utilizes short-term funding sources from time to time. These sources consist of overnight federal funds purchased from other financial institutions, secured repurchase agreements that generally mature within one day of the transaction date, and secured overnight variable rate borrowings from the FHLB. These borrowings represent an important source of short-term liquidity for the Company’s bank subsidiary. Long-term debt at the Company’s bank subsidiary is in the form of FHLB advances, which are secured by the pledge of certain investment securities, residential and housing-related mortgage loans, and certain other commercial real estate loans. See Note 7 to the Company’s consolidated financial statements included in Item 8 of this Report for further information regarding borrowed funds.
PARENT COMPANY FUNDING SOURCES
The parent company is a corporation separate and distinct from its bank and other subsidiaries. For information regarding the financial condition, result of operations, and cash flows of the Company, presented on a parent-company-only basis, see Note 16 to the Company’s consolidated financial statements included in Item 8 of this Report.
The Company uses funds at the parent company level to pay dividends to its shareholders, to acquire or make other investments in other businesses or their securities or assets, to repurchase its stock from time to time, and for other general corporate purposes. The parent company does not have access at the parent-company level to the deposits and certain other sources of funds that are available to its bank subsidiary to support its operations. Instead, the parent company has historically derived most of its revenues from dividends paid to the parent company by its bank subsidiary. The Company’s banking subsidiary is subject to statutory restrictions on its ability to pay dividends to the parent company. The parent company has in recent years supplemented the dividends received from its subsidiaries with borrowings, which are discussed in detail below.
At year-end 2009, the Company had borrowing obligations with JPMorgan Chase Bank, N.A. (the “Lender”) in the form a $10 million Subordinated Debenture, a $10 million Term Note and a $10 million Revolving Note. The Company's obligations under the Term Note and Revolving Note are secured by a pledge of all of the Company's stock in its sole depository institution subsidiary, German American Bancorp, pursuant to a pledge agreement.
The subordinated loan established under the Restated Agreement is evidenced by a subordinated debenture in the principal amount of $10 million, and matures in a single installment of principal on January 1, 2014. Interest is payable quarterly on the outstanding principal balance.
The term loan matures on the following schedule: $1.0 million principal amount was payable on January 1, 2008 and $1.5 million payable on January 1 of each of the years 2009 through 2014, inclusive. Interest is payable quarterly on the outstanding principal balance, and the balance was $6.0 million at year-end 2009 (the $1.5 million principal payment due January 1, 2010 was made in late December 2009).
The revolving note matures September 30, 2010, with the interest rate payable by the Company to the Lender in respect of LIBOR-based advances is LIBOR plus 300 basis points, and includes a provision for a non-refundable fee on the unused portion of the maximum amount available under the line of credit of 35 basis points per annum, due quarterly in arrears. At December 31, 2009, there was no outstanding balance on the revolving note.
The Company made certain representations and warranties to the Lender, and agreed to comply with certain affirmative and negative covenants with the Lender. Among the affirmative covenants are provisions requiring that (a) the Company maintain the capital ratios of the Company and of its subsidiary bank(s) at levels that would be considered “well-capitalized” under the prompt corrective action regulations of the federal banking agencies, and (b) the Company maintain a consolidated ratio of (i) the sum of its non-performing loans plus other real estate owned (real estate that is neither used in the ordinary course of the business of the Company or its subsidiaries nor held for future use) (OREO) to (ii) the sum of the Company's loans plus OREO, of not greater than 3.25%. At December 31, 2009, this ratio was 1.27%.
On April 30, 2009, the Company issued $19.3 million of 8% redeemable subordinated debentures that will mature in a single payment of principal on March 30, 2019 for gross proceeds to the Company (before offering expenses) of $19.3 million. The Company has the right to redeem the debentures without penalty or premium on or after March 30, 2012 subject to prior consultation with the Federal Reserve Board. The entire principal amount was includable in the Company’s Tier 2 regulatory capital under banking agency regulatory standards at December 31, 2009.
See Note 7 to the Company’s consolidated financial statements included in Item 8 of this Report for further information regarding the parent company borrowed funds.
The Company is exposed to various types of business risk on an on-going basis. These risks include credit risk, liquidity risk and interest rate risk. Various procedures are employed at the Company’s affiliate banks to monitor and mitigate risk in the loan and investment portfolios, as well as risks associated with changes in interest rates. Following is a discussion of the Company’s philosophies and procedures to address these risks.
LENDING AND LOAN ADMINISTRATION
Primary responsibility and accountability for day-to-day lending activities rests with the Company’s subsidiary bank. Loan personnel at the subsidiary bank have the authority to extend credit under guidelines approved by the bank’s board of directors. The executive loan committee serves as a vehicle for communication and for the pooling of knowledge, judgment and experience of its members. The committee provides valuable input to lending personnel, acts as an approval body, and monitors the overall quality of the bank’s loan portfolio. The Corporate Credit Risk Management Committee, comprised of members of the Company’s and its subsidiary bank’s executive officers and board of directors, strives to ensure a consistent application of the Company’s lending policies. The Company also maintains a comprehensive risk-grading and loan review program, which includes quarterly reviews of problem loans, delinquencies and charge-offs. The purpose of this program is to evaluate loan administration, credit quality, loan documentation and the adequacy of the allowance for loan losses.
The Company maintains an allowance for loan losses to cover probable, incurred credit losses identified during its loan review process. Management estimates the required level of allowance for loan losses using past loan loss experience, the nature and volume of the portfolio, information about specific borrower situations and estimated collateral values, economic conditions, and other factors. Allocations of the allowance may be made for specific loans, but the entire allowance is available for any loan that, in management’s judgment, should be charged-off. Loan losses are charged against the allowance when management believes the uncollectibility of a loan balance is confirmed.
The allowance for loan losses is comprised of: (a) specific reserves on individual credits; (b) general reserves for certain loan categories and industries, and overall historical loss experience; and (c) unallocated reserves based on performance trends in the loan portfolios, current economic conditions, and other factors that influence the level of estimated probable losses. The need for specific reserves are considered for credits when: (a) the customer’s cash flow or net worth appears insufficient to repay the loan; (b) the loan has been criticized in a regulatory examination; (c) the loan is on non-accrual; or, (d) other reasons where the ultimate collectibility of the loan is in question, or the loan characteristics require special monitoring.
| Allowance for Loan Losses | | | |
| (dollars in thousands) | | Years Ended December 31, | |
| | | 2009 | | | 2008 | | | 2007 | | | 2006 | | | 2005 | |
| Balance of Allowance for Possible | | | | | | | | | | | | | | | |
| Losses at Beginning of Period | | $ | 9,522 | | | $ | 8,044 | | | $ | 7,129 | | | $ | 9,265 | | | $ | 8,801 | |
| | | | | | | | | | | | | | | | | | | | | |
| Loans Charged-off: | | | | | | | | | | | | | | | | | | | | |
| Commercial and Industrial Loans | | | 941 | | | | 148 | | | | 506 | | | | 870 | | | | 539 | |
| Commercial Real Estate Loans | | | 1,248 | | | | 2,005 | | | | 1,601 | | | | 2,187 | | | | 739 | |
| Agricultural Loans | | | — | | | | 28 | | | | 360 | | | | — | | | | 3 | |
| Consumer Loans | | | 640 | | | | 686 | | | | 508 | | | | 706 | | | | 624 | |
| Residential Mortgage Loans | | | 345 | | | | 257 | | | | 269 | | | | 185 | | | | 238 | |
| Total Loans Charged-off | | | 3,174 | | | | 3,124 | | | | 3,244 | | | | 3,948 | | | | 2,143 | |
| | | | | | | | | | | | | | | | | | | | | |
| Recoveries of Previously Charged-off Loans: | | | | | | | | | | | | | | | | | | | | |
| Commercial and Industrial Loans | | | — | | | | 49 | | | | 53 | | | | 78 | | | | 120 | |
| Commercial Real Estate Loans | | | 588 | | | | 285 | | | | 270 | | | | 35 | | | | 85 | |
| Agricultural Loans | | | 17 | | | | — | | | | 55 | | | | 30 | | | | 53 | |
| Consumer Loans | | | 192 | | | | 267 | | | | 172 | | | | 226 | | | | 149 | |
| Residential Mortgage Loans | | | 121 | | | | 11 | | | | 18 | | | | 34 | | | | 58 | |
| Total Recoveries | | | 918 | | | | 612 | | | | 568 | | | | 403 | | | | 465 | |
| | | | | | | | | | | | | | | | | | | | | |
| Net Loans Recovered (Charged-off) | | | (2,256 | ) | | | (2,512 | ) | | | (2,676 | ) | | | (3,545 | ) | | | (1,678 | ) |
| Additions to Allowance Charged to Expense | | | 3,750 | | | | 3,990 | | | | 3,591 | | | | 925 | | | | 1,903 | |
| Allowance from Acquired Subsidiary | | | — | | | | — | | | | — | | | | 484 | | | | 239 | |
| Balance at End of Period | | $ | 11,016 | | | $ | 9,522 | | | $ | 8,044 | | | $ | 7,129 | | | $ | 9,265 | |
| | | | | | | | | | | | | | | | | | | | | |
| Net Charge-offs to Average Loans Outstanding | | | 0.25 | % | | | 0.29 | % | | | 0.32 | % | | | 0.50 | % | | | 0.26 | % |
| Provision for Loan Losses to Average Loans Outstanding | | | 0.42 | % | | | 0.45 | % | | | 0.43 | % | | | 0.13 | % | | | 0.30 | % |
| Allowance for Loan Losses to Total Loans at Year-end | | | 1.25 | % | | | 1.07 | % | | | 0.93 | % | | | 0.90 | % | | | 1.42 | % |
| | | | | | | | | | | | | | | | | | | | | |
| The following table indicates the breakdown of the allowance for loan losses for the periods indicated (dollars in thousands): | |
| | | | | | | | | | | | | | | | | | | | | |
| Commercial and Industrial Loans | | $ | 2,146 | | | $ | 2,476 | | | $ | 1,830 | | | $ | 1,799 | | | $ | 2,570 | |
| Commercial Real Estate Loans | | | 6,477 | | | | 4,909 | | | | 4,068 | | | | 3,365 | | | | 3,916 | |
| Agricultural Loans | | | 872 | | | | 1,258 | | | | 1,343 | | | | 971 | | | | 822 | |
| Consumer Loans | | | 520 | | | | 481 | | | | 483 | | | | 602 | | | | 1,127 | |
| Residential Mortgage Loans | | | 545 | | | | 398 | | | | 320 | | | | 341 | | | | 710 | |
| Unallocated | | | 456 | | | | — | | | | — | | | | 51 | | | | 120 | |
| | | | | | | | | | | | | | | | | | | | | |
| Total Allowance for Loan Losses | | $ | 11,016 | | | $ | 9,522 | | | $ | 8,044 | | | $ | 7,129 | | | $ | 9,265 | |
The allowance for loan losses at year-end 2009 increased to $11.0 million or 1.25% of total loans compared to $9.5 million or 1.07% of total loans at year-end 2008. The increase in the allowance for loan losses during 2009 was largely attributable to an increased level of commercial watch list, adversely classified, and impaired loans. While this increased level has not necessarily translated into a significant increase in the Company’s non-performing loan portfolio or increase in net charge-offs, the Company’s methodology for determining the allowance indicated a higher level of allowance for loan losses was warranted when compared with prior years. A significant qualitative factor considered by the Company in determining the higher level of allowance for loan losses was the volatility and disruption experienced in the credit markets over the past several quarters and the possibility that these conditions will place additional pressure on the Company’s credit quality. As these difficult economic conditions continue, the risk that real estate values could further decline, business profits could continue to be stressed, and the financial strength of borrowers and guarantors may continue to be negatively impacted indicated that the Company’s credit quality may be under downward pressure in the coming quarters and was a key driver in determining the level of necessary allowance for loan loss during 2009.
The allowance for loan loss at year-end 2009 represented 125% of non-performing loans compared to 114% at year-end 2008. Net charge-offs totaled $2.3 million or 0.25% of average loans during 2009. This compares to net charge-offs of $2.5 million or 0.29% of average loans outstanding during 2008 and $2.7 million or 0.32% of average loans outstanding during 2007.
Please see “RESULTS OF OPERATIONS – Provision for Loan Losses” and “CRITICAL ACCOUNTING POLICIES AND ESTIMATES – Allowance for Loan Losses” for additional information regarding the allowance.
NON-PERFORMING ASSETS
Non-performing assets consist of: (a) non-accrual loans; (b) loans which have been renegotiated to provide for a reduction or deferral of interest or principal because of deterioration in the financial condition of the borrower; (c) loans past due 90 days or more as to principal or interest; and, (d) other real estate owned. Loans are placed on non-accrual status when scheduled principal or interest payments are past due for 90 days or more or when the borrower’s ability to repay becomes doubtful. Uncollected accrued interest is reversed against income at the time a loan is placed on non-accrual. Loans are typically charged-off at 120 days past due, or earlier if deemed uncollectible. Exceptions to the non-accrual and charge-off policies are made when the loan is well secured and in the process of collection. The following table presents an analysis of the Company’s non-performing assets.
| Non-performing Assets | | December 31, | |
| (dollars in thousands) | | 2009 | | | 2008 | | | 2007 | | | 2006 | | | 2005 | |
| Non-accrual Loans | | $ | 8,374 | | | $ | 8,316 | | | $ | 4,356 | | | $ | 9,652 | | | $ | 14,763 | |
| Past Due Loans (90 days or more) | | | 113 | | | | 34 | | | | 8 | | | | — | | | | 944 | |
| Restructured Loans | | | 306 | | | | — | | | | — | | | | — | | | | — | |
| Total Non-performing Loans | | | 8,793 | | | | 8,350 | | | | 4,364 | | | | 9,652 | | | | 15,707 | |
| Other Real Estate | | | 2,363 | | | | 1,818 | | | | 1,517 | | | | 845 | | | | 506 | |
| Total Non-performing Assets | | $ | 11,156 | | | $ | 10,168 | | | $ | 5,881 | | | $ | 10,497 | | | $ | 16,213 | |
| | | | | | | | | | | | | | | | | | | | | |
| Non-performing Loans to Total Loans | | | 1.00 | % | | | 0.94 | % | | | 0.50 | % | | | 1.21 | % | | | 2.41 | % |
| Allowance for Loan Losses to Non-performing Loans | | | 125.28 | % | | | 114.04 | % | | | 184.33 | % | | | 73.86 | % | | | 58.99 | % |
The level of non-performing loans remained relatively stable during 2009, and considerably lower than the Company’s peer group. The Company’s level of overall non-performing assets increased by approximately $988,000 and non-performing loans increased by approximately $443,000 during 2009 compared with year-end 2008. This level of non-performing loans represents 1.00% of total loans outstanding at December 31, 2009, a modest increase from 0.94% as of year-end 2008. As economic pressures continue to build as a result of difficult economic conditions, increasing numbers of the Company’s borrowers could be negatively impacted resulting in an increased level of non-performing loans in future periods.
Loan impairment is reported when full repayment under the terms of the loan is not expected. If a loan is impaired, a portion of the allowance is allocated so that the loan is reported net, at the present value of estimated future cash flows using the loan’s existing rate, or at the fair value of collateral if repayment is expected solely from the collateral. Commercial and industrial loans, commercial real estate loans, and agricultural loans are evaluated individually for impairment. Smaller balance homogeneous loans are evaluated for impairment in total. Such loans include real estate loans secured by one-to-four family residences and loans to individuals for household, family and other personal expenditures. Individually evaluated loans on non-accrual are generally considered impaired. Impaired loans, or portions thereof, are charged off when deemed uncollectible. The total dollar amount of impaired loans at December 31, 2009 was $8,145,000. For additional detail on impaired loans, see Note 3 to the Company’s consolidated financial statements included in Item 8 of this Report.
Interest income recognized on non-performing loans for 2009 was $338,000. The gross interest income that would have been recognized in 2009 on non-performing loans if the loans had been current in accordance with their original terms was $1,006,000. Loans are typically placed on non-accrual status when scheduled principal or interest payments are past due for 90 days or more, unless the loan is well secured and in the process of collection.
LIQUIDITY AND INTEREST RATE RISK MANAGEMENT
Liquidity is a measure of the ability of the Company’s subsidiary bank to fund new loan demand, existing loan commitments and deposit withdrawals. The purpose of liquidity management is to match sources of funds with anticipated customer borrowings and withdrawals and other obligations to ensure a dependable funding base, without unduly penalizing earnings. Failure to properly manage liquidity requirements can result in the need to satisfy customer withdrawals and other obligations on less than desirable terms. The liquidity of the parent company is dependent upon the receipt of dividends from its bank subsidiary, which are subject to certain regulatory limitations explained in Note 8 to the Company’s consolidated financial statements included in Item 8 of this Report, as enhanced by its ability to draw upon term financing arrangements and a line of credit established by the parent company with a correspondent bank lender as described under “SOURCES OF FUNDS – Parent Company Funding Sources”, above. The subsidiary bank’s source of funding is predominately core deposits, time deposits in excess of $100,000 and brokered certificates of deposit, maturities of securities, repayments of loan principal and interest, federal funds purchased, securities sold under agreements to repurchase and borrowings from the Federal Home Loan Bank and Federal Reserve Bank.
Interest rate risk is the exposure of the Company’s financial condition to adverse changes in market interest rates. In an effort to estimate the impact of sustained interest rate movements to the Company’s earnings, the Company monitors interest rate risk through computer-assisted simulation modeling of its net interest income. The Company’s simulation modeling monitors the potential impact to net interest income under various interest rate scenarios. The Company’s objective is to actively manage its asset/liability position within a one-year interval and to limit the risk in any of the interest rate scenarios to a reasonable level of tax-equivalent net interest income within that interval. The Company’s Asset/Liability Committee monitors compliance within established guidelines of the Funds Management Policy. See Item 7A. Quantitative and Qualitative Disclosures About Market Risk section for further discussion regarding interest rate risk.
OFF-BALANCE SHEET ARRANGEMENTS
The Company has no off-balance sheet arrangements other than stand-by letters of credit as disclosed in Note 13 to the Company’s consolidated financial statements included in Item 8 of this Report.
Item 7A. Quantitative and Qualitative Disclosures About Market Risk.
The Company’s exposure to market risk is reviewed on a regular basis by the Asset/Liability Committee and Board of Directors. Primary market risks, which impact the Company’s operations, are liquidity risk and interest rate risk, as discussed above.
As discussed previously, the Company monitors interest rate risk by the use of computer simulation modeling to estimate the potential impact on its net interest income under various interest rate scenarios. Another method by which the Company’s interest rate risk position can be estimated is by computing estimated changes in its net portfolio value (“NPV”). This method estimates interest rate risk exposure from movements in interest rates by using interest rate sensitivity analysis to determine the change in the NPV of discounted cash flows from assets and liabilities. NPV represents the market value of portfolio equity and is equal to the estimated market value of assets minus the estimated market value of liabilities. Computations are based on a number of assumptions, including the relative levels of market interest rates and prepayments in mortgage loans and certain types of investments. These computations do not contemplate any actions management may undertake in response to changes in interest rates, and should not be relied upon as indicative of actual results. In addition, certain shortcomings are inherent in the method of computing NPV. Should interest rates remain or decrease below current levels, the proportion of adjustable rate loans could decrease in future periods due to refinancing activity. In the event of an interest rate change, prepayment levels would likely be different from those assumed in the table. Lastly, the ability of many borrowers to repay their adjustable rate debt may decline during a rising interest rate environment.
The following table provides an assessment of the risk to NPV in the event of sudden and sustained 1% and 2% increases and decreases in prevailing interest rates. The table indicates that as of December 31, 2009 the Company’s estimated NPV might be expected to decrease under both an increase or decrease of 2% in prevailing interest rates (dollars in thousands).
| Interest Rate Sensitivity as of December 31, 2009 | |
| | | | | | | | | Net Portfolio Value | |
| | | Net Portfolio | | | as a % of Present Value | |
| | | Value | | | of Assets | |
| Changes | | | | | | | | | | | | |
| in Rates | | Amount | | | | | | | | | Change | |
| +2% | | $ | 126,472 | | | | (12.94 | )% | | | 10.64 | % | | (108) | b.p. |
| +1% | | | 136,585 | | | | (5.98 | )% | | | 11.25 | % | | (47) | b.p. |
| Base | | | 145,273 | | | | — | | | | 11.72 | % | | | — | |
| -1% | | | 132,022 | | | | (9.12 | )% | | | 10.57 | % | | (115) | b.p. |
| -2% | | | 115,247 | | | | (20.67 | )% | | | 9.17 | % | | (255) | b.p. |
The above discussion, and the portions of MANAGEMENT’S DISCUSSION AND ANALYSIS in Item 7 of this Report that are referenced in the above discussion contain statements relating to future results of the Company that are considered “forward-looking statements” within the meaning of the Private Securities Litigation Reform Act of 1995. These statements relate to, among other things, simulation of the impact on net interest income from changes in interest rates. Actual results may differ materially from those expressed or implied therein as a result of certain risks and uncertainties, including those risks and uncertainties expressed above, those that are described in MANAGEMENT’S DISCUSSION AND ANALYSIS in Item 7 of this Report, and those that are described in Item 1 of this Report, “Business,” under the caption “Forward-Looking Statements and Associated Risks,” which discussions are incorporated herein by reference.
Item 8. Financial Statements and Supplementary Data.
Report of Independent Registered Public Accounting Firm
Board of Directors and Shareholders
German American Bancorp, Inc.
Jasper, Indiana
We have audited the accompanying consolidated balance sheets of German American Bancorp, Inc. as of December 31, 2009 and 2008 and the related consolidated statements of income, changes in shareholders’ equity, and cash flows for each of the three years in the period ended December 31, 2009. We also have audited German American Bancorp, Inc.’s internal control over financial reporting as of December 31, 2009, based on criteria established in Internal Control – Integrated Framework issued by the Committee of Sponsoring Organizations of the Treadway Commission (COSO). German American Bancorp, Inc.’s management is responsible for these financial statements, for maintaining effective internal control over financial reporting, and for its assessment of the effectiveness of internal control over financial reporting, included in the accompanying Management’s Report on Internal Control over Financial Reporting. Our responsibility is to express an opinion on these financial statements and an opinion on the company's internal control over financial reporting based on our audits.
We conducted our audits in accordance with the standards of the Public Company Accounting Oversight Board (United States). Those standards require that we plan and perform the audit to obtain reasonable assurance about whether the financial statements are free of material misstatement and whether effective internal control over financial reporting was maintained in all material respects. Our audits of the financial statements included examining, on a test basis, evidence supporting the amounts and disclosures in the financial statements, assessing the accounting principles used and significant estimates made by management, and evaluating the overall financial statement presentation. Our audit of internal control over financial reporting included obtaining an understanding of internal control over financial reporting, assessing the risk that a material weakness exists, and testing and evaluating the design and operating effectiveness of internal control based on the assessed risk. Our audits also included performing such other procedures as we considered necessary in the circumstances. We believe that our audits provide a reasonable basis for our opinions.
A company's internal control over financial reporting is a process designed to provide reasonable assurance regarding the reliability of financial reporting and the preparation of financial statements for external purposes in accordance with generally accepted accounting principles. A company's internal control over financial reporting includes those policies and procedures that (1) pertain to the maintenance of records that, in reasonable detail, accurately and fairly reflect the transactions and dispositions of the assets of the company; (2) provide reasonable assurance that transactions are recorded as necessary to permit preparation of financial statements in accordance with generally accepted accounting principles, and that receipts and expenditures of the company are being made only in accordance with authorizations of management and directors of the company; and (3) provide reasonable assurance regarding prevention or timely detection of unauthorized acquisition, use, or disposition of the company's assets that could have a material effect on the financial statements.
Because of its inherent limitations, internal control over financial reporting may not prevent or detect misstatements. Also, projections of any evaluation of effectiveness to future periods are subject to the risk that controls may become inadequate because of changes in conditions, or that the degree of compliance with the policies or procedures may deteriorate.
In our opinion, the consolidated financial statements referred to above present fairly, in all material respects, the financial position of German American Bancorp, Inc. as of December 31, 2009 and 2008, and the results of its operations and its cash flows for each of the three years in the period ended December 31, 2009, in conformity with accounting principles generally accepted in the United States of America. Also in our opinion German American Bancorp, Inc. maintained, in all material respects, effective internal control over financial reporting as of December 31, 2009, based on criteria established in Internal Control – Integrated Framework issued by the COSO.
| Louisville, Kentucky | /s/ Crowe Horwath LLP |
| March 5, 2010 | Crowe Horwath LLP |
Consolidated Balance Sheets
Dollars in thousands, except per share data
| | | December 31, | |
| | | | | | | |
| | | 2009 | | | 2008 | |
| ASSETS | | | | | | |
| Cash and Due from Banks | | $ | 16,052 | | | $ | 17,201 | |
| Federal Funds Sold and Other Short-term Investments | | | 12,002 | | | | 27,791 | |
| | | | | | | | | |
| Cash and Cash Equivalents | | | 28,054 | | | | 44,992 | |
| | | | | | | | | |
| Securities Available-for-Sale, at Fair Value | | | 250,940 | | | | 175,840 | |
| Securities Held-to-Maturity, at Cost (Fair value of $2,801 and $3,358 on | | | | | | | | |
| December 31, 2009 and 2008, respectively) | | | 2,774 | | | | 3,326 | |
| | | | | | | | | |
| Loans Held-for-Sale | | | 5,706 | | | | 3,166 | |
| | | | | | | | | |
| Loans | | | 879,475 | | | | 892,511 | |
| Less: Unearned Income | | | (1,653 | ) | | | (2,075 | ) |
| Allowance for Loan Losses | | | (11,016 | ) | | | (9,522 | ) |
| Loans, Net | | | 866,806 | | | | 880,914 | |
| | | | | | | | | |
| Stock in FHLB of Indianapolis and Other Restricted Stock, at Cost | | | 10,621 | | | | 10,621 | |
| Premises, Furniture and Equipment, Net | | | 22,153 | | | | 22,330 | |
| Other Real Estate | | | 2,363 | | | | 1,818 | |
| Goodwill | | | 9,655 | | | | 9,655 | |
| Intangible Assets | | | 2,618 | | | | 3,141 | |
| Company Owned Life Insurance | | | 24,008 | | | | 23,338 | |
| Accrued Interest Receivable and Other Assets | | | 17,267 | | | | 11,687 | |
| | | | | | | | | |
| TOTAL ASSETS | | $ | 1,242,965 | | | $ | 1,190,828 | |
| | | | | | | | | |
| LIABILITIES | | | | | | | | |
| Non-interest-bearing Demand Deposits | | $ | 155,268 | | | $ | 147,977 | |
| Interest-bearing Demand, Savings, and Money Market Accounts | | | 484,699 | | | | 439,305 | |
| Time Deposits | | | 329,676 | | | | 354,468 | |
| | | | | | | | | |
| Total Deposits | | | 969,643 | | | | 941,750 | |
| | | | | | | | | |
| FHLB Advances and Other Borrowings | | | 148,121 | | | | 131,664 | |
| Accrued Interest Payable and Other Liabilities | | | 11,652 | | | | 12,240 | |
| | | | | | | | | |
| TOTAL LIABILITIES | | | 1,129,416 | | | | 1,085,654 | |
| | | | | | | | | |
| Commitments and Contingencies (Note 13) | | | | | | | | |
| | | | | | | | | |
| SHAREHOLDERS’ EQUITY | | | | | | | | |
| Preferred Stock, $10 par value; 500,000 shares authorized, no shares issued | | | — | | | | — | |
| Common Stock, no par value, $1 stated value; 20,000,000 shares authorized | | | 11,077 | | | | 11,030 | |
| Additional Paid-in Capital | | | 68,816 | | | | 68,371 | |
| Retained Earnings | | | 29,041 | | | | 23,019 | |
| Accumulated Other Comprehensive Income | | | 4,615 | | | | 2,754 | |
| | | | | | | | | |
| TOTAL SHAREHOLDERS’ EQUITY | | | 113,549 | | | | 105,174 | |
| | | | | | | | | |
| TOTAL LIABILITIES AND SHAREHOLDERS’ EQUITY | | $ | 1,242,965 | | | $ | 1,190,828 | |
| | | | | | | | | |
| End of period shares issued and outstanding | | | 11,077,382 | | | | 11,030,288 | |
See accompanying notes to consolidated financial statements.
Consolidated Statements of Income
Dollars in thousands, except per share data
| | | Years Ended December 31, | |
| | | | | | | | | | |
| | | 2009 | | | 2008 | | | 2007 | |
| INTEREST INCOME | | | | | | | | | |
| Interest and Fees on Loans | | $ | 53,905 | | | $ | 58,477 | | | $ | 63,852 | |
| Interest on Federal Funds Sold and Other Short-term Investments | | | 106 | | | | 593 | | | | 478 | |
| Interest and Dividends on Securities: | | | | | | | | | | | | |
| Taxable | | | 8,660 | | | | 8,007 | | | | 6,992 | |
| Non-taxable | | | 1,065 | | | | 768 | | | | 939 | |
| TOTAL INTEREST INCOME | | | 63,736 | | | | 67,845 | | | | 72,261 | |
| | | | | | | | | | | | | |
| INTEREST EXPENSE | | | | | | | | | | | | |
| Interest on Deposits | | | 13,495 | | | | 21,212 | | | | 27,289 | |
| Interest on FHLB Advances and Other Borrowings | | | 5,728 | | | | 5,696 | | | | 6,357 | |
| TOTAL INTEREST EXPENSE | | | 19,223 | | | | 26,908 | | | | 33,646 | |
| NET INTEREST INCOME | | | 44,513 | | | | 40,937 | | | | 38,615 | |
| Provision for Loan Losses | | | 3,750 | | | | 3,990 | | | | 3,591 | |
| NET INTEREST INCOME AFTER PROVISION FOR LOAN LOSSES | | | 40,763 | | | | 36,947 | | | | 35,024 | |
| | | | | | | | | | | | | |
| NON-INTEREST INCOME | | | | | | | | | | | | |
| Trust and Investment Product Fees | | | 1,617 | | | | 2,288 | | | | 2,590 | |
| Service Charges on Deposit Accounts | | | 4,395 | | | | 4,920 | | | | 4,361 | |
| Insurance Revenues | | | 5,296 | | | | 6,306 | | | | 5,794 | |
| Company Owned Life Insurance | | | 1,104 | | | | 791 | | | | 823 | |
| Other Operating Income | | | 2,110 | | | | 2,412 | | | | 1,994 | |
| Net Gains on Sales of Loans and Related Assets | | | 1,760 | | | | 1,399 | | | | 822 | |
| Net Gain (Loss) on Securities | | | (423 | ) | | | 94 | | | | (680 | ) |
| TOTAL NON-INTEREST INCOME | | | 15,859 | | | | 18,210 | | | | 15,704 | |
| | | | | | | | | | | | | |
| NON-INTEREST EXPENSE | | | | | | | | | | | | |
| Salaries and Employee Benefits | | | 21,961 | | | | 20,786 | | | | 21,671 | |
| Occupancy Expense | | | 3,382 | | | | 3,249 | | | | 3,144 | |
| Furniture and Equipment Expense | | | 2,653 | | | | 2,428 | | | | 2,235 | |
| FDIC Premiums | | | 1,863 | | | | 209 | | | | 103 | |
| Data Processing Fees | | | 1,368 | | | | 1,493 | | | | 1,370 | |
| Professional Fees | | | 1,740 | | | | 1,670 | | | | 1,418 | |
| Advertising and Promotion | | | 993 | | | | 1,078 | | | | 957 | |
| Supplies | | | 528 | | | | 570 | | | | 625 | |
| Intangible Amortization | | | 909 | | | | 889 | | | | 894 | |
| Other Operating Expenses | | | 4,994 | | | | 4,344 | | | | 4,804 | |
| TOTAL NON-INTEREST EXPENSE | | | 40,391 | | | | 36,716 | | | | 37,221 | |
| | | | | | | | | | | | | |
| Income before Income Taxes | | | 16,231 | | | | 18,441 | | | | 13,507 | |
| Income Tax Expense | | | 4,013 | | | | 5,638 | | | | 4,102 | |
| NET INCOME | | $ | 12,218 | | | $ | 12,803 | | | $ | 9,405 | |
| | | | | | | | | | | | | |
| Earnings per Share | | $ | 1.10 | | | $ | 1.16 | | | $ | 0.85 | |
| | | | | | | | | | | | | |
| Diluted Earnings per Share | | $ | 1.10 | | | $ | 1.16 | | | $ | 0.85 | |
See accompanying notes to consolidated financial statements.
Consolidated Statements of Changes in Shareholders’ Equity
Dollars in thousands, except per share data
| | | | | | | | | | | | | | | Accumulated | | | | |
| | | | | | | | | Additional | | | | | | Other | | | Total | |
| | | Common Stock | | | Paid-in | | | Retained | | | Comprehensive | | | Shareholders’ | |
| | | Shares | | | Amount | | | Capital | | | Earnings | | | Income / (Loss) | | | Equity | |
| | | | | | | | | | | | | | | | | | | |
| Balances, January 1, 2007 | | | 11,008,562 | | | $ | 11,008 | | | $ | 68,216 | | | $ | 13,450 | | | $ | (283 | ) | | $ | 92,391 | |
| | | | | | | | | | | | | | | | | | | | | | | | | |
| Comprehensive Income: | | | | | | | | | | | | | | | | | | | | | | | | |
| Net Income | | | | | | | | | | | | | | | 9,405 | | | | | | | | 9,405 | |
| Changes in Unrealized Gain (Loss) on | | | | | | | | | | | | | | | | | | | 1,210 | | | | 1,210 | |
| Securities Available for Sale, net | | | | | | | | | | | | | | | | | | | | | | | | |
| Change in Unrecognized Loss on | | | | | | | | | | | | | | | | | | | | | | | | |
| Postretirement Benefit Obligation | | | | | | | | | | | | | | | | | | | 30 | | | | 30 | |
| Change in Unrecognized Amounts in Pension | | | | | | | | | | | | | | | | | | | 41 | | | | 41 | |
| Total Comprehensive Income | | | | | | | | | | | | | | | | | | | | | | | 10,686 | |
| Cash Dividends ($.56 per share) | | | | | | | | | | | | | | | (6,174 | ) | | | | | | | (6,174 | ) |
| Employee Stock Purchase Plan | | | | | | | | | | | (70 | ) | | | | | | | | | | | (70 | ) |
| Restricted Share Grants | | | 20,922 | | | | 21 | | | | 262 | | | | | | | | | | | | 283 | |
| | | | | | | | | | | | | | | | | | | | | | | | | |
| Balances, December 31, 2007 | | | 11,029,484 | | | | 11,029 | | | | 68,408 | | | | 16,681 | | | | 998 | | | | 97,116 | |
| | | | | | | | | | | | | | | | | | | | | | | | | |
| Comprehensive Income: | | | | | | | | | | | | | | | | | | | | | | | | |
| Net Income | | | | | | | | | | | | | | | 12,803 | | | | | | | | 12,803 | |
| Changes in Unrealized Gain (Loss) on | | | | | | | | | | | | | | | | | | | | | | | | |
| Securities Available for Sale, net | | | | | | | | | | | | | | | | | | | 1,612 | | | | 1,612 | |
| Change in Unrecognized Loss on | | | | | | | | | | | | | | | | | | | | | | | | |
| Postretirement Benefit Obligation | | | | | | | | | | | | | | | | | | | 144 | | | | 144 | |
| Total Comprehensive Income | | | | | | | | | | | | | | | | | | | | | | | 14,559 | |
| Cash Dividends ($.56 per share) | | | | | | | | | | | | | | | (6,177 | ) | | | | | | | (6,177 | ) |
| Adjustment to Initially Apply ASC 715-60 | | | | | | | | | | | | | | | (288 | ) | | | | | | | (288 | ) |
| Employee Stock Purchase Plan | | | | | | | | | | | (46 | ) | | | | | | | | | | | (46 | ) |
| Restricted Share Grants | | | 804 | | | | 1 | | | | 9 | | | | | | | | | | | | 10 | |
| | | | | | | | | | | | | | | | | | | | | | | | | |
| Balances, December 31, 2008 | | | 11,030,288 | | | | 11,030 | | | | 68,371 | | | | 23,019 | | | | 2,754 | | | | 105,174 | |
| | | | | | | | | | | | | | | | | | | | | | | | | |
| Comprehensive Income: | | | | | | | | | | | | | | | | | | | | | | | | |
| Net Income | | | | | | | | | | | | | | | 12,218 | | | | | | | | 12,218 | |
| Changes in Unrealized Gain (Loss) on | | | | | | | | | | | | | | | | | | | | | | | | |
| Securities Available for Sale, net | | | | | | | | | | | | | | | | | | | 1,908 | | | | 1,908 | |
| Change in Unrecognized Amounts in Pension | | | | | | | | | | | | | | | | | | | (47 | ) | | | (47 | ) |
| Total Comprehensive Income | | | | | | | | | | | | | | | | | | | | | | | 14,079 | |
| Cash Dividends ($.56 per share) | | | | | | | | | | | | | | | (6,196 | ) | | | | | | | (6,196 | ) |
| Issuance of Common Stock for: | | | | | | | | | | | | | | | | | | | | | | | | |
| Exercise of Stock Options | | | 3,354 | | | | 3 | | | | 6 | | | | | | | | | | | | 9 | |
| Employee Stock Purchase Plan | | | | | | | | | | | (2 | ) | | | | | | | | | | | (2 | ) |
| Restricted Share Grants | | | 43,740 | | | | 44 | | | | 441 | | | | | | | | | | | | 485 | |
| | | | | | | | | | | | | | | | | | | | | | | | | |
| Balances, December 31, 2009 | | | 11,077,382 | | | $ | 11,077 | | | $ | 68,816 | | | $ | 29,041 | | | $ | 4,615 | | | $ | 113,549 | |
See accompanying notes to consolidated financial statements.
Consolidated Statements of Cash Flows
| | | Years Ended December 31, | |
| | | | | | | | | | |
| | | 2009 | | | 2008 | | | 2007 | |
| CASH FLOWS FROM OPERATING ACTIVITIES | | | | | | | | | |
| Net Income | | $ | 12,218 | | | $ | 12,803 | | | $ | 9,405 | |
| Adjustments to Reconcile Net Income to Net Cash from Operating Activities: | | | | | | | | | | | | |
| Net Accretion on Securities | | | (144 | ) | | | (812 | ) | | | (383 | ) |
| Depreciation and Amortization | | | 3,688 | | | | 3,362 | | | | 3,140 | |
| Loans Originated for Sale | | | (145,993 | ) | | | (105,448 | ) | | | (71,091 | ) |
| Proceeds from Sales of Loans Held-for-Sale | | | 145,213 | | | | 109,378 | | | | 67,817 | |
| Loss in Investment in Limited Partnership | | | 138 | | | | 141 | | | | 178 | |
| Provision for Loan Losses | | | 3,750 | | | | 3,990 | | | | 3,591 | |
| Gain on Sale of Loans, net | | | (1,760 | ) | | | (1,399 | ) | | | (822 | ) |
| Gain on Securities, net | | | — | | | | (1,031 | ) | | | (62 | ) |
| Loss (Gain) on Sales of Other Real Estate and Repossessed Assets | | | 364 | | | | 62 | | | | (52 | ) |
| Loss (Gain) on Disposition and Impairment of Premises and Equipment | | | 11 | | | | (25 | ) | | | 120 | |
| Other-than-temporary Impairment on Securities | | | 423 | | | | 937 | | | | 742 | |
| Increase in Cash Surrender Value of Company Owned Life Insurance | | | (670 | ) | | | (805 | ) | | | (823 | ) |
| Equity Based Compensation | | | 485 | | | | 10 | | | | 331 | |
| Change in Assets and Liabilities: | | | | | | | | | | | | |
| Interest Receivable and Other Assets | | | (4,236 | ) | | | 1,798 | | | | 1,070 | |
| Interest Payable and Other Liabilities | | | (3,062 | ) | | | (827 | ) | | | (406 | ) |
| Net Cash from Operating Activities | | | 10,425 | | | | 22,134 | | | | 12,755 | |
| | | | | | | | | | | | | |
| CASH FLOWS FROM INVESTING ACTIVITIES | | | | | | | | | | | | |
| Proceeds from Maturity of Other Short-term Investments | | | — | | | | — | | | | 200 | |
| Proceeds from Maturities of Securities Available-for-Sale | | | 54,294 | | | | 52,304 | | | | 41,899 | |
| Proceeds from Sales of Securities Available-for-Sale | | | 379 | | | | 53,641 | | | | 998 | |
| Purchase of Securities Available-for-Sale | | | (127,192 | ) | | | (130,170 | ) | | | (10,434 | ) |
| Proceeds from Maturities of Securities Held-to-Maturity | | | 554 | | | | 1,140 | | | | 1,671 | |
| Purchase of Loans | | | (24,078 | ) | | | (29,574 | ) | | | (23,065 | ) |
| Proceeds from Sales of Loans | | | 21,057 | | | | 5,369 | | | | 3,953 | |
| Loans Made to Customers, net of Payments Received | | | 10,678 | | | | (4,447 | ) | | | (58,503 | ) |
| Proceeds from Sales of Other Real Estate | | | 1,756 | | | | 3,068 | | | | 2,987 | |
| Property and Equipment Expenditures | | | (2,637 | ) | | | (2,122 | ) | | | (1,372 | ) |
| Proceeds from Sales of Property and Equipment | | | 4 | | | | 65 | | | | 62 | |
| Acquire Capitalized Lease | | | — | | | | — | | | | (13 | ) |
| Acquire Insurance Agencies | | | (386 | ) | | | — | | | | — | |
| Net Cash from Investing Activities | | | (65,571 | ) | | | (50,726 | ) | | | (41,617 | ) |
| | | | | | | | | | | | | |
| CASH FLOWS FROM FINANCING ACTIVITIES | | | | | | | | | | | | |
| Change in Deposits | | | 27,952 | | | | 64,388 | | | | 9,862 | |
| Change in Short-term Borrowings | | | 8,745 | | | | (31,328 | ) | | | 5,828 | |
| Advances in Long-term Debt | | | 29,250 | | | | 25,000 | | | | 30,000 | |
| Repayments of Long-term Debt | | | (21,541 | ) | | | (6,167 | ) | | | (12,317 | ) |
| Employee Stock Purchase Plan | | | (2 | ) | | | (46 | ) | | | (118 | ) |
| Dividends Paid | | | (6,196 | ) | | | (6,177 | ) | | | (6,174 | ) |
| Net Cash from Financing Activities | | | 38,208 | | | | 45,670 | | | | 27,081 | |
| | | | | | | | | | | | | |
| Net Change in Cash and Cash Equivalents | | | (16,938 | ) | | | 17,078 | | | | (1,781 | ) |
| Cash and Cash Equivalents at Beginning of Year | | | 44,992 | | | | 27,914 | | | | 29,695 | |
| Cash and Cash Equivalents at End of Year | | $ | 28,054 | | | $ | 44,992 | | | $ | 27,914 | |
| | | | | | | | | | | | | |
| Cash Paid During the Year for | | | | | | | | | | | | |
| Interest | | $ | 19,815 | | | $ | 27,246 | | | $ | 33,781 | |
| Income Taxes | | | 4,305 | | | | 6,122 | | | | 2,395 | |
| | | | | | | | | | | | | |
| Supplemental Non Cash Disclosures | | | | | | | | | | | | |
| Loans Transferred to Other Real Estate | | $ | 2,665 | | | $ | 3,353 | | | $ | 4,919 | |
See accompanying notes to consolidated financial statements.
Notes to the Consolidated Financial Statements
Dollars in thousands, except per share data
NOTE 1 – Summary of Significant Accounting Policies
Description of Business and Basis of Presentation
German American Bancorp, Inc. operations are primarily comprised of three business segments: core banking, trust and investment advisory services, and insurance operations. The accounting and reporting policies of German American Bancorp, Inc. and its subsidiaries conform to U.S. generally accepted accounting principles. The more significant policies are described below. The consolidated financial statements include the accounts of the Company and its subsidiaries after elimination of all material intercompany accounts and transactions. Certain prior year amounts have been reclassified to conform with current classifications. The preparation of financial statements in conformity with U.S. generally accepted accounting principles requires management to make estimates and assumptions that affect the reported amounts and disclosures. Actual results could differ from those estimates. Estimates susceptible to change in the near term include the allowance for loan losses, other-than-temporary impairment of securities, the valuation allowance on deferred tax assets, and loss contingencies.
Securities
Securities classified as available-for-sale are securities that the Company intends to hold for an indefinite period of time, but not necessarily until maturity. These include securities that management may use as part of its asset/liability strategy, or that may be sold in response to changes in interest rates, changes in prepayment risk, or similar reasons. Equity securities with readily determinable fair values are classified as available-for-sale. Equity securities that do not have readily determinable fair values are carried at historical cost and evaluated for impairment on a periodic basis. Securities classified as available-for-sale are reported at market value with unrealized gains or losses included as a separate component of equity, net of tax. Securities classified as held-to-maturity are securities that the Company has both the ability and positive intent to hold to maturity. Securities held-to-maturity are carried at amortized cost.
Premium amortization is deducted from, and discount accretion is added to, interest income using the level yield method without anticipating prepayments, except for mortgage-backed securities where prepayments are anticipated. Gains and losses on sales are recorded on trade date and are computed on the identified securities method. Management evaluates securities for other-than-temporary impairment (“OTTI”) at least on a quarterly basis, and more frequently when economic conditions or market conditions warrant such an evaluation.
Loans Held for Sale
Mortgage loans originated and intended for sale in the secondary market are carried at fair value. Fair value is determined based on collateral value and prevailing market prices for loans with similar characteristics. Net unrealized gains or losses are recorded through earnings. Mortgage loans held for sale are generally sold on a servicing released basis.
Mortgage loans held for sale are generally sold on a servicing released basis. Gains and losses on sales of mortgage loans are based on the difference between the selling price and the carrying value of the related loan sold.
Loans
Loans that management has the intent and ability to hold for the foreseeable future or until maturity or pay-off are reported at the principal balance outstanding, net of unearned interest, deferred loan fees and costs, and an allowance for loan losses. Interest income is accrued on unpaid principal balance and includes amortization of net deferred loan fees and costs over the loan term without anticipating prepayments.
Interest income is discontinued on impaired loans and loans past due 90 days or more, unless the loan is well secured and in process of collection. All interest accrued but not received for loans placed on non-accrual is reversed against interest income. Interest received on such loans is accounted for on the cash-basis or cost-recovery method, until qualifying for return to accrual. Loans are returned to accrual status when all the principal and interest amounts contractually due are brought current and future payments are reasonably assured.
Notes to the Consolidated Financial Statements
Dollars in thousands, except per share data
NOTE 1 – Summary of Significant Accounting Policies (continued)
Certain Purchased Loans
The Company purchases individual loans and groups of loans. Purchased loans that show evidence of credit deterioration since origination are recorded at the amount paid (or allocated fair value in a purchase business combination), such that there is no carryover of the seller’s allowance for loan losses. After acquisition, incurred losses are recognized by an increase in the allowance for loan losses.
Such purchased loans are accounted for individually or aggregated into pools of loans based on common risk characteristics (e.g., credit score, loan type, and date of origination). The Company estimates the amount and timing of expected cash flows for each purchased loan or pool, and the expected cash flows in excess of amount paid is recorded as interest income over the remaining life of the loan or pool (accretable yield). The excess of the loan’s or pool’s contractual principal and interest over expected cash flows is not recorded (nonaccretable difference).
Over the life of the loan or pool, expected cash flows continue to be estimated. If the present value of expected cash flows is less than the carrying amount, a loss is recorded. If the present value of expected cash flows is greater than the carrying amount, it is recognized as part of future interest income.
Allowance for Loan Losses
The allowance for loan losses is a valuation allowance for probable incurred credit losses. Loan losses are charged against the allowance when management believes the uncollectibility of a loan balance is confirmed. Subsequent recoveries, if any, are credited to the allowance. Management estimates the allowance balance required using past loan loss experience, the nature and volume of the portfolio, information about specific borrower situations and estimated collateral values, economic conditions, and other factors. Allocations of the allowance may be made for specific loans, but the entire allowance is available for any loan that, in management’s judgment, should be charged-off. The allowance consists of specific and general components. The specific component relates to loans that are individually classified as impaired or loans otherwise classified as substandard or special mention. The general component covers non-classified loans and is based on historical loss experience adjusted for current factors.
Loan impairment is reported when full repayment under the terms of the loan is not expected. If a loan is impaired, a portion of the allowance is allocated so that the loan is reported net, at the present value of estimated future cash flows using the loan’s existing rate, or at the fair value of collateral if repayment is expected solely from the collateral. Commercial and agricultural loans are evaluated individually for impairment. Smaller balance homogeneous loans are evaluated for impairment in total. Such loans include real estate loans secured by one-to-four family residences and loans to individuals for household, family and other personal expenditures. Individually evaluated loans on non-accrual are generally considered impaired. Impaired loans, or portions thereof, are charged off when deemed uncollectible.
Federal Home Loan Bank (FHLB) Stock
The Bank is a member of the FHLB of Indianapolis. Members are required to own a certain amount of stock based on the level of borrowings and other factors, and may invest in additional amounts. FHLB stock is carried at cost, classified as a restricted security, and periodically evaluated for impairment based on ultimate recovery of par value. Both cash and stock dividends are reported as income.
Premises, Furniture and Equipment
Land is carried at cost. Premises, furniture, and equipment are stated at cost less accumulated depreciation. Buildings and related components are depreciated using the straight-line method with useful lives ranging from 10 to 40 years. Furniture, fixtures, and equipment are depreciated using the straight-line method with useful lives ranging from 3 to 10 years.
Other Real Estate
Assets acquired through or instead of loan foreclosure are initially recorded at fair value less costs to sell when acquired, establishing a new cost basis. If fair value declines subsequent to foreclosure, a valuation allowance is recorded through expense. Operating costs after acquisition are expensed.
Notes to the Consolidated Financial Statements
Dollars in thousands, except per share data
NOTE 1 – Summary of Significant Accounting Policies (continued)
Goodwill and Other Intangible Assets
Goodwill resulting from business combinations prior to January 1, 2009 represents the excess of the purchase price over the fair value of the net assets of businesses acquired. Goodwill resulting from business combinations after January 1, 2009, is generally determined as the excess of the fair value of the consideration transferred, plus the fair value of any noncontrolling interests in the acquiree, over the fair value of the net assets acquired and liabilities assumed as of the acquisition date. Goodwill and intangible assets acquired in a purchase business combination and determined to have an indefinite useful life are not amortized, but tested for impairment at least annually. The Company has selected December 31 as the date to perform the annual impairment test. Intangible assets with definite useful lives are amortized over their estimated useful lives to their estimated residual values. Goodwill is the only intangible asset with an indefinite life on our balance sheet.
Other intangible assets consist of core deposit and acquired customer relationship intangible assets. They are initially measured at fair value and then are amortized over their estimated useful lives, which range from 7 to 10 years.
Company Owned Life Insurance
The Company has purchased life insurance policies on certain directors and executives. This life insurance is recorded at its cash surrender value or the amount that can be realized, which considers any adjustments or changes that are probable at settlement.
Loss Contingencies
Loss contingencies, including claims and legal actions arising in the ordinary course of business, are recorded as liabilities when the likelihood of loss is probable and an amount or range of loss can be reasonably estimated. Management does not believe currently that there are any such matters that will have a material impact on the financial statements.
Loan Commitments and Related Financial Instruments
Financial instruments include off-balance sheet credit instruments, such as commitments to make loans and commercial letters of credit issued to meet customer financing needs. The face amount for these items represents the exposure to loss, before considering customer collateral or ability to repay. Such financial instruments are recorded when they are funded.
Restrictions on Cash
At December 31, 2009 and 2008, respectively, the company was required to have $3,223 and $945 on deposit with the Federal Reserve, or as cash on hand.
Long-term Assets
Premises and equipment, core deposit and other intangible assets, and other long-term assets are reviewed for impairment when events indicate their carrying amount may not be recoverable from future undiscounted cash flows. If impaired, the assets are recorded at fair value.
Stock Based Compensation
Compensation cost is recognized for stock options and restricted stock awards issued to employees, based on the fair value of these awards at the date of grant. A Black-Scholes model is utilized to estimate the fair value of stock options, while the market price of the Corporation’s common stock at the date of grant is used for restricted stock awards. Compensation cost is recognized over the required service period, generally defined as the vesting period.
Comprehensive Income
Comprehensive income consists of net income and other comprehensive income. Other comprehensive income includes unrealized gains and losses on securities available for sale and changes in unrecognized amounts in pension and other postretirement benefits, which are also recognized as a separate component of equity.
Income Taxes
Deferred tax liabilities and assets are determined at each balance sheet date and are the result of differences in the financial statement and tax bases of assets and liabilities. Income tax expense is the amount due on the current year tax returns plus or minus the change in deferred taxes. A valuation allowance, if needed, reduces deferred tax assets to the amount expected to be realized.
Notes to the Consolidated Financial Statements
Dollars in thousands, except per share data
NOTE 1 – Summary of Significant Accounting Policies (continued)
A tax position is recognized as a benefit only if it is “more likely than not” that the tax position would be sustained in a tax examination, with a tax examination being presumed to occur. The amount recognized is the largest amount of tax benefit that is greater than 50% likely of being realized on examination. For tax positions not meeting the “more likely than not” test, no tax benefit is recorded.
Retirement Plans
Pension expense under the suspended defined benefit plan is the net of interest cost, return on plan assets and amortization of gains and losses not immediately recognized. Employee 401(k) and profit sharing plan expense is the amount of matching contributions. Deferred compensation and supplemental retirement plan expense allocates the benefits over years of service.
Earnings Per Share
Earnings per share are based on net income divided by the weighted average number of shares outstanding during the period. Diluted earnings per share show the potential dilutive effect of additional common shares issuable under the Company’s stock based compensation plans. Earnings per share are retroactively restated for stock dividends.
Cash Flow Reporting
The Company reports net cash flows for customer loan transactions, deposit transactions, deposits made with other financial institutions and short-term borrowings. Cash and cash equivalents are defined to include cash on hand, demand deposits in other institutions and Federal Funds Sold.
Fair Values of Financial Instruments
Fair values of financial instruments are estimated using relevant market information and other assumptions, as more fully disclosed in Note 14. Fair value estimates involve uncertainties and matters of significant judgment regarding interest rates, credit risk, prepayments, and other factors, especially in the absence of broad markets for particular items. Changes in assumptions or in market conditions could significantly affect the estimates.
Reclassifications
Some items in the prior year financial statements were reclassified to conform to the current presentation.
New Accounting Pronouncements
In September 2006, the FASB issued new guidance impacting FASB ASC 820-10, Fair Value Measurements. This Statement defines fair value, establishes a framework for measuring fair value and expands disclosures about fair value measurements. This Statement also establishes a fair value hierarchy about the assumptions used to measure fair value and clarifies assumptions about risk and the effect of a restriction on the sale or use of an asset. The standard was effective for fiscal years beginning after November 15, 2007. In February 2008, the FASB issued Staff Position (FSP) No. 157-2, Effective Date of FASB Statement No. 157, which is currently FASB ASC 820-10. This FSP delayed the effective date of FAS 157 for all nonfinancial assets and nonfinancial liabilities, except those that are recognized or disclosed at fair value on a recurring basis (at least annually) to fiscal years beginning after November 15, 2008, and interim periods within those fiscal years. The adoption of this update did not have a material effect on the results of operations or financial position.
In December 2007, the FASB issued an update to FASB ASC 805, Business Combinations, which establishes principles and requirements for how an acquirer recognizes and measures in its financial statements the identifiable assets acquired, the liabilities assumed, and any noncontrolling interest in an acquiree, including the recognition and measurement of goodwill acquired in a business combination. This update became effective for the Company on January 1, 2009. The impact of the adoption of this standard will depend upon the nature of any future acquisitions.
In December 2007, the FASB issued an update to FASB ASC 810, Consolidation, which changes the accounting and reporting for minority interests, which is recharacterized as noncontrolling interests and classified as a component of equity within the consolidated balance sheets. This update became effective for the Company on January 1, 2009. The adoption did not have a significant impact on the Company’s results of operations or financial position.
Notes to the Consolidated Financial Statements
Dollars in thousands, except per share data
NOTE 1 – Summary of Significant Accounting Policies (continued)
In June 2009, the FASB issued an update to FASB ASC 105, Generally Accepted Accounting Principles. The update is effective for financial statements issued for interim and annual periods ending after September 15, 2009. The FASB Accounting Standards Codification TM will become the source of authoritative GAAP recognized by the FASB to be applied by nongovernmental entities. On the effective date of this Statement, the Codification will supersede all then-existing non-SEC accounting and reporting standards and all the contents in the Codification will carry the same level of authority. Following this Statement, the FASB will not issue new standards in the form of Statements, FASB Staff Positions, or Emerging Issues Task Force Abstracts. The adoption of this standard did not have a material effect on the Company’s results of operations or financial position.
In June 2008, the FASB issued guidance which addresses whether instruments granted in share-based payment transactions are participating securities prior to vesting and, therefore, included in the earnings allocation in computing earnings per share (EPS) under the two-class method. Unvested share-based payment awards that contain non-forfeitable rights to dividends or dividend equivalents (whether paid or unpaid) are participating securities and shall be included in the computation of EPS pursuant to the two-class method. This guidance was effective for financial statements issued for fiscal years beginning after December 15, 2008, and interim periods within those years. All prior-period EPS data presented were to be adjusted retrospectively (including interim financial statements, summaries of earnings, and selected financial data) to conform to the provisions of this guidance. The adoption of this standard did not have a material impact on the Company’s earnings per share.
In April 2009, the FASB issued an update to FASB ASC 320, Recognition and Presentation of Other-Than-Temporary Impairments that amends existing guidance for determining whether impairment is other-than-temporary for debt securities. The update requires an entity to assess whether it intends to sell, or it is more likely than not that it will be required to sell a security in an unrealized loss position before recovery of its amortized cost basis. If either of these criteria is met, the entire difference between amortized cost and fair value is recognized as impairment through earnings. For securities that do not meet the aforementioned criteria, the amount of impairment recognized in earnings is limited to the amount related to credit losses, while impairment related to other factors is recognized in other comprehensive income. The credit loss is determined as the difference between the present value of the cash flows expected to be collected and the amortized cost basis. Additionally, the update expands and increases the frequency of existing disclosures about other-than-temporary impairments for debt and equity securities. This update is effective for interim and annual reporting periods ending after June 15, 2009. The adoption of this update on April 1, 2009 did not have a significant impact on the Company’s results of operations or financial position.
In April 2009, the FASB issued an update to ASC 820, Fair Value Measurement and Disclosures, that emphasizes that even if there has been a significant decrease in the volume and level of activity, the objective of a fair value measurement remains the same. Fair value is the price that would be received to sell an asset or paid to transfer a liability in an orderly transaction (that is, not a forced liquidation or distressed sale) between market participants at the measurement date under current market conditions. The update provides a number of factors to consider when evaluating whether there has been a significant decrease in the volume and level of activity for an asset or liability in relation to normal market activity. In addition, when transactions or quoted prices are not considered orderly, adjustments to those prices based on the weight of available information may be needed to determine the appropriate fair value. The update also requires increased disclosures. This update is effective for interim and annual reporting periods ending after June 15, 2009, and shall be applied prospectively. The adoption of this update did not have a material effect on the results of operations or financial position.
In August 2009, the FASB issued guidance impacting FASB ASC 820, Fair Value Measurements and Disclosures. The update is effective for the first reporting period including interim periods after the issuance. The update reduces potential ambiguity in financial reporting when measuring the fair value of liabilities by providing clarification for circumstances in which quoted prices in an active market for the identical liability is not available. A reporting entity is required to measure fair value using one or more of the following techniques: A valuation technique that uses the quoted price of the identical liability when traded as an asset, quoted prices for similar liabilities or similar liabilities when traded as an asset. Another valuation technique consistent with the principals of FASB ASC 820 would be an income approach such as a present value technique or a market approach based on the amount at the measurement date that the reporting entity would pay to transfer the identical liability or would receive to enter into the identical liability. The adoption of this standard did not have a material effect on the Corporation’s results of operations or financial position.
Notes to the Consolidated Financial Statements
Dollars in thousands, except per share data
NOTE 1 – Summary of Significant Accounting Policies (continued)
Effect of Newly Issued but Not Yet Effective Accounting Standards
On June 12, 2009, the FASB issued new guidance impacting FASB ASC 860, Transfers and Servicing. The new guidance amends ASC 860, and will require more information about transfers of financial assets, including securitization transactions, and where entities have continuing exposure to the risks related to transferred financial assets. It eliminates the concept of a “qualifying special-purpose entity,” changes the requirements for derecognizing financial assets, and requires additional disclosures. The new standard will be effective January 1, 2010 and the adoption of this standard is not expected to have a material effect on the Company’s results of operations or financial position.
On June 12, 2009, the FASB issued new guidance impacting FASB ASC 810-10, Consolidation (Statement No. 167 amends FIN 46(R)). The new guidance replaces the quantitative-based risks and rewards calculation for determining which enterprise, if any, has a controlling financial interest in a variable interest entity with a qualitative approach focused on identifying which enterprise has the power to direct the activities of a variable interest entity (VIE) that most significantly impact the entity’s economic performance and (1) the obligation to absorb losses of the entity or (2) the right to receive benefits from the entity. Unlike previous guidance, this Statement requires ongoing reconsideration of whether (1) an entity is a VIE and (2) an enterprise is the primary beneficiary of a VIE. It is expected that the amendments will result in more entities consolidating VIEs that previously were not consolidated This new guidance will also require additional disclosures about the Company’s involvement in variable interest entities. This new guidance will be effective January 1, 2010 and the adoption of this standard is not expected to have a material effect on the Company’s results of operations or financial position.
NOTE 2 – Securities
The amortized cost, unrealized gross gains and losses recognized in accumulated other comprehensive income (loss), and fair value of Securities Available-for-Sale were as follows:
| | | | | | Gross | | | Gross | | | | |
| | | Amortized | | | Unrealized | | | Unrealized | | | Fair | |
| Securities Available-for-Sale: | | Cost | | | Gains | | | Losses | | | Value | |
| | | | | | | | | | | | | |
| 2009 | | | | | | | | | | | | |
| U.S. Treasury and Agency Securities | | $ | 5,000 | | | $ | — | | | $ | (30 | ) | | $ | 4,970 | |
| Obligations of State and Political Subdivisions | | | 21,511 | | | | 931 | | | | (64 | ) | | | 22,378 | |
| Mortgage-backed Securities - Residential | | | 214,591 | | | | 7,065 | | | | (404 | ) | | | 221,252 | |
| Equity Securities | | | 2,818 | | | | 13 | | | | (491 | ) | | | 2,340 | |
| Total | | $ | 243,920 | | | $ | 8,009 | | | $ | (989 | ) | | $ | 250,940 | |
| | | | | | | | | | | | | | | | | |
| 2008 | | | | | | | | | | | | | | | | |
| U.S. Treasury and Agency Securities | | $ | — | | | $ | — | | | $ | — | | | $ | — | |
| Obligations of State and Political Subdivisions | | | 16,561 | | | | 307 | | | | — | | | | 16,868 | |
| Mortgage-backed Securities - Residential | | | 151,499 | | | | 4,132 | | | | (4 | ) | | | 155,627 | |
| Equity Securities | | | 3,620 | | | | 44 | | | | (319 | ) | | | 3,345 | |
| Total | | $ | 171,680 | | | $ | 4,483 | | | $ | (323 | ) | | $ | 175,840 | |
The carrying amount, unrecognized gains and losses and fair value of Securities Held-to-Maturity were as follows:
| | | | | | Gross | | | Gross | | | | |
| Securities Held-to-Maturity: | | Carrying | | | Unrecognized | | | Unrecognized | | | Fair | |
| | | Amount | | | Gains | | | Losses | | | Value | |
| 2009 | | | | | | | | | | | | |
| Obligations of State and Political Subdivisions | | $ | 2,774 | | | $ | 27 | | | $ | — | | | $ | 2,801 | |
| | | | | | | | | | | | | | | | | |
| 2008 | | | | | | | | | | | | | | | | |
| Obligations of State and Political Subdivisions | | $ | 3,326 | | | $ | 32 | | | $ | — | | | $ | 3,358 | |
Notes to the Consolidated Financial Statements
Dollars in thousands, except per share data
NOTE 2 – Securities (continued)
The amortized cost and fair value of Securities at December 31, 2009 by contractual maturity are shown below. Expected maturities may differ from contractual maturities because some issuers have the right to call or prepay certain obligations with or without call or prepayment penalties. Mortgage-backed and Equity Securities are not due at a single maturity date and are shown separately.
| | | Amortized | | | Fair | |
| | | Cost | | | Value | |
| Securities Available-for-Sale: | | | | | | |
| Due in one year or less | | $ | 1,695 | | | $ | 1,701 | |
| Due after one year through five years | | | 3,320 | | | | 3,467 | |
| Due after five years through ten years | | | 9,186 | | | | 9,157 | |
| Due after ten years | | | 12,310 | | | | 13,023 | |
| Mortgage-backed Securities - Residential | | | 214,591 | | | | 221,252 | |
| Equity Securities | | | 2,818 | | | | 2,340 | |
| Total | | $ | 243,920 | | | $ | 250,940 | |
| | | Carrying | | | Fair | |
| | | Amount | | | Value | |
| Securities Held-to-Maturity: | | | | | | |
| Due in one year or less | | $ | 345 | | | $ | 346 | |
| Due after one year through five years | | | 744 | | | | 754 | |
| Due after five years through ten years | | | 1,365 | | | | 1,380 | |
| Due after ten years | | | 320 | | | | 321 | |
| Total | | $ | 2,774 | | | $ | 2,801 | |
Proceeds from the Sales of Securities are summarized below:
| | | 2009 | | | 2008 | | | 2007 | |
| | | Available- | | | Available- | | | Available- | |
| | | for-Sale | | | for-Sale | | | for-Sale | |
| | | | | | | | | | |
| Proceeds from Sales and Calls | | $ | 379 | | | $ | 53,641 | | | $ | 998 | |
| Gross Gains on Sales and Calls | | | — | | | | 1,031 | | | | 62 | |
| | | | | | | | | | | | | |
| Income Taxes on Gross Gains | | | — | | | | 351 | | | | 25 | |
The carrying value of securities pledged to secure repurchase agreements, public and trust deposits, and for other purposes as required by law was $87,940 and $101,333 as of December 31, 2009 and 2008, respectively.
Below is a summary of securities with unrealized losses as of year-end 2009 and 2008, presented by length of time the securities have been in a continuous unrealized loss position:
At December 31, 2009: | | Less than 12 Months | | | 12 Months or More | | | Total | |
| | | Fair | | | Unrealized | | | Fair | | | Unrealized | | | Fair | | | Unrealized | |
| | | Value | | | Loss | | | Value | | | Loss | | | Value | | | Loss | |
| | | | | | | | | | | | | | | | | | | |
| U.S. Treasury and Agency Securities | | $ | 4,970 | | | $ | (30 | ) | | $ | — | | | $ | — | | | $ | 4,970 | | | $ | (30 | ) |
| Obligations of State and Political Subdivisions | | | 3,419 | | | | (64 | ) | | | — | | | | — | | | | 3,419 | | | | (64 | ) |
Mortgage-backed Securities - Residential | | | 47,726 | | | | (403 | ) | | | 40 | | | | (1 | ) | | | 47,766 | | | | (404 | ) |
| Equity Securities | | | 1,533 | | | | (491 | ) | | | — | | | | — | | | | 1,533 | | | | (491 | ) |
| Total | | $ | 57,648 | | | $ | (988 | ) | | $ | 40 | | | $ | (1 | ) | | $ | 57,688 | | | $ | (989 | ) |
At December 31, 2008: | | Less than 12 Months | | | 12 Months or More | | | Total | |
| | | Fair | | | Unrealized | | | Fair | | | Unrealized | | | Fair | | | Unrealized | |
| | | Value | | | Loss | | | Value | | | Loss | | | Value | | | Loss | |
| | | | | | | | | | | | | | | | | | | |
| U.S. Treasury and Agency Securities | | $ | — | | | $ | — | | | $ | — | | | $ | — | | | $ | — | | | $ | — | |
| Obligations of State and Political Subdivisions | | | — | | | | — | | | | — | | | | — | | | | — | | | | — | |
Mortgage-backed Securities - Residential | | | 1,253 | | | | (2 | ) | | | 617 | | | | (2 | ) | | | 1,870 | | | | (4 | ) |
| Equity Securities | | | 1,705 | | | | (319 | ) | | | — | | | | — | | | | 1,705 | | | | (319 | ) |
| Total | | $ | 2,958 | | | $ | (321 | ) | | $ | 617 | | | $ | (2 | ) | | $ | 3,575 | | | $ | (323 | ) |
Notes to the Consolidated Financial Statements
Dollars in thousands, except per share data
NOTE 2 – Securities (continued)
Securities are written down to fair value when a decline in fair value is not considered temporary. In estimating other-than-temporary losses, management considers many factors, including: (1) the length of time and the extent to which the fair value has been less than cost, (2) the financial condition and near-term prospects of the issuer, (3) whether the market decline was affected by macroeconomic conditions, and (4) whether the Company has the intent to sell the debt security or more likely than not will be required to sell the debt security before its anticipated recovery. The Company doesn’t intend to sell or expect to be required to sell these securities, and the decline in fair value is largely due to changes in market interest rates, therefore, the Company does not consider these securities to be other-than-temporarily impaired. All mortgage-backed securities in the Company’s portfolio are guaranteed by government sponsored entities, are investment grade, and are performing as expected.
The Company’s equity securities consist of non-controlling investments in other banking organizations. When a decline in fair value below cost is deemed to be other-than-temporary, the unrealized loss must be recognized as a charge to earnings. At December 31, 2009 and December 31, 2008, certain equity securities in the Company’s portfolio with fair values below amortized cost were deemed to not be other-than-temporarily impaired due in large part to the overall financial condition of the issuers which included continued profitability throughout 2009 and 2008 and that the fair value of the securities has declined due to difficult macroeconomic conditions for equity security valuations of banking organizations. In addition, the length of time that fair value has been less than cost was assessed and it is fair to expect that fair value can recover to a level greater than cost in a reasonable period of time.
As a result of valuations of the Company’s equity securities portfolio during 2009, the Company recognized a $423 pre-tax charge for an other-than-temporary decline in fair value of this portfolio. Accordingly, the other-than-temporary impairment was recognized in the income statement as an investment securities loss during 2009. A pre-tax charge of $937 for other-than-temporary impairment was also recognized for this portfolio during 2008.
NOTE 3 – Loans
Loans were comprised of the following classifications at December 31:
| | | 2009 | | | 2008 | |
| | | | | | | |
| Commercial and Industrial Loans | | $ | 188,962 | | | $ | 175,828 | |
| Commercial Real Estate Loans | | | 334,255 | | | | 329,363 | |
| Agricultural Loans | | | 156,845 | | | | 159,923 | |
| Consumer Loans | | | 114,736 | | | | 127,343 | |
| Residential Mortgage Loans | | | 84,677 | | | | 100,054 | |
| Total | | $ | 879,475 | | | $ | 892,511 | |
Nonperforming loans were as follows at December 31:
| Loans past due over 90 days and accruing and Restructured Loans | | $ | 419 | | | $ | 34 | |
| Non-accrual Loans | | | 8,374 | | | | 8,316 | |
| Total | | $ | 8,793 | | | $ | 8,350 | |
| Information regarding impaired loans: | | 2009 | | | 2008 | | |
| | | | | | | | |
| Year-end impaired loans with no allowance for loan losses allocated | | $ | 1,213 | | | $ | 1,713 | | |
| Year-end impaired loans with allowance for loan losses allocated | | | 6,932 | | | | 4,232 | | |
| | | | | | | | | | |
| Amount of allowance allocated to impaired loans | | | 3,024 | | | | 1,797 | | |
| | | 2009 | | | 2008 | | | 2007 | |
| Average balance of impaired loans during the year | | $ | 6,676 | | | $ | 5,787 | | | $ | 7,376 | |
| | | | | | | | | | | | | |
| Interest income recognized during impairment | | | 73 | | | | 161 | | | | 314 | |
| Interest income recognized on cash basis | | | 71 | | | | 161 | | | | 304 | |
Notes to the Consolidated Financial Statements
Dollars in thousands, except per share data
NOTE 3 – Loans (continued)
Certain directors, executive officers, and principal shareholders of the Company, including their immediate families and companies in which they are principal owners, were loan customers of the Company during 2009. A summary of the activity of these loans follows:
| Balance | | | | | | Changes | | | | | | Balance | |
| January 1, | | | | | | in Persons | | | Deductions | | | December 31, | |
| 2009 | | | Additions | | | Included | | | Collected | | | Charged-off | | | 2009 | |
| $7,386 | | | $3,633 | | | $(1,260) | | | $(5,330) | | | $— | | | $4,429 | |
NOTE 4 – Allowance for Loan Losses
A summary of the activity in the Allowance for Loan Losses follows:
| | | 2009 | | | 2008 | | | 2007 | |
| | | | | | | | | | |
| Balance as of January 1 | | $ | 9,522 | | | $ | 8,044 | | | $ | 7,129 | |
| Provision for Loan Losses | | | 3,750 | | | | 3,990 | | | | 3,591 | |
| Recoveries of Prior Loan Losses | | | 918 | | | | 612 | | | | 568 | |
| Loan Losses Charged to the Allowance | | | (3,174 | ) | | | (3,124 | ) | | | (3,244 | ) |
| Balance as of December 31 | | $ | 11,016 | | | $ | 9,522 | | | $ | 8,044 | |
NOTE 5 – Premises, Furniture, and Equipment
Premises, furniture, and equipment was comprised of the following classifications at December 31:
| | | 2009 | | | 2008 | |
Land | | $ | 4,653 | | | $ | 4,540 | |
| Buildings and Improvements | | | 29,353 | | | | 28,114 | |
| Furniture and Equipment | | | 17,397 | | | | 16,922 | |
| Total Premises, Furniture and Equipment | | | 51,403 | | | | 49,576 | |
| Less: Accumulated Depreciation | | | (29,250 | ) | | | (27,246 | ) |
| Total | | $ | 22,153 | | | $ | 22,330 | |
Depreciation expense was $2,772, $2,509, and $2,368 for 2009, 2008, and 2007, respectively.
The Company leases one of its branch buildings under a capital lease. The lease arrangement requires monthly payments through 2027.
The Company has included this lease in buildings and improvements as follows:
| | | 2009 | | | 2008 | |
Capital Lease | | $ | 743 | | | $ | 743 | |
| Less: Accumulated Depreciation | | | (108 | ) | | | (72 | ) |
| Total | | $ | 635 | | | $ | 671 | |
The following is a schedule of future minimum lease payments under the capital lease, together with the present value of net minimum lease payments at year end 2009:
| 2010 | | $ | 81 | |
| 2011 | | | 81 | |
| 2012 | | | 81 | |
| 2013 | | | 81 | |
| 2014 | | | 81 | |
| Thereafter | | | 1,022 | |
| Total minimum lease payments | | | 1,427 | |
| Less: Amount representing interest | | | (726 | ) |
| Present Value of Net Minimum Lease Payments | | $ | 701 | |
Notes to the Consolidated Financial Statements
Dollars in thousands, except per share data
NOTE 6 – Deposits
At year-end 2009, stated maturities of time deposits were as follows:
| 2010 | | $ | 109,685 | |
| 2011 | | | 134,195 | |
| 2012 | | | 74,965 | |
| 2013 | | | 9,076 | |
| 2014 | | | 1,390 | |
| Thereafter | | | 365 | |
| Total | | $ | 329,676 | |
Time deposits of $100 or more at December 31, 2009 and 2008 were $63,276 and $69,129, respectively.
Time deposits originated from outside the geographic area, generally through brokers, totaled $10,000 and $35,000 at December 31, 2009 and 2008, respectively.
NOTE 7 – FHLB Advances and Other Borrowed Money; Subordinated Debentures
The Company’s funding sources include Federal Home Loan Bank advances, borrowings from other third party correspondent financial institutions, issuance and sale of subordinated debt and other capital securities, and repurchase agreements. Information regarding each of these types of borrowings or other indebtedness is as follows:
| | | December 31, | |
| | | 2009 | | | 2008 | |
Long-term Advances from Federal Home Loan Bank collateralized by qualifying mortgages, investment securities, and mortgage-backed securities | | $ | 77,369 | | | $ | 87,392 | |
| Term Loans | | | 6,000 | | | | 7,500 | |
| Subordinated Debentures | | | 29,250 | | | | 10,000 | |
| Capital Lease Obligation | | | 701 | | | | 716 | |
| Long-term Borrowings | | | 113,320 | | | | 105,608 | |
| | | | | | | | | |
Overnight Variable Rate Advances from Federal Home Loan Bank collateralized by qualifying mortgages, investment securities, and mortgage-backed securities | | $ | 1,300 | | | $ | — | |
| Repurchase Agreements | | | 33,501 | | | | 26,056 | |
| Short-term Borrowings | | | 34,801 | | | | 26,056 | |
| | | | | | | | | |
| Total Borrowings | | $ | 148,121 | | | $ | 131,664 | |
Repurchase agreements, which are classified as secured borrowings, generally mature within one day of the transaction date. Repurchase agreements are reflected at the amount of cash received in connection with the transaction. The Company may be required to provide additional collateral based on the value of the underlying securities.
| | | 2009 | | | 2008 | |
| Average Daily Balance During the Year | | $ | 24,231 | | | $ | 30,995 | |
| Average Interest Rate During the Year | | | 0.73 | % | | | 1.52 | % |
| Maximum Month-end Balance During the Year | | $ | 33,501 | | | $ | 42,975 | |
| Weighted Average Interest at Year-end | | | 0.50 | % | | | 0.82 | % |
At December 31, 2009 interest rates on the fixed rate long-term FHLB advances ranged from .47% to 7.22% with a weighted average rate of 4.08%. Of the $78.7 million, $55.0 million or 70% of the advances contained options whereby the FHLB may convert the fixed rate advance to an adjustable rate advance, at which time the Company may prepay the advance without penalty.
At December 31, 2008 interest rates on the fixed rate long-term FHLB advances ranged from 2.76% to 7.22% with a weighted average rate of 4.66%. Of the $87.4 million, $65.0 million or 74% of the advances contained options whereby the FHLB may convert the fixed rate advance to an adjustable rate advance, at which time the Company may prepay the advance without penalty. The options on these advances are subject to a variety of terms including LIBOR based strike rates.
Notes to the Consolidated Financial Statements
Dollars in thousands, except per share data
NOTE 7 – FHLB Advances and Other Borrowed Money; Subordinated Debentures (continued)
The long-term borrowings shown above includes $6 million and $7.5 million outstanding on a term loan owed by the parent company as of December 31, 2009 and 2008, respectively. Interest on the term loan is based upon 90-day LIBOR plus 1.15%. The term loan matures January 1, 2014. At December 31, 2009, the parent company had a $10 million line of credit with no outstanding balance. The line of credit matures September 30, 2010. Interest on the line of credit is based upon 90-day LIBOR plus 3.00% and includes an unused commitment fee of 0.35%. At December 31, 2008, the parent company had a $10 million line of credit with no outstanding balance. Interest on the line of credit is based upon 90-day LIBOR plus 1.65% and includes an unused commitment fee of 0.35%. The line of credit was renewed and extended in December 2009 and September 2008.
At December 31, 2009, the long-term borrowings shown above includes an aggregate of $29.3 million of indebtedness represented by subordinated debentures issued by the Company’s parent company in two separate transactions. A $10 million subordinated debenture issued by the parent company to another bank, bears interest based upon 90-day LIBOR plus 1.35%. This subordinated debenture matures on January 1, 2014. 80% of this subordinated debenture was treated as Tier 2 capital for regulatory capital purposes as of December 31, 2009. On April 30, 2009 the parent company issued $19.3 million principal amount of 8% redeemable subordinated debentures to the public. These debentures will mature in a single payment of principal on March 30, 2019. The Company has the right to redeem these debentures without penalty or premium on or after March 30, 2012 subject to prior consultation with the Federal Reserve Board. The entire principal amount of these debentures was treated as Tier 2 capital for regulatory capital purposes as of December 31, 2009.
At December 31, 2008, the long-term borrowings shown above included the above-described $10 million subordinated debenture owed by the parent company. The entire principal amount of the subordinated debenture was treated as Tier 2 capital for regulatory capital purposes as of December 31, 2008.
Scheduled principal payments on long-term borrowings, excluding the capitalized lease obligation, at December 31, 2009 are as follows:
| 2010 | | $ | 30,787 | |
| 2011 | | | 1,530 | |
| 2012 | | | 21,533 | |
| 2013 | | | 16,536 | |
| 2014 | | | 11,539 | |
| Thereafter | | | 30,694 | |
| Total | | $ | 112,619 | |
See also Note 5 regarding the capital lease obligation.
NOTE 8 – Stockholders’ Equity
The Company and affiliate bank are subject to regulatory capital requirements administered by federal banking agencies. Capital adequacy guidelines and prompt corrective action regulations involve quantitative measures of assets, liabilities, and certain off-balance sheet items calculated under regulatory accounting practices. Capital amounts and classifications are also subject to qualitative judgments by regulators about components, risk weightings, and other factors, and the regulators can lower classifications in certain cases. Failure to meet various capital requirements can initiate regulatory action that could have a direct material effect on the financial statements. Management believes as of December 31, 2009, the Company and Bank meet all capital adequacy requirements to which it is subject.
The prompt corrective action regulations provide five classifications, including well-capitalized, adequately capitalized, undercapitalized, significantly undercapitalized, and critically undercapitalized, although these terms are not used to represent overall financial condition. If adequately capitalized, regulatory approval is required to accept brokered deposits. If undercapitalized, capital distributions are limited, as is asset growth and expansion, and plans for capital restoration are required.
Notes to the Consolidated Financial Statements
Dollars in thousands, except per share data
NOTE 8 – Stockholders’ Equity (continued)
At December 31, 2009, consolidated and affiliate bank actual capital and minimum required levels are presented below:
| | | | | | | | | Minimum Required | |
| | | | | | | | | To Be Well- | |
| | | | | | Minimum Required | | | Capitalized Under | |
| | | | | | For Capital | | | Prompt Corrective | |
| | | Actual | | | Adequacy Purposes: | | | Action Regulations: | |
| | | Amount | | | Ratio | | | Amount | | | Ratio | | | Amount | | | Ratio | |
| Total Capital | | | | | | | | | | | | | | | | | | |
| (to Risk Weighted Assets) | | | | | | | | | | | | | | | | | | |
| Consolidated | | $ | 135,153 | | | | 14.09 | % | | $ | 76,738 | | | | 8.00 | % | | | N/A | | | | N/A | |
| Bank | | | 129,874 | | | | 13.62 | | | | 76,266 | | | | 8.00 | | | $ | 95,333 | | | | 10.00 | % |
| | | | | | | | | | | | | | | | | | | | | | | | | |
| Tier 1 Capital | | | | | | | | | | | | | | | | | | | | | | | | |
| (to Risk Weighted Assets) | | | | | | | | | | | | | | | | | | | | | | | | |
| Consolidated | | $ | 96,887 | | | | 10.10 | % | | $ | 38,369 | | | | 4.00 | % | | | N/A | | | | N/A | |
| Bank | | | 118,858 | | | | 12.47 | | | | 38,133 | | | | 4.00 | | | $ | 57,200 | | | | 6.00 | % |
| | | | | | | | | | | | | | | | | | | | | | | | | |
| Tier 1 Capital | | | | | | | | | | | | | | | | | | | | | | | | |
| (to Average Assets) | | | | | | | | | | | | | | | | | | | | | | | | |
| Consolidated | | $ | 96,887 | | | | 7.64 | % | | $ | 50,730 | | | | 4.00 | % | | | N/A | | | | N/A | |
| Bank | | | 118,858 | | | | 9.50 | | | | 50,048 | | | | 4.00 | | | $ | 62,560 | | | | 5.00 | % |
At December 31, 2008, consolidated and affiliate bank actual capital and minimum required levels are presented below:
| | | | | | | | | Minimum Required | |
| | | | | | | | | To Be Well- | |
| | | | | | Minimum Required | | | Capitalized Under | |
| | | | | | For Capital | | | Prompt Corrective | |
| | | Actual | | | Adequacy Purposes: | | | Action Regulations: | |
| | | Amount | | | Ratio | | | Amount | | | Ratio | | | Amount | | | Ratio | |
| Total Capital | | | | | | | | | | | | | | | | | | |
| (to Risk Weighted Assets) | | | | | | | | | | | | | | | | | | |
| Consolidated | | $ | 109,029 | | | | 11.42 | % | | $ | 76,387 | | | | 8.00 | % | | | N/A | | | | N/A | |
| Bank | | | 107,243 | | | | 11.32 | | | | 75,782 | | | | 8.00 | | | $ | 94,727 | | | | 10.00 | % |
| | | | | | | | | | | | | | | | | | | | | | | | | |
| Tier 1 Capital | | | | | | | | | | | | | | | | | | | | | | | | |
| (to Risk Weighted Assets) | | | | | | | | | | | | | | | | | | | | | | | | |
| Consolidated | | $ | 89,507 | | | | 9.37 | % | | $ | 38,193 | | | | 4.00 | % | | | N/A | | | | N/A | |
| Bank | | | 97,721 | | | | 10.32 | | | | 37,891 | | | | 4.00 | | | $ | 56,836 | | | | 6.00 | % |
| | | | | | | | | | | | | | | | | | | | | | | | | |
| Tier 1 Capital | | | | | | | | | | | | | | | | | | | | | | | | |
| (to Average Assets) | | | | | | | | | | | | | | | | | | | | | | | | |
| Consolidated | | $ | 89,507 | | | | 7.54 | % | | $ | 47,512 | | | | 4.00 | % | | | N/A | | | | N/A | |
| Bank | | | 97,721 | | | | 8.29 | | | | 47,161 | | | | 4.00 | | | $ | 58,952 | | | | 5.00 | % |
The Company and the affiliate bank at year-end 2009 and 2008 were categorized as well-capitalized. There have been no conditions or events that management believes have changed the classification of the Company or affiliate bank under the prompt corrective action regulations since the last notification from regulators. Regulations require the maintenance of certain capital levels at the affiliate bank, and may limit the dividends payable by the affiliate to the holding company, or by the holding company to its shareholders. At December 31, 2009, the affiliate bank had $34,500 in retained earnings available for payment of dividends to the parent company without prior regulatory approval.
Equity Plans and Equity Based Compensation
The Company maintains three equity incentive plans under which stock options, restricted stock, and other equity incentive awards can be granted. At December 31, 2009, the Company has reserved 657,956 shares of Common Stock (as adjusted for subsequent stock dividends and subject to further customary anti-dilution adjustments) for the purpose of issuance pursuant to outstanding and future grants of options, restricted stock, and other equity awards to officers, directors and other employees of the Company.
Notes to the Consolidated Financial Statements
Dollars in thousands, except per share data
NOTE 8 – Stockholders’ Equity (continued)
Stock Options
Options may be designated as “incentive stock options” under the Internal Revenue Code of 1986, or as nonqualified options. While the date after which options are first exercisable is determined by the Long-Term Incentive Award Committee of the Company or, in the case of options granted to directors, by the Board of Directors, no stock option may be exercised after ten years from the date of grant (twenty years in the case of nonqualified stock options). The exercise price of stock options granted pursuant to the Plans must be no less than the fair market value of the Common Stock on the date of the grant.
The Plans authorize an optionee to pay the exercise price of options in cash or in common shares of the Company or in some combination of cash and common shares. An optionee may tender already-owned common shares to the Company in exercise of an option. The Company typically issues authorized but unissued common shares upon the exercise of options.
The following table presents activity for stock options under the Company’s equity incentive plan for 2009:
| | | Year Ended December 31, 2009 | |
| | | | | | | | | Weighted Average | | | | |
| | | Number of | | | Average Price | | | Life of Options | | | Intrinsic | |
| | | Options | | | of Options | | | (in years) | | | Value | |
| | | | | | | | | | | | | |
| Outstanding at Beginning of Period | | | 248,871 | | | $ | 16.25 | | | | | | | | | |
| Granted | | | — | | | | — | | | | | | | | | |
| Exercised | | | (30,035 | ) | | | 14.50 | | | | | | | | | |
| Forfeited | | | (2,992 | ) | | | 13.49 | | | | | | | | | |
| Expired | | | (57,888 | ) | | | 16.77 | | | | | | | | | |
| Outstanding & Exercisable at End of Period | | | 157,956 | | | $ | 16.44 | | | | 5.90 | | | $ | 150 | |
The following table presents information related to stock options under the Company’s equity incentive plan during the years ended 2009, 2008, and 2007:
| | | 2009 | | | 2008 | | | 2007 | |
| | | | | | | | | | |
| Intrinsic Value of Options Exercised | | $ | 55 | | | $ | — | | | $ | — | |
| Cash Received from Option Exercises | | $ | — | | | $ | — | | | $ | — | |
| Tax Benefit of Option Exercises | | $ | 10 | | | $ | — | | | $ | — | |
| Weighted Average Fair Value of Options Granted | | $ | — | | | $ | — | | | $ | — | |
The intrinsic value for stock options is calculated based on the exercise price of the underlying awards and the market price of common stock as of the reporting date.
During 2009 and 2008, the Company granted no options, and accordingly, recorded no stock compensation expense related to option grants. The Company recorded no other stock compensation expense applicable to options during the years ended December 31, 2009, 2008, and 2007 because all outstanding options were fully vested prior to 2007. As of December 31, 2009 and 2008, there was no unrecognized option expense as all outstanding options were fully vested.
Restricted Stock
During the periods presented, awards of long-term incentives were granted in the form of restricted stock, granted in tandem with cash credit entitlements. The incentive awards will typically be in the form of 50% restricted stock grants and 50% cash credit entitlements. The restricted stock grants and tandem cash credit entitlements are subject to forfeiture in the event that the recipient of the grant does not continue employment with the Company through December 15 of the year of grant, at which time they generally vest 100 percent. For measuring compensation costs, restricted stock awards are valued based upon the market value of the common shares on the date of grant.
Notes to the Consolidated Financial Statements
Dollars in thousands, except per share data
NOTE 8 – Stockholders’ Equity (continued)
The expense recorded for the restricted stock grants totaled $485 (or $293, net of an income tax benefit of $192) during the year ended December 31, 2009. The expense recorded for the restricted stock grants totaled $10 (or $6, net of an income tax benefit of $4) during the year ended December 31, 2008. The expense recorded for the restricted stock grants totaled $283 (or $171, net of an income tax benefit of $112) during the year ended December 31, 2007. There was no unrecognized expense associated with the restricted stock grants as of December 31, 2009 and 2008.
The following table presents information on restricted stock grants outstanding for the period shown:
| | | Year Ended | |
| | | December 31, 2009 | |
| | | | | | Weighted | |
| | | Restricted | | | Average Market | |
| | | Shares | | | Price at Grant | |
| | | | | | | |
| Outstanding at Beginning of Period | | | — | | | $ | — | |
| Granted | | | 43,740 | | | | 11.08 | |
| Issued and Vested | | | 43,740 | | | | 11.08 | |
| Forfeited | | | — | | | | — | |
| Outstanding at End of Period | | | — | | | | — | |
Employee Stock Purchase Plan
The Company maintains an Employee Stock Purchase Plan whereby eligible employees have the option to purchase the Company’s common stock at a discount. The plan year for the Employee Stock Purchase Plan runs from August 17 through August 16 of the subsequent year. For years prior to the plan year beginning August 17, 2007, the purchase price of the shares was determined annually and in the range from 85% to 100% of the fair market value of such stock at either the beginning or end of the plan year. For subsequent plan years, the purchase price of the shares under this Plan has been set at 95% of the fair market value of the Company’s common stock as of the last day of the plan year. The plan provides for the purchase of up to 542,420 shares of common stock, which the Company may obtain by purchases on the open market or from private sources, or by issuing authorized but unissued common shares. Funding for the purchase of common stock is from employee and Company contributions.
Based on the above referenced setting of the purchase price at 95% of the fair market value of the Company’s common stock and elimination of the look-back feature for the 2007/2008, 2008/2009, and the 2009/2010 plan years, the Employee Stock Purchase Plan was not and will not be considered compensatory and no expense was or will be recorded during the 2007/2008, 2008/2009, and the 2009/2010 plan years. There was no expense recorded for the employee stock purchase plan in 2009 and 2008. The expense recorded for the employee stock purchase plan totaled $47 (or $28, net of an income tax benefit of $19) during the year ended December 31, 2007. There was no unrecognized compensation expense as of December 31, 2009 and 2008 for the Employee Stock Purchase Plan.
In 2009, the Company adopted an Employee Stock Purchase Plan to replace the existing Employee Stock Purchase Plan that expired at the end of the 2008/2009 plan year. The Plan adopted during 2009 has substantially the same terms as the existing Plan and 500,000 shares of common stock have been reserved for issuance under the newly adopted plan. No shares have been issued under the newly adopted Plan.
Stock Repurchase Plan
On April 26, 2001, the Company announced that its Board of Directors approved a stock repurchase program for up to 607,754 of the outstanding Common Shares of the Company. Shares may be purchased from time to time in the open market and in large block privately negotiated transactions. The Company is not obligated to purchase any shares under the program, and the program may be discontinued at any time before the maximum number of shares specified by the program are purchased. As of December 31, 2009, the Company had purchased 334,965 shares under the program. No shares were purchased under the program during the year ended December 31, 2009.
Notes to the Consolidated Financial Statements
Dollars in thousands, except per share data
NOTE 9 – Employee Benefit Plans
The Company provides a contributory trusteed 401(k) deferred compensation and profit sharing plan, which covers substantially all employees. The Company agrees to match certain employee contributions under the 401(k) portion of the plan, while profit sharing contributions are discretionary and are subject to determination by the Board of Directors. Company contributions were $562, $560, and $552 for 2009, 2008 and 2007, respectively.
The Company self-insures employee health benefits. Stop loss insurance covers annual losses exceeding $85 per covered individual. Management’s policy is to establish a reserve for claims not submitted by a charge to earnings based on prior experience. Charges to earnings were $2,476, $1,387, and $1,495 for 2009, 2008 and 2007, respectively.
The Company maintains deferred compensation plans for the benefit of certain directors and officers. Under the plans, the Company agrees in return for the directors and officers deferring the receipt of a portion of their current compensation, to pay a retirement benefit computed as the amount of the compensation deferred plus accrued interest at a variable rate. Accrued benefits payable totaled $2,735 and $2,678 at December 31, 2009 and 2008. Deferred compensation expense was $429, $229, and $121 for 2009, 2008 and 2007, respectively. In conjunction with the plans, the Company purchased life insurance on certain directors and officers.
The Company entered into early retirement agreements with certain officers of the Company during 2008. Accrued benefits payable as a result of the agreements totaled $615 and $701 at December 31, 2009 and 2008, respectively. Expense associated with these agreements totaled $110 and $718 during 2009 and 2008, respectively. The benefits under the agreements will be paid through 2017.
The Company acquired through previous bank mergers a noncontributory defined benefit pension plan with benefits based on years of service and compensation prior to retirement. The benefits under the plan were suspended in 1998. During the years ended 2009 and 2008, there were no losses incurred on partial settlements of the plan. Partial settlements of the plan were $46 during the year ended 2007.
In September 2006, the Financial Accounting Standards Board (FASB) issued guidance which requires that defined benefit plan assets and obligations to be measured as of the date of the employer’s fiscal year-end, starting in 2008. Through 2007, the Company utilized the early measurement date, and measured the funded status of the defined benefit plan assets and obligations as of September 30 each year. The net periodic benefit cost for the period between the September 30 measurement date and the 2008 fiscal year end measurement was simply recognized during 2008 given the nature of this suspended plan and immateriality of the net periodic pension cost for this additional quarter.
Accumulated plan benefit information for the Company’s plan as of December 31, 2009 and 2008 was as follows:
| Changes in Benefit Obligation: | | 2009 | | | 2008 | |
| Obligation at Beginning of Year | | $ | 620 | | | $ | 615 | |
| Interest Cost | | | 36 | | | | 46 | |
| Benefits Paid | | | (65 | ) | | | (52 | ) |
| Actuarial (Gain) Loss | | | 83 | | | | 11 | |
| Obligation at End of Year | | | 674 | | | | 620 | |
| | | | | | | | | |
| Changes in Plan Assets: | | | | | | | | |
| Fair Value at Beginning of Year | | | 331 | | | | 270 | |
| Actual Return on Plan Assets | | | (1 | ) | | | 14 | |
| Employer Contributions | | | 24 | | | | 99 | |
| Benefits Paid | | | (65 | ) | | | (52 | ) |
| Fair Value at End of Year | | | 289 | | | | 331 | |
| | | | | | | | | |
| Funded Status: | | | | | | | | |
| | | | | | | | | |
| Funded Status at End of Year | | $ | (385 | ) | | $ | (289 | ) |
Notes to the Consolidated Financial Statements
Dollars in thousands, except per share data
NOTE 9 – Employee Benefit Plans (continued)
Amounts recognized in accumulated other comprehensive income at December 31 consist of:
| Net Loss (Gain) | | $ | 268 | | | $ | 193 | |
| Prior Service Cost | | | 12 | | | | 9 | |
| | | $ | 280 | | | $ | 202 | |
The accumulated benefit obligation was $674 and $620 at year-end 2009 and 2008, respectively.
Because the plan has been suspended, the projected benefit obligation and accumulated benefit obligation are the same. The accumulated benefit obligation for the defined benefit pension plan exceeds the fair value of the assets included in the plan.
Components of Net Periodic Benefit Cost and Other Amounts Recognized in Other Comprehensive Income
| | | 2009 | | | 2008 | | | 2007 | |
| | | | | | | | | | |
| Interest Cost | | $ | 36 | | | $ | 37 | | | $ | 37 | |
| Expected Return on Assets | | | (7 | ) | | | (13 | ) | | | (12 | ) |
| Amortization of Transition Amount | | | — | | | | (1 | ) | | | (1 | ) |
| Amortization of Prior Service Cost | | | (3 | ) | | | (3 | ) | | | (3 | ) |
| Recognition of Net Loss | | | 16 | | | | 21 | | | | 27 | |
| Net Periodic Benefit Cost | | $ | 42 | | | $ | 41 | | | $ | 48 | |
| | | | | | | | | | | | | |
| Net Loss During the Period | | | 91 | | | | 11 | | | | 2 | |
| Amortization of Unrecognized Loss | | | (16 | ) | | | (16 | ) | | | (74 | ) |
| Amortization of Transition Cost | | | — | | | | 1 | | | | 1 | |
| Amortization of Prior Service Cost | | | 3 | | | | 4 | | | | 3 | |
| Total Recognized in Other Comprehensive Income | | | 78 | | | | — | | | | (68 | ) |
| | | | | | | | | | | | | |
| Total Recognized in Net Periodic Benefit Cost and Other | | | | | | | | | | | | |
| Comprehensive Income | | $ | 120 | | | $ | 41 | | | $ | (20 | ) |
The estimated net loss, prior service costs, and net transition obligation (asset) for the defined benefit pension plan that will be amortized from accumulated other comprehensive income into net periodic benefit cost over the next fiscal year are $25, $(3), and $0, respectively.
Assumptions
Weighted-average assumptions used to determine benefit obligations at year-end:
| | | 2009 | | | 2008 | | | 2007 | |
| Discount Rate | | | 5.29 | % | | | 6.17 | % | | | 6.25 | % |
Rate of Compensation Increase (1) | | | N/A | | | | N/A | | | | N/A | |
| | | | | | | | | | | | | |
| Weighted-average assumptions used to determine net periodic pension cost: | | | | | | | | | | | | |
| | | 2009 | | | 2008 | | | 2007 | |
| Discount Rate | | | 6.17 | % | | | 6.25 | % | | | 5.75 | % |
| Expected Return on Plan Assets | | | 2.20 | % | | | 4.50 | % | | | 4.75 | % |
Rate of Compensation Increase (1) | | | N/A | | | | N/A | | | | N/A | |
(1) Benefits under the plan were suspended in 1998; therefore, the weighted-average rate of increase in future compensation levels was not applicable for all years presented.
Notes to the Consolidated Financial Statements
Dollars in thousands, except per share data
NOTE 9 – Employee Benefit Plans (continued)
The expected return on plan assets was determined based upon rates that are expected to be available for future reinvestment of earnings and maturing investments along with consideration given to the current mix of plan assets.
Plan Assets
The Company’s defined benefit pension plan asset allocation at year-end 2009 and 2008 and target allocation for 2010 by asset category are as follows:
| | | Target Allocation | | | Percentage of Plan Assets at Year-end | |
| Asset Category | | 2010 | | | 2009 | | | 2008 | |
| | | | | | | | | | |
| Cash | | | 50 | % | | | 100 | % | | | 71 | % |
| Certificates of Deposit | | | 50 | % | | | — | % | | | 29 | % |
| Total | | | 100 | % | | | 100 | % | | | 100 | % |
Plan benefits are suspended. Therefore, the Company has invested predominantly in relatively short-term investments over the past two years. No significant changes to investing strategies are anticipated.
Fair Value of Plan Assets
Fair value is the exchange price that would be received for an asset in the principal or most advantageous market for the asset in an orderly transaction between market participants on the measurement date. Since plan assets consist of cash, there are no estimates or assumptions applied to determine fair value.
Postretirement Medical and Life Benefit Plan
The Company has an unfunded postretirement benefit plan covering substantially all of its employees. The medical plan is contributory with the participants’ contributions adjusted annually; the life insurance plans are noncontributory.
Changes in Accumulated Postretirement Benefits Obligations
| | | 2009 | | | 2008 | |
| Obligation at the Beginning of Year | | $ | 450 | | | $ | 619 | |
| Unrecognized Loss (Gain) | | | 7 | | | | (174 | ) |
| | | | | | | | | |
| Components of Net Periodic Postretirement Benefit Cost | | | | | | | | |
| Service Cost | | | 17 | | | | 35 | |
| Interest Cost | | | 25 | | | | 34 | |
| | | | | | | | | |
| Net Expected Benefit Payments | | | (53 | ) | | | (64 | ) |
| Obligation at End of Year | | $ | 446 | | | $ | 450 | |
Components of Postretirement Benefit Expense
| | | 2009 | | | 2008 | |
| Service Cost | | $ | 17 | | | $ | 35 | |
| Interest Cost | | | 25 | | | | 34 | |
| Net Postretirement Benefit Expense | | | 42 | | | | 69 | |
| | | | | | | | | |
| Net Gain During Period Recognized in Other Comprehensive Income | | | — | | | | (238 | ) |
| | | | | | | | | |
| Total Recognized in Net Postretirement Benefit Expense | | | | | | | | |
| and Other Comprehensive Income | | $ | 42 | | | $ | (169 | ) |
Notes to the Consolidated Financial Statements
Dollars in thousands, except per share data
NOTE 9 – Employee Benefit Plans (continued)
Assumptions Used to Determine Net Periodic Cost and Benefit Obligations:
| | | 2009 | | | 2008 | | | 2007 | |
| Discount Rate | | | 6.00 | % | | | 6.00 | % | | | 5.50 | % |
Assumed Health Care Cost Trend Rates at Year-end:
| | | 2009 | | | 2008 | |
| Health Care Cost Trend Rate Assumed for Next Year | | | 8.00 | % | | | 8.00 | % |
| Rate that the Cost Trend Rate Gradually Declines to | | | 4.50 | % | | | 4.50 | % |
| Year that the Rate Reaches the Rate it is Assumed to Remain at | | 2016 | | | 2015 | |
Assumed health care cost trend rates have a significant effect on the amounts reported for the health care plans. A one-percentage-point change in assumed health care cost trend rates would have the following effects:
| | | One-Percentage-Point | | | One-Percentage-Point | |
| | | Increase | | | Decrease | |
| Effect on Total of Service and Interest Cost | | $ | 3 | | | $ | (3 | ) |
| Effect on Postretirement Benefit Obligation | | $ | 25 | | | $ | (23 | ) |
Pension and Other Benefit Plans
Contributions
The Company expects to contribute $75 to its defined benefit pension plan and $38 to its postretirement medical and life insurance plan in 2010.
Estimated Future Benefits
The following benefit payments, which reflect expected future service, are expected to be paid:
| | | Pension | | | Postretirement | |
| Year | | Benefits | | | Benefits | |
| 2010 | | $ | 58 | | | $ | 38 | |
| 2011 | | | 53 | | | | 48 | |
| 2012 | | | 49 | | | | 40 | |
| 2013 | | | 104 | | | | 42 | |
| 2014 | | | 41 | | | | 39 | |
| 2015-2019 | | | 303 | | | | 272 | |
Notes to the Consolidated Financial Statements
Dollars in thousands, except per share data
NOTE 10 – Income Taxes
| The provision for income taxes consists of the following: | | 2009 | | | 2008 | | | 2007 | |
| Current Federal | | $ | 4,424 | | | $ | 4,604 | | | $ | 2,991 | |
| Current State | | | 25 | | | | 476 | | | | 504 | |
| Deferred Federal | | | (192 | ) | | | 719 | | | | 634 | |
| Deferred State | | | (244 | ) | | | (161 | ) | | | (27 | ) |
| Total | | $ | 4,013 | | | $ | 5,638 | | | $ | 4,102 | |
Income tax expense is reconciled to the 34% statutory rate applied to pre-tax income as follows:
| | | 2009 | | | 2008 | | | 2007 | |
| Statutory Rate Times Pre-tax Income | | $ | 5,518 | | | $ | 6,270 | | | $ | 4,592 | |
| Add (Subtract) the Tax Effect of: | | | | | | | | | | | | |
| | | | | | | | | | | | | |
| Income from Tax-exempt Loans and Investments | | | (512 | ) | | | (351 | ) | | | (346 | ) |
| State Income Tax, Net of Federal Tax Effect | | | (145 | ) | | | 208 | | | | 315 | |
| General Business Tax Credits | | | (466 | ) | | | (182 | ) | | | (182 | ) |
| Dividends Received Deduction | | | (5 | ) | | | (22 | ) | | | — | |
| Company Owned Life Insurance | | | (375 | ) | | | (269 | ) | | | (280 | ) |
| Other Differences | | | (2 | ) | | | (16 | ) | | | 3 | |
| Total Income Taxes | | $ | 4,013 | | | $ | 5,638 | | | $ | 4,102 | |
The net deferred tax asset (liability) at December 31 consists of the following:
| | | 2009 | | | 2008 | | |
| Deferred Tax Assets: | | | | | | | |
| Allowance for Loan Losses | | $ | 3,815 | | | $ | 2,871 | | |
| Deferred Compensation and Employee Benefits | | | 1,585 | | | | 1,535 | | |
| Other-than-temporary Impairment | | | 401 | | | | 676 | | |
| Accrued Expenses | | | 440 | | | | 487 | | |
| Business Combination Fair Value Adjustments | | | 14 | | | | 23 | | |
| Pension and Postretirement Plans | | | 1 | | | | — | | |
| Other | | | 271 | | | | 113 | | |
| Total Deferred Tax Assets | | | 6,527 | | | | 5,705 | | |
| Deferred Tax Liabilities: | | | | | | | | | |
| Depreciation | | | (179 | ) | | | (345 | ) | |
| Leasing Activities, Net | | | (3,580 | ) | | | (3,254 | ) | |
| Investment in Low Income Housing Partnerships | | | (392 | ) | | | (262 | ) | |
| Unrealized Appreciation on Securities | | | (2,404 | ) | | | (1,451 | ) | |
| FHLB Stock Dividends | | | (440 | ) | | | (440 | ) | |
| Prepaid Expenses | | | (394 | ) | | | (408 | ) | |
| Intangibles | | | (105 | ) | | | (254 | ) | |
| Pension and Postretirement Plans | | | — | | | | (30 | ) | |
| Other | | | (276 | ) | | | (18 | ) | |
| Total Deferred Tax Liabilities | | | (7,770 | ) | | | (6,462 | ) | |
| Valuation Allowance | | | (45 | ) | | | (45 | ) | |
| Net Deferred Tax Asset (Liability) | | $ | (1,288 | ) | | $ | (802 | ) | |
Under the Internal Revenue Code, through 1996 two acquired banking companies, which are now a part of the Company’s single banking subsidiary, were allowed a special bad debt deduction related to additions to tax bad debt reserves established for the purpose of absorbing losses. The acquired banks were formerly known as Peoples Community Bank (acquired in October 2005) and First American Bank (acquired in January 1999). Subject to certain limitations, these Banks were permitted to deduct from taxable income an allowance for bad debts based on a percentage of taxable income before such deductions or actual loss experience. The Banks generally computed its annual addition to its bad debt reserves using the percentage of taxable income method; however, due to certain limitations in 1996, the Banks were only allowed a deduction based on actual loss experience.
Notes to the Consolidated Financial Statements
Dollars in thousands, except per share data
NOTE 10 – Income Taxes (continued)
Retained earnings at December 31, 2009, include approximately $2,995 for which no provision for federal income taxes has been made. This amount represents allocations of income for allowable bad debt deductions. Reduction of amounts so allocated for purposes other than tax bad debt losses will create taxable income, which will be subject to the then current corporate income tax rate. It is not contemplated that amounts allocated to bad debt deductions will be used in any manner to create taxable income. The unrecorded deferred income tax liability on the above amount at December 31, 2009 was approximately $1,018.
Unrecognized Tax Benefits
The Company had no unrecognized tax benefits as of December 31, 2009, 2008, and 2007, and did not recognize any increase in unrecognized benefits during 2009 relative to any tax positions taken in 2009. Should the accrual of any interest or penalties relative to unrecognized tax benefits be necessary, it is the Company’s policy to record such accruals in its income tax expense accounts; no such accruals existed as of December 31, 2009, 2008, and 2007. The Company and its corporate subsidiaries file a consolidated U.S. Federal income tax return, which is subject to examination for all years after 2005. The Company and its corporate subsidiaries doing business in Indiana file a combined Indiana unitary return, which is subject to examination for years 2003, 2004, and all years after 2005.
NOTE 11 – Per Share Data
The computation of Earnings per Share and Diluted Earnings per Share are provided below:
| | | 2009 | | | 2008 | | | 2007 | |
| Earnings per Share: | | | | | | | | | |
| Net Income | | $ | 12,218 | | | $ | 12,803 | | | $ | 9,405 | |
| Weighted Average Shares Outstanding | | | 11,065,917 | | | | 11,029,519 | | | | 11,009,536 | |
| Earnings per Share | | $ | 1.10 | | | $ | 1.16 | | | $ | 0.85 | |
| | | | | | | | | | | | | |
| Diluted Earnings per Share: | | | | | | | | | | | | |
| Net Income | | $ | 12,218 | | | $ | 12,803 | | | $ | 9,405 | |
| Weighted Average Shares Outstanding | | | 11,065,917 | | | | 11,029,519 | | | | 11,009,536 | |
| Stock Options, Net | | | 3,071 | | | | 392 | | | | 15,690 | |
| | | | | | | | | | | | | |
| Diluted Weighted Average Shares Outstanding | | | 11,068,988 | | | | 11,029,911 | | | | 11,025,226 | |
| Diluted Earnings per Share | | $ | 1.10 | | | $ | 1.16 | | | $ | 0.85 | |
Stock options for 117,898, 248,871, and 257,063 shares of common stock were not considered in computing diluted earnings per common share for 2009, 2008, and 2007, respectively, because they were anti-dilutive.
NOTE 12 – Lease Commitments
The total rental expense for all operating leases for the years ended December 31, 2009, 2008, and 2007 was $316, $338, and $355, respectively, including amounts paid under short-term cancelable leases.
The following is a schedule of future minimum lease payments:
| Years Ending December 31: | | Premises and Equipment | |
| | | | |
| 2010 | | $ | 256 | |
| 2011 | | | 157 | |
| 2012 | | | 132 | |
| 2013 | | | 84 | |
| 2014 | | | 82 | |
| Thereafter | | | 1,034 | |
| Total | | $ | 1,745 | |
Notes to the Consolidated Financial Statements
Dollars in thousands, except per share data
NOTE 13 – Commitments and Off-balance Sheet Items
In the normal course of business, there are various commitments and contingent liabilities, such as commitments to extend credit and commitments to sell loans, which are not reflected in the accompanying consolidated financial statements. The Company’s exposure to credit loss in the event of nonperformance by the other party to the financial instruments for commitments to make loans and standby letters of credit is represented by the contractual amount of those instruments. The Company uses the same credit policy to make commitments as it uses for on-balance sheet items.
The Company’s exposure to credit risk for commitments to sell loans is dependent upon the ability of the counter-party to purchase the loans. This is generally assured by the use of government sponsored entity counterparts. These commitments are subject to market risk resulting from fluctuations in interest rates. Commitments to sell loans are not mandatory (i.e., do not require net settlement with the counter-party to cancel the commitment).
Commitments and contingent liabilities are summarized as follows, at December 31:
| | | 2009 | | | 2008 | |
| | | Fixed | | | Variable | | | Fixed | | | Variable | |
| | | Rate | | | Rate | | | Rate | | | Rate | |
| Commitments to Fund Loans: | | | | | | | | | | | | |
| Consumer Lines | | $ | 1,839 | | | $ | 102,628 | | | $ | 3,488 | | | $ | 98,592 | |
| Commercial Operating Lines | | | 7,733 | | | | 120,732 | | | | 4,779 | | | | 122,882 | |
| Residential Mortgages | | | 8,324 | | | | 1,387 | | | | — | | | | 858 | |
| Total Commitments to Fund Loans | | $ | 17,896 | | | $ | 224,747 | | | $ | 8,267 | | | $ | 222,332 | |
| Commitments to Sell Loans | | $ | 15,263 | | | $ | — | | | $ | 27,219 | | | $ | — | |
| | | | | | | | | | | | | | | | | |
| Standby Letters of Credit | | $ | 970 | | | $ | 2,517 | | | $ | 975 | | | $ | 7,580 | |
The fixed rate commitments to fund loans have interest rates ranging from 2.000% to 18.000% and maturities ranging from less than 1 year to 15 years. Since many commitments to make loans expire without being used, these amounts do not necessarily represent future cash commitments. Collateral obtained upon exercise of the commitment is determined using management’s credit evaluation of the borrower, and may include accounts receivable, inventory, property, land, and other items.
NOTE 14 – Fair Value
Fair value as the exchange price that would be received for an asset or paid to transfer a liability (exit price) in the principal or most advantageous market for the asset or liability in an orderly transaction between market participants on the measurement date. There are three levels of inputs that may be used to measure fair values:
Level 1: Quoted prices (unadjusted) for identical assets or liabilities in active markets that the entity has the ability to access as of the measurement date.
Level 2: Significant other observable inputs other than Level 1 prices such as quoted prices for similar assets or liabilities; quoted prices in markets that are not active; or other inputs that are observable or can be corroborated by observable market data.
Level 3: Significant unobservable inputs that reflect a reporting entity’s own assumptions about the assumptions that market participants would use in pricing an asset or liability.
The Company used the following methods and significant assumptions to estimate the fair value of each type of financial instrument:
Investment Securities: The fair values for investment securities are determined by quoted market prices, if available (Level 1). For securities where quoted prices are not available, fair values are calculated based on market prices of similar securities (Level 2). For securities where quoted prices or market prices of similar securities are not available, fair values are calculated using discounted cash flows or other market indicators (Level 3).
Notes to the Consolidated Financial Statements
Dollars in thousands, except per share data
NOTE 14 – Fair Value (continued)
Impaired Loans: Values for collateral dependent loans are generally based on appraisals obtained from licensed real estate appraisers and in certain circumstances consideration of offers obtained to purchase properties prior to foreclosure. Appraisals for commercial real estate generally use three methods to derive value: cost, sales or market comparison and income approach. The cost method bases value in the cost to replace the current property. Value of market comparison approach evaluates the sales price of similar properties in the same market area. The income approach considers net operating income generated by the property and an investors required return. Adjustments are routinely made in the appraisal process to adjust for differences between the comparable sale and income data available. Such adjustments are typically significant and result in a Level 3 classification of the inputs for determining fair value.
Other Real Estate Owned: Nonrecurring adjustments to certain commercial and residential real estate properties classified as other real estate owned (OREO) are measured at the lower of carrying amount or fair value, less costs to sell. Fair values are generally based on third party appraisals of the property utilizing similar techniques as discussed above for Impaired Loans, resulting in a Level 3 classification. In cases where the carrying amount exceeds the fair value, less costs to sell, impairment loss is recognized.
Loans Held-for-Sale: The fair values of loans held for sale are determined by using quoted prices for a similar asset, adjusted for specific attributes of that loan (Level 2).
Assets and Liabilities Measured on a Recurring Basis
Assets and liabilities measured at fair value on a recurring basis are summarized below:
| | | | | | Fair Value Measurements at December 31, 2009 Using | |
| | | | | | Quoted Prices in | | | | | | | |
| | | | | | Active Markets for | | | Significant Other | | | Significant | |
| | | | | | Identical Assets | | | Observable Inputs | | | Unobservable Inputs | |
| | | Carrying Value | | | (Level 1) | | | (Level 2) | | | (Level 3) | |
| Assets: | | | | | | | | | | | | |
| U.S. Treasury and Agency Securities | | $ | 4,970 | | | $ | — | | | $ | 4,970 | | | $ | — | |
| Obligations of State and Political Subdivisions | | | 22,378 | | | | — | | | | 22,378 | | | | — | |
| Mortgage-backed Securities - Residential | | | 221,252 | | | | — | | | | 221,252 | | | | — | |
| Equity Securities | | | 2,340 | | | | 1,987 | | | | — | | | | 353 | |
| Loans Held-for-Sale | | | 5,706 | | | | — | | | | 5,706 | | | | — | |
| | | | | | Fair Value Measurements at December 31, 2008 Using | |
| | | | | | Quoted Prices in | | | | | | | |
| | | | | | Active Markets for | | | Significant Other | | | Significant | |
| | | | | | Identical Assets | | | Observable Inputs | | | Unobservable Inputs | |
| | | Carrying Value | | | (Level 1) | | | (Level 2) | | | (Level 3) | |
| Assets: | | | | | | | | | | | | |
| U.S. Treasury and Agency Securities | | $ | — | | | $ | — | | | $ | — | | | $ | — | |
| Obligations of State and Political Subdivisions | | | 16,868 | | | | — | | | | 16,868 | | | | — | |
| Mortgage-backed Securities - Residential | | | 155,627 | | | | — | | | | 155,627 | | | | — | |
| Equity Securities | | | 3,345 | | | | 2,190 | | | | — | | | | 1,155 | |
Notes to the Consolidated Financial Statements
Dollars in thousands, except per share data
NOTE 14 – Fair Value (continued)
The table below presents a reconciliation and income statement classification of gains and losses for equity securities that do not have readily determinable fair values and are evaluated for impairment on a periodic basis. These assets were measured at fair value on a recurring basis using significant unobservable inputs (Level 3) for the year ended December 31, 2009:
| | | Fair Value Measurements | |
| | | Using Significant | |
| | | Unobservable Inputs | |
| | | (Level 3) | |
| | | | |
| | | Available-for-Sale | |
| | | Securities | |
| | | | |
| Year Ended December 31, 2009: | | | |
| Balance of Recurring Level 3 Assets at January 1, 2009 | | $ | 1,155 | |
| Sale of Securities | | | (379 | ) |
| Other-than-temporary Impairment Charges Recognized through Net Income | | | (423 | ) |
| Ending Balance, December 31, 2009 | | $ | 353 | |
| | | Fair Value Measurements | |
| | | Using Significant | |
| | | Unobservable Inputs | |
| | | (Level 3) | |
| | | | |
| | | Available-for-Sale | |
| | | Securities | |
| | | | |
| Year Ended December 31, 2008: | | | |
| Balance of Recurring Level 3 Assets at January 1, 2008 | | $ | 2,092 | |
| Other-than-temporary Impairment Charges Recognized through Net Income | | | (937 | ) |
| Ending Balance, December 31, 2008 | | $ | 1,155 | |
Assets and Liabilities Measured on a Non-Recurring Basis
Assets and liabilities measured at fair value on a non-recurring basis are summarized below:
| | | | | | Fair Value Measurements at December 31, 2009 Using | |
| | | | | | Quoted Prices in | | | | | | | |
| | | | | | Active Markets for | | | Significant Other | | | Significant | |
| | | | | | Identical Assets | | | Observable Inputs | | | Unobservable Inputs | |
| | | Carrying Value | | | (Level 1) | | | (Level 2) | | | (Level 3) | |
| Assets: | | | | | | | | | | | | |
| Impaired Loans | | $ | 3,699 | | | $ | — | | | $ | — | | | $ | 3,699 | |
| Other Real Estate | | $ | 2,363 | | | $ | — | | | $ | — | | | $ | 2,363 | |
| | | | | | Fair Value Measurements at December 31, 2008 Using | |
| | | | | | Quoted Prices in | | | | | | | |
| | | | | | Active Markets for | | | Significant Other | | | Significant | |
| | | | | | Identical Assets | | | Observable Inputs | | | Unobservable Inputs | |
| | | Carrying Value | | | (Level 1) | | | (Level 2) | | | (Level 3) | |
| Assets: | | | | | | | | | | | | |
| Impaired Loans | | $ | 2,284 | | | $ | — | | | $ | — | | | $ | 2,284 | |
| Other Real Estate | | $ | 1,818 | | | $ | — | | | $ | — | | | $ | 1,818 | |
Notes to the Consolidated Financial Statements
Dollars in thousands, except per share data
NOTE 14 – Fair Value (continued)
Impaired loans, which are measured for impairment using the fair value of the collateral for collateral dependent loans, had a carrying amount of $6,602, with a valuation allowance of $2,903, resulting in an additional provision for loan losses of $2,517 for the year ended December 31, 2009. At December 31, 2008, impaired loans had a carrying amount of $3,755, with a valuation allowance of $1,471, resulting in an additional provision for loan losses of $1,017 for the year ended December 31, 2008.
Other Real Estate which is measured at the lower of carrying or fair value less costs to sell, had a carrying amount of $2,363 at December 31, 2009, resulting in a write-down of $228 for the year ending December 31, 2009.
Fair Value of Financial Instruments
The estimated fair values of the Company’s financial instruments not previously disclosed are provided in the table below. Not all of the Company’s assets and liabilities are considered financial instruments, and therefore are not included in the table. Because no active market exists for a significant portion of the Company’s financial instruments, fair value estimates were based on subjective judgments, and therefore cannot be determined with precision.
| | | December 31, 2009 | | | December 31, 2008 | |
| | | Carrying | | | Fair | | | Carrying | | | Fair | |
| | | Value | | | Value | | | Value | | | Value | |
| Financial Assets: | | | | | | | | | | | | |
| Cash and Short-term Investments | | $ | 28,054 | | | $ | 28,054 | | | $ | 44,992 | | | $ | 44,992 | |
| Securities Held-to-Maturity | | | 2,774 | | | | 2,801 | | | | 3,326 | | | | 3,358 | |
| FHLB Stock and Other Restricted Stock | | | 10,621 | | | | N/A | | | | 10,621 | | | | N/A | |
| Loans, including Loans Held-for-Sale, Net | | | 872,512 | | | | 880,077 | | | | 884,080 | | | | 892,785 | |
| Accrued Interest Receivable | | | 6,605 | | | | 6,605 | | | | 7,215 | | | | 7,215 | |
| Financial Liabilities: | | | | | | | | | | | | | | | | |
| Demand, Savings, and Money Market Deposits | | | (639,967 | ) | | | (639,967 | ) | | | (587,282 | ) | | | (587,282 | ) |
| Time Deposits | | | (329,676 | ) | | | (330,628 | ) | | | (354,468 | ) | | | (357,089 | ) |
| Short-term Borrowings | | | (34,801 | ) | | | (34,801 | ) | | | (26,056 | ) | | | (26,056 | ) |
| Long-term Debt | | | (113,320 | ) | | | (114,742 | ) | | | (105,608 | ) | | | (111,092 | ) |
| Accrued Interest Payable | | | (2,292 | ) | | | (2,292 | ) | | | (2,884 | ) | | | (2,884 | ) |
| Unrecognized Financial Instruments: | | | | | | | | | | | | | | | | |
| Commitments to Extend Credit | | | — | | | | — | | | | — | | | | — | |
| Standby Letters of Credit | | | — | | | | — | | | | — | | | | — | |
| Commitments to Sell Loans | | | — | | | | — | | | | — | | | | — | |
The fair values of securities held to maturity are based on quoted market prices or dealer quotes, if available, or by using quoted market prices for similar instruments. The fair value of loans held-for-sale is estimated using commitment prices or market quotes on similar loans. The fair value of loans are estimated by discounting future cash flows using the current rates at which similar loans would be made for the average remaining maturities. It was not practicable to determine the fair value of FHLB stock and other restricted stock due to restrictions placed on its transferability. The fair value of demand deposits, savings accounts, money market deposits, short-term borrowings and accrued interest payable is the amount payable on demand at the reporting date. The fair value of fixed-maturity time deposits and long-term borrowings are estimated using the rates currently offered on these instruments for similar remaining maturities. Commitments to extend credit and standby letters of credit are generally short-term or variable rate with minimal fees charged. These instruments have no carrying value, and the fair value is not significant. The fair value of commitments to sell loans is the cost or benefit of settling the commitments with the counter-party at the reporting date. At December 31, 2009 and 2008, none of the Company’s commitments to sell loans were mandatory, and there is no cost or benefit to settle these commitments.
NOTE 15 – Segment Information
The Company’s operations include three primary segments: core banking, trust and investment advisory services, and insurance operations. The core banking segment involves attracting deposits from the general public and using such funds to originate consumer, commercial and agricultural, commercial and agricultural real estate, and residential mortgage loans, primarily in the Company’s local markets. The core banking segment also involves the sale of residential mortgage loans in the secondary market.
Notes to the Consolidated Financial Statements
Dollars in thousands, except per share data
NOTE 15 – Segment Information (continued)
The trust and investment advisory services segment involves providing trust, investment advisory, and brokerage services to customers. The insurance segment offers a full range of personal and corporate property and casualty insurance products, primarily in the affiliate banks’ local markets.
The core banking segment is comprised by the Company’s banking subsidiary, German American Bancorp, which operates through 28 retail banking offices. Net interest income from loans and investments funded by deposits and borrowings is the primary revenue for the core-banking segment. The trust and investment advisory services segment’s revenues are comprised primarily of fees generated by German American Financial Advisors & Trust Company (“GAFA”). These fees are derived by providing trust, investment advisory, and brokerage services to its customers. The insurance segment consists of German American Insurance, Inc., which provides a full line of personal and corporate insurance products from seven offices; and German American Reinsurance Company, Ltd. (“GARC”), which reinsures credit insurance products sold by the Company’s affiliate bank. Commissions derived from the sale of insurance products are the primary source of revenue for the insurance segment.
The following segment financial information has been derived from the internal financial statements of German American Bancorp, Inc., which are used by management to monitor and manage the financial performance of the Company. The accounting policies of the three segments are the same as those of the Company. The evaluation process for segments does not include holding company income and expense. Holding company amounts are the primary differences between segment amounts and consolidated totals, and are reflected in the column labeled “Other” below, along with amounts to eliminate transactions between segments.
Year ended December 31, 2009
| | | | | | Trust and | | | | | | | | | | |
| | | | | | Investment | | | | | | | | | | |
| | | Core | | | Advisory | | | | | | | | | Consolidated | |
| | | Banking | | | Services | | | Insurance | | | Other | | | Totals | |
| | | | | | | | | | | | | | | | |
| Net Interest Income | | $ | 45,825 | | | $ | 13 | | | $ | 59 | | | $ | (1,384 | ) | | $ | 44,513 | |
| Net Gains on Sales of Loans and Related Assets | | | 1,760 | | | | — | | | | — | | | | — | | | | 1,760 | |
| Net Gain (Loss) on Securities | | | — | | | | — | | | | — | | | | (423 | ) | | | (423 | ) |
| Trust and Investment Product Fees | | | 4 | | | | 1,617 | | | | — | | | | (4 | ) | | | 1,617 | |
| Insurance Revenues | | | 82 | | | | 18 | | | | 5,241 | | | | (45 | ) | | | 5,296 | |
| Noncash Items: | | | | | | | | | | | | | | | | | | | | |
| Provision for Loan Losses | | | 3,750 | | | | — | | | | — | | | | — | | | | 3,750 | |
| Depreciation and Amortization | | | 2,727 | | | | 27 | | | | 934 | | | | — | | | | 3,688 | |
| Income Tax Expense | | | 5,298 | | | | 15 | | | | (29 | ) | | | (1,271 | ) | | | 4,013 | |
| Segment Profit (Loss) | | | 13,140 | | | | 20 | | | | (44 | ) | | | (898 | ) | | | 12,218 | |
| Segment Assets | | | 1,236,745 | | | | 2,182 | | | | 8,432 | | | | (4,394 | ) | | | 1,242,965 | |
Year ended December 31, 2008
| | | | | | Trust and | | | | | | | | | | |
| | | | | | Investment | | | | | | | | | | |
| | | Core | | | Advisory | | | | | | | | | Consolidated | |
| | | Banking | | | Services | | | Insurance | | | Other | | | Totals | |
| | | | | | | | | | | | | | | | |
| Net Interest Income | | $ | 41,725 | | | $ | 60 | | | $ | 71 | | | $ | (919 | ) | | $ | 40,937 | |
| Net Gains on Sales of Loans and Related Assets | | | 1,399 | | | | — | | | | — | | | | — | | | | 1,399 | |
| Net Gain (Loss) on Securities | | | 1,031 | | | | — | | | | — | | | | (937 | ) | | | 94 | |
| Trust and Investment Product Fees | | | 4 | | | | 2,312 | | | | — | | | | (28 | ) | | | 2,288 | |
| Insurance Revenues | | | 75 | | | | 43 | | | | 6,256 | | | | (68 | ) | | | 6,306 | |
| Noncash Items: | | | | | | | | | | | | | | | | | | | | |
| Provision for Loan Losses | | | 3,990 | | | | — | | | | — | | | | — | | | | 3,990 | |
| Depreciation and Amortization | | | 2,490 | | | | 25 | | | | 847 | | | | — | | | | 3,362 | |
| Income Tax Expense | | | 6,383 | | | | 230 | | | | 256 | | | | (1,231 | ) | | | 5,638 | |
| Segment Profit (Loss) | | | 13,185 | | | | 338 | | | | 413 | | | | (1,133 | ) | | | 12,803 | |
| Segment Assets | | | 1,183,773 | | | | 1,992 | | | | 8,930 | | | | (3,867 | ) | | | 1,190,828 | |
Notes to the Consolidated Financial Statements
Dollars in thousands, except per share data
NOTE 15 – Segment Information (continued)
Year ended December 31, 2007
| | | | | | Trust and | | | | | | | | | | |
| | | | | | Investment | | | | | | | | | | |
| | | Core | | | Advisory | | | | | | | | | Consolidated | |
| | | Banking | | | Services | | | Insurance | | | Other | | | Totals | |
| | | | | | | | | | | | | | | | |
| Net Interest Income | | $ | 39,677 | | | $ | 94 | | | $ | 111 | | | $ | (1,267 | ) | | $ | 38,615 | |
| Net Gains on Sales of Loans and Related Assets | | | 822 | | | | — | | | | — | | | | — | | | | 822 | |
| Net Gain (Loss) on Securities | | | — | | | | — | | | | — | | | | (680 | ) | | | (680 | ) |
| Trust and Investment Product Fees | | | 3 | | | | 2,690 | | | | — | | | | (103 | ) | | | 2,590 | |
| Insurance Revenues | | | 102 | | | | 42 | | | | 5,727 | | | | (77 | ) | | | 5,794 | |
| Noncash Items: | | | | | | | | | | | | | | | | | | | | |
| Provision for Loan Losses | | | 3,591 | | | | — | | | | — | | | | — | | | | 3,591 | |
| Depreciation and Amortization | | | 2,319 | | | | 21 | | | | 800 | | | | — | | | | 3,140 | |
| Income Tax Expense | | | 4,896 | | | | 316 | | | | 262 | | | | (1,372 | ) | | | 4,102 | |
| Segment Profit (Loss) | | | 10,153 | | | | 481 | | | | 396 | | | | (1,625 | ) | | | 9,405 | |
| Segment Assets | | | 1,121,183 | | | | 2,201 | | | | 9,675 | | | | (1,349 | ) | | | 1,131,710 | |
Notes to the Consolidated Financial Statements
Dollars in thousands, except per share data
NOTE 16 – Parent Company Financial Statements
The condensed financial statements of German American Bancorp, Inc. are presented below:
CONDENSED BALANCE SHEETS
| | | December 31, | |
| | | 2009 | | | 2008 | |
| ASSETS | | | | | | |
| Cash | | $ | 4,848 | | | $ | 1,121 | |
| Securities Available-for-Sale, at Fair Value | | | 2,340 | | | | 3,345 | |
| Investment in Subsidiary Bank | | | 135,491 | | | | 113,364 | |
| Investment in Non-banking Subsidiaries | | | 2,783 | | | | 2,188 | |
| Other Assets | | | 5,422 | | | | 4,347 | |
| Total Assets | | $ | 150,884 | | | $ | 124,365 | |
| LIABILITIES | | | | | | | | |
| Borrowings | | $ | 35,250 | | | $ | 17,500 | |
| Other Liabilities | | | 2,085 | | | | 1,691 | |
| Total Liabilities | | | 37,335 | | | | 19,191 | |
| SHAREHOLDERS’ EQUITY | | | | | | | | |
| Common Stock | | | 11,077 | | | | 11,030 | |
| Additional Paid-in Capital | | | 68,816 | | | | 68,371 | |
| Retained Earnings | | | 29,041 | | | | 23,019 | |
| Accumulated Other Comprehensive Income | | | 4,615 | | | | 2,754 | |
| Total Shareholders’ Equity | | | 113,549 | | | | 105,174 | |
| Total Liabilities and Shareholders’ Equity | | $ | 150,884 | | | $ | 124,365 | |
CONDENSED STATEMENTS OF INCOME
| | | Years Ended December 31, | |
| | | 2009 | | | 2008 | | | 2007 | |
| INCOME | | | | | | | | | |
| Dividends from Subsidiaries | | | | | | | | | |
| Bank | | $ | 8,000 | | | $ | 13,000 | | | $ | 2,000 | |
| Non-bank | | | — | | | | — | | | | 500 | |
| Dividend and Interest Income | | | 57 | | | | 57 | | | | 101 | |
| Net Loss on Securities | | | (423 | ) | | | (937 | ) | | | (680 | ) |
| Other Income | | | 119 | | | | 39 | | | | 66 | |
| Total Income | | | 7,753 | | | | 12,159 | | | | 1,987 | |
| EXPENSES | | | | | | | | | | | | |
| Salaries and Employee Benefits | | | 364 | | | | 163 | | | | 367 | |
| Professional Fees | | | 342 | | | | 245 | | | | 309 | |
| Occupancy and Equipment Expense | | | 7 | | | | 8 | | | | 6 | |
| Interest Expense | | | 1,459 | | | | 981 | | | | 1,369 | |
| Other Expenses | | | 292 | | | | 324 | | | | 413 | |
| Total Expenses | | | 2,464 | | | | 1,721 | | | | 2,464 | |
| INCOME BEFORE INCOME TAXES AND EQUITY IN UNDISTRIBUTED INCOME OF SUBSIDIARIES | | | 5,289 | | | | 10,438 | | | | (477 | ) |
| Income Tax Benefit | | | 1,237 | | | | 1,212 | | | | 1,364 | |
| INCOME BEFORE EQUITY IN UNDISTRIBUTED INCOME OF SUBSIDIARIES | | | 6,526 | | | | 11,650 | | | | 887 | |
| Equity in Undistributed Income of Subsidiaries | | | 5,692 | | | | 1,153 | | | | 8,518 | |
| NET INCOME | | | 12,218 | | | | 12,803 | | | | 9,405 | |
| Other Comprehensive Income: | | | | | | | | | | | | |
| Unrealized Gain on Securities, Net | | | 1,908 | | | | 1,612 | | | | 1,210 | |
| Changes in Unrecognized Amounts in Pension | | | (47 | ) | | | — | | | | 41 | |
| Changes in Unrecognized Loss in Postretirement Benefit Obligation | | | — | | | | 144 | | | | 30 | |
| TOTAL COMPREHENSIVE INCOME | | $ | 14,079 | | | $ | 14,559 | | | $ | 10,686 | |
Notes to the Consolidated Financial Statements
Dollars in thousands, except per share data
NOTE 16 – Parent Company Financial Statements (continued)
CONDENSED STATEMENTS OF CASH FLOWS
| | | Years Ended December 31, | |
| | | | |
| | | 2009 | | | 2008 | | | 2007 | |
| CASH FLOWS FROM OPERATING ACTIVITIES | | | | | | | | | |
| Net Income | | $ | 12,218 | | | $ | 12,803 | | | $ | 9,405 | |
| Adjustments to Reconcile Net Income to Net Cash from Operations | | | | | | | | | | | | |
| Loss on Securities, net | | | 423 | | | | 937 | | | | 680 | |
| Change in Other Assets | | | (963 | ) | | | (39 | ) | | | (191 | ) |
| Change in Other Liabilities | | | 325 | | | | (493 | ) | | | (843 | ) |
| Equity Based Compensation | | | 485 | | | | 10 | | | | 331 | |
| Equity in Undistributed Income of Subsidiaries | | | (5,692 | ) | | | (1,153 | ) | | | (8,518 | ) |
| Net Cash from Operating Activities | | | 6,796 | | | | 12,065 | | | | 864 | |
| | | | | | | | | | | | | |
| CASH FLOWS FROM INVESTING ACTIVITIES | | | | | | | | | | | | |
| Capital Contribution to Subsidiaries | | | (15,000 | ) | | | (250 | ) | | | (5,000 | ) |
| Proceeds from Sales of Securities Available-for-Sale | | | 379 | | | | — | | | | 998 | |
| Net Cash from Investing Activities | | | (14,621 | ) | | | (250 | ) | | | (4,002 | ) |
| | | | | | | | | | | | | |
| CASH FLOWS FROM FINANCING ACTIVITIES | | | | | | | | | | | | |
| Change in Short-term Borrowings | | | — | | | | (3,250 | ) | | | 3,250 | |
| Advances in Long-term Debt | | | 19,250 | | | | — | | | | — | |
| Repayment of Long-term Debt | | | (1,500 | ) | | | (1,500 | ) | | | (1,000 | ) |
| Employee Stock Purchase Plan | | | (2 | ) | | | (46 | ) | | | (118 | ) |
| Dividends Paid | | | (6,196 | ) | | | (6,177 | ) | | | (6,174 | ) |
| Net Cash from Financing Activities | | | 11,552 | | | | (10,973 | ) | | | (4,042 | ) |
| | | | | | | | | | | | | |
| Net Change in Cash and Cash Equivalents | | | 3,727 | | | | 842 | | | | (7,180 | ) |
| Cash and Cash Equivalents at Beginning of Year | | | 1,121 | | | | 279 | | | | 7,459 | |
| Cash and Cash Equivalents at End of Year | | $ | 4,848 | | | $ | 1,121 | | | $ | 279 | |
Notes to the Consolidated Financial Statements
Dollars in thousands, except per share data
NOTE 17 – Business Combinations, Goodwill and Intangible Assets
On June 26, 2009, the Company acquired certain assets of an existing insurance agency office located in Tell City, Indiana. The assets became a part of German American Insurance, Inc., the Company’s property and casualty insurance entity.
The purchase price for this transaction was $386 in cash and resulted in $386 in customer list intangible. The customer relationship intangible is being amortized over seven years utilizing the straight-line method and deducted for tax purposes over 15 years using the straight line method.
The changes in the carrying amount of goodwill for the periods ended December 31, 2009, 2008, and 2007 were classified as follows:
| | | 2009 | | | 2008 | | | 2007 | |
| Beginning of Year | | $ | 9,655 | | | $ | 9,655 | | | $ | 9,655 | |
| Acquired Goodwill | | | — | | | | — | | | | — | |
| Impairment | | | — | | | | — | | | | — | |
| End of Year | | $ | 9,655 | | | $ | 9,655 | | | $ | 9,655 | |
Of the $9,655 carrying amount of goodwill, $8,323 is allocated to the core banking segment and $1,332 is allocated to the insurance segment for the periods ended December 31, 2009, 2008, and 2007.
Acquired intangible assets were as follows as of year end:
| | | 2009 | |
| | | Gross | | | Accumulated | |
| | | Amount | | | Amortization | |
| Core Banking | | | | | | |
| Core Deposit Intangible | | $ | 2,372 | | | $ | 1,435 | |
| Unidentified Branch Acquisition Intangible | | | 257 | | | | 257 | |
| Insurance | | | | | | | | |
| Customer List | | | 5,199 | | | | 3,518 | |
| Total | | $ | 7,828 | | | $ | 5,210 | |
| | | | |
| | | 2008 | |
| | | Gross | | | Accumulated | |
| | | Amount | | | Amortization | |
| Core Banking | | | | | | | | |
| Core Deposit Intangible | | $ | 2,372 | | | $ | 1,253 | |
| Unidentified Branch Acquisition Intangible | | | 257 | | | | 243 | |
| Insurance | | | | | | | | |
| Customer List | | | 4,813 | | | | 2,805 | |
| Total | | $ | 7,442 | | | $ | 4,301 | |
Amortization Expense was $909, $889, and $894 for 2009, 2008, and 2007.
Estimated amortization expense for each of the next five years is as follows:
| 2010 | | $ | 782 | |
| 2011 | | | 512 | |
| 2012 | | | 512 | |
| 2013 | | | 442 | |
| 2014 | | | 232 | |
Notes to the Consolidated Financial Statements
Dollars in thousands, except per share data
NOTE 18 – Other Comprehensive Income
Other comprehensive income components and related taxes were as follows:
| | | 2009 | | | 2008 | | | 2007 | |
Unrealized Holding Gains on Securities Available-for-Sale | | $ | 2,437 | | | $ | 2,506 | | | $ | 1,158 | |
| Reclassification Adjustments for (Gains) Losses Later Realized in Income | | | 423 | | | | (94 | ) | | | 680 | |
| Net Unrealized Gains | | | 2,860 | | | | 2,412 | | | | 1,838 | |
| Amortization of Amounts Included in Net Periodic Pension Costs | | | 13 | | | | 11 | | | | 70 | |
| Unrecognized Loss on Pension | | | (91 | ) | | | (11 | ) | | | (2 | ) |
| Unrecognized Gain on Postretirement Benefits | | | — | | | | 238 | | | | 49 | |
| Tax Effect | | | (921 | ) | | | (894 | ) | | | (674 | ) |
| Other Comprehensive Income | | $ | 1,861 | | | $ | 1,756 | | | $ | 1,281 | |
The following is a summary of the accumulated other comprehensive income balances, net of tax:
| | | Balance | | | Current | | | Balance | |
| | | At | | | Period | | | at | |
| | | 12/31/2008 | | | Change | | | 12/31/2009 | |
| Unrealized Gains on Securities Available-for-Sale | | $ | 2,708 | | | $ | 1,908 | | | $ | 4,616 | |
| Unrecognized Losses on Pension Benefits | | | (128 | ) | | | (47 | ) | | | (175 | ) |
| Unrecognized Gains on Postretirement Benefits | | | 174 | | | | — | | | | 174 | |
| Total | | $ | 2,754 | | | $ | 1,861 | | | $ | 4,615 | |
NOTE 19 – Quarterly Financial Data (Unaudited)
The following table represents selected quarterly financial data for the Company:
| | | Interest | | | Net Interest | | | Net | | | Earnings per Share | |
| | | Income | | | Income | | | Income | | | Basic | | | Diluted | |
| 2009 | | | | | | | | | | | | | | | |
| First Quarter | | $ | 15,857 | | | $ | 10,641 | | | $ | 2,942 | | | $ | 0.27 | | | $ | 0.27 | |
| Second Quarter | | | 15,923 | | | | 11,117 | | | | 2,764 | | | | 0.25 | | | | 0.25 | |
| Third Quarter | | | 16,159 | | | | 11,481 | | | | 3,191 | | | | 0.29 | | | | 0.29 | |
| Fourth Quarter | | | 15,797 | | | | 11,274 | | | | 3,321 | | | | 0.30 | | | | 0.30 | |
| | | | | | | | | | | | | | | | | | | | | |
| 2008 | | | | | | | | | | | | | | | | | | | | |
| First Quarter | | $ | 17,825 | | | $ | 10,119 | | | $ | 3,020 | | | $ | 0.27 | | | $ | 0.27 | |
| Second Quarter | | | 16,778 | | | | 10,065 | | | | 3,111 | | | | 0.28 | | | | 0.28 | |
| Third Quarter | | | 16,729 | | | | 10,446 | | | | 3,319 | | | | 0.30 | | | | 0.30 | |
| Fourth Quarter | | | 16,513 | | | | 10,307 | | | | 3,353 | | | | 0.30 | | | | 0.30 | |
Notes to the Consolidated Financial Statements
Dollars in thousands, except per share data
NOTE 20 – Subsequent Events
German American Bancorp, the banking subsidiary of the Company, entered into a Branch Purchase Agreement with Farmers State Bank of Alto Pass, Ill. dated February 17, 2009. Under the Agreement, German American Bancorp has agreed to purchase the two branches of Farmers in metropolitan Evansville, Indiana. One of the branches is located in Evansville (Vanderburgh County, Indiana) and the other in adjacent Newburgh (Warrick County, Indiana).
In general, German American Bancorp has agreed to buy and assume from Farmers all of Farmers' interest in the physical assets associated with the branches (including the real estate of the Branches, automated teller machines, and furniture, fixtures and equipment) and most of the loans and deposits of the branches. Loans to be purchased are expected to total approximately $40 million and deposits to be assumed are expected to approximate $50 million at the time of closing. In addition, a fixed sum of $4.9 million will be paid by German American Bancorp for all assets other than loans and cash balances.
Consummation of the transaction is subject to approval by the Federal Deposit Insurance Corporation and the Indiana Department of Financial Institutions, the receipt of certain required consents, and other usual and customary closing conditions, and is currently expected to be completed within the second quarter of 2010.
Item 9. Changes in and Disagreements with Accountants on Accounting and Financial Disclosure.
Not Applicable.
Item 9A. Controls and Procedures.
Disclosure Controls and Procedures
As of December 31, 2009, the Company carried out an evaluation, under the supervision and with the participation of its principal executive officer and principal financial officer, of the effectiveness of the design and operation of its disclosure controls and procedures. Based on this evaluation, the Company’s principal executive officer and principal financial officer concluded that the Company’s disclosure controls and procedures are effective in timely alerting them to material information required to be included in the Company’s periodic reports filed with the Securities and Exchange Commission. There are inherent limitations to the effectiveness of systems of disclosure controls and procedures, including the possibility of human error and the circumvention or overriding of the controls and procedures. Accordingly, even effective systems of disclosure controls and procedures can provide only reasonable assurances of achieving their control objectives.
Changes in Internal Control Over Financial Reporting in Most Recent Fiscal Quarter
There was no change in the Company’s internal control over financial reporting that occurred during the Company’s fourth fiscal quarter of 2009 that has materially affected, or is reasonably likely to materially affect, the Company’s internal control over financial reporting.
Management’s Report on Internal Control Over Financial Reporting
The management of the Company is responsible for establishing and maintaining adequate internal control over financial reporting as defined in Rules 13a-15(f) and 15d-15(f) under the Securities Exchange Act of 1934. The Company’s internal control over financial reporting is designed to provide reasonable assurance regarding the reliability of financial reporting and the preparation of financial statements for external purposes in accordance with U.S. generally accepted accounting principles. The Company’s internal control over financial reporting includes those policies and procedures that: (i) pertain to the maintenance of records that, in reasonable detail, accurately and fairly reflect the transactions and dispositions of the assets of the Company; (ii) provide reasonable assurance that transactions are recorded as necessary to permit preparation of financial statements in accordance with U.S. generally accepted accounting principles, and that receipts and expenditures of the Company are being made only in accordance with authorizations of management and directors of the Company; and (iii) provide reasonable assurance regarding prevention or timely detection of unauthorized acquisition, use or disposition of the Company’s assets that could have a material effect on the financial statements.
Because of its inherent limitations, internal control over financial reporting may not prevent or detect misstatements. Also, projections of any evaluation of effectiveness to future periods are subject to the risk that controls may become inadequate because of changes in conditions, or that the degree of compliance with the policies or procedures may deteriorate. Management assessed the effectiveness of the Company’s internal control over financial reporting as of December 31, 2009. In making this assessment, management used the criteria set forth by the Committee of Sponsoring Organizations of the Treadway Commission (COSO) in Internal Control-Integrated Framework. Based on our assessment and those criteria, management concluded that the Company maintained effective internal control over financial reporting as of December 31, 2009.
The Company’s independent registered public accounting firm has issued their report on the Company’s internal control over financial reporting. That report is included in Item 8. Financial Statement and Supplementary Data of this Report under the heading, Report of Independent Registered Public Accounting Firm.
Item 9B. Other Information.
Not applicable.
PART III
Item 10. Directors and Executive Officers of the Registrant.
Information relating to directors and executive officers of the Company will be included under the captions “Election of Directors” and “Our Executive Officers” in the Company’s Proxy Statement for the Annual Meeting of Shareholders to be held in May 2010, which will be filed within 120 days of the end of the fiscal year covered by this Report (the “2010 Proxy Statement”), which sections are incorporated herein in partial response to this Item’s informational requirements.
Section 16(a) Compliance. Information relating to Section 16(a) compliance will be included in the 2010 Proxy Statement under the caption of “Section 16(a): Beneficial Ownership Reporting Compliance” and is incorporated herein by reference.
Code of Business Conduct. The Company’s Board of Directors has adopted a Code of Business Conduct, which constitutes a “code of ethics” as that term is defined by SEC rules adopted under the Sarbanes-Oxley Act of 2002 (“SOA”). The Company has posted a copy of the Code of Business Conduct on its Internet website (www.germanamerican.com). The Company intends to satisfy its disclosure requirements under Item 5.05 of Form 8-K regarding certain amendments to, or waivers of, the Code of Business Conduct, by posting such information on its Internet website, except that waivers that must under NASDAQ rules be filed with the SEC on Form 8-K will be so filed.
Audit Committee Identification. The Board of Directors of the Company has a separately-designated standing audit committee established in accordance with Section 3(a) (58) (A) of the Securities Exchange Act of 1934. The description of the Audit Committee of the Board of Directors, and the identification of its members, will be set forth in the 2010 Proxy Statement under the caption “ELECTION OF DIRECTORS”, which section is incorporated herein by reference.
Audit Committee Financial Expert. The Board of Directors has determined that Richard E. Forbes, a director who serves on the Audit Committee of the Board of Directors and who is an independent director as defined by NASDAQ listing standards, is an “audit committee financial expert” as that term is defined by SEC rules adopted under SOA by reason of his experience as the former chief executive officer and former chief financial officer of a subsidiary of a Fortune 500 company.
Item 11. Executive Compensation.
Information relating to compensation of the Company’s executive officers and directors, (including the required disclosures under the subheadings “Compensation Committee Interlocks and Insider Participation” and “Compensation Committee Report”) will be included under the caption “Executive and Director Compensation” in the 2010 Proxy Statement of the Company, which section is incorporated herein by reference.
Item 12. Security Ownership of Certain Beneficial Owners and Management and Related Stockholder Matters.
Information relating to security ownership of certain beneficial owners and the directors and executive officers of the Company will be included under the captions “Ownership of Our Common Stock by Our Directors and Executive Officers” and “Principal Owners of Common Shares” of the 2010 Proxy Statement of the Company, which sections are incorporated herein by reference.
Equity Compensation Plan Information
The Company maintains four plans under which it has authorized the issuance of its Common Shares to employees and non-employee directors as compensation: its 1992 Stock Option Plan (under which no new grants may be made), its 1999 Long-Term Equity Incentive Plan (under which no new grants may be made), its 2009 Long-Term Equity Incentive Plan, and its 2009 Employee Stock Purchase Plan. Each of these four plans was approved by the requisite vote of the Company's common shareholders in the year of adoption by the Board of Directors. The Company is not a party to any individual compensation arrangement involving the authorization for issuance of its equity securities to any single person, other than option agreements and restricted stock award agreements that have been granted under the terms of one of the four plans identified above. The following table sets forth information regarding these plans as of December 31, 2009:
| Plan Category | | Number of Securities to be Issued upon Exercise of Outstanding Options, Warrants or Rights | | | Weighted Average Exercise Price of Outstanding Options, Warrants and Rights | | | Number of Securities Remaining Available for Future Issuance under Equity Compensation Plans (Excluding Securities Reflected in First Column) | |
| Equity compensation plans approved by security holders | | | 157,956 | (a) | | $ | 16.44 | | | | 1,000,000 | (b) |
| Equity compensation plans not approved by security holders | | | — | | | | — | | | | — | |
| Total | | | 157,956 | | | $ | 16.44 | | | | 1,000,000 | |
(a) Does not include any shares that employees may have the right to purchase under the Employee Stock Purchase Plan in August 2010 in respect of employee payroll deductions of participating employees that had accumulated as of December 31, 2009 during the plan year that commenced in August 2009. Although these employees have the right under this Plan to have their accumulated payroll deductions applied to the purchase of Common Shares at a discounted price in August 2010, the price at which such shares may be purchased and the number of shares that may be purchased under that Plan at that time is not presently determinable.
(b) Represents 500,000 shares that the Company may in the future issue to employees under the Employee Stock Purchase Plan (although the Company typically purchases the shares needed for sale to participating employees on the open market rather than issuing new issue shares to such employees) and 500,000 shares that were available for grant or issuance at December 31, 2009 under the 2009 Long-Term Equity Incentive Plan. Under the Long-Term Equity Incentive Plan, the aggregate number of Common Shares available for the grant of awards in any given fiscal year is equal to the sum of (i) one percent of the number of Common Shares outstanding as of the last day of the Company's prior fiscal year, plus (ii) the number of Common Shares that were available for the grant of awards, but were not granted, under the Plan in any previous fiscal year. Under no circumstances, however, may the number of Common Shares available for the grant of awards in any fiscal year under the Long-Term Equity Incentive Plan exceed one and one-half percent of the Common Shares outstanding as of the last day of the prior fiscal year.
For additional information regarding the Company’s equity incentive plans and employee stock purchase plan, see Note 8 to the consolidated financial statements in Item 8 of this Report.
Item 13. Certain Relationships and Related Transactions.
Information responsive to this Item 13 will be included under the captions “Election of Directors” and “Transactions with Related Persons” of the 2010 Proxy Statement of the Company, which sections are incorporated herein by reference.
Item 14. Principal Accountant Fees and Services.
Information responsive to this Item 14 will be included in the 2010 Proxy Statement under the caption “Principal Accountant Fees and Services”, which section is incorporated herein by reference.
PART IV
Item 15. Exhibits and Financial Statement Schedules.
a) Financial Statements
The following items are included in Item 8 of this Report:
| | Page # |
| German American Bancorp, Inc. and Subsidiaries: | |
| | |
| Report of Independent Registered Public Accounting Firm on Financial Statements | 32 |
| | |
| Consolidated Balance Sheets at December 31, 2009 and 2008 | 33 |
| | |
| Consolidated Statements of Income, years ended December 31, 2009, 2008, and 2007 | 34 |
| | |
| Consolidated Statements of Changes in Shareholders’ Equity, years ended December 31, 2009, 2008, and 2007 | 35 |
| | |
| Consolidated Statements of Cash Flows, years ended December 31, 2009, 2008, and 2007 | 36 |
| | |
| Notes to the Consolidated Financial Statements | 37-67 |
b) Exhibits
The Exhibits described in the Exhibit List immediately following the “Signatures” page of this Report (which Exhibit List is incorporated herein by reference) are hereby filed as part of this Report.
c) Financial Statement Schedules
None.
Pursuant to the requirements of Section 13 of the Securities Exchange Act of 1934, the Registrant has duly caused this Report to be signed on its behalf by the undersigned thereunto duly authorized.
| | | GERMAN AMERICAN BANCORP, INC. |
| | | (Registrant) |
| | | |
Date: March 5, 2010 | | By/s/Mark A. Schroeder |
| | | Mark A. Schroeder, Chairman and |
| | | Chief Executive Officer |
Pursuant to the requirements of the Securities Exchange Act of 1934, this Report has been signed below by the following persons on behalf of the Registrant and in the capacities and on the dates indicated.
Date: March 5, 2010 | | By/s/Mark A. Schroeder |
| | | Mark A. Schroeder, Chairman and Chief Executive |
| | | Officer (principal executive officer), Director |
| | | |
Date: March 5, 2010 | | By/s/Douglas A. Bawel |
| | | Douglas A. Bawel, Director |
| | | |
Date: March 5, 2010 | | By/s/Christina M. Ernst |
| | | Christina M. Ernst, Director |
| | | |
Date: March 5, 2010 | | By/s/Richard E. Forbes |
| | | Richard E. Forbes, Director |
| | | |
Date: March 5, 2010 | | By/s/U. Butch Klem |
| | | U. Butch Klem, Director |
| | | |
Date: March 5, 2010 | | By/s/J. David Lett |
| | | J. David Lett, Director |
| | | |
Date: March 5, 2010 | | By/s/Gene C. Mehne |
| | | Gene C. Mehne, Director |
| | | |
Date: March 5, 2010 | | By/s/Michael J. Voyles |
| | | Michael J. Voyles, Director |
| | | |
Date: March 5, 2010 | | By/s/Bradley M. Rust |
| | | Bradley M. Rust, Executive Vice President and |
| | | Chief Financial Officer (principal accounting officer |
| | | and principal financial officer) |
INDEX OF EXHIBITS
| Exhibit No. | | Description |
| 3.1 | | Restatement of the Articles of Incorporation of the Registrant is incorporated by reference from Exhibit 3 to the Registrant’s Current Report on 8-K filed May 22, 2006. |
| | | |
| 3.2 | | Restated Bylaws of German American Bancorp, Inc., as amended and restated July 27, 2009. The copy of this exhibit filed as Exhibit 3 to the current report on Form 8-K of the Registrant filed July 31, 2009 is incorporated herein by reference. |
| | | |
| 4.1 | | Rights Agreement dated April 27, 2000, is incorporated by reference from Exhibit 4.1 to the Registrant’s Quarterly Report on Form 10-Q for the quarter ended March 31, 2005. |
| | | |
| 4.2 | | No long-term debt instrument issued by the Registrant exceeds 10% of consolidated total assets or is registered. In accordance with paragraph 4 (iii) of Item 601(b) of Regulation S-K, the Registrant will furnish the Securities and Exchange Commission copies of long-term debt instruments and related agreements upon request. |
| | | |
| 4.3 | | Terms of Common Shares and Preferred Shares of the Registrant (included in Restatement of Articles of Incorporation) are incorporated by reference from Exhibit 3 to the Registrant’s Current Report on 8-K filed May 22, 2006. |
| | | |
| 4.4 | | Indenture dated as of April 30, 2009 by and between Wells Fargo Bank, N.A. and German American Bancorp, Inc., including Exhibit A thereto the form of the certificate for the 8% redeemable subordinated debentures due 2019 issued thereunder. This exhibit is incorporated by reference from Exhibit 4 to the Registrant’s Current Report on Form 8-K filed May 4, 2009. |
| | | |
| 10.1 | | The Registrant’s 1992 Stock Option Plan, as amended, is incorporated by reference from Exhibit 10.1 to the Registrant’s Registration Statement on Form S-4 filed October 14, 1998.* |
| | | |
| 10.2 | | Form of Director Deferred Compensation Agreement between The German American Bank and certain of its Directors is incorporated herein by reference from Exhibit 10.4 to the Registrant’s Registration Statement on Form S-4 filed January 21, 1993 (the Agreement entered into by former director George W. Astrike, a copy of which was filed as Exhibit 10.4 to the Registrant’s Registration Statement on Form S-4 filed January 21, 1993, is substantially identical to the Agreements entered into by the other Directors, some of whom remain directors of the Registrant). The schedule following such Exhibit 10.4 lists the Agreements with the other Directors and sets forth the material detail in which such Agreements differ from the Agreement filed as such Exhibit 10.4.* |
| | | |
| 10.3 | | The Registrant’s 1999 Long-Term Equity Incentive Plan, as amended through February 22, 2008 is incorporated by reference from Exhibit 10.3 to the Registrant’s Annual Report on Form 10-K for the year ended December 31, 2007.* |
| | | |
| 10.4 | | The Registrant’s 1999 Long-Term Equity Incentive Plan, as amended through February 22, 2008 is incorporated by reference from Exhibit 10.3 to the Registrant’s Annual Report on Form 10-K for the year ended December 31, 2007.* |
| 10.5 | | Basic Plan Document for the Registrant’s Nonqualified Savings Plan is incorporated by reference from Exhibit 10.4 to the Registrant’s Annual Report on Form 10-K for the year ended December 31, 2004.* |
| | | |
| 10.6 | | Adoption Agreement for the Registrant’s Nonqualified Savings Plan dated August 17, 2004, is incorporated by reference from Exhibit 10.5 to the Registrant’s Annual Report on Form 10-K for the year ended December 31, 2004.* |
| | | |
| 10.7 | | First Amendment to the Registrant’s Nonqualified Savings Plan dated August 17, 2004, is incorporated by reference from Exhibit 10.6 to the Registrant’s Annual Report on Form 10-K for the year ended December 31, 2004.* |
| | | |
| 10.8 | | Form of Employee Stock Option Agreement (new grant, five-year expiration, five year 20% vesting) typically issued during 2005 and prior periods to executive officers and other key employees as incentives is incorporated by reference from Exhibit 10.7 to the Registrant’s Annual Report on Form 10-K for the year ended December 31, 2004.* |
| | | |
| 10.9 | | Form of Employee Stock Option Agreement (Replacement Grant) typically issued during 2005 and prior periods to persons who exercise other stock options using common shares as payment for the exercise price (one year vesting) is incorporated by reference from Exhibit 10.8 to the Registrant’s Annual Report on Form 10-K for the year ended December 31, 2004.* |
| | | |
| 10.10 | | Form of Non-Employee Director Stock Option Agreement (new grant, ten year expiration, no vesting) that in prior periods was typically issued to non-employee members of the Board of Directors as part of annual director fee retainer (not Incentive Stock Option for tax purposes) is incorporated by reference from Exhibit 10.9 to the Registrant’s Annual Report on Form 10-K for the year ended December 31, 2004.* |
| | | |
| 10.11 | | Form of Employee Director Stock Option Agreement (new grant, ten year expiration, no vesting) that in prior periods was typically issued to employee members of the Board of Directors as part of annual director fee retainer (intended to be Incentive Stock Option for tax purposes) is incorporated by reference from Exhibit 10.10 to the Registrant’s Annual Report on Form 10-K for the year ended December 31, 2004.* |
| | | |
| 10.12 | | Description of Director Compensation Arrangements for the 12 month period ending at 2008 Annual Meeting of Shareholders is incorporated by reference from the description included in the Company’s definitive proxy statement for the 2008 Annual Meeting of Shareholders, filed March 20, 2008, under the caption “DIRECTOR COMPENSATION.”* |
| | | |
| 10.13 | | Description of Director Compensation Arrangements for the 12 month period ending at the 2009 Annual Meeting of Shareholders is incorporated by reference from Exhibit 10.2 to the Registrant’s Quarterly Report on Form 10-Q for the quarter ended June 30, 2008.* |
| | | |
| 10.14 | | Description of Director Compensation Arrangements for the 12 month period ending at the 2010 Annual Meeting of Shareholders is incorporated by reference from Exhibit 10.3 to the Registrant’s Quarterly Report on Form 10-Q for the quarter ended June 30, 2009.* |
| | | |
| 10.15 | | Description of Executive Management Incentive Plan for 2007 (awards payable in 2008) is incorporated by reference from the description contained in Item 5.02 of the Registrant’s Current Report on Form 8-K filed February 12, 2007.* |
| 10.16 | | Description of Executive Management Incentive Plan for 2008 (awards payable in 2009) is incorporated by reference from the description contained in Item 5.02 of the Registrant’s Current Report on Form 8-K filed February 28, 2008.* |
| | | |
| 10.17 | | Description of Executive Management Incentive Plan for 2009 (awards payable in 2010) is incorporated by reference from the description contained in Item 5.02 of the Registrant’s Current Report on Form 8-K filed February 28, 2009. * |
| | | |
| 10.18 | | Executive Supplemental Retirement Income Agreement dated October 1, 1996, between First Federal Bank, F.S.B. and Bradley M. Rust as amended by a First Amendment between Bradley M. Rust and the Registrant dated December 30, 2008.* |
| | | |
| 10.19 | | Form of Restricted Stock Award Agreement that evidences the terms of awards of restricted stock grants and related cash entitlements granted under the 1999 Long-Term Equity Incentive Plan is incorporated by reference from Exhibit 99 to the Registrant’s Current Report on Form 8-K filed February 17, 2006.* |
| | | |
| 10.20 | | Resolutions of Stock Option Committee of Board of Directors of the Registrant amending outstanding stock options by accelerating in full all vesting periods and exercise date restrictions and terminating replacement stock option privileges in connection with future option exercises, adopted by written consent effective December 29, 2005, is incorporated by reference from Exhibit 10.18 to the Registrant’s Annual Report on Form 10-K for its fiscal year ended December 31, 2005.* |
| | | |
| 10.21 | | Early Retirement and General Release Agreement dated May 7, 2008 between German American Bancorp and Stan Ruhe, is incorporated by reference from exhibit 10.1 to the Registrant’s Quarterly Report on Form 10-Q for the quarter ended June 30, 2008.* |
| | | |
| 10.22 | | Second Amended and Restated Loan and Subordinated Debenture Purchase Agreement dated as of December 29, 2006, by and between JPMorgan Chase Bank, N.A., and German American Bancorp, Inc., is incorporated by reference from Exhibit 99.1 to the Registrant’s Current Report on 8-K filed January 5, 2007. |
| | | |
| 10.23 | | Agreed Upon Terms and Procedures dated December 29, 2006, executed and delivered by German American Bancorp, Inc. to JPMorgan Chase Bank, N.A., is incorporated by reference from Exhibit 99.2 to the Registrant’s Current Report on 8-K filed January 5, 2007. |
| | | |
| 10.24 | | Amendment to Second Amended and Restated Loan and Subordinated Debenture Purchase Agreement dated as of December 29, 2006, by and between JPMorgan Chase Bank, N.A. and German American Bancorp, Inc., dated September 28, 2007, is incorporated by reference from Exhibit 99 to the Registrant’s Current Report on 8-K filed October 1, 2007. |
| | | |
| 10.25 | | Second Amendment to Second Amended and Restated Loan and Subordinated Debenture Purchase Agreement dated as of December 29, 2006, by and between JPMorgan Chase Bank, N.A. and German American Bancorp, Inc., dated September 30, 2008, is incorporated by reference from Exhibit 10.1 to the Registrant’s Quarterly Report on Form 10-Q for the quarter ended September 30, 2008. |
| | | |
| 10.26 | | Third Amendment dated March 20, 2009, to Second Amended and Restated Loan and Subordinated Debenture Purchase Agreement dated as of December 29, 2006, by and between JPMorgan Chase Bank, N.A. and German American Bancorp, Inc., is incorporated by reference from Exhibit 10.1 to the Registrant’s Quarterly Report on Form 10-Q for the quarter ended June 30, 2009. |
| 10.27 | | Fourth Amendment to Second Amended and Restated Loan and Subordinated Debenture Purchase Agreement dated as of December 10, 2009, by and between JPMorgan Chase Bank, N.A., and German American Bancorp, Inc. is incorporated by reference from Exhibit 99 to the Registrant’s Current Report on Form 8-K filed December 15, 2009. |
| | | |
| 10.28 | | German American Bancorp, Inc., 2009 Long Term Equity Incentive Plan. This exhibit is incorporated by reference from Exhibit 99.1 to the Registrant’s Registration Statement on Form S-8 (No. 333-160749) filed July 23, 2009.* |
| | | |
| 10.29 | | German American Bancorp, Inc., 2009 Employee Stock Purchase Plan. This exhibit is incorporated by reference from Exhibit 99.2 to the Registrant’s Registration Statement on Form S-8 (No. 333-160749) filed July 23, 2009.* |
| | | |
| 21 | | Subsidiaries of the Registrant |
| | | |
| 23 | | Consent of Crowe Horwath LLP |
| | | |
| 31.1 | | Sarbanes-Oxley Act of 2002, Section 302 Certification for Chairman and Chief Executive Officer. |
| | | |
| 31.2 | | Sarbanes-Oxley Act of 2002, Section 302 Certification for Executive Vice President (Principal Financial Officer). |
| | | |
| 32.1 | | Sarbanes-Oxley Act of 2002, Section 906 Certification for Chairman and Chief Executive Officer. |
| | | |
| 32.2 | | Sarbanes-Oxley Act of 2002, Section 906 Certification for Executive Vice President (Principal Financial Officer). |
*Exhibits that describe or evidence all management contracts or compensatory plans or arrangements required to be filed as exhibits to this Report are indicated by an asterisk.
GERMAN AMERICAN BANCORP, INC. WILL FURNISH TO ANY SHAREHOLDER AS OF MARCH 1, 2010 A COPY OF ANY OF THE ABOVE-LISTED EXHIBITS UPON THE PAYMENT OF A CHARGE OF $.50 PER PAGE IN ORDER TO DEFRAY ITS EXPENSES IN PROVIDING SUCH EXHIBIT. SUCH REQUEST SHOULD BE ADDRESSED TO GERMAN AMERICAN BANCORP, INC., ATTN: TERRI A. ECKERLE, SHAREHOLDER RELATIONS, P.O. BOX 810, JASPER, INDIANA, 47547-0810.