UNITED STATES
SECURITIES AND EXCHANGE COMMISSION
Washington, D.C. 20549
FORM N-CSR
CERTIFIED SHAREHOLDER REPORT OF REGISTERED
MANAGEMENT INVESTMENT COMPANIES
Investment Company Act file number 811-3725
Fidelity California Municipal Trust
(Exact name of registrant as specified in charter)
245 Summer St., Boston, MA 02210
(Address of principal executive offices) (Zip code)
Marc Bryant, Secretary
245 Summer St.
Boston, Massachusetts 02210
(Name and address of agent for service)
Registrant's telephone number, including area code:
617-563-7000
Date of fiscal year end: | February 28 |
Date of reporting period: | August 31, 2017 |
Item 1.
Reports to Stockholders
Fidelity® California Limited Term Tax-Free Bond Fund Semi-Annual Report August 31, 2017 |
 |
Contents
To view a fund's proxy voting guidelines and proxy voting record for the 12-month period ended June 30, visit http://www.fidelity.com/proxyvotingresults or visit the Securities and Exchange Commission's (SEC) web site at http://www.sec.gov.
You may also call 1-800-544-8544 to request a free copy of the proxy voting guidelines.
Standard & Poor's, S&P and S&P 500 are registered service marks of The McGraw-Hill Companies, Inc. and have been licensed for use by Fidelity Distributors Corporation.
Other third-party marks appearing herein are the property of their respective owners.
All other marks appearing herein are registered or unregistered trademarks or service marks of FMR LLC or an affiliated company. © 2017 FMR LLC. All rights reserved.
This report and the financial statements contained herein are submitted for the general information of the shareholders of the Fund. This report is not authorized for distribution to prospective investors in the Fund unless preceded or accompanied by an effective prospectus.
A fund files its complete schedule of portfolio holdings with the SEC for the first and third quarters of each fiscal year on Form N-Q. Forms N-Q are available on the SEC’s web site at http://www.sec.gov. A fund's Forms N-Q may be reviewed and copied at the SEC’s Public Reference Room in Washington, DC. Information regarding the operation of the SEC's Public Reference Room may be obtained by calling 1-800-SEC-0330.
For a complete list of a fund's portfolio holdings, view the most recent holdings listing, semiannual report, or annual report on Fidelity's web site at http://www.fidelity.com, http://www.institutional.fidelity.com, or http://www.401k.com, as applicable.
NOT FDIC INSURED •MAY LOSE VALUE •NO BANK GUARANTEE
Neither the Fund nor Fidelity Distributors Corporation is a bank.
Investment Summary (Unaudited)
Top Five Sectors as of August 31, 2017
| % of fund's net assets | % of fund's net assets 6 months ago | |
| General Obligations | 33.3 | 36.8 |
| Health Care | 17.9 | 16.6 |
| Special Tax | 13.2 | 13.2 |
| Electric Utilities | 12.4 | 8.0 |
| Transportation | 6.8 | 7.4 |
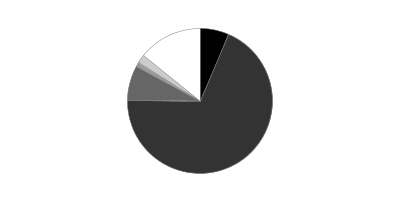
Quality Diversification (% of fund's net assets)
| As of August 31, 2017 | ||
| AAA | 6.5% | |
| AA,A | 68.7% | |
| BBB | 7.7% | |
| BB and Below | 0.9% | |
| Not Rated | 1.9% | |
| Short-Term Investments and Net Other Assets | 14.3% | |
| As of February 28, 2017 | ||
| AAA | 7.6% | |
| AA,A | 71.3% | |
| BBB | 6.0% | |
| BB and Below | 1.0% | |
| Not Rated | 3.6% | |
| Short-Term Investments and Net Other Assets | 10.5% | |
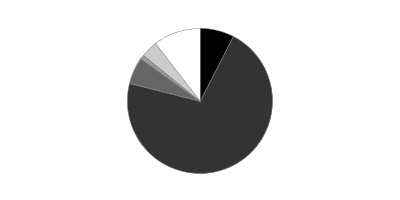
We have used ratings from Moody's Investors Service, Inc. Where Moody's® ratings are not available, we have used S&P® ratings. All ratings are as of the date indicated and do not reflect subsequent changes.
Investments August 31, 2017 (Unaudited)
Showing Percentage of Net Assets
| Municipal Bonds - 85.7% | |||
| Principal Amount | Value | ||
| California - 84.6% | |||
| ABAG Fin. Auth. for Nonprofit Corps. Rev.: | |||
| (Sharp HealthCare Proj.): | $ | $ | |
| Series 2011 A: | |||
| 5% 8/1/18 | 2,645,000 | 2,743,235 | |
| 5% 8/1/22 | 1,655,000 | 1,900,205 | |
| Series 2012 A: | |||
| 4% 8/1/21 | 1,200,000 | 1,332,084 | |
| 5% 8/1/19 | 1,200,000 | 1,291,656 | |
| Series 2007 A, 5% 12/1/37 (Pre-Refunded to 12/1/17 @ 100) | 3,350,000 | 3,383,333 | |
| Alameda Corridor Trans. Auth. Rev.: | |||
| Series 2004, 0% 10/1/18 | 1,975,000 | 1,930,958 | |
| Series 2013 A: | |||
| 5% 10/1/19 | 1,000,000 | 1,081,930 | |
| 5% 10/1/20 | 1,730,000 | 1,933,638 | |
| 5% 10/1/21 | 2,725,000 | 3,137,402 | |
| Series 2016 A: | |||
| 4% 10/1/21 | 1,250,000 | 1,369,800 | |
| 4% 10/1/23 | 850,000 | 952,383 | |
| 5% 10/1/22 | 1,250,000 | 1,449,525 | |
| Antelope Valley Healthcare District Rev. Series 2016 A, 5% 3/1/21 | 2,470,000 | 2,620,571 | |
| Antioch Unified School District (School Facilities Impt. District #1 Proj.) Series 2008 B, 6.25% 8/1/19 (Assured Guaranty Corp. Insured) | 440,000 | 484,132 | |
| Bay Area Toll Auth. San Francisco Bay Toll Bridge Rev.: | |||
| Bonds: | |||
| Series B, 2.85%, tender 4/1/25 (a) | 7,000,000 | 7,452,270 | |
| Series C, 2.1%, tender 4/1/22 (a) | 7,000,000 | 7,218,400 | |
| Series H, 2.125%, tender 4/1/25 (a) | 8,000,000 | 8,097,280 | |
| 1.5%, tender 10/1/17 (a) | 1,000,000 | 1,000,550 | |
| 1.875%, tender 4/1/19 (a) | 16,250,000 | 16,444,350 | |
| Series 2014 E, 2% 4/1/34 | 3,000,000 | 3,072,090 | |
| California Dept. of Wtr. Resources Pwr. Supply Rev.: | |||
| Series 2010 L, 5% 5/1/21 | 1,890,000 | 2,092,136 | |
| Series 2011 N, 5% 5/1/19 | 5,000,000 | 5,348,350 | |
| California Econ. Recovery Series 2009 A: | |||
| 5% 7/1/18 (Escrowed to Maturity) | 415,000 | 429,517 | |
| 5% 7/1/18 (Escrowed to Maturity) | 1,490,000 | 1,542,120 | |
| 5% 7/1/19 (Escrowed to Maturity) | 7,300,000 | 7,853,997 | |
| California Edl. Facilities Auth. Rev. Series U5, 5% 5/1/21 | 8,000,000 | 9,175,920 | |
| California Enterprise Dev. Auth. (The Thacher School Proj.) Series 2010: | |||
| 4% 9/1/18 | 255,000 | 263,305 | |
| 5% 9/1/17 | 400,000 | 400,000 | |
| California Gen. Oblig.: | |||
| Bonds: | |||
| 3%, tender 12/1/19 (a) | 7,000,000 | 7,256,270 | |
| 4%, tender 12/1/21 (a) | 4,000,000 | 4,403,320 | |
| 4% 5/1/23 | 2,440,000 | 2,780,746 | |
| 5% 9/1/21 | 6,080,000 | 6,989,446 | |
| 5% 2/1/22 | 3,850,000 | 4,466,539 | |
| California Health Facilities Fing. Auth. Bonds: | |||
| Series 2009 D, 1.7%, tender 10/18/22 (a) | 5,000,000 | 5,068,850 | |
| Series 2016 B1, 1.25%, tender 10/1/20 (a) | 9,545,000 | 9,580,030 | |
| Series 2016 B2, 4%, tender 10/1/24 (a) | 6,000,000 | 6,885,360 | |
| Series 2016 B3, 2%, tender 10/1/25 (a) | 11,145,000 | 11,111,899 | |
| Series 2016 C, 1%, tender 8/15/19 (a) | 10,000,000 | 10,011,500 | |
| California Health Facilities Fing. Auth. Rev.: | |||
| (Children's Hosp. of Orange County Proj.) Series 2012 A: | |||
| 4% 11/15/17 | 1,000,000 | 1,005,310 | |
| 5% 11/15/21 | 1,450,000 | 1,650,332 | |
| Series 2011 A, 5% 3/1/19 | 5,010,000 | 5,302,584 | |
| Series 2011 D: | |||
| 5% 8/15/19 | 1,500,000 | 1,622,040 | |
| 5% 8/15/20 | 1,460,000 | 1,633,842 | |
| Series 2011: | |||
| 5% 8/15/19 | 2,000,000 | 2,161,100 | |
| 5% 8/15/20 | 2,000,000 | 2,238,140 | |
| Series 2014 A: | |||
| 5% 10/1/19 | 1,250,000 | 1,356,188 | |
| 5% 10/1/20 | 1,200,000 | 1,347,060 | |
| 5% 10/1/21 | 500,000 | 578,905 | |
| 5% 10/1/22 | 1,650,000 | 1,961,949 | |
| California Infrastructure and Econ. Dev. Bank Rev. Bonds: | |||
| Series 2010 E, 1.75%, tender 6/1/22 (a) | 3,000,000 | 3,032,760 | |
| Series 2013 A2, 1 month U.S. LIBOR + 0.500% 1.362%, tender 4/1/19 (a)(b) | 10,000,000 | 10,086,000 | |
| Series 2017, 1.75%, tender 6/1/22 (a) | 4,150,000 | 4,195,318 | |
| California Muni. Fin. Auth. (Orange County Civic Ctr. Infrastructure Impt. Prog.) Series 2017 A: | |||
| 5% 6/1/21 | 900,000 | 1,029,546 | |
| 5% 6/1/30 | 2,650,000 | 3,268,245 | |
| California Muni. Fin. Auth. Rev.: | |||
| ( Biola Univeristy, Inc. Proj.) Series 2017, 5% 10/1/20 | 305,000 | 339,334 | |
| ( Univ. of Verne Proj.) Series 2017 A, 5% 6/1/23 | 700,000 | 829,087 | |
| (Biola Univeristy, Inc. Proj.) Series 2017: | |||
| 5% 10/1/21 | 375,000 | 427,260 | |
| 5% 10/1/22 | 795,000 | 926,946 | |
| 5% 10/1/23 | 415,000 | 487,633 | |
| 5% 10/1/24 | 370,000 | 438,802 | |
| (Biola Univeristy, Inc.Proj.) Series 2017, 4% 10/1/19 | 405,000 | 429,648 | |
| (Channing House Proj.) Series 2017 A, 5% 5/15/26 | 360,000 | 445,115 | |
| (Channing House Proj.) Series 2017 A: | |||
| 4% 5/15/28 | 2,000,000 | 2,254,900 | |
| 5% 5/15/24 | 910,000 | 1,099,799 | |
| 5% 5/15/27 | 350,000 | 436,142 | |
| (Eisenhower Med. Ctr. Proj.) Series 2010 A, 5% 7/1/18 (Escrowed to Maturity) | 1,645,000 | 1,701,851 | |
| (Institute On Aging Proj.) Series 2017: | |||
| 5% 8/15/21 | 225,000 | 257,164 | |
| 5% 8/15/23 | 225,000 | 269,181 | |
| 5% 8/15/24 | 285,000 | 345,916 | |
| 5% 8/15/25 | 735,000 | 902,220 | |
| 5% 8/15/26 | 275,000 | 340,967 | |
| (Northbay Healthcare Group Proj.) Series 2013 B, 5% 11/1/19 | 3,335,000 | 3,579,089 | |
| (Univ. of Verne Proj.) Series 2017 A: | |||
| 4% 6/1/19 | 300,000 | 315,714 | |
| 5% 6/1/20 | 200,000 | 220,736 | |
| 5% 6/1/21 | 550,000 | 624,613 | |
| 5% 6/1/22 | 625,000 | 727,119 | |
| 5% 6/1/25 | 1,250,000 | 1,512,525 | |
| Series 2010 A. 5% 7/1/22 (Pre-Refunded to 7/1/20 @ 100) | 1,850,000 | 2,056,294 | |
| Series 2017 A: | |||
| 5% 7/1/24 | 1,400,000 | 1,671,390 | |
| 5% 7/1/25 | 750,000 | 899,483 | |
| 5% 7/1/26 | 1,000,000 | 1,206,410 | |
| 5% 7/1/27 | 800,000 | 967,736 | |
| Series 2017 B: | |||
| 5% 7/1/24 | 1,440,000 | 1,716,062 | |
| 5% 7/1/26 | 500,000 | 603,205 | |
| 5% 7/1/27 | 640,000 | 774,189 | |
| California Pub. Works Board Lease Rev.: | |||
| (Coalinga State Hosp. Proj.) Series 2013 E, 5% 6/1/21 | 7,000,000 | 7,985,460 | |
| (Dept. of Corrections State Prison Proj.) Series A, 5% 12/1/19 (AMBAC Insured) | 5,930,000 | 6,238,538 | |
| (Riverside Campus Proj.) Series 2012 H, 5% 4/1/21 | 1,000,000 | 1,135,380 | |
| (Univ. Proj.) Series 2012 D: | |||
| 4% 9/1/21 (Escrowed to Maturity) | 1,000,000 | 1,115,280 | |
| 4% 9/1/22 (Escrowed to Maturity) | 1,000,000 | 1,140,850 | |
| 4% 9/1/23 (Pre-Refunded to 9/1/22 @ 100) | 1,000,000 | 1,140,850 | |
| (Various Cap. Projs.): | |||
| Series 2009 G1, 5.25% 10/1/17 (Escrowed to Maturity) | 2,900,000 | 2,909,222 | |
| Series 2011 A, 5% 10/1/21 | 4,230,000 | 4,871,987 | |
| Series 2012 A, 5% 4/1/20 | 1,800,000 | 1,983,150 | |
| Series 2012 G, 5% 11/1/21 | 1,500,000 | 1,731,525 | |
| Series 2014 H, 5% 12/1/18 | 5,000,000 | 5,260,900 | |
| (Various Judicial Council Projs.) Series 2011 D, 5% 12/1/19 | 2,700,000 | 2,942,595 | |
| Series 2008 F, 5.25% 11/1/19 (Nat'l. Pub. Fin. Guarantee Corp. Insured) | 3,000,000 | 3,275,550 | |
| Series 2009 A, 5% 4/1/19 (Escrowed to Maturity) | 1,000,000 | 1,066,020 | |
| Series 2009 J, 5% 11/1/17 | 2,700,000 | 2,718,009 | |
| Series 2014 B: | |||
| 5% 10/1/21 | 1,000,000 | 1,151,770 | |
| 5% 10/1/22 | 1,225,000 | 1,442,046 | |
| Series 2014 C: | |||
| 5% 10/1/21 | 1,355,000 | 1,560,648 | |
| 5% 10/1/22 | 1,000,000 | 1,177,180 | |
| Series 2014 G, 5% 1/1/18 | 5,000,000 | 5,069,550 | |
| 5% 9/1/20 | 3,500,000 | 3,908,660 | |
| California State Univ. Rev. Bonds 4%, tender 11/1/23 (a) | 5,000,000 | 5,701,200 | |
| California Statewide Cmntys. Dev. Auth. Series 2016: | |||
| 5% 5/15/19 | 1,000,000 | 1,066,920 | |
| 5% 5/15/20 | 575,000 | 634,467 | |
| 5% 5/15/21 | 825,000 | 936,581 | |
| 5% 5/15/22 | 1,000,000 | 1,163,400 | |
| 5% 5/15/23 | 1,250,000 | 1,482,550 | |
| 5% 5/15/24 | 1,000,000 | 1,202,960 | |
| California Statewide Cmntys. Dev. Auth. Poll. Cont. Rev. Bonds Series 2006 A, 1.375%, tender 4/2/18 (a) | 1,000,000 | 1,002,930 | |
| California Statewide Cmntys. Dev. Auth. Rev.: | |||
| (Cottage Health Sys. Obligated Group Proj.) Series 2010, 5% 11/1/18 | 500,000 | 523,390 | |
| Series 2016: | |||
| 5% 10/1/22 | 725,000 | 827,472 | |
| 5% 10/1/24 | 2,030,000 | 2,375,587 | |
| 5% 10/1/25 | 1,010,000 | 1,191,851 | |
| Corona-Norco Unified School District Series 2013 A: | |||
| 5% 9/1/19 | 1,225,000 | 1,318,345 | |
| 5% 9/1/20 | 1,285,000 | 1,421,814 | |
| 5% 9/1/22 | 500,000 | 577,005 | |
| Corona-Norco Unified School District Spl. Tax Series 2013: | |||
| 4% 9/1/18 | 1,405,000 | 1,443,033 | |
| 4% 9/1/20 | 1,665,000 | 1,787,111 | |
| East Side Union High School District Santa Clara County Series B, 5.1% 2/1/19 (Nat'l. Pub. Fin. Guarantee Corp. Insured) | 500,000 | 529,420 | |
| Eastern Muni. Wtr. Distr. Rfdg. Wtr. and Wastewtr. Rev. Series 2011 A, 5% 7/1/18 | 1,085,000 | 1,123,865 | |
| El Dorado County Gen. Oblig.: | |||
| 5% 9/1/20 | 545,000 | 606,078 | |
| 5% 9/1/22 | 1,295,000 | 1,518,763 | |
| El Dorado Irr. Distr. Rev. Series 2016 A: | |||
| 4% 3/1/20 | 500,000 | 538,790 | |
| 4% 3/1/21 | 625,000 | 690,894 | |
| 5% 3/1/22 | 500,000 | 587,045 | |
| 5% 3/1/23 | 500,000 | 601,765 | |
| Elk Grove Fin. Auth. Spl. Tax Rev.: | |||
| Series 2015: | |||
| 5% 9/1/22 | 425,000 | 498,215 | |
| 5% 9/1/23 | 775,000 | 926,799 | |
| 5% 9/1/24 | 1,000,000 | 1,213,570 | |
| Series 2016: | |||
| 4% 9/1/21 | 1,130,000 | 1,241,215 | |
| 4% 9/1/23 | 1,500,000 | 1,688,295 | |
| 4% 9/1/25 | 1,915,000 | 2,158,703 | |
| Elk Grove Unified School Distr. Cert. of Prtn. (Cap. Facilities Proj.) Series 2016: | |||
| 5% 2/1/19 (Build America Mutual Assurance Insured) | 2,515,000 | 2,663,134 | |
| 5% 2/1/22 (Build America Mutual Assurance Insured) | 2,895,000 | 3,365,380 | |
| 5% 2/1/23 (Build America Mutual Assurance Insured) | 1,390,000 | 1,654,281 | |
| 5% 2/1/24 (Build America Mutual Assurance Insured) | 1,460,000 | 1,769,841 | |
| Elsinore Valley Muni. Wtr. District Series 2016 A: | |||
| 5% 7/1/21 | 1,375,000 | 1,579,463 | |
| 5% 7/1/22 | 900,000 | 1,062,909 | |
| 5% 7/1/23 | 750,000 | 906,435 | |
| 5% 7/1/24 | 1,000,000 | 1,228,960 | |
| Fullerton School District 5% 8/1/18 | 500,000 | 519,635 | |
| Golden State Tobacco Securitization Corp. Tobacco Settlement Rev.: | |||
| Series 2013 A, 5% 6/1/21 | 5,000,000 | 5,713,750 | |
| Series 2017 A1: | |||
| 5% 6/1/21 | 1,000,000 | 1,136,450 | |
| 5% 6/1/22 | 1,000,000 | 1,159,910 | |
| 5% 6/1/23 | 1,000,000 | 1,177,210 | |
| 5% 6/1/27 | 2,000,000 | 2,416,200 | |
| Series A, 0% 6/1/24 (AMBAC Insured) | 7,000,000 | 6,121,780 | |
| Indio Pub. Fing. Auth. Lease Rev. Series 2012: | |||
| 5% 11/1/17 | 1,080,000 | 1,086,944 | |
| 5% 11/1/18 | 1,135,000 | 1,189,037 | |
| 5% 11/1/19 | 635,000 | 690,093 | |
| 5% 11/1/20 | 670,000 | 752,296 | |
| 5% 11/1/21 | 455,000 | 526,030 | |
| 5% 11/1/22 | 745,000 | 883,168 | |
| Irvine Reassessment District 12-1 Ltd. Oblig.: | |||
| 4% 9/2/19 | 2,000,000 | 2,117,040 | |
| 4% 9/2/20 | 1,000,000 | 1,074,930 | |
| 5% 9/2/20 | 800,000 | 880,800 | |
| 5% 9/2/22 | 750,000 | 867,518 | |
| La Quinta Redev. Agcy.: | |||
| (La Quinta Redev. Proj. Areas No. 1 and 2) Series 2014 A: | |||
| 5% 9/1/20 | 500,000 | 556,660 | |
| 5% 9/1/21 | 615,000 | 704,403 | |
| 5% 9/1/22 | 615,000 | 721,918 | |
| 5% 9/1/23 | 1,205,000 | 1,441,783 | |
| Series 2013 A: | |||
| 5% 9/1/21 | 1,000,000 | 1,144,530 | |
| 5% 9/1/22 | 2,000,000 | 2,345,580 | |
| 5% 9/1/23 | 1,500,000 | 1,792,860 | |
| Laguna Beach Unified School District Gen. Oblig. (Election of 2001 Proj.) 5% 8/1/19 | 250,000 | 270,183 | |
| Los Angeles Cmnty. College District Series 2016 I: | |||
| 2% 8/1/22 | 1,000,000 | 1,046,750 | |
| 3% 8/1/23 | 1,100,000 | 1,215,148 | |
| 4% 8/1/24 | 700,000 | 822,367 | |
| Los Angeles County Ctfs. of Prtn.: | |||
| (Disney Concert Hall Parking Garage Proj.): | |||
| 5% 9/1/20 | 500,000 | 559,480 | |
| 5% 3/1/21 | 500,000 | 568,170 | |
| 5% 9/1/21 | 1,270,000 | 1,464,259 | |
| 5% 3/1/22 | 1,000,000 | 1,168,340 | |
| (Disney Parking Proj.) 0% 3/1/20 | 3,205,000 | 3,111,831 | |
| Los Angeles County Metropolitan Trans. Auth. Sales Tax Rev. Series 2013 A, 5% 7/1/18 | 3,000,000 | 3,103,920 | |
| Los Angeles Dept. of Wtr. & Pwr. Rev.: | |||
| Series 2011 A, 5% 7/1/19 | 5,000,000 | 5,381,350 | |
| Series 2014 B, 5% 7/1/19 | 450,000 | 484,322 | |
| Los Angeles Muni. Impt. Corp. Lease Rev.: | |||
| Series 2012 C, 5% 3/1/21 | 5,055,000 | 5,734,847 | |
| Series 2014 A, 5% 5/1/23 | 475,000 | 568,760 | |
| Series 2014 B, 5% 5/1/23 | 200,000 | 239,478 | |
| Los Angeles Unified School District Series 2016: | |||
| 4% 7/1/23 | 3,000,000 | 3,470,760 | |
| 5% 7/1/23 | 2,000,000 | 2,425,920 | |
| Los Angeles Unified School District Ctfs. of Prtn.: | |||
| (Multiple Properties Proj.) Series 2010 A, 5% 12/1/17 | 1,045,000 | 1,055,544 | |
| Series 2012 A, 5% 10/1/19 | 5,000,000 | 5,418,250 | |
| Los Angeles Wastewtr. Sys. Rev. Series 2013 B, 5% 6/1/22 | 5,000,000 | 5,915,200 | |
| Modesto Irrigation District Elec. Rev. Series 2011 A, 5% 7/1/18 | 2,000,000 | 2,069,280 | |
| Montebello Pub. Fing. Auth.: | |||
| (Montebello Home2 Suites By Hilton Hotel Proj.) Series 2016 A, 5% 6/1/27 | 1,415,000 | 1,719,508 | |
| (Montebello Home2 Suites by Hilton Hotel Proj.) Series 2016 A, 5% 6/1/28 | 1,490,000 | 1,766,514 | |
| (Montebello Home2 Suites By Hilton Hotel Proj.) Series 2016 A, 5% 6/1/29 | 1,560,000 | 1,828,226 | |
| Monterey Peninsula Cmnty. College District Series 2016: | |||
| 0% 8/1/22 | 2,300,000 | 2,118,875 | |
| 0% 8/1/24 | 2,700,000 | 2,343,816 | |
| Murrieta Pub. Fing. Auth. Spl. Tax Series 2012, 5% 9/1/19 | 1,090,000 | 1,169,047 | |
| Oakland St. Bldg. Auth. Lease Rev. Series 2015 A: | |||
| 5% 12/1/19 | 3,500,000 | 3,806,320 | |
| 5% 12/1/20 | 8,110,000 | 9,098,933�� | |
| Oakland Unified School District Alameda County: | |||
| Series 2013: | |||
| 5% 8/1/18 | 1,000,000 | 1,038,340 | |
| 5% 8/1/19 | 1,000,000 | 1,078,950 | |
| Series 2015 A: | |||
| 5% 8/1/23 (FSA Insured) | 2,000,000 | 2,428,000 | |
| 5% 8/1/24 | 1,900,000 | 2,347,127 | |
| 5% 8/1/24 (FSA Insured) | 2,020,000 | 2,495,367 | |
| Oakland-Alameda County Coliseum Auth. (Oakland Coliseum Proj.) Series 2012 A, 5% 2/1/22 | 3,300,000 | 3,850,077 | |
| Ohlone Cmnty. College District Series 2010, 4% 8/1/18 | 200,000 | 205,964 | |
| Orange County Trans. Auth. Toll Road Rev. Series 2013, 5% 8/15/20 | 1,440,000 | 1,608,336 | |
| Padre Dam Muni. Wtr. District Ctfs. of Prtn. Series 2009 A, 4% 10/1/17 (Escrowed to Maturity) | 420,000 | 420,958 | |
| Palm Springs Fing. Auth. Lease (Downtown Revitalization Proj.) Series 2012 B: | |||
| 4% 6/1/18 | 1,345,000 | 1,377,724 | |
| 4% 6/1/20 | 1,560,000 | 1,687,748 | |
| Palo Alto Unified School District Gen. Oblig. Series 2008, 0% 8/1/25 | 2,180,000 | 1,884,741 | |
| Palomar Health Rev. Series 2016: | |||
| 5% 11/1/25 | 2,000,000 | 2,320,240 | |
| 5% 11/1/26 | 1,875,000 | 2,189,475 | |
| Pasadena Area Cmnty. College District Gen. Oblig. Series 2009 D, 5% 8/1/18 | 505,000 | 524,599 | |
| Poway California Redev. Agcy. Successor Series A: | |||
| 5% 12/15/23 | 4,330,000 | 5,234,277 | |
| 5% 6/15/24 | 2,440,000 | 2,961,867 | |
| Poway Unified School District Pub. Fing.: | |||
| 4% 9/1/19 | 1,000,000 | 1,051,760 | |
| 4% 9/1/20 | 1,170,000 | 1,256,171 | |
| 4% 9/15/20 | 340,000 | 364,313 | |
| 4% 9/15/21 | 325,000 | 353,961 | |
| 5% 9/1/21 | 1,230,000 | 1,390,872 | |
| 5% 9/1/22 | 1,000,000 | 1,154,530 | |
| 5% 9/1/23 | 1,350,000 | 1,585,737 | |
| Rancho Cucamonga Redev. Agcy. (Rancho Redev. Proj.): | |||
| 5% 9/1/20 (FSA Insured) | 1,175,000 | 1,309,984 | |
| 5% 9/1/21 (FSA Insured) | 1,000,000 | 1,147,470 | |
| 5% 9/1/22 (FSA Insured) | 1,400,000 | 1,647,086 | |
| Riverside County Asset Leasing Rev. (Riverside Cap. Proj.) Series 2012 A, 5% 6/1/19 | 3,655,000 | 3,915,821 | |
| Riverside County Palm Desert (County Facilities Proj.) Series 2008 A, 6% 5/1/22 (Pre-Refunded to 5/1/18 @ 100) | 2,760,000 | 2,854,337 | |
| Riverside Swr. Rev. Series 2015 A: | |||
| 5% 8/1/22 | 2,160,000 | 2,546,273 | |
| 5% 8/1/24 | 1,500,000 | 1,835,310 | |
| Sacramento City Fing. Auth. Lease Rev.: | |||
| Series 1993 A, 5.4% 11/1/20 (AMBAC Insured) | 880,000 | 938,802 | |
| Series 1993 B, 5.4% 11/1/20 | 2,000,000 | 2,133,640 | |
| Sacramento Muni. Util. District Elec. Rev. Series 2011 X: | |||
| 5% 8/15/19 | 1,465,000 | 1,583,006 | |
| 5% 8/15/20 | 5,500,000 | 6,149,770 | |
| San Bernardino County Ctfs. of Prtn. (Arrowhead Proj.) Series 2009 B, 5.25% 8/1/19 | 3,285,000 | 3,550,691 | |
| San Bernardino Unified School District Gen. Oblig. Series 2013 A: | |||
| 5% 8/1/21 (FSA Insured) | 1,150,000 | 1,323,248 | |
| 5% 8/1/22 (FSA Insured) | 1,500,000 | 1,773,735 | |
| San Diego Convention Ctr. Expansion Series 2012 A, 5% 4/15/19 | 3,000,000 | 3,201,930 | |
| San Diego Pub. Facilities Fing. Auth. Lease Rev. Series 2015 B: | |||
| 5% 10/15/23 | 1,355,000 | 1,639,604 | |
| 5% 10/15/25 | 1,605,000 | 1,994,951 | |
| San Diego Pub. Facilities Fing. Auth. Swr. Rev.: | |||
| Series 2016, 5% 5/15/21 | 2,500,000 | 2,873,300 | |
| 4% 5/15/21 | 4,225,000 | 4,702,721 | |
| San Francisco Bldg. Auth. Lease Rev. Series 2015 A, 5% 12/1/20 | 6,990,000 | 7,882,833 | |
| San Francisco City & County Redev. Agcy. Successor: | |||
| (San Francisco Redev. Projs.) Series 2014 C: | |||
| 5% 8/1/20 | 1,000,000 | 1,113,540 | |
| 5% 8/1/21 | 1,000,000 | 1,147,750 | |
| 5% 8/1/22 | 175,000 | 206,203 | |
| 5% 8/1/18 | 2,215,000 | 2,297,885 | |
| 5% 8/1/18 | 285,000 | 295,690 | |
| 5% 8/1/19 | 2,050,000 | 2,207,379 | |
| San Jacinto Unified School District: | |||
| Series 2014 A, 5% 8/1/22 (FSA Insured) | 325,000 | 382,441 | |
| Series 2014: | |||
| 5% 8/1/20 (FSA Insured) | 165,000 | 183,584 | |
| 5% 8/1/21 (FSA Insured) | 150,000 | 171,977 | |
| 5% 8/1/23 (FSA Insured) | 400,000 | 480,552 | |
| 5% 8/1/24 (FSA Insured) | 750,000 | 914,918 | |
| San Joaquin County Ctfs. of Prtn. 5% 11/15/17 (Escrowed to Maturity) | 1,280,000 | 1,290,458 | |
| San Jose Fing. Auth. Lease Rev.: | |||
| (Civic Ctr. Proj.) Series 2013 A, 5% 6/1/22 | 1,100,000 | 1,294,645 | |
| Series 2013 A, 4% 6/1/21 | 1,000,000 | 1,108,570 | |
| San Jose Int'l. Arpt. Rev. Series 2017 B, 3% 3/1/19 | 1,000,000 | 1,032,130 | |
| San Marcos Redev. Agcy. Successor Series 2015 A: | |||
| 5% 10/1/22 | 1,850,000 | 2,183,759 | |
| 5% 10/1/23 | 900,000 | 1,083,240 | |
| San Mateo Unified School District (Election of 2000 Proj.) Series B, 0% 9/1/25 (Nat'l. Pub. Fin. Guarantee Corp. Insured) | 3,055,000 | 2,599,927 | |
| San Mateo-Foster City School District: | |||
| 5% 8/15/20 | 2,510,000 | 2,807,310 | |
| 5% 8/15/21 | 7,105,000 | 8,200,733 | |
| San Pablo Redev. Agcy. Series 2014 A: | |||
| 4% 6/15/19 (FSA Insured) | 380,000 | 399,794 | |
| 5% 6/15/20 (FSA Insured) | 1,000,000 | 1,104,840 | |
| 5% 6/15/21 (FSA Insured) | 500,000 | 568,915 | |
| 5% 6/15/22 (FSA Insured) | 1,000,000 | 1,167,210 | |
| 5% 6/15/23 (FSA Insured) | 630,000 | 750,374 | |
| San Ramon Valley Union School District Series 2012, 4% 8/1/20 | 3,620,000 | 3,939,718 | |
| Santa Monica Pub. Fin. Rev.: | |||
| (Santa Monica Calif Proj.) Series 2017, 5% 7/1/22 (c) | 400,000 | 474,344 | |
| Series 2011 A: | |||
| 4% 6/1/19 | 880,000 | 929,227 | |
| 4% 6/1/20 | 770,000 | 834,796 | |
| Santa Rosa Wastewtr. Rev. Series 2016 A: | |||
| 4% 9/1/20 | 2,000,000 | 2,184,120 | |
| 5% 9/1/21 | 1,250,000 | 1,447,025 | |
| South Orange County Pub. Fing. Auth. Spl. Tax Rev. Series 2014 A: | |||
| 5% 8/15/18 | 1,000,000 | 1,034,030 | |
| 5% 8/15/21 | 750,000 | 841,830 | |
| 5% 8/15/22 | 750,000 | 849,653 | |
| Southern California Pub. Pwr. Auth. Bonds Series 1, 2%, tender 7/1/20 (a)(c) | 5,000,000 | 5,097,950 | |
| Southern California Pub. Pwr. Auth. Transmission Proj. Rev. (Southern Transmission Proj.) Series 2013 A, 5% 7/1/21 | 5,000,000 | 5,749,600 | |
| Stockton Unified School District Gen. Oblig.: | |||
| Series 2011, 5% 7/1/20 (FSA Insured) | 1,575,000 | 1,748,297 | |
| 5% 7/1/21 (FSA Insured) | 1,200,000 | 1,373,100 | |
| 5% 7/1/22 (FSA Insured) | 1,220,000 | 1,433,939 | |
| Successor Agcy. To The Redev. Agcy. of Pittsburg: | |||
| (Los Medanos Cmnty. Dev. Proj. Series 2016, 5% 9/1/21 (FSA Insured) | 1,000,000 | 1,138,260 | |
| (Los Medanos Cmnty. Dev. Proj.) Series 2016 A: | |||
| 5% 9/1/18 (FSA Insured) | 5,000,000 | 5,191,750 | |
| 5% 9/1/19 (FSA Insured) | 5,000,000 | 5,373,850 | |
| 5% 9/1/21 (FSA Insured) | 1,025,000 | 1,167,567 | |
| 5% 9/1/22 (FSA Insured) | 3,370,000 | 3,927,567 | |
| 5% 9/1/23 (FSA Insured) | 3,000,000 | 3,561,210 | |
| Sweetwater Union High School District: | |||
| 4.5% 9/1/17 | 500,000 | 500,000 | |
| 5% 9/1/19 | 1,000,000 | 1,077,030 | |
| 5% 9/1/20 | 1,000,000 | 1,111,760 | |
| Torrance Unified School District Series 2008 Z, 5.25% 8/1/18 | 1,000,000 | 1,041,520 | |
| Univ. of California Revs. Bonds 1.4%, tender 5/15/21 (a) | 6,500,000 | 6,524,310 | |
| Upland Gen. Oblig. Ctfs. of Prtn. 5% 1/1/18 | 2,220,000 | 2,242,888 | |
| Vacaville Unified School District: | |||
| Series 2014 C: | |||
| 5% 8/1/19 (Build America Mutual Assurance Insured) | 1,255,000 | 1,355,074 | |
| 5% 8/1/21 (Build America Mutual Assurance Insured) | 1,530,000 | 1,761,122 | |
| Series 2015 A: | |||
| 4% 8/1/18 | 845,000 | 870,198 | |
| 5% 8/1/19 | 300,000 | 323,922 | |
| 5% 8/1/20 | 200,000 | 223,014 | |
| Walnut Energy Ctr. Auth. Rev. Series 2014 A: | |||
| 5% 1/1/20 | 250,000 | 273,353 | |
| 5% 1/1/21 | 250,000 | 282,390 | |
| 5% 1/1/22 | 350,000 | 406,777 | |
| West Contra Costa Unified School District: | |||
| Series 2014 A: | |||
| 4% 8/1/20 | 2,715,000 | 2,953,974 | |
| 4% 8/1/21 | 1,355,000 | 1,509,646 | |
| 5% 8/1/18 | 2,630,000 | 2,732,070 | |
| 5% 8/1/19 | 2,325,000 | 2,510,396 | |
| 5% 8/1/22 | 575,000 | 681,438 | |
| 5% 8/1/23 | 1,500,000 | 1,817,190 | |
| Series 2015 B, 5% 8/1/19 | 1,290,000 | 1,392,865 | |
| 5% 8/1/18 (FSA Insured) | 1,500,000 | 1,558,215 | |
| 5% 8/1/19 (FSA Insured) | 1,500,000 | 1,619,610 | |
| Western Muni. Wtr. District Facilities Auth. Wtr. Rev. Series 2016 A, 1.5%, tender 7/1/20 (a) | 5,500,000 | 5,556,265 | |
| Wiseburn Unified School District Series 2015 B: | |||
| 5% 8/1/18 | 2,680,000 | 2,784,011 | |
| 5% 8/1/19 | 2,925,000 | 3,158,240 | |
| 5% 8/1/21 | 1,690,000 | 1,941,793 | |
| TOTAL CALIFORNIA | 682,748,849 | ||
| Guam - 1.1% | |||
| Guam Gov't. Ltd. Oblig. Rev. Series 2016 A: | |||
| 5% 12/1/17 | 350,000 | 353,087 | |
| 5% 12/1/18 | 760,000 | 793,052 | |
| 5% 12/1/19 | 1,500,000 | 1,612,035 | |
| 5% 12/1/20 | 2,000,000 | 2,203,840 | |
| 5% 12/1/23 | 2,140,000 | 2,459,074 | |
| Guam Pwr. Auth. Rev. Series 2012 A, 5% 10/1/20 (FSA Insured) | 1,500,000 | 1,657,860 | |
| TOTAL GUAM | 9,078,948 | ||
| TOTAL MUNICIPAL BONDS | |||
| (Cost $674,541,424) | 691,827,797 | ||
| Municipal Notes - 13.4% | |||
| California - 13.4% | |||
| California Health Facilities Fing. Auth. Rev. (Catholic Healthcare West Proj.): | |||
| Series 2005 H, 0.77% 9/7/17, LOC Sumitomo Mitsui Banking Corp., VRDN (a) | 1,800,000 | $1,800,000 | |
| Series 2009 H, 0.77% 9/7/17, LOC Wells Fargo Bank NA, VRDN (a) | 33,150,000 | 33,150,000 | |
| California Infrastructure & Econ. Dev. Bank Rev. (Pacific Gas & Elec. Co. Proj.) Series 2009 A, 0.78% 9/1/17, LOC MUFG Union Bank NA, VRDN (a) | 4,000,000 | 4,000,000 | |
| California Poll. Cont. Fing. Auth. Ctfs. of Prtn. (Pacific Gas & Elec. Co. Proj.): | |||
| Series 1996 C, 0.8% 9/1/17, LOC Mizuho Corporate Bank Ltd., VRDN (a) | 47,300,000 | 47,299,985 | |
| Series 1996 E, 0.71% 9/1/17, LOC Sumitomo Mitsui Banking Corp., VRDN (a) | 2,000,000 | 2,000,000 | |
| California Statewide Cmntys. Dev. Auth. Poll. Cont. Rev. (Chevron U.S.A., Inc. Proj.) Series 2002, 0.75% 9/1/17, VRDN (a) | 6,000,000 | 6,000,000 | |
| California Statewide Cmntys. Dev. Auth. Rev. (SWEEP Ln. Prog.) Series 2007 A, 0.75% 9/7/17, LOC U.S. Bank NA, Cincinnati, VRDN (a) | 5,500,000 | 5,500,000 | |
| Irvine Impt. Bond Act of 1915: | |||
| (Assessment District #00-18 Proj.) Series A, 0.8% 9/1/17, LOC State Street Bank & Trust Co., Boston, VRDN (a) | 5,583,000 | 5,583,000 | |
| (Assessment District #97-17 Proj.) 0.8% 9/1/17, LOC State Street Bank & Trust Co., Boston, VRDN (a) | 2,600,000 | 2,600,000 | |
| TOTAL MUNCIPAL NOTES | |||
| (Cost $107,933,006) | 107,932,985 | ||
| TOTAL INVESTMENT IN SECURITIES - 99.1% | |||
| (Cost $782,474,430) | 799,760,782 | ||
| NET OTHER ASSETS (LIABILITIES) - 0.9% | 7,172,184 | ||
| NET ASSETS - 100% | $806,932,966 |
Security Type Abbreviations
VRDN – VARIABLE RATE DEMAND NOTE (A debt instrument that is payable upon demand, either daily, weekly or monthly)
Legend
(a) Coupon rates for floating and adjustable rate securities reflect the rates in effect at period end.
(b) Coupon is indexed to a floating interest rate which may be multiplied by a specified factor and/or subject to caps or floors.
(c) Security or a portion of the security purchased on a delayed delivery or when-issued basis.
Investment Valuation
All investments are categorized as Level 2 under the Fair Value Hierarchy. The inputs or methodology used for valuing securities may not be an indication of the risk associated with investing in those securities. For more information on valuation inputs please refer to the Investment Valuation section in the accompanying Notes to Financial Statements.
Other Information
The distribution of municipal securities by revenue source, as a percentage of total Net Assets, is as follows (Unaudited):
| General Obligations | 33.3% |
| Health Care | 17.9% |
| Special Tax | 13.2% |
| Electric Utilities | 12.4% |
| Transportation | 6.8% |
| Others* (Individually Less Than 5%) | 16.4% |
| 100.0% |
* Includes net other assets
See accompanying notes which are an integral part of the financial statements.
Financial Statements
Statement of Assets and Liabilities
| August 31, 2017 (Unaudited) | ||
| Assets | ||
| Investment in securities, at value — See accompanying schedule: Unaffiliated issuers (cost $782,474,430) | $799,760,782 | |
| Cash | 7,086,726 | |
| Receivable for fund shares sold | 245,430 | |
| Interest receivable | 7,260,811 | |
| Receivable from investment adviser for expense reductions | 74,774 | |
| Other receivables | 2,034 | |
| Total assets | 814,430,557 | |
| Liabilities | ||
| Payable for investments purchased | ||
| Regular delivery | $996,500 | |
| Delayed delivery | 5,573,286 | |
| Payable for fund shares redeemed | 321,535 | |
| Distributions payable | 272,572 | |
| Accrued management fee | 238,435 | |
| Other affiliated payables | 66,365 | |
| Other payables and accrued expenses | 28,898 | |
| Total liabilities | 7,497,591 | |
| Net Assets | $806,932,966 | |
| Net Assets consist of: | ||
| Paid in capital | $790,406,354 | |
| Distributions in excess of net investment income | (1,716) | |
| Accumulated undistributed net realized gain (loss) on investments | (758,024) | |
| Net unrealized appreciation (depreciation) on investments | 17,286,352 | |
| Net Assets, for 75,382,854 shares outstanding | $806,932,966 | |
| Net Asset Value, offering price and redemption price per share ($806,932,966 ÷ 75,382,854 shares) | $10.70 |
See accompanying notes which are an integral part of the financial statements.
Statement of Operations
| Six months ended August 31, 2017 (Unaudited) | ||
| Investment Income | ||
| Interest | $7,538,884 | |
| Expenses | ||
| Management fee | $1,396,077 | |
| Transfer agent fees | 304,642 | |
| Accounting fees and expenses | 86,546 | |
| Custodian fees and expenses | 2,974 | |
| Independent trustees' fees and expenses | 1,442 | |
| Registration fees | 9,811 | |
| Audit | 30,799 | |
| Legal | 870 | |
| Miscellaneous | 3,941 | |
| Total expenses before reductions | 1,837,102 | |
| Expense reductions | (465,981) | 1,371,121 |
| Net investment income (loss) | 6,167,763 | |
| Realized and Unrealized Gain (Loss) | ||
| Net realized gain (loss) on: | ||
| Investment securities: | ||
| Unaffiliated issuers | 486,555 | |
| Total net realized gain (loss) | 486,555 | |
| Change in net unrealized appreciation (depreciation) on investment securities | 8,087,889 | |
| Net gain (loss) | 8,574,444 | |
| Net increase (decrease) in net assets resulting from operations | $14,742,207 |
See accompanying notes which are an integral part of the financial statements.
Statement of Changes in Net Assets
| Six months ended August 31, 2017 (Unaudited) | Year ended February 28, 2017 | |
| Increase (Decrease) in Net Assets | ||
| Operations | ||
| Net investment income (loss) | $6,167,763 | $13,077,567 |
| Net realized gain (loss) | 486,555 | (350,325) |
| Change in net unrealized appreciation (depreciation) | 8,087,889 | (16,207,874) |
| Net increase (decrease) in net assets resulting from operations | 14,742,207 | (3,480,632) |
| Distributions to shareholders from net investment income | (6,165,897) | (13,077,104) |
| Distributions to shareholders from net realized gain | – | (855,127) |
| Total distributions | (6,165,897) | (13,932,231) |
| Share transactions | ||
| Proceeds from sales of shares | 106,095,201 | 274,696,744 |
| Reinvestment of distributions | 4,548,922 | 10,333,680 |
| Cost of shares redeemed | (79,738,375) | (317,848,225) |
| Net increase (decrease) in net assets resulting from share transactions | 30,905,748 | (32,817,801) |
| Redemption fees | – | 18,040 |
| Total increase (decrease) in net assets | 39,482,058 | (50,212,624) |
| Net Assets | ||
| Beginning of period | 767,450,908 | 817,663,532 |
| End of period | $806,932,966 | $767,450,908 |
| Other Information | ||
| Distributions in excess of net investment income end of period | $(1,716) | $(3,582) |
| Shares | ||
| Sold | 9,973,651 | 25,651,303 |
| Issued in reinvestment of distributions | 427,414 | 966,955 |
| Redeemed | (7,504,330) | (29,873,889) |
| Net increase (decrease) | 2,896,735 | (3,255,631) |
See accompanying notes which are an integral part of the financial statements.
Financial Highlights — Fidelity California Limited Term Tax-Free Bond Fund
| Six months ended (Unaudited) August 31, | Years ended February 28, | |||||
| 2017 | 2017 | 2016 A | 2015 | 2014 | 2013 | |
| Selected Per–Share Data | ||||||
| Net asset value, beginning of period | $10.59 | $10.80 | $10.76 | $10.71 | $10.81 | $10.85 |
| Income from Investment Operations | ||||||
| Net investment income (loss)B | .084 | .170 | .183 | .194 | .219 | .232 |
| Net realized and unrealized gain (loss) | .110 | (.199) | .048 | .051 | (.080) | (.039) |
| Total from investment operations | .194 | (.029) | .231 | .245 | .139 | .193 |
| Distributions from net investment income | (.084) | (.170) | (.183) | (.195) | (.218) | (.227) |
| Distributions from net realized gain | – | (.011) | (.008) | – | (.021) | (.006) |
| Total distributions | (.084) | (.181) | (.191) | (.195) | (.239) | (.233) |
| Redemption fees added to paid in capitalB | – | –C | –C | –C | –C | –C |
| Net asset value, end of period | $10.70 | $10.59 | $10.80 | $10.76 | $10.71 | $10.81 |
| Total ReturnD,E | 1.84% | (.27)% | 2.17% | 2.31% | 1.32% | 1.79% |
| Ratios to Average Net AssetsF | ||||||
| Expenses before reductions | .47%G | .47% | .48% | .49% | .49% | .48% |
| Expenses net of fee waivers, if any | .35%G | .35% | .35% | .35% | .35% | .35% |
| Expenses net of all reductions | .35%G | .35% | .35% | .35% | .35% | .34% |
| Net investment income (loss) | 1.57%G | 1.59% | 1.71% | 1.81% | 2.05% | 2.14% |
| Supplemental Data | ||||||
| Net assets, end of period (000 omitted) | $806,933 | $767,451 | $817,664 | $795,240 | $705,030 | $793,283 |
| Portfolio turnover rate | 23%G | 33% | 20% | 25% | 22% | 17% |
A For the year ended February 29.
B Calculated based on average shares outstanding during the period.
C Amount represents less than $.0005 per share.
D Total returns for periods of less than one year are not annualized.
E Total returns would have been lower if certain expenses had not been reduced during the applicable periods shown.
F Expense ratios reflect operating expenses of the Fund. Expenses before reductions do not reflect amounts reimbursed by the investment adviser or reductions from expense offset arrangements and do not represent the amount paid by the Fund during periods when reimbursements or reductions occur. Expenses net of fee waivers reflect expenses after reimbursement by the investment adviser but prior to reductions from expense offset arrangements. Expenses net of all reductions represent the net expenses paid by the Fund.
G Annualized
See accompanying notes which are an integral part of the financial statements.
Notes to Financial Statements (Unaudited)
For the period ended August 31, 2017
1. Organization.
Fidelity California Limited Term Tax-Free Bond Fund (the Fund) is a non-diversified fund of Fidelity California Municipal Trust (the Trust) and is authorized to issue an unlimited number of shares. Share transactions on the Statement of Changes in Net Assets may contain exchanges between affiliated funds. The Trust is registered under the Investment Company Act of 1940, as amended (the 1940 Act), as an open-end management investment company organized as a Massachusetts business trust. The Fund may be affected by economic and political developments in the state of California.
2. Significant Accounting Policies.
The Fund is an investment company and applies the accounting and reporting guidance of the Financial Accounting Standards Board (FASB) Accounting Standards Codification Topic 946 Financial Services – Investments Companies. The financial statements have been prepared in conformity with accounting principles generally accepted in the United States of America (GAAP), which require management to make certain estimates and assumptions at the date of the financial statements. Actual results could differ from those estimates. Subsequent events, if any, through the date that the financial statements were issued have been evaluated in the preparation of the financial statements. The following summarizes the significant accounting policies of the Fund:
Investment Valuation. Investments are valued as of 4:00 p.m. Eastern time on the last calendar day of the period. The Board of Trustees (the Board) has delegated the day to day responsibility for the valuation of the Fund's investments to the Fair Value Committee (the Committee) established by the Fund's investment adviser. In accordance with valuation policies and procedures approved by the Board, the Fund attempts to obtain prices from one or more third party pricing vendors or brokers to value its investments. When current market prices, quotations or currency exchange rates are not readily available or reliable, investments will be fair valued in good faith by the Committee, in accordance with procedures adopted by the Board. Factors used in determining fair value vary by investment type and may include market or investment specific events, changes in interest rates and credit quality. The frequency with which these procedures are used cannot be predicted and they may be utilized to a significant extent. The Committee oversees the Fund's valuation policies and procedures and reports to the Board on the Committee's activities and fair value determinations. The Board monitors the appropriateness of the procedures used in valuing the Fund's investments and ratifies the fair value determinations of the Committee.
The Fund categorizes the inputs to valuation techniques used to value its investments into a disclosure hierarchy consisting of three levels as shown below:
- Level 1 – quoted prices in active markets for identical investments
- Level 2 – other significant observable inputs (including quoted prices for similar investments, interest rates, prepayment speeds, etc.)
- Level 3 – unobservable inputs (including the Fund's own assumptions based on the best information available)
Valuation techniques used to value the Fund's investments by major category are as follows:
Debt securities, including restricted securities, are valued based on evaluated prices received from third party pricing vendors or from brokers who make markets in such securities. Municipal securities are valued by pricing vendors who utilize matrix pricing which considers yield or price of bonds of comparable quality, coupon, maturity and type or by broker-supplied prices. When independent prices are unavailable or unreliable, debt securities may be valued utilizing pricing methodologies which consider similar factors that would be used by third party pricing vendors. Debt securities are generally categorized as Level 2 in the hierarchy but may be Level 3 depending on the circumstances.
Changes in valuation techniques may result in transfers in or out of an assigned level within the disclosure hierarchy.
Investment Transactions and Income. For financial reporting purposes, the Fund's investment holdings and NAV include trades executed through the end of the last business day of the period. The NAV per share for processing shareholder transactions is calculated as of the close of business of the New York Stock Exchange (NYSE), normally 4:00 p.m. Eastern time and includes trades executed through the end of the prior business day. Gains and losses on securities sold are determined on the basis of identified cost. Interest income is accrued as earned and includes coupon interest and amortization of premium and accretion of discount on debt securities as applicable. Debt obligations may be placed on non-accrual status and related interest income may be reduced by ceasing current accruals and writing off interest receivables when the collection of all or a portion of interest has become doubtful based on consistently applied procedures. A debt obligation is removed from non-accrual status when the issuer resumes interest payments or when collectability of interest is reasonably assured.
Expenses. Expenses directly attributable to a fund are charged to that fund. Expenses attributable to more than one fund are allocated among the respective funds on the basis of relative net assets or other appropriate methods. Expense estimates are accrued in the period to which they relate and adjustments are made when actual amounts are known.
Income Tax Information and Distributions to Shareholders. Each year, the Fund intends to qualify as a regulated investment company under Subchapter M of the Internal Revenue Code, including distributing substantially all of its taxable income and realized gains. As a result, no provision for U.S. Federal income taxes is required. The Fund files a U.S. federal tax return, in addition to state and local tax returns as required. The Fund's federal income tax returns are subject to examination by the Internal Revenue Service (IRS) for a period of three fiscal years after they are filed. State and local tax returns may be subject to examination for an additional fiscal year depending on the jurisdiction.
Dividends are declared and recorded daily and paid monthly from net investment income. Distributions from realized gains, if any, are declared and recorded on the ex-dividend date. Income and capital gain distributions are determined in accordance with income tax regulations, which may differ from GAAP.
Capital accounts within the financial statements are adjusted for permanent book-tax differences. These adjustments have no impact on net assets or the results of operations. Capital accounts are not adjusted for temporary book-tax differences which will reverse in a subsequent period.
Book-tax differences are primarily due to market discount and losses deferred due to excise tax regulations.
The Fund purchases municipal securities whose interest, in the opinion of the issuer, is free from federal income tax. There is no assurance that the IRS will agree with this opinion. In the event the IRS determines that the issuer does not comply with relevant tax requirements, interest payments from a security could become federally taxable, possibly retroactively to the date the security was issued.
As of period end, the cost and unrealized appreciation (depreciation) in securities, and derivatives if applicable, for federal income tax purposes were as follows:
| Gross unrealized appreciation | $17,529,050 |
| Gross unrealized depreciation | (240,790) |
| Net unrealized appreciation (depreciation) | $17,288,260 |
| Tax cost | $782,472,522 |
The Fund elected to defer to its next fiscal year $1,244,580 of capital losses recognized during the period November 1, 2016 to February 28, 2017.
Delayed Delivery Transactions and When-Issued Securities. During the period, the Fund transacted in securities on a delayed delivery or when-issued basis. Payment and delivery may take place after the customary settlement period for that security. The price of the underlying securities and the date when the securities will be delivered and paid for are fixed at the time the transaction is negotiated. The securities purchased on a delayed delivery or when-issued basis are identified as such in the Fund's Schedule of Investments. The Fund may receive compensation for interest forgone in the purchase of a delayed delivery or when-issued security. With respect to purchase commitments, the Fund identifies securities as segregated in its records with a value at least equal to the amount of the commitment. Losses may arise due to changes in the value of the underlying securities or if the counterparty does not perform under the contract's terms, or if the issuer does not issue the securities due to political, economic, or other factors.
New Accounting Pronouncement. In March 2017, the Financial Accounting Standards Board (FASB) issued an Accounting Standards Update (ASU), ASU 2017-08, which amends the amortization period for certain callable debt securities that are held at a premium. The amendment requires the premium to be amortized to the earliest call date. The amendments do not require an accounting change for securities held at a discount. The ASU is effective for annual periods beginning after December 15, 2018. Management is currently evaluating the potential impact of these changes to the financial statements.
3. Purchases and Sales of Investments.
Purchases and sales of securities, other than short-term securities, aggregated $80,701,816 and $78,485,165, respectively.
4. Fees and Other Transactions with Affiliates.
Management Fee. Fidelity Management & Research Company and its affiliates provide the Fund with investment management related services for which the Fund pays a monthly management fee. The management fee is the sum of an individual fund fee rate that is based on an annual rate of .25% of the Fund's average net assets and an annualized group fee rate that averaged .11% during the period. The group fee rate is based upon the average net assets of all the mutual funds advised by the investment adviser, including any mutual funds previously advised by the investment adviser that are currently advised by Fidelity SelectCo, LLC, an affiliate of the investment adviser. The group fee rate decreases as assets under management increase and increases as assets under management decrease. For the reporting period, the total annualized management fee rate was .36% of the Fund's average net assets.
Transfer Agent Fees. Fidelity Investments Institutional Operations Company, Inc. (FIIOC), an affiliate of the investment adviser, is the transfer, dividend disbursing and shareholder servicing agent for the Fund. FIIOC receives account fees and asset-based fees that vary according to account size and type of account. FIIOC pays for typesetting, printing and mailing of shareholder reports, except proxy statements. For the period, transfer agent fees were equivalent to an annualized rate of .08% of average net assets.
Accounting Fees. Fidelity Service Company, Inc. (FSC), an affiliate of the investment adviser, maintains the Fund's accounting records. The fee is based on the level of average net assets for each month.
Interfund Trades. The Fund may purchase from or sell securities to other Fidelity Funds under procedures adopted by the Board. The procedures have been designed to ensure these interfund trades are executed in accordance with Rule 17a-7 of the 1940 Act. Interfund trades are included within the respective purchases and sales amounts shown in the Purchases and Sales of Investments note.
5. Committed Line of Credit.
The Fund participates with other funds managed by the investment adviser or an affiliate in a $4.25 billion credit facility (the "line of credit") to be utilized for temporary or emergency purposes to fund shareholder redemptions or for other short-term liquidity purposes. The Fund has agreed to pay commitment fees on its pro-rata portion of the line of credit, which amounted to $1,251 and is reflected in Miscellaneous expenses on the Statement of Operations. During the period, the Fund did not borrow on this line of credit.
6. Expense Reductions.
The investment adviser voluntarily agreed to reimburse the Fund to the extent annual operating expenses exceeded .35% of average net assets. Some expenses, for example interest expense, including commitment fees, are excluded from this reimbursement. During the period this reimbursement reduced the Fund's expenses by $460,719.
In addition, through arrangements with the Fund's custodian, credits realized as a result of certain uninvested cash balances were used to reduce the Fund's expenses. During the period, these credits reduced the Fund's custody expenses by $2,913.
In addition, during the period the investment adviser reimbursed and/or waived a portion of operating expenses in the amount of $2,349.
7. Other.
The Fund's organizational documents provide former and current trustees and officers with a limited indemnification against liabilities arising in connection with the performance of their duties to the Fund. In the normal course of business, the Fund may also enter into contracts that provide general indemnifications. The Fund's maximum exposure under these arrangements is unknown as this would be dependent on future claims that may be made against the Fund. The risk of material loss from such claims is considered remote.
Shareholder Expense Example
As a shareholder of a Fund, you incur two types of costs: (1) transaction costs, including redemption fees and (2) ongoing costs, including management fees and other Fund expenses. This Example is intended to help you understand your ongoing costs (in dollars) of investing in the Fund and to compare these costs with the ongoing costs of investing in other mutual funds.
The Example is based on an investment of $1,000 invested at the beginning of the period and held for the entire period (March 1, 2017 to August 31, 2017).
Actual Expenses
The first line of the accompanying table provides information about actual account values and actual expenses. You may use the information in this line, together with the amount you invested, to estimate the expenses that you paid over the period. Simply divide your account value by $1,000.00 (for example, an $8,600 account value divided by $1,000.00 = 8.6), then multiply the result by the number in the first line under the heading entitled "Expenses Paid During Period" to estimate the expenses you paid on your account during this period. A small balance maintenance fee of $12.00 that is charged once a year may apply for certain accounts with a value of less than $2,000. This fee is not included in the table below. If it was, the estimate of expenses you paid during the period would be higher, and your ending account value lower, by this amount.
Hypothetical Example for Comparison Purposes
The second line of the accompanying table provides information about hypothetical account values and hypothetical expenses based on the Fund's actual expense ratio and an assumed rate of return of 5% per year before expenses, which is not the Fund's actual return. The hypothetical account values and expenses may not be used to estimate the actual ending account balance or expenses you paid for the period. You may use this information to compare the ongoing costs of investing in the Fund and other funds. To do so, compare this 5% hypothetical example with the 5% hypothetical examples that appear in the shareholder reports of the other funds. A small balance maintenance fee of $12.00 that is charged once a year may apply for certain accounts with a value of less than $2,000. This fee is not included in the table below. If it was, the estimate of expenses you paid during the period would be higher, and your ending account value lower, by this amount.
Please note that the expenses shown in the table are meant to highlight your ongoing costs only and do not reflect any transaction costs. Therefore, the second line of the table is useful in comparing ongoing costs only, and will not help you determine the relative total costs of owning different funds. In addition, if these transactional costs were included, your costs would have been higher.
| Annualized Expense Ratio-A | Beginning Account Value March 1, 2017 | Ending Account Value August 31, 2017 | Expenses Paid During Period-B March 1, 2017 to August 31, 2017 | |
| Actual | .35% | $1,000.00 | $1,018.40 | $1.78 |
| Hypothetical-C | $1,000.00 | $1,023.44 | $1.79 |
A Annualized expense ratio reflects expenses net of applicable fee waivers.
B Expenses are equal to the Fund's annualized expense ratio, multiplied by the average account value over the period, multiplied by 184/365 (to reflect the one-half year period).
C 5% return per year before expenses
![]()
Corporate Headquarters
245 Summer St.
Boston, MA 02210
www.fidelity.com
CSI-SANN-1017
1.817080.111
Fidelity Advisor® California Municipal Income Fund - Semi-Annual Report August 31, 2017 Class A, Class M, Class C and Class I are classes of Fidelity® California Municipal Income Fund |
|
Contents
To view a fund's proxy voting guidelines and proxy voting record for the 12-month period ended June 30, visit http://www.fidelity.com/proxyvotingresults or visit the Securities and Exchange Commission's (SEC) web site at http://www.sec.gov.
You may also call 1-877-208-0098 to request a free copy of the proxy voting guidelines.
Standard & Poor's, S&P and S&P 500 are registered service marks of The McGraw-Hill Companies, Inc. and have been licensed for use by Fidelity Distributors Corporation.
Other third-party marks appearing herein are the property of their respective owners.
All other marks appearing herein are registered or unregistered trademarks or service marks of FMR LLC or an affiliated company. © 2017 FMR LLC. All rights reserved.
This report and the financial statements contained herein are submitted for the general information of the shareholders of the Fund. This report is not authorized for distribution to prospective investors in the Fund unless preceded or accompanied by an effective prospectus.
A fund files its complete schedule of portfolio holdings with the SEC for the first and third quarters of each fiscal year on Form N-Q. Forms N-Q are available on the SEC’s web site at http://www.sec.gov. A fund's Forms N-Q may be reviewed and copied at the SEC’s Public Reference Room in Washington, DC. Information regarding the operation of the SEC's Public Reference Room may be obtained by calling 1-800-SEC-0330.
For a complete list of a fund's portfolio holdings, view the most recent holdings listing, semiannual report, or annual report on Fidelity's web site at http://www.fidelity.com, http://www.institutional.fidelity.com, or http://www.401k.com, as applicable.
NOT FDIC INSURED •MAY LOSE VALUE •NO BANK GUARANTEE
Neither the Fund nor Fidelity Distributors Corporation is a bank.
Investment Summary (Unaudited)
Top Five Sectors as of August 31, 2017
| % of fund's net assets | % of fund's net assets 6 months ago | |
| General Obligations | 35.3 | 37.2 |
| Transportation | 18.5 | 13.8 |
| Special Tax | 11.9 | 12.4 |
| Escrowed/Pre-Refunded | 8.5 | 11.0 |
| Health Care | 8.5 | 7.8 |
Quality Diversification (% of fund's net assets)
| As of August 31, 2017 | ||
| AAA | 5.0% | |
| AA,A | 79.6% | |
| BBB | 9.8% | |
| BB and Below | 1.5% | |
| Not Rated | 2.6% | |
| Short-Term Investments and Net Other Assets | 1.5% | |

| As of February 28, 2017 | ||
| AAA | 5.7% | |
| AA,A | 77.3% | |
| BBB | 7.7% | |
| BB and Below | 1.5% | |
| Not Rated | 2.6% | |
| Short-Term Investments and Net Other Assets | 5.2% | |

We have used ratings from Moody's Investors Service, Inc. Where Moody's® ratings are not available, we have used S&P® ratings. All ratings are as of the date indicated and do not reflect subsequent changes.
Investments August 31, 2017 (Unaudited)
Showing Percentage of Net Assets
| Municipal Bonds - 98.5% | |||
| Principal Amount (000s) | Value (000s) | ||
| California - 97.2% | |||
| ABAG Fin. Auth. for Nonprofit Corps. Rev. (Sharp HealthCare Proj.): | |||
| Series 2009 B, 6.25% 8/1/39 | $3,000 | $3,276 | |
| Series 2012 A: | |||
| 5% 8/1/24 | 1,050 | 1,207 | |
| 5% 8/1/25 | 1,245 | 1,421 | |
| 5% 8/1/27 | 300 | 339 | |
| 5% 8/1/28 | 400 | 450 | |
| ABC Unified School District Series 1997 C: | |||
| 0% 8/1/31 (Nat'l. Pub. Fin. Guarantee Corp. Insured) | 2,780 | 1,740 | |
| 0% 8/1/32 (Nat'l. Pub. Fin. Guarantee Corp. Insured) | 3,760 | 2,245 | |
| Alameda Corridor Trans. Auth. Rev.: | |||
| Series 2004 A, 5.3% 10/1/23 (Pre-Refunded to 10/1/17 @ 100) | 935 | 938 | |
| Series 2004: | |||
| 0% 10/1/19 | 7,920 | 7,773 | |
| 0% 10/1/19 | 630 | 600 | |
| Series 2013 A: | |||
| 5% 10/1/24 | 7,750 | 9,253 | |
| 5% 10/1/25 | 5,245 | 6,249 | |
| Series 2016 B: | |||
| 5% 10/1/34 | 2,500 | 2,890 | |
| 5% 10/1/35 | 4,000 | 4,607 | |
| 5% 10/1/36 | 2,250 | 2,586 | |
| 5% 10/1/37 | 2,200 | 2,521 | |
| Alameda County Ctfs. of Prtn. (Santa Rita Jail Proj.) Series 2007 A: | |||
| 5% 12/1/18 (AMBAC Insured) | 2,645 | 2,672 | |
| 5% 12/1/20 (AMBAC Insured) | 2,810 | 2,837 | |
| Anaheim Pub. Fing. Auth. Lease Rev. (Anaheim Pub. Impt. Proj.): | |||
| Series 1997 A, 6% 9/1/24 (FSA Insured) | 1,000 | 1,216 | |
| Series 1997 C: | |||
| 0% 9/1/19 (FSA Insured) | 1,285 | 1,255 | |
| 0% 9/1/22 (FSA Insured) | 5,150 | 4,750 | |
| Antelope Valley Cmnty. College District: | |||
| Series A: | |||
| 5% 8/1/31 | 1,325 | 1,605 | |
| 5% 8/1/32 | 1,345 | 1,618 | |
| 5% 8/1/33 | 1,805 | 2,156 | |
| 5% 8/1/34 | 3,000 | 3,559 | |
| 5% 8/1/35 | 4,000 | 4,719 | |
| 5% 8/1/39 | 17,680 | 20,443 | |
| Antelope Valley Healthcare District Rev. Series 2016 A, 5% 3/1/26 | 5,000 | 5,405 | |
| Antioch Unified School District (School Facilities Impt. District #1 Proj.) Series 2008 B, 5.75% 8/1/24 (Pre-Refunded to 8/1/19 @ 100) | 1,000 | 1,092 | |
| Bay Area Toll Auth. San Francisco Bay Toll Bridge Rev.: | |||
| Bonds: | |||
| Series B, 2.85%, tender 4/1/25 (a) | 7,000 | 7,452 | |
| Series C, 2.1%, tender 4/1/22 (a) | 7,000 | 7,218 | |
| Series H, 2.125%, tender 4/1/25 (a) | 4,000 | 4,049 | |
| 1.5%, tender 10/1/17 (a) | 1,000 | 1,001 | |
| 1.875%, tender 4/1/19 (a) | 6,250 | 6,325 | |
| Series 2014 E, 2% 4/1/34 | 6,000 | 6,144 | |
| Beverly Hills Fin. Auth. Rev. (2007 Rfdg. Proj.) Series A: | |||
| 5% 6/1/24 | 3,235 | 3,765 | |
| 5% 6/1/25 | 4,355 | 5,062 | |
| 5% 6/1/27 | 2,755 | 3,191 | |
| 5% 6/1/28 | 3,045 | 3,521 | |
| Burbank Unified School District: | |||
| Series 1997 B, 0% 8/1/20 (Nat'l. Pub. Fin. Guarantee Corp. Insured) | 3,835 | 3,649 | |
| Series 1997 C, 0% 8/1/20 (Nat'l. Pub. Fin. Guarantee Corp. Insured) | 5,865 | 5,618 | |
| Cabrillo Unified School District Series A, 0% 8/1/18 (AMBAC Insured) | 2,000 | 1,974 | |
| California Dept. of Wtr. Resources Series AI, 5% 12/1/25 | 2,700 | 3,130 | |
| California Econ. Recovery Series 2009 A, 5% 7/1/19 (Escrowed to Maturity) | 1,725 | 1,856 | |
| California Edl. Facilities Auth. Rev.: | |||
| (Loyola Marymount Univ. Proj.) Series 2010 A, 5% 10/1/25 | 5,860 | 6,316 | |
| (Pomona College Proj.) Series 2005 A, 0% 7/1/38 | 3,155 | 1,567 | |
| (Santa Clara Univ. Proj.) Series 1999, 5.25% 9/1/26 (AMBAC Insured) | 7,910 | 9,846 | |
| Series 2009, 5% 1/1/39 (Pre-Refunded to 1/1/19 @ 100) | 2,700 | 2,851 | |
| California Enterprise Dev. Auth. (The Thacher School Proj.) Series 2010: | |||
| 4% 9/1/20 | 860 | 912 | |
| 4% 9/1/21 | 1,000 | 1,058 | |
| 4% 9/1/22 | 740 | 781 | |
| 4% 9/1/23 | 1,080 | 1,136 | |
| 4% 9/1/24 | 1,125 | 1,181 | |
| 5% 9/1/19 | 400 | 433 | |
| 5% 9/1/39 | 5,000 | 5,337 | |
| California Gen. Oblig.: | |||
| Series 2007: | |||
| 5% 8/1/22 | 5 | 5 | |
| 5.625% 5/1/20 | 85 | 85 | |
| 5.625% 5/1/26 | 120 | 120 | |
| 5.75% 5/1/30 | 90 | 90 | |
| Series 2016, 5% 9/1/36 | 7,630 | 9,069 | |
| 4.5% 8/1/30 | 35 | 35 | |
| 5% 3/1/19 (Pre-Refunded to 3/1/18 @ 100) | 3,000 | 3,063 | |
| 5% 10/1/22 | 1,355 | 1,470 | |
| 5% 11/1/22 (Pre-Refunded to 11/1/17 @ 100) | 2,800 | 2,818 | |
| 5% 10/1/26 | 6,065 | 7,429 | |
| 5% 10/1/32 (Nat'l. Pub. Fin. Guarantee Corp. Insured) | 10 | 10 | |
| 5.25% 10/1/17 | 105 | 105 | |
| 5.25% 4/1/27 | 5 | 5 | |
| 5.25% 4/1/29 | 5 | 5 | |
| 5.25% 12/1/33 | 105 | 105 | |
| 5.25% 4/1/35 | 3,500 | 4,105 | |
| 5.25% 3/1/38 | 3,740 | 3,812 | |
| 5.5% 4/1/28 | 5 | 5 | |
| 5.5% 4/1/30 | 25 | 25 | |
| 5.5% 11/1/34 | 2,535 | 2,778 | |
| 5.5% 11/1/39 | 1,810 | 1,981 | |
| 6% 4/1/18 | 1,570 | 1,617 | |
| 6% 3/1/33 | 16,330 | 18,339 | |
| 6% 4/1/38 | 1,190 | 1,283 | |
| 6.5% 4/1/33 | 11,650 | 12,661 | |
| California Health Facilities Fing. Auth.: | |||
| Bonds: | |||
| Series 2016 B1, 1.25%, tender 10/1/20 (a) | 6,980 | 7,006 | |
| Series 2016 B3, 2%, tender 10/1/25 (a) | 8,190 | 8,166 | |
| Series 2017 A, 5% 11/15/32 | 1,400 | 1,702 | |
| California Health Facilities Fing. Auth. Rev.: | |||
| (Catholic Healthcare West Proj.) Series 2009 E, 5.625% 7/1/25 | 11,000 | 11,913 | |
| (Children's Hosp. of Orange County Proj.) Series 2012 A: | |||
| 5% 11/15/22 | 2,500 | 2,907 | |
| 5% 11/15/23 | 2,000 | 2,324 | |
| (Providence Health and Svcs. Proj.): | |||
| Series 2009 B, 5.5% 10/1/39 | 2,000 | 2,162 | |
| Series C, 6.5% 10/1/38 (Pre-Refunded to 10/1/18 @ 100) | 90 | 95 | |
| 6.5% 10/1/38 (Pre-Refunded to 10/1/18 @ 100) | 4,910 | 5,208 | |
| (Scripps Health Proj.) Series 2010 A, 5% 11/15/36 | 3,000 | 3,259 | |
| (St. Joseph Health Sys. Proj.) Series 2009 A, 5.75% 7/1/39 | 1,000 | 1,085 | |
| Series 2008 A3, 5.5% 11/15/40 | 3,090 | 3,544 | |
| Series 2011 A, 5% 3/1/20 | 3,250 | 3,568 | |
| Series 2011 D: | |||
| 5% 8/15/22 | 900 | 1,042 | |
| 5% 8/15/23 | 700 | 809 | |
| 5% 8/15/25 | 2,000 | 2,302 | |
| California Infrastructure & Econ. Dev. Bank Rev. (Performing Arts Ctr. of Los Angeles County Proj.) Series 2007: | |||
| 5% 12/1/27 | 1,080 | 1,090 | |
| 5% 12/1/32 | 1,000 | 1,009 | |
| 5% 12/1/42 | 3,000 | 3,024 | |
| California Infrastructure and Econ. Dev. Bank Rev.: | |||
| Bonds Series 2010 E, 1.75%, tender 6/1/22 (a) | 1,000 | 1,011 | |
| Series 2017: | |||
| 5% 10/1/35 | 5,000 | 6,067 | |
| 5% 10/1/36 | 5,000 | 6,053 | |
| California Muni. Fin. Auth. (Orange County Civic Ctr. Infrastructure Impt. Prog.) Series 2017 A: | |||
| 5% 6/1/32 | 2,750 | 3,351 | |
| 5% 6/1/33 | 2,320 | 2,814 | |
| 5% 6/1/34 | 5,290 | 6,371 | |
| 5% 6/1/35 | 5,110 | 6,120 | |
| 5% 6/1/36 | 5,830 | 6,949 | |
| 5% 6/1/37 | 3,000 | 3,562 | |
| California Muni. Fin. Auth. Ctfs. of Prtn. (Cmnty. Hospitals of Central California Obligated Group Proj.) Series 2009, 5.5% 2/1/39 (Pre-Refunded to 2/1/19 @ 100) | 5,000 | 5,327 | |
| California Muni. Fin. Auth. Rev.: | |||
| ( Channing House Proj.) Series 2017 A, 4% 5/15/32 | 1,000 | 1,089 | |
| ( Univ. of Verne Proj.) Series 2017 A: | |||
| 5% 6/1/27 | 1,000 | 1,223 | |
| 5% 6/1/33 | 1,000 | 1,174 | |
| (Biola Univeristy, Inc. Proj.) Series 2017: | |||
| 5% 10/1/25 | 305 | 366 | |
| 5% 10/1/28 | 1,040 | 1,252 | |
| 5% 10/1/30 | 1,000 | 1,187 | |
| 5% 10/1/32 | 1,000 | 1,173 | |
| 5% 10/1/34 | 1,000 | 1,172 | |
| (Biola Univeristy, Inc.Proj.) Series 2017, 5% 10/1/26 | 715 | 864 | |
| (Channing House Proj.) Series 2017 A: | |||
| 4% 5/15/29 | 2,000 | 2,231 | |
| 4% 5/15/30 | 1,575 | 1,744 | |
| 4% 5/15/31 | 2,150 | 2,352 | |
| 5% 5/15/33 | 895 | 1,065 | |
| 5% 5/15/34 | 1,000 | 1,185 | |
| (Eisenhower Med. Ctr. Proj.) Series 2010 A, 5% 7/1/19 (Escrowed to Maturity) | 300 | 322 | |
| (Institute On Aging Proj.) Series 2017: | |||
| 5% 8/15/27 | 230 | 287 | |
| 5% 8/15/29 | 245 | 300 | |
| 5% 8/15/30 | 225 | 273 | |
| 5% 8/15/33 | 750 | 896 | |
| 5% 8/15/36 | 1,435 | 1,695 | |
| (Univ. of Verne Proj.) Series 2017 A, 5% 6/1/32 | 1,000 | 1,180 | |
| (Univ. of Verne Proj.) Series 2017 A: | |||
| 5% 6/1/28 | 1,000 | 1,210 | |
| 5% 6/1/30 | 1,000 | 1,192 | |
| 5% 6/1/35 | 1,000 | 1,164 | |
| Series 2016 A, 5% 11/1/36 (b) | 1,000 | 1,082 | |
| Series 2017 A: | |||
| 5% 7/1/29 | 575 | 685 | |
| 5% 7/1/31 | 1,000 | 1,176 | |
| 5% 7/1/32 | 1,400 | 1,639 | |
| 5% 7/1/33 | 1,000 | 1,165 | |
| 5% 7/1/34 | 1,395 | 1,618 | |
| 5% 7/1/35 | 1,500 | 1,733 | |
| 5% 7/1/36 | 1,500 | 1,729 | |
| 5% 7/1/37 | 1,250 | 1,436 | |
| Series 2017 B: | |||
| 5% 7/1/28 | 1,250 | 1,501 | |
| 5% 7/1/29 | 1,300 | 1,549 | |
| 5% 7/1/30 | 750 | 887 | |
| 5% 7/1/31 | 800 | 941 | |
| 5% 7/1/32 | 1,385 | 1,622 | |
| California Poll. Cont. Fing. Auth. Solid Waste Disp. Rev.: | |||
| (U.S.A. Waste Svcs., Inc. Proj.) Series 1998 A, 1.5% 6/1/18 (c) | 1,920 | 1,928 | |
| Bonds: | |||
| (Republic Svcs., Inc. Proj.) Series B, 5.25%, tender 12/1/17 (a)(c) | 3,250 | 3,280 | |
| (Waste Mgmt., Inc. Proj.) Series 2002 C, 3.25%, tender 6/3/24 (a)(c) | 7,500 | 7,933 | |
| California Pub. Fin. Auth. Univ. H (Claremont Colleges Proj.) Series 2017 A: | |||
| 5% 7/1/27 (b) | 800 | 922 | |
| 5% 7/1/32 (b) | 750 | 836 | |
| 5% 7/1/37 (b) | 2,100 | 2,299 | |
| California Pub. Works Board Lease Rev.: | |||
| (Coalinga State Hosp. Proj.) Series 2013 E, 5% 6/1/29 | 7,000 | 8,166 | |
| (Dept. of Corrections & Rehab. Proj.) Series 2011 C: | |||
| 5% 10/1/27 | 9,530 | 10,878 | |
| 5.25% 10/1/24 | 4,170 | 4,837 | |
| 5.25% 10/1/25 | 2,875 | 3,330 | |
| 5.75% 10/1/31 | 4,000 | 4,667 | |
| (Dept. of Corrections State Prison Proj.) Series A, 5% 12/1/19 (AMBAC Insured) | 2,285 | 2,404 | |
| (Porterville Developmental Ctr. Hsg. Expansion and Recreation Complex Proj.) Series 2009 C, 6.25% 4/1/34 (Pre-Refunded to 4/1/19 @ 100) | 5,900 | 6,404 | |
| (Univ. Proj.) Series 2012 D: | |||
| 5% 9/1/24 (Pre-Refunded to 9/1/22 @ 100) | 1,700 | 2,022 | |
| 5% 9/1/24 (Pre-Refunded to 9/1/22 @ 100) | 1,865 | 2,218 | |
| (Various Cap. Projs.): | |||
| Series 2012 A: | |||
| 5% 4/1/24 | 1,000 | 1,164 | |
| 5% 4/1/25 | 5,300 | 6,154 | |
| Series 2012 G, 5% 11/1/25 | 2,500 | 2,953 | |
| (Various Judicial Council Projs.) Series 2011 D: | |||
| 5% 12/1/22 | 3,000 | 3,478 | |
| 5% 12/1/23 | 2,800 | 3,236 | |
| Series 2009 G1, 5.75% 10/1/30 (Pre-Refunded to 10/1/19 @ 100) | 1,800 | 1,982 | |
| Series 2009 I: | |||
| 5.5% 11/1/23 (Pre-Refunded to 11/1/19 @ 100) | 1,535 | 1,688 | |
| 6.125% 11/1/29 (Pre-Refunded to 11/1/19 @ 100) | 1,200 | 1,336 | |
| 6.25% 11/1/21 (Pre-Refunded to 11/1/19 @ 100) | 2,000 | 2,232 | |
| 6.375% 11/1/34 (Pre-Refunded to 11/1/19 @ 100) | 3,000 | 3,356 | |
| California Statewide Cmntys. Dev. Auth. Series 2016: | |||
| 5% 5/15/34 | 1,250 | 1,447 | |
| 5% 5/15/35 | 1,750 | 2,019 | |
| 5% 5/15/40 | 2,250 | 2,575 | |
| California Statewide Cmntys. Dev. Auth. Rev.: | |||
| (Adventist Health Sys. Proj.) Series 2007 B, 5% 3/1/37 (Pre-Refunded to 5/23/18 @ 100) | 4,970 | 5,120 | |
| (Cottage Health Sys. Obligated Group Proj.) Series 2010, 5.25% 11/1/30 | 3,000 | 3,324 | |
| (Enloe Health Sys. Proj.) Series 2008 B, 5% 8/15/19 (Pre-Refunded to 8/15/18 @ 100) | 50 | 52 | |
| (Sutter Health Proj.) Series 2011 A, 6% 8/15/42 | 2,120 | 2,398 | |
| Series 2016: | |||
| 5% 10/1/26 | 1,125 | 1,336 | |
| 5% 10/1/27 | 2,360 | 2,775 | |
| 5% 10/1/28 | 1,230 | 1,434 | |
| 5% 10/1/29 | 675 | 780 | |
| 5% 10/1/30 | 1,100 | 1,264 | |
| 5% 10/1/33 | 1,850 | 2,099 | |
| 5.375% 6/1/26 (Pre-Refunded to 6/1/21 @ 100) | 2,520 | 2,922 | |
| 6% 6/1/33 (Pre-Refunded to 6/1/21 @ 100) | 3,020 | 3,571 | |
| Carlsbad Unified School District Series 2009 B: | |||
| 0% 5/1/18 | 1,335 | 1,327 | |
| 0% 5/1/19 | 1,000 | 984 | |
| 0% 5/1/34 (d) | 5,300 | 5,757 | |
| Chino Basin Reg'l. Fing. Auth. Rev. (Inland Empire Util. Agcy. Proj.) Series 2008 A: | |||
| 5% 11/1/24 (Pre-Refunded to 11/1/17 @ 100) | 1,000 | 1,007 | |
| 5% 11/1/25 (Pre-Refunded to 11/1/17 @ 100) | 3,820 | 3,845 | |
| Chula Vista Ind. Dev. Rev. (San Diego Gas & Elec. Co. Proj.) Series B, 5.875% 2/15/34 | 5,000 | 5,397 | |
| Contra Costa Trans. Auth. Sales Tax Rev. Series 2012 B: | |||
| 5% 3/1/23 (Pre-Refunded to 3/1/20 @ 100) | 1,500 | 1,653 | |
| 5% 3/1/24 (Pre-Refunded to 3/1/20 @ 100) | 2,000 | 2,204 | |
| 5% 3/1/25 (Pre-Refunded to 3/1/20 @ 100) | 2,000 | 2,204 | |
| Corona-Norco Unified School District Series 2013 A: | |||
| 5% 9/1/25 | 645 | 737 | |
| 5% 9/1/28 | 1,250 | 1,408 | |
| 5% 9/1/32 | 1,125 | 1,255 | |
| 5% 9/1/35 | 585 | 648 | |
| Ctr. Unified School District Series 1997 C: | |||
| 0% 9/1/18 (Nat'l. Pub. Fin. Guarantee Corp. Insured) | 2,000 | 1,974 | |
| 0% 9/1/20 (Nat'l. Pub. Fin. Guarantee Corp. Insured) | 2,010 | 1,912 | |
| Davis Spl. Tax Rev. Series 2007: | |||
| 5% 9/1/18 (AMBAC Insured) | 835 | 835 | |
| 5% 9/1/20 (AMBAC Insured) | 925 | 925 | |
| 5% 9/1/22 (AMBAC Insured) | 1,020 | 1,020 | |
| Desert Sands Unified School District Series 2013 B: | |||
| 5% 6/1/27 | 2,000 | 2,370 | |
| 5% 6/1/28 | 2,000 | 2,358 | |
| 5% 6/1/29 | 1,650 | 1,935 | |
| 5% 6/1/30 | 2,500 | 2,918 | |
| 5% 6/1/31 | 1,750 | 2,032 | |
| East Bay Muni. Util. District Wastewtr. Sys. Rev.: | |||
| Series 2017 A: | |||
| 5% 6/1/32 | 2,000 | 2,478 | |
| 5% 6/1/34 | 3,800 | 4,661 | |
| Series 2017 B: | |||
| 5% 6/1/33 | 3,060 | 3,771 | |
| 5% 6/1/34 | 2,615 | 3,207 | |
| El Dorado County Gen. Oblig. 5% 9/1/23 | 1,360 | 1,589 | |
| El Dorado Irrigation District Rev. Ctfs. of Prtn. Series 2016 B: | |||
| 5% 3/1/28 | 3,125 | 3,812 | |
| 5% 3/1/29 | 8,125 | 9,821 | |
| Elk Grove Fin. Auth. Spl. Tax Rev.: | |||
| (Elk Grove Cfd Laguna Ridge Proj.) Series 2016, 5% 9/1/41 | 4,500 | 5,050 | |
| Series 2015: | |||
| 5% 9/1/27 | 1,940 | 2,336 | |
| 5% 9/1/28 | 4,125 | 4,923 | |
| 5% 9/1/29 | 4,325 | 5,121 | |
| 5% 9/1/30 (Build America Mutual Assurance Insured) | 1,135 | 1,337 | |
| 5% 9/1/31 (Build America Mutual Assurance Insured) | 1,750 | 2,048 | |
| 5% 9/1/32 (Build America Mutual Assurance Insured) | 1,615 | 1,881 | |
| Series 2016: | |||
| 5% 9/1/27 | 1,875 | 2,220 | |
| 5% 9/1/28 | 1,500 | 1,761 | |
| 5% 9/1/29 | 2,000 | 2,328 | |
| 5% 9/1/30 | 1,720 | 1,994 | |
| 5% 9/1/31 | 2,500 | 2,883 | |
| Elk Grove Unified School District Spl. Tax (Cmnty. Facilities District #1 Proj.) 6.5% 12/1/24 (AMBAC Insured) | 4,025 | 4,742 | |
| Empire Union School District Spl. Tax (Cmnty. Facilities District No. 1987 Proj.) Series 2002 A: | |||
| 0% 10/1/24 (AMBAC Insured) | 1,665 | 1,387 | |
| 0% 10/1/25 (AMBAC Insured) | 1,665 | 1,330 | |
| Encinitas Union School District Series 1996, 0% 8/1/21 (Nat'l. Pub. Fin. Guarantee Corp. Insured) | 1,000 | 954 | |
| Escondido Union High School District Series 2008 A: | |||
| 0% 8/1/33 (Assured Guaranty Corp. Insured) | 5,655 | 3,345 | |
| 0% 8/1/34 (Assured Guaranty Corp. Insured) | 3,500 | 1,973 | |
| Folsom Cordova Unified School District School Facilities Impt. District #1 Series A, 0% 10/1/20 (Nat'l. Pub. Fin. Guarantee Corp. Insured) | 1,315 | 1,256 | |
| Foothill-De Anza Cmnty. College District: | |||
| Series 1999 A: | |||
| 0% 8/1/19 (Nat'l. Pub. Fin. Guarantee Corp. Insured) | 5,365 | 5,276 | |
| 0% 8/1/20 (Nat'l. Pub. Fin. Guarantee Corp. Insured) | 6,425 | 6,240 | |
| Series 1999 B, 0% 8/1/24 (Nat'l. Pub. Fin. Guarantee Corp. Insured) | 5,000 | 4,446 | |
| Gilroy School Facilities Fing. Series 2013 A, 5% 8/1/46 | 10,000 | 11,189 | |
| Golden State Tobacco Securitization Corp. Tobacco Settlement Rev.: | |||
| Series 2013 A, 5% 6/1/30 | 6,000 | 6,988 | |
| Series 2017 A1: | |||
| 5% 6/1/21 | 2,000 | 2,273 | |
| 5% 6/1/22 | 2,000 | 2,320 | |
| 5% 6/1/23 | 2,000 | 2,354 | |
| 5% 6/1/24 | 3,000 | 3,564 | |
| 5% 6/1/25 | 3,000 | 3,590 | |
| 5% 6/1/26 | 3,000 | 3,611 | |
| 5% 6/1/27 | 5,760 | 6,959 | |
| 5% 6/1/28 | 7,500 | 8,961 | |
| Series A, 0% 6/1/24 (AMBAC Insured) | 8,030 | 7,023 | |
| Golden West Schools Fing. Auth. Rev. Series A, 0% 8/1/18 (Nat'l. Pub. Fin. Guarantee Corp. Insured) | 2,750 | 2,716 | |
| Irvine Reassessment District 12-1 Ltd. Oblig.: | |||
| 4% 9/2/21 | 1,750 | 1,915 | |
| 5% 9/2/23 | 1,000 | 1,149 | |
| 5% 9/2/24 | 825 | 960 | |
| 5% 9/2/25 | 500 | 565 | |
| 5% 9/2/26 | 800 | 916 | |
| La Quinta Redev. Agcy.: | |||
| (La Quinta Redev. Proj. Areas No. 1 and 2) Series 2014 A: | |||
| 5% 9/1/24 | 1,200 | 1,455 | |
| 5% 9/1/25 | 1,700 | 2,069 | |
| 5% 9/1/26 | 1,860 | 2,255 | |
| 5% 9/1/27 | 1,725 | 2,083 | |
| 5% 9/1/28 | 1,000 | 1,203 | |
| 5% 9/1/29 | 1,250 | 1,501 | |
| Series 2013 A: | |||
| 5% 9/1/24 | 3,830 | 4,566 | |
| 5% 9/1/25 | 4,085 | 4,857 | |
| 5% 9/1/26 | 4,105 | 4,868 | |
| Ladera Ranch Cmnty. Facilities District 2004-1 Series 2014 A: | |||
| 5% 8/15/27 | 1,765 | 1,957 | |
| 5% 8/15/28 | 1,960 | 2,164 | |
| 5% 8/15/29 | 4,225 | 4,645 | |
| 5% 8/15/30 | 4,555 | 4,994 | |
| Laguna Beach Unified School District Gen. Oblig. (Election of 2001 Proj.): | |||
| 5% 8/1/21 | 405 | 452 | |
| 5% 8/1/22 | 450 | 502 | |
| 5% 8/1/23 | 485 | 541 | |
| 5% 8/1/24 | 1,000 | 1,115 | |
| 5% 8/1/26 | 1,370 | 1,526 | |
| 5% 8/1/28 | 760 | 846 | |
| Loma Linda Hosp. Rev. (Loma Linda Univ. Med. Ctr. Proj.) Series 2008 A, 8.25% 12/1/38 (Pre-Refunded to 12/1/17 @ 100) | 4,400 | 4,477 | |
| Long Beach Bond Fin. Auth. Lease Series 2012 A: | |||
| 5% 8/1/24 | 1,000 | 1,163 | |
| 5% 8/1/25 | 1,000 | 1,159 | |
| 5% 8/1/26 | 1,000 | 1,155 | |
| 5% 8/1/27 | 1,000 | 1,152 | |
| 5% 8/1/28 | 1,000 | 1,149 | |
| 5% 8/1/29 | 1,000 | 1,147 | |
| 5% 8/1/30 | 1,000 | 1,145 | |
| 5% 8/1/31 | 1,000 | 1,144 | |
| Long Beach Bond Fin. Auth. Natural Gas Purchase Rev. Series 2007 A, 5.25% 11/15/21 | 3,790 | 4,312 | |
| Long Beach Cmnty. College: | |||
| 0% 6/1/28 (Escrowed to Maturity) | 530 | 424 | |
| 0% 6/1/28 (FSA Insured) | 2,995 | 2,208 | |
| 0% 6/1/31 (Escrowed to Maturity) | 1,465 | 1,046 | |
| 0% 6/1/31 (FSA Insured) | 8,285 | 5,357 | |
| Long Beach Hbr. Rev.: | |||
| Series 2010 B, 5% 5/15/22 | 2,735 | 3,025 | |
| Series 2017 A: | |||
| 5% 5/15/26 (c) | 1,110 | 1,374 | |
| 5% 5/15/27 (c) | 2,000 | 2,498 | |
| 5% 5/15/28 (c) | 3,390 | 4,194 | |
| 5% 5/15/29 (c) | 1,350 | 1,657 | |
| 5% 5/15/30 (c) | 1,300 | 1,584 | |
| 5% 5/15/31 (c) | 1,200 | 1,453 | |
| 5% 5/15/32 (c) | 1,760 | 2,121 | |
| 5% 5/15/33 (c) | 1,350 | 1,620 | |
| 5% 5/15/34 (c) | 1,650 | 1,970 | |
| 5% 5/15/35 (c) | 2,500 | 2,973 | |
| 5% 5/15/36 (c) | 3,000 | 3,560 | |
| 5% 5/15/37 (c) | 2,755 | 3,261 | |
| Long Beach Unified School District Series 2009: | |||
| 5.25% 8/1/33 | 410 | 442 | |
| 5.75% 8/1/33 | 170 | 185 | |
| 5.75% 8/1/33 (Pre-Refunded to 8/1/19 @ 100) | 2,630 | 2,875 | |
| Los Angeles Cmnty. College District: | |||
| Series 2008 A, 6% 8/1/33 (Pre-Refunded to 8/1/19 @ 100) | 10,025 | 10,997 | |
| Series 2009 A, 5.5% 8/1/29 (Pre-Refunded to 8/1/19 @ 100) | 1,000 | 1,088 | |
| Series 2010 C, 5.25% 8/1/39 (Pre-Refunded to 8/1/20 @ 100) | 1,300 | 1,460 | |
| Series 2015 A, 5% 8/1/29 | 7,000 | 8,519 | |
| Los Angeles Cmnty. Redev. Agcy. Lease Rev. (Vermont Manchester Social Svcs. Proj.) Series 2005, 5% 9/1/21 (AMBAC Insured) | 2,805 | 2,813 | |
| Los Angeles County Ctfs. of Prtn.: | |||
| (Disney Concert Hall Parking Garage Proj.) 5% 3/1/23 | 1,600 | 1,914 | |
| (Disney Parking Proj.): | |||
| 0% 3/1/18 | 3,000 | 2,987 | |
| 0% 3/1/19 | 3,200 | 3,151 | |
| 0% 3/1/20 | 1,000 | 971 | |
| Los Angeles County Reg'l. Fin. Auth. (MonteCedro, Inc. Proj.) Series 2014 A, 5% 11/15/44 | 2,250 | 2,566 | |
| Los Angeles Dept. Arpt. Rev.: | |||
| Series 2015 A: | |||
| 5% 5/15/21 (c) | 1,000 | 1,137 | |
| 5% 5/15/24 (c) | 795 | 962 | |
| 5% 5/15/25 (c) | 2,250 | 2,758 | |
| 5% 5/15/26 (c) | 1,705 | 2,067 | |
| 5% 5/15/27 (c) | 1,250 | 1,501 | |
| 5% 5/15/28 (c) | 1,250 | 1,490 | |
| 5% 5/15/29 (c) | 1,575 | 1,860 | |
| 5% 5/15/30 (c) | 1,400 | 1,643 | |
| Series 2015 D: | |||
| 5% 5/15/28 (c) | 1,950 | 2,324 | |
| 5% 5/15/29 (c) | 2,550 | 3,011 | |
| 5% 5/15/30 (c) | 2,000 | 2,348 | |
| 5% 5/15/31 (c) | 2,540 | 2,966 | |
| 5% 5/15/41 (c) | 3,240 | 3,687 | |
| Series 2016 A: | |||
| 5% 5/15/29 (c) | 2,500 | 3,005 | |
| 5% 5/15/30 (c) | 2,500 | 2,985 | |
| 5% 5/15/31 (c) | 3,000 | 3,562 | |
| 5% 5/15/32 (c) | 3,500 | 4,138 | |
| 5% 5/15/33 (c) | 2,000 | 2,354 | |
| 5% 5/15/35 (c) | 2,000 | 2,336 | |
| 5% 5/15/42 (c) | 7,500 | 8,640 | |
| Series 2016 B: | |||
| 5% 5/15/22 (c) | 1,000 | 1,165 | |
| 5% 5/15/26 (c) | 1,600 | 1,978 | |
| 5% 5/15/27 (c) | 1,000 | 1,223 | |
| 5% 5/15/36 (c) | 3,600 | 4,195 | |
| 5% 5/15/41 (c) | 3,750 | 4,326 | |
| Series 2017 B: | |||
| 5% 5/15/23 (c) | 1,000 | 1,189 | |
| 5% 5/15/24 (c) | 1,500 | 1,811 | |
| 5% 5/15/25 (c) | 1,750 | 2,138 | |
| Los Angeles Dept. of Wtr. & Pwr. Elec. Plant Rev. 4.75% 10/15/20 (Escrowed to Maturity) | 125 | 125 | |
| Los Angeles Dept. of Wtr. & Pwr. Rev. Series 2015 A: | |||
| 5% 7/1/28 | 3,400 | 4,096 | |
| 5% 7/1/30 | 19,905 | 23,713 | |
| Los Angeles Dept. of Wtr. & Pwr. Wtrwks. Rev. Series 2016 B: | |||
| 5% 7/1/38 | 2,000 | 2,359 | |
| 5% 7/1/42 | 3,500 | 4,096 | |
| Los Angeles Hbr. Dept. Rev.: | |||
| Series 2016 A, 5% 8/1/24 (c) | 1,500 | 1,817 | |
| 7.6% 10/1/18 (Escrowed to Maturity) | 3,010 | 3,118 | |
| Los Angeles Muni. Impt. Corp. Lease Rev.: | |||
| Series 2012 C, 5% 3/1/26 | 3,000 | 3,451 | |
| Series 2014 A: | |||
| 5% 5/1/24 | 325 | 395 | |
| 5% 5/1/25 | 540 | 654 | |
| 5% 5/1/29 | 500 | 592 | |
| 5% 5/1/30 | 1,000 | 1,178 | |
| 5% 5/1/31 | 1,555 | 1,825 | |
| Series 2014 B: | |||
| 5% 5/1/24 | 200 | 243 | |
| 5% 5/1/25 | 225 | 271 | |
| 5% 5/1/29 | 500 | 592 | |
| 5% 5/1/30 | 400 | 471 | |
| 5% 5/1/31 | 400 | 469 | |
| Series 2016 A: | |||
| 5% 11/1/21 | 2,500 | 2,891 | |
| 5% 11/1/22 | 2,500 | 2,965 | |
| Series 2016 B, 5% 11/1/36 | 1,500 | 1,771 | |
| Los Angeles Wastewtr. Sys. Rev.: | |||
| Series 2009 A, 5.75% 6/1/34 (Pre-Refunded to 6/1/19 @ 100) | 4,455 | 4,832 | |
| Series 2012 B, 5% 6/1/28 | 4,800 | 5,608 | |
| M-S-R Pub. Pwr. Agcy. San Juan Proj. Rev. Series D, 6.75% 7/1/20 (Escrowed to Maturity) | 650 | 714 | |
| Madera County Ctfs. of Prtn. (Children's Hosp. Central California Proj.) Series 2010, 5.375% 3/15/36 | 3,425 | 3,685 | |
| Malibu Gen. Oblig. Ctfs. of Prtn. (City Hall Proj.) Series A: | |||
| 5% 7/1/32 (Pre-Refunded to 7/1/19 @ 100) | 500 | 537 | |
| 5% 7/1/39 (Pre-Refunded to 7/1/19 @ 100) | 4,095 | 4,402 | |
| Merced Union High School District Series A, 0% 8/1/22 (Nat'l. Pub. Fin. Guarantee Corp. Insured) | 1,100 | 1,005 | |
| Modesto Elementary School District, Stanislaus County Series A: | |||
| 0% 8/1/21 (Nat'l. Pub. Fin. Guarantee Corp. Insured) | 2,000 | 1,858 | |
| 0% 8/1/25 (Nat'l. Pub. Fin. Guarantee Corp. Insured) | 2,800 | 2,272 | |
| Modesto Gen. Oblig. Ctfs. of Prtn.: | |||
| (Cmnty. Ctr. Refing. Proj.) Series A, 5% 11/1/23 (AMBAC Insured) | 1,995 | 2,093 | |
| (Golf Course Refing. Proj.) Series B, 5% 11/1/23 (Nat'l. Pub. Fin. Guarantee Corp. Insured) | 1,290 | 1,356 | |
| Modesto Irrigation District Ctfs. of Prtn.: | |||
| (Cap. Impts. Proj.) Series 2004 B, 5.5% 7/1/35 (Pre-Refunded to 7/1/18 @ 100) | 3,800 | 3,945 | |
| (Geysers Geothermal Pwr. Proj.) Series 1986 A, 5% 10/1/17 (Escrowed to Maturity) | 2,560 | 2,568 | |
| Monrovia Unified School District Series B, 0% 8/1/33 (Nat'l. Pub. Fin. Guarantee Corp. Insured) | 2,500 | 1,463 | |
| Montebello Pub. Fing. Auth.: | |||
| (Montebello Home2 Suites by Hilton Hotel Proj.) Series 2016 A: | |||
| 5% 6/1/30 | 1,640 | 1,908 | |
| 5% 6/1/31 | 500 | 579 | |
| 5% 6/1/32 | 500 | 577 | |
| 5% 6/1/33 | 1,800 | 2,067 | |
| 5% 6/1/35 | 1,895 | 2,159 | |
| 5% 6/1/36 | 2,000 | 2,271 | |
| 5% 6/1/41 | 6,155 | 6,908 | |
| (Montebello Home2 Suties by HIlton Hotel Proj.) Series 2016 A, 5% 6/1/34 | 1,345 | 1,538 | |
| Monterey County Pub. Impt. Corp. Ctfs. of Prtn. 5% 8/1/18 (AMBAC Insured) | 3,580 | 3,590 | |
| Moreland School District Series 2003 B, 0% 8/1/27 (Nat'l. Pub. Fin. Guarantee Corp. Insured) | 1,485 | 1,123 | |
| Murrieta Pub. Fing. Auth. Spl. Tax Series 2012: | |||
| 5% 9/1/23 | 1,650 | 1,875 | |
| 5% 9/1/25 | 1,000 | 1,120 | |
| 5% 9/1/26 | 1,155 | 1,287 | |
| Murrieta Valley Unified School District: | |||
| Series 2008, 0% 9/1/32 (FSA Insured) | 5,000 | 2,960 | |
| Series 2015: | |||
| 4% 9/1/24 (FSA Insured) | 330 | 383 | |
| 5% 9/1/25 (FSA Insured) | 680 | 836 | |
| 5% 9/1/26 (FSA Insured) | 500 | 608 | |
| 5% 9/1/26 (FSA Insured) | 1,500 | 1,824 | |
| 5% 9/1/27 (FSA Insured) | 455 | 547 | |
| North City West School Facilities Fing. Auth. Spl. Tax: | |||
| Series 2005 B, 5.25% 9/1/23 (AMBAC Insured) | 1,530 | 1,872 | |
| Series 2006 C, 5% 9/1/17 (AMBAC Insured) | 2,735 | 2,735 | |
| Northern California Pwr. Agcy. Rev. (Hydroelectric #1 Proj.) Series 1986 A, 7.5% 7/1/23 (Pre-Refunded to 7/1/21 @ 100) | 3,390 | 3,961 | |
| Northern California Transmission Agcy. Rev.: | |||
| 5% 5/1/36 | 2,390 | 2,814 | |
| 5% 5/1/37 | 3,500 | 4,111 | |
| 5% 5/1/38 | 1,500 | 1,758 | |
| 5% 5/1/39 | 1,500 | 1,754 | |
| Norwalk-Mirada Unified School District Series 2009 D, 0% 8/1/33 (FSA Insured) | 5,700 | 3,387 | |
| Oakland Gen. Oblig.: | |||
| Series 2009 B, 6.25% 1/15/39 (Pre-Refunded to 1/15/19 @ 100) | 3,000 | 3,221 | |
| Series 2012, 5% 1/15/25 | 3,460 | 3,910 | |
| Series 2015 A: | |||
| 5% 1/15/28 | 1,225 | 1,488 | |
| 5% 1/15/29 | 1,650 | 1,992 | |
| 5% 1/15/30 | 1,665 | 2,004 | |
| 5% 1/15/31 | 1,520 | 1,818 | |
| Oakland Redev. Agcy. Sub Tax Allocation (Central District Redev. Proj.) Series 1993 A, 5% 9/1/21 (Escrowed to Maturity) | 670 | 717 | |
| Oakland Unified School District Alameda County: | |||
| Series 2009 A: | |||
| 6.5% 8/1/23 (Pre-Refunded to 8/1/19 @ 100) | 2,810 | 3,112 | |
| 6.5% 8/1/24 (Pre-Refunded to 8/1/19 @ 100) | 1,220 | 1,351 | |
| Series 2013: | |||
| 6.25% 8/1/30 (Pre-Refunded to 8/1/21 @ 100) | 1,500 | 1,802 | |
| 6.625% 8/1/38 (Pre-Refunded to 8/1/21 @ 100) | 5,000 | 6,078 | |
| Series 2015 A: | |||
| 5% 8/1/30 | 1,250 | 1,502 | |
| 5% 8/1/30 (FSA Insured) | 1,570 | 1,886 | |
| 5% 8/1/40 | 3,500 | 4,053 | |
| Oakland-Alameda County Coliseum Auth. (Oakland Coliseum Proj.) Series 2012 A: | |||
| 5% 2/1/22 | 2,935 | 3,424 | |
| 5% 2/1/23 | 5,000 | 5,819 | |
| Oceanside Unified School District Series A, 0% 8/1/31 (Assured Guaranty Corp. Insured) | 5,000 | 3,138 | |
| Orange County San District Waste Series 2016 A: | |||
| 5% 2/1/35 | 5,490 | 6,552 | |
| 5% 2/1/36 | 6,630 | 7,890 | |
| Palomar Health Rev. Series 2016: | |||
| 5% 11/1/36 | 7,970 | 8,913 | |
| 5% 11/1/39 | 5,250 | 5,767 | |
| Placer County Union High School District Series A: | |||
| 0% 8/1/20 (Nat'l. Pub. Fin. Guarantee Corp. Insured) | 2,000 | 1,913 | |
| 0% 8/1/21 (Nat'l. Pub. Fin. Guarantee Corp. Insured) | 1,000 | 938 | |
| Port of Oakland Rev.: | |||
| Series 2007 A, 5% 11/1/17 (Escrowed to Maturity) (c) | 2,185 | 2,199 | |
| Series 2011 O, 5% 5/1/22 (c) | 4,500 | 5,095 | |
| Series 2012 P: | |||
| 5% 5/1/22 (c) | 4,000 | 4,646 | |
| 5% 5/1/24 (c) | 2,820 | 3,269 | |
| Series 2017 D: | |||
| 5% 11/1/23 (c) | 5,100 | 6,089 | |
| 5% 11/1/24 (c) | 6,100 | 7,377 | |
| 5% 11/1/25 (c) | 2,585 | 3,157 | |
| 5% 11/1/26 (c) | 2,285 | 2,815 | |
| 5% 11/1/27 (c) | 4,000 | 4,956 | |
| 5% 11/1/28 (c) | 4,925 | 6,033 | |
| 5% 11/1/29 (c) | 3,850 | 4,670 | |
| Poway California Redev. Agcy. Successor Series A: | |||
| 5% 6/15/27 | 2,385 | 2,967 | |
| 5% 6/15/28 | 2,190 | 2,646 | |
| 5% 12/15/28 | 2,200 | 2,658 | |
| 5% 12/15/29 | 4,825 | 5,781 | |
| 5% 12/15/30 | 3,500 | 4,318 | |
| Poway Unified School District: | |||
| (District #2007-1 School Facilities Proj.) Series 2008 A, 0% 8/1/32 | 12,800 | 7,825 | |
| Series 2011, 0% 8/1/46 | 10,150 | 3,338 | |
| Series B: | |||
| 0% 8/1/33 | 4,840 | 2,831 | |
| 0% 8/1/35 | 9,000 | 4,802 | |
| 0% 8/1/37 | 6,325 | 3,085 | |
| 0% 8/1/41 | 5,130 | 2,086 | |
| Poway Unified School District Pub. Fing.: | |||
| 5% 9/15/26 | 935 | 1,081 | |
| 5% 9/1/30 | 1,500 | 1,715 | |
| 5% 9/1/31 | 1,265 | 1,440 | |
| 5% 9/1/32 | 1,800 | 2,038 | |
| 5% 9/1/33 | 2,750 | 3,101 | |
| 5% 9/1/34 | 1,230 | 1,380 | |
| 5% 9/1/35 | 1,585 | 1,772 | |
| 5% 9/1/36 | 3,410 | 3,804 | |
| Rancho Cucamonga Redev. Agcy. (Rancho Redev. Proj.): | |||
| 5% 9/1/25 (FSA Insured) | 1,740 | 2,103 | |
| 5% 9/1/26 (FSA Insured) | 1,350 | 1,615 | |
| 5% 9/1/27 (FSA Insured) | 1,700 | 2,021 | |
| 5% 9/1/28 (FSA Insured) | 1,700 | 2,009 | |
| 5% 9/1/29 (FSA Insured) | 1,850 | 2,172 | |
| Redwood City Elementary School District Series 1997, 0% 8/1/20 (Nat'l. Pub. Fin. Guarantee Corp. Insured) | 4,825 | 4,573 | |
| Riverside County Trans. Commission Toll Rev. Series 2013 A: | |||
| 5.75% 6/1/44 | 2,500 | 2,812 | |
| 5.75% 6/1/48 | 5,000 | 5,596 | |
| Riverside Swr. Rev. Series 2015 A: | |||
| 5% 8/1/26 | 1,710 | 2,097 | |
| 5% 8/1/27 | 1,725 | 2,093 | |
| 5% 8/1/28 | 1,935 | 2,328 | |
| 5% 8/1/29 | 2,330 | 2,780 | |
| Rocklin Unified School District Series 2002: | |||
| 0% 8/1/23 (Nat'l. Pub. Fin. Guarantee Corp. Insured) | 2,610 | 2,371 | |
| 0% 8/1/24 (Nat'l. Pub. Fin. Guarantee Corp. Insured) | 6,370 | 5,606 | |
| 0% 8/1/25 (Nat'l. Pub. Fin. Guarantee Corp. Insured) | 6,725 | 5,670 | |
| 0% 8/1/26 (Nat'l. Pub. Fin. Guarantee Corp. Insured) | 5,365 | 4,358 | |
| 0% 8/1/27 (Nat'l. Pub. Fin. Guarantee Corp. Insured) | 6,500 | 5,062 | |
| Roseville City School District Series 2002 A: | |||
| 0% 8/1/25 (Nat'l. Pub. Fin. Guarantee Corp. Insured) | 1,745 | 1,458 | |
| 0% 8/1/27 (Nat'l. Pub. Fin. Guarantee Corp. Insured) | 1,940 | 1,507 | |
| Sacramento City Fing. Auth. Lease Rev. Series 1993 A, 5.4% 11/1/20 (AMBAC Insured) | 1,395 | 1,488 | |
| Sacramento City Fing. Auth. Rev. Series A, 0% 12/1/26 (Nat'l. Pub. Fin. Guarantee Corp. Insured) | 6,000 | 4,566 | |
| Sacramento County Arpt. Sys. Rev. Series 2016 B: | |||
| 5% 7/1/35 | 790 | 929 | |
| 5% 7/1/36 | 2,000 | 2,345 | |
| 5% 7/1/41 | 6,430 | 7,447 | |
| Sacramento Muni. Util. District Elec. Rev.: | |||
| Series 2012 Y, 5% 8/15/27 | 2,800 | 3,303 | |
| Series 2013 A, 5% 8/15/41 | 2,810 | 3,237 | |
| Series 2016 D, 5% 8/15/28 | 2,500 | 3,234 | |
| San Bernardino County Ctfs. of Prtn.: | |||
| (Arrowhead Proj.) Series 2009 A, 5.25% 8/1/26 | 3,000 | 3,214 | |
| (Cap. Facilities Proj.) Series B, 6.875% 8/1/24 (Escrowed to Maturity) | 8,300 | 10,457 | |
| (Med. Ctr. Fing. Prog.) 5.5% 8/1/22 | 10,000 | 11,546 | |
| San Bernardino Unified School District Gen. Oblig. Series 2013 A: | |||
| 5% 8/1/23 (FSA Insured) | 1,100 | 1,329 | |
| 5% 8/1/24 (FSA Insured) | 1,250 | 1,499 | |
| 5% 8/1/25 (FSA Insured) | 2,000 | 2,388 | |
| 5% 8/1/27 (FSA Insured) | 2,000 | 2,361 | |
| San Diego Convention Ctr. Expansion Series 2012 A, 5% 4/15/24 | 3,300 | 3,859 | |
| San Diego County Reg'l. Arpt. Auth. Arpt. Rev.: | |||
| ( Sub Lien Proj.) Series 2017 B, 5% 7/1/36 (c) | 1,500 | 1,759 | |
| ( Sub Lien Proj.) Series A, 5% 7/1/26 (c) | 400 | 489 | |
| (Sub Lien Proj.) Series 2017 B: | |||
| 5% 7/1/22 (c) | 500 | 582 | |
| 5% 7/1/23 (c) | 280 | 332 | |
| 5% 7/1/24 (c) | 1,000 | 1,202 | |
| 5% 7/1/25 (c) | 515 | 625 | |
| 5% 7/1/27 (c) | 500 | 615 | |
| 5% 7/1/28 (c) | 1,000 | 1,225 | |
| 5% 7/1/29 (c) | 1,725 | 2,093 | |
| 5% 7/1/30 (c) | 2,915 | 3,509 | |
| 5% 7/1/31 (c) | 1,250 | 1,496 | |
| 5% 7/1/32 (c) | 1,300 | 1,549 | |
| 5% 7/1/33 (c) | 530 | 628 | |
| 5% 7/1/34 (c) | 1,000 | 1,180 | |
| 5% 7/1/37 (c) | 750 | 877 | |
| Series 2013 B, 5% 7/1/38 (c) | 7,000 | 7,950 | |
| Series 2017 B, 5% 7/1/21 (c) | 300 | 340 | |
| San Diego Pub. Facilities Fing. Auth. Lease Rev.: | |||
| (Cap. Impt. Proj.) Series 2012 A, 5% 4/15/23 | 1,710 | 1,994 | |
| Series 2015 A, 5% 10/15/44 | 4,005 | 4,565 | |
| Series 2016: | |||
| 5% 10/15/29 | 2,000 | 2,391 | |
| 5% 10/15/30 | 1,000 | 1,185 | |
| 5% 10/15/31 | 650 | 765 | |
| San Diego Pub. Facilities Fing. Auth. Wtr. Rev.: | |||
| Series 2009 B, 5.75% 8/1/35 (Pre-Refunded to 8/1/19 @ 100) | 3,455 | 3,774 | |
| Series 2016 B: | |||
| 5% 8/1/38 | 4,000 | 4,751 | |
| 5% 8/1/39 | 3,520 | 4,172 | |
| San Diego Unified School District: | |||
| (Convention Ctr. Proj.) Series 2012, 0% 7/1/45 | 4,770 | 1,607 | |
| Series 2008 C: | |||
| 0% 7/1/37 | 1,300 | 631 | |
| 0% 7/1/47 | 4,000 | 1,228 | |
| Series 2008 E, 0% 7/1/47 (d) | 8,700 | 5,466 | |
| San Francisco City & County Arpts. Commission Int'l. Arpt. Rev.: | |||
| (SFO Fuel Co. Proj.) Series 1997 A, 5.25% 1/1/18 (AMBAC Insured) (c) | 4,515 | 4,536 | |
| Second Series 32F, 5.25% 5/1/19 (Nat'l. Pub. Fin. Guarantee Corp. Insured) | 2,500 | 2,684 | |
| Series 2014 A: | |||
| 5% 5/1/40 (c) | 1,865 | 2,103 | |
| 5% 5/1/44 (c) | 8,390 | 9,416 | |
| Series 2016 B: | |||
| 5% 5/1/41 (c) | 11,695 | 13,341 | |
| 5% 5/1/46 (c) | 21,000 | 23,830 | |
| 5% 5/1/28 | 2,280 | 2,801 | |
| 5% 5/1/29 | 1,225 | 1,492 | |
| 5% 5/1/30 | 330 | 399 | |
| 5% 5/1/32 | 1,000 | 1,195 | |
| San Francisco City & County Redev. Fing. Auth. Tax Allocation Rev. (San Francisco Redev. Projs.) Series 2009 B: | |||
| 6.125% 8/1/28 | 1,000 | 1,091 | |
| 6.625% 8/1/39 | 1,000 | 1,099 | |
| San Francisco City & County Redev. Spl. Tax (Mission Bay South Pub. Impt. Proj.) Series 2013 A: | |||
| 5% 8/1/23 | 1,000 | 1,157 | |
| 5% 8/1/24 | 750 | 862 | |
| San Francisco Pub. Utils. Commission Wtr. Rev. Series 2016, 5% 11/1/31 | 3,500 | 4,325 | |
| San Jacinto Unified School District Series 2014: | |||
| 5% 8/1/25 (FSA Insured) | 875 | 1,061 | |
| 5% 8/1/26 (FSA Insured) | 1,055 | 1,272 | |
| 5% 8/1/27 (FSA Insured) | 1,250 | 1,498 | |
| 5% 8/1/28 (FSA Insured) | 1,250 | 1,489 | |
| 5% 8/1/29 (FSA Insured) | 3,150 | 3,730 | |
| 5% 8/1/30 (FSA Insured) | 4,070 | 4,790 | |
| 5% 8/1/31 (FSA Insured) | 650 | 761 | |
| San Joaquin County Ctfs. of Prtn. (County Administration Bldg. Proj.): | |||
| 5% 11/15/20 (Nat'l. Pub. Fin. Guarantee Corp. Insured) | 3,720 | 3,750 | |
| 5% 11/15/21 (Nat'l. Pub. Fin. Guarantee Corp. Insured) | 3,645 | 3,675 | |
| San Joaquin Hills Trans. Corridor Agcy. Toll Road Rev. Series 1993, 0% 1/1/27 (Escrowed to Maturity) | 4,000 | 3,317 | |
| San Jose Fing. Auth. Lease Rev. (Civic Ctr. Proj.) Series 2013 A: | |||
| 5% 6/1/25 | 3,500 | 4,154 | |
| 5% 6/1/26 | 3,000 | 3,551 | |
| San Jose Int'l. Arpt. Rev.: | |||
| Series 2014 A: | |||
| 5% 3/1/19 (c) | 500 | 530 | |
| 5% 3/1/20 (c) | 3,500 | 3,826 | |
| 5% 3/1/21 (c) | 2,750 | 3,094 | |
| Series 2017 A: | |||
| 5% 3/1/20 (c) | 6,370 | 6,963 | |
| 5% 3/1/21 (c) | 2,750 | 3,094 | |
| 5% 3/1/22 (c) | 1,750 | 2,019 | |
| 5% 3/1/27 (c) | 2,480 | 3,038 | |
| 5% 3/1/31 (c) | 1,100 | 1,306 | |
| 5% 3/1/32 (c) | 850 | 1,005 | |
| 5% 3/1/33 (c) | 1,095 | 1,288 | |
| 5% 3/1/34 (c) | 1,250 | 1,464 | |
| 5% 3/1/35 (c) | 2,250 | 2,625 | |
| 5% 3/1/36 (c) | 2,250 | 2,621 | |
| 5% 3/1/37 (c) | 2,250 | 2,615 | |
| 5% 3/1/41 (c) | 5,000 | 5,767 | |
| Series 2017 B: | |||
| 5% 3/1/29 | 200 | 245 | |
| 5% 3/1/30 | 250 | 304 | |
| 5% 3/1/32 | 235 | 282 | |
| 5% 3/1/33 | 250 | 299 | |
| 5% 3/1/34 | 500 | 595 | |
| 5% 3/1/37 | 3,000 | 3,541 | |
| San Marcos Redev. Agcy. Successor Series 2015 A: | |||
| 5% 10/1/27 | 1,650 | 2,001 | |
| 5% 10/1/29 | 675 | 806 | |
| 5% 10/1/30 | 2,000 | 2,376 | |
| 5% 10/1/31 | 2,310 | 2,733 | |
| San Marcos Unified School District: | |||
| Series 2010 A, 5% 8/1/38 | 5,000 | 5,651 | |
| Series 2010 B, 0% 8/1/47 | 9,000 | 2,759 | |
| San Mateo County Cmnty. College District Series A, 0% 9/1/18 (Nat'l. Pub. Fin. Guarantee Corp. Insured) | 3,000 | 2,976 | |
| San Mateo County Joint Powers Fing. Auth. (Cap. Projs.) Series 2009 A, 5.25% 7/15/24 | 5,280 | 5,816 | |
| San Mateo Unified School District (Election of 2000 Proj.) Series B: | |||
| 0% 9/1/23 (Nat'l. Pub. Fin. Guarantee Corp. Insured) | 2,000 | 1,819 | |
| 0% 9/1/25 (Nat'l. Pub. Fin. Guarantee Corp. Insured) | 1,490 | 1,268 | |
| 0% 9/1/26 (Nat'l. Pub. Fin. Guarantee Corp. Insured) | 1,500 | 1,231 | |
| San Pablo Redev. Agcy. Series 2014 A: | |||
| 5% 6/15/25 (FSA Insured) | 825 | 988 | |
| 5% 6/15/26 (FSA Insured) | 860 | 1,020 | |
| 5% 6/15/27 (FSA Insured) | 1,770 | 2,080 | |
| 5% 6/15/28 (FSA Insured) | 1,865 | 2,177 | |
| 5% 6/15/29 (FSA Insured) | 1,780 | 2,064 | |
| 5% 6/15/30 (FSA Insured) | 1,150 | 1,325 | |
| 5% 6/15/31 (FSA Insured) | 1,000 | 1,146 | |
| Sanger Unified School District 5.6% 8/1/23 (Nat'l. Pub. Fin. Guarantee Corp. Insured) | 1,885 | 2,049 | |
| Santa Clara Elec. Rev. Series 2011 A, 6% 7/1/31 | 3,000 | 3,521 | |
| Santa Monica Pub. Fin. Rev. (City Svcs. Bldg. Proj.) Series 2017: | |||
| 4% 7/1/39 (e) | 790 | 847 | |
| 5% 7/1/36 (e) | 2,380 | 2,855 | |
| 5% 7/1/37 (e) | 1,780 | 2,130 | |
| Santa Monica-Malibu Unified School District Series 2017 C: | |||
| 4% 7/1/36 | 435 | 474 | |
| 4% 7/1/37 | 475 | 516 | |
| 4% 7/1/38 | 450 | 488 | |
| 4% 7/1/39 | 550 | 595 | |
| 5% 7/1/30 | 250 | 312 | |
| 5% 7/1/31 | 350 | 434 | |
| 5% 7/1/32 | 255 | 314 | |
| 5% 7/1/33 | 250 | 307 | |
| 5% 7/1/34 | 315 | 385 | |
| 5% 7/1/35 | 400 | 487 | |
| Santa Rosa Wastewtr. Rev. Series 2002 B: | |||
| 0% 9/1/20 (AMBAC Insured) | 4,030 | 3,877 | |
| 0% 9/1/22 (AMBAC Insured) | 2,900 | 2,680 | |
| 0% 9/1/25 (AMBAC Insured) | 6,800 | 5,728 | |
| Shasta Union High School District: | |||
| Series 2002, 0% 8/1/26 (Nat'l. Pub. Fin. Guarantee Corp. Insured) | 1,000 | 796 | |
| Series 2003, 0% 5/1/28 (Nat'l. Pub. Fin. Guarantee Corp. Insured) | 3,340 | 2,481 | |
| South Orange County Pub. Fin. Auth. Series 2016: | |||
| 5% 4/1/21 | 1,000 | 1,138 | |
| 5% 4/1/34 | 2,000 | 2,348 | |
| 5% 4/1/36 | 3,000 | 3,490 | |
| South Orange County Pub. Fing. Auth. Spl. Tax Rev. Series 2014 A: | |||
| 5% 8/15/23 | 1,000 | 1,128 | |
| 5% 8/15/26 | 1,975 | 2,189 | |
| 5% 8/15/27 | 700 | 773 | |
| 5% 8/15/28 | 1,000 | 1,101 | |
| Southwestern Cmnty. College District Gen. Oblig. Series 2000, 0% 8/1/27 (Nat'l. Pub. Fin. Guarantee Corp. Insured) | 2,495 | 1,932 | |
| Stockton Unified School District Gen. Oblig.: | |||
| Series 2012 A: | |||
| 5% 8/1/24 (FSA Insured) | 300 | 367 | |
| 5% 8/1/25 (FSA Insured) | 750 | 904 | |
| 5% 8/1/27 (FSA Insured) | 265 | 316 | |
| 5% 8/1/28 (FSA Insured) | 510 | 604 | |
| 5% 8/1/38 (FSA Insured) | 2,500 | 2,860 | |
| 5% 8/1/42 (FSA Insured) | 4,650 | 5,304 | |
| 5% 7/1/23 (FSA Insured) | 1,270 | 1,496 | |
| 5% 7/1/24 (FSA Insured) | 1,350 | 1,587 | |
| 5% 7/1/25 (FSA Insured) | 1,060 | 1,243 | |
| 5% 7/1/26 (FSA Insured) | 1,110 | 1,299 | |
| 5% 7/1/27 (FSA Insured) | 1,065 | 1,244 | |
| 5% 1/1/29 (FSA Insured) | 600 | 698 | |
| Successor Agcy. To The Redev. Agcy. of Pittsburg (Los Medanos Cmnty. Dev. Proj.) Series 2016 A: | |||
| 5% 9/1/24 (FSA Insured) | 2,440 | 2,933 | |
| 5% 9/1/25 (FSA Insured) | 3,500 | 4,254 | |
| 5% 9/1/26 (FSA Insured) | 8,000 | 9,810 | |
| 5% 9/1/27 (FSA Insured) | 4,000 | 4,851 | |
| 5% 9/1/28 (FSA Insured) | 3,500 | 4,203 | |
| 5% 9/1/29 (FSA Insured) | 2,000 | 2,381 | |
| Sweetwater Union High School District 5% 9/1/21 | 4,705 | 5,381 | |
| Torrance Gen. Oblig. Rev. (Torrance Memorial Med. Ctr. Proj.) Series A, 5% 9/1/40 | 5,660 | 6,033 | |
| Tracy Operating Partnership Joint Powers Auth. Rev. 6.375% 10/1/38 (Assured Guaranty Corp. Insured) | 5,000 | 5,278 | |
| Tulare Swr. Rev. Series 2015: | |||
| 5% 11/15/24 (FSA Insured) | 820 | 995 | |
| 5% 11/15/25 (FSA Insured) | 800 | 980 | |
| 5% 11/15/26 (FSA Insured) | 965 | 1,171 | |
| 5% 11/15/27 (FSA Insured) | 1,500 | 1,802 | |
| 5% 11/15/28 (FSA Insured) | 1,165 | 1,389 | |
| Turlock Irrigation District Rev. Series 2011, 5.5% 1/1/41 | 10,000 | 11,304 | |
| Union Elementary School District Series A: | |||
| 0% 9/1/18 (Nat'l. Pub. Fin. Guarantee Corp. Insured) | 1,000 | 991 | |
| 0% 9/1/21 (Nat'l. Pub. Fin. Guarantee Corp. Insured) | 2,995 | 2,837 | |
| Univ. of California Regents Med. Ctr. Pool Rev. Series 2013 J, 5% 5/15/48 | 7,300 | 8,127 | |
| Univ. of California Revs.: | |||
| Bonds 1.4%, tender 5/15/21 (a) | 3,000 | 3,011 | |
| Series 2009 O, 5.75% 5/15/34 (Pre-Refunded to 5/15/19 @ 100) | 9,900 | 10,718 | |
| Series 2017 AV: | |||
| 5% 5/15/29 | 2,500 | 3,125 | |
| 5% 5/15/34 | 2,000 | 2,426 | |
| 5% 5/15/35 | 5,000 | 6,041 | |
| Vacaville Unified School District Series 2014 C: | |||
| 5% 8/1/23 (Build America Mutual Assurance Insured) | 930 | 1,125 | |
| 5% 8/1/26 (Build America Mutual Assurance Insured) | 1,295 | 1,584 | |
| 5% 8/1/30 | 6,710 | 8,026 | |
| Ventura County Pub. Fing. Auth. Series 2013 A: | |||
| 5% 11/1/24 | 1,000 | 1,175 | |
| 5% 11/1/25 | 1,000 | 1,172 | |
| 5% 11/1/26 | 1,000 | 1,171 | |
| Walnut Valley Unified School District Series D: | |||
| 0% 8/1/30 (Nat'l. Pub. Fin. Guarantee Corp. Insured) | 2,875 | 1,938 | |
| 0% 8/1/31 (Nat'l. Pub. Fin. Guarantee Corp. Insured) | 2,715 | 1,746 | |
| 0% 8/1/32 (Nat'l. Pub. Fin. Guarantee Corp. Insured) | 1,315 | 806 | |
| Washington Township Health Care District Gen. Oblig. Series 2013 B: | |||
| 5% 8/1/43 | 5,000 | 5,730 | |
| 5.5% 8/1/38 | 1,500 | 1,819 | |
| 5.5% 8/1/40 | 5,000 | 6,055 | |
| Washington Township Health Care District Rev.: | |||
| Series 2009 A: | |||
| 6% 7/1/29 | 3,000 | 3,189 | |
| 6.25% 7/1/39 | 7,015 | 7,457 | |
| Series 2010 A, 5.5% 7/1/38 | 3,100 | 3,356 | |
| West Contra Costa Unified School District: | |||
| Series 2012, 5% 8/1/32 | 8,265 | 9,555 | |
| Series 2014 A: | |||
| 5% 8/1/23 | 365 | 442 | |
| 5% 8/1/25 | 2,555 | 3,134 | |
| 5% 8/1/26 | 2,550 | 3,111 | |
| 5% 8/1/27 | 1,150 | 1,395 | |
| 5% 8/1/28 | 1,000 | 1,207 | |
| 5% 8/1/29 | 1,675 | 2,011 | |
| Western Riverside County Trust & Wastewtr. Fin. Auth.: | |||
| 5.5% 9/1/34 (Assured Guaranty Corp. Insured) | 1,750 | 1,893 | |
| 5.625% 9/1/39 (Assured Guaranty Corp. Insured) | 2,250 | 2,436 | |
| Yuba City Unified School District Series A, 0% 9/1/21 (Nat'l. Pub. Fin. Guarantee Corp. Insured) | 2,090 | 1,947 | |
| TOTAL CALIFORNIA | 1,914,066 | ||
| Guam - 1.3% | |||
| Guam Ed. Fing. Foundation Ctfs. of Prtn. Series 2008, 5.875% 10/1/18 (Escrowed to Maturity) | 825 | 846 | |
| Guam Gov't. Ltd. Oblig. Rev. Series 2016 A: | |||
| 5% 12/1/22 | 3,000 | 3,440 | |
| 5% 12/1/24 | 3,000 | 3,511 | |
| 5% 12/1/25 | 2,500 | 2,939 | |
| 5% 12/1/26 | 2,000 | 2,362 | |
| 5% 12/1/27 | 2,000 | 2,345 | |
| 5% 12/1/29 | 645 | 743 | |
| 5% 12/1/31 | 2,500 | 2,843 | |
| 5% 12/1/33 | 2,250 | 2,536 | |
| 5% 12/1/34 | 1,750 | 1,967 | |
| 5% 12/1/36 | 1,000 | 1,118 | |
| 5% 12/1/46 | 645 | 710 | |
| TOTAL GUAM | 25,360 | ||
| TOTAL MUNICIPAL BONDS | |||
| (Cost $1,811,848) | 1,939,426 | ||
| Municipal Notes - 0.7% | |||
| California - 0.7% | |||
| San Jose Int'l. Arpt. Rev. Participating VRDN Series 2017, 0.98% 9/7/17 (Liquidity Facility Citibank NA) (a)(c)(f) | |||
| (Cost $14,100) | 14,100 | 14,100 | |
| TOTAL INVESTMENT IN SECURITIES - 99.2% | |||
| (Cost $1,825,948) | 1,953,526 | ||
| NET OTHER ASSETS (LIABILITIES) - 0.8% | 14,901 | ||
| NET ASSETS - 100% | $1,968,427 |
Security Type Abbreviations
VRDN – VARIABLE RATE DEMAND NOTE (A debt instrument that is payable upon demand, either daily, weekly or monthly)
Legend
(a) Coupon rates for floating and adjustable rate securities reflect the rates in effect at period end.
(b) Security exempt from registration under Rule 144A of the Securities Act of 1933. These securities may be resold in transactions exempt from registration, normally to qualified institutional buyers. At the end of the period, the value of these securities amounted to $5,139,000 or 0.3% of net assets.
(c) Private activity obligations whose interest is subject to the federal alternative minimum tax for individuals.
(d) Security initially issued in zero coupon form which converts to coupon form at a specified rate and date. The rate shown is the rate at period end.
(e) Security or a portion of the security purchased on a delayed delivery or when-issued basis.
(f) Provides evidence of ownership in one or more underlying municipal bonds.
Investment Valuation
All investments are categorized as Level 2 under the Fair Value Hierarchy. The inputs or methodology used for valuing securities may not be an indication of the risk associated with investing in those securities. For more information on valuation inputs please refer to the Investment Valuation section in the accompanying Notes to Financial Statements.
Other Information
The distribution of municipal securities by revenue source, as a percentage of total Net Assets, is as follows (Unaudited):
| General Obligations | 35.3% |
| Transportation | 18.5% |
| Special Tax | 11.9% |
| Escrowed/Pre-Refunded | 8.5% |
| Health Care | 8.5% |
| Water & Sewer | 5.4% |
| Others* (Individually Less Than 5%) | 11.9% |
| 100.0% |
* Includes net other assets
See accompanying notes which are an integral part of the financial statements.
Financial Statements
Statement of Assets and Liabilities
| Amounts in thousands (except per-share amounts) | August 31, 2017 (Unaudited) | |
| Assets | ||
| Investment in securities, at value — See accompanying schedule: Unaffiliated issuers (cost $1,825,948) | $1,953,526 | |
| Cash | 2,446 | |
| Receivable for fund shares sold | 574 | |
| Interest receivable | 20,839 | |
| Other receivables | 6 | |
| Total assets | 1,977,391 | |
| Liabilities | ||
| Payable for investments purchased on a delayed delivery basis | $5,808 | |
| Payable for fund shares redeemed | 661 | |
| Distributions payable | 1,693 | |
| Accrued management fee | 583 | |
| Distribution and service plan fees payable | 35 | |
| Other affiliated payables | 158 | |
| Other payables and accrued expenses | 26 | |
| Total liabilities | 8,964 | |
| Net Assets | $1,968,427 | |
| Net Assets consist of: | ||
| Paid in capital | $1,835,779 | |
| Accumulated net investment loss | (176) | |
| Accumulated undistributed net realized gain (loss) on investments | 5,246 | |
| Net unrealized appreciation (depreciation) on investments | 127,578 | |
| Net Assets | $1,968,427 | |
| Calculation of Maximum Offering Price | ||
| Class A: | ||
| Net Asset Value and redemption price per share ($36,162 ÷ 2,762 shares) | $13.09 | |
| Maximum offering price per share (100/96.00 of $13.09) | $13.64 | |
| Class M: | ||
| Net Asset Value and redemption price per share ($7,860 ÷ 599 shares) | $13.12 | |
| Maximum offering price per share (100/96.00 of $13.12) | $13.67 | |
| Class C: | ||
| Net Asset Value and offering price per share ($31,081 ÷ 2,378 shares)(a) | $13.07 | |
| California Municipal Income: | ||
| Net Asset Value, offering price and redemption price per share ($1,829,768 ÷ 139,962 shares) | $13.07 | |
| Class I: | ||
| Net Asset Value, offering price and redemption price per share ($63,556 ÷ 4,851 shares) | $13.10 |
(a) Redemption price per share is equal to net asset value less any applicable contingent deferred sales charge.
See accompanying notes which are an integral part of the financial statements.
Statement of Operations
| Amounts in thousands | Six months ended August 31, 2017 (Unaudited) | |
| Investment Income | ||
| Interest | $33,627 | |
| Expenses | ||
| Management fee | $3,420 | |
| Transfer agent fees | 745 | |
| Distribution and service plan fees | 212 | |
| Accounting fees and expenses | 175 | |
| Custodian fees and expenses | 7 | |
| Independent trustees' fees and expenses | 4 | |
| Registration fees | 69 | |
| Audit | 28 | |
| Legal | 7 | |
| Miscellaneous | 10 | |
| Total expenses before reductions | 4,677 | |
| Expense reductions | (13) | 4,664 |
| Net investment income (loss) | 28,963 | |
| Realized and Unrealized Gain (Loss) | ||
| Net realized gain (loss) on: | ||
| Investment securities: | ||
| Unaffiliated issuers | 6,131 | |
| Total net realized gain (loss) | 6,131 | |
| Change in net unrealized appreciation (depreciation) on investment securities | 41,239 | |
| Net gain (loss) | 47,370 | |
| Net increase (decrease) in net assets resulting from operations | $76,333 |
See accompanying notes which are an integral part of the financial statements.
Statement of Changes in Net Assets
| Amounts in thousands | Six months ended August 31, 2017 (Unaudited) | Year ended February 28, 2017 |
| Increase (Decrease) in Net Assets | ||
| Operations | ||
| Net investment income (loss) | $28,963 | $62,517 |
| Net realized gain (loss) | 6,131 | 18,294 |
| Change in net unrealized appreciation (depreciation) | 41,239 | (93,757) |
| Net increase (decrease) in net assets resulting from operations | 76,333 | (12,946) |
| Distributions to shareholders from net investment income | (28,921) | (62,370) |
| Distributions to shareholders from net realized gain | (2,493) | – |
| Total distributions | (31,414) | (62,370) |
| Share transactions - net increase (decrease) | 49,295 | (46,002) |
| Redemption fees | – | 34 |
| Total increase (decrease) in net assets | 94,214 | (121,284) |
| Net Assets | ||
| Beginning of period | 1,874,213 | 1,995,497 |
| End of period | $1,968,427 | $1,874,213 |
| Other Information | ||
| Accumulated net investment loss end of period | $(176) | $(218) |
See accompanying notes which are an integral part of the financial statements.
Financial Highlights — Fidelity California Municipal Income Fund Class A
| Six months ended (Unaudited) August 31, | Years ended February 28, | |||||
| 2017 | 2017 | 2016 A | 2015 | 2014 | 2013 | |
| Selected Per–Share Data | ||||||
| Net asset value, beginning of period | $12.79 | $13.24 | $13.16 | $12.63 | $13.02 | $12.69 |
| Income from Investment Operations | ||||||
| Net investment income (loss)B | .176 | .363 | .390 | .397 | .437 | .436 |
| Net realized and unrealized gain (loss) | .316 | (.451) | .081 | .544 | (.396) | .324 |
| Total from investment operations | .492 | (.088) | .471 | .941 | .041 | .760 |
| Distributions from net investment income | (.175) | (.362) | (.390) | (.411) | (.431) | (.428) |
| Distributions from net realized gain | (.017) | – | (.001) | – | – | (.002) |
| Total distributions | (.192) | (.362) | (.391) | (.411) | (.431) | (.430) |
| Redemption fees added to paid in capitalB | – | –C | –C | –C | –C | –C |
| Net asset value, end of period | $13.09 | $12.79 | $13.24 | $13.16 | $12.63 | $13.02 |
| Total ReturnD,E,F | 3.88% | (.70)% | 3.66% | 7.55% | .40% | 6.08% |
| Ratios to Average Net AssetsG | ||||||
| Expenses before reductions | .80%H | .80% | .80% | .79% | .77% | .77% |
| Expenses net of fee waivers, if any | .80%H | .80% | .80% | .79% | .77% | .77% |
| Expenses net of all reductions | .80%H | .80% | .80% | .79% | .77% | .77% |
| Net investment income (loss) | 2.70%H | 2.75% | 2.99% | 3.07% | 3.47% | 3.38% |
| Supplemental Data | ||||||
| Net assets, end of period (in millions) | $36 | $47 | $48 | $42 | $34 | $56 |
| Portfolio turnover rate | 26%H | 25% | 11% | 10% | 13% | 9% |
A For the year ended February 29.
B Calculated based on average shares outstanding during the period.
C Amount represents less than $.0005 per share.
D Total returns for periods of less than one year are not annualized.
E Total returns would have been lower if certain expenses had not been reduced during the applicable periods shown.
F Total returns do not include the effect of the sales charges.
G Expense ratios reflect operating expenses of the class. Expenses before reductions do not reflect amounts reimbursed by the investment adviser or reductions from expense offset arrangements and do not represent the amount paid by the class during periods when reimbursements or reductions occur. Expenses net of fee waivers reflect expenses after reimbursement by the investment adviser but prior to reductions from expense offset arrangements. Expenses net of all reductions represent the net expenses paid by the class.
H Annualized
See accompanying notes which are an integral part of the financial statements.
Financial Highlights — Fidelity California Municipal Income Fund Class M
| Six months ended (Unaudited) August 31, | Years ended February 28, | |||||
| 2017 | 2017 | 2016 A | 2015 | 2014 | 2013 | |
| Selected Per–Share Data | ||||||
| Net asset value, beginning of period | $12.82 | $13.28 | $13.20 | $12.67 | $13.05 | $12.72 |
| Income from Investment Operations | ||||||
| Net investment income (loss)B | .179 | .368 | .399 | .408 | .442 | .440 |
| Net realized and unrealized gain (loss) | .316 | (.460) | .080 | .543 | (.385) | .323 |
| Total from investment operations | .495 | (.092) | .479 | .951 | .057 | .763 |
| Distributions from net investment income | (.178) | (.368) | (.398) | (.421) | (.437) | (.432) |
| Distributions from net realized gain | (.017) | – | (.001) | – | – | (.002) |
| Total distributions | (.195) | (.368) | (.399) | (.421) | (.437) | (.433)C |
| Redemption fees added to paid in capitalB | – | –D | –D | –D | –D | –D |
| Net asset value, end of period | $13.12 | $12.82 | $13.28 | $13.20 | $12.67 | $13.05 |
| Total ReturnE,F,G | 3.89% | (.74)% | 3.72% | 7.61% | .53% | 6.09% |
| Ratios to Average Net AssetsH | ||||||
| Expenses before reductions | .77%I | .76% | .74% | .72% | .71% | .75% |
| Expenses net of fee waivers, if any | .77%I | .76% | .74% | .72% | .71% | .75% |
| Expenses net of all reductions | .76%I | .76% | .74% | .72% | .71% | .74% |
| Net investment income (loss) | 2.73%I | 2.79% | 3.04% | 3.14% | 3.52% | 3.41% |
| Supplemental Data | ||||||
| Net assets, end of period (in millions) | $8 | $9 | $8 | $7 | $6 | $6 |
| Portfolio turnover rate | 26%I | 25% | 11% | 10% | 13% | 9% |
A For the year ended February 29.
B Calculated based on average shares outstanding during the period.
C Total distributions of $.433 per share is comprised of distributions from net investment income of $.4316 and distributions from net realized gain of $.0016 per share.
D Amount represents less than $.0005 per share.
E Total returns for periods of less than one year are not annualized.
F Total returns would have been lower if certain expenses had not been reduced during the applicable periods shown.
G Total returns do not include the effect of the sales charges.
H Expense ratios reflect operating expenses of the class. Expenses before reductions do not reflect amounts reimbursed by the investment adviser or reductions from expense offset arrangements and do not represent the amount paid by the class during periods when reimbursements or reductions occur. Expenses net of fee waivers reflect expenses after reimbursement by the investment adviser but prior to reductions from expense offset arrangements. Expenses net of all reductions represent the net expenses paid by the class.
I Annualized
See accompanying notes which are an integral part of the financial statements.
Financial Highlights — Fidelity California Municipal Income Fund Class C
| Six months ended (Unaudited) August 31, | Years ended February 28, | |||||
| 2017 | 2017 | 2016 A | 2015 | 2014 | 2013 | |
| Selected Per–Share Data | ||||||
| Net asset value, beginning of period | $12.77 | $13.22 | $13.14 | $12.61 | $13.00 | $12.67 |
| Income from Investment Operations | ||||||
| Net investment income (loss)B | .127 | .263 | .292 | .300 | .337 | .337 |
| Net realized and unrealized gain (loss) | .316 | (.451) | .080 | .544 | (.393) | .325 |
| Total from investment operations | .443 | (.188) | .372 | .844 | (.056) | .662 |
| Distributions from net investment income | (.126) | (.262) | (.291) | (.314) | (.334) | (.330) |
| Distributions from net realized gain | (.017) | – | (.001) | – | – | (.002) |
| Total distributions | (.143) | (.262) | (.292) | (.314) | (.334) | (.332) |
| Redemption fees added to paid in capitalB | – | –C | –C | –C | –C | –C |
| Net asset value, end of period | $13.07 | $12.77 | $13.22 | $13.14 | $12.61 | $13.00 |
| Total ReturnD,E,F | 3.49% | (1.46)% | 2.88% | 6.76% | (.37)% | 5.28% |
| Ratios to Average Net AssetsG | ||||||
| Expenses before reductions | 1.55%H | 1.55% | 1.55% | 1.54% | 1.54% | 1.54% |
| Expenses net of fee waivers, if any | 1.55%H | 1.55% | 1.55% | 1.54% | 1.54% | 1.54% |
| Expenses net of all reductions | 1.55%H | 1.55% | 1.55% | 1.54% | 1.54% | 1.53% |
| Net investment income (loss) | 1.95%H | 2.00% | 2.24% | 2.32% | 2.70% | 2.62% |
| Supplemental Data | ||||||
| Net assets, end of period (in millions) | $31 | $31 | $26 | $24 | $24 | $24 |
| Portfolio turnover rate | 26%H | 25% | 11% | 10% | 13% | 9% |
A For the year ended February 29.
B Calculated based on average shares outstanding during the period.
C Amount represents less than $.0005 per share..
D Total returns for periods of less than one year are not annualized.
E Total returns would have been lower if certain expenses had not been reduced during the applicable periods shown.
F Total returns do not include the effect of the contingent deferred sales charge.
G Expense ratios reflect operating expenses of the class. Expenses before reductions do not reflect amounts reimbursed by the investment adviser or reductions from expense offset arrangements and do not represent the amount paid by the class during periods when reimbursements or reductions occur. Expenses net of fee waivers reflect expenses after reimbursement by the investment adviser but prior to reductions from expense offset arrangements. Expenses net of all reductions represent the net expenses paid by the class.
H Annualized
See accompanying notes which are an integral part of the financial statements.
Financial Highlights — Fidelity California Municipal Income Fund
| Six months ended (Unaudited) August 31, | Years ended February 28, | |||||
| 2017 | 2017 | 2016 A | 2015 | 2014 | 2013 | |
| Selected Per–Share Data | ||||||
| Net asset value, beginning of period | $12.77 | $13.22 | $13.15 | $12.62 | $13.00 | $12.67 |
| Income from Investment Operations | ||||||
| Net investment income (loss)B | .198 | .407 | .434 | .440 | .473 | .475 |
| Net realized and unrealized gain (loss) | .316 | (.450) | .070 | .543 | (.384) | .325 |
| Total from investment operations | .514 | (.043) | .504 | .983 | .089 | .800 |
| Distributions from net investment income | (.197) | (.407) | (.433) | (.453) | (.469) | (.468) |
| Distributions from net realized gain | (.017) | – | (.001) | – | – | (.002) |
| Total distributions | (.214) | (.407) | (.434) | (.453) | (.469) | (.470) |
| Redemption fees added to paid in capitalB | – | –C | –C | –C | –C | –C |
| Net asset value, end of period | $13.07 | $12.77 | $13.22 | $13.15 | $12.62 | $13.00 |
| Total ReturnD,E | 4.06% | (.37)% | 3.93% | 7.91% | .78% | 6.41% |
| Ratios to Average Net AssetsF | ||||||
| Expenses before reductions | .46%G | .46% | .46% | .46% | .46% | .46% |
| Expenses net of fee waivers, if any | .46%G | .46% | .46% | .46% | .46% | .46% |
| Expenses net of all reductions | .46%G | .46% | .46% | .46% | .46% | .46% |
| Net investment income (loss) | 3.04%G | 3.09% | 3.33% | 3.40% | 3.77% | 3.69% |
| Supplemental Data | ||||||
| Net assets, end of period (in millions) | $1,830 | $1,728 | $1,866 | $1,813 | $1,629 | $1,855 |
| Portfolio turnover rate | 26%G | 25% | 11% | 10% | 13% | 9% |
A For the year ended February 29.
B Calculated based on average shares outstanding during the period.
C Amount represents less than $.0005 per share.
D Total returns for periods of less than one year are not annualized.
E Total returns would have been lower if certain expenses had not been reduced during the applicable periods shown.
F Expense ratios reflect operating expenses of the class. Expenses before reductions do not reflect amounts reimbursed by the investment adviser or reductions from expense offset arrangements and do not represent the amount paid by the class during periods when reimbursements or reductions occur. Expenses net of fee waivers reflect expenses after reimbursement by the investment adviser but prior to reductions from expense offset arrangements. Expenses net of all reductions represent the net expenses paid by the class.
G Annualized
See accompanying notes which are an integral part of the financial statements.
Financial Highlights — Fidelity California Municipal Income Fund Class I
| Six months ended (Unaudited) August 31, | Years ended February 28, | |||||
| 2017 | 2017 | 2016 A | 2015 | 2014 | 2013 | |
| Selected Per–Share Data | ||||||
| Net asset value, beginning of period | $12.80 | $13.25 | $13.17 | $12.64 | $13.03 | $12.70 |
| Income from Investment Operations | ||||||
| Net investment income (loss)B | .192 | .395 | .423 | .429 | .463 | .465 |
| Net realized and unrealized gain (loss) | .317 | (.450) | .080 | .543 | (.394) | .324 |
| Total from investment operations | .509 | (.055) | .503 | .972 | .069 | .789 |
| Distributions from net investment income | (.192) | (.395) | (.422) | (.442) | (.459) | (.458) |
| Distributions from net realized gain | (.017) | – | (.001) | – | – | (.002) |
| Total distributions | (.209) | (.395) | (.423) | (.442) | (.459) | (.459)C |
| Redemption fees added to paid in capitalB | – | –D | –D | –D | –D | –D |
| Net asset value, end of period | $13.10 | $12.80 | $13.25 | $13.17 | $12.64 | $13.03 |
| Total ReturnE,F | 4.00% | (.46)% | 3.91% | 7.80% | .62% | 6.31% |
| Ratios to Average Net AssetsG | ||||||
| Expenses before reductions | .55%H | .55% | .55% | .55% | .54% | .54% |
| Expenses net of fee waivers, if any | .55%H | .55% | .55% | .55% | .54% | .54% |
| Expenses net of all reductions | .55%H | .55% | .55% | .55% | .54% | .54% |
| Net investment income (loss) | 2.94%H | 3.00% | 3.23% | 3.31% | 3.69% | 3.61% |
| Supplemental Data | ||||||
| Net assets, end of period (in millions) | $64 | $59 | $47 | $40 | $33 | $33 |
| Portfolio turnover rate | 26%H | 25% | 11% | 10% | 13% | 9% |
A For the year ended February 29.
B Calculated based on average shares outstanding during the period.
C Total distributions of $459 per share is comprised of distributions from net investment income of $.4578 and distributions from net realized gain of $.0016 per share.
D Amount represents less than $.0005 per share.
E Total returns for periods of less than one year are not annualized.
F Total returns would have been lower if certain expenses had not been reduced during the applicable periods shown.
G Expense ratios reflect operating expenses of the class. Expenses before reductions do not reflect amounts reimbursed by the investment adviser or reductions from expense offset arrangements and do not represent the amount paid by the class during periods when reimbursements or reductions occur. Expenses net of fee waivers reflect expenses after reimbursement by the investment adviser but prior to reductions from expense offset arrangements. Expenses net of all reductions represent the net expenses paid by the class.
H Annualized
See accompanying notes which are an integral part of the financial statements.
Notes to Financial Statements (Unaudited)
For the period ended August 31, 2017
(Amounts in thousands except percentages)
1. Organization.
Fidelity California Municipal Income Fund (the Fund) is a fund of Fidelity California Municipal Trust (the Trust) and is authorized to issue an unlimited number of shares. The Trust is registered under the Investment Company Act of 1940, as amended (the 1940 Act), as an open-end management investment company organized as a Massachusetts business trust. The Fund offers Class A, Class M (formerly Class T), Class C, California Municipal Income and Class I shares, each of which has equal rights as to assets and voting privileges. Each class has exclusive voting rights with respect to matters that affect that class. The Fund may be affected by economic and political developments in the state of California.
After the close of business on June 24, 2016, all outstanding Class B shares were converted to Class A shares. All prior fiscal period dollar and share amounts for Class B presented in the Notes to Financial Statements are for the period March 1, 2016 through June 24, 2016.
2. Significant Accounting Policies.
The Fund is an investment company and applies the accounting and reporting guidance of the Financial Accounting Standards Board (FASB) Accounting Standards Codification Topic 946 Financial Services – Investments Companies. The financial statements have been prepared in conformity with accounting principles generally accepted in the United States of America (GAAP), which require management to make certain estimates and assumptions at the date of the financial statements. Actual results could differ from those estimates. Subsequent events, if any, through the date that the financial statements were issued have been evaluated in the preparation of the financial statements. The following summarizes the significant accounting policies of the Fund:
Investment Valuation. Investments are valued as of 4:00 p.m. Eastern time on the last calendar day of the period. The Board of Trustees (the Board) has delegated the day to day responsibility for the valuation of the Fund's investments to the Fair Value Committee (the Committee) established by the Fund's investment adviser. In accordance with valuation policies and procedures approved by the Board, the Fund attempts to obtain prices from one or more third party pricing vendors or brokers to value its investments. When current market prices, quotations or currency exchange rates are not readily available or reliable, investments will be fair valued in good faith by the Committee, in accordance with procedures adopted by the Board. Factors used in determining fair value vary by investment type and may include market or investment specific events, changes in interest rates and credit quality. The frequency with which these procedures are used cannot be predicted and they may be utilized to a significant extent. The Committee oversees the Fund's valuation policies and procedures and reports to the Board on the Committee's activities and fair value determinations. The Board monitors the appropriateness of the procedures used in valuing the Fund's investments and ratifies the fair value determinations of the Committee.
The Fund categorizes the inputs to valuation techniques used to value its investments into a disclosure hierarchy consisting of three levels as shown below:
- Level 1 – quoted prices in active markets for identical investments
- Level 2 – other significant observable inputs (including quoted prices for similar investments, interest rates, prepayment speeds, etc.)
- Level 3 – unobservable inputs (including the Fund's own assumptions based on the best information available)
Valuation techniques used to value the Fund's investments by major category are as follows:
Debt securities, including restricted securities, are valued based on evaluated prices received from third party pricing vendors or from brokers who make markets in such securities. Municipal securities are valued by pricing vendors who utilize matrix pricing which considers yield or price of bonds of comparable quality, coupon, maturity and type or by broker-supplied prices. When independent prices are unavailable or unreliable, debt securities may be valued utilizing pricing methodologies which consider similar factors that would be used by third party pricing vendors. Debt securities are generally categorized as Level 2 in the hierarchy but may be Level 3 depending on the circumstances.
Changes in valuation techniques may result in transfers in or out of an assigned level within the disclosure hierarchy.
Investment Transactions and Income. For financial reporting purposes, the Fund's investment holdings and NAV include trades executed through the end of the last business day of the period. The NAV per share for processing shareholder transactions is calculated as of the close of business of the New York Stock Exchange (NYSE), normally 4:00 p.m. Eastern time and includes trades executed through the end of the prior business day. Gains and losses on securities sold are determined on the basis of identified cost. Interest income is accrued as earned and includes coupon interest and amortization of premium and accretion of discount on debt securities as applicable. Debt obligations may be placed on non-accrual status and related interest income may be reduced by ceasing current accruals and writing off interest receivables when the collection of all or a portion of interest has become doubtful based on consistently applied procedures. A debt obligation is removed from non-accrual status when the issuer resumes interest payments or when collectability of interest is reasonably assured.
Class Allocations and Expenses. Investment income, realized and unrealized capital gains and losses, common expenses of the Fund, and certain fund-level expense reductions, if any, are allocated daily on a pro-rata basis to each class based on the relative net assets of each class to the total net assets of the Fund. Each class differs with respect to transfer agent and distribution and service plan fees incurred. Certain expense reductions may also differ by class. For the reporting period, the allocated portion of income and expenses to each class as a percent of its average net assets may vary due to the timing of recording these transactions in relation to fluctuating net assets of the classes. Expenses directly attributable to a fund are charged to that fund. Expenses attributable to more than one fund are allocated among the respective funds on the basis of relative net assets or other appropriate methods. Expense estimates are accrued in the period to which they relate and adjustments are made when actual amounts are known.
Income Tax Information and Distributions to Shareholders. Each year, the Fund intends to qualify as a regulated investment company under Subchapter M of the Internal Revenue Code, including distributing substantially all of its taxable income and realized gains. As a result, no provision for U.S. Federal income taxes is required. The Fund files a U.S. federal tax return, in addition to state and local tax returns as required. The Fund's federal income tax returns are subject to examination by the Internal Revenue Service (IRS) for a period of three fiscal years after they are filed. State and local tax returns may be subject to examination for an additional fiscal year depending on the jurisdiction.
Dividends are declared and recorded daily and paid monthly from net investment income. Distributions from realized gains, if any, are declared and recorded on the ex-dividend date. Income dividends and capital gain distributions are declared separately for each class. Income and capital gain distributions are determined in accordance with income tax regulations, which may differ from GAAP.
Capital accounts within the financial statements are adjusted for permanent book-tax differences. These adjustments have no impact on net assets or the results of operations. Capital accounts are not adjusted for temporary book-tax differences which will reverse in a subsequent period.
Book-tax differences are primarily due to market discount, deferred trustees compensation, capital loss carryforwards and losses deferred due to futures contracts.
The Fund purchases municipal securities whose interest, in the opinion of the issuer, is free from federal income tax. There is no assurance that the IRS will agree with this opinion. In the event the IRS determines that the issuer does not comply with relevant tax requirements, interest payments from a security could become federally taxable, possibly retroactively to the date the security was issued.
As of period end, the cost and unrealized appreciation (depreciation) in securities, and derivatives if applicable, for federal income tax purposes were as follows:
| Gross unrealized appreciation | $130,719 |
| Gross unrealized depreciation | (2,659) |
| Net unrealized appreciation (depreciation) | $128,060 |
| Tax cost | $1,825,466 |
At the prior fiscal period end, the Fund was required to defer approximately $644 of losses on futures contracts.
Delayed Delivery Transactions and When-Issued Securities. During the period, the Fund transacted in securities on a delayed delivery or when-issued basis. Payment and delivery may take place after the customary settlement period for that security. The price of the underlying securities and the date when the securities will be delivered and paid for are fixed at the time the transaction is negotiated. The securities purchased on a delayed delivery or when-issued basis are identified as such in the Fund's Schedule of Investments. The Fund may receive compensation for interest forgone in the purchase of a delayed delivery or when-issued security. With respect to purchase commitments, the Fund identifies securities as segregated in its records with a value at least equal to the amount of the commitment. Losses may arise due to changes in the value of the underlying securities or if the counterparty does not perform under the contract's terms, or if the issuer does not issue the securities due to political, economic, or other factors.
Restricted Securities. The Fund may invest in securities that are subject to legal or contractual restrictions on resale. These securities generally may be resold in transactions exempt from registration or to the public if the securities are registered. Disposal of these securities may involve time-consuming negotiations and expense, and prompt sale at an acceptable price may be difficult. Information regarding restricted securities is included at the end of the Fund's Schedule of Investments.
New Accounting Pronouncement. In March 2017, the Financial Accounting Standards Board (FASB) issued an Accounting Standards Update (ASU), ASU 2017-08, which amends the amortization period for certain callable debt securities that are held at a premium. The amendment requires the premium to be amortized to the earliest call date. The amendments do not require an accounting change for securities held at a discount. The ASU is effective for annual periods beginning after December 15, 2018. Management is currently evaluating the potential impact of these changes to the financial statements.
3. Purchases and Sales of Investments.
Purchases and sales of securities, other than short-term securities, aggregated $365,757 and $246,455, respectively.
4. Fees and Other Transactions with Affiliates.
Management Fee. Fidelity Management & Research Company (the investment adviser) and its affiliates provide the Fund with investment management related services for which the Fund pays a monthly management fee. The management fee is the sum of an individual fund fee rate that is based on an annual rate of .25% of the Fund's average net assets and an annualized group fee rate that averaged .11% during the period. The group fee rate is based upon the average net assets of all the mutual funds advised by the investment adviser, including any mutual funds previously advised by the investment adviser that are currently advised by Fidelity SelectCo, LLC, an affiliate of the investment adviser. The group fee rate decreases as assets under management increase and increases as assets under management decrease. For the reporting period, the total annualized management fee rate was .36% of the Fund's average net assets.
Distribution and Service Plan Fees. In accordance with Rule 12b-1 of the 1940 Act, the Fund has adopted separate Distribution and Service Plans for each class of shares. Certain classes pay Fidelity Distributors Corporation (FDC), an affiliate of the investment adviser, separate Distribution and Service Fees, each of which is based on an annual percentage of each class' average net assets. In addition, FDC may pay financial intermediaries for selling shares of the Fund and providing shareholder support services. For the period, the Distribution and Service Fee rates, total fees and amounts retained by FDC were as follows:
| Distribution Fee | Service Fee | Total Fees | Retained by FDC | |
| Class A | -% | .25% | $46 | $2 |
| Class M | -% | .25% | 10 | – |
| Class C | .75% | .25% | 156 | 27 |
| $212 | $29 |
Sales Load. FDC may receive a front-end sales charge of up to 4.00% for selling Class A shares and Class M shares, some of which is paid to financial intermediaries for selling shares of the Fund. Depending on the holding period, FDC may receive contingent deferred sales charges levied on Class A, Class M and Class C redemptions. The deferred sales charges are 1.00% for Class C shares, .75% for certain purchases of Class A shares and .25% for certain purchases of Class M shares.
For the period, sales charge amounts retained by FDC were as follows:
| Retained by FDC | |
| Class A | $3 |
| Class M | 1 |
| Class C(a) | 2 |
| $6 |
(a) When Class C shares are initially sold, FDC pays commissions from its own resources to financial intermediaries through which the sales are made.
Transfer Agent Fees. Fidelity Investments Institutional Operations Company, Inc. (FIIOC), an affiliate of the investment adviser, is the transfer, dividend disbursing and shareholder servicing agent for the Fund. FIIOC receives account fees and asset-based fees that vary according to the account size and type of account of the shareholders of the respective classes of the Fund. FIIOC pays for typesetting, printing and mailing of shareholder reports, except proxy statements. For the period, transfer agent fees for each class were as follows:
| Amount | % of Class-Level Average Net Assets(a) | |
| Class A | $31 | .17 |
| Class M | 5 | .13 |
| Class C | 27 | .17 |
| California Municipal Income | 625 | .07 |
| Class I | 57 | .17 |
| $745 |
(a) Annualized
Accounting Fees. Fidelity Service Company, Inc. (FSC), an affiliate of the investment adviser, maintains the Fund's accounting records. The fee is based on the level of average net assets for each month.
Interfund Trades. The Fund may purchase from or sell securities to other Fidelity Funds under procedures adopted by the Board. The procedures have been designed to ensure these interfund trades are executed in accordance with Rule 17a-7 of the 1940 Act. Interfund trades are included within the respective purchases and sales amounts shown in the Purchases and Sales of Investments note.
5. Committed Line of Credit.
The Fund participates with other funds managed by the investment adviser or an affiliate in a $4.25 billion credit facility (the "line of credit") to be utilized for temporary or emergency purposes to fund shareholder redemptions or for other short-term liquidity purposes. The Fund has agreed to pay commitment fees on its pro-rata portion of the line of credit, which amounted to $3 and is reflected in Miscellaneous expenses on the Statement of Operations. During the period, the Fund did not borrow on this line of credit.
6. Expense Reductions.
Through arrangements with the Fund's custodian, credits realized as a result of certain uninvested cash balances were used to reduce the Fund's expenses. During the period, these credits reduced the Fund's custody expenses by $7.
In addition, during the period the investment adviser reimbursed and/or waived a portion of fund-level operating expenses in the amount of $6.
7. Distributions to Shareholders.
Distributions to shareholders of each class were as follows:
| Six months ended August 31, 2017 | Year ended February 28, 2017 | |
| From net investment income | ||
| Class A | $505 | $1,420 |
| Class M | 114 | 254 |
| Class B | – | 2 |
| Class C | 304 | 606 |
| California Municipal Income | 26,975 | 58,322 |
| Class I | 1,023 | 1,766 |
| Total | $28,921 | $62,370 |
| From net realized gain | ||
| Class A | $49 | $– |
| Class M | 11 | – |
| Class C | 41 | – |
| California Municipal Income | 2,300 | – |
| Class I | 92 | – |
| Total | $2,493 | $– |
8. Share Transactions.
Share transactions for each class were as follows and may contain automatic conversions between classes or exchanges between affiliated funds:
| Shares | Shares | Dollars | Dollars | |
| Six months ended August 31, 2017 | Year ended February 28, 2017 | Six months ended August 31, 2017 | Year ended February 28, 2017 | |
| Class A | ||||
| Shares sold | 180 | 1,196 | $2,320 | $15,842 |
| Reinvestment of distributions | 40 | 93 | 516 | 1,220 |
| Shares redeemed | (1,118) | (1,287) | (14,286) | (16,733) |
| Net increase (decrease) | (898) | 2 | $(11,450) | $329 |
| Class M | ||||
| Shares sold | 30 | 300 | $394 | $3,963 |
| Reinvestment of distributions | 9 | 16 | 115 | 212 |
| Shares redeemed | (121) | (201) | (1,567) | (2,613) |
| Net increase (decrease) | (82) | 115 | $(1,058) | $1,562 |
| Class B | ||||
| Shares sold | – | –(a) | $– | $–(b) |
| Reinvestment of distributions | – | –(a) | – | 1 |
| Shares redeemed | – | (20) | (276) | |
| Net increase (decrease) | – | (20) | $– | $(275) |
| Class C | ||||
| Shares sold | 166 | 879 | $2,145 | $11,675 |
| Reinvestment of distributions | 22 | 37 | 280 | 480 |
| Shares redeemed | (263) | (443) | (3,386) | (5,751) |
| Net increase (decrease) | (75) | 473 | $(961) | $6,404 |
| California Municipal Income | ||||
| Shares sold | 11,346 | 29,076 | $146,510 | $381,477 |
| Reinvestment of distributions | 1,454 | 2,791 | 18,788 | 36,674 |
| Shares redeemed | (8,160) | (37,651) | (105,144) | (486,869) |
| Net increase (decrease) | 4,640 | (5,784) | $60,154 | $(68,718) |
| Class I | ||||
| Shares sold | 1,924 | 3,196 | $24,736 | $42,101 |
| Reinvestment of distributions | 69 | 100 | 890 | 1,317 |
| Shares redeemed | (1,778) | (2,208) | (23,016) | (28,722) |
| Net increase (decrease) | 215 | 1,088 | $2,610 | $14,696 |
(a) In the amount of less than five hundred shares.
(b) In the amount of less than five hundred dollars.
9. Other.
The Fund's organizational documents provide former and current trustees and officers with a limited indemnification against liabilities arising in connection with the performance of their duties to the Fund. In the normal course of business, the Fund may also enter into contracts that provide general indemnifications. The Fund's maximum exposure under these arrangements is unknown as this would be dependent on future claims that may be made against the Fund. The risk of material loss from such claims is considered remote.
Shareholder Expense Example
As a shareholder of the Fund, you incur two types of costs: (1) transaction costs, including sales charges (loads) on purchase payments or redemption proceeds, and (2) ongoing costs, including management fees, distribution and/or service (12b-1) fees and other Fund expenses. This Example is intended to help you understand your ongoing costs (in dollars) of investing in the Fund and to compare these costs with the ongoing costs of investing in other mutual funds.
The Example is based on an investment of $1,000 invested at the beginning of the period and held for the entire period (March 1, 2017 to August 31, 2017).
Actual Expenses
The first line of the accompanying table for each class of the Fund provides information about actual account values and actual expenses. You may use the information in this line, together with the amount you invested, to estimate the expenses that you paid over the period. Simply divide your account value by $1,000.00 (for example, an $8,600 account value divided by $1,000.00 = 8.6), then multiply the result by the number in the first line for a class of the Fund under the heading entitled "Expenses Paid During Period" to estimate the expenses you paid on your account during this period. A small balance maintenance fee of $12.00 that is charged once a year may apply for certain accounts with a value of less than $2,000. This fee is not included in the table below. If it was, the estimate of expenses you paid during the period would be higher, and your ending account value lower, by this amount.
Hypothetical Example for Comparison Purposes
The second line of the accompanying table for each class of the Fund provides information about hypothetical account values and hypothetical expenses based on a Class' actual expense ratio and an assumed rate of return of 5% per year before expenses, which is not the Class' actual return. The hypothetical account values and expenses may not be used to estimate the actual ending account balance or expenses you paid for the period. You may use this information to compare the ongoing costs of investing in the Fund and other funds. To do so, compare this 5% hypothetical example with the 5% hypothetical examples that appear in the shareholder reports of the other funds. A small balance maintenance fee of $12.00 that is charged once a year may apply for certain accounts with a value of less than $2,000. This fee is not included in the table below. If it was, the estimate of expenses you paid during the period would be higher, and your ending account value lower, by this amount.
Please note that the expenses shown in the table are meant to highlight your ongoing costs only and do not reflect any transaction costs. Therefore, the second line of the table is useful in comparing ongoing costs only, and will not help you determine the relative total costs of owning different funds. In addition, if these transactional costs were included, your costs would have been higher.
| Annualized Expense Ratio-A | Beginning Account Value March 1, 2017 | Ending Account Value August 31, 2017 | Expenses Paid During Period-B March 1, 2017 to August 31, 2017 | |
| Class A | .80% | |||
| Actual | $1,000.00 | $1,038.80 | $4.11 | |
| Hypothetical-C | $1,000.00 | $1,021.17 | $4.08 | |
| Class M | .77% | |||
| Actual | $1,000.00 | $1,038.90 | $3.96 | |
| Hypothetical-C | $1,000.00 | $1,021.32 | $3.92 | |
| Class C | 1.55% | |||
| Actual | $1,000.00 | $1,034.90 | $7.95 | |
| Hypothetical-C | $1,000.00 | $1,017.39 | $7.88 | |
| California Municipal Income | .46% | |||
| Actual | $1,000.00 | $1,040.60 | $2.37 | |
| Hypothetical-C | $1,000.00 | $1,022.89 | $2.35 | |
| Class I | .55% | |||
| Actual | $1,000.00 | $1,040.00 | $2.83 | |
| Hypothetical-C | $1,000.00 | $1,022.43 | $2.80 |
A Annualized expense ratio reflects expenses net of applicable fee waivers.
B Expenses are equal to each Class' annualized expense ratio, multiplied by the average account value over the period, multiplied by 184/365 (to reflect the one-half year period).
C 5% return per year before expenses
![]()
ASCM-SANN-1017
1.777331.115
Fidelity® California Municipal Income Fund Semi-Annual Report August 31, 2017 |
|
Contents
To view a fund's proxy voting guidelines and proxy voting record for the 12-month period ended June 30, visit http://www.fidelity.com/proxyvotingresults or visit the Securities and Exchange Commission's (SEC) web site at http://www.sec.gov.
You may also call 1-800-544-8544 to request a free copy of the proxy voting guidelines.
Standard & Poor's, S&P and S&P 500 are registered service marks of The McGraw-Hill Companies, Inc. and have been licensed for use by Fidelity Distributors Corporation.
Other third-party marks appearing herein are the property of their respective owners.
All other marks appearing herein are registered or unregistered trademarks or service marks of FMR LLC or an affiliated company. © 2017 FMR LLC. All rights reserved.
This report and the financial statements contained herein are submitted for the general information of the shareholders of the Fund. This report is not authorized for distribution to prospective investors in the Fund unless preceded or accompanied by an effective prospectus.
A fund files its complete schedule of portfolio holdings with the SEC for the first and third quarters of each fiscal year on Form N-Q. Forms N-Q are available on the SEC’s web site at http://www.sec.gov. A fund's Forms N-Q may be reviewed and copied at the SEC’s Public Reference Room in Washington, DC. Information regarding the operation of the SEC's Public Reference Room may be obtained by calling 1-800-SEC-0330.
For a complete list of a fund's portfolio holdings, view the most recent holdings listing, semiannual report, or annual report on Fidelity's web site at http://www.fidelity.com, http://www.institutional.fidelity.com, or http://www.401k.com, as applicable.
NOT FDIC INSURED •MAY LOSE VALUE •NO BANK GUARANTEE
Neither the Fund nor Fidelity Distributors Corporation is a bank.
Investment Summary (Unaudited)
Top Five Sectors as of August 31, 2017
| % of fund's net assets | % of fund's net assets 6 months ago | |
| General Obligations | 35.3 | 37.2 |
| Transportation | 18.5 | 13.8 |
| Special Tax | 11.9 | 12.4 |
| Escrowed/Pre-Refunded | 8.5 | 11.0 |
| Health Care | 8.5 | 7.8 |
Quality Diversification (% of fund's net assets)
| As of August 31, 2017 | ||
| AAA | 5.0% | |
| AA,A | 79.6% | |
| BBB | 9.8% | |
| BB and Below | 1.5% | |
| Not Rated | 2.6% | |
| Short-Term Investments and Net Other Assets | 1.5% | |
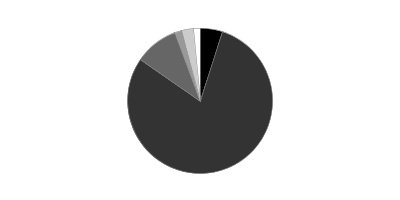
| As of February 28, 2017 | ||
| AAA | 5.7% | |
| AA,A | 77.3% | |
| BBB | 7.7% | |
| BB and Below | 1.5% | |
| Not Rated | 2.6% | |
| Short-Term Investments and Net Other Assets | 5.2% | |

We have used ratings from Moody's Investors Service, Inc. Where Moody's® ratings are not available, we have used S&P® ratings. All ratings are as of the date indicated and do not reflect subsequent changes.
Investments August 31, 2017 (Unaudited)
Showing Percentage of Net Assets
| Municipal Bonds - 98.5% | |||
| Principal Amount (000s) | Value (000s) | ||
| California - 97.2% | |||
| ABAG Fin. Auth. for Nonprofit Corps. Rev. (Sharp HealthCare Proj.): | |||
| Series 2009 B, 6.25% 8/1/39 | $3,000 | $3,276 | |
| Series 2012 A: | |||
| 5% 8/1/24 | 1,050 | 1,207 | |
| 5% 8/1/25 | 1,245 | 1,421 | |
| 5% 8/1/27 | 300 | 339 | |
| 5% 8/1/28 | 400 | 450 | |
| ABC Unified School District Series 1997 C: | |||
| 0% 8/1/31 (Nat'l. Pub. Fin. Guarantee Corp. Insured) | 2,780 | 1,740 | |
| 0% 8/1/32 (Nat'l. Pub. Fin. Guarantee Corp. Insured) | 3,760 | 2,245 | |
| Alameda Corridor Trans. Auth. Rev.: | |||
| Series 2004 A, 5.3% 10/1/23 (Pre-Refunded to 10/1/17 @ 100) | 935 | 938 | |
| Series 2004: | |||
| 0% 10/1/19 | 7,920 | 7,773 | |
| 0% 10/1/19 | 630 | 600 | |
| Series 2013 A: | |||
| 5% 10/1/24 | 7,750 | 9,253 | |
| 5% 10/1/25 | 5,245 | 6,249 | |
| Series 2016 B: | |||
| 5% 10/1/34 | 2,500 | 2,890 | |
| 5% 10/1/35 | 4,000 | 4,607 | |
| 5% 10/1/36 | 2,250 | 2,586 | |
| 5% 10/1/37 | 2,200 | 2,521 | |
| Alameda County Ctfs. of Prtn. (Santa Rita Jail Proj.) Series 2007 A: | |||
| 5% 12/1/18 (AMBAC Insured) | 2,645 | 2,672 | |
| 5% 12/1/20 (AMBAC Insured) | 2,810 | 2,837 | |
| Anaheim Pub. Fing. Auth. Lease Rev. (Anaheim Pub. Impt. Proj.): | |||
| Series 1997 A, 6% 9/1/24 (FSA Insured) | 1,000 | 1,216 | |
| Series 1997 C: | |||
| 0% 9/1/19 (FSA Insured) | 1,285 | 1,255 | |
| 0% 9/1/22 (FSA Insured) | 5,150 | 4,750 | |
| Antelope Valley Cmnty. College District: | |||
| Series A: | |||
| 5% 8/1/31 | 1,325 | 1,605 | |
| 5% 8/1/32 | 1,345 | 1,618 | |
| 5% 8/1/33 | 1,805 | 2,156 | |
| 5% 8/1/34 | 3,000 | 3,559 | |
| 5% 8/1/35 | 4,000 | 4,719 | |
| 5% 8/1/39 | 17,680 | 20,443 | |
| Antelope Valley Healthcare District Rev. Series 2016 A, 5% 3/1/26 | 5,000 | 5,405 | |
| Antioch Unified School District (School Facilities Impt. District #1 Proj.) Series 2008 B, 5.75% 8/1/24 (Pre-Refunded to 8/1/19 @ 100) | 1,000 | 1,092 | |
| Bay Area Toll Auth. San Francisco Bay Toll Bridge Rev.: | |||
| Bonds: | |||
| Series B, 2.85%, tender 4/1/25 (a) | 7,000 | 7,452 | |
| Series C, 2.1%, tender 4/1/22 (a) | 7,000 | 7,218 | |
| Series H, 2.125%, tender 4/1/25 (a) | 4,000 | 4,049 | |
| 1.5%, tender 10/1/17 (a) | 1,000 | 1,001 | |
| 1.875%, tender 4/1/19 (a) | 6,250 | 6,325 | |
| Series 2014 E, 2% 4/1/34 | 6,000 | 6,144 | |
| Beverly Hills Fin. Auth. Rev. (2007 Rfdg. Proj.) Series A: | |||
| 5% 6/1/24 | 3,235 | 3,765 | |
| 5% 6/1/25 | 4,355 | 5,062 | |
| 5% 6/1/27 | 2,755 | 3,191 | |
| 5% 6/1/28 | 3,045 | 3,521 | |
| Burbank Unified School District: | |||
| Series 1997 B, 0% 8/1/20 (Nat'l. Pub. Fin. Guarantee Corp. Insured) | 3,835 | 3,649 | |
| Series 1997 C, 0% 8/1/20 (Nat'l. Pub. Fin. Guarantee Corp. Insured) | 5,865 | 5,618 | |
| Cabrillo Unified School District Series A, 0% 8/1/18 (AMBAC Insured) | 2,000 | 1,974 | |
| California Dept. of Wtr. Resources Series AI, 5% 12/1/25 | 2,700 | 3,130 | |
| California Econ. Recovery Series 2009 A, 5% 7/1/19 (Escrowed to Maturity) | 1,725 | 1,856 | |
| California Edl. Facilities Auth. Rev.: | |||
| (Loyola Marymount Univ. Proj.) Series 2010 A, 5% 10/1/25 | 5,860 | 6,316 | |
| (Pomona College Proj.) Series 2005 A, 0% 7/1/38 | 3,155 | 1,567 | |
| (Santa Clara Univ. Proj.) Series 1999, 5.25% 9/1/26 (AMBAC Insured) | 7,910 | 9,846 | |
| Series 2009, 5% 1/1/39 (Pre-Refunded to 1/1/19 @ 100) | 2,700 | 2,851 | |
| California Enterprise Dev. Auth. (The Thacher School Proj.) Series 2010: | |||
| 4% 9/1/20 | 860 | 912 | |
| 4% 9/1/21 | 1,000 | 1,058 | |
| 4% 9/1/22 | 740 | 781 | |
| 4% 9/1/23 | 1,080 | 1,136 | |
| 4% 9/1/24 | 1,125 | 1,181 | |
| 5% 9/1/19 | 400 | 433 | |
| 5% 9/1/39 | 5,000 | 5,337 | |
| California Gen. Oblig.: | |||
| Series 2007: | |||
| 5% 8/1/22 | 5 | 5 | |
| 5.625% 5/1/20 | 85 | 85 | |
| 5.625% 5/1/26 | 120 | 120 | |
| 5.75% 5/1/30 | 90 | 90 | |
| Series 2016, 5% 9/1/36 | 7,630 | 9,069 | |
| 4.5% 8/1/30 | 35 | 35 | |
| 5% 3/1/19 (Pre-Refunded to 3/1/18 @ 100) | 3,000 | 3,063 | |
| 5% 10/1/22 | 1,355 | 1,470 | |
| 5% 11/1/22 (Pre-Refunded to 11/1/17 @ 100) | 2,800 | 2,818 | |
| 5% 10/1/26 | 6,065 | 7,429 | |
| 5% 10/1/32 (Nat'l. Pub. Fin. Guarantee Corp. Insured) | 10 | 10 | |
| 5.25% 10/1/17 | 105 | 105 | |
| 5.25% 4/1/27 | 5 | 5 | |
| 5.25% 4/1/29 | 5 | 5 | |
| 5.25% 12/1/33 | 105 | 105 | |
| 5.25% 4/1/35 | 3,500 | 4,105 | |
| 5.25% 3/1/38 | 3,740 | 3,812 | |
| 5.5% 4/1/28 | 5 | 5 | |
| 5.5% 4/1/30 | 25 | 25 | |
| 5.5% 11/1/34 | 2,535 | 2,778 | |
| 5.5% 11/1/39 | 1,810 | 1,981 | |
| 6% 4/1/18 | 1,570 | 1,617 | |
| 6% 3/1/33 | 16,330 | 18,339 | |
| 6% 4/1/38 | 1,190 | 1,283 | |
| 6.5% 4/1/33 | 11,650 | 12,661 | |
| California Health Facilities Fing. Auth.: | |||
| Bonds: | |||
| Series 2016 B1, 1.25%, tender 10/1/20 (a) | 6,980 | 7,006 | |
| Series 2016 B3, 2%, tender 10/1/25 (a) | 8,190 | 8,166 | |
| Series 2017 A, 5% 11/15/32 | 1,400 | 1,702 | |
| California Health Facilities Fing. Auth. Rev.: | |||
| (Catholic Healthcare West Proj.) Series 2009 E, 5.625% 7/1/25 | 11,000 | 11,913 | |
| (Children's Hosp. of Orange County Proj.) Series 2012 A: | |||
| 5% 11/15/22 | 2,500 | 2,907 | |
| 5% 11/15/23 | 2,000 | 2,324 | |
| (Providence Health and Svcs. Proj.): | |||
| Series 2009 B, 5.5% 10/1/39 | 2,000 | 2,162 | |
| Series C, 6.5% 10/1/38 (Pre-Refunded to 10/1/18 @ 100) | 90 | 95 | |
| 6.5% 10/1/38 (Pre-Refunded to 10/1/18 @ 100) | 4,910 | 5,208 | |
| (Scripps Health Proj.) Series 2010 A, 5% 11/15/36 | 3,000 | 3,259 | |
| (St. Joseph Health Sys. Proj.) Series 2009 A, 5.75% 7/1/39 | 1,000 | 1,085 | |
| Series 2008 A3, 5.5% 11/15/40 | 3,090 | 3,544 | |
| Series 2011 A, 5% 3/1/20 | 3,250 | 3,568 | |
| Series 2011 D: | |||
| 5% 8/15/22 | 900 | 1,042 | |
| 5% 8/15/23 | 700 | 809 | |
| 5% 8/15/25 | 2,000 | 2,302 | |
| California Infrastructure & Econ. Dev. Bank Rev. (Performing Arts Ctr. of Los Angeles County Proj.) Series 2007: | |||
| 5% 12/1/27 | 1,080 | 1,090 | |
| 5% 12/1/32 | 1,000 | 1,009 | |
| 5% 12/1/42 | 3,000 | 3,024 | |
| California Infrastructure and Econ. Dev. Bank Rev.: | |||
| Bonds Series 2010 E, 1.75%, tender 6/1/22 (a) | 1,000 | 1,011 | |
| Series 2017: | |||
| 5% 10/1/35 | 5,000 | 6,067 | |
| 5% 10/1/36 | 5,000 | 6,053 | |
| California Muni. Fin. Auth. (Orange County Civic Ctr. Infrastructure Impt. Prog.) Series 2017 A: | |||
| 5% 6/1/32 | 2,750 | 3,351 | |
| 5% 6/1/33 | 2,320 | 2,814 | |
| 5% 6/1/34 | 5,290 | 6,371 | |
| 5% 6/1/35 | 5,110 | 6,120 | |
| 5% 6/1/36 | 5,830 | 6,949 | |
| 5% 6/1/37 | 3,000 | 3,562 | |
| California Muni. Fin. Auth. Ctfs. of Prtn. (Cmnty. Hospitals of Central California Obligated Group Proj.) Series 2009, 5.5% 2/1/39 (Pre-Refunded to 2/1/19 @ 100) | 5,000 | 5,327 | |
| California Muni. Fin. Auth. Rev.: | |||
| ( Channing House Proj.) Series 2017 A, 4% 5/15/32 | 1,000 | 1,089 | |
| ( Univ. of Verne Proj.) Series 2017 A: | |||
| 5% 6/1/27 | 1,000 | 1,223 | |
| 5% 6/1/33 | 1,000 | 1,174 | |
| (Biola Univeristy, Inc. Proj.) Series 2017: | |||
| 5% 10/1/25 | 305 | 366 | |
| 5% 10/1/28 | 1,040 | 1,252 | |
| 5% 10/1/30 | 1,000 | 1,187 | |
| 5% 10/1/32 | 1,000 | 1,173 | |
| 5% 10/1/34 | 1,000 | 1,172 | |
| (Biola Univeristy, Inc.Proj.) Series 2017, 5% 10/1/26 | 715 | 864 | |
| (Channing House Proj.) Series 2017 A: | |||
| 4% 5/15/29 | 2,000 | 2,231 | |
| 4% 5/15/30 | 1,575 | 1,744 | |
| 4% 5/15/31 | 2,150 | 2,352 | |
| 5% 5/15/33 | 895 | 1,065 | |
| 5% 5/15/34 | 1,000 | 1,185 | |
| (Eisenhower Med. Ctr. Proj.) Series 2010 A, 5% 7/1/19 (Escrowed to Maturity) | 300 | 322 | |
| (Institute On Aging Proj.) Series 2017: | |||
| 5% 8/15/27 | 230 | 287 | |
| 5% 8/15/29 | 245 | 300 | |
| 5% 8/15/30 | 225 | 273 | |
| 5% 8/15/33 | 750 | 896 | |
| 5% 8/15/36 | 1,435 | 1,695 | |
| (Univ. of Verne Proj.) Series 2017 A, 5% 6/1/32 | 1,000 | 1,180 | |
| (Univ. of Verne Proj.) Series 2017 A: | |||
| 5% 6/1/28 | 1,000 | 1,210 | |
| 5% 6/1/30 | 1,000 | 1,192 | |
| 5% 6/1/35 | 1,000 | 1,164 | |
| Series 2016 A, 5% 11/1/36 (b) | 1,000 | 1,082 | |
| Series 2017 A: | |||
| 5% 7/1/29 | 575 | 685 | |
| 5% 7/1/31 | 1,000 | 1,176 | |
| 5% 7/1/32 | 1,400 | 1,639 | |
| 5% 7/1/33 | 1,000 | 1,165 | |
| 5% 7/1/34 | 1,395 | 1,618 | |
| 5% 7/1/35 | 1,500 | 1,733 | |
| 5% 7/1/36 | 1,500 | 1,729 | |
| 5% 7/1/37 | 1,250 | 1,436 | |
| Series 2017 B: | |||
| 5% 7/1/28 | 1,250 | 1,501 | |
| 5% 7/1/29 | 1,300 | 1,549 | |
| 5% 7/1/30 | 750 | 887 | |
| 5% 7/1/31 | 800 | 941 | |
| 5% 7/1/32 | 1,385 | 1,622 | |
| California Poll. Cont. Fing. Auth. Solid Waste Disp. Rev.: | |||
| (U.S.A. Waste Svcs., Inc. Proj.) Series 1998 A, 1.5% 6/1/18 (c) | 1,920 | 1,928 | |
| Bonds: | |||
| (Republic Svcs., Inc. Proj.) Series B, 5.25%, tender 12/1/17 (a)(c) | 3,250 | 3,280 | |
| (Waste Mgmt., Inc. Proj.) Series 2002 C, 3.25%, tender 6/3/24 (a)(c) | 7,500 | 7,933 | |
| California Pub. Fin. Auth. Univ. H (Claremont Colleges Proj.) Series 2017 A: | |||
| 5% 7/1/27 (b) | 800 | 922 | |
| 5% 7/1/32 (b) | 750 | 836 | |
| 5% 7/1/37 (b) | 2,100 | 2,299 | |
| California Pub. Works Board Lease Rev.: | |||
| (Coalinga State Hosp. Proj.) Series 2013 E, 5% 6/1/29 | 7,000 | 8,166 | |
| (Dept. of Corrections & Rehab. Proj.) Series 2011 C: | |||
| 5% 10/1/27 | 9,530 | 10,878 | |
| 5.25% 10/1/24 | 4,170 | 4,837 | |
| 5.25% 10/1/25 | 2,875 | 3,330 | |
| 5.75% 10/1/31 | 4,000 | 4,667 | |
| (Dept. of Corrections State Prison Proj.) Series A, 5% 12/1/19 (AMBAC Insured) | 2,285 | 2,404 | |
| (Porterville Developmental Ctr. Hsg. Expansion and Recreation Complex Proj.) Series 2009 C, 6.25% 4/1/34 (Pre-Refunded to 4/1/19 @ 100) | 5,900 | 6,404 | |
| (Univ. Proj.) Series 2012 D: | |||
| 5% 9/1/24 (Pre-Refunded to 9/1/22 @ 100) | 1,700 | 2,022 | |
| 5% 9/1/24 (Pre-Refunded to 9/1/22 @ 100) | 1,865 | 2,218 | |
| (Various Cap. Projs.): | |||
| Series 2012 A: | |||
| 5% 4/1/24 | 1,000 | 1,164 | |
| 5% 4/1/25 | 5,300 | 6,154 | |
| Series 2012 G, 5% 11/1/25 | 2,500 | 2,953 | |
| (Various Judicial Council Projs.) Series 2011 D: | |||
| 5% 12/1/22 | 3,000 | 3,478 | |
| 5% 12/1/23 | 2,800 | 3,236 | |
| Series 2009 G1, 5.75% 10/1/30 (Pre-Refunded to 10/1/19 @ 100) | 1,800 | 1,982 | |
| Series 2009 I: | |||
| 5.5% 11/1/23 (Pre-Refunded to 11/1/19 @ 100) | 1,535 | 1,688 | |
| 6.125% 11/1/29 (Pre-Refunded to 11/1/19 @ 100) | 1,200 | 1,336 | |
| 6.25% 11/1/21 (Pre-Refunded to 11/1/19 @ 100) | 2,000 | 2,232 | |
| 6.375% 11/1/34 (Pre-Refunded to 11/1/19 @ 100) | 3,000 | 3,356 | |
| California Statewide Cmntys. Dev. Auth. Series 2016: | |||
| 5% 5/15/34 | 1,250 | 1,447 | |
| 5% 5/15/35 | 1,750 | 2,019 | |
| 5% 5/15/40 | 2,250 | 2,575 | |
| California Statewide Cmntys. Dev. Auth. Rev.: | |||
| (Adventist Health Sys. Proj.) Series 2007 B, 5% 3/1/37 (Pre-Refunded to 5/23/18 @ 100) | 4,970 | 5,120 | |
| (Cottage Health Sys. Obligated Group Proj.) Series 2010, 5.25% 11/1/30 | 3,000 | 3,324 | |
| (Enloe Health Sys. Proj.) Series 2008 B, 5% 8/15/19 (Pre-Refunded to 8/15/18 @ 100) | 50 | 52 | |
| (Sutter Health Proj.) Series 2011 A, 6% 8/15/42 | 2,120 | 2,398 | |
| Series 2016: | |||
| 5% 10/1/26 | 1,125 | 1,336 | |
| 5% 10/1/27 | 2,360 | 2,775 | |
| 5% 10/1/28 | 1,230 | 1,434 | |
| 5% 10/1/29 | 675 | 780 | |
| 5% 10/1/30 | 1,100 | 1,264 | |
| 5% 10/1/33 | 1,850 | 2,099 | |
| 5.375% 6/1/26 (Pre-Refunded to 6/1/21 @ 100) | 2,520 | 2,922 | |
| 6% 6/1/33 (Pre-Refunded to 6/1/21 @ 100) | 3,020 | 3,571 | |
| Carlsbad Unified School District Series 2009 B: | |||
| 0% 5/1/18 | 1,335 | 1,327 | |
| 0% 5/1/19 | 1,000 | 984 | |
| 0% 5/1/34 (d) | 5,300 | 5,757 | |
| Chino Basin Reg'l. Fing. Auth. Rev. (Inland Empire Util. Agcy. Proj.) Series 2008 A: | |||
| 5% 11/1/24 (Pre-Refunded to 11/1/17 @ 100) | 1,000 | 1,007 | |
| 5% 11/1/25 (Pre-Refunded to 11/1/17 @ 100) | 3,820 | 3,845 | |
| Chula Vista Ind. Dev. Rev. (San Diego Gas & Elec. Co. Proj.) Series B, 5.875% 2/15/34 | 5,000 | 5,397 | |
| Contra Costa Trans. Auth. Sales Tax Rev. Series 2012 B: | |||
| 5% 3/1/23 (Pre-Refunded to 3/1/20 @ 100) | 1,500 | 1,653 | |
| 5% 3/1/24 (Pre-Refunded to 3/1/20 @ 100) | 2,000 | 2,204 | |
| 5% 3/1/25 (Pre-Refunded to 3/1/20 @ 100) | 2,000 | 2,204 | |
| Corona-Norco Unified School District Series 2013 A: | |||
| 5% 9/1/25 | 645 | 737 | |
| 5% 9/1/28 | 1,250 | 1,408 | |
| 5% 9/1/32 | 1,125 | 1,255 | |
| 5% 9/1/35 | 585 | 648 | |
| Ctr. Unified School District Series 1997 C: | |||
| 0% 9/1/18 (Nat'l. Pub. Fin. Guarantee Corp. Insured) | 2,000 | 1,974 | |
| 0% 9/1/20 (Nat'l. Pub. Fin. Guarantee Corp. Insured) | 2,010 | 1,912 | |
| Davis Spl. Tax Rev. Series 2007: | |||
| 5% 9/1/18 (AMBAC Insured) | 835 | 835 | |
| 5% 9/1/20 (AMBAC Insured) | 925 | 925 | |
| 5% 9/1/22 (AMBAC Insured) | 1,020 | 1,020 | |
| Desert Sands Unified School District Series 2013 B: | |||
| 5% 6/1/27 | 2,000 | 2,370 | |
| 5% 6/1/28 | 2,000 | 2,358 | |
| 5% 6/1/29 | 1,650 | 1,935 | |
| 5% 6/1/30 | 2,500 | 2,918 | |
| 5% 6/1/31 | 1,750 | 2,032 | |
| East Bay Muni. Util. District Wastewtr. Sys. Rev.: | |||
| Series 2017 A: | |||
| 5% 6/1/32 | 2,000 | 2,478 | |
| 5% 6/1/34 | 3,800 | 4,661 | |
| Series 2017 B: | |||
| 5% 6/1/33 | 3,060 | 3,771 | |
| 5% 6/1/34 | 2,615 | 3,207 | |
| El Dorado County Gen. Oblig. 5% 9/1/23 | 1,360 | 1,589 | |
| El Dorado Irrigation District Rev. Ctfs. of Prtn. Series 2016 B: | |||
| 5% 3/1/28 | 3,125 | 3,812 | |
| 5% 3/1/29 | 8,125 | 9,821 | |
| Elk Grove Fin. Auth. Spl. Tax Rev.: | |||
| (Elk Grove Cfd Laguna Ridge Proj.) Series 2016, 5% 9/1/41 | 4,500 | 5,050 | |
| Series 2015: | |||
| 5% 9/1/27 | 1,940 | 2,336 | |
| 5% 9/1/28 | 4,125 | 4,923 | |
| 5% 9/1/29 | 4,325 | 5,121 | |
| 5% 9/1/30 (Build America Mutual Assurance Insured) | 1,135 | 1,337 | |
| 5% 9/1/31 (Build America Mutual Assurance Insured) | 1,750 | 2,048 | |
| 5% 9/1/32 (Build America Mutual Assurance Insured) | 1,615 | 1,881 | |
| Series 2016: | |||
| 5% 9/1/27 | 1,875 | 2,220 | |
| 5% 9/1/28 | 1,500 | 1,761 | |
| 5% 9/1/29 | 2,000 | 2,328 | |
| 5% 9/1/30 | 1,720 | 1,994 | |
| 5% 9/1/31 | 2,500 | 2,883 | |
| Elk Grove Unified School District Spl. Tax (Cmnty. Facilities District #1 Proj.) 6.5% 12/1/24 (AMBAC Insured) | 4,025 | 4,742 | |
| Empire Union School District Spl. Tax (Cmnty. Facilities District No. 1987 Proj.) Series 2002 A: | |||
| 0% 10/1/24 (AMBAC Insured) | 1,665 | 1,387 | |
| 0% 10/1/25 (AMBAC Insured) | 1,665 | 1,330 | |
| Encinitas Union School District Series 1996, 0% 8/1/21 (Nat'l. Pub. Fin. Guarantee Corp. Insured) | 1,000 | 954 | |
| Escondido Union High School District Series 2008 A: | |||
| 0% 8/1/33 (Assured Guaranty Corp. Insured) | 5,655 | 3,345 | |
| 0% 8/1/34 (Assured Guaranty Corp. Insured) | 3,500 | 1,973 | |
| Folsom Cordova Unified School District School Facilities Impt. District #1 Series A, 0% 10/1/20 (Nat'l. Pub. Fin. Guarantee Corp. Insured) | 1,315 | 1,256 | |
| Foothill-De Anza Cmnty. College District: | |||
| Series 1999 A: | |||
| 0% 8/1/19 (Nat'l. Pub. Fin. Guarantee Corp. Insured) | 5,365 | 5,276 | |
| 0% 8/1/20 (Nat'l. Pub. Fin. Guarantee Corp. Insured) | 6,425 | 6,240 | |
| Series 1999 B, 0% 8/1/24 (Nat'l. Pub. Fin. Guarantee Corp. Insured) | 5,000 | 4,446 | |
| Gilroy School Facilities Fing. Series 2013 A, 5% 8/1/46 | 10,000 | 11,189 | |
| Golden State Tobacco Securitization Corp. Tobacco Settlement Rev.: | |||
| Series 2013 A, 5% 6/1/30 | 6,000 | 6,988 | |
| Series 2017 A1: | |||
| 5% 6/1/21 | 2,000 | 2,273 | |
| 5% 6/1/22 | 2,000 | 2,320 | |
| 5% 6/1/23 | 2,000 | 2,354 | |
| 5% 6/1/24 | 3,000 | 3,564 | |
| 5% 6/1/25 | 3,000 | 3,590 | |
| 5% 6/1/26 | 3,000 | 3,611 | |
| 5% 6/1/27 | 5,760 | 6,959 | |
| 5% 6/1/28 | 7,500 | 8,961 | |
| Series A, 0% 6/1/24 (AMBAC Insured) | 8,030 | 7,023 | |
| Golden West Schools Fing. Auth. Rev. Series A, 0% 8/1/18 (Nat'l. Pub. Fin. Guarantee Corp. Insured) | 2,750 | 2,716 | |
| Irvine Reassessment District 12-1 Ltd. Oblig.: | |||
| 4% 9/2/21 | 1,750 | 1,915 | |
| 5% 9/2/23 | 1,000 | 1,149 | |
| 5% 9/2/24 | 825 | 960 | |
| 5% 9/2/25 | 500 | 565 | |
| 5% 9/2/26 | 800 | 916 | |
| La Quinta Redev. Agcy.: | |||
| (La Quinta Redev. Proj. Areas No. 1 and 2) Series 2014 A: | |||
| 5% 9/1/24 | 1,200 | 1,455 | |
| 5% 9/1/25 | 1,700 | 2,069 | |
| 5% 9/1/26 | 1,860 | 2,255 | |
| 5% 9/1/27 | 1,725 | 2,083 | |
| 5% 9/1/28 | 1,000 | 1,203 | |
| 5% 9/1/29 | 1,250 | 1,501 | |
| Series 2013 A: | |||
| 5% 9/1/24 | 3,830 | 4,566 | |
| 5% 9/1/25 | 4,085 | 4,857 | |
| 5% 9/1/26 | 4,105 | 4,868 | |
| Ladera Ranch Cmnty. Facilities District 2004-1 Series 2014 A: | |||
| 5% 8/15/27 | 1,765 | 1,957 | |
| 5% 8/15/28 | 1,960 | 2,164 | |
| 5% 8/15/29 | 4,225 | 4,645 | |
| 5% 8/15/30 | 4,555 | 4,994 | |
| Laguna Beach Unified School District Gen. Oblig. (Election of 2001 Proj.): | |||
| 5% 8/1/21 | 405 | 452 | |
| 5% 8/1/22 | 450 | 502 | |
| 5% 8/1/23 | 485 | 541 | |
| 5% 8/1/24 | 1,000 | 1,115 | |
| 5% 8/1/26 | 1,370 | 1,526 | |
| 5% 8/1/28 | 760 | 846 | |
| Loma Linda Hosp. Rev. (Loma Linda Univ. Med. Ctr. Proj.) Series 2008 A, 8.25% 12/1/38 (Pre-Refunded to 12/1/17 @ 100) | 4,400 | 4,477 | |
| Long Beach Bond Fin. Auth. Lease Series 2012 A: | |||
| 5% 8/1/24 | 1,000 | 1,163 | |
| 5% 8/1/25 | 1,000 | 1,159 | |
| 5% 8/1/26 | 1,000 | 1,155 | |
| 5% 8/1/27 | 1,000 | 1,152 | |
| 5% 8/1/28 | 1,000 | 1,149 | |
| 5% 8/1/29 | 1,000 | 1,147 | |
| 5% 8/1/30 | 1,000 | 1,145 | |
| 5% 8/1/31 | 1,000 | 1,144 | |
| Long Beach Bond Fin. Auth. Natural Gas Purchase Rev. Series 2007 A, 5.25% 11/15/21 | 3,790 | 4,312 | |
| Long Beach Cmnty. College: | |||
| 0% 6/1/28 (Escrowed to Maturity) | 530 | 424 | |
| 0% 6/1/28 (FSA Insured) | 2,995 | 2,208 | |
| 0% 6/1/31 (Escrowed to Maturity) | 1,465 | 1,046 | |
| 0% 6/1/31 (FSA Insured) | 8,285 | 5,357 | |
| Long Beach Hbr. Rev.: | |||
| Series 2010 B, 5% 5/15/22 | 2,735 | 3,025 | |
| Series 2017 A: | |||
| 5% 5/15/26 (c) | 1,110 | 1,374 | |
| 5% 5/15/27 (c) | 2,000 | 2,498 | |
| 5% 5/15/28 (c) | 3,390 | 4,194 | |
| 5% 5/15/29 (c) | 1,350 | 1,657 | |
| 5% 5/15/30 (c) | 1,300 | 1,584 | |
| 5% 5/15/31 (c) | 1,200 | 1,453 | |
| 5% 5/15/32 (c) | 1,760 | 2,121 | |
| 5% 5/15/33 (c) | 1,350 | 1,620 | |
| 5% 5/15/34 (c) | 1,650 | 1,970 | |
| 5% 5/15/35 (c) | 2,500 | 2,973 | |
| 5% 5/15/36 (c) | 3,000 | 3,560 | |
| 5% 5/15/37 (c) | 2,755 | 3,261 | |
| Long Beach Unified School District Series 2009: | |||
| 5.25% 8/1/33 | 410 | 442 | |
| 5.75% 8/1/33 | 170 | 185 | |
| 5.75% 8/1/33 (Pre-Refunded to 8/1/19 @ 100) | 2,630 | 2,875 | |
| Los Angeles Cmnty. College District: | |||
| Series 2008 A, 6% 8/1/33 (Pre-Refunded to 8/1/19 @ 100) | 10,025 | 10,997 | |
| Series 2009 A, 5.5% 8/1/29 (Pre-Refunded to 8/1/19 @ 100) | 1,000 | 1,088 | |
| Series 2010 C, 5.25% 8/1/39 (Pre-Refunded to 8/1/20 @ 100) | 1,300 | 1,460 | |
| Series 2015 A, 5% 8/1/29 | 7,000 | 8,519 | |
| Los Angeles Cmnty. Redev. Agcy. Lease Rev. (Vermont Manchester Social Svcs. Proj.) Series 2005, 5% 9/1/21 (AMBAC Insured) | 2,805 | 2,813 | |
| Los Angeles County Ctfs. of Prtn.: | |||
| (Disney Concert Hall Parking Garage Proj.) 5% 3/1/23 | 1,600 | 1,914 | |
| (Disney Parking Proj.): | |||
| 0% 3/1/18 | 3,000 | 2,987 | |
| 0% 3/1/19 | 3,200 | 3,151 | |
| 0% 3/1/20 | 1,000 | 971 | |
| Los Angeles County Reg'l. Fin. Auth. (MonteCedro, Inc. Proj.) Series 2014 A, 5% 11/15/44 | 2,250 | 2,566 | |
| Los Angeles Dept. Arpt. Rev.: | |||
| Series 2015 A: | |||
| 5% 5/15/21 (c) | 1,000 | 1,137 | |
| 5% 5/15/24 (c) | 795 | 962 | |
| 5% 5/15/25 (c) | 2,250 | 2,758 | |
| 5% 5/15/26 (c) | 1,705 | 2,067 | |
| 5% 5/15/27 (c) | 1,250 | 1,501 | |
| 5% 5/15/28 (c) | 1,250 | 1,490 | |
| 5% 5/15/29 (c) | 1,575 | 1,860 | |
| 5% 5/15/30 (c) | 1,400 | 1,643 | |
| Series 2015 D: | |||
| 5% 5/15/28 (c) | 1,950 | 2,324 | |
| 5% 5/15/29 (c) | 2,550 | 3,011 | |
| 5% 5/15/30 (c) | 2,000 | 2,348 | |
| 5% 5/15/31 (c) | 2,540 | 2,966 | |
| 5% 5/15/41 (c) | 3,240 | 3,687 | |
| Series 2016 A: | |||
| 5% 5/15/29 (c) | 2,500 | 3,005 | |
| 5% 5/15/30 (c) | 2,500 | 2,985 | |
| 5% 5/15/31 (c) | 3,000 | 3,562 | |
| 5% 5/15/32 (c) | 3,500 | 4,138 | |
| 5% 5/15/33 (c) | 2,000 | 2,354 | |
| 5% 5/15/35 (c) | 2,000 | 2,336 | |
| 5% 5/15/42 (c) | 7,500 | 8,640 | |
| Series 2016 B: | |||
| 5% 5/15/22 (c) | 1,000 | 1,165 | |
| 5% 5/15/26 (c) | 1,600 | 1,978 | |
| 5% 5/15/27 (c) | 1,000 | 1,223 | |
| 5% 5/15/36 (c) | 3,600 | 4,195 | |
| 5% 5/15/41 (c) | 3,750 | 4,326 | |
| Series 2017 B: | |||
| 5% 5/15/23 (c) | 1,000 | 1,189 | |
| 5% 5/15/24 (c) | 1,500 | 1,811 | |
| 5% 5/15/25 (c) | 1,750 | 2,138 | |
| Los Angeles Dept. of Wtr. & Pwr. Elec. Plant Rev. 4.75% 10/15/20 (Escrowed to Maturity) | 125 | 125 | |
| Los Angeles Dept. of Wtr. & Pwr. Rev. Series 2015 A: | |||
| 5% 7/1/28 | 3,400 | 4,096 | |
| 5% 7/1/30 | 19,905 | 23,713 | |
| Los Angeles Dept. of Wtr. & Pwr. Wtrwks. Rev. Series 2016 B: | |||
| 5% 7/1/38 | 2,000 | 2,359 | |
| 5% 7/1/42 | 3,500 | 4,096 | |
| Los Angeles Hbr. Dept. Rev.: | |||
| Series 2016 A, 5% 8/1/24 (c) | 1,500 | 1,817 | |
| 7.6% 10/1/18 (Escrowed to Maturity) | 3,010 | 3,118 | |
| Los Angeles Muni. Impt. Corp. Lease Rev.: | |||
| Series 2012 C, 5% 3/1/26 | 3,000 | 3,451 | |
| Series 2014 A: | |||
| 5% 5/1/24 | 325 | 395 | |
| 5% 5/1/25 | 540 | 654 | |
| 5% 5/1/29 | 500 | 592 | |
| 5% 5/1/30 | 1,000 | 1,178 | |
| 5% 5/1/31 | 1,555 | 1,825 | |
| Series 2014 B: | |||
| 5% 5/1/24 | 200 | 243 | |
| 5% 5/1/25 | 225 | 271 | |
| 5% 5/1/29 | 500 | 592 | |
| 5% 5/1/30 | 400 | 471 | |
| 5% 5/1/31 | 400 | 469 | |
| Series 2016 A: | |||
| 5% 11/1/21 | 2,500 | 2,891 | |
| 5% 11/1/22 | 2,500 | 2,965 | |
| Series 2016 B, 5% 11/1/36 | 1,500 | 1,771 | |
| Los Angeles Wastewtr. Sys. Rev.: | |||
| Series 2009 A, 5.75% 6/1/34 (Pre-Refunded to 6/1/19 @ 100) | 4,455 | 4,832 | |
| Series 2012 B, 5% 6/1/28 | 4,800 | 5,608 | |
| M-S-R Pub. Pwr. Agcy. San Juan Proj. Rev. Series D, 6.75% 7/1/20 (Escrowed to Maturity) | 650 | 714 | |
| Madera County Ctfs. of Prtn. (Children's Hosp. Central California Proj.) Series 2010, 5.375% 3/15/36 | 3,425 | 3,685 | |
| Malibu Gen. Oblig. Ctfs. of Prtn. (City Hall Proj.) Series A: | |||
| 5% 7/1/32 (Pre-Refunded to 7/1/19 @ 100) | 500 | 537 | |
| 5% 7/1/39 (Pre-Refunded to 7/1/19 @ 100) | 4,095 | 4,402 | |
| Merced Union High School District Series A, 0% 8/1/22 (Nat'l. Pub. Fin. Guarantee Corp. Insured) | 1,100 | 1,005 | |
| Modesto Elementary School District, Stanislaus County Series A: | |||
| 0% 8/1/21 (Nat'l. Pub. Fin. Guarantee Corp. Insured) | 2,000 | 1,858 | |
| 0% 8/1/25 (Nat'l. Pub. Fin. Guarantee Corp. Insured) | 2,800 | 2,272 | |
| Modesto Gen. Oblig. Ctfs. of Prtn.: | |||
| (Cmnty. Ctr. Refing. Proj.) Series A, 5% 11/1/23 (AMBAC Insured) | 1,995 | 2,093 | |
| (Golf Course Refing. Proj.) Series B, 5% 11/1/23 (Nat'l. Pub. Fin. Guarantee Corp. Insured) | 1,290 | 1,356 | |
| Modesto Irrigation District Ctfs. of Prtn.: | |||
| (Cap. Impts. Proj.) Series 2004 B, 5.5% 7/1/35 (Pre-Refunded to 7/1/18 @ 100) | 3,800 | 3,945 | |
| (Geysers Geothermal Pwr. Proj.) Series 1986 A, 5% 10/1/17 (Escrowed to Maturity) | 2,560 | 2,568 | |
| Monrovia Unified School District Series B, 0% 8/1/33 (Nat'l. Pub. Fin. Guarantee Corp. Insured) | 2,500 | 1,463 | |
| Montebello Pub. Fing. Auth.: | |||
| (Montebello Home2 Suites by Hilton Hotel Proj.) Series 2016 A: | |||
| 5% 6/1/30 | 1,640 | 1,908 | |
| 5% 6/1/31 | 500 | 579 | |
| 5% 6/1/32 | 500 | 577 | |
| 5% 6/1/33 | 1,800 | 2,067 | |
| 5% 6/1/35 | 1,895 | 2,159 | |
| 5% 6/1/36 | 2,000 | 2,271 | |
| 5% 6/1/41 | 6,155 | 6,908 | |
| (Montebello Home2 Suties by HIlton Hotel Proj.) Series 2016 A, 5% 6/1/34 | 1,345 | 1,538 | |
| Monterey County Pub. Impt. Corp. Ctfs. of Prtn. 5% 8/1/18 (AMBAC Insured) | 3,580 | 3,590 | |
| Moreland School District Series 2003 B, 0% 8/1/27 (Nat'l. Pub. Fin. Guarantee Corp. Insured) | 1,485 | 1,123 | |
| Murrieta Pub. Fing. Auth. Spl. Tax Series 2012: | |||
| 5% 9/1/23 | 1,650 | 1,875 | |
| 5% 9/1/25 | 1,000 | 1,120 | |
| 5% 9/1/26 | 1,155 | 1,287 | |
| Murrieta Valley Unified School District: | |||
| Series 2008, 0% 9/1/32 (FSA Insured) | 5,000 | 2,960 | |
| Series 2015: | |||
| 4% 9/1/24 (FSA Insured) | 330 | 383 | |
| 5% 9/1/25 (FSA Insured) | 680 | 836 | |
| 5% 9/1/26 (FSA Insured) | 500 | 608 | |
| 5% 9/1/26 (FSA Insured) | 1,500 | 1,824 | |
| 5% 9/1/27 (FSA Insured) | 455 | 547 | |
| North City West School Facilities Fing. Auth. Spl. Tax: | |||
| Series 2005 B, 5.25% 9/1/23 (AMBAC Insured) | 1,530 | 1,872 | |
| Series 2006 C, 5% 9/1/17 (AMBAC Insured) | 2,735 | 2,735 | |
| Northern California Pwr. Agcy. Rev. (Hydroelectric #1 Proj.) Series 1986 A, 7.5% 7/1/23 (Pre-Refunded to 7/1/21 @ 100) | 3,390 | 3,961 | |
| Northern California Transmission Agcy. Rev.: | |||
| 5% 5/1/36 | 2,390 | 2,814 | |
| 5% 5/1/37 | 3,500 | 4,111 | |
| 5% 5/1/38 | 1,500 | 1,758 | |
| 5% 5/1/39 | 1,500 | 1,754 | |
| Norwalk-Mirada Unified School District Series 2009 D, 0% 8/1/33 (FSA Insured) | 5,700 | 3,387 | |
| Oakland Gen. Oblig.: | |||
| Series 2009 B, 6.25% 1/15/39 (Pre-Refunded to 1/15/19 @ 100) | 3,000 | 3,221 | |
| Series 2012, 5% 1/15/25 | 3,460 | 3,910 | |
| Series 2015 A: | |||
| 5% 1/15/28 | 1,225 | 1,488 | |
| 5% 1/15/29 | 1,650 | 1,992 | |
| 5% 1/15/30 | 1,665 | 2,004 | |
| 5% 1/15/31 | 1,520 | 1,818 | |
| Oakland Redev. Agcy. Sub Tax Allocation (Central District Redev. Proj.) Series 1993 A, 5% 9/1/21 (Escrowed to Maturity) | 670 | 717 | |
| Oakland Unified School District Alameda County: | |||
| Series 2009 A: | |||
| 6.5% 8/1/23 (Pre-Refunded to 8/1/19 @ 100) | 2,810 | 3,112 | |
| 6.5% 8/1/24 (Pre-Refunded to 8/1/19 @ 100) | 1,220 | 1,351 | |
| Series 2013: | |||
| 6.25% 8/1/30 (Pre-Refunded to 8/1/21 @ 100) | 1,500 | 1,802 | |
| 6.625% 8/1/38 (Pre-Refunded to 8/1/21 @ 100) | 5,000 | 6,078 | |
| Series 2015 A: | |||
| 5% 8/1/30 | 1,250 | 1,502 | |
| 5% 8/1/30 (FSA Insured) | 1,570 | 1,886 | |
| 5% 8/1/40 | 3,500 | 4,053 | |
| Oakland-Alameda County Coliseum Auth. (Oakland Coliseum Proj.) Series 2012 A: | |||
| 5% 2/1/22 | 2,935 | 3,424 | |
| 5% 2/1/23 | 5,000 | 5,819 | |
| Oceanside Unified School District Series A, 0% 8/1/31 (Assured Guaranty Corp. Insured) | 5,000 | 3,138 | |
| Orange County San District Waste Series 2016 A: | |||
| 5% 2/1/35 | 5,490 | 6,552 | |
| 5% 2/1/36 | 6,630 | 7,890 | |
| Palomar Health Rev. Series 2016: | |||
| 5% 11/1/36 | 7,970 | 8,913 | |
| 5% 11/1/39 | 5,250 | 5,767 | |
| Placer County Union High School District Series A: | |||
| 0% 8/1/20 (Nat'l. Pub. Fin. Guarantee Corp. Insured) | 2,000 | 1,913 | |
| 0% 8/1/21 (Nat'l. Pub. Fin. Guarantee Corp. Insured) | 1,000 | 938 | |
| Port of Oakland Rev.: | |||
| Series 2007 A, 5% 11/1/17 (Escrowed to Maturity) (c) | 2,185 | 2,199 | |
| Series 2011 O, 5% 5/1/22 (c) | 4,500 | 5,095 | |
| Series 2012 P: | |||
| 5% 5/1/22 (c) | 4,000 | 4,646 | |
| 5% 5/1/24 (c) | 2,820 | 3,269 | |
| Series 2017 D: | |||
| 5% 11/1/23 (c) | 5,100 | 6,089 | |
| 5% 11/1/24 (c) | 6,100 | 7,377 | |
| 5% 11/1/25 (c) | 2,585 | 3,157 | |
| 5% 11/1/26 (c) | 2,285 | 2,815 | |
| 5% 11/1/27 (c) | 4,000 | 4,956 | |
| 5% 11/1/28 (c) | 4,925 | 6,033 | |
| 5% 11/1/29 (c) | 3,850 | 4,670 | |
| Poway California Redev. Agcy. Successor Series A: | |||
| 5% 6/15/27 | 2,385 | 2,967 | |
| 5% 6/15/28 | 2,190 | 2,646 | |
| 5% 12/15/28 | 2,200 | 2,658 | |
| 5% 12/15/29 | 4,825 | 5,781 | |
| 5% 12/15/30 | 3,500 | 4,318 | |
| Poway Unified School District: | |||
| (District #2007-1 School Facilities Proj.) Series 2008 A, 0% 8/1/32 | 12,800 | 7,825 | |
| Series 2011, 0% 8/1/46 | 10,150 | 3,338 | |
| Series B: | |||
| 0% 8/1/33 | 4,840 | 2,831 | |
| 0% 8/1/35 | 9,000 | 4,802 | |
| 0% 8/1/37 | 6,325 | 3,085 | |
| 0% 8/1/41 | 5,130 | 2,086 | |
| Poway Unified School District Pub. Fing.: | |||
| 5% 9/15/26 | 935 | 1,081 | |
| 5% 9/1/30 | 1,500 | 1,715 | |
| 5% 9/1/31 | 1,265 | 1,440 | |
| 5% 9/1/32 | 1,800 | 2,038 | |
| 5% 9/1/33 | 2,750 | 3,101 | |
| 5% 9/1/34 | 1,230 | 1,380 | |
| 5% 9/1/35 | 1,585 | 1,772 | |
| 5% 9/1/36 | 3,410 | 3,804 | |
| Rancho Cucamonga Redev. Agcy. (Rancho Redev. Proj.): | |||
| 5% 9/1/25 (FSA Insured) | 1,740 | 2,103 | |
| 5% 9/1/26 (FSA Insured) | 1,350 | 1,615 | |
| 5% 9/1/27 (FSA Insured) | 1,700 | 2,021 | |
| 5% 9/1/28 (FSA Insured) | 1,700 | 2,009 | |
| 5% 9/1/29 (FSA Insured) | 1,850 | 2,172 | |
| Redwood City Elementary School District Series 1997, 0% 8/1/20 (Nat'l. Pub. Fin. Guarantee Corp. Insured) | 4,825 | 4,573 | |
| Riverside County Trans. Commission Toll Rev. Series 2013 A: | |||
| 5.75% 6/1/44 | 2,500 | 2,812 | |
| 5.75% 6/1/48 | 5,000 | 5,596 | |
| Riverside Swr. Rev. Series 2015 A: | |||
| 5% 8/1/26 | 1,710 | 2,097 | |
| 5% 8/1/27 | 1,725 | 2,093 | |
| 5% 8/1/28 | 1,935 | 2,328 | |
| 5% 8/1/29 | 2,330 | 2,780 | |
| Rocklin Unified School District Series 2002: | |||
| 0% 8/1/23 (Nat'l. Pub. Fin. Guarantee Corp. Insured) | 2,610 | 2,371 | |
| 0% 8/1/24 (Nat'l. Pub. Fin. Guarantee Corp. Insured) | 6,370 | 5,606 | |
| 0% 8/1/25 (Nat'l. Pub. Fin. Guarantee Corp. Insured) | 6,725 | 5,670 | |
| 0% 8/1/26 (Nat'l. Pub. Fin. Guarantee Corp. Insured) | 5,365 | 4,358 | |
| 0% 8/1/27 (Nat'l. Pub. Fin. Guarantee Corp. Insured) | 6,500 | 5,062 | |
| Roseville City School District Series 2002 A: | |||
| 0% 8/1/25 (Nat'l. Pub. Fin. Guarantee Corp. Insured) | 1,745 | 1,458 | |
| 0% 8/1/27 (Nat'l. Pub. Fin. Guarantee Corp. Insured) | 1,940 | 1,507 | |
| Sacramento City Fing. Auth. Lease Rev. Series 1993 A, 5.4% 11/1/20 (AMBAC Insured) | 1,395 | 1,488 | |
| Sacramento City Fing. Auth. Rev. Series A, 0% 12/1/26 (Nat'l. Pub. Fin. Guarantee Corp. Insured) | 6,000 | 4,566 | |
| Sacramento County Arpt. Sys. Rev. Series 2016 B: | |||
| 5% 7/1/35 | 790 | 929 | |
| 5% 7/1/36 | 2,000 | 2,345 | |
| 5% 7/1/41 | 6,430 | 7,447 | |
| Sacramento Muni. Util. District Elec. Rev.: | |||
| Series 2012 Y, 5% 8/15/27 | 2,800 | 3,303 | |
| Series 2013 A, 5% 8/15/41 | 2,810 | 3,237 | |
| Series 2016 D, 5% 8/15/28 | 2,500 | 3,234 | |
| San Bernardino County Ctfs. of Prtn.: | |||
| (Arrowhead Proj.) Series 2009 A, 5.25% 8/1/26 | 3,000 | 3,214 | |
| (Cap. Facilities Proj.) Series B, 6.875% 8/1/24 (Escrowed to Maturity) | 8,300 | 10,457 | |
| (Med. Ctr. Fing. Prog.) 5.5% 8/1/22 | 10,000 | 11,546 | |
| San Bernardino Unified School District Gen. Oblig. Series 2013 A: | |||
| 5% 8/1/23 (FSA Insured) | 1,100 | 1,329 | |
| 5% 8/1/24 (FSA Insured) | 1,250 | 1,499 | |
| 5% 8/1/25 (FSA Insured) | 2,000 | 2,388 | |
| 5% 8/1/27 (FSA Insured) | 2,000 | 2,361 | |
| San Diego Convention Ctr. Expansion Series 2012 A, 5% 4/15/24 | 3,300 | 3,859 | |
| San Diego County Reg'l. Arpt. Auth. Arpt. Rev.: | |||
| ( Sub Lien Proj.) Series 2017 B, 5% 7/1/36 (c) | 1,500 | 1,759 | |
| ( Sub Lien Proj.) Series A, 5% 7/1/26 (c) | 400 | 489 | |
| (Sub Lien Proj.) Series 2017 B: | |||
| 5% 7/1/22 (c) | 500 | 582 | |
| 5% 7/1/23 (c) | 280 | 332 | |
| 5% 7/1/24 (c) | 1,000 | 1,202 | |
| 5% 7/1/25 (c) | 515 | 625 | |
| 5% 7/1/27 (c) | 500 | 615 | |
| 5% 7/1/28 (c) | 1,000 | 1,225 | |
| 5% 7/1/29 (c) | 1,725 | 2,093 | |
| 5% 7/1/30 (c) | 2,915 | 3,509 | |
| 5% 7/1/31 (c) | 1,250 | 1,496 | |
| 5% 7/1/32 (c) | 1,300 | 1,549 | |
| 5% 7/1/33 (c) | 530 | 628 | |
| 5% 7/1/34 (c) | 1,000 | 1,180 | |
| 5% 7/1/37 (c) | 750 | 877 | |
| Series 2013 B, 5% 7/1/38 (c) | 7,000 | 7,950 | |
| Series 2017 B, 5% 7/1/21 (c) | 300 | 340 | |
| San Diego Pub. Facilities Fing. Auth. Lease Rev.: | |||
| (Cap. Impt. Proj.) Series 2012 A, 5% 4/15/23 | 1,710 | 1,994 | |
| Series 2015 A, 5% 10/15/44 | 4,005 | 4,565 | |
| Series 2016: | |||
| 5% 10/15/29 | 2,000 | 2,391 | |
| 5% 10/15/30 | 1,000 | 1,185 | |
| 5% 10/15/31 | 650 | 765 | |
| San Diego Pub. Facilities Fing. Auth. Wtr. Rev.: | |||
| Series 2009 B, 5.75% 8/1/35 (Pre-Refunded to 8/1/19 @ 100) | 3,455 | 3,774 | |
| Series 2016 B: | |||
| 5% 8/1/38 | 4,000 | 4,751 | |
| 5% 8/1/39 | 3,520 | 4,172 | |
| San Diego Unified School District: | |||
| (Convention Ctr. Proj.) Series 2012, 0% 7/1/45 | 4,770 | 1,607 | |
| Series 2008 C: | |||
| 0% 7/1/37 | 1,300 | 631 | |
| 0% 7/1/47 | 4,000 | 1,228 | |
| Series 2008 E, 0% 7/1/47 (d) | 8,700 | 5,466 | |
| San Francisco City & County Arpts. Commission Int'l. Arpt. Rev.: | |||
| (SFO Fuel Co. Proj.) Series 1997 A, 5.25% 1/1/18 (AMBAC Insured) (c) | 4,515 | 4,536 | |
| Second Series 32F, 5.25% 5/1/19 (Nat'l. Pub. Fin. Guarantee Corp. Insured) | 2,500 | 2,684 | |
| Series 2014 A: | |||
| 5% 5/1/40 (c) | 1,865 | 2,103 | |
| 5% 5/1/44 (c) | 8,390 | 9,416 | |
| Series 2016 B: | |||
| 5% 5/1/41 (c) | 11,695 | 13,341 | |
| 5% 5/1/46 (c) | 21,000 | 23,830 | |
| 5% 5/1/28 | 2,280 | 2,801 | |
| 5% 5/1/29 | 1,225 | 1,492 | |
| 5% 5/1/30 | 330 | 399 | |
| 5% 5/1/32 | 1,000 | 1,195 | |
| San Francisco City & County Redev. Fing. Auth. Tax Allocation Rev. (San Francisco Redev. Projs.) Series 2009 B: | |||
| 6.125% 8/1/28 | 1,000 | 1,091 | |
| 6.625% 8/1/39 | 1,000 | 1,099 | |
| San Francisco City & County Redev. Spl. Tax (Mission Bay South Pub. Impt. Proj.) Series 2013 A: | |||
| 5% 8/1/23 | 1,000 | 1,157 | |
| 5% 8/1/24 | 750 | 862 | |
| San Francisco Pub. Utils. Commission Wtr. Rev. Series 2016, 5% 11/1/31 | 3,500 | 4,325 | |
| San Jacinto Unified School District Series 2014: | |||
| 5% 8/1/25 (FSA Insured) | 875 | 1,061 | |
| 5% 8/1/26 (FSA Insured) | 1,055 | 1,272 | |
| 5% 8/1/27 (FSA Insured) | 1,250 | 1,498 | |
| 5% 8/1/28 (FSA Insured) | 1,250 | 1,489 | |
| 5% 8/1/29 (FSA Insured) | 3,150 | 3,730 | |
| 5% 8/1/30 (FSA Insured) | 4,070 | 4,790 | |
| 5% 8/1/31 (FSA Insured) | 650 | 761 | |
| San Joaquin County Ctfs. of Prtn. (County Administration Bldg. Proj.): | |||
| 5% 11/15/20 (Nat'l. Pub. Fin. Guarantee Corp. Insured) | 3,720 | 3,750 | |
| 5% 11/15/21 (Nat'l. Pub. Fin. Guarantee Corp. Insured) | 3,645 | 3,675 | |
| San Joaquin Hills Trans. Corridor Agcy. Toll Road Rev. Series 1993, 0% 1/1/27 (Escrowed to Maturity) | 4,000 | 3,317 | |
| San Jose Fing. Auth. Lease Rev. (Civic Ctr. Proj.) Series 2013 A: | |||
| 5% 6/1/25 | 3,500 | 4,154 | |
| 5% 6/1/26 | 3,000 | 3,551 | |
| San Jose Int'l. Arpt. Rev.: | |||
| Series 2014 A: | |||
| 5% 3/1/19 (c) | 500 | 530 | |
| 5% 3/1/20 (c) | 3,500 | 3,826 | |
| 5% 3/1/21 (c) | 2,750 | 3,094 | |
| Series 2017 A: | |||
| 5% 3/1/20 (c) | 6,370 | 6,963 | |
| 5% 3/1/21 (c) | 2,750 | 3,094 | |
| 5% 3/1/22 (c) | 1,750 | 2,019 | |
| 5% 3/1/27 (c) | 2,480 | 3,038 | |
| 5% 3/1/31 (c) | 1,100 | 1,306 | |
| 5% 3/1/32 (c) | 850 | 1,005 | |
| 5% 3/1/33 (c) | 1,095 | 1,288 | |
| 5% 3/1/34 (c) | 1,250 | 1,464 | |
| 5% 3/1/35 (c) | 2,250 | 2,625 | |
| 5% 3/1/36 (c) | 2,250 | 2,621 | |
| 5% 3/1/37 (c) | 2,250 | 2,615 | |
| 5% 3/1/41 (c) | 5,000 | 5,767 | |
| Series 2017 B: | |||
| 5% 3/1/29 | 200 | 245 | |
| 5% 3/1/30 | 250 | 304 | |
| 5% 3/1/32 | 235 | 282 | |
| 5% 3/1/33 | 250 | 299 | |
| 5% 3/1/34 | 500 | 595 | |
| 5% 3/1/37 | 3,000 | 3,541 | |
| San Marcos Redev. Agcy. Successor Series 2015 A: | |||
| 5% 10/1/27 | 1,650 | 2,001 | |
| 5% 10/1/29 | 675 | 806 | |
| 5% 10/1/30 | 2,000 | 2,376 | |
| 5% 10/1/31 | 2,310 | 2,733 | |
| San Marcos Unified School District: | |||
| Series 2010 A, 5% 8/1/38 | 5,000 | 5,651 | |
| Series 2010 B, 0% 8/1/47 | 9,000 | 2,759 | |
| San Mateo County Cmnty. College District Series A, 0% 9/1/18 (Nat'l. Pub. Fin. Guarantee Corp. Insured) | 3,000 | 2,976 | |
| San Mateo County Joint Powers Fing. Auth. (Cap. Projs.) Series 2009 A, 5.25% 7/15/24 | 5,280 | 5,816 | |
| San Mateo Unified School District (Election of 2000 Proj.) Series B: | |||
| 0% 9/1/23 (Nat'l. Pub. Fin. Guarantee Corp. Insured) | 2,000 | 1,819 | |
| 0% 9/1/25 (Nat'l. Pub. Fin. Guarantee Corp. Insured) | 1,490 | 1,268 | |
| 0% 9/1/26 (Nat'l. Pub. Fin. Guarantee Corp. Insured) | 1,500 | 1,231 | |
| San Pablo Redev. Agcy. Series 2014 A: | |||
| 5% 6/15/25 (FSA Insured) | 825 | 988 | |
| 5% 6/15/26 (FSA Insured) | 860 | 1,020 | |
| 5% 6/15/27 (FSA Insured) | 1,770 | 2,080 | |
| 5% 6/15/28 (FSA Insured) | 1,865 | 2,177 | |
| 5% 6/15/29 (FSA Insured) | 1,780 | 2,064 | |
| 5% 6/15/30 (FSA Insured) | 1,150 | 1,325 | |
| 5% 6/15/31 (FSA Insured) | 1,000 | 1,146 | |
| Sanger Unified School District 5.6% 8/1/23 (Nat'l. Pub. Fin. Guarantee Corp. Insured) | 1,885 | 2,049 | |
| Santa Clara Elec. Rev. Series 2011 A, 6% 7/1/31 | 3,000 | 3,521 | |
| Santa Monica Pub. Fin. Rev. (City Svcs. Bldg. Proj.) Series 2017: | |||
| 4% 7/1/39 (e) | 790 | 847 | |
| 5% 7/1/36 (e) | 2,380 | 2,855 | |
| 5% 7/1/37 (e) | 1,780 | 2,130 | |
| Santa Monica-Malibu Unified School District Series 2017 C: | |||
| 4% 7/1/36 | 435 | 474 | |
| 4% 7/1/37 | 475 | 516 | |
| 4% 7/1/38 | 450 | 488 | |
| 4% 7/1/39 | 550 | 595 | |
| 5% 7/1/30 | 250 | 312 | |
| 5% 7/1/31 | 350 | 434 | |
| 5% 7/1/32 | 255 | 314 | |
| 5% 7/1/33 | 250 | 307 | |
| 5% 7/1/34 | 315 | 385 | |
| 5% 7/1/35 | 400 | 487 | |
| Santa Rosa Wastewtr. Rev. Series 2002 B: | |||
| 0% 9/1/20 (AMBAC Insured) | 4,030 | 3,877 | |
| 0% 9/1/22 (AMBAC Insured) | 2,900 | 2,680 | |
| 0% 9/1/25 (AMBAC Insured) | 6,800 | 5,728 | |
| Shasta Union High School District: | |||
| Series 2002, 0% 8/1/26 (Nat'l. Pub. Fin. Guarantee Corp. Insured) | 1,000 | 796 | |
| Series 2003, 0% 5/1/28 (Nat'l. Pub. Fin. Guarantee Corp. Insured) | 3,340 | 2,481 | |
| South Orange County Pub. Fin. Auth. Series 2016: | |||
| 5% 4/1/21 | 1,000 | 1,138 | |
| 5% 4/1/34 | 2,000 | 2,348 | |
| 5% 4/1/36 | 3,000 | 3,490 | |
| South Orange County Pub. Fing. Auth. Spl. Tax Rev. Series 2014 A: | |||
| 5% 8/15/23 | 1,000 | 1,128 | |
| 5% 8/15/26 | 1,975 | 2,189 | |
| 5% 8/15/27 | 700 | 773 | |
| 5% 8/15/28 | 1,000 | 1,101 | |
| Southwestern Cmnty. College District Gen. Oblig. Series 2000, 0% 8/1/27 (Nat'l. Pub. Fin. Guarantee Corp. Insured) | 2,495 | 1,932 | |
| Stockton Unified School District Gen. Oblig.: | |||
| Series 2012 A: | |||
| 5% 8/1/24 (FSA Insured) | 300 | 367 | |
| 5% 8/1/25 (FSA Insured) | 750 | 904 | |
| 5% 8/1/27 (FSA Insured) | 265 | 316 | |
| 5% 8/1/28 (FSA Insured) | 510 | 604 | |
| 5% 8/1/38 (FSA Insured) | 2,500 | 2,860 | |
| 5% 8/1/42 (FSA Insured) | 4,650 | 5,304 | |
| 5% 7/1/23 (FSA Insured) | 1,270 | 1,496 | |
| 5% 7/1/24 (FSA Insured) | 1,350 | 1,587 | |
| 5% 7/1/25 (FSA Insured) | 1,060 | 1,243 | |
| 5% 7/1/26 (FSA Insured) | 1,110 | 1,299 | |
| 5% 7/1/27 (FSA Insured) | 1,065 | 1,244 | |
| 5% 1/1/29 (FSA Insured) | 600 | 698 | |
| Successor Agcy. To The Redev. Agcy. of Pittsburg (Los Medanos Cmnty. Dev. Proj.) Series 2016 A: | |||
| 5% 9/1/24 (FSA Insured) | 2,440 | 2,933 | |
| 5% 9/1/25 (FSA Insured) | 3,500 | 4,254 | |
| 5% 9/1/26 (FSA Insured) | 8,000 | 9,810 | |
| 5% 9/1/27 (FSA Insured) | 4,000 | 4,851 | |
| 5% 9/1/28 (FSA Insured) | 3,500 | 4,203 | |
| 5% 9/1/29 (FSA Insured) | 2,000 | 2,381 | |
| Sweetwater Union High School District 5% 9/1/21 | 4,705 | 5,381 | |
| Torrance Gen. Oblig. Rev. (Torrance Memorial Med. Ctr. Proj.) Series A, 5% 9/1/40 | 5,660 | 6,033 | |
| Tracy Operating Partnership Joint Powers Auth. Rev. 6.375% 10/1/38 (Assured Guaranty Corp. Insured) | 5,000 | 5,278 | |
| Tulare Swr. Rev. Series 2015: | |||
| 5% 11/15/24 (FSA Insured) | 820 | 995 | |
| 5% 11/15/25 (FSA Insured) | 800 | 980 | |
| 5% 11/15/26 (FSA Insured) | 965 | 1,171 | |
| 5% 11/15/27 (FSA Insured) | 1,500 | 1,802 | |
| 5% 11/15/28 (FSA Insured) | 1,165 | 1,389 | |
| Turlock Irrigation District Rev. Series 2011, 5.5% 1/1/41 | 10,000 | 11,304 | |
| Union Elementary School District Series A: | |||
| 0% 9/1/18 (Nat'l. Pub. Fin. Guarantee Corp. Insured) | 1,000 | 991 | |
| 0% 9/1/21 (Nat'l. Pub. Fin. Guarantee Corp. Insured) | 2,995 | 2,837 | |
| Univ. of California Regents Med. Ctr. Pool Rev. Series 2013 J, 5% 5/15/48 | 7,300 | 8,127 | |
| Univ. of California Revs.: | |||
| Bonds 1.4%, tender 5/15/21 (a) | 3,000 | 3,011 | |
| Series 2009 O, 5.75% 5/15/34 (Pre-Refunded to 5/15/19 @ 100) | 9,900 | 10,718 | |
| Series 2017 AV: | |||
| 5% 5/15/29 | 2,500 | 3,125 | |
| 5% 5/15/34 | 2,000 | 2,426 | |
| 5% 5/15/35 | 5,000 | 6,041 | |
| Vacaville Unified School District Series 2014 C: | |||
| 5% 8/1/23 (Build America Mutual Assurance Insured) | 930 | 1,125 | |
| 5% 8/1/26 (Build America Mutual Assurance Insured) | 1,295 | 1,584 | |
| 5% 8/1/30 | 6,710 | 8,026 | |
| Ventura County Pub. Fing. Auth. Series 2013 A: | |||
| 5% 11/1/24 | 1,000 | 1,175 | |
| 5% 11/1/25 | 1,000 | 1,172 | |
| 5% 11/1/26 | 1,000 | 1,171 | |
| Walnut Valley Unified School District Series D: | |||
| 0% 8/1/30 (Nat'l. Pub. Fin. Guarantee Corp. Insured) | 2,875 | 1,938 | |
| 0% 8/1/31 (Nat'l. Pub. Fin. Guarantee Corp. Insured) | 2,715 | 1,746 | |
| 0% 8/1/32 (Nat'l. Pub. Fin. Guarantee Corp. Insured) | 1,315 | 806 | |
| Washington Township Health Care District Gen. Oblig. Series 2013 B: | |||
| 5% 8/1/43 | 5,000 | 5,730 | |
| 5.5% 8/1/38 | 1,500 | 1,819 | |
| 5.5% 8/1/40 | 5,000 | 6,055 | |
| Washington Township Health Care District Rev.: | |||
| Series 2009 A: | |||
| 6% 7/1/29 | 3,000 | 3,189 | |
| 6.25% 7/1/39 | 7,015 | 7,457 | |
| Series 2010 A, 5.5% 7/1/38 | 3,100 | 3,356 | |
| West Contra Costa Unified School District: | |||
| Series 2012, 5% 8/1/32 | 8,265 | 9,555 | |
| Series 2014 A: | |||
| 5% 8/1/23 | 365 | 442 | |
| 5% 8/1/25 | 2,555 | 3,134 | |
| 5% 8/1/26 | 2,550 | 3,111 | |
| 5% 8/1/27 | 1,150 | 1,395 | |
| 5% 8/1/28 | 1,000 | 1,207 | |
| 5% 8/1/29 | 1,675 | 2,011 | |
| Western Riverside County Trust & Wastewtr. Fin. Auth.: | |||
| 5.5% 9/1/34 (Assured Guaranty Corp. Insured) | 1,750 | 1,893 | |
| 5.625% 9/1/39 (Assured Guaranty Corp. Insured) | 2,250 | 2,436 | |
| Yuba City Unified School District Series A, 0% 9/1/21 (Nat'l. Pub. Fin. Guarantee Corp. Insured) | 2,090 | 1,947 | |
| TOTAL CALIFORNIA | 1,914,066 | ||
| Guam - 1.3% | |||
| Guam Ed. Fing. Foundation Ctfs. of Prtn. Series 2008, 5.875% 10/1/18 (Escrowed to Maturity) | 825 | 846 | |
| Guam Gov't. Ltd. Oblig. Rev. Series 2016 A: | |||
| 5% 12/1/22 | 3,000 | 3,440 | |
| 5% 12/1/24 | 3,000 | 3,511 | |
| 5% 12/1/25 | 2,500 | 2,939 | |
| 5% 12/1/26 | 2,000 | 2,362 | |
| 5% 12/1/27 | 2,000 | 2,345 | |
| 5% 12/1/29 | 645 | 743 | |
| 5% 12/1/31 | 2,500 | 2,843 | |
| 5% 12/1/33 | 2,250 | 2,536 | |
| 5% 12/1/34 | 1,750 | 1,967 | |
| 5% 12/1/36 | 1,000 | 1,118 | |
| 5% 12/1/46 | 645 | 710 | |
| TOTAL GUAM | 25,360 | ||
| TOTAL MUNICIPAL BONDS | |||
| (Cost $1,811,848) | 1,939,426 | ||
| Municipal Notes - 0.7% | |||
| California - 0.7% | |||
| San Jose Int'l. Arpt. Rev. Participating VRDN Series 2017, 0.98% 9/7/17 (Liquidity Facility Citibank NA) (a)(c)(f) | |||
| (Cost $14,100) | 14,100 | 14,100 | |
| TOTAL INVESTMENT IN SECURITIES - 99.2% | |||
| (Cost $1,825,948) | 1,953,526 | ||
| NET OTHER ASSETS (LIABILITIES) - 0.8% | 14,901 | ||
| NET ASSETS - 100% | $1,968,427 |
Security Type Abbreviations
VRDN – VARIABLE RATE DEMAND NOTE (A debt instrument that is payable upon demand, either daily, weekly or monthly)
Legend
(a) Coupon rates for floating and adjustable rate securities reflect the rates in effect at period end.
(b) Security exempt from registration under Rule 144A of the Securities Act of 1933. These securities may be resold in transactions exempt from registration, normally to qualified institutional buyers. At the end of the period, the value of these securities amounted to $5,139,000 or 0.3% of net assets.
(c) Private activity obligations whose interest is subject to the federal alternative minimum tax for individuals.
(d) Security initially issued in zero coupon form which converts to coupon form at a specified rate and date. The rate shown is the rate at period end.
(e) Security or a portion of the security purchased on a delayed delivery or when-issued basis.
(f) Provides evidence of ownership in one or more underlying municipal bonds.
Investment Valuation
All investments are categorized as Level 2 under the Fair Value Hierarchy. The inputs or methodology used for valuing securities may not be an indication of the risk associated with investing in those securities. For more information on valuation inputs please refer to the Investment Valuation section in the accompanying Notes to Financial Statements.
Other Information
The distribution of municipal securities by revenue source, as a percentage of total Net Assets, is as follows (Unaudited):
| General Obligations | 35.3% |
| Transportation | 18.5% |
| Special Tax | 11.9% |
| Escrowed/Pre-Refunded | 8.5% |
| Health Care | 8.5% |
| Water & Sewer | 5.4% |
| Others* (Individually Less Than 5%) | 11.9% |
| 100.0% |
* Includes net other assets
See accompanying notes which are an integral part of the financial statements.
Financial Statements
Statement of Assets and Liabilities
| Amounts in thousands (except per-share amounts) | August 31, 2017 (Unaudited) | |
| Assets | ||
| Investment in securities, at value — See accompanying schedule: Unaffiliated issuers (cost $1,825,948) | $1,953,526 | |
| Cash | 2,446 | |
| Receivable for fund shares sold | 574 | |
| Interest receivable | 20,839 | |
| Other receivables | 6 | |
| Total assets | 1,977,391 | |
| Liabilities | ||
| Payable for investments purchased on a delayed delivery basis | $5,808 | |
| Payable for fund shares redeemed | 661 | |
| Distributions payable | 1,693 | |
| Accrued management fee | 583 | |
| Distribution and service plan fees payable | 35 | |
| Other affiliated payables | 158 | |
| Other payables and accrued expenses | 26 | |
| Total liabilities | 8,964 | |
| Net Assets | $1,968,427 | |
| Net Assets consist of: | ||
| Paid in capital | $1,835,779 | |
| Accumulated net investment loss | (176) | |
| Accumulated undistributed net realized gain (loss) on investments | 5,246 | |
| Net unrealized appreciation (depreciation) on investments | 127,578 | |
| Net Assets | $1,968,427 | |
| Calculation of Maximum Offering Price | ||
| Class A: | ||
| Net Asset Value and redemption price per share ($36,162 ÷ 2,762 shares) | $13.09 | |
| Maximum offering price per share (100/96.00 of $13.09) | $13.64 | |
| Class M: | ||
| Net Asset Value and redemption price per share ($7,860 ÷ 599 shares) | $13.12 | |
| Maximum offering price per share (100/96.00 of $13.12) | $13.67 | |
| Class C: | ||
| Net Asset Value and offering price per share ($31,081 ÷ 2,378 shares)(a) | $13.07 | |
| California Municipal Income: | ||
| Net Asset Value, offering price and redemption price per share ($1,829,768 ÷ 139,962 shares) | $13.07 | |
| Class I: | ||
| Net Asset Value, offering price and redemption price per share ($63,556 ÷ 4,851 shares) | $13.10 |
(a) Redemption price per share is equal to net asset value less any applicable contingent deferred sales charge.
See accompanying notes which are an integral part of the financial statements.
Statement of Operations
| Amounts in thousands | Six months ended August 31, 2017 (Unaudited) | |
| Investment Income | ||
| Interest | $33,627 | |
| Expenses | ||
| Management fee | $3,420 | |
| Transfer agent fees | 745 | |
| Distribution and service plan fees | 212 | |
| Accounting fees and expenses | 175 | |
| Custodian fees and expenses | 7 | |
| Independent trustees' fees and expenses | 4 | |
| Registration fees | 69 | |
| Audit | 28 | |
| Legal | 7 | |
| Miscellaneous | 10 | |
| Total expenses before reductions | 4,677 | |
| Expense reductions | (13) | 4,664 |
| Net investment income (loss) | 28,963 | |
| Realized and Unrealized Gain (Loss) | ||
| Net realized gain (loss) on: | ||
| Investment securities: | ||
| Unaffiliated issuers | 6,131 | |
| Total net realized gain (loss) | 6,131 | |
| Change in net unrealized appreciation (depreciation) on investment securities | 41,239 | |
| Net gain (loss) | 47,370 | |
| Net increase (decrease) in net assets resulting from operations | $76,333 |
See accompanying notes which are an integral part of the financial statements.
Statement of Changes in Net Assets
| Amounts in thousands | Six months ended August 31, 2017 (Unaudited) | Year ended February 28, 2017 |
| Increase (Decrease) in Net Assets | ||
| Operations | ||
| Net investment income (loss) | $28,963 | $62,517 |
| Net realized gain (loss) | 6,131 | 18,294 |
| Change in net unrealized appreciation (depreciation) | 41,239 | (93,757) |
| Net increase (decrease) in net assets resulting from operations | 76,333 | (12,946) |
| Distributions to shareholders from net investment income | (28,921) | (62,370) |
| Distributions to shareholders from net realized gain | (2,493) | – |
| Total distributions | (31,414) | (62,370) |
| Share transactions - net increase (decrease) | 49,295 | (46,002) |
| Redemption fees | – | 34 |
| Total increase (decrease) in net assets | 94,214 | (121,284) |
| Net Assets | ||
| Beginning of period | 1,874,213 | 1,995,497 |
| End of period | $1,968,427 | $1,874,213 |
| Other Information | ||
| Accumulated net investment loss end of period | $(176) | $(218) |
See accompanying notes which are an integral part of the financial statements.
Financial Highlights — Fidelity California Municipal Income Fund Class A
| Six months ended (Unaudited) August 31, | Years ended February 28, | |||||
| 2017 | 2017 | 2016 A | 2015 | 2014 | 2013 | |
| Selected Per–Share Data | ||||||
| Net asset value, beginning of period | $12.79 | $13.24 | $13.16 | $12.63 | $13.02 | $12.69 |
| Income from Investment Operations | ||||||
| Net investment income (loss)B | .176 | .363 | .390 | .397 | .437 | .436 |
| Net realized and unrealized gain (loss) | .316 | (.451) | .081 | .544 | (.396) | .324 |
| Total from investment operations | .492 | (.088) | .471 | .941 | .041 | .760 |
| Distributions from net investment income | (.175) | (.362) | (.390) | (.411) | (.431) | (.428) |
| Distributions from net realized gain | (.017) | – | (.001) | – | – | (.002) |
| Total distributions | (.192) | (.362) | (.391) | (.411) | (.431) | (.430) |
| Redemption fees added to paid in capitalB | – | –C | –C | –C | –C | –C |
| Net asset value, end of period | $13.09 | $12.79 | $13.24 | $13.16 | $12.63 | $13.02 |
| Total ReturnD,E,F | 3.88% | (.70)% | 3.66% | 7.55% | .40% | 6.08% |
| Ratios to Average Net AssetsG | ||||||
| Expenses before reductions | .80%H | .80% | .80% | .79% | .77% | .77% |
| Expenses net of fee waivers, if any | .80%H | .80% | .80% | .79% | .77% | .77% |
| Expenses net of all reductions | .80%H | .80% | .80% | .79% | .77% | .77% |
| Net investment income (loss) | 2.70%H | 2.75% | 2.99% | 3.07% | 3.47% | 3.38% |
| Supplemental Data | ||||||
| Net assets, end of period (in millions) | $36 | $47 | $48 | $42 | $34 | $56 |
| Portfolio turnover rate | 26%H | 25% | 11% | 10% | 13% | 9% |
A For the year ended February 29.
B Calculated based on average shares outstanding during the period.
C Amount represents less than $.0005 per share.
D Total returns for periods of less than one year are not annualized.
E Total returns would have been lower if certain expenses had not been reduced during the applicable periods shown.
F Total returns do not include the effect of the sales charges.
G Expense ratios reflect operating expenses of the class. Expenses before reductions do not reflect amounts reimbursed by the investment adviser or reductions from expense offset arrangements and do not represent the amount paid by the class during periods when reimbursements or reductions occur. Expenses net of fee waivers reflect expenses after reimbursement by the investment adviser but prior to reductions from expense offset arrangements. Expenses net of all reductions represent the net expenses paid by the class.
H Annualized
See accompanying notes which are an integral part of the financial statements.
Financial Highlights — Fidelity California Municipal Income Fund Class M
| Six months ended (Unaudited) August 31, | Years ended February 28, | |||||
| 2017 | 2017 | 2016 A | 2015 | 2014 | 2013 | |
| Selected Per–Share Data | ||||||
| Net asset value, beginning of period | $12.82 | $13.28 | $13.20 | $12.67 | $13.05 | $12.72 |
| Income from Investment Operations | ||||||
| Net investment income (loss)B | .179 | .368 | .399 | .408 | .442 | .440 |
| Net realized and unrealized gain (loss) | .316 | (.460) | .080 | .543 | (.385) | .323 |
| Total from investment operations | .495 | (.092) | .479 | .951 | .057 | .763 |
| Distributions from net investment income | (.178) | (.368) | (.398) | (.421) | (.437) | (.432) |
| Distributions from net realized gain | (.017) | – | (.001) | – | – | (.002) |
| Total distributions | (.195) | (.368) | (.399) | (.421) | (.437) | (.433)C |
| Redemption fees added to paid in capitalB | – | –D | –D | –D | –D | –D |
| Net asset value, end of period | $13.12 | $12.82 | $13.28 | $13.20 | $12.67 | $13.05 |
| Total ReturnE,F,G | 3.89% | (.74)% | 3.72% | 7.61% | .53% | 6.09% |
| Ratios to Average Net AssetsH | ||||||
| Expenses before reductions | .77%I | .76% | .74% | .72% | .71% | .75% |
| Expenses net of fee waivers, if any | .77%I | .76% | .74% | .72% | .71% | .75% |
| Expenses net of all reductions | .76%I | .76% | .74% | .72% | .71% | .74% |
| Net investment income (loss) | 2.73%I | 2.79% | 3.04% | 3.14% | 3.52% | 3.41% |
| Supplemental Data | ||||||
| Net assets, end of period (in millions) | $8 | $9 | $8 | $7 | $6 | $6 |
| Portfolio turnover rate | 26%I | 25% | 11% | 10% | 13% | 9% |
A For the year ended February 29.
B Calculated based on average shares outstanding during the period.
C Total distributions of $.433 per share is comprised of distributions from net investment income of $.4316 and distributions from net realized gain of $.0016 per share.
D Amount represents less than $.0005 per share.
E Total returns for periods of less than one year are not annualized.
F Total returns would have been lower if certain expenses had not been reduced during the applicable periods shown.
G Total returns do not include the effect of the sales charges.
H Expense ratios reflect operating expenses of the class. Expenses before reductions do not reflect amounts reimbursed by the investment adviser or reductions from expense offset arrangements and do not represent the amount paid by the class during periods when reimbursements or reductions occur. Expenses net of fee waivers reflect expenses after reimbursement by the investment adviser but prior to reductions from expense offset arrangements. Expenses net of all reductions represent the net expenses paid by the class.
I Annualized
See accompanying notes which are an integral part of the financial statements.
Financial Highlights — Fidelity California Municipal Income Fund Class C
| Six months ended (Unaudited) August 31, | Years ended February 28, | |||||
| 2017 | 2017 | 2016 A | 2015 | 2014 | 2013 | |
| Selected Per–Share Data | ||||||
| Net asset value, beginning of period | $12.77 | $13.22 | $13.14 | $12.61 | $13.00 | $12.67 |
| Income from Investment Operations | ||||||
| Net investment income (loss)B | .127 | .263 | .292 | .300 | .337 | .337 |
| Net realized and unrealized gain (loss) | .316 | (.451) | .080 | .544 | (.393) | .325 |
| Total from investment operations | .443 | (.188) | .372 | .844 | (.056) | .662 |
| Distributions from net investment income | (.126) | (.262) | (.291) | (.314) | (.334) | (.330) |
| Distributions from net realized gain | (.017) | – | (.001) | – | – | (.002) |
| Total distributions | (.143) | (.262) | (.292) | (.314) | (.334) | (.332) |
| Redemption fees added to paid in capitalB | – | –C | –C | –C | –C | –C |
| Net asset value, end of period | $13.07 | $12.77 | $13.22 | $13.14 | $12.61 | $13.00 |
| Total ReturnD,E,F | 3.49% | (1.46)% | 2.88% | 6.76% | (.37)% | 5.28% |
| Ratios to Average Net AssetsG | ||||||
| Expenses before reductions | 1.55%H | 1.55% | 1.55% | 1.54% | 1.54% | 1.54% |
| Expenses net of fee waivers, if any | 1.55%H | 1.55% | 1.55% | 1.54% | 1.54% | 1.54% |
| Expenses net of all reductions | 1.55%H | 1.55% | 1.55% | 1.54% | 1.54% | 1.53% |
| Net investment income (loss) | 1.95%H | 2.00% | 2.24% | 2.32% | 2.70% | 2.62% |
| Supplemental Data | ||||||
| Net assets, end of period (in millions) | $31 | $31 | $26 | $24 | $24 | $24 |
| Portfolio turnover rate | 26%H | 25% | 11% | 10% | 13% | 9% |
A For the year ended February 29.
B Calculated based on average shares outstanding during the period.
C Amount represents less than $.0005 per share..
D Total returns for periods of less than one year are not annualized.
E Total returns would have been lower if certain expenses had not been reduced during the applicable periods shown.
F Total returns do not include the effect of the contingent deferred sales charge.
G Expense ratios reflect operating expenses of the class. Expenses before reductions do not reflect amounts reimbursed by the investment adviser or reductions from expense offset arrangements and do not represent the amount paid by the class during periods when reimbursements or reductions occur. Expenses net of fee waivers reflect expenses after reimbursement by the investment adviser but prior to reductions from expense offset arrangements. Expenses net of all reductions represent the net expenses paid by the class.
H Annualized
See accompanying notes which are an integral part of the financial statements.
Financial Highlights — Fidelity California Municipal Income Fund
| Six months ended (Unaudited) August 31, | Years ended February 28, | |||||
| 2017 | 2017 | 2016 A | 2015 | 2014 | 2013 | |
| Selected Per–Share Data | ||||||
| Net asset value, beginning of period | $12.77 | $13.22 | $13.15 | $12.62 | $13.00 | $12.67 |
| Income from Investment Operations | ||||||
| Net investment income (loss)B | .198 | .407 | .434 | .440 | .473 | .475 |
| Net realized and unrealized gain (loss) | .316 | (.450) | .070 | .543 | (.384) | .325 |
| Total from investment operations | .514 | (.043) | .504 | .983 | .089 | .800 |
| Distributions from net investment income | (.197) | (.407) | (.433) | (.453) | (.469) | (.468) |
| Distributions from net realized gain | (.017) | – | (.001) | – | – | (.002) |
| Total distributions | (.214) | (.407) | (.434) | (.453) | (.469) | (.470) |
| Redemption fees added to paid in capitalB | – | –C | –C | –C | –C | –C |
| Net asset value, end of period | $13.07 | $12.77 | $13.22 | $13.15 | $12.62 | $13.00 |
| Total ReturnD,E | 4.06% | (.37)% | 3.93% | 7.91% | .78% | 6.41% |
| Ratios to Average Net AssetsF | ||||||
| Expenses before reductions | .46%G | .46% | .46% | .46% | .46% | .46% |
| Expenses net of fee waivers, if any | .46%G | .46% | .46% | .46% | .46% | .46% |
| Expenses net of all reductions | .46%G | .46% | .46% | .46% | .46% | .46% |
| Net investment income (loss) | 3.04%G | 3.09% | 3.33% | 3.40% | 3.77% | 3.69% |
| Supplemental Data | ||||||
| Net assets, end of period (in millions) | $1,830 | $1,728 | $1,866 | $1,813 | $1,629 | $1,855 |
| Portfolio turnover rate | 26%G | 25% | 11% | 10% | 13% | 9% |
A For the year ended February 29.
B Calculated based on average shares outstanding during the period.
C Amount represents less than $.0005 per share.
D Total returns for periods of less than one year are not annualized.
E Total returns would have been lower if certain expenses had not been reduced during the applicable periods shown.
F Expense ratios reflect operating expenses of the class. Expenses before reductions do not reflect amounts reimbursed by the investment adviser or reductions from expense offset arrangements and do not represent the amount paid by the class during periods when reimbursements or reductions occur. Expenses net of fee waivers reflect expenses after reimbursement by the investment adviser but prior to reductions from expense offset arrangements. Expenses net of all reductions represent the net expenses paid by the class.
G Annualized
See accompanying notes which are an integral part of the financial statements.
Financial Highlights — Fidelity California Municipal Income Fund Class I
| Six months ended (Unaudited) August 31, | Years ended February 28, | |||||
| 2017 | 2017 | 2016 A | 2015 | 2014 | 2013 | |
| Selected Per–Share Data | ||||||
| Net asset value, beginning of period | $12.80 | $13.25 | $13.17 | $12.64 | $13.03 | $12.70 |
| Income from Investment Operations | ||||||
| Net investment income (loss)B | .192 | .395 | .423 | .429 | .463 | .465 |
| Net realized and unrealized gain (loss) | .317 | (.450) | .080 | .543 | (.394) | .324 |
| Total from investment operations | .509 | (.055) | .503 | .972 | .069 | .789 |
| Distributions from net investment income | (.192) | (.395) | (.422) | (.442) | (.459) | (.458) |
| Distributions from net realized gain | (.017) | – | (.001) | – | – | (.002) |
| Total distributions | (.209) | (.395) | (.423) | (.442) | (.459) | (.459)C |
| Redemption fees added to paid in capitalB | – | –D | –D | –D | –D | –D |
| Net asset value, end of period | $13.10 | $12.80 | $13.25 | $13.17 | $12.64 | $13.03 |
| Total ReturnE,F | 4.00% | (.46)% | 3.91% | 7.80% | .62% | 6.31% |
| Ratios to Average Net AssetsG | ||||||
| Expenses before reductions | .55%H | .55% | .55% | .55% | .54% | .54% |
| Expenses net of fee waivers, if any | .55%H | .55% | .55% | .55% | .54% | .54% |
| Expenses net of all reductions | .55%H | .55% | .55% | .55% | .54% | .54% |
| Net investment income (loss) | 2.94%H | 3.00% | 3.23% | 3.31% | 3.69% | 3.61% |
| Supplemental Data | ||||||
| Net assets, end of period (in millions) | $64 | $59 | $47 | $40 | $33 | $33 |
| Portfolio turnover rate | 26%H | 25% | 11% | 10% | 13% | 9% |
A For the year ended February 29.
B Calculated based on average shares outstanding during the period.
C Total distributions of $459 per share is comprised of distributions from net investment income of $.4578 and distributions from net realized gain of $.0016 per share.
D Amount represents less than $.0005 per share.
E Total returns for periods of less than one year are not annualized.
F Total returns would have been lower if certain expenses had not been reduced during the applicable periods shown.
G Expense ratios reflect operating expenses of the class. Expenses before reductions do not reflect amounts reimbursed by the investment adviser or reductions from expense offset arrangements and do not represent the amount paid by the class during periods when reimbursements or reductions occur. Expenses net of fee waivers reflect expenses after reimbursement by the investment adviser but prior to reductions from expense offset arrangements. Expenses net of all reductions represent the net expenses paid by the class.
H Annualized
See accompanying notes which are an integral part of the financial statements.
Notes to Financial Statements (Unaudited)
For the period ended August 31, 2017
(Amounts in thousands except percentages)
1. Organization.
Fidelity California Municipal Income Fund (the Fund) is a fund of Fidelity California Municipal Trust (the Trust) and is authorized to issue an unlimited number of shares. The Trust is registered under the Investment Company Act of 1940, as amended (the 1940 Act), as an open-end management investment company organized as a Massachusetts business trust. The Fund offers Class A, Class M (formerly Class T), Class C, California Municipal Income and Class I shares, each of which has equal rights as to assets and voting privileges. Each class has exclusive voting rights with respect to matters that affect that class. The Fund may be affected by economic and political developments in the state of California.
After the close of business on June 24, 2016, all outstanding Class B shares were converted to Class A shares. All prior fiscal period dollar and share amounts for Class B presented in the Notes to Financial Statements are for the period March 1, 2016 through June 24, 2016.
2. Significant Accounting Policies.
The Fund is an investment company and applies the accounting and reporting guidance of the Financial Accounting Standards Board (FASB) Accounting Standards Codification Topic 946 Financial Services – Investments Companies. The financial statements have been prepared in conformity with accounting principles generally accepted in the United States of America (GAAP), which require management to make certain estimates and assumptions at the date of the financial statements. Actual results could differ from those estimates. Subsequent events, if any, through the date that the financial statements were issued have been evaluated in the preparation of the financial statements. The following summarizes the significant accounting policies of the Fund:
Investment Valuation. Investments are valued as of 4:00 p.m. Eastern time on the last calendar day of the period. The Board of Trustees (the Board) has delegated the day to day responsibility for the valuation of the Fund's investments to the Fair Value Committee (the Committee) established by the Fund's investment adviser. In accordance with valuation policies and procedures approved by the Board, the Fund attempts to obtain prices from one or more third party pricing vendors or brokers to value its investments. When current market prices, quotations or currency exchange rates are not readily available or reliable, investments will be fair valued in good faith by the Committee, in accordance with procedures adopted by the Board. Factors used in determining fair value vary by investment type and may include market or investment specific events, changes in interest rates and credit quality. The frequency with which these procedures are used cannot be predicted and they may be utilized to a significant extent. The Committee oversees the Fund's valuation policies and procedures and reports to the Board on the Committee's activities and fair value determinations. The Board monitors the appropriateness of the procedures used in valuing the Fund's investments and ratifies the fair value determinations of the Committee.
The Fund categorizes the inputs to valuation techniques used to value its investments into a disclosure hierarchy consisting of three levels as shown below:
- Level 1 – quoted prices in active markets for identical investments
- Level 2 – other significant observable inputs (including quoted prices for similar investments, interest rates, prepayment speeds, etc.)
- Level 3 – unobservable inputs (including the Fund's own assumptions based on the best information available)
Valuation techniques used to value the Fund's investments by major category are as follows:
Debt securities, including restricted securities, are valued based on evaluated prices received from third party pricing vendors or from brokers who make markets in such securities. Municipal securities are valued by pricing vendors who utilize matrix pricing which considers yield or price of bonds of comparable quality, coupon, maturity and type or by broker-supplied prices. When independent prices are unavailable or unreliable, debt securities may be valued utilizing pricing methodologies which consider similar factors that would be used by third party pricing vendors. Debt securities are generally categorized as Level 2 in the hierarchy but may be Level 3 depending on the circumstances.
Changes in valuation techniques may result in transfers in or out of an assigned level within the disclosure hierarchy.
Investment Transactions and Income. For financial reporting purposes, the Fund's investment holdings and NAV include trades executed through the end of the last business day of the period. The NAV per share for processing shareholder transactions is calculated as of the close of business of the New York Stock Exchange (NYSE), normally 4:00 p.m. Eastern time and includes trades executed through the end of the prior business day. Gains and losses on securities sold are determined on the basis of identified cost. Interest income is accrued as earned and includes coupon interest and amortization of premium and accretion of discount on debt securities as applicable. Debt obligations may be placed on non-accrual status and related interest income may be reduced by ceasing current accruals and writing off interest receivables when the collection of all or a portion of interest has become doubtful based on consistently applied procedures. A debt obligation is removed from non-accrual status when the issuer resumes interest payments or when collectability of interest is reasonably assured.
Class Allocations and Expenses. Investment income, realized and unrealized capital gains and losses, common expenses of the Fund, and certain fund-level expense reductions, if any, are allocated daily on a pro-rata basis to each class based on the relative net assets of each class to the total net assets of the Fund. Each class differs with respect to transfer agent and distribution and service plan fees incurred. Certain expense reductions may also differ by class. For the reporting period, the allocated portion of income and expenses to each class as a percent of its average net assets may vary due to the timing of recording these transactions in relation to fluctuating net assets of the classes. Expenses directly attributable to a fund are charged to that fund. Expenses attributable to more than one fund are allocated among the respective funds on the basis of relative net assets or other appropriate methods. Expense estimates are accrued in the period to which they relate and adjustments are made when actual amounts are known.
Income Tax Information and Distributions to Shareholders. Each year, the Fund intends to qualify as a regulated investment company under Subchapter M of the Internal Revenue Code, including distributing substantially all of its taxable income and realized gains. As a result, no provision for U.S. Federal income taxes is required. The Fund files a U.S. federal tax return, in addition to state and local tax returns as required. The Fund's federal income tax returns are subject to examination by the Internal Revenue Service (IRS) for a period of three fiscal years after they are filed. State and local tax returns may be subject to examination for an additional fiscal year depending on the jurisdiction.
Dividends are declared and recorded daily and paid monthly from net investment income. Distributions from realized gains, if any, are declared and recorded on the ex-dividend date. Income dividends and capital gain distributions are declared separately for each class. Income and capital gain distributions are determined in accordance with income tax regulations, which may differ from GAAP.
Capital accounts within the financial statements are adjusted for permanent book-tax differences. These adjustments have no impact on net assets or the results of operations. Capital accounts are not adjusted for temporary book-tax differences which will reverse in a subsequent period.
Book-tax differences are primarily due to market discount, deferred trustees compensation, capital loss carryforwards and losses deferred due to futures contracts.
The Fund purchases municipal securities whose interest, in the opinion of the issuer, is free from federal income tax. There is no assurance that the IRS will agree with this opinion. In the event the IRS determines that the issuer does not comply with relevant tax requirements, interest payments from a security could become federally taxable, possibly retroactively to the date the security was issued.
As of period end, the cost and unrealized appreciation (depreciation) in securities, and derivatives if applicable, for federal income tax purposes were as follows:
| Gross unrealized appreciation | $130,719 |
| Gross unrealized depreciation | (2,659) |
| Net unrealized appreciation (depreciation) | $128,060 |
| Tax cost | $1,825,466 |
At the prior fiscal period end, the Fund was required to defer approximately $644 of losses on futures contracts.
Delayed Delivery Transactions and When-Issued Securities. During the period, the Fund transacted in securities on a delayed delivery or when-issued basis. Payment and delivery may take place after the customary settlement period for that security. The price of the underlying securities and the date when the securities will be delivered and paid for are fixed at the time the transaction is negotiated. The securities purchased on a delayed delivery or when-issued basis are identified as such in the Fund's Schedule of Investments. The Fund may receive compensation for interest forgone in the purchase of a delayed delivery or when-issued security. With respect to purchase commitments, the Fund identifies securities as segregated in its records with a value at least equal to the amount of the commitment. Losses may arise due to changes in the value of the underlying securities or if the counterparty does not perform under the contract's terms, or if the issuer does not issue the securities due to political, economic, or other factors.
Restricted Securities. The Fund may invest in securities that are subject to legal or contractual restrictions on resale. These securities generally may be resold in transactions exempt from registration or to the public if the securities are registered. Disposal of these securities may involve time-consuming negotiations and expense, and prompt sale at an acceptable price may be difficult. Information regarding restricted securities is included at the end of the Fund's Schedule of Investments.
New Accounting Pronouncement. In March 2017, the Financial Accounting Standards Board (FASB) issued an Accounting Standards Update (ASU), ASU 2017-08, which amends the amortization period for certain callable debt securities that are held at a premium. The amendment requires the premium to be amortized to the earliest call date. The amendments do not require an accounting change for securities held at a discount. The ASU is effective for annual periods beginning after December 15, 2018. Management is currently evaluating the potential impact of these changes to the financial statements.
3. Purchases and Sales of Investments.
Purchases and sales of securities, other than short-term securities, aggregated $365,757 and $246,455, respectively.
4. Fees and Other Transactions with Affiliates.
Management Fee. Fidelity Management & Research Company (the investment adviser) and its affiliates provide the Fund with investment management related services for which the Fund pays a monthly management fee. The management fee is the sum of an individual fund fee rate that is based on an annual rate of .25% of the Fund's average net assets and an annualized group fee rate that averaged .11% during the period. The group fee rate is based upon the average net assets of all the mutual funds advised by the investment adviser, including any mutual funds previously advised by the investment adviser that are currently advised by Fidelity SelectCo, LLC, an affiliate of the investment adviser. The group fee rate decreases as assets under management increase and increases as assets under management decrease. For the reporting period, the total annualized management fee rate was .36% of the Fund's average net assets.
Distribution and Service Plan Fees. In accordance with Rule 12b-1 of the 1940 Act, the Fund has adopted separate Distribution and Service Plans for each class of shares. Certain classes pay Fidelity Distributors Corporation (FDC), an affiliate of the investment adviser, separate Distribution and Service Fees, each of which is based on an annual percentage of each class' average net assets. In addition, FDC may pay financial intermediaries for selling shares of the Fund and providing shareholder support services. For the period, the Distribution and Service Fee rates, total fees and amounts retained by FDC were as follows:
| Distribution Fee | Service Fee | Total Fees | Retained by FDC | |
| Class A | -% | .25% | $46 | $2 |
| Class M | -% | .25% | 10 | – |
| Class C | .75% | .25% | 156 | 27 |
| $212 | $29 |
Sales Load. FDC may receive a front-end sales charge of up to 4.00% for selling Class A shares and Class M shares, some of which is paid to financial intermediaries for selling shares of the Fund. Depending on the holding period, FDC may receive contingent deferred sales charges levied on Class A, Class M and Class C redemptions. The deferred sales charges are 1.00% for Class C shares, .75% for certain purchases of Class A shares and .25% for certain purchases of Class M shares.
For the period, sales charge amounts retained by FDC were as follows:
| Retained by FDC | |
| Class A | $3 |
| Class M | 1 |
| Class C(a) | 2 |
| $6 |
(a) When Class C shares are initially sold, FDC pays commissions from its own resources to financial intermediaries through which the sales are made.
Transfer Agent Fees. Fidelity Investments Institutional Operations Company, Inc. (FIIOC), an affiliate of the investment adviser, is the transfer, dividend disbursing and shareholder servicing agent for the Fund. FIIOC receives account fees and asset-based fees that vary according to the account size and type of account of the shareholders of the respective classes of the Fund. FIIOC pays for typesetting, printing and mailing of shareholder reports, except proxy statements. For the period, transfer agent fees for each class were as follows:
| Amount | % of Class-Level Average Net Assets(a) | |
| Class A | $31 | .17 |
| Class M | 5 | .13 |
| Class C | 27 | .17 |
| California Municipal Income | 625 | .07 |
| Class I | 57 | .17 |
| $745 |
(a) Annualized
Accounting Fees. Fidelity Service Company, Inc. (FSC), an affiliate of the investment adviser, maintains the Fund's accounting records. The fee is based on the level of average net assets for each month.
Interfund Trades. The Fund may purchase from or sell securities to other Fidelity Funds under procedures adopted by the Board. The procedures have been designed to ensure these interfund trades are executed in accordance with Rule 17a-7 of the 1940 Act. Interfund trades are included within the respective purchases and sales amounts shown in the Purchases and Sales of Investments note.
5. Committed Line of Credit.
The Fund participates with other funds managed by the investment adviser or an affiliate in a $4.25 billion credit facility (the "line of credit") to be utilized for temporary or emergency purposes to fund shareholder redemptions or for other short-term liquidity purposes. The Fund has agreed to pay commitment fees on its pro-rata portion of the line of credit, which amounted to $3 and is reflected in Miscellaneous expenses on the Statement of Operations. During the period, the Fund did not borrow on this line of credit.
6. Expense Reductions.
Through arrangements with the Fund's custodian, credits realized as a result of certain uninvested cash balances were used to reduce the Fund's expenses. During the period, these credits reduced the Fund's custody expenses by $7.
In addition, during the period the investment adviser reimbursed and/or waived a portion of fund-level operating expenses in the amount of $6.
7. Distributions to Shareholders.
Distributions to shareholders of each class were as follows:
| Six months ended August 31, 2017 | Year ended February 28, 2017 | |
| From net investment income | ||
| Class A | $505 | $1,420 |
| Class M | 114 | 254 |
| Class B | – | 2 |
| Class C | 304 | 606 |
| California Municipal Income | 26,975 | 58,322 |
| Class I | 1,023 | 1,766 |
| Total | $28,921 | $62,370 |
| From net realized gain | ||
| Class A | $49 | $– |
| Class M | 11 | – |
| Class C | 41 | – |
| California Municipal Income | 2,300 | – |
| Class I | 92 | – |
| Total | $2,493 | $– |
8. Share Transactions.
Share transactions for each class were as follows and may contain automatic conversions between classes or exchanges between affiliated funds:
| Shares | Shares | Dollars | Dollars | |
| Six months ended August 31, 2017 | Year ended February 28, 2017 | Six months ended August 31, 2017 | Year ended February 28, 2017 | |
| Class A | ||||
| Shares sold | 180 | 1,196 | $2,320 | $15,842 |
| Reinvestment of distributions | 40 | 93 | 516 | 1,220 |
| Shares redeemed | (1,118) | (1,287) | (14,286) | (16,733) |
| Net increase (decrease) | (898) | 2 | $(11,450) | $329 |
| Class M | ||||
| Shares sold | 30 | 300 | $394 | $3,963 |
| Reinvestment of distributions | 9 | 16 | 115 | 212 |
| Shares redeemed | (121) | (201) | (1,567) | (2,613) |
| Net increase (decrease) | (82) | 115 | $(1,058) | $1,562 |
| Class B | ||||
| Shares sold | – | –(a) | $– | $–(b) |
| Reinvestment of distributions | – | –(a) | – | 1 |
| Shares redeemed | – | (20) | (276) | |
| Net increase (decrease) | – | (20) | $– | $(275) |
| Class C | ||||
| Shares sold | 166 | 879 | $2,145 | $11,675 |
| Reinvestment of distributions | 22 | 37 | 280 | 480 |
| Shares redeemed | (263) | (443) | (3,386) | (5,751) |
| Net increase (decrease) | (75) | 473 | $(961) | $6,404 |
| California Municipal Income | ||||
| Shares sold | 11,346 | 29,076 | $146,510 | $381,477 |
| Reinvestment of distributions | 1,454 | 2,791 | 18,788 | 36,674 |
| Shares redeemed | (8,160) | (37,651) | (105,144) | (486,869) |
| Net increase (decrease) | 4,640 | (5,784) | $60,154 | $(68,718) |
| Class I | ||||
| Shares sold | 1,924 | 3,196 | $24,736 | $42,101 |
| Reinvestment of distributions | 69 | 100 | 890 | 1,317 |
| Shares redeemed | (1,778) | (2,208) | (23,016) | (28,722) |
| Net increase (decrease) | 215 | 1,088 | $2,610 | $14,696 |
(a) In the amount of less than five hundred shares.
(b) In the amount of less than five hundred dollars.
9. Other.
The Fund's organizational documents provide former and current trustees and officers with a limited indemnification against liabilities arising in connection with the performance of their duties to the Fund. In the normal course of business, the Fund may also enter into contracts that provide general indemnifications. The Fund's maximum exposure under these arrangements is unknown as this would be dependent on future claims that may be made against the Fund. The risk of material loss from such claims is considered remote.
Shareholder Expense Example
As a shareholder of the Fund, you incur two types of costs: (1) transaction costs, including sales charges (loads) on purchase payments or redemption proceeds, and (2) ongoing costs, including management fees, distribution and/or service (12b-1) fees and other Fund expenses. This Example is intended to help you understand your ongoing costs (in dollars) of investing in the Fund and to compare these costs with the ongoing costs of investing in other mutual funds.
The Example is based on an investment of $1,000 invested at the beginning of the period and held for the entire period (March 1, 2017 to August 31, 2017).
Actual Expenses
The first line of the accompanying table for each class of the Fund provides information about actual account values and actual expenses. You may use the information in this line, together with the amount you invested, to estimate the expenses that you paid over the period. Simply divide your account value by $1,000.00 (for example, an $8,600 account value divided by $1,000.00 = 8.6), then multiply the result by the number in the first line for a class of the Fund under the heading entitled "Expenses Paid During Period" to estimate the expenses you paid on your account during this period. A small balance maintenance fee of $12.00 that is charged once a year may apply for certain accounts with a value of less than $2,000. This fee is not included in the table below. If it was, the estimate of expenses you paid during the period would be higher, and your ending account value lower, by this amount.
Hypothetical Example for Comparison Purposes
The second line of the accompanying table for each class of the Fund provides information about hypothetical account values and hypothetical expenses based on a Class' actual expense ratio and an assumed rate of return of 5% per year before expenses, which is not the Class' actual return. The hypothetical account values and expenses may not be used to estimate the actual ending account balance or expenses you paid for the period. You may use this information to compare the ongoing costs of investing in the Fund and other funds. To do so, compare this 5% hypothetical example with the 5% hypothetical examples that appear in the shareholder reports of the other funds. A small balance maintenance fee of $12.00 that is charged once a year may apply for certain accounts with a value of less than $2,000. This fee is not included in the table below. If it was, the estimate of expenses you paid during the period would be higher, and your ending account value lower, by this amount.
Please note that the expenses shown in the table are meant to highlight your ongoing costs only and do not reflect any transaction costs. Therefore, the second line of the table is useful in comparing ongoing costs only, and will not help you determine the relative total costs of owning different funds. In addition, if these transactional costs were included, your costs would have been higher.
| Annualized Expense Ratio-A | Beginning Account Value March 1, 2017 | Ending Account Value August 31, 2017 | Expenses Paid During Period-B March 1, 2017 to August 31, 2017 | |
| Class A | .80% | |||
| Actual | $1,000.00 | $1,038.80 | $4.11 | |
| Hypothetical-C | $1,000.00 | $1,021.17 | $4.08 | |
| Class M | .77% | |||
| Actual | $1,000.00 | $1,038.90 | $3.96 | |
| Hypothetical-C | $1,000.00 | $1,021.32 | $3.92 | |
| Class C | 1.55% | |||
| Actual | $1,000.00 | $1,034.90 | $7.95 | |
| Hypothetical-C | $1,000.00 | $1,017.39 | $7.88 | |
| California Municipal Income | .46% | |||
| Actual | $1,000.00 | $1,040.60 | $2.37 | |
| Hypothetical-C | $1,000.00 | $1,022.89 | $2.35 | |
| Class I | .55% | |||
| Actual | $1,000.00 | $1,040.00 | $2.83 | |
| Hypothetical-C | $1,000.00 | $1,022.43 | $2.80 |
A Annualized expense ratio reflects expenses net of applicable fee waivers.
B Expenses are equal to each Class' annualized expense ratio, multiplied by the average account value over the period, multiplied by 184/365 (to reflect the one-half year period).
C 5% return per year before expenses
![]()
Corporate Headquarters
245 Summer St.
Boston, MA 02210
www.fidelity.com
CFL-SANN-1017
1.777802.115
Item 2.
Code of Ethics
Not applicable.
Item 3.
Audit Committee Financial Expert
Not applicable.
Item 4.
Principal Accountant Fees and Services
Not applicable.
Item 5.
Audit Committee of Listed Registrants
Not applicable.
Item 6.
Investments
(a)
Not applicable.
(b)
Not applicable
Item 7.
Disclosure of Proxy Voting Policies and Procedures for Closed-End Management Investment Companies
Not applicable.
Item 8.
Portfolio Managers of Closed-End Management Investment Companies
Not applicable.
Item 9.
Purchase of Equity Securities by Closed-End Management Investment Company and Affiliated Purchasers
Not applicable.
Item 10.
Submission of Matters to a Vote of Security Holders
There were no material changes to the procedures by which shareholders may recommend nominees to the Fidelity California Municipal Trust’s Board of Trustees.
Item 11.
Controls and Procedures
(a)(i) The President and Treasurer and the Chief Financial Officer have concluded that the Fidelity California Municipal Trust’s (the “Trust”) disclosure controls and procedures (as defined in Rule 30a-3(c) under the Investment Company Act) provide reasonable
assurances that material information relating to the Trust is made known to them by the appropriate persons, based on their evaluation of these controls and procedures as of a date within 90 days of the filing date of this report.
(a)(ii) There was no change in the Trust’s internal control over financial reporting (as defined in Rule 30a-3(d) under the Investment Company Act) that occurred during the second fiscal quarter of the period covered by this report that has materially affected, or is reasonably likely to materially affect, the Trust’s internal control over financial reporting.
Item 12.
Exhibits
(a) | (1) | Not applicable. |
(a) | (2) | Certification pursuant to Rule 30a-2(a) under the Investment Company Act of 1940 (17 CFR 270.30a-2(a)) is filed and attached hereto as Exhibit 99.CERT. |
(a) | (3) | Not applicable. |
(b) | Certification pursuant to Rule 30a-2(b) under the Investment Company Act of 1940 (17 CFR 270.30a-2(b)) is furnished and attached hereto as Exhibit 99.906CERT. |
SIGNATURES
Pursuant to the requirements of the Securities Exchange Act of 1934 and the Investment Company Act of 1940, the registrant has duly caused this report to be signed on its behalf by the undersigned, thereunto duly authorized.
Fidelity California Municipal Trust
By: | /s/Stephanie J. Dorsey |
Stephanie J. Dorsey | |
President and Treasurer | |
Date: | October 25, 2017 |
Pursuant to the requirements of the Securities Exchange Act of 1934 and the Investment Company Act of 1940, this report has been signed below by the following persons on behalf of the registrant and in the capacities and on the dates indicated.
By: | /s/Stephanie J. Dorsey |
Stephanie J. Dorsey | |
President and Treasurer | |
Date: | October 25, 2017 |
By: | /s/Howard J. Galligan III |
Howard J. Galligan III | |
Chief Financial Officer | |
Date: | October 25, 2017 |