UNITED STATES
SECURITIES AND EXCHANGE COMMISSION
Washington, D.C. 20549
FORM N-CSR
Certified Shareholder Report of
Registered Management Investment Companies
Investment Company Act File Number: 811-03734
EuroPacific Growth Fund
(Exact Name of Registrant as Specified in Charter)
333 South Hope Street
Los Angeles, California 90071
(Address of Principal Executive Offices)
Registrant's telephone number, including area code: (949) 975-5000
Date of fiscal year end: March 31
Date of reporting period: March 31, 2020
Brian C. Janssen
EuroPacific Growth Fund
6455 Irvine Center Drive
Los Angeles, California 90071
(Name and Address of Agent for Service)
ITEM 1 – Reports to Stockholders
EuroPacific Growth Fund®
Annual report |  |

Tap into the growth
potential of
international equities
Beginning January 1, 2021, as permitted by regulations adopted by the U.S. Securities and Exchange Commission, we intend to no longer mail paper copies of the fund’s shareholder reports, unless specifically requested from American Funds or your financial intermediary, such as a broker-dealer or bank. Instead, the reports will be made available on the Capital Group website (capitalgroup.com); you will be notified by mail and provided with a website link to access the report each time a report is posted. If you have already elected to receive shareholder reports electronically, you will not be affected by this change and do not need to take any action. If you prefer to receive shareholder reports and other communications electronically, you may update your mailing preferences with your financial intermediary, or enroll in e-delivery at capitalgroup.com (for accounts held directly with the fund).
You may elect to receive paper copies of all future reports free of charge. If you invest through a financial intermediary, you may contact your financial intermediary to request that you continue to receive paper copies of your shareholder reports. If you invest directly with the fund, you may inform American Funds that you wish to continue receiving paper copies of your shareholder reports by contacting us at (800) 421-4225. Your election to receive paper reports will apply to all funds held with American Funds or through your financial intermediary.
EuroPacific Growth Fund seeks to provide you with long-term growth of capital.
This fund is one of more than 40 offered by Capital Group, home of American Funds, one of the nation’s largest mutual fund families. For nearly 90 years, Capital Group has invested with a long-term focus based on thorough research and attention to risk.
Fund results shown in this report, unless otherwise indicated, are for Class A shares at net asset value. If a sales charge (maximum 5.75%) had been deducted, the results would have been lower. Results are for past periods and are not predictive of results for future periods. Current and future results may be lower or higher than those shown. Prices and returns will vary, so investors may lose money. Investing for short periods makes losses more likely. For current information and month-end results, visit capitalgroup.com.
See page 4 for Class A share results with relevant sales charges deducted and fund expenses. For other share class results, visit capitalgroup.com and americanfundsretirement.com.
Investment results assume all distributions are reinvested and reflect applicable fees and expenses. When applicable, investment results reflect fee waivers, without which results would have been lower. Visit capitalgroup.com for more information.
Investing outside the United States may be subject to risks, such as currency fluctuations, periods of illiquidity and price volatility. These risks may be heightened in connection with investments in developing countries. Refer to the fund prospectus and the Risk Factors section of this report for more information on these and other risks associated with investing in the fund.
Investments are not FDIC-insured, nor are they deposits of or guaranteed by a bank or any other entity, so they may lose value.
Contents
| 1 | Letter to investors |
| 4 | The value of a long-term perspective |
| 6 | Summary investment portfolio |
| 11 | Financial statements |
| 34 | Board of trustees and other officers |
Fellow investors
In a market shaped by extreme volatility, EuroPacific Growth Fund declined in value but surpassed its primary benchmark by a significant margin.
For the 12-month period ended March 31, the fund declined 13.03% for shareholders who reinvested dividends and capital gains. This return was better than the 15.57% loss recorded by the fund’s primary benchmark, the unmanaged MSCI All Country World Index ex USA, which reflects the returns of more than 40 developed and developing country stock markets.
Equity markets tumble
International equity markets fell sharply, pressured initially by rising U.S.-China trade tensions and then by the severe COVID-19 outbreak that brought the global economy to a virtual standstill. In the final two months of the 12-month period, stock markets plummeted as governments around the world ordered people to stay home and avoid all non-essential activities. Central banks and national leaders responded with unprecedented monetary and fiscal stimulus measures in an attempt to lessen the severity of an expected global recession amid government-imposed lockdowns.
Earlier in the fiscal year, markets fluctuated largely in line with the progress of trade negotiations between the U.S. and China. Rising tariffs and other retaliatory trade measures hurt investor sentiment at various times. In December, equity markets rallied as Washington and Beijing agreed to a limited trade truce. But a month later, press reports began accelerating about a strange new virus infecting people in Wuhan, China. By March, the virus had spread around the world, prompting many countries to lock down their economies, ban most air travel and impose “social distancing” practices.
Sector returns fall
Most sectors declined, underscored by large drops in the shares of energy, real estate and financial companies. Oil stocks were particularly hard hit as oil prices fell to 18-year lows amid plummeting global
Results at a glance
For periods ended March 31, 2020, with all distributions reinvested
| Cumulative total return | Average annual total returns | |||||||||||||||
| 1 year | 5 years | 10 years | Lifetime (since 4/16/84) | |||||||||||||
| EuroPacific Growth Fund (Class A shares) | –13.03 | % | 0.56 | % | 3.61 | % | 9.74 | % | ||||||||
| MSCI ACWI (All Country World Index) ex USA1,2 | –15.57 | –0.64 | 2.05 | N/A | ||||||||||||
| 1 | The market indexes are unmanaged and, therefore, have no expenses. Investors cannot invest directly in an index. Source: MSCI. |
| 2 | The index did not exist prior to December 31, 1987. Results reflect dividends net of withholding taxes. |
| EuroPacific Growth Fund | 1 |
demand and a price war between Russia and Saudi Arabia. Shares of real estate companies declined on worries that commercial and residential tenants may default en masse on rental and lease agreements. Financial shares also fell precipitously amid ultra-low interest rates and warnings from many banks that they would not make dividend payments in a bid to conserve capital.
Health care stocks provided one of the few bright spots, rising about 5% in aggregate as investors flocked to select drug companies with steady cash flows. Some drug makers also benefited from increased demand for coronavirus test kits and investor optimism for potential treatments to fight COVID-19, the disease caused by the virus. Meanwhile, the information technology sector rose modestly, lifted by companies engaged in e-commerce and online entertainment. Internet activity soared during the January-to-March period, boosting the shares of networking firms, gaming companies and food-delivery services.
Inside the portfolio
Select investments in the consumer discretionary sector produced solid results for the fund. E-commerce firm Meituan Dianping recovered from earlier declines amid soaring demand for food delivery in China. Indeed, several Chinese and Japanese stocks were among the top contributors to results as both countries were struck by the coronavirus outbreak earlier than most and appeared to be emerging from the crisis earlier, as well. Sony and Nintendo, both based in Japan, advanced amid growing demand for their online entertainment and gaming services.
Stocks in the health care sector boosted the fund’s results, led by pharmaceutical company Daiichi Sankyo. Shares of the Japanese drug manufacturer rallied on strong earnings and investor optimism for its oncology drug pipeline. Chugai Pharmaceutical was another top contributor in the health care sector. The Japanese company gained regulatory approval for several new drugs, and one of its existing anti-inflammatory drugs emerged as a promising treatment for COVID-19.
The fund’s underweight position in financial stocks contributed to results relative to the index. While the fund’s exposure to the sector detracted overall, select holdings rallied, including London Stock Exchange Group, which benefited from high volatility as trading volumes increased. On the other hand, some of the fund’s bank holdings tumbled, particularly banks based in India. HDFC Bank, India’s largest private lender, was among the top detractors.
Stock selection in the industrials sector hurt the fund’s results. Shares of Airbus fell sharply as the European aircraft manufacturer faced a precipitous loss of orders from its primary customers in the commercial airline industry. Coronavirus-related travel restrictions caused passenger traffic to plummet, leaving all facets of the travel and tourism industry in dire shape. Other travel-oriented holdings that detracted from results include International Consolidated Airlines — the parent company of British Airways — and casino operator Melco Resorts & Entertainment.
Elsewhere in the portfolio, shares of Brazilian mining company Vale declined in the aftermath of a fatal dam collapse and continuing litigation. Falling global demand for commodities and raw materials also hurt the share prices of several other holdings in the materials sector, including Canadian mining companies Teck Resources and First Quantum Minerals.
Looking ahead
The outlook has shifted dramatically as the nations of the world struggle to deal with the life and death consequences of a global pandemic. First and foremost, our thoughts are with the people who have fallen ill and their family members who are deeply affected by these tragic events. We look forward hopefully to the day this virus is contained and life resumes some sense of normalcy.
As of May 2020, the full impact of the coronavirus outbreak is unknown. Governments are weighing the public
| 2 | EuroPacific Growth Fund |
health benefits of ongoing lockdowns against the damage they are undoubtedly doing to the economy. Job losses are mounting, and the employment outlook in many countries is highly uncertain. In equity markets, volatility levels are high, and they will likely remain so for the balance of 2020 and potentially beyond.
However, it is possible to envision an end to this uncertainty. The world has dealt with deadly viral outbreaks many times before — from SARS in 2003, to swine flu in 2009, to MERS, Ebola and the Zika virus in more recent years. Humankind and the global economy have powered through each of these outbreaks as they are eventually suppressed and ultimately contained. We believe this time will be no different.
We are also confident that we have the right people in place all over the world to monitor this event, study it from all angles, and make decisions based on deep fundamental research, which has always formed the bedrock of our investment philosophy. From day one of this crisis, our analysts in Beijing, Hong Kong, Tokyo, Singapore and elsewhere were hard at work gathering data, as well as on-the-ground evidence, to help inform our investment decisions. We will continue to do so as these events unfold and investment opportunities emerge.
As always, we remain focused on the long-term picture and we believe we are well positioned to tolerate periods of market volatility. We continue to be optimistic about the long-term outlook, once we move past the challenging days ahead.
Thank you for your commitment to the fund and we look forward to reporting to you again in six months.
Sincerely,

Gerald Du Manoir
Co-President

Carl Kawaja
Co-President

Christopher Thomsen
Co-President
May 11, 2020
For current information about the fund, visit capitalgroup.com.
| EuroPacific Growth Fund | 3 |
The value of a long-term perspective

Fund results shown are for Class A shares and reflect deduction of the maximum sales charge of 5.75% on the $10,000 investment.1Thus, the net amount invested was $9,425.2Results are for past periods and are not predictive of results for future periods. Current and future results may be lower or higher than those shown. Prices and returns will vary, so investors may lose money. Investing for short periods makes losses more likely. For current information and month-end results, visit capitalgroup.com.
The results shown are before taxes on fund distributions and sale of fund shares.
| 1 | As outlined in the prospectus, the sales charge is reduced for accounts (and aggregated investments) of $25,000 or more and is eliminated for purchases of $1 million or more. There is no sales charge on dividends or capital gain distributions that are reinvested in additional shares. |
| 2 | The maximum initial sales charge was 8.50% prior to July 1, 1988. |
| 3 | For the period April 16, 1984, commencement of operations, through March 31, 1985. |
| 4 | The index is unmanaged and, therefore, has no expenses. Investors cannot invest directly in an index. |
| 5 | From April 16, 1984, through December 31, 1987, the MSCI EAFE (Europe, Australasia, Far East) Index was used because the MSCI ACWI (All Country World Index) ex USA did not yet exist. Since January 1, 1988, the MSCI ACWI ex USA has been used. The MSCI EAFE Index reflects dividends net of withholding taxes. The MSCI ACWI ex USA reflects dividends gross of withholding taxes through December 31, 2000, and dividends net of withholding taxes thereafter. |
| 4 | EuroPacific Growth Fund |
How a hypothetical $10,000 investment has grown
This chart shows how a hypothetical $10,000 investment in the EuroPacific Growth Fund grew from April 16, 1984, to March 31, 2020. As you can see, the investment grew to $266,058 with all distributions reinvested.

| EuroPacific Growth Fund | 5 |
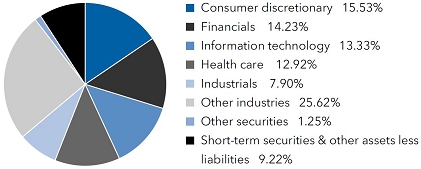
Summary investment portfolio March 31, 2020
| Industry sector diversification | Percent of net assets |
| Country diversification by domicile | Percent of net assets | |||
| Eurozone* | 24.29 | % | ||
| Japan | 14.88 | |||
| China | 10.00 | |||
| India | 7.38 | |||
| United Kingdom | 6.68 | |||
| Switzerland | 4.73 | |||
| Hong Kong | 4.69 | |||
| Brazil | 3.08 | |||
| Canada | 2.92 | |||
| Other countries | 12.13 | |||
| Short-term securities & other assets less liabilities | 9.22 | |||
| * | Countries using the euro as a common currency; those represented in the fund’s portfolio are Belgium, Finland, France, Germany, Ireland, Italy, the Netherlands and Spain. |
| Common stocks 89.53% | Shares | Value (000) | ||||||
| Consumer discretionary 15.53% | ||||||||
| Alibaba Group Holding Ltd. (ADR)1 | 9,539,293 | $ | 1,855,201 | |||||
| Alibaba Group Holding Ltd.1,2 | 69,630,448 | 1,637,913 | ||||||
| MercadoLibre, Inc.1,3 | 4,108,989 | 2,007,570 | ||||||
| LVMH Moët Hennessy-Louis Vuitton SE2 | 5,335,525 | 1,980,523 | ||||||
| Sony Corp.2 | 22,651,200 | 1,346,460 | ||||||
| adidas AG2 | 4,687,433 | 1,078,334 | ||||||
| Meituan Dianping, Class B1,2 | 74,215,949 | 890,630 | ||||||
| Kering SA2 | 1,612,355 | 841,319 | ||||||
| EssilorLuxottica2 | 7,764,090 | 837,667 | ||||||
| Galaxy Entertainment Group Ltd.2 | 145,458,000 | 770,474 | ||||||
| Just Eat Takeaway (GBP denominated)1,2,3 | 6,590,594 | 496,082 | ||||||
| Just Eat Takeaway (EUR denominated)1,2,3 | 3,151,312 | 237,563 | ||||||
| Flutter Entertainment PLC (EUR denominated)2,3 | 5,056,753 | 458,413 | ||||||
| Flutter Entertainment PLC (GBP denominated)2,3 | 1,214,593 | 109,544 | ||||||
| Other securities | 5,690,820 | |||||||
| 20,238,513 | ||||||||
| Financials 14.23% | ||||||||
| AIA Group Ltd.2 | 378,001,706 | 3,400,617 | ||||||
| HDFC Bank Ltd.2 | 194,701,815 | 2,190,710 | ||||||
| HDFC Bank Ltd. (ADR) | 11,291,403 | 434,267 | ||||||
| Kotak Mahindra Bank Ltd.2 | 95,139,478 | 1,610,084 | ||||||
| London Stock Exchange Group PLC2 | 10,226,141 | 921,392 | ||||||
| Ping An Insurance (Group) Co. of China, Ltd., Class H2 | 63,610,999 | 622,253 | ||||||
| ICICI Bank Ltd.2 | 135,615,372 | 593,896 | ||||||
| ICICI Bank Ltd. (ADR) | 9,800,077 | 83,300 | ||||||
| B3 SA - Brasil, Bolsa, Balcao | 91,700,000 | 633,558 | ||||||
| Sberbank of Russia PJSC (ADR)2 | 57,378,085 | 543,663 | ||||||
| Other securities | 7,507,724 | |||||||
| 18,541,464 | ||||||||
| Information technology 13.33% | ||||||||
| ASML Holding NV2 | 11,730,764 | 3,117,574 | ||||||
| Taiwan Semiconductor Manufacturing Co., Ltd.2 | 192,306,649 | 1,716,532 | ||||||
| Taiwan Semiconductor Manufacturing Co., Ltd. (ADR) | 8,126,216 | 388,352 | ||||||
| Keyence Corp.2 | 6,325,900 | 2,041,466 | ||||||
| SAP SE2 | 11,482,593 | 1,318,812 | ||||||
| Samsung Electronics Co., Ltd.2 | 28,446,453 | 1,105,546 | ||||||
| Shopify Inc., Class A, subordinate voting shares1 | 2,220,000 | 925,585 | ||||||
| Amadeus IT Group SA, Class A, non-registered shares2 | 18,137,099 | 860,160 | ||||||
| Edenred SA2,3 | 13,593,956 | 568,951 | ||||||
| Other securities | 5,327,462 | |||||||
| 17,370,440 | ||||||||
| 6 | EuroPacific Growth Fund |
| Shares | Value (000) | |||||||
| Health care 12.92% | ||||||||
| Daiichi Sankyo Co., Ltd.2,3 | 39,384,700 | $ | 2,709,731 | |||||
| Chugai Pharmaceutical Co., Ltd.2 | 13,495,300 | 1,562,099 | ||||||
| Novartis AG2 | 18,338,137 | 1,515,556 | ||||||
| AstraZeneca PLC2 | 15,279,883 | 1,364,922 | ||||||
| Alcon Inc.1,2 | 18,591,046 | 948,739 | ||||||
| CSL Ltd.2 | 4,126,058 | 748,479 | ||||||
| HOYA Corp.2 | 8,172,151 | 695,114 | ||||||
| Takeda Pharmaceutical Co. Ltd.2 | 19,089,453 | 584,187 | ||||||
| Other securities | 6,710,869 | |||||||
| 16,839,696 | ||||||||
| Industrials 7.90% | ||||||||
| Airbus SE, non-registered shares2 | 30,488,033 | 1,978,163 | ||||||
| Recruit Holdings Co., Ltd.2 | 53,138,429 | 1,372,130 | ||||||
| Safran SA2 | 9,134,324 | 802,871 | ||||||
| Other securities | 6,142,717 | |||||||
| 10,295,881 | ||||||||
| Consumer staples 6.07% | ||||||||
| Nestlé SA2 | 14,203,727 | 1,463,953 | ||||||
| Kweichow Moutai Co., Ltd., Class A2 | 6,215,215 | 976,974 | ||||||
| British American Tobacco PLC2 | 25,595,618 | 874,048 | ||||||
| Pernod Ricard SA2 | 5,229,022 | 743,770 | ||||||
| Other securities | 3,849,822 | |||||||
| 7,908,567 | ||||||||
| Communication services 5.86% | ||||||||
| Nintendo Co., Ltd.2 | 5,999,727 | 2,314,058 | ||||||
| Tencent Holdings Ltd.2 | 32,814,411 | 1,600,082 | ||||||
| SoftBank Group Corp.2 | 34,007,900 | 1,190,855 | ||||||
| Sea Ltd., Class A (ADR)1,4 | 13,238,115 | 586,581 | ||||||
| Other securities | 1,945,882 | |||||||
| 7,637,458 | ||||||||
| Materials 5.50% | ||||||||
| Vale SA, ordinary nominative (ADR) | 103,405,704 | 857,234 | ||||||
| Vale SA, ordinary nominative | 50,047,180 | 416,281 | ||||||
| Sika AG2 | 5,845,135 | 967,115 | ||||||
| Koninklijke DSM NV2 | 7,965,617 | 905,167 | ||||||
| Shin-Etsu Chemical Co., Ltd.2 | 7,521,100 | 745,408 | ||||||
| Other securities | 3,280,412 | |||||||
| 7,171,617 | ||||||||
| Energy 3.60% | ||||||||
| Reliance Industries Ltd.2 | 188,970,403 | 2,781,444 | ||||||
| Canadian Natural Resources, Ltd. (CAD denominated) | 57,731,064 | 789,684 | ||||||
| Other securities | 1,117,702 | |||||||
| 4,688,830 | ||||||||
| Utilities 3.36% | ||||||||
| Ørsted AS2 | 9,120,210 | 895,650 | ||||||
| China Gas Holdings Ltd.2 | 209,890,000 | 727,894 | ||||||
| Enel SpA2 | 104,040,486 | 724,166 | ||||||
| ENN Energy Holdings Ltd.2,3 | 73,744,200 | 709,198 | ||||||
| China Resources Gas Group Ltd.2,3 | 126,618,000 | 635,653 | ||||||
| Other securities | 686,965 | |||||||
| 4,379,526 | ||||||||
| Real estate 1.23% | ||||||||
| Other securities | 1,609,082 | |||||||
| Total common stocks (cost: $101,879,095,000) | 116,681,074 | |||||||
| Preferred securities 1.10% | ||||||||
| Other 1.10% | ||||||||
| Other securities | 1,432,226 | |||||||
| Total preferred securities (cost: $1,430,619,000) | 1,432,226 | |||||||
| EuroPacific Growth Fund | 7 |
| Rights & warrants 0.06% | Shares | Value (000) | ||||||
| Health care 0.06% | ||||||||
| Other securities | $ | 77,631 | ||||||
| Total rights & warrants (cost: $46,709,000) | 77,631 | |||||||
| Bonds, notes & other debt instruments 0.09% | Principal amount (000) | |||||||
| Other 0.09% | ||||||||
| Other securities | 114,027 | |||||||
| Total bonds, notes & other debt instruments (cost: $111,557,000) | 114,027 | |||||||
| Short-term securities 8.78% | Shares | |||||||
| Money market investments 8.78% | ||||||||
| Capital Group Central Cash Fund 1.00%3,5 | 113,995,069 | 11,404,067 | ||||||
| Blackrock FedFund 0.33%5,6 | 14,000,000 | 14,000 | ||||||
| Invesco Short-term Investments Trust - Government & Agency Portfolio 0.43%5,6 | 6,578,920 | 6,579 | ||||||
| State Street Institutional U.S. Government Money Market Fund 0.32%5,6 | 6,350,000 | 6,350 | ||||||
| Goldman Sachs Financial Square Government Fund 0.34%5,6 | 4,000,000 | 4,000 | ||||||
| Fidelity Institutional Money Market Funds - Government Portfolio 0.30%5,6 | 1,700,000 | 1,700 | ||||||
| Morgan Stanley Institutional Liquidity Funds - Government Portfolio 0.25%5,6 | 1,000,000 | 1,000 | ||||||
| RBC U.S. Government Money Market Fund 0.82%5,6 | 1,000,000 | 1,000 | ||||||
| 11,438,696 | ||||||||
| Total short-term securities (cost: $11,433,919,000) | 11,438,696 | |||||||
| Total investment securities 99.56% (cost: $114,901,899,000) | 129,743,654 | |||||||
| Other assets less liabilities 0.44% | 578,916 | |||||||
| Net assets 100.00% | $ | 130,322,570 | ||||||
This summary investment portfolio is designed to streamline the report and help investors better focus on the fund’s principal holdings. See the inside back cover for details on how to obtain a complete schedule of portfolio holdings.
“Other securities” includes all issues that are not disclosed separately in the summary investment portfolio. “Other securities” also includes a security (with a value of $77,631,000, which represented .06% of the net assets of the fund) which was acquired in transactions exempt from registration under Rule 144A of the Securities Act of 1933 and may be resold in the U.S. in transactions exempt from registration, normally to qualified institutional buyers.
| 8 | EuroPacific Growth Fund |
Investments in affiliates
A company is an affiliate of the fund under the Investment Company Act of 1940 if the fund’s holdings represent 5% or more of the outstanding voting shares of that company. The value of the fund’s affiliated-company holdings is either shown in the summary investment portfolio or included in the value of “Other securities” under the respective industry sectors. Further details on these holdings and related transactions during the year ended March 31, 2020, appear below.
| Beginning shares | Additions | Reductions | Ending shares | Net realized gain (loss) (000) | Net unrealized (depreciation) appreciation (000) | Dividend income (000) | Value of affiliates at 3/31/2020 (000) | |||||||||||||||||||||||||
| Common stocks 10.62% | ||||||||||||||||||||||||||||||||
| Consumer discretionary 3.68% | ||||||||||||||||||||||||||||||||
| MercadoLibre, Inc.1 | 3,424,500 | 714,536 | 30,047 | 4,108,989 | $ | 12,020 | $ | (135,635 | ) | $ | — | $ | 2,007,570 | |||||||||||||||||||
| Just Eat Takeaway (GBP denominated)1,2 | — | 6,590,594 | — | 6,590,594 | — | (12,259 | ) | — | 496,082 | |||||||||||||||||||||||
| Just Eat Takeaway (EUR denominated)1,2 | — | 3,176,472 | 25,160 | 3,151,312 | 464 | (17,623 | ) | — | 237,563 | |||||||||||||||||||||||
| Flutter Entertainment PLC (EUR denominated)2,7 | 2,325,681 | 2,764,000 | 32,928 | 5,056,753 | 1,397 | (9,370 | ) | 5,949 | 458,413 | |||||||||||||||||||||||
| Flutter Entertainment PLC (GBP denominated)2 | — | 1,218,109 | 3,516 | 1,214,593 | (3 | ) | (41,836 | ) | — | 109,544 | ||||||||||||||||||||||
| Stars Group Inc.1 | — | 23,163,200 | 80,529 | 23,082,671 | 441 | (83,155 | ) | — | 471,348 | |||||||||||||||||||||||
| Melco Resorts & Entertainment Ltd. (ADR) | 32,297,140 | 1,707,496 | 1,378,750 | 32,625,886 | (7,324 | ) | (317,330 | ) | 21,036 | 404,561 | ||||||||||||||||||||||
| GVC Holdings PLC2 | 31,312,683 | 21,442,594 | 6,466,357 | 46,288,920 | (35,707 | ) | (77,044 | ) | 15,775 | 321,321 | ||||||||||||||||||||||
| Ryohin Keikaku Co., Ltd.2 | 2,164,000 | 19,035,900 | 3,094,400 | 18,105,500 | (98,969 | ) | (195,954 | ) | 6,654 | 203,217 | ||||||||||||||||||||||
| ASOS PLC1,2 | 5,897,884 | 969,940 | 1,426,848 | 5,440,976 | (24,232 | ) | (108,647 | ) | — | 80,572 | ||||||||||||||||||||||
| Galaxy Entertainment Group Ltd.2,8 | 224,749,000 | 17,726,000 | 97,017,000 | 145,458,000 | (30,099 | ) | (207,933 | ) | 21,034 | — | ||||||||||||||||||||||
| Just Eat PLC1,2,8 | 54,396,000 | — | 54,396,000 | — | (24,726 | ) | (36,622 | ) | — | — | ||||||||||||||||||||||
| 4,790,191 | ||||||||||||||||||||||||||||||||
| Information technology 1.24% | ||||||||||||||||||||||||||||||||
| Edenred SA2 | 8,850,000 | 4,831,063 | 87,107 | 13,593,956 | 2,233 | (76,555 | ) | 8,495 | 568,951 | |||||||||||||||||||||||
| Halma PLC2 | 22,653,157 | 2,090,072 | 2,264,750 | 22,478,479 | 10,606 | 42,067 | 5,046 | 534,058 | ||||||||||||||||||||||||
| PagSeguro Digital Ltd., Class A1 | 24,308,238 | 2,177,223 | 207,764 | 26,277,697 | 3,488 | (283,112 | ) | — | 507,948 | |||||||||||||||||||||||
| 1,610,957 | ||||||||||||||||||||||||||||||||
| Health care 3.15% | ||||||||||||||||||||||||||||||||
| Daiichi Sankyo Co., Ltd.2 | 34,141,000 | 5,555,300 | 311,600 | 39,384,700 | 12,855 | 706,439 | 25,508 | 2,709,731 | ||||||||||||||||||||||||
| Teva Pharmaceutical Industries Ltd. (ADR)1 | 52,991,159 | 3,685,000 | 447,084 | 56,229,075 | (699 | ) | (372,387 | ) | — | 504,937 | ||||||||||||||||||||||
| Hikma Pharmaceuticals PLC2 | 14,615,045 | — | 115,762 | 14,499,283 | 1,363 | 25,960 | 10,190 | 365,512 | ||||||||||||||||||||||||
| Notre Dame Intermédica Participações SA | — | 37,609,625 | — | 37,609,625 | — | (218,794 | ) | 1,246 | 325,423 | |||||||||||||||||||||||
| Hypera SA, ordinary nominative | 4,229,700 | 30,658,400 | 29,800 | 34,858,300 | 80 | (102,695 | ) | 3,875 | 191,798 | |||||||||||||||||||||||
| NMC Health PLC2,9 | 12,262,303 | 6,383,562 | 5,892,244 | 12,753,621 | (175,034 | ) | (231,187 | ) | 2,213 | 8,290 | ||||||||||||||||||||||
| GW Pharmaceuticals PLC (ADR)1,4,8 | 1,816,499 | — | 1,298,137 | 518,362 | 8,858 | (88,459 | ) | — | — | |||||||||||||||||||||||
| 4,105,691 | ||||||||||||||||||||||||||||||||
| Industrials 0.67% | ||||||||||||||||||||||||||||||||
| Melrose Industries PLC2 | 290,421,746 | 100,609,640 | 2,581,542 | 388,449,844 | 2,221 | (492,402 | ) | 17,734 | 438,676 | |||||||||||||||||||||||
| MTU Aero Engines AG2 | 3,144,000 | 1,041,766 | 1,230,964 | 2,954,802 | (78,101 | ) | (247,723 | ) | 10,089 | 432,886 | ||||||||||||||||||||||
| International Consolidated Airlines Group SA (CDI)2,8 | 129,105,675 | 8,590,200 | 108,192,964 | 29,502,911 | (182,319 | ) | (211,183 | ) | 95,582 | — | ||||||||||||||||||||||
| Yamato Holdings Co., Ltd.2,8 | 25,518,093 | 178,692 | 25,696,785 | — | (247,256 | ) | (473 | ) | — | — | ||||||||||||||||||||||
| DCC PLC2,8 | 4,784,045 | 258,000 | 1,419,459 | 3,622,586 | (59,907 | ) | (82,324 | ) | 8,871 | — | ||||||||||||||||||||||
| Rentokil Initial PLC2,8 | 53,636,506 | 53,028,794 | 27,768,786 | 78,896,514 | (45,505 | ) | 153 | 3,689 | — | |||||||||||||||||||||||
| 871,562 | ||||||||||||||||||||||||||||||||
| Consumer staples 0.40% | ||||||||||||||||||||||||||||||||
| KOSÉ Corp.2 | 1,048,500 | 3,222,500 | 26,200 | 4,244,800 | 1,292 | (178,114 | ) | 6,874 | 523,331 | |||||||||||||||||||||||
| EuroPacific Growth Fund | 9 |
Investments in affiliates(continued)
| Beginning shares | Additions | Reductions | Ending shares | Net realized gain (loss) (000) | Net unrealized (depreciation) appreciation (000) | Dividend income (000) | Value of affiliates at 3/31/2020 (000) | |||||||||||||||||||||||||
| Communication services 0.24% | ||||||||||||||||||||||||||||||||
| Altice Europe NV, Class A1,2 | 62,627,628 | 6,601,569 | 1,759,066 | 67,470,131 | $ | 5,729 | $ | 81,728 | $ | — | $ | 260,811 | ||||||||||||||||||||
| Altice Europe NV, Class B1,2 | 14,777,869 | — | 117,050 | 14,660,819 | (503 | ) | 19,663 | — | 57,068 | |||||||||||||||||||||||
| Nintendo Co., Ltd.2,8 | 9,070,426 | 1,373,200 | 4,443,899 | 5,999,727 | 245,699 | 650,886 | 70,200 | — | ||||||||||||||||||||||||
| 317,879 | ||||||||||||||||||||||||||||||||
| Materials 0.21% | ||||||||||||||||||||||||||||||||
| First Quantum Minerals Ltd. | 54,022,483 | 7,688,412 | 8,610,606 | 53,100,289 | (43,170 | ) | (289,821 | ) | 409 | 271,293 | ||||||||||||||||||||||
| Chr. Hansen Holding A/S2,8 | 7,314,000 | 186,000 | 7,314,000 | 186,000 | 392,036 | (574,689 | ) | 11,468 | — | |||||||||||||||||||||||
| Asahi Kasei Corp.2,8 | 76,292,742 | 1,032,000 | 45,125,700 | 32,199,042 | (241,488 | ) | (5,329 | ) | 18,707 | — | ||||||||||||||||||||||
| 271,293 | ||||||||||||||||||||||||||||||||
| Energy 0.00% | ||||||||||||||||||||||||||||||||
| Cenovus Energy Inc.8 | 69,818,000 | 30,755,700 | 54,418,743 | 46,154,957 | (118,662 | ) | (281,255 | ) | 13,277 | — | ||||||||||||||||||||||
| Oil Search Ltd.2,8 | 94,187,800 | 4,920,000 | 99,107,800 | — | (273,678 | ) | 32,014 | 7,223 | — | |||||||||||||||||||||||
| Tourmaline Oil Corp.8 | 16,547,000 | — | 12,499,396 | 4,047,604 | (339,503 | ) | 223,954 | 3,879 | — | |||||||||||||||||||||||
| — | ||||||||||||||||||||||||||||||||
| Utilities 1.03% | ||||||||||||||||||||||||||||||||
| ENN Energy Holdings Ltd.2 | 77,627,000 | 1,186,000 | 5,068,800 | 73,744,200 | (2,228 | ) | (3,316 | ) | 11,106 | 709,198 | ||||||||||||||||||||||
| China Resources Gas Group Ltd.2 | 76,616,000 | 69,242,000 | 19,240,000 | 126,618,000 | 858 | 37,416 | 11,588 | 635,653 | ||||||||||||||||||||||||
| 1,344,851 | ||||||||||||||||||||||||||||||||
| Short-term securities 8.75% | ||||||||||||||||||||||||||||||||
| Money market investments 8.75% | ||||||||||||||||||||||||||||||||
| Capital Group Central Cash Fund 1.00%5 | 93,044,336 | 224,043,130 | 203,092,397 | 113,995,069 | 97 | 5,705 | 233,582 | 11,404,067 | ||||||||||||||||||||||||
| Total 19.37% | $ | (1,327,376 | ) | $ | (3,157,241 | ) | $ | 651,299 | $ | 25,239,822 | ||||||||||||||||||||||
| 1 | Security did not produce income during the last 12 months. |
| 2 | Valued under fair value procedures adopted by authority of the board of trustees. The total value of all such securities, including those in “Other securities,” was $102,147,116,000, which represented 78.38% of the net assets of the fund. This amount includes $102,047,159,000 related to certain securities trading outside the U.S. whose values were adjusted as a result of significant market movements following the close of local trading. |
| 3 | Represents an affiliated company as defined under the Investment Company Act of 1940. |
| 4 | All or a portion of this security was on loan. The total value of all such securities, including those in “Other securities,” was $71,863,000, which represented .06% of the net assets of the fund. Refer to Note 5 for more information on securities lending. |
| 5 | Rate represents the seven-day yield at 3/31/2020. |
| 6 | Security purchased with cash collateral from securities on loan. Refer to Note 5 for more information on securities lending. |
| 7 | This security changed its name during the reporting period. |
| 8 | Unaffiliated issuer at 3/31/2020. |
| 9 | Value determined using significant unobservable inputs. |
Key to abbreviations
ADR = American Depositary Receipts
CAD = Canadian dollars
CDI = CREST Depository Interest
EUR = Euros
GBP = British pounds
See notes to financial statements.
| 10 | EuroPacific Growth Fund |
Financial statements
| Statement of assets and liabilities | |
| at March 31, 2020 | (dollars in thousands) |
| Assets: | ||||||||
| Investment securities, at value: | ||||||||
| Unaffiliated issuers (cost: $87,913,213) | $ | 104,503,832 | ||||||
| Affiliated issuers (cost: $26,988,686) | 25,239,822 | $ | 129,743,654 | |||||
| Cash | 78,659 | |||||||
| Cash denominated in currencies other than U.S. dollars (cost: $70,018) | 70,042 | |||||||
| Receivables for: | ||||||||
| Sales of investments | 431,364 | |||||||
| Sales of fund’s shares | 323,109 | |||||||
| Dividends and interest | 471,817 | |||||||
| Securities lending income | 77 | 1,226,367 | ||||||
| 131,118,722 | ||||||||
| Liabilities: | ||||||||
| Collateral for securities on loan | 34,629 | |||||||
| Payables for: | ||||||||
| Purchases of investments | 409,371 | |||||||
| Repurchases of fund’s shares | 246,992 | |||||||
| Investment advisory services | 47,946 | |||||||
| Services provided by related parties | 14,322 | |||||||
| Trustees’ deferred compensation | 4,094 | |||||||
| Non-U.S. taxes | 29,146 | |||||||
| Other | 9,652 | 761,523 | ||||||
| Net assets at March 31, 2020 | $ | 130,322,570 | ||||||
| Net assets consist of: | ||||||||
| Capital paid in on shares of beneficial interest | $ | 118,342,702 | ||||||
| Total distributable earnings | 11,979,868 | |||||||
| Net assets at March 31, 2020 | $ | 130,322,570 |
(dollars and shares in thousands, except per-share amounts)
Shares of beneficial interest issued and outstanding (no stated par value) —
unlimited shares authorized (3,030,995 total shares outstanding)
| Net assets | Shares outstanding | Net asset value per share | ||||||||||
| Class A | $ | 19,074,518 | 442,270 | $ | 43.13 | |||||||
| Class C | 653,866 | 15,577 | 41.98 | |||||||||
| Class T | 9 | — | * | 43.13 | ||||||||
| Class F-1 | 2,258,910 | 52,618 | 42.93 | |||||||||
| Class F-2 | 18,606,871 | 432,753 | 43.00 | |||||||||
| Class F-3 | 12,238,873 | 283,812 | 43.12 | |||||||||
| Class 529-A | 1,095,880 | 25,739 | 42.58 | |||||||||
| Class 529-C | 148,016 | 3,566 | 41.51 | |||||||||
| Class 529-E | 46,353 | 1,100 | 42.15 | |||||||||
| Class 529-T | 10 | — | * | 43.12 | ||||||||
| Class 529-F-1 | 126,203 | 2,966 | 42.54 | |||||||||
| Class R-1 | 144,219 | 3,498 | 41.23 | |||||||||
| Class R-2 | 534,201 | 12,841 | 41.60 | |||||||||
| Class R-2E | 76,768 | 1,802 | 42.60 | |||||||||
| Class R-3 | 2,395,232 | 56,830 | 42.15 | |||||||||
| Class R-4 | 5,278,199 | 125,110 | 42.19 | |||||||||
| Class R-5E | 1,744,739 | 40,791 | 42.77 | |||||||||
| Class R-5 | 5,759,077 | 133,803 | 43.04 | |||||||||
| Class R-6 | 60,140,626 | 1,395,919 | 43.08 | |||||||||
| * | Amount less than one thousand. |
See notes to financial statements.
| EuroPacific Growth Fund | 11 |
| Statement of operations for the year ended March 31, 2020 | (dollars in thousands) |
| Investment income: | ||||||||
| Income: | ||||||||
| Dividends (net of non-U.S. taxes of $254,123; also includes $651,299 from affiliates) | $ | 2,834,450 | ||||||
| Interest | 112,781 | |||||||
| Securities lending income (net of fees) | 77 | $ | 2,947,308 | |||||
| Fees and expenses*: | ||||||||
| Investment advisory services | 661,981 | |||||||
| Distribution services | 122,750 | |||||||
| Transfer agent services | 89,141 | |||||||
| Administrative services | 53,383 | |||||||
| Reports to shareholders | 3,804 | |||||||
| Registration statement and prospectus | 2,544 | |||||||
| Trustees’ compensation | 766 | |||||||
| Auditing and legal | 525 | |||||||
| Custodian | 29,732 | |||||||
| Other | 1,367 | 965,993 | ||||||
| Net investment income | 1,981,315 | |||||||
| Net realized gain and unrealized depreciation: | ||||||||
| Net realized gain (loss) on: | ||||||||
| Investments (net of non-U.S. taxes of $10): | ||||||||
| Unaffiliated issuers | 4,395,796 | |||||||
| Affiliated issuers | (1,327,376 | ) | ||||||
| Forward currency contracts | 7,027 | |||||||
| Currency transactions | 9,999 | 3,085,446 | ||||||
| Net unrealized depreciation on: | ||||||||
| Investments: | ||||||||
| Unaffiliated issuers | (20,916,618 | ) | ||||||
| Affiliated issuers | (3,157,241 | ) | ||||||
| Forward currency contracts | (1,473 | ) | ||||||
| Currency translations | (36,112 | ) | (24,111,444 | ) | ||||
| Net realized gain and unrealized depreciation | (21,025,998 | ) | ||||||
| Net decrease in net assets resulting from operations | $ | (19,044,683 | ) |
| * | Additional information related to class-specific fees and expenses is included in the notes to financial statements. |
See notes to financial statements.
| 12 | EuroPacific Growth Fund |
| Statements of changes in net assets | |
| (dollars in thousands) |
| Year ended March 31, | ||||||||
| 2020 | 2019 | |||||||
| Operations: | ||||||||
| Net investment income | $ | 1,981,315 | $ | 2,434,145 | ||||
| Net realized gain | 3,085,446 | 353,327 | ||||||
| Net unrealized depreciation | (24,111,444 | ) | (10,967,830 | ) | ||||
| Net decrease in net assets resulting from operations | (19,044,683 | ) | (8,180,358 | ) | ||||
| Distributions paid to shareholders | (5,069,935 | ) | (8,900,930 | ) | ||||
| Net capital share transactions | (2,068,413 | ) | 6,917,067 | |||||
| Total decrease in net assets | (26,183,031 | ) | (10,164,221 | ) | ||||
| Net assets: | ||||||||
| Beginning of year | 156,505,601 | 166,669,822 | ||||||
| End of year | $ | 130,322,570 | $ | 156,505,601 | ||||
See notes to financial statements.
| EuroPacific Growth Fund | 13 |
Notes to financial statements
1. Organization
EuroPacific Growth Fund (the “fund”) is registered under the Investment Company Act of 1940 as an open-end, diversified management investment company. The fund seeks to provide long-term growth of capital. Shareholders approved a proposal to reorganize the fund from a Massachusetts business trust to a Delaware statutory trust. The reorganization may be completed in the next year; however, the fund reserves the right to delay the implementation.
The fund has 19 share classes consisting of six retail share classes (Classes A, C, T, F-1, F-2 and F-3), five 529 college savings plan share classes (Classes 529-A, 529-C, 529-E, 529-T and 529-F-1) and eight retirement plan share classes (Classes R-1, R-2, R-2E, R-3, R-4, R-5E, R-5 and R-6). The 529 college savings plan share classes can be used to save for college education. The retirement plan share classes are generally offered only through eligible employer-sponsored retirement plans. The fund’s share classes are described further in the following table:
| Share class | Initial sales charge | Contingent deferred sales charge upon redemption | Conversion feature | ||||
| Classes A and 529-A | Up to 5.75% | None (except 1% for certain redemptions within 18 months of purchase without an initial sales charge) | None | ||||
| Class C | None | 1% for redemptions within one year of purchase | Class C converts to Class F-1 after 10 years | ||||
| Class 529-C | None | 1% for redemptions within one year of purchase | Class 529-C converts to Class 529-A after 10 years | ||||
| Class 529-E | None | None | None | ||||
| Classes T and 529-T* | Up to 2.50% | None | None | ||||
| Classes F-1, F-2, F-3 and 529-F-1 | None | None | None | ||||
| Classes R-1, R-2, R-2E, R-3, R-4, R-5E, R-5 and R-6 | None | None | None |
| * | Class T and 529-T shares are not available for purchase. |
Holders of all share classes have equal pro rata rights to the assets, dividends and liquidation proceeds of the fund. Each share class has identical voting rights, except for the exclusive right to vote on matters affecting only its class. Share classes have different fees and expenses (“class-specific fees and expenses”), primarily due to different arrangements for distribution, transfer agent and administrative services. Differences in class-specific fees and expenses will result in differences in net investment income and, therefore, the payment of different per-share dividends by each share class.
2. Significant accounting policies
The fund is an investment company that applies the accounting and reporting guidance issued in Topic 946 by the U.S. Financial Accounting Standards Board. The fund’s financial statements have been prepared to comply with U.S. generally accepted accounting principles (“U.S. GAAP”). These principles require the fund’s investment adviser to make estimates and assumptions that affect reported amounts and disclosures. Actual results could differ from those estimates. Subsequent events, if any, have been evaluated through the date of issuance in the preparation of the financial statements. The fund follows the significant accounting policies described in this section, as well as the valuation policies described in the next section on valuation.
Security transactions and related investment income — Security transactions are recorded by the fund as of the date the trades are executed with brokers. Realized gains and losses from security transactions are determined based on the specific identified cost of the securities. In the event a security is purchased with a delayed payment date, the fund will segregate liquid assets sufficient to meet its payment obligations. Dividend income is recognized on the ex-dividend date and interest income is recognized on an accrual basis. Market discounts, premiums and original issue discounts on fixed-income securities are amortized daily over the expected life of the security.
Class allocations — Income, fees and expenses (other than class-specific fees and expenses) and realized and unrealized gains and losses are allocated daily among the various share classes based on their relative net assets. Class-specific fees and expenses, such as distribution, transfer agent and administrative services, are charged directly to the respective share class.
Distributions paid to shareholders — Income dividends and capital gain distributions are recorded on the ex-dividend date.
| 14 | EuroPacific Growth Fund |
Currency translation — Assets and liabilities, including investment securities, denominated in currencies other than U.S. dollars are translated into U.S. dollars at the exchange rates supplied by one or more pricing vendors on the valuation date. Purchases and sales of investment securities and income and expenses are translated into U.S. dollars at the exchange rates on the dates of such transactions. The effects of changes in exchange rates on investment securities are included with the net realized gain or loss and net unrealized appreciation or depreciation on investments in the fund’s statement of operations. The realized gain or loss and unrealized appreciation or depreciation resulting from all other transactions denominated in currencies other than U.S. dollars are disclosed separately.
3. Valuation
Capital Research and Management Company (“CRMC”), the fund’s investment adviser, values the fund’s investments at fair value as defined by U.S. GAAP. The net asset value of each share class of the fund is generally determined as of approximately 4:00 p.m. New York time each day the New York Stock Exchange is open.
Methods and inputs — The fund’s investment adviser uses the following methods and inputs to establish the fair value of the fund’s assets and liabilities. Use of particular methods and inputs may vary over time based on availability and relevance as market and economic conditions evolve.
Equity securities are generally valued at the official closing price of, or the last reported sale price on, the exchange or market on which such securities are traded, as of the close of business on the day the securities are being valued or, lacking any sales, at the last available bid price. Prices for each security are taken from the principal exchange or market on which the security trades.
Fixed-income securities, including short-term securities, are generally valued at prices obtained from one or more pricing vendors. Vendors value such securities based on one or more of the inputs described in the following table. The table provides examples of inputs that are commonly relevant for valuing particular classes of fixed-income securities in which the fund is authorized to invest. However, these classifications are not exclusive, and any of the inputs may be used to value any other class of fixed-income security.
| Fixed-income class | Examples of standard inputs | |
| All | Benchmark yields, transactions, bids, offers, quotations from dealers and trading systems, new issues, spreads and other relationships observed in the markets among comparable securities; and proprietary pricing models such as yield measures calculated using factors such as cash flows, financial or collateral performance and other reference data (collectively referred to as “standard inputs”) | |
| Corporate bonds & notes; convertible securities | Standard inputs and underlying equity of the issuer | |
| Bonds & notes of governments & government agencies | Standard inputs and interest rate volatilities |
When the fund’s investment adviser deems it appropriate to do so (such as when vendor prices are unavailable or deemed to be not representative), fixed-income securities will be valued in good faith at the mean quoted bid and ask prices that are reasonably and timely available (or bid prices, if ask prices are not available) or at prices for securities of comparable maturity, quality and type.
Securities with both fixed-income and equity characteristics, or equity securities traded principally among fixed-income dealers, are generally valued in the manner described for either equity or fixed-income securities, depending on which method is deemed most appropriate by the fund’s investment adviser. The Capital Group Central Cash Fund (“CCF”), a fund within the Capital Group Central Fund Series (“Central Funds”), is valued based upon a floating net asset value, which fluctuates with changes in the value of CCF’s portfolio securities. The underlying securities are valued based on the policies and procedures in CCF’s statement of additional information. Forward currency contracts are valued at the mean of representative quoted bid and ask prices, generally based on prices supplied by one or more pricing vendors.
Securities and other assets for which representative market quotations are not readily available or are considered unreliable by the fund’s investment adviser are fair valued as determined in good faith under fair valuation guidelines adopted by authority of the fund’s board of trustees as further described. The investment adviser follows fair valuation guidelines, consistent with U.S. Securities and Exchange Commission rules and guidance, to consider relevant principles and factors when making fair value determinations. The investment adviser considers relevant indications of value that are reasonably and timely available to it in determining the fair value to be assigned to a particular security, such as the type and cost of the security; contractual or legal restrictions on resale of the security; relevant financial or business developments of the issuer; actively traded similar or related securities; conversion or exchange rights on the security; related corporate actions; significant events occurring after the close of trading in the security; and changes in overall market conditions. In addition, the closing prices of equity securities that trade in markets outside U.S. time zones may be adjusted to reflect significant events
| EuroPacific Growth Fund | 15 |
that occur after the close of local trading but before the net asset value of each share class of the fund is determined. Fair valuations and valuations of investments that are not actively trading involve judgment and may differ materially from valuations that would have been used had greater market activity occurred.
Processes and structure — The fund’s board of trustees has delegated authority to the fund’s investment adviser to make fair value determinations, subject to board oversight. The investment adviser has established a Joint Fair Valuation Committee (the “Fair Valuation Committee”) to administer, implement and oversee the fair valuation process, and to make fair value decisions. The Fair Valuation Committee regularly reviews its own fair value decisions, as well as decisions made under its standing instructions to the investment adviser’s valuation teams. The Fair Valuation Committee reviews changes in fair value measurements from period to period and may, as deemed appropriate, update the fair valuation guidelines to better reflect the results of back testing and address new or evolving issues. The Fair Valuation Committee reports any changes to the fair valuation guidelines to the board of trustees. The fund’s board and audit committee also regularly review reports that describe fair value determinations and methods.
The fund’s investment adviser has also established a Fixed-Income Pricing Review Group to administer and oversee the fixed-income valuation process, including the use of fixed-income pricing vendors. This group regularly reviews pricing vendor information and market data. Pricing decisions, processes and controls over security valuation are also subject to additional internal reviews, including an annual control self-evaluation program facilitated by the investment adviser’s compliance group.
Classifications — The fund’s investment adviser classifies the fund’s assets and liabilities into three levels based on the inputs used to value the assets or liabilities. Level 1 values are based on quoted prices in active markets for identical securities. Level 2 values are based on significant observable market inputs, such as quoted prices for similar securities and quoted prices in inactive markets. Certain securities trading outside the U.S. may transfer between Level 1 and Level 2 due to valuation adjustments resulting from significant market movements following the close of local trading. Level 3 values are based on significant unobservable inputs that reflect the investment adviser’s determination of assumptions that market participants might reasonably use in valuing the securities. The valuation levels are not necessarily an indication of the risk or liquidity associated with the underlying investment. For example, U.S. government securities are reflected as Level 2 because the inputs used to determine fair value may not always be quoted prices in an active market. The following table presents the fund’s valuation levels as of March 31, 2020 (dollars in thousands):
| Investment securities | ||||||||||||||||
| Level 1 | Level 2 | Level 3 | Total | |||||||||||||
| Assets: | ||||||||||||||||
| Common stocks: | ||||||||||||||||
| Consumer discretionary | $ | 4,877,620 | $ | 15,360,893 | $ | — | $ | 20,238,513 | ||||||||
| Financials | 1,895,943 | 16,645,521 | — | 18,541,464 | ||||||||||||
| Information technology | 2,275,501 | 15,094,939 | — | 17,370,440 | ||||||||||||
| Health care | 1,348,311 | 15,483,095 | 8,290 | 16,839,696 | ||||||||||||
| Industrials | 331,342 | 9,964,539 | — | 10,295,881 | ||||||||||||
| Consumer staples | 699,450 | 7,209,117 | — | 7,908,567 | ||||||||||||
| Communication services | 875,067 | 6,762,391 | — | 7,637,458 | ||||||||||||
| Materials | 2,230,946 | 4,940,671 | — | 7,171,617 | ||||||||||||
| Energy | 1,198,329 | 3,490,501 | — | 4,688,830 | ||||||||||||
| Utilities | — | 4,379,526 | — | 4,379,526 | ||||||||||||
| Real estate | — | 1,609,082 | — | 1,609,082 | ||||||||||||
| Preferred securities | 311,306 | 1,120,920 | — | * | 1,432,226 | |||||||||||
| Rights & warrants | — | 77,631 | — | 77,631 | ||||||||||||
| Bonds, notes & other debt instruments | — | 114,027 | — | 114,027 | ||||||||||||
| Short-term securities | 11,438,696 | — | — | 11,438,696 | ||||||||||||
| Total | $ | 27,482,511 | $ | 102,252,853 | $ | 8,290 | $ | 129,743,654 | ||||||||
| * | Amount less than one thousand. |
4. Risk factors
Investing in the fund may involve certain risks including, but not limited to, those described below.
Market conditions — The prices of, and the income generated by, the common stocks and other securities held by the fund may decline — sometimes rapidly or unpredictably — due to various factors, including events or conditions affecting the general economy or particular industries; overall market changes; local, regional or global political, social or economic instability; governmental, governmental agency or central bank responses to economic conditions; and currency exchange rate, interest rate and commodity price fluctuations.
| 16 | EuroPacific Growth Fund |
Issuer risks — The prices of, and the income generated by, securities held by the fund may decline in response to various factors directly related to the issuers of such securities, including reduced demand for an issuer’s goods or services, poor management performance, major litigation related to the issuer, changes in government regulations affecting the issuer or its competitive environment and strategic initiatives such as mergers, acquisitions or dispositions and the market response to any such initiatives.
Investing in growth-oriented stocks — Growth-oriented common stocks and other equity-type securities (such as preferred stocks, convertible preferred stocks and convertible bonds) may involve larger price swings and greater potential for loss than other types of investments. These risks may be even greater in the case of smaller capitalization stocks.
Investing outside the U.S. — Securities of issuers domiciled outside the U.S., or with significant operations or revenues outside the U.S., may lose value because of adverse political, social, economic or market developments (including social instability, regional conflicts, terrorism and war) in the countries or regions in which the issuers operate or generate revenue. These securities may also lose value due to changes in foreign currency exchange rates against the U.S. dollar and/or currencies of other countries. Issuers of these securities may be more susceptible to actions of foreign governments, such as nationalization, currency blockage or the imposition of price controls or punitive taxes, each of which could adversely impact the value of these securities. Securities markets in certain countries may be more volatile and/or less liquid than those in the U.S. Investments outside the U.S. may also be subject to different accounting practices and different regulatory, legal and reporting standards and practices, and may be more difficult to value, than those in the U.S. In addition, the value of investments outside the U.S. may be reduced by foreign taxes, including foreign withholding taxes on interest and dividends. Further, there may be increased risks of delayed settlement of securities purchased or sold by the fund. The risks of investing outside the U.S. may be heightened in connection with investments in emerging markets.
Investing in emerging markets — Investing in emerging markets may involve risks in addition to and greater than those generally associated with investing in the securities markets of developed countries. For instance, emerging market countries may have less developed legal and accounting systems than those in developed countries. The governments of these countries may be less stable and more likely to impose capital controls, nationalize a company or industry, place restrictions on foreign ownership and on withdrawing sale proceeds of securities from the country, and/or impose punitive taxes that could adversely affect the prices of securities. In addition, the economies of these countries may be dependent on relatively few industries that are more susceptible to local and global changes. Securities markets in these countries can also be relatively small and have substantially lower trading volumes. As a result, securities issued in these countries may be more volatile and less liquid, and may be more difficult to value, than securities issued in countries with more developed economies and/or markets. Less certainty with respect to security valuations may lead to additional challenges and risks in calculating the fund’s net asset value. Additionally, emerging markets are more likely to experience problems with the clearing and settling of trades and the holding of securities by banks, agents and depositories that are less established than those in developed countries.
Management — The investment adviser to the fund actively manages the fund’s investments. Consequently, the fund is subject to the risk that the methods and analyses, including models, tools and data, employed by the investment adviser in this process may be flawed or incorrect and may not produce the desired results. This could cause the fund to lose value or its investment results to lag relevant benchmarks or other funds with similar objectives.
5. Certain investment techniques
Securities lending — The fund has entered into securities lending transactions in which the fund earns income by lending investment securities to brokers, dealers or other institutions. Each transaction involves three parties: the fund, acting as the lender of the securities, a borrower, and a lending agent that acts as an intermediary.
Securities lending transactions are entered into by the fund under a securities lending agent agreement with the lending agent. The lending agent facilitates the exchange of securities between the lender and approved borrowers, ensures that securities loans are properly coordinated and documented, marks-to-market the value of collateral daily, secures additional collateral from a borrower if it falls below preset terms, and may reinvest cash collateral on behalf of the fund according to agreed parameters. The lending agent provides indemnification to the fund against losses resulting from a borrower default. Although risk is mitigated by the collateral and indemnification, the fund could experience a delay in recovering its securities and a potential loss of income or value if a borrower fails to return securities, collateral investments decline in value or the lending agent fails to perform.
The borrower is required to post highly liquid assets, such as cash or U.S. government securities, as collateral for the loan in an amount at least equal to the value of the securities loaned. Investments made with cash collateral are recognized as assets in the fund’s investment portfolio. The same amount is recorded as a liability in the fund’s statement of assets and liabilities. While securities are on loan, the fund will continue to receive the equivalent of the interest, dividends or other distributions paid by the issuer, as well as a portion of the interest
| EuroPacific Growth Fund | 17 |
on the investment of the collateral. Additionally, although the fund does not have the right to vote on securities while they are on loan, the fund has a right to consent on corporate actions and a right to recall loaned securities to vote. A borrower is obligated to return loaned securities at the conclusion of a loan or, during the pendency of a loan, on demand from the fund.
As of March 31, 2020, the total value of securities on loan was $71,863,000, and the total value of collateral received was $77,345,000. Collateral received includes cash of $34,629,000 and U.S. government securities of $42,716,000. Investment securities purchased from cash collateral of $34,629,000 are disclosed in the summary investment portfolio as short-term securities. Securities received as collateral, if any, are not recognized as fund assets. The contractual maturity of cash collateral received under the securities lending agreement is classified as overnight and continuous.
Forward currency contracts — The fund has entered into forward currency contracts, which represent agreements to exchange currencies on specific future dates at predetermined rates. The fund’s investment adviser uses forward currency contracts to manage the fund’s exposure to changes in exchange rates. Upon entering into these contracts, risks may arise from the potential inability of counterparties to meet the terms of their contracts and from possible movements in exchange rates.
On a daily basis, the fund’s investment adviser values forward currency contracts and records unrealized appreciation or depreciation for open forward currency contracts in the fund’s statement of assets and liabilities. Realized gains or losses are recorded at the time the forward currency contract is closed or offset by another contract with the same broker for the same settlement date and currency.
Closed forward currency contracts that have not reached their settlement date are included in the respective receivables or payables for closed forward currency contracts in the fund’s statement of assets and liabilities. Net realized gains or losses from closed forward currency contracts and net unrealized appreciation or depreciation from open forward currency contracts are recorded in the fund’s statement of operations. As of March 31, 2020, the fund did not have any open forward currency contracts. The average month-end notional amount of open forward currency contracts while held was $460,164,000.
The following table identifies the effect on the fund’s statement of operations resulting from the fund’s use of forward currency contracts for the year ended March 31, 2020 (dollars in thousands):
| Net realized gain | Net unrealized depreciation | |||||||||||||
| Contracts | Risk type | Location on statement of operations | Value | Location on statement of operations | Value | |||||||||
| Forward currency | Currency | Net realized gain on forward currency contracts | $ | 7,027 | Net unrealized depreciation on forward currency contracts | $ | (1,473 | ) | ||||||
Collateral — The fund participates in a collateral program due to securities lending and its use of forward currency contracts. For securities lending, the fund receives collateral in exchange for lending investment securities. The purpose of the collateral is to cover potential losses that could occur in the event that the borrower cannot meet its contractual obligation. The lending agent may reinvest collateral from securities lending transactions according to agreed parameters. Cash collateral reinvested by the lending agent, if any, is disclosed in the fund’s summary investment portfolio. For forward currency contracts, the fund either receives or pledges collateral based on the net gain or loss on unsettled forward currency contracts by counterparty. The purpose of the collateral is to cover potential losses that could occur in the event that either party cannot meet its contractual obligation. Non-cash collateral pledged by the fund, if any, is disclosed in the fund’s investment portfolio, and cash collateral pledged by the fund, if any, is held in a segregated account with the fund’s custodian, which is reflected as pledged cash collateral in the fund’s statement of assets and liabilities.
6. Taxation and distributions
Federal income taxation — The fund complies with the requirements under Subchapter M of the Internal Revenue Code applicable to mutual funds and intends to distribute substantially all of its net taxable income and net capital gains each year. The fund is not subject to income taxes to the extent such distributions are made. Therefore, no federal income tax provision is required.
As of and during the year ended March 31, 2020, the fund did not have a liability for any unrecognized tax benefits. The fund recognizes interest and penalties, if any, related to unrecognized tax benefits as income tax expense in the statement of operations. During the period, the fund did not incur any significant interest or penalties.
The fund’s tax returns are not subject to examination by federal, state and, if applicable, non-U.S. tax authorities after the expiration of each jurisdiction’s statute of limitations, which is generally three years after the date of filing but can be extended in certain jurisdictions.
| 18 | EuroPacific Growth Fund |
Non-U.S. taxation — Dividend and interest income are recorded net of non-U.S. taxes paid. The fund may file withholding tax reclaims in certain jurisdictions to recover a portion of amounts previously withheld. As a result of rulings from European courts, the fund filed for additional reclaims related to prior years. These reclaims are recorded when the amount is known and there are no significant uncertainties on collectability. Gains realized by the fund on the sale of securities in certain countries, if any, may be subject to non-U.S. taxes. If applicable, the fund records an estimated deferred tax liability based on unrealized gains to provide for potential non-U.S. taxes payable upon the sale of these securities.
Distributions — Distributions paid to shareholders are based on net investment income and net realized gains determined on a tax basis, which may differ from net investment income and net realized gains for financial reporting purposes. These differences are due primarily to different treatment for items such as currency gains and losses; short-term capital gains and losses; capital losses related to sales of certain securities within 30 days of purchase; unrealized appreciation of certain investments in securities outside the U.S.; deferred expenses; cost of investments sold and income on certain investments. The fiscal year in which amounts are distributed may differ from the year in which the net investment income and net realized gains are recorded by the fund for financial reporting purposes. The fund may also designate a portion of the amount paid to redeeming shareholders as a distribution for tax purposes.
During the year ended March 31, 2020, the fund reclassified $590,508,000 from total distributable earnings to capital paid in on shares of beneficial interest to align financial reporting with tax reporting.
As of March 31, 2020, the tax basis components of distributable earnings, unrealized appreciation (depreciation) and cost of investments were as follows (dollars in thousands):
| Post-October capital loss deferral* | $ | (1,546,268 | ) | |
| Gross unrealized appreciation on investments | 28,739,628 | |||
| Gross unrealized depreciation on investments | (15,203,310 | ) | ||
| Net unrealized appreciation on investments | 13,536,318 | |||
| Cost of investments | 116,207,336 |
| * | This deferral is considered incurred in the subsequent year. |
Distributions paid were characterized for tax purposes as follows (dollars in thousands):
| Year ended March 31, 2020 | Year ended March 31, 2019 | |||||||||||||||||||||||
| Share class | Ordinary income | Long-term capital gains | Total distributions paid | Ordinary income | Long-term capital gains | Total distributions paid | ||||||||||||||||||
| Class A | $ | 261,015 | $ | 438,500 | $ | 699,515 | $ | 300,775 | $ | 1,127,603 | $ | 1,428,378 | ||||||||||||
| Class C | 3,469 | 16,160 | 19,629 | 6,163 | 51,849 | 58,012 | ||||||||||||||||||
| Class T | — | * | — | * | — | * | — | * | — | * | — | * | ||||||||||||
| Class F-1 | 30,972 | 53,340 | 84,312 | 35,862 | 161,250 | 197,112 | ||||||||||||||||||
| Class F-2 | 320,054 | 436,534 | 756,588 | 357,839 | 1,054,389 | 1,412,228 | ||||||||||||||||||
| Class F-3 | 207,100 | 264,488 | 471,588 | 168,391 | 423,728 | 592,119 | ||||||||||||||||||
| Class 529-A | 14,393 | 24,982 | 39,375 | 15,928 | 61,112 | 77,040 | ||||||||||||||||||
| Class 529-C | 788 | 3,631 | 4,419 | 1,305 | 10,802 | 12,107 | ||||||||||||||||||
| Class 529-E | 487 | 1,071 | 1,558 | 617 | 2,818 | 3,435 | ||||||||||||||||||
| Class 529-T | — | * | — | * | — | * | — | * | — | * | — | * | ||||||||||||
| Class 529-F-1 | 1,957 | 2,787 | 4,744 | 2,015 | 5,727 | 7,742 | ||||||||||||||||||
| Class R-1 | 908 | 3,673 | 4,581 | 1,368 | 10,489 | 11,857 | ||||||||||||||||||
| Class R-2 | 3,359 | 12,731 | 16,090 | 4,303 | 32,240 | 36,543 | ||||||||||||||||||
| Class R-2E | 703 | 1,804 | 2,507 | 227 | 8,663 | 8,890 | ||||||||||||||||||
| Class R-3 | 25,201 | 58,515 | 83,716 | 35,061 | 176,288 | 211,349 | ||||||||||||||||||
| Class R-4 | 80,355 | 133,603 | 213,958 | 102,828 | 402,073 | 504,901 | ||||||||||||||||||
| Class R-5E | 22,920 | 32,062 | 54,982 | 20,731 | 38,416 | 59,147 | ||||||||||||||||||
| Class R-5 | 106,341 | 138,184 | 244,525 | 112,862 | 359,636 | 472,498 | ||||||||||||||||||
| Class R-6 | 1,045,181 | 1,322,667 | 2,367,848 | 1,027,207 | 2,780,365 | 3,807,572 | ||||||||||||||||||
| Total | $ | 2,125,203 | $ | 2,944,732 | $ | 5,069,935 | $ | 2,193,482 | $ | 6,707,448 | $ | 8,900,930 | ||||||||||||
| * | Amount less than one thousand. |
| EuroPacific Growth Fund | 19 |
7. Fees and transactions with related parties
CRMC, the fund’s investment adviser, is the parent company of American Funds Distributors®, Inc. (“AFD”), the principal underwriter of the fund’s shares, and American Funds Service Company® (“AFS”), the fund’s transfer agent. CRMC, AFD and AFS are considered related parties to the fund.
Investment advisory services — The fund has an investment advisory and service agreement with CRMC that provides for monthly fees accrued daily. These fees are based on a series of decreasing annual rates beginning with 0.690% on the first $500 million of daily net assets and decreasing to 0.392% on such assets in excess of $186 billion. For the year ended March 31, 2020, the investment advisory services fee was $661,981,000, which was equivalent to an annualized rate of 0.414% of average daily net assets.
Class-specific fees and expenses — Expenses that are specific to individual share classes are accrued directly to the respective share class. The principal class-specific fees and expenses are further described below:
Distribution services — The fund has plans of distribution for all share classes, except Class F-2, F-3, R-5E, R-5 and R-6 shares. Under the plans, the board of trustees approves certain categories of expenses that are used to finance activities primarily intended to sell fund shares and service existing accounts. The plans provide for payments, based on an annualized percentage of average daily net assets, ranging from 0.25% to 1.00% as noted in this section. In some cases, the board of trustees has limited the amounts that may be paid to less than the maximum allowed by the plans. All share classes with a plan may use up to 0.25% of average daily net assets to pay service fees, or to compensate AFD for paying service fees, to firms that have entered into agreements with AFD to provide certain shareholder services. The remaining amounts available to be paid under each plan are paid to dealers to compensate them for their sales activities.
| Share class | Currently approved limits | Plan limits | ||||||
| Class A | 0.25 | % | 0.25 | % | ||||
| Class 529-A | 0.25 | 0.50 | ||||||
| Classes C, 529-C and R-1 | 1.00 | 1.00 | ||||||
| Class R-2 | 0.75 | 1.00 | ||||||
| Class R-2E | 0.60 | 0.85 | ||||||
| Classes 529-E and R-3 | 0.50 | 0.75 | ||||||
| Classes T, F-1, 529-T, 529-F-1 and R-4 | 0.25 | 0.50 | ||||||
For Class A and 529-A shares, distribution-related expenses include the reimbursement of dealer and wholesaler commissions paid by AFD for certain shares sold without a sales charge. These share classes reimburse AFD for amounts billed within the prior 15 months but only to the extent that the overall annual expense limits are not exceeded. As of March 31, 2020, there were no unreimbursed expenses subject to reimbursement for Class A or 529-A shares.
Transfer agent services — The fund has a shareholder services agreement with AFS under which the fund compensates AFS for providing transfer agent services to each of the fund’s share classes. These services include recordkeeping, shareholder communications and transaction processing. In addition, the fund reimburses AFS for amounts paid to third parties for performing transfer agent services on behalf of fund shareholders.
Administrative services — The fund has an administrative services agreement with CRMC under which the fund compensates CRMC for providing administrative services to all share classes. Administrative services are provided by CRMC and its affiliates to help assist third parties providing non-distribution services to fund shareholders. These services include providing in depth information on the fund and market developments that impact fund investments. Administrative services also include, but are not limited to, coordinating, monitoring and overseeing third parties that provide services to fund shareholders. The agreement provides the fund the ability to charge an administrative services fee at the annual rate of 0.05% of the daily net assets attributable to each share class of the fund. Prior to July 1, 2019, Class A shares paid CRMC an administrative services fee at the annual rate of 0.01% of daily net assets and all other share classes paid a fee at the annual rate of 0.05% of their respective daily net assets. The fund’s board of trustees authorized the fund to pay CRMC effective July 1, 2019, an administrative services fee at the annual rate of 0.03% of the average daily net assets attributable to each share class of the fund (which could increase as noted above) for CRMC’s provision of administrative services.
529 plan services — Each 529 share class is subject to service fees to compensate the Virginia College Savings Plan (“Virginia529”) for its oversight and administration of the CollegeAmerica 529 college savings plan. The fee is based on the combined net assets invested in Class 529 and ABLE shares of the American Funds. Class ABLE shares are offered on other American Funds by Virginia529 through ABLEAmerica, a tax-advantaged savings program for individuals with disabilities. Prior to January 1, 2020, the
| 20 | EuroPacific Growth Fund |
quarterly fee was based on a series of decreasing annual rates beginning with 0.10% on the first $20 billion of the combined net assets invested in the American Funds and decreasing to 0.03% on such assets in excess of $100 billion. Effective January 1, 2020, the quarterly fee was amended to a series of decreasing annual rates beginning with 0.09% on the first $20 billion of the combined net assets invested in the American Funds and decreasing to 0.03% on such assets in excess of $100 billion. The fee for any given calendar quarter is accrued and calculated on the basis of the average net assets of Class 529 and ABLE shares of the American Funds for the last month of the prior calendar quarter. The fee is included in other expenses in the fund’s statement of operations. Virginia529 is not considered a related party to the fund.
For the year ended March 31, 2020, class-specific expenses under the agreements were as follows (dollars in thousands):
| Share class | Distribution services | Transfer agent services | Administrative services | 529 plan services | ||||||||||||
| Class A | $58,915 | $32,320 | $6,055 | Not applicable | ||||||||||||
| Class C | 9,068 | 1,135 | 325 | Not applicable | ||||||||||||
| Class T | — | — | * | — | * | Not applicable | ||||||||||
| Class F-1 | 7,541 | 3,958 | 1,068 | Not applicable | ||||||||||||
| Class F-2 | Not applicable | 27,775 | 8,565 | Not applicable | ||||||||||||
| Class F-3 | Not applicable | 342 | 4,697 | Not applicable | ||||||||||||
| Class 529-A | 3,100 | 1,460 | 478 | $879 | ||||||||||||
| Class 529-C | 1,938 | 218 | 71 | 129 | ||||||||||||
| Class 529-E | 286 | 37 | 20 | 38 | ||||||||||||
| Class 529-T | — | — | * | — | * | — | * | |||||||||
| Class 529-F-1 | — | 159 | 52 | 96 | ||||||||||||
| Class R-1 | 1,975 | 224 | 70 | Not applicable | ||||||||||||
| Class R-2 | 5,097 | 2,387 | 238 | Not applicable | ||||||||||||
| Class R-2E | 573 | 198 | 33 | Not applicable | ||||||||||||
| Class R-3 | 16,165 | 4,964 | 1,140 | Not applicable | ||||||||||||
| Class R-4 | 18,092 | 7,333 | 2,550 | Not applicable | ||||||||||||
| Class R-5E | Not applicable | 2,479 | 590 | Not applicable | ||||||||||||
| Class R-5 | Not applicable | 3,557 | 2,633 | Not applicable | ||||||||||||
| Class R-6 | Not applicable | 595 | 24,798 | Not applicable | ||||||||||||
| Total class-specific expenses | $122,750 | $89,141 | $53,383 | $1,142 | ||||||||||||
| * | Amount less than one thousand. |
Trustees’ deferred compensation — Trustees who are unaffiliated with CRMC may elect to defer the cash payment of part or all of their compensation. These deferred amounts, which remain as liabilities of the fund, are treated as if invested in shares of the fund or other American Funds. These amounts represent general, unsecured liabilities of the fund and vary according to the total returns of the selected funds. Trustees’ compensation of $766,000 in the fund’s statement of operations reflects $559,000 in current fees (either paid in cash or deferred) and a net increase of $207,000 in the value of the deferred amounts.
Affiliated officers and trustees — Officers and certain trustees of the fund are or may be considered to be affiliated with CRMC, AFD and AFS. No affiliated officers or trustees received any compensation directly from the fund.
Investment in CCF — The fund holds shares of CCF, an institutional prime money market fund managed by CRMC. CCF invests in high-quality, short-term money market instruments. CCF is used as the primary investment vehicle for the fund’s short-term investments. CCF shares are only available for purchase by CRMC, its affiliates, and other funds managed by CRMC or its affiliates, and are not available to the public. CRMC does not receive an investment advisory services fee from CCF.
Security transactions with related funds — The fund purchased securities from, and sold securities to, other funds managed by CRMC (or funds managed by certain affiliates of CRMC) under procedures adopted by the fund’s board of trustees. The funds involved in such transactions are considered related by virtue of having a common investment adviser (or affiliated investment advisers), common trustees and/or common officers. Each transaction was executed at the current market price of the security and no brokerage commissions or fees were paid in accordance with Rule 17a-7 of the 1940 Act. During the year ended March 31, 2020, the fund engaged in such purchase and sale transactions with related funds in the amounts of $1,626,254,000 and $1,843,672,000, respectively, which generated $101,184,000 of net realized losses from such sales.
Interfund lending — Pursuant to an exemptive order issued by the SEC, the fund, along with other CRMC-managed funds (or funds managed by certain affiliates of CRMC), may participate in an interfund lending program. The program provides an alternate credit facility that permits the funds to lend or borrow cash for temporary purposes directly to or from one another, subject to the conditions of the
| EuroPacific Growth Fund | 21 |
exemptive order. The fund did not lend or borrow cash through the interfund lending program at any time during the year ended March 31, 2020.
8. Capital share transactions
Capital share transactions in the fund were as follows (dollars and shares in thousands):
| Reinvestments of | Net (decrease) | |||||||||||||||||||||||||||||||
| Sales* | distributions | Repurchases* | increase | |||||||||||||||||||||||||||||
| Share class | Amount | Shares | Amount | Shares | Amount | Shares | Amount | Shares | ||||||||||||||||||||||||
| Year ended March 31, 2020 | ||||||||||||||||||||||||||||||||
| Class A | $ | 1,274,015 | 24,688 | $ | 684,017 | 12,395 | $ | (4,068,897 | ) | (79,294 | ) | $ | (2,110,865 | ) | (42,211 | ) | ||||||||||||||||
| Class C | 71,722 | 1,416 | 19,407 | 360 | (334,117 | ) | (6,627 | ) | (242,988 | ) | (4,851 | ) | ||||||||||||||||||||
| Class T | — | — | — | — | — | — | — | — | ||||||||||||||||||||||||
| Class F-1 | 418,803 | 8,114 | 81,854 | 1,490 | (1,057,188 | ) | (20,666 | ) | (556,531 | ) | (11,062 | ) | ||||||||||||||||||||
| Class F-2 | 5,144,729 | 100,669 | 723,904 | 13,185 | (8,426,394 | ) | (164,771 | ) | (2,557,761 | ) | (50,917 | ) | ||||||||||||||||||||
| Class F-3 | 4,884,766 | 95,241 | 422,315 | 7,670 | (2,735,186 | ) | (54,352 | ) | 2,571,895 | 48,559 | ||||||||||||||||||||||
| Class 529-A | 131,361 | 2,537 | 39,363 | 722 | (248,626 | ) | (4,840 | ) | (77,902 | ) | (1,581 | ) | ||||||||||||||||||||
| Class 529-C | 18,708 | 371 | 4,417 | 83 | (67,226 | ) | (1,331 | ) | (44,101 | ) | (877 | ) | ||||||||||||||||||||
| Class 529-E | 5,156 | 102 | 1,558 | 29 | (11,691 | ) | (230 | ) | (4,977 | ) | (99 | ) | ||||||||||||||||||||
| Class 529-T | — | — | — | † | — | † | — | — | — | † | — | † | ||||||||||||||||||||
| Class 529-F-1 | 30,766 | 595 | 4,741 | 87 | (31,168 | ) | (607 | ) | 4,339 | 75 | ||||||||||||||||||||||
| Class R-1 | 19,610 | 403 | 4,576 | 86 | (62,831 | ) | (1,268 | ) | (38,645 | ) | (779 | ) | ||||||||||||||||||||
| Class R-2 | 165,222 | 3,260 | 16,078 | 301 | (237,918 | ) | (4,721 | ) | (56,618 | ) | (1,160 | ) | ||||||||||||||||||||
| Class R-2E | 24,419 | 474 | 2,506 | 46 | (24,138 | ) | (476 | ) | 2,787 | 44 | ||||||||||||||||||||||
| Class R-3 | 452,952 | 8,951 | 83,634 | 1,546 | (1,164,746 | ) | (22,786 | ) | (628,160 | ) | (12,289 | ) | ||||||||||||||||||||
| Class R-4 | 1,153,114 | 22,768 | 213,908 | 3,963 | (2,908,739 | ) | (56,210 | ) | (1,541,717 | ) | (29,479 | ) | ||||||||||||||||||||
| Class R-5E | 956,114 | 18,124 | 54,982 | 1,006 | (430,357 | ) | (8,211 | ) | 580,739 | 10,919 | ||||||||||||||||||||||
| Class R-5 | 1,694,832 | 32,584 | 244,248 | 4,445 | (2,436,024 | ) | (46,366 | ) | (496,944 | ) | (9,337 | ) | ||||||||||||||||||||
| Class R-6 | 13,841,526 | 267,563 | 2,360,459 | 42,925 | (13,072,949 | ) | (254,335 | ) | 3,129,036 | 56,153 | ||||||||||||||||||||||
| Total net increase (decrease) | $ | 30,287,815 | 587,860 | $ | 4,961,967 | 90,339 | $ | (37,318,195 | ) | (727,091 | ) | $ | (2,068,413 | ) | (48,892 | ) | ||||||||||||||||
| Year ended March 31, 2019 | ||||||||||||||||||||||||||||||||
| Class A | $ | 1,745,025 | 33,779 | $ | 1,400,728 | 27,795 | $ | (4,591,568 | ) | (90,056 | ) | $ | (1,445,815 | ) | (28,482 | ) | ||||||||||||||||
| Class C | 131,659 | 2,589 | 57,361 | 1,146 | (384,770 | ) | (7,703 | ) | (195,750 | ) | (3,968 | ) | ||||||||||||||||||||
| Class T | — | — | — | — | — | — | — | — | ||||||||||||||||||||||||
| Class F-1 | 822,668 | 16,074 | 192,181 | 3,793 | (1,772,096 | ) | (33,935 | ) | (757,247 | ) | (14,068 | ) | ||||||||||||||||||||
| Class F-2 | 8,283,565 | 160,944 | 1,336,131 | 26,800 | (8,105,462 | ) | (161,012 | ) | 1,514,234 | 26,732 | ||||||||||||||||||||||
| Class F-3 | 5,778,865 | 112,229 | 541,201 | 10,866 | (2,726,520 | ) | (54,975 | ) | 3,593,546 | 68,120 | ||||||||||||||||||||||
| Class 529-A | 148,848 | 2,915 | 77,005 | 1,548 | (221,689 | ) | (4,386 | ) | 4,164 | 77 | ||||||||||||||||||||||
| Class 529-C | 27,200 | 546 | 12,102 | 245 | (71,019 | ) | (1,425 | ) | (31,717 | ) | (634 | ) | ||||||||||||||||||||
| Class 529-E | 5,528 | 110 | 3,432 | 70 | (12,673 | ) | (253 | ) | (3,713 | ) | (73 | ) | ||||||||||||||||||||
| Class 529-T | — | — | 1 | — | † | — | — | 1 | — | † | ||||||||||||||||||||||
| Class 529-F-1 | 42,297 | 838 | 7,738 | 157 | (24,685 | ) | (492 | ) | 25,350 | 503 | ||||||||||||||||||||||
| Class R-1 | 21,196 | 429 | 11,853 | 241 | (60,088 | ) | (1,230 | ) | (27,039 | ) | (560 | ) | ||||||||||||||||||||
| Class R-2 | 156,715 | 3,160 | 36,498 | 737 | (238,880 | ) | (4,793 | ) | (45,667 | ) | (896 | ) | ||||||||||||||||||||
| Class R-2E | 52,852 | 1,018 | 8,890 | 168 | (212,291 | ) | (3,979 | ) | (150,549 | ) | (2,793 | ) | ||||||||||||||||||||
| Class R-3 | 650,346 | 12,821 | 211,068 | 4,245 | (1,578,069 | ) | (31,422 | ) | (716,655 | ) | (14,356 | ) | ||||||||||||||||||||
| Class R-4 | 1,531,980 | 30,328 | 504,822 | 10,214 | (3,503,544 | ) | (71,071 | ) | (1,466,742 | ) | (30,529 | ) | ||||||||||||||||||||
| Class R-5E | 1,264,628 | 24,306 | 59,150 | 1,241 | (310,842 | ) | (6,387 | ) | 1,012,936 | 19,160 | ||||||||||||||||||||||
| Class R-5 | 1,999,574 | 38,294 | 472,082 | 9,375 | (3,227,419 | ) | (62,636 | ) | (755,763 | ) | (14,967 | ) | ||||||||||||||||||||
| Class R-6 | 14,811,246 | 288,387 | 3,793,726 | 76,102 | (12,241,479 | ) | (239,135 | ) | 6,363,493 | 125,354 | ||||||||||||||||||||||
| Total net increase (decrease) | $ | 37,474,192 | 728,767 | $ | 8,725,969 | 174,743 | $ | (39,283,094 | ) | (774,890 | ) | $ | 6,917,067 | 128,620 | ||||||||||||||||||
| * | Includes exchanges between share classes of the fund. |
| † | Amount less than one thousand. |
| 22 | EuroPacific Growth Fund |
9. Investment transactions
The fund made purchases and sales of investment securities, excluding short-term securities and U.S. government obligations, if any, of $54,822,521,000 and $62,264,315,000, respectively, during the year ended March 31, 2020.
| EuroPacific Growth Fund | 23 |
Financial highlights
| (Loss) income from investment operations1 | Dividends and distributions | |||||||||||||||||||||||||||||||||||||||||||||||
| Period ended | Net asset value, beginning of period | Net investment income | Net (losses) gains on securities (both realized and unrealized) | Total from investment operations | Dividends (from net investment income) | Distributions (from capital gains) | Total dividends and distributions | Net asset value, end of period | Total return2 | Net assets, end of period (in millions) | Ratio of expenses to average net assets3 | Ratio of net income to average net assets | ||||||||||||||||||||||||||||||||||||
| Class A: | ||||||||||||||||||||||||||||||||||||||||||||||||
| 3/31/2020 | $ | 50.99 | $ | .53 | $ | (6.84 | ) | $ | (6.31 | ) | $ | (.58 | ) | $ | (.97 | ) | $ | (1.55 | ) | $ | 43.13 | (13.03 | )% | $ | 19,075 | .84 | % | 1.02 | % | |||||||||||||||||||
| 3/31/2019 | 56.66 | .71 | (3.52 | ) | (2.81 | ) | (.62 | ) | (2.24 | ) | (2.86 | ) | 50.99 | (4.97 | ) | 24,704 | .83 | 1.37 | ||||||||||||||||||||||||||||||
| 3/31/2018 | 49.30 | .47 | 9.51 | 9.98 | (.49 | ) | (2.13 | ) | (2.62 | ) | 56.66 | 20.74 | 29,067 | .82 | .86 | |||||||||||||||||||||||||||||||||
| 3/31/2017 | 44.28 | .44 | 5.14 | 5.58 | (.56 | ) | — | (.56 | ) | 49.30 | 12.72 | 25,678 | .85 | .95 | ||||||||||||||||||||||||||||||||||
| 3/31/2016 | 49.91 | .44 | (4.68 | ) | (4.24 | ) | (.80 | ) | (.59 | ) | (1.39 | ) | 44.28 | (8.60 | ) | 26,556 | .83 | .92 | ||||||||||||||||||||||||||||||
| Class C: | ||||||||||||||||||||||||||||||||||||||||||||||||
| 3/31/2020 | 49.70 | .15 | (6.69 | ) | (6.54 | ) | (.21 | ) | (.97 | ) | (1.18 | ) | 41.98 | (13.68 | ) | 654 | 1.58 | .30 | ||||||||||||||||||||||||||||||
| 3/31/2019 | 55.32 | .31 | (3.41 | ) | (3.10 | ) | (.28 | ) | (2.24 | ) | (2.52 | ) | 49.70 | (5.70 | ) | 1,015 | 1.60 | .62 | ||||||||||||||||||||||||||||||
| 3/31/2018 | 48.19 | .04 | 9.29 | 9.33 | (.07 | ) | (2.13 | ) | (2.20 | ) | 55.32 | 19.82 | 1,350 | 1.60 | .08 | |||||||||||||||||||||||||||||||||
| 3/31/2017 | 43.25 | .08 | 5.02 | 5.10 | (.16 | ) | — | (.16 | ) | 48.19 | 11.82 | 1,240 | 1.63 | .17 | ||||||||||||||||||||||||||||||||||
| 3/31/2016 | 48.75 | .06 | (4.56 | ) | (4.50 | ) | (.41 | ) | (.59 | ) | (1.00 | ) | 43.25 | (9.30 | ) | 1,474 | 1.62 | .13 | ||||||||||||||||||||||||||||||
| Class T: | ||||||||||||||||||||||||||||||||||||||||||||||||
| 3/31/2020 | 50.99 | .65 | (6.82 | ) | (6.17 | ) | (.72 | ) | (.97 | ) | (1.69 | ) | 43.13 | (12.82 | )4 | — | 5 | .59 | 4 | 1.25 | 4 | |||||||||||||||||||||||||||
| 3/31/2019 | 56.69 | .83 | (3.54 | ) | (2.71 | ) | (.75 | ) | (2.24 | ) | (2.99 | ) | 50.99 | (4.76 | )4 | — | 5 | .59 | 4 | 1.60 | 4 | |||||||||||||||||||||||||||
| 3/31/20186,7 | 49.19 | .58 | 9.63 | 10.21 | (.58 | ) | (2.13 | ) | (2.71 | ) | 56.69 | 21.27 | 4,8 | — | 5 | .60 | 4,9 | 1.07 | 4,9 | |||||||||||||||||||||||||||||
| Class F-1: | ||||||||||||||||||||||||||||||||||||||||||||||||
| 3/31/2020 | 50.75 | .53 | (6.82 | ) | (6.29 | ) | (.56 | ) | (.97 | ) | (1.53 | ) | 42.93 | (13.05 | ) | 2,259 | .85 | 1.02 | ||||||||||||||||||||||||||||||
| 3/31/2019 | 56.40 | .74 | (3.57 | ) | (2.83 | ) | (.58 | ) | (2.24 | ) | (2.82 | ) | 50.75 | (5.01 | ) | 3,232 | .87 | 1.43 | ||||||||||||||||||||||||||||||
| 3/31/2018 | 49.08 | .45 | 9.46 | 9.91 | (.46 | ) | (2.13 | ) | (2.59 | ) | 56.40 | 20.69 | 4,385 | .86 | .83 | |||||||||||||||||||||||||||||||||
| 3/31/2017 | 44.08 | .43 | 5.11 | 5.54 | (.54 | ) | — | (.54 | ) | 49.08 | 12.69 | 4,179 | .87 | .93 | ||||||||||||||||||||||||||||||||||
| 3/31/2016 | 49.67 | .41 | (4.64 | ) | (4.23 | ) | (.77 | ) | (.59 | ) | (1.36 | ) | 44.08 | (8.60 | ) | 4,281 | .86 | .86 | ||||||||||||||||||||||||||||||
| Class F-2: | ||||||||||||||||||||||||||||||||||||||||||||||||
| 3/31/2020 | 50.83 | .66 | (6.81 | ) | (6.15 | ) | (.71 | ) | (.97 | ) | (1.68 | ) | 43.00 | (12.80 | ) | 18,607 | .59 | 1.27 | ||||||||||||||||||||||||||||||
| 3/31/2019 | 56.52 | .82 | (3.52 | ) | (2.70 | ) | (.75 | ) | (2.24 | ) | (2.99 | ) | 50.83 | (4.75 | ) | 24,585 | .59 | 1.58 | ||||||||||||||||||||||||||||||
| 3/31/2018 | 49.17 | .61 | 9.48 | 10.09 | (.61 | ) | (2.13 | ) | (2.74 | ) | 56.52 | 21.05 | 25,826 | .59 | 1.11 | |||||||||||||||||||||||||||||||||
| 3/31/2017 | 44.19 | .55 | 5.12 | 5.67 | (.69 | ) | — | (.69 | ) | 49.17 | 12.99 | 22,949 | .60 | 1.19 | ||||||||||||||||||||||||||||||||||
| 3/31/2016 | 49.82 | .56 | (4.68 | ) | (4.12 | ) | (.92 | ) | (.59 | ) | (1.51 | ) | 44.19 | (8.36 | ) | 19,386 | .60 | 1.18 | ||||||||||||||||||||||||||||||
| Class F-3: | ||||||||||||||||||||||||||||||||||||||||||||||||
| 3/31/2020 | 50.98 | .70 | (6.82 | ) | (6.12 | ) | (.77 | ) | (.97 | ) | (1.74 | ) | 43.12 | (12.70 | ) | 12,239 | .47 | 1.34 | ||||||||||||||||||||||||||||||
| 3/31/2019 | 56.68 | .82 | (3.48 | ) | (2.66 | ) | (.80 | ) | (2.24 | ) | (3.04 | ) | 50.98 | (4.65 | ) | 11,993 | .49 | 1.60 | ||||||||||||||||||||||||||||||
| 3/31/2018 | 49.32 | .59 | 9.58 | 10.17 | (.68 | ) | (2.13 | ) | (2.81 | ) | 56.68 | 21.15 | 9,473 | .49 | 1.06 | |||||||||||||||||||||||||||||||||
| 3/31/20176,10 | 47.46 | .24 | 1.62 | 1.86 | — | — | — | 49.32 | 3.92 | 8 | 1,162 | .09 | 8 | .50 | 8 | |||||||||||||||||||||||||||||||||
| Class 529-A: | ||||||||||||||||||||||||||||||||||||||||||||||||
| 3/31/2020 | 50.35 | .51 | (6.75 | ) | (6.24 | ) | (.56 | ) | (.97 | ) | (1.53 | ) | 42.58 | (13.05 | ) | 1,096 | .87 | .98 | ||||||||||||||||||||||||||||||
| 3/31/2019 | 56.00 | .67 | (3.49 | ) | (2.82 | ) | (.59 | ) | (2.24 | ) | (2.83 | ) | 50.35 | (5.04 | ) | 1,376 | .89 | 1.31 | ||||||||||||||||||||||||||||||
| 3/31/2018 | 48.77 | .44 | 9.40 | 9.84 | (.48 | ) | (2.13 | ) | (2.61 | ) | 56.00 | 20.71 | 1,525 | .87 | .81 | |||||||||||||||||||||||||||||||||
| 3/31/2017 | 43.82 | .41 | 5.09 | 5.50 | (.55 | ) | — | (.55 | ) | 48.77 | 12.65 | 1,172 | .90 | .90 | ||||||||||||||||||||||||||||||||||
| 3/31/2016 | 49.41 | .40 | (4.63 | ) | (4.23 | ) | (.77 | ) | (.59 | ) | (1.36 | ) | 43.82 | (8.64 | ) | 1,103 | .90 | .86 | ||||||||||||||||||||||||||||||
| 24 | EuroPacific Growth Fund |
| (Loss) income from investment operations1 | Dividends and distributions | |||||||||||||||||||||||||||||||||||||||||||||||
| Period ended | Net asset value, beginning of period | Net investment income | Net (losses) gains on securities (both realized and unrealized) | Total from investment operations | Dividends (from net investment income) | Distributions (from capital gains) | Total dividends and distributions | Net asset value, end of period | Total return2 | Net assets, end of period (in millions) | Ratio of expenses to average net assets3 | Ratio of net income to average net assets | ||||||||||||||||||||||||||||||||||||
| Class 529-C: | ||||||||||||||||||||||||||||||||||||||||||||||||
| 3/31/2020 | $ | 49.18 | $ | .13 | $ | (6.62 | ) | $ | (6.49 | ) | $ | (.21 | ) | $ | (.97 | ) | $ | (1.18 | ) | $ | 41.51 | (13.72 | )% | $ | 148 | 1.61 | % | .26 | % | |||||||||||||||||||
| 3/31/2019 | 54.79 | .29 | (3.38 | ) | (3.09 | ) | (.28 | ) | (2.24 | ) | (2.52 | ) | 49.18 | (5.72 | ) | 219 | 1.64 | .59 | ||||||||||||||||||||||||||||||
| 3/31/2018 | 47.73 | .01 | 9.21 | 9.22 | (.03 | ) | (2.13 | ) | (2.16 | ) | 54.79 | 19.76 | 278 | 1.65 | .03 | |||||||||||||||||||||||||||||||||
| 3/31/2017 | 42.90 | .05 | 4.97 | 5.02 | (.19 | ) | — | (.19 | ) | 47.73 | 11.76 | 343 | 1.68 | .12 | ||||||||||||||||||||||||||||||||||
| 3/31/2016 | 48.38 | .04 | (4.53 | ) | (4.49 | ) | (.40 | ) | (.59 | ) | (.99 | ) | 42.90 | (9.35 | ) | 335 | 1.68 | .08 | ||||||||||||||||||||||||||||||
| Class 529-E: | ||||||||||||||||||||||||||||||||||||||||||||||||
| 3/31/2020 | 49.87 | .39 | (6.70 | ) | (6.31 | ) | (.44 | ) | (.97 | ) | (1.41 | ) | 42.15 | (13.24 | ) | 46 | 1.09 | .77 | ||||||||||||||||||||||||||||||
| 3/31/2019 | 55.50 | .55 | (3.44 | ) | (2.89 | ) | (.50 | ) | (2.24 | ) | (2.74 | ) | 49.87 | (5.24 | ) | 60 | 1.11 | 1.09 | ||||||||||||||||||||||||||||||
| 3/31/2018 | 48.35 | .31 | 9.31 | 9.62 | (.34 | ) | (2.13 | ) | (2.47 | ) | 55.50 | 20.41 | 71 | 1.11 | .57 | |||||||||||||||||||||||||||||||||
| 3/31/2017 | 43.45 | .30 | 5.04 | 5.34 | (.44 | ) | — | (.44 | ) | 48.35 | 12.39 | 60 | 1.13 | .66 | ||||||||||||||||||||||||||||||||||
| 3/31/2016 | 49.00 | .29 | (4.59 | ) | (4.30 | ) | (.66 | ) | (.59 | ) | (1.25 | ) | 43.45 | (8.86 | ) | 57 | 1.14 | .62 | ||||||||||||||||||||||||||||||
| Class 529-T: | ||||||||||||||||||||||||||||||||||||||||||||||||
| 3/31/2020 | 50.98 | .63 | (6.83 | ) | (6.20 | ) | (.69 | ) | (.97 | ) | (1.66 | ) | 43.12 | (12.87 | )4 | — | 5 | .64 | 4 | 1.19 | 4 | |||||||||||||||||||||||||||
| 3/31/2019 | 56.68 | .79 | (3.53 | ) | (2.74 | ) | (.72 | ) | (2.24 | ) | (2.96 | ) | 50.98 | (4.82 | )4 | — | 5 | .65 | 4 | 1.52 | 4 | |||||||||||||||||||||||||||
| 3/31/20186,7 | 49.19 | .56 | 9.62 | 10.18 | (.56 | ) | (2.13 | ) | (2.69 | ) | 56.68 | 21.22 | 4,8 | — | 5 | .64 | 4,9 | 1.03 | 4,9 | |||||||||||||||||||||||||||||
| Class 529-F-1: | ||||||||||||||||||||||||||||||||||||||||||||||||
| 3/31/2020 | 50.32 | .62 | (6.75 | ) | (6.13 | ) | (.68 | ) | (.97 | ) | (1.65 | ) | 42.54 | (12.86 | ) | 126 | .64 | 1.20 | ||||||||||||||||||||||||||||||
| 3/31/2019 | 55.99 | .76 | (3.47 | ) | (2.71 | ) | (.72 | ) | (2.24 | ) | (2.96 | ) | 50.32 | (4.81 | ) | 145 | .66 | 1.50 | ||||||||||||||||||||||||||||||
| 3/31/2018 | 48.74 | .56 | 9.40 | 9.96 | (.58 | ) | (2.13 | ) | (2.71 | ) | 55.99 | 20.96 | 134 | .65 | 1.02 | |||||||||||||||||||||||||||||||||
| 3/31/2017 | 43.81 | .51 | 5.07 | 5.58 | (.65 | ) | — | (.65 | ) | 48.74 | 12.88 | 102 | .68 | 1.11 | ||||||||||||||||||||||||||||||||||
| 3/31/2016 | 49.40 | .50 | (4.62 | ) | (4.12 | ) | (.88 | ) | (.59 | ) | (1.47 | ) | 43.81 | (8.44 | ) | 90 | .69 | 1.07 | ||||||||||||||||||||||||||||||
| Class R-1: | ||||||||||||||||||||||||||||||||||||||||||||||||
| 3/31/2020 | 48.86 | .14 | (6.56 | ) | (6.42 | ) | (.24 | ) | (.97 | ) | (1.21 | ) | 41.23 | (13.68 | ) | 144 | 1.58 | .29 | ||||||||||||||||||||||||||||||
| 3/31/2019 | 54.46 | .31 | (3.37 | ) | (3.06 | ) | (.30 | ) | (2.24 | ) | (2.54 | ) | 48.86 | (5.71 | ) | 209 | 1.60 | .61 | ||||||||||||||||||||||||||||||
| 3/31/2018 | 47.49 | .05 | 9.14 | 9.19 | (.09 | ) | (2.13 | ) | (2.22 | ) | 54.46 | 19.82 | 263 | 1.60 | .09 | |||||||||||||||||||||||||||||||||
| 3/31/2017 | 42.69 | .08 | 4.96 | 5.04 | (.24 | ) | — | (.24 | ) | 47.49 | 11.86 | 247 | 1.61 | .19 | ||||||||||||||||||||||||||||||||||
| 3/31/2016 | 48.14 | .07 | (4.50 | ) | (4.43 | ) | (.43 | ) | (.59 | ) | (1.02 | ) | 42.69 | (9.28 | ) | 248 | 1.61 | .15 | ||||||||||||||||||||||||||||||
| Class R-2: | ||||||||||||||||||||||||||||||||||||||||||||||||
| 3/31/2020 | 49.30 | .14 | (6.61 | ) | (6.47 | ) | (.26 | ) | (.97 | ) | (1.23 | ) | 41.60 | (13.65 | ) | 534 | 1.57 | .28 | ||||||||||||||||||||||||||||||
| 3/31/2019 | 54.93 | .31 | (3.39 | ) | (3.08 | ) | (.31 | ) | (2.24 | ) | (2.55 | ) | 49.30 | (5.71 | ) | 690 | 1.60 | .61 | ||||||||||||||||||||||||||||||
| 3/31/2018 | 47.88 | .06 | 9.21 | 9.27 | (.09 | ) | (2.13 | ) | (2.22 | ) | 54.93 | 19.84 | 818 | 1.58 | .11 | |||||||||||||||||||||||||||||||||
| 3/31/2017 | 43.01 | .09 | 5.00 | 5.09 | (.22 | ) | — | (.22 | ) | 47.88 | 11.88 | 767 | 1.60 | .20 | ||||||||||||||||||||||||||||||||||
| 3/31/2016 | 48.49 | .08 | (4.53 | ) | (4.45 | ) | (.44 | ) | (.59 | ) | (1.03 | ) | 43.01 | (9.25 | ) | 800 | 1.58 | .18 | ||||||||||||||||||||||||||||||
| Class R-2E: | ||||||||||||||||||||||||||||||||||||||||||||||||
| 3/31/2020 | 50.42 | .29 | (6.76 | ) | (6.47 | ) | (.38 | ) | (.97 | ) | (1.35 | ) | 42.60 | (13.40 | ) | 77 | 1.28 | .56 | ||||||||||||||||||||||||||||||
| 3/31/2019 | 55.76 | .77 | (3.74 | ) | (2.97 | ) | (.13 | ) | (2.24 | ) | (2.37 | ) | 50.42 | (5.46 | ) | 89 | 1.31 | 1.47 | ||||||||||||||||||||||||||||||
| 3/31/2018 | 48.59 | .20 | 9.38 | 9.58 | (.28 | ) | (2.13 | ) | (2.41 | ) | 55.76 | 20.19 | 254 | 1.29 | .38 | |||||||||||||||||||||||||||||||||
| 3/31/2017 | 43.79 | .18 | 5.14 | 5.32 | (.52 | ) | — | (.52 | ) | 48.59 | 12.25 | 189 | 1.28 | .40 | ||||||||||||||||||||||||||||||||||
| 3/31/2016 | 49.67 | .52 | (4.89 | ) | (4.37 | ) | (.92 | ) | (.59 | ) | (1.51 | ) | 43.79 | (8.89 | ) | 8 | 1.18 | 1.25 | ||||||||||||||||||||||||||||||
See end of table for footnotes.
| EuroPacific Growth Fund | 25 |
Financial highlights(continued)
| (Loss) income from investment operations1 | Dividends and distributions | |||||||||||||||||||||||||||||||||||||||||||||||
| Period ended | Net asset value, beginning of period | Net investment income | Net (losses) gains on securities (both realized and unrealized) | Total from investment operations | Dividends (from net investment income) | Distributions (from capital gains) | Total dividends and distributions | Net asset value, end of period | Total return2 | Net assets, end of period (in millions) | Ratio of expenses to average net assets3 | Ratio of net income to average net assets | ||||||||||||||||||||||||||||||||||||
| Class R-3: | ||||||||||||||||||||||||||||||||||||||||||||||||
| 3/31/2020 | $ | 49.86 | $ | .38 | $ | (6.70 | ) | $ | (6.32 | ) | $ | (.42 | ) | $ | (.97 | ) | $ | (1.39 | ) | $ | 42.15 | (13.28 | )% | $ | 2,395 | 1.13 | % | .75 | % | |||||||||||||||||||
| 3/31/2019 | 55.48 | .55 | (3.45 | ) | (2.90 | ) | (.48 | ) | (2.24 | ) | (2.72 | ) | 49.86 | (5.26 | ) | 3,446 | 1.14 | 1.08 | ||||||||||||||||||||||||||||||
| 3/31/2018 | 48.32 | .30 | 9.31 | 9.61 | (.32 | ) | (2.13 | ) | (2.45 | ) | 55.48 | 20.36 | 4,631 | 1.14 | .56 | |||||||||||||||||||||||||||||||||
| 3/31/2017 | 43.40 | .30 | 5.04 | 5.34 | (.42 | ) | — | (.42 | ) | 48.32 | 12.40 | 4,505 | 1.14 | .66 | ||||||||||||||||||||||||||||||||||
| 3/31/2016 | 48.93 | .29 | (4.59 | ) | (4.30 | ) | (.64 | ) | (.59 | ) | (1.23 | ) | 43.40 | (8.87 | ) | 5,029 | 1.14 | .62 | ||||||||||||||||||||||||||||||
| Class R-4: | ||||||||||||||||||||||||||||||||||||||||||||||||
| 3/31/2020 | 49.91 | .54 | (6.71 | ) | (6.17 | ) | (.58 | ) | (.97 | ) | (1.55 | ) | 42.19 | (13.03 | ) | 5,278 | .82 | 1.04 | ||||||||||||||||||||||||||||||
| 3/31/2019 | 55.52 | .69 | (3.46 | ) | (2.77 | ) | (.60 | ) | (2.24 | ) | (2.84 | ) | 49.91 | (4.99 | ) | 7,715 | .84 | 1.37 | ||||||||||||||||||||||||||||||
| 3/31/2018 | 48.35 | .46 | 9.32 | 9.78 | (.48 | ) | (2.13 | ) | (2.61 | ) | 55.52 | 20.76 | 10,278 | .83 | .85 | |||||||||||||||||||||||||||||||||
| 3/31/2017 | 43.45 | .43 | 5.03 | 5.46 | (.56 | ) | — | (.56 | ) | 48.35 | 12.70 | 9,854 | .85 | .96 | ||||||||||||||||||||||||||||||||||
| 3/31/2016 | 48.99 | .43 | (4.59 | ) | (4.16 | ) | (.79 | ) | (.59 | ) | (1.38 | ) | 43.45 | (8.58 | ) | 11,310 | .85 | .92 | ||||||||||||||||||||||||||||||
| Class R-5E: | ||||||||||||||||||||||||||||||||||||||||||||||||
| 3/31/2020 | 50.58 | .62 | (6.76 | ) | (6.14 | ) | (.70 | ) | (.97 | ) | (1.67 | ) | 42.77 | (12.82 | ) | 1,745 | .62 | 1.20 | ||||||||||||||||||||||||||||||
| 3/31/2019 | 56.29 | .62 | (3.33 | ) | (2.71 | ) | (.76 | ) | (2.24 | ) | (3.00 | ) | 50.58 | (4.78 | ) | 1,511 | .63 | 1.24 | ||||||||||||||||||||||||||||||
| 3/31/2018 | 49.02 | .59 | 9.45 | 10.04 | (.64 | ) | (2.13 | ) | (2.77 | ) | 56.29 | 21.01 | 603 | .62 | 1.06 | |||||||||||||||||||||||||||||||||
| 3/31/2017 | 44.14 | .53 | 5.09 | 5.62 | (.74 | ) | — | (.74 | ) | 49.02 | 12.89 | 9 | .62 | 1.14 | ||||||||||||||||||||||||||||||||||
| 3/31/20166,11 | 48.16 | .20 | (2.65 | ) | (2.45 | ) | (.98 | ) | (.59 | ) | (1.57 | ) | 44.14 | (5.19 | )8 | — | 5 | .25 | 8 | .46 | 8 | |||||||||||||||||||||||||||
| Class R-5: | ||||||||||||||||||||||||||||||||||||||||||||||||
| 3/31/2020 | 50.88 | .70 | (6.82 | ) | (6.12 | ) | (.75 | ) | (.97 | ) | (1.72 | ) | 43.04 | (12.75 | ) | 5,759 | .52 | 1.33 | ||||||||||||||||||||||||||||||
| 3/31/2019 | 56.57 | .89 | (3.57 | ) | (2.68 | ) | (.77 | ) | (2.24 | ) | (3.01 | ) | 50.88 | (4.71 | ) | 7,283 | .54 | 1.72 | ||||||||||||||||||||||||||||||
| 3/31/2018 | 49.22 | .64 | 9.48 | 10.12 | (.64 | ) | (2.13 | ) | (2.77 | ) | 56.57 | 21.09 | 8,944 | .53 | 1.16 | |||||||||||||||||||||||||||||||||
| 3/31/2017 | 44.22 | .58 | 5.13 | 5.71 | (.71 | ) | — | (.71 | ) | 49.22 | 13.07 | 8,721 | .54 | 1.27 | ||||||||||||||||||||||||||||||||||
| 3/31/2016 | 49.85 | .58 | (4.68 | ) | (4.10 | ) | (.94 | ) | (.59 | ) | (1.53 | ) | 44.22 | (8.32 | ) | 9,285 | .54 | 1.21 | ||||||||||||||||||||||||||||||
| Class R-6: | ||||||||||||||||||||||||||||||||||||||||||||||||
| 3/31/2020 | 50.93 | .71 | (6.82 | ) | (6.11 | ) | (.77 | ) | (.97 | ) | (1.74 | ) | 43.08 | (12.70 | ) | 60,141 | .47 | 1.36 | ||||||||||||||||||||||||||||||
| 3/31/2019 | 56.63 | .86 | (3.52 | ) | (2.66 | ) | (.80 | ) | (2.24 | ) | (3.04 | ) | 50.93 | (4.66 | ) | 68,234 | .49 | 1.68 | ||||||||||||||||||||||||||||||
| 3/31/2018 | 49.27 | .65 | 9.51 | 10.16 | (.67 | ) | (2.13 | ) | (2.80 | ) | 56.63 | 21.17 | 68,770 | .49 | 1.18 | |||||||||||||||||||||||||||||||||
| 3/31/2017 | 44.27 | .60 | 5.14 | 5.74 | (.74 | ) | — | (.74 | ) | 49.27 | 13.10 | 51,100 | .50 | 1.30 | ||||||||||||||||||||||||||||||||||
| 3/31/2016 | 49.90 | .60 | (4.67 | ) | (4.07 | ) | (.97 | ) | (.59 | ) | (1.56 | ) | 44.27 | (8.26 | ) | 41,539 | .50 | 1.27 | ||||||||||||||||||||||||||||||
| Year ended March 31, | ||||||||||
| 2020 | 2019 | 2018 | 2017 | 2016 | ||||||
| Portfolio turnover rate for all share classes12 | 38% | 35% | 29% | 36% | 30% | |||||
| 1 | Based on average shares outstanding. |
| 2 | Total returns exclude any applicable sales charges, including contingent deferred sales charges. |
| 3 | Ratios do not include expenses of any Central Funds. The fund indirectly bears its proportionate share of the expenses of any Central Funds. |
| 4 | All or a significant portion of assets in this class consisted of seed capital invested by CRMC and/or its affiliates. Fees for distribution services are not charged or accrued on these seed capital assets. If such fees were paid by the fund on seed capital assets, fund expenses would have been higher and net income and total return would have been lower. |
| 5 | Amount less than $1 million. |
| 6 | Based on operations for a period that is less than a full year. |
| 7 | Class T and 529-T shares began investment operations on April 7, 2017. |
| 8 | Not annualized. |
| 9 | Annualized. |
| 10 | Class F-3 shares began investment operations on January 27, 2017. |
| 11 | Class R-5E shares began investment operations on November 20, 2015. |
| 12 | Rates do not include the fund’s portfolio activity with respect to any Central Funds. |
See notes to financial statements.
| 26 | EuroPacific Growth Fund |
Report of Independent Registered Public Accounting Firm
To the Shareholders and Board of Trustees of EuroPacific Growth Fund:
Opinion on the Financial Statements and Financial Highlights
We have audited the accompanying statement of assets and liabilities of EuroPacific Growth Fund (the “Fund”), including the summary investment portfolio, as of March 31, 2020, the related statement of operations for the year then ended, the statements of changes in net assets for each of the two years in the period then ended, the financial highlights for each of the five years in the period then ended, and the related notes. In our opinion, the financial statements and financial highlights present fairly, in all material respects, the financial position of the Fund as of March 31, 2020, and the results of its operations for the year then ended, the changes in its net assets for each of the two years in the period then ended, and the financial highlights for each of the five years in the period then ended, in conformity with accounting principles generally accepted in the United States of America.
Basis for Opinion
These financial statements and financial highlights are the responsibility of the Fund’s management. Our responsibility is to express an opinion on the Fund’s financial statements and financial highlights based on our audits. We are a public accounting firm registered with the Public Company Accounting Oversight Board (United States) (PCAOB) and are required to be independent with respect to the Fund in accordance with the U.S. federal securities laws and the applicable rules and regulations of the Securities and Exchange Commission and the PCAOB.
We conducted our audits in accordance with the standards of the PCAOB. Those standards require that we plan and perform the audit to obtain reasonable assurance about whether the financial statements and financial highlights are free of material misstatement, whether due to error or fraud. The Fund is not required to have, nor were we engaged to perform, an audit of its internal control over financial reporting. As part of our audits we are required to obtain an understanding of internal control over financial reporting but not for the purpose of expressing an opinion on the effectiveness of the Fund’s internal control over financial reporting. Accordingly, we express no such opinion.
Our audits included performing procedures to assess the risks of material misstatement of the financial statements and financial highlights, whether due to error or fraud, and performing procedures that respond to those risks. Such procedures included examining, on a test basis, evidence regarding the amounts and disclosures in the financial statements and financial highlights. Our audits also included evaluating the accounting principles used and significant estimates made by management, as well as evaluating the overall presentation of the financial statements and financial highlights. Our procedures included confirmation of securities owned as of March 31, 2020, by correspondence with the custodian and brokers; when replies were not received from brokers, we performed other auditing procedures. We believe that our audits provide a reasonable basis for our opinion.
Deloitte & Touche LLP
Costa Mesa, California
May 11, 2020
We have served as the auditor of one or more American Funds investment companies since 1956.
| EuroPacific Growth Fund | 27 |
| Expense example | unaudited |
As a fund shareholder, you incur two types of costs: (1) transaction costs, such as initial sales charges on purchase payments and contingent deferred sales charges on redemptions (loads), and (2) ongoing costs, including management fees, distribution and service (12b-1) fees, and other expenses. This example is intended to help you understand your ongoing costs (in dollars) of investing in the fund so you can compare these costs with the ongoing costs of investing in other mutual funds. The example is based on an investment of $1,000 invested at the beginning of the period and held for the entire six-month period (October 1, 2019, through March 31, 2020).
Actual expenses:
The first line of each share class in the table on the following page provides information about actual account values and actual expenses. You may use the information in this line, together with the amount you invested, to estimate the expenses that you paid over the period. Simply divide your account value by $1,000 (for example, an $8,600 account value divided by $1,000 = 8.6), then multiply the result by the number in the first line under the heading titled “Expenses paid during period” to estimate the expenses you paid on your account during this period.
Hypothetical example for comparison purposes:
The second line of each share class in the table on the following page provides information about hypothetical account values and hypothetical expenses based on the actual expense ratio for the share class and an assumed rate of return of 5.00% per year before expenses, which is not the actual return of the share class. The hypothetical account values and expenses may not be used to estimate the actual ending account balance or expenses you paid for the period. You may use this information to compare the ongoing costs of investing in the fund and other funds. To do so, compare this 5.00% hypothetical example with the 5.00% hypothetical examples that appear in the shareholder reports of the other funds.
Notes:
Retirement plan participants may be subject to certain fees charged by the plan sponsor, and Class F-1, F-2, F-3 and 529-F-1 shareholders may be subject to fees charged by financial intermediaries, typically ranging from 0.75% to 1.50% of assets annually depending on services offered. You can estimate the impact of these fees by adding the amount of the fees to the total estimated expenses you paid on your account during the period as calculated above. In addition, your ending account value would be lower by the amount of these fees.
Note that the expenses shown in the table on the following page are meant to highlight your ongoing costs only and do not reflect any transactional costs, such as sales charges (loads). Therefore, the second line of each share class in the table is useful in comparing ongoing costs only and will not help you determine the relative total costs of owning different funds. In addition, if these transactional costs were included, your costs would have been higher.
| 28 | EuroPacific Growth Fund |
| Beginning account value 10/1/2019 | Ending account value 3/31/2020 | Expenses paid during period* | Annualized expense ratio | |||||||||||||
| Class A – actual return | $ | 1,000.00 | $ | 852.34 | $ | 3.89 | .84 | % | ||||||||
| Class A – assumed 5% return | 1,000.00 | 1,020.80 | 4.24 | .84 | ||||||||||||
| Class C – actual return | 1,000.00 | 849.21 | 7.26 | 1.57 | ||||||||||||
| Class C – assumed 5% return | 1,000.00 | 1,017.15 | 7.92 | 1.57 | ||||||||||||
| Class T – actual return | 1,000.00 | 853.28 | 2.73 | .59 | ||||||||||||
| Class T – assumed 5% return | 1,000.00 | 1,022.05 | 2.98 | .59 | ||||||||||||
| Class F-1 – actual return | 1,000.00 | 852.25 | 3.94 | .85 | ||||||||||||
| Class F-1 – assumed 5% return | 1,000.00 | 1,020.75 | 4.29 | .85 | ||||||||||||
| Class F-2 – actual return | 1,000.00 | 853.51 | 2.69 | .58 | ||||||||||||
| Class F-2 – assumed 5% return | 1,000.00 | 1,022.10 | 2.93 | .58 | ||||||||||||
| Class F-3 – actual return | 1,000.00 | 853.97 | 2.18 | .47 | ||||||||||||
| Class F-3 – assumed 5% return | 1,000.00 | 1,022.65 | 2.38 | .47 | ||||||||||||
| Class 529-A – actual return | 1,000.00 | 852.24 | 3.98 | .86 | ||||||||||||
| Class 529-A – assumed 5% return | 1,000.00 | 1,020.70 | 4.34 | .86 | ||||||||||||
| Class 529-C – actual return | 1,000.00 | 849.05 | 7.40 | 1.60 | ||||||||||||
| Class 529-C – assumed 5% return | 1,000.00 | 1,017.00 | 8.07 | 1.60 | ||||||||||||
| Class 529-E – actual return | 1,000.00 | 851.29 | 5.00 | 1.08 | ||||||||||||
| Class 529-E – assumed 5% return | 1,000.00 | 1,019.60 | 5.45 | 1.08 | ||||||||||||
| Class 529-T – actual return | 1,000.00 | 853.09 | 2.92 | .63 | ||||||||||||
| Class 529-T – assumed 5% return | 1,000.00 | 1,021.85 | 3.18 | .63 | ||||||||||||
| Class 529-F-1 – actual return | 1,000.00 | 853.26 | 2.92 | .63 | ||||||||||||
| Class 529-F-1 – assumed 5% return | 1,000.00 | 1,021.85 | 3.18 | .63 | ||||||||||||
| Class R-1 – actual return | 1,000.00 | 849.13 | 7.30 | 1.58 | ||||||||||||
| Class R-1 – assumed 5% return | 1,000.00 | 1,017.10 | 7.97 | 1.58 | ||||||||||||
| Class R-2 – actual return | 1,000.00 | 849.34 | 7.30 | 1.58 | ||||||||||||
| Class R-2 – assumed 5% return | 1,000.00 | 1,017.10 | 7.97 | 1.58 | ||||||||||||
| Class R-2E – actual return | 1,000.00 | 850.50 | 5.92 | 1.28 | ||||||||||||
| Class R-2E – assumed 5% return | 1,000.00 | 1,018.60 | 6.46 | 1.28 | ||||||||||||
| Class R-3 – actual return | 1,000.00 | 851.13 | 5.18 | 1.12 | ||||||||||||
| Class R-3 – assumed 5% return | 1,000.00 | 1,019.40 | 5.65 | 1.12 | ||||||||||||
| Class R-4 – actual return | 1,000.00 | 852.36 | 3.80 | .82 | ||||||||||||
| Class R-4 – assumed 5% return | 1,000.00 | 1,020.90 | 4.14 | .82 | ||||||||||||
| Class R-5E – actual return | 1,000.00 | 853.33 | 2.83 | .61 | ||||||||||||
| Class R-5E – assumed 5% return | 1,000.00 | 1,021.95 | 3.08 | .61 | ||||||||||||
| Class R-5 – actual return | 1,000.00 | 853.57 | 2.36 | .51 | ||||||||||||
| Class R-5 – assumed 5% return | 1,000.00 | 1,022.45 | 2.58 | .51 | ||||||||||||
| Class R-6 – actual return | 1,000.00 | 854.00 | 2.18 | .47 | ||||||||||||
| Class R-6 – assumed 5% return | 1,000.00 | 1,022.65 | 2.38 | .47 | ||||||||||||
| * | The “expenses paid during period” are equal to the “annualized expense ratio,” multiplied by the average account value over the period, multiplied by the number of days in the period, and divided by 366 (to reflect the one-half year period). |
| EuroPacific Growth Fund | 29 |
| Tax information | unaudited |
We are required to advise you of the federal tax status of certain distributions received by shareholders during the fiscal year. The fund hereby designates the following amounts for the fund’s fiscal year ended March 31, 2020:
| Long-term capital gains | $ | 2,944,647,000 | |
| Foreign taxes | $ | 0.08 per share | |
| Foreign source income | $ | 1.08 per share | |
| Qualified dividend income | 100% | ||
| Corporate dividends received deduction | $ | 11,899,000 | |
| U.S. government income that may be exempt from state taxation | $ | 85,576,000 | |
Individual shareholders should refer to their Form 1099 or other tax information, which will be mailed in January 2021, to determine thecalendar yearamounts to be included on their 2020 tax returns. Shareholders should consult their tax advisors.
| 30 | EuroPacific Growth Fund |
Approval of Investment Advisory and Service Agreement
The fund’s board has approved the continuation of the fund’s Investment Advisory and Service Agreement (the “agreement”) with Capital Research and Management Company (“CRMC”) for an additional one-year term through January 31, 2021. The board approved the agreement following the recommendation of the fund’s Contracts Committee (the “committee”), which is composed of all the fund’s independent board members. The board and the committee determined in the exercise of their business judgment that the fund’s advisory fee structure was fair and reasonable in relation to the services provided, and that approving the agreement was in the best interests of the fund and its shareholders.
In reaching this decision, the board and the committee took into account their interaction with CRMC as well as information furnished to them throughout the year and otherwise provided to them, as well as information prepared specifically in connection with their review of the agreement, and were advised by their independent counsel with respect to the matters considered. They considered the following factors, among others, but did not identify any single issue or particular piece of information that, in isolation, was the controlling factor, and each board and committee member did not necessarily attribute the same weight to each factor.
1. Nature, extent and quality of services
The board and the committee considered the depth and quality of CRMC’s investment management process, including its global research capabilities; the experience, capability and integrity of its senior management and other personnel; the low turnover rates of its key personnel; the overall financial strength and stability of CRMC and the Capital Group organization; the resources and systems CRMC devotes to investment management (the manner in which the fund’s assets are managed, including liquidity management), financial, investment operations, compliance, trading, proxy voting, shareholder communications, and other services; and the ongoing evolution of CRMC’s organizational structure designed to maintain and strengthen these qualities. The board and the committee also considered the nature, extent and quality of administrative and shareholder services provided by CRMC to the fund under the agreement and other agreements, as well as the benefits to fund shareholders from investing in a fund that is part of a large family of funds. The board considered the risks assumed by CRMC in providing services to the fund, including operational, business, financial, reputational, regulatory and litigation risks. The board and the committee concluded that the nature, extent and quality of the services provided by CRMC have benefited and should continue to benefit the fund and its shareholders.
2. Investment results
The board and the committee considered the investment results of the fund in light of its objective. They compared the fund’s investment results with those of other funds (including funds that currently form the basis of the Lipper index for the category in which the fund is included), and data such as relevant market and fund indexes over various periods (including the fund’s lifetime) through June 30, 2019. They generally placed greater emphasis on longer term periods. On the basis of this evaluation and the Board’s ongoing review of investment results, and considering the relative market conditions during certain of the reporting periods, the board and the committee concluded that the fund’s investment results have been satisfactory for renewal of the agreement, and that CRMC’s record in managing the fund indicated that its continued management should benefit the fund and its shareholders. This report, including the letter to shareholders and related disclosures, contains certain information about the fund’s investment results and related benchmarks, which the board also used to assess the results of the fund.
3. Advisory fees and total expenses
The board and the committee compared the advisory fees and total expense levels of the fund to those of other relevant funds. They observed that the fund’s advisory fees and expenses generally compared favorably to those of other similar funds included in the comparable Lipper category. The board and the committee also considered the breakpoint discounts in the fund’s advisory fee structure that reduce the level of fees charged by CRMC to the fund as fund assets increase. In addition, they reviewed information regarding the effective advisory fees charged to non-mutual fund clients by CRMC and its affiliates. They noted that, to the extent there were differences between the advisory fees paid by the fund and the advisory fees paid by those clients, the differences appropriately reflected the investment, operational, regulatory and market differences between advising the fund and the other clients. The board and the committee concluded that the fund’s cost structure was fair and reasonable in relation to the services provided, as well as the risks assumed by the adviser, and that the fund’s shareholders receive reasonable value in return for the advisory fees and other amounts paid to CRMC by the fund.
| EuroPacific Growth Fund | 31 |
4. Ancillary benefits
The board and the committee considered a variety of other benefits that CRMC and its affiliates receive as a result of CRMC’s relationship with the fund and other American Funds, including fees for administrative services provided to certain share classes; fees paid to CRMC’s affiliated transfer agent; sales charges and distribution fees received and retained by the fund’s principal underwriter, an affiliate of CRMC; and possible ancillary benefits to CRMC and its institutional management affiliates in managing other investment vehicles. The board and the committee reviewed CRMC’s portfolio trading practices, noting that through December 31, 2018, CRMC benefited from research obtained with commissions from portfolio transactions made on behalf of the fund, and since that time has undertaken to bear the cost of obtaining such research. The board and the committee took these ancillary benefits into account in evaluating the reasonableness of the advisory fees and other amounts paid to CRMC by the fund.
5. Adviser financial information
The board and the committee reviewed information regarding CRMC’s costs of providing services to the American Funds, including personnel, systems and resources of investment, compliance, trading, accounting and other administrative operations. They considered CRMC’s costs and related cost allocation methodology as well as its track record of investing in technology, infrastructure and staff to maintain and expand services and capabilities, respond to industry and regulatory developments, and attract and retain qualified personnel. They noted information regarding the compensation structure for CRMC’s investment professionals. They reviewed information on the profitability of the investment adviser and its affiliates. The board and the committee also compared CRMC’s profitability and compensation data to the reported results and data of several large, publicly held investment management companies. The board and the committee noted the competitiveness and cyclicality of both the mutual fund industry and the capital markets, and the importance in that environment of CRMC’s long-term profitability for maintaining its independence, company culture and management continuity. They further considered the breakpoint discounts in the fund’s advisory fee structure and CRMC’s sharing of potential economies of scale, or efficiencies, through breakpoints and other fee reductions and costs voluntarily absorbed. The board and the committee concluded that the fund’s advisory fee structure reflected a reasonable sharing of benefits between CRMC and the fund’s shareholders.
| 32 | EuroPacific Growth Fund |
Liquidity Risk Management Program
The fund has adopted a liquidity risk management program (the “program”). The fund’s board has designated Capital Research and Management Company (“CRMC”) as the administrator of the program. Personnel of CRMC or its affiliates conduct the day-to-day operation of the program pursuant to policies and procedures administered by the Capital Group Liquidity Risk Management Committee.
Under the program, CRMC manages the fund’s liquidity risk, which is the risk that the fund could not meet shareholder redemption requests without significant dilution of remaining shareholders’ interests in the fund. This risk is managed by monitoring the degree of liquidity of the fund’s investments, limiting the amount of the fund’s illiquid investments, and utilizing various risk management tools and facilities available to the fund for meeting shareholder redemptions, among other means. CRMC’s process of determining the degree of liquidity of the fund’s investments is supported by one or more third-party liquidity assessment vendors.
The fund’s board reviewed a report prepared by CRMC regarding the operation and effectiveness of the program for the period December 1, 2018, through September 30, 2019. No significant liquidity events impacting the fund were noted in the report. In addition, CRMC provided its assessment that the program had been effective in managing the fund’s liquidity risk.
| EuroPacific Growth Fund | 33 |
Board of trustees and other officers
| Independent trustees1 | ||||||||
| Name and year of birth | Year first elected a trustee of the fund2 | Principal occupation(s) during past five years | Number of portfolios in fund complex overseen by trustee3 | Other directorships4 held by trustee | ||||
| Vanessa C. L. Chang, 1952 | 2005 | Former Director, EL & EL Investments (real estate) | 17 | Edison International; Sykes Enterprises; Transocean Ltd. | ||||
| Pablo R. González Guajardo, 1967 | 2014 | CEO, Kimberly-Clark de México, SAB de CV | 17 | América Móvil, SAB de CV; Grupo Lala, SAB de CV; Grupo Sanborns, SAB de CV; Kimberly-Clark de México, SAB de CV | ||||
| Martin E. Koehler, 1957 | 2015 | Independent management consultant | 3 | Deutsche Lufthansa AG | ||||
| Pascal Millaire, 1983 | 2019 | CEO, CyberCube Analytics, Inc. (cyber risk software for insurers); former Vice President and General Manager, Symantec Corporation (cybersecurity company); former President, Fingi Inc. (enterprise software) | 3 | None | ||||
| William I. Miller, 1956 Chairman of the Board (Independent and Non-Executive) | 1992 | President, The Wallace Foundation | 3 | Cummins, Inc. | ||||
| Josette Sheeran, 1954 | 2015 | President and CEO, Asia Society; United Nations Special Envoy for Haiti | 7 | None | ||||
| Amy Zegart, PhD, 1967 | 2019 | Senior Fellow, Hoover Institution, Stanford University; Senior Fellow, Freeman Spogli Institute, Stanford University | 3 | Kratos Defense & Security Solutions | ||||
| Interested trustees5,6 | ||||||||
| Name, year of birth and position with fund | Year first elected a trustee or officer of the fund2 | Principal occupation(s) during past five years and positions held with affiliated entities or the principal underwriter of the fund | Number of portfolios in fund complex overseen by trustee3 | Other directorships4 held by trustee | ||||
| Carl M. Kawaja, 1964 Co-President | 2003 | Chairman and Director, Capital Research and Management Company; Partner — Capital World Investors, Capital Research and Management Company; Partner — Capital World Investors, Capital Bank and Trust Company; Director, The Capital Group Companies, Inc. | 3 | None | ||||
| Joanna F. Jonsson, 1963 | 2019 | Partner — Capital World Investors, Capital Research and Management Company; Vice Chair, Capital Research and Management Company; Director, The Capital Group Companies, Inc. | 3 | None | ||||
The fund’s statement of additional information includes further details about fund trustees and is available without charge upon request by calling American Funds Service Company at (800) 421-4225 or by visiting the Capital Group website at capitalgroup.com. The address for all trustees and officers of the fund is 333 South Hope Street, Los Angeles, CA 90071, Attention: Secretary.
| 34 | EuroPacific Growth Fund |
| Other officers6 | ||||
| Name, year of birth and position with fund | Year first elected an officer of the fund2 | Principal occupation(s) during past five years and positions held with affiliated entities or the principal underwriter of the fund | ||
| Gerald Du Manoir, 1966 Co-President | 2020 | Partner — Capital International Investors, Capital Research and Management Company; Partner — Capital International Investors, Capital Bank and Trust Company; Senior Vice President, Capital International Asset Management (Canada), Inc.; Vice President, Capital Guardian (Canada), Inc. | ||
| Christopher Thomsen, 1970 Co-President | 2015 | Partner — Capital Research Global Investors, Capital Research Company; Director, Capital Research and Management Company | ||
| Walt Burkley, 1966 Executive Vice President | 2012 | Senior Vice President and Senior Counsel — Fund Business Management Group, Capital Research and Management Company; Director, Capital Research Company; Director, Capital Research and Management Company | ||
| Noriko H. Chen, 1967 Senior Vice President | 2020 | Partner — Capital International Investors, Capital Research and Management Company; President and Director, Capital Research Company; Director, The Capital Group Companies, Inc. | ||
| Nicholas J. Grace, 1966 Senior Vice President | 2004 | Partner — Capital Research Global Investors, Capital Research Company; Director, The Capital Group Companies, Inc. | ||
| Jonathan Knowles, PhD, 1961 Senior Vice President | 2012 | Partner — Capital World Investors, Capital International, Inc. | ||
| Lawrence Kymisis, 1970 Senior Vice President | 2019 | Partner — Capital World Investors, Capital Research Company | ||
| Sung Lee, 1966 Senior Vice President | 2003 | Partner — Capital Research Global Investors, Capital International, Inc. | ||
| Jesper Lyckeus, 1967 Senior Vice President | 2010 | Partner — Capital Research Global Investors, Capital Research Company | ||
| Lara Pellini, 1975 Senior Vice President | 2015 | Partner — Capital World Investors, Capital Research Company | ||
| Andrew B. Suzman, 1967 Senior Vice President | 2019 | Partner — Capital World Investors, Capital Research and Management Company; Partner — Capital World Investors, Capital Bank and Trust Company | ||
| Leo Hee, 1971 Vice President | 2014 | Partner — Capital World Investors, Capital International, Inc. | ||
| Joerg Sponer, 1972 Vice President | 2010 | Partner — Capital Research Global Investors, Capital Research Company | ||
| Michael W. Stockton, 1967 Secretary | 2013 | Senior Vice President — Fund Business Management Group, Capital Research and Management Company | ||
| Brian C. Janssen, 1972 Treasurer | 2010 | Vice President — Investment Operations, Capital Research and Management Company | ||
| Jennifer L. Butler, 1966 Assistant Secretary | 2013 | Assistant Vice President — Fund Business Management Group, Capital Research and Management Company | ||
| Sandra Chuon, 1972 Assistant Treasurer | 2019 | Assistant Vice President — Investment Operations, Capital Research and Management Company | ||
| Gregory F. Niland, 1971 Assistant Treasurer | 2016 | Vice President — Investment Operations, Capital Research and Management Company | ||
| 1 | The term independent trustee refers to a trustee who is not an “interested person” of the fund within the meaning of the Investment Company Act of 1940. |
| 2 | Trustees and officers of the fund serve until their resignation, removal or retirement. |
| 3 | Funds managed by Capital Research and Management Company or its affiliates. |
| 4 | This includes all directorships/trusteeships (other than those in the American Funds or other funds managed by Capital Research and Management Company or its affiliates) that are held by each trustee as a trustee or director of a public company or a registered investment company. |
| 5 | The term interested trustee refers to a trustee who is an “interested person” within the meaning of the Investment Company Act of 1940, on the basis of their affiliation with the fund’s investment adviser, Capital Research and Management Company, or affiliated entities (including the fund’s principal underwriter). |
| 6 | All of the trustees and/or officers listed, with the exception of Lara Pellini and Joerg Sponer, are officers and/or directors/trustees of one or more of the other funds for which Capital Research and Management Company serves as investment adviser. |
| EuroPacific Growth Fund | 35 |
Office of the fund
333 South Hope Street
Los Angeles, CA 90071-1406
Investment adviser
Capital Research and Management Company
333 South Hope Street
Los Angeles, CA 90071-1406
Transfer agent for shareholder accounts
American Funds Service Company
(Write to the address near you.)
P.O. Box 6007
Indianapolis, IN 46206-6007
P.O. Box 2280
Norfolk, VA 23501-2280
Custodian of assets
JPMorgan Chase Bank
270 Park Avenue
New York, NY 10017-2070
Counsel
Dechert LLP
One Bush Street, Suite 1600
San Francisco, CA 94104-4446
Independent registered public accounting firm
Deloitte & Touche LLP
695 Town Center Drive
Suite 1000
Costa Mesa, CA 92626-7188
Principal underwriter
American Funds Distributors, Inc.
333 South Hope Street
Los Angeles, CA 90071-1406
| 36 | EuroPacific Growth Fund |
Investors should carefully consider investment objectives, risks, charges and expenses. This and other important information is contained in the fund prospectus and summary prospectus, which can be obtained from your financial professional and should be read carefully before investing. You may also call American Funds Service Company (AFS) at (800) 421-4225 or visit the Capital Group website at capitalgroup.com.
“American Funds Proxy Voting Procedures and Principles” — which describes how we vote proxies relating to portfolio securities — is available on our website or upon request by calling AFS. The fund files its proxy voting record with the U.S. Securities and Exchange Commission (SEC) for the 12 months ended June 30 by August 31. The proxy voting record is available free of charge on the SEC website at sec.gov and on our website.
A complete March 31, 2020, portfolio of EuroPacific Growth Fund’s investments is available free of charge by calling AFS or visiting the SEC website (where it is part of Form N-CSR).
EuroPacific Growth Fund files a complete list of its portfolio holdings with the SEC for the first and third quarters of each fiscal year on Form NPORT-P. This filing is available free of charge on the SEC website. Additionally, the list of portfolio holdings is available by calling AFS.
This report is for the information of shareholders of EuroPacific Growth Fund, but it also may be used as sales literature when preceded or accompanied by the current prospectus or summary prospectus, which gives details about charges, expenses, investment objectives and operating policies of the fund. If used as sales material after June 30, 2020, this report must be accompanied by an American Funds statistical update for the most recently completed calendar quarter.
The Standard & Poor’s 500 Composite Index is a product of S&P Dow Jones Indices LLC and/or its affiliates and has been licensed for use by Capital Group. Copyright © 2020 S&P Dow Jones Indices LLC, a division of S&P Global, and/or its affiliates. All rights reserved. Redistribution or reproduction in whole or in part is prohibited without written permission of S&P Dow Jones Indices LLC.
American Funds Distributors, Inc., member FINRA.
The Capital Advantage®
Since 1931, Capital Group, home of American Funds, has helped investors pursue long-term investment success. Our consistent approach — in combination with The Capital SystemSM— has resulted in superior outcomes.
Aligned with investor success
We base our decisions on a long-term perspective, which we believe aligns our goals with the interests of our clients. Our portfolio managers average 28 years of investment experience, including 22 years at our company, reflecting a career commitment to our long-term approach.1
The Capital System
The Capital System combines individual accountability with teamwork. Funds using The Capital System are divided into portions that are managed independently by investment professionals with diverse backgrounds, ages and investment approaches. An extensive global research effort is the backbone of our system.
American Funds’ superior outcomes
Equity funds have beaten their Lipper peer indexes in 92% of 10-year periods and 99% of 20-year periods.2 Fixed income funds have helped investors achieve diversification through attention to correlation between bonds and equities.3 Fund management fees have been among the lowest in the industry.4
| 1 | Portfolio manager experience as of December 31, 2019. | |
| 2 | Based on Class F-2 share results for rolling periods through December 31, 2019. Periods covered are the shorter of the fund’s lifetime or since the comparable Lipper index inception date (except Capital Income Builder and SMALLCAP World Fund, for which the Lipper average was used). Expenses differ for each share class, so results will vary. Visitcapitalgroup.com for more information on specific expense adjustments and the actual dates of first sale. | |
| 3 | Based on Class F-2 share results as of December 31, 2019. Fifteen of the 17 fixed income American Funds that have been in existence for the three-year period showed a three-year correlation below 0.2. Standard & Poor’s 500 Composite Index was used as an equity market proxy. Correlation based on monthly total returns. Correlation is a statistical measure of how two securities move in relation to each other. A correlation ranges from –1 to 1. A positive correlation close to 1 implies that as one security moves, either up or down, the other security will move in “lockstep,” in the same direction. A negative correlation close to –1 indicates that the securities have moved in the opposite direction. | |
| 4 | On average, our management fees were in the lowest quintile 65% of the time, based on the 20-year period ended December 31, 2019, versus comparable Lipper categories, excluding funds of funds. |
Class F-2 shares were first offered on August 1, 2008. Class F-2 share results prior to the date of first sale are hypothetical based on the results of the original share class of the fund without a sales charge, adjusted for typical estimated expenses. Results for certain funds with an inception date after August 1, 2008, also include hypothetical returns because those funds’ Class F-2 shares sold after the funds’ date of first offering. Visitcapitalgroup.com for more information on specific expense adjustments and the actual dates of first sale.
All Capital Group trademarks mentioned are owned by The Capital Group Companies, Inc., an affiliated company or fund. All other company and product names mentioned are the property of their respective companies.

ITEM 2 – Code of Ethics
The Registrant has adopted a Code of Ethics that applies to its Principal Executive Officer and Principal Financial Officer. The Registrant undertakes to provide to any person without charge, upon request, a copy of the Code of Ethics. Such request can be made by calling 800/421-4225 or to the Secretary of the Registrant, 333 South Hope Street, Los Angeles, California 90071.
ITEM 3 – Audit Committee Financial Expert
The Registrant’s board has determined that Pablo R. González Guajardo, a member of the Registrant’s audit committee, is an “audit committee financial expert” and "independent," as such terms are defined in this Item. This designation will not increase the designee’s duties, obligations or liability as compared to his or her duties, obligations and liability as a member of the audit committee and of the board, nor will it reduce the responsibility of the other audit committee members. There may be other individuals who, through education or experience, would qualify as "audit committee financial experts" if the board had designated them as such. Most importantly, the board believes each member of the audit committee contributes significantly to the effective oversight of the Registrant’s financial statements and condition.
| ITEM 4 – Principal Accountant Fees and Services | EUPAC | |
| Registrant: | ||
| a) Audit Fees: | ||
| Audit | 2019 | 3,000 |
| 2020 | 134,000 | |
| b) Audit-Related Fees: | ||
| 2019 | 38,000 | |
| 2020 | 28,000 | |
| c) Tax Fees: | ||
| 2019 | 19,000 | |
| 2020 | 70,000 | |
| The tax fees consist of professional services relating to the preparation of the Registrant’s tax returns. | ||
| d) All Other Fees: | ||
| 2019 | None | |
| 2020 | None | |
| Adviser and affiliates (includes only fees for non-audit services billed to the adviser and affiliates for engagements that relate directly to the operations and financial reporting of the Registrant and were subject to the pre-approval policies described below): | ||
| a) Audit Fees: | ||
| Not Applicable | ||
| b) Audit-Related Fees: | ||
| 2019 | 1,365,000 | |
| 2020 | 1,671,000 | |
| The audit-related fees consist of assurance and related services relating to the examination of the Registrant’s transfer agent, principal underwriter and investment adviser conducted in accordance with Statement on Standards for Attestation Engagements Number 18 issued by the American Institute of Certified Public Accountants. | ||
| c) Tax Fees: | ||
| 2019 | 9,000 |
| 2020 | 66,000 | |
| The tax fees consist of consulting services relating to the Registrant’s investments. | ||
| d) All Other Fees: | ||
| 2019 | None | |
| 2020 | 2,000 | |
| The other fees consist of subscription services related to an accounting research tool. | ||
| All audit and permissible non-audit services that the Registrant’s audit committee considers compatible with maintaining the independent registered public accounting firm’s independence are required to be pre-approved by the committee. The pre-approval requirement will extend to all non-audit services provided to the Registrant, the investment adviser, and any entity controlling, controlled by, or under common control with the investment adviser that provides ongoing services to the Registrant, if the engagement relates directly to the operations and financial reporting of the Registrant. The committee will not delegate its responsibility to pre-approve these services to the investment adviser. The committee may delegate to one or more committee members the authority to review and pre-approve audit and permissible non-audit services. Actions taken under any such delegation will be reported to the full committee at its next meeting. The pre-approval requirement is waived with respect to non-audit services if certain conditions are met. The pre-approval requirement was not waived for any of the non-audit services listed above provided to the Registrant, adviser and affiliates. | ||
| Aggregate non-audit fees paid to the Registrant’s auditors, including fees for all services billed to the Registrant, adviser and affiliates that provide ongoing services to the Registrant, were $1,484,000 for fiscal year 2019 and $1,837,000 for fiscal year 2020. The non-audit services represented by these amounts were brought to the attention of the committee and considered to be compatible with maintaining the auditors’ independence. |
ITEM 5 – Audit Committee of Listed Registrants
Not applicable to this Registrant, insofar as the Registrant is not a listed issuer as defined in Rule 10A-3 under the Securities Exchange Act of 1934.
ITEM 6 – Schedule of Investments

| Common stocks 89.53% Consumer discretionary 15.53% | Shares | Value (000) |
| Alibaba Group Holding Ltd. (ADR)1 | 9,539,293 | $1,855,201 |
| Alibaba Group Holding Ltd.1,2 | 69,630,448 | 1,637,913 |
| MercadoLibre, Inc.1,3 | 4,108,989 | 2,007,570 |
| LVMH Moët Hennessy-Louis Vuitton SE2 | 5,335,525 | 1,980,523 |
| Sony Corp.2 | 22,651,200 | 1,346,460 |
| adidas AG2 | 4,687,433 | 1,078,334 |
| Meituan Dianping, Class B1,2 | 74,215,949 | 890,630 |
| Kering SA2 | 1,612,355 | 841,319 |
| EssilorLuxottica2 | 7,764,090 | 837,667 |
| Galaxy Entertainment Group Ltd.2 | 145,458,000 | 770,474 |
| Just Eat Takeaway (GBP denominated)1,2,3 | 6,590,594 | 496,082 |
| Just Eat Takeaway (EUR denominated)1,2,3 | 3,151,312 | 237,563 |
| Flutter Entertainment PLC (EUR denominated)2,3 | 5,056,753 | 458,413 |
| Flutter Entertainment PLC (GBP denominated)2,3 | 1,214,593 | 109,544 |
| Industria de Diseño Textil, SA2 | 18,534,026 | 481,176 |
| Stars Group Inc.1,3 | 23,082,671 | 471,348 |
| Delivery Hero SE1,2 | 5,615,825 | 425,849 |
| Melco Resorts & Entertainment Ltd. (ADR)3 | 32,625,886 | 404,561 |
| Fast Retailing Co., Ltd.2 | 858,000 | 350,592 |
| GVC Holdings PLC2,3 | 46,288,920 | 321,321 |
| Prosus NV1,2 | 4,633,502 | 321,049 |
| Hermès International2 | 459,238 | 317,178 |
| Sands China Ltd.2 | 72,348,000 | 263,301 |
| Naspers Ltd., Class N2 | 1,802,594 | 256,096 |
| Ryohin Keikaku Co., Ltd.2,3 | 18,105,500 | 203,217 |
| Evolution Gaming Group AB2 | 5,627,834 | 191,614 |
| Barratt Developments PLC2 | 33,323,000 | 181,613 |
| Maruti Suzuki India Ltd.2 | 2,794,233 | 156,594 |
| Nitori Holdings Co., Ltd.2 | 1,150,200 | 155,473 |
| Central Retail Corp. PCL, foreign registered1,2 | 179,357,000 | 153,028 |
| Accor SA2 | 4,780,501 | 130,766 |
| Ferrari NV2 | 755,813 | 117,473 |
| Peugeot SA2 | 6,800,000 | 90,661 |
| Wynn Macau, Ltd.2 | 57,774,800 | 87,386 |
| Gree Electric Appliances, Inc. of Zhuhai, Class A2 | 11,618,530 | 85,856 |
| ASOS PLC1,2,3 | 5,440,976 | 80,572 |
| Bayerische Motoren Werke AG2 | 1,443,384 | 75,778 |
| B2W - Cia. Digital, ordinary nominative1 | 7,096,000 | 65,551 |
| Melco International Development Ltd.2 | 39,377,000 | 56,649 |
| Moncler SpA2 | 1,315,000 | 48,004 |
| Cie. Financière Richemont SA, Class A2 | 832,731 | 45,638 |
| Trip.com Group Ltd. (ADR)1 | 1,727,400 | 40,508 |
| China International Travel Service Corp. Ltd., Class A2 | 2,989,487 | 28,457 |
| S.A.C.I. Falabella | 11,675,000 | 25,726 |
| William Hill PLC2 | 21,244,348 | 17,882 |
| Hyundai Motor Co.2 | 239,825 | 17,281 |
| Pan Pacific International Holdings Corp.2 | 735,000 | 13,958 |
| Common stocks (continued) Consumer discretionary (continued) | Shares | Value (000) |
| Lojas Americanas SA, ordinary nominative | 2,573,000 | $7,155 |
| Burberry Group PLC2 | 92,256 | 1,509 |
| 20,238,513 | ||
| Financials 14.23% | ||
| AIA Group Ltd.2 | 378,001,706 | 3,400,617 |
| HDFC Bank Ltd.2 | 194,701,815 | 2,190,710 |
| HDFC Bank Ltd. (ADR) | 11,291,403 | 434,267 |
| Kotak Mahindra Bank Ltd.2 | 95,139,478 | 1,610,084 |
| London Stock Exchange Group PLC2 | 10,226,141 | 921,392 |
| Ping An Insurance (Group) Co. of China, Ltd., Class H2 | 63,610,999 | 622,253 |
| Ping An Insurance (Group) Co. of China, Ltd., Class A2 | 8,178,157 | 80,042 |
| ICICI Bank Ltd.2 | 135,615,372 | 593,896 |
| ICICI Bank Ltd. (ADR) | 9,800,077 | 83,300 |
| B3 SA - Brasil, Bolsa, Balcao | 91,700,000 | 633,558 |
| Sberbank of Russia PJSC (ADR)2 | 57,378,085 | 543,663 |
| UniCredit SpA2 | 66,455,164 | 520,326 |
| Barclays PLC2 | 372,479,246 | 432,788 |
| PICC Property and Casualty Co. Ltd., Class H2 | 446,035,869 | 429,018 |
| Housing Development Finance Corp. Ltd.2 | 18,926,695 | 404,228 |
| Bank Central Asia Tbk PT2 | 229,396,100 | 387,894 |
| Deutsche Boerse AG2 | 2,727,756 | 374,707 |
| Deutsche Bank AG2 | 53,441,066 | 359,012 |
| Hong Kong Exchanges and Clearing Ltd.2 | 11,213,100 | 336,743 |
| BNP Paribas SA2 | 10,359,303 | 312,284 |
| Brookfield Asset Management Inc., Class A | 6,987,319 | 309,189 |
| Zurich Insurance Group AG2 | 866,388 | 307,532 |
| HDFC Life Insurance Co. Ltd.1,2 | 45,707,639 | 263,750 |
| HDFC Life Insurance Co. Ltd.1,2 | 7,532,055 | 43,463 |
| Axis Bank Ltd.2 | 57,971,711 | 286,001 |
| Toronto-Dominion Bank (CAD denominated) | 6,694,077 | 284,592 |
| Banco Santander, SA2 | 113,083,146 | 275,239 |
| FinecoBank SpA2 | 27,828,446 | 252,892 |
| Commerzbank AG, non-registered shares2 | 59,879,938 | 217,823 |
| The People’s Insurance Co. (Group) of China Ltd., Class H2 | 573,739,215 | 188,526 |
| Turkiye Garanti Bankasi AS1,2 | 134,754,880 | 162,175 |
| Société Générale2 | 8,241,084 | 138,635 |
| Capitec Bank Holdings Ltd.2 | 2,606,636 | 127,618 |
| 3i Group PLC2 | 11,855,348 | 116,023 |
| Bank Rakyat Indonesia (Persero) Tbk PT2 | 528,789,300 | 97,238 |
| Sony Financial Holdings Inc.2 | 5,244,600 | 88,648 |
| Banco BPM SpA1,2 | 59,907,284 | 78,757 |
| Royal Bank of Canada | 1,241,092 | 76,875 |
| Akbank TAS1,2 | 92,023,146 | 76,521 |
| Hiscox Ltd.2 | 5,765,619 | 66,017 |
| BB Seguridade Participações SA | 11,335,200 | 54,210 |
| Macquarie Group Ltd.2 | 977,198 | 53,202 |
| ING Groep NV2 | 8,818,056 | 46,189 |
| Hargreaves Lansdown PLC2 | 2,648,876 | 45,388 |
| Bajaj Finance Ltd.2 | 1,526,622 | 44,005 |
| Metropolitan Bank & Trust Co.2 | 46,894,890 | 36,388 |
| DBS Group Holdings Ltd.2 | 2,601,800 | 34,019 |
| Burford Capital Ltd.2 | 6,488,198 | 33,724 |
| IndusInd Bank Ltd.2 | 4,977,000 | 22,692 |
| TMX Group Ltd. | 268,000 | 19,952 |
| Common stocks (continued) Financials (continued) | Shares | Value (000) |
| Discovery Ltd.2 | 3,425,623 | $14,896 |
| Banco Bilbao Vizcaya Argentaria, SA2 | 2,659,942 | 8,503 |
| 18,541,464 | ||
| Information technology 13.33% | ||
| ASML Holding NV2 | 11,730,764 | 3,117,574 |
| Taiwan Semiconductor Manufacturing Co., Ltd.2 | 192,306,649 | 1,716,532 |
| Taiwan Semiconductor Manufacturing Co., Ltd. (ADR) | 8,126,216 | 388,352 |
| Keyence Corp.2 | 6,325,900 | 2,041,466 |
| SAP SE2 | 11,482,593 | 1,318,812 |
| Samsung Electronics Co., Ltd.2 | 28,446,453 | 1,105,546 |
| Shopify Inc., Class A, subordinate voting shares1 | 2,220,000 | 925,585 |
| Amadeus IT Group SA, Class A, non-registered shares2 | 18,137,099 | 860,160 |
| Edenred SA2,3 | 13,593,956 | 568,951 |
| Halma PLC2,3 | 22,478,479 | 534,058 |
| PagSeguro Digital Ltd., Class A1,3 | 26,277,697 | 507,948 |
| STMicroelectronics NV2 | 21,192,740 | 461,232 |
| Tokyo Electron Ltd.2 | 2,097,200 | 394,356 |
| Worldline SA, non-registered shares1,2 | 6,162,508 | 362,245 |
| Hexagon AB, Class B2 | 7,920,153 | 337,823 |
| Temenos AG2 | 2,565,397 | 336,386 |
| Adyen NV1,2 | 395,598 | 334,805 |
| Nice Ltd. (ADR)1 | 1,785,840 | 256,375 |
| Nice Ltd.1,2 | 252,694 | 36,585 |
| Largan Precision Co., Ltd.2 | 2,033,000 | 252,732 |
| Capgemini SE2 | 2,703,426 | 228,695 |
| StoneCo Ltd., Class A1 | 7,066,758 | 153,843 |
| Nomura Research Institute, Ltd.2 | 7,131,200 | 150,677 |
| OBIC Co., Ltd.2 | 1,042,863 | 136,236 |
| Murata Manufacturing Co., Ltd.2 | 2,469,800 | 125,009 |
| Ingenico Group SA2 | 1,024,000 | 108,834 |
| SimCorp AS2 | 1,175,949 | 98,973 |
| Dassault Systemes SA2 | 639,344 | 94,813 |
| TeamViewer AG1,2 | 2,188,898 | 87,588 |
| TravelSky Technology Ltd., Class H2 | 48,338,000 | 84,839 |
| Hangzhou Hikvision Digital Technology Co., Ltd., Class A2 | 18,959,894 | 74,203 |
| MediaTek Inc.2 | 6,176,000 | 65,781 |
| Infineon Technologies AG2 | 3,346,283 | 50,123 |
| Infosys Ltd. (ADR) | 5,286,000 | 43,398 |
| TDK Corp.2 | 128,000 | 9,905 |
| 17,370,440 | ||
| Health care 12.92% | ||
| Daiichi Sankyo Co., Ltd.2,3 | 39,384,700 | 2,709,731 |
| Chugai Pharmaceutical Co., Ltd.2 | 13,495,300 | 1,562,099 |
| Novartis AG2 | 18,338,137 | 1,515,556 |
| AstraZeneca PLC2 | 15,279,883 | 1,364,922 |
| Alcon Inc.1,2 | 18,591,046 | 948,739 |
| CSL Ltd.2 | 4,126,058 | 748,479 |
| HOYA Corp.2 | 8,172,151 | 695,114 |
| Takeda Pharmaceutical Co. Ltd.2 | 19,089,453 | 584,187 |
| Teva Pharmaceutical Industries Ltd. (ADR)1,3 | 56,229,075 | 504,937 |
| Grifols, SA, Class A, non-registered shares2 | 11,435,697 | 389,501 |
| Grifols, SA, Class B (ADR) | 3,513,426 | 70,761 |
| Koninklijke Philips NV (EUR denominated)2 | 11,074,321 | 448,230 |
| Common stocks (continued) Health care (continued) | Shares | Value (000) |
| Fresenius SE & Co. KGaA2 | 11,726,344 | $440,661 |
| Galapagos NV1,2 | 2,146,391 | 425,892 |
| Hikma Pharmaceuticals PLC2,3 | 14,499,283 | 365,512 |
| Novo Nordisk A/S, Class B2 | 5,805,787 | 350,213 |
| Olympus Corp.2 | 23,589,200 | 340,450 |
| Notre Dame Intermédica Participações SA3 | 37,609,625 | 325,423 |
| M3, Inc.2,4 | 10,227,151 | 302,229 |
| Asahi Intecc Co., Ltd.2 | 10,907,700 | 270,020 |
| Aier Eye Hospital Group Co., Ltd., Class A2 | 48,364,109 | 269,746 |
| Coloplast A/S, Class B2 | 1,815,502 | 264,144 |
| Hypera SA, ordinary nominative3 | 34,858,300 | 191,798 |
| Fisher & Paykel Healthcare Corp. Ltd.2 | 9,783,090 | 177,345 |
| bioMérieux SA2 | 1,471,463 | 166,056 |
| WuXi AppTec Co., Ltd. Class A2 | 12,892,445 | 163,664 |
| WuXi Biologics (Cayman) Inc.1,2 | 12,496,847 | 161,104 |
| Merck KGaA2 | 1,435,831 | 148,885 |
| Fresenius Medical Care AG & Co. KGaA2 | 2,203,725 | 146,996 |
| BeiGene, Ltd. (ADR)1 | 1,093,753 | 134,652 |
| Lonza Group AG2 | 317,000 | 131,888 |
| Sonova Holding AG2 | 645,000 | 116,446 |
| GN Store Nord AS2 | 1,858,445 | 83,191 |
| Argenx SE (ADR)1 | 571,982 | 75,347 |
| Genmab A/S1,2 | 360,000 | 73,072 |
| Terumo Corp.2 | 1,870,000 | 64,308 |
| GW Pharmaceuticals PLC (ADR)1,4 | 518,362 | 45,393 |
| Straumann Holding AG2 | 46,168 | 34,408 |
| Shionogi & Co., Ltd.2 | 412,700 | 20,307 |
| NMC Health PLC2,3,5 | 12,753,621 | 8,290 |
| 16,839,696 | ||
| Industrials 7.90% | ||
| Airbus SE, non-registered shares2 | 30,488,033 | 1,978,163 |
| Recruit Holdings Co., Ltd.2 | 53,138,429 | 1,372,130 |
| Safran SA2 | 9,134,324 | 802,871 |
| DSV Panalpina A/S2 | 5,519,125 | 502,535 |
| Melrose Industries PLC2,3 | 388,449,844 | 438,676 |
| MTU Aero Engines AG2,3 | 2,954,802 | 432,886 |
| Knorr-Bremse AG, non-registered shares2 | 4,478,659 | 401,556 |
| Experian PLC2 | 13,838,819 | 385,248 |
| Rentokil Initial PLC2 | 78,896,514 | 378,672 |
| SMC Corp.2 | 794,900 | 339,321 |
| Airports of Thailand PCL, foreign registered2 | 201,546,900 | 315,335 |
| NIBE Industrier AB, Class B2 | 18,065,926 | 263,047 |
| Spirax-Sarco Engineering PLC2 | 2,306,867 | 233,035 |
| DCC PLC2 | 3,622,586 | 228,475 |
| Jardine Matheson Holdings Ltd.2 | 4,333,300 | 216,754 |
| Shanghai International Airport Co., Ltd., Class A2 | 24,393,228 | 209,997 |
| Nidec Corp.2 | 3,910,400 | 202,837 |
| Rolls-Royce Holdings PLC1,2 | 47,193,306 | 198,608 |
| Ryanair Holdings PLC (ADR)1 | 3,479,326 | 184,717 |
| ASSA ABLOY AB, Class B2 | 9,264,950 | 175,154 |
| Rheinmetall AG2 | 1,965,507 | 140,283 |
| Adani Ports & Special Economic Zone Ltd.2 | 42,547,717 | 139,064 |
| CCR SA, ordinary nominative | 55,762,655 | 125,882 |
| Kingspan Group PLC2 | 2,064,109 | 110,520 |
| Common stocks (continued) Industrials (continued) | Shares | Value (000) |
| Aeroports de Paris SA2 | 866,993 | $83,241 |
| International Consolidated Airlines Group SA (CDI)2 | 29,502,911 | 78,214 |
| Rational AG2 | 143,296 | 76,783 |
| Epiroc AB, Class B2 | 7,064,752 | 70,064 |
| Aalberts NV, non-registered shares2 | 2,925,608 | 69,464 |
| easyJet PLC2 | 5,880,000 | 42,316 |
| Deutsche Lufthansa AG2,4 | 3,148,000 | 30,058 |
| Daikin Industries, Ltd.2 | 173,300 | 21,133 |
| Canadian National Railway Co. (CAD denominated) | 265,300 | 20,743 |
| Alliance Global Group, Inc.1,2 | 123,500,000 | 16,879 |
| RELX PLC2 | 523,400 | 11,220 |
| 10,295,881 | ||
| Consumer staples 6.07% | ||
| Nestlé SA2 | 14,203,727 | 1,463,953 |
| Kweichow Moutai Co., Ltd., Class A2 | 6,215,215 | 976,974 |
| British American Tobacco PLC2 | 25,595,618 | 874,048 |
| Pernod Ricard SA2 | 5,229,022 | 743,770 |
| KOSÉ Corp.2,3 | 4,244,800 | 523,331 |
| Kirin Holdings Co., Ltd.2 | 16,075,300 | 318,392 |
| Philip Morris International Inc. | 4,252,740 | 310,280 |
| Thai Beverage PCL2 | 682,793,300 | 290,859 |
| Anheuser-Busch InBev SA/NV2 | 6,431,802 | 285,626 |
| Inner Mongolia Yili Industrial Group Co., Ltd., Class A2 | 53,578,236 | 226,424 |
| Reckitt Benckiser Group PLC2 | 2,737,800 | 210,120 |
| Danone SA2 | 2,388,782 | 154,064 |
| Coca-Cola European Partners PLC | 3,579,115 | 134,324 |
| Uni-Charm Corp.2 | 3,573,700 | 134,183 |
| CP ALL PCL, foreign registered2 | 66,136,166 | 123,540 |
| Shiseido Co., Ltd.2 | 2,071,600 | 122,373 |
| Alimentation Couche-Tard Inc., Class B | 4,601,397 | 108,389 |
| Chocoladefabriken Lindt & Sprüngli AG2 | 1,143 | 99,992 |
| Ambev SA | 41,116,000 | 94,321 |
| Treasury Wine Estates Ltd.2 | 14,646,186 | 89,855 |
| Avenue Supermarts Ltd.1,2 | 2,982,864 | 86,073 |
| Diageo PLC2 | 2,576,600 | 82,525 |
| China Mengniu Dairy Co.2 | 22,077,000 | 76,465 |
| Coca-Cola HBC AG (CDI)2 | 3,000,046 | 64,480 |
| Associated British Foods PLC2 | 2,687,600 | 60,317 |
| Glanbia PLC2 | 5,175,719 | 56,221 |
| Budweiser Brewing Co., APAC Ltd.1,2 | 20,889,800 | 53,675 |
| Fomento Económico Mexicano, SAB de CV | 8,635,600 | 52,136 |
| Carlsberg A/S, Class B2 | 422,800 | 47,995 |
| Unilever PLC2 | 335,000 | 16,912 |
| Foshan Haitian Flavouring and Food Co. Ltd., Class A2 | 795,400 | 14,036 |
| L’Oréal SA, non-registered shares2 | 49,200 | 12,914 |
| 7,908,567 | ||
| Communication services 5.86% | ||
| Nintendo Co., Ltd.2 | 5,999,727 | 2,314,058 |
| Tencent Holdings Ltd.2 | 32,814,411 | 1,600,082 |
| SoftBank Group Corp.2 | 34,007,900 | 1,190,855 |
| Sea Ltd., Class A (ADR)1,4 | 13,238,115 | 586,581 |
| Altice Europe NV, Class A1,2,3 | 67,470,131 | 260,811 |
| Altice Europe NV, Class B1,2,3 | 14,660,819 | 57,068 |
| Common stocks (continued) Communication services (continued) | Shares | Value (000) |
| Cellnex Telecom, SA, non-registered shares2 | 6,661,678 | $303,217 |
| Bharti Airtel Ltd.1,2 | 50,194,098 | 289,179 |
| Z Holding Corp.2 | 69,950,400 | 225,001 |
| América Móvil, SAB de CV, Series L (ADR) | 12,849,394 | 151,366 |
| América Móvil, SAB de CV, Series L | 18,821,401 | 11,147 |
| Ubisoft Entertainment SA1,2 | 1,946,572 | 143,552 |
| China Tower Corp. Ltd., Class H2 | 484,308,000 | 108,130 |
| Yandex NV, Class A1 | 2,703,400 | 92,051 |
| Koninklijke KPN NV2 | 36,186,245 | 86,555 |
| Nippon Telegraph and Telephone Corp.2 | 3,271,700 | 77,638 |
| ITV PLC2 | 89,847,024 | 74,290 |
| JOYY Inc., Class A (ADR)1 | 636,921 | 33,922 |
| TalkTalk Telecom Group PLC2 | 30,312,400 | 31,955 |
| 7,637,458 | ||
| Materials 5.50% | ||
| Vale SA, ordinary nominative (ADR) | 103,405,704 | 857,234 |
| Vale SA, ordinary nominative | 50,047,180 | 416,281 |
| Sika AG2 | 5,845,135 | 967,115 |
| Koninklijke DSM NV2 | 7,965,617 | 905,167 |
| Shin-Etsu Chemical Co., Ltd.2 | 7,521,100 | 745,408 |
| Linde PLC | 1,887,263 | 326,497 |
| Linde PLC (EUR denominated)2 | 1,139,582 | 205,631 |
| UPM-Kymmene Oyj2 | 17,531,112 | 483,201 |
| Rio Tinto PLC2 | 6,845,348 | 314,220 |
| First Quantum Minerals Ltd.3 | 53,100,289 | 271,293 |
| Asahi Kasei Corp.2 | 32,199,042 | 227,576 |
| CCL Industries Inc., Class B, nonvoting shares | 5,843,000 | 177,661 |
| Givaudan SA2 | 43,608 | 135,203 |
| CRH PLC2 | 4,368,987 | 119,094 |
| HeidelbergCement AG2 | 2,649,529 | 115,558 |
| ArcelorMittal SA2 | 9,893,012 | 93,756 |
| Teck Resources Ltd., Class B | 11,696,626 | 88,683 |
| Barrick Gold Corp. (CAD denominated) | 4,588,000 | 84,307 |
| UltraTech Cement Ltd.2 | 1,856,186 | 78,916 |
| Beijing Oriental Yuhong Waterproof Technology Co., Ltd., Class A2 | 15,392,944 | 74,191 |
| Akzo Nobel NV2 | 1,015,052 | 66,919 |
| Evonik Industries AG2 | 3,112,643 | 66,461 |
| Yara International ASA2 | 2,065,509 | 65,351 |
| LafargeHolcim Ltd.2 | 1,774,810 | 64,881 |
| BASF SE2 | 1,273,072 | 61,532 |
| UPL Ltd.2 | 13,500,000 | 57,700 |
| Aluminum Corp. of China Ltd., Class H1,2 | 254,328,000 | 50,303 |
| MMG Ltd.1,2,4 | 115,376,000 | 16,417 |
| Chr. Hansen Holding A/S2 | 186,000 | 13,956 |
| Asian Paints Ltd.2 | 555,000 | 12,115 |
| Gerdau SA (ADR)4 | 4,706,919 | 8,990 |
| 7,171,617 | ||
| Energy 3.60% | ||
| Reliance Industries Ltd.2 | 188,970,403 | 2,781,444 |
| Canadian Natural Resources, Ltd. (CAD denominated) | 57,731,064 | 789,684 |
| Petróleo Brasileiro SA (Petrobras), ordinary nominative (ADR) | 45,607,884 | 250,843 |
| BP PLC2 | 49,835,026 | 212,007 |
| TOTAL SA2 | 5,236,838 | 203,082 |
| Common stocks (continued) Energy (continued) | Shares | Value (000) |
| Royal Dutch Shell PLC, Class B2 | 7,708,697 | $129,251 |
| Cenovus Energy Inc. | 46,154,957 | 93,143 |
| Saipem SpA, Class S1,2 | 25,896,502 | 63,638 |
| Neste Oyj2 | 1,681,240 | 56,946 |
| Rosneft Oil Co. PJSC (GDR)2 | 10,938,600 | 44,133 |
| Suncor Energy Inc. | 2,494,365 | 39,809 |
| Tourmaline Oil Corp. | 4,047,604 | 24,850 |
| 4,688,830 | ||
| Utilities 3.36% | ||
| Ørsted AS2 | 9,120,210 | 895,650 |
| China Gas Holdings Ltd.2 | 209,890,000 | 727,894 |
| Enel SpA2 | 104,040,486 | 724,166 |
| ENN Energy Holdings Ltd.2,3 | 73,744,200 | 709,198 |
| China Resources Gas Group Ltd.2,3 | 126,618,000 | 635,653 |
| E.ON SE2 | 17,919,929 | 188,455 |
| Iberdrola, SA, non-registered shares2 | 15,902,630 | 157,023 |
| Guangdong Investment Ltd.2 | 75,892,000 | 145,553 |
| National Grid PLC2 | 11,155,000 | 130,742 |
| SSE PLC2 | 4,039,391 | 65,192 |
| 4,379,526 | ||
| Real estate 1.23% | ||
| China Overseas Land & Investment Ltd.2 | 140,136,000 | 432,450 |
| Longfor Group Holdings Ltd.2 | 65,944,000 | 319,119 |
| Ayala Land, Inc.2 | 390,814,709 | 233,413 |
| ESR Cayman Ltd.1,2 | 85,112,800 | 183,037 |
| Vonovia SE2 | 3,332,417 | 164,259 |
| CK Asset Holdings Ltd.2 | 20,715,500 | 112,697 |
| Sun Hung Kai Properties Ltd.2 | 6,620,226 | 86,923 |
| Vinhomes JSC2 | 33,474,875 | 77,184 |
| 1,609,082 | ||
| Total common stocks (cost: $101,879,095,000) | 116,681,074 | |
| Preferred securities 1.10% Health care 0.55% | ||
| Sartorius AG, nonvoting preferred, non-registered shares1,2 | 1,839,693 | 449,640 |
| Grifols, SA, Class B, nonvoting preferred, non-registered shares2 | 13,344,611 | 266,699 |
| 716,339 | ||
| Consumer discretionary 0.25% | ||
| Volkswagen AG, nonvoting preferred shares2 | 2,727,227 | 324,933 |
| Financials 0.13% | ||
| Itaú Unibanco Holding SA, preferred nominative (ADR) | 36,535,654 | 164,045 |
| Energy 0.11% | ||
| Petróleo Brasileiro SA (Petrobras), preferred nominative (ADR) | 23,704,148 | 127,765 |
| Petróleo Brasileiro SA (Petrobras), preferred nominative | 4,531,400 | 12,201 |
| 139,966 |
| Preferred securities (continued) Information technology 0.06% | Shares | Value (000) |
| Samsung Electronics Co., Ltd., nonvoting preferred shares2 | 2,440,000 | $79,648 |
| Industrials 0.00% | ||
| Azul SA, preferred nominative1 | 1,272,000 | 4,296 |
| Materials 0.00% | ||
| Gerdau SA, preferred nominative | 1,550,300 | 2,999 |
| Real estate 0.00% | ||
| Ayala Land, Inc., preferred shares1,2,5 | 481,283,600 | —6 |
| Total preferred securities (cost: $1,430,619,000) | 1,432,226 | |
| Rights & warrants 0.06% Health care 0.06% | ||
| WuXi AppTec Co., Ltd., Class A, warrants, expire 20202,7 | 6,115,300 | 77,631 |
| Total rights & warrants (cost: $46,709,000) | 77,631 | |
| Bonds, notes & other debt instruments 0.09% U.S. Treasury bonds & notes 0.08% U.S. Treasury 0.08% | Principal amount (000) | |
| U.S. Treasury 2.50% 2020 | $100,000 | 101,785 |
| Total U.S. Treasury bonds & notes | 101,785 | |
| Bonds & notes of governments outside the U.S. 0.01% | ||
| Argentine Republic 1.40% 20238 | ARS2,111,366 | 12,242 |
| Total bonds, notes & other debt instruments (cost: $111,557,000) | 114,027 | |
| Short-term securities 8.78% Money market investments 8.78% | Shares | |
| Capital Group Central Cash Fund 1.00%3,9 | 113,995,069 | 11,404,067 |
| Blackrock FedFund 0.33%9,10 | 14,000,000 | 14,000 |
| Invesco Short-term Investments Trust - Government & Agency Portfolio 0.43%9,10 | 6,578,920 | 6,579 |
| State Street Institutional U.S. Government Money Market Fund 0.32%9,10 | 6,350,000 | 6,350 |
| Goldman Sachs Financial Square Government Fund 0.34%9,10 | 4,000,000 | 4,000 |
| Fidelity Institutional Money Market Funds - Government Portfolio 0.30%9,10 | 1,700,000 | 1,700 |
| Morgan Stanley Institutional Liquidity Funds - Government Portfolio 0.25%9,10 | 1,000,000 | 1,000 |
| RBC U.S. Government Money Market Fund 0.82%9,10 | 1,000,000 | 1,000 |
| 11,438,696 | ||
| Total short-term securities (cost: $11,433,919,000) | 11,438,696 | |
| Total investment securities99.56% (cost: $114,901,899,000) | 129,743,654 | |
| Other assets less liabilities 0.44% | 578,916 | |
| Net assets100.00% | $130,322,570 |
| 1 | Security did not produce income during the last 12 months. |
| 2 | Valued under fair value procedures adopted by authority of the board of trustees. The total value of all such securities was $102,147,116,000, which represented 78.38% of the net assets of the fund. This amount includes $102,047,159,000 related to certain securities trading outside the U.S. whose values were adjusted as a result of significant market movements following the close of local trading. |
| 3 | Represents an affiliated company as defined under the Investment Company Act of 1940. |
| 4 | All or a portion of this security was on loan. The total value of all such securities was $71,863,000, which represented .06% of the net assets of the fund. |
| 5 | Value determined using significant unobservable inputs. |
| 6 | Amount less than one thousand. |
| 7 | Acquired in a transaction exempt from registration under Rule 144A of the Securities Act of 1933. May be resold in the U.S. in transactions exempt from registration, normally to qualified institutional buyers. The total value of all such securities was $77,631,000, which represented .06% of the net assets of the fund. |
| 8 | Index-linked bond whose principal amount moves with a government price index. |
| 9 | Rate represents the seven-day yield at 3/31/2020. |
| 10 | Security purchased with cash collateral from securities on loan. |
| Key to abbreviations |
| ADR = American Depositary Receipts |
| CAD = Canadian dollars |
| CDI = CREST Depository Interest |
| EUR = Euros |
| GBP = British pounds |
| GDR = Global Depositary Receipts |
| MFGEFPX-016-0520O-S73158 | EuroPacific Growth Fund — Page 9 of 9 |
REPORT OF INDEPENDENT REGISTERED PUBLIC ACCOUNTING FIRM ON INVESTMENT PORTFOLIO
To the Shareholders and Board of Trustees of EuroPacific Growth Fund:
Opinion on the Investment Portfolio
We have audited the accompanying investment portfolio of EuroPacific Growth Fund (the “Fund”), as of March 31, 2020, and the related notes (“investment portfolio”) (included in Item 6 of this Form N-CSR). In our opinion, the investment portfolio presents fairly, in all material respects, the investments in securities of the Fund as of March 31, 2020, in conformity with accounting principles generally accepted in the United States of America.
Basis for Opinion
The investment portfolio is the responsibility of the Fund’s management. Our responsibility is to express an opinion on the investment portfolio based on our audit. We are a public accounting firm registered with the Public Company Accounting Oversight Board (United States) (PCAOB) and are required to be independent with respect to the Fund in accordance with the U.S. federal securities laws and the applicable rules and regulations of the Securities and Exchange Commission and the PCAOB.
We conducted our audit in accordance with the standards of the PCAOB. Those standards require that we plan and perform the audit to obtain reasonable assurance about whether the investment portfolio is free of material misstatement, whether due to error or fraud. The Fund is not required to have, nor were we engaged to perform, an audit of its internal control over financial reporting. As part of our audit we are required to obtain an understanding of internal control over financial reporting but not for the purpose of expressing an opinion on the effectiveness of the Fund's internal control over financial reporting. Accordingly, we express no such opinion.
Our audit included performing procedures to assess the risks of material misstatement of the investment portfolio, whether due to error or fraud, and performing procedures that respond to those risks. Such procedures included examining, on a test basis, evidence regarding the amounts and disclosures in the investment portfolio. Our audit also included evaluating the accounting principles used and significant estimates made by management, as well as evaluating the overall presentation of the investment portfolio. We believe that our audit provides a reasonable basis for our opinion.

Costa Mesa, California
May 11, 2020
We have served as the auditor of one or more American Funds investment companies since 1956.
ITEM 7 – Disclosure of Proxy Voting Policies and Procedures for Closed-End Management Investment Companies
Not applicable to this Registrant, insofar as the Registrant is not a closed-end management investment company.
ITEM 8 – Portfolio Managers of Closed-End Management Investment Companies
Not applicable to this Registrant, insofar as the Registrant is not a closed-end management investment company.
ITEM 9 – Purchases of Equity Securities by Closed-End Management Investment Company and Affiliated Purchasers
Not applicable to this Registrant, insofar as the Registrant is not a closed-end management investment company.
ITEM 10 – Submission of Matters to a Vote of Security Holders
There have been no material changes to the procedures by which shareholders may recommend nominees to the Registrant’s board of trustees since the Registrant last submitted a proxy statement to its shareholders. The procedures are as follows. The Registrant has a nominating and governance committee comprised solely of persons who are not considered ‘‘interested persons’’ of the Registrant within the meaning of the Investment Company Act of 1940, as amended. The committee periodically reviews such issues as the board’s composition, responsibilities, committees, compensation and other relevant issues, and recommends any appropriate changes to the full board of trustees. While the committee normally is able to identify from its own resources an ample number of qualified candidates, it will consider shareholder suggestions of persons to be considered as nominees to fill future vacancies on the board. Such suggestions must be sent in writing to the nominating and governance committee of the Registrant, c/o the Registrant’s Secretary, and must be accompanied by complete biographical and occupational data on the prospective nominee, along with a written consent of the prospective nominee for consideration of his or her name by the nominating and governance committee.
ITEM 11 – Controls and Procedures
| (a) | The Registrant’s Principal Executive Officer and Principal Financial Officer have concluded, based on their evaluation of the Registrant’s disclosure controls and procedures (as such term is defined in Rule 30a-3 under the Investment Company Act of 1940), that such controls and procedures are adequate and reasonably designed to achieve the purposes described in paragraph (c) of such rule. |
| (b) | There were no changes in the Registrant’s internal controls over financial reporting (as defined in Rule 30a-3(d) under the Investment Company Act of 1940) that occurred during the Registrant’s semi-annual period covered by this report that has materially affected, or is reasonably likely to materially affect, the Registrant’s internal control over financial reporting.
|
ITEM 12 – Exhibits
| (a)(1) | TheCode of Ethics that is the subject of the disclosure required by Item 2 is attached as an exhibit hereto. |
| (a)(2) | The certifications required by Rule 30a-2 of the Investment Company Act of 1940 and Sections302 and906 of the Sarbanes-Oxley Act of 2002 are attached as exhibits hereto. |
SIGNATURES
Pursuant to the requirements of the Securities Exchange Act of 1934 and the Investment Company Act of 1940, the Registrant has duly caused this report to be signed on its behalf by the undersigned, thereunto duly authorized.
| EUROPACIFIC GROWTH FUND | |
| By __/s/ Walter R. Burkley________________ | |
Walter R. Burkley, Executive Vice President and Principal Executive Officer | |
| Date: May 29, 2020 |
Pursuant to the requirements of the Securities Exchange Act of 1934 and the Investment Company Act of 1940, this report has been signed below by the following persons on behalf of the Registrant and in the capacities and on the dates indicated.
| By _/s/ Walter R. Burkley_____________ |
Walter R. Burkley, Executive Vice President and Principal Executive Officer |
| Date: May 29, 2020 |
| By___/s/ Brian C. Janssen__________________ |
Brian C. Janssen, Treasurer and Principal Financial Officer |
| Date: May 29, 2020 |