UNITED STATES
SECURITIES AND EXCHANGE COMMISSION
Washington, D.C. 20549
FORM 10-K
ANNUAL REPORT PURSUANT TO SECTION 13 OR 15(d) OF THE SECURITIES EXCHANGE ACT OF 1934
For the fiscal year ended December 31, 2014
Commission File number 001-34453
HUDSON VALLEY HOLDING CORP.
(Exact name of registrant as specified in its charter)
New York |
| 13-3148745 |
(State or other jurisdiction of incorporation or organization) |
| (I.R.S. Employer Identification No.) |
21 Scarsdale Road, Yonkers, New York |
| 10707 |
(Address of principal executive offices) |
| (Zip Code) |
Registrant’s telephone number, including area code: (914) 961-6100
Securities Registered Pursuant to Section 12(b) of the Act:
Title of each Class |
| Name of each exchange on which registered |
Common Stock, ($0.20 par value per share) |
| New York Stock Exchange |
Securities Registered Pursuant to Section 12(g) of the Act: None
Indicate by check mark if the registrant is a well-known seasoned issuer, as defined in Rule 405 of the Securities Act. Yes ¨ No x
Indicate by check mark if the registrant is not required to file reports pursuant to Section 13 or Section 15 (d) of the Act. Yes ¨ No x
Indicate by check mark whether the Registrant (1) has filed all reports required to be filed by Sections 13 or 15(d) of the Securities Exchange Act of 1934 during the preceding 12 months and (2) has been subject to such filing requirements for the past 90 days. Yes x No ¨
Indicate by check mark whether the registrant has submitted electronically and posted on its corporate Website, if any, every Interactive Data File required to be submitted and posted pursuant to Rule 405 of Regulation S-T (§232.405 of this chapter) during the preceding 12 months (or for shorter period that the registrant is required to submit and post such files). Yes x No ¨
Indicate by check mark if disclosure of delinquent filers pursuant to Item 405 of Regulation S-K is not contained herein, and will not be contained, to the best of Registrant’s knowledge, in definitive proxy or information statements incorporated by reference in Part III of this Form 10-K or any amendment to this Form 10-K. ¨
Indicate by check mark whether the registrant is a large accelerated filer, an accelerated filer, a non-accelerated filer or a smaller reporting company. See definition of “large accelerated filer”, “accelerated filer”, and “smaller reporting company” in Rule 12b-2 of the Exchange Act (Check one):
Large accelerated filer |
| ¨ |
| Accelerated filer |
| x |
|
|
|
| |||
Non-accelerated filer |
| ¨ |
| Smaller reporting company |
| ¨ |
Indicate by check mark whether the registrant is a shell company (as defined in Rule 12b-2 of the Act) Yes ¨ No x
Class |
| Outstanding at March 3, 2015 |
Common Stock ($0.20 par value) |
| 20,072,296 |
The aggregate market value on June 30, 2014 of voting stock held by non-affiliates of the Registrant was approximately $267,656,000.
FORM 10-K
TABLE OF CONTENTS
|
|
|
|
|
| Page No. |
PART I |
|
|
|
|
|
|
|
|
|
|
|
|
|
|
| ITEM 1 |
|
| 1 | |
|
|
|
|
|
|
|
|
| ITEM 1A |
|
| 12 | |
|
|
|
|
|
|
|
|
| ITEM 1B |
|
| 23 | |
|
|
|
|
|
|
|
|
| ITEM 2 |
|
| 23 | |
|
|
|
|
|
|
|
|
| ITEM 3 |
|
| 24 | |
|
|
|
|
|
|
|
|
| ITEM 4 |
|
| 24 | |
|
|
|
|
|
|
|
PART II |
|
|
|
|
|
|
|
|
|
|
|
|
|
|
| ITEM 5 |
| MARKET FOR REGISTRANT’S COMMON EQUITY, RELATED MATTERS AND ISSUER PURCHASES OF EQUITY SECURITIES |
| 25 |
|
|
|
|
|
|
|
|
| ITEM 6 |
|
| 27 | |
|
|
|
|
|
|
|
|
| ITEM 7 |
| MANAGEMENT’S DISCUSSION AND ANALYSIS OF FINANCIAL CONDITION AND RESULTS OF OPERATIONS |
| 29 |
|
|
|
|
|
|
|
|
| ITEM 7A |
|
| 59 | |
|
|
|
|
|
|
|
|
| ITEM 8 |
|
| 62 | |
|
|
|
|
|
|
|
|
| ITEM 9 |
| CHANGES IN AND DISAGREEMENTS WITH ACCOUNTANTS ON ACCOUNTING AND FINANCIAL DISCLOSURE |
| 105 |
|
|
|
|
|
|
|
|
| ITEM 9A |
|
| 105 | |
|
|
|
|
|
|
|
|
| ITEM 9B |
|
| 105 | |
|
|
|
|
|
|
|
PART III |
|
|
|
|
|
|
|
|
|
|
|
|
|
|
| ITEM 10 |
|
| 106 | |
|
|
|
|
|
|
|
|
| ITEM 11 |
|
| 111 | |
|
|
|
|
|
|
|
|
| ITEM 12 |
| SECURITY OWNERSHIP OF CERTAIN BENEFICIAL OWNERS AND MANAGEMENT, AND RELATED STOCKHOLDER MATTERS |
| 130 |
|
|
|
|
|
|
|
|
| ITEM 13 |
| CERTAIN RELATIONSHIPS AND RELATED TRANSACTIONS, AND DIRECTOR INDEPENDENCE |
| 132 |
|
|
|
|
|
|
|
|
| ITEM 14 |
|
| 133 | |
|
|
|
|
|
|
|
PART IV |
|
|
|
|
|
|
|
|
|
|
|
|
|
|
| ITEM 15 |
|
| 134 | |
|
|
| ||||
| 137 | |||||
PART I
General
Hudson Valley Holding Corp. (“Hudson Valley” or the “Company”) is a New York corporation founded in 1982. The Company is registered as a bank holding company under the Bank Holding Company Act of 1956.
The Company provides financial services through its wholly-owned subsidiary, Hudson Valley Bank, N.A. (“HVB” or “the Bank”), a national banking association established in 1972, with operational headquarters in Westchester County, New York. HVB has seventeen branch offices in Westchester County, New York, four in Manhattan, New York, four in Bronx County, New York, two in Rockland County, New York, and one in Kings County, New York. During 2013, the Company announced and completed the consolidation and/or closure of its six Connecticut branches, one branch in Westchester, and one branch in Manhattan, New York.
The Company provides asset based lending products through a wholly-owned subsidiary of HVB, HVB Capital Credit LLC. HVB Capital Credit LLC, which was formed in 2013, has offices at 489 Fifth Avenue in Manhattan, New York.
The Company provides equipment loan and lease financing through a wholly-owned subsidiary of HVB, HVB Equipment Capital, LLC. HVB Equipment Capital, LLC, which was formed in 2014, also has offices at 489 Fifth Avenue in Manhattan, New York.
On January 22, 2015, the Company completed the sale of A.R. Schmeidler & Co., Inc. (“ARS”). ARS provided money management services and had offices at 500 Fifth Avenue in Manhattan, New York.
We derive substantially all of our revenue and income from providing banking and related services to businesses, professionals, municipalities, not-for-profit organizations and individuals within our market area. See “Our Market Area.”
Our principal executive offices are located at 21 Scarsdale Road, Yonkers, New York 10707.
Our principal customers are businesses, professionals, municipalities, not-for-profit organizations and individuals. Our strategy is to operate community-oriented banking institutions dedicated to providing personalized service to customers and focusing on products and services for selected segments of the market. We believe that our ability to attract and retain customers is due primarily to our focused approach to our markets, our personalized and professional services, our product offerings, our experienced staff, our knowledge of our markets and our ability to provide responsive solutions to customer needs. We provide these products and services to a diverse range of customers and do not rely on a single large depositor for a significant percentage of deposits.
On November 4, 2014, the Company signed a definitive Agreement and Plan of Merger (the “Merger Agreement”) with Sterling Bancorp (“Sterling”) whereby the Company will be merged with and into Sterling (the “Merger”). Immediately following the Merger, HVB will merge with and into Sterling’s wholly owned subsidiary, Sterling National Bank, with Sterling National Bank as the surviving entity. Subject to the terms and conditions of the Merger Agreement, upon completion of the Merger, the Company’s stockholders will have the right to receive 1.92 shares of Sterling common stock for each share of Company common stock. The Merger has been approved by the boards of directors of both the Company and Sterling and is subject to approval by the Company’s and Sterling’s shareholders as well as regulatory approval and other customary closing conditions. The Merger is subject to customary conditions and is anticipated to close in the second quarter of 2015.
Subsidiaries of the Bank and the Company
The Company’s direct subsidiaries at December 31, 2014 were the Bank and HVHC Risk Management Corp. The Company has no separate operations or revenues apart from HVHC Risk Management Corp. and the Bank and its subsidiaries.
The Bank’s direct subsidiaries include Grassy Sprain Real Estate Holdings, Inc. (“REIT”); HVB Capital Credit, LLC; HVB Equipment Capital, LLC; HVB Leasing Corp.; HVB Realty Corp.; Sprain Brook Realty Corp.; 369 East Realty Corp.; HVB Properties Corp.; HVB Fleet Services Corp.; and 21 Scarsdale Road Corp. HVB is the primary source of community banking activity within the consolidated group. HVB provides services through 28 branches, 23 automated teller machines, or ATMs, electronic banking, telephone banking, and its internet banking.
All significant intercompany balances and transactions have been eliminated in consolidation.
1
Employees
At December 31, 2014, we employed 403 full-time employees and 18 part-time employees. None of our employees are represented by a collective bargaining organization. We provide a variety of benefit plans for our employees, including group life, health, dental, disability, retirement and stock option plans. We consider our employee relations to be satisfactory.
Our Market Area
The banking and financial services business in our market area is highly competitive. Due to their proximity to and location within New York City, our branches compete with regional and money center banks, as well as many other non-bank financial institutions. A number of these banks are larger than we are and are increasing their efforts to serve smaller commercial borrowers. Many of these competitors, by virtue of their size and resources, may enjoy efficiencies and competitive advantages over us in pricing, delivery and marketing of their products and services. We believe that, despite the continued growth of large institutions and the potential for large out-of-area banking and financial institutions to enter our market area, there will continue to be opportunities for efficiently-operated, service-oriented, well-capitalized, community-based banking organizations to grow by serving customers that are not well served by larger institutions or do not wish to bank with such large institutions.
Westchester County is a suburban county located in the northern sector of the New York metropolitan area. It has a large and varied economic base containing many corporate headquarters, research facilities, manufacturing firms as well as well-developed trade and service sectors. The median household income, based on 2010 census data, was $79,619. The County’s 2010 per capita income of $47,814 placed Westchester County among the highest of the nation’s counties. In June 2014, the County’s unemployment rate was 5.1 percent, as compared to New York State at 6.5 percent and the United States at 6.1 percent. The County has over 100,000 businesses, which form a large portion of our current and potential customer base.
New York City, which borders Westchester County, is the nation’s financial capital and the home of more than 8 million individuals representing virtually every race and nationality. According to the 2010 census data, the median household income in the city was $64,971, while the per capita income was $59,149. This places New York City in the top ranks of cities across the United States. In June 2014, New York City’s unemployment rate was 6.4 percent. New York City also has a vibrant and diverse business community with more than 100,000 businesses and professional service firms. New York City is comprised of five counties or boroughs: Bronx, Kings (Brooklyn), New York (Manhattan), Queens and Richmond (Staten Island).
New York City has many attractive attributes and we believe that there is an opportunity for community banks to service our niche markets of businesses and professionals very effectively. We initially expanded into New York City in 1999 in the Bronx borough.
We expanded into Rockland County, New York, by opening a full service branch in New City in 2007 with a second branch opening in Suffern, New York in January 2012. Rockland County’s 2010 per capita income was $34,304, while the median household income was $82,534. In June 2014, the County’s unemployment rate was 4.9 percent. We believe Rockland County offers attractive opportunities for us to develop new customers within our niche markets of businesses, professionals and not-for-profit organizations.
Competition
The banking and financial services business in our market area is highly competitive. There are approximately 113 banking institutions with 1,686 branch banking offices in our Westchester County, Rockland County, Bronx County, Kings County and New York County market areas. These banking institutions had deposits of approximately $992 billion as of June 30, 2014 according to FDIC data. Our branches compete with local offices of large New York City commercial banks due to their proximity to and location within New York City. Other financial institutions, such as mutual funds, finance companies, factoring companies, mortgage bankers and insurance companies, also compete with us for both loans and deposits, although they are not subject to the same extensive federal regulations that govern bank holding companies and federally insured banks. We are smaller in size than most of our competitors
Competition for depositors’ funds and for credit-worthy loan customers is intense. Competition among financial institutions is based upon interest rates and other credit and service charges, the quality of service provided, the convenience of banking facilities, the products offered and, in the case of larger commercial borrowers, relative lending limits.
Federal legislation permits banking organizations to expand across state lines to offer banking services. In view of this, it is possible for large organizations to enter many new markets, including our market area. Many of these competitors, by virtue of their size and resources, may enjoy efficiencies and competitive advantages over us in pricing, delivery and marketing of their products and services.
2
In response to competition, we have focused our attention on customer service and on addressing the needs of businesses, professionals and not-for-profit organizations located in the communities in which we operate. We emphasize community relations and relationship banking.
During the past five years, we have focused on maintaining existing customer relationships and adding new relationships by providing products and services that meet these customers’ needs. The focus of our products and services continues to be businesses, professionals, not-for-profit organizations and municipalities. Our overall strategy included investigation of opportunities for expansion within our market area and beyond, as well as an ongoing review of our existing branch system to evaluate if our current locations have or have not met expectations for growth and profitability. We have invested in technology-based products and services to meet customer needs. In addition, we have expanded products and services in our deposit gathering and lending programs, and our offering of investment management and trust services.
Lending
We engage in a variety of lending activities which are primarily categorized as real estate, commercial and industrial, individual and lease financing. At December 31, 2014, gross loans totaled $1,927.4 million. Gross loans were comprised of the following loan types:
Real estate |
|
| 74.7 | % | ||
Commercial & industrial |
|
| 23.3 | % | ||
Individuals |
|
| 0.7 | % | ||
Lease financing |
|
| 1.3 | % | ||
Total |
|
| 100.0 | % | ||
|
|
|
|
|
|
|
At December 31, 2014, HVB’s lending limit to one borrower under applicable regulations was approximately $46.9 million.
In managing our loan portfolios, we focus on:
(i) | the application of established underwriting criteria, |
(ii) | the establishment of individual internal levels of lending authority below HVB’s legal lending authority, |
(iii) | the involvement by senior management and the Board of Directors in the loan approval process for designated categories, types or amounts of loans, |
(iv) | an awareness of concentration by industry or collateral, and |
(v) | the monitoring of loans for timely payment and to seek to identify potential problem loans. |
We utilize our Credit Department to assess acceptable and unacceptable credit risks based upon established underwriting criteria. We utilize our loan officers, branch managers and Credit Department to identify changes in a borrower’s financial condition that may affect the borrower’s ability to perform in accordance with loan terms. Lending policies and procedures place an emphasis on assessing a borrower’s income and cash flow as well as collateral values. Further, we utilize systems and analysis which assist in monitoring loan delinquencies. We utilize our loan officers, Asset Recovery Department and legal counsel in collection efforts on past due loans. Additional collateral or guarantees may be requested where delinquencies remain unresolved.
An independent qualified loan review firm reviews loans in our portfolios and confirms a risk grading to each reviewed loan. Loans are reviewed based upon the type of loan, the collateral for the loan, the amount of the loan and any other pertinent information. The loan review firm reports directly to the Audit Committee of the Board of Directors.
We have participated in loans originated by various other financial institutions within the normal course of business and within standard industry practices.
See “Management’s Discussion and Analysis of Financial Condition and Results of Operations — Loan Portfolio” for further information related to our portfolio and lending activities.
Deposits
We offer deposit products ranging from demand-type accounts to certificates of deposit with maturities of up to five years. Deposits are generally derived from customers within our primary marketplace. We solicit only certain types of deposits from outside
3
our market area, primarily from certain professionals and government agencies. To a lesser extent, we also utilize brokered certificates of deposit as a source of funding and to manage interest rate risk.
We set deposit rates to remain generally competitive with other financial institutions in our market, although we do not generally seek to match the highest rates paid by competing institutions. We have established a process to review interest rates on all deposit products and, based upon this process, update our deposit rates weekly. This process also established a procedure to set deposit interest rates on a relationship basis and to periodically review these deposit rates. Our Asset/Liability Management Policy and our Liquidity Policy set guidelines to manage overall interest rate risk and liquidity. These guidelines can affect the rates paid on deposits. Deposit rates are reviewed under these policies periodically since deposits are our primary source of liquidity.
For more information regarding our deposits, see “Management’s Discussion and Analysis of Financial Condition and Results of Operations — Deposits.”
Other Services
We also offer a software application designed to meet the specific administrative needs of bankruptcy trustees through a marketing and licensing agreement with the application vendor. We have no current plans to expand this line of business.
Segments
We maintain only one business segment which is discussed in more detail in Notes 1 and 15 to the financial statements included elsewhere herein.
Supervision and Regulation
Banks and bank holding companies are extensively regulated under both federal and state law. The primary regulator of the Company is the Board of Governors of the Federal Reserve System (“FRB”). The primary regulators of the Bank is the Office of the Comptroller of the Currency (“OCC”) and the Federal Deposit Insurance Corporation (“FDIC” and together with the OCC and FRB, the “Banking Agencies”). Changes in statutes, regulations, or regulatory policies applicable to the Company and its subsidiaries could have a material effect on the results of the Company.
We have set forth below brief summaries of various aspects of the supervision and regulation of bank holding companies and banks. These summaries do not purport to be complete and are qualified in their entirety by reference to applicable laws, rules and regulations.
As a bank holding company, the Company is regulated by and subject to the supervision of the FRB and are required to file with the FRB an annual report and such other information as may be required. The FRB has the authority to conduct examinations of the Company as well.
The Bank Holding Company Act of 1956 (the “BHC Act”) limits the types of companies which we may acquire or organize and the activities in which they may engage. In general, a bank holding company and its subsidiaries are prohibited from engaging in or acquiring control of any company engaged in non-banking activities unless such activities are so closely related to banking or managing and controlling banks as to be a proper incident thereto. Activities determined by the FRB to be so closely related to banking within the meaning of the BHC Act include operating a mortgage company, finance company, credit card company, factoring company, trust company or savings association; performing certain data processing operations; providing limited securities brokerage services; acting as an investment or financial advisor; acting as an insurance agent for certain types of credit-related insurance; leasing personal property on a full-payout, non-operating basis; providing tax planning and preparation service; operating a collection agency; and providing certain courier services. The FRB also has determined that certain other activities, including real estate brokerage and syndication, land development, property management and underwriting of life insurance unrelated to credit transactions, are not closely related to banking and therefore are not proper activities for a bank holding company.
The BHC Act requires every bank holding company to obtain the prior approval of the FRB before acquiring substantially all the assets of, or direct or indirect ownership or control of more than five percent of the voting shares of, any bank. Subject to certain limitations and restrictions, a bank holding company, with the prior approval of the FRB, may acquire an out-of-state bank.
Certain provisions of the BHC Act were amended in 1999 through passage of the Gramm-Leach-Bliley Financial Modernization Act of 1999 (“GLBA”). Under this legislation, a bank holding company may elect to become a “financial holding company” and thereby engage in a broader range of activities than would be permissible for traditional bank holding companies. In order to qualify for the election, all of the depository institution subsidiaries of the bank holding company must be well capitalized and well managed,
4
as defined under FRB regulations, and all such subsidiaries must have achieved a rating of “satisfactory” or better with respect to meeting community credit needs. Pursuant to the GLBA, financial holding companies are permitted to engage in activities that are “financial in nature” or incidental or complementary thereto, as determined by the FRB. The GLBA identifies several activities as “financial in nature”, including, among others, insurance underwriting and agency activities, investment advisory services, merchant banking and underwriting, and dealing in or making a market in securities.
We believe we meet the regulatory criteria that would enable us to elect to become a financial holding company. At this time, we have determined not to make such an election.
The GLBA also makes it possible for entities engaged in providing various other financial services to form financial holding companies and form or acquire banks. Accordingly, the GLBA makes it possible for a variety of financial services firms to offer products and services comparable to the products and services we offer.
There are various statutory and regulatory limitations regarding the extent to which present and future banking subsidiaries of the Company can finance or otherwise transfer funds to the Company or its non-banking subsidiaries, whether in the form of loans, extensions of credit, investments or asset purchases, including regulatory limitations on the payment of dividends directly or indirectly to the Company from the Bank. Federal bank regulatory agencies also have the authority to limit further the Bank’s payment of dividends based on such factors as the maintenance of adequate capital for such subsidiary bank, which could reduce the amount of dividends otherwise payable. Under applicable banking statutes, at December 31, 2014, the Bank could have declared additional dividends of approximately $22.0 million to the Company.
Under the policy of the FRB, the Company is expected to act as a source of financial strength to its banking subsidiaries and to commit resources to support its banking subsidiaries in circumstances where we might not do so absent such policy. In addition, any subordinated loans by the Company to its banking subsidiaries would also be subordinate in right of payment to depositors and obligations to general creditors of such subsidiary banks. The Company currently has no loans to the Bank.
The FRB has established capital adequacy guidelines for bank holding companies that are similar to the OCC capital requirements for the Bank described below. See “Management’s Discussion and Analysis of Financial Condition and Results of Operations — Capital Resources” and Note 10 to the Consolidated Financial Statements. The Company and HVB are subject to various regulatory capital guidelines. To be considered “well capitalized,” an institution must generally have a Tier 1 leverage ratio of at least 5 percent, a Tier 1 capital ratio of 8 percent and a total capital ratio of 10 percent.
Basel III
In July 2013, the U.S. banking agencies published final rules establishing a new comprehensive capital framework for U.S. banking organizations. These rules implement the Basel Committee’s December 2010 framework, commonly referred to as Basel III, for strengthening international capital standards, as well as certain provisions of the Dodd-Frank Wall Street Reform and Consumer Protections Act of 2010 (“Dodd-Frank Act”). Basel III regulations were published by the U.S. banking agencies in 2013, and when fully phased-in, will require bank holding companies and their bank subsidiaries to maintain substantially more capital, with a greater emphasis on common equity.
Basel III regulations, among other things, (i) introduce a new capital measure called “Common Equity Tier 1” (“CET1”), (ii) specify that Tier 1 capital consists of CET1 and “Additional Tier 1 capital” instruments meeting specified requirements, (iii) define CET1 narrowly by requiring that most adjustments to regulatory capital measures be made to CET1 and not to the other components of capital, thus potentially requiring higher levels of CET1 in order to meet minimum ratios and (iv) expand the scope of the adjustments as compared to existing regulations.
When fully phased in on January 1, 2019, Basel III regulations will require banks and bank holding companies to maintain (i) as a newly adopted international standard, a minimum ratio of CET1 to risk-weighted assets of at least 4.5%, plus a 2.5% “capital conservation buffer” (which is added to the 4.5% CET1 ratio as that buffer is phased in, effectively resulting in a minimum ratio of CET1 to risk-weighted assets of at least 7%), (ii) a minimum ratio of Tier 1 capital to risk-weighted assets of at least 6.0%, plus the capital conservation buffer (which is added to the 6.0% Tier 1 capital ratio as that buffer is phased in, effectively resulting in a minimum Tier 1 capital ratio of 8.5% upon full implementation), (iii) a minimum ratio of Total (that is, Tier 1 plus Tier 2) capital to risk-weighted assets of at least 8.0%, plus the capital conservation buffer (which is added to the 8.0% total capital ratio as that buffer is phased in, effectively resulting in a minimum total capital ratio of 10.5% upon full implementation) and (iv) as a newly adopted international standard, a minimum leverage ratio of 3%, calculated as the ratio of Tier 1 capital to balance sheet exposures plus certain off-balance sheet exposures (computed as the average for each quarter of the month-end ratios for the quarter).
5
In connection with the Basel III regulations, the FDIC also changed its prompt corrective action regulations. Effective January 1, 2015, banks are required to have the following capital levels in order to be considered well capitalized:
● | 6.5% CET1 to risk-weighted assets. |
● | 8.0% Tier 1 capital (i.e., CET1 plus Additional Tier 1) to risk-weighted assets. |
● | 10.0% Total capital (i.e., Tier 1 plus Tier 2) to risk-weighted assets. |
● | 5.0% Tier 1 leverage capital ratio |
The Basel III regulations provide for a number of new deductions from and adjustments to CET1. These include, for example, the requirement that mortgage servicing rights, deferred tax assets dependent upon future taxable income and significant investments in non-consolidated financial entities be deducted from CET1 to the extent that any one such category exceeds 10% of CET1 or all such categories in the aggregate exceed 15% of CET1.
Implementation of the deductions and other adjustments to CET1 began on January 1, 2014 and will be phased-in over a five-year period (20% per year). The implementation of the capital conservation buffer will begin on January 1, 2016 at 0.625% and be phased in over a four-year period (increasing by that amount on each subsequent January 1, until it reaches 2.5% on January 1, 2019). On January 7, 2013, the Basel Committee released the revised Basel III Liquidity Coverage Ratio (“LCR”). The revised LCR standards allow banks to use a broader range of liquid assets to meet their liquidity buffer and reduce some of the run-off assumptions that banks must make in calculating their net cash outflows. The revised standards also clarify that banks may dip below the minimum LCR requirement during periods of stress. On October 17, 2014, the OCC, U.S. Treasury, FRB, and the FDIC issued the Final Rule regarding the implementation of a quantitative liquidity requirement consistent with the LCR standard established by the Basel Committee and are designed to promote the short term resilience of the liquidity risk profile of banks, to which it applies. The LCR will apply to all banking organizations with $250 billion or more in total consolidated assets or $10 billion or more in on-balance sheet foreign exposure and to these banking organizations’ subsidiary depository institutions that have assets of $10 billion or more. The rule also will apply a less stringent, modified LCR to bank holding companies and savings and loan holding companies that do not meet these thresholds, but have $50 billion or more in total assets. Bank holding companies and savings and loan holding companies with substantial insurance or commercial operations are not covered by the final rule.
The Basel Committee is considering further amendments to Basel III, including the imposition of additional capital surcharges on globally systemically important financial institutions. In addition to Basel III, the Dodd-Frank Act requires or permits the federal banking agencies to adopt regulations affecting banking institutions’ capital requirements in a number of respects, including potentially more stringent capital requirements for systemically important financial institutions.
The Dodd-Frank Wall Street Reform and Consumer Protection Act of 2010
The Dodd-Frank Wall Street Reform and Consumer Protection Act of 2010 significantly changed the bank regulatory landscape and has impacted and will continue to impact the lending, deposit, investment, trading and operating activities of financial institutions and their holding companies. Generally, the Dodd-Frank Act was effective the day after it was signed into law, but different effective dates apply to specific sections of the law. The Dodd-Frank Act, among other things:
● | Directed the FRB to issue rules which limited debit-card interchange fees; |
● | After a three-year phase-in period which began January 1, 2013, removes trust preferred securities as a permitted component of Tier 1 capital for bank holding companies with assets of $15 billion or more; |
● | Provided for increases in the minimum reserve ratio for the deposit insurance fund from 1.15 percent to 1.35 percent and changes the basis for determining FDIC premiums from deposits to assets; |
● | Created a new Consumer Financial Protection Bureau (“CFPB”) which has rulemaking authority for a wide range of consumer protection laws that applies to all banks and has broad powers to supervise and enforce consumer protection laws; |
● | Required public companies to give stockholders a non-binding vote on executive compensation and on “golden parachute” payments in connection with approvals of pending mergers and acquisitions unless previously voted on by stockholders; |
● | Directed federal banking regulators to promulgate rules prohibiting excessive compensation paid to executives of depository institutions and their holding companies with assets in excess of $1 billion; |
6
● | Provided mortgage reform provisions regarding a customer’s ability to repay, requiring the ability to repay for variable-rate loans to be determined by using the maximum rate that will apply during the first five years of the loan term, and making more loans subject to provisions for higher cost loans, new disclosures, and certain other revisions; |
● | Created a Financial Stability Oversight Council that will recommend to the FRB increasingly strict rules for capital, leverage, liquidity, risk management and other requirements as companies grow in size and complexity; and |
● | Made permanent the $250 thousand limit for federal deposit insurance. |
On June 20, 2012, the SEC adopted final rules regarding heightened independence requirements for Compensation Committee members. These rules require stock exchanges to adopt listing standards that address (i) independence of compensation committee members, (ii) the compensation committee’s authority to retain compensation advisers, (iii) the compensation committee’s consideration of the independence of any compensation advisers, and (iv) the compensation committee’s responsibility for the appointment, compensation and oversight of the work of any compensation adviser. On September 25, 2012, the New York Stock Exchange and NASDAQ released proposed compensation committee and compensation committee adviser independence listing standards, and on January 11, 2013, the SEC approved these standards.
Interchange fees on debit card transactions were limited to a maximum of 21 cents per transaction plus 5 basis points of the transaction amount under the rules promulgated under the Dodd-Frank Act. A debit card issuer may recover an additional one cent per transaction for fraud prevention purposes if the issuer complies with certain fraud-related requirements prescribed by the Federal Reserve. Issuers that, together with their affiliates, have less than $10 billion in assets, such as the Bank, are exempt from the debit card interchange fee standards.
The CFPB took over rulemaking responsibility over the principal federal consumer protection laws, such as the Truth in Lending Act, the Equal Credit Opportunity Act, the Real Estate Settlement Procedures Act and the Truth in Saving Act, among others, on July 21, 2011. Institutions that have assets of $10 billion or less, such as the Bank, will continue to be supervised in this area by their primary federal regulators (in the case of the Bank, the OCC). The Act also gave the CFPB expanded data collecting powers for fair lending purposes for both small business and mortgage loans, as well as expanded authority to prevent unfair, deceptive and abusive practices.
The CFPB continued to propose amendments to mortgage regulations to implement Dodd-Frank mortgage lending requirements in August and September of 2012, and in January 2013, the CFPB issued several final rules. On January 10, 2013, the CFPB issued a final rule amending Regulation Z to implement certain amendments to the Truth in Lending Act. The rule implements statutory changes that lengthen the time for which a mandatory escrow account established for a higher-priced mortgage loan must be maintained. The rule also exempts certain transactions from the statute’s escrow requirement. The rule became effective on June 1, 2013. Also on January 10, 2013, the CFPB issued a final rule implementing amendments to the Truth in Lending Act and the Real Estate Settlement Procedures Act. The rule amends Regulation Z by expanding the types of mortgage loans that are subject to the protections of the Home Ownership and Equity Protections Act of 1994 (“HOEPA”), revising and expanding the tests for coverage under HOEPA, and imposing additional restrictions on mortgages that are covered by HOEPA, including a pre-loan counseling requirement. The rule also amends Regulation Z and Regulation X by imposing other requirements related to homeownership counseling. The rule became effective on January 10, 2014.
On January 18, 2013, the CFPB amended Regulation B to implement changes to the Equal Credit Opportunity Act. The revisions to Regulation B require creditors to provide applicants with free copies of all appraisals and other written valuations developed in connection with an application for a loan to be secured by a first lien on a dwelling, and require creditors to notify applicants in writing that copies of appraisals will be provided to them promptly. The rule became effective on January 18, 2014. On January 20, 2013, the CFPB amended Regulation Z to implement requirements and restrictions to the Truth in Lending Act concerning loan originator compensation, qualifications of, and registration or licensing of loan originators, compliance procedures for depository institutions, mandatory arbitration, and the financing of single-premium credit insurance. These amendments revise or provide additional commentary on Regulation Z’s restrictions on loan originator compensation, including application of these restrictions to prohibitions on dual compensation and compensation based on a term of a transaction or a proxy for a term of a transaction, and to recordkeeping requirements. This rule also establishes tests for when loan originators can be compensated through certain profits-based compensation arrangements. The amendments to § 1026.36(h) and (i) are effective on June 1, 2013, while the other provisions of the rule became effective on January 10, 2014.
The final rules also implement the ability-to-repay and qualified mortgage (“QM”) provisions of the Truth in Lending Act, as amended by the Dodd-Frank Act (the “QM Rule”). The ability-to-repay provision requires creditors to make reasonable, good faith determinations that borrowers are able to repay their mortgages before extending the credit based on a number of factors and consideration of financial information about the borrower from reasonably reliable third-party documents. Under the Dodd-Frank Act and the QM Rule, loans meeting the definition of “qualified mortgage” are entitled to a presumption that the lender satisfied the
7
ability-to-repay requirements. The presumption is a conclusive presumption/safe harbor for prime loans meeting the QM requirements, and a rebuttable presumption for higher-priced/subprime loans meeting the QM requirements. The definition of a “qualified mortgage” incorporates the statutory requirements, such as not allowing negative amortization or terms longer than 30 years. The QM Rule also adds an explicit maximum 43 percent debt-to-income ratio for borrowers if the loan is to meet the QM definition, though some mortgages that meet GSE, FHA and VA underwriting guidelines may, for a period not to exceed seven years, meet the QM definition without being subject to the 43 percent debt-to-income limits.
The Dodd-Frank Act contains numerous other provisions affecting financial institutions of all types, many of which may have an impact on our operating environment in substantial and unpredictable ways. Consequently, the Dodd-Frank Act is likely to continue to increase our cost of doing business, it may limit or expand our permissible activities, and it may affect the competitive balance within our industry and market areas. The nature and extent of future legislative and regulatory changes affecting financial institutions, including as a result of the Dodd-Frank Act, remains very unpredictable at this time.
On July 6, 2012, President Obama signed into law the Biggert-Waters Flood Insurance Reform and Modernization Act of 2012, making substantial changes to the National Flood Insurance Program (“NFIP”). Effective immediately were the re-authorization of the NFIP through September 30, 2017, and an increase in per violation Civil Money Penalties (“CMP”) from $385 to $2,000 and the elimination of the $100,000 CMP cap. The effective dates on the remaining provisions are either delayed or are addressed in the Notice of Proposal Rulemaking dated October 11, 2013.
Volcker Rule
On December 10, 2013, the Banking Agencies along with the Commodity Futures Trading Commission (“CFTC”) and the Securities and Exchange Commission (“SEC”) issued final rules to implement the Volcker Rule contained in section 619 of the Dodd-Frank Act, generally to become effective on July 21, 2015. The Volcker Rule prohibits an insured depository institution and its affiliates (referred to as “banking entities”) from: (i) engaging in “proprietary trading” and (ii) investing in or sponsoring certain types of funds (“covered funds”) subject to certain limited exceptions. The rule also effectively prohibits short-term trading strategies by any U.S. banking entity if those strategies involve instruments other than those specifically permitted for trading and prohibits the use of some hedging strategies.
Regulation of the Bank
The Bank is subject to the supervision of, and to regular examination by, the OCC. Various laws and the regulations thereunder applicable to the Company and the Bank impose restrictions and requirements in many areas, including capital requirements, the maintenance of reserves, establishment of new offices, the making of loans and investments, consumer protection, employment practices, bank acquisitions and entry into new types of business. There are various legal limitations, including Sections 23A and 23B of the Federal Reserve Act, which govern the extent to which a bank subsidiary may finance or otherwise supply funds to its holding company or its holding company’s non-bank subsidiaries. Under federal law, no bank subsidiary may, subject to certain limited exceptions, make loans or extensions of credit to, or investments in the securities of, its parent or the non-bank subsidiaries of its parent (other than direct subsidiaries of such bank which are not financial subsidiaries) or take their securities as collateral for loans to any borrower. The Bank is also subject to collateral security requirements for any loans or extensions of credit permitted by such exceptions.
Dividend Limitations
The Company is a legal entity separate and distinct from its subsidiaries. The Company’s revenues (on a parent company only basis) result in substantial part from dividends paid by the Bank. The Bank’s dividend payments, without prior regulatory approval, are subject to regulatory limitations. Under the National Bank Act, dividends may be declared only if, after payment thereof, capital would be unimpaired and remaining surplus would equal 100 percent of capital. Moreover, a national bank may declare, in any one year, dividends only in an amount aggregating not more than the sum of its net profits for such year and its retained net profits for the preceding two years. In addition, the bank regulatory agencies have the authority to prohibit the Bank from paying dividends or otherwise supplying funds to the Company if the supervising agency determines that such payment would constitute an unsafe or unsound banking practice. Under applicable banking statutes, at December 31, 2014, the Bank could have declared additional dividends of approximately $22.0 million to the Company.
Capital Standards
The Federal Deposit Insurance Corporation Improvement Act of 1991 (“FDICIA”), defines specific capital categories based upon an institution’s capital ratios. The capital categories, in declining order, are: (i) “well capitalized”; (ii) “adequately capitalized”; (iii) “undercapitalized”; (iv) “significantly undercapitalized”; and (v) “critically undercapitalized”. Under FDICIA and the FDIC’s
8
prompt corrective action rules, the FDIC may take any one or more of the following actions against an undercapitalized bank: restrict dividends and management fees, restrict asset growth and prohibit new acquisitions, new branches or new lines of business without prior FDIC approval. If a bank is “significantly undercapitalized”, the FDIC may also require the bank to raise capital, restrict interest rates a bank may pay on deposits, require a reduction in assets, restrict any activities that might cause risk to the bank, require improved management, prohibit the acceptance of deposits from correspondent banks and restrict compensation to any senior executive officer. When a bank becomes “critically undercapitalized”, (i.e., the ratio of tangible equity to total assets is equal to or less than 2 percent), the FDIC must, within 90 days thereafter, appoint a receiver for the bank or take such action as the FDIC determines would better achieve the purposes of the law. Even where such other action is taken, the FDIC generally must appoint a receiver for a bank if the bank remains “critically undercapitalized” during the calendar quarter beginning 270 days after the date on which the bank became “critically undercapitalized”.
With respect to the Bank, the Basel Rules also revised the “prompt corrective action” regulations pursuant to Section 38 of the Federal Deposit Insurance Act, by (i) introducing a CET1 ratio requirement at each capital quality level (other than critically undercapitalized); (ii) increasing the minimum Tier 1 capital ratio requirement for each category; and (iii) requiring a leverage ratio of 5 percent to be well-capitalized. Effective as of January 1, 2015, the OCC’s regulations implementing these provisions of FDICIA provide that an institution will be classified as “well capitalized” if it (i) has a total risk-based capital ratio of at least 10.0 percent, (ii) has a Tier 1 risk-based capital ratio of at least 8.0 percent, (iii) has a CET1 ratio of at least 6.5 percent, (iv) has a Tier 1 leverage ratio of at least 5.0 percent, and (v) meets certain other requirements. An institution will be classified as “adequately capitalized” if it (i) has a total risk-based capital ratio of at least 8.0 percent, (ii) has a Tier 1 risk-based capital ratio of at least 6.0 percent, (iii) has a CET1 ratio of at least 4.5 percent, (iv) has a Tier 1 leverage ratio of at least 4.0 percent, and (v) does not meet the definition of “well capitalized.” An institution will be classified as “undercapitalized” if it (i) has a total risk-based capital ratio of less than 8.0 percent, (ii) has a Tier 1 risk-based capital ratio of less than 6.0 percent, (iii) has a CET1 ratio of less than 4.5 percent or (iv) has a Tier 1 leverage ratio of less than 4.0 percent. An institution will be classified as “significantly undercapitalized” if it (i) has a total risk-based capital ratio of less than 6.0 percent, (ii) has a Tier 1 risk-based capital ratio of less than 4.0 percent, (iii) has a CET1 ratio of less than 3.0 percent or (iv) has a Tier 1 leverage ratio of less than 3.0 percent. An institution will be classified as “critically undercapitalized” if it has a tangible equity to total assets ratio that is equal to or less than 2.0 percent. An insured depository institution may be deemed to be in a lower capitalization category if it receives an unsatisfactory examination rating. Similar categories apply to bank holding companies. When the capital conservation buffer is fully phased in, the capital ratios applicable to depository institutions under the Basel Rules will exceed the ratios to be considered well-capitalized under the prompt corrective action regulations.
The Bank’s capital ratios were all above the minimum levels required for it to be considered a “well capitalized” financial institution at December 31, 2014 under the “prompt corrective action” regulations in effect as of such date. We believe that, as of December 31, 2014, the Company and the Bank would meet all capital adequacy requirements under the Basel Rules on a fully phased-in basis if such requirements were currently effective including after giving effect to the deductions described above.
In addition, significant provisions of FDICIA required federal banking regulators to impose standards in a number of other important areas to assure bank safety and soundness, including internal controls, information systems and internal audit systems, credit underwriting, asset growth, compensation, loan documentation and interest rate exposure.
See Note 10 to the Consolidated Financial Statements.
Insurance of Deposit Accounts
The Bank’s deposits are insured up to applicable limits by the Deposit Insurance Fund (“DIF”) of the FDIC. The DIF is the successor to the Bank Insurance Fund and the Savings Association Insurance Fund, which were merged in 2006. Under the FDIC’s risk-based system, insured institutions are assigned to one of four risk categories based on supervisory evaluations, regulatory capital levels and certain other factors with less risky institutions paying lower assessments on their deposits.
In 2011, as required by the Dodd-Frank Act, the FDIC approved a final rule revising the assessment base to consist of average consolidated total assets during the assessment period minus the average tangible equity during the assessment period. In addition, the final rule eliminated the adjustment for secured borrowings and made certain other changes to the impact of unsecured borrowings and brokered deposits on an institution’s deposit insurance assessment. The final rule also revised the assessment rate schedule to provide initial base assessment rates ranging from 5 to 35 basis points and total base assessment rates ranging from 2.5 to 45 basis points after adjustment. The final rule became effective on April 1, 2011.
As previously noted above, the Dodd-Frank Act makes permanent the $250 thousand limit for federal deposit insurance.
9
The FDIC has authority to further increase insurance assessments. A significant increase in insurance premiums may have an adverse effect on the operating expenses and results of operations of the Bank. Management cannot predict what insurance assessment rates will be in the future.
Loans to Related Parties
The Bank’s authority to extend credit to its directors, executive officers and 10 percent stockholders, as well as to entities controlled by such persons, is currently governed by the requirements of the National Bank Act, Sarbanes-Oxley Act and Regulation O of the FRB thereunder. Among other things, these provisions require that extensions of credit to insiders (i) be made on terms that are substantially the same as, and follow credit underwriting procedures that are not less stringent than, those prevailing for comparable transactions with other persons not related to the lender and that do not involve more than the normal risk of repayment or present other unfavorable features and (ii) not exceed certain limitations on the amount of credit extended to such persons, individually and in the aggregate, which limits are based, in part, on the amount of the Bank’s capital. In addition, extensions of credit in excess of certain limits must be approved by the Bank’s Board of Directors. Under the Sarbanes-Oxley Act, the Company and its subsidiaries, other than the Bank, may not extend or arrange for any personal loans to its directors and executive officers.
Community Reinvestment Act and Fair Lending Developments
Under the Community Reinvestment Act (“CRA”), as implemented by the Federal Financial Institutions Examination Council (“FFIEC”), the Bank has a continuing and affirmative obligation consistent with its safe and sound operation to help meet the credit needs of our entire community, including low and moderate income neighborhoods. The CRA does not prescribe specific lending requirements or programs for financial institutions nor does it limit an institution’s discretion to develop the types of products and services that it believes are best suited to its particular community, consistent with the CRA. The CRA requires the regulatory agencies, in connection with its examination of a bank, to assess the institution’s record of meeting the credit needs of its community and to take such record into account in its evaluation of certain applications by such institution. FIRREA amended the CRA to require public disclosure of an institution’s CRA rating and require the regulatory agencies to provide a written evaluation of an institution’s CRA performance utilizing a four-tiered descriptive rating system. Institutions are evaluated and rated by the regulatory agencies as “Outstanding”, “Satisfactory”, “Needs to Improve” or “Substantial Noncompliance.” Failure to receive at least a “Satisfactory” rating may inhibit an institution from undertaking certain activities, including acquisitions of other financial institutions, which require regulatory approval based, in part, on CRA Compliance considerations. As of its last CRA examination in May 2013, the Bank received a rating of “Satisfactory”.
USA Patriot Act
The USA Patriot Act of 2001 enhances the powers of domestic law enforcement organizations and makes numerous other changes aimed at countering the international terrorist threat to the security of the United States. Title III of the legislation most directly affects the financial services industry. It is intended to enhance the federal government’s ability to fight money laundering by monitoring currency transactions and suspicious financial activities. The USA Patriot Act has significant implications for depository institutions and other businesses involved in the transfer of money. Under the USA Patriot Act, a financial institution must establish due diligence policies, procedures and controls reasonably designed to detect and report money laundering and terrorist financing. Financial institutions must follow regulations adopted by the Treasury Department to encourage financial institutions, their regulatory authorities, and law enforcement authorities to share information about individuals, entities, and organizations engaged in or suspected of engaging in terrorist acts or money laundering activities. Financial institutions must follow regulations adopted by the Treasury Department setting forth minimum standards regarding customer identification. These regulations require financial institutions to implement reasonable procedures for verifying the identity of any person seeking to open an account, maintain records of the information used to verify the person’s identity, and consult lists of known or suspected terrorists and terrorist organizations provided to the financial institution by government agencies. Every financial institution must establish anti-money laundering programs, including the development of internal policies and procedures, designation of a compliance officer, employee training, and an independent audit function. The passage of the USA Patriot Act has increased our compliance activities, but has not otherwise affected our operations.
Office of Foreign Assets Control Regulation
The United States has imposed economic sanctions that affect transactions with designated foreign countries, nationals and others. These are typically known as the “OFAC” rules based on their administration by the U.S. Treasury Department Office of Foreign Assets Control (“OFAC”). The OFAC-administered sanctions targeting countries take many different forms. Generally, however, they contain one or more of the following elements: (i) restrictions on trade with or investment in a sanctioned country, including prohibitions against direct or indirect imports from and exports to a sanctioned country and prohibitions on “U.S. persons” engaging in financial transactions relating to making investments in, or providing investment-related advice or assistance to, a
10
sanctioned country; and (ii) a blocking of assets in which the government or specially designated nationals of the sanctioned country have an interest, by prohibiting transfers of property subject to U.S. jurisdiction (including property in the possession or control of U.S. persons). Blocked assets (e.g. property and bank deposits) cannot be paid out, withdrawn, set off or transferred in any manner without a license from OFAC. Failure to comply with these sanctions could have serious legal and reputational consequences.
Sarbanes-Oxley Act of 2002
The Sarbanes-Oxley Act of 2002 (“Sarbanes-Oxley Act”) added new legal requirements for public companies affecting corporate governance, accounting and corporate reporting.
The Sarbanes-Oxley Act provides for, among other things:
● | a prohibition on personal loans made or arranged by the issuer to its directors and executive officers (except for loans made by a bank subject to Regulation O); |
● | independence requirements for audit committee members; |
● | independence requirements for company auditors; |
● | certification of financial statements within the Annual Report on Form 10-K and Quarterly Reports on Form 10-Q by the chief executive officer and the chief financial officer; |
● | the forfeiture by the chief executive officer and the chief financial officer of bonuses or other incentive-based compensation and profits from the sale of an issuer’s securities by such officers in the twelve month period following initial publication of any financial statements that later require restatement due to corporate misconduct; |
● | disclosure of off-balance sheet transactions; |
● | two-business day filing requirements for insiders filing on Form 4; |
● | disclosure of a code of ethics for financial officers and filing a Current Report on Form 8-K for a change in or waiver of such code; |
● | the reporting of securities violations “up the ladder” by both in-house and outside attorneys; |
● | restrictions on the use of non-generally accepted accounting principles (“non-GAAP”) financial measures in press releases and SEC filings; |
● | the formation of a public accounting oversight board; |
● | various increased criminal penalties for violations of securities laws; and |
● | an assertion by management with respect to the effectiveness of internal control over financial reporting. |
Governmental Monetary Policy
Our business and earnings depend in large part on differences in interest rates. One of the most significant factors affecting our earnings is the difference between (1) the interest rates paid by us on our deposits and other borrowings (liabilities) and (2) the interest rates received by us on loans made to our customers and securities held in our investment portfolios (assets). The value of and yield on our assets and the rates paid on our liabilities are sensitive to changes in prevailing market rates of interest. Therefore, our earnings and growth will be influenced by general economic conditions, the monetary and fiscal policies of the Federal government, including the Federal Reserve System, whose function is to regulate the national supply of bank credit in order to influence inflation and overall economic growth. Its policies are used in varying combinations to influence overall growth of bank loans, investments and deposits and may also affect interest rates charged on loans, earned on investments or paid for deposits.
In view of changing conditions in the national and local economies, we cannot predict possible future changes in interest rates, deposit levels, loan demand, or availability of investment securities and the resulting effect on our business or earnings.
Available Information
We make available free of charge on our website (http://www.hudsonvalleybank.com) our Annual Report on Form 10-K, quarterly reports on Form 10-Q, current reports on Form 8-K, and all amendments to those reports, as soon as reasonably practicable after such material is electronically filed with or furnished to the Securities and Exchange Commission. We provide electronic or paper copies of filings free of charge upon request.
11
Risks Related to Our Business
Our concentration of commercial real estate loans has resulted in increased scrutiny by the OCC, and we may be subject to future regulatory action and loss of business opportunity as a result.
As part of a routine safety and soundness exam conducted by the OCC during the fourth quarter of 2011, we were made aware that we would be required to reduce our concentrations in commercial real estate (“CRE”) and classified loans relative to tier 1 capital plus the allowance for loan and lease losses. In response, we sold approximately $474 million in loans at the end of the first quarter of 2012, of which $27.8 million were nonperforming, and another $25.5 million were performing classified loans, a significant step toward reducing the Bank’s concentrations of CRE loans and classified assets to less than 400 percent and 25 percent of tier 1 capital plus the allowance for loan and lease losses, respectively. At December 31, 2014, the Bank’s concentration of CRE loans and classified loans was 333.3 percent and 16.5 percent, respectively, of tier 1 capital plus the allowance for loan and lease losses.
We can provide no assurances that we will not become subject to some form of administrative action in the future. These limitations and any future administrative actions may restrict our business opportunities and adversely affect our operating results. In addition, further deterioration in our loan portfolio, including further declines in the market values of real estate supporting certain CRE loans, would result in further provisions for loan losses in future periods, which would have a material adverse affect on our business and results of operations.
Further additions to our nonperforming loans may occur and adversely affect our results of operations and financial condition.
At December 31, 2014 and 2013, our non-accrual loans totaled $22.4 million and $23.5 million, or 1.2% and 1.4% of the loan portfolio, respectively. At December 31, 2014 and 2013, our nonperforming assets (which include non-accrual loans, accruing loans 90 days or more past due, nonperforming loans held for sale and foreclosed real estate, also called other real estate owned) totaled $22.4 million and $23.5 million, or 0.7% and 0.8% of total assets, respectively. In addition, we had $7.9 million and $4.6 million of accruing loans that were 31-89 days delinquent at December 31, 2014 and 2013, respectively.
Despite improvements in overall economic and market conditions, we expect to continue to incur additional losses relating to nonperforming loans. Our nonperforming assets adversely affect our net income in various ways. First, we do not record interest income on non-accrual loans or other real estate owned, thereby adversely affecting our income and increasing our loan administration costs. Second, when we take collateral in foreclosures and similar proceedings, we are required to mark the related loan to the then fair market value of the collateral, which may result in a loss. Third, these loans and other real estate owned also increase our risk profile and the capital our regulators believe is appropriate in light of such risks. Adverse changes in the value of our problem assets, or the underlying collateral, or in these borrowers’ performance or financial conditions, whether or not due to economic and market conditions beyond our control, could adversely affect our business, results of operations and financial condition. In addition, the resolution of nonperforming assets requires significant commitments of time from management and our directors, which can be detrimental to the performance of their other responsibilities. There can be no assurance that we will not experience further additions to nonperforming loans in the future, or that our nonperforming assets will not result in further losses in the future.
As regulated entities, the Company and the Bank are subject to extensive supervision and regulation, including maintaining certain capital requirements, which may limit their operations and potential growth. Failure to meet any such requirements would subject us to regulatory action.
The Company is supervised by the FRB and the Bank is supervised by the OCC. As such, each is subject to extensive supervision and prudential regulation, including risk-based and leverage capital requirements. The Company and the Bank must maintain certain risk-based and leverage capital ratios as required by the FRB or the OCC, respectively that may change depending upon general economic conditions and the particular condition, risk profile and growth plans of the Company and the Bank.
In today’s economic and regulatory environment, banking regulators, including the OCC, continue to direct greater scrutiny to banks with higher levels of commercial real estate loans like us. As a general matter, such banks, including the Bank, are expected to maintain higher capital levels as well as other measures due to commercial real estate lending growth and exposures. If we do not maintain these higher capital levels, we may be subject to enforcement actions. More generally, compliance with capital requirements may limit loan growth or other operations that require the use of capital and could adversely affect our ability to expand or maintain present business levels.
If we fail to meet any regulatory capital requirement or are otherwise deemed to be operating in an unsafe and unsound manner or in violation of law, we may be subject to a variety of informal or formal remedial measures and enforcement actions. Such informal remedial measures and enforcement actions may include a memorandum of understanding which is initiated by the regulator and
12
outlines an institution’s agreement to take specified actions within specified time periods to correct violations of law or unsafe and unsound practices. In addition, as part of our regular examination process, regulators may advise us to operate under various restrictions as a prudential matter. Any of these restrictions, in whatever manner imposed, could have a material adverse effect on our business and results of operations.
In addition to informal remedial actions, we may also be subject to formal enforcement actions. Failure to comply with an informal enforcement action could cause us to be subject to formal enforcement actions. Formal enforcement actions include written agreements, cease and desist orders, the imposition of substantial fines and other civil penalties and, in the most severe cases, the termination of deposit insurance or the appointment of a conservator or receiver for our bank subsidiary. Furthermore, if the Bank fails to meet any regulatory capital requirement, it will be subject to the prompt corrective action framework of the FDICIA, which imposes progressively more restrictive constraints on operations, management and capital distributions as the capital category of an institution declines, up to and including, ultimately, the appointment of a conservator or receiver. A failure to meet regulatory capital requirements could also subject us to capital raising requirements. Additional capital raisings would be dilutive to holders of our common stock. See “Risk Factors — Risks Relating to Our Common Stock” for more information.
Any remedial measure or enforcement action, whether formal or informal, could impose restrictions on our ability to operate our business and adversely affect our prospects, financial condition or results of operations. In addition, any formal enforcement action could harm our reputation and our ability to retain and attract customers and impact the trading price of our common stock.
Increases to the allowance for loan losses may cause our earnings to decrease.
In determining our loan loss reserves for each quarter, we make various assumptions and judgments about the future performance of our loan portfolio, including the creditworthiness of our borrowers and the value of the real estate and other assets serving as collateral for the repayment of loans. In determining the amount of the allowance for loan losses, we rely on loan quality reviews, past experience, and an evaluation of economic conditions, among other factors. If our assumptions prove to be incorrect, our allowance for credit losses may not be sufficient to cover probable incurred losses in our loan portfolio, resulting in additions to the allowance and a corresponding decrease in income. In addition, bank regulators periodically review our allowance for loan losses and may require us to increase our provision for loan losses or loan charge-offs. Any increase in our allowance for loan losses or loan charge-offs as required by these regulatory authorities or otherwise could have a material adverse effect on our results of operations or financial condition.
Declines in value may adversely impact the carrying amount of our investment portfolio and result in other-than-temporary impairment charges.
Numerous factors, including lack of liquidity for sales of certain investment securities, absence of reliable pricing information for investment securities, adverse changes in business climate or adverse actions by regulators could have a negative impact on the valuation of our investment portfolio in future periods. If an impairment charge is significant enough, it could affect the ability of the Bank to upstream dividends to us, which could have a material adverse effect on our liquidity and our ability to pay dividends to stockholders, and could also negatively impact our regulatory capital ratios and result in us not being classified as “well capitalized” for regulatory purposes.
A prolonged or worsened downturn in the economy in general and the real estate market in our key market areas in particular would adversely affect our loan portfolio and our growth potential.
Our primary lending market area is Westchester County, New York and New York City and to an increasing extent, Rockland County, New York, with a primary focus on businesses, professionals and not-for-profit organizations located in this area. Accordingly, the asset quality of our loan portfolio largely depends upon the area’s economy and real estate markets. The Bank’s primary lending market area and asset quality have been adversely affected by continued weakness in the economy. A prolonged or worsened downturn in the economy in our primary lending area would adversely affect our asset quality, operations and limit our future growth potential.
In particular, a downturn in our local real estate market could negatively affect our business because a significant portion (approximately 75% as of December 31, 2014) of our loans are secured, either on a primary or secondary basis, by real estate. Our ability to recover on defaulted loans by selling the real estate collateral would then be diminished and we would be more likely to suffer losses on defaulted loans. The Bank’s loans have already been adversely affected by the current decline in the real estate market. Continuation or worsening of such conditions could have additional negative effects on our business in the future.
13
Difficult market conditions have adversely affected our industry.
Prior to 2014, declines in the real estate markets negatively impacted the credit performance of real estate related loans and resulted in significant write-downs of asset values by financial institutions. These write-downs caused many financial institutions to seek additional capital, to reduce or eliminate dividends, to merge with larger and stronger institutions and, in some cases, to fail. Reflecting concern about the stability of the financial markets generally and the strength of counterparties, many lenders and institutional investors have reduced or ceased providing funding to borrowers, including to other financial institutions. This market turmoil and tightening of credit have led to an increased level of commercial and consumer delinquencies, lack of consumer confidence, increased market volatility and widespread reduction of business activity generally.
As a result of the foregoing, there is a potential for new laws and regulations regarding lending and funding practices and liquidity and capital standards, and financial institution regulatory agencies are now expected to be very aggressive in responding to concerns and trends identified in examinations, including the more frequent issuance of informal remedial measures and formal enforcement orders. These negative developments in the financial services industry and the impact of new legislation in response to those developments could negatively impact our operations by restricting our business operations, including our ability to originate loans and work with borrowers to collect loans, and adversely impact our financial performance.
Higher FDIC deposit insurance premiums and assessments could adversely affect our financial condition.
As a result of the financial crisis which began in 2008, the Deposit Insurance Fund (“DIF”) was significantly depleted. As a result, the FDIC increased the required deposit insurance premiums and instituted special assessments. The insurance premiums have remained at the elevated levels although no special assessments have been levied since 2009. Continuation of the elevated insurance levels may adversely affect our financial condition.
Certain of our goodwill and intangible assets may become impaired in the future.
We test our goodwill and intangible assets for impairment on a periodic basis. It is possible that future impairment testing could result in a value of our goodwill and intangibles which may be less than the carrying value and, as a result, may adversely affect our financial condition and results of operations. If we determine that impairment exists at a given time, our earnings and the book value of the related goodwill and intangibles will be reduced by the amount of the impairment. During 2014, the Company recorded an impairment charge totaling $1.2 million on the remaining goodwill in connection with the sale of ARS. At December 31, 2014, the Company’s goodwill totaled $4.0 million which is subject to annual review. A goodwill impairment analysis performed in the fourth quarter of 2013 indicated pretax impairment of $18.7 million primarily driven by the loss of clients and a reduction in the projected earnings capacity of the Company’s asset management subsidiary. The impairment charge was recorded in net income in the fourth quarter of 2013.
Our income is sensitive to changes in interest rates.
Our profitability, like that of most banking institutions, depends to a large extent upon our net interest income. Net interest income is the difference between interest income received on interest-earning assets, including loans and securities, and the interest paid on interest-bearing liabilities, including deposits and borrowings. Accordingly, our results of operations and financial condition depend largely on movements in market interest rates and our ability to manage our assets and liabilities in response to such movements. Management estimates that, as of December 31, 2014, a 200 basis point increase in interest rates would result in a 1.1% increase in net interest income and a 100 basis point decrease would result in a 2.4% decrease in net interest income. See also “Management’s Discussion and Analysis of Financial Condition and Results of Operations” in Part 7 of this document.
In addition, changes in interest rates may result in an increase in higher cost deposit products within our existing portfolios, as well as a flow of funds away from bank accounts into direct investments (such as U.S. government and corporate securities and other investment instruments such as mutual funds) to the extent that we may not pay rates of interest competitive with these alternative investments. Our inability to re-deploy excess liquidity into higher yielding assets will continue to compress margins and earnings.
We may need to raise additional capital in the future and such capital may not be available when needed or at all.
If the Merger is not completed, we may need to raise additional capital in the future to provide us with sufficient capital resources and liquidity to meet our commitments and business needs. Our ability to raise additional capital, if needed, will depend on, among other things, conditions in the capital markets at that time, which are outside of our control, and our financial performance. We cannot assure you that such capital will be available to us on acceptable terms or at all. Our inability to raise sufficient additional capital on acceptable terms when needed could adversely affect our businesses, financial condition and results of operations.
14
Our markets are intensely competitive, and our principal competitors are larger than us.
We face significant competition both in making loans and in attracting deposits. This competition is based on, among other things, interest rates and other credit and service charges, the quality of services rendered, the convenience of the banking facilities, the range and type of products offered and the relative lending limits in the case of loans to larger commercial borrowers. Our market area has a very high density of financial institutions, many of which are branches of institutions that are significantly larger than we are and have greater financial resources and higher lending limits than we do. Many of these institutions offer services that we do not or cannot provide. Nearly all such institutions compete with us to varying degrees.
Our competition for loans comes principally from commercial banks, savings banks, savings and loan associations, credit unions, mortgage banking companies, insurance companies and other financial service companies. Our most direct competition for deposits has historically come from commercial banks, savings banks, savings and loan associations, and money market funds and other securities funds offered by brokerage firms and other similar financial institutions. We face additional competition for deposits from non-depository competitors such as the mutual fund industry, securities and brokerage firms, and insurance companies. Competition may increase in the future as a result of recently proposed regulatory changes in the financial services industry.
If we cannot fully integrate new business lines and technologies, our operating expenses could increase without corresponding revenue being recognized.
We have introduced two new lending products, asset based and equipment financing, during 2014 and 2013. Personnel have been hired and systems purchased to start these business lines. If we are unable to achieve the required loan origination levels to offset these costs, our non-interest expenses could increase without revenue to offset these costs.
In addition, we have purchased new mobile banking platforms. If we are unable to integrate the platforms and generate the anticipated fees, our non-interest expense could increase without a corresponding increase to fee income.
Inflation can have an impact on the cost of our operations.
The consolidated financial statements and notes thereto incorporated by reference herein have been prepared in accordance with accounting principles generally accepted in the United States (“GAAP”), which requires the measurement of financial position and operating results in terms of historical dollar amounts or estimated fair value without considering the changes in the relative purchasing power of money over time due to inflation. The impact of inflation is reflected in the increased cost of our operations. Unlike industrial companies, nearly all of our assets and liabilities are monetary in nature. As a result, interest rates have a greater impact on our performance than do the effects of general levels of inflation. Interest rates do not necessarily move in the same direction or to the same extent as the price of goods and services.
Extensive regulation and supervision may have a negative impact on our ability to compete in a cost-effective manner and subject us to material compliance costs and penalties.
The Company, primarily through its principal subsidiary and certain non-bank subsidiaries, is subject to extensive federal and state regulation and supervision. Banking regulations are primarily intended to protect depositors’ funds, federal deposit insurance funds and the banking system as a whole. Such laws are not designed to protect the Company’s stockholders. These regulations affect the Company’s lending practices, capital structure, investment practices, dividend policy and growth, among other things. The Company is also subject to a number of federal laws, which, among other things, require it to lend to various sectors of the economy and population, and establish and maintain comprehensive programs relating to anti-money laundering and customer identification. Congress and federal regulatory agencies continually review banking laws, regulations and policies for possible changes. Failure to comply with laws, regulations or policies could result in sanctions by regulatory agencies, civil money penalties and/or reputation damage, which could have a material adverse effect on the Company’s business, financial condition and results of operations. The Company’s compliance with certain of these laws will be considered by banking regulators when reviewing bank merger and bank holding company acquisitions.
The Dodd-Frank Wall Street Reform and Consumer Protection Act may affect our business activities, financial position and profitability by increasing our regulatory compliance burden and associated costs, placing restrictions on certain products and services, and limiting our future capital raising strategies.
On July 21, 2010, the Dodd-Frank Wall Street Reform and Consumer Protection Act was signed into law by the President of the United States. The Dodd-Frank Act implements significant changes in financial regulation and will impact all financial institutions, including the Company and the Bank. Among the Dodd-Frank Act’s significant regulatory changes, was the creation of a new financial consumer protection agency, known as the CFPB, that is empowered to promulgate new consumer protection regulations and revise existing regulations in many areas of consumer protection. CFPB has exclusive authority to issue regulations, orders and
15
guidance to administer and implement the objectives of federal consumer protection laws. CFPB will also have the ability to participate, with the OCC, in our consumer compliance examinations. Moreover, the Dodd-Frank Act permits states to adopt stricter consumer protection laws and authorizes state attorney generals’ to enforce consumer protection rules issued by the CFPB. The Dodd-Frank Act also restricts the authority of the Comptroller of the Currency to preempt state consumer protection laws applicable to national banks, such as the Bank, and may affect the preemption of state laws as they affect subsidiaries and agents of national banks, changes the scope of federal deposit insurance coverage, and potentially increases the FDIC assessment payable by the Bank. We expect that the CFPB and certain other provisions in the Dodd-Frank Act will significantly increase our regulatory compliance burden and costs and may restrict the financial products and services we offer to our customers.
Because many of the Dodd-Frank Act’s provisions require regulatory rulemaking, we are uncertain as to the impact that some of the provisions of the Dodd-Frank Act will have on the Company and the Bank and cannot provide assurance that the Dodd-Frank Act will not adversely affect our financial condition and results of operations for other reasons.
Technological change may affect our ability to compete.
The banking industry continues to undergo rapid technological changes, with frequent introductions of new technology-driven products and services. In addition to improving customer services, the effective use of technology increases efficiency and enables financial institutions to reduce costs. Our future success will depend, in part, on our ability to address the needs of customers by using technology to provide products and services that will satisfy customer demands, as well as to create additional efficiencies in our operations. Many of our competitors have substantially greater resources to invest in technological improvements. There can be no assurance that we will be able to effectively implement new technology-driven products and services or be successful in marketing such products and services to the public.
In addition, because of the demand for technology-driven products, banks are increasingly contracting with outside vendors to provide data processing and core banking functions. The use of technology-related products, services, delivery channels and processes exposes a bank to various risks, particularly transaction, strategic, reputation and compliance risks. There can be no assurance that we will be able to successfully manage the risks associated with our increased dependency on technology.
The failure of our operating facilities or our computer systems or network, or the intentional disruption of our systems by malicious third parties, could disrupt our businesses and cause financial losses.
Our business is dependent on the technology services we provide to clients and our ability to process and monitor, on a daily basis, a large number of financial transactions. Our financial, accounting, data processing or other operating systems which facilitate these services may fail to operate properly or become disabled as a result of events that are wholly or partially beyond our control, such as a spike in transaction volume, cyber attack or other unforeseen catastrophic events, which may adversely affect our ability to process these transactions or provide services.
In addition, our operations rely on the secure processing, storage and transmission of confidential and other information on our computer systems and networks. Although we take protective measures to maintain the confidentiality, integrity and availability of our clients’ information, the nature of the threats continues to evolve. As a result, our computer systems, software and networks may be vulnerable to unauthorized access, loss or destruction of data (including confidential client information), account takeovers, unavailability of service, computer viruses or other malicious code, cyber attacks and other events that could have an adverse security impact. Despite the defensive measures we take to manage our internal technological and operational infrastructure, these threats may originate externally from third parties such as foreign governments, organized crime and other hackers, and outsourced or infrastructure-support providers and application developers, or may originate internally from within our organization. Given the increasingly high volume of our transactions, certain errors may be repeated or compounded before they can be discovered and rectified.
We also face the risk of operational disruption, failure, termination or capacity constraints of any of the third parties that facilitate our business activities, including exchanges, clearing agents, clearing houses or other financial intermediaries. Such parties could also be the source of an attack on, or breach of, our operational systems, data or infrastructure. In addition, as interconnectivity with our clients grows, we increasingly face the risk of operational failure with respect to our clients’ systems.
If one or more of these events occurs, it could potentially jeopardize the confidential, proprietary and other information processed and stored in, and transmitted through, our computer systems and networks, or otherwise cause interruptions or malfunctions in our, as well as our clients’ or other third parties’, operations, which could result in damage to our reputation, substantial costs, regulatory penalties and/or client dissatisfaction or loss. Potential costs of a cyber incident may include, but would not be limited to, remediation costs, increased protection costs, lost revenue from the unauthorized use of proprietary information or the loss of current and/or future customers, and litigation.
16
Our framework for managing risks and risk management procedures and practices may not be effective in identifying and mitigating every risk to the Company, thereby resulting in losses.
Our risk management framework seeks to mitigate risk and loss to the Company. The Company has established processes and procedures intended to identify, measure, monitor, report and analyze the types of risk to which the Company is subject. However, as with any risk management framework, there are inherent limitations to the Company’s risk management strategies because there may exist, or develop in the future, risks that the Company has not appropriately anticipated or identified. Any lapse in the Company’s risk management framework and governance structure or other inadequacies in the design or implementation of the Company’s risk management framework, governance, procedures or practices could, individually or in the aggregate, cause unexpected losses for the Company, materially and adversely affect the Company’s financial condition and results of operations, require significant resources to remediate any risk management deficiency, attract heightened regulatory scrutiny, expose the Company to regulatory investigations or legal proceedings, subject the Company to fines, penalties or judgments, harm the Company’s reputation, or otherwise cause a decline in investor confidence.
The inability to attract and retain key personnel could adversely impact our financial condition and results of operations.
To a large degree, our success depends on our ability to attract and retain key personnel whose expertise, knowledge of our markets, and years of industry experience would make them difficult to replace. Competition for skilled leaders in our industry can be intense, and we may not be able to hire or retain the people we would like to have working for us. In addition, as a result of the Merger, we may be subject to a greater risk of losing certain of our key personnel. The unexpected loss of services of one or more of our key personnel could have a material adverse impact on our business, given the specialized knowledge of such personnel and the difficulty of finding qualified replacements on a timely basis. To attract and retain personnel with the skills and knowledge to support our business, we offer a variety of benefits that may reduce our earnings.
If federal, state, or local tax authorities were to determine that we did not adequately provide for our taxes, our income tax expense could be increased, adversely affecting our earnings.
The amount of income taxes we are required to pay on our earnings is based on federal and state legislation and regulations. We provide for current and deferred taxes in our financial statements, based on our results of operations, business activity, legal structure, interpretation of tax statutes, assessment of risk of adjustment upon audit, and application of financial accounting standards. We may take tax return filing positions for which the final determination of tax is uncertain. Our net income and earnings per share may be reduced if a federal, state, or local authority assesses additional taxes that have not been provided for in our consolidated financial statements. There can be no assurance that we will achieve our anticipated effective tax rate either due to a change in tax law, a change in regulatory or judicial guidance, or an audit assessment that denies previously recognized tax benefits. One of our subsidiaries, Grassy Sprain Real Estate Holdings, Inc., qualifies as a real estate investment trust (“REIT”) under the laws of the State of New York. A qualified REIT is entitled to special tax treatment by the State of New York, which lowers the Company’s tax rate. If the State of New York changes the provisions of the tax code related to REITs, our tax rate could increase.
Changes in Accounting Policies or Accounting Standards can cause us to change the manner in which we report our financial results and condition in adverse ways and could subject us to additional costs and expenses.
The Company’s accounting policies are fundamental to understanding its financial results and condition. Some of these policies require use of estimates and assumptions that may affect the value of the Company’s assets or liabilities and financial results. The Company identified its accounting policies regarding the allowance for loan losses, security valuations, goodwill and other intangible assets, and income taxes to be critical because they require management to make difficult, subjective and complex judgments about matters that are inherently uncertain. Under each of these policies, it is possible that materially different amounts would be reported under different conditions, using different assumptions, or as new information becomes available.
From time to time the Financial Accounting Standards Board (“FASB”) and the SEC change their guidance governing the form and content of the Company’s external financial statements. In addition, accounting standard setters and those who interpret GAAP, such as the FASB, SEC, banking regulators and the Company’s outside independent registered accounting firm, may change or even reverse their previous interpretations or positions on how these standards should be applied. Changes in GAAP and changes in current interpretations are beyond the Company’s control, can be hard to predict and could materially impact how the Company reports its financial results and condition. In certain cases, the Company could be required to apply a new or revised guidance retroactively or apply existing guidance differently (also retroactively) which may result in the Company restating prior period financial statements for material amounts. Additionally, significant changes to GAAP may require costly technology changes, additional training and personnel, and other expenses that will negatively impact our results of operations.
17
We are subject to environmental liability risk associated with lending activities.
A significant portion of our loan portfolio is secured by real property. During the ordinary course of business, we may foreclose on and take title to properties securing certain loans. In doing so, there is a risk that hazardous or toxic substances could be found on these properties. If hazardous or toxic substances are found, we may be liable for remediation costs, as well as for personal injury and property damage. Environmental laws may require us to incur substantial expenses and may materially reduce the affected property’s value or limit our ability to use or sell the affected property. In addition, future laws or more stringent interpretations or enforcement policies with respect to existing laws may increase our exposure to environmental liability. Although we have policies and procedures to perform an environmental review prior to originating certain commercial real estate loans, as well as before initiating any foreclosure action on real property, these reviews may not be sufficient to detect all potential environmental hazards. The remediation costs and any other financial liabilities associated with an environmental hazard could have a material adverse effect on our financial condition and results of operations.
Risk Related to the Merger
Because the market price of Sterling common stock will fluctuate, Company shareholders cannot be certain of the market value of the Merger consideration they will receive.
Upon completion of the Merger, each share of Company common stock (except for specified shares of Company common stock owned by the Company or Sterling) will be converted into the right to receive 1.92 shares of Sterling common stock. The market value of the Merger consideration will vary from the closing price of Sterling common stock on the date Sterling and the Company announced the Merger, on the date that the joint proxy statement/prospectus was mailed to Company shareholders, on the date of the special meeting of Company shareholders and on the date the Merger is completed and thereafter. Any change in the market price of Sterling common stock prior to the completion of the Merger will affect the market value of the Merger consideration that Company shareholders will receive upon completion of the Merger, and there will be no adjustment to the Merger consideration for changes in the market price of either shares of Sterling common stock or shares of Company common stock. Stock price changes may result from a variety of factors that are beyond the control of Sterling and the Company, including, but not limited to, general market and economic conditions, changes in our respective businesses, operations and prospects and regulatory considerations. Therefore, at the time of the Company special meeting you will not know the precise market value of the consideration you will receive at the effective time of the Merger. You should obtain current market quotations for shares of Sterling common stock and for shares of Company common stock.
The market price of Sterling common stock after the Merger may be affected by factors different from those affecting the shares of the Company or Sterling currently.
Upon completion of the Merger, holders of Company common stock will become holders of Sterling common stock. Sterling’s business differs in important respects from that of the Company, and, accordingly, the results of operations of the combined company and the market price of Sterling common stock after the completion of the Merger may be affected by factors different from those currently affecting the independent results of operations of each of Sterling and the Company.
Regulatory approvals may not be received, may take longer than expected or may impose conditions that are not presently anticipated or that could have an adverse effect on the combined company following the Merger.
Before the Merger and the Bank merger may be completed, Sterling and the Company must obtain approvals from the FRB and the OCC. Other approvals, waivers or consents from regulators may also be required. In determining whether to grant these approvals the regulators consider a variety of factors, including the regulatory standing of each party. An adverse development in either party’s regulatory standing or such factors could result in an inability to obtain approval or delay their receipt. These regulators may impose conditions on the completion of the Merger or the Bank merger or require changes to the terms of the Merger or the Bank merger. Such conditions or changes could have the effect of delaying or preventing completion of the Merger or the Bank merger or imposing additional costs on or limiting the revenues of the combined company following the Merger and the Bank merger, any of which might have an adverse effect on the combined company following the Merger.
Combining the two companies may be more difficult, costly or time consuming than expected and the anticipated benefits and cost savings of the Merger may not be realized.
Sterling and the Company have operated and, until the completion of the Merger, will continue to operate, independently. The success of the Merger, including anticipated benefits and cost savings, will depend, in part, on Sterling’s ability to successfully combine and integrate the businesses of Sterling and the Company in a manner that permits growth opportunities and does not materially disrupt the existing customer relations nor result in decreased revenues due to loss of customers. It is possible that the integration process could result in the loss of key employees, the disruption of either company's ongoing businesses or inconsistencies in standards, controls, procedures and policies that adversely affect the combined company's ability to maintain relationships with clients, customers, depositors and employees or to achieve the anticipated benefits and cost savings of the Merger. The loss of key employees could adversely affect Sterling’s ability to successfully conduct its business, which could have an adverse effect on
18
Sterling’s financial results and the value of its common stock. If Sterling experiences difficulties with the integration process and attendant systems conversion, the anticipated benefits of the Merger may not be realized fully or at all, or may take longer to realize than expected. As with any merger of financial institutions, there also may be business disruptions that cause Sterling and/or the Company to lose customers or cause customers to remove their accounts from Sterling and/or the Company and move their business to competing financial institutions. Integration efforts between the two companies will also divert management attention and resources. In addition, though the integration and systems conversion of Sterling and legacy Sterling Bancorp following the completion of the Provident New York Bancorp merger on October 31, 2013 is nearly complete, it remains a top priority and continues to utilize human and capital resources. The risk of a diversion of Sterling’s management’s attention away from ongoing business concerns may be increased by two merger integration processes which are relatively close in time. These integration matters could have an adverse effect on each of the Company and Sterling during this transition period and for an undetermined period after completion of the Merger on the combined company. In addition, the actual cost savings of the Merger could be less than anticipated.
The unaudited pro forma condensed combined financial statements included in the registration statement filed with the SEC in connection with the Merger are preliminary and the actual financial condition and results of operations after the Merger may differ materially.
The unaudited pro forma condensed combined financial statements in the registration statement filed with the SEC in connection with the Merger are presented for illustrative purposes only and are not necessarily indicative of what the combined company’s actual financial condition or results of operations would have been had the Merger been completed on the dates indicated. The unaudited pro forma condensed combined financial statements reflect adjustments to illustrate the effect of the Merger had it been completed on the dates indicated, which are based upon preliminary estimates, to record the Company’s identifiable assets acquired and liabilities assumed at fair value and the resulting goodwill recognized. The purchase price allocation for the Merger reflected in such registration statement is preliminary, and final allocation of the purchase price will be based upon the actual purchase price and the fair value of the assets and liabilities of the Company as of the date of the completion of the Merger. Accordingly, the final acquisition accounting adjustments may differ materially from the pro forma adjustments reflected in the registration statement.
Certain of our directors and executive officers have interests in the Merger that may differ from the interests of our shareholders.
Our shareholders should be aware that some of our directors and executive officers have interests in the Merger and have arrangements that are different from, or in addition to, those of our shareholders generally. Our board of directors was aware of these interests and considered these interests, among other matters, when making its decision to approve the Merger Agreement, and in recommending that our shareholders vote in favor of adopting the merger agreement.
The material interests considered by our board of directors were as follows:
● | The terms of the restricted stock, restricted stock unit and stock option awards held by Company directors and executive officers provide for accelerated vesting of the awards upon a change in control such as the Merger. |
● | Subject to the terms of the Merger Agreement, we have, in consultation with Sterling, accelerated the payment of certain compensatory amounts so that they were paid in 2014 for tax planning purposes with respect to Sections 280G and 4999 of the Code. Such amounts included the acceleration of the vesting date of the Company restricted stock, restricted stock units and 2014 bonuses under our Annual Incentive Plan and the Long Term Incentive Plan. |
● | We previously entered into change of control agreements on April 10, 2014 and July 7, 2014 with a number of our executive officers, which entitle each of them to certain payments and benefits upon a qualifying termination in connection with a change in control such as the Merger. |
● | We previously entered into a consulting agreement, dated October 6, 2014, with our retiring executive chairman, which entitles him to terminate the consulting agreement and receive certain payments and benefits in connection with a change in control such as the Merger. |
● | In connection with the execution of the Merger Agreement, our president and chief executive officer entered into a one-year consulting agreement, dated as of November 4, 2014, with Sterling National Bank, which entitles him to the receipt of consulting fees for providing services in connection with the integration of Sterling and the Company. |
● | Our supplemental deferred compensation agreement dated as of October 1, 2010, and our supplemental retirement plans each provide for accelerated vesting of retirement benefits in connection with a change in control such as the Merger. |
● | Four current Company directors will join the board of Sterling and Sterling National Bank upon completion of the Merger, and Sterling will also establish an advisory board consisting of Company directors who are not joining the boards of Sterling and Sterling National Bank and who wish to serve on the advisory board. Members of the Sterling board are expected to receive compensation consistent with the compensation paid to current non-employee directors of Sterling. During 2014, such compensation included an annual retainer fee of $24,000 and per-meeting fees. Directors are also eligible to receive stock awards and stock option grants and are eligible to participate in Sterling’s Deferred Director Fee |
19
Plan. Members of the Sterling advisory board will be eligible to receive fees for their service on the advisory board that are substantially similar to the fees received by members of our Business Development Board as of the date of the Merger Agreement, which in 2014 totaled approximately $1,250 in value per person. As of the date of this Annual Report on Form 10-K, Sterling had not yet identified which of our current directors will join the boards of Sterling and Sterling National Bank upon completion of the Merger. |
Termination of the Merger Agreement could negatively impact the Company or Sterling.
If the Merger Agreement is terminated, there may be various consequences. For example, our or Sterling’s businesses may have been impacted adversely by the failure to pursue other beneficial opportunities due to the focus of management on the Merger, without realizing any of the anticipated benefits of completing the Merger. Additionally, if the Merger Agreement is terminated, the market price of our or Sterling’s common stock could decline to the extent that the current market prices reflect a market assumption that the Merger will be completed. If the Merger Agreement is terminated under certain circumstances, the Company or Sterling may be required to pay to the other party a termination fee of $20 million.
The Company and Sterling will be subject to business uncertainties and contractual restrictions while the Merger is pending.
Uncertainty about the effect of the Merger on employees and customers may have an adverse effect on the Company or Sterling. These uncertainties may impair our or Sterling’s ability to attract, retain and motivate key personnel until the Merger is completed, and could cause customers and others that deal with the Company or Sterling to seek to change existing business relationships with the Company or Sterling. Retention of certain employees by the Company or Sterling may be challenging while the Merger is pending, as certain employees may experience uncertainty about their future roles with the Company or Sterling. If key employees depart because of issues relating to the uncertainty and difficulty of integration or a desire not to remain with the Company or Sterling, our business or Sterling’s business could be harmed. In addition, subject to certain exceptions, the Company has agreed to operate its business in the ordinary course prior to closing, and each of the Company and Sterling has agreed to certain restrictive covenants.
If the Merger is not completed, Sterling and the Company will have incurred substantial expenses without realizing the expected benefits of the Merger.
Each of Sterling and the Company has incurred and will incur substantial expenses in connection with the negotiation and completion of the transactions contemplated by the Merger Agreement. If the Merger is not completed, Sterling and the Company would have to recognize these expenses without realizing the expected benefits of the Merger.
The Merger Agreement limits the Company’s ability to pursue acquisition proposals and requires either company to pay a termination fee of $20 million under limited circumstances, including circumstances relating to acquisition proposals for the Company. Additionally, certain provisions of our articles of incorporation and bylaws may deter potential acquirers.
The Merger Agreement prohibits the Company from initiating, soliciting, knowingly encouraging or knowingly facilitating certain third-party acquisition proposals. In addition, unless the Merger Agreement has been terminated in accordance with its terms, we have an unqualified obligation to submit the Merger proposal to a vote by the shareholders of the Company, even if the Company receives a proposal that the our board believes is superior to the Merger. The Merger Agreement also provides that Sterling or the Company must pay a termination fee in the amount of $20 million in the event that the Merger Agreement is terminated under certain circumstances, including involving our failure to abide by certain obligations not to solicit acquisition proposals. These provisions might discourage a potential competing acquirer that might have an interest in acquiring all or a significant part of the Company from considering or proposing such an acquisition. Each of the members of the Company’s board, solely in his or her capacity as a shareholder of the Company, and certain of their affiliates, has entered into voting agreements and have agreed to vote his or her shares of the Company’s common stock in favor of the Merger Agreement and certain related matters and against alternative transactions. The Company’s shareholders that are party to these voting agreements beneficially own and are entitled to vote in the aggregate approximately 24.9% of the outstanding shares of the Company’s common stock as of the record date. Additionally, certain provisions of our certificate of incorporation or bylaws or of the New York Business Corporation Law (“NYBCL”) could make it more difficult for a third-party to acquire control of the Company or may discourage a potential competing acquirer.
The shares of Sterling common stock to be received by Company shareholders as a result of the Merger will have different rights from the shares of Company common stock.
Upon completion of the Merger, Company shareholders will become Sterling stockholders and their rights as stockholders will be governed by the Delaware General Corporation Law and the Sterling certificate of incorporation and bylaws. The rights associated with Company common stock are different from the rights associated with Sterling common stock.
Holders of Company and Sterling common stock will have a reduced ownership and voting interest after the Merger and will exercise less influence over management.
Holders of Company and Sterling common stock currently have the right to vote in the election of the board of directors and on other matters affecting the Company and Sterling, respectively. Upon the completion of the Merger, each Company shareholder who receives shares of Sterling common stock will become a stockholder of Sterling with a percentage ownership of Sterling that is smaller
20
than the stockholder’s percentage ownership of the Company. It is currently expected that the former shareholders of the Company as a group will receive shares in the Merger constituting approximately 30% of the outstanding shares of Sterling common stock immediately after the Merger. As a result, current stockholders of Sterling as a group will own approximately 70% of the outstanding shares of Sterling common stock immediately after the Merger. Because of this, Company shareholders may have less influence on the management and policies of Sterling than they now have on the management and policies of the Company and current Sterling stockholders may have less influence than they now have on the management and policies of Sterling.
Company shareholders will not have dissenters' or appraisal rights in the Merger.
Dissenters’ rights are statutory rights that, if applicable under law, enable shareholders to dissent from an extraordinary transaction, such as a merger, and to demand that the corporation pay the fair value for their shares as determined by a court in a judicial proceeding instead of receiving the consideration offered to shareholders in connection with the extraordinary transaction. Under the NYBCL, a shareholder may not dissent from a merger as to shares that are listed on a national securities exchange at the record date fixed to determine the shareholders entitled to receive notice of the meeting of shareholders to vote upon the agreement of merger or consolidation.
Because the Company’s common stock is listed on the New York Stock Exchange, a national securities exchange, and is expected to continue to be so listed on the record date, and because the Merger otherwise satisfies the foregoing requirements of the NYBCL, holders of Company common stock will not be entitled to dissenters’ or appraisal rights in the Merger with respect to their shares of Company common stock.
Pending litigation against the Company and Sterling could result in an injunction preventing the completion of the Merger or a judgment resulting in the payment of damages.
The outcome of any such litigation is uncertain. If the cases are not resolved, these lawsuits could prevent or delay completion of the Merger and result in substantial costs to Sterling and the Company, including any costs associated with the indemnification of directors and officers. Plaintiffs may file additional lawsuits against Sterling, the Company and/or the directors and officers of either company in connection with the Merger. The defense or settlement of any lawsuit or claim that remains unresolved at the time the Merger is completed may adversely affect Sterling’s business, financial condition, results of operations and cash flows.
Risks Relating to Our Common Stock
Market conditions and other factors may affect the value of our common stock.
The trading price of the shares of our common stock will depend on many factors, which may change from time to time, including:
● | conditions in the credit, mortgage and housing markets, the markets for securities relating to mortgages or housing, and developments with respect to financial institutions generally; |
● | interest rates; |
● | the market for similar securities; |
● | government action or regulation; |
● | general economic conditions or conditions in the financial markets; |
● | our past and future dividend practice; |
● | our financial condition, performance, creditworthiness and prospects; and |
● | the stock price of Sterling Bancorp, our partner in the Merger. |
Accordingly, the shares of common stock that an investor purchases may trade at a price lower than that at which they were purchased.
21
There may be future dilution of our common stock.
The Company is currently authorized to issue up to 25 million shares of common stock, of which 20,082,568 shares were outstanding as of December 31, 2014, and up to 15 million shares of preferred stock, of which no shares are outstanding. The Company’s certificate of incorporation authorizes the Board of Directors to, among other things, issue additional shares of common or preferred stock, or securities convertible or exchangeable into common or preferred stock, without stockholder approval. We may issue such additional equity or convertible securities to raise additional capital in connection with acquisitions, as part of our employee and director compensation or otherwise. The issuance of any additional shares of common or preferred stock or convertible securities could substantially dilute holders of our common stock. Moreover, to the extent that we issue restricted stock, stock options, or warrants to purchase our common stock in the future and those stock options or warrants are exercised or the restricted stock vests, our stockholders may experience further dilution. Holders of our shares of common stock have no preemptive rights that entitle them to purchase their pro rata share of any offering of shares of any class or series and, therefore, such sales or offerings could result in increased dilution to our stockholders.
We may reduce or eliminate the cash dividend on our common stock.
We increased our total per share dividend in 2014 to $0.28 per share from a total per share dividend of $0.24 in 2013, compared to a total per share dividend of $0.72 in 2012. Holders of our common stock are only entitled to receive such cash dividends as our Board of Directors may declare out of funds legally available for such payments. Although we have historically declared cash dividends on our common stock, we are not required to do so and we may reduce or eliminate our common stock cash dividend in the future. This could adversely affect the market price of our common stock. Also, as a bank holding company, the Company’s ability to declare and pay dividends depends on certain federal regulatory considerations, including the guidelines of the FRB regarding capital adequacy and dividends.
Dividends from the Bank are the only current significant source of cash for the Company. There are various statutory and regulatory limitations regarding the extent to which the Bank can pay dividends or otherwise transfer funds to the Company. Federal bank regulatory agencies also have the authority to limit further the Bank’s payment of dividends based on such factors as the maintenance of adequate capital for the Bank, which could reduce the amount of dividends otherwise payable. Under applicable banking statutes, at December 31, 2014, the Bank could have declared additional dividends of approximately $22.0 million to the Company. No assurance can be given that the Bank will have the profitability necessary to permit the payment of dividends in the future; therefore, no assurance can be given that the Company would have any funds available to pay dividends to stockholders.
Federal bank regulators require us to maintain certain levels of regulatory capital. The failure to maintain these capital levels or to comply with applicable laws, regulations and supervisory agreements could subject us to a variety of informal and formal enforcement actions. Moreover, dividends can be restricted by any of our regulatory authorities if the agency believes that our financial condition warrants such a restriction.
The Company’s ability to declare and pay dividends is restricted under the New York Business Corporation Law, which provides that dividends may only be paid by a corporation out of its surplus.
The FRB issued a supervisory letter dated February 24, 2009 to bank holding companies that contains guidance on when the board of directors of a bank holding company should eliminate, defer or severely limit dividends including, for example, when net income available for stockholders for the past four quarters, net of dividends previously paid during that period, is not sufficient to fully fund the dividends. The letter also contains guidance on the redemption of stock by bank holding companies which urges bank holding companies to advise the FRB of any such redemption or repurchase of common stock for cash or other value which results in the net reduction of a bank holding company’s capital during the quarter. The Company did not redeem or repurchase any common stock in the years ended December 31, 2014, 2013 or 2012.
Our common stock price may fluctuate due to the potential sale of stock by our existing stockholders.
We are aware that several of our large stockholders may in the future liquidate some or all of their shares of Company common stock for estate planning and other reasons. In addition, other stockholders may sell their shares of common stock from time to time on the New York Stock Exchange or otherwise. As a result, substantial amounts of our common stock are eligible for future sale. While we cannot predict either the magnitude or the timing of such sales, if a large number of common shares are sold during a short time frame, it may have the effect of reducing the market price of our common stock.
22
Our earnings may be subject to increased volatility.
Our earnings may experience volatility as a result of several factors. These factors include, among others:
● | interest rate risk and margin compression; |
● | regulatory action against the Bank; |
● | a continuation of the poor economic conditions, or further adverse economic developments; |
● | instability in the financial markets; |
● | our inability to generate or maintain creditworthy customer relationships in our primary markets; |
● | unexpected increases in operating costs, including special assessments for FDIC insurance; |
● | further credit deterioration in our loan portfolio or unanticipated credit deterioration, or defaults by our loan customers; |
● | credit deterioration or defaults by issuers of securities within our investment portfolio; or |
● | increased costs relating to the Merger, including payment of the termination fee. |
If any one or more of these events occur, we may experience significant declines in our net interest margin and non-interest income, or we may be required to record substantial charges to our earnings, including increases in the provision for loan losses, credit-related impairment on securities (both permanent and other-than-temporary), and impairment on goodwill and other intangible assets, in future periods.
Our certificate of incorporation, the New York Business Corporation Law and federal banking laws and regulations may prevent a takeover of our company.
If the Merger is not completed, provisions of the Company’s certificate of incorporation, the New York Business Corporation Law and federal banking laws and regulations, including regulatory approval requirements, could make it more difficult for another third party to acquire us, even if doing so would be perceived to be beneficial to our stockholders. The combination of these provisions may inhibit a non-negotiated merger or other business combination, which, in turn, could adversely affect the market price of our common stock.
ITEM 1B — UNRESOLVED STAFF COMMENTS
None
Our principal executive offices, including administrative and operating departments, and HVB’s main branch, are located at 21 Scarsdale Road, Yonkers, New York, in premises we own.
HVB operates 28 branches. HVB owns the following branch locations:
Address |
| City |
| County |
| State |
37 East Main Street |
| Elmsford |
| Westchester |
| New York |
61 South Broadway |
| Yonkers |
| Westchester |
| New York |
150 Lake Avenue |
| Yonkers |
| Westchester |
| New York |
865 McLean Avenue |
| Yonkers |
| Westchester |
| New York |
21 Scarsdale Road |
| Yonkers |
| Westchester |
| New York |
664 Main Street |
| Mount Kisco |
| Westchester |
| New York |
HVB leases the following branch locations:
Address |
| City |
| County |
| State |
35 East Grassy Sprain Road |
| Yonkers |
| Westchester |
| New York |
403 East Sandford Boulevard |
| Mount Vernon |
| Westchester |
| New York |
1835 East Main Street |
| Peekskill |
| Westchester |
| New York |
500 Westchester Avenue |
| Port Chester |
| Westchester |
| New York |
501 Marble Avenue |
| Pleasantville |
| Westchester |
| New York |
23
328 Central Avenue |
| White Plains |
| Westchester |
| New York |
5 Huguenot Street |
| New Rochelle |
| Westchester |
| New York |
40 Church Street |
| White Plains |
| Westchester |
| New York |
875 Mamaroneck Avenue |
| Mamaroneck |
| Westchester |
| New York |
399 Knollwood Road |
| White Plains |
| Westchester |
| New York |
111 Brook Street |
| Eastchester |
| Westchester |
| New York |
3130 East Tremont Avenue |
| Bronx |
| Bronx |
| New York |
975 Allerton Avenue |
| Bronx |
| Bronx |
| New York |
369 East 149th Street |
| Bronx |
| Bronx |
| New York |
1250 Waters Place |
| Bronx |
| Bronx |
| New York |
16 Court Street |
| Brooklyn |
| Kings |
| New York |
60 East 42nd Street |
| Manhattan |
| New York |
| New York |
233 Broadway |
| Manhattan |
| New York |
| New York |
350 Park Avenue |
| Manhattan |
| New York |
| New York |
112 West 34th Street |
| Manhattan |
| New York |
| New York |
254 South Main Street |
| New City |
| Rockland |
| New York |
4 Executive Boulevard |
| Suffern |
| Rockland |
| New York |
Of the above leased properties, 4 properties have lease terms that expire within the next 2 years. We currently expect to renew the leases of each of these properties.
HVB Capital Credit LLC is located at 489 Fifth Avenue, New York, New York in leased premises.
HVB Equipment Capital LLC is located at 489 Fifth Avenue, New York, New York in leased premises.
We currently operate 23 ATM machines, 20 of which are located in the Banks’ facilities. Three ATMs are located at off-site locations in New York: St. Joseph’s Hospital, Yonkers, College of Mount Saint Vincent, Riverdale, and Concordia College, Bronxville.
In our opinion, the premises, fixtures and equipment are adequate and suitable for the conduct of our business. All facilities are well maintained and provide adequate parking.
On November 25, 2014, an action captioned Graner v. Hudson Valley Holding Corp., et al., Index No. 70348/2014 (Sup. Ct., Westchester Cnty.), was filed on behalf of a putative class of Hudson Valley shareholders against Hudson Valley, its current directors, and Sterling. On January 7, 2015, plaintiff filed an amended complaint. As amended, the complaint alleges that the Hudson Valley board breached its fiduciary duties by agreeing to the Merger and certain terms of the Merger Agreement and by failing to disclose all material information concerning the Merger to shareholders. The complaint further alleges that Sterling aided and abetted those alleged fiduciary breaches. The action seeks, among other things, an order enjoining the operation of certain provisions of the Merger Agreement, enjoining any shareholder vote on the Merger, as well as other equitable relief and/or money damages in the event that the Merger is consummated. The defendants believe that the claims are without merit.
Various claims and lawsuits are pending against the Company and its subsidiaries in the ordinary course of business. In the opinion of management, resolution of each of these other matters is not expected to have a material effect on the financial condition or results of operations of the Company and its subsidiaries.
ITEM 4 — MINE SAFETY DISCLOSURE
Not applicable
24
PART II
ITEM 5 — MARKET FOR REGISTRANT’S COMMON EQUITY, RELATED STOCKHOLDER MATTERS AND ISSUER PURCHASES OF EQUITY SECURITIES
Our common stock was held of record as of March 3, 2015 by approximately 602 registered stockholders. Our common stock trades on the New York Stock Exchange under the symbol “HVB”.
The table below sets forth the closing price range of our common stock for each quarter indicated and the cash dividends per common share for each quarter. The amounts shown in the table below have been adjusted to reflect all dividends and stock splits.
|
| 2014 |
| |||||||||
|
| High |
|
| Low |
|
| Dividend |
| |||
|
|
|
|
|
|
|
|
|
|
|
|
|
First Quarter |
| $ | 19.44 |
|
| $ | 16.52 |
|
| $ | 0.06 |
|
Second Quarter |
|
| 19.09 |
|
|
| 16.82 |
|
|
| 0.06 |
|
Third Quarter |
|
| 18.23 |
|
|
| 16.71 |
|
|
| 0.08 |
|
Fourth Quarter |
|
| 27.31 |
|
|
| 18.04 |
|
|
| 0.08 |
|
|
|
|
|
|
|
|
|
|
|
|
|
|
|
| 2013 |
| |||||||||
|
| High |
|
| Low |
|
| Dividend |
| |||
|
|
|
|
|
|
|
|
|
|
|
|
|
First Quarter |
| $ | 16.06 |
|
| $ | 14.31 |
|
| $ | 0.06 |
|
Second Quarter |
|
| 18.69 |
|
|
| 14.01 |
|
|
| 0.06 |
|
Third Quarter |
|
| 21.03 |
|
|
| 17.42 |
|
|
| 0.06 |
|
Fourth Quarter |
|
| 21.09 |
|
|
| 17.99 |
|
|
| 0.06 |
|
In 1998, the Board of Directors of the Company adopted a policy of paying quarterly cash dividends to holders of its common stock. For information regarding the amount of past dividends, see “We may reduce or eliminate the cash dividend on our common stock” under Item 1A.
Any funds which the Company may require in the future to pay cash dividends, as well as various Company expenses, are expected to be obtained by the Company chiefly in the form of cash dividends from HVB and secondarily from sales of common stock pursuant to the Company’s stock option plan. The ability of the Company to declare and pay dividends in the future will depend not only upon its future earnings and financial condition, but also upon the future earnings and financial condition of the Bank and its ability to transfer funds to the Company in the form of cash dividends and otherwise. See further discussion in “Supervision and Regulation” under Item 1 of this Annual Report on Form 10-K. The Company is a separate and distinct legal entity from HVB. The Company’s right to participate in any distribution of the assets or earnings of HVB is subordinate to prior claims of creditors of HVB.
There were no purchases made by the Company of its common stock during the year ended December 31, 2014.
The following table sets forth information regarding the Company’s Stock Option Plans as of December 31, 2014:
|
|
|
|
|
|
|
|
|
| Number of Shares |
| |
|
| Number of Shares |
|
|
|
|
|
| Remaining Available |
| ||
|
| to be Issued |
|
| Weighted-Average |
|
| for Future Issuance |
| |||
|
| Upon Exercise of |
|
| Exercise Price of |
|
| Under Equity |
| |||
Plan Category |
| Outstanding Options |
|
| Outstanding Options |
|
| Compensation Plans |
| |||
Equity compensation plans approved by stockholders |
|
| 88,466 |
|
| $ | 25.14 |
|
|
| 952,061 |
|
Equity compensation plans not approved by stockholders |
|
| — |
|
|
| — |
|
|
| — |
|
All equity compensation plans have been approved by the Company’s stockholders. Additional details related to the Company’s equity compensation plans are provided in Note 11 to the Company’s consolidated financial statements presented in this Form 10-K.
25
Stockholder Return
The following compares the Company’s total stockholder return on a hypothetical $100 investment on December 31, 2009 and for the years 2010 through 2014, with the Russell 2000 and the SNL $1 billion to $5 billion Bank indexes.
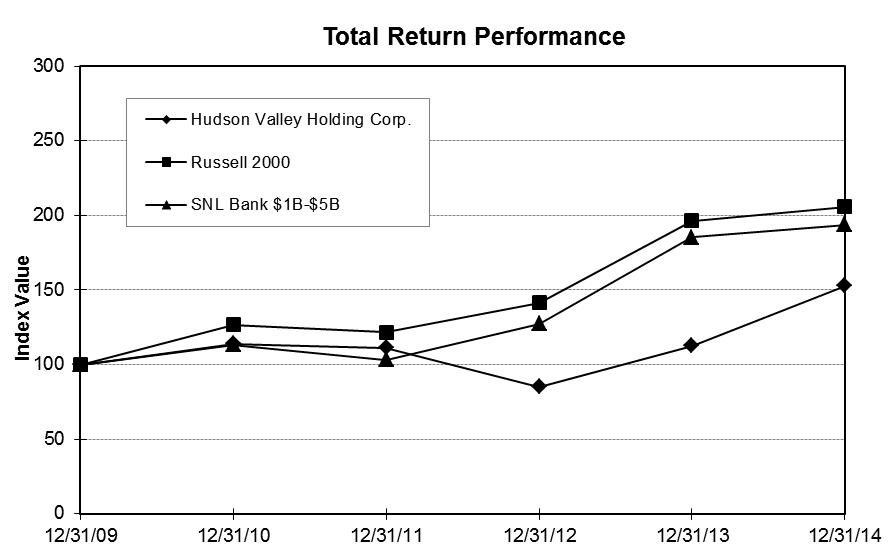
| Period Ending |
| ||||||||||||||||
Index | 12/31/09 |
| 12/31/10 |
| 12/31/11 |
| 12/31/12 |
| 12/31/13 |
| 12/31/14 |
| ||||||
Hudson Valley Holding Corp. | $ | 100.00 |
| $ | 113.99 |
| $ | 111.14 |
| $ | 85.08 |
| $ | 112.77 |
| $ | 152.74 |
|
Russell 2000 |
| 100.00 |
|
| 126.86 |
|
| 121.56 |
|
| 141.43 |
|
| 196.34 |
|
| 205.95 |
|
SNL Bank $1B-$5B |
| 100.00 |
|
| 113.35 |
|
| 103.38 |
|
| 127.47 |
|
| 185.36 |
|
| 193.81 |
|
The graph assumes all dividends were reinvested. Returns are market capitalization weighted.
26
ITEM 6 — SELECTED FINANCIAL DATA
The following table sets forth selected historical consolidated financial data for the years ended and at the dates indicated. The selected historical consolidated financial data as of December 31, 2014 and 2013, and for the years ended December 31, 2014, 2013 and 2012, are derived from our consolidated financial statements included elsewhere in this Annual Report on Form 10-K. The selected historical consolidated financial data as of December 31, 2012, 2011 and 2010 and for the years ended December 31, 2011 and 2010 are derived from our consolidated financial statements that are not included in this Annual Report on Form 10-K. Share and per share data have been restated to reflect the effects of 10 percent stock dividends issued in 2011 and 2010. The information set forth below should be read in conjunction with the consolidated financial statements and “Management’s Discussion and Analysis of Financial Condition and Results of Operations” appearing elsewhere in this Annual Report on Form 10-K.
|
| Years Ended December 31, |
| |||||||||||||||||
|
| 2014 |
|
| 2013 |
|
| 2012 |
|
| 2011 |
|
| 2010 |
| |||||
|
| (Dollars in thousands, except per share data) |
| |||||||||||||||||
Operating Results: |
|
|
|
|
|
|
|
|
|
|
|
|
|
|
|
|
|
|
|
|
Total interest income |
| $ | 97,091 |
|
| $ | 89,583 |
|
| $ | 110,052 |
|
| $ | 128,617 |
|
| $ | 128,339 |
|
Total interest expense |
|
| 4,763 |
|
|
| 5,646 |
|
|
| 6,723 |
|
|
| 10,758 |
|
|
| 17,683 |
|
Net interest income |
|
| 92,328 |
|
|
| 83,937 |
|
|
| 103,329 |
|
|
| 117,859 |
|
|
| 110,656 |
|
Provision for loan losses |
|
| 1,792 |
|
|
| 2,476 |
|
|
| 8,507 |
|
|
| 64,154 |
|
|
| 46,527 |
|
Income (loss) before income taxes |
|
| 11,924 |
|
|
| (3,496 | ) |
|
| 46,126 |
|
|
| (7,550 | ) |
|
| 3,708 |
|
Net income (loss) |
|
| 7,942 |
|
|
| 1,130 |
|
|
| 29,181 |
|
|
| (2,137 | ) |
|
| 5,113 |
|
Basic earnings (loss) per common share |
|
| 0.40 |
|
|
| 0.06 |
|
|
| 1.49 |
|
|
| (0.11 | ) |
|
| 0.26 |
|
Diluted earnings (loss) per common share |
|
| 0.40 |
|
|
| 0.06 |
|
|
| 1.49 |
|
|
| (0.11 | ) |
|
| 0.26 |
|
Weighted average shares outstanding |
|
| 19,721,575 |
|
|
| 19,597,431 |
|
|
| 19,538,294 |
|
|
| 19,462,055 |
|
|
| 19,393,895 |
|
Diluted weighted average shares outstanding |
|
| 19,770,051 |
|
|
| 19,597,713 |
|
|
| 19,545,037 |
|
|
| 19,462,055 |
|
|
| 19,455,971 |
|
Cash dividend per common share |
| $ | 0.28 |
|
| $ | 0.24 |
|
| $ | 0.72 |
|
| $ | 0.64 |
|
| $ | 0.59 |
|
|
|
|
|
|
|
|
|
|
|
|
|
|
|
|
|
|
|
|
|
|
Financial Position: |
|
|
|
|
|
|
|
|
|
|
|
|
|
|
|
|
|
|
|
|
Securities |
| $ | 819,874 |
|
| $ | 548,436 |
|
| $ | 455,295 |
|
| $ | 520,802 |
|
| $ | 459,934 |
|
Loans, net |
|
| 1,900,814 |
|
|
| 1,606,179 |
|
|
| 1,440,760 |
|
|
| 1,541,405 |
|
|
| 1,689,187 |
|
Total assets |
|
| 3,138,570 |
|
|
| 2,999,199 |
|
|
| 2,891,246 |
|
|
| 2,797,670 |
|
|
| 2,669,033 |
|
Deposits |
|
| 2,781,072 |
|
|
| 2,633,744 |
|
|
| 2,519,961 |
|
|
| 2,425,282 |
|
|
| 2,234,412 |
|
Borrowings |
|
| 28,161 |
|
|
| 50,767 |
|
|
| 51,052 |
|
|
| 69,522 |
|
|
| 124,345 |
|
Stockholders' equity |
|
| 297,566 |
|
|
| 284,309 |
|
|
| 290,971 |
|
|
| 277,562 |
|
|
| 289,917 |
|
27
Financial Ratios
Significant ratios of the Company for the periods indicated were as follows:
|
| Year Ended December 31, |
| |||||||||||||||||
|
| 2014 |
|
| 2013 |
|
| 2012 |
|
| 2011 |
|
| 2010 |
| |||||
|
|
|
|
|
|
|
|
|
|
|
|
|
|
|
|
|
|
|
|
|
Earnings Ratios: |
|
|
|
|
|
|
|
|
|
|
|
|
|
|
|
|
|
|
|
|
Net income as a percentage of: |
|
|
|
|
|
|
|
|
|
|
|
|
|
|
|
|
|
|
|
|
Average earning assets |
|
| 0.27 | % |
|
| 0.04 | % |
|
| 1.10 | % |
|
| (0.08 | )% |
|
| 0.20 | % |
Average total assets |
|
| 0.26 |
|
|
| 0.04 |
|
|
| 1.02 |
|
|
| (0.08 | ) |
|
| 0.18 |
|
Average total stockholders' equity |
|
| 2.73 |
|
|
| 0.39 |
|
|
| 10.05 |
|
|
| (0.72 | ) |
|
| 1.75 |
|
Adjusted average total stockholders' equity (1) |
|
| 2.72 |
|
|
| 0.38 |
|
|
| 10.10 |
|
|
| (0.72 | ) |
|
| 1.77 |
|
|
|
|
|
|
|
|
|
|
|
|
|
|
|
|
|
|
|
|
|
|
Capital Ratios: |
|
|
|
|
|
|
|
|
|
|
|
|
|
|
|
|
|
|
|
|
Average total stockholders' equity to average total assets |
|
| 9.43 | % |
|
| 9.84 | % |
|
| 10.19 | % |
|
| 10.59 | % |
|
| 10.43 | % |
Average net loans as a multiple of average total stockholders' equity |
|
| 5.92 |
|
|
| 5.05 |
|
|
| 5.63 |
|
|
| 6.33 |
|
|
| 5.86 |
|
Leverage capital |
|
| 9.32 | % |
|
| 9.52 | % |
|
| 9.32 | % |
|
| 8.80 | % |
|
| 9.60 | % |
Tier 1 capital (to risk weighted assets) |
|
| 13.89 |
|
|
| 16.21 |
|
|
| 16.46 |
|
|
| 11.33 |
|
|
| 13.92 |
|
Total risk-based capital (to risk weighted assets) |
|
| 15.14 |
|
|
| 17.46 |
|
|
| 17.72 |
|
|
| 12.58 |
|
|
| 15.18 |
|
|
|
|
|
|
|
|
|
|
|
|
|
|
|
|
|
|
|
|
|
|
Other: |
|
|
|
|
|
|
|
|
|
|
|
|
|
|
|
|
|
|
|
|
Allowance for loan losses as a percentage of year-end loans |
|
| 1.42 | % |
|
| 1.59 | % |
|
| 1.81 | % |
|
| 1.95 | % |
|
| 2.25 | % |
Loans (net) as a percentage of year-end total assets (2) |
|
| 60.56 |
|
|
| 53.55 |
|
|
| 49.83 |
|
|
| 55.10 |
|
|
| 63.29 |
|
Loans (net) as a percentage of year-end total deposits (2) |
|
| 68.35 |
|
|
| 60.98 |
|
|
| 57.17 |
|
|
| 63.56 |
|
|
| 75.60 |
|
Securities as a percentage of year-end total assets |
|
| 26.12 |
|
|
| 18.29 |
|
|
| 15.75 |
|
|
| 18.62 |
|
|
| 17.23 |
|
Average interest earning assets as a percentage of average interest bearing liabilities |
|
| 168.94 |
|
|
| 170.73 |
|
|
| 169.33 |
|
|
| 161.63 |
|
|
| 150.04 |
|
Dividends per share as a percentage of diluted earnings per share |
|
| 70.00 |
|
|
| 400.00 |
|
|
| 48.32 |
|
|
| — |
|
|
| 226.92 |
|
|
(1) | Adjusted average stockholders’ equity excludes unrealized losses, net of tax, of $1,490 and $3,985 in 2014 and 2013, respectively, and unrealized gains, net of tax, of $1,536, $1,229, and $3,078 in 2012, 2011 and 2010, respectively. Adjusted average stockholders’ equity is a non-GAAP financial measure. Please refer to pages below for a reconciliation to GAAP. Management believes this alternate presentation more closely reflects actual performance, as it is more consistent with the Company’s stated asset/liability management strategies, which have not resulted in significant realization of temporary market gains or losses on securities available for sale which were primarily related to changes in interest rates. Net income as a percentage of adjusted average stockholders’ equity is one of several factors utilized by management to determine total compensation. |
(2) | Loans, net, exclude $474 million in loans held for sale at year-end 2011. These were sold at the end of the first quarter of 2012. |
28
ITEM 7 — MANAGEMENT’S DISCUSSION AND ANALYSIS OF FINANCIAL CONDITION AND RESULTS OF OPERATIONS
This section presents discussion and analysis of the Company’s consolidated financial condition at December 31, 2014 and 2013, and consolidated results of operations for each of the three years in the period ended December 31, 2014. The Company is consolidated with its wholly-owned subsidiaries Hudson Valley Bank, N.A. and its subsidiaries (collectively “HVB” or “the Bank”) and HVHC Risk Management Corp. This discussion and analysis should be read in conjunction with the financial statements and supplementary financial information contained elsewhere in this Annual Report on Form 10-K.
Forward-Looking Statements
The Company has made in this Annual Report on Form 10-K various forward-looking statements within the meaning of the Private Securities Litigation Reform Act of 1995 with respect to earnings, credit quality and other financial and business matters for periods subsequent to December 31, 2014. Such statements are not historical facts and include expressions about management’s confidence and strategies and management’s expectations about items such as new and existing programs and products, relationships, opportunities, taxation, technology, market conditions and economic expectations. These statements may be identified by such forward-looking terminology as “should,” “expect,” “believe,” “view,” “intends,” “estimates,” “predicts,” “opportunity,” “allow,” “continues,” “reflects,” “typically,” “usually,” “anticipate,” and words of similar import. The Company cautions that these forward-looking statements are subject to numerous assumptions, risks and uncertainties, and that statements relating to subsequent periods increasingly are subject to greater uncertainty because of the increased likelihood of changes in underlying factors and assumptions. Actual results could differ materially from forward-looking statements.
Factors that may cause actual results to differ materially from those contemplated by such forward-looking statements, in addition to those risk factors disclosed in this Annual Report on Form 10-K include, but are not limited to, statements regarding:
● | the OCC and other bank regulators may require us to modify or change our mix of assets, including our concentration in certain types of loans, or require us to take further remedial actions; |
● | our inability to deploy our excess cash, reduce our expenses and improve our operating leverage and efficiency; |
● | our ability to pay quarterly cash dividends to shareholders in light of our earnings, the current and future economic environment, FRB guidance, our Bank’s capital plan and other regulatory requirements applicable to Hudson Valley or Hudson Valley Bank; |
● | the possibility that we may need to raise additional capital in the future and our ability to raise such capital on terms that are favorable to us; |
● | further increases in our nonperforming loans and allowance for loan losses; |
● | ineffectiveness in managing our loan portfolios; |
● | lower than expected future performance of our investment portfolio; |
● | inability to effectively integrate and manage new businesses and lending teams; |
● | a lack of opportunities for growth and increased or unexpected competition in attracting and retaining customers; |
● | continued poor economic conditions generally and in our market area in particular, which may adversely affect the ability of borrowers to repay their loans and the value of real property or other property held as collateral for such loans; |
● | lower than expected demand for our products and services; |
● | possible additional impairment of our goodwill and other intangible assets; |
● | our inability to manage interest rate risk; |
● | increased expense and burdens resulting from the regulatory environment in which we operate and our ability to comply with existing and future regulatory requirements; |
● | our inability to maintain regulatory capital above the minimum levels the Bank has set as its minimum capital levels or such higher capital levels as may be required; |
● | proposed legislative and regulatory action may adversely affect us and the financial services industry; |
● | legislative and regulatory actions (including the impact of the Dodd-Frank Act and Consumer Protection Act and related regulations) may subject us to additional regulatory oversight which may result in increased compliance costs and/or require us to change our business model; |
29
● | future increased FDIC special assessments or changes to regular assessments; |
● | potential liabilities under federal and state environmental laws; |
● | legislative and regulatory changes to laws governing New York State’s taxation of HVB’s REIT subsidiary; |
● | our ability to obtain regulatory approvals and meet other closing conditions to the Merger, including approval by Sterling Bancorp and Hudson Valley Holding Corp. stockholders, on the expected terms and schedule; |
● | delay in closing the Merger; |
● | difficulties and delays in integrating the Sterling and Hudson Valley businesses or fully realizing cost savings and other benefits; |
● | business disruption following the proposed Merger transaction; changes in asset quality and credit risk; |
● | the inability to sustain revenue and earnings growth; changes in interest rates and capital markets; and |
● | the inability to realize cost savings or revenues or to implement integration plans and other consequences associated with mergers, acquisitions and divestitures. |
We assume no obligation for updating any such forward-looking statements at any time.
Overview of Management’s Discussion and Analysis
This overview is intended to highlight selected information included in this Annual Report on Form 10-K. It does not contain sufficient information for a complete understanding of the Company’s financial condition and operating results and, therefore, should be read in conjunction with this entire Annual Report on Form 10-K.
The Company derives substantially all of its revenue from providing banking and related services to businesses, professionals, municipalities, not-for profit organizations and individuals within its market area, primarily Westchester County and Rockland County, New York, and portions of New York City. The Company’s assets consist primarily of cash and cash equivalents, loans and investment securities, which are funded by deposits, borrowings and capital. The primary source of revenue is net interest income, the difference between interest income on cash and cash equivalents, loans and investments, and interest expense on deposits and borrowed funds. The Company’s strategy includes consummation of the Merger, and to a lesser extent, investigation of opportunities for expansion within our market area, select lending opportunities outside our market area, as well as an ongoing review of our existing branch system to evaluate if our current locations have or have not met expectations for growth and profitability. Considering current economic conditions, the Company’s primary market risk exposures are interest rate risk, the risk of deterioration of market values of collateral supporting the Company’s loan portfolio, particularly commercial and residential real estate, and potential risks associated with the impact of regulatory changes that have occurred and may continue to take place in reaction to current conditions in the financial system. Interest rate risk is the exposure of net interest income to changes in interest rates. Commercial and residential real estate are the primary collateral for the majority of the Company’s loans.
The Company recorded net income of $7.9 million or $0.40 per diluted share in 2014 compared to net income of $1.1 million or $0.06 per diluted share in 2013. The overall increase in 2014, compared to 2013, reflected higher net interest income, lower non-interest expense, and a lower provision for loan losses, partially offset by lower non-interest income and higher income taxes.
Net interest income was $92.3 million for the year ended December 31, 2014, compared to $83.9 million for the year ended December 31, 2013. The $8.4 million or 10.0% increase in net interest income was attributable to the combination of higher levels of interest-earnings assets and the lower cost of interest-bearing liabilities, partially offset by lower yields on interest-earning assets.
The provision for loan losses totaled $1.8 million for the year ended December 31, 2014 compared to $2.5 million for the year ended December 31, 2013. The decline in the provision reflects continued improvement in overall asset quality and the continued improvements in the resolution of classified and nonperforming loans.
Non-interest income was $13.7 million for the year ended 2014 compared to $15.1 million for the year ended December 31, 2013. The decline in non-interest income was due to the recognition of the $1.9 million pre-tax prepayment penalty for the redemption of all of the outstanding Federal Home Loan Bank of New York (“FHLB”) advances and the $0.9 million pre-tax loss the Company recognized on the sale of A.R. Schmeidler partially offset by the pretax other-than-temporary impairment charge of $1.2 million the Company recorded in 2013.
Non-interest expense was $92.3 million for the year ended December 31, 2014 compared to $100.1 million for the year ended December 31, 2013. The decline in non-interest expense was attributable to the $18.7 million pretax goodwill impairment charge the Company recorded in 2013, partially offset by a $1.2 million pre-tax goodwill impairment charge and higher compensation and professional fees recorded in 2014.
30
Total investment securities increased $271.5 million to $819.9 million at December 31, 2014 compared to $548.4 million at the prior year end. Total loans increased $296.6 million to $1,927.4 million at December 31, 2014, compared to $1,630.8 million at the prior year end. The overall increase in investment securities was the result of the previously reported $300 million securities purchase. The overall increase in loans was primarily the result of increased organic loan growth in excess of payoffs and pay downs during the year.
The increase in investment securities and loans was primarily funded by the $406.5 million reduction in cash and cash equivalents and the $147.4 million increase in deposits. Cash and cash equivalents totaled $292.9 million at December 31, 2014, compared to $699.4 million at December 31, 2013. Total deposits were $2,781.1 million at December 31, 2014, compared to $2,633.7 million at December 31, 2013. The Company continued to emphasize its core deposit growth, while placing less emphasis on non-core deposits including deposits which are obtained on a bid basis.
Hudson Valley’s capital ratios remain significantly in excess of “well capitalized” levels generally applicable to banks under current regulations. At December 31, 2014, Hudson Valley Holding Corp. posted a total risk-based capital ratio of 15.1 percent, a Tier 1 risk-based capital ratio of 13.9 percent, and a Tier 1 leverage ratio of 9.3 percent. At December 31, 2014, Hudson Valley Bank, N.A. posted a total risk-based capital ratio of 14.8 percent, a Tier 1 risk-based capital ratio of 13.6 percent, and a Tier 1 leverage ratio of 9.1 percent.
Critical Accounting Policies
Application of Critical Accounting Policies — The Company’s consolidated financial statements are prepared in accordance with accounting principles generally accepted in the United States (“GAAP”). The Company’s significant accounting policies are more fully described in Note 1 to the Consolidated Financial Statements. Certain accounting policies require management to make estimates and assumptions that affect the reported amounts of assets and liabilities at the date of the financial statements and the reported amounts of revenue and expense during the reporting period. On an on-going basis, management evaluates its estimates and assumptions, and the effects of revisions are reflected in the financial statements in the period in which they are determined to be necessary. The accounting policies described below are those that most frequently require management to make estimates and judgments, and therefore, are critical to understanding the Company’s results of operations. Senior management has discussed the development and selection of these accounting estimates and the related disclosures with the Audit Committee of the Company’s Board of Directors.
Securities — Securities are classified as either available for sale, representing securities the Company may sell in the ordinary course of business, or as held to maturity, representing securities that the Company has determined that it is more likely than not it would not be required to sell prior to maturity or recovery of cost. Securities available for sale are reported at fair value with unrealized gains and losses (net of tax) excluded from operations and reported in other comprehensive income. Securities held to maturity are stated at amortized cost. Interest income includes amortization of purchase premium and accretion of purchase discount. The amortization of premiums and accretion of discounts is determined by using the level yield method. Securities are not acquired for purposes of engaging in trading activities. Realized gains and losses from sales of securities are determined using the specific identification method. The Company regularly reviews declines in the fair value of securities below their costs for purposes of determining whether such declines are other-than-temporary in nature. In estimating other-than-temporary impairment (“OTTI”), management considers adverse changes in expected cash flows, the length of time and extent that fair value has been less than cost and the financial condition and near term prospects of the issuer. The Company also assesses whether it intends to sell, or it is more likely than not that it will be required to sell, a security in an unrealized loss position before recovery of its amortized cost basis. If either of these criteria is met, the entire difference between amortized cost and fair value is recognized as impairment through earnings. For securities that do not meet the aforementioned criteria, the amount of impairment is split into two components as follows: 1) OTTI related to credit loss, which must be recognized in the income statement and 2) OTTI related to other factors, which is recognized in other comprehensive income. The credit loss is defined as the difference between the present value of the cash flows expected to be collected and the amortized cost basis.
Allowance for Loan Losses — The Company maintains an allowance for loan losses to absorb inherent probable losses in the loan portfolio. The Company calculates the allowance for loan losses on a quarterly basis applying and documenting a systematic methodology. The Company’s methodology for assessing the appropriateness of the allowance consists of a specific component for identified problem loans, and a formula component which addresses historical loan loss experience together with other relevant risk factors affecting the portfolio. This methodology applies to all portfolio segments.
The specific component incorporates the Company’s analysis of impaired loans. The accounting standards prescribe the measurement methods, income recognition and disclosures related to impaired loans. A loan is recognized as impaired when it is probable that principal and/or interest are not collectible in accordance with the loan’s contractual terms. In addition, a loan which has been renegotiated with a borrower experiencing financial difficulties for which the terms of the loan have been modified with a
31
concession that the Company would not otherwise have granted are considered troubled debt restructurings (“TDR”) and are also recognized as impaired. Measurement of impairment can be based on the present value of expected future cash flows discounted at the loan’s effective interest rate, the loan’s observable market price or the fair value of the collateral, taking into account estimated selling costs, if the loan is collateral dependent. This evaluation is inherently subjective as it requires material estimates that may be susceptible to significant change. If the fair value of an impaired loan is less than the related recorded amount, a specific valuation component is established within the allowance for loan losses or, if the impairment is considered to be permanent, a full or partial charge-off is recorded against the allowance for loan losses. Triggering events that may impact the Company’s decision to record a specific reserve instead of a partial charge-off on impaired loans typically involve some uncertainty as to the amount of loss to be recorded. Examples include ongoing negotiations with a borrower, new appraisals or other collateral evaluations not yet received or completed and other factors where the decision to record a charge-off is considered premature. Subsequent changes in impairment are recorded as an adjustment to the provision for loan losses. The Company has groups of smaller balance homogenous loans which are collectively reviewed for impairment. These groups include residential 1-4 family loans, home equity lines of credit and consumer loans. These loans are not individually risk rated while performing. They are either charged off or evaluated for impairment after 90 days delinquency.
The formula component is calculated by first applying historical loss experience factors to outstanding loans by type. The Company’s primary loan types are commercial real estate (“CRE”), construction, residential real estate, commercial & industrial, lease financing and other loans. The Company uses a three year average loss experience as the starting point for the formula component. The three year average loss experience is calculated over the loss emergence period (“LEP”). The LEP is an estimate of the average amount of time from the point at which a loss is incurred on a loan to the point at which the loss is confirmed. This component is then adjusted to reflect qualitative risk factors not addressed by historical loss experience. These factors include the evaluation of then-existing economic and business conditions affecting the key lending areas of the Company and other conditions, such as new loan products, credit quality trends (including trends in nonperforming loans expected to result from existing conditions), collateral values, loan volumes and concentrations, recent charge-off and delinquency experience, specific industry conditions within portfolio segments that existed as of the balance sheet date and the impact that such conditions were believed to have had on the collectability of the loan portfolio, changes in the Company’s lending policy, changes in the experience and ability of our lending management staff, changes in the Company’s loan review system, and other external considerations, including regulatory requirements. Senior management reviews these conditions quarterly. Management’s evaluation of the loss related to each of these conditions is quantified by portfolio segment and reflected in the formula component. The evaluations of the inherent loss with respect to these conditions is subject to a higher degree of uncertainty due to the subjective nature of such evaluations and because they are not identified with specific problem credits.
Actual losses can vary significantly from the estimated amounts. The Company’s methodology permits adjustments to the allowance in the event that, in management’s judgment, significant factors which affect the collectability of the loan portfolio as of the evaluation date have changed.
Management believes the allowance for loan losses is the best estimate of probable losses which have been incurred as of December 31, 2014 and 2013. While the Company attributes portions of the allowance for loan losses to the Company’s portfolio segments, the entire allowance is available to absorb credit losses inherent in the total loan portfolio. There is no assurance that the Company will not be required to make future adjustments to the allowance in response to changing economic conditions, particularly in the Company’s service area, since the majority of the Company’s loans are collateralized by real estate. In addition, various regulatory agencies, as an integral part of their examination process, periodically review the Company’s allowance for loan losses. Such agencies may require the Company to recognize additions to the allowance based on their judgments at the time of their examinations.
Goodwill and Other Intangible Assets — Goodwill and identified intangible assets with indefinite useful lives are not subject to amortization. Identified intangible assets that have finite useful lives are amortized over those lives by a method which reflects the pattern in which the economic benefits of the intangible asset are used up. Goodwill is subject to impairment testing on an annual basis, or more often if events or circumstances indicate that impairment may exist. Identifiable intangible assets are subject to impairment if events or circumstances indicate that impairment may exist. If such testing indicates impairment in the values and/or remaining amortization periods of the intangible assets, adjustments are made to reflect such impairment.
Income Taxes — Income tax expense is the total of the current year income tax due or refundable and the change in deferred tax assets and liabilities. Deferred tax assets and liabilities are recognized for the future tax consequences attributable to differences between the financial statement carrying amounts of assets and liabilities and their respective tax bases. Deferred tax assets and liabilities are measured using enacted tax rates expected to apply to taxable income in the years in which those temporary differences are expected to be recovered or settled. The deferred tax asset is evaluated for realizability at each balance sheet date. At December 31, 2014 and 2013, the Company determined the deferred tax asset was fully realizable. The effect on deferred tax assets and liabilities from a change in tax rates is recognized in income in the period the change is enacted. At December 31, 2014 and 2013, the Company
32
had no unrecognized tax benefits. The Company does not expect the total amount of unrecognized tax benefits to significantly increase within the next twelve months. The Company policy is to recognize interest and penalties related to unrecognized tax benefits as a component of income tax expense. There were no expenses accrued for interest and penalties on unrecognized tax benefits for the years ended December 31, 2014 and 2013.
Comparison of Results of Operations and Financial Condition for the Years Ended December 31, 2014 and 2013
Results of Operations
Summary
Net income for the year ended December 31, 2014 increased $6.8 million to $7.9 million, compared to $1.1 million for the year ended December 31, 2013. Diluted earnings per common share increased to $0.40 per common share for the year ended December 31, 2014, compared to $0.06 per common share for the year ended December 31, 2013. The overall increase in 2014, compared to 2013, reflected higher net interest income, increased margin, lower non-interest expense, and a lower provision for loan losses, partially offset by lower non-interest income and higher income taxes.
In addition to earnings per share, key performance measurements for the Company are return on average shareholder’s equity (“ROAE”) and return on average assets (“ROAA”). ROAE totaled 2.7 percent for 2014 as compared to 0.4 percent for 2013, while ROAE was 0.26 percent for 2014 as compared to 0.04 percent for 2013.
33
Average Balances and Interest Rates
The following table sets forth the daily average balances of interest earning assets and interest bearing liabilities as well as total interest and corresponding yields and rates for each of the periods indicated:
|
| Year Ended December 31, |
| |||||||||||||||||||||||||||||||||
|
| 2014 |
|
| 2013 |
|
| 2012 |
| |||||||||||||||||||||||||||
|
| Average Balance |
|
| Interest (3) |
|
| Yield/ Rate |
|
| Average Balance |
|
| Interest (3) |
|
| Yield/ Rate |
|
| Average Balance |
|
| Interest (3) |
|
| Yield/ Rate |
| |||||||||
|
| (Dollars in thousands) |
| |||||||||||||||||||||||||||||||||
ASSETS |
|
|
|
|
|
|
|
|
|
|
|
|
|
|
|
|
|
|
|
|
|
|
|
|
|
|
|
|
|
|
|
|
|
|
|
|
Interest earning assets: |
|
|
|
|
|
|
|
|
|
|
|
|
|
|
|
|
|
|
|
|
|
|
|
|
|
|
|
|
|
|
|
|
|
|
|
|
Deposits in banks |
| $ | 461,196 |
|
| $ | 1,164 |
|
|
| 0.25 | % |
| $ | 759,011 |
|
| $ | 1,985 |
|
|
| 0.26 | % |
| $ | 535,868 |
|
| $ | 1,254 |
|
|
| 0.23 | % |
Federal funds sold |
|
| 18,179 |
|
|
| 31 |
|
|
| 0.17 | % |
|
| 22,256 |
|
|
| 38 |
|
|
| 0.17 | % |
|
| 19,695 |
|
|
| 39 |
|
|
| 0.20 | % |
Securities: (1) |
|
|
|
|
|
|
|
|
|
|
|
|
|
|
|
|
|
|
|
|
|
|
|
|
|
|
|
|
|
|
|
|
|
|
|
|
Taxable |
|
| 619,856 |
|
|
| 12,115 |
|
|
| 1.95 | % |
|
| 434,926 |
|
|
| 9,436 |
|
|
| 2.17 | % |
|
| 376,450 |
|
|
| 11,898 |
|
|
| 3.16 | % |
Exempt from federal income taxes |
|
| 97,917 |
|
|
| 3,674 |
|
|
| 3.75 | % |
|
| 84,825 |
|
|
| 4,485 |
|
|
| 5.29 | % |
|
| 92,323 |
|
|
| 5,548 |
|
|
| 6.01 | % |
Loans, net (2) |
|
| 1,722,948 |
|
|
| 81,393 |
|
|
| 4.72 | % |
|
| 1,464,100 |
|
|
| 75,209 |
|
|
| 5.14 | % |
|
| 1,636,097 |
|
|
| 93,255 |
|
|
| 5.70 | % |
Total interest earning assets |
|
| 2,920,096 |
|
|
| 98,377 |
|
|
| 3.37 | % |
|
| 2,765,118 |
|
|
| 91,153 |
|
|
| 3.30 | % |
|
| 2,660,433 |
|
|
| 111,994 |
|
|
| 4.21 | % |
Non-interest earning assets: |
|
|
|
|
|
|
|
|
|
|
|
|
|
|
|
|
|
|
|
|
|
|
|
|
|
|
|
|
|
|
|
|
|
|
|
|
Cash & due from banks |
|
| 58,701 |
|
|
|
|
|
|
|
|
|
|
| 57,258 |
|
|
|
|
|
|
|
|
|
|
| 41,898 |
|
|
|
|
|
|
|
|
|
Other assets |
|
| 109,920 |
|
|
|
|
|
|
|
|
|
|
| 131,197 |
|
|
|
|
|
|
|
|
|
|
| 145,184 |
|
|
|
|
|
|
|
|
|
Total non-interest earning assets |
|
| 168,621 |
|
|
|
|
|
|
|
|
|
|
| 188,455 |
|
|
|
|
|
|
|
|
|
|
| 187,082 |
|
|
|
|
|
|
|
|
|
Total assets |
| $ | 3,088,717 |
|
|
|
|
|
|
|
|
|
| $ | 2,953,573 |
|
|
|
|
|
|
|
|
|
| $ | 2,847,515 |
|
|
|
|
|
|
|
|
|
LIABILITIES AND STOCKHOLDERS' EQUITY |
|
|
|
|
|
|
|
|
|
|
|
|
|
|
|
|
|
|
|
|
|
|
|
|
|
|
|
|
|
|
|
|
|
|
|
|
Interest bearing liabilities: |
|
|
|
|
|
|
|
|
|
|
|
|
|
|
|
|
|
|
|
|
|
|
|
|
|
|
|
|
|
|
|
|
|
|
|
|
Deposits: |
|
|
|
|
|
|
|
|
|
|
|
|
|
|
|
|
|
|
|
|
|
|
|
|
|
|
|
|
|
|
|
|
|
|
|
|
Money market |
| $ | 957,298 |
|
| $ | 3,209 |
|
|
| 0.34 | % |
| $ | 885,502 |
|
| $ | 3,244 |
|
|
| 0.37 | % |
| $ | 894,068 |
|
| $ | 3,858 |
|
|
| 0.43 | % |
Savings |
|
| 121,935 |
|
|
| 147 |
|
|
| 0.12 | % |
|
| 126,605 |
|
|
| 330 |
|
|
| 0.26 | % |
|
| 124,244 |
|
|
| 500 |
|
|
| 0.40 | % |
Time |
|
| 112,539 |
|
|
| 518 |
|
|
| 0.46 | % |
|
| 122,761 |
|
|
| 596 |
|
|
| 0.49 | % |
|
| 138,863 |
|
|
| 838 |
|
|
| 0.60 | % |
Checking with interest |
|
| 501,474 |
|
|
| 840 |
|
|
| 0.17 | % |
|
| 437,673 |
|
|
| 725 |
|
|
| 0.17 | % |
|
| 353,206 |
|
|
| 701 |
|
|
| 0.20 | % |
Securities sold under repo & other short-term borrowings |
|
| 33,654 |
|
|
| 39 |
|
|
| 0.12 | % |
|
| 26,738 |
|
|
| 27 |
|
|
| 0.10 | % |
|
| 45,619 |
|
|
| 98 |
|
|
| 0.21 | % |
Other borrowings |
|
| 225 |
|
|
| 10 |
|
|
| 4.44 | % |
|
| 16,407 |
|
|
| 724 |
|
|
| 4.41 | % |
|
| 16,446 |
|
|
| 728 |
|
|
| 4.43 | % |
Total interest bearing liabilities |
|
| 1,727,125 |
|
|
| 4,763 |
|
|
| 0.28 | % |
|
| 1,615,686 |
|
|
| 5,646 |
|
|
| 0.35 | % |
|
| 1,572,446 |
|
|
| 6,723 |
|
|
| 0.43 | % |
Non-interest bearing liabilities: |
|
|
|
|
|
|
|
|
|
|
|
|
|
|
|
|
|
|
|
|
|
|
|
|
|
|
|
|
|
|
|
|
|
|
|
|
Demand deposits |
|
| 1,038,886 |
|
|
|
|
|
|
|
|
|
|
| 1,013,154 |
|
|
|
|
|
|
|
|
|
|
| 959,566 |
|
|
|
|
|
|
|
|
|
Other liabilities |
|
| 30,206 |
|
|
|
|
|
|
|
|
|
|
| 30,823 |
|
|
|
|
|
|
|
|
|
|
| 26,553 |
|
|
|
|
|
|
|
|
|
Total non-interest bearing liabilities |
|
| 1,069,092 |
|
|
|
|
|
|
|
|
|
|
| 1,043,977 |
|
|
|
|
|
|
|
|
|
|
| 986,119 |
|
|
|
|
|
|
|
|
|
Stockholders' equity (1) |
|
| 292,500 |
|
|
|
|
|
|
|
|
|
|
| 293,910 |
|
|
|
|
|
|
|
|
|
|
| 288,950 |
|
|
|
|
|
|
|
|
|
Total liabilities and stockholders' equity |
| $ | 3,088,717 |
|
|
|
|
|
|
|
|
|
| $ | 2,953,573 |
|
|
|
|
|
|
|
|
|
| $ | 2,847,515 |
|
|
|
|
|
|
|
|
|
Net interest earnings |
|
|
|
|
| $ | 93,614 |
|
|
|
|
|
|
|
|
|
| $ | 85,507 |
|
|
|
|
|
|
|
|
|
| $ | 105,271 |
|
|
|
|
|
Net yield on interest earning assets |
|
|
|
|
|
|
|
|
|
| 3.21 | % |
|
|
|
|
|
|
|
|
|
| 3.09 | % |
|
|
|
|
|
|
|
|
|
| 3.96 | % |
|
(1) | Excludes unrealized gains (losses) on securities available for sale. Management believes that this presentation more closely reflects actual performance, as it is more consistent with the Company’s stated asset/liability management strategies, which have not resulted in significant realization of temporary market gains or losses on securities available for sale which were primarily related to changes in interest rates. Effects of these adjustments are presented in the non-GAAP financial disclosures and reconciliation to GAAP table below. |
(2) | Includes loans classified as non-accrual. |
(3) | The data contained in this table has been adjusted to a tax equivalent basis, based on the Company’s federal statutory rate of 35 percent. Management believes that this presentation provides comparability of net interest income and net interest margin arising from both taxable and tax-exempt sources and is consistent with industry practice and SEC rules. Effects of these adjustments are presented in the non-GAAP financial disclosures and reconciliations to GAAP table below. |
34
The following table sets forth the non-GAAP financial disclosures and reconciliations for each of the periods indicated:
|
| Year Ended December 31, |
| |||||||||
|
| 2014 |
|
| 2013 |
|
| 2012 |
| |||
|
| (Dollars in thousands) |
| |||||||||
Total average interest earning assets: |
|
|
|
|
|
|
|
|
|
|
|
|
As reported |
| $ | 2,917,766 |
|
| $ | 2,758,437 |
|
| $ | 2,662,587 |
|
Unrealized loss on securities available-for-sale (a) |
|
| (2,330 | ) |
|
| (6,681 | ) |
|
| 2,154 |
|
Adjusted total average interest earning assets |
| $ | 2,920,096 |
|
| $ | 2,765,118 |
|
| $ | 2,660,433 |
|
Net interest income: |
|
|
|
|
|
|
|
|
|
|
|
|
As reported |
| $ | 92,328 |
|
| $ | 83,937 |
|
| $ | 103,329 |
|
Adjustment to tax equivalency basis (b) |
|
| 1,286 |
|
|
| 1,570 |
|
|
| 1,942 |
|
Adjusted net interest income |
| $ | 93,614 |
|
| $ | 85,507 |
|
| $ | 105,271 |
|
Net yield on average interest earning assets: |
|
|
|
|
|
|
|
|
|
|
|
|
As reported |
|
| 3.16 | % |
|
| 3.04 | % |
|
| 3.88 | % |
Effects of (a) and (b) above |
|
| 0.05 | % |
|
| 0.05 | % |
|
| 0.08 | % |
Adjusted net yield on average interest earning assets |
|
| 3.21 | % |
|
| 3.09 | % |
|
| 3.96 | % |
Average stockholders' equity: |
|
|
|
|
|
|
|
|
|
|
|
|
As reported |
| $ | 291,010 |
|
| $ | 289,925 |
|
| $ | 290,486 |
|
Effects of (a) and (b) above |
|
| (1,490 | ) |
|
| (3,985 | ) |
|
| 1,536 |
|
Adjusted average stockholders' equity |
| $ | 292,500 |
|
| $ | 293,910 |
|
| $ | 288,950 |
|
Interest income: |
|
|
|
|
|
|
|
|
|
|
|
|
As reported |
| $ | 97,091 |
|
| $ | 89,583 |
|
| $ | 110,052 |
|
Adjustment to tax equivalency basis (b) |
|
| 1,286 |
|
|
| 1,570 |
|
|
| 1,942 |
|
Adjusted interest income |
| $ | 98,377 |
|
| $ | 91,153 |
|
| $ | 111,994 |
|
Gross yield on average interest earning assets: |
|
|
|
|
|
|
|
|
|
|
|
|
As reported |
|
| 3.33 | % |
|
| 3.25 | % |
|
| 4.13 | % |
Effects of (a) and (b) above |
|
| 0.04 | % |
|
| 0.05 | % |
|
| 0.08 | % |
Adjusted gross yield on average interest earning assets |
|
| 3.37 | % |
|
| 3.30 | % |
|
| 4.21 | % |
|
|
|
|
|
|
|
|
|
|
|
|
|
The following table sets forth the interest rate spread on a tax equivalent basis for each of the years indicated:
|
| 2014 |
|
| 2013 |
|
| 2012 |
| |||
Average interest rate on: |
|
|
|
|
|
|
|
|
|
|
|
|
Total average interest earning assets |
|
| 3.37 | % |
|
| 3.30 | % |
|
| 4.21 | % |
Total average interest bearing liabilities |
|
| 0.28 | % |
|
| 0.35 | % |
|
| 0.43 | % |
Total interest rate spread |
|
| 3.09 | % |
|
| 2.95 | % |
|
| 3.78 | % |
35
Interest Differential
The following table sets forth the dollar amount of changes in interest income, interest expense and net interest income between the years ended December 31, 2014 and 2013, and the years ended December 31, 2013 and 2012, on a tax equivalent basis:
|
| Year Ended December 31, |
|
| Year Ended December 31, |
| ||||||||||||||||||
|
| 2014 Compared to 2013 |
|
| 2013 Compared to 2012 |
| ||||||||||||||||||
|
| Volume |
|
| Rate |
|
| Total (1) |
|
| Volume |
|
| Rate |
|
| Total (1) |
| ||||||
|
| (In thousands) |
| |||||||||||||||||||||
Interest income: |
|
|
|
|
|
|
|
|
|
|
|
|
|
|
|
|
|
|
|
|
|
|
|
|
Deposits in banks |
| $ | (779 | ) |
| $ | (42 | ) |
| $ | (821 | ) |
| $ | 522 |
|
| $ | 209 |
|
| $ | 731 |
|
Federal funds sold |
|
| (7 | ) |
|
| — |
|
|
| (7 | ) |
|
| 5 |
|
|
| (6 | ) |
|
| (1 | ) |
Securities: |
|
|
|
|
|
|
|
|
|
|
|
|
|
|
|
|
|
|
|
|
|
|
|
|
Taxable |
|
| 4,012 |
|
|
| (1,333 | ) |
|
| 2,679 |
|
|
| 1,848 |
|
|
| (4,310 | ) |
|
| (2,462 | ) |
Exempt from federal income taxes (2) |
|
| 692 |
|
|
| (1,503 | ) |
|
| (811 | ) |
|
| (451 | ) |
|
| (612 | ) |
|
| (1,063 | ) |
Loans, net |
|
| 13,297 |
|
|
| (7,113 | ) |
|
| 6,184 |
|
|
| (9,804 | ) |
|
| (8,242 | ) |
|
| (18,046 | ) |
Total interest income |
|
| 17,215 |
|
|
| (9,991 | ) |
|
| 7,224 |
|
|
| (7,880 | ) |
|
| (12,961 | ) |
|
| (20,841 | ) |
|
|
|
|
|
|
|
|
|
|
|
|
|
|
|
|
|
|
|
|
|
|
|
|
|
Interest expense: |
|
|
|
|
|
|
|
|
|
|
|
|
|
|
|
|
|
|
|
|
|
|
|
|
Deposits: |
|
|
|
|
|
|
|
|
|
|
|
|
|
|
|
|
|
|
|
|
|
|
|
|
Money market |
|
| 263 |
|
|
| (298 | ) |
|
| (35 | ) |
|
| (37 | ) |
|
| (577 | ) |
|
| (614 | ) |
Savings |
|
| (12 | ) |
|
| (171 | ) |
|
| (183 | ) |
|
| 10 |
|
|
| (180 | ) |
|
| (170 | ) |
Time |
|
| (50 | ) |
|
| (28 | ) |
|
| (78 | ) |
|
| (97 | ) |
|
| (145 | ) |
|
| (242 | ) |
Checking with interest |
|
| 106 |
|
|
| 9 |
|
|
| 115 |
|
|
| 168 |
|
|
| (144 | ) |
|
| 24 |
|
Securities sold under repo & other s/t borrowings |
|
| 7 |
|
|
| 5 |
|
|
| 12 |
|
|
| (41 | ) |
|
| (30 | ) |
|
| (71 | ) |
Other borrowings |
|
| (714 | ) |
|
| — |
|
|
| (714 | ) |
|
| (2 | ) |
|
| (2 | ) |
|
| (4 | ) |
Total interest expense |
|
| (400 | ) |
|
| (483 | ) |
|
| (883 | ) |
|
| 1 |
|
|
| (1,078 | ) |
|
| (1,077 | ) |
Interest differential |
| $ | 17,615 |
|
| $ | (9,508 | ) |
| $ | 8,107 |
|
| $ | (7,881 | ) |
| $ | (11,883 | ) |
| $ | (19,764 | ) |
|
|
|
|
|
|
|
|
|
|
|
|
|
|
|
|
|
|
|
|
|
|
|
|
|
|
(1) | Changes attributable to both rate and volume are allocated between the rate and volume variances based upon their absolute relative weight to the total change. |
(2) | Equivalent yields on securities exempt from federal income taxes are based on a federal statutory rate of 35 percent in both 2014 and 2013. |
Net Interest Income
Net interest income, on a tax equivalent basis, increased $8.1 million, or 9.5 percent, to $93.6 million in 2014, compared to $85.5 million in 2013. The increase in 2014, compared to 2013, was primarily due to an increase in the average balance of higher yielding loans and investment securities, funded by a decrease in the average balance of deposits in banks coupled with an increase in the overall rate earned on interest earning assets. The tax equivalent basis of the net interest margin increased to 3.21 percent in 2014, compared to 3.09 percent in 2013. Net interest income recognized in accordance with GAAP increased by $8.4 million, or 10.0 percent, to $92.3 million for the year ended December 31, 2014, as compared to $83.9 million in 2013.
Net interest income recognized in accordance with GAAP, the difference between interest income and interest expense, is the most significant component of the Company’s consolidated earnings. Net interest income represented 83.3 percent of total revenue for the year ended December 31, 2014 as compared to 80.1 percent for the year ended December 31, 2013. Net interest income is dependent on the volume and composition of interest-earning assets and interest-bearing liabilities along with the interest rates in the market. The Company’s net interest income reflects the new loan production and the purchase of securities in June 2014, partially offset by the continued low interest rate environment. The low interest rate environment resulted in interest-earning assets re-pricing at lower yields. Interest income from loans receivable comprised the largest component of interest income at 83.8 percent for the year ended December 31, 2014, as compared to 84.0 percent for the year ended December 31, 2013. Average loans receivable totaled 59.0 percent of interest-earning assets for the year ended December 31, 2014 as compared to 52.9 percent for the year ended December 31, 2013. The Company has also been able to reduce its funding costs by expanding the deposit base and re-pricing interest-bearing liabilities to a lower rate.
The Average Balances and Interest Rates table displays average interest-earning assets and interest-bearing liabilities, and the corresponding yield or cost associated with each. The tax equivalent net interest margin was 3.21 percent in 2014 compared to 3.09 percent in 2013. Tax equivalent net interest income for 2014 was $93.6 million as compared to $85.5 million for 2013. The increase in
36
tax equivalent net interest income was due to higher interest income on loans and investments due to the previously mentioned growth and lower interest expense on deposits and borrowings, partially offset by lower interest income on deposits in banks due to the redeployment of excess cash into investment securities.
Tax equivalent interest income increased $7.2 million or 7.9 percent, to $98.4 million for the year ended December 31, 2014, as compared to $91.2 million for the year ended December 31, 2013.
See the Non-GAAP reconciliation in the “Average Balances and Interest Rates” section herein.
Interest expense decreased by $0.8 million or 14.3 percent, to $4.8 million for the year ended December 31, 2014, as compared to interest expense of $5.6 million for the year ended December 31, 2013. The decrease was primarily attributable to a $0.7 million reduction in interest expense on borrowed funds for the year ended December 31, 2014, which was attributed to the Company prepaying all of its FHLB advances in January 2014.
Provision for Loan Losses
The provision for loan losses in 2014 was $1.8 million compared to $2.5 million in 2013. Net charge-offs declined by $2.7 million to $0.4 million for the year ended December 31, 2014 from $3.1 million for the year ended December 31, 2013. The decrease in 2014 compared to 2013, reflected an improved credit environment coupled with continued improvements in the resolution of classified and nonperforming loans.
Non-Interest Income
Non-interest income decreased $1.4 million, or 9.3 percent, to $13.7 million in 2014 compared to $15.1 million in 2013. As previously mentioned, the Company incurred a $0.9 million pretax loss on the sale of its investment management subsidiary and a $1.9 million pre-tax prepayment penalty for the redemption of the FHLB outstanding borrowings.
Service charges increased by $0.4 million, or 6.9 percent, to $6.2 million in 2014 compared to $5.8 million in 2013. The 2014 increase was due to a growth in deposits.
Investment advisory fees decreased $0.1 million, or 1.3 percent, to $7.6 million in 2014 from $7.7 million in 2013. The 2014 decrease was primarily the result of declining assets under management and lower average fees.
There were no impairment charges on securities available for sale for the year ended December 31, 2014. The Company recognized impairment charges on securities available for sale of $1.2 million for the year ended December 31, 2013. The 2013 impairment charge resulted directly from management’s decision to sell its portfolio of pooled trust preferred securities given the uncertainty of pending final regulations of the Volcker rule. The Company sold the portfolio in January 2014, without further loss.
Other income decreased $0.3 million, or 10.7 percent, to $2.5 million in 2014 compared to $2.8 million in 2013. The decrease in 2014, compared to 2013, primarily resulted from lower rental income and lower earnings from bank owned life insurance.
Non-Interest Expense
Non-interest expense decreased $7.8 million, or 7.8 percent, to $92.3 million in 2014, compared to $100.1 million in 2013. The decrease in 2014 was primarily due to the pretax goodwill impairment charge of $18.7 million in 2013 necessitated by the decline in the earnings capacity of the Company’s asset management subsidiary, and the reduced FDIC assessment in 2014. Partially offsetting the decrease was a $1.2 million pre-tax goodwill impairment charge related to the divestiture of ARS, increased Merger related compensation and professional fee expenses, business development expense, and other operating expenses.
The Company’s efficiency ratio which compares adjusted non-interest expense (excluding goodwill impairment charges) to total adjusted revenue (tax equivalent net interest income, plus non-interest income, excluding gains or losses on securities and loans, loss on sale of subsidiaries, and the prepayment penalty on FHLB borrowings) was 82.8 percent in 2014, compared to 79.9 percent in 2013. The increasing trend of the efficiency ratio was primarily the result of higher non-interest expenses related to the Merger.
Salaries and employee benefits, the largest component of non-interest expense, increased $7.7 million, or 17.1 percent, to $52.8 million in 2014 from $45.1 million in 2013. The increase in 2014 resulted primarily from the $3.0 million accelerated vesting expense related to the Merger and new hires in the asset-based lending and equipment financing units.
37
The following tables show the number of full and part time employees and the salaries and employee benefit expenses for the Company for the years indicated:
|
| 2014 |
|
| 2013 |
| ||
Employees at December 31, |
|
|
|
|
|
|
|
|
Full time employees |
|
| 403 |
|
|
| 401 |
|
Part time employees |
|
| 18 |
|
|
| 18 |
|
|
|
| 2014 |
|
|
| 2013 |
|
|
| (Dollars in thousands) |
| |||||
Salaries and Employee Benefits: |
|
|
|
|
|
|
|
|
Salaries |
| $ | 37,614 |
|
| $ | 32,992 |
|
Payroll taxes |
|
| 3,065 |
|
|
| 2,748 |
|
Medical plans |
|
| 2,865 |
|
|
| 2,824 |
|
Incentive compensation plans |
|
| 5,756 |
|
|
| 2,982 |
|
Employee retirement plans |
|
| 2,570 |
|
|
| 2,813 |
|
Other |
|
| 966 |
|
|
| 750 |
|
Total |
| $ | 52,836 |
|
| $ | 45,109 |
|
|
|
|
|
|
|
|
|
|
Percent of total non-interest expense |
|
| 57.2 | % |
|
| 45.1 | % |
|
|
|
|
|
|
|
|
|
Occupancy expense remained unchanged at $8.6 million in both 2014 and 2013.
Professional service fees increased $1.4 million, or 20.6 percent, to $8.2 million in 2014 from $6.8 million in 2013. Professional fees included approximately $0.8 million of Merger related legal and advisory fees that were incurred in 2014.
Equipment expense remained unchanged at $4.1 million in both 2014 and 2013.
Business development expense increased $0.9 million, or 40.9 percent, to $3.1 million in 2014 from $2.2 million in 2013. The increase in 2014 resulted from expanded marketing and business development programs that were launched in 2014.
The FDIC assessment decreased $1.6 million, or 41.0 percent, to $2.3 million in 2014 from $3.9 million in 2013. The decrease in 2014 was reflective of changes in the Bank’s premium calculation base and assessment rate.
Other operating expenses, as reflected in the following table, increased 12.8 percent in 2014 compared to 2013:
|
| 2014 |
|
| 2013 |
| ||
|
| (Dollars in thousands) |
| |||||
Other Operating Expenses: |
|
|
|
|
|
|
|
|
Stationary & printing |
| $ | 1,027 |
|
| $ | 739 |
|
Communications expense |
|
| 721 |
|
|
| 672 |
|
Courier expense |
|
| 773 |
|
|
| 850 |
|
Other loan expense |
|
| 1,549 |
|
|
| 1,097 |
|
Outside services |
|
| 5,390 |
|
|
| 4,628 |
|
Dues, meetings, and seminars |
|
| 408 |
|
|
| 298 |
|
Other |
|
| 2,172 |
|
|
| 2,389 |
|
Total |
| $ | 12,040 |
|
| $ | 10,673 |
|
|
|
|
|
|
|
|
|
|
Percent of total non-interest expense |
|
| 13.0 | % |
|
| 10.7 | % |
|
|
|
|
|
|
|
|
|
38
The increase in other operating expenses is primarily due to an increase in expenses related to loans, new technology and products, partially offset by efficiencies resulting from the branch closures in 2013. The increase in loan expense is due to an increase in Bank paid appraisals, collection fees, and premiums paid for force-placed insurance.
Income Taxes
Income tax expense (benefit) of $4.0 million and ($4.6) million were recorded in 2014 and 2013, respectively. The Company is currently subject to a statutory Federal tax rate of 35 percent, a New York State tax rate of 7.1 percent plus a 17 percent surcharge, and a New York City tax rate of approximately 9 percent. Prior to the consolidation/closure of the Connecticut branches, we were also subject to a Connecticut State tax rate of 7.5 percent.
Effective January 1, 2015, the Company’s Bank subsidiary became subject to Article 9(A) for New York State income taxes. The effects of the tax law change resulted in $0.8 million in tax expense due to the transition to Article 9(A) in 2014.
In the normal course of business, the Company’s Federal, New York State and New York City Corporation Tax returns are subject to examination. The Company is currently open to examination by the Internal Revenue Service for years after 2011. The Company is currently undergoing a routine examination by New York State for years 2009 through 2012. This examination has not yet been completed and no significant issues have yet been raised. The Company does not expect any material adjustments as a result of this examination, however, until the examination is completed, the Company cannot predict the final outcome.
Financial Condition at December 31, 2014 and 2013
Cash and Due from Banks
Cash and cash equivalents was $292.9 million at December 31, 2014, a decrease of $406.5 million or 58.1 percent from $699.4 million at December 31, 2013. Included in cash and cash equivalents is interest earning deposits of $259.7 million at December 31, 2014 and $661.6 million at December 31, 2013. The decrease was a result of loan originations and securities purchases during the year.
Federal Funds Sold
Federal funds sold totaled $13.7 million at December 31, 2014, a decrease of $13.4 million or 49.4 percent from $27.1 million at December 31, 2013. The decrease resulted from timing differences in the redeployment of available funds into loans and longer term investments and volatility in certain deposit types and relationships.
Securities Portfolio
Securities are selected to provide safety of principal, liquidity, pledging capabilities (to collateralize certain deposits and borrowings), income and to leverage capital. The Company’s investment strategy focuses on maximizing income while providing for safety of principal, maintaining appropriate utilization of capital, providing adequate liquidity to meet loan demand or deposit outflows and to manage overall interest rate risk. The Company selects individual securities whose credit, cash flow, maturity and interest rate characteristics, in the aggregate, affect the stated strategies.
Securities are classified as either available for sale, representing securities the Company may sell in the ordinary course of business, or as held to maturity, representing securities the Company has the ability and positive intent to hold until maturity. Securities available for sale are reported at fair value with unrealized gains and losses (net of tax) excluded from operations and reported in other comprehensive income. Securities held to maturity are stated at amortized cost.
39
The following table sets forth the amortized cost and estimated fair value of securities classified as available for sale and held to maturity at December 31:
| 2014 |
|
| 2013 |
| ||||||||||
| Amortized |
|
| Estimated |
|
| Amortized |
|
| Estimated |
| ||||
| Cost |
|
| Fair Value |
|
| Cost |
|
| Fair Value |
| ||||
| (In thousands) |
| |||||||||||||
Classified as Available for Sale |
|
|
|
|
|
|
|
|
|
|
|
|
|
|
|
U.S. Treasury and government agencies | $ | 120,545 |
|
| $ | 120,422 |
|
| $ | 94,427 |
|
| $ | 93,692 |
|
Mortgage-backed securities - residential |
| 583,031 |
|
|
| 582,459 |
|
|
| 349,216 |
|
|
| 339,695 |
|
Obligations of states and political subdivisions |
| 100,830 |
|
|
| 101,454 |
|
|
| 87,884 |
|
|
| 89,304 |
|
Other debt securities |
| 969 |
|
|
| 970 |
|
|
| 9,529 |
|
|
| 9,529 |
|
Total debt securities |
| 805,375 |
|
|
| 805,305 |
|
|
| 541,056 |
|
|
| 532,220 |
|
Mutual funds and other equity securities |
| 9,702 |
|
|
| 10,411 |
|
|
| 9,729 |
|
|
| 9,978 |
|
Total | $ | 815,077 |
|
| $ | 815,716 |
|
| $ | 550,785 |
|
| $ | 542,198 |
|
|
|
|
|
|
|
|
|
|
|
|
|
|
|
|
|
|
|
|
|
|
|
|
|
|
|
|
|
|
|
|
|
Classified as Held To Maturity |
|
|
|
|
|
|
|
|
|
|
|
|
|
|
|
Mortgage-backed securities - residential | $ | 2,301 |
|
| $ | 2,520 |
|
| $ | 3,133 |
|
| $ | 3,382 |
|
Obligations of states and political subdivisions |
| 1,857 |
|
|
| 1,884 |
|
|
| 3,105 |
|
|
| 3,174 |
|
Total | $ | 4,158 |
|
| $ | 4,404 |
|
| $ | 6,238 |
|
| $ | 6,556 |
|
|
|
|
|
|
|
|
|
|
|
|
|
|
|
|
|
The available for sale portfolio totaled $815.7 million at December 31, 2014 which was an increase of $273.5 million or 50.4 percent from $542.2 million at December 31, 2013. The increase resulted from a $26.7 million increase in U.S. Treasury and agency securities, a $242.8 million increase in mortgage-backed securities, a $12.2 million increase in obligations of states and political subdivisions, and a $0.4 million increase in other equity securities, partially offset by a $8.6 million decrease in other debt securities. The increase in U.S. Treasury and agency securities was due to purchases of $49.2 million, partially offset by maturities, calls and other changes of $22.5 million. The increase in mortgage-backed securities was due to purchases of $335.4 million, partially offset by principal paydowns and other changes of $92.6 million. The increase in obligations of states and political subdivisions was due to purchases of $41.5 million, partially offset by sales of $1.7 million, and maturities, calls, and other changes of $27.6 million. The increase in other equity securities was due to purchases of $0.4 million. The decrease in other debt securities was due to sales of $8.8 million, partially offset by other changes of $0.2 million.
Included in other debt securities at December 31, 2013 were investments in five pooled trust preferred securities. The value of these investments had been severely negatively affected by the economic downturn of recent years and the resulting investor concerns about recent and future losses in the financial services industry. In December 2013, a joint federal bank regulatory agency statement was issued noting that they were reviewing certain provisions of the Dodd-Frank Act and other related regulations regarding whether it should be permissible for Banks to continue to hold investments in collateralized debt obligations, including trust preferred securities. As a result of the joint statement, liquidity in the market for pooled trust preferred securities improved greatly as holders evaluated their positions in light of a potential regulatory mandate to divest. The Company sought and reviewed offers for its holdings and, based on the significant improvement in the market and the uncertainty of being able to hold these investments to maturity, decided to sell the entire portfolio in early January 2014, prior to the federal agencies’ interim final rule, for $8.8 million. Due to this change in intent, the remaining $1.2 million difference between the amortized cost and fair value at December 31, 2013 was recognized as other-than-temporary impairment through earnings with no additional gain or loss realized upon completion of the sale in January 2014.
The held to maturity portfolio totaled $4.2 million at December 31, 2014, which was a decrease of $2.0 million or 32.3 percent from $6.2 million at December 31, 2013. The decrease was due to principal paydowns of $0.8 million in mortgage-backed securities and maturities and calls of $1.2 million in obligations of states and political subdivisions.
Subsequent to December 31, 2014, the Company sold approximately $0.4 million of equity securities realizing a net gain of less than $0.1 million.
The following table presents the amortized cost of securities at December 31, 2014, distributed based on contractual maturity or earlier call date, for securities expected to be called, and weighted average yields computed on a tax equivalent basis. Mortgage-backed securities which may have principal prepayments are distributed to a maturity category based on estimated average lives. During 2014, prepayments of mortgage-backed securities increased significantly. As a result, the yield was adversely affected by the accelerated premium amortization. Actual maturities will differ from contractual maturities because issuers may have the right to call or prepay obligations with or without call or prepayment penalties.
40
|
|
|
|
|
|
|
|
|
| After 1 Year but |
|
| After 5 Years but |
|
|
|
|
|
|
|
|
|
|
|
|
|
|
|
|
| ||||||||||
|
| Within 1 Year |
|
| Within 5 Years |
|
| Within 10 Years |
|
| After 10 Years |
|
| Total |
| |||||||||||||||||||||||||
|
| Amount |
|
| Yield |
|
| Amount |
|
| Yield |
|
| Amount |
|
| Yield |
|
| Amount |
|
| Yield |
|
| Amount |
|
| Yield |
| ||||||||||
|
| (Dollars in thousands) |
| |||||||||||||||||||||||||||||||||||||
U.S. Treasury and government agencies |
| $ | 25,518 |
|
|
| 0.41 | % |
| $ | 91,907 |
|
|
| 1.24 | % |
| $ | 3,120 |
|
|
| 2.40 | % |
|
| — |
|
|
| — |
|
| $ | 120,545 |
|
|
| 1.09 | % |
Mortgage-backed securities - residential |
|
| 22,136 |
|
|
| 2.36 | % |
|
| 560,702 |
|
|
| 1.90 | % |
|
| 2,298 |
|
|
| 2.18 | % |
| $ | 196 |
|
|
| 3.51 | % |
|
| 585,332 |
|
|
| 1.92 | % |
Obligations of states and political subdivisions |
|
| 25,472 |
|
|
| 3.55 | % |
|
| 59,894 |
|
|
| 3.16 | % |
|
| 17,321 |
|
|
| 3.08 | % |
|
| — |
|
|
| — |
|
|
| 102,687 |
|
|
| 3.24 | % |
Other debt securities |
|
| 170 |
|
|
| 2.11 | % |
|
| 799 |
|
|
| 2.58 | % |
|
| — |
|
|
| — |
|
|
| — |
|
|
| — |
|
|
| 969 |
|
|
| 2.50 | % |
Total |
| $ | 73,296 |
|
|
| 2.09 | % |
| $ | 713,302 |
|
|
| 1.92 | % |
| $ | 22,739 |
|
|
| 2.90 | % |
| $ | 196 |
|
|
| 3.51 | % |
| $ | 809,533 |
|
|
| 1.96 | % |
|
|
|
|
|
|
|
|
|
|
|
|
|
|
|
|
|
|
|
|
|
|
|
|
|
|
|
|
|
|
|
|
|
|
|
|
|
|
|
|
|
Estimated fair value |
| $ | 73,318 |
|
|
|
|
|
| $ | 713,515 |
|
|
|
|
|
| $ | 22,680 |
|
|
|
|
|
| $ | 196 |
|
|
|
|
|
| $ | 809,709 |
|
|
|
|
|
|
|
|
|
|
|
|
|
|
|
|
|
|
|
|
|
|
|
|
|
|
|
|
|
|
|
|
|
|
|
|
|
|
|
|
|
|
|
|
|
|
The Bank, as a member of the FHLB, invests in stock of the FHLB as a prerequisite to obtaining funding under various programs offered by the FHLB. The Bank must purchase additional shares of FHLB stock to obtain increases in such borrowings. Shares in excess of required amounts for outstanding borrowings are generally redeemed by the FHLB. The investment in FHLB stock totaled $2.4 million at December 31, 2014 and $3.5 million at December 31, 2013.
The Company continues to exercise a conservative approach to investing by purchasing high credit quality investments with various maturities and cash flows to provide for liquidity needs and prudent asset liability management. The Company’s securities portfolio provides for a significant source of income, liquidity and is utilized in managing Company-wide interest rate risk. These securities are used to collateralize borrowings and deposits to the extent required or permitted by law. Therefore, the securities portfolio is an integral part of the Company’s funding strategy.
There were no obligations of any single issuer which exceeded ten percent of stockholders’ equity at December 31, 2014 or December 31, 2013.
Loan Portfolio
Real Estate Loans: We make five types of real estate loans: construction, commercial, multi-family, residential first liens, and residential second liens. In addition, we extend home equity lines of credit (“HELOC”) to our borrowers. For purposes of this discussion residential second liens and HELOCs are considered as one type. The Company originates these loans primarily for its portfolio, although a portion of its residential real estate loans, in addition to meeting the Company’s underwriting criteria, comply with nationally recognized underwriting criteria (“conforming loans”) and can be sold in the secondary market.
Construction Loans: Construction loans are short-term loans (generally up to 18 months) secured by land for both residential and commercial development. The loans are generally made for acquisition and improvements. Funds are disbursed as phases of construction are completed. The majority of these loans are made with variable rates of interest, although some fixed rate financing is provided. The loan amount is generally limited to 55% to 70% of completed value, depending on the type of property. Most non-residential construction loans require pre-approved permanent financing or pre-leasing by the Company or another bank providing the permanent financing.
The Company funds construction of single family homes and commercial real estate, when no contract of sale exists, based upon the experience of the builder, the financial strength of the owner, the type and location of the property and other factors. Construction loans are generally personally guaranteed by the principal(s). Repayment of such loans may be negatively impacted by the builders’ inability to complete construction, by a downturn in the new construction market, by a significant increase in interest rates or by a decline in general economic conditions.
Commercial Real Estate Loans: Commercial real estate loans are offered by the Company on a fixed or variable rate basis generally with up to 10 year terms. Amortizations range up to 30 years. The Company also originates 15 year fixed rate self-amortizing commercial mortgages.
In underwriting commercial real estate loans, the Company evaluates both the prospective borrower’s ability to make timely payments on the loan and the value of the property securing the loan. The Company generally utilizes licensed or certified appraisers, previously approved by the Company, to determine the estimated value of the property. Commercial mortgages are generally underwritten for up to 75% of the value of the property depending on the type of the property. The Company generally requires lease assignments where applicable. Repayment of such loans may be negatively impacted should the borrower default or should there be a substantial decline in the value of the property securing the loan, or a decline in general economic conditions.
41
Where the owner occupies the property, the Company also evaluates the business’s ability to repay the loan on a timely basis. In addition, the Company may require personal guarantees, lease assignments and/or the guarantee of the operating company when the property is owner occupied. These types of loans may involve greater risks than other types of lending, because payments on such loans are often dependent upon the successful operation of the business involved, therefore, repayment of such loans may be negatively impacted by adverse changes in economic conditions affecting the borrowers’ business.
Multi-Family Loans: The Company offers multi-family loans up to $7,500,000 per transaction and $15,000,000 per borrower. These loans are available for 7 or 10 year terms with one 5 year extension option. A 7 year term with no extension option is also offered. Pricing is typically based on a spread over the corresponding FHLB rate. Amortization of up to 30 years, a maximum loan to value ratio of 75% and a debt service coverage ratio of 1.2 to 1 are generally required. The Bank’s primary regulator considers multi-family residential loans to be part of commercial real estate for concentration risk measurement purposes.
Residential Real Estate First Liens: First lien loans secured by 1 to 4 family residential real estate properties are offered by the Company. The first mortgage loans are either fixed or adjustable rate loans for terms up to 30 years. All first lien loans are fully amortizing. Repayment of such loans may be negatively impacted should the borrower default, should there be a significant decline in the value of the property securing the loan or should there be a decline in general economic conditions.
The Company does not intend to offer residential real estate loans that do not conform to the “qualified mortgage” rules promulgated by Dodd-Frank.
Residential Second Liens: The Company offers a variety of second lien loans and home equity line of credit products. These products include loans on primary residences, credit lines on primary residences, vacation homes and 1-4 unit residential investment properties. A low cost option is available to qualified borrowers who intend to actively utilize the lines. Depending on the product, loan amounts of $50,000 to $2,000,000 are available for terms ranging from 5 years to 25 years with various repayment terms. Required combined maximum loan to value ratios range from 60% to 70%, and the lines generally carry adjustable rates with the Prime Rate (as published in the Wall Street Journal) as the index, subject to certain interest rate floors.
The Company does not originate or purchase loans similar to payment option loans or loans that allow for negative interest amortization. The Company does not engage in sub-prime lending nor does it offer loans with low “teaser” rates or high loan-to-value ratios to sub-prime borrowers.
Commercial and Industrial Loans: The Company’s commercial and industrial loan portfolio consists primarily of commercial business loans, lines of credit to businesses and professionals, asset-based lending, and lease financing.
The commercial business loans and lines are usually made to finance the purchase of inventory, equipment or other short or long-term working capital purposes. These loans are generally secured by corporate assets, often with real estate as secondary collateral, but are also offered on an unsecured basis. These loans generally have variable rates of interest. Commercial loans, for the purpose of purchasing equipment and/or inventory, are usually written for terms of 1 to 5 years with, exceptionally, longer terms. In granting this type of loan, the Company primarily looks to the borrower’s cash flow as the source of repayment with collateral and personal guarantees, where obtained, as a secondary source. The Company generally requires a debt service coverage ratio of at least 125%.
Asset-Based Lending: In late 2013, the Company initiated an asset-based lending (“ABL”) program which offers credit facilities in the form of credit lines and/or term loans to manufacturers, wholesalers, distributors, service providers and retailers. ABL refers to loans secured by a variety of assets usually comprised of accounts receivable, inventory, machinery and equipment and, at times, real estate. The collateral is considered the primary source of repayment and the operation of the business is the secondary source. The Company typically will advance 80-85% against eligible receivables; 50-60% of cost or 85% of appraised net recovery value of inventory; 60% of appraised value or 70-80% of liquidation value of machinery & equipment and 60% of appraised value of real estate. Ongoing collateral management and other monitoring on the part of the lender are essential to the success this type of program. Generally, asset-based lending transactions are variable rate loans with maturities generally from 3 to 5 years.
Lease Financing: The Company originates lease financing transactions which are primarily conducted with businesses, professionals and not-for-profit organizations. In late March 2014, the Company initiated an equipment leasing program with a focus on financing income producing equipment in the manufacturing, healthcare, technology and transportation segments. Payments on such loans are often dependent upon the successful operation of the underlying business involved and, therefore, repayment of such loans may be negatively impacted by adverse changes in economic conditions, and management’s inability to effectively manage the business or loss of market for the borrower’s products or services.
42
Commercial and industrial loans are often larger and may involve greater risks than other types of loans offered by the Company. Payments on such loans are often dependent upon the successful operation of the underlying business involved and, therefore, repayment of such loans may be negatively impacted by adverse changes in economic conditions, management’s inability to effectively manage the business, claims of others against the borrower’s assets which may take priority over the Company’s claims against assets, death or disability of the borrower or loss of market for the borrower’s products or services.
Loans to Individuals: The Company offers installment loans and reserve lines of credit to individuals. Installment loans are limited to $50,000 and lines of credit are generally limited to $5,000. These loans have terms up to 5 years with fixed or variable rates of interest. The rate of interest is dependent on the term of the loan and the type of collateral. The Company does not place an emphasis on originating these types of loans.
Major classifications of loans at December 31 were as follows:
|
| 2014 |
|
| 2013 |
|
| 2012 |
|
| 2011 |
|
| 2010 |
| |||||
|
| (In thousands) |
| |||||||||||||||||
Real estate: |
|
|
|
|
|
|
|
|
|
|
|
|
|
|
|
|
|
|
|
|
Commercial |
| $ | 617,299 |
|
| $ | 593,476 |
|
| $ | 550,786 |
|
| $ | 690,837 |
|
| $ | 796,253 |
|
Construction |
|
| 101,802 |
|
|
| 88,311 |
|
|
| 74,727 |
|
|
| 110,027 |
|
|
| 174,369 |
|
Residential multi-family |
|
| 326,416 |
|
|
| 226,898 |
|
|
| 196,199 |
|
|
| 227,595 |
|
|
| 152,295 |
|
Residential other |
|
| 394,820 |
|
|
| 432,999 |
|
|
| 325,774 |
|
|
| 287,233 |
|
|
| 315,031 |
|
Commercial & industrial |
|
| 448,628 |
|
|
| 258,578 |
|
|
| 288,809 |
|
|
| 218,500 |
|
|
| 245,263 |
|
Other |
|
| 13,497 |
|
|
| 17,388 |
|
|
| 21,725 |
|
|
| 29,222 |
|
|
| 33,257 |
|
Lease financing |
|
| 24,942 |
|
|
| 13,140 |
|
|
| 11,763 |
|
|
| 12,538 |
|
|
| 15,783 |
|
Total loans |
|
| 1,927,404 |
|
|
| 1,630,790 |
|
|
| 1,469,783 |
|
|
| 1,575,952 |
|
|
| 1,732,251 |
|
Deferred loan costs (fees), net |
|
| 752 |
|
|
| 1,379 |
|
|
| (2,411 | ) |
|
| (3,862 | ) |
|
| (4,115 | ) |
Allowance for loan losses |
|
| (27,342 | ) |
|
| (25,990 | ) |
|
| (26,612 | ) |
|
| (30,685 | ) |
|
| (38,949 | ) |
Loans, net |
| $ | 1,900,814 |
|
| $ | 1,606,179 |
|
| $ | 1,440,760 |
|
| $ | 1,541,405 |
|
| $ | 1,689,187 |
|
|
|
|
|
|
|
|
|
|
|
|
|
|
|
|
|
|
|
|
|
|
Gross loans increased $296.6 million, or 18.2 percent, to $1,927.4 million at December 31, 2014 from $1,630.8 million at December 31, 2013, which increased $161.0 million or 11.0 percent from $1,469.8 million at December 31, 2012. The changes in gross loans resulted primarily from:
● | Increases of $23.8 million and $42.7 million in 2014 and 2013, respectively, in commercial real estate mortgages. The increases resulted primarily from higher volume of originations. |
● | Increases of $13.5 million and $13.6 million in 2014 and 2013, respectively, in construction loans. The increases resulted primarily from higher volume of originations. |
● | Increases of $99.5 million and $30.7 million in 2014 and 2013, respectively, in multi-family loans. The increases resulted primarily from higher volume of originations. |
● | Decrease of $38.2 million and increase of $107.2 million in 2014 and 2013, respectively, in residential real estate mortgages. The decrease in 2014 resulted primarily from payoffs, paydowns, and charge-offs. The increase in 2013 resulted primarily from the purchase of $142.9 million of fixed and adjustable rate 1-4 family residential loans, partially offset by payoffs, paydowns, and charge-offs. |
● | Increase of $190.1 million and decrease of $30.2 million in 2014 and 2013, respectively, in commercial and industrial loans. The increase in 2014 resulted primarily from increased originations as the Company emphasized this loan type to diversify the loan portfolio. The decrease in 2013 was due to payoffs, paydowns, and charge-offs. |
● | Decreases of $3.9 million and $4.3 million in 2014 and 2013, respectively, in other loans; and |
● | Increases of $11.8 million and $1.4 million in 2014 and 2013, respectively, in lease financings due to the volume generated by HVB Equipment Capital, LLC in 2014. |
Loans are made at both fixed rates of interest and variable or floating rates of interest, generally based upon the Prime Rate as published in the Wall Street Journal. At December 31, 2014, the Company had total gross loans with fixed rates of interest of $1,382.6 million, or 71.7 percent of total loans, and total gross loans with variable or floating rates of interest of $544.8 million, or 28.3 percent of total loans, as compared to $1,067.6 million or 65.5 percent of total loans in fixed rate loans and $563.1 million or 34.5 percent of total loans in variable or floating rate loans at December 31, 2013.
Average net loans increased $258.8 million, or 17.7 percent, to $1,722.9 million in 2014 from $1,464.1 million in 2013, which decreased $172.0 million or 10.5 percent from $1,636.1 million in 2012.
43
At December 31, 2014 and 2013, the Company had approximately $267.6 million and $237.3 million, respectively, of committed but unissued lines of credit, commercial mortgages, construction loans and commercial and industrial loans.
The following table presents the maturities of loans outstanding at December 31, 2014 excluding loans to individuals, real estate mortgages (other than construction loans) and lease financings, and the amount of such loans by maturity date that have pre-determined interest rates and the amounts that have floating or adjustable rates:
|
|
|
|
|
| After 1 Year |
|
|
|
|
|
|
|
|
|
|
|
|
| |
|
| Within |
|
| but Within |
|
| After 5 |
|
|
|
|
|
|
|
|
| |||
|
| 1 Year |
|
| 5 Years |
|
| Years |
|
| Total |
|
| Percent |
| |||||
|
| (Dollars in thousands) |
| |||||||||||||||||
Loans: |
|
|
|
|
|
|
|
|
|
|
|
|
|
|
|
|
|
|
|
|
Real estate - commercial |
| $ | 70,325 |
|
| $ | 295,962 |
|
| $ | 251,012 |
|
| $ | 617,299 |
|
|
| 52.9 | % |
Real estate - construction |
|
| 59,675 |
|
|
| 41,727 |
|
|
| 400 |
|
|
| 101,802 |
|
|
| 8.7 | % |
Commercial & industrial |
|
| 102,066 |
|
|
| 240,597 |
|
|
| 105,965 |
|
|
| 448,628 |
|
|
| 38.4 | % |
Total |
| $ | 232,066 |
|
| $ | 578,286 |
|
| $ | 357,377 |
|
| $ | 1,167,729 |
|
|
| 100.0 | % |
|
|
|
|
|
|
|
|
|
|
|
|
|
|
|
|
|
|
|
|
|
|
|
|
|
|
|
|
|
|
|
|
|
|
|
|
|
|
|
|
|
|
Rate sensitivity: |
|
|
|
|
|
|
|
|
|
|
|
|
|
|
|
|
|
|
|
|
Fixed or predetermined interest rates |
| $ | 64,047 |
|
| $ | 385,540 |
|
| $ | 334,885 |
|
| $ | 784,472 |
|
|
| 67.2 | % |
Floating or adjustable interest rates |
|
| 168,019 |
|
|
| 192,746 |
|
|
| 22,492 |
|
|
| 383,257 |
|
|
| 32.8 | % |
Total |
| $ | 232,066 |
|
| $ | 578,286 |
|
| $ | 357,377 |
|
| $ | 1,167,729 |
|
|
| 100.0 | % |
|
|
|
|
|
|
|
|
|
|
|
|
|
|
|
|
|
|
|
|
|
Percent |
|
| 19.9 | % |
|
| 49.5 | % |
|
| 30.6 | % |
|
| 100.0 | % |
|
|
|
|
|
|
|
|
|
|
|
|
|
|
|
|
|
|
|
|
|
|
|
|
|
It is the Company’s policy to discontinue the accrual of interest on loans when, in the opinion of management, a reasonable doubt exists as to the timely collectability of the amounts due. Regulatory requirements generally prohibit the accrual of interest on certain loans when principal or interest is due and remains unpaid for 90 days or more, unless the loan is both well secured and in the process of collection.
The following table summarizes the Company’s non-accrual loans, loans past due 90 days or more, nonperforming loans held for sale, Other Real Estate Owned (“OREO”) and related interest income not recorded on non-accrual loans as of and for the years ended December 31:
| 2014 |
|
| 2013 |
|
| 2012 |
|
| 2011 |
|
| 2010 |
| |||||
| (In thousands) |
| |||||||||||||||||
Loans past due 90 days or more and still accruing |
| — |
|
|
| — |
|
|
| — |
|
|
| — |
|
| $ | 1,625 |
|
Non-accrual loans at period end | $ | 22,384 |
|
| $ | 23,489 |
|
| $ | 34,808 |
|
| $ | 29,892 |
|
|
| 43,684 |
|
Other real estate owned |
| — |
|
|
| — |
|
|
| 250 |
|
|
| 1,174 |
|
|
| 11,028 |
|
Nonperforming loans held for sale |
| — |
|
|
| — |
|
|
| — |
|
|
| 27,848 |
|
|
| 7,811 |
|
Additional interest income that would have been recorded if these borrowers had complied with contractual terms |
| 1,124 |
|
|
| 805 |
|
|
| 1,401 |
|
|
| 3,216 |
|
|
| 4,346 |
|
There was no interest income on non-accrual loans included in net income for the years ended December 31, 2014, 2013, 2012, 2011, and 2010, respectively.
44
The following table is a summary of nonperforming assets as of December 31:
| 2014 |
|
| 2013 |
|
| 2012 |
|
| 2011 |
|
| 2010 |
| |||||
| (Dollars in thousands) |
| |||||||||||||||||
Loans past due 90 days or more and still accruing: |
|
|
|
|
|
|
|
|
|
|
|
|
|
|
|
|
|
|
|
Real estate: |
|
|
|
|
|
|
|
|
|
|
|
|
|
|
|
|
|
|
|
Commercial |
| — |
|
|
| — |
|
|
| — |
|
|
| — |
|
| $ | 292 |
|
Construction |
| — |
|
|
| — |
|
|
| — |
|
|
| — |
|
|
| 1,323 |
|
Total real estate |
| — |
|
|
| — |
|
|
| — |
|
|
| — |
|
|
| 1,615 |
|
Commercial & industrial |
| — |
|
|
| — |
|
|
| — |
|
|
| — |
|
|
| 10 |
|
Total loans past due 90 days or more and still accruing |
| — |
|
|
| — |
|
|
| — |
|
|
| — |
|
|
| 1,625 |
|
Non-accrual loans: |
|
|
|
|
|
|
|
|
|
|
|
|
|
|
|
|
|
|
|
Real estate: |
|
|
|
|
|
|
|
|
|
|
|
|
|
|
|
|
|
|
|
Commercial | $ | 13,781 |
|
| $ | 6,629 |
|
| $ | 18,387 |
|
| $ | 13,212 |
|
|
| 15,295 |
|
Construction |
| 879 |
|
|
| 879 |
|
|
| 4,720 |
|
|
| 5,481 |
|
|
| 15,689 |
|
Residential |
| 7,474 |
|
|
| 14,559 |
|
|
| 9,682 |
|
|
| 3,396 |
|
|
| 7,744 |
|
Total real estate |
| 22,134 |
|
|
| 22,067 |
|
|
| 32,789 |
|
|
| 22,089 |
|
|
| 38,728 |
|
Commercial & industrial |
| 250 |
|
|
| 1,422 |
|
|
| 2,019 |
|
|
| 7,803 |
|
|
| 4,563 |
|
Lease financing & other |
| — |
|
|
| — |
|
|
| — |
|
|
| — |
|
|
| 393 |
|
Total non-accrual loans |
| 22,384 |
|
|
| 23,489 |
|
|
| 34,808 |
|
|
| 29,892 |
|
|
| 43,684 |
|
Other real estate owned |
| — |
|
|
| — |
|
|
| 250 |
|
|
| 1,174 |
|
|
| 11,028 |
|
Nonperforming assets excluding loans held for sale |
| 22,384 |
|
|
| 23,489 |
|
|
| 35,058 |
|
|
| 31,066 |
|
|
| 56,337 |
|
Nonperforming loans held for sale |
| — |
|
|
| — |
|
|
| — |
|
|
| 27,848 |
|
|
| 7,811 |
|
Total nonperforming assets including loans held for sale | $ | 22,384 |
|
| $ | 23,489 |
|
| $ | 35,058 |
|
| $ | 58,914 |
|
| $ | 64,148 |
|
|
|
|
|
|
|
|
|
|
|
|
|
|
|
|
|
|
|
|
|
Net charge-offs during year | $ | 440 |
|
| $ | 3,098 |
|
| $ | 12,580 |
|
| $ | 72,418 |
|
| $ | 46,223 |
|
Nonperforming assets to total assets |
| 0.71 | % |
|
| 0.78 | % |
|
| 1.21 | % |
|
| 2.11 | % |
|
| 2.40 | % |
Non-accrual commercial real estate loans increased to $13.8 million in 2014 compared to $6.6 million in 2013 due to the addition of five loans totaling $10.4 million, partially offset by the charge-off of three loans totaling $0.7 million, principal payments of $1.9 million, and the transfer of one loan totaling $0.6 million to performing status. The 2013 decrease in non-accrual commercial real estate loans compared to 2012 resulted from the charge-off of four loans totaling $0.9 million, principal payments of $14.4 million, and the transfer of one loan totaling $0.3 million from nonperforming TDRs, partially offset by the addition of four loans totaling $3.2 million and the transfer of two loans totaling $0.6 million to non-accrual.
Non-accrual construction loans were $0.9 million at both December 31, 2014 and 2013. The 2013 decrease in non-accrual construction loans compared to 2012 resulted from the charge-off of two loans totaling $0.8 million, principal payments of $1.5 million, and the transfer of one loan totaling $1.5 million from nonperforming TDRs.
Nonaccrual residential real estate loans decreased in 2014 compared to 2013 due to the charge-off of eight loans totaling $1.5 million and principal payments of $10.8 million, partially offset by addition of fifteen loans totaling $5.2 million. The 2013 increase in nonaccrual residential loans compared to 2012 was due to the addition of two loans totaling $1.0 million and the transfer of two loans totaling $5.7 million, partially offset by the charge-off of one loan totaling $0.5 million and principal payments of $1.3 million.
Non-accrual commercial and industrial loans decreased in 2014 compared to 2013 due to the charge-off of three loans totaling $0.3 million and principal payments of $1.4 million, partially offset by the addition of three loans totaling $0.6 million. The 2013 decrease in non-accrual commercial and industrial loans compared to 2012 resulted from payments of $0.9 million and the transfer of one loan totaling $0.3 million from nonperforming TDRs, partially offset by the addition of one loan totaling $0.6 million.
There were no non-accrual loans to individuals at December 31, 2014 and 2013.
There were no loans past due 90 days or more and still accruing at December 31, 2014 and 2013. In addition, $7.9 million and $4.6 million of accruing loans were 31-89 days delinquent at December 31, 2014 and 2013, respectively.
There was no other real estate owned at December 31, 2014 and 2013. Other real estate owned totaled $0.3 million at December 31, 2012. The 2013 decrease compared to 2012 was due to the sale of one property totaling $0.3 million.
45
At December 31, 2014, the Company had a commitment to lend $0.8 million to a customer with a restructured loan balance. Non-accrual loans decreased $1.1 million to $22.4 million at December 31, 2014, compared to $23.5 million at December 31, 2013. Net income is adversely impacted by the level of non-accrual loans and other nonperforming assets caused by the deterioration of the borrowers’ ability to meet scheduled interest and principal payments. In addition to forgone revenue, the Company must increase the level of provision for loan losses, incur higher collection costs and other costs associated with the management and disposition of foreclosed properties.
Impaired loans totaling $42.4 million and $41.1 million at December 31, 2014 and 2013, respectively, have been measured based on the estimated fair value. At December 31, 2014, and 2013, there was no allowance for loan losses allocated to impaired loans. The average recorded investment in impaired loans for the years ended December 31, 2014 and 2013 was approximately $42.8 million and $53.0 million, respectively. Loans which have been renegotiated with a borrower experiencing financial difficulties for which the terms of the loan have been modified with a concession that the Company would not otherwise have granted are considered to be TDRs and are included in impaired loans. Impaired loans as of December 31, 2014 and 2013 included $25.8 million and $30.9 million, respectively, of loans considered to be TDRs. At December 31, 2014, fifteen TDRs with a carrying amount of $20.1 million were on accrual status and performing in accordance with their modified terms as compared to ten TDRs with a carrying amount of $17.6 million at December 31, 2013. All other TDRs as of December 31, 2014 and 2013, were on non-accrual status. Other pertinent data related to the Company’s loan portfolio are contained in Note 4 to the Company’s consolidated financial statements presented in this Form 10-K.
Allowance for Loan Losses: The Company maintains an allowance for loan losses to absorb inherent probable losses in the loan portfolio. The Company calculates the allowance for loan losses on a quarterly basis applying and documenting a systematic methodology. The Company’s methodology for assessing the appropriateness of the allowance consists of a specific component for identified problem loans, and a formula component which addresses historical loan loss experience together with other relevant risk factors affecting the portfolio.
A summary of the components of the allowance for loan losses, changes in the components and the impact of charge-offs/recoveries on the resulting provision for loan losses for the years ended December 31 is as follows:
|
|
|
|
|
| Change |
|
|
|
|
|
| Change |
|
|
|
|
|
| Change |
|
|
|
|
|
| Change |
|
|
|
|
|
| Change |
|
|
|
|
| |||||
|
|
|
|
|
| During |
|
|
|
|
|
| During |
|
|
|
|
|
| During |
|
|
|
|
|
| During |
|
|
|
|
|
| During |
|
|
|
|
| |||||
|
| 2014 |
|
| 2014 |
|
| 2013 |
|
| 2013 |
|
| 2012 |
|
| 2012 |
|
| 2011 |
|
| 2011 |
|
| 2010 |
|
| 2010 |
|
| 2009 |
| |||||||||||
|
| (Dollars in thousands) |
| |||||||||||||||||||||||||||||||||||||||||
Components |
|
|
|
|
|
|
|
|
|
|
|
|
|
|
|
|
|
|
|
|
|
|
|
|
|
|
|
|
|
|
|
|
|
|
|
|
|
|
|
|
|
|
|
|
Specific: |
|
|
|
|
|
|
|
|
|
|
|
|
|
|
|
|
|
|
|
|
|
|
|
|
|
|
|
|
|
|
|
|
|
|
|
|
|
|
|
|
|
|
|
|
Real estate: |
|
|
|
|
|
|
|
|
|
|
|
|
|
|
|
|
|
|
|
|
|
|
|
|
|
|
|
|
|
|
|
|
|
|
|
|
|
|
|
|
|
|
|
|
Commercial |
|
| — |
|
|
| — |
|
|
| — |
|
|
| — |
|
|
| — |
|
|
| — |
|
|
| — |
|
|
| — |
|
|
| — |
|
|
| — |
|
|
| — |
|
Construction |
|
| — |
|
|
| — |
|
|
| — |
|
|
| — |
|
|
| — |
|
| $ | (2,374 | ) |
| $ | 2,374 |
|
| $ | 1,524 |
|
| $ | 850 |
|
| $ | 725 |
|
| $ | 125 |
|
Residential |
|
| — |
|
|
| — |
|
|
| — |
|
|
| — |
|
|
| — |
|
|
| — |
|
|
| — |
|
|
| (17 | ) |
|
| 17 |
|
|
| (2,461 | ) |
|
| 2,478 |
|
Commercial and industrial |
|
| — |
|
|
| — |
|
|
| — |
|
|
| — |
|
|
| — |
|
|
| — |
|
|
| — |
|
|
| (25 | ) |
|
| 25 |
|
|
| (471 | ) |
|
| 496 |
|
Lease financing & other |
|
| — |
|
|
| — |
|
|
| — |
|
|
| — |
|
|
| — |
|
|
| — |
|
|
| — |
|
|
| — |
|
|
| — |
|
|
| (475 | ) |
|
| 475 |
|
Total specific component |
|
| — |
|
|
| — |
|
|
| — |
|
|
| — |
|
|
| — |
|
|
| (2,374 | ) |
|
| 2,374 |
|
|
| 1,482 |
|
|
| 892 |
|
|
| (2,682 | ) |
|
| 3,574 |
|
Formula: |
|
|
|
|
|
|
|
|
|
|
|
|
|
|
|
|
|
|
|
|
|
|
|
|
|
|
|
|
|
|
|
|
|
|
|
|
|
|
|
|
|
|
|
|
Real estate: |
|
|
|
|
|
|
|
|
|
|
|
|
|
|
|
|
|
|
|
|
|
|
|
|
|
|
|
|
|
|
|
|
|
|
|
|
|
|
|
|
|
|
|
|
Commercial |
| $ | 11,226 |
|
| $ | (5 | ) |
| $ | 11,231 |
|
| $ | 1,141 |
|
| $ | 10,090 |
|
|
| (2,686 | ) |
|
| 12,776 |
|
|
| (3,889 | ) |
|
| 16,665 |
|
|
| 1,392 |
|
|
| 15,273 |
|
Construction |
|
| 3,643 |
|
|
| (998 | ) |
|
| 4,641 |
|
|
| 692 |
|
|
| 3,949 |
|
|
| (147 | ) |
|
| 4,096 |
|
|
| (2,215 | ) |
|
| 6,311 |
|
|
| 634 |
|
|
| 5,677 |
|
Residential |
|
| 6,273 |
|
|
| 37 |
|
|
| 6,236 |
|
|
| (1,883 | ) |
|
| 8,119 |
|
|
| 26 |
|
|
| 8,093 |
|
|
| (1,774 | ) |
|
| 9,867 |
|
|
| 2,639 |
|
|
| 7,228 |
|
Commercial and industrial |
|
| 5,777 |
|
|
| 2,341 |
|
|
| 3,436 |
|
|
| (641 | ) |
|
| 4,077 |
|
|
| 1,427 |
|
|
| 2,650 |
|
|
| (1,629 | ) |
|
| 4,279 |
|
|
| (2,551 | ) |
|
| 6,830 |
|
Lease financing & other |
|
| 423 |
|
|
| (23 | ) |
|
| 446 |
|
|
| 69 |
|
|
| 377 |
|
|
| (319 | ) |
|
| 696 |
|
|
| (239 | ) |
|
| 935 |
|
|
| 872 |
|
|
| 63 |
|
Total formula component |
|
| 27,342 |
|
|
| 1,352 |
|
|
| 25,990 |
|
|
| (622 | ) |
|
| 26,612 |
|
|
| (1,699 | ) |
|
| 28,311 |
|
|
| (9,746 | ) |
|
| 38,057 |
|
|
| 2,986 |
|
|
| 35,071 |
|
Total allowance |
| $ | 27,342 |
|
|
|
|
|
| $ | 25,990 |
|
|
|
|
|
| $ | 26,612 |
|
|
|
|
|
| $ | 30,685 |
|
|
|
|
|
| $ | 38,949 |
|
|
|
|
|
| $ | 38,645 |
|
|
|
|
|
|
|
|
|
|
|
|
|
|
|
|
|
|
|
|
|
|
|
|
|
|
|
|
|
|
|
|
|
|
|
|
|
|
|
|
|
|
|
|
|
|
Net change |
|
|
|
|
|
| 1,352 |
|
|
|
|
|
|
| (622 | ) |
|
|
|
|
|
| (4,073 | ) |
|
|
|
|
|
| (8,264 | ) |
|
|
|
|
|
| 304 |
|
|
|
|
|
Net charge-offs |
|
|
|
|
|
| 440 |
|
|
|
|
|
|
| 3,098 |
|
|
|
|
|
|
| 12,580 |
|
|
|
|
|
|
| 72,418 |
|
|
|
|
|
|
| 46,223 |
|
|
|
|
|
Provision for loan losses |
|
|
|
|
| $ | 1,792 |
|
|
|
|
|
| $ | 2,476 |
|
|
|
|
|
| $ | 8,507 |
|
|
|
|
|
| $ | 64,154 |
|
|
|
|
|
| $ | 46,527 |
|
|
|
|
|
Coverage ratio (2) |
|
| 122 | % |
|
|
|
|
|
| 111 | % |
|
|
|
|
|
| 76 | % |
|
|
|
|
|
| 103 | % |
|
|
|
|
|
| 86 | % |
|
|
|
|
|
|
|
|
Coverage ratio excluding partial charge-offs |
|
| 121 | % |
|
|
|
|
|
| 110 | % |
|
|
|
|
|
| 81 | % |
|
|
|
|
|
| 102 | % |
|
|
|
|
|
| 89 | % |
|
|
|
|
|
|
|
|
|
|
|
|
|
|
|
|
|
|
|
|
|
|
|
|
|
|
|
|
|
|
|
|
|
|
|
|
|
|
|
|
|
|
|
|
|
|
|
|
|
|
|
|
|
46
|
(1) | Net charge-offs include partial charge-offs of $992, $767, $7,344, $2,551, and $11,211 related nonperforming and impaired loans for the years ended December 31, 2014, 2013, 2012, 2011 and 2010, respectively. |
(2) | The Coverage Ratio is the allowance for loan losses divided by total nonperforming loans, excluding loans held for sale. |
The specific component of the allowance for loan losses is the result of our analysis of impaired loans and our determination of the amount required to reduce the carrying amount of such loans to estimated fair value. Accordingly, such allowance is dependent on the particular loans and their characteristics at each measurement date, not necessarily the total amount of such loans. The Company usually records partial charge-offs as opposed to specific reserves for impaired loans that are real estate collateral dependent and for which independent appraisals have determined the fair value of the collateral to be less than the carrying amount of the loan. Partial charge-offs can significantly impact the allowance for loan losses as a percentage of nonperforming loans (coverage ratio) and other credit loss statistics and trends due to the fact that, in this situation, the allowance for loan loss is reduced and the remaining loan balance continues to be carried in nonperforming loans.
At December 31, 2014, 2013 and 2012, the Company had $8.0 million, $14.1 million, and $20.3 million, respectively, of impaired loans for which $2.7 million, $3.9 million, and $9.9 million of partial charge-offs, respectively, had been recorded. At December 31, 2014, 2013 and 2012, the Company had no specific reserves allocated, as partial charge-offs were recorded for all identified impairments. The Company’s analyses as of December 31, 2014, 2013 and 2012, indicated that impaired loans were principally real estate collateral dependent and that, with the exception of those loans for which specific reserves were assigned, there was sufficient underlying collateral value or guarantees to indicate expected recovery of the carrying amount of the loans.
The changes in the formula component of the allowance for loan losses are the result of the application of historical loss experience to outstanding loans by type. Loss experience for each year is based upon average charge-off experience for the prior three year period by loan type. The formula component is then adjusted to reflect changes in other relevant factors affecting loan collectability. Loss experience factors for new products, such as the asset-based lending and equipment finance programs implemented in 2014, were supplemented with additional factors such as industry loss experience and risk coefficients for new product and concentration risk. Management periodically adjusted the formula component to an amount that, when considered with the specific component, represented its best estimate of probable losses in the loan portfolio as of each balance sheet date.
47
A summary of the allowance for loan losses for each of the prior five years ended December 31 is as follows:
| 2014 |
|
| 2013 |
|
| 2012 |
|
| 2011 |
|
| 2010 |
| |||||
| (Dollars in thousands) |
| |||||||||||||||||
Net loans outstanding at end of year | $ | 1,900,814 |
|
| $ | 1,606,179 |
|
| $ | 1,440,760 |
|
| $ | 1,541,405 |
|
| $ | 1,689,187 |
|
Average net loans outstanding during the year | $ | 1,722,948 |
|
| $ | 1,464,100 |
|
| $ | 1,636,097 |
|
| $ | 1,882,199 |
|
| $ | 1,714,325 |
|
|
|
|
|
|
|
|
|
|
|
|
|
|
|
|
|
|
|
|
|
Allowance for loan losses: |
|
|
|
|
|
|
|
|
|
|
|
|
|
|
|
|
|
|
|
Balance, beginning of year | $ | 25,990 |
|
| $ | 26,612 |
|
| $ | 30,685 |
|
| $ | 38,949 |
|
| $ | 38,645 |
|
Provision charged to expense |
| 1,792 |
|
|
| 2,476 |
|
|
| 8,507 |
|
|
| 64,154 |
|
|
| 46,527 |
|
|
|
|
|
|
|
|
|
|
|
|
|
|
|
|
|
|
|
|
|
|
| 27,782 |
|
|
| 29,088 |
|
|
| 39,192 |
|
|
| 103,103 |
|
|
| 85,172 |
|
|
|
|
|
|
|
|
|
|
|
|
|
|
|
|
|
|
|
|
|
Charge-offs: |
|
|
|
|
|
|
|
|
|
|
|
|
|
|
|
|
|
|
|
Real estate: |
|
|
|
|
|
|
|
|
|
|
|
|
|
|
|
|
|
|
|
Commercial |
| (676 | ) |
|
| (1,084 | ) |
|
| (5,002 | ) |
|
| (39,168 | ) |
|
| (13,452 | ) |
Construction |
| — |
|
|
| (793 | ) |
|
| (3,509 | ) |
|
| (10,026 | ) |
|
| (16,582 | ) |
Residential |
| (1,550 | ) |
|
| (2,216 | ) |
|
| (3,018 | ) |
|
| (22,692 | ) |
|
| (14,911 | ) |
Commercial and industrial |
| (363 | ) |
|
| (1,103 | ) |
|
| (3,744 | ) |
|
| (6,225 | ) |
|
| (3,150 | ) |
Lease financing and other |
| (36 | ) |
|
| (406 | ) |
|
| (574 | ) |
|
| (125 | ) |
|
| (544 | ) |
Recoveries: |
|
|
|
|
|
|
|
|
|
|
|
|
|
|
|
|
|
|
|
Real estate: |
|
|
|
|
|
|
|
|
|
|
|
|
|
|
|
|
|
|
|
Commercial |
| 992 |
|
|
| 113 |
|
|
| 957 |
|
|
| 1,424 |
|
|
| 833 |
|
Construction |
| 37 |
|
|
| 15 |
|
|
| 179 |
|
|
| 622 |
|
|
| 151 |
|
Residential |
| 211 |
|
|
| 1,746 |
|
|
| 437 |
|
|
| 2,571 |
|
|
| 856 |
|
Commercial and industrial |
| 792 |
|
|
| 561 |
|
|
| 1,171 |
|
|
| 992 |
|
|
| 535 |
|
Lease financing and other |
| 153 |
|
|
| 69 |
|
|
| 523 |
|
|
| 209 |
|
|
| 41 |
|
|
|
|
|
|
|
|
|
|
|
|
|
|
|
|
|
|
|
|
|
Net charge-offs during the year |
| (440 | ) |
|
| (3,098 | ) |
|
| (12,580 | ) |
|
| (72,418 | ) |
|
| (46,223 | ) |
|
|
|
|
|
|
|
|
|
|
|
|
|
|
|
|
|
|
|
|
Balance, end of year | $ | 27,342 |
|
| $ | 25,990 |
|
| $ | 26,612 |
|
| $ | 30,685 |
|
| $ | 38,949 |
|
|
|
|
|
|
|
|
|
|
|
|
|
|
|
|
|
|
|
|
|
Ratio of net charge-offs to average net loans outstanding during year |
| 0.03 | % |
|
| 0.21 | % |
|
| 0.77 | % |
|
| 3.85 | % |
|
| 2.70 | % |
Ratio of allowance for loan losses to gross loans outstanding at end of year |
| 1.42 | % |
|
| 1.59 | % |
|
| 1.81 | % |
|
| 1.95 | % |
|
| 2.25 | % |
In determining the allowance for loan losses, in addition to historical loss experience and the other relevant factors disclosed above, management considers changes in net charge-offs during the year.
48
The distribution of the allowance for loan losses at the years ended December 31 is summarized as follows:
| 2014 |
|
| 2013 |
| ||||||||||||||||||
| Amount of |
|
| Loan |
|
| Percent of Loans |
|
| Amount of |
|
| Loan |
|
| Percent of Loans |
| ||||||
| Loan Loss |
|
| Amount |
|
| in Each Category |
|
| Loan Loss |
|
| Amount |
|
| in Each Category |
| ||||||
| Allowance |
|
| by Category |
|
| by Total Loans |
|
| Allowance |
|
| by Category |
|
| by Total Loans |
| ||||||
| (In thousands) |
| |||||||||||||||||||||
Real Estate: |
|
|
|
|
|
|
|
|
|
|
|
|
|
|
|
|
|
|
|
|
|
|
|
Commercial | $ | 11,226 |
|
| $ | 617,299 |
|
|
| 32.03 | % |
| $ | 11,231 |
|
| $ | 593,476 |
|
|
| 36.39 | % |
Construction |
| 3,643 |
|
|
| 101,802 |
|
|
| 5.28 | % |
|
| 4,641 |
|
|
| 88,311 |
|
|
| 5.42 | % |
Residential |
| 6,273 |
|
|
| 721,236 |
|
|
| 37.42 | % |
|
| 6,236 |
|
|
| 659,897 |
|
|
| 40.46 | % |
Commercial and industrial |
| 5,777 |
|
|
| 448,628 |
|
|
| 23.28 | % |
|
| 3,436 |
|
|
| 258,578 |
|
|
| 15.86 | % |
Lease financing and other |
| 423 |
|
|
| 38,439 |
|
|
| 1.99 | % |
|
| 446 |
|
|
| 30,528 |
|
|
| 1.87 | % |
Total | $ | 27,342 |
|
| $ | 1,927,404 |
|
|
| 100.00 | % |
| $ | 25,990 |
|
| $ | 1,630,790 |
|
|
| 100.00 | % |
|
|
|
|
|
|
|
|
|
|
|
|
|
|
|
|
|
|
|
|
|
|
|
|
| 2012 |
|
| 2011 |
| ||||||||||||||||||
| Amount of |
|
| Loan |
|
| Percent of Loans |
|
| Amount of |
|
| Loan |
|
| Percent of Loans |
| ||||||
| Loan Loss |
|
| Amount |
|
| in Each Category |
|
| Loan Loss |
|
| Amount |
|
| in Each Category |
| ||||||
| Allowance |
|
| by Category |
|
| by Total Loans |
|
| Allowance |
|
| by Category |
|
| by Total Loans |
| ||||||
| (In thousands) |
| |||||||||||||||||||||
Real Estate: |
|
|
|
|
|
|
|
|
|
|
|
|
|
|
|
|
|
|
|
|
|
|
|
Commercial | $ | 10,090 |
|
| $ | 550,786 |
|
|
| 37.47 | % |
| $ | 12,776 |
|
| $ | 690,837 |
|
|
| 43.84 | % |
Construction |
| 3,949 |
|
|
| 74,727 |
|
|
| 5.08 | % |
|
| 6,470 |
|
|
| 110,027 |
|
|
| 6.98 | % |
Residential |
| 8,119 |
|
|
| 521,973 |
|
|
| 35.51 | % |
|
| 8,093 |
|
|
| 514,828 |
|
|
| 32.67 | % |
Commercial and industrial |
| 4,077 |
|
|
| 288,809 |
|
|
| 19.65 | % |
|
| 2,650 |
|
|
| 218,500 |
|
|
| 13.86 | % |
Lease financing and other |
| 377 |
|
|
| 33,488 |
|
|
| 2.29 | % |
|
| 696 |
|
|
| 41,760 |
|
|
| 2.65 | % |
Total | $ | 26,612 |
|
| $ | 1,469,783 |
|
|
| 100.00 | % |
| $ | 30,685 |
|
| $ | 1,575,952 |
|
|
| 100.00 | % |
|
|
|
|
|
|
|
|
|
|
|
|
|
|
|
|
|
|
|
|
|
|
|
|
|
|
|
|
|
|
|
|
|
|
|
|
| 2010 |
| |||||||||
|
|
| Amount of |
|
| Loan |
|
| Percent of Loans |
| |||||||||||||
|
|
| Loan Loss |
|
| Amount |
|
| in Each Category |
| |||||||||||||
|
|
| Allowance |
|
| by Category |
|
| by Total Loans |
| |||||||||||||
|
|
| (In thousands) |
| |||||||||||||||||||
Real Estate: |
|
|
|
|
|
|
|
|
|
|
|
|
|
|
|
|
|
|
|
|
|
|
|
Commercial |
|
|
|
|
|
|
|
|
|
|
|
| $ | 16,665 |
|
| $ | 796,253 |
|
|
| 45.96 | % |
Construction |
|
|
|
|
|
|
|
|
|
|
|
|
| 7,161 |
|
|
| 174,369 |
|
|
| 10.07 | % |
Residential |
|
|
|
|
|
|
|
|
|
|
|
|
| 9,884 |
|
|
| 467,326 |
|
|
| 26.98 | % |
Commercial and industrial |
|
|
|
|
|
|
|
|
|
|
|
|
| 4,304 |
|
|
| 245,263 |
|
|
| 14.16 | % |
Lease financing and other |
|
|
|
|
|
|
|
|
|
|
|
|
| 935 |
|
|
| 49,040 |
|
|
| 2.83 | % |
Total |
|
|
|
|
|
|
|
|
|
|
|
| $ | 38,949 |
|
| $ | 1,732,251 |
|
|
| 100.00 | % |
|
|
|
|
|
|
|
|
|
|
|
|
|
|
|
|
|
|
|
|
|
|
|
|
Actual losses can vary significantly from the estimated amounts. The Company’s methodology permits adjustments to the allowance in the event that, in management’s judgment, significant factors which affect the collectability of the loan portfolio as of the evaluation date have changed. By assessing the estimated losses probable in the loan portfolio on a quarterly basis, the Bank is able to adjust specific and probable loss estimates based upon any more recent information that has become available. Other pertinent information related to the Company’s allowance for loan losses is contained in Note 4 to the Company’s consolidated financial statements presented in this Form 10-K.
Management believes the allowance for loan losses is the best estimate of probable losses which have been incurred as of December 31, 2014. There is no assurance that the Company will not be required to make future adjustments to the allowance in response to changing economic conditions or regulatory examinations.
The Company recorded a provision for loan losses of $1.8 million during 2014, $2.5 million for 2013 and $8.5 million in 2012. The provision for loan losses is charged to income to bring the Company’s allowance for loan losses to a level deemed appropriate by management based on the factors previously discussed under “Allowance for Loan Losses.”
49
Deposits
The Company’s fundamental source of funds supporting interest earning assets is deposits, consisting of non-interest bearing demand deposits, checking with interest, money market, savings and various forms of time deposits. The maintenance of a strong deposit base is key to the development of lending opportunities and creates long term customer relationships, which enhance the ability to cross sell services. Depositors include businesses, professionals, municipalities, not-for-profit organizations and individuals. To meet the requirements of a diverse customer base, a full range of deposit instruments are offered, which has allowed the Company to maintain and expand its deposit base despite intense competition from other banking institutions and non-bank financial service providers.
Total deposits increased $147.4 million, or 5.6 percent, to $2,781.1 million at December 31, 2014 from $2,633.7 million at December 31, 2013, an increase of $113.7 million or 4.5 percent from $2,520.0 million at December 31, 2012. The Company has experienced growth in new customers during 2014 and 2013. This growth was partially offset by some declines in balances of existing customers, primarily those customers directly involved in or supported by the real estate industry. Proceeds from deposit growth were used primarily to reduce long term and short term borrowings and to fund loan growth.
The following table presents a summary of deposits at December 31:
|
| December 31 |
|
| December 31 |
|
| Increase |
| |||
|
|
| 2014 |
|
|
| 2013 |
|
| (Decrease) |
| |
|
| (In thousands) |
| |||||||||
Demand deposits |
| $ | 1,081,251 |
|
| $ | 1,069,631 |
|
| $ | 11,620 |
|
Money market accounts |
|
| 962,487 |
|
|
| 870,291 |
|
|
| 92,196 |
|
Savings accounts |
|
| 128,252 |
|
|
| 120,000 |
|
|
| 8,252 |
|
Time deposits of $100,000 or more |
|
| 80,332 |
|
|
| 85,205 |
|
|
| (4,873 | ) |
Time deposits of less than $100,000 |
|
| 27,739 |
|
|
| 30,863 |
|
|
| (3,124 | ) |
Checking with interest |
|
| 501,011 |
|
|
| 457,754 |
|
|
| 43,257 |
|
Total deposits |
| $ | 2,781,072 |
|
| $ | 2,633,744 |
|
| $ | 147,328 |
|
|
|
|
|
|
|
|
|
|
|
|
|
|
The following table presents deposits classified by time remaining to maturity at December 31:
|
| 2014 |
|
| 2013 |
| ||||||||||||||||||
|
| Time Deposits of $100,000 or More |
|
| Time Deposits Less Than $100,000 |
|
| Total Time Deposits |
|
| Time Deposits of $100,000 or More |
|
| Time Deposits Less Than $100,000 |
|
| Total Time Deposits |
| ||||||
|
| (In thousands) |
| |||||||||||||||||||||
3 months or less |
| $ | 37,212 |
|
| $ | 7,664 |
|
| $ | 44,876 |
|
| $ | 41,306 |
|
| $ | 8,758 |
|
| $ | 50,064 |
|
Over 3 months through 6 months |
|
| 14,928 |
|
|
| 5,438 |
|
|
| 20,366 |
|
|
| 15,220 |
|
|
| 5,934 |
|
|
| 21,154 |
|
Over 6 months through 12 months |
|
| 23,630 |
|
|
| 4,528 |
|
|
| 28,158 |
|
|
| 22,439 |
|
|
| 5,626 |
|
|
| 28,065 |
|
Over 12 months |
|
| 4,562 |
|
|
| 10,109 |
|
|
| 14,671 |
|
|
| 6,240 |
|
|
| 10,545 |
|
|
| 16,785 |
|
Total |
| $ | 80,332 |
|
| $ | 27,739 |
|
| $ | 108,071 |
|
| $ | 85,205 |
|
| $ | 30,863 |
|
| $ | 116,068 |
|
|
|
|
|
|
|
|
|
|
|
|
|
|
|
|
|
|
|
|
|
|
|
|
|
|
Time deposits of $100,000 or more, including municipal CDs, decreased $4.9 million and $12.5 million at December 31, 2014 and 2013, respectively, compared to the prior year end balances. These CDs are primarily short term and are acquired on a bid basis. Time deposits of $100,000 or more generally have maturities of 7 days to one year.
The Company also from time to time utilizes wholesale borrowings, brokered deposits and other sources of funds interchangeably with time deposits of $100,000 or more depending upon availability and rates paid for such funds at any point in time. Due to the generally short maturity of these funding sources, the Company can experience higher volatility of interest margins during periods of both rising and declining interest rates.
The Company participates in a reciprocal sweep arrangement with other financial institutions through an intermediary which provides customers with balances in excess of FDIC insurance limits a vehicle to expand the insurable amount of their deposits. Money market and checking with interest deposit balances under this arrangement totaled $72.4 million and $49.4 million at December 31, 2014 and 2013, respectively. Deposits under this arrangement are products we offer to existing customers and are considered brokered deposits for regulatory reporting purposes. The Company had no other brokered certificates of deposit at December 31, 2014 or 2013.
50
The following table summarizes the average amounts and rates of various classifications of deposits for the periods indicated:
| Year Ended December 31, |
| |||||||||||||||||||||
| 2014 Average |
|
| 2013 Average |
|
| 2012 Average |
| |||||||||||||||
| Amount |
|
| Rate |
|
| Amount |
|
| Rate |
|
| Amount |
|
| Rate |
| ||||||
| (Dollars in thousands) |
| |||||||||||||||||||||
Demand deposits - non-interest bearing | $ | 1,038,886 |
|
|
|
|
|
| $ | 1,013,154 |
|
|
|
|
|
| $ | 959,566 |
|
|
|
|
|
Money market accounts |
| 957,298 |
|
|
| 0.34 | % |
|
| 885,502 |
|
|
| 0.37 | % |
|
| 894,068 |
|
|
| 0.43 | % |
Savings accounts |
| 121,935 |
|
|
| 0.12 | % |
|
| 126,605 |
|
|
| 0.26 | % |
|
| 124,244 |
|
|
| 0.40 | % |
Time deposits |
| 112,539 |
|
|
| 0.46 | % |
|
| 122,761 |
|
|
| 0.49 | % |
|
| 138,863 |
|
|
| 0.60 | % |
Checking with interest |
| 501,474 |
|
|
| 0.17 | % |
|
| 437,673 |
|
|
| 0.17 | % |
|
| 353,206 |
|
|
| 0.20 | % |
Total | $ | 2,732,132 |
|
|
| 0.17 | % |
| $ | 2,585,695 |
|
|
| 0.19 | % |
| $ | 2,469,947 |
|
|
| 0.24 | % |
|
|
|
|
|
|
|
|
|
|
|
|
|
|
|
|
|
|
|
|
|
|
|
|
Average deposits outstanding increased $146.4 million, or 5.7 percent, to $2,732.1 million in 2014 from $2,585.7 million in 2013, which increased $115.8 million or 4.7 percent from $2,469.9 million in 2012.
Average non-interest bearing deposits increased $25.7 million, or 2.5 percent, to $1,038.9 million in 2014 from $1,013.2 million in 2013, which increased $53.6 million or 5.6 percent from $959.6 million in 2012, reflecting the Company’s continuing emphasis on developing this funding source. Average interest bearing deposits increased $120.7 million, or 7.7 percent, in 2014 and $62.2 million, or 4.1 percent, in 2013 due to new account activity and increased activity.
Average money market deposits increased $71.8 million, or 8.1 percent, in 2014 and decreased $8.6 million, or 1.0 percent, in 2013. The 2014 increase was due to new customer accounts and increased activity and the 2013 decrease was due to decreased activity as a result of the low interest rate environment.
Average checking with interest deposits increased $63.8 million, or 14.6 percent, in 2014 and $84.5 million, or 23.9 percent, in 2013. The increases in 2014 and 2013 were due to new account activity.
Average time deposits decreased $10.2 million, or 8.3 percent, in 2014 and $16.1 million or 11.6 percent in 2013. The decreases in 2014 and 2013 were due to decreased activity in existing accounts as a result of the low interest rate environment.
Average savings deposit balances decreased $4.7 million, or 3.7 percent, in 2014 and increased $2.4 million, or 1.9 percent, in 2013. The 2014 decrease was due to decreased activity as a result of the lower interest rate environment and the 2013 increase was a result of new customer accounts and increased activity.
Borrowings
The Company’s borrowings with original maturities of one year or less totaled $28.2 million and $34.4 million at December 31, 2014 and 2013, respectively. Such short-term borrowings consisted entirely of customer repurchase agreements at December 31, 2014 and 2013. As of December 2014 and 2013, borrowings were collateralized by loans and securities with estimated fair values of $28.2 million and $50.8 million, respectively. Other borrowings totaled $16.4 million at December 31, 2013. In January 2014, the Company prepaid all of its outstanding FHLB borrowings. The borrowings totaled $16.4 million and the related prepayment penalty totaled $1.9 million.
Interest expense on all borrowings totaled less than $0.1 million in 2014 and $0.8 million in both 2013 and 2012.
The following table summarizes the average balances, weighted average interest rates and the maximum month-end outstanding amounts of the Company’s borrowings for each of the years below:
|
|
|
| 2014 |
|
| 2013 |
|
| 2012 |
| |||
|
|
|
| (Dollars in thousands) |
| |||||||||
Average balance: |
| Short-term |
| $ | 33,654 |
|
| $ | 26,738 |
|
| $ | 45,619 |
|
|
| Other Borrowings |
|
| 225 |
|
|
| 16,407 |
|
|
| 16,446 |
|
Weighted average interest rate (for the year): |
| Short-term |
|
| 0.1 | % |
|
| 0.1 | % |
|
| 0.2 | % |
|
| Other Borrowings |
|
| 4.4 |
|
|
| 4.4 |
|
|
| 4.4 |
|
Weighted average interest rate (at year end): |
| Short-term |
|
| 0.1 | % |
|
| 0.1 | % |
|
| 0.3 | % |
|
| Other Borrowings |
|
| — |
|
|
| 4.4 |
|
|
| 4.4 |
|
Maximum month-end outstanding amount: |
| Short-term |
| $ | 46,072 |
|
| $ | 34,379 |
|
| $ | 56,312 |
|
|
| Other Borrowings |
|
| — |
|
|
| 16,425 |
|
|
| 16,463 |
|
51
HVB is a member of the FHLB. As a member, HVB is able to participate in various FHLB borrowing programs which require certain investments in FHLB common stock as a prerequisite to obtaining funds. As of December 31, 2014, HVB had short-term borrowing lines with the FHLB of $188 million with no amounts outstanding. These, and various other FHLB borrowing programs available to members, are subject to availability of qualifying loan and/or investment securities collateral and other terms and conditions.
HVB also has unsecured overnight borrowing lines totaling $75 million with three major financial institutions which were all unused and available at December 31, 2014. In addition, HVB has approved lines under Retail Certificate of Deposit Agreements with three major financial institutions totaling $1.1 billion of which no balances were outstanding as at December 31, 2014. Utilization of these lines is subject to product availability and other restrictions.
Additional liquidity is also provided by the Company’s ability to borrow from the FRB’s discount window. In response to the current economic crisis, the FRB has increased the ability of banks to borrow from this source through its Borrower-in-Custody (“BIC”) program, which expanded the types of collateral which qualify as security for such borrowings. HVB has been approved to participate in the BIC program. There were no balances outstanding with the FRB at December 31, 2014.
As of December 31, 2014, the Company had qualifying loan and investment securities totaling approximately $736 million which could be utilized under available borrowing programs thereby increasing liquidity.
Capital Resources
Stockholders’ equity increased $13.3 million, or 4.7 percent, to $297.6 million at December 31, 2014 from $284.3 million at December 31, 2013, which decreased $6.7 million or 2.3 percent from $291.0 million at December 31, 2012. The 2014 increase resulted from net income of $7.9 million, net proceeds from stock options of $2.7 million and restricted stock of $2.6 million, and an increase of accumulated other comprehensive income of $5.7 million, partially offset by cash dividends of $5.6 million. The 2013 decrease resulted from cash dividends of $4.8 million and a decrease of accumulated other comprehensive income of $5.5 million, partially offset by net income of $1.1 million, net proceeds from stock options of $1.1 million and restricted stock of $1.4 million.
HVB’s payment of dividends to the Company, the Company’s primary source of funds, is subject to limitation by federal and state regulators based on such factors as the maintenance of adequate capital, which could reduce the amount of dividends otherwise payable. See “Business — Supervision and Regulation.”
The various components and changes in stockholders’ equity are reflected in the Consolidated Statements of Changes in Stockholders’ Equity for the years ended December 31, 2014, 2013 and 2012 included elsewhere herein.
The Board of Governors of the Federal Reserve System issued a supervisory letter dated February 24, 2009 to bank holding companies that contains guidance on when the board of directors of a bank holding company should eliminate, defer or severely limit dividends including, for example, when net income available for stockholders for the past four quarters, net of dividends previously paid during that period, is not sufficient to fully fund the dividends. The letter also contains guidance on the redemption of stock by bank holding companies which urges bank holding companies to advise the Federal Reserve of any such redemption or repurchase of common stock for cash or other value which results in the net reduction of a bank holding company’s capital during the quarter.
All banks and bank holding companies are subject to risk-based capital guidelines. These guidelines define capital as Tier 1 and Total capital. Tier 1 capital consists of common stockholders’ equity and qualifying preferred stock, less intangibles; and Total capital consists of Tier 1 capital plus the allowance for loan and lease losses up to certain limits, preferred stock and certain subordinated and term-debt securities. The guidelines require a minimum total risk-based capital ratio of 8.0 percent, and a minimum Tier 1 risk-based capital ratio of 4.0 percent. Banks and bank holding companies must also maintain a minimum leverage ratio of 4.0 percent, which consists of Tier 1 capital based on risk-based capital guidelines, divided by average tangible assets (excluding intangible assets that were deducted to arrive at Tier 1 capital).
52
The capital ratios at December 31 were as follows:
| 2014 |
|
| 2013 |
|
| 2012 |
| |||
Tier 1 capital: |
|
|
|
|
|
|
|
|
|
|
|
Company |
| 13.9% |
|
|
| 16.2% |
|
|
| 16.5% |
|
HVB |
| 13.6% |
|
|
| 15.8% |
|
|
| 16.2% |
|
|
|
|
|
|
|
|
|
|
|
|
|
Total capital: |
|
|
|
|
|
|
|
|
|
|
|
Company |
| 15.1% |
|
|
| 17.5% |
|
|
| 17.7% |
|
HVB |
| 14.8% |
|
|
| 17.1% |
|
|
| 17.4% |
|
|
|
|
|
|
|
|
|
|
|
|
|
Leverage: |
|
|
|
|
|
|
|
|
|
|
|
Company |
| 9.3% |
|
|
| 9.5% |
|
|
| 9.3% |
|
HVB |
| 9.1% |
|
|
| 9.3% |
|
|
| 9.2% |
|
On July 2, 2013, the Banking Agencies approved the final rules implementing the Basel Committee on Banking Supervision’s capital guidelines for U.S. banks. The rules include a new common equity Tier 1 capital to risk-weighted assets ratio of 4.5% and a common equity Tier 1 capital conservation buffer of 2.5% of risk-weighted assets. The final rules also raise the minimum ratio of Tier 1 capital to risk-weighted assets from 4.0% to 6.0% and require a minimum leverage ratio of 4.0%. The final rules also implement strict eligibility criteria for regulatory capital instruments. The phase-in period for the final rules began for the Company on January 1, 2015, with full compliance with all of the final rule’s requirements phased in over a multi-year schedule.
Comparison of Results of Operations for the Years Ended December 31, 2013 and 2012
The Company reported net income of $1.1 million or $0.06 per diluted share in 2013 compared to net income of $29.2 million or $1.49 per diluted share in 2012. The overall decrease in 2013 compared to 2012 reflected lower net interest income, lower non-interest income and higher non-interest expense, partially offset by a lower provision for loan losses and lower income taxes. Non-interest expense in 2013 included an $18.7 million pretax goodwill impairment charge in the fourth quarter. Non-interest income for 2012 included a pretax gain of $15.9 million resulting from loan sales completed at the end of the first quarter. The goodwill impairment charge was primarily driven by loss of clients and a reduction in the projected earnings capacity of the Company’s asset management subsidiary. The decrease in net interest income in 2013 compared to 2012 was primarily due to significant margin compression resulting from the combined impacts of only partial redeployment of proceeds from loan sales completed in the first quarter of 2012 and the continuation of historically low interest rates.
Provision for loan losses totaled $2.5 million and $8.5 million in 2013 and 2012, respectively. The 2013 provision was significantly lower than 2012 reflecting gradually improving credit environment and improvements achieved in the resolution of classified and nonperforming loans.
Non-interest income also included pretax other-than-temporary impairment charges of $1.2 million and $0.5 million in 2013 and 2012, respectively, related to the Bank’s investments in pooled trust preferred securities. The 2013 impairment charge resulted from management’s decision to sell the portfolio given the uncertainty of pending final regulations of the Volcker rule. The Company sold its portfolio of pooled trust preferred securities in January 2014, prior to the federal banking agencies’ interim final rule, without further loss. Non-interest expense for 2013 also included approximately $1.3 million of non-recurring fees and expenses incurred to fully address matters raised by the OCC in the previously disclosed Formal Written Agreement, which was terminated in October 2013 and a $1.3 million write-off associated with branch closings and consolidations during 2013. Non-interest expense for 2012 also included legal and other expenses of $1.2 million related to the previously announced ongoing investigations by the SEC and the Department of Labor (“DOL”) relating to issues surrounding the brokerage practices and policies and disclosures about such practices of the Company’s investment advisory subsidiary, ARS.
Net Interest Income
Net interest income, the difference between interest income and interest expense, is the most significant component of the Company’s consolidated earnings. The Company has experienced an extended period of negative, although recently improving, economic conditions and historically low interest rates. These conditions have resulted in sharp declines in the value of collateral securing many of the Company’s loans, elevated levels of classified and nonperforming loans and declining margins. In addition, a dynamically changing regulatory landscape has resulted in greater scrutiny of the historic business models of community-based institutions. This has resulted in greater pressure on many community banks to reduce loan concentrations, particularly commercial real estate loans, and to accelerate the reduction of levels of nonperforming and classified loans. During this period, the Company took various steps to address these issues. These steps included repositioning its securities portfolio, reducing higher cost term borrowings
53
and, during the first half of 2012, executing significant loan sales for the purpose of reducing commercial real estate concentrations and overall levels of classified and nonperforming loans. These actions have resulted in significant margin compression, particularly in 2013, as a result of the impact of only partial redeployment of proceeds from loan sales. As a result of these differentials in redeployment and average yields, additional margin compression may result in the near term, particularly during the period of redeployment of excess liquidity. During 2013, management executed on several initiatives previously disclosed to redeploy excess liquidity. These initiatives included asset purchases, loan participations with other institutions and the ability to internally originate, underwrite and service leasing and other non-commercial real estate credits. Management believes that the results of these efforts will enable the Company to maximize its net interest income, address regulatory concerns, and effectively reposition its portfolios from both asset composition and interest rate risk perspectives.
Net interest income, on a tax equivalent basis, decreased $19.8 million, or 18.8 percent, to $85.5 million in 2013, compared to $105.3 million in 2012. The decrease in 2013, compared to 2012, was primarily due to a decrease in the tax equivalent basis net interest margin to 3.09 percent in 2013, compared to 3.96 percent in 2012. The decreasing margin resulted from the aforementioned significant changes in the composition of interest earning assets resulting from the combined effects of loan sales conducted in the first quarter of 2012 and continued low interest rates. The effects of the decreasing margins were partially offset by an increase of $61.4 million in 2013 in the excess of adjusted average interest earning assets over average interest bearing liabilities. For purposes of the financial information included in this section, the Company adjusts average interest earning assets to exclude the effects of unrealized gains and losses on securities available for sale and adjusts net interest income to a tax equivalent basis. Management believes that this alternate presentation more closely reflects actual performance, as it is consistent with the Company’s stated asset/liability management strategies. The effects of these non-GAAP adjustments to tax equivalent basis net interest income and adjusted average assets are included in the table presented in the “Average Balances and Interest Rates” section herein. Net interest income in accordance with GAAP decreased by $19.4 million, or 18.8 percent, to $83.9 million for the year ended December 31, 2013, compared to $103.3 million for the year ended December 31, 2012.
The Company’s overall asset quality has improved as a result of actions taken by management to reduce concentrations and classified assets and the gradually improving credit environment. However, asset quality has continued to be adversely affected by the current state of the economy and it has continued to experience elevated levels of delinquent and nonperforming loans, and declines in the loan-to-value ratios on existing loans. Changes in the levels of nonperforming loans have a direct impact on net interest income.
The Company’s short-term liquidity remains at elevated levels, resulting from continued deposit growth and proceeds from loan sales which have not yet been redeployed. This excess liquidity contributed to margin compression. The Company has made efforts throughout the extended period of economic uncertainty and fluctuating interest rates to minimize the impact on its net interest income by appropriately repositioning its securities portfolio and funding sources while maintaining prudence and awareness of the potential consequences that the current economic crisis could have on its asset quality and interest rate risk profiles. The Company continues to increase the number of loans originated with interest rate floors and exercise caution in reinvestment of excess liquidity provided from continued strong deposit growth and proceeds from loan sales. These actions are being conducted partially to maintain flexibility in reaction to the continuation of historically low interest rates. The Company’s ability to make changes in its asset mix allows management to capitalize on more desirable yields, as available, on various interest earning assets.
Interest income is determined by the volume of and related rates earned on interest earning assets. Volume decreases in loans and a lower average yield on interest earning assets, partially offset by volume increases in investments, interest earning deposits and Federal funds sold resulted in lower interest income in 2013, compared to 2012. Adjusted average interest earning assets in 2013 increased $104.7 million, or 3.9 percent, to $2,765.1 million from $2,660.4 million in 2012.
Loans are the largest component of interest earning assets. Net loans, excluding loans held-for-sale, increased $165.4 million, or 11.5 percent, to $1,606.2 million at December 31, 2013 from $1,440.8 million at December 31, 2012. Average net loans decreased $172.0 million, or 10.5 percent, to $1,464.1 million in 2013 from $1,636.1 million in 2012. The decrease in average net loans in 2013 resulted primarily from the aforementioned actions taken by the Company to reduce its concentration in commercial real estate and its level of classified loans. The average yield on loans was 5.14 percent in 2013, compared to 5.70 percent in 2012. As a result, interest income on loans decreased in 2013 due to lower volume and lower interest rates.
Total securities, including FHLB stock and excluding net unrealized gains and losses, increased $101.2 million, or 22.0 percent, to $560.5 million at December 31, 2013 from $459.3 million at December 31, 2012. Average total securities, including FHLB stock and excluding net unrealized gains and losses, increased $51.0 million, or 10.9 percent, to $519.8 million in 2013 from $468.8 million in 2012. The increase in average total securities in 2013 compared to 2012 reflected volume increases in U.S Treasury and Agency securities, mortgage-backed securities and other fixed income securities, and obligations of state and political subdivisions, partially offset by volume decreases in equities and FHLB stock. The average tax equivalent basis yields on securities were 2.68 percent and 3.72 percent in 2013 and 2012, respectively. As a result, tax equivalent basis interest income on securities decreased in 2013 due to lower rates partially offset by higher volume.
54
Interest expense is a function of the volume of, and rates paid for, interest bearing liabilities, comprised of deposits and borrowings. Interest expense decreased $1.1 million, or 16.4 percent, to $5.6 million in 2013 from $6.7 million in 2012. Average interest bearing liabilities increased $43.3 million, or 2.8 percent, to $1,615.7 million in 2013 from $1,572.4 million in 2012.
The increase in average interest bearing liabilities in 2013, compared to 2012, was due to volume increases in savings deposits and checking with interest, partially offset by volume decreases in money market deposits, time deposits, short-term borrowings and other borrowed funds. Overall deposit growth in 2013 was partially offset by planned reductions in certain non-core deposit balances, and proceeds from deposit growth were used to fund new loans, reduce maturing term borrowings, increase the securities portfolio or were retained in liquid investments, principally interest earning bank deposits. The average interest rate paid on interest bearing liabilities was 0.35 percent in 2013, compared to 0.43 percent in 2012. As a result of these factors, interest expense was lower in 2013 due to lower interest rates.
Average non-interest bearing demand deposits increased $53.6 million, or 5.6 percent, to $1,013.2 million in 2013 from $959.6 million in 2012. Non-interest bearing demand deposits are an important component of the Company’s ongoing asset liability management, and also have a direct impact on the determination of net interest income.
The interest rate spread on a tax equivalent basis for each of the years indicated:
|
| 2013 |
|
| 2012 |
| ||
Average interest rate on: |
|
|
|
|
|
|
|
|
Total average interest earning assets |
|
| 3.30 | % |
|
| 4.21 | % |
Total average interest bearing liabilities |
|
| 0.35 | % |
|
| 0.43 | % |
Total interest rate spread |
|
| 2.95 | % |
|
| 3.78 | % |
In 2013, the interest rate spread decreased reflecting decreases in interest rates on interest earnings assets and interest earning liabilities. Management cannot predict what impact market conditions will have on its interest rate spread and future compression in net interest rate spread may occur.
Provision for Loan Losses
The provision for loan losses in 2013 was $2.5 million compared to $8.5 million in 2012. The decrease in 2013, compared to 2012, reflected the gradually improving credit environment coupled with improvements achieved in the resolution of classified and nonperforming loans.
Non-Interest Income
Non-interest income decreased $18.7 million, or 55.3 percent, to $15.1 million in 2013 compared to $33.8 million in 2012. The decrease in 2013, compared to 2012, resulted primarily from a $15.9 million pretax gain on sales of loans completed in the first quarter of 2012. The 2013 decrease, compared to 2012, was also due to lower service fees, lower investment advisory fees and higher impairment charges on securities available-for-sale, partially offset by higher other income.
Service charges decreased by $0.5 million, or 7.9 percent, to $5.8 million in 2013 compared to $6.3 million in 2012. The 2013 decrease was due to decreased fee-based activity.
Investment advisory fees decreased $1.8 million, or 18.9 percent, to $7.7 million in 2013 from $9.5 million in 2012. The 2013 decrease was primarily the result of recent losses of customers, declining assets under management and lower average fees.
The Company recognized impairment charges on securities available for sale of $1.2 million and $0.5 million for the years ended December 31, 2013 and 2012, respectively. The impairment charges were related to adverse market conditions affecting the Company’s investments in pooled trust preferred securities. The 2013 impairment charge resulted directly from management’s decision to sell the portfolio given the uncertainty of pending final regulations of the Volcker rule. The Company sold its portfolio of pooled trust preferred securities in January 2014, prior to the federal banking agencies’ interim final rule, without further loss. Dispositions of securities available for sale resulted in net realized gains of less than $0.1 million in both 2013 and 2012. The sales were conducted as part of the Company’s ongoing asset/liability management process.
Other income increased $0.1 million, or 3.7 percent, to $2.8 million in 2013 compared to $2.7 million in 2012. The increase in 2013, compared to 2012, resulted primarily from credit card income.
Non-Interest Expense
55
Non-interest expense increased $17.6 million, or 21.3 percent, to $100.1 million in 2013, compared to $82.5 million in 2012. The increase in 2013, compared to 2012, resulted primarily from the aforementioned pretax goodwill impairment charge of $18.7 million, an increase in FDIC assessments, and a slight increase in personnel expense, partially offset by decreases in occupancy expense, professional fees, equipment expense, business development expense, and other operating expenses. Non-interest expense for 2013 also included approximately $1.3 million of non-recurring fees and expenses incurred to fully address matters raised by the OCC in the previously disclosed Formal Written Agreement, which was terminated in October 2013 and a $1.3 million write-off associated with branch closings and consolidations during 2013.
The Company’s efficiency ratio (a lower ratio indicates greater efficiency) which compares non-interest expense to total adjusted revenue (tax equivalent net interest income, plus non-interest income, excluding gain or loss on securities transactions and the goodwill impairment charge) was 79.9 percent in 2013, compared to 66.7 percent in 2012. The increasing trend of the efficiency ratio is primarily the result of significant reductions in net interest income due to continued low interest rates.
Salaries and employee benefits, the largest component of non-interest expense, increased $0.3 million, or 0.7 percent, to $45.1 million in 2013 from $44.8 million in 2012. The 2013 increase resulted primarily from hiring experienced personnel to accommodate expanding risk management requirements and the expansion of services and products available to new and existing customers.
The following tables show the number of full and part time employees and the salaries and employee benefit expenses for the Company for the years indicated:
|
| 2013 |
|
| 2012 |
| ||
Employees at December 31, |
|
|
|
|
|
|
|
|
Full time employees |
|
| 401 |
|
|
| 429 |
|
Part time employees |
|
| 18 |
|
|
| 31 |
|
|
|
| 2013 |
|
|
| 2012 |
|
|
| (Dollars in thousands) |
| |||||
Salaries and Employee Benefits: |
|
|
|
|
|
|
|
|
Salaries |
| $ | 32,992 |
|
| $ | 31,578 |
|
Payroll taxes |
|
| 2,748 |
|
|
| 2,643 |
|
Medical plans |
|
| 2,824 |
|
|
| 2,581 |
|
Incentive compensation plans |
|
| 2,982 |
|
|
| 4,423 |
|
Employee retirement plans |
|
| 2,813 |
|
|
| 2,730 |
|
Other |
|
| 750 |
|
|
| 858 |
|
Total |
| $ | 45,109 |
|
| $ | 44,813 |
|
|
|
|
|
|
|
|
|
|
Percent of total non-interest expense |
|
| 45.1 | % |
|
| 54.3 | % |
|
|
|
|
|
|
|
|
|
Occupancy expense decreased $0.1 million, or 1.1 percent, to $8.6 million in 2013 from $8.7 million in 2012. The decrease in 2013 resulted primarily from a decrease in real estate taxes.
Professional service fees decreased $0.8 million, or 10.5 percent, to $6.8 million in 2013 from $7.6 million in 2012. The decrease in 2013 was primarily due to costs related to the engagement of consultants to assist with new systems implementations and legal costs related to the SEC and DOL investigations of ARS during 2012.
Equipment expense decreased $0.4 million, or 8.9 percent, to $4.1 million in 2013 from $4.5 million in 2012. The decrease in 2013 reflected a decrease in depreciation expense of office equipment.
Business development expense decreased $0.2 million, or 8.3 percent, to $2.2 million in 2013 from $2.4 million in 2012. The decrease in 2013 resulted from decreased participation in business development activities.
The Federal Deposit Insurance Corporation (“FDIC”) assessment was $3.9 million in 2013, compared to $3.2 million in 2012. The increase in 2013 was reflective of changes in the Bank’s premium calculation base and assessment rate.
Other operating expenses, as reflected in the following table, decreased 6.0 percent in 2013:
56
|
| 2013 |
|
| 2012 |
| ||
|
| (Dollars in thousands) |
| |||||
Other Operating Expenses: |
|
|
|
|
|
|
|
|
Stationary & printing |
| $ | 739 |
|
| $ | 819 |
|
Communications expense |
|
| 672 |
|
|
| 719 |
|
Courier expense |
|
| 850 |
|
|
| 829 |
|
Other loan expense |
|
| 1,097 |
|
|
| 889 |
|
Outside services |
|
| 4,628 |
|
|
| 4,307 |
|
Dues, meetings, and seminars |
|
| 298 |
|
|
| 272 |
|
Other |
|
| 2,389 |
|
|
| 3,517 |
|
Total |
| $ | 10,673 |
|
| $ | 11,352 |
|
|
|
|
|
|
|
|
|
|
Percent of total non-interest expense |
|
| 10.7 | % |
|
| 13.8 | % |
|
|
|
|
|
|
|
|
|
Income Taxes
Income tax expense (benefit) of ($4.6) million and $16.9 million were recorded in 2013 and 2012, respectively. The Company is currently subject to a statutory Federal tax rate of 35 percent, a New York State tax rate of 7.1 percent plus a 17 percent surcharge, and a New York City tax rate of approximately 9 percent. Prior to the consolidation/closure of the Connecticut branches, we were also subject to a Connecticut State tax rate of 7.5 percent.
Liquidity
The Asset/Liability Strategic Committee (“ALSC”) of the Board of Directors of HVB establishes specific policies and operating procedures governing the Company’s liquidity levels and develops plans to address future liquidity needs, including contingent sources of liquidity. The primary functions of asset liability management are to provide safety of depositor and investor funds, assure adequate liquidity and maintain an appropriate balance between interest earning assets and interest bearing liabilities. Liquidity management involves the ability to meet the cash flow requirement of depositors wanting to withdraw funds or borrowers needing assurance that sufficient funds will be available to meet their credit needs. Interest rate sensitivity management seeks to manage fluctuating net interest margins and to enhance consistent growth of net interest income through periods of changing interest rates.
The Company’s liquid assets, at December 31, 2014, include cash and due from banks of $292.9 million and Federal funds sold of $13.7 million. Federal funds sold represents the Company’s excess liquid funds that are invested with other financial institutions in need of funds and which mature daily.
Other sources of liquidity include maturities and principal and interest payments on loans and securities. The loan and securities portfolios provide a constant stream of maturing assets and re-investable cash flows, which can be converted into cash should the need arise. The ability to redeploy these funds is an important source of medium to long term liquidity. The amortized cost of securities having contractual maturities, expected call dates or average lives of one year or less amounted to $102.2 million at December 31, 2014. This represented 12.6 percent of the amortized cost of the securities portfolio. Excluding installment loans to individuals, real estate loans other than construction loans and lease financing, $174.1 million, or 9.0 percent of loans at December 31, 2014, mature in one year or less. The Company may increase liquidity by selling certain residential mortgages, or exchanging them for mortgage-backed securities that may be sold in the secondary market.
Non-interest bearing demand deposits and interest bearing deposits from businesses, professionals, not-for-profit organizations and individuals are a relatively stable, low-cost source of funds. The deposits of the Bank generally have shown a steady growth trend as well as a generally consistent deposit mix. However, there can be no assurance that deposit growth will continue or that the deposit mix will not shift to higher rate products.
The Bank is a member of the FHLB. As such, we are able to participate in various FHLB borrowing programs which require certain investments in FHLB common stock as a prerequisite to obtaining funds. As of December 31, 2014, HVB had short-term borrowing lines with the FHLB of $188 million with no balances outstanding. These, and various other FHLB borrowing programs available to members, are subject to availability of qualifying loan and/or investment securities collateral and other terms and conditions.
The Bank also has unsecured overnight borrowing lines totaling $75 million with three major financial institutions which were all unused and available at December 31, 2014. In addition, HVB has approved lines under Retail Certificate of Deposit Agreements with three major financial institutions totaling approximately $1.1 billion which were also unused and available at December 31, 2014. The retail certificates of deposit lines are subject to product availability and other restrictions.
57
Additional liquidity is also provided by the Bank’s ability to borrow from the FRB’s discount window. In response to the current economic crisis, the FRB has increased the ability of banks to borrow from this source through its Borrower-in-Custody (“BIC”) program, which expanded the types of collateral which qualify as security for such borrowings. The Bank has been approved to participate in the BIC program. There were no amounts outstanding with the FRB at December 31, 2014.
The various borrowing programs discussed above are subject to certain restrictions and terms and conditions which may include continued availability of such borrowing programs, the Company’s ability to pledge qualifying collateral in sufficient amounts, the Company’s maintenance of capital ratios acceptable to these lenders and other conditions which may be imposed on the Company.
As of December 31, 2014, the Company had qualifying loan and investment securities totaling approximately $736 million which could be utilized under available borrowing programs thereby increasing liquidity.
The Company also has outstanding, at any time, a significant number of commitments to extend credit and provide financial guarantees to third parties. These arrangements are subject to strict credit control assessments. Guarantees specify limits to the Company’s obligations. Because many commitments and almost all guarantees expire without being funded in whole or in part, the contract amounts are not estimates of future cash flows. The Company is also obligated under leases or license agreements for certain of its branches and equipment.
A summary of significant long-term contractual obligations, credit commitments, and projected retirement benefits at December 31, 2014 is as follows:
| Payments Due |
| |||||||||||||||||
|
|
|
|
| After 1 |
|
| After 3 |
|
|
|
|
|
|
|
|
| ||
|
|
|
|
| Year but |
|
| Year but |
|
|
|
|
|
|
|
|
| ||
| Within 1 |
|
| Within 3 |
|
| Within 5 |
|
| After 5 |
|
|
|
|
| ||||
| Year |
|
| Years |
|
| Years |
|
| Years |
|
| Total |
| |||||
| (In thousands) |
| |||||||||||||||||
Contractual obligations: (1) |
|
|
|
|
|
|
|
|
|
|
|
|
|
|
|
|
|
|
|
Time deposits | $ | 93,400 |
|
| $ | 9,737 |
|
| $ | 4,934 |
|
|
| — |
|
| $ | 108,071 |
|
Operating lease and license obligations |
| 8,527 |
|
|
| 13,809 |
|
|
| 8,431 |
|
| $ | 10,885 |
|
|
| 41,652 |
|
Total | $ | 101,927 |
|
| $ | 23,546 |
|
| $ | 13,365 |
|
| $ | 10,885 |
|
| $ | 149,723 |
|
|
|
|
|
|
|
|
|
|
|
|
|
|
|
|
|
|
|
|
|
Credit commitments: |
|
|
|
|
|
|
|
|
|
|
|
|
|
|
|
|
|
|
|
Available lines of credit | $ | 147,133 |
|
| $ | 50,508 |
|
| $ | 13,203 |
|
| $ | 56,769 |
|
| $ | 267,613 |
|
Letters of credit |
| 22,967 |
|
|
| 1,615 |
|
|
| 12,210 |
|
|
| — |
|
|
| 36,792 |
|
Total | $ | 170,100 |
|
| $ | 52,123 |
|
| $ | 25,413 |
|
| $ | 56,769 |
|
| $ | 304,405 |
|
|
|
|
|
|
|
|
|
|
|
|
|
|
|
|
|
|
|
|
|
Projected retirement benefits: |
|
|
|
|
|
|
|
|
|
|
|
|
|
|
|
|
|
|
|
Supplemental employee retirement plan | $ | 1,053 |
|
| $ | 1,815 |
|
| $ | 1,646 |
|
| $ | 12,604 |
|
| $ | 17,118 |
|
Directors retirement plan |
| 399 |
|
|
| 765 |
|
|
| 726 |
|
|
| 1,347 |
|
|
| 3,237 |
|
Total | $ | 1,452 |
|
| $ | 2,580 |
|
| $ | 2,372 |
|
| $ | 13,951 |
|
| $ | 20,355 |
|
|
|
|
|
|
|
|
|
|
|
|
|
|
|
|
|
|
|
|
|
|
(1) | Interest not included. |
The Company pledges certain of its assets as collateral for deposits of municipalities and other deposits allowed or required by law, FHLB and FRB borrowings and repurchase agreements. By utilizing collateralized funding sources, the Company is able to access a variety of cost effective sources of funds. The assets pledged consist of certain loans secured by real estate, U.S. Treasury and government agency securities, mortgage-backed securities, certain obligations of state and political subdivisions and other securities. Management monitors its liquidity requirements by assessing assets pledged, the level of assets available for sale, additional borrowing capacity and other factors. Management does not anticipate any negative impact to its liquidity from its pledging activities.
Another source of funding for the Company is capital market funds, which includes common stock, preferred stock, convertible debentures, retained earnings and long-term debt qualifying as regulatory capital.
Each of the Company’s sources of liquidity is vulnerable to various uncertainties beyond the control of the Company. Scheduled loan and security payments are a relatively stable source of funds, while loan and security prepayments and calls, and deposit flows vary widely in reaction to market conditions, primarily prevailing interest rates. Asset sales are influenced by general market interest
58
rates and other unforeseen market conditions. The Company’s ability to borrow to meet liquidity demands or to do so at attractive rates is affected by its financial condition and other market conditions.
Management expects that the Company has and will have sources of liquidity to meet any expected funding needs and also to be responsive to changing interest rate markets.
Quarterly Results of Operations
Set forth below are certain quarterly results of operations for the periods indicated:
| 2014 |
|
| 2013 |
| ||||||||||||||||||||||||||
| Fourth |
|
| Third |
|
| Second |
|
| First |
|
| Fourth |
|
| Third |
|
| Second |
|
| First |
| ||||||||
| (In thousands, except per share data) |
| |||||||||||||||||||||||||||||
Total interest income | $ | 26,148 |
|
| $ | 24,827 |
|
| $ | 23,281 |
|
| $ | 22,835 |
|
| $ | 21,946 |
|
| $ | 22,409 |
|
| $ | 22,547 |
|
| $ | 22,681 |
|
Net interest income |
| 24,907 |
|
|
| 23,592 |
|
|
| 22,100 |
|
|
| 21,729 |
|
|
| 20,610 |
|
|
| 21,013 |
|
|
| 21,068 |
|
|
| 21,246 |
|
Provision for loan losses |
| 603 |
|
|
| 651 |
|
|
| 460 |
|
|
| 78 |
|
|
| 648 |
|
|
| 767 |
|
|
| 289 |
|
|
| 772 |
|
Income (loss) before income taxes |
| 1,326 |
|
|
| 4,777 |
|
|
| 3,481 |
|
|
| 2,340 |
|
|
| (16,607 | ) |
|
| 2,889 |
|
|
| 4,842 |
|
|
| 5,380 |
|
Net income (loss) | $ | 638 |
|
| $ | 3,262 |
|
| $ | 2,440 |
|
| $ | 1,602 |
|
| $ | (8,503 | ) |
| $ | 2,495 |
|
| $ | 3,487 |
|
| $ | 3,651 |
|
Basic earnings (loss) per common share |
| 0.03 |
|
|
| 0.16 |
|
|
| 0.12 |
|
|
| 0.09 |
|
|
| (0.43 | ) |
|
| 0.13 |
|
|
| 0.18 |
|
|
| 0.18 |
|
Diluted earnings (loss) per common share |
| 0.03 |
|
|
| 0.16 |
|
|
| 0.12 |
|
|
| 0.09 |
|
|
| (0.43 | ) |
|
| 0.13 |
|
|
| 0.18 |
|
|
| 0.18 |
|
The significant decline in income before income taxes in the fourth quarter of 2014 is due to the Merger related professional services and higher compensation costs coupled with the goodwill impairment charge of $1.2 million related to the sale of ARS. The significant decline in income before income taxes in the fourth quarter of 2013 is due to the pretax goodwill impairment charge of $18.7 million and the $1.2 million pretax other-than-temporary impairment charge related to the Company’s investment in pooled trust preferred securities.
ITEM 7A — QUANTITATIVE AND QUALITATIVE DISCLOSURES ABOUT MARKET RISK
Market risk is the potential for economic losses to be incurred on market risk sensitive instruments arising from adverse changes in market indices such as interest rates, foreign currency exchange rates and commodity prices. Since all Company transactions are denominated in U.S. dollars with no direct foreign exchange or changes in commodity price exposures, the Company’s primary market risk exposure is interest rate risk.
Interest rate risk is the exposure of net interest income to changes in interest rates. Interest rate sensitivity is the relationship between market interest rates and net interest income due to the re-pricing characteristics of assets and liabilities. If more liabilities than assets re-price in a given period (a liability-sensitive position or “negative gap”), market interest rate changes will be reflected more quickly in liability rates. If interest rates decline, such positions will generally benefit net interest income. Alternatively, where assets re-price more quickly than liabilities in a given period (an asset-sensitive position or “positive gap”), a decline in market rates could have an adverse effect on net interest income. Excessive levels of interest rate risk can result in a material adverse effect on the Company’s future financial condition and results of operations. Accordingly, effective risk management techniques that maintain interest rate risk at prudent levels are essential to the Company’s safety and soundness.
The Company has no financial instruments entered into for trading purposes. Federal funds, both purchases and sales, on which rates change daily, and loans and deposits tied to certain indices, such as the prime rate and federal discount rate, are the most market sensitive and have the most stable fair values. The least sensitive instruments include long-term fixed rate loans and securities and fixed rate savings deposits, which have the least stable fair value. On those types falling between these extremes, the management of maturity distributions is as important as the balances maintained. Management of maturity distributions involve the matching of interest rate maturities, as well as principal maturities, and is a key determinant of net interest income. In periods of rapidly changing interest rates, an imbalance (“gap”) between the rate sensitive assets and liabilities can cause major fluctuations in net interest income and in earnings. Establishing patterns of sensitivity which will enhance future growth regardless of frequent shifts in the market conditions is one of the objectives of the Company’s asset/liability management strategy.
Evaluating the Company’s exposure to changes in interest rates is the responsibility of ALSC and includes assessing both the adequacy of the management process used to control interest rate risk and the quantitative level of exposure. When assessing the interest rate risk management process, the Company seeks to ensure that appropriate policies, procedures, management information systems and internal controls are in place to maintain interest rate risk at appropriate levels. Evaluating the quantitative level of
59
interest rate risk exposure requires the Company to assess the existing and potential future effects of changes in interest rates on its consolidated financial condition, including capital adequacy, earnings, liquidity and asset quality.
The Company uses the simulation analysis to estimate the effect that specific movements in interest rates would have on net interest income. This analysis incorporates management assumptions about the levels of future balance sheet trends, different patterns of interest rate movements, and changing relationships between interest rates (i.e. basis risk). These assumptions have been developed through a combination of historical analysis and future expected pricing behavior. For a given level of market interest rate changes, the simulation can consider the impact of the varying behavior of cash flows from principal prepayments on the loan portfolio and mortgage-backed securities, call activities on investment securities, balance changes on non-contractual maturity deposit products (demand deposits, checking with interest, money market and savings accounts), and embedded option risk by taking into account the effects of interest rate caps and floors. The impact of planned growth and anticipated new business activities is not integrated into the simulation analysis. The Company can assess the results of the simulation and, if necessary, implement suitable strategies to adjust the structure of its assets and liabilities to reduce potential unacceptable risks to net interest income. The simulation analysis at December 31, 2014 shows the Company’s net interest income increasing moderately if rates rise and decreasing slightly if rates fall.
The Company’s policy limit on interest rate risk is that if interest rates were to gradually increase or decrease 200 basis points from current rates, the percentage change in estimated net interest income for the subsequent 12 month measurement period should not decline by more than 15.0 percent. Net interest income is forecasted using various interest rate scenarios that management believes are reasonably likely to impact the Company’s financial condition. A base case scenario, in which current interest rates remain stable, is used for comparison to other scenario simulations. The table below illustrates the estimated exposures under a rising rate scenario and a declining rate scenario calculated as a percentage change in estimated net interest income from the base case scenario, assuming a gradual shift in interest rates for the next 12 month measurement period, beginning December 31, 2014 and 2013.
|
| Percent Change in Estimated |
| Percent Change in Estimated |
|
| Net Interest Income from |
| Net Interest Income from |
Gradual Change in Interest Rates |
| December 31, 2014 |
| December 31, 2013 |
+200 basis points |
| 1.1% |
| 5.6% |
-100 basis points |
| (2.4)% |
| (2.6)% |
Since 2008, a 100 basis point downward change was substituted for the 200 basis point downward scenario previously used, as management believes that a 200 basis point downward change is not a plausible analysis in light of current interest rate levels. The percentage change in estimated net income in the +200 and -100 basis points scenario is within the Company’s policy limits.
As with any method of measuring interest rate risk, there are certain limitations inherent in the method of analysis presented. Actual results may differ significantly from simulated results should market conditions and management strategies, among other factors, vary from the assumptions used in the analysis. The model assumes that certain assets and liabilities of similar maturity or period to re-pricing will react the same to changes in interest rates, but, in reality, they may react in different degrees to changes in market interest rates. Specific types of financial instruments may fluctuate in advance of changes in market interest rates, while other types of financial instruments may lag behind changes in market interest rates. Additionally, other assets, such as adjustable-rate loans, have features which restrict changes in interest rates on a short-term basis and over the life of the asset. Furthermore, in the event of a change in interest rates, expected rates of prepayments on loans and securities and early withdrawals from time deposits could deviate significantly from those assumed in the simulation.
One way to minimize interest rate risk is to maintain a balanced or matched interest rate sensitivity position. However, profits are not always maximized by matched funding. To increase net interest earnings, the Company selectively mismatches asset and liability re-pricing to take advantage of short-term interest rate movements and the shape of the U.S. Treasury yield curve. The magnitude of the mismatch depends on a careful assessment of the risks presented by forecasted interest rate movements. The risk inherent in such a mismatch, or gap, is that interest rates may not move as anticipated.
Interest rate risk exposure is reviewed in quarterly meetings in which guidelines are established for the following quarter and the longer term exposure. The structural interest rate mismatch is reviewed periodically by ALSC and management.
The Company also prepares a static gap analysis. Balance sheet items are appropriately categorized by contractual maturity, expected average lives for mortgage-backed securities, or re-pricing dates, with prime rate indexed loans and certificates of deposit. Checking with interest accounts, savings accounts, money market accounts and other borrowings constitute the bulk of the floating rate category. The determination of the interest rate sensitivity of non-contractual items is arrived at in a subjective fashion. Savings accounts are viewed as a relatively stable source of funds and are therefore classified as intermediate funds.
60
At December 31, 2014, the “Static Gap” showed a positive cumulative gap of $346.8 million in the one day to one year re-pricing period, as compared to a positive cumulative gap of $580.9 million at December 31, 2013. The change in the cumulative static gap between December 31, 2014 and December 31, 2013 reflects the results of the Company’s efforts to reposition its portfolios as a result of changes in interest rates and changes to the shape of the yield curve. Management believes that this strategy has enabled the Company to be well positioned for the next cycle of interest rate changes and to address conditions which may arise as a result of the current financial crisis.
61
ITEM 8 — FINANCIAL STATEMENTS AND SUPPLEMENTARY DATA
INDEX TO CONSOLIDATED FINANCIAL STATEMENTS
| 63 | |
CONSOLIDATED FINANCIAL STATEMENTS AS OF DECEMBER 31, 2014 AND 2013, AND FOR EACH OF THE THREE YEARS IN THE PERIOD ENDED DECEMBER 31, 2014: |
|
|
|
| 66 |
|
| 67 |
|
| 68 |
|
| 69 |
|
| 70 |
|
| 71 |
62
Report of Independent Registered Public Accounting Firm
The Board of Directors and Stockholders
Hudson Valley Holding Corp.:
We have audited the accompanying consolidated balance sheet of Hudson Valley Holding Corp. and Subsidiaries as of December 31, 2014, and the related consolidated statements of income, comprehensive income (loss), changes in stockholders’ equity, and cash flows for the year then ended. These consolidated financial statements are the responsibility of the Company’s management. Our responsibility is to express an opinion on these consolidated financial statements based on our audit.
We conducted our audit in accordance with the standards of the Public Company Accounting Oversight Board (United States). Those standards require that we plan and perform the audit to obtain reasonable assurance about whether the financial statements are free of material misstatement. An audit includes examining, on a test basis, evidence supporting the amounts and disclosures in the financial statements. An audit also includes assessing the accounting principles used and significant estimates made by management, as well as evaluating the overall financial statement presentation. We believe that our audit provides a reasonable basis for our opinion.
In our opinion, the consolidated financial statements referred to above present fairly, in all material respects, the financial position of Hudson Valley Holding Corp. and Subsidiaries as of December 31, 2014, and the results of their operations and their cash flows for the year then ended, in conformity with U.S. generally accepted accounting principles.
We also have audited, in accordance with the standards of the Public Company Accounting Oversight Board (United States), Hudson Valley Holding Corp. and Subsidiaries’ internal control over financial reporting as of December 31, 2014, based on criteria established in Internal Control – Integrated Framework (1992) issued by the Committee of Sponsoring Organizations of the Treadway Commission (COSO), and our report dated March 13, 2015 expressed an unqualified opinion on the effectiveness of the Company’s internal control over financial reporting.
/s/ KPMG LLP
New York, New York
March 13, 2015
63
Report of Independent Registered Public Accounting Firm
The Board of Directors and Stockholders
Hudson Valley Holding Corp.:
We have audited Hudson Valley Holding Corp. and Subsidiaries’ (the Company) internal control over financial reporting as of December 31, 2014, based on criteria established in Internal Control – Integrated Framework (1992) issued by the Committee of Sponsoring Organizations of the Treadway Commission (COSO). Hudson Valley Holding Corp. and Subsidiaries’ management is responsible for maintaining effective internal control over financial reporting and for its assessment of the effectiveness of internal control over financial reporting, included in the accompanying Management’s Report on Internal Control Over Financial Reporting. Our responsibility is to express an opinion on the Company’s internal control over financial reporting based on our audit.
We conducted our audit in accordance with the standards of the Public Company Accounting Oversight Board (United States). Those standards require that we plan and perform the audit to obtain reasonable assurance about whether effective internal control over financial reporting was maintained in all material respects. Our audit included obtaining an understanding of internal control over financial reporting, assessing the risk that a material weakness exists, and testing and evaluating the design and operating effectiveness of internal control based on the assessed risk. Our audit also included performing such other procedures as we considered necessary in the circumstances. We believe that our audit provides a reasonable basis for our opinion.
A company’s internal control over financial reporting is a process designed to provide reasonable assurance regarding the reliability of financial reporting and the preparation of financial statements for external purposes in accordance with generally accepted accounting principles. A company’s internal control over financial reporting includes those policies and procedures that (1) pertain to the maintenance of records that, in reasonable detail, accurately and fairly reflect the transactions and dispositions of the assets of the company; (2) provide reasonable assurance that transactions are recorded as necessary to permit preparation of financial statements in accordance with generally accepted accounting principles, and that receipts and expenditures of the company are being made only in accordance with authorizations of management and directors of the company; and (3) provide reasonable assurance regarding prevention or timely detection of unauthorized acquisition, use, or disposition of the company’s assets that could have a material effect on the financial statements.
Because of its inherent limitations, internal control over financial reporting may not prevent or detect misstatements. Also, projections of any evaluation of effectiveness to future periods are subject to the risk that controls may become inadequate because of changes in conditions, or that the degree of compliance with the policies or procedures may deteriorate.
In our opinion, Hudson Valley Holding Corp. and Subsidiaries maintained, in all material respects, effective internal control over financial reporting as of December 31, 2014, based on criteria established in Internal Control – Integrated Framework (1992) issued by the Committee of Sponsoring Organizations of the Treadway Commission.
We also have audited, in accordance with the standards of the Public Company Accounting Oversight Board (United States), the consolidated balance sheet of Hudson Valley Holding Corp. and Subsidiaries as of December 31, 2014, and the related consolidated statements of income, comprehensive income (loss), changes in stockholders’ equity, and cash flows for the year then ended, and our report dated March 13, 2015 expressed an unqualified opinion on those consolidated financial statements.
/s/ KPMG LLP
New York, NY
March 13, 2015
64
REPORT OF INDEPENDENT REGISTERED PUBLIC ACCOUNTING FIRM
To the Directors and Stockholders of
Hudson Valley Holding Corp.
Yonkers, New York
We have audited the accompanying consolidated balance sheet of Hudson Valley Holding Corp. and Subsidiaries as of December 31, 2013 and the related consolidated statements of income, comprehensive income (loss), changes in stockholders’ equity and cash flows for each of the years in the two year period ended December 31, 2013.
We conducted our audit in accordance with the standards of the Public Company Accounting Oversight Board (United States). Those standards require that we plan and perform the audit to obtain reasonable assurance about whether the financial statements are free of material misstatement. An audit includes examining, on a test basis, evidence supporting the amounts and disclosures in the financial statements. An audit also includes assessing the accounting principles used and significant estimates made by management, as well as evaluating the overall financial statement presentation. We believe that our audit provides a reasonable basis for our opinion.
In our opinion, the consolidated financial statements referred to above present fairly, in all material respects, the financial position of Hudson Valley Holding Corp. and Subsidiaries as of December 31, 2013 and the results of their operations and their cash flows for each of the years in the two year period ended December 31, 2013 in conformity with accounting principles generally accepted in the United States of America.
/s/ Crowe Horwath LLP
New York, New York
March 17, 2014
65
HUDSON VALLEY HOLDING CORP. AND SUBSIDIARIES
CONSOLIDATED STATEMENTS OF INCOME
(In thousands, except per share data)
|
| Year Ended December 31, |
| |||||||||
|
| 2014 |
|
| 2013 |
|
| 2012 |
| |||
Interest Income: |
|
|
|
|
|
|
|
|
|
|
|
|
Loans, including fees |
| $ | 81,393 |
|
| $ | 75,209 |
|
| $ | 93,255 |
|
Securities: |
|
|
|
|
|
|
|
|
|
|
|
|
Taxable |
|
| 12,115 |
|
|
| 9,436 |
|
|
| 11,898 |
|
Exempt from federal income taxes |
|
| 2,388 |
|
|
| 2,915 |
|
|
| 3,606 |
|
Federal funds sold |
|
| 31 |
|
|
| 38 |
|
|
| 39 |
|
Deposits in banks |
|
| 1,164 |
|
|
| 1,985 |
|
|
| 1,254 |
|
Total interest income |
|
| 97,091 |
|
|
| 89,583 |
|
|
| 110,052 |
|
Interest Expense: |
|
|
|
|
|
|
|
|
|
|
|
|
Deposits |
|
| 4,714 |
|
|
| 4,895 |
|
|
| 5,897 |
|
Securities sold under repurchase agreements and other short-term borrowings |
|
| 39 |
|
|
| 27 |
|
|
| 98 |
|
Other borrowings |
|
| 10 |
|
|
| 724 |
|
|
| 728 |
|
Total interest expense |
|
| 4,763 |
|
|
| 5,646 |
|
|
| 6,723 |
|
Net Interest Income |
|
| 92,328 |
|
|
| 83,937 |
|
|
| 103,329 |
|
Provision for loan losses |
|
| 1,792 |
|
|
| 2,476 |
|
|
| 8,507 |
|
Net interest income after provision for loan losses |
|
| 90,536 |
|
|
| 81,461 |
|
|
| 94,822 |
|
Non-Interest Income: |
|
|
|
|
|
|
|
|
|
|
|
|
Service charges |
|
| 6,184 |
|
|
| 5,813 |
|
|
| 6,279 |
|
Investment advisory fees |
|
| 7,630 |
|
|
| 7,731 |
|
|
| 9,458 |
|
Realized gains on securities available for sale, net |
|
| 50 |
|
|
| — |
|
|
| — |
|
Net impairment loss recognized in earnings |
|
| — |
|
|
| (1,240 | ) |
|
| (528 | ) |
Gains on sales and revaluation of other real estate owned, net |
|
| — |
|
|
| 17 |
|
|
| 15,920 |
|
Loss on sale of subsidiary company |
|
| (853 | ) |
|
| — |
|
|
| — |
|
Prepayment penalty - FHLB Borrowings |
|
| (1,860 | ) |
|
| — |
|
|
| — |
|
Other income |
|
| 2,535 |
|
|
| 2,823 |
|
|
| 2,713 |
|
Total non-interest income |
|
| 13,686 |
|
|
| 15,144 |
|
|
| 33,842 |
|
Non-Interest Expense: |
|
|
|
|
|
|
|
|
|
|
|
|
Salaries and employee benefits |
|
| 52,836 |
|
|
| 45,109 |
|
|
| 44,813 |
|
Occupancy |
|
| 8,567 |
|
|
| 8,590 |
|
|
| 8,693 |
|
Professional services |
|
| 8,229 |
|
|
| 6,846 |
|
|
| 7,587 |
|
Equipment |
|
| 4,101 |
|
|
| 4,139 |
|
|
| 4,522 |
|
Business development |
|
| 3,061 |
|
|
| 2,165 |
|
|
| 2,417 |
|
FDIC assessment |
|
| 2,311 |
|
|
| 3,879 |
|
|
| 3,154 |
|
Goodwill impairment |
|
| 1,153 |
|
|
| 18,700 |
|
|
| — |
|
Other operating expenses |
|
| 12,040 |
|
|
| 10,673 |
|
|
| 11,352 |
|
Total non-interest expense |
|
| 92,298 |
|
|
| 100,101 |
|
|
| 82,538 |
|
Income (loss) before income taxes |
|
| 11,924 |
|
|
| (3,496 | ) |
|
| 46,126 |
|
Income tax expense (benefit) |
|
| 3,982 |
|
|
| (4,626 | ) |
|
| 16,945 |
|
Net Income |
| $ | 7,942 |
|
| $ | 1,130 |
|
| $ | 29,181 |
|
Basic earnings per common share |
| $ | 0.40 |
|
| $ | 0.06 |
|
| $ | 1.49 |
|
Diluted earnings per common share |
| $ | 0.40 |
|
| $ | 0.06 |
|
| $ | 1.49 |
|
See notes to consolidated financial statements
66
HUDSON VALLEY HOLDING CORP. AND SUBSIDIARIES
CONSOLIDATED STATEMENTS OF COMPREHENSIVE INCOME (LOSS)
(In thousands)
|
| Year Ended December 31, |
| |||||||||
|
|
| 2014 |
|
|
| 2013 |
|
|
| 2012 |
|
Net Income |
| $ | 7,942 |
|
| $ | 1,130 |
|
| $ | 29,181 |
|
Other comprehensive income (loss), net of tax: |
|
|
|
|
|
|
|
|
|
|
|
|
Net change in unrealized gains (losses): |
|
|
|
|
|
|
|
|
|
|
|
|
Other-than-temporarily impaired securities available for sale: |
|
|
|
|
|
|
|
|
|
|
|
|
Total gains |
|
| — |
|
|
| 6,331 |
|
|
| 739 |
|
Losses recognized in earnings |
|
| — |
|
|
| 1,240 |
|
|
| 528 |
|
Gains recognized in comprehensive income |
|
| — |
|
|
| 7,571 |
|
|
| 1,267 |
|
Income tax effect |
|
| — |
|
|
| (3,104 | ) |
|
| (519 | ) |
Unrealized holding gains on other-than-temporarily impaired securities available for sale, net of tax |
|
| — |
|
|
| 4,467 |
|
|
| 748 |
|
Securities available for sale not other-than-temporarily impaired: |
|
|
|
|
|
|
|
|
|
|
|
|
Gains (losses) arising during the year |
|
| 9,276 |
|
|
| (16,985 | ) |
|
| (4,754 | ) |
Income tax effect |
|
| (3,576 | ) |
|
| 6,566 |
|
|
| 1,706 |
|
|
|
| 5,700 |
|
|
| (10,419 | ) |
|
| (3,048 | ) |
Gains recognized in earnings |
|
| (50 | ) |
|
| — |
|
|
| — |
|
Income tax effect |
|
| 20 |
|
|
| — |
|
|
| — |
|
|
|
| (30 | ) |
|
| — |
|
|
| — |
|
Unrealized holding gains (losses) on securities available for sale not other-than-temporarily-impaired, net of tax |
|
| 5,670 |
|
|
| (10,419 | ) |
|
| (3,048 | ) |
Unrealized holding gains (losses) on securities, net |
|
| 5,670 |
|
|
| (5,952 | ) |
|
| (2,300 | ) |
Accrued benefit liability adjustment: |
|
|
|
|
|
|
|
|
|
|
|
|
Net gain during the year |
|
| (362 | ) |
|
| (33 | ) |
|
| (895 | ) |
Reclassification adjustment for amortization of prior service cost and net gain/loss included in net period pension cost |
|
| 328 |
|
|
| 750 |
|
|
| 438 |
|
Income tax effect |
|
| 14 |
|
|
| (287 | ) |
|
| 182 |
|
Net of tax |
|
| (20 | ) |
|
| 430 |
|
|
| (275 | ) |
Other comprehensive income (loss) |
|
| 5,650 |
|
|
| (5,522 | ) |
|
| (2,575 | ) |
Comprehensive Income (Loss) |
| $ | 13,592 |
|
| $ | (4,392 | ) |
| $ | 26,606 |
|
|
|
|
|
|
|
|
|
|
|
|
|
|
See notes to consolidated financial statements
67
HUDSON VALLEY HOLDING CORP. AND SUBSIDIARIES
(In thousands, except share and per share data)
|
| December 31 |
| |||||
|
| 2014 |
|
| 2013 |
| ||
ASSETS |
|
|
|
|
|
|
|
|
Cash and non-interest earning due from banks |
| $ | 33,208 |
|
| $ | 37,711 |
|
Interest earning deposits in banks |
|
| 259,660 |
|
|
| 661,643 |
|
Total cash and cash equivalents |
|
| 292,868 |
|
|
| 699,354 |
|
Federal funds sold |
|
| 13,673 |
|
|
| 27,134 |
|
Securities available for sale, at estimated fair value (amortized cost of $815,077 in |
|
|
|
|
|
|
|
|
2014 and $550,785 in 2013) |
|
| 815,716 |
|
|
| 542,198 |
|
Securities held to maturity, at amortized cost (estimated fair value of $4,404 in |
|
|
|
|
|
|
|
|
2014 and $6,556 in 2013) |
|
| 4,158 |
|
|
| 6,238 |
|
Federal Home Loan Bank of New York (FHLB) stock |
|
| 2,409 |
|
|
| 3,478 |
|
Loans (net of allowance for loan losses of $27,342 in 2014 and $25,990 in 2013) |
|
| 1,900,814 |
|
|
| 1,606,179 |
|
Accrued interest and other receivables |
|
| 13,219 |
|
|
| 14,663 |
|
Premises and equipment, net |
|
| 15,251 |
|
|
| 15,103 |
|
Deferred income tax, net |
|
| 26,364 |
|
|
| 31,433 |
|
Bank owned life insurance |
|
| 43,058 |
|
|
| 41,224 |
|
Goodwill |
|
| 3,989 |
|
|
| 5,142 |
|
Other intangible assets |
|
| 523 |
|
|
| 713 |
|
Other assets |
|
| 6,528 |
|
|
| 6,340 |
|
Total Assets |
| $ | 3,138,570 |
|
| $ | 2,999,199 |
|
|
|
|
|
|
|
|
|
|
LIABILITIES |
|
|
|
|
|
|
|
|
Deposits: |
|
|
|
|
|
|
|
|
Non-interest bearing |
| $ | 1,081,251 |
|
| $ | 1,069,631 |
|
Interest bearing |
|
| 1,699,821 |
|
|
| 1,564,113 |
|
Total deposits |
|
| 2,781,072 |
|
|
| 2,633,744 |
|
Securities sold under repurchase agreements and other short-term borrowings |
|
| 28,161 |
|
|
| 34,379 |
|
Other borrowings |
|
| — |
|
|
| 16,388 |
|
Accrued interest and other liabilities |
|
| 31,771 |
|
|
| 30,379 |
|
Total Liabilities |
|
| 2,841,004 |
|
|
| 2,714,890 |
|
|
|
|
|
|
|
|
|
|
STOCKHOLDERS’ EQUITY |
|
|
|
|
|
|
|
|
Preferred stock, $0.01 par value; authorized 15,000,000 shares; no shares |
|
|
|
|
|
|
|
|
outstanding in 2014 and 2013, respectively |
|
| — |
|
|
| — |
|
Common stock, $0.20 par value; authorized 25,000,000 shares: outstanding |
|
|
|
|
|
|
|
|
20,082,568 and 19,935,559 shares in 2014 and 2013, respectively |
|
| 4,276 |
|
|
| 4,247 |
|
Additional paid-in capital |
|
| 356,339 |
|
|
| 351,108 |
|
Retained deficit |
|
| (4,764 | ) |
|
| (7,111 | ) |
Accumulated other comprehensive loss |
|
| (721 | ) |
|
| (6,371 | ) |
Treasury stock, at cost; 1,299,414 shares in 2014 and 2013 |
|
| (57,564 | ) |
|
| (57,564 | ) |
Total Stockholders' Equity |
|
| 297,566 |
|
|
| 284,309 |
|
Total Liabilities and Stockholders' Equity |
| $ | 3,138,570 |
|
| $ | 2,999,199 |
|
|
|
|
|
|
|
|
|
|
See notes to consolidated financial statements
68
HUDSON VALLEY HOLDING CORP. AND SUBSIDIARIES
CONSOLIDATED STATEMENTS OF CHANGES IN STOCKHOLDERS’ EQUITY
For the years ended December 31, 2014, 2013 and 2012
(In thousands, except share and per share data)
|
|
|
|
|
|
|
|
|
|
|
|
|
|
|
|
|
|
|
|
|
| Accumulated |
|
|
|
|
| |
|
| Number of |
|
|
|
|
|
|
|
|
|
| Additional |
|
| Retained |
|
| Other |
|
|
|
|
| ||||
|
| Shares |
|
| Common |
|
| Treasury |
|
| Paid-in |
|
| Earnings |
|
| Comprehensive |
|
|
|
|
| ||||||
|
| Outstanding |
|
| Stock |
|
| Stock |
|
| Capital |
|
| (Deficit) |
|
| Income (Loss) |
|
| Total |
| |||||||
|
|
|
|
|
|
|
|
|
|
|
|
|
|
|
|
|
|
|
|
|
|
|
|
|
|
|
|
|
Balance at January 1, 2012 |
|
| 19,516,490 |
|
| $ | 4,163 |
|
| $ | (57,564 | ) |
| $ | 347,764 |
|
| $ | (18,527 | ) |
| $ | 1,726 |
|
| $ | 277,562 |
|
Net income |
|
| — |
|
|
| — |
|
|
| — |
|
|
| — |
|
|
| 29,181 |
|
|
| — |
|
|
| 29,181 |
|
Other comprehensive loss |
|
| — |
|
|
| — |
|
|
| — |
|
|
| — |
|
|
| — |
|
|
| (2,575 | ) |
|
| (2,575 | ) |
Vesting and exercise of stock options, net of tax |
|
| 35,258 |
|
|
| 7 |
|
|
| — |
|
|
| 493 |
|
|
| — |
|
|
| — |
|
|
| 500 |
|
Restricted stock awards and related expense |
|
| 209,678 |
|
|
| 42 |
|
|
| — |
|
|
| 386 |
|
|
| — |
|
|
| — |
|
|
| 428 |
|
Cash dividends ($0.72 per share) |
|
| — |
|
|
| — |
|
|
| — |
|
|
| — |
|
|
| (14,125 | ) |
|
| — |
|
|
| (14,125 | ) |
|
|
|
|
|
|
|
|
|
|
|
|
|
|
|
|
|
|
|
|
|
|
|
|
|
|
|
|
|
Balance at December 31, 2012 |
|
| 19,761,426 |
|
|
| 4,212 |
|
|
| (57,564 | ) |
|
| 348,643 |
|
|
| (3,471 | ) |
|
| (849 | ) |
|
| 290,971 |
|
|
|
|
|
|
|
|
|
|
|
|
|
|
|
|
|
|
|
|
|
|
|
|
|
|
|
|
|
|
Net income |
|
| — |
|
|
| — |
|
|
| — |
|
|
| — |
|
|
| 1,130 |
|
|
| — |
|
|
| 1,130 |
|
Other comprehensive loss |
|
| — |
|
|
| — |
|
|
| — |
|
|
| — |
|
|
| — |
|
|
| (5,522 | ) |
|
| (5,522 | ) |
Common stock issued for dividend reinvestment |
|
| 2,287 |
|
|
| — |
|
|
| — |
|
|
| 41 |
|
|
| — |
|
|
| — |
|
|
| 41 |
|
Vesting and exercise of stock options, net of tax |
|
| 60,732 |
|
|
| 13 |
|
|
| — |
|
|
| 1,081 |
|
|
| — |
|
|
| — |
|
|
| 1,094 |
|
Restricted stock awards and related expense |
|
| 111,114 |
|
|
| 22 |
|
|
| — |
|
|
| 1,343 |
|
|
| — |
|
|
| — |
|
|
| 1,365 |
|
Cash dividends ($0.24 per share) |
|
| — |
|
|
| — |
|
|
| — |
|
|
| — |
|
|
| (4,770 | ) |
|
| — |
|
|
| (4,770 | ) |
|
|
|
|
|
|
|
|
|
|
|
|
|
|
|
|
|
|
|
|
|
|
|
|
|
|
|
|
|
Balance at December 31, 2013 |
|
| 19,935,559 |
|
|
| 4,247 |
|
|
| (57,564 | ) |
|
| 351,108 |
|
|
| (7,111 | ) |
|
| (6,371 | ) |
|
| 284,309 |
|
|
|
|
|
|
|
|
|
|
|
|
|
|
|
|
|
|
|
|
|
|
|
|
|
|
|
|
|
|
Net income |
|
| — |
|
|
| — |
|
|
| — |
|
|
| — |
|
|
| 7,942 |
|
|
| — |
|
|
| 7,942 |
|
Other comprehensive income |
|
| — |
|
|
| — |
|
|
| — |
|
|
| — |
|
|
| — |
|
|
| 5,650 |
|
|
| 5,650 |
|
Common stock issued for dividend reinvestment |
|
| 3,087 |
|
|
| 1 |
|
|
| — |
|
|
| 60 |
|
|
| — |
|
|
| — |
|
|
| 61 |
|
Vesting and exercise of stock options, net of tax |
|
| 117,232 |
|
|
| 23 |
|
|
| — |
|
|
| 2,539 |
|
|
| — |
|
|
| — |
|
|
| 2,562 |
|
Restricted stock awards and related expense |
|
| 26,690 |
|
|
| 5 |
|
|
| — |
|
|
| 2,632 |
|
|
| — |
|
|
| — |
|
|
| 2,637 |
|
Cash dividends ($0.28 per share) |
|
| — |
|
|
| — |
|
|
| — |
|
|
| — |
|
|
| (5,595 | ) |
|
| — |
|
|
| (5,595 | ) |
|
|
|
|
|
|
|
|
|
|
|
|
|
|
|
|
|
|
|
|
|
|
|
|
|
|
|
|
|
Balance at December 31, 2014 |
|
| 20,082,568 |
|
| $ | 4,276 |
|
| $ | (57,564 | ) |
| $ | 356,339 |
|
| $ | (4,764 | ) |
| $ | (721 | ) |
| $ | 297,566 |
|
|
|
|
|
|
|
|
|
|
|
|
|
|
|
|
|
|
|
|
|
|
|
|
|
|
|
|
|
|
See notes to consolidated financial statements
69
HUDSON VALLEY HOLDING CORP. AND SUBSIDIARIES
CONSOLIDATED STATEMENTS OF CASH FLOWS
(In thousands)
|
| Year Ended December 31, |
| |||||||||
|
|
| 2014 |
|
|
| 2013 |
|
|
| 2012 |
|
Operating Activities: |
|
|
|
|
|
|
|
|
|
|
|
|
Net Income |
| $ | 7,942 |
|
| $ | 1,130 |
|
| $ | 29,181 |
|
Adjustments to reconcile net income to net cash provided by operating activities: |
|
|
|
|
|
|
|
|
|
|
|
|
Provision for loan losses |
|
| 1,792 |
|
|
| 2,476 |
|
|
| 8,507 |
|
Depreciation and amortization |
|
| 2,775 |
|
|
| 4,220 |
|
|
| 3,926 |
|
Recognized impairment charge on securities available for sale |
|
| — |
|
|
| 1,240 |
|
|
| 528 |
|
Realized gain on security transactions, net |
|
| (50 | ) |
|
| — |
|
|
| — |
|
Amortization of premiums on securities, net |
|
| 3,084 |
|
|
| 1,735 |
|
|
| 2,067 |
|
Realized (gain) loss on sale of loans and revaluation of OREO, net |
|
| — |
|
|
| (17 | ) |
|
| 15 |
|
Increase in cash value of bank owned life insurance |
|
| (1,570 | ) |
|
| (1,703 | ) |
|
| (1,430 | ) |
Amortization of other intangible assets |
|
| 190 |
|
|
| 190 |
|
|
| 748 |
|
Share-based payment expense |
|
| 2,637 |
|
|
| 1,365 |
|
|
| 381 |
|
Impairment charge on goodwill |
|
| 1,153 |
|
|
| 18,700 |
|
|
| — |
|
Loss on sale of subsidiary company |
|
| 853 |
|
|
| — |
|
|
| — |
|
Realized gain on sale of loans held-for-sale |
|
| — |
|
|
| — |
|
|
| (15,935 | ) |
Deferred tax expense (benefit) |
|
| 1,527 |
|
|
| (8,995 | ) |
|
| 1,928 |
|
Increase (decrease) in deferred loan fees, net |
|
| 627 |
|
|
| (3,790 | ) |
|
| (1,452 | ) |
Decrease in accrued interest and other receivables |
|
| 1,444 |
|
|
| 10,163 |
|
|
| 15,579 |
|
(Increase) decrease in other assets |
|
| (188 | ) |
|
| 2,597 |
|
|
| 3,959 |
|
Excess tax benefit from share-based payment arrangements |
|
| (385 | ) |
|
| (166 | ) |
|
| (38 | ) |
Increase in accrued interest and other liabilities |
|
| 504 |
|
|
| 1,834 |
|
|
| 3,501 |
|
Net Cash Provided by Operating Activities |
|
| 22,335 |
|
|
| 30,979 |
|
|
| 51,465 |
|
Investing Activities: |
|
|
|
|
|
|
|
|
|
|
|
|
Net decrease (increase) in short term investments |
|
| 13,461 |
|
|
| (7,883 | ) |
|
| (2,826 | ) |
Decrease (increase) in FHLB stock |
|
| 1,069 |
|
|
| 1,348 |
|
|
| (995 | ) |
Proceeds from maturities of securities available for sale |
|
| 148,524 |
|
|
| 181,732 |
|
|
| 249,065 |
|
Proceeds from maturities of securities held to maturity |
|
| 2,071 |
|
|
| 3,999 |
|
|
| 2,685 | �� |
Proceeds from sales of securities available for sale |
|
| 10,480 |
|
|
| 789 |
|
|
| 9,997 |
|
Purchases of securities available for sale |
|
| (426,320 | ) |
|
| (292,050 | ) |
|
| (202,322 | ) |
Proceeds from sales and payments of loans held for sale |
|
| — |
|
|
| — |
|
|
| 487,432 |
|
Net (increase) decrease in loans |
|
| (297,054 | ) |
|
| (161,788 | ) |
|
| 93,590 |
|
Proceeds from sales of OREO |
|
| — |
|
|
| 267 |
|
|
| 909 |
|
Premiums paid on bank owned life insurance |
|
| (264 | ) |
|
| (264 | ) |
|
| (264 | ) |
Net (purchases) sales of premises and equipment |
|
| (2,923 | ) |
|
| 4,673 |
|
|
| (1,986 | ) |
Net Cash (Used in) Provided by Investing Activities |
|
| (550,956 | ) |
|
| (269,177 | ) |
|
| 635,285 |
|
Financing Activities: |
|
|
|
|
|
|
|
|
|
|
|
|
Proceeds from issuance of common stock |
|
| 2,623 |
|
|
| 1,094 |
|
|
| 547 |
|
Excess tax benefits from share-based payment arrangements |
|
| 385 |
|
|
| 166 |
|
|
| 38 |
|
Net increase in deposits |
|
| 147,328 |
|
|
| 113,783 |
|
|
| 94,679 |
|
Cash dividends paid |
|
| (5,595 | ) |
|
| (4,729 | ) |
|
| (14,125 | ) |
Repayment of other borrowings |
|
| (16,388 | ) |
|
| (40 | ) |
|
| (38 | ) |
Net decrease in securities sold under repurchase agreements and short-term borrowings |
|
| (6,218 | ) |
|
| (245 | ) |
|
| (18,432 | ) |
Net Cash Provided by Financing Activities |
|
| 122,135 |
|
|
| 110,029 |
|
|
| 62,669 |
|
(Decrease) Increase in Cash and Cash Equivalents |
|
| (406,486 | ) |
|
| (128,169 | ) |
|
| 749,419 |
|
Cash and Cash Equivalents, Beginning of Period |
|
| 699,354 |
|
|
| 827,523 |
|
|
| 78,104 |
|
Cash and Cash Equivalents, End of Period |
| $ | 292,868 |
|
| $ | 699,354 |
|
| $ | 827,523 |
|
Supplemental Disclosures: |
|
|
|
|
|
|
|
|
|
|
|
|
Interest paid |
| $ | 4,839 |
|
| $ | 5,565 |
|
| $ | 7,772 |
|
Income tax payments |
|
| 65 |
|
|
| 5,095 |
|
|
| 969 |
|
Change in unrealized loss on securities available for sale, net of tax |
|
| 5,670 |
|
|
| (5,952 | ) |
|
| (2,300 | ) |
Transfers from loans held for sale back to loan portfolio |
|
| — |
|
|
| 2,317 |
|
|
| 121 |
|
See notes to consolidated financial statements
70
HUDSON VALLEY HOLDING CORP. AND SUBSIDIARIES
NOTES TO CONSOLIDATED FINANCIAL STATEMENTS
(Dollars in thousands, except share and per share data)
1 Summary of Significant Accounting Policies
Description of Operations and Basis of Presentation — The consolidated financial statements include the accounts of Hudson Valley Holding Corp. and its wholly owned subsidiaries, Hudson Valley Bank N.A. and its subsidiaries (the “Bank” or “HVB”) and HVHC Risk Management Corp (“HVHC RMC”) (collectively the “Company”). The Company offers a broad range of banking and related services to businesses, professionals, municipalities, not-for-profit organizations and individuals. HVB is a national banking association headquartered in Westchester County, New York. HVB has 28 branch offices, 17 in Westchester County, New York, 2 in Rockland County, New York, and 9 in New York City. The Company provided investment management and broker-dealer services to its customers through the Bank’s wholly-owned subsidiary, A.R. Schmeidler & Co., Inc. (“ARS”), a Manhattan, New York based money management firm. During 2014, HVB formed HVB Equipment Capital LLC to provide equipment loan and lease financing. During 2013, HVB formed HVB Capital Credit LLC to offer asset-based lending products. Subsequent to December 31, 2014, HVB sold ARS, the effects of the sale on the statements of income are recorded in the 2014 financial statements. All significant intercompany balances and transactions have been eliminated in consolidation.
The consolidated financial statements have been prepared in accordance with generally accepted accounting principles. In preparing the consolidated financial statements, management is required to make estimates and assumptions that affect the reported amounts of assets and liabilities as of the date of the consolidated balance sheet and income and expenses for the period. Actual results could differ significantly from those estimates. Estimates that are particularly susceptible to significant change in the near term relates to the determination of the allowance for loan losses, valuation of goodwill, fair value of other real estate owned and fair value of financial instruments. In connection with the determination of the allowance for loan losses, management utilizes the work of professional appraisers for significant properties.
Cash and Cash Equivalents — For purposes of reporting cash flows, cash and cash equivalents include cash on hand, amounts due from banks and interest bearing deposits in other banks (including the Federal Reserve Bank of New York).
Securities — Securities are classified as either available for sale, representing securities the Company may sell in the ordinary course of business, or as held to maturity, representing securities that the Company has determined that it is more likely than not that it would not be required to sell prior to maturity or recovery of cost. Securities available for sale are reported at fair value with unrealized gains and losses (net of tax) excluded from operations and reported in other comprehensive income. Securities held to maturity are stated at amortized cost. Interest income includes amortization of purchase premium and accretion of purchase discount. The amortization of premiums and accretion of discounts is determined by using the level yield method. Securities are not acquired for trading activities. Realized gains and losses from sales of securities are determined using the specific identification method.
The Company regularly reviews declines in the fair value of securities below their costs for purposes of determining whether such declines are other-than-temporary. In estimating other-than-temporary impairment (“OTTI”), management considers adverse changes in expected cash flows, the length of time and extent that fair value has been less than cost and the financial condition and near term prospects of the issuer. The Company also assesses whether it intends to sell, or it is more likely than not that it will be required to sell, a security in an unrealized loss position before recovery of its amortized cost basis. If either of these criteria is met, the entire difference between amortized cost and fair value is recognized as impairment through earnings. For securities that do not meet the aforementioned criteria, the amount of impairment is split into two components as follows: 1) OTTI related to credit loss, which must be recognized through earnings and 2) OTTI related to other factors, which is recognized in other comprehensive income. The credit loss is defined as the difference between the present value of the cash flows expected to be collected and the amortized cost basis.
Loans Held for Sale — Loan sales occur in limited circumstances as part of strategic business or regulatory compliance initiatives. Loans held for sale, including deferred fees and costs, are reported at the lower of cost or fair value as determined by expected bid prices from potential investors. Loans held for sale are segregated into pools based on distinct criteria and the lower of cost or fair value analysis is performed at the pool level. Loans are sold without recourse and servicing released. When a loan is transferred from portfolio to held for sale and the fair value is less than cost, a charge off is recorded against the allowance for loan loss. Subsequent declines in fair value, if any, are recorded as a valuation allowance and charged against earnings.
Loans — Loans are reported at their outstanding principal balance, net of charge-offs, the allowance for loan losses, and deferred loan origination fees and costs. Loan origination fees and certain direct loan origination costs are deferred and recognized over the life of the related loan or commitment as an adjustment to yield, or taken directly into income when the related loan is sold or commitment expires.
71
Allowance for Loan Losses — The Company maintains an allowance for loan losses to absorb inherent probable losses in the loan portfolio. The Company calculates the allowance for loan losses on a quarterly basis applying and documenting a systematic methodology. The Company’s methodology for assessing the appropriateness of the allowance consists of a specific component for identified problem loans, and a formula component which addresses historical loan loss experience together with other relevant risk factors affecting the portfolio. This methodology applies to all portfolio segments.
The specific component incorporates the Company’s analysis of impaired loans. The accounting standards prescribe the measurement methods, income recognition and disclosures related to impaired loans. A loan is recognized as impaired when it is probable that principal and/or interest are not collectible in accordance with the loan’s contractual terms. In addition, a loan which has been renegotiated with a borrower experiencing financial difficulties for which the terms of the loan have been modified with a concession that the Company would not otherwise have granted are considered troubled debt restructurings (“TDR”) and are also recognized as impaired. Measurement of impairment can be based on the present value of expected future cash flows discounted at the loan’s effective interest rate, the loan’s observable market price or the fair value of the collateral, taking into account estimated selling costs, if the loan is collateral dependent. This evaluation is inherently subjective as it requires material estimates that may be susceptible to significant change. If the fair value of an impaired loan is less than the related recorded amount, a specific valuation component is established within the allowance for loan losses or, if the impairment is considered to be permanent, a full or partial charge-off is recorded against the allowance for loan losses. Triggering events that may impact the Company’s decision to record a specific reserve instead of a partial charge-off on impaired loans typically involve some uncertainty as to the amount of loss to be recorded. Examples include ongoing negotiations with a borrower, new appraisals or other collateral evaluations not yet received or completed and other factors where the decision to record a charge-off is considered premature. Subsequent changes in impairment are recorded as an adjustment to the provision for loan losses. The Company has groups of smaller balance homogenous loans which are collectively reviewed for impairment. These groups include residential 1-4 family loans, home equity lines of credit and consumer loans. These loans are not individually risk rated while performing. They are either charged off or evaluated for impairment after 90 days delinquency.
The formula component is calculated by first applying historical loss experience factors to outstanding loans by type. The Company’s primary loan types are commercial real estate (“CRE”), construction, and residential real estate, commercial & industrial, lease financing and other loans. The Company uses a three year average loss experience as the starting point for the formula component. The three year average loss experience is calculated over the loss emergence period (“LEP”). The LEP is an estimate of the average amount of time from the point at which a loss is incurred on a loan to the point at which the loss is confirmed. This component is then adjusted to reflect qualitative risk factors not addressed by historical loss experience. These factors include the evaluation of then-existing economic and business conditions affecting the key lending areas of the Company and other conditions, such as new loan products, credit quality trends (including trends in nonperforming loans expected to result from existing conditions), collateral values, loan volumes and concentrations, recent charge-off and delinquency experience, specific industry conditions within portfolio segments that existed as of the balance sheet date and the impact that such conditions were believed to have had on the collectability of the loan portfolio, changes in the Company’s lending policy, changes in the experience and ability of our lending management staff, changes in the Company’s loan review system, and other external considerations, including regulatory requirements. Senior management reviews these conditions quarterly. Management’s evaluation of the loss related to each of these conditions is quantified by portfolio segment and reflected in the formula component. The evaluations of the inherent loss with respect to these conditions is subject to a higher degree of uncertainty due to the subjective nature of such evaluations and because they are not identified with specific problem credits.
Actual losses can vary significantly from the estimated amounts. The Company’s methodology permits adjustments to the allowance in the event that, in management’s judgment, significant factors which affect the collectability of the loan portfolio as of the evaluation date have changed.
Management believes the allowance for loan losses is the best estimate of probable losses which have been incurred as of December 31, 2014 and 2013. While the Company attributes portions of the allowance for loan losses to the Company’s portfolio segments, the entire allowance is available to absorb credit losses inherent in the total loan portfolio. There is no assurance that the Company will not be required to make future adjustments to the allowance in response to changing economic conditions, particularly in the Company’s service area, since the majority of the Company’s loans are collateralized by real estate. In addition, various regulatory agencies, as an integral part of their examination process, periodically review the Company’s allowance for loan losses. Such agencies may require the Company to recognize additions to the allowance based on their judgments at the time of their examinations.
Loan Charge-Offs — The Company’s charge-off policy covers all loan portfolio classes. Loans are generally fully or partially charged-off at the earlier of when it is determined that collection efforts are no longer productive or when they have been identified as permanent losses by management and/or bank examiners. Factors considered in determining whether collection efforts are no longer productive include any amounts currently being collected, the status of discussions or negotiations with the borrower, the principal
72
and/or guarantors, the cost of continuing, efforts to collect, the status of any foreclosure or legal actions, the value of the collateral, and any other pertinent factors. For loans in groups that are collectively reviewed for impairment, actions taken after 90 days delinquency depend upon the principal balance. Consumer loans, loans and lines with balances of $100 thousand or less and other unsecured loans are charged off after 90 days delinquency. Residential 1-4 mortgages and home equity lines of credit greater than $100 thousand are placed on non-accrual status after 90 days delinquency and are immediately evaluated for collectability utilizing a collateral based impairment analysis. Full or partial charge-offs are taken for impairment recognition on these loans. The loans are then transferred to asset recovery or other legal channels for foreclosure or other resolution.
Income Recognition on Loans — Interest on loans is accrued daily. Net loan origination and commitment fees are deferred and recognized as an adjustment of yield over the lives of the related loans. Loans, including impaired loans, are placed on a non-accrual status when management believes that interest or principal on such loans may not be collected in the normal course of business. When a loan is placed on non-accrual status, all interest previously accrued, but not collected, is reversed against interest income. Interest received on non-accrual loans generally is either applied against principal or reported as interest income, in accordance with management’s judgment as to the collectability of principal. Loans can be returned to accruing status when they become current as to principal and interest, demonstrate a period of performance under the contractual terms, and when, in management’s opinion, they are estimated to be fully collectible. This methodology applies to all loan classes.
Premises and Equipment — Premises and equipment are stated at cost less accumulated depreciation and amortization. Depreciation is computed using the straight-line method over the estimated useful lives of the related assets, generally 3 to 5 years for furniture, fixtures and equipment and 39.5 years for buildings. Leasehold improvements are amortized over the lesser of the term of the lease or the estimated useful life of the asset.
Other Real Estate Owned (“OREO”) — Real estate properties acquired through loan foreclosure are recorded at estimated fair value, net of estimated selling costs, at time of foreclosure establishing a new cost basis. Credit losses arising at the time of foreclosure are charged against the allowance for loan losses. Subsequent valuations are periodically performed by management and the carrying value is adjusted to expense to reflect any subsequent changes in the estimated fair value. Routine holding costs are charged to expense as incurred.
Goodwill and Other Intangible Assets — Goodwill and identified intangible assets with indefinite useful lives are not subject to amortization. Identified intangible assets that have finite useful lives are amortized over those lives by a method which reflects the pattern in which the economic benefits of the intangible asset are used up. Goodwill is subject to impairment testing on an annual basis, or more often if events or circumstances indicate that impairment may exist. Identifiable intangible assets are subject to impairment if events or circumstances indicate that impairment may exist. If such testing indicates impairment in the values and/or remaining amortization periods of the intangible assets, adjustments are made to reflect such impairment.
Loss Contingencies — Loss contingencies, including claims and legal actions arising in the ordinary course of business, are recorded as liabilities when the likelihood of loss is probable and an amount or range of loss can be reasonably estimated. Legal fees associated with loss contingencies are included in loss contingency accruals.
Income Taxes — Income tax expense is the total of the current year income tax due or refundable and the change in deferred tax assets and liabilities. Deferred tax assets and liabilities are recognized for the future tax consequences attributable to differences between the financial statement carrying amounts of assets and liabilities and their respective tax bases. Deferred tax assets and liabilities are measured using enacted tax rates expected to apply to taxable income in the years in which those temporary differences are expected to be recovered or settled. The effect on deferred tax assets and liabilities from a change in tax rates is recognized in income in the period the change is enacted.
At December 31, 2014 and 2013, the Company had no unrecognized tax benefits. The Company does not expect the total amount of unrecognized tax benefits to significantly increase within the next twelve months. The Company policy is to recognize interest and penalties related to unrecognized taxes as a component of income tax expense. There were no expenses accrued for interest and penalties on unrecognized taxes for the years ended December 31, 2014 and 2013.
Stock-Based Compensation — Compensation costs relating to share-based payment transactions are recognized in the financial statements with measurement based upon the fair value of the equity or liability instruments issued. Compensation costs related to share based payment transactions are expensed over their respective vesting periods. The fair value (present value of the estimated future benefit to the recipient) of each restricted stock award is the market price of the Company’s common stock at the grant date. The fair value of stock options was estimated on the grant date using the Black-Scholes option pricing model. No options have been granted since 2008. See Note 11 “Stock-Based Compensation” herein for additional discussion.
73
Earnings per Common Share — ASC 260-10-45, Determining Whether Instruments Granted in Share-Based Payment Transactions Are Participating Securities, addresses whether instruments granted in share-based payment transactions are participating securities prior to vesting and, therefore, need to be included in the calculation of earnings per share. Basic earnings per common share are computed by dividing income attributable to common stock by the weighted average number of common shares outstanding during the period. The computation of diluted earnings per common share is similar to the computation of basic earnings per share except that the denominator is increased to include the number of additional common shares that would have been outstanding if the dilutive potential common shares, consisting solely of stock options, had been issued.
Disclosures About Segments of an Enterprise and Related Information — “Segment Reporting” topic of the FASB Accounting Standards Codification establishes standards for the way business enterprises report information about operating segments and establishes standards for related disclosure about products and services, geographic areas, and major customers. The statement requires that a business enterprise report financial and descriptive information about its reportable operating segments. Operating segments are components of an enterprise about which separate financial information is available that is evaluated regularly by the chief operating decision maker in deciding how to allocate resources and assess performance. The Company has one operating segment, “Community Banking.”
Bank Owned Life Insurance — The Company has purchased life insurance policies on certain key executives. Bank owned life insurance is recorded at the amount that can be realized under the insurance contract at the balance sheet date, which is the cash surrender value adjusted for other charges or other amounts due that are probable at settlement.
Retirement Plans — Pension expense is the net of service and interest cost, and amortization of gains and losses not immediately recognized. Employee 401(k) and profit sharing plan expense is the amount of matching contributions. Supplemental retirement plan expense allocates the benefits over years of service.
Other — Certain prior year amounts have been reclassified to conform to the 2014 presentation.
Recent Accounting Pronouncements
In January 2014, the FASB issued ASU 2014-04, “Receivables—Troubled Debt Restructuring by Creditors (Subtopic 310-40): Reclassification of Residential Real Estate Collateralized Consumer Mortgage Loans Upon Foreclosure.” The ASU clarifies that an in substance repossession or foreclosure has occurred and a creditor is considered to have received physical possession of residential real estate property collateralizing a consumer mortgage loan, upon either the creditor obtaining legal title to the residential real estate property upon completion of a foreclosure or the borrower conveying all interest in the residential real estate property to the creditor to satisfy that loan through completion of a deed in lieu of foreclosure. Interim and annual disclosure is required of both the amount of foreclosed residential real estate property held by the creditor and the recorded investment in consumer mortgage loans collateralized by residential real estate property that are in the process of foreclosure. The new standard is effective using either the modified retrospective transition method or a prospective transition method for fiscal years and interim periods within those years, beginning after December 15, 2014, and early adoption is permitted. We do not expect that this ASU will have a material impact on our results of operations or financial position.
In April 2014, the FASB issued ASU 2014-08, “Presentation of Financial Statements (Topic 205) and Property, Plant, and Equipment (Topic 360) – Reporting Discontinued Operations and Disclosures of Disposals of Components of an Entity,” which changes the criteria for determining which disposals can be presented as discontinued operations and modifies related disclosure requirements. The guidance applies to all entities that dispose of components. It will significantly change current practices for assessing discontinued operations and affect an entity’s income and earnings per share from continuing operations. An entity is required to reclassify assets and liabilities of a discontinued operation that are classified as held for sale or disposed of in the current period for all comparative periods presented. The ASU requires that an entity present in the statement of cash flows or disclose in a note either total operating and investing cash flows for discontinued operations, or depreciation, amortization, capital expenditures and significant operating and investing noncash items related to discontinued operations. Additional disclosures are required when an entity retains significant continuing involvement with a discontinued operation after its disposal, including the amount of cash flows to and from a discontinued operation. The new standard applies prospectively after the effective date of December 15, 2014, and early adoption is permitted. We do not expect that this ASU will have a material impact on our results of operations or financial position.
74
2 Securities
The following table sets forth the amortized cost, gross unrealized gains and losses and the estimated fair value of securities classified as available for sale and held to maturity at December 31:
| 2014 |
|
| 2013 |
| ||||||||||||||||||||||||||
| Amortized |
|
| Gross Unrealized |
|
|
|
|
|
| Amortized |
|
| Gross Unrealized |
|
|
|
|
| ||||||||||||
| Cost |
|
| Gains |
|
| Losses |
|
| Fair Value |
|
| Cost |
|
| Gains |
|
| Losses |
|
| Fair Value |
| ||||||||
| (In thousands) |
| |||||||||||||||||||||||||||||
Classified as Available for Sale |
|
|
|
|
|
|
|
|
|
|
|
|
|
|
|
|
|
|
|
|
|
|
|
|
|
|
|
|
|
|
|
U.S. Treasury and government agencies | $ | 120,545 |
|
| $ | 159 |
|
| $ | 282 |
|
| $ | 120,422 |
|
| $ | 94,427 |
|
| $ | 35 |
|
| $ | 770 |
|
| $ | 93,692 |
|
Mortgage-backed securities - residential |
| 583,031 |
|
|
| 2,829 |
|
|
| 3,401 |
|
|
| 582,459 |
|
|
| 349,216 |
|
|
| 2,211 |
|
|
| 11,732 |
|
|
| 339,695 |
|
Obligations of states and political subdivisions |
| 100,830 |
|
|
| 817 |
|
|
| 193 |
|
|
| 101,454 |
|
|
| 87,884 |
|
|
| 1,520 |
|
|
| 100 |
|
|
| 89,304 |
|
Other debt securities |
| 969 |
|
|
| 2 |
|
|
| 1 |
|
|
| 970 |
|
|
| 9,529 |
|
|
| 4 |
|
|
| 4 |
|
|
| 9,529 |
|
Total debt securities |
| 805,375 |
|
|
| 3,807 |
|
|
| 3,877 |
|
|
| 805,305 |
|
|
| 541,056 |
|
|
| 3,770 |
|
|
| 12,606 |
|
|
| 532,220 |
|
Mutual funds and other equity securities |
| 9,702 |
|
|
| 904 |
|
|
| 195 |
|
|
| 10,411 |
|
|
| 9,729 |
|
|
| 636 |
|
|
| 387 |
|
|
| 9,978 |
|
Total | $ | 815,077 |
|
| $ | 4,711 |
|
| $ | 4,072 |
|
| $ | 815,716 |
|
| $ | 550,785 |
|
| $ | 4,406 |
|
| $ | 12,993 |
|
| $ | 542,198 |
|
|
|
|
|
|
|
|
|
|
|
|
|
|
|
|
|
|
|
|
|
|
|
|
|
|
|
|
|
|
|
|
|
|
|
|
|
|
|
|
|
|
|
|
|
|
|
|
|
|
|
|
|
|
|
|
|
|
|
|
|
|
|
|
|
| Amortized |
|
| Gross Unrecognized |
|
|
|
|
|
| Amortized |
|
| Gross Unrecognized |
|
|
|
|
| ||||||||||||
| Cost |
|
| Gains |
|
| Losses |
|
| Fair Value |
|
| Cost |
|
| Gains |
|
| Losses |
|
| Fair Value |
| ||||||||
| (In thousands) |
| |||||||||||||||||||||||||||||
Classified as Held To Maturity |
|
|
|
|
|
|
|
|
|
|
|
|
|
|
|
|
|
|
|
|
|
|
|
|
|
|
|
|
|
|
|
Mortgage-backed securities - residential | $ | 2,301 |
|
| $ | 219 |
|
|
| — |
|
| $ | 2,520 |
|
| $ | 3,133 |
|
| $ | 249 |
|
|
| — |
|
| $ | 3,382 |
|
Obligations of states and political subdivisions |
| 1,857 |
|
|
| 27 |
|
|
| — |
|
|
| 1,884 |
|
|
| 3,105 |
|
|
| 69 |
|
|
| — |
|
|
| 3,174 |
|
Total | $ | 4,158 |
|
| $ | 246 |
|
|
| — |
|
| $ | 4,404 |
|
| $ | 6,238 |
|
| $ | 318 |
|
|
| — |
|
| $ | 6,556 |
|
|
|
|
|
|
|
|
|
|
|
|
|
|
|
|
|
|
|
|
|
|
|
|
|
|
|
|
|
|
|
|
|
At December 31, 2013, included in other debt securities were investments in five pooled trust preferred securities. The value of these investments had been severely negatively affected by the economic downturn of recent years and the resulting investor concerns about recent and future losses in the financial services industry. In December 2013, a joint federal bank regulatory agency statement was issued noting that they were reviewing certain provisions of the Dodd-Frank Act and other related regulations regarding whether it should be permissible for banks to continue to hold investments in collateralized debt obligations, including trust preferred securities. As a result of the joint statement, liquidity in the market for pooled trust preferred securities improved greatly as holders evaluated their positions in light of a potential regulatory mandate to divest. The Company sought and reviewed offers for its holdings and, based on the significant improvement in the market and the uncertainty of being able to hold these investments to maturity, decided to sell the entire portfolio in January 2014, prior to the federal agencies’ interim final rule, for $8,753. Due to this change in intent, an other-than-temporary charge of $1,240 was recognized through earnings in 2013 with no additional gain or loss realized upon completion of the sale in January 2014.
The following table summarizes the change in pretax OTTI credit related losses on securities available for sale for the periods indicated:
|
|
| 2014 |
|
|
| 2013 |
|
|
| 2012 |
|
|
| (In thousands) |
| |||||||||
Balance at beginning of period: |
|
|
|
|
|
|
|
|
|
|
|
|
Total OTTI credit related impairment charges beginning of period |
| $ | 11,242 |
|
| $ | 10,002 |
|
| $ | 9,478 |
|
Increase to the amount related to the credit loss for which other-than-temporary impairment was previously recognized |
|
| — |
|
|
| 1,240 |
|
|
| 528 |
|
Credit related impairment dispositions |
|
| (11,242 | ) |
|
| — |
|
|
| (4 | ) |
Credit related impairment not previously recognized |
|
| — |
|
|
| — |
|
|
| — |
|
Balance at end of period: |
| $ | — |
|
| $ | 11,242 |
|
| $ | 10,002 |
|
|
|
|
|
|
|
|
|
|
|
|
|
|
The Company recorded $1,240 and $528 of pretax impairment charges on securities available-for-sale in 2013 and 2012, respectively. There were no pretax impairment charges in 2014. All of the 2013 and 2012 charges were related to the Company’s investments in pooled trust preferred securities. These charges represented approximately 12.4 percent and 5.0 percent of the book value of the related investments in 2013 and 2012, respectively. Income tax benefits applicable to impairment charges were $513 and $217 in 2013 and 2012, respectively.
75
Gross proceeds from sales of securities available for sale were $10,480, $789 and $9,997 in 2014, 2013 and 2012, respectively. The Company recognized a pretax gain on sales for the year ended December 31, 2014, totaling $50. There were no gross pretax gains or losses in 2013 and 2012 as a result of these sales.
At December 31, 2014 and 2013, securities having a stated value of approximately $265,054 and $216,051 were pledged to secure public deposits, securities sold under agreements to repurchase and for other purposes as required or permitted by law.
The following tables reflect the Company’s investments fair value and gross unrealized loss, aggregated by investment category and length of time the individual securities have been in a continuous unrealized loss position at the dates indicated:
|
| Less Than 12 Months |
|
| Greater Than 12 Months |
|
| Total |
| |||||||||||||||
|
|
|
|
|
| Gross |
|
|
|
|
|
| Gross |
|
|
|
|
|
| Gross |
| |||
|
| Fair |
|
| Unrealized |
|
| Fair |
|
| Unrealized |
|
| Fair |
|
| Unrealized |
| ||||||
December 31, 2014 |
| Value |
|
| Loss |
|
| Value |
|
| Loss |
|
| Value |
|
| Loss |
| ||||||
|
| (In thousands) |
| |||||||||||||||||||||
Available for sale: |
|
|
|
|
|
|
|
|
|
|
|
|
|
|
|
|
|
|
|
|
|
|
|
|
U.S. Treasuries and government agencies |
| $ | 35,149 |
|
| $ | 82 |
|
| $ | 17,880 |
|
| $ | 200 |
|
| $ | 53,029 |
|
| $ | 282 |
|
Mortgage-backed securities - residential |
|
| 187,074 |
|
|
| 617 |
|
|
| 136,437 |
|
|
| 2,784 |
|
|
| 323,511 |
|
|
| 3,401 |
|
Obligations of states and political subdivisions |
|
| 29,654 |
|
|
| 181 |
|
|
| 2,412 |
|
|
| 12 |
|
|
| 32,066 |
|
|
| 193 |
|
Other debt securities |
|
| 201 |
|
|
| — |
|
|
| 409 |
|
|
| 1 |
|
|
| 610 |
|
|
| 1 |
|
Total debt securities |
|
| 252,078 |
|
|
| 880 |
|
|
| 157,138 |
|
|
| 2,997 |
|
|
| 409,216 |
|
|
| 3,877 |
|
Mutual funds and other equity securities |
|
| — |
|
|
| — |
|
|
| 9,014 |
|
|
| 195 |
|
|
| 9,014 |
|
|
| 195 |
|
Total temporarily impaired securities |
| $ | 252,078 |
|
| $ | 880 |
|
| $ | 166,152 |
|
| $ | 3,192 |
|
| $ | 418,230 |
|
| $ | 4,072 |
|
|
|
|
|
|
|
|
|
|
|
|
|
|
|
|
|
|
|
|
|
|
|
|
|
|
|
|
|
|
|
|
|
|
|
|
|
|
|
|
|
|
|
|
|
|
|
|
|
|
|
|
| Less Than 12 Months |
|
| Greater Than 12 Months |
|
| Total |
| |||||||||||||||
|
|
|
|
|
| Gross |
|
|
|
|
|
| Gross |
|
|
|
|
|
| Gross |
| |||
|
| Fair |
|
| Unrealized |
|
| Fair |
|
| Unrealized |
|
| Fair |
|
| Unrealized |
| ||||||
December 31, 2013 |
| Value |
|
| Loss |
|
| Value |
|
| Loss |
|
| Value |
|
| Loss |
| ||||||
|
| (In thousands) |
| |||||||||||||||||||||
Available for sale: |
|
|
|
|
|
|
|
|
|
|
|
|
|
|
|
|
|
|
|
|
|
|
|
|
U.S. Treasuries and government agencies |
| $ | 53,299 |
|
| $ | 761 |
|
| $ | 3,469 |
|
| $ | 9 |
|
| $ | 56,768 |
|
| $ | 770 |
|
Mortgage-backed securities - residential |
|
| 240,192 |
|
|
| 10,593 |
|
|
| 20,216 |
|
|
| 1,139 |
|
|
| 260,408 |
|
|
| 11,732 |
|
Obligations of states and political subdivisions |
|
| 8,060 |
|
|
| 94 |
|
|
| 1,322 |
|
|
| 6 |
|
|
| 9,382 |
|
|
| 100 |
|
Other debt securities |
|
| 203 |
|
|
| 2 |
|
|
| 98 |
|
|
| 2 |
|
|
| 301 |
|
|
| 4 |
|
Total debt securities |
|
| 301,754 |
|
|
| 11,450 |
|
|
| 25,105 |
|
|
| 1,156 |
|
|
| 326,859 |
|
|
| 12,606 |
|
Mutual funds and other equity securities |
|
| — |
|
|
| — |
|
|
| 8,785 |
|
|
| 387 |
|
|
| 8,785 |
|
|
| 387 |
|
Total temporarily impaired securities |
| $ | 301,754 |
|
| $ | 11,450 |
|
| $ | 33,890 |
|
| $ | 1,543 |
|
| $ | 335,644 |
|
| $ | 12,993 |
|
|
|
|
|
|
|
|
|
|
|
|
|
|
|
|
|
|
|
|
|
|
|
|
|
|
There were no securities classified as held to maturity in an unrealized loss position at December 31, 2014 and 2013.
The total number of securities in the Company’s portfolio that were in an unrealized loss position was 273 and 215 at December 31, 2014 and December 31, 2013, respectively. The Company has determined that it does not intend to sell, or it is more likely than not that it will be required to sell, its securities that are in an unrealized loss position prior to the recovery of its amortized cost basis. The Company believes that its securities continue to have satisfactory ratings, are readily marketable and that current unrealized losses are primarily a result of changes in interest rates. Therefore, management does not consider these investments to be other-than-temporarily impaired at December 31, 2014 and 2013.
The contractual maturity of all debt securities held at December 31, 2014 is shown below. Actual maturities may differ from contractual maturities because some issuers have the right to call or prepay obligations with or without call or prepayment penalties.
76
|
| Available for Sale |
|
| Held to Maturity |
| ||||||||||
|
| Amortized |
|
| Fair |
|
| Amortized |
|
| Fair |
| ||||
|
| Cost |
|
| Value |
|
| Cost |
|
| Value |
| ||||
|
| (In thousands) |
| |||||||||||||
Contractual Maturity |
|
|
|
|
|
|
|
|
|
|
|
|
|
|
|
|
Within 1 year |
| $ | 45,548 |
|
| $ | 45,623 |
|
|
| — |
|
|
| — |
|
After 1 year but within 5 years |
|
| 155,827 |
|
|
| 156,083 |
|
| $ | 1,857 |
|
| $ | 1,884 |
|
After 5 year but within 10 years |
|
| 20,969 |
|
|
| 21,140 |
|
|
| — |
|
|
| — |
|
Mortgage-backed securities - residential |
|
| 583,031 |
|
|
| 582,459 |
|
|
| 2,301 |
|
|
| 2,520 |
|
Total |
| $ | 805,375 |
|
| $ | 805,305 |
|
| $ | 4,158 |
|
| $ | 4,404 |
|
|
|
|
|
|
|
|
|
|
|
|
|
|
|
|
|
|
3 Credit Commitments and Concentrations of Credit Risk
The Company has outstanding, at any time, a significant number of commitments to extend credit and also provide financial guarantees to third parties. Those arrangements are subject to strict credit control assessments. Guarantees specify limits to the Company’s obligations. The amounts of those loan commitments and guarantees are set out in the following table. Because many commitments and almost all guarantees expire without being funded in whole or in part, the contract amounts are not estimates of future cash flows.
|
| December 31, |
| |||||
|
| 2014 |
|
| 2013 |
| ||
|
| Contract |
|
| Contract |
| ||
|
| Amount |
|
| Amount |
| ||
|
| (In thousands) |
| |||||
Credit commitments - variable |
| $ | 262,820 |
|
| $ | 234,760 |
|
Credit commitments - fixed |
|
| 4,793 |
|
|
| 2,563 |
|
Guarantees written |
|
| 36,792 |
|
|
| 24,695 |
|
The majority of loan commitments have terms up to one year, with either a floating interest rate or contracted fixed interest rates, generally ranging from 2.00% to 16.00%. Guarantees written generally have terms up to one year.
Loan commitments and guarantees written have off-balance-sheet credit risk because only origination fees and accruals for probable losses are recognized in the balance sheet until the commitments are fulfilled or the guarantees expire. Credit risk represents the accounting loss that would be recognized at the reporting date if counterparties failed completely to perform as contracted. The credit risk amounts are equal to the contractual amounts, assuming that the amounts are fully advanced and that collateral or other security would have no value.
The Company’s policy is to require customers to provide collateral prior to the disbursement of approved loans. For loans and financial guarantees, the Company usually retains a security interest in the property or products financed or other collateral which provides repossession rights in the event of default by the customer.
77
Concentrations of credit risk (whether on or off-balance-sheet) arising from financial instruments exist in relation to certain groups of customers. A group concentration arises when a number of counterparties have similar economic characteristics that would cause their ability to meet contractual obligations to be similarly affected by changes in economic or other conditions. The Company does not have a significant exposure to any individual customer or counterparty. A geographic concentration arises because the Company operates principally in Westchester County and Bronx County, New York. Loans and credit commitments collateralized by real estate including all loans where real estate is the primary collateral were as follows at December 31:
|
| Residential 1-4 |
|
| Multifamily |
|
| Commercial |
|
|
|
|
| |||
2014 |
| Property |
|
| Property |
|
| Property |
|
| Total |
| ||||
|
| (In thousands) |
| |||||||||||||
Loans |
| $ | 434,074 |
|
| $ | 326,416 |
|
| $ | 679,847 |
|
| $ | 1,440,337 |
|
Credit commitments |
|
| 62,893 |
|
|
| 2,074 |
|
|
| 47,670 |
|
|
| 112,637 |
|
Total |
| $ | 496,967 |
|
| $ | 328,490 |
|
| $ | 727,517 |
|
| $ | 1,552,974 |
|
|
|
|
|
|
|
|
|
|
|
|
|
|
|
|
|
|
|
|
|
|
|
|
|
|
|
|
|
|
|
|
|
|
|
|
| Residential 1-4 |
|
| Multifamily |
|
| Commercial |
|
|
|
|
| |||
2013 |
| Property |
|
| Property |
|
| Property |
|
| Total |
| ||||
|
| (In thousands) |
| |||||||||||||
Loans |
| $ | 474,270 |
|
| $ | 226,898 |
|
| $ | 640,516 |
|
| $ | 1,341,684 |
|
Credit commitments |
|
| 50,278 |
|
|
| 1,024 |
|
|
| 38,500 |
|
|
| 89,802 |
|
Total |
| $ | 524,548 |
|
| $ | 227,922 |
|
| $ | 679,016 |
|
| $ | 1,431,486 |
|
|
|
|
|
|
|
|
|
|
|
|
|
|
|
|
|
|
4 Loans
The loan portfolio, excluding loans held for sale, is comprised of the following:
|
| December 31 |
|
| December 31 |
| ||
|
| 2014 |
|
|
| 2013 |
| |
|
| (In thousands) |
| |||||
Real estate: |
|
|
|
|
|
|
|
|
Commercial |
| $ | 617,299 |
|
| $ | 593,476 |
|
Construction |
|
| 101,802 |
|
|
| 88,311 |
|
Residential multi-family |
|
| 326,416 |
|
|
| 226,898 |
|
Residential other |
|
| 394,820 |
|
|
| 432,999 |
|
Commercial & industrial |
|
| 448,628 |
|
|
| 258,578 |
|
Individuals & lease financing |
|
| 38,439 |
|
|
| 30,528 |
|
Total loans |
|
| 1,927,404 |
|
|
| 1,630,790 |
|
Deferred loan costs, net |
|
| 752 |
|
|
| 1,379 |
|
Allowance for loan losses |
|
| (27,342 | ) |
|
| (25,990 | ) |
Loans, net |
| $ | 1,900,814 |
|
| $ | 1,606,179 |
|
|
|
|
|
|
|
|
|
|
The Company has established credit policies applicable to each type of lending activity in which it engages. The Bank evaluates the credit worthiness of each customer and extends credit based on credit history, ability to repay and market value of collateral. The customers’ credit worthiness is monitored on an ongoing basis. Additional collateral is obtained when warranted. Real estate is the primary form of collateral. Other forms of collateral are bank deposits and marketable securities. While collateral provides assurance as a secondary source of repayment, the Company ordinarily requires the primary source of payment to be based on the borrower’s ability to generate continuing cash flows.
Risk characteristics of the Company’s loan portfolio segments include the following:
Commercial Real Estate Loans — In underwriting commercial real estate loans, the Company evaluates both the prospective borrower’s ability to make timely payments on the loan and the value of the property securing the loan. Repayment of such loans may be negatively impacted should the borrower default or should there be a substantial decline in the value of the property securing the loan, or a decline in general economic conditions. Where the owner occupies the property, the Company also evaluates the business’s ability to repay the loan on a timely basis. In addition, the Company may require personal guarantees, lease assignments and/or the guarantee of the operating company when the property is owner occupied. These types of loans may involve greater risks than other types of lending, because payments on such loans are often dependent upon the
78
successful operation of the business involved, therefore, repayment of such loans may be negatively impacted by adverse changes in economic conditions affecting the borrowers’ business.
Construction Loans — Construction loans are short-term loans (generally up to 18 months) secured by land for both residential and commercial development. The loans are generally made for acquisition and improvements. Funds are disbursed as phases of construction are completed. Most non-residential construction loans require pre-approved permanent financing or pre-leasing by the company or another bank providing the permanent financing. The Company funds construction of single family homes and commercial real estate, when no contract of sale exists, based upon the experience of the builder, the financial strength of the owner, the type and location of the property and other factors. Construction loans are generally personally guaranteed by the principal(s). Repayment of such loans may be negatively impacted by the builders’ inability to complete construction, by a downturn in the new construction market, by a significant increase in interest rates or by a decline in general economic conditions. The Bank’s primary regulator considers construction loans to be part of commercial real estate for concentration risk measurement purposes.
Residential Real Estate Loans — Various loans secured by residential real estate properties are offered by the Company, including 1-4 family residential mortgages, multi-family residential loans and a variety of home equity line of credit products. Repayment of such loans may be negatively impacted should the borrower default, should there be a significant decline in the value of the property securing the loan or should there be decline in general economic conditions. These loans are available for 7 or 10 year terms with one 5 year extension option. A 7 year term with no extension option is also offered. Pricing is typically based on a spread over the corresponding Federal Home Loan Bank (“FHLB”) rate. Amortization of up to 30 years, a maximum loan to value ratio of 80% and a debt service coverage ratio of 1.2 to 1 are generally required. The Bank’s primary regulator considers multi-family residential loans to be part of commercial real estate for concentration risk measurement purposes.
Commercial and Industrial Loans — The Company’s commercial and industrial loan portfolio consists primarily of commercial business loans and lines of credit to businesses and professionals. These loans are usually made to finance the purchase of inventory, new or used equipment or other short or long-term working capital purposes. These loans are generally secured by corporate assets, often with real estate as secondary collateral, but are also offered on an unsecured basis. In granting this type of loan, the Company primarily looks to the borrower’s cash flow as the source of repayment with collateral and personal guarantees, where obtained, as a secondary source. In late 2013, the Company initiated an asset-based lending (“ABL”) program which offers credit facilities in the form of credit lines and/or term loans to manufacturers, wholesalers, distributors, service providers and retailers. ABL refers to loans secured by a variety of assets usually comprised of accounts receivable, inventory, machinery and equipment and, at times, real estate. The collateral is considered the primary source of repayment and the operation of the business is the secondary source. Commercial loans are often larger and may involve greater risks than other types of loans offered by the Company. Payments on such loans are often dependent upon the successful operation of the underlying business involved and, therefore, repayment of such loans may be negatively impacted by adverse changes in economic conditions, management’s inability to effectively manage the business, claims of others against the borrower’s assets which may take priority over the Company’s claims against assets, death or disability of the borrower or loss of market for the borrower’s products or services.
Lease Financing and Other Loans — The Company originates lease financing transactions which are primarily conducted with businesses, professionals and not-for-profit organizations. In late March 2014, the Company initiated an equipment leasing program with a focus on financing income producing equipment in the manufacturing, healthcare, technology and transportation segments. Payments on such loans are often dependent upon the successful operation of the underlying business involved and, therefore, repayment of such loans may be negatively impacted by adverse changes in economic conditions, and management’s inability to effectively manage the business or loss of market for the borrower’s products or services. The Company also offers installment loans and reserve lines of credit to individuals. Repayment of such loans are often dependent on the personal income of the borrower which may be negatively impacted by adverse changes in economic conditions. The Company does not place an emphasis on originating these types of loans.
79
The following table presents the allowance for loan losses by portfolio segment for the years indicated:
| For the Year Ended December 31, 2014 |
| |||||||||||||||||||||
| Commercial |
|
|
|
|
|
| Residential |
|
| Commercial & |
|
| Lease Financing |
|
|
|
|
| ||||
| Real Estate |
|
| Construction |
|
| Real Estate |
|
| Industrial |
|
| & Other |
|
| Total |
| ||||||
| (In thousands) |
| |||||||||||||||||||||
Balance at beginning of period | $ | 11,231 |
|
| $ | 4,641 |
|
| $ | 6,236 |
|
| $ | 3,436 |
|
| $ | 446 |
|
| $ | 25,990 |
|
Charge-offs |
| (676 | ) |
|
| — |
|
|
| (1,550 | ) |
|
| (363 | ) |
|
| (36 | ) |
|
| (2,625 | ) |
Recoveries |
| 992 |
|
|
| 37 |
|
|
| 211 |
|
|
| 792 |
|
|
| 153 |
|
|
| 2,185 |
|
Net recoveries (charge-offs) |
| 316 |
|
|
| 37 |
|
|
| (1,339 | ) |
|
| 429 |
|
|
| 117 |
|
|
| (440 | ) |
Provision for loan losses |
| (321 | ) |
|
| (1,035 | ) |
|
| 1,376 |
|
|
| 1,912 |
|
|
| (140 | ) |
|
| 1,792 |
|
Net change during the period |
| (5 | ) |
|
| (998 | ) |
|
| 37 |
|
|
| 2,341 |
|
|
| (23 | ) |
|
| 1,352 |
|
Balance at end of period | $ | 11,226 |
|
| $ | 3,643 |
|
| $ | 6,273 |
|
| $ | 5,777 |
|
| $ | 423 |
|
| $ | 27,342 |
|
|
|
|
|
|
|
|
|
|
|
|
|
|
|
|
|
|
|
|
|
|
|
|
|
| For the Year Ended December 31, 2013 |
| |||||||||||||||||||||
| Commercial |
|
|
|
|
|
| Residential |
|
| Commercial & |
|
| Lease Financing |
|
|
|
|
| ||||
| Real Estate |
|
| Construction |
|
| Real Estate |
|
| Industrial |
|
| & Other |
|
| Total |
| ||||||
| (In thousands) |
| |||||||||||||||||||||
Balance at beginning of period | $ | 10,090 |
|
| $ | 3,949 |
|
| $ | 8,119 |
|
| $ | 4,077 |
|
| $ | 377 |
|
| $ | 26,612 |
|
Charge-offs |
| (1,084 | ) |
|
| (793 | ) |
|
| (2,216 | ) |
|
| (1,103 | ) |
|
| (406 | ) |
|
| (5,602 | ) |
Recoveries |
| 113 |
|
|
| 15 |
|
|
| 1,746 |
|
|
| 561 |
|
|
| 69 |
|
|
| 2,504 |
|
Net charge-offs |
| (971 | ) |
|
| (778 | ) |
|
| (470 | ) |
|
| (542 | ) |
|
| (337 | ) |
|
| (3,098 | ) |
Provision for loan losses |
| 2,112 |
|
|
| 1,470 |
|
|
| (1,413 | ) |
|
| (99 | ) |
|
| 406 |
|
|
| 2,476 |
|
Net change during the period |
| 1,141 |
|
|
| 692 |
|
|
| (1,883 | ) |
|
| (641 | ) |
|
| 69 |
|
|
| (622 | ) |
Balance at end of period | $ | 11,231 |
|
| $ | 4,641 |
|
| $ | 6,236 |
|
| $ | 3,436 |
|
| $ | 446 |
|
| $ | 25,990 |
|
|
|
|
|
|
|
|
|
|
|
|
|
|
|
|
|
|
|
|
|
|
|
|
|
| For the Year Ended December 31, 2012 |
| |||||||||||||||||||||
| Commercial |
|
|
|
|
|
| Residential |
|
| Commercial & |
|
| Lease Financing |
|
|
|
|
| ||||
| Real Estate |
|
| Construction |
|
| Real Estate |
|
| Industrial |
|
| & Other |
|
| Total |
| ||||||
| (In thousands) |
| |||||||||||||||||||||
Balance at beginning of period | $ | 12,776 |
|
| $ | 6,470 |
|
| $ | 8,093 |
|
| $ | 2,650 |
|
| $ | 696 |
|
| $ | 30,685 |
|
Charge-offs |
| (5,002 | ) |
|
| (3,509 | ) |
|
| (3,018 | ) |
|
| (3,744 | ) |
|
| (574 | ) |
|
| (15,847 | ) |
Recoveries |
| 957 |
|
|
| 179 |
|
|
| 437 |
|
|
| 1,171 |
|
|
| 523 |
|
|
| 3,267 |
|
Net charge-offs |
| (4,045 | ) |
|
| (3,330 | ) |
|
| (2,581 | ) |
|
| (2,573 | ) |
|
| (51 | ) |
|
| (12,580 | ) |
Provision for loan losses |
| 1,359 |
|
|
| 809 |
|
|
| 2,607 |
|
|
| 4,000 |
|
|
| (268 | ) |
|
| 8,507 |
|
Net change during the period |
| (2,686 | ) |
|
| (2,521 | ) |
|
| 26 |
|
|
| 1,427 |
|
|
| (319 | ) |
|
| (4,073 | ) |
Balance at end of period | $ | 10,090 |
|
| $ | 3,949 |
|
| $ | 8,119 |
|
| $ | 4,077 |
|
| $ | 377 |
|
| $ | 26,612 |
|
|
|
|
|
|
|
|
|
|
|
|
|
|
|
|
|
|
|
|
|
|
|
|
|
80
The following tables present the allowance for loan losses and the recorded investment in loans by portfolio segment based on impairment method at the dates indicated:
| December 31, 2014 |
| |||||||||||||||||||||
| Commercial |
|
|
|
|
|
| Residential |
|
| Commercial & |
|
| Lease Financing |
|
|
|
|
| ||||
| Real Estate |
|
| Construction |
|
| Real Estate |
|
| Industrial |
|
| & Other |
|
| Total |
| ||||||
| (In thousands) |
| |||||||||||||||||||||
Allowance for loan losses: |
|
|
|
|
|
|
|
|
|
|
|
|
|
|
|
|
|
|
|
|
|
|
|
Ending balance attributed to loans: |
|
|
|
|
|
|
|
|
|
|
|
|
|
|
|
|
|
|
|
|
|
|
|
Collectively evaluated for impairment | $ | 11,226 |
|
| $ | 3,643 |
|
| $ | 6,273 |
|
| $ | 5,777 |
|
| $ | 423 |
|
| $ | 27,342 |
|
Individually evaluated for impairment |
| — |
|
|
| — |
|
|
| — |
|
|
| — |
|
|
| — |
|
|
| — |
|
Total allowance for loan losses | $ | 11,226 |
|
| $ | 3,643 |
|
| $ | 6,273 |
|
| $ | 5,777 |
|
| $ | 423 |
|
| $ | 27,342 |
|
Total loans: |
|
|
|
|
|
|
|
|
|
|
|
|
|
|
|
|
|
|
|
|
|
|
|
Ending balance of loans: |
|
|
|
|
|
|
|
|
|
|
|
|
|
|
|
|
|
|
|
|
|
|
|
Collectively evaluated for impairment | $ | 593,985 |
|
| $ | 100,923 |
|
| $ | 711,476 |
|
| $ | 440,131 |
|
| $ | 38,439 |
|
| $ | 1,884,954 |
|
Individually evaluated for impairment |
| 23,314 |
|
|
| 879 |
|
|
| 9,760 |
|
|
| 8,497 |
|
|
| — |
|
|
| 42,450 |
|
Total loans | $ | 617,299 |
|
| $ | 101,802 |
|
| $ | 721,236 |
|
| $ | 448,628 |
|
| $ | 38,439 |
|
| $ | 1,927,404 |
|
|
|
|
|
|
|
|
|
|
|
|
|
|
|
|
|
|
|
|
|
|
|
|
|
| December 31, 2013 |
| |||||||||||||||||||||
| Commercial |
|
|
|
|
|
| Residential |
|
| Commercial & |
|
| Lease Financing |
|
|
|
|
| ||||
| Real Estate |
|
| Construction |
|
| Real Estate |
|
| Industrial |
|
| & Other |
|
| Total |
| ||||||
| (In thousands) |
| |||||||||||||||||||||
Allowance for loan losses: |
|
|
|
|
|
|
|
|
|
|
|
|
|
|
|
|
|
|
|
|
|
|
|
Ending balance attributed to loans: |
|
|
|
|
|
|
|
|
|
|
|
|
|
|
|
|
|
|
|
|
|
|
|
Collectively evaluated for impairment | $ | 11,231 |
|
| $ | 4,641 |
|
| $ | 6,236 |
|
| $ | 3,436 |
|
| $ | 446 |
|
| $ | 25,990 |
|
Individually evaluated for impairment |
| — |
|
|
| — |
|
|
| — |
|
|
| — |
|
|
| — |
|
|
| — |
|
Total allowance for loan losses | $ | 11,231 |
|
| $ | 4,641 |
|
| $ | 6,236 |
|
| $ | 3,436 |
|
| $ | 446 |
|
| $ | 25,990 |
|
Total loans: |
|
|
|
|
|
|
|
|
|
|
|
|
|
|
|
|
|
|
|
|
|
|
|
Ending balance of loans: |
|
|
|
|
|
|
|
|
|
|
|
|
|
|
|
|
|
|
|
|
|
|
|
Collectively evaluated for impairment | $ | 580,561 |
|
| $ | 87,432 |
|
| $ | 642,957 |
|
| $ | 248,260 |
|
| $ | 30,528 |
|
| $ | 1,589,738 |
|
Individually evaluated for impairment |
| 12,915 |
|
|
| 879 |
|
|
| 16,940 |
|
|
| 10,318 |
|
|
| — |
|
|
| 41,052 |
|
Total loans | $ | 593,476 |
|
| $ | 88,311 |
|
| $ | 659,897 |
|
| $ | 258,578 |
|
| $ | 30,528 |
|
| $ | 1,630,790 |
|
|
|
|
|
|
|
|
|
|
|
|
|
|
|
|
|
|
|
|
|
|
|
|
|
Non-accrual loans at December 31, 2014, 2013 and 2012 are summarized as follows:
| 2014 |
|
| 2013 |
|
| 2012 |
| |||
| (In thousands) |
| |||||||||
Total non-accrual loans | $ | 22,384 |
|
| $ | 23,489 |
|
| $ | 34,808 |
|
Interest income that would have been recorded under the original contract terms |
| 1,124 |
|
|
| 805 |
|
|
| 1,401 |
|
There was no income recorded on non-accrual loans during the years ended December 31, 2014, 2013 and 2012.
81
The following table presents the recorded investments in non-accrual loans and loans past due 90 days and still accruing by class of loans at the dates indicated:
| December 31, 2014 |
|
| December 31, 2013 |
| ||||||||||
|
|
|
|
| Past Due |
|
|
|
|
|
| Past Due |
| ||
|
|
|
|
| 90 Days and |
|
|
|
|
|
| 90 Days and |
| ||
| Non-Accrual |
|
| Still Accruing |
|
| Non-Accrual |
|
| Still Accruing |
| ||||
| (In thousands) |
| |||||||||||||
Loans: |
|
|
|
|
|
|
|
|
|
|
|
|
|
|
|
Commercial real estate: |
|
|
|
|
|
|
|
|
|
|
|
|
|
|
|
Owner occupied | $ | 1,817 |
|
|
| — |
|
| $ | 3,768 |
|
|
| — |
|
Non owner occupied |
| 11,964 |
|
|
| — |
|
|
| 2,861 |
|
|
| — |
|
Construction: |
|
|
|
|
|
|
|
|
|
|
|
|
|
|
|
Commercial |
| 879 |
|
|
| — |
|
|
| 879 |
|
|
| — |
|
Residential |
| — |
|
|
| — |
|
|
| — |
|
|
| — |
|
Residential: |
|
|
|
|
|
|
|
|
|
|
|
|
|
|
|
Multifamily |
| — |
|
|
| — |
|
|
| 1,282 |
|
|
| — |
|
1-4 family |
| 6,494 |
|
|
| — |
|
|
| 12,164 |
|
|
| — |
|
Home equity |
| 980 |
|
|
| — |
|
|
| 1,113 |
|
|
| — |
|
Commercial & industrial |
| 250 |
|
|
| — |
|
|
| 1,422 |
|
|
| — |
|
Other: |
|
|
|
|
|
|
|
|
|
|
|
|
|
|
|
Lease financing & other |
| — |
|
|
| — |
|
|
| — |
|
|
| — |
|
Overdrafts |
| — |
|
|
| — |
|
|
| — |
|
|
| — |
|
Total | $ | 22,384 |
|
|
| — |
|
| $ | 23,489 |
|
|
| — |
|
|
|
|
|
|
|
|
|
|
|
|
|
|
|
|
|
The following tables present the aging of loans (including past due and non-accrual loans) at the dates indicated:
|
| December 31, 2014 |
| |||||||||||||||||||||
|
| 31-60 Days |
|
| 61-89 Days |
|
| 90 Days Or |
|
| Total |
|
|
|
|
|
|
|
|
| ||||
|
| Past Due |
|
| Past Due |
|
| More Past Due |
|
| Past Due |
|
| Current |
|
| Total |
| ||||||
|
| (In thousands) |
| |||||||||||||||||||||
Loans: |
|
|
|
|
|
|
|
|
|
|
|
|
|
|
|
|
|
|
|
|
|
|
|
|
Commercial real estate: |
|
|
|
|
|
|
|
|
|
|
|
|
|
|
|
|
|
|
|
|
|
|
|
|
Owner occupied |
|
| — |
|
|
| — |
|
| $ | 205 |
|
| $ | 205 |
|
| $ | 162,894 |
|
| $ | 163,099 |
|
Non owner occupied |
|
| — |
|
|
| — |
|
|
| 11,963 |
|
|
| 11,963 |
|
|
| 442,237 |
|
|
| 454,200 |
|
Construction: |
|
|
|
|
|
|
|
|
|
|
|
|
|
|
|
|
|
|
|
|
|
|
|
|
Commercial |
|
| — |
|
|
| — |
|
|
| 879 |
|
|
| 879 |
|
|
| 61,668 |
|
|
| 62,547 |
|
Residential |
|
| — |
|
|
| — |
|
|
| — |
|
|
| — |
|
|
| 39,255 |
|
|
| 39,255 |
|
Residential: |
|
|
|
|
|
|
|
|
|
|
|
|
|
|
|
|
|
|
|
|
|
|
|
|
Multifamily |
| $ | 616 |
|
|
| — |
|
|
| — |
|
|
| 616 |
|
|
| 325,800 |
|
|
| 326,416 |
|
1-4 family |
|
| 923 |
|
| $ | 314 |
|
|
| 4,818 |
|
|
| 6,055 |
|
|
| 272,523 |
|
|
| 278,578 |
|
Home equity |
|
| 4,133 |
|
|
| 922 |
|
|
| 980 |
|
|
| 6,035 |
|
|
| 110,207 |
|
|
| 116,242 |
|
Commercial & industrial |
|
| 131 |
|
|
| 879 |
|
|
| 250 |
|
|
| 1,260 |
|
|
| 447,368 |
|
|
| 448,628 |
|
Other: |
|
|
|
|
|
|
|
|
|
|
|
|
|
|
|
|
|
|
|
|
|
|
|
|
Lease financing & other |
|
| 5 |
|
|
| — |
|
|
| — |
|
|
| 5 |
|
|
| 37,186 |
|
|
| 37,191 |
|
Overdrafts |
|
| — |
|
|
| — |
|
|
| — |
|
|
| — |
|
|
| 1,248 |
|
|
| 1,248 |
|
Total |
| $ | 5,808 |
|
| $ | 2,115 |
|
| $ | 19,095 |
|
| $ | 27,018 |
|
| $ | 1,900,386 |
|
| $ | 1,927,404 |
|
|
|
|
|
|
|
|
|
|
|
|
|
|
|
|
|
|
|
|
|
|
|
|
|
|
82
|
| December 31, 2013 |
| |||||||||||||||||||||
�� |
| 31-60 Days |
|
| 61-89 Days |
|
| 90 Days Or |
|
| Total |
|
|
|
|
|
|
|
|
| ||||
|
| Past Due |
|
| Past Due |
|
| More Past Due |
|
| Past Due |
|
| Current |
|
| Total |
| ||||||
|
| (In thousands) |
| |||||||||||||||||||||
Loans: |
|
|
|
|
|
|
|
|
|
|
|
|
|
|
|
|
|
|
|
|
|
|
|
|
Commercial real estate: |
|
|
|
|
|
|
|
|
|
|
|
|
|
|
|
|
|
|
|
|
|
|
|
|
Owner occupied |
|
| — |
|
| $ | 158 |
|
| $ | 704 |
|
| $ | 862 |
|
| $ | 167,509 |
|
| $ | 168,371 |
|
Non owner occupied |
| $ | 200 |
|
|
| — |
|
|
| 2,861 |
|
|
| 3,061 |
|
|
| 422,044 |
|
|
| 425,105 |
|
Construction: |
|
|
|
|
|
|
|
|
|
|
|
|
|
|
|
|
|
|
|
|
|
|
|
|
Commercial |
|
| — |
|
|
| — |
|
|
| 879 |
|
|
| 879 |
|
|
| 46,160 |
|
|
| 47,039 |
|
Residential |
|
| 1 |
|
|
| — |
|
|
| — |
|
|
| 1 |
|
|
| 41,271 |
|
|
| 41,272 |
|
Residential: |
|
|
|
|
|
|
|
|
|
|
|
|
|
|
|
|
|
|
|
|
|
|
|
|
Multifamily |
|
| — |
|
|
| — |
|
|
| — |
|
|
| — |
|
|
| 226,898 |
|
|
| 226,898 |
|
1-4 family |
|
| 1,012 |
|
|
| 190 |
|
|
| 11,841 |
|
|
| 13,043 |
|
|
| 307,598 |
|
|
| 320,641 |
|
Home equity |
|
| 408 |
|
|
| 540 |
|
|
| 1,113 |
|
|
| 2,061 |
|
|
| 110,297 |
|
|
| 112,358 |
|
Commercial & industrial |
|
| 1,606 |
|
|
| 321 |
|
|
| 1,365 |
|
|
| 3,292 |
|
|
| 255,286 |
|
|
| 258,578 |
|
Other: |
|
|
|
|
|
|
|
|
|
|
|
|
|
|
|
|
|
|
|
|
|
|
|
|
Lease financing & other |
|
| 185 |
|
|
| 4 |
|
|
| — |
|
|
| 189 |
|
|
| 29,437 |
|
|
| 29,626 |
|
Overdrafts |
|
| — |
|
|
| — |
|
|
| — |
|
|
| — |
|
|
| 902 |
|
|
| 902 |
|
Total |
| $ | 3,412 |
|
| $ | 1,213 |
|
| $ | 18,763 |
|
| $ | 23,388 |
|
| $ | 1,607,402 |
|
| $ | 1,630,790 |
|
|
|
|
|
|
|
|
|
|
|
|
|
|
|
|
|
|
|
|
|
|
|
|
|
|
Impaired loans and the recorded investment in loans by class of loans were as follows:
|
| December 31, 2014 |
|
| December 31, 2013 |
| ||||||||||||||||||
|
| Unpaid |
|
|
|
|
|
| Allowance for |
|
| Unpaid |
|
|
|
|
|
| Allowance for |
| ||||
|
| Principal |
|
| Recorded |
|
| Loan Losses |
|
| Principal |
|
| Recorded |
|
| Loan Losses |
| ||||||
|
| Balance |
|
| Investment |
|
| Allocated |
|
| Balance |
|
| Investment |
|
| Allocated |
| ||||||
|
| (In thousands) |
| |||||||||||||||||||||
With no related allowance recorded: |
|
|
|
|
|
|
|
|
|
|
|
|
|
|
|
|
|
|
|
|
|
|
|
|
Commercial real estate: |
|
|
|
|
|
|
|
|
|
|
|
|
|
|
|
|
|
|
|
|
|
|
|
|
Owner occupied |
| $ | 10,010 |
|
| $ | 9,930 |
|
|
| — |
|
| $ | 10,320 |
|
| $ | 10,054 |
|
|
| — |
|
Non owner occupied |
|
| 14,028 |
|
|
| 13,385 |
|
|
| — |
|
|
| 2,861 |
|
|
| 2,861 |
|
|
| — |
|
Construction: |
|
|
|
|
|
|
|
|
|
|
|
|
|
|
|
|
|
|
|
|
|
|
|
|
Commercial |
|
| 1,231 |
|
|
| 879 |
|
|
| — |
|
|
| 1,231 |
|
|
| 879 |
|
|
| — |
|
Residential: |
|
|
|
|
|
|
|
|
|
|
|
|
|
|
|
|
|
|
|
|
|
|
|
|
Multifamily |
|
| 1,589 |
|
|
| 1,589 |
|
|
| — |
|
|
| 2,921 |
|
|
| 2,921 |
|
|
| — |
|
1-4 family |
|
| 8,692 |
|
|
| 7,115 |
|
|
| — |
|
|
| 14,782 |
|
|
| 12,831 |
|
|
| — |
|
Home equity |
|
| 1,055 |
|
|
| 1,055 |
|
|
| — |
|
|
| 1,705 |
|
|
| 1,188 |
|
|
| — |
|
Commercial & industrial |
|
| 8,725 |
|
|
| 8,497 |
|
|
| — |
|
|
| 11,421 |
|
|
| 10,318 |
|
|
| — |
|
Total loans |
| $ | 45,330 |
|
| $ | 42,450 |
|
|
| — |
|
| $ | 45,241 |
|
| $ | 41,052 |
|
|
| — |
|
|
|
|
|
|
|
|
|
|
|
|
|
|
|
|
|
|
|
|
|
|
|
|
|
|
The carrying value of impaired loans was determined using either the fair value of the underlying collateral of the loan or by an analysis of the expected cash flows related to the loan.
83
The following tables present the average recorded investment in impaired loans by class of loans and interest recognized on impaired loans for the years indicated:
|
| Year Ended December 31, |
| |||||||||||||
|
| 2014 |
|
| 2013 |
| ||||||||||
|
| Average |
|
|
|
|
|
| Average |
|
|
|
|
| ||
|
| Recorded |
|
| Interest |
|
| Recorded |
|
| Interest |
| ||||
|
| Investment |
|
| Income |
|
| Investment |
|
| Income |
| ||||
|
| (In thousands) |
| |||||||||||||
Commercial real estate: |
|
|
|
|
|
|
|
|
|
|
|
|
|
|
|
|
Owner occupied |
| $ | 10,888 |
|
| $ | 85 |
|
| $ | 19,227 |
|
| $ | 14 |
|
Non owner occupied |
|
| 7,771 |
|
|
| 318 |
|
|
| 3,068 |
|
|
| 251 |
|
Construction: |
|
|
|
|
|
|
|
|
|
|
|
|
|
|
|
|
Commercial |
|
| 879 |
|
|
| — |
|
|
| 1,127 |
|
|
| — |
|
Residential |
|
| — |
|
|
| — |
|
|
| 1,574 |
|
|
| 37 |
|
Residential: |
|
|
|
|
|
|
|
|
|
|
|
|
|
|
|
|
Multifamily |
|
| 1,776 |
|
|
| 69 |
|
|
| 3,202 |
|
|
| 72 |
|
1-4 family |
|
| 11,354 |
|
|
| 43 |
|
|
| 12,544 |
|
|
| — |
|
Home equity |
|
| 1,109 |
|
|
| 2 |
|
|
| 828 |
|
|
| 1 |
|
Commercial & industrial |
|
| 9,001 |
|
|
| 390 |
|
|
| 11,458 |
|
|
| 431 |
|
Lease financing & other |
|
| — |
|
|
| — |
|
|
| — |
|
|
| — |
|
Total |
| $ | 42,778 |
|
|
| 907 |
|
| $ | 53,028 |
|
| $ | 806 |
|
|
|
|
|
|
|
|
|
|
|
|
|
|
|
|
|
|
During the year ended December 31, 2014, the terms of certain loans were modified as troubled debt restructurings (“TDRs”). The modification of the terms of such loans included one or a combination of the following: a reduction of the stated interest rate of the loan; an extension of the maturity date at a stated rate of interest lower than the current market rate for new debt with similar risk; or a permanent reduction of the recorded investment in the loan. Modifications involving a reduction of the stated interest rate of the loan were for periods ranging from 6 months to 15 years. Modifications involving an extension of the maturity date were for periods ranging from 6 months to 3 years.
The Company is committed to extend approximately $784 of additional credit to a borrower whose loan is classified as a TDR at December 31, 2014. Impaired loans at December 31, 2014 and 2013 included $25,837 and $30,864, respectively, of loans considered to be TDRs. The Company classifies all loans considered to be TDRs as impaired.
At December 31, 2014 and 2013, fifteen TDRs with carrying amounts totaling $20,066 and ten TDRs with carrying amounts totaling $17,564 respectively, were on accrual status and performing in accordance with their modified terms. All other TDRs at December 31, 2014 and 2013, were on non-accrual status. A loan that has been on non-accrual status that is subsequently modified as a TDR will usually remain on non-accrual status until the borrower is able to demonstrate repayment performance in compliance with the modified terms for a sustained period. A loan that has not been placed on non-accrual status may be modified as a TDR and remain on accrual status. The Company’s policy states that a TDR is considered to be in payment default once it is 45 days contractually past due under the modified terms.
At December 31, 2014, there were no loans modified as TDRs that were in payment default within twelve months following the modification. At December 31, 2013, there was one loan totaling $4,069 modified as a TDR that was in payment default within twelve months following the modification.
84
The following table presents loans by class modified as troubled debt restructurings that occurred during the years indicated:
|
| Year ended December 31, 2014 |
|
| Year ended December 31, 2013 |
| ||||||||||||||||||
|
|
|
|
|
| Pre-Modification |
|
| Post-Modification |
|
|
|
|
|
| Pre-Modification |
|
| Post-Modification |
| ||||
|
|
|
|
|
| Outstanding |
|
| Outstanding |
|
|
|
|
|
| Outstanding |
|
| Outstanding |
| ||||
|
| Number |
|
| Recorded |
|
| Recorded |
|
| Number |
|
| Recorded |
|
| Recorded |
| ||||||
|
| of Loans |
|
| Investment |
|
| Investment |
|
| of Loans |
|
| Investment |
|
| Investment |
| ||||||
|
| (Dollars in thousands) |
| |||||||||||||||||||||
Commercial real estate: |
|
|
|
|
|
|
|
|
|
|
|
|
|
|
|
|
|
|
|
|
|
|
|
|
Owner occupied |
|
| 2 |
|
| $ | 1,901 |
|
| $ | 1,901 |
|
|
| — |
|
|
| — |
|
|
| — |
|
Non owner occupied |
|
| 2 |
|
|
| 1,444 |
|
|
| 1,444 |
|
|
| 1 |
|
| $ | 5,546 |
|
| $ | 5,546 |
|
Construction: |
|
|
|
|
|
|
|
|
|
|
|
|
|
|
|
|
|
|
|
|
|
|
|
|
Commercial |
|
| — |
|
|
| — |
|
|
| — |
|
|
| — |
|
|
| — |
|
|
| — |
|
Residential |
|
| — |
|
|
| — |
|
|
| — |
|
|
| — |
|
|
| — |
|
|
| — |
|
Residential: |
|
|
|
|
|
|
|
|
|
|
|
|
|
|
|
|
|
|
|
|
|
|
|
|
Multifamily |
|
| — |
|
|
| — |
|
|
| — |
|
|
| — |
|
|
| — |
|
|
| — |
|
1-4 family |
|
| 4 |
|
|
| 365 |
|
|
| 365 |
|
|
| 7 |
|
|
| 9,643 |
|
|
| 9,419 |
|
Home equity |
|
| 1 |
|
|
| 75 |
|
|
| 75 |
|
|
| 1 |
|
|
| 75 |
|
|
| 75 |
|
Commercial & industrial |
|
| — |
|
|
| — |
|
|
| — |
|
|
| 2 |
|
|
| 569 |
|
|
| 538 |
|
Other: |
|
|
|
|
|
|
|
|
|
|
|
|
|
|
|
|
|
|
|
|
|
|
|
|
Lease financing & other |
|
| — |
|
|
| — |
|
|
| — |
|
|
| — |
|
|
| — |
|
|
| — |
|
Overdrafts |
|
| — |
|
|
| — |
|
|
| — |
|
|
| — |
|
|
| — |
|
|
| — |
|
Total |
|
| 9 |
|
| $ | 3,785 |
|
| $ | 3,785 |
|
|
| 11 |
|
| $ | 15,833 |
|
| $ | 15,578 |
|
|
|
|
|
|
|
|
|
|
|
|
|
|
|
|
|
|
|
|
|
|
|
|
|
|
The troubled debt restructurings described above resulted in no charge-offs in 2014 and $269 during the year ended December 31, 2013.
The Company categorizes loans into risk categories based on relevant information about the ability of the borrowers to service their debt such as: value of underlying collateral, current financial information, historical payment experience, credit documentation, public information, and current economic trends, among other factors. The Company analyzes non-homogeneous loans individually and classifies them as to credit risk on a quarterly basis. The Company uses the following definitions for risk ratings.
Special Mention — Loans classified as special mention have potential weaknesses that deserve management’s close attention. If left uncorrected, these potential weaknesses may result in deterioration of repayment prospects for the asset or in the institution’s credit position at some future date.
Substandard — Loans classified as substandard are inadequately protected by the current net worth and paying capacity of the obligor or of the collateral pledged, if any. Loans so classified must have a well-defined weakness, or weaknesses, that jeopardize the liquidation of the debt. They are characterized by the distinct possibility that the bank will sustain some loss if the deficiencies are not corrected.
Doubtful — Loans classified as doubtful have all the weaknesses inherent in one classified as substandard with the added characteristic that the weaknesses make collection or liquidation in full, on the basis of currently known facts, conditions and values, highly questionable and improbable.
Loans not meeting the above criteria that are analyzed individually as part of the above described process are considered to be pass rated loans.
85
The following tables present the risk category by class of loans at the dates indicated of non-homogeneous loans individually classified as to credit risk as of the most recent analysis performed:
|
| December 31, 2014 |
| |||||||||||||||||
|
| Pass |
|
| Special Mention |
|
| Substandard |
|
| Doubtful |
|
| Total |
| |||||
|
| (In thousands) |
| |||||||||||||||||
Commercial real estate: |
|
|
|
|
|
|
|
|
|
|
|
|
|
|
|
|
|
|
|
|
Owner occupied |
| $ | 137,544 |
|
| $ | 8,969 |
|
| $ | 16,586 |
|
|
| — |
|
| $ | 163,099 |
|
Non owner occupied |
|
| 418,511 |
|
|
| 17,649 |
|
|
| 18,040 |
|
|
| — |
|
|
| 454,200 |
|
Construction: |
|
|
|
|
|
|
|
|
|
|
|
|
|
|
|
|
|
|
|
|
Commercial |
|
| 55,368 |
|
|
| 6,300 |
|
|
| 879 |
|
|
| — |
|
|
| 62,547 |
|
Residential |
|
| 39,077 |
|
|
| — |
|
|
| 178 |
|
|
| — |
|
|
| 39,255 |
|
Residential: |
|
|
|
|
|
|
|
|
|
|
|
|
|
|
|
|
|
|
|
|
Multifamily |
|
| 323,573 |
|
|
| 2,843 |
|
|
| — |
|
|
| — |
|
|
| 326,416 |
|
1-4 family |
|
| 27,737 |
|
|
| 2,350 |
|
|
| 9,577 |
|
|
| — |
|
|
| 39,664 |
|
Home equity |
|
| 32 |
|
|
| — |
|
|
| 1,750 |
|
|
| — |
|
|
| 1,782 |
|
Commercial & industrial |
|
| 429,147 |
|
|
| 8,641 |
|
|
| 2,670 |
|
|
| — |
|
|
| 440,458 |
|
Lease financing & other |
|
| 34,227 |
|
|
| — |
|
|
| 174 |
|
|
| — |
|
|
| 34,401 |
|
Total loans |
| $ | 1,465,216 |
|
| $ | 46,752 |
|
| $ | 49,854 |
|
|
| — |
|
| $ | 1,561,822 |
|
|
|
|
|
|
|
|
|
|
|
|
|
|
|
|
|
|
|
|
|
|
|
| December 31, 2013 |
| |||||||||||||||||
|
| Pass |
|
| Special Mention |
|
| Substandard |
|
| Doubtful |
|
| Total |
| |||||
|
| (In thousands) |
| |||||||||||||||||
Commercial real estate: |
|
|
|
|
|
|
|
|
|
|
|
|
|
|
|
|
|
|
|
|
Owner occupied |
| $ | 139,108 |
|
| $ | 6,342 |
|
| $ | 22,921 |
|
|
| — |
|
| $ | 168,371 |
|
Non owner occupied |
|
| 399,009 |
|
|
| 14,024 |
|
|
| 12,072 |
|
|
| — |
|
|
| 425,105 |
|
Construction: |
|
|
|
|
|
|
|
|
|
|
|
|
|
|
|
|
|
|
|
|
Commercial |
|
| 46,160 |
|
|
| — |
|
|
| 879 |
|
|
| — |
|
|
| 47,039 |
|
Residential |
|
| 37,931 |
|
|
| 3,341 |
|
|
| — |
|
|
| — |
|
|
| 41,272 |
|
Residential: |
|
|
|
|
|
|
|
|
|
|
|
|
|
|
|
|
|
|
|
|
Multifamily |
|
| 222,147 |
|
|
| 2,550 |
|
|
| 2,201 |
|
|
| — |
|
|
| 226,898 |
|
1-4 family |
|
| 42,158 |
|
|
| 2,008 |
|
|
| 17,274 |
|
|
| — |
|
|
| 61,440 |
|
Home equity |
|
| 34 |
|
|
| — |
|
|
| 1,112 |
|
|
| — |
|
|
| 1,146 |
|
Commercial & industrial |
|
| 249,238 |
|
|
| 5,207 |
|
|
| 4,133 |
|
|
| — |
|
|
| 258,578 |
|
Lease financing & other |
|
| 28,391 |
|
|
| — |
|
|
| 270 |
|
|
| — |
|
|
| 28,661 |
|
Total loans |
| $ | 1,164,176 |
|
| $ | 33,472 |
|
| $ | 60,862 |
|
|
| — |
|
| $ | 1,258,510 |
|
|
|
|
|
|
|
|
|
|
|
|
|
|
|
|
|
|
|
|
|
|
Loans not individually rated, primarily consisting of certain 1-4 family residential mortgages and home equity lines of credit, are evaluated for risk in groups of homogeneous loans. The primary risk characteristic evaluated on these pools is payment history.
The following tables present delinquency categories by class of loans for loans evaluated for risk in groups of homogeneous loans at the dates indicated:
| December 31, 2014 |
| |||||||||||||||||||||
| 31-59 Days |
|
| 60-89 Days |
|
| 90 Days Or |
|
| Total |
|
|
|
|
|
|
|
|
| ||||
| Past Due |
|
| Past Due |
|
| More Past Due |
|
| Past Due |
|
| Current |
|
| Total |
| ||||||
| (In thousands) |
| |||||||||||||||||||||
Residential: |
|
|
|
|
|
|
|
|
|
|
|
|
|
|
|
|
|
|
|
|
|
|
|
1-4 family | $ | 425 |
|
|
| — |
|
|
| — |
|
| $ | 425 |
|
| $ | 238,489 |
|
| $ | 238,914 |
|
Home equity |
| 4,133 |
|
| $ | 498 |
|
|
| — |
|
|
| 4,631 |
|
|
| 109,829 |
|
|
| 114,460 |
|
Other: |
|
|
|
|
|
|
|
|
|
|
|
|
|
|
|
|
|
|
|
|
|
|
|
Other loans |
| 1 |
|
|
| — |
|
|
| — |
|
|
| 1 |
|
|
| 2,789 |
|
|
| 2,790 |
|
Commercial & industrial |
| — |
|
|
| — |
|
|
| — |
|
|
| — |
|
|
| 8,170 |
|
|
| 8,170 |
|
Overdrafts |
| — |
|
|
| — |
|
|
| — |
|
|
| — |
|
|
| 1,248 |
|
|
| 1,248 |
|
Total loans | $ | 4,559 |
|
| $ | 498 |
|
|
| — |
|
| $ | 5,057 |
|
| $ | 360,525 |
|
| $ | 365,582 |
|
|
|
|
|
|
|
|
|
|
|
|
|
|
|
|
|
|
|
|
|
|
|
|
|
86
| December 31, 2013 |
| |||||||||||||||||||||
| 31-59 Days |
|
| 60-89 Days |
|
| 90 Days Or |
|
| Total |
|
|
|
|
|
|
|
|
| ||||
| Past Due |
|
| Past Due |
|
| More Past Due |
|
| Past Due |
|
| Current |
|
| Total |
| ||||||
| (In thousands) |
| |||||||||||||||||||||
Residential: |
|
|
|
|
|
|
|
|
|
|
|
|
|
|
|
|
|
|
|
|
|
|
|
1-4 family | $ | 705 |
|
| $ | 115 |
|
|
| — |
|
| $ | 820 |
|
| $ | 258,381 |
|
| $ | 259,201 |
|
Home equity |
| 408 |
|
|
| 540 |
|
|
| — |
|
|
| 948 |
|
|
| 110,264 |
|
|
| 111,212 |
|
Other: |
|
|
|
|
|
|
|
|
|
|
|
|
|
|
|
|
|
|
|
|
|
|
|
Other loans |
| 23 |
|
|
| 4 |
|
|
| — |
|
|
| 27 |
|
|
| 938 |
|
|
| 965 |
|
Overdrafts |
| — |
|
|
| — |
|
|
| — |
|
|
| — |
|
|
| 902 |
|
|
| 902 |
|
Total loans | $ | 1,136 |
|
| $ | 659 |
|
|
| — |
|
| $ | 1,795 |
|
| $ | 370,485 |
|
| $ | 372,280 |
|
|
|
|
|
|
|
|
|
|
|
|
|
|
|
|
|
|
|
|
|
|
|
|
|
Loans made directly or indirectly to executive officers, directors or principal stockholders were approximately $32,853 and $36,642 at December 31, 2014 and 2013, respectively. During 2014, new loans granted to these individuals totaled $2,964 and payments and decreases due to changes in board composition totaled $6,753. During 2013, new loans granted to these individuals totaled $12,840 and payments and decreases due to changes in board composition totaled $7,536.
Loans Held for Sale
There were no loans held-for-sale at December 31, 2014 and 2013.
5 Premises and Equipment
A summary of premises and equipment is as follows:
|
| December 31, |
| |||||
|
|
| 2014 |
|
|
| 2013 |
|
|
| (In thousands) |
| |||||
Land |
| $ | 1,085 |
|
| $ | 1,085 |
|
Buildings |
|
| 15,462 |
|
|
| 15,175 |
|
Leasehold improvements |
|
| 10,220 |
|
|
| 10,571 |
|
Furniture, fixtures and equipment |
|
| 24,138 |
|
|
| 21,562 |
|
Automobiles |
|
| 629 |
|
|
| 818 |
|
Total |
|
| 51,534 |
|
|
| 49,211 |
|
Less: accumulated depreciation and amortization |
|
| (36,283 | ) |
|
| (34,108 | ) |
Premises and equipment, net |
| $ | 15,251 |
|
| $ | 15,103 |
|
|
|
|
|
|
|
|
|
|
During 2013, the Company sold three of its properties, all of which were locations of bank branches. Two of the branches were closed and the third continued to lease the branch space from the new owner. The total book value of the properties at the time of the sales was $6,270. Net proceeds from the sales totaled $6,411. In addition, during 2013, the Company recorded an impairment charge of $975 related to leasehold improvements of other closed branches.
Depreciation and amortization expense totaled $2,775, $3,385 and $3,926 in 2014, 2013 and 2012, respectively.
6 Goodwill and Other Intangible Assets
The carrying amount of goodwill was $3,989 and $5,142 at December 31, 2014 and 2013, respectively. The balances at December 31, 2014 and 2013, reflected cumulative pretax impairment charges of $19,853 and $18,700, respectively, related to impairment of goodwill associated with the Company’s former asset management subsidiary. These impairment charges represented the results of a goodwill impairment analysis performed in the fourth quarter of 2013, which indicated pretax impairment of $18,700, which was recorded as a charge against earnings in December of 2013, and an additional pretax impairment charge of $1,153 recorded as a charge against earnings in December 2014 related to the divestiture of the asset management subsidiary. The cumulative deferred tax benefit on goodwill deductible for tax purposes was $2,592 and $2,879 at December 31, 2014 and 2013, respectively.
At December 31, 2013, the Company’s reporting unit had positive equity and the Company elected to perform a qualitative assessment to determine if it was more likely than not that the fair value of the reporting unit exceeded its carrying value, including goodwill. The qualitative assessment indicated that it was more likely than not that the carrying value of the reporting unit exceeded its fair value. Therefore, the Company proceeded to complete the two-step impairment test. Step 1 includes the determination of the carrying value of the reporting unit, including the existing goodwill and intangible assets, and estimating the fair value of the reporting
87
unit. If the carrying amount of a reporting unit exceeds its fair value, we are required to perform a second step to the impairment test. Our annual impairment analysis as of December 31, 2013, indicated that the Step 2 analysis was necessary. Step 2 of the goodwill impairment test is performed to measure the impairment loss. Step 2 requires that the implied fair value of the reporting unit goodwill be compared to the carrying amount of that goodwill. If the carrying amount of the reporting unit goodwill exceeds the implied fair value of that goodwill, an impairment loss shall be recognized in an amount equal to that excess. After performing Step 2 it was determined that the implied value of goodwill was less than the carrying costs, resulting in an impairment charge of $18,700 for the year ended December 31, 2013. The facts and circumstances that led to an impairment of goodwill included a loss of clients and a reduction in the projected earnings capacity of the Company’s asset management subsidiary. The fair value of the reporting unit at December 31, 2013 was determined based on a discounted cash flow model. The $1,153 impairment charge in 2014 resulted from similar impairment analyses performed in the fourth quarter of 2014 related to the divestiture of the Company’s asset management subsidiary, which was completed in January 2015. See Note 21 to the Company’s consolidated financial statements presented in this Form 10-K for additional discussion of the divestiture.
The following table sets forth the gross carrying amount and accumulated amortization for each of the Company’s intangible assets subject to amortization as of December 31:
|
| 2014 |
|
| 2013 |
| ||||||||||
|
| Gross |
|
|
|
|
|
| Gross |
|
|
|
|
| ||
|
| Carrying |
|
| Accumulated |
|
| Carrying |
|
| Accumulated |
| ||||
|
| Amount |
|
| Amortization |
|
| Amount |
|
| Amortization |
| ||||
|
| (In thousands) |
| |||||||||||||
|
|
|
|
|
|
|
|
|
|
|
|
|
|
|
|
|
Customer relationships |
| $ | 2,470 |
|
| $ | 1,947 |
|
| $ | 2,470 |
|
| $ | 1,757 |
|
Intangible assets amortization expense was $190, $190, and $748 for 2014, 2013 and 2012, respectively. The estimated remaining annual intangible assets amortization expense in years subsequent to December 31, 2014 is as follows:
Year |
| Amount |
| |
|
| (In thousands) |
| |
2015 |
| $ | 190 |
|
2016 |
|
| 190 |
|
2017 |
|
| 143 |
|
7 Deposits
The following table presents a summary of deposits at the dates indicated:
|
| December 31 |
|
| December 31 |
| ||
|
|
| 2014 |
|
|
| 2013 |
|
|
| (In thousands) |
| |||||
Demand deposits |
| $ | 1,081,251 |
|
| $ | 1,069,631 |
|
Money market accounts |
|
| 962,487 |
|
|
| 870,291 |
|
Savings accounts |
|
| 128,252 |
|
|
| 120,000 |
|
Time deposits of $100,000 or more |
|
| 80,332 |
|
|
| 85,205 |
|
Time deposits of less than $100,000 |
|
| 27,739 |
|
|
| 30,863 |
|
Checking with interest |
|
| 501,011 |
|
|
| 457,754 |
|
Total deposits |
| $ | 2,781,072 |
|
| $ | 2,633,744 |
|
|
|
|
|
|
|
|
|
|
The Company participates in a reciprocal sweep arrangement with other financial institutions through an intermediary which provides customers with balances in excess of FDIC insurance limits a vehicle to expand the insurable amount of their deposits. Money market and checking with interest deposit balances under this arrangement totaled $72,427 and $49,408 at December 31, 2014 and 2013, respectively. Deposits under this arrangement are considered brokered deposits for regulatory reporting purposes. The Company had no other brokered deposits at December 31, 2014 or 2013.
88
Scheduled maturities of time deposits for each of the five years subsequent to December 31, 2014 are as follows:
Year |
| Amount |
| |
|
| (In thousands) |
| |
2015 |
| $ | 93,400 |
|
2016 |
|
| 5,688 |
|
2017 |
|
| 4,049 |
|
2018 |
|
| 2,150 |
|
2019 |
|
| 2,784 |
|
8 Borrowings
The Company’s borrowings with original maturities of one year or less totaled $28,161 and $34,379 at December 31, 2014 and 2013, respectively. Such short-term borrowings consisted entirely of customer repurchase agreements at December 31, 2014. There were no other borrowings at December 31, 2014. At December 31, 2013, other borrowings totaled $16,388, which included a $15,000 callable fixed rate FHLB borrowing with an initial stated maturity of ten years and a $1,300 non-callable FHLB borrowing with an initial maturity of thirty years. In January 2014, the Company prepaid all of its outstanding Federal Home Loan Bank borrowings. The borrowings totaled $16,388 and the related prepayment penalty totaled $1,860 which was recorded in earnings at the time of the prepayment.
As of December 31, 2014 and 2013, borrowings were collateralized by loans and securities with an estimated fair value of $28,161 and $50,767, respectively.
Interest expense on all borrowings totaled $49, $751 and $826 in 2014, 2013 and 2012, respectively.
The following table summarizes the average balances, weighted average interest rates and the maximum month-end outstanding amounts of the Company’s borrowings for each of the following years:
|
|
|
| 2014 |
|
| 2013 |
|
| 2012 |
| |||
|
|
|
| (Dollars in thousands) |
| |||||||||
Average balance: |
| Short-term |
| $ | 33,654 |
|
| $ | 26,738 |
|
| $ | 45,619 |
|
|
| Other Borrowings |
|
| 225 |
|
|
| 16,407 |
|
|
| 16,446 |
|
Weighted average interest rate (for the year): |
| Short-term |
|
| 0.1 | % |
|
| 0.1 | % |
|
| 0.2 | % |
|
| Other Borrowings |
|
| 4.4 |
|
|
| 4.4 |
|
|
| 4.4 |
|
Weighted average interest rate (at year end): |
| Short-term |
|
| 0.1 | % |
|
| 0.1 | % |
|
| 0.3 | % |
|
| Other Borrowings |
|
| — |
|
|
| 4.4 |
|
|
| 4.4 |
|
Maximum month-end outstanding amount: |
| Short-term |
| $ | 46,072 |
|
| $ | 34,379 |
|
| $ | 56,312 |
|
|
| Other Borrowings |
|
| — |
|
|
| 16,425 |
|
|
| 16,463 |
|
HVB is a member of the FHLB. As a member, HVB is able to participate in various FHLB borrowing programs which require certain investments in FHLB common stock as a prerequisite to obtaining funds. As of December 31, 2014, HVB had short-term borrowing lines with the FHLB of $188 million with no amounts outstanding. These, and various other FHLB borrowing programs available to members, are subject to availability of qualifying loan and/or investment securities collateral and other terms and conditions.
HVB also has unsecured overnight borrowing lines totaling $75 million with three major financial institutions which were all unused and available at December 31, 2014. In addition, HVB has approved lines under Retail Certificate of Deposit Agreements with three major financial institutions totaling $1.1 billion of which no balances were outstanding as at December 31, 2014. Utilization of these lines is subject to product availability and other restrictions.
Additional liquidity is also provided by the Company’s ability to borrow from the FRB’s discount window. In response to the current economic crisis, the FRB has increased the ability of banks to borrow from this source through its Borrower-in-Custody (“BIC”) program, which expanded the types of collateral which qualify as security for such borrowings. HVB has been approved to participate in the BIC program. There were no balances outstanding with the FRB at December 31, 2014 or 2013.
As of December 31, 2014, the Company had qualifying loan and investment securities totaling approximately $736 million which could be utilized under available borrowing programs thereby increasing liquidity.
89
The various borrowing programs discussed above are subject to certain restrictions and terms and conditions which may include continued availability of such borrowing programs, the Company’s ability to pledge qualifying collateral in sufficient amounts, the Company’s maintenance of capital ratios acceptable to these lenders and other conditions which may be imposed on the Company.
9 Income Taxes
The reconciliation between the provision (benefit) for income taxes and the amount computed using the federal statutory rate is as follows:
|
| Year Ended December 31, |
| |||||||||||||||||||||
|
| 2014 |
|
| 2013 |
|
| 2012 |
| |||||||||||||||
|
| (Dollars in thousands) |
| |||||||||||||||||||||
Income tax at statutory rate |
| $ | 4,173 |
|
|
| 35.0 | % |
| $ | (1,223 | ) |
|
| 35.0 | % |
| $ | 16,144 |
|
|
| 35.0 | % |
State and local income tax, net of federal benefit |
|
| 330 |
|
|
| 2.8 | % |
|
| (807 | ) |
|
| 23.1 | % |
|
| 2,446 |
|
|
| 5.3 | % |
Tax-exempt interest income |
|
| (1,372 | ) |
|
| (11.5 | )% |
|
| (1,585 | ) |
|
| 45.3 | % |
|
| (1,712 | ) |
|
| (3.7 | )% |
Non-deductible expenses and other |
|
| 851 |
|
|
| 7.1 | % |
|
| (1,011 | ) |
|
| 28.9 | % |
|
| 67 |
|
|
| 0.1 | % |
Provision (benefit) for income taxes |
| $ | 3,982 |
|
|
| 33.4 | % |
| $ | (4,626 | ) |
|
| 132.3 | % |
| $ | 16,945 |
|
|
| 36.7 | % |
|
|
|
|
|
|
|
|
|
|
|
|
|
|
|
|
|
|
|
|
|
|
|
|
|
The components of the provision (benefit) for income taxes were as follows:
|
| Year Ended December 31, |
| |||||||||
|
|
| 2014 |
|
|
| 2013 |
|
|
| 2012 |
|
|
| (In thousands) |
| |||||||||
Federal: |
|
|
|
|
|
|
|
|
|
|
|
|
Current |
| $ | 1,717 |
|
| $ | 3,476 |
|
| $ | 13,457 |
|
Deferred |
|
| 1,760 |
|
|
| (6,860 | ) |
|
| (275 | ) |
State and Local: |
|
|
|
|
|
|
|
|
|
|
|
|
Current |
|
| 738 |
|
|
| 892 |
|
|
| 1,560 |
|
Deferred |
|
| (233 | ) |
|
| (2,134 | ) |
|
| 2,203 |
|
Total |
| $ | 3,982 |
|
| $ | (4,626 | ) |
| $ | 16,945 |
|
|
|
|
|
|
|
|
|
|
|
|
|
|
The tax effect of temporary differences giving rise to deferred tax assets and liabilities were as follows:
|
| December 31, 2014 |
|
| December 31, 2013 |
| ||||||||||
|
| Asset |
|
| Liability |
|
| Asset |
|
| Liability |
| ||||
|
| (In thousands) |
| |||||||||||||
Allowance for loan losses |
| $ | 11,031 |
|
|
| — |
|
| $ | 10,763 |
|
|
| — |
|
Supplemental executive retirement benefit |
|
| 5,159 |
|
|
| — |
|
|
| 5,229 |
|
|
| — |
|
Other-than-temporary impairment of investments |
|
| — |
|
|
| — |
|
|
| 4,655 |
|
|
| — |
|
Other |
|
| 5,169 |
|
| $ | 425 |
|
|
| 2,700 |
|
| $ | 597 |
|
Unfunded SERP liability |
|
| 709 |
|
|
| — |
|
|
| 695 |
|
|
| — |
|
Deferred compensation |
|
| — |
|
|
| — |
|
|
| 235 |
|
|
| — |
|
Share based compensation costs |
|
| 386 |
|
|
| — |
|
|
| 287 |
|
|
| — |
|
State net operating loss carryforward |
|
| 115 |
|
|
| — |
|
|
| 189 |
|
|
| — |
|
Intangible assets |
|
| 2,176 |
|
|
| — |
|
|
| 2,820 |
|
|
| — |
|
Property and equipment |
|
| 2,341 |
|
|
| — |
|
|
| 1,198 |
|
|
| — |
|
Unrealized gains/losses on available for sale securities |
|
| — |
|
|
| 297 |
|
|
| 3,259 |
|
|
| — |
|
Total |
| $ | 27,086 |
|
| $ | 722 |
|
| $ | 32,030 |
|
| $ | 597 |
|
|
|
|
|
|
|
|
|
|
|
|
|
|
|
|
|
|
Net deferred tax asset |
| $ | 26,364 |
|
|
|
|
|
| $ | 31,433 |
|
|
|
|
|
|
|
|
|
|
|
|
|
|
|
|
|
|
|
|
|
|
The Company determined that it was not required to establish a valuation allowance for deferred tax assets in accordance with GAAP since it is more likely than not that the deferred tax asset will be realized through carryback to taxable income in prior years, future reversals of existing taxable temporary differences, and future taxable income.
At December 31, 2014 and 2013, the Company had no unrecognized tax benefits. The Company does not expect the total amount of unrecognized tax benefits to significantly increase within the next twelve months. The Company policy is to recognize
90
interest and penalties related to unrecognized tax benefits as a component of income tax expense. There were no expenses accrued for interest and penalties on unrecognized tax benefits for the years ended December 31, 2014, 2013, or 2012.
On January 1, 2015, the Company’s Bank subsidiary became subject to tax under Article 9(A) for New York State tax purposes. The Company recognized $800 in state tax expense in 2014 for the transition.
In the normal course of business, the Company’s Federal, New York State and New York City Corporation Tax returns are subject to examination. The Company is currently open to examination by the Internal Revenue Service for years after 2011. The Company is currently undergoing a routine examination by New York State for years 2009 through 2012. This examination has not yet been completed and no significant issues have yet been raised.
10 Regulatory Capital Requirements
The Company and the Bank are subject to various regulatory capital requirements administered by the federal banking agencies. Failure to meet minimum capital requirements can initiate certain mandatory — and possibly additional discretionary — actions by regulators that, if undertaken, could have a direct material effect on the financial statements of the Company and the Bank. Under capital adequacy guidelines and the regulatory framework for prompt corrective action, the Company and the Bank must meet specific capital guidelines that involve quantitative measures of their assets, liabilities and certain off-balance-sheet items as calculated under regulatory accounting practices. Quantitative measures established by regulation to ensure capital adequacy require the Company and HVB to maintain minimum amounts and ratios (set forth in the table below) of total and Tier I capital (as defined in the regulations) to risk-weighted assets (as defined), and of Tier I capital (as defined) to average assets (as defined).
Capital amounts and classifications are also subject to qualitative judgments by the regulators about components, risk weightings and other factors.
91
The following summarizes the capital requirements and capital position at December 31, 2014 and 2013:
|
|
|
|
|
|
|
| Minimum to be |
| |||||||||||||||
|
|
|
|
|
|
|
| Well Capitalized |
| |||||||||||||||
|
|
|
|
| Minimum for |
|
| Under Prompt |
| |||||||||||||||
|
| Actual |
|
| Capital Adequacy |
|
| Corrective Action |
| |||||||||||||||
Capital Ratios: |
| Amount |
|
| Ratio |
|
| Amount |
|
| Ratio |
|
| Amount |
|
| Ratio |
| ||||||
|
| (Dollars in thousands) |
| |||||||||||||||||||||
HVB Only: |
|
|
|
|
|
|
|
|
|
|
|
|
|
|
|
|
|
|
|
|
|
|
|
|
December 31, 2014 |
|
|
|
|
|
|
|
|
|
|
|
|
|
|
|
|
|
|
|
|
|
|
|
|
Total Capital (To Risk Weighted Assets) |
| $ | 312,681 |
|
|
| 14.8% |
|
| $ | 168,574 |
|
|
| 8.0% |
|
| $ | 210,717 |
|
|
| 10.0% |
|
Tier 1 Capital (To Risk Weighted Assets) |
|
| 286,327 |
|
|
| 13.6% |
|
|
| 84,287 |
|
|
| 4.0% |
|
|
| 126,430 |
|
|
| 6.0% |
|
Tier 1 Capital (To Average Assets) |
|
| 286,327 |
|
|
| 9.1% |
|
|
| 125,528 |
|
|
| 4.0% |
|
|
| 156,910 |
|
|
| 5.0% |
|
|
|
|
|
|
|
|
|
|
|
|
|
|
|
|
|
|
|
|
|
|
|
|
|
|
December 31, 2013 |
|
|
|
|
|
|
|
|
|
|
|
|
|
|
|
|
|
|
|
|
|
|
|
|
Total Capital (To Risk Weighted Assets) |
| $ | 295,940 |
|
|
| 17.1% |
|
| $ | 138,533 |
|
|
| 8.0% |
|
| $ | 173,167 |
|
|
| 10.0% |
|
Tier 1 Capital (To Risk Weighted Assets) |
|
| 274,239 |
|
|
| 15.8% |
|
|
| 69,267 |
|
|
| 4.0% |
|
|
| 103,900 |
|
|
| 6.0% |
|
Tier 1 Capital (To Average Assets) |
|
| 274,239 |
|
|
| 9.3% |
|
|
| 118,062 |
|
|
| 4.0% |
|
|
| 147,578 |
|
|
| 5.0% |
|
|
|
|
|
|
|
|
|
|
|
|
|
|
|
|
|
|
|
|
|
|
|
|
|
|
Consolidated: |
|
|
|
|
|
|
|
|
|
|
|
|
|
|
|
|
|
|
|
|
|
|
|
|
December 31, 2014 |
|
|
|
|
|
|
|
|
|
|
|
|
|
|
|
|
|
|
|
|
|
|
|
|
Total Capital (To Risk Weighted Assets) |
| $ | 319,454 |
|
|
| 15.1% |
|
| $ | 168,835 |
|
|
| 8.0% |
|
|
|
|
|
|
|
|
|
Tier 1 Capital (To Risk Weighted Assets) |
|
| 293,059 |
|
|
| 13.9% |
|
|
| 84,418 |
|
|
| 4.0% |
|
|
|
|
|
|
|
|
|
Tier 1 Capital (To Average Assets) |
|
| 293,059 |
|
|
| 9.3% |
|
|
| 125,765 |
|
|
| 4.0% |
|
|
|
|
|
|
|
|
|
|
|
|
|
|
|
|
|
|
|
|
|
|
|
|
|
|
|
|
|
|
|
|
|
|
December 31, 2013 |
|
|
|
|
|
|
|
|
|
|
|
|
|
|
|
|
|
|
|
|
|
|
|
|
Total Capital (To Risk Weighted Assets) |
| $ | 303,059 |
|
|
| 17.5% |
|
| $ | 138,843 |
|
|
| 8.0% |
|
|
|
|
|
|
|
|
|
Tier 1 Capital (To Risk Weighted Assets) |
|
| 281,310 |
|
|
| 16.2% |
|
|
| 69,422 |
|
|
| 4.0% |
|
|
|
|
|
|
|
|
|
Tier 1 Capital (To Average Assets) |
|
| 281,310 |
|
|
| 9.5% |
|
|
| 118,257 |
|
|
| 4.0% |
|
|
|
|
|
|
|
|
|
Management believes, as of December 31, 2014, that the Bank had capital in excess of the minimum level required to meet the definition of “well capitalized”. At December 31, 2014 and 2013, the Company and the Bank met all capital adequacy requirements to which they were subject.
In addition, pursuant to Rule 15c3-1 of the Securities and Exchange Commission, ARS as a broker-dealer is required to maintain minimum “net capital” as defined under such rule. As of December 31, 2014 and 2013, ARS exceeded its minimum capital requirement.
11 Stock-Based Compensation
In accordance with the provisions of the Hudson Valley Holding Corp. 2010 Omnibus Incentive Plan (the “2010 Plan”), the Company may grant eligible employees, including directors, consultants and advisors, incentive stock options, non-qualified stock options, restricted stock awards, restricted stock units, stock appreciation rights, performance awards and other types of awards. The 2010 Plan provides for the issuance of up to 1,331,000 shares of the Company’s common stock. Prior to the 2010 Plan, the Company had stock option plans that provided for the granting of options to directors, officers, eligible employees, and certain advisors at an exercise price not less than the market value of the stock on the date of grant subject to various eligibility and vesting requirements. There will be no further grants under any plans adopted prior to the 2010 Plan.
Compensation costs relating to stock-based payment transactions are recognized in the financial statements with measurement based upon the fair value of the equity or liability instruments issued. Stock-based payments are expensed over their respective vesting periods.
92
The following table summarizes stock based compensation activity for 2014:
|
|
|
|
|
| Weighted |
|
| Aggregate |
|
| Weighted Average |
| |||
|
|
|
|
|
| Average Grant or |
|
| Intrinsic Value (2) |
|
| Remaining |
| |||
Prior Option Plans (1): |
| Shares |
|
| Exercise Price |
|
| (In thousands) |
|
| Contractual Term |
| ||||
Outstanding at December 31, 2013 |
|
| 295,627 |
|
| $ | 21.62 |
|
|
|
|
|
|
|
|
|
Granted |
|
| — |
|
|
| — |
|
|
|
|
|
|
|
|
|
Exercised |
|
| (117,232 | ) |
|
| 20.74 |
|
|
|
|
|
|
|
|
|
Cancelled or expired |
|
| (89,929 | ) |
|
| 19.30 |
|
|
|
|
|
|
|
|
|
Outstanding at December 31, 2014 |
|
| 88,466 |
|
|
| 25.14 |
|
| $ | 257 |
|
|
| 1.2 |
|
|
|
|
|
|
|
|
|
|
|
|
|
|
|
|
|
|
Exercisable at December 31, 2014 |
|
| 88,466 |
|
|
| 25.14 |
|
|
| 257 |
|
|
| 1.2 |
|
|
|
|
|
|
|
|
|
|
|
|
|
|
|
|
|
|
Non-vested at December 31, 2014 |
|
| — |
|
|
| — |
|
|
|
|
|
|
|
|
|
|
|
|
|
|
|
|
|
|
|
|
|
|
|
|
|
|
|
|
|
|
|
|
|
|
|
|
|
|
|
|
|
|
|
2010 Omnibus Incentive Plan: |
|
|
|
|
|
|
|
|
|
|
|
|
|
|
|
|
|
|
|
|
|
|
|
|
|
|
|
|
|
|
|
|
|
Non-vested at December 31, 2013 |
|
| 251,274 |
|
| $ | 16.30 |
|
|
|
|
|
|
|
|
|
Granted at fair value |
|
| 210,142 |
|
|
| 19.73 |
|
|
|
|
|
|
|
|
|
Restriction released |
|
| (169,499 | ) |
|
| 18.91 |
|
|
|
|
|
|
|
|
|
Cancelled |
|
| (81,200 | ) |
|
| 16.72 |
|
|
|
|
|
|
|
|
|
Non-vested at December 31, 2014 |
|
| 210,717 |
|
|
| 17.46 |
|
|
|
|
|
|
|
|
|
|
|
|
|
|
|
|
|
|
|
|
|
|
|
|
|
|
|
|
|
|
|
|
|
|
|
|
|
|
|
|
|
|
|
Available for grant at December 31, 2013 |
|
| 968,762 |
|
|
|
|
|
|
|
|
|
|
|
|
|
Restricted stock awards |
|
| (210,142 | ) |
| $ | 19.53 |
|
|
|
|
|
|
|
|
|
Unissued or cancelled |
|
| 193,441 |
|
|
| 17.25 |
|
|
|
|
|
|
|
|
|
Available for future grant |
|
| 952,061 |
|
|
|
|
|
|
|
|
|
|
|
|
|
|
|
|
|
|
|
|
|
|
|
|
|
|
|
|
|
|
|
(1) | Prior option plans did not include restricted stock awards. |
(2) | The aggregate intrinsic value of a stock option in the table above represents the total pretax intrinsic value (the amount by which the current market value of the underlying stock exceeds the exercise price of the option) that would have been received by the option holders had all option holders exercised their options on December 31, 2014. This amount changes based on changes in the market value of the Company’s stock. |
The following table summarizes the range of exercise prices of the Company’s stock options outstanding and exercisable at December 31, 2014:
|
|
|
|
|
|
|
|
|
|
|
|
|
| Weighted Average |
| |||||
|
|
|
|
|
|
|
|
|
| Number |
|
| Remaining |
|
| Exercise |
| |||
|
| Exercise Price |
|
| of Options |
|
| Life (Years) |
|
| Price |
| ||||||||
|
| $ | 18.79 |
|
| $ | 23.71 |
|
|
| 33,899 |
|
|
| 0.9 |
|
| $ | 23.22 |
|
|
|
| 23.73 |
|
|
| 25.63 |
|
|
| 36,712 |
|
|
| 1.0 |
|
|
| 23.96 |
|
|
|
| 25.77 |
|
|
| 36.29 |
|
|
| 17,855 |
|
|
| 2.3 |
|
|
| 31.23 |
|
Total options outstanding |
|
| 18.79 |
|
|
| 36.29 |
|
|
| 88,466 |
|
|
| 1.2 |
|
|
| 25.14 |
|
Exercisable |
|
| 18.79 |
|
|
| 36.29 |
|
|
| 88,466 |
|
|
| 1.2 |
|
|
| 25.14 |
|
Not exercisable |
|
| — |
|
|
| — |
|
|
| — |
|
|
| — |
|
|
| — |
|
The fair value (present value of the estimated future benefit to the option holder) of each option grant is estimated on the date of grant using the Black-Scholes option pricing model. There were no non-vested options at December 31, 2014 and 2013. There were no stock options granted in the years ended December 31, 2014 and 2013.
There was no compensation expense related to the Company’s stock option plans included in net income for the years ended December 31, 2014 and 2013. Compensation benefit of $63 related to the Company’s stock option plans was included in net income for the year ended December 31, 2012. There was no remaining unrecognized compensation expense related to stock options at December 31, 2014. Cash received from option exercises was $2,432, $1,042 and $547 for the years ended December 31, 2014, 2013 and 2012, respectively.
93
Compensation expense of $3,645, $1,918, and $457 related to the Company’s restricted stock awards was included in net income and the related tax benefit was $1,510, $794, and $189 for the years ended December 31, 2014, 2013 and 2012, respectively. Unrecognized compensation expense related to restricted stock awards totaled $1,969, $3,168, and $3,284 at December 31, 2014, 2013 and 2012, respectively. This expense is expected to be recognized over a remaining weighted average period of 1.9 years.
12 Fair Value
Fair value is the exchange price that would be received for an asset or paid to transfer a liability (exit price) in the principal or most advantageous market for the asset or liability in an orderly transaction between market participants on the measurement date. There are three levels of inputs that may be used to measure fair values:
Level 1: Quoted prices (unadjusted) for identical assets or liabilities in active markets that the entity has the ability to access as of the measurement date.
Level 2: Significant other observable inputs other than Level 1 prices such as quoted prices for similar assets or liabilities; quoted prices in markets that are not active; or other inputs that are observable or can be corroborated by observable market data.
Level 3: Significant unobservable inputs that reflect a reporting entity’s own assumptions about the assumptions that market participants would use in pricing an asset or liability.
A description of the valuation methodologies used for assets and liabilities measured at fair value, as well as the general classification of such instruments pursuant to the valuation hierarchy, is set forth below. While management believes the Company’s valuation methodologies are appropriate and consistent with other financial institutions, the use of different methodologies or assumptions to determine the fair value of certain financial instruments could result in a different estimate of fair value at the reporting date.
Investment Securities — The fair values of investment securities are determined by obtaining quoted prices on nationally recognized securities exchanges, if available (Level 1), or matrix pricing, which is a mathematical technique widely used in the industry to value debt securities without relying exclusively on quoted prices for the specific securities but rather by relying on the securities’ relationship to other benchmark quoted securities, which is a Level 2 input. The Company’s available for sale securities at December 31, 2013 included several pooled trust preferred instruments. The downturn in the overall economy and, in particular, in the financial services industry had created a situation where significant observable inputs (Level 2) were not readily available for these instruments at that time. As an alternative, the Company combined Level 2 input of market yield requirements of similar instruments together with certain Level 3 assumptions addressing the impact of current market illiquidity to estimate the fair value of these instruments which were sold in January 2014. The fair values of Level 3 investment securities are determined by the Company’s Controller and Investment Officer who report to the Chief Financial Officer. See Note 2 “Securities” for further discussion of pooled trust preferred securities.
Impaired Loans — At the time a loan is considered impaired, it is generally valued at lower of cost or fair value. Impaired loans carried at fair value generally are partially charged off or receive specific allocations of the allowance for loan losses. For collateral dependent loans, fair value is commonly based on recent real estate appraisals adjusted for market conditions and costs to sell. Management may apply additional discounts based on changes in the market from the time of valuation. Such adjustments are usually significant and typically result in a Level 3 classification of the inputs for determining value. Non-real estate collateral may be valued using an appraisal, net book value per the borrower’s financial statements, or aging reports, adjusted or discounted based on management’s historical knowledge, changes in market conditions from the time of the valuation, and management’s expertise and knowledge of the client and the client’s business, resulting in a Level 3 fair value classification. Impaired loans are evaluated on a quarterly basis for additional impairment and adjusted accordingly.
Other Real Estate Owned (“OREO”) — Real estate properties acquired through loan foreclosure are recorded at estimated fair value, net of estimated selling costs, at time of foreclosure establishing a new cost basis. Fair value is commonly based on real estate appraisals. These appraisals may utilize a single valuation approach or a combination of approaches including comparable sales and the income approach. Adjustments are routinely made in the appraisal process by the independent appraisers to adjust for differences between the comparable sales and income data available. Such adjustments are usually significant and typically result in a Level 3 classification of the inputs used in determining fair value.
94
Assets and liabilities measured at fair value are summarized below:
|
| December 31, 2014 |
| |||||||||||||
|
| Quoted Prices in |
|
| Significant |
|
| Significant |
|
|
|
|
| |||
|
| Active Markets |
|
| Other |
|
| Unobservable |
|
|
|
|
| |||
|
| for Identical Assets |
|
| Observable Inputs |
|
| Inputs |
|
|
|
|
| |||
|
| (Level 1) |
|
| (Level 2) |
|
| (Level 3) |
|
| Total |
| ||||
|
| (In thousands) |
| |||||||||||||
Measured on a recurring basis: |
|
|
|
|
|
|
|
|
|
|
|
|
|
|
|
|
Available for sale securities: |
|
|
|
|
|
|
|
|
|
|
|
|
|
|
|
|
U.S. Treasury and government agencies |
|
| — |
|
| $ | 120,422 |
|
|
| — |
|
| $ | 120,422 |
|
Mortgage-backed securities - residential |
|
| — |
|
|
| 582,459 |
|
|
| — |
|
|
| 582,459 |
|
Obligations of states and political subdivisions |
|
| — |
|
|
| 101,454 |
|
|
| — |
|
|
| 101,454 |
|
Other debt securities |
|
| — |
|
|
| 970 |
|
|
| — |
|
|
| 970 |
|
Mutual funds and other equity securities |
| $ | 10,411 |
|
|
| — |
|
|
| — |
|
|
| 10,411 |
|
Total assets at fair value |
| $ | 10,411 |
|
| $ | 805,305 |
|
|
| — |
|
| $ | 815,716 |
|
|
|
|
|
|
|
|
|
|
|
|
|
|
|
|
|
|
Measured on a non-recurring basis: |
|
|
|
|
|
|
|
|
|
|
|
|
|
|
|
|
Impaired loans: (1) |
|
|
|
|
|
|
|
|
|
|
|
|
|
|
|
|
Commercial real estate |
|
| — |
|
|
| — |
|
| $ | 725 |
|
| $ | 725 |
|
Construction |
|
| — |
|
|
| — |
|
|
| — |
|
|
| — |
|
Residential |
|
| — |
|
|
| — |
|
|
| — |
|
|
| — |
|
Commercial & industrial |
|
| — |
|
|
| — |
|
|
| — |
|
|
| — |
|
Total assets at fair value |
|
| — |
|
|
| — |
|
| $ | 725 |
|
| $ | 725 |
|
|
|
|
|
|
|
|
|
|
|
|
|
|
|
|
|
|
|
(1) | Impaired loans are reported at the fair value of the underlying collateral if repayment is expected solely from the collateral. Collateral values are estimated using Level 2 and Level 3 inputs which include independent appraisals and internally customized discounting criteria. The recorded investment in impaired loans subject to fair value reporting on December 31, 2014 was $725 for which no specific allowance has been established within the allowance for loan losses. During 2014, $167 of charge-offs were recorded related to impaired loans. The level of charge-offs has a direct impact on the determination of the provision for loan losses. The fair values were based on internally customized discounting criteria of the collateral and thus classified as Level 3 fair values. |
|
| December 31, 2013 |
| |||||||||||||
|
| Quoted Prices in |
|
| Significant |
|
| Significant |
|
|
|
|
| |||
|
| Active Markets |
|
| Other |
|
| Unobservable |
|
|
|
|
| |||
|
| for Identical Assets |
|
| Observable Inputs |
|
| Inputs |
|
|
|
|
| |||
|
| (Level 1) |
|
| (Level 2) |
|
| (Level 3) |
|
| Total |
| ||||
|
| (In thousands) |
| |||||||||||||
Measured on a recurring basis: |
|
|
|
|
|
|
|
|
|
|
|
|
|
|
|
|
Available for sale securities: |
|
|
|
|
|
|
|
|
|
|
|
|
|
|
|
|
U.S. Treasury and government agencies |
|
| — |
|
| $ | 93,692 |
|
|
| — |
|
| $ | 93,692 |
|
Mortgage-backed securities - residential |
|
| — |
|
|
| 339,695 |
|
|
| — |
|
|
| 339,695 |
|
Obligations of states and political subdivisions |
|
| — |
|
|
| 89,304 |
|
|
| — |
|
|
| 89,304 |
|
Other debt securities |
|
| — |
|
|
| 9,529 |
|
|
| — |
|
|
| 9,529 |
|
Mutual funds and other equity securities |
| $ | 9,978 |
|
|
| — |
|
|
| — |
|
|
| 9,978 |
|
Total assets at fair value |
| $ | 9,978 |
|
| $ | 532,220 |
|
|
| — |
|
| $ | 542,198 |
|
|
|
|
|
|
|
|
|
|
|
|
|
|
|
|
|
|
Measured on a non-recurring basis: |
|
|
|
|
|
|
|
|
|
|
|
|
|
|
|
|
Impaired loans: (1) |
|
|
|
|
|
|
|
|
|
|
|
|
|
|
|
|
Commercial real estate |
|
| — |
|
|
| — |
|
|
| — |
|
|
| — |
|
Construction |
|
| — |
|
|
| — |
|
|
| — |
|
|
| — |
|
Residential |
|
| — |
|
|
| — |
|
| $ | 380 |
|
| $ | 380 |
|
Commercial & industrial |
|
| — |
|
|
| — |
|
|
| 895 |
|
|
| 895 |
|
Total assets at fair value |
|
| — |
|
|
| — |
|
| $ | 1,275 |
|
| $ | 1,275 |
|
|
|
|
|
|
|
|
|
|
|
|
|
|
|
|
|
|
|
95
(1) | Impaired loans are reported at the fair value of the underlying collateral if repayment is expected solely from the collateral. Collateral values are estimated using Level 2 and Level 3 inputs which include independent appraisals and internally customized discounting criteria. The recorded investment in impaired loans subject to fair value reporting on December 31, 2013 was $1,275 for which no specific allowance has been established within the allowance for loan losses. During 2013, $31 of charge-offs were recorded related to impaired loans. The level of charge-offs has a direct impact on the determination of the provision for loan losses. The fair values were based on internally customized discounting criteria of the collateral and thus classified as Level 3 fair values. |
The table below presents a reconciliation and income statement classification of gains and losses for securities available for sale measured at fair value on a recurring basis using significant unobservable inputs (Level 3) for the periods indicated:
|
| Year Ended December 31, |
| |||||
|
|
| 2014 |
|
|
| 2013 |
|
|
| (In thousands) |
| |||||
Balance at beginning of period |
|
| — |
|
| $ | 2,950 |
|
Additions to level 3 |
|
| — |
|
|
| 263 |
|
Net unrealized gain (loss) included in other comprehensive income (1) |
|
| — |
|
|
| 7,571 |
|
Principal payments |
|
| — |
|
|
| (791 | ) |
Recognized impairment charge included in the statement of income (2) |
|
| — |
|
|
| (1,240 | ) |
Transfers out of level 3 |
|
| — |
|
|
| (8,753 | ) |
Balance at end of period |
|
| — |
|
| $ | — |
|
|
|
|
|
|
|
|
|
|
|
(1) | Reported under “Gains recognized in comprehensive income” |
(2) | Reported under “Net impairment loss recognized in earnings” |
The following table presents quantitative information about Level 3 fair value measurements for financial instruments measured at fair value on a non-recurring basis at the dates indicated:
|
| Fair Value at |
|
|
|
|
|
|
|
|
| |
|
| December 31, 2014 |
|
| Valuation |
| Unobservable |
|
|
|
| |
Asset |
| (In thousands) |
|
| Technique |
| Inputs |
| Discount |
| ||
Impaired loans - commercial real estate |
| $ | 725 |
|
| Sales comparison approach |
| Discounts to appraisals for market conditions |
|
| 5% |
|
|
| Fair Value at |
|
|
|
|
|
|
| |
|
| December 31, 2013 |
|
| Valuation |
| Unobservable |
| Discount Range | |
Asset |
| (In thousands) |
|
| Technique |
| Inputs |
| (Weighted Average) | |
Impaired loans - residential real estate |
| $ | 380 |
|
| Sales comparison approach |
| Discounts to appraisals for market conditions |
| 0% (0%) |
|
|
|
|
|
|
|
|
|
|
|
Impaired loans - commercial and industrial |
|
| 895 |
|
| Sales comparison approach |
| Discounts to appraisals for market conditions |
| 0% (0%) |
13 Benefit Plans
The Hudson Valley Bank Employees’ Defined Contribution Pension Plan covers substantially all employees. Pension costs charged to current operations included 5.0 percent of each participant’s earnings in 2014, 2013 and 2012. Pension costs charged to operating expenses totaled $1,227, $914 and $1,219 in 2014, 2013 and 2012, respectively.
The Hudson Valley Bank Employees’ Savings Plan covers substantially all employees. The Company matches 25 percent of employee contributions annually, up to 4 percent of base salary. Savings Plan costs charged to expense totaled approximately $188, $176 and $180 in 2014, 2013 and 2012, respectively.
The Company’s matching contribution under the Employees’ Savings Plan as well as its contribution to the Defined Contribution Pension Plan is in the form of cash. Neither plan holds any shares of the Company’s stock.
Additional retirement benefits are provided to certain officers and directors of HVB pursuant to unfunded supplemental plans. Costs for the supplemental pension plans totaled $1,345, $1,944 and $1,586 in 2014, 2013 and 2012, respectively. The Company uses
96
a December 31 measurement date for the supplemental plans and makes contributions to the plans only as benefit payments become due.
The following tables set forth the status of the Company’s supplemental plans as of December 31:
|
|
| 2014 |
|
|
| 2013 |
|
|
| 2012 |
|
|
| (In thousands) |
| |||||||||
Change in benefit obligation: |
|
|
|
|
|
|
|
|
|
|
|
|
Benefit obligation at beginning of year |
| $ | 14,365 |
|
| $ | 14,038 |
|
| $ | 12,688 |
|
Service cost |
|
| 405 |
|
|
| 521 |
|
|
| 506 |
|
Interest cost |
|
| 612 |
|
|
| 673 |
|
|
| 642 |
|
Amendments |
|
| — |
|
|
| — |
|
|
| — |
|
Actuarial loss |
|
| 363 |
|
|
| 33 |
|
|
| 895 |
|
Benefits paid |
|
| (1,124 | ) |
|
| (900 | ) |
|
| (693 | ) |
Benefit obligation at end of year |
| $ | 14,621 |
|
| $ | 14,365 |
|
| $ | 14,038 |
|
|
|
|
|
|
|
|
|
|
|
|
|
|
Change in plan assets: |
|
|
|
|
|
|
|
|
|
|
|
|
Fair value of plan assets at beginning of year |
|
|
|
|
|
|
|
|
|
|
|
|
Actual return on assets |
|
| — |
|
|
| — |
|
|
| — |
|
Employer contribution |
| $ | 1,124 |
|
| $ | 900 |
|
| $ | 693 |
|
Benefits paid |
|
| (1,124 | ) |
|
| (900 | ) |
|
| (693 | ) |
Fair value of plan assets at end of year |
|
| — |
|
|
| — |
|
|
| — |
|
Funded status at year end |
| $ | (14,621 | ) |
| $ | (14,365 | ) |
| $ | (14,038 | ) |
|
|
|
|
|
|
|
|
|
|
|
|
|
Amounts recognized in accumulated other comprehensive income at December 31 consist of:
|
|
| 2014 |
|
|
| 2013 |
|
|
| 2012 |
|
|
| (In thousands) |
| |||||||||
Net actuarial loss |
| $ | 1,772 |
|
| $ | 1,738 |
|
| $ | 2,671 |
|
Prior service cost |
|
| — |
|
|
| — |
|
|
| (216 | ) |
|
| $ | 1,772 |
|
| $ | 1,738 |
|
| $ | 2,455 |
|
|
|
|
|
|
|
|
|
|
|
|
|
|
The accumulated benefit obligation was $14,260 and $13,704 at December 31, 2014 and 2013, respectively.
97
The following table consists of the weighted average assumptions and components of net periodic benefit cost and other amounts recognized in other comprehensive income for the years indicated:
|
|
| 2014 |
|
|
| 2013 |
|
|
| 2012 |
|
|
| (Dollars in thousands) |
| |||||||||
Weighted Average Assumptions: |
|
|
|
|
|
|
|
|
|
|
|
|
Discount rate |
|
| 3.25 | % |
|
| 3.95 | % |
|
| 3.50 | % |
Expected return on plan assets |
|
| — |
|
|
| — |
|
|
| — |
|
Rate of compensation increase |
|
| 3.00 | % |
|
| 3.00 | % |
|
| 3.00 | % |
|
|
|
|
|
|
|
|
|
|
|
|
|
Components of net periodic benefit cost and other amounts recognized in other comprehensive income: |
|
|
|
|
|
|
|
|
|
|
|
|
Service cost |
| $ | 405 |
|
| $ | 521 |
|
| $ | 506 |
|
Interest cost |
|
| 612 |
|
|
| 673 |
|
|
| 642 |
|
Expected return on plan assets |
|
| — |
|
|
| — |
|
|
| — |
|
Amortization of transition obligation |
|
| — |
|
|
| — |
|
|
| — |
|
Amortization of prior service cost |
|
| — |
|
|
| (216 | ) |
|
| (233 | ) |
Amortization of net loss |
|
| 328 |
|
|
| 966 |
|
|
| 671 |
|
Net periodic benefit cost |
|
| 1,345 |
|
|
| 1,944 |
|
|
| 1,586 |
|
Net (gain) loss |
|
| 35 |
|
|
| (933 | ) |
|
| 224 |
|
Amortization of prior service cost |
|
| — |
|
|
| 216 |
|
|
| 233 |
|
Total recognized in other comprehensive income |
|
| 35 |
|
|
| (717 | ) |
|
| 457 |
|
Total recognized in net periodic benefit cost and other comprehensive income |
| $ | 1,380 |
|
| $ | 1,227 |
|
| $ | 2,043 |
|
|
|
|
|
|
|
|
|
|
|
|
|
|
The estimated net loss and prior service costs that will be amortized from accumulated other comprehensive income into net periodic benefit cost in 2015 are $197 and $0, respectively.
The following benefit payments, which reflect expected future service, as appropriate, are expected to be paid in the years indicated:
Year |
| Pension Benefit |
| |
|
| (In thousands) |
| |
2015 |
| $ | 1,452 |
|
2016 |
|
| 1,310 |
|
2017 |
|
| 1,270 |
|
2018 |
|
| 1,165 |
|
2019 |
|
| 1,207 |
|
Years 2020-2024 |
|
| 5,460 |
|
14 Commitments, Contingent Liabilities and Other Disclosures
The Company is obligated under leases and other contracts for certain of its branches and equipment. Minimum rental commitments for bank premises and equipment under non-cancelable operating leases are as follows:
Year |
| Amount |
| |||
|
| (In thousands) |
| |||
2015 |
| $ | 3,933 |
| ||
2016 |
|
| 3,526 |
| ||
2017 |
|
| 3,537 |
| ||
2018 |
|
| 3,051 |
| ||
2019 |
|
| 2,058 |
| ||
Thereafter |
|
| 10,885 |
| ||
Total minimum future payments |
| $ | 26,990 |
| ||
|
|
|
|
|
|
|
Rent expense for premises and equipment was $4,558, $3,852 and $3,832 in 2014, 2013 and 2012, respectively.
98
Cash Reserve Requirements
HVB is required to maintain average reserve balances under the Federal Reserve Act and Regulation D issued thereunder. Such reserves totaled $20,717 at December 31, 2014.
Restrictions on Funds Transfers
There are various restrictions which limit the ability of a bank subsidiary to transfer funds in the form of cash dividends, loans or advances to the parent company. Under federal law, the approval of the primary regulator is required if dividends declared by a bank in any year exceed the net profits of that year, as defined, combined with the retained net profits for the two preceding years. Under applicable banking statutes, at December 31, 2014, the Bank could have declared additional dividends of approximately $22,027 to the Company.
15 Segment Information
The Company has one reportable segment, “Community Banking.” All of the Company’s activities are interrelated, and each activity is dependent and assessed based on how each of the activities of the Company supports the others. For example, commercial lending is dependent upon the ability of the Company to fund itself with retail deposits and other borrowings and to manage interest rate and credit risk. This situation is also similar for consumer and residential mortgage lending. Accordingly, all significant operating decisions are based upon analysis of the Company as one operating segment or unit.
The Company operates only in the U.S. domestic market, primarily in the New York metropolitan area. For the years ended December 31, 2014, 2013 and 2012, there is no customer that accounted for more than 10% of the Company’s revenue.
16 Fair Value of Financial Instruments
The “Financial Instruments” topic of the FASB Accounting Standards Codification requires the disclosure of the estimated fair value of certain financial instruments. These estimated fair values as of December 31, 2014 and 2013 have been determined using available market information and appropriate valuation methodologies. Considerable judgment is required to interpret market data to develop estimates of fair value. The estimates presented are not necessarily indicative of amounts the Company could realize in a current market exchange. The use of alternative market assumptions and estimation methodologies could have had a material effect on these estimates of fair value.
Carrying amount and estimated fair value of financial instruments, not previously presented were as follows:
|
|
|
|
|
|
|
|
|
| Fair Value Measurements |
| |||||||||
|
|
|
|
|
|
|
|
|
| Quoted Prices in |
|
| Significant |
|
| Significant |
| |||
|
|
|
|
|
| Total |
|
| Active Markets for |
|
| Other Observable |
|
| Unobservable |
| ||||
|
| Carrying |
|
| Fair |
|
| Identical Assets |
|
| Inputs |
|
| Inputs |
| |||||
December 31, 2014 |
| Amount |
|
| Value |
|
| (Level 1) |
|
| (Level 2) |
|
| (Level 3) |
| |||||
|
| (In millions) |
| |||||||||||||||||
Assets: |
|
|
|
|
|
|
|
|
|
|
|
|
|
|
|
|
|
|
|
|
Held to maturity securities and accrued interest |
| $ | 4.2 |
|
| $ | 4.4 |
|
|
| — |
|
| $ | 4.4 |
|
|
| — |
|
FHLB stock |
|
| 2.4 |
|
| N/A |
|
|
| — |
|
|
| — |
|
|
| — |
| |
Loans and accrued interest |
|
| 1,933.9 |
|
|
| 1,931.7 |
|
|
| — |
|
|
| — |
|
| $ | 1,931.7 |
|
|
|
|
|
|
|
|
|
|
|
|
|
|
|
|
|
|
|
|
|
|
Liabilities: |
|
|
|
|
|
|
|
|
|
|
|
|
|
|
|
|
|
|
|
|
Deposits with no stated maturity and accrued interest |
|
| 2,673.2 |
|
|
| 2,673.2 |
|
| $ | 2,673.2 |
|
|
| — |
|
|
| — |
|
Time deposits and accrued interest |
|
| 108.1 |
|
|
| 107.9 |
|
|
| — |
|
|
| 107.9 |
|
|
| — |
|
Securities sold under repurchase agreements and other short-term borrowing and accrued interest |
|
| 28.2 |
|
|
| 28.2 |
|
|
| 28.2 |
|
|
| — |
|
|
| — |
|
99
|
|
|
|
|
|
|
|
|
| Fair Value Measurements |
| |||||||||
|
|
|
|
|
|
|
|
|
| Quoted Prices in |
|
| Significant |
|
| Significant |
| |||
|
|
|
|
|
| Total |
|
| Active Markets for |
|
| Other Observable |
|
| Unobservable |
| ||||
|
| Carrying |
|
| Fair |
|
| Identical Assets |
|
| Inputs |
|
| Inputs |
| |||||
December 31, 2013 |
| Amount |
|
| Value |
|
| (Level 1) |
|
| (Level 2) |
|
| (Level 3) |
| |||||
|
| (In millions) |
| |||||||||||||||||
Assets: |
|
|
|
|
|
|
|
|
|
|
|
|
|
|
|
|
|
|
|
|
Held to maturity securities and accrued interest |
| $ | 6.2 |
|
| $ | 6.6 |
|
|
| — |
|
| $ | 6.6 |
|
|
| — |
|
FHLB stock |
|
| 3.5 |
|
| N/A |
|
|
| — |
|
|
| — |
|
|
| — |
| |
Loans and accrued interest |
|
| 1,637.3 |
|
|
| 1,655.6 |
|
|
| — |
|
|
| — |
|
| $ | 1,655.6 |
|
|
|
|
|
|
|
|
|
|
|
|
|
|
|
|
|
|
|
|
|
|
Liabilities: |
|
|
|
|
|
|
|
|
|
|
|
|
|
|
|
|
|
|
|
|
Deposits with no stated maturity and accrued interest |
|
| 2,517.8 |
|
|
| 2,517.8 |
|
| $ | 2,517.8 |
|
|
| — |
|
|
| — |
|
Time deposits and accrued interest |
|
| 116.1 |
|
|
| 116.1 |
|
|
| — |
|
|
| 116.1 |
|
|
| — |
|
Securities sold under repurchase agreements and other short-term borrowing and accrued interest |
|
| 34.4 |
|
|
| 34.4 |
|
|
| 34.4 |
|
|
| — |
|
|
| — |
|
Other borrowings and accrued interest |
|
| 16.5 |
|
|
| 14.6 |
|
|
| — |
|
|
| 14.6 |
|
|
| — |
|
The estimated fair value of the indicated items was determined as follows:
Financial assets for which carrying value approximates fair value are excluded from the table — The estimated fair value approximates carrying amount because of the immediate availability of these funds or based on the short maturities and current rates for similar deposits.
Held to maturity securities and accrued interest — The fair value of securities held to maturity was estimated based on quoted market prices or dealer quotations. Accrued interest is stated at its carrying amount which approximates fair value.
FHLB Stock — It is not practicable to determine its fair value due to restrictions placed on its transferability.
Loans and accrued interest — The fair value of loans was estimated by discounting projected cash flows at the reporting date using current rates for similar loans. Accrued interest is stated at its carrying amount which approximates fair value. The methods used to estimate the fair value of loans do not necessarily represent an exit price.
Deposits with no stated maturity and accrued interest — The estimated fair value of deposits with no stated maturity and accrued interest, as applicable, are considered to be equal to their carrying amounts.
Time deposits and accrued interest — The fair value of time deposits has been estimated by discounting projected cash flows at the reporting date using current rates for similar deposits. Accrued interest is stated at its carrying amount which approximates fair value.
Securities sold under repurchase agreements and other short-term borrowings and accrued interest —The estimated fair value of these instruments approximate carrying amount because of their short maturities and variable rates. Accrued interest is stated at its carrying amount which approximates fair value.
Other borrowings and accrued interest — The fair value of callable FHLB advances was estimated by discounting projected cash flows at the reporting date using the rate applicable to the projected call date option. Accrued interest is stated at its carrying amount which approximates fair value.
100
17 Condensed Financial Information of Hudson Valley Holding Corp.
(Parent Company Only)
Condensed Balance Sheets |
|
|
|
|
|
|
|
|
(In thousands) |
|
|
|
|
|
|
|
|
|
| December 31, |
| |||||
|
| 2014 |
|
| 2013 |
| ||
Assets |
|
|
|
|
|
|
|
|
Due from banks |
| $ | 968 |
|
| $ | 1,381 |
|
Investment in subsidiaries |
|
| 295,641 |
|
|
| 282,072 |
|
Equity securities |
|
| 1,496 |
|
|
| 1,223 |
|
Other assets |
|
| 28 |
|
|
| 71 |
|
Total Assets |
| $ | 298,133 |
|
| $ | 284,747 |
|
|
|
|
|
|
|
|
|
|
Liabilities and Stockholders' Equity |
|
|
|
|
|
|
|
|
Other liabilities |
| $ | 567 |
|
| $ | 438 |
|
Stockholders' equity |
|
| 297,566 |
|
|
| 284,309 |
|
Total Liabilities and Stockholders' Equity |
| $ | 298,133 |
|
| $ | 284,747 |
|
|
|
|
|
|
|
|
|
|
Condensed Statements of Income |
|
|
|
|
|
|
|
|
|
|
|
|
(In thousands) |
|
|
|
|
|
|
|
|
|
|
|
|
|
| Year Ended December 31, |
| |||||||||
|
| 2014 |
|
| 2013 |
|
| 2012 |
| |||
Dividends from subsidiaries |
| $ | 3,850 |
|
| $ | 4,685 |
|
| $ | 7,040 |
|
Dividends from equity securities |
|
| 60 |
|
|
| 50 |
|
|
| 105 |
|
Other income |
|
| (8 | ) |
|
| — |
|
|
| — |
|
Operating expenses |
|
| 1,287 |
|
|
| 553 |
|
|
| 619 |
|
Income before equity in undistributed earnings of subsidiaries |
|
| 2,615 |
|
|
| 4,182 |
|
|
| 6,526 |
|
Equity in undistributed earnings of subsidiaries |
|
| 5,327 |
|
|
| (3,052 | ) |
|
| 22,655 |
|
Net Income |
| $ | 7,942 |
|
| $ | 1,130 |
|
| $ | 29,181 |
|
|
|
|
|
|
|
|
|
|
|
|
|
|
Condensed Statements of Cash Flows |
|
|
|
|
|
|
|
|
|
|
|
|
(In thousands) |
|
|
|
|
|
|
|
|
|
|
|
|
|
| Year Ended December 31, |
| |||||||||
|
| 2014 |
|
| 2013 |
|
| 2012 |
| |||
Operating Activities: |
|
|
|
|
|
|
|
|
|
|
|
|
Net Income |
| $ | 7,942 |
|
| $ | 1,130 |
|
| $ | 29,181 |
|
Adjustments to reconcile net income to net cash provided by operating activities: |
|
|
|
|
|
|
|
|
|
|
|
|
Equity in undistributed earnings of subsidiaries |
|
| (5,327 | ) |
|
| 3,052 |
|
|
| (22,655 | ) |
Decrease in other liabilities |
|
| 7 |
|
|
| (108 | ) |
|
| (113 | ) |
Increase in other assets |
|
| 43 |
|
|
| (44 | ) |
|
| (1 | ) |
Other changes, net |
|
| (185 | ) |
|
| (49 | ) |
|
| — |
|
Net Cash Provided by Operating Activities |
|
| 2,480 |
|
|
| 3,981 |
|
|
| 6,412 |
|
|
|
|
|
|
|
|
|
|
|
|
|
|
Investing Activities: |
|
|
|
|
|
|
|
|
|
|
|
|
Proceeds from sales of equity securities |
|
| 79 |
|
|
| 60 |
|
|
| 8 |
|
Net Cash Provided by Investing Activities |
|
| 79 |
|
|
| 60 |
|
|
| 8 |
|
|
|
|
|
|
|
|
|
|
|
|
|
|
Financing Activities: |
|
|
|
|
|
|
|
|
|
|
|
|
Proceeds from issuance of common stock |
|
| 2,623 |
|
|
| 1,094 |
|
|
| 547 |
|
Cash dividends paid |
|
| (5,595 | ) |
|
| (4,729 | ) |
|
| (14,125 | ) |
Net Cash Used in Financing Activities |
|
| (2,972 | ) |
|
| (3,635 | ) |
|
| (13,578 | ) |
|
|
|
|
|
|
|
|
|
|
|
|
|
(Decrease) Increase in Cash and Cash Equivalents |
|
| (413 | ) |
|
| 406 |
|
|
| (7,158 | ) |
Cash and Cash Equivalents, Beginning of Period |
|
| 1,381 |
|
|
| 975 |
|
|
| 8,133 |
|
Cash and Cash Equivalents, End of Period |
| $ | 968 |
|
| $ | 1,381 |
|
| $ | 975 |
|
|
|
|
|
|
|
|
|
|
|
|
|
|
101
18 Earnings Per Share
FASB ASC 260-10-45 addresses whether instruments granted in share-based payment transactions are participating securities prior to vesting and, therefore, need to be included in the earnings allocation in computing earnings per share (“EPS”). The restricted stock awards and restricted stock units granted by the Company contain non-forfeitable rights to dividends and therefore are considered participating securities. The two-class method for calculating basic EPS excludes dividends paid to participating securities and any undistributed earnings attributable to participating securities.
The following is a reconciliation of earnings per share for the years indicated:
|
| Year Ended December 31, |
| |||||||||
|
| 2014 |
|
| 2013 |
|
| 2012 |
| |||
|
| (In thousands, except share and per share data) |
| |||||||||
Net Income |
| $ | 7,942 |
|
| $ | 1,130 |
|
| $ | 29,181 |
|
Less: Dividends paid on and earnings allocated to participating securities |
|
| 108 |
|
|
| 13 |
|
|
| 115 |
|
Income attributable to common stock |
| $ | 7,834 |
|
| $ | 1,117 |
|
| $ | 29,066 |
|
Weighted average common shares outstanding, including participating securities |
|
| 19,996,079 |
|
|
| 19,876,377 |
|
|
| 19,620,251 |
|
Less: Weighted average participating securities |
|
| 274,504 |
|
|
| 278,946 |
|
|
| 81,957 |
|
Weighted average common shares outstanding |
|
| 19,721,575 |
|
|
| 19,597,431 |
|
|
| 19,538,294 |
|
Basic earnings per common share |
| $ | 0.40 |
|
| $ | 0.06 |
|
| $ | 1.49 |
|
|
|
|
|
|
|
|
|
|
|
|
|
|
Weighted average common shares outstanding |
|
| 19,721,575 |
|
|
| 19,597,431 |
|
|
| 19,538,294 |
|
Weighted average common equivalent shares outstanding |
|
| 48,476 |
|
|
| 282 |
|
|
| 6,743 |
|
Weighted average common and equivalent shares outstanding |
|
| 19,770,051 |
|
|
| 19,597,713 |
|
|
| 19,545,037 |
|
Diluted earnings per common share |
| $ | 0.40 |
|
| $ | 0.06 |
|
| $ | 1.49 |
|
|
|
|
|
|
|
|
|
|
|
|
|
|
Dividends per common share |
| $ | 0.28 |
|
| $ | 0.24 |
|
| $ | 0.72 |
|
|
|
|
|
|
|
|
|
|
|
|
|
|
There were 85,033, 295,627 and 330,568 options outstanding at December 31, 2014, 2013 and 2012, respectively, which were not included in the computation of diluted earnings per share because the options’ exercise prices were greater than the average market price of common stock and were, therefore, antidilutive.
19 Accumulated Other Comprehensive Income
Comprehensive income consists of net income and other comprehensive income. Other comprehensive income includes unrealized gains and losses on securities available for sale and accrued benefit liability adjustments which are also recognized as separate components of equity. Activity in accumulated other comprehensive income (loss), net of tax, was as follows:
102
|
|
|
|
|
|
|
|
|
| Accumulated |
| |
|
| Securities |
|
| Defined |
|
| Other |
| |||
|
| Available |
|
| Benefit |
|
| Comprehensive |
| |||
|
| For Sale |
|
| Plans |
|
| Income (Loss) |
| |||
|
| (In thousands) |
| |||||||||
Balance at January 1, 2014 |
| $ | (5,328 | ) |
| $ | (1,043 | ) |
| $ | (6,371 | ) |
Other comprehensive income (loss) before reclassification |
|
| 5,700 |
|
|
| (214 | ) |
|
| 5,486 |
|
Amounts reclassified from accumulated other comprehensive income |
|
| (30 | ) |
|
| 194 |
|
|
| 164 |
|
Net other comprehensive income during period |
|
| 5,670 |
|
|
| (20 | ) |
|
| 5,650 |
|
Balance at December 31, 2014 |
| $ | 342 |
|
| $ | (1,063 | ) |
| $ | (721 | ) |
|
|
|
|
|
|
|
|
|
|
|
|
|
Balance at January 1, 2013 |
| $ | 624 |
|
| $ | (1,473 | ) |
| $ | (849 | ) |
Other comprehensive loss before reclassification |
|
| (6,684 | ) |
|
| (20 | ) |
|
| (6,704 | ) |
Amounts reclassified from accumulated other comprehensive income |
|
| 732 |
|
|
| 450 |
|
|
| 1,182 |
|
Net other comprehensive (loss) income during period |
|
| (5,952 | ) |
|
| 430 |
|
|
| (5,522 | ) |
Balance at December 31, 2013 |
| $ | (5,328 | ) |
| $ | (1,043 | ) |
| $ | (6,371 | ) |
|
|
|
|
|
|
|
|
|
|
|
|
|
Balance at January 1, 2012 |
| $ | 2,924 |
|
| $ | (1,198 | ) |
| $ | 1,726 |
|
Other comprehensive loss before reclassification |
|
| (2,612 | ) |
|
| (539 | ) |
|
| (3,151 | ) |
Amounts reclassified from accumulated other comprehensive income |
|
| 312 |
|
|
| 264 |
|
|
| 576 |
|
Net other comprehensive loss during period |
|
| (2,300 | ) |
|
| (275 | ) |
|
| (2,575 | ) |
Balance at December 31, 2012 |
| $ | 624 |
|
| $ | (1,473 | ) |
| $ | (849 | ) |
|
|
|
|
|
|
|
|
|
|
|
|
|
The following table represents the reclassification out of accumulated other comprehensive income for the years indicated:
|
| Year Ended December 31, |
| |||||||||
|
| 2014 |
|
| 2013 |
|
| 2012 |
| |||
|
| (In thousands) |
|
|
|
|
| |||||
Unrealized gains (losses) on securities available for sale: |
|
|
|
|
|
|
|
|
|
|
|
|
Realized gains on securities transactions |
| $ | 50 |
|
|
| — |
|
|
| — |
|
Other-than-temporary impairment charges |
|
| — |
|
| $ | (1,240 | ) |
| $ | (528 | ) |
Income tax (benefit) expense |
|
| (20 | ) |
|
| 508 |
|
|
| 216 |
|
Net of tax |
|
| 30 |
|
|
| (732 | ) |
|
| (312 | ) |
Amortization of pension and post-retirement benefit items: |
|
|
|
|
|
|
|
|
|
|
|
|
Amortization of net actuarial loss |
|
| (328 | ) |
|
| (966 | ) |
|
| (671 | ) |
Amortization of prior service cost |
|
| — |
|
|
| 216 |
|
|
| 233 |
|
Income tax (benefit) expense |
|
| 134 |
|
|
| 300 |
|
|
| 174 |
|
Net of tax |
|
| (194 | ) |
|
| (450 | ) |
|
| (264 | ) |
Total reclassifications, net of tax |
| $ | (164 | ) |
| $ | (1,182 | ) |
| $ | (576 | ) |
|
|
|
|
|
|
|
|
|
|
|
|
|
The income statement line items impacted by the reclassification of unrealized gains (losses) on securities available for sale are realized gain on securities available for sale, net, net impairment loss recognized in earnings and income tax expense. The income statement line items impacted by the reclassification of amortization of pension and post-retirement benefit items are salaries and employee benefits and income tax expense.
20 Pending Business Combination
On November 4, 2014, the Company entered into an Agreement and Plan of Merger (the “Merger Agreement”) with Sterling Bancorp, a Delaware corporation (“Sterling”). The Merger Agreement provides that, upon the terms and subject to the conditions set forth therein, Hudson Valley will merge with and into Sterling (the “Merger”), with Sterling as the surviving corporation in the Merger. Immediately following the Merger, Hudson Valley’s wholly owned subsidiary, Hudson Valley Bank, N.A., will merge with and into Sterling’s wholly owned subsidiary, Sterling National Bank (the “Bank Merger”), with Sterling National Bank as the surviving entity in the Bank Merger. The Merger Agreement was unanimously approved and adopted by the Board of Directors of each of Hudson Valley and Sterling.
Subject to the terms and conditions of the Merger Agreement, at the effective time of the Merger (the “Effective Time”), Hudson Valley stockholders will have the right to receive 1.92 shares (the “Exchange Ratio”) of common stock, par value $0.01 per share, of Sterling (“Sterling Common Stock”) for each share of common stock, par value $0.20 per share, of Hudson Valley (“Hudson
103
Valley Common Stock”). At the Effective Time, each restricted stock unit award granted by Hudson Valley will vest, with any performance-based vesting condition deemed satisfied to the extent provided in the applicable award agreement (or, if not provided in the applicable award agreement, then deemed satisfied at target), and be converted into the right to receive a cash amount equal to (i) the number of shares subject to such restricted stock unit award multiplied by (ii) the product of the average closing price for Sterling Common Stock for the five trading days ending on the day immediately preceding the closing date and the Exchange Ratio (the “Per Share Cash Consideration Value”), less applicable tax withholdings. Each in-the-money stock option granted by Hudson Valley will vest in full and be converted into the right to receive a cash amount equal to the product of (i) the number of shares subject to such stock option multiplied by (ii) the Per Share Cash Consideration, minus the exercise price of such option, and any out-of-the-money stock options granted by Hudson Valley will be cancelled for no consideration. Each restricted share of Hudson Valley Common Stock will vest, with any performance-based vesting condition deemed satisfied to the extent provided in the applicable award agreement, and be converted into the right to receive 1.92 shares of Sterling Common Stock.
The Merger Agreement also provides, among other things, that, effective as of the Effective Time, Sterling will appoint four current members of the board of directors of Hudson Valley, as designated by Sterling, to the boards of directors of Sterling and Sterling National Bank.
The Merger Agreement contains customary representations and warranties from both Sterling and Hudson Valley, each with respect to its and its subsidiaries’ businesses, and each party has agreed to customary covenants, including, among others, covenants relating to the conduct of its business during the interim period between the execution of the Merger Agreement and the Effective Time and each parties’ obligation to call a meeting of its stockholders to adopt the Merger Agreement, and, subject to certain exceptions, to recommend that its stockholders adopt the Merger Agreement. Hudson Valley has also agreed to customary non-solicitation covenants relating to alternative acquisition proposals, subject to certain exceptions.
The completion of the Merger is subject to customary conditions, including (1) adoption of the Merger Agreement by Hudson Valley’s stockholders and by Sterling’s stockholders, (2) authorization for listing on the New York Stock Exchange of the shares of Sterling Common Stock to be issued in the Merger, (3) the receipt of required regulatory approvals, including the approval of the Federal Reserve Board and the Office of the Comptroller of the Currency, (4) effectiveness of the registration statement on Form S-4 for the Sterling Common Stock to be issued in the Merger, and (5) the absence of any order, injunction or other legal restraint preventing the completion of the Merger or making the completion of the Merger illegal. Each party’s obligation to complete the Merger is also subject to certain additional customary conditions, including (1) subject to certain exceptions, the accuracy of the representations and warranties of the other party, (2) performance in all material respects by the other party of its obligations under the Merger Agreement and (3) receipt by such party of an opinion from its counsel to the effect that the Merger will qualify as a reorganization within the meaning of Section 368(a) of the Internal Revenue Code of 1986, as amended.
The Merger Agreement provides certain termination rights for both Sterling and Hudson Valley and further provides that a termination fee of $20.0 million will be payable by either Sterling or Hudson Valley, as applicable, upon termination of the Merger Agreement under certain circumstances.
21 Subsequent Events
On January 22, 2015, the Company consummated the sale of A.R. Schmeidler recognizing a pretax impairment charge of $1.2 million on the goodwill and pretax $0.9 million loss on sale. The loss is included in the 2014 consolidated results of operations.
104
ITEM 9 — CHANGES IN AND DISAGREEMENTS WITH ACCOUNTANTS ON ACCOUNTING AND FINANCIAL DISCLOSURE
None.
ITEM 9A. CONTROLS AND PROCEDURES
Our disclosure controls and procedures are designed to ensure that information the Company must disclose in its reports filed or submitted under the Securities Exchange Act of 1934, as amended (the “Exchange Act”), is recorded, processed, summarized, and reported on a timely basis. Any controls and procedures, no matter how well designed and operated, can only provide reasonable assurance of achieving the desired control objectives. We carried out an evaluation, under the supervision and with the participation of our Chief Executive Officer and Chief Financial Officer, of the effectiveness of our disclosure controls and procedures as of December 31, 2014. Based on this evaluation, the Chief Executive Officer and Chief Financial Officer have concluded that, as of December 31, 2014, the Company’s disclosure controls and procedures were effective in bringing to their attention on a timely basis information required to be disclosed by the Company in reports that the Company files or submits under the Exchange Act. Also, during the year ended December 31, 2014, there has not been any change that has materially affected, or is reasonably likely to materially affect, the Company’s internal control over financial reporting.
Management’s Report on Internal Control Over Financial Reporting
The management of the Company is responsible for establishing and maintaining adequate internal control over financial reporting as defined in Rules 13a-15(f) and 15d-15(f) under the Securities and Exchange Act of 1934. The Company’s internal control over financial reporting is designed to provide reasonable assurance regarding the reliability of financial reporting and the preparation of financial statements for external purposes in accordance with generally accepted accounting principles.
The Company’s internal control over financial reporting includes those policies and procedures that: (i) pertain to the maintenance of records that, in reasonable detail, accurately and fairly reflect the transactions and dispositions of the assets of the Company; (ii) provide reasonable assurance that transactions are recorded as necessary to permit preparation of financial statements in accordance with generally accepted accounting principles, and that receipts and expenditures of the Company are being made only in accordance with authorizations of management and directors of the Company; and (iii) provide reasonable assurance regarding prevention or timely detection of unauthorized acquisition, use or disposition of the Company’s assets that could have a material effect on the financial statements.
Because of its inherent limitations, internal control over financial reporting may not prevent or detect misstatements. Also, projections of any evaluation of effectiveness to future periods are subject to the risk that controls may become inadequate because of changes in conditions, or that the degree of compliance with the policies or procedures may deteriorate.
Management assessed the effectiveness of the Company’s internal control over financial reporting as of December 31, 2014. In making this assessment, management used the criteria set forth by the Committee of Sponsoring Organizations of the Treadway Commission (“COSO”) in Internal Control-Integrated Framework (1992). Based on our assessment and those criteria, management concluded that the Company maintained effective internal control over financial reporting as of December 31, 2014.
The Company’s independent registered public accounting firm has issued their report on the effectiveness of the Company’s internal control over financial reporting. That report is included under the heading, Report of Independent Registered Public Accounting Firm.
Not applicable.
105
PART III
ITEM 10. DIRECTORS, EXECUTIVE OFFICERS AND CORPORATE GOVERNANCE
Board of Directors
All directors of the Company serve for a term of one year, until the next annual meeting of shareholders or until their respective successors have been duly elected and qualified.
Presently, the Board of Directors consists of ten members. The following table sets forth the names and ages of the directors of the Company, each director’s position with the Company, if any, the principal occupation of each director, the period during which each director has served as a director of the Company and certain other background information about the directors of the Company based on information obtained from each director. In addition, described below is each director’s particular experience, qualifications, attributes or skills that have led the Board of Directors to conclude that the person should serve as a director of the Company.
Name | Age |
| Position with the Company and Principal Occupation; Other Directorships |
Director of the Company Since | Independent |
| 60 |
| Chairman of the Board of the Company since January 1, 2015, Previously Mr. Landy served as Executive Chairman of the Board of the Company from May 10, 2012 to December 31, 2014. Prior to May 2012, Mr. Landy served as President and Chief Executive Officer of the Company from January 2001. Prior to January 2001, Mr. Landy served as Executive Vice President of the Bank and in various other executive capacities with the Bank. He has been employed by the Bank since 1977. Mr. Landy is a director of Sacred Heart Housing Corp., a senior citizen housing company in Yonkers, New York, the Chairman of St. Joseph’s Medical Center, a health care facility in Westchester County, New York and a director and Chairman of the New York Bankers Association, as well as Chairman of the Board of the Friendly Sons of St. Patrick in Westchester County, a fraternal and charitable organization. His commercial banking background for over thirty-five years in conjunction with his leadership ability makes him a valuable member of the Board of Directors. As the Chairman of the Company, he brings to the Board an intimate understanding of the Company’s business and organization and the community we serve. Mr. Landy’s extensive executive management experience within the Company provides the Board with a unique perspective and understanding of the Company’s customers, products and operations of the Company.��
| 2000 | No |
106
Stephen R. Brown | 59 |
| President and Chief Executive Officer of the Company since May 10, 2012. Previously, Mr. Brown was Senior Executive Vice President, Chief Financial Officer of the Company from January 2001 to May 2012, Treasurer of the Company from July 2004 to May 2012 and Secretary from May 2010 to May 2012. Prior to 2001, Mr. Brown served in various other executive capacities with the Company and the Bank. He has been employed by the Bank since 1993. He is a Certified Public Accountant. Mr. Brown brings over thirty-five years of general business, managerial and commercial banking experience as well as financial expertise to the Board of Directors. His current position with the Company, along with his prior professional experience outside of the Company, provides the Board of Directors with unique insights as to the Company’s operations, policies, development of strategic plans and SEC and public company issues. In addition, he provides the Board with insights and information regarding the operations of the Company, which assists the Board of Directors in providing adequate levels of management oversight.
| 2000 | No |
56 |
| Counsel at Chadbourne & Parke LLP, a law firm based in New York, New York, since March 2007. Mr. Cahill is also Co-Founder and Principal of the Pataki-Cahill Group LLC, based in New York, New York, a strategic consulting firm established in 2007 focusing on the economic and policy implication of domestic energy needs. From 1995 to 2006, Mr. Cahill served in various capacities in the administration of the Governor of New York George E. Pataki, including Chief of Staff to the Governor, Commissioner of the New York Department of Environmental Conservation and as Chairman of the Environmental Facilities Corporation. He is a trustee for the National September 11 Memorial Museum and serves on the board of various civic and non-profit organizations. Mr. Cahill serves as Lead Independent Director for the Board of the Company. Mr. Cahill’s extensive experience as an attorney in government and in business together with his affiliations and active involvement in various organizations within the Company’s marketplace make him a valuable member of the Board of Directors.
| 2011 | Yes |
Mary-Jane Foster | 64 |
| Vice President, University Relations, of University of Bridgeport, located in Bridgeport, Connecticut, since May 2009. Ms. Foster was a co-owner and Chief Executive Officer of Westchester Baseball, LLC, an investor group located in Yonkers, New York from 1999 to 2011. She was a principal of Black Rock Investors, LLC, a development and investment firm, located in Bridgeport, Connecticut, from 1995 to 2009. Ms. Foster was also the Co-founder, Owner and Chief Executive Officer of Bridgeport Bluefish Professional Baseball Club based in Bridgeport, Connecticut from December 2005 to October 2008. Ms. Foster’s varied experience including forty years of marketing experience across diverse business sectors (entertainment, law, development and baseball) make her a valuable member of the Board of Directors.
| 2008 | Yes |
107
| 53 |
| Vice President, BMW Machinery Co., Inc., an investment holding company, since 1994. Mr. Holcombe also serves as a Director of Osage Exploration & Development Inc., an OTCQB listed company, and independent exploration company with oil and gas operations in the mid-continent region of the United States, with executive offices in San Diego, CA. Mr. Holcombe has developed a deep understanding of the key markets we serve which, together with his extensive business experience and management expertise, make him a valuable member of the Board of Directors.
| 1999 | Yes |
Adam W. Ifshin | 49 |
| President and Chief Executive Officer of DLC Management Corp., a company property management firm specializing in owning, operating and redeveloping retail shopping centers, located in Tarrytown, New York, since 1991. In addition, Mr. Ifshin is President of Delphi Commercial Properties, Inc., a specialty real estate brokerage firm, President of First Man Investment Securities Corp., a placement agent for real estate investments and a co-founder of DLC UrbanCore, a joint venture created to promote development of retail real estate in under-served, infill and multi-ethnic markets nationwide. Mr. Ifshin serves as a Trustee and Divisional Vice President of the International Council of Shopping Centers, the industry trade association. Mr. Ifshin’s extensive real estate and financial markets experience, together with his vast knowledge of the New York metropolitan marketplace, make him a valuable member of the Board of Directors.
| 2008 | Yes |
Matthew A. Lindenbaum | 52 |
| Founder and Principal of Basswood Capital Management, LLC, an alternative asset management firm with over $1.3 billion assets under management located in New York City since 1998. In addition, Mr. Lindenbaum is Founder, Vice Chairman and director of Community National Bank, an OTCQB listed independent commercial bank based in Long Island, New York. Mr. Lindenbaum’s extensive banking experience in the New York metropolitan area and his knowledge and experience in the financial markets and financial services industry provide the Board of Directors with financial expertise and make him a valuable member of the Board of Directors. | 2014 | Yes |
108
Joseph A. Schenk | 56 |
| Senior Advisor at The Carlyle Group, an alternative asset manager with over $160 billion of assets under management located in New York City since October 2012. Mr. Schenk was Chief Executive Officer of First New York Securities LLC, a diversified trading firm located in New York City, from March 2009 to June 2012. From March 2008 to March 2009, Mr. Schenk was Chief Executive Officer at Pali Capital, Inc., a boutique investment banking firm located in New York City. From January 2000 to January 2008, Mr. Schenk served as Executive Vice President and Chief Financial Officer of Jefferies Group, Inc., a full service investment bank and institutional securities firm, located in New York City. Mr. Schenk serves as a Director of Gain Capital Holdings, Inc. a NYSE listed company and a global provider of online trading services, and is Chairman of the Audit Committee. He also serves as a director of Duff & Phelps., a private company which provides valuation services and merger advisory services. He is a Certified Public Accountant (inactive). Mr. Schenk also sits on the Board of Trustees for a number of organizations including the New York Catholic Foundation and St. Joseph’s Seminary. Mr. Schenk serves as the Audit Committee Chairman for the Company. Mr. Schenk’s extensive experience in the financial markets and financial services industry provide the Board of Directors with financial expertise and make him a valuable member of the Board of Directors.
| 2013 | Yes |
Craig S. Thompson | 61 |
| President and principal shareholder of Thompson Pension Employee Plans, Inc., a company located in New York City and specializing in pension administration and investment and insurance sales for over twenty years. Through his business, Mr. Thompson has developed extensive knowledge of pension plans and related businesses, which provides the Board of Directors with unique insights regarding the development of potential customer relationships and opportunities for the Company. In addition to Mr. Thompson’s business experience, he has a law degree. Mr. Thompson serves as the Compensation and Organization Committee Chairman for the Company. This unique combination of experience provides the Board of Directors with a valuable perspective on legal and business management matters.
| 1988 | Yes |
William E. Whiston | 61 |
| Chief Financial Officer of the Archdiocese of New York, a religious not-for-profit organ-ization, based in New York City, since January 2002. Prior to joining the Archdiocese of New York, Mr. Whiston spent twenty-nine years at Allied Irish Bank, where he served in a number of executive positions, including lending, product development and operations/compliance. Mr. Whiston is also a director of Mutual of America Investment Corporation and Mutual of America Institutional Funds, Inc., private money market funds companies, both based in New York. He is also a Trustee of St. Joseph’s Seminary and a Trustee and Treasurer of the Trustees of St. Patrick’s Cathedral in New York City. Mr. Whiston’s varied business experience in the areas of finance, financial services and e-commerce make him a valuable member of the Board of Directors. | 2013 | Yes |
109
Executive Officers
Certain information with respect to executive officers of the Company and of the Bank is set forth below. All executive officers are elected by the Board of Directors and serve at the pleasure of the Board of Directors. Messrs. Brown, Blose and Indiveri serve as executive officers of both the Company and the Bank, while the other individuals named below are executive officers of the Bank only. Biographical information concerning executive officers who are also members of the Board of Directors is given under the caption “Board of Directors” beginning on page 106.
Name | Age |
| Position |
Stephen R. Brown | 59 |
| President, Chief Executive Officer and Director
|
James P. Blose | 46 |
| Executive Vice President, General Counsel & Secretary since October 2013. Prior to joining the Company, Mr. Blose served as a partner with the law firm of Griffin, Coogan, Blose, Sulzer & Horgan, P.C., located in Bronxville, New York, since December 2003.
|
Michael E. Finn | 50 |
| Executive Vice President, Chief Risk Officer of the Bank since January 2014. From August 2011 to December 2013, Mr. Finn served as Senior Thrift Advisor for the Office of the Comptroller of the Currency, the national banking regulator. From September 2004 to August 2011, Mr. Finn served as a Regional Director for the Office of the Thrift Supervision, a banking regulator.
|
Michael J. Indiveri | 62 |
| Executive Vice President, Chief Financial Officer since May 2013. Mr. Indiveri serves on the board of directors and is Chairman of the audit committee of Retail Opportunity Investments Corporation, a NASDAQ listed, real estate investment trust, since 2007. From June 2011 to May 2013, Mr. Indiveri was a self-employed consultant providing financial and accounting services to financial companies. From July 2007 to April 2011 Mr. Indiveri was Chief Financial Officer at Amalgamated Bank. Mr. Indiveri is a Certified Public Accountant.
|
Scott J. Skorobohaty | 46 |
| Executive Vice President, Chief Banking Officer of the Bank since July 2014. From November 2012 to July 2014, Mr. Skorobohaty served as a Principal of The Vortex Group LLC, a commercial real estate company specializing in tenant representation in Metro New York. From September 2009 to November 2012, Mr. Skorobohaty was an initial investor and Executive Vice President, Head of Private Banking with BankUnited, N.A.
|
John M. Swadba | 53 |
| Executive Vice President, Chief Credit Officer of the Bank since July 2013. From June 2011 to June 2012, Mr. Swadba served as a market analyst and strategy consultant with Inveraray Capital Management, a privately owned hedge fund sponsor, based out of Ridgefield, Connecticut. From July 2006 to October 2009, Mr. Swadba was Managing Director, Loan Portfolio Management at Merrill Lynch and Company. |
Section 16(a) Beneficial Ownership Reporting Compliance
Section 16(a) of the Securities Exchange Act of 1934 requires the Company’s officers, directors and persons beneficially owning more than 10% of a registered class of the Company’s equity securities to file reports of ownership and changes in ownership with the SEC, and to furnish to the Company copies of such reports. Based solely on the review of copies of the forms received, the Company believes that, during the last fiscal year, all filing requirements under Section 16(a) applicable to its officers, directors and 10% shareholders were timely, with the exception of one late Form 4 filed on behalf of Stephen R. Brown with regard to the grant of a Restricted Stock Awards, filed on March 20, 2014.
The Board of Directors and Committees of the Board
Under the New York Stock Exchange (“NYSE”) independence standards, the Board of Directors has affirmatively determined that Ms. Foster and Messrs. Cahill, Holcombe, Ifshin, Lindenbaum, Schenk, Thompson and Whiston meet the standards of independence for board members. In addition to the transactions disclosed under “Certain Relationships and Related Transactions, and Director Independence,” the Board of Directors considered the banking relationships that exist between the Bank and Ms. Foster and Messrs. Cahill, Ifshin, Holcombe, Schenk, Thompson and Whiston in determining each director’s independence. Since these banking products and services are provided in the normal course of business and are available on the same basis as to customers in general, the Board of Directors concluded that these relationships do not affect the directors’ independence. The Board of Directors also concluded
110
that those transactions disclosed under “Certain Relationships and Related Transactions, and Director Independence,” do not affect the directors’ independence.
The Company’s Board of Directors convened 12 times in 2014. The Company’s Committees of the Board of Directors include the Audit Committee, the Compensation and Organization Committee, and the Nominating Committee. Other policy decisions for the Company and its subsidiaries continue to often be made by the full Board of Directors of the Company or the Bank, or by a standing committee of the Board of Directors of the Bank. All directors, with the exception of M. Lindenbaum, attended more than 75 percent of the meetings of the Board and the Committees of the Board on which he or she has served.
Under the requirements of the NYSE rules, which the Audit Committee meets, all Audit Committee members must be financially literate and one member must have accounting or related financial management expertise. The Board has determined that Mr. Schenk meets the SEC standards as “financial expert”.
The Company’s Board of Directors has adopted a code of ethics for all directors, officers and employees in accordance with SEC and NYSE listing rules. This code of ethics can be found on the Company’s website at www.hudsonvalleybank.com. The Company intends to disclose amendments to, and waivers from, its code of ethics, if any, on the Company’s website at www.hudsonvalleybank.com.
ITEM 11. EXECUTIVE COMPENSATION
This section explains how we compensate the executive officers (the “Named Executive Officers”) listed in the Summary Compensation Table that follows. Compensation for our Named Executive Officers is determined by the Compensation and Organization Committee of the Board of Directors (the “Compensation Committee”).
Compensation Discussion and Analysis
Objectives of Hudson Valley Holding Corp.’s Compensation Programs
The primary objectives of the Company's executive compensation program are to attract, retain, motivate and reward executives capable of leading the Company in achieving its business objectives and annual goals. The Company’s program is intended to measure and reward past performance of the Named Executive Officers and encourage a long-term perspective that aligns their interests with those of our shareholders.
Our executive compensation program goals are designed to:
· | Closely align executives’ interests with the long-term interests of shareholders; |
· | Provide market competitive compensation in order to attract and retain highly qualified executives that can lead the Company in achieving its business goals; |
· | Recognize and differentiate individual and team performance; |
· | Motivate and reward superior performance; |
· | Balance rewards for short-term and long-term results to ensure sustainable performance over time; |
· | Encourage exceptional business performance without encouraging excessive risk taking; |
· | Align incentives with Hudson Valley Bank’s profitability, and |
· | Create a meaningful ownership stake among key employees. |
We have historically compensated Named Executive Officers through a combination of base salary, non-equity incentive awards, equity awards, retirement plans and other personal benefits designed to be competitive with comparable employers.
The compensation program for our Named Executive Officers and other senior officers provides performance-incentive awards that are aligned with specific business goals and objectives. Our annual incentive program for 2014 (“the 2014 Annual Incentive Program”) provided for cash and equity awards based on achievement of predefined Company and individual goals. Beginning in 2014, in addition to providing time-based restricted stock to our executives, we have also implemented performance-based restricted stock grants tied to a performance goal, in each case designed to align executives with shareholder interests. Awards are determined based on an assessment of a combination of the Company, department and individual performance and all awards are subject to the discretion of the Compensation Committee.
111
Best Practices
To support our goals of encouraging long-term value creation, further aligning executives’ interests with the interests of our stockholders and ensuring good governance practices, our executive compensation program supports many best practices:
· | Pay-for-performance. A substantial percentage of each of our Named Executive Officer’s total target direct compensation is variable, performance-based compensation. |
· | Performance measures support strategic objectives. The performance measures we used for our annual incentive plan reflect strategic, financial, operating and business development objectives we believe will create long-term value for our stockholders. |
· | Appropriate risk-taking. We set achievable performance goals that are centered around our internal financial plan, which we believe will not encourage risk taking outside the range of risk inherent in our business plan. |
· | Clawback provisions. Incentive compensation is subject to clawback. |
· | Anti-hedging policy. We have implemented an anti-hedging policy for the executive officers. |
· | Ownership guidelines. We encourage executives and directors to have and hold stock in our Company by maintaining robust stock ownership guidelines and a holding requirement. |
· | No golden parachute excise tax gross-ups. We have not entered into any agreements which provide a golden parachute excise tax gross-up in the event of a change in control. |
· | Long-Term Incentive Program. We implemented an equity incentive program that will focus executives on forward-looking performance by conditioning vesting of a portion of restricted stock on the Company’s relative Return on Assets. |
2014 Advisory Vote on Executive Compensation
At the 2014 Annual Meeting of Shareholders, stockholders were provided the opportunity to cast an advisory vote on the compensation of the Named Executive Officers and approximately 84.9% of the votes cast on such proposal were voted in favor of such compensation. The Compensation Committee takes into consideration the outcome of “say-on-pay” votes when determining subsequent compensation polices and decisions and acknowledged the votes as indicative of shareholder support for the Company’s executive compensation program. Even with this level of support, the Compensation Committee determined to update our Annual Incentive Program to provide for grants of performance-based equity awards consistent with current best practices commencing in 2014, as discussed in further detail below.
Role of the Compensation Committee, Independent Consultant and Management
Role of the Compensation Committee
The Board of Directors established the Compensation Committee to, among other things; establish, review, and approve the compensation levels of Named Executive Officers, evaluate the performance of Named Executive Officers and certain other officers, and address other executive compensation-related matters for the Company. The Compensation Committee ensures that the total compensation paid to executives is fair, reasonable, and performance-based while aligning with shareholder interests.
The Compensation Committee reviews all compensation components for the Company’s Chief Executive Officer and other Named Executive Officers, including base salary, annual incentive, long-term equity incentives, benefits and other perquisites. While the Chief Executive Officer makes recommendations on other Named Executive Officers, the Compensation Committee is ultimately responsible for approving compensation for all Named Executive Officers. The Compensation Committee reviews its decisions with the full Board of Directors.
112
The Compensation Committee has the sole authority and access to resources to obtain advice and assistance from internal or external legal, human resource, accounting or other advisors or consultants as it deems desirable or appropriate. The Compensation Committee has direct access to outside advisors and consultants throughout the year as they relate to executive compensation and meets periodically with the compensation consultant independently of management.
Role of the Compensation Consultants
In 2014, the Compensation Committee did not consult with any compensation consultants. In 2013, the Compensation Committee utilized the services of two compensation consultants. The first consultant was used to advise the Compensation Committee related to the compensation of the Chairman, CEO and Board. The second compensation consultant assisted the Compensation Committee with incentive plan designs, changes in control arrangements and proxy disclosures.
The Compensation Committee Chair has regular contact with its independent consultants outside meetings as appropriate. The Compensation Committee has considered all relevant factors, including the six factors listed in Section 10C-1(b)(4) of the Exchange Act, and determined that no conflict of interest exists with respect to previously used compensation consultants.
Role of Management
Although the Compensation Committee makes independent determinations on all matters related to compensation of the Named Executive Officers, certain members of management may be requested to attend or provide input to the Compensation Committee. Input may be sought from the Executive Chairman, Chief Executive Officer or others to ensure the Compensation Committee has the information and perspective it needs to carry out its duties.
In particular, the Compensation Committee seeks input from the Chief Executive Officer on matters relating to strategic objectives, Company performance goals and input on his assessment of the Named Executive Officers’ performance. Although executives may provide insight, suggestions or recommendations regarding executive compensation, executives are not present during the Compensation Committee’s deliberations or voting on their own compensation. Only Compensation Committee members vote on decisions regarding Named Executive Officer compensation. The Compensation Committee regularly meets in executive session without management present.
Executive Compensation Market Review
The Compensation Committee reviewed general market pay ranges when determining Mr. Brown’s compensation. The data was not based on a specific peer group of companies. The data reflected typical compensation ranges at banks of a similar size and in our general geographic region. Mr. Brown’s salary remained unchanged from 2013. The Compensation Committee reviewed general market trends when setting compensation for the other Named Executive Officers, however, a specific benchmarking study was not conducted for those positions in 2013.
Review of Named Executive Officer Performance and 2014 Compensation Decisions
Our Named Executive Officers for 2014 were:
· | Stephen R. Brown, President, Chief Executive Officer & Director |
· | Michael J. Indiveri, Executive Vice President, Chief Financial Officer |
· | James J. Landy, Executive Chairman of the Board |
· | James P. Blose , Executive Vice President General Counsel & Secretary |
· | Scott J. Skorobohaty, Executive Vice President, Chief Banking Officer of the Bank |
Each year the Compensation Committee reviews each element relating to Named Executive Officer compensation. Members of the Compensation Committee have the opportunity to interact with the Named Executive Officers at various times during the year, which allows the Compensation Committee to form its own assessment of each individual's performance. This interaction is further supplemented by input from the Board which also regularly interacts with the Named Executive Officers.
Each year the CEO presents to the Compensation Committee his evaluation of each Named Executive Officer, other than himself which includes a review of contribution and performance over the past year, strengths, weaknesses, development plans and succession potential. Following this presentation, and a review of the achievement of individual and Company performance, the Compensation Committee makes its own assessments and determines the compensation for each Named Executive Officer.
113
The Compensation Committee reviews the performance of the CEO annually. The CEO does not participate in the Compensation Committee’s deliberations of his own pay. Prior to January 1, 2015, the Compensation Committee reviewed the performance of both the CEO and Executive Chairman relative to achievement of individual and Company performance. Following such review the Compensation Committee made its own assessment and determined the compensation for both the CEO and Executive Chairman. Neither the CEO nor the Executive Chairman participated in the Compensation Committee’s deliberations regarding their own compensation nor are they present when such deliberations take place.
Base Salaries
The Compensation Committee establishes the base salaries of the Named Executive Officers considering the performance of the Named Executive Officers with the goal of being market competitive. In each case, the Compensation Committee takes into account the scope of responsibilities and experience of the particular officer, and balances them against competitive salary levels.
The Named Executive Officers did not receive annual base pay increases for 2014.
Incentive Plans
Our 2014 Incentive Plan Program consists of our Annual Incentive Plan and Long Term Incentive Plan (or LTIP), both of which were adopted to promote and reward the achievement of performance objectives and to align the interests of participants, including the Named Executive Officers, with shareholders. The 2014 Incentive Program focuses on financial and strategic measures that are critical to the Company’s success and are intended to encourage teamwork and collaboration across business lines.
Awards are determined based on a combination of Company and individual performance and paid out in cash and equity. Target annual incentive awards under the 2014 Incentive Program were established by the Compensation Committee to reflect each executive’s responsibilities and general market practices as a percentage of each Named Executive Officer’s base salary as follows:
Named Executive Officer |
| Cash Incentive (As a % of Base Salary) |
|
|
| Equity Incentive (As a % of Base Salary) |
|
|
| Total Annual Incentive (As a % of Base Salary) |
|
Stephen R. Brown |
| 55% |
|
|
| 50% |
|
|
| 105% |
|
Michael J. Indiveri |
| 40% |
|
|
| 35% |
|
|
| 75% |
|
James P. Blose |
| 40% |
|
|
| 35% |
|
|
| 75% |
|
Scott J. Skorobohaty (1) |
| — |
|
|
| — |
|
|
| — |
|
James J. Landy (2) |
| — |
|
|
| — |
|
|
| — |
|
(1) Based on specific employment goals and initiatives established when hired in 2014 and established during the year.
(2) Based on specific employment goals and initiatives established during the year.
The maximum total annual incentive opportunity for each Named Executive Officer under the 2014 Incentive Program was 150% of his target award. Threshold performance would result in a payout of 50%. Below threshold performance would result in no payout. When establishing the level of potential award opportunity for each Named Executive Officer, the Compensation Committee considers the individual level of responsibility, including the ability to impact the Company’s financial, strategic and operational objectives, as well as internal comparability, retention goals and competitive considerations.
The Compensation Committee approved the goals for 2014 following its assessment of the appropriateness of the goals that were proposed by the CEO and the management team. The goals were developed to reflect the Company’s overall annual and long-term business goals, as reviewed and discussed by the management team with the Board.
Incentive payouts under the 2014 Incentive Program are determined by a two-step process. First, the incentive pool must fund based on net income performance. If threshold performance is not achieved, no cash or equity awards will be paid. Once the threshold net income is achieved, an incentive pool is funded and awards are paid out based on performance of objectives set forth on a balanced scorecard. The Committee reserves the right to apply discretion to the 2014 Incentive Program as needed to reflect the business environment, market conditions, as well as budgetary, compliance, and risk management considerations.
Incentive Pool Funding
The incentive pool is funded based on net income performance. The pool is funded 50% of target for threshold performance (80% of net income budget), 100% of target for target performance (100% of net income budget) and 150% of target for maximum
114
performance (125% of net income budget). The pool is scaled for performance between threshold, target and maximum. Performance below threshold (i.e. 80% of net income budget) would result in 0% payouts under the 2014 Incentive Program.
Balanced Scorecard of Strategic Initiatives
Once the pool funding is established, executive performance is measured based on a “balanced scorecard” structure including a portfolio of performance goals that are intended to support our business plan. Performance goals are established at three levels (threshold, target, and maximum) to correspond with our strategic objectives and budgetary plans. The goals are recommended in conjunction with budget and planning and approved by the Compensation Committee. For 2014, the following goals were established:
Goal Weighting
Each executive’s annual bonus opportunity is based on weightings appropriate to their specific roles and responsibilities.
Named Executive Officer |
| Loan Origination And Diversification |
|
|
| Asset Quality |
|
|
| Efficiency |
|
|
| Compliance |
|
|
| Specific Initiatives |
|
Stephen R. Brown |
| 25% |
|
|
| 25% |
|
|
| 25% |
|
|
| 25% |
|
|
| N/A |
|
Michael J. Indiveri |
| 25% |
|
|
| 25% |
|
|
| 25% |
|
|
| 25% |
|
|
| N/A |
|
James P. Blose |
| 25% |
|
|
| 30% |
|
|
| 15% |
|
|
| 30% |
|
|
| N/A |
|
Scott J. Skorobohaty |
| N/A |
|
|
| N/A |
|
|
| N/A |
|
|
| N/A |
|
|
| 100% |
|
Scorecard Targets and Results
The Compensation Committee and Company management established performance targets and ranges based on overall corporate strategy and budgets. The table below summarizes the performance measures, performance ranges and 2014 achievements:
Company Performance Metrics | ||||
Performance Measure | Threshold | Target | Stretch | Achievement Percentage |
Loan Origination and Diversification | $576 Million | $720 Million | $900 Million | 65% |
Asset Quality | 22.5% of Risk Based Capital | 20.0% of Risk Based Capital | 17.5% of Risk Based Capital | 150% |
Efficiency (a) | 80% Efficiency Ratio | 72.5% Efficiency Ratio | 65% Efficiency Ratio | 68% |
Compliance | Maintenance of certain regulatory standards – No negative regulatory actions | 100% | ||
Specific Initiatives | Varies by Individual | Varies | ||
(a) | Defined as budget Non-Interest Expense less budget Non-interest Income divided by budget Net Interest Income before provision for loan loss (all adjusted for significant non-recurring income) |
The incentive compensation pool was funded and disbursed to the Named Executive Officers in December 2014.
Mr. Landy’s Annual Incentive Goals and Performance
Mr. Landy’s incentive award was defined based on specific employment goals and initiatives established in 2014.
115
Compensation of Named Executive Officers
Set forth below is information regarding compensation earned by or paid or awarded to our Named Executive Officers during the year ended December 31, 2014. The chart below breaks down total target direct compensation by element for each Named Executive Officer for the 2014 Incentive Program approved by the Compensation Committee in 2014. For purpose of this table, “Pay Mix” represents the percentage of target total direct compensation for each element. A large portion of pay is tied to financial and strategic performance and other goals believed to be related to increasing shareholder value. Consequently, actual compensation may vary from targeted compensation based on performance achievement against these goals.
Components of Total Direct Compensation at Target |
| |||||||||||||||||||||||||||||||||||||||
Name and Principal Position |
| Salary |
|
| Annual Cash Incentive |
|
| Total Cash Compensation |
|
| Long-Term Incentive |
|
| Total Direct Compensation, |
| |||||||||||||||||||||||||
| ($) |
|
| Pay Mix | Target ($) |
|
| Pay Mix |
| Target ($) |
|
| Pay Mix |
| Target ($) |
|
| Pay Mix |
| Target ($) |
|
| Pay Mix | |||||||||||||||||
Stephen R. Brown President and Chief Executive Officer |
|
| 505,000 |
|
|
| 49 | % |
|
| 277,750 |
|
|
| 27 | % |
|
| 782,750 |
|
|
| 76 | % |
|
| 252,500 |
|
|
| 24 | % |
|
| 1,035,250 |
|
|
| 100 | % |
Michael J. Indiveri Executive Vice President and Chief Financial Officer |
|
| 300,000 |
|
|
| 57 | % |
|
| 120,000 |
|
|
| 23 | % |
|
| 420,000 |
|
|
| 80 | % |
|
| 105,000 |
|
|
| 20 | % |
|
| 525,000 |
|
|
| 100 | % |
James J. Landy Executive Chairman |
|
| 275,000 |
|
|
| 57 | % |
|
| 110,000 |
|
|
| 23 | % |
|
| 385,000 |
|
|
| 80 | % |
|
| 96,250 |
|
|
| 20 | % |
|
| 481,250 |
|
|
| 100 | % |
James P. Blose Executive Vice President, General Counsel & Secretary |
|
| 300,000 |
|
|
| 57 | % |
|
| 120,000 |
|
|
| 23 | % |
|
| 420,000 |
|
|
| 80 | % |
|
| 105,000 |
|
|
| 20 | % |
|
| 525,000 |
|
|
| 100 | % |
Scott J. Skorobohaty 1 Executive Vice President, Chief Banking Officer of the Bank |
|
| 275,000 |
|
|
| 42 | % |
|
| 275,000 |
|
|
| 42 | % |
|
| 550,000 |
|
|
| 84 | % |
|
| 100,000 |
|
|
| 16 | % |
|
| 650,000 |
|
|
| 100 | % |
1. Agreement under new hire employment offer
Incentive Program Results for 2014
Pursuant to the Merger Agreement, the Compensation Committee was permitted to determine the level of achievement of the performance goals for 2014 under the Annual Incentive Plan in the ordinary course of business, consistent with past practice, and award annual cash bonuses based on that level achievement, and, if actual performance was less than target, the Company was permitted to pay each Named Executive Officer an amount equal to the difference between his target bonus and the bonus determined based on actual performance. In addition, pursuant to the Merger Agreement, the Compensation Committee was also permitted to grant time-based restricted stock and performance awards to the Named Executive Officers in the ordinary course of business pursuant to the LTIP, consistent with past practice, subject to specified individual and aggregate caps.
The 2014 Annual Incentive Program funded at 79% based on 2014 net income (as adjusted). Taking into consideration Company performance based on the goals established above, the Compensation Committee reviewed the performance of the CEO in light of the goals established. The Compensation Committee then reviewed the CEO’s evaluation of the performance of each Named Executive Officer other than himself and the Executive Chairman, and their individual attainment of the specific performance metrics. Based upon this review, the Committee determined that each Named Executive Officer earned the following incentive awards without regard to the Merger Agreement:
116
Named Executive Officer |
| Net Income Pool Funding Results |
|
| Individual Balance Scorecard Results |
|
| Target Achievement (% of Target) |
|
| Total Equity Payout |
|
| Total Cash Payout |
|
| Base Salary |
| ||||||
Stephen R. Brown |
|
| 79% |
|
|
| 95.8% |
|
|
| 75.6% |
|
| $ | 190,890 |
|
| $ | 209,979 |
|
| $ | 505,000 |
|
Michael J. Indiveri |
|
| 79% |
|
|
| 95.8% |
|
|
| 75.6% |
|
| $ | 79,380 |
|
| $ | 90,720 |
|
| $ | 300,000 |
|
James P. Blose |
|
| 79% |
|
|
| 101.5% |
|
|
| 80.1% |
|
| $ | 84,105 |
|
| $ | 96,120 |
|
| $ | 300,000 |
|
James J. Landy (1) |
|
| — |
|
|
| — |
|
|
| — |
|
|
| — |
|
|
| — |
|
|
| — |
|
Scott J. Skorobohaty (1) |
|
| — |
|
|
| — |
|
|
| — |
|
|
| — |
|
|
| — |
|
|
| — |
|
(1) Not funded under the 2014 Annual Incentive Program as Named Executive Officer had specific goals and initiatives.
However, because the Compensation Committee was permitted to make awards at target level, each Named Executive Officer received the following incentive awards in lieu of the awards above:
Named Executive Officer |
| Total Equity Payout |
|
| Total Cash Payout |
| ||
Stephen R. Brown |
| $ | 252,500 |
|
| $ | 277,750 |
|
Michael J. Indiveri |
| $ | 105,000 |
|
| $ | 120,000 |
|
James J. Landy |
| $ | 96,250 |
|
| $ | 110,000 |
|
James P. Blose |
| $ | 105,000 |
|
| $ | 120,000 |
|
Scott J. Skorobohaty |
| $ | 100,000 |
|
| $ | 275,000 |
|
The total equity payout above was distributed in the form of 50% time-based restricted shares and 50% performance-based restricted stock units. Consistent with past practice, the time-based restricted shares vest ratably over a three-year period. The performance-based restricted stock units vest based on the Company’s ROA over three years to an industry comparator group. Except for the stock award granted to Scott Skorobohaty, in connection with the pending merger with Sterling Bancorp, the cash awards were paid and the equity awards were vested on December 30, 2014 for tax planning purposes with respect to Sections 280G and 4999 of the Code.
The 2014 Long-Term Incentive Plan
During 2013, the Compensation Committee decided, after consultation with its independent consultant, to differentiate the long-term incentive plan and the short-term incentive plan. The Annual Incentive Plan operates the same as described above and results in cash incentives. The LTIP has been established separately from the Annual Incentive Plan. The LTIP, in addition to time-based restricted stock, will include performance-based restricted stock units that will pay out based on future performance. Historically and going forward, long-term incentive awards are granted to balance five key goals:
· | Reward performance |
· | Encourage stock ownership |
· | Retain top performers |
· | Align participant interests with shareholder interests |
· | Reinforce sound risk management |
The Company grants long term equity awards to participants based on their role and market practice. Performance that increases shareholder value and economic profit to the Company determines award amounts. The table below summarizes LTIP award targets as a percent of base salary based on market data for participating roles. Actual award grants will vary from target to reflect performance.
117
Role/Tier | LTIP Award Targets (% of Base Salary) |
Chief Executive Officer (CEO) | 50% |
Executive Management | 35% |
Senior Management | 20% |
LTIP awards will be granted as a combination of performance and time vested equity that is designed to achieve the Company’s performance, ownership and retention goals. Fifty (50%) percent of the target award will be granted as performance based restricted stock units (“Performance Units”). Performance Units will vest based on the Company’s return on assets (“ROA”) compared over three years to an industry comparator group comprised of banks in our geographic region with assets ranging from $1 to $10 billion. The potential vesting of Performance Units is as follows:
· | If the Company’s average ROA over three years compared to the peer group is less than the 36th percentile, no Performance Units will vest; |
· | If the Company’s average ROA over three years compared to the peer group is equal to the 36th percentile, 50% of the target Performance Units will vest; |
· | If the Company’s average ROA over three years compared to the peer group is equal to the 50th percentile, 100% of the target Performance Units will vest; and |
· | If the Company’s average ROA over three years compared to the peer group is equal to or greater than the 75th percentile, 150% of the target Performance Units will vest. |
To the extent that the Company’s average ROA over three years compared to the peer group falls between the 36th and 50th percentiles, or the 50th and 75th percentiles, the number of Performance Units that will vest will be determined using a straight line interpolation method.
The Performance Units reward future Company performance and allows for alignment with shareholders through a long-term performance perspective.
Fifty (50%) percent of the award will be granted in the form of time-based restricted stock. This portion of the award reflects a combination of Company and individual performance during the previous fiscal year (“Look-Back” Perspective). These awards allow the recognition of individual performance and further create an ownership and retention perspective.
The combination of Performance Units and time-based restricted stock allows the Company to recognize past and current performance with awards subject to future vesting for retention, while also focusing on long term, sustainable performance that is not earned until the completion of a multi-year performance period.
Performance Units cliff vest after three years to reflect actual performance of the Company with respect to relative ROA. Time based awards vest in annual one-third increments commencing with the first anniversary of the grant date. All awards granted under the LTIP are subject to a one-year holding period following vesting during which time participants cannot sell the acquired award shares. This practice helps the Company support its ownership goals and aligns with the time horizon of risk and clawback features.
Mr. Brown’s Promotion Grant
In February 2013, the Committee awarded Mr. Brown a restricted stock promotion grant of 66,000 shares in consideration for his promotion to President and CEO during 2012. Two-thirds of the restricted stock award is performance-based and vests in increments which are contingent upon achievement of the termination of the Formal Agreement and other Board-approved corporate goals. 22,000 of Mr. Brown’s restricted shares vested upon the termination of the Formal Agreement in October 2013 and 22,000 of Mr. Brown’s restricted shares vested upon achievement of certain Board-approved corporate goals. The last goal was achieved in the fourth quarter of 2014. The remaining one-third of the promotion grant consists of time-based restricted stock and vests over a period of four years on the anniversary of his appointment to CEO in increments of 15%, 15%, 35%, and 35%.
Mr. Indiveri’s Sign-On Grant
118
In May, 2013, Mr. Indiveri was awarded 7,500 restricted shares, consistent with our typical practice for new executives. Half of the award was subject to time-based vesting over four years (20% vesting on each the first and second anniversary of the grant and 30% vesting on each the third and fourth anniversary of the grant). The other half of the award was performance-based and vested upon the termination of the Formal Agreement.
Mr. Blose’s Sign-On Grant
In December, 2013, Mr. Blose was awarded 7,500 restricted shares, consistent with our typical practice for new executives. The award was subject to time-based vesting over four years (20% vesting on each the first and second anniversary of the grant and 30% vesting on each the third and fourth anniversary of the grant).
Mr. Skorobohaty’s Sign-on Grant
In July 2014, Mr. Skorobohaty was awarded 5,426 restricted shares, consistent with our typical practice for new executives. The award was performance based for which the specific criteria were achieved in December 2014.
Retirement, Health and Welfare Benefits
We offer a variety of health and welfare programs to all eligible employees. The Named Executive Officers generally are eligible for the same benefit programs on the same basis as the rest of the eligible employees. The health and welfare programs are intended to protect employees against catastrophic loss and encourage a healthy lifestyle. Our health and welfare programs include medical including pharmaceutical, dental, life insurance and accidental death and disability. The Company provides full time employees, regularly scheduled to work 30 or more hours per week, short-term disability, long-term disability and life insurance. All employees, including Named Executive Officers, contribute to the cost of some of these plans. We offer a qualified 401(k) savings and profit sharing retirement plan. All Company employees, including Named Executive Officers, are generally eligible for this plan. The Compensation Committee determines the contribution to the profit sharing plan and the 401(k) matching contribution annually as reflected in the All Other Compensation Table on page 125.
Supplemental Employee Retirement Plan
The Company provides supplemental retirement benefits to Named Executive Officers and certain other officers. These benefits are provided through both the 1995 Supplemental Retirement Plan and the 1997 Supplemental Retirement Plan (collectively the “SERP”). These plans are frozen for new participants, are not qualified for tax purposes and are available only to certain officers. Benefits under these plans are unfunded. The SERP entitles participating officers to receive supplemental retirement benefits for a period of 15 years payable on a monthly basis. The Company believes providing this benefit is important to remain competitive with companies within the industry, to provide a competitive level of retirement income, and to help assure orderly management succession by encouraging continued employment.
Pursuant to the 1995 Supplemental Retirement Plan, supplemental benefits equal 75% of the officer’s highest base salary in any of the last three years of employment, less any retirement plan benefits provided to him by the Company. Pursuant to the 1997 Supplemental Retirement Plan, supplemental benefits equal 65% of the average of the highest five years’ annual base salary paid to the officer during his last 10 years of employment, reduced by (1) the value of his qualified plan account as of the date of retirement; (2) the value of his 401(k) matching benefit as of the date of retirement; (3) 50% of his primary social security benefit; and (4) the value of any other retirement type benefits provided to him by the Company. Mr. Brown has a $400,000 salary cap for determination of his benefits under the SERP. Mr. Brown is a participant in the 1997 Supplemental Retirement Plan. Mr. Landy is a participant in the 1995 Supplemental Retirement Plan. Messrs. Blose, Indiveri, and Skorobohaty are not currently eligible to participate in the SERP.
For more information, see below under “Pension Benefits.”
Personal Benefits
Each Named Executive Officer is provided certain additional benefits which includes the use of a company-owned automobile. The automobile facilitates Named Executive Officers’ travel between our offices, to business meetings with customers and vendors. Named Executive Officers may use the automobile for personal transportation. Personal use of the automobile results in taxable income to the Named Executive Officer, and we include this in the amounts of income we report to the Named Executive Officers and the Internal Revenue Service. We also support and encourage certain Named Executive Officers to hold a membership in one local country club for which we pay dues and other business related expenses. We find that the club membership is an effective means of obtaining business as it allows Named Executive Officers to interact with present and prospective customers in a relaxed,
119
informal environment. We require that any personal use of the country club facilities be paid directly by the Named Executive Officers. Because the club memberships are used at our expense only for business entertainment, we do not include them as benefits in the Summary Compensation Table on page 123.
Severance Plans
Except for the Change in Control Agreements described below, the Company has no severance plan or individual severance arrangements in place for any of its Named Executive Officers.
Employment Agreements and Arrangements
The Company has no employment agreements or employment arrangements in place for any of its Named Executive Officers.
Change in Control Agreements
In the first quarter of 2014, the Compensation Committee approved Change in Control Agreements (each, a “Change in Control Agreement”) with Messrs. Brown, Blose, Indiveri and Skorobohaty as well as several other executive officers. The Change in Control Agreements provide certain benefits in the event the executive’s employment is terminated under specified circumstances and within a specified period of time following a change in control (as such term is defined in the Change in Control Agreement). Each such Change in Control Agreement remains in effect until the executive’s employment is terminated prior to the occurrence of a change in control, or termination of the executive’s employment within two years after a change in control.
If an executive’s employment is terminated without “cause”, or the executive resigns for “good reason” (each term as defined in the Change in Control Agreement), within two years following the occurrence of a change in control at a time when the Change in Control Agreement is in effect, the Company will make payments and provide benefits as follows:
· | For Mr. Brown, a lump sum cash severance equal to three times (a) the sum of his annual base salary as in effect immediately prior to termination of employment, and (b) the target amount of his annual incentive award. |
· | For Messrs. Blose, Indiveri and Skorobohaty, a lump sum cash severance equal to two times (a) the sum of his annual base salary as in effect immediately prior to termination of employment, and (b) the target amount of his annual incentive award. |
· | A pro-rated portion of the executive officer’s target annual incentive award for the year in which the termination occurs. |
· | The executive officer’s pro rata profit sharing contribution. |
· | For Mr. Brown, continued participation for three years following termination for the executive, his spouse and his dependents under the health care plans and life insurance plans which are sponsored by the Company (substantial equivalent medical coverage if the covered officer cannot continue participation on our plans). |
· | For Messrs. Blose, Indiveri and Skorobohaty, continued participation for two years following termination for the executive, his spouse and his dependents under the health care plans and life insurance plans which are sponsored by the Company (substantial equivalent medical coverage if the covered officer cannot continue participation on our plans). |
The Change in Control Agreements to which Mr. Brown and Messrs. Blose, Indiveri and Skorobohaty are a party do not include excise tax gross-up provisions. The Change in Control Agreement includes a “best net” cutback clause which provides that in the event that the total payments following a change in control would require the executive to pay an excise tax under Section 4999 of the Internal Revenue Code, as amended, then the total payments paid to the executive will be the greater of (i) a payment equal to the amount which would not result in the payment of an excise tax by the executive under Section 4999, and (ii) a payment equal to the greatest after tax amount payable to the executive after taking into account any excise tax imposed under Section 4999.
As a condition to receiving any of the payments or benefits described above, the executive officer must first sign and deliver a release of claims to the Company.
The Change in Control Agreements are not employment agreements. The Company is permitted to terminate any executive officer’s employment at any time prior to a change in control, with or without cause, without triggering any payment obligations under the Change in Control Agreements.
Consulting Agreement with James J. Landy
120
In view of James J. Landy's retirement as the Executive Chairman of the Board of Directors of the Company and the Bank as of December 31, 2014, the Bank entered into a consulting agreement with Mr. Landy on October 6, 2014 pursuant to which Mr. Landy would be retained as a consultant to the Bank effective January 1, 2015 to provide advice with respect to the business, operations and opportunities to the Bank within his areas of expertise. The consulting agreement provides for the payment to Mr. Landy of a fee of $16,667.67 per month for the five-year term of the consulting agreement and includes a change in control provision and customary confidentiality, noncompetition, non-solicitation, and indemnification covenants. In the event of a change in control, Mr. Landy may terminate the consulting agreement during the 90-day period following the change in control and, upon such termination, Mr. Landy will receive a lump sum payment equal to the aggregate remaining monthly payments through the expiration of the then current term of the consulting agreement.
Change in Control Provision Under SERP
In addition to potential payments under the Change in Control Agreement, the SERP, provides for the acceleration of a participant’s age under the SERP should a change in control of the Company occur. Mr. Brown participates in the SERP and would receive this benefit upon a change in control. These provisions are intended to help the Company retain key employees by providing such individuals greater assurance regarding their retirement benefits and to align the interests of shareholders and management. See “Potential SERP Payments upon Termination or Change in Control” on page 128 for more information.
Mr. Landy’s participation in the SERP is not affected by the Change of Control provisions as he became eligible to begin receiving payments on January 1, 2015.
Stock Ownership Guidelines
Executives and directors are subject to stock ownership guidelines to encourage and demonstrate commitment and alignment with shareholder interests. In this regard the CEO is required to own a minimum of 2.5 times his annual salary in shares of the Company, while other Named Executive Officers are required to own one times their annual salary in shares in the Company.
Holding Requirement
Additionally, the Named Executive Officers are required to hold all awards earned through the Long-Term Incentive Plan, for one year following the date the awards vest.
Anti-Hedging Policy
Named Executive Officers are prohibited from engaging in short sales of the Company’s securities. Additionally, the Named Executive Officers may not engage in transactions in publicly traded options in the Company’s securities such as puts, calls and other derivative securities, on an exchange or in any other organized market.
Clawback Policy
In the event the Company is required to prepare an accounting restatement due to the material noncompliance of the Company with any financial reporting requirement under the securities laws, as a result of misconduct (as determined by the members of the Board of Directors who are considered “independent” for purposes of the listing standards of the NYSE) each of the Named Executive Officers who participate in the incentive program shall reimburse the Company for part or the entire incentive award made to such participants on the basis of having met or exceeded specific goals for performance periods.
Tax Implications of Executive Compensation
Section 162(m) of the Internal Revenue Code of 1986, as amended (the “Code”) places a limit of $1,000,000 on the amount of compensation that may be deducted by the Company in any year with respect to the CEO and certain other highly compensated executive officers unless the compensation qualifies as performance-based compensation as described in Section 162(m) and the related regulations. We have structured certain compensation paid to certain of our Named Executive Officers in a manner intended to qualify for deductibility under Section 162(m), including (i) certain compensation expense related to options granted pursuant to the Company's 2002 Stock Option Plan (the “2002 Plan”), and (ii) certain restricted stock awards made pursuant to the 2010 Omnibus Incentive Plan.
Although we have generally attempted to structure executive compensation in a manner intended to preserve deductibility under Section 162(m), we also believe that there may be circumstances where our interests are best served by maintaining flexibility in the way compensation is provided, even if it may result in the non-deductibility of certain compensation under the Code.
121
Other Merger-Related Developments
Restricted Stock and Restricted Stock Unit Awards. The time-based restricted stock awards granted to Messrs. Brown, Landy and Blose and the performance-based restricted stock unit awards granted to Messrs. Brown and Landy, which would otherwise vest automatically upon the consummation of the Merger, were accelerated as of the vesting as of the close of business on December 30, 2014. The awards were vested for tax planning purposes with respect to Sections 280G and 4999 of the Code. The number of shares of the Company’s common stock associated with the awards and the corresponding value of such awards as of December 30, 2014 (based on a closing price of the Company’s common stock of $27.37 on such date) are set forth below for the executives.
Named Executive Officer | # of Restricted Stock Awards |
Value of Shares |
Stephen R. Brown | 20,395 | $558,211 |
James J. Landy | 1,745 | $47,761 |
James P. Blose | 6,000 | $164,220 |
Named Executive Officer | # of Performance-Based Restricted Stock Units |
Value of Shares |
Stephen R. Brown | 11,590 | $317,218 |
James J. Landy | 4,402 | $120,483 |
Compensation Committee Report
The Compensation and Organization Committee (“Committee”) of the Board of Directors has reviewed and discussed with the Company’s management the Compensation Discussion and Analysis that is required by the SEC rules to be included in this Proxy Statement. Based on that review and those discussions, the Committee has recommended to the Company’s Board of Directors that the Compensation Discussion and Analysis beginning on page 111 be included.
Craig S. Thompson, Chairman
John P. Cahill
Gregory F. Holcombe
Adam W. Ifshin
William E. Whiston
122
Compensation of Named Executive Officers
SUMMARY COMPENSATION TABLE
The following table sets forth the compensation for each of the Named Executive Officers for fiscal 2014, 2013 and 2012, including the dollar value of the executive’s: (i) annual base salary; (ii) earned non-equity incentive award; (iii) the grant date fair value, calculated in accordance with FASB ASC Topic 718 for equity, if any, granted in those years; (iv) the aggregate change in the present value of the accumulated benefit under the non-qualified supplemental retirement plan during the year; (v) all other compensation for the year; and (vi) the dollar value of total compensation for the year. Grant date fair value of the stock awards reported below is determined using the closing market price on the date prior to grant. Additional information concerning our accounting for stock awards is included in Note 11 of the Notes to the Consolidated Financial Statements herein.
|
|
| Salary |
|
| Bonus |
|
| Stock |
|
| Non- |
|
| Change in Pension |
|
| All |
|
| Total |
| ||||||||
| Year |
| ($) |
|
| ($) |
|
| ($)1 |
|
| ($) |
|
| ($) |
|
| ($)12 |
|
| ($) |
| ||||||||
Stephen R. Brown |
| 2014 |
|
| 505,000 |
|
|
| — |
|
|
| 1,127,929 | 2 |
|
| 277,761 |
|
|
| 351,567 | 10 |
|
| 38,882 |
|
|
| 2,301,139 |
|
President and Chief Executive Officer |
| 2013 |
|
| 505,000 |
|
|
| — |
|
|
| 1,026,300 | 3 |
|
| 210,296 |
|
|
| — | 10 |
|
| 28,155 |
|
|
| 1,769,751 |
|
| 2012 |
|
| 467,200 |
|
|
| — |
|
|
| — |
|
|
| — |
|
|
| 518,984 | 10 |
|
| 21,067 |
|
|
| 1,007,251 |
| |
|
|
|
|
|
|
|
|
|
|
|
|
|
|
|
|
|
|
|
|
|
|
|
|
|
|
|
|
|
|
|
Michael J. Indiveri |
| 2014 |
|
| 300,000 |
|
|
| — |
|
|
| 204,170 | 2 |
|
| 120,008 |
|
|
| — |
|
|
| 19,334 |
|
|
| 643,512 |
|
Executive Vice President and Chief Financial Officer |
| 2013 |
|
| 192,000 | 4 |
|
| — |
|
|
| 127,425 | 5 |
|
| 53,312 |
|
|
| — |
|
|
| 13,261 |
|
|
| 385,998 |
|
|
|
|
|
|
|
|
|
|
|
|
|
|
|
|
|
|
|
|
|
|
|
|
|
|
|
|
|
|
|
|
James J. Landy |
| 2014 |
|
| 275,000 |
|
|
| — |
|
|
| 264,494 | 2 |
|
| 110,016 |
|
|
| 347,109 | 11 |
|
| 20,918 |
|
|
| 1,017,537 |
|
Executive Chairman |
| 2013 |
|
| 313,750 |
|
|
| — |
|
|
| — |
|
|
| 72,188 |
|
|
| 636,840 | 11 |
|
| 22,522 |
|
|
| 1,045,300 |
|
| 2012 |
|
| 430,000 |
|
|
| — |
|
|
| — |
|
|
| — |
|
|
| 478,208 | 11 |
|
| 22,789 |
|
|
| 930,997 |
| |
|
|
|
|
|
|
|
|
|
|
|
|
|
|
|
|
|
|
|
|
|
|
|
|
|
|
|
|
|
|
|
James P. Blose |
| 2014 |
|
| 300,000 |
|
|
| — |
|
|
| 374,200 | 2 |
|
| 120,008 |
|
|
| — |
|
|
| 6,900 |
|
|
| 801,108 |
|
Executive Vice President, General Counsel & Secretary |
| 2013 |
|
| 25,000 | 6 |
|
| — |
|
|
| 157,200 | 7 |
|
| — |
|
|
| — |
|
|
| — |
|
|
| 182,200 |
|
|
|
|
|
|
|
|
|
|
|
|
|
|
|
|
|
|
|
|
|
|
|
|
|
|
|
|
|
|
| |
|
|
|
|
|
|
|
|
|
|
|
|
|
|
|
|
|
|
|
|
|
|
|
|
|
|
|
|
|
|
|
Scott Skorobohaty |
| 2014 |
|
| 137,500 | 8 |
|
| — |
|
|
| 200,000 | 9 |
|
| 275,000 |
|
|
| — |
|
|
| 18,992 |
|
|
| 631,492 |
|
Executive Vice President, Chief Banking Officer of the Bank |
|
|
|
|
|
|
|
|
|
|
|
|
|
|
|
|
|
|
|
|
|
|
|
|
|
|
|
|
|
|
|
|
|
|
|
|
|
|
|
|
|
|
|
|
|
|
|
|
|
|
|
|
|
|
|
|
|
|
|
| |
|
|
|
|
|
|
|
|
|
|
|
|
|
|
|
|
|
|
|
|
|
|
|
|
|
|
|
|
|
| |
123
2. | For Messrs. Brown and Landy, amount represents the sum of: (i) the grant date fair value of the time-based restricted stock and performance-based restricted stock units issued under the LTIP, which were awarded and vested on December 30, 2014; and (ii) the incremental fair value of the executive’s modified outstanding restricted stock and performance-based restricted stock units that vested on December 30, 2014. For Mr. Blose, amount represents the sum of: (i) the grant date fair value of the time-based restricted stock and performance-based restricted stock units issued under the LTIP, which were awarded on December 30, 2014; and (ii) the incremental fair value of his modified outstanding restricted stock awards granted on December 2, 2013 that vested on December 30, 2014. For Mr. Indiveri, amount represents the restricted stock and performance-based restricted units issued under the LTIP, which were awarded and vested on December 30, 2014. In connection with the pending merger with Sterling Bancorp, the awards were vested on December 30, 2014 for tax planning purposes with respect to Sections 280G and 4999 of the Code. |
3. | The amount in this column represents the restricted stock granted to Mr. Brown in February 2013 in consideration of his promotion to President and CEO in May 2012. See “Mr. Brown’s Promotion Grant” on page 118 for additional information regarding this award |
4. | Mr. Indiveri was hired as an employee effective May 13, 2013 at an annual salary of $300,000. The figure in this column reflects the pro-rated salary paid in 2013. |
5. | The amount in this column reflects 7,500 shares of restricted stock granted to Mr. Indiveri in connection with his hiring. Half of the award is time-based and vests over 4 years on the anniversary of the grant and half is performance based contingent upon the achievement of a specified performance criteria which was met in October 2013. See “Mr. Indiveri’s Sign-On-Grant” on page 118 for additional information regarding this award. |
6. | Mr. Blose was hired as an employee effective December 2, 2013 at an annual salary of $300,000. The figure in this column reflects the pro-rated salary paid in 2013. |
7. | The amount in this column reflects 7,500 shares of restricted stock granted to Mr. Blose in connection with his hiring. The award is time-based and vests over 4 years on the anniversary of the grant. See “Mr. Blose’s Sign-On-Grant” on page 119 for additional information regarding this award. |
8. | Mr. Skorobohaty was hired as an employee effective July 7, 2014, at an annual salary of $275,000. The figure in this column reflects the pro-rated salary paid in 2014. |
9. | The amount in this column reflects two Restricted Stock Awards granted in 2014. The first for 5,426 shares of restricted stock granted in connection with Mr. Skorobohaty’s hiring. The award is performance based upon the achievement of two specified criteria which were met in December 2014. The second award totaled 3,650 shares of restricted stock which vest 100% on the third anniversary of the grant, December 31, 2017. |
10. | The amount shown represents the increase in the actuarial value during the year of the supplemental pension benefit under the Company's 1997 Supplemental Retirement Plan. |
11. | The amount shown represents the increase in the actuarial value during the year of the supplemental pension benefit under the Company's 1995 Supplemental Retirement Plan. |
124
12. | The following table shows the specific amounts included in the All Other Compensation column for fiscal 2014: |
| |||||||||||||||||||||||||||
|
|
|
| Employer Contribution/Match |
| Group |
| Personal |
| Cash |
| Other Fees |
| ||||||||||||||
Name |
|
|
| Profit- |
| 401(k) |
|
|
|
|
| ||||||||||||||||
| Year |
| ($) |
| ($) |
| ($) |
| ($) |
| ($) |
| ($) |
| |||||||||||||
Stephen R. Brown |
| 2014 |
|
| 13,000 |
|
|
| 2,600 |
|
|
| 2,621 |
|
|
| 3,285 |
|
|
| 17,376 |
|
|
| — |
|
|
Michael J. Indiveri |
| 2014 |
|
| 13,000 |
|
|
| 346 |
|
|
| 1,608 |
|
|
| 3,167 |
|
|
| 1,213 |
|
|
| — |
|
|
James J. Landy |
| 2014 |
|
| 13,000 |
|
|
| 2,600 |
|
|
| 1,803 |
|
|
| 2,163 |
|
|
| 1,352 |
|
|
| — |
|
|
James P. Blose |
| 2014 |
|
| — |
|
|
| — |
|
|
| 1,608 |
|
|
| 2,554 |
|
|
| 2,738 |
|
|
| — |
|
|
Scott J. Skorobohaty |
| 2014 |
|
| — |
|
|
| — |
|
|
| 746 |
|
|
| 2,378 |
|
|
| 868 |
|
|
| 15,0001 |
|
|
1. | Housing allowance paid to Mr. Skorobohaty. |
GRANTS OF PLAN-BASED AWARDS IN FISCAL 2014
The following table sets forth information regarding the restricted stock awards granted to our Named Executive Officers in 2014, as well as the potential range of annual incentive awards, both equity and non-equity based, that could have been earned for performance during 2014. As discussed above, under the 2014 Incentive Program, annual performance criteria were developed to determine achievement of goals by the Named Executive Officers. These performance-based criteria include financial and non-financial metrics. See “Goal Weighting” and “Scorecard Targets and Results” on page 115 for additional information regarding these criteria.
|
|
|
|
|
| Estimated future payouts under Non- |
| All other |
|
| Grant Date |
| ||||||||||||
Name |
| Award Type |
| Grant |
| Threshold |
|
| Target |
|
| Maximum |
|
|
|
|
| |||||||
Stephen R. Brown |
| Annual Incentive Plan (1) |
| 3/14/2014 |
|
| 138,875 |
|
|
| 277,750 |
|
|
| 416,625 |
|
|
|
|
|
|
|
|
|
|
| LTIP (2) |
| 3/14/2014 |
|
| — |
|
|
| 252,500 |
|
|
| — |
|
|
|
|
|
|
|
|
|
|
| Restricted Stock Awards (3) |
| 3/14/2014 |
|
| — |
|
|
| — |
|
|
| — |
|
|
| 4,995 |
|
|
| 136,713 |
|
|
| Restricted Stock Units (3) |
| 3/14/2014 |
|
| — |
|
|
| — |
|
|
| — |
|
|
| 11,590 |
|
|
| 317,218 |
|
|
| Modified Restricted Stock Awards (4) |
| 12/30/2014 |
|
| — |
|
|
| — |
|
|
| — |
|
|
| 15,400 |
|
|
| 421,498 |
|
Michael J. Indiveri |
| Annual Incentive Plan (1) |
| 2/20/2014 |
|
| 60,000 |
|
|
| 120,000 |
|
|
| 180,000 |
|
|
|
|
|
|
|
|
|
|
| LTIP (2) |
| 2/20/2014 |
|
| — |
|
|
| 105,000 |
|
|
| — |
|
|
|
|
|
|
|
|
|
|
| Restricted Stock Awards (3) |
| 2/20/2014 |
|
| — |
|
|
| — |
|
|
| — |
|
|
| 1,290 |
|
|
| 23,349 |
|
|
| Restricted Stock Units (3) |
| 2/20/2014 |
|
| — |
|
|
| — |
|
|
| — |
|
|
| 4,189 |
|
|
| 75,821 |
|
James J. Landy |
| Annual Incentive Plan (1) |
| 2/20/2014 |
|
| 55,000 |
|
|
| 110,000 |
|
|
| 165,000 |
|
|
|
|
|
|
|
|
|
|
| LTIP (2) |
| 2/20/2014 |
|
| — |
|
|
| 96,250 |
|
|
| — |
|
|
|
|
|
|
|
|
|
|
| Restricted Stock Awards (3) |
| 2/20/2014 |
|
| — |
|
|
| — |
|
|
| — |
|
|
| 4,402 |
|
|
| 120,483 |
|
|
| Restricted Stock Units (3) |
| 2/20/2014 |
|
| — |
|
|
| — |
|
|
| — |
|
|
| 1,745 |
|
|
| 47,761 |
|
James P. Blose |
| Annual Incentive Plan (1) |
| 2/20/2014 |
|
| 60,000 |
|
|
| 120,000 |
|
|
| 180,000 |
|
|
|
|
|
|
|
|
|
|
| LTIP (2) |
| 2/20/2014 |
|
| — |
|
|
| 105,000 |
|
|
| — |
|
|
|
|
|
|
|
|
|
|
| Restricted Stock Awards (3) |
| 2/20/2014 |
|
| — |
|
|
| — |
|
|
| — |
|
|
| 2,900 |
|
|
| 52,490 |
|
|
| Restricted Stock Units (3) |
| 2/20/2014 |
|
| — |
|
|
| — |
|
|
| — |
|
|
| 2,900 |
|
|
| 52,490 |
|
|
| Modified Restricted Stock Awards (4) |
| 12/30/2014 |
|
| — |
|
|
| — |
|
|
| — |
|
|
| 6,000 |
|
|
| 164,220 |
|
Scott J. Skorobohaty |
| Restricted Stock Awards |
| 7/7/2014 |
|
| — |
|
|
| — |
|
|
| — |
|
|
| 5,426 |
|
|
| 100,000 |
|
|
| Restricted Stock Awards |
| 12/31/2014 |
|
| — |
|
|
| — |
|
|
| — |
|
|
| 3,650 |
|
|
| 100,010 |
|
(1) Represents the threshold, target and maximum cash awards that could be awarded under the Annual Incentive Plan during the 2014 performance period. Actual amounts were paid at target level on December 30, 2014.
125
(2) Represents the target amount that could be awarded under the LTIP during the 2014 performance period. 50% of such amount was awarded as time-based restricted stock awards and 50% of such amount was awarded as performance-based restricted stock units. Such awards for Messrs. Brown, Indiveri, Landy and Blose became vested on December 30, 2014.
(3) Represents equity awards granted under the LTIP attributable to the 2013 performance period. Such awards for Messrs. Brown and Landy were modified with accelerated vesting and payment of the awards occurring on December 30, 2014.
(4) Represents restricted stock awards and units that were modified with accelerated vesting and payment of the awards occurring on December 30, 2014 with respect to stock awards granted prior to January 1, 2014.
(5) The grant date value equaled the fair market value of the Company’s stock on the date of grant. However, the awards granted to Messrs. Brown and Landy on March 14, 2014, and February 20, 2014, respectively, have a grant date fair value equal to $27.37, which was the fair market value of the Company’s stock on the December 30, 2014 vesting date of the awards.
OUTSTANDING EQUITY AWARDS AT FISCAL YEAR END
The following table sets forth information on outstanding stock options and unvested restricted stock awards held by the Named Executive Officers at December 31, 2014, including the number of shares underlying both exercisable and unexercisable portions of each stock option as well as the exercise price and the expiration date of each outstanding option.
| Option Awards1 |
|
| Stock Awards |
| |||||||||||||||||||||||||||
|
| Number of securities underlying unexercised options exercisable |
|
| Number of securities underlying unexercised options unexercisable |
|
| Option exercise price |
|
| Option |
|
| Number of shares or units of stock that have not vested |
|
| Market value of shares or units of stock that have not vested |
|
| Equity incentive plan awards: number of unearned shares, units or other rights that have not vested |
|
| Equity incentive plan awards: market or payout value of unearned shares, units or other rights that have not vested |
| ||||||||
Name |
| (#)1 |
|
| (#)1 |
|
| ($)2 |
|
| date |
|
| (#) |
|
| ($) |
|
| (#) |
|
| ($) |
| ||||||||
Stephen R. Brown |
|
| 6,868 |
|
|
| — |
|
| $ | 23.727 |
|
|
| 1/1/2016 |
|
|
| — |
|
|
| — |
|
|
| — |
|
|
| — |
|
|
|
|
|
|
|
|
|
|
|
|
|
|
|
|
|
|
|
|
|
|
|
|
|
|
|
|
|
|
|
|
| |
Michael J. Indiveri |
|
|
|
|
|
|
|
|
|
|
|
|
|
|
|
|
|
| 1,290 | 3 |
|
| 35,036 |
|
|
| 1,289 | 4 |
|
| 35,008 |
|
|
|
|
|
|
|
|
|
|
|
|
|
|
|
|
|
|
| 3,000 | 5 |
|
| 81,480 |
|
|
| 2,900 | 4 |
|
| 78,764 |
| |
James J. Landy |
|
|
|
|
|
|
|
|
|
|
|
|
|
|
|
|
|
| — |
|
|
| — |
|
|
| — |
|
|
| — |
|
|
|
|
|
|
|
|
|
|
|
|
|
|
|
|
|
|
|
|
|
|
|
|
|
|
|
|
|
|
|
|
| |
James P. Blose |
|
| 1,325 |
|
|
| — |
|
| $ | 26.462 |
|
|
| 10/2/2016 |
|
|
| 2,900 | 3 |
|
| 78,764 |
|
|
| 2,900 | 4 |
|
| 78,764 |
|
|
| 2,172 |
|
|
| — |
|
| $ | 35.273 |
|
|
| 10/17/2017 |
|
|
|
|
|
|
|
|
|
|
|
|
|
|
|
|
| |
Scott J. Skorobohaty |
|
|
|
|
|
|
|
|
|
|
|
|
|
|
|
|
|
| 3,650 | 6 |
|
| 99,134 |
|
|
| — |
|
|
| — |
|
|
|
|
|
|
|
|
|
|
|
|
|
|
|
|
|
|
|
|
|
|
|
|
|
|
|
|
|
|
|
|
| |
1 | The number of shares underlying the options were adjusted to reflect 10% stock dividends annually in the six year period ended December 31, 2011as applicable. Awards vested in 20% increments on the anniversary of the respective grant dates. |
2 | The option grant price has been adjusted to reflect the allocation of the 10% stock dividends described in footnote 1. |
3 | Restricted stock awards vest on the anniversary of the grant date at a rate of 20% for each of year one and year two, and at a rate of 30% for each of years three and four. |
4 | Performance stock units which cliff-vest on the third anniversary of the grant date upon achievement of certain board approved performance goals. |
5 | Restricted stock awards vest on the anniversary of the grant date at a rate of 33.3% for each of year one, two and three. |
6 | Restricted stock award which vests in full on the third anniversary of the grant date. |
OPTION EXERCISES AND STOCK VESTED in Fiscal 2014
| Option Awards |
|
| Stock Awards |
| |||||||||||
Name |
| Number of Shares Acquired on Exercise |
|
| Value Realized on Exercise1 |
|
| Number of Shares Acquired on Vesting |
|
| Value Realized |
| ||||
Stephen R. Brown |
|
| 3,777 |
|
| $ | 27,468 |
|
|
| 55,509 |
|
| $ | 1,477,679 |
|
Michael J. Indiveri |
|
| — |
|
|
| — |
|
|
| 4,586 |
|
|
| 118,589 |
|
James J. Landy |
|
| 21,606 |
|
|
| 61,520 |
|
|
| 9,663 |
|
|
| 264,476 |
|
James P. Blose |
|
| — |
|
|
| — |
|
|
| 11,336 |
|
|
| 306,876 |
|
Scott J. Skorobohaty |
|
| — |
|
|
| — |
|
|
| 5,426 |
|
|
| 148,672 |
|
126
1 | The value realized represents the difference between the fair market price of underlying securities on the day of exercise and the exercise price of the options. |
PENSION BENEFITS
The Company makes available to its Named Executive Officers a qualified 401(k) and profit sharing retirement plan, which is available to all employees on the same terms and conditions.
The Company provides supplemental retirement benefits to certain Named Executive Officers and other officers. These benefits are provided through both the 1995 Supplemental Retirement Plan and the 1997 Supplemental Retirement Plan (collectively the “SERP”). These plans are not qualified for tax purposes and are available only to certain officers. Benefits under these plans are unfunded. The SERP entitles participating officers to receive supplemental retirement benefits for a period of 15 years payable on a monthly basis.
Mr. Brown is the only Named Executive Officer who is a participant in the 1997 Supplemental Retirement Plan.
Pursuant to the 1995 Supplemental Retirement Plan, supplemental benefits equal 75% of the participant’s highest base salary in any of the last three years of employment, less any retirement plan benefits provided to him by the Company. Pursuant to the 1997 Supplemental Retirement Plan, supplemental benefits equal 65% of the average of the highest five years’ annual salary paid to the participant during his last 10 years of employment, reduced by (1) the value of his qualified plan account as of the date of retirement; (2) the value of his 401(k) matching benefit as of the date of retirement; (3) 50% of his primary social security benefit; and (4) the value of any other retirement type benefits provided to him by the Company. Messrs. Landy and Brown have a $400,000 salary cap for determination of their benefits under the SERP.
Pursuant to the SERP, the participants receive supplemental retirement benefits determined as described under Supplemental Employee Retirement Plan on page 119. Under the SERP the normal retirement date is defined as follows: for Messrs. Landy and Brown anytime between the attainment of age 60 and age 70 with a minimum of 20 years of service. Mr. Landy became eligible to receive his SERP benefit on January 1, 2015. No benefits vest to the participant prior to the normal retirement date except at death or disability as defined in the SERP. Certain benefits may be received based upon a change in control as described in “Potential SERP Payments upon Termination or Change in Control” on page 128. The SERP does not provide for early retirement nor for the crediting of extra years of service. The Company believes providing this benefit is important to remain competitive with companies within the industry, to provide a competitive level of retirement income, and to help assure orderly management succession by encouraging continued employment.
127
PENSION BENEFITS IN FISCAL 2014
Name |
| Plan Name |
| Number of Years Credited Service1 |
| Present Value of Accumulated Benefit2 |
Stephen R. Brown |
| 1997 Supplemental Retirement Plan |
| 21 |
| $ 1,888,394 |
James J. Landy |
| 1995 Supplemental Retirement Plan |
| 37 |
| 3,130,825 |
James P. Blose |
|
|
| — |
| — |
Michael J. Indiveri |
|
|
| — |
| — |
Scott J. Skorobohaty |
|
|
| — |
| — |
1 | Under the terms of the 1995 and 1997 Supplemental Retirement Plans, a participant must have 10 years credited service for pension benefit eligibility. |
2 | The amount shown represents the actuarial accumulated pension benefit using the same assumptions used for financial reporting purposes in our 2014 Annual Report. Retirement age is assumed to be the normal retirement date as defined in each plan. A complete description of the 1995 and 1997 Supplemental Retirement Plans is included in Note 13 of the Notes to the Consolidated Financial Statements in the Company’s 2014 Annual Report. |
Potential SERP Payments upon Termination or Change in Control
Under the SERP, the participant’s age is accelerated upon a change in control, including a merger, consolidation or sale of substantially all of the Company’s assets. Following a change of control, each participant with at least 10 years of service, for purposes of the SERP, will be deemed to be the greater of age 60 or the participant’s actual age. Should the participant be terminated without cause subsequent to such transaction, the participant will be entitled to receive the full retirement benefit, as follows:
Age at Termination | Number of Years Service | Non Forfeiture Benefit |
55 | 10 or more | 50% |
56 | 11 or more | 60% |
57 | 12 or more | 70% |
58 | 13 or more | 80% |
59 | 14 or more | 90% |
60 | 15 or more | 100% |
Should a change in control have occurred as of December 31, 2014 and the participant had been terminated without cause as of that date, the participant would have been entitled to benefits under the SERP as follows:
Name |
| As at December 31, 2014 | ||||
| Age deemed under the SERP |
| Number of Years Service |
| Present Value of Benefit 1 | |
|
|
| ||||
Stephen R. Brown |
| 60 |
| 21 |
| 2,673,564 |
1 | The amount shown represents the present value of benefits paid monthly for 15 years as determined under the SERP resulting from an assumed change in control as of December 31, 2014. |
Potential SERP Payments Due to Death or Disability
The participants in the SERP (or their designated beneficiaries), are entitled to certain benefits upon death or disability (as defined in the SERP). These benefits entitle the Named Executive Officer (or their designated beneficiaries) to the same retirement benefits under the SERP to which the participant would be entitled at the normal retirement date.
Compensation Committee Interlocks and Insider Participation
Messrs. Cahill, Holcombe, Ifshin, Thompson and Whiston, all of whom are independent directors, served on the Compensation and Organization Committee, in 2014. Mr. Thompson is the only shareholder and officer of a firm that has performed services for the Company. The Bank has made loans to Messrs. Holcombe, Ifshin and Thompson. See “Certain Relationships and
128
Related Transactions,” which begins on page 132. No executive officer of the Company has served as a director or a member of a compensation committee of another company of which any member of the Committee is an executive officer.
DIRECTOR COMPENSATION
The Company uses a combination of cash and stock-based incentive compensation to attract and retain qualified individuals to serve on the Board. In setting director compensation, the Company considers the significant amount of time that Directors expend in fulfilling their duties to the Company, the business which they refer, as well as the skill-level required by the Company of members of the Board. Employee directors do not receive Directors fees. The Compensation Committee reviews and approves all forms of compensation to the Company’s non-employee directors, including the Executive Chairman of the Board.
Compensation Paid to Board Members
Members of the Board who are not employees of the Company are entitled to receive an annual cash retainer of $75,000 for Board membership. The Audit Committee Chairman and the Compensation Committee Chairman receive an additional fee of $25,000 per year. The Lead Independent Director receives an additional fee of $40,000 per year. Committee Chairmen of various Bank Board Committees also receive Chairman Fees of $10,000 for Board Committee they Chair. The Director Liaison with the Business Development Board Mr. Thompson received an additional annual retainer of $12,500. Directors receive additional compensation of $3,500 when participating in more than two committees.
These retainer fees were approved by the Board in December 2013 and made effective January 1, 2014. Non-employee directors may elect to receive up to 100% of their retainer fees in the Company’s common stock. The Company permits directors to defer all or any portion of their retainer fees. On each of February 6, 2014 and 2015, each independent director received a grant of 1,000 Restricted Stock Awards. The awards vest on the one year anniversary of the grant date.
Directors who are not full-time employees of the Company or its subsidiaries participate in the Directors’ Retirement Plan. This plan is designed to benefit all non-employee directors who serve two or more years as a director. Benefits are paid upon a director’s retirement or resignation. The amount to be paid shall be the highest Basic Fee (as defined) paid to the director in any one of the three prior years to the directors’ retirement. Benefits are payable for a period of up to 10 years after resignation or retirement, depending on the number of years of service as a director. Benefits under the plan are not funded.
The following vesting schedule determines the annual benefit to directors:
Number of Years as a Director | Percentage of Director’s Fees Payable at Retirement Age |
Less than 2 years | 0% |
2 years but less than 3 | 5.0% |
3 years but less than 4 | 10.0% |
4 years but less than 5 | 17.5% |
5 years but less than 6 | 25.0% |
6 years but less than 7 | 32.5% |
7 years but less than 8 | 40.0% |
8 years but less than 9 | 47.5% |
9 years but less than 10 | 55.0% |
10 years but less than 11 | 62.5% |
11 years but less than 12 | 70.0% |
12 years but less than 13 | 77.5% |
13 years but less than 14 | 85.0% |
14 years but less than 15 | 92.5% |
15 years or more | 100% |
Effective December 31, 2008, the Board of Directors suspended the Director’s Retirement Plan. Benefits under the Plan were determined as though the non-employee director had retired or resigned from the Board of Directors at December 31, 2008. Based upon this change to the Plan, annual benefits to each of the non-employee directors upon their retirement or resignation from the Board of Directors under the Directors’ Retirement Plan are: $38,500 to Mr. Holcombe and, $74,000 to Mr. Thompson. Ms. Foster and Messrs. Cahill, Ifshin, Schenk, Lindenbaum and Whiston were either not on the Board or had less than two years of service as directors at December 31, 2008, and therefore are not entitled to receive annual benefits.
129
Fiscal 2014 Director Compensation Table
The following table discloses the cash, equity awards and other compensation earned, paid or awarded, as the case may be, to each of the Company's non-employee directors during the fiscal year ended December 31, 2014. Messrs. Landy and Brown received no separate compensation for their service as directors and are not included in this table. The compensation received by these individuals as executives of the Company is shown in the Summary Compensation Table on page 123.
|
| Fees Earned or Paid in Cash |
|
| Stock Awards |
|
| Change in 1 Pension Value and Nonqualified Deferred Compensation Earnings |
|
| All Other Compensation |
|
| Total |
| |||||
Name |
| ($) |
|
| ($) |
|
| ($) |
|
| ($) |
|
| ($) |
| |||||
John P. Cahill |
|
| 135,500 |
|
|
| 16,760 |
|
|
| — |
|
| 280 3 |
|
|
| 152,540 |
| |
Mary-Jane Foster |
|
| 83,500 |
|
|
| 16,760 |
|
|
| — |
|
| 280 3 |
|
|
| 100,540 |
| |
Gregory F. Holcombe 2 |
|
| 102,500 |
|
|
| 16,760 |
|
|
| 11,180 |
|
| 280 3 |
|
|
| 130,720 |
| |
Adam W. Ifshin |
|
| 95,500 |
|
|
| 16,760 |
|
|
| — |
|
| 280 3 |
|
|
| 112,540 |
| |
Matthew A. Lindenbaum |
|
| 56,250 |
|
|
| — |
|
|
| — |
|
|
| — |
|
|
| 56,250 |
|
Joseph A. Schenk |
|
| 107,000 |
|
|
| 16,760 |
|
|
| — |
|
| 280 3 |
|
|
| 124,040 |
| |
Craig S. Thompson |
|
| 133,500 |
|
|
| 16,760 |
|
|
| 41,876 |
|
| 280 3 |
|
|
| 192,416 |
| |
William E. Whiston |
|
| 95,500 |
|
|
| 16,760 |
|
|
| — |
|
| 280 3 |
|
|
| 153,592 |
| |
1 | Effective December 31, 2008, the Board of Directors suspended the Directors Retirement Plan. This suspension resulted in a reduction of the projected accumulated pension value. Despite the suspension of the Directors Retirement Plan and the freezing of benefits, the table reflects an increase in Pension Value due to the method of accounting for the accumulated benefit obligation. |
2 | Mr. Holcombe had 15,233 options outstanding at December 31, 2014, all of which were exercisable. |
3 | Cash Dividends on unvested Restricted Stock. |
ITEM 12. SECURITY OWNERSHIP OF CERTAIN BENEFICIAL OWNERS AND MANAGEMENT, AND RELATED STOCKHOLDER MATTERS
The following table sets forth the “beneficial ownership” (as that term is defined in the rules of the SEC) of the common stock as of February 13, 2015, by (a) each Named Executive Officer and member of the Board of Directors, (b) persons known to be a beneficial owner of more than five percent of the common stock and (c) all executive officers and members of the Board of Directors as a group. Persons who hold options that are exercisable within 60 days of February 13, 2015 are deemed to own, beneficially, the shares of common stock that may be acquired on the exercise of such options. Such shares are deemed outstanding for purposes of computing the number of shares owned by the person holding the option, but not for any other purpose. Unless otherwise indicated, the address of each of the individuals named below is: c/o Hudson Valley Holding Corp., 21 Scarsdale Road, Yonkers, New York 10707.
130
| Address |
|
|
| Amount and Nature of Beneficial Ownership |
|
|
| Percent of Outstanding Shares of Common Stock |
| |
Gregory F. Holcombe1 |
| 35 E. Grassy Sprain Road, Yonkers, NY10710 |
|
|
| 2,374,489 | (1) |
|
| 11.8 | % |
Marie A. Holcombe1 |
| 35 E. Grassy Sprain Road, Yonkers, NY10710 |
|
|
| 2,374,489 | (1) |
|
| 11.8 | % |
Matthew Lindebaum |
| 645 Madison Ave. - 10th flr New York, NY10022 |
|
|
| 1,971,074 | (2) |
|
| 9.8 | % |
|
|
|
|
|
|
|
|
|
|
|
|
James J. Landy |
|
|
|
|
| 233,543 | (3) |
|
| 1.2 | % |
Stephen R. Brown |
|
|
|
|
| 155,889 | (4) |
|
| * |
|
John P. Cahill |
|
|
|
|
| 7,720 |
|
|
| * |
|
Mary-Jane Foster |
|
|
|
|
| 6,787 |
|
|
| * |
|
Adam W. Ifshin |
|
|
|
|
| 58,053 |
|
|
| * |
|
Michael J. Indiveri |
|
|
|
|
| 25,951 | (5) |
|
| * |
|
Joseph A. Schenk |
|
|
|
|
| 15,000 |
|
|
| * |
|
Craig S. Thompson |
|
|
|
|
| 198,842 | (6) |
|
| 1.0 | % |
William E. Whiston |
|
|
|
|
| 7,000 |
|
|
|
|
|
James P. Blose |
|
|
|
|
| 16,338 | (7) |
|
| * |
|
Scott J. Skorobohaty |
|
|
|
|
| 3,650 |
|
|
| * |
|
Michael E. Finn |
|
|
|
|
| 19,157 |
|
|
| * |
|
John M. Swadba |
|
|
|
|
| 6,883 |
|
|
| * |
|
All directors and executive officers as a group (16 persons). |
|
|
|
|
| 5,129,486 | (8) |
|
| 25.5 | % |
* Less than 1% of the outstanding shares of common stock.
2 | Matthew A. Lindenbaum, as Managing Member of Basswood Capital Management, LLC, has shared voting and dispositive power over 1,970,074. All of these shares are directly owned by private investment vehicles and separately managed accounts in which Basswood serves as the investment manager or adviser and include (i) 152,774 shares owned by Basswood Opportunity Partners, LP; (ii) 90,629 owned by Basswood Opportunity Fund, Inc.; (iii) 739,423 shares held by Basswood Enhanced Long Short Fund, LP; (iv) 730,756 shares owned by Main Street Master, Ltd.; (v) 81,181 shares owned by Basswood Financial Fund, LP; (vi) 107,529 shares owned by Basswood Financial Fund, Inc.; (vii) 54,655 shares owned by Basswood Financial Long Only Fund, LP; and (viii) 13,127 shares held in a separately managed account for a non-affiliated client of Basswood. Mr. Lindenbaum individually holds 1,000 which are not included with the Basswood Capital Management, LLC, shares. |
3 | Includes 93,577 shares pledged as collateral. |
4 | Includes 6,868 of vested and exercisable stock options. |
5 | Includes 7,325 shares held by The Indiveri Group, LLC, an entity owned 50% by Mr. Indiveri and 50% by his spouse. |
6 | Includes 142,275 shares pledged as collateral. |
7 | Includes 3,497 shares which may be acquired upon the exercise of options. |
8 | Includes 30,724 shares which may be acquired upon the exercise of options. |
131
As of February 13, 2015 other than as listed in the “Security Ownership of Certain Beneficial Owners and Management” table above, no person was known by the Company to be the beneficial owner of more than 5% of the outstanding shares of the Company’s common shares, except as follows:
Name and Address of Beneficial Owner |
|
| Amount and |
|
|
| Percent of Outstanding Shares of Common Stock |
|
Basswood Capital Management, LLC 1 645 Madison Avenue, New York NY 10022 |
|
| 1,970,074 | 1 |
|
| 9.83 | % |
1 | This information is based on a Schedule 13D/A filed by Basswood Capital Management, LLC (“Basswood”) on March 27, 2014. Basswood, of which Matthew A. Lindenbaum is the Managing Member and member of the Board of Directors, may be deemed to beneficially own 1,970,074 shares which are directly owned by certain entities affiliated with Basswood (the “Funds”) by virtue of the authority granted to it as investment manager or advisor of the Funds to vote and dispose of the securities held by the Funds. |
ITEM 13. CERTAIN RELATIONSHIPS AND RELATED TRANSACTIONS, AND DIRECTOR INDEPENDENCE
Loans to Officers, Directors and 5% Shareholders
The Bank makes loans to the Company’s executive officers, directors and 5% Shareholders, and immediate family members or businesses with which they are associated, in the ordinary course of business. Such loans are made on substantially the same terms and conditions, including interest rate and collateral, as those prevailing at the same time for comparable transactions with other persons not related to the lender. None of the loans involves more than the normal risk of collectability or presents other unfavorable features. The aggregate amount outstanding for all such loans was $32,852,898 at December 31, 2014. (This aggregate amount reflects the full amount outstanding, portions of which are participated to other banks).
Certain Other Related Party Transactions
Mr. Thompson, a director of the Company, is the President and principal shareholder of Thompson Pension Employee Plans, Inc., which has written life insurance policies supporting the Company’s obligations under the supplemental retirement plans for executive officers. The total annual premiums approximated $255,940 in 2014. The commissions earned by Thompson Pension Employee Plans, Inc. during 2014 on these policies were de minimus due to the age of the policies and the commission structure.
Mr. Schenk, a director of the Company, is also a director of Duff & Phelps which has provided valuation services to the Company. The Company paid Duff & Phelps $52,750 in 2014.
Policies Regarding Transactions with Related Persons
The Board of Directors has established and annually approves a written policy governing transactions with related persons. The Company, in the normal course of business, retains the services of various product and service providers. It is our policy to purchase appropriate and necessary products and services at competitive prices and with service quality appropriate to meet our needs. We desire to do business, whenever possible, with those individuals and businesses that are customers of ours, including related persons, provided that such business transactions are concluded on an arms’ length basis and comply with applicable law regarding such transactions.
In selecting a service or product provider, the Company considers various criteria, including:
· | whether the provider is a customer of the Company, |
· | whether the provider has previously supplied the Company with goods or services, |
· | the provider’s knowledge of the Company and our needs specific to the product or service to be rendered, |
· | the provider’s qualifications, reputation and capability, and |
· | the total cost of the product or service to be provided. |
The Company expects that products or services provided by related persons will be of at least the same quality and competitively priced with those available from non-related persons, including consideration of the items listed above. The Company takes reasonable and appropriate steps to evaluate the pricing, quality and capability of product and service providers, including related persons.
132
Corporate Governance
Under the New York Stock Exchange (“NYSE”) independence standards, the Board of Directors has affirmatively determined that Ms. Foster and Messrs. Cahill, Holcombe, Ifshin, Lindenbaum, Schenk, Thompson and Whiston meet the standards of independence for board members. The Board of Directors considered the banking relationships that exist between the Bank and Ms. Foster and Messrs. Cahill, Ifshin, Holcombe, Schenk, Thompson and Whiston in determining each director’s independence. Since these banking products and services are provided in the normal course of business and are available on the same basis as to customers in general, the Board of Directors concluded that these relationships do not affect the directors’ independence. The Board of Directors also concluded that the transactions disclosed above do not affect the directors’ independence.
ITEM 14. PRINCIPAL ACCOUNTANT FEES AND SERVICES
The table below provides the aggregate fees paid or accrued by the Company to its independent registered public accounting firms KPMG LLP (“KPMG”) for the year ended December 31, 2014, and Crowe Horwath LLP (“Crowe”) for the year ended December 31, 2013.
| 2014 KPMG |
| 2013 Crowe |
Integrated Audit Fees1 | $ 518,000 |
| $ 410,622 |
Tax fees2 | — |
| 81,935 |
All other fees3 | 45,000 |
| 42,500 |
Total | $ 563,000 |
| $ 535,057 |
1Includes audit of financial statements and audit of internal controls over financial reporting and other related matters | ||||
2Tax fees |
| 2014 KPMG |
| 2013 Crowe |
Tax return preparation and review |
| $ — |
| $ 71,935 |
Tax consulting – tax research |
| — |
| — |
Tax consulting – IRS audit assistance |
|
|
| 10,000 |
|
| $ — |
| $ 81,935 |
|
|
|
|
|
3All other fees |
| 2014 KPMG |
| 2013 Crowe |
The Company paid fees in connection with the Merger. |
| $ 35,000 |
| — |
The Company paid consulting fees with regard to the sale of A.R. Schmeidler & Co., Inc. |
| 10,000 |
| — |
The Company paid fees relating to the renewal of captive insurance company in 2013 and 2014. |
| — |
| $ 7,500 |
The Company paid consulting fees with regard to the tax effect of restructuring of A.R. Schmeidler & Co., Inc. |
| — |
| 35,000 |
|
| $ 45,000 |
| $ 42,500 |
Pre-Approval Policies
In accordance with the procedures set forth in its charter, the Committee approves in advance all audit services and permitted non-audit services (including the fees and terms of those services) to be performed for the Company by its independent registered public accounting firm. All services must be submitted to the Committee for approval in writing, generally in the form of an engagement letter, which outlines the services to be performed and the associated fees. All of the fees and services described above were pre-approved by the Committee.
133
PART IV
ITEM 15. EXHIBITS AND FINANCIAL STATEMENT SCHEDULES
1. Financial Statements:
The following financial statements of the Company are included in this document in Item 8 — Financial Statements and Supplementary Data:
● | Report of Independent Registered Public Accounting Firm |
● | Consolidated Statements of Income for the Years Ended December 31, 2014, 2013 and 2012 |
● | Consolidated Statements of Comprehensive Income (Loss) for the Years Ended December 31, 2014, 2013 and 2012 |
● | Consolidated Balance Sheets at December 31, 2014 and 2013 |
● | Consolidated Statements of Changes in Stockholders’ Equity for the Years Ended December 31, 2014, 2013 and 2012 |
● | Consolidated Statements of Cash Flows for the Years Ended December 31, 2014, 2013 and 2012 |
● | Notes to Consolidated Financial Statements |
2. Financial Statement Schedules:
Financial Statement Schedules have been omitted because they are not applicable or the required information is shown elsewhere in the document in the Financial Statements or Notes thereto, or in “Management’s Discussion and Analysis of Financial Condition and Results of Operations.”
3. Exhibits Required by Securities and Exchange Commission Regulation S-K:
Number |
| Exhibit Title |
2.1 |
|
Agreement and Plan of Merger, dated as of November 4, 2014, by and between Sterling Bancorp and Hudson Valley Holding Corp. (7) |
3.1 |
|
Restated Certificate of Incorporation of Hudson Valley Holding Corp. (2) |
3.2 |
|
Amended and Restated By-Laws of Hudson Valley Holding Corp. (3) |
4.1 |
|
Specimen of Common Stock Certificate (1) |
10.1 |
|
Hudson Valley Bank Amended and Restated Directors Retirement Plan Effective December 31, 2008* (6) |
10.2 |
|
Hudson Valley Bank Restated and Amended Supplemental Retirement Plan of 1995* (1) |
10.3 |
|
Form of Amendment No. 1 to Hudson Valley Bank Restated and Amended Supplemental Retirement Plan of 1995* (5) |
10.4 |
|
Hudson Valley Bank Supplemental Retirement Plan of 1997* (1) |
10.5 |
|
Form of Amendment No. 1 to Hudson Valley Bank Supplemental Retirement Plan of 1997* (5) |
10.5 |
|
Form of Amendment No. 2 to Hudson Valley Bank Supplemental Retirement Plan of 1995 and 1997* (5) |
10.7 |
|
Form of Amendment No. 3 to Hudson Valley Bank Supplemental Retirement Plan of 1995 and 1997* (5) |
10.8 |
|
Amended and Restated 2002 Stock Option Plan* (4) |
10.9 |
|
Specimen Non-Statutory Stock Option Agreement* (1) |
10.10 |
|
Specimen Incentive Stock Option Agreement* (6) |
10.11 |
|
Specimen Restricted Stock Award Agreement* (8) |
10.12 |
|
Hudson Valley Holding Corp. 2010 Omnibus Incentive Plan, as amended February 28, 2012* (6) |
10.13 |
|
Hudson Valley Holding Corp. 2010 Omnibus Incentive Plan: Form of agreement with regard to restricted stock awards to directors* (6) |
134
Number |
| Exhibit Title |
10.14 |
|
Hudson Valley Holding Corp. 2010 Omnibus Incentive Plan: Form of agreement with regard to restricted stock awards to employees* (6) |
10.15 |
|
Hudson Valley Holding Corp. 2010 Omnibus Incentive Plan: Form of agreement with regard to restricted stock awards to consultants and advisors* (6) |
10.16 |
|
Form of Amendment No. 1 to Hudson Valley Bank Amended and Restated Directors Retirement Plan* (10) |
10.17 |
|
Supplemental Deferred Compensation Agreement* (10) |
10.18 |
|
Form of Amendment No. 1 to the Supplemental Deferred Compensation Agreement* (10) |
10.19 |
|
Consulting Agreement, dated October 6, 2014, between Hudson Valley Bank, N.A. and James J. Landy* (8) |
10.20 |
|
Amendment to the Hudson Valley Bank Supplemental Retirement Plan of 1995, dated October 7, 2014, between Hudson Valley Bank, N.A. and Vincent T. Palaia* (8) |
10.21 |
|
Amendment to the Hudson Valley Bank Supplemental Retirement Plan of 1995, dated October 6, 2014, between Hudson Valley Bank, N.A. and James J. Landy* (8) |
10.22 |
|
Third Amendment to the Hudson Valley Bank Supplemental Retirement Plan of 1997, dated October 7, 2014, between Hudson Valley Bank, N.A. and Stephen R. Brown* (8) |
10.23 |
|
Hudson Valley Holding Corp. 2010 Omnibus Incentive Plan: Employee Performance-Based Restricted Stock Unit Award Agreement* (9) |
10.24 |
|
Change in Control Agreement, dated April 10, 2014, between Hudson Valley Bank, N.A. and Stephen R. Brown* (9) |
10.25 |
|
Change in Control Agreement, dated April 10, 2014, between Hudson Valley Bank, N.A. and Michael J. Indiveri* (9) |
10.26 |
|
Change in Control Agreement, dated April 10, 2014, between Hudson Valley Bank, N.A. and James P. Blose* (9) |
10.27 |
|
Change in Control Agreement, dated April 10, 2014, between Hudson Valley Bank, N.A. and Michael E. Finn* (9) |
10.28 |
|
Change in Control Agreement, dated April 10, 2014, between Hudson Valley Bank, N.A. and John M. Swadba* (9) |
10.29 |
|
Change in Control Agreement, dated April 10, 2014, between Hudson Valley Bank, N.A. and Scott J. Skorobohaty* (9) |
21 |
|
Subsidiaries of the Company (10) |
23.1 |
|
Consent of KPMG LLP (10) |
23.2 |
|
Consent of Crowe Horwath LLP (10) |
31.1 |
|
Certification of Chief Executive Officer Pursuant to Section 302 of the Sarbanes-Oxley Act of 2002 (10) |
31.2 |
|
Certification of Chief Financial Officer Pursuant to Section 302 of the Sarbanes-Oxley Act of 2002 (10) |
32.1 |
|
Certification of Chief Executive Officer Pursuant to 18 U.S.C. Section 1350, as Adopted Pursuant to Section 906 of the Sarbanes-Oxley Act of 2002 (10) |
32.2 |
|
Certification of Chief Financial Officer Pursuant to 18 U.S.C. Section 1350, as Adopted Pursuant to Section 906 of the Sarbanes-Oxley Act of 2002 (10) |
101.INS |
|
XBRL Instance Document (10) |
101.SCH |
|
XBRL Taxonomy Extension Schema (10) |
101.CAL |
|
XBRL Taxonomy Extension Calculation Linkbase (10) |
101.LAB |
|
XBRL Taxonomy Extension Label Linkbase (10) |
101.PRE |
|
XBRL Taxonomy Extension Presentation Linkbase (10) |
101.DEF |
|
XBRL Taxonomy Extension Definition Linkbase (10) |
135
|
* | Management contract and compensatory plan or arrangement |
(1) | Incorporated herein by reference in this document to the Form 10-K filed on March 15, 2007 (SEC File No. 000-30525) |
(2) | Incorporated herein by reference in this document to the Form 10-Q filed on October 20, 2009 (SEC File No. 001-34453) |
(3) | Incorporated herein by reference in this document to the Form 8-K filed on April 28, 2010 (SEC File No. 001-34453) |
(4) | Incorporated herein by reference in this document to the Form 10-K filed on March 16, 2009 (SEC File No. 000-30525) |
(5) | Incorporated herein by reference in this document to the Form 10-K filed on March 16, 2010 (SEC File No. 001-34453) |
(6) | Incorporated herein by reference in this document to the Form 10-K filed on March 15, 2012 (SEC File No. 001-34453) |
(7) | Incorporated herein by reference in this document to the Form 8-K filed on November 7, 2014 (SEC File No. 001-34453) |
(8) | Incorporated herein by reference in this document to the Form 8-K filed on October 10, 2014 (SEC File No. 001-34453) |
(9) | Incorporated herein by reference in this document to the Form 10-Q filed on August 6, 2014 (SEC File No. 001-34453) |
(10) | Filed herewith |
136
Pursuant to the requirements of Section 13 or 15(d) of the Securities Exchange Act of 1934, the Registrant has duly caused this report to be signed on its behalf by the undersigned, thereunto duly authorized.
|
| HUDSON VALLEY HOLDING CORP. | ||
March 13, 2015 |
|
By: |
|
/S/ MICHAEL J. INDIVERI |
|
|
|
| Michael J. Indiveri |
|
|
|
| Executive Vice President, Chief Financial Officer |
Pursuant to the requirements of the Securities Exchange Act of 1934, this report has been signed below on March 13, 2015 by the following persons on behalf of the Registrant and in the capacities and on the dates indicated.
/S/ STEPHEN R. BROWN |
|
|
Stephen R. Brown |
|
|
President, Chief Executive Officer and Director |
|
|
/S/ JAMES J. LANDY |
|
|
James J. Landy |
|
|
Executive Chairman of the Board and Director |
|
|
/S/ JOHN P. CAHILL |
|
|
John P. Cahill |
|
|
Director |
|
|
/S/ MARY JANE FOSTER |
|
|
Mary Jane Foster |
|
|
Director |
|
|
/S/ GREGORY F. HOLCOMBE |
|
|
Gregory F. Holcombe |
|
|
Director |
|
|
/S/ ADAM IFSHIN |
|
|
Adam Ifshin |
|
|
Director |
|
|
/S/ MATTHEW A. LINDENBAUM |
|
|
Matthew A. Lindenbaum Director
/S/ JOSEPH A. SCHENK |
|
|
Joseph A. Schenk |
|
|
Director |
|
|
/S/ CRAIG S. THOMPSON |
|
|
Craig S. Thompson |
|
|
Director |
|
|
/S/ WILLIAM E. WHISTON |
|
|
William E. Whiston |
|
|
Director |
|
|
137