UNITED STATES
SECURITIES AND EXCHANGE COMMISSION
Washington, D.C. 20549
FORM N-CSR
CERTIFIED SHAREHOLDER REPORT OF REGISTERED
MANAGEMENT INVESTMENT COMPANIES
Investment Company Act file number 811-3785
Fidelity Advisor Series I
(Exact name of registrant as specified in charter)
245 Summer St., Boston, MA 02210
(Address of principal executive offices) (Zip code)
Marc Bryant, Secretary
245 Summer St.
Boston, Massachusetts 02210
(Name and address of agent for service)
Registrant's telephone number, including area code:
617-563-7000
Date of fiscal year end: | November 30 |
Date of reporting period: | May 31, 2017 |
Item 1.
Reports to Stockholders
Fidelity Advisor® Dividend Growth Fund Semi-Annual Report May 31, 2017 |
 |
Contents
To view a fund's proxy voting guidelines and proxy voting record for the 12-month period ended June 30, visit http://www.fidelity.com/proxyvotingresults or visit the Securities and Exchange Commission's (SEC) web site at http://www.sec.gov.
You may also call 1-877-208-0098 to request a free copy of the proxy voting guidelines.
Standard & Poor's, S&P and S&P 500 are registered service marks of The McGraw-Hill Companies, Inc. and have been licensed for use by Fidelity Distributors Corporation.
Other third-party marks appearing herein are the property of their respective owners.
All other marks appearing herein are registered or unregistered trademarks or service marks of FMR LLC or an affiliated company. © 2017 FMR LLC. All rights reserved.
This report and the financial statements contained herein are submitted for the general information of the shareholders of the Fund. This report is not authorized for distribution to prospective investors in the Fund unless preceded or accompanied by an effective prospectus.
A fund files its complete schedule of portfolio holdings with the SEC for the first and third quarters of each fiscal year on Form N-Q. Forms N-Q are available on the SEC’s web site at http://www.sec.gov. A fund's Forms N-Q may be reviewed and copied at the SEC’s Public Reference Room in Washington, DC. Information regarding the operation of the SEC's Public Reference Room may be obtained by calling 1-800-SEC-0330.
For a complete list of a fund's portfolio holdings, view the most recent holdings listing, semiannual report, or annual report on Fidelity's web site at http://www.fidelity.com, http://www.institutional.fidelity.com, or http://www.401k.com, as applicable.
NOT FDIC INSURED •MAY LOSE VALUE •NO BANK GUARANTEE
Neither the Fund nor Fidelity Distributors Corporation is a bank.
Investment Summary (Unaudited)
Top Ten Stocks as of May 31, 2017
| % of fund's net assets | % of fund's net assets 6 months ago | |
| Apple, Inc. | 5.3 | 3.6 |
| Alphabet, Inc. Class C | 3.9 | 2.8 |
| Microsoft Corp. | 3.4 | 3.4 |
| Johnson & Johnson | 3.2 | 3.0 |
| JPMorgan Chase & Co. | 2.5 | 2.7 |
| Bank of America Corp. | 2.3 | 2.9 |
| Wells Fargo & Co. | 2.3 | 3.0 |
| Chevron Corp. | 2.2 | 2.5 |
| Exxon Mobil Corp. | 2.2 | 2.6 |
| Citigroup, Inc. | 2.1 | 1.7 |
| 29.4 |
Top Five Market Sectors as of May 31, 2017
| % of fund's net assets | % of fund's net assets 6 months ago | |
| Information Technology | 22.4 | 18.4 |
| Financials | 17.7 | 18.0 |
| Health Care | 11.2 | 10.7 |
| Consumer Staples | 11.1 | 12.4 |
| Industrials | 8.6 | 8.1 |
Asset Allocation (% of fund's net assets)
| As of May 31, 2017* | ||
| Stocks | 94.9% | |
| Convertible Securities | 0.1% | |
| Short-Term Investments and Net Other Assets (Liabilities) | 5.0% | |

* Foreign investments - 11.9%
| As of November 30, 2016* | ||
| Stocks | 94.0% | |
| Convertible Securities | 0.1% | |
| Short-Term Investments and Net Other Assets (Liabilities) | 5.9% | |

* Foreign investments - 12.1%
Investments May 31, 2017 (Unaudited)
Showing Percentage of Net Assets
| Common Stocks - 94.9% | |||
| Shares | Value (000s) | ||
| CONSUMER DISCRETIONARY - 8.1% | |||
| Diversified Consumer Services - 0.1% | |||
| Service Corp. International | 37,800 | $1,205 | |
| Hotels, Restaurants & Leisure - 2.2% | |||
| Cedar Fair LP (depositary unit) | 71,509 | 5,079 | |
| Las Vegas Sands Corp. | 76,500 | 4,523 | |
| McDonald's Corp. | 83,300 | 12,569 | |
| 22,171 | |||
| Internet & Direct Marketing Retail - 0.2% | |||
| Liberty Interactive Corp. QVC Group Series A (a) | 73,000 | 1,713 | |
| Media - 2.6% | |||
| Charter Communications, Inc. Class A (a) | 23,800 | 8,224 | |
| Comcast Corp. Class A | 447,950 | 18,675 | |
| 26,899 | |||
| Multiline Retail - 0.5% | |||
| Dollar General Corp. | 42,400 | 3,112 | |
| Dollar Tree, Inc. (a) | 26,100 | 2,028 | |
| 5,140 | |||
| Specialty Retail - 2.1% | |||
| AutoZone, Inc. (a) | 12,400 | 7,513 | |
| Foot Locker, Inc. | 109,691 | 6,517 | |
| Kingfisher PLC | 4,121 | 17 | |
| L Brands, Inc. | 71,700 | 3,700 | |
| Ross Stores, Inc. | 61,200 | 3,912 | |
| 21,659 | |||
| Textiles, Apparel & Luxury Goods - 0.4% | |||
| VF Corp. | 78,800 | 4,239 | |
| TOTAL CONSUMER DISCRETIONARY | 83,026 | ||
| CONSUMER STAPLES - 11.1% | |||
| Beverages - 5.1% | |||
| Anheuser-Busch InBev SA NV | 29,100 | 3,401 | |
| Constellation Brands, Inc. Class A (sub. vtg.) | 33,300 | 6,086 | |
| Dr. Pepper Snapple Group, Inc. | 70,911 | 6,581 | |
| Molson Coors Brewing Co. Class B | 98,500 | 9,337 | |
| PepsiCo, Inc. | 123,000 | 14,375 | |
| The Coca-Cola Co. | 275,310 | 12,518 | |
| 52,298 | |||
| Food & Staples Retailing - 0.9% | |||
| CVS Health Corp. | 44,300 | 3,404 | |
| Kroger Co. | 188,220 | 5,605 | |
| 9,009 | |||
| Food Products - 0.8% | |||
| Hilton Food Group PLC | 243,744 | 2,390 | |
| Morinaga & Co. Ltd. | 11,900 | 709 | |
| The J.M. Smucker Co. | 13,700 | 1,752 | |
| The Kraft Heinz Co. | 42,400 | 3,909 | |
| 8,760 | |||
| Household Products - 1.9% | |||
| Colgate-Palmolive Co. | 53,600 | 4,093 | |
| Procter & Gamble Co. | 175,388 | 15,450 | |
| 19,543 | |||
| Personal Products - 0.4% | |||
| Coty, Inc. Class A | 242,984 | 4,602 | |
| Tobacco - 2.0% | |||
| British American Tobacco PLC (United Kingdom) | 140,330 | 10,040 | |
| Reynolds American, Inc. | 152,200 | 10,235 | |
| 20,275 | |||
| TOTAL CONSUMER STAPLES | 114,487 | ||
| ENERGY - 8.1% | |||
| Energy Equipment & Services - 0.3% | |||
| Baker Hughes, Inc. | 43,500 | 2,399 | |
| Oil, Gas & Consumable Fuels - 7.8% | |||
| Amyris, Inc. (a) | 99,781 | 26 | |
| Chevron Corp. | 216,890 | 22,444 | |
| ConocoPhillips Co. | 350,600 | 15,668 | |
| Exxon Mobil Corp. | 276,822 | 22,284 | |
| Imperial Oil Ltd. | 196,100 | 5,548 | |
| Kinder Morgan, Inc. | 194,700 | 3,653 | |
| Northern Oil & Gas, Inc. (a)(b) | 128,694 | 212 | |
| PrairieSky Royalty Ltd. (b) | 119,900 | 2,586 | |
| Suncor Energy, Inc. | 257,180 | 8,049 | |
| 80,470 | |||
| TOTAL ENERGY | 82,869 | ||
| FINANCIALS - 17.7% | |||
| Banks - 12.4% | |||
| Bank of America Corp. | 1,063,803 | 23,840 | |
| Citigroup, Inc. | 361,423 | 21,881 | |
| JPMorgan Chase & Co. | 317,493 | 26,082 | |
| PacWest Bancorp | 159,000 | 7,421 | |
| Stock Yards Bancorp, Inc. | 20,700 | 749 | |
| SunTrust Banks, Inc. | 163,100 | 8,705 | |
| U.S. Bancorp | 299,317 | 15,232 | |
| Wells Fargo & Co. | 462,190 | 23,636 | |
| 127,546 | |||
| Capital Markets - 2.6% | |||
| CBOE Holdings, Inc. | 31,500 | 2,721 | |
| Diamond Hill Investment Group, Inc. | 15,100 | 3,054 | |
| MSCI, Inc. | 70,700 | 7,192 | |
| S&P Global, Inc. | 85,467 | 12,206 | |
| TD Ameritrade Holding Corp. | 37,600 | 1,405 | |
| 26,578 | |||
| Consumer Finance - 0.6% | |||
| Capital One Financial Corp. | 83,400 | 6,415 | |
| Imperial Holdings, Inc. warrants 4/11/19 (a) | 4,481 | 0 | |
| 6,415 | |||
| Diversified Financial Services - 1.2% | |||
| Berkshire Hathaway, Inc. Class B (a) | 72,700 | 12,016 | |
| Insurance - 0.9% | |||
| Chubb Ltd. | 63,600 | 9,107 | |
| TOTAL FINANCIALS | 181,662 | ||
| HEALTH CARE - 11.2% | |||
| Biotechnology - 2.1% | |||
| Alexion Pharmaceuticals, Inc. (a) | 32,100 | 3,147 | |
| Amgen, Inc. | 117,037 | 18,169 | |
| 21,316 | |||
| Health Care Equipment & Supplies - 3.1% | |||
| Boston Scientific Corp. (a) | 227,300 | 6,144 | |
| Danaher Corp. | 123,094 | 10,456 | |
| Medtronic PLC | 177,502 | 14,960 | |
| 31,560 | |||
| Health Care Technology - 0.2% | |||
| CompuGroup Medical AG | 43,779 | 2,487 | |
| Pharmaceuticals - 5.8% | |||
| Allergan PLC | 56,900 | 12,731 | |
| Bristol-Myers Squibb Co. | 43,000 | 2,320 | |
| GlaxoSmithKline PLC | 314,127 | 6,876 | |
| Johnson & Johnson | 261,002 | 33,474 | |
| Teva Pharmaceutical Industries Ltd. sponsored ADR | 170,600 | 4,753 | |
| 60,154 | |||
| TOTAL HEALTH CARE | 115,517 | ||
| INDUSTRIALS - 8.6% | |||
| Aerospace & Defense - 1.9% | |||
| BWX Technologies, Inc. | 36,600 | 1,779 | |
| General Dynamics Corp. | 42,900 | 8,719 | |
| United Technologies Corp. | 70,800 | 8,587 | |
| 19,085 | |||
| Commercial Services & Supplies - 0.3% | |||
| Deluxe Corp. | 45,900 | 3,129 | |
| Electrical Equipment - 1.9% | |||
| AMETEK, Inc. | 243,200 | 14,840 | |
| Fortive Corp. | 83,197 | 5,196 | |
| 20,036 | |||
| Industrial Conglomerates - 3.2% | |||
| General Electric Co. | 614,300 | 16,820 | |
| Honeywell International, Inc. | 66,700 | 8,870 | |
| Roper Technologies, Inc. | 29,596 | 6,724 | |
| 32,414 | |||
| Machinery - 0.8% | |||
| Caterpillar, Inc. | 79,200 | 8,350 | |
| Professional Services - 0.1% | |||
| Recruit Holdings Co. Ltd. | 24,800 | 1,314 | |
| Trading Companies & Distributors - 0.4% | |||
| Fastenal Co. | 46,100 | 1,990 | |
| HD Supply Holdings, Inc. (a) | 49,700 | 2,005 | |
| Now, Inc. (a) | 17,720 | 293 | |
| 4,288 | |||
| TOTAL INDUSTRIALS | 88,616 | ||
| INFORMATION TECHNOLOGY - 22.4% | |||
| Communications Equipment - 1.3% | |||
| Cisco Systems, Inc. | 431,179 | 13,595 | |
| Internet Software & Services - 3.9% | |||
| Alphabet, Inc. Class C (a) | 42,228 | 40,744 | |
| IT Services - 3.9% | |||
| Accenture PLC Class A | 114,000 | 14,190 | |
| Fidelity National Information Services, Inc. | 106,298 | 9,128 | |
| PayPal Holdings, Inc. (a) | 72,700 | 3,796 | |
| Sabre Corp. (b) | 147,600 | 3,311 | |
| Total System Services, Inc. | 158,800 | 9,457 | |
| 39,882 | |||
| Semiconductors & Semiconductor Equipment - 1.6% | |||
| Intel Corp. | 93,500 | 3,376 | |
| KLA-Tencor Corp. | 23,700 | 2,465 | |
| NXP Semiconductors NV (a) | 11,800 | 1,297 | |
| Qualcomm, Inc. | 160,578 | 9,196 | |
| 16,334 | |||
| Software - 6.4% | |||
| Activision Blizzard, Inc. | 316,517 | 18,542 | |
| Constellation Software, Inc. | 2,400 | 1,241 | |
| Micro Focus International PLC | 291,300 | 8,985 | |
| Microsoft Corp. | 503,963 | 35,197 | |
| SAP AG | 13,942 | 1,498 | |
| 65,463 | |||
| Technology Hardware, Storage & Peripherals - 5.3% | |||
| Apple, Inc. | 356,224 | 54,413 | |
| TOTAL INFORMATION TECHNOLOGY | 230,431 | ||
| MATERIALS - 4.7% | |||
| Chemicals - 3.5% | |||
| E.I. du Pont de Nemours & Co. | 151,800 | 11,980 | |
| LyondellBasell Industries NV Class A | 136,100 | 10,959 | |
| Monsanto Co. | 67,300 | 7,902 | |
| PPG Industries, Inc. | 27,900 | 2,967 | |
| W.R. Grace & Co. | 37,700 | 2,703 | |
| 36,511 | |||
| Containers & Packaging - 1.2% | |||
| Ball Corp. | 290,936 | 11,899 | |
| TOTAL MATERIALS | 48,410 | ||
| REAL ESTATE - 1.2% | |||
| Equity Real Estate Investment Trusts (REITs) - 1.2% | |||
| American Tower Corp. | 86,400 | 11,335 | |
| Corrections Corp. of America | 15,200 | 437 | |
| 11,772 | |||
| TELECOMMUNICATION SERVICES - 1.8% | |||
| Diversified Telecommunication Services - 1.8% | |||
| AT&T, Inc. | 300,800 | 11,590 | |
| Verizon Communications, Inc. | 142,500 | 6,646 | |
| 18,236 | |||
| TOTAL COMMON STOCKS | |||
| (Cost $739,708) | 975,026 | ||
| Principal Amount (000s) | Value (000s) | ||
| Convertible Bonds - 0.1% | |||
| ENERGY - 0.1% | |||
| Oil, Gas & Consumable Fuels - 0.1% | |||
| Amyris, Inc. 9.5% 4/15/19 pay-in-kind (Cost $660) | 989 | 653 | |
| Shares | Value (000s) | ||
| Money Market Funds - 5.5% | |||
| Fidelity Cash Central Fund, 0.86% (c) | 53,292,387 | 53,303 | |
| Fidelity Securities Lending Cash Central Fund 0.87% (c)(d) | 3,676,346 | 3,677 | |
| TOTAL MONEY MARKET FUNDS | |||
| (Cost $56,973) | 56,980 | ||
| TOTAL INVESTMENT PORTFOLIO - 100.5% | |||
| (Cost $797,341) | 1,032,659 | ||
| NET OTHER ASSETS (LIABILITIES) - (0.5)% | (4,628) | ||
| NET ASSETS - 100% | $1,028,031 |
Values shown as $0 may reflect amounts less than $500.
Legend
(a) Non-income producing
(b) Security or a portion of the security is on loan at period end.
(c) Affiliated fund that is generally available only to investment companies and other accounts managed by Fidelity Investments. The rate quoted is the annualized seven-day yield of the fund at period end. A complete unaudited listing of the fund's holdings as of its most recent quarter end is available upon request. In addition, each Fidelity Central Fund's financial statements are available on the SEC's website or upon request.
(d) Investment made with cash collateral received from securities on loan.
Affiliated Central Funds
Information regarding fiscal year to date income earned by the Fund from investments in Fidelity Central Funds is as follows:
| Fund | Income earned |
| (Amounts in thousands) | |
| Fidelity Cash Central Fund | $191 |
| Fidelity Securities Lending Cash Central Fund | 7 |
| Total | $198 |
Investment Valuation
The following is a summary of the inputs used, as of May 31, 2017, involving the Fund's assets and liabilities carried at fair value. The inputs or methodology used for valuing securities may not be an indication of the risk associated with investing in those securities. For more information on valuation inputs, and their aggregation into the levels used below, please refer to the Investment Valuation section in the accompanying Notes to Financial Statements.
| Valuation Inputs at Reporting Date: | ||||
| Description | Total | Level 1 | Level 2 | Level 3 |
| (Amounts in thousands) | ||||
| Investments in Securities: | ||||
| Equities: | ||||
| Consumer Discretionary | $83,026 | $83,009 | $17 | $-- |
| Consumer Staples | 114,487 | 101,046 | 13,441 | -- |
| Energy | 82,869 | 82,869 | -- | -- |
| Financials | 181,662 | 181,662 | -- | -- |
| Health Care | 115,517 | 108,641 | 6,876 | -- |
| Industrials | 88,616 | 88,616 | -- | -- |
| Information Technology | 230,431 | 228,933 | 1,498 | -- |
| Materials | 48,410 | 48,410 | -- | -- |
| Real Estate | 11,772 | 11,772 | -- | -- |
| Telecommunication Services | 18,236 | 18,236 | -- | -- |
| Corporate Bonds | 653 | -- | 653 | -- |
| Money Market Funds | 56,980 | 56,980 | -- | -- |
| Total Investments in Securities: | $1,032,659 | $1,010,174 | $22,485 | $-- |
Other Information
Distribution of investments by country or territory of incorporation, as a percentage of Total Net Assets, is as follows (Unaudited):
| United States of America | 88.1% |
| Ireland | 4.1% |
| United Kingdom | 2.8% |
| Canada | 1.6% |
| Netherlands | 1.2% |
| Others (Individually Less Than 1%) | 2.2% |
| 100.0% |
See accompanying notes which are an integral part of the financial statements.
Financial Statements
Statement of Assets and Liabilities
| Amounts in thousands (except per-share amounts) | May 31, 2017 (Unaudited) | |
| Assets | ||
| Investment in securities, at value (including securities loaned of $3,422) — See accompanying schedule: Unaffiliated issuers (cost $740,368) | $975,679 | |
| Fidelity Central Funds (cost $56,973) | 56,980 | |
| Total Investments (cost $797,341) | $1,032,659 | |
| Receivable for fund shares sold | 442 | |
| Dividends receivable | 2,233 | |
| Interest receivable | 12 | |
| Distributions receivable from Fidelity Central Funds | 39 | |
| Other receivables | 18 | |
| Total assets | 1,035,403 | |
| Liabilities | ||
| Payable for fund shares redeemed | $2,806 | |
| Accrued management fee | 297 | |
| Distribution and service plan fees payable | 357 | |
| Other affiliated payables | 197 | |
| Other payables and accrued expenses | 38 | |
| Collateral on securities loaned | 3,677 | |
| Total liabilities | 7,372 | |
| Net Assets | $1,028,031 | |
| Net Assets consist of: | ||
| Paid in capital | $787,530 | |
| Undistributed net investment income | 4,866 | |
| Accumulated undistributed net realized gain (loss) on investments and foreign currency transactions | 316 | |
| Net unrealized appreciation (depreciation) on investments and assets and liabilities in foreign currencies | 235,319 | |
| Net Assets | $1,028,031 | |
| Calculation of Maximum Offering Price | ||
| Class A: | ||
| Net Asset Value and redemption price per share ($361,970 ÷ 19,950.30 shares) | $18.14 | |
| Maximum offering price per share (100/94.25 of $18.14) | $19.25 | |
| Class M: | ||
| Net Asset Value and redemption price per share ($356,542 ÷ 19,738.08 shares) | $18.06 | |
| Maximum offering price per share (100/96.50 of $18.06) | $18.72 | |
| Class C: | ||
| Net Asset Value and offering price per share ($158,040 ÷ 9,139.40 shares)(a) | $17.29 | |
| Class I: | ||
| Net Asset Value, offering price and redemption price per share ($151,242 ÷ 7,962.58 shares) | $18.99 | |
| Class Z: | ||
| Net Asset Value, offering price and redemption price per share ($237 ÷ 12.31 shares) | $19.25 |
(a) Redemption price per share is equal to net asset value less any applicable contingent deferred sales charge.
See accompanying notes which are an integral part of the financial statements.
Statement of Operations
| Amounts in thousands | Six months ended May 31, 2017 (Unaudited) | |
| Investment Income | ||
| Dividends | $10,119 | |
| Interest | 126 | |
| Income from Fidelity Central Funds | 198 | |
| Total income | 10,443 | |
| Expenses | ||
| Management fee | ||
| Basic fee | $2,781 | |
| Performance adjustment | (1,011) | |
| Transfer agent fees | 1,025 | |
| Distribution and service plan fees | 2,140 | |
| Accounting and security lending fees | 169 | |
| Custodian fees and expenses | 19 | |
| Independent trustees' fees and expenses | 2 | |
| Registration fees | 37 | |
| Audit | 35 | |
| Legal | 6 | |
| Miscellaneous | 5 | |
| Total expenses before reductions | 5,208 | |
| Expense reductions | (20) | 5,188 |
| Net investment income (loss) | 5,255 | |
| Realized and Unrealized Gain (Loss) | ||
| Net realized gain (loss) on: | ||
| Investment securities: | ||
| Unaffiliated issuers | 10,450 | |
| Fidelity Central Funds | (1) | |
| Total net realized gain (loss) | 10,449 | |
| Change in net unrealized appreciation (depreciation) on: Investment securities | 67,192 | |
| Assets and liabilities in foreign currencies | 3 | |
| Total change in net unrealized appreciation (depreciation) | 67,195 | |
| Net gain (loss) | 77,644 | |
| Net increase (decrease) in net assets resulting from operations | $82,899 |
See accompanying notes which are an integral part of the financial statements.
Statement of Changes in Net Assets
| Amounts in thousands | Six months ended May 31, 2017 (Unaudited) | Year ended November 30, 2016 |
| Increase (Decrease) in Net Assets | ||
| Operations | ||
| Net investment income (loss) | $5,255 | $11,303 |
| Net realized gain (loss) | 10,449 | (3,768) |
| Change in net unrealized appreciation (depreciation) | 67,195 | 31,304 |
| Net increase (decrease) in net assets resulting from operations | 82,899 | 38,839 |
| Distributions to shareholders from net investment income | (10,211) | (8,944) |
| Distributions to shareholders from net realized gain | – | (56,257) |
| Total distributions | (10,211) | (65,201) |
| Share transactions - net increase (decrease) | (30,926) | (21,716) |
| Total increase (decrease) in net assets | 41,762 | (48,078) |
| Net Assets | ||
| Beginning of period | 986,269 | 1,034,347 |
| End of period | $1,028,031 | $986,269 |
| Other Information | ||
| Undistributed net investment income end of period | $4,866 | $9,822 |
See accompanying notes which are an integral part of the financial statements.
Financial Highlights — Fidelity Advisor Dividend Growth Fund Class A
| Six months ended (Unaudited) May 31, | Years ended November 30, | |||||
| 2017 | 2016 | 2015 | 2014 | 2013 | 2012 | |
| Selected Per–Share Data | ||||||
| Net asset value, beginning of period | $16.90 | $17.35 | $19.65 | $17.23 | $13.33 | $11.45 |
| Income from Investment Operations | ||||||
| Net investment income (loss)A | .11 | .21 | .20 | .23B | .13 | .07 |
| Net realized and unrealized gain (loss) | 1.34 | .46 | (.34)C | 2.29 | 3.87 | 1.81 |
| Total from investment operations | 1.45 | .67 | (.14) | 2.52 | 4.00 | 1.88 |
| Distributions from net investment income | (.21) | (.18) | (.19) | (.09) | (.10) | – |
| Distributions from net realized gain | – | (.94) | (1.96) | (.01) | – | – |
| Total distributions | (.21) | (1.12) | (2.16)D | (.10) | (.10) | – |
| Net asset value, end of period | $18.14 | $16.90 | $17.35 | $19.65 | $17.23 | $13.33 |
| Total ReturnE,F,G | 8.62% | 4.36% | (.41)%C | 14.70% | 30.26% | 16.42% |
| Ratios to Average Net AssetsH,I | ||||||
| Expenses before reductions | .85%J | .90% | 1.01% | .94% | .98% | 1.21% |
| Expenses net of fee waivers, if any | .85%J | .90% | 1.00% | .94% | .98% | 1.21% |
| Expenses net of all reductions | .85%J | .90% | 1.00% | .94% | .97% | 1.20% |
| Net investment income (loss) | 1.20%J | 1.33% | 1.13% | 1.29%B | .87% | .53% |
| Supplemental Data | ||||||
| Net assets, end of period (in millions) | $362 | $355 | $356 | $386 | $369 | $301 |
| Portfolio turnover rateK | 27%J | 31% | 56% | 106% | 70% | 64% |
A Calculated based on average shares outstanding during the period.
B Net Investment income per share reflects a large, non-recurring dividend which amounted to $.04 per share. Excluding this non-recurring dividend, the ratio of net investment income (loss) to average net assets would have been 1.07%.
C Net realized and unrealized gain (loss) per share reflects proceeds received from litigation which amounted to $.02 per share. Excluding these litigation proceeds, the total return would have been (.51)%.
D Total distributions of $2.16 per share is comprised of distributions from net investment income of $.193 and distributions from net realized gain of $1.962 per share.
E Total returns for periods of less than one year are not annualized.
F Total returns would have been lower if certain expenses had not been reduced during the applicable periods shown.
G Total returns do not include the effect of the sales charges.
H Fees and expenses of any underlying Fidelity Central Funds are not included in the Fund's expense ratio. The Fund indirectly bears its proportionate share of the expenses of any underlying Fidelity Central Funds.
I Expense ratios reflect operating expenses of the class. Expenses before reductions do not reflect amounts reimbursed by the investment adviser or reductions from brokerage service arrangements or reductions from other expense offset arrangements and do not represent the amount paid by the class during periods when reimbursements or reductions occur. Expenses net of fee waivers reflect expenses after reimbursement by the investment adviser but prior to reductions from brokerage service arrangements or other expense offset arrangements. Expenses net of all reductions represent the net expenses paid by the class.
J Annualized
K Amount does not include the portfolio activity of any underlying Fidelity Central Funds.
See accompanying notes which are an integral part of the financial statements.
Financial Highlights — Fidelity Advisor Dividend Growth Fund Class M
| Six months ended (Unaudited) May 31, | Years ended November 30, | |||||
| 2017 | 2016 | 2015 | 2014 | 2013 | 2012 | |
| Selected Per–Share Data | ||||||
| Net asset value, beginning of period | $16.81 | $17.25 | $19.55 | $17.15 | $13.26 | $11.42 |
| Income from Investment Operations | ||||||
| Net investment income (loss)A | .08 | .17 | .15 | .19B | .10 | .04 |
| Net realized and unrealized gain (loss) | 1.33 | .47 | (.34)C | 2.27 | 3.86 | 1.80 |
| Total from investment operations | 1.41 | .64 | (.19) | 2.46 | 3.96 | 1.84 |
| Distributions from net investment income | (.16) | (.14) | (.15) | (.06) | (.07) | – |
| Distributions from net realized gain | – | (.94) | (1.96) | (.01) | – | – |
| Total distributions | (.16) | (1.08) | (2.11) | (.06)D | (.07) | – |
| Net asset value, end of period | $18.06 | $16.81 | $17.25 | $19.55 | $17.15 | $13.26 |
| Total ReturnE,F,G | 8.45% | 4.15% | (.67)%C | 14.41% | 30.05% | 16.11% |
| Ratios to Average Net AssetsH,I | ||||||
| Expenses before reductions | 1.10%J | 1.14% | 1.24% | 1.18% | 1.20% | 1.42% |
| Expenses net of fee waivers, if any | 1.09%J | 1.14% | 1.24% | 1.18% | 1.20% | 1.42% |
| Expenses net of all reductions | 1.09%J | 1.14% | 1.24% | 1.17% | 1.19% | 1.42% |
| Net investment income (loss) | .96%J | 1.09% | .89% | 1.05%B | .65% | .32% |
| Supplemental Data | ||||||
| Net assets, end of period (in millions) | $357 | $351 | $372 | $412 | $375 | $304 |
| Portfolio turnover rateK | 27%J | 31% | 56% | 106% | 70% | 64% |
A Calculated based on average shares outstanding during the period.
B Net Investment income per share reflects a large, non-recurring dividend which amounted to $.04 per share. Excluding this non-recurring dividend, the ratio of net investment income (loss) to average net assets would have been .83%.
C Net realized and unrealized gain (loss) per share reflects proceeds received from litigation which amounted to $.02 per share. Excluding these litigation proceeds, the total return would have been (.77)%.
D Total distributions of $.06 per share is comprised of distributions from net investment income of $.055 and distributions from net realized gain of $.007 per share.
E Total returns for periods of less than one year are not annualized.
F Total returns would have been lower if certain expenses had not been reduced during the applicable periods shown.
G Total returns do not include the effect of the sales charges.
H Fees and expenses of any underlying Fidelity Central Funds are not included in the Fund's expense ratio. The Fund indirectly bears its proportionate share of the expenses of any underlying Fidelity Central Funds.
I Expense ratios reflect operating expenses of the class. Expenses before reductions do not reflect amounts reimbursed by the investment adviser or reductions from brokerage service arrangements or reductions from other expense offset arrangements and do not represent the amount paid by the class during periods when reimbursements or reductions occur. Expenses net of fee waivers reflect expenses after reimbursement by the investment adviser but prior to reductions from brokerage service arrangements or other expense offset arrangements. Expenses net of all reductions represent the net expenses paid by the class.
J Annualized
K Amount does not include the portfolio activity of any underlying Fidelity Central Funds.
See accompanying notes which are an integral part of the financial statements.
Financial Highlights — Fidelity Advisor Dividend Growth Fund Class C
| Six months ended (Unaudited) May 31, | Years ended November 30, | |||||
| 2017 | 2016 | 2015 | 2014 | 2013 | 2012 | |
| Selected Per–Share Data | ||||||
| Net asset value, beginning of period | $16.06 | $16.53 | $18.82 | $16.54 | $12.79 | $11.07 |
| Income from Investment Operations | ||||||
| Net investment income (loss)A | .04 | .09 | .06 | .09B | .02 | (.02) |
| Net realized and unrealized gain (loss) | 1.27 | .44 | (.32)C | 2.20 | 3.73 | 1.74 |
| Total from investment operations | 1.31 | .53 | (.26) | 2.29 | 3.75 | 1.72 |
| Distributions from net investment income | (.08) | (.06) | (.06) | – | – | – |
| Distributions from net realized gain | – | (.94) | (1.96) | (.01) | – | – |
| Total distributions | (.08) | (1.00) | (2.03)D | (.01) | – | – |
| Net asset value, end of period | $17.29 | $16.06 | $16.53 | $18.82 | $16.54 | $12.79 |
| Total ReturnE,F,G | 8.18% | 3.58% | (1.16)%C | 13.83% | 29.36% | 15.54% |
| Ratios to Average Net AssetsH,I | ||||||
| Expenses before reductions | 1.61%J | 1.66% | 1.76% | 1.69% | 1.72% | 1.94% |
| Expenses net of fee waivers, if any | 1.61%J | 1.66% | 1.76% | 1.69% | 1.72% | 1.94% |
| Expenses net of all reductions | 1.61%J | 1.66% | 1.76% | 1.69% | 1.71% | 1.93% |
| Net investment income (loss) | .44%J | .57% | .37% | .54%B | .13% | (.20)% |
| Supplemental Data | ||||||
| Net assets, end of period (in millions) | $158 | $154 | $167 | $179 | $160 | $123 |
| Portfolio turnover rateK | 27%J | 31% | 56% | 106% | 70% | 64% |
A Calculated based on average shares outstanding during the period.
B Net Investment income per share reflects a large, non-recurring dividend which amounted to $.04 per share. Excluding this non-recurring dividend, the ratio of net investment income (loss) to average net assets would have been .32%.
C Net realized and unrealized gain (loss) per share reflects proceeds received from litigation which amounted to $.02 per share. Excluding these litigation proceeds, the total return would have been (1.26)%.
D Total distributions of $2.03 per share is comprised of distributions from net investment income of $.064 and distributions from net realized gain of $1.962 per share.
E Total returns for periods of less than one year are not annualized.
F Total returns would have been lower if certain expenses had not been reduced during the applicable periods shown.
G Total returns do not include the effect of the contingent deferred sales charge.
H Fees and expenses of any underlying Fidelity Central Funds are not included in the Fund's expense ratio. The Fund indirectly bears its proportionate share of the expenses of any underlying Fidelity Central Funds.
I Expense ratios reflect operating expenses of the class. Expenses before reductions do not reflect amounts reimbursed by the investment adviser or reductions from brokerage service arrangements or reductions from other expense offset arrangements and do not represent the amount paid by the class during periods when reimbursements or reductions occur. Expenses net of fee waivers reflect expenses after reimbursement by the investment adviser but prior to reductions from brokerage service arrangements or other expense offset arrangements. Expenses net of all reductions represent the net expenses paid by the class.
J Annualized
K Amount does not include the portfolio activity of any underlying Fidelity Central Funds.
See accompanying notes which are an integral part of the financial statements.
Financial Highlights — Fidelity Advisor Dividend Growth Fund Class I
| Six months ended (Unaudited) May 31, | Years ended November 30, | |||||
| 2017 | 2016 | 2015 | 2014 | 2013 | 2012 | |
| Selected Per–Share Data | ||||||
| Net asset value, beginning of period | $17.70 | $18.12 | $20.42 | $17.91 | $13.86 | $11.88 |
| Income from Investment Operations | ||||||
| Net investment income (loss)A | .13 | .26 | .25 | .29B | .18 | .11 |
| Net realized and unrealized gain (loss) | 1.40 | .49 | (.35)C | 2.37 | 4.02 | 1.87 |
| Total from investment operations | 1.53 | .75 | (.10) | 2.66 | 4.20 | 1.98 |
| Distributions from net investment income | (.24) | (.22) | (.24) | (.14) | (.15) | – |
| Distributions from net realized gain | – | (.94) | (1.96) | (.01) | – | – |
| Total distributions | (.24) | (1.17)D | (2.20) | (.15) | (.15) | – |
| Net asset value, end of period | $18.99 | $17.70 | $18.12 | $20.42 | $17.91 | $13.86 |
| Total ReturnE,F | 8.73% | 4.60% | (.14)%C | 14.99% | 30.63% | 16.67% |
| Ratios to Average Net AssetsG,H | ||||||
| Expenses before reductions | .61%I | .67% | .76% | .69% | .70% | .91% |
| Expenses net of fee waivers, if any | .61%I | .67% | .76% | .69% | .70% | .91% |
| Expenses net of all reductions | .61%I | .66% | .76% | .69% | .69% | .90% |
| Net investment income (loss) | 1.44%I | 1.57% | 1.37% | 1.54%B | 1.15% | .83% |
| Supplemental Data | ||||||
| Net assets, end of period (in millions) | $151 | $123 | $125 | $131 | $135 | $103 |
| Portfolio turnover rateJ | 27%I | 31% | 56% | 106% | 70% | 64% |
A Calculated based on average shares outstanding during the period.
B Net Investment income per share reflects a large, non-recurring dividend which amounted to $.04 per share. Excluding this non-recurring dividend, the ratio of net investment income (loss) to average net assets would have been 1.32%.
C Net realized and unrealized gain (loss) per share reflects proceeds received from litigation which amounted to $.02 per share. Excluding these litigation proceeds, the total return would have been (.24)%.
D Total distributions of $1.17 per share is comprised of distributions from net investment income of $.224 and distributions from net realized gain of $.941 per share.
E Total returns for periods of less than one year are not annualized.
F Total returns would have been lower if certain expenses had not been reduced during the applicable periods shown.
G Fees and expenses of any underlying Fidelity Central Funds are not included in the Fund's expense ratio. The Fund indirectly bears its proportionate share of the expenses of any underlying Fidelity Central Funds.
H Expense ratios reflect operating expenses of the class. Expenses before reductions do not reflect amounts reimbursed by the investment adviser or reductions from brokerage service arrangements or reductions from other expense offset arrangements and do not represent the amount paid by the class during periods when reimbursements or reductions occur. Expenses net of fee waivers reflect expenses after reimbursement by the investment adviser but prior to reductions from brokerage service arrangements or other expense offset arrangements. Expenses net of all reductions represent the net expenses paid by the class.
I Annualized
J Amount does not include the portfolio activity of any underlying Fidelity Central Funds.
See accompanying notes which are an integral part of the financial statements.
Financial Highlights — Fidelity Advisor Dividend Growth Fund Class Z
| Six months ended (Unaudited) May 31, | Years ended November 30, | ||||
| 2017 | 2016 | 2015 | 2014 | 2013 A | |
| Selected Per–Share Data | |||||
| Net asset value, beginning of period | $17.95 | $18.36 | $20.44 | $17.92 | $16.59 |
| Income from Investment Operations | |||||
| Net investment income (loss)B | .15 | .29 | .28 | .31C | .06 |
| Net realized and unrealized gain (loss) | 1.41 | .50 | (.35)D | 2.38 | 1.27 |
| Total from investment operations | 1.56 | .79 | (.07) | 2.69 | 1.33 |
| Distributions from net investment income | (.26) | (.26) | (.05) | (.17) | – |
| Distributions from net realized gain | – | (.94) | (1.96) | (.01) | – |
| Total distributions | (.26) | (1.20) | (2.01) | (.17)E | – |
| Net asset value, end of period | $19.25 | $17.95 | $18.36 | $20.44 | $17.92 |
| Total ReturnF,G | 8.80% | 4.80% | (.01)%D | 15.20% | 8.02% |
| Ratios to Average Net AssetsH,I | |||||
| Expenses before reductions | .45%J | .49% | .59% | .52% | .54%J |
| Expenses net of fee waivers, if any | .45%J | .49% | .59% | .52% | .54%J |
| Expenses net of all reductions | .45%J | .49% | .59% | .52% | .52%J |
| Net investment income (loss) | 1.60%J | 1.74% | 1.54% | 1.71%C | 1.26%J |
| Supplemental Data | |||||
| Net assets, end of period (000 omitted) | $237 | $2,455 | $8,642 | $118 | $7,394 |
| Portfolio turnover rateK | 27%J | 31% | 56% | 106% | 70% |
A For the period August 13, 2013 (commencement of sale of shares) to November 30, 2013.
B Calculated based on average shares outstanding during the period.
C Net Investment income per share reflects a large, non-recurring dividend which amounted to $.04 per share. Excluding this non-recurring dividend, the ratio of net investment income (loss) to average net assets would have been 1.49%.
D Net realized and unrealized gain (loss) per share reflects proceeds received from litigation which amounted to $.02 per share. Excluding these litigation proceeds, the total return would have been (.11)%.
E Total distributions of $.17 per share is comprised of distributions from net investment income of $.166 and distributions from net realized gain of $.007 per share.
F Total returns for periods of less than one year are not annualized.
G Total returns would have been lower if certain expenses had not been reduced during the applicable periods shown.
H Fees and expenses of any underlying Fidelity Central Funds are not included in the Fund's expense ratio. The Fund indirectly bears its proportionate share of the expenses of any underlying Fidelity Central Funds.
I Expense ratios reflect operating expenses of the class. Expenses before reductions do not reflect amounts reimbursed by the investment adviser or reductions from brokerage service arrangements or reductions from other expense offset arrangements and do not represent the amount paid by the class during periods when reimbursements or reductions occur. Expense ratios before reductions for start-up periods may not be representative of longer-term operating periods. Expenses net of fee waivers reflect expenses after reimbursement by the investment adviser but prior to reductions from brokerage service arrangements or other expense offset arrangements. Expenses net of all reductions represent the net expenses paid by the class.
J Annualized
K Amount does not include the portfolio activity of any underlying Fidelity Central Funds.
See accompanying notes which are an integral part of the financial statements.
Notes to Financial Statements (Unaudited)
For the period ended May 31, 2017
(Amounts in thousands except percentages)
1. Organization.
Fidelity Advisor Dividend Growth Fund (the Fund) is a fund of Fidelity Advisor Series I (the Trust) and is authorized to issue an unlimited number of shares. The Trust is registered under the Investment Company Act of 1940, as amended (the 1940 Act), as an open-end management investment company organized as a Massachusetts business trust. The Fund offers Class A, Class M (formerly Class T), Class C, Class I and Class Z shares, each of which has equal rights as to assets and voting privileges. Each class has exclusive voting rights with respect to matters that affect that class.
After the close of business on June 24, 2016, all outstanding Class B shares were converted to Class A shares. All prior fiscal period dollar and share amounts for Class B presented in the Notes to Financial Statements are for the period December 1, 2015 through June 24, 2016.
2. Investments in Fidelity Central Funds.
The Fund invests in Fidelity Central Funds, which are open-end investment companies generally available only to other investment companies and accounts managed by the investment adviser and its affiliates. The Fund's Schedule of Investments lists each of the Fidelity Central Funds held as of period end, if any, as an investment of the Fund, but does not include the underlying holdings of each Fidelity Central Fund. As an Investing Fund, the Fund indirectly bears its proportionate share of the expenses of the underlying Fidelity Central Funds.
The Money Market Central Funds seek preservation of capital and current income and are managed by Fidelity Investments Money Management, Inc. (FIMM), an affiliate of the investment adviser. Annualized expenses of the Money Market Central Funds as of their most recent shareholder report date are less than .005%.
A complete unaudited list of holdings for each Fidelity Central Fund is available upon request or at the Securities and Exchange Commission (the SEC) website at www.sec.gov. In addition, the financial statements of the Fidelity Central Funds are available on the SEC website or upon request.
3. Significant Accounting Policies.
The Fund is an investment company and applies the accounting and reporting guidance of the Financial Accounting Standards Board (FASB) Accounting Standards Codification Topic 946 Financial Services – Investments Companies. The financial statements have been prepared in conformity with accounting principles generally accepted in the United States of America (GAAP), which require management to make certain estimates and assumptions at the date of the financial statements. Actual results could differ from those estimates. Subsequent events, if any, through the date that the financial statements were issued have been evaluated in the preparation of the financial statements. The following summarizes the significant accounting policies of the Fund:
Investment Valuation. Investments are valued as of 4:00 p.m. Eastern time on the last calendar day of the period. The Board of Trustees (the Board) has delegated the day to day responsibility for the valuation of the Fund's investments to the Fair Value Committee (the Committee) established by the Fund's investment adviser. In accordance with valuation policies and procedures approved by the Board, the Fund attempts to obtain prices from one or more third party pricing vendors or brokers to value its investments. When current market prices, quotations or currency exchange rates are not readily available or reliable, investments will be fair valued in good faith by the Committee, in accordance with procedures adopted by the Board. Factors used in determining fair value vary by investment type and may include market or investment specific events, changes in interest rates and credit quality. The frequency with which these procedures are used cannot be predicted and they may be utilized to a significant extent. The Committee oversees the Fund's valuation policies and procedures and reports to the Board on the Committee's activities and fair value determinations. The Board monitors the appropriateness of the procedures used in valuing the Fund's investments and ratifies the fair value determinations of the Committee.
The Fund categorizes the inputs to valuation techniques used to value its investments into a disclosure hierarchy consisting of three levels as shown below:
- Level 1 – quoted prices in active markets for identical investments
- Level 2 – other significant observable inputs (including quoted prices for similar investments, interest rates, prepayment speeds, etc.)
- Level 3 – unobservable inputs (including the Fund's own assumptions based on the best information available)
Valuation techniques used to value the Fund's investments by major category are as follows:
Equity securities, including restricted securities, for which market quotations are readily available, are valued at the last reported sale price or official closing price as reported by a third party pricing vendor on the primary market or exchange on which they are traded and are categorized as Level 1 in the hierarchy. In the event there were no sales during the day or closing prices are not available, securities are valued at the last quoted bid price or may be valued using the last available price and are generally categorized as Level 2 in the hierarchy. For foreign equity securities, when market or security specific events arise, comparisons to the valuation of American Depositary Receipts (ADRs) futures contracts, Exchange-Traded Funds (ETFs) and certain indexes as well as quoted prices for similar securities may be used and would be categorized as Level 2 in the hierarchy. Utilizing these techniques may result in transfers between Level 1 and Level 2. For equity securities, including restricted securities, where observable inputs are limited, assumptions about market activity and risk are used and these securities may be categorized as Level 3 in the hierarchy.
Debt securities, including restricted securities, are valued based on evaluated prices received from third party pricing vendors or from brokers who make markets in such securities. Corporate bonds are valued by pricing vendors who utilize matrix pricing which considers yield or price of bonds of comparable quality, coupon, maturity and type or by broker-supplied prices. When independent prices are unavailable or unreliable, debt securities may be valued utilizing pricing methodologies which consider similar factors that would be used by third party pricing vendors. Debt securities are generally categorized as Level 2 in the hierarchy but may be Level 3 depending on the circumstances.
Investments in open-end mutual funds, including the Fidelity Central Funds, are valued at their closing net asset value (NAV) each business day and are categorized as Level 1 in the hierarchy.
Changes in valuation techniques may result in transfers in or out of an assigned level within the disclosure hierarchy. The aggregate value of investments by input level as of May 31, 2017, is included at the end of the Fund's Schedule of Investments.
Foreign Currency. The Fund may use foreign currency contracts to facilitate transactions in foreign-denominated securities. Gains and losses from these transactions may arise from changes in the value of the foreign currency or if the counterparties do not perform under the contracts' terms.
Foreign-denominated assets, including investment securities, and liabilities are translated into U.S. dollars at the exchange rates at period end. Purchases and sales of investment securities, income and dividends received and expenses denominated in foreign currencies are translated into U.S. dollars at the exchange rate in effect on the transaction date.
The effects of exchange rate fluctuations on investments are included with the net realized and unrealized gain (loss) on investment securities. Other foreign currency transactions resulting in realized and unrealized gain (loss) are disclosed separately.
Investment Transactions and Income. For financial reporting purposes, the Fund's investment holdings and NAV include trades executed through the end of the last business day of the period. The NAV per share for processing shareholder transactions is calculated as of the close of business of the New York Stock Exchange (NYSE), normally 4:00 p.m. Eastern time and includes trades executed through the end of the prior business day. Gains and losses on securities sold are determined on the basis of identified cost and may include proceeds received from litigation. Dividend income is recorded on the ex-dividend date, except for certain dividends from foreign securities where the ex-dividend date may have passed, which are recorded as soon as the Fund is informed of the ex-dividend date. Non-cash dividends included in dividend income, if any, are recorded at the fair market value of the securities received. Income and capital gain distributions from Fidelity Central Funds, if any, are recorded on the ex-dividend date. Certain distributions received by the Fund represent a return of capital or capital gain. The Fund determines the components of these distributions subsequent to the ex-dividend date, based upon receipt of tax filings or other correspondence relating to the underlying investment. These distributions are recorded as a reduction of cost of investments and/or as a realized gain. Interest income is accrued as earned and includes coupon interest and amortization of premium and accretion of discount on debt securities as applicable. Investment income is recorded net of foreign taxes withheld where recovery of such taxes is uncertain.
Class Allocations and Expenses. Investment income, realized and unrealized capital gains and losses, common expenses of the Fund, and certain fund-level expense reductions, if any, are allocated daily on a pro-rata basis to each class based on the relative net assets of each class to the total net assets of the Fund. Each class differs with respect to transfer agent and distribution and service plan fees incurred. Certain expense reductions may also differ by class. For the reporting period, the allocated portion of income and expenses to each class as a percent of its average net assets may vary due to the timing of recording these transactions in relation to fluctuating net assets of the classes. Expenses directly attributable to a fund are charged to that fund. Expenses attributable to more than one fund are allocated among the respective funds on the basis of relative net assets or other appropriate methods. Expense estimates are accrued in the period to which they relate and adjustments are made when actual amounts are known.
Income Tax Information and Distributions to Shareholders. Each year, the Fund intends to qualify as a regulated investment company under Subchapter M of the Internal Revenue Code, including distributing substantially all of its taxable income and realized gains. As a result, no provision for U.S. Federal income taxes is required. The Fund files a U.S. federal tax return, in addition to state and local tax returns as required. The Fund's federal income tax returns are subject to examination by the Internal Revenue Service (IRS) for a period of three fiscal years after they are filed. State and local tax returns may be subject to examination for an additional fiscal year depending on the jurisdiction. Foreign taxes are provided for based on the Fund's understanding of the tax rules and rates that exist in the foreign markets in which it invests.
Distributions are declared and recorded on the ex-dividend date. Income dividends and capital gain distributions are declared separately for each class. Income and capital gain distributions are determined in accordance with income tax regulations, which may differ from GAAP.
Capital accounts within the financial statements are adjusted for permanent book-tax differences. These adjustments have no impact on net assets or the results of operations. Capital accounts are not adjusted for temporary book-tax differences which will reverse in a subsequent period.
Book-tax differences are primarily due to foreign currency transactions, partnerships, capital loss carryforwards and losses deferred due to wash sales and excise tax regulations.
The federal tax cost of investment securities and unrealized appreciation (depreciation) as of period end were as follows:
| Gross unrealized appreciation | $261,838 |
| Gross unrealized depreciation | (26,605) |
| Net unrealized appreciation (depreciation) on securities | $235,233 |
| Tax cost | $797,426 |
Capital loss carryforwards are only available to offset future capital gains of the Fund to the extent provided by regulations and may be limited. Under the Regulated Investment Company Modernization Act of 2010 (the Act), the Fund is permitted to carry forward capital losses incurred in taxable years beginning after December 22, 2010 for an unlimited period and such capital losses are required to be used prior to any losses that expire. The capital loss carryforward information presented below, including any applicable limitation, is estimated as of prior fiscal period end and is subject to adjustment.
| No expiration | |
| Short-term | $(9,753) |
| Long-term | – |
| Total no expiration | (9,753) |
| Total capital loss carryforward | $(9,753) |
4. Purchases and Sales of Investments.
Purchases and sales of securities, other than short-term securities, aggregated $128,519 and $158,068, respectively.
5. Fees and Other Transactions with Affiliates.
Management Fee. Fidelity Management & Research Company (the investment adviser) and its affiliates provide the Fund with investment management related services for which the Fund pays a monthly management fee. The management fee is the sum of an individual fund fee rate that is based on an annual rate of .30% of the Fund's average net assets and an annualized group fee rate that averaged .25% during the period. The group fee rate is based upon the average net assets of all the mutual funds advised by the investment adviser, including any mutual funds previously advised by the investment adviser that are currently advised by Fidelity SelectCo, LLC, an affiliate of the investment adviser. The group fee rate decreases as assets under management increase and increases as assets under management decrease. In addition, the management fee is subject to a performance adjustment (up to a maximum of +/- .20% of the Fund's average net assets over a 36 month performance period). The upward or downward adjustment to the management fee is based on the relative investment performance of Class I of the Fund as compared to its benchmark index, the S&P 500 Index, over the same 36 month performance period. For the reporting period, the total annualized management fee rate, including the performance adjustment, was .35% of the Fund's average net assets. The performance adjustment included in the management fee rate may be higher or lower than the maximum performance adjustment rate due to the difference between the average net assets for the reporting and performance periods.
Distribution and Service Plan Fees. In accordance with Rule 12b-1 of the 1940 Act, the Fund has adopted separate Distribution and Service Plans for each class of shares. Certain classes pay Fidelity Distributors Corporation (FDC), an affiliate of the investment adviser, separate Distribution and Service Fees, each of which is based on an annual percentage of each class' average net assets. In addition, FDC may pay financial intermediaries for selling shares of the Fund and providing shareholder support services. For the period, the Distribution and Service Fee rates, total fees and amounts retained by FDC were as follows:
| Distribution Fee | Service Fee | Total Fees | Retained by FDC | |
| Class A | -% | .25% | $457 | $3 |
| Class M | .25% | .25% | 896 | 2 |
| Class C | .75% | .25% | 787 | 16 |
| $2,140 | $21 |
Sales Load. FDC may receive a front-end sales charge of up to 5.75% for selling Class A shares and 3.50% for selling Class M shares, some of which is paid to financial intermediaries for selling shares of the Fund. Depending on the holding period, FDC may receive contingent deferred sales charges levied on Class A, Class M, and Class C redemptions. The deferred sales charges are1.00% for Class C shares, 1.00% for certain purchases of Class A shares and .25% for certain purchases of Class M shares.
For the period, sales charge amounts retained by FDC were as follows:
| Retained by FDC | |
| Class A | $48 |
| Class M | 8 |
| Class C(a) | 4 |
| $60 |
(a) When Class C shares are initially sold, FDC pays commissions from its own resources to financial intermediaries through which the sales are made.
Transfer Agent Fees. Fidelity Investments Institutional Operations Company, Inc., (FIIOC), an affiliate of the investment adviser, is the transfer, dividend disbursing and shareholder servicing agent for each class of the Fund. FIIOC receives account fees and asset-based fees that vary according to the account size and type of account of the shareholders of the respective classes of the Fund, except for Class Z. FIIOC receives an asset-based fee of Class Z's average net assets. FIIOC pays for typesetting, printing and mailing of shareholder reports, except proxy statements.
For the period, transfer agent fees for each class were as follows:
| Amount | % of Class-Level Average Net Assets(a) | |
| Class A | $364 | .20 |
| Class M | 348 | .19 |
| Class C | 168 | .21 |
| Class I | 145 | .21 |
| Class Z | –(b) | .05 |
| $1,025 |
(a) Annualized
(b) In the amount of less than five hundred dollars
Accounting and Security Lending Fees. Fidelity Service Company, Inc. (FSC), an affiliate of the investment adviser, maintains the Fund's accounting records. The accounting fee is based on the level of average net assets for each month. Under a separate contract, FSC administers the security lending program. The security lending fee is based on the number and duration of lending transactions.
Brokerage Commissions. The Fund placed a portion of its portfolio transactions with brokerage firms which are affiliates of the investment adviser. Brokerage commissions are included in net realized gain (loss) and change in net unrealized appreciation (depreciation) in the Statement of Operations. The commissions paid to these affiliated firms were $3 for the period.
Interfund Trades. The Fund may purchase from or sell securities to other Fidelity Funds under procedures adopted by the Board. The procedures have been designed to ensure these interfund trades are executed in accordance with Rule 17a-7 of the 1940 Act. Interfund trades are included within the respective purchases and sales amounts shown in the Purchases and Sales of Investments note.
6. Committed Line of Credit.
The Fund participates with other funds managed by the investment adviser or an affiliate in a $4.25 billion credit facility (the "line of credit") to be utilized for temporary or emergency purposes to fund shareholder redemptions or for other short-term liquidity purposes. The Fund has agreed to pay commitment fees on its pro-rata portion of the line of credit, which amounted to $2 and is reflected in Miscellaneous expenses on the Statement of Operations. During the period, the Fund did not borrow on this line of credit.
7. Security Lending.
The Fund lends portfolio securities through a lending agent from time to time in order to earn additional income. For equity securities, a lending agent is used and may loan securities to certain qualified borrowers, including Fidelity Capital Markets (FCM), a broker-dealer affiliated with the Fund. On the settlement date of the loan, the Fund receives collateral (in the form of U.S. Treasury obligations, letters of credit and/or cash) against the loaned securities and maintains collateral in an amount not less than 100% of the market value of the loaned securities during the period of the loan. The market value of the loaned securities is determined at the close of business of the Fund and any additional required collateral is delivered to the Fund on the next business day. The Fund or borrower may terminate the loan at any time, and if the borrower defaults on its obligation to return the securities loaned because of insolvency or other reasons, the Fund may apply collateral received from the borrower against the obligation. The Fund may experience delays and costs in recovering the securities loaned. Any cash collateral received is invested in the Fidelity Securities Lending Cash Central Fund. The value of loaned securities and cash collateral at period end are disclosed on the Fund's Statement of Assets and Liabilities. Security lending income represents the income earned on investing cash collateral, less rebates paid to borrowers and any lending agent fees associated with the loan, plus any premium payments received for lending certain types of securities. Security lending income is presented in the Statement of Operations as a component of income from Fidelity Central Funds. Total security lending income during the period amounted to $7. During the period, there were no securities loaned to FCM.
8. Expense Reductions.
Commissions paid to certain brokers with whom the investment adviser, or its affiliates, places trades on behalf of the Fund include an amount in addition to trade execution, which may be rebated back to the Fund to offset certain expenses. This amount totaled $15 for the period.
In addition, during the period the investment adviser reimbursed and/or waived a portion of fund-level operating expenses in the amount of $5.
9. Distributions to Shareholders.
Distributions to shareholders of each class were as follows:
| Six months ended May 31, 2017 | Year ended November 30, 2016 | |
| From net investment income | ||
| Class A | $4,338 | $3,750 |
| Class M | 3,360 | 2,967 |
| Class C | 762 | 563 |
| Class I | 1,715 | 1,543 |
| Class Z | 36 | 121 |
| Total | $10,211 | $8,944 |
| From net realized gain | ||
| Class A | $– | $19,280 |
| Class M | – | 20,231 |
| Class B | – | 361 |
| Class C | – | 9,460 |
| Class I | – | 6,482 |
| Class Z | – | 443 |
| Total | $– | $56,257 |
10. Share Transactions.
Share transactions for each class were as follows and may contain automatic conversions between classes or exchanges between affiliated funds:
| Shares | Shares | Dollars | Dollars | |
| Six months ended May 31, 2017 | Year ended November 30, 2016 | Six months ended May 31, 2017 | Year ended November 30, 2016 | |
| Class A | ||||
| Shares sold | 1,336 | 3,281 | $23,462 | $52,651 |
| Reinvestment of distributions | 236 | 1,348 | 4,055 | 21,238 |
| Shares redeemed | (2,634) | (4,157) | (46,585) | (66,836) |
| Net increase (decrease) | (1,062) | 472 | $(19,068) | $7,053 |
| Class M | ||||
| Shares sold | 1,584 | 3,492 | $27,756 | $55,838 |
| Reinvestment of distributions | 191 | 1,444 | 3,277 | 22,671 |
| Shares redeemed | (2,942) | (5,580) | (51,773) | (89,471) |
| Net increase (decrease) | (1,167) | (644) | $(20,740) | $(10,962) |
| Class B | ||||
| Shares sold | – | 10 | $– | $140 |
| Reinvestment of distributions | – | 22 | – | 337 |
| Shares redeemed | – | (423) | – | (6,401) |
| Net increase (decrease) | – | (391) | $– | $(5,924) |
| Class C | ||||
| Shares sold | 381 | 946 | $6,384 | $14,422 |
| Reinvestment of distributions | 41 | 579 | 674 | 8,736 |
| Shares redeemed | (863) | (2,021) | (14,470) | (31,096) |
| Net increase (decrease) | (441) | (496) | $(7,412) | $(7,938) |
| Class I | ||||
| Shares sold | 1,878 | 1,496 | $34,959 | $25,131 |
| Reinvestment of distributions | 89 | 451 | 1,608 | 7,424 |
| Shares redeemed | (979) | (1,850) | (17,927) | (30,828) |
| Net increase (decrease) | 988 | 97 | $18,640 | $1,727 |
| Class Z | ||||
| Shares sold | 13 | 23 | $251 | $389 |
| Reinvestment of distributions | 2 | 34 | 36 | 565 |
| Shares redeemed | (140) | (391) | (2,633) | (6,626) |
| Net increase (decrease) | (125) | (334) | $(2,346) | $(5,672) |
11. Other.
The Fund's organizational documents provide former and current trustees and officers with a limited indemnification against liabilities arising in connection with the performance of their duties to the Fund. In the normal course of business, the Fund may also enter into contracts that provide general indemnifications. The Fund's maximum exposure under these arrangements is unknown as this would be dependent on future claims that may be made against the Fund. The risk of material loss from such claims is considered remote.
Shareholder Expense Example
As a shareholder of the Fund, you incur two types of costs: (1) transaction costs, including sales charges (loads) on purchase payments or redemption proceeds, and (2) ongoing costs, including management fees, distribution and/or service (12b-1) fees and other Fund expenses. This Example is intended to help you understand your ongoing costs (in dollars) of investing in the Fund and to compare these costs with the ongoing costs of investing in other mutual funds.
The Example is based on an investment of $1,000 invested at the beginning of the period and held for the entire period (December 1, 2016 to May 31, 2017).
Actual Expenses
The first line of the accompanying table for each class of the Fund provides information about actual account values and actual expenses. You may use the information in this line, together with the amount you invested, to estimate the expenses that you paid over the period. Simply divide your account value by $1,000.00 (for example, an $8,600 account value divided by $1,000.00 = 8.6), then multiply the result by the number in the first line for a class of the Fund under the heading entitled "Expenses Paid During Period" to estimate the expenses you paid on your account during this period. In addition, the Fund, as a shareholder in the underlying Fidelity Central Funds, will indirectly bear its pro-rata share of the fees and expenses incurred by the underlying Fidelity Central Funds. These fees and expenses are not included in the Fund's annualized expense ratio used to calculate the expense estimate in the table below.
Hypothetical Example for Comparison Purposes
The second line of the accompanying table for each class of the Fund provides information about hypothetical account values and hypothetical expenses based on a Class' actual expense ratio and an assumed rate of return of 5% per year before expenses, which is not the Class' actual return. The hypothetical account values and expenses may not be used to estimate the actual ending account balance or expenses you paid for the period. You may use this information to compare the ongoing costs of investing in the Fund and other funds. To do so, compare this 5% hypothetical example with the 5% hypothetical examples that appear in the shareholder reports of the other funds. In addition, the Fund, as a shareholder in the underlying Fidelity Central Funds, will indirectly bear its pro-rata share of the fees and expenses incurred by the underlying Fidelity Central Funds. These fees and expenses are not included in the Fund's annualized expense ratio used to calculate the expense estimate in the table below.
Please note that the expenses shown in the table are meant to highlight your ongoing costs only and do not reflect any transaction costs. Therefore, the second line of the table is useful in comparing ongoing costs only, and will not help you determine the relative total costs of owning different funds. In addition, if these transactional costs were included, your costs would have been higher.
| Annualized Expense Ratio-A | Beginning Account Value December 1, 2016 | Ending Account Value May 31, 2017 | Expenses Paid During Period-B December 1, 2016 to May 31, 2017 | |
| Class A | .85% | |||
| Actual | $1,000.00 | $1,086.20 | $4.42 | |
| Hypothetical-C | $1,000.00 | $1,020.69 | $4.28 | |
| Class M | 1.09% | |||
| Actual | $1,000.00 | $1,084.50 | $5.66 | |
| Hypothetical-C | $1,000.00 | $1,019.50 | $5.49 | |
| Class C | 1.61% | |||
| Actual | $1,000.00 | $1,081.80 | $8.36 | |
| Hypothetical-C | $1,000.00 | $1,016.90 | $8.10 | |
| Class I | .61% | |||
| Actual | $1,000.00 | $1,087.30 | $3.17 | |
| Hypothetical-C | $1,000.00 | $1,021.89 | $3.07 | |
| Class Z | .45% | |||
| Actual | $1,000.00 | $1,088.00 | $2.34 | |
| Hypothetical-C | $1,000.00 | $1,022.69 | $2.27 |
A Annualized expense ratio reflects expenses net of applicable fee waivers.
B Expenses are equal to each Class' annualized expense ratio, multiplied by the average account value over the period, multiplied by 182/365 (to reflect the one-half year period).
C 5% return per year before expenses
![]()
ADGF-SANN-0717
1.721239.118
Fidelity Advisor® Equity Value Fund Semi-Annual Report May 31, 2017 |
|
Contents
To view a fund's proxy voting guidelines and proxy voting record for the 12-month period ended June 30, visit http://www.fidelity.com/proxyvotingresults or visit the Securities and Exchange Commission's (SEC) web site at http://www.sec.gov.
You may also call 1-877-208-0098 to request a free copy of the proxy voting guidelines.
Standard & Poor's, S&P and S&P 500 are registered service marks of The McGraw-Hill Companies, Inc. and have been licensed for use by Fidelity Distributors Corporation.
Other third-party marks appearing herein are the property of their respective owners.
All other marks appearing herein are registered or unregistered trademarks or service marks of FMR LLC or an affiliated company. © 2017 FMR LLC. All rights reserved.
This report and the financial statements contained herein are submitted for the general information of the shareholders of the Fund. This report is not authorized for distribution to prospective investors in the Fund unless preceded or accompanied by an effective prospectus.
A fund files its complete schedule of portfolio holdings with the SEC for the first and third quarters of each fiscal year on Form N-Q. Forms N-Q are available on the SEC’s web site at http://www.sec.gov. A fund's Forms N-Q may be reviewed and copied at the SEC’s Public Reference Room in Washington, DC. Information regarding the operation of the SEC's Public Reference Room may be obtained by calling 1-800-SEC-0330.
For a complete list of a fund's portfolio holdings, view the most recent holdings listing, semiannual report, or annual report on Fidelity's web site at http://www.fidelity.com, http://www.institutional.fidelity.com, or http://www.401k.com, as applicable.
NOT FDIC INSURED •MAY LOSE VALUE •NO BANK GUARANTEE
Neither the Fund nor Fidelity Distributors Corporation is a bank.
Investment Summary (Unaudited)
Top Ten Stocks as of May 31, 2017
| % of fund's net assets | % of fund's net assets 6 months ago | |
| Berkshire Hathaway, Inc. Class B | 3.4 | 3.4 |
| Wells Fargo & Co. | 3.0 | 3.0 |
| JPMorgan Chase & Co. | 2.6 | 4.2 |
| Alphabet, Inc. Class A | 2.1 | 2.0 |
| Apple, Inc. | 2.1 | 1.9 |
| Amgen, Inc. | 2.0 | 2.1 |
| U.S. Bancorp | 2.0 | 1.9 |
| United Technologies Corp. | 1.7 | 1.4 |
| General Electric Co. | 1.7 | 2.8 |
| Johnson & Johnson | 1.7 | 3.1 |
| 22.3 |
Top Five Market Sectors as of May 31, 2017
| % of fund's net assets | % of fund's net assets 6 months ago | |
| Financials | 22.9 | 28.7 |
| Health Care | 14.1 | 13.5 |
| Information Technology | 12.7 | 14.4 |
| Consumer Discretionary | 9.8 | 10.4 |
| Consumer Staples | 7.0 | 3.9 |
Asset Allocation (% of fund's net assets)
| As of May 31, 2017 * | ||
| Stocks | 89.9% | |
| Short-Term Investments and Net Other Assets (Liabilities) | 10.1% | |

* Foreign investments - 22.1%
| As of November 30, 2016 * | ||
| Stocks | 94.0% | |
| Short-Term Investments and Net Other Assets (Liabilities) | 6.0% | |

* Foreign investments - 19.8%
Investments May 31, 2017 (Unaudited)
Showing Percentage of Net Assets
| Common Stocks - 89.9% | |||
| Shares | Value | ||
| CONSUMER DISCRETIONARY - 9.8% | |||
| Auto Components - 0.5% | |||
| Hyundai Mobis | 3,850 | $944,003 | |
| Leisure Products - 0.7% | |||
| Vista Outdoor, Inc. (a) | 68,300 | 1,432,934 | |
| Media - 6.1% | |||
| CBS Corp. Class B | 29,700 | 1,814,967 | |
| Charter Communications, Inc. Class A (a) | 3,211 | 1,109,561 | |
| Corus Entertainment, Inc. Class B (non-vtg.) | 61,600 | 609,228 | |
| Discovery Communications, Inc. Class A (a)(b) | 55,000 | 1,457,500 | |
| John Wiley & Sons, Inc. Class A | 21,215 | 1,075,601 | |
| Lions Gate Entertainment Corp.: | |||
| Class A | 18,950 | 513,545 | |
| Class B (a) | 81,381 | 2,058,125 | |
| Time Warner, Inc. | 22,500 | 2,238,525 | |
| Twenty-First Century Fox, Inc. Class A | 73,000 | 1,979,760 | |
| 12,856,812 | |||
| Specialty Retail - 0.7% | |||
| Cabela's, Inc. Class A (a) | 25,900 | 1,368,297 | |
| Textiles, Apparel & Luxury Goods - 1.8% | |||
| Christian Dior SA | 5,300 | 1,513,445 | |
| PVH Corp. | 21,700 | 2,299,115 | |
| 3,812,560 | |||
| TOTAL CONSUMER DISCRETIONARY | 20,414,606 | ||
| CONSUMER STAPLES - 7.0% | |||
| Beverages - 1.5% | |||
| C&C Group PLC | 372,820 | 1,423,945 | |
| PepsiCo, Inc. | 14,400 | 1,682,928 | |
| 3,106,873 | |||
| Food & Staples Retailing - 2.2% | |||
| CVS Health Corp. | 34,000 | 2,612,220 | |
| Wal-Mart Stores, Inc. | 26,700 | 2,098,620 | |
| 4,710,840 | |||
| Food Products - 2.0% | |||
| Kellogg Co. | 13,200 | 945,120 | |
| Seaboard Corp. | 300 | 1,214,853 | |
| The J.M. Smucker Co. | 16,279 | 2,081,270 | |
| 4,241,243 | |||
| Personal Products - 0.7% | |||
| Unilever NV (Certificaten Van Aandelen) (Bearer) | 24,800 | 1,412,723 | |
| Tobacco - 0.6% | |||
| British American Tobacco PLC: | |||
| (United Kingdom) | 14,400 | 1,030,213 | |
| sponsored ADR | 2,800 | 201,936 | |
| 1,232,149 | |||
| TOTAL CONSUMER STAPLES | 14,703,828 | ||
| ENERGY - 7.0% | |||
| Oil, Gas & Consumable Fuels - 7.0% | |||
| Chevron Corp. | 30,697 | 3,176,526 | |
| FLEX LNG Ltd. (a) | 638,500 | 808,582 | |
| GasLog Ltd. | 27,800 | 360,010 | |
| GasLog Partners LP | 77,000 | 1,686,300 | |
| Golar LNG Partners LP | 69,200 | 1,367,392 | |
| Hoegh LNG Partners LP | 45,800 | 874,780 | |
| Phillips 66 Co. | 25,600 | 1,948,416 | |
| Suncor Energy, Inc. | 33,100 | 1,035,991 | |
| Teekay Corp. (b) | 135,500 | 827,905 | |
| Teekay LNG Partners LP | 92,500 | 1,406,000 | |
| Teekay Offshore Partners LP | 375,913 | 1,176,608 | |
| 14,668,510 | |||
| FINANCIALS - 22.9% | |||
| Banks - 8.4% | |||
| JPMorgan Chase & Co. | 66,252 | 5,442,602 | |
| SunTrust Banks, Inc. | 32,300 | 1,723,851 | |
| U.S. Bancorp | 81,366 | 4,140,716 | |
| Wells Fargo & Co. | 122,132 | 6,245,830 | |
| 17,552,999 | |||
| Capital Markets - 1.2% | |||
| Goldman Sachs Group, Inc. | 11,900 | 2,513,994 | |
| Consumer Finance - 2.1% | |||
| Capital One Financial Corp. | 12,918 | 993,653 | |
| Discover Financial Services | 28,800 | 1,690,560 | |
| Synchrony Financial | 61,200 | 1,643,220 | |
| 4,327,433 | |||
| Diversified Financial Services - 3.4% | |||
| Berkshire Hathaway, Inc. Class B (a) | 42,969 | 7,101,914 | |
| Insurance - 5.0% | |||
| Allied World Assurance Co. Holdings AG | 28,300 | 1,487,731 | |
| Allstate Corp. | 21,300 | 1,839,042 | |
| Chubb Ltd. | 13,400 | 1,918,746 | |
| FNF Group | 25,380 | 1,081,442 | |
| FNFV Group (a) | 30,592 | 426,758 | |
| Prudential PLC | 72,464 | 1,625,830 | |
| The Travelers Companies, Inc. | 17,487 | 2,183,252 | |
| 10,562,801 | |||
| Mortgage Real Estate Investment Trusts - 2.8% | |||
| Agnc Investment Corp. | 90,201 | 1,875,279 | |
| Annaly Capital Management, Inc. | 179,505 | 2,150,470 | |
| MFA Financial, Inc. | 209,136 | 1,740,012 | |
| 5,765,761 | |||
| TOTAL FINANCIALS | 47,824,902 | ||
| HEALTH CARE - 14.1% | |||
| Biotechnology - 3.0% | |||
| Amgen, Inc. | 26,700 | 4,144,908 | |
| Dyax Corp. rights 12/31/19 (a) | 58,900 | 190,836 | |
| Shire PLC sponsored ADR | 10,943 | 1,890,075 | |
| 6,225,819 | |||
| Health Care Providers & Services - 4.5% | |||
| Aetna, Inc. | 10,900 | 1,578,974 | |
| Anthem, Inc. | 10,000 | 1,823,500 | |
| Cigna Corp. | 20,400 | 3,289,092 | |
| McKesson Corp. | 16,300 | 2,658,367 | |
| 9,349,933 | |||
| Pharmaceuticals - 6.6% | |||
| Allergan PLC | 13,100 | 2,931,125 | |
| Bayer AG | 18,700 | 2,484,720 | |
| Johnson & Johnson | 27,392 | 3,513,024 | |
| Sanofi SA sponsored ADR | 48,000 | 2,380,320 | |
| Teva Pharmaceutical Industries Ltd. sponsored ADR | 94,632 | 2,636,448 | |
| 13,945,637 | |||
| TOTAL HEALTH CARE | 29,521,389 | ||
| INDUSTRIALS - 6.3% | |||
| Aerospace & Defense - 1.7% | |||
| United Technologies Corp. | 29,500 | 3,577,760 | |
| Industrial Conglomerates - 1.7% | |||
| General Electric Co. | 130,500 | 3,573,090 | |
| Machinery - 0.5% | |||
| Deere & Co. | 8,210 | 1,005,397 | |
| Professional Services - 1.9% | |||
| Dun & Bradstreet Corp. | 24,200 | 2,533,982 | |
| Nielsen Holdings PLC | 38,700 | 1,489,176 | |
| 4,023,158 | |||
| Trading Companies & Distributors - 0.5% | |||
| AerCap Holdings NV (a) | 23,400 | 1,030,068 | |
| TOTAL INDUSTRIALS | 13,209,473 | ||
| INFORMATION TECHNOLOGY - 12.7% | |||
| Communications Equipment - 2.8% | |||
| Cisco Systems, Inc. | 101,082 | 3,187,115 | |
| Harris Corp. | 14,500 | 1,626,320 | |
| Juniper Networks, Inc. | 37,800 | 1,108,674 | |
| 5,922,109 | |||
| Electronic Equipment & Components - 0.7% | |||
| TE Connectivity Ltd. | 16,998 | 1,340,292 | |
| Internet Software & Services - 3.5% | |||
| Alphabet, Inc. Class A (a) | 4,500 | 4,441,905 | |
| comScore, Inc. (a) | 50,800 | 1,275,080 | |
| VeriSign, Inc. (a)(b) | 18,500 | 1,667,960 | |
| 7,384,945 | |||
| IT Services - 2.1% | |||
| Amdocs Ltd. | 19,800 | 1,282,644 | |
| Cognizant Technology Solutions Corp. Class A | 25,000 | 1,672,750 | |
| The Western Union Co. | 78,100 | 1,485,462 | |
| 4,440,856 | |||
| Semiconductors & Semiconductor Equipment - 0.9% | |||
| Lattice Semiconductor Corp. (a) | 63,100 | 438,545 | |
| NXP Semiconductors NV (a) | 13,700 | 1,505,630 | |
| 1,944,175 | |||
| Software - 0.6% | |||
| Oracle Corp. | 28,187 | 1,279,408 | |
| Technology Hardware, Storage & Peripherals - 2.1% | |||
| Apple, Inc. | 27,900 | 4,262,004 | |
| TOTAL INFORMATION TECHNOLOGY | 26,573,789 | ||
| MATERIALS - 3.5% | |||
| Chemicals - 2.0% | |||
| LyondellBasell Industries NV Class A | 24,600 | 1,980,792 | |
| Monsanto Co. | 13,000 | 1,526,460 | |
| Valspar Corp. | 5,800 | 655,342 | |
| 4,162,594 | |||
| Containers & Packaging - 1.5% | |||
| Ball Corp. | 39,300 | 1,607,370 | |
| Graphic Packaging Holding Co. | 112,400 | 1,518,524 | |
| 3,125,894 | |||
| TOTAL MATERIALS | 7,288,488 | ||
| REAL ESTATE - 1.0% | |||
| Real Estate Management & Development - 1.0% | |||
| CBRE Group, Inc. (a) | 58,400 | 2,036,992 | |
| TELECOMMUNICATION SERVICES - 1.6% | |||
| Diversified Telecommunication Services - 1.6% | |||
| Verizon Communications, Inc. | 69,600 | 3,246,144 | |
| UTILITIES - 4.0% | |||
| Electric Utilities - 4.0% | |||
| DONG Energy A/S | 19,400 | 847,026 | |
| Exelon Corp. | 79,800 | 2,897,538 | |
| PPL Corp. | 47,800 | 1,907,698 | |
| Xcel Energy, Inc. | 58,200 | 2,788,362 | |
| 8,440,624 | |||
| TOTAL COMMON STOCKS | |||
| (Cost $162,675,819) | 187,928,745 | ||
| Money Market Funds - 12.1% | |||
| Fidelity Cash Central Fund, 0.86% (c) | 21,615,908 | 21,620,231 | |
| Fidelity Securities Lending Cash Central Fund 0.87% (c)(d) | 3,666,830 | 3,667,197 | |
| TOTAL MONEY MARKET FUNDS | |||
| (Cost $25,287,268) | 25,287,428 | ||
| TOTAL INVESTMENT PORTFOLIO - 102.0% | |||
| (Cost $187,963,087) | 213,216,173 | ||
| NET OTHER ASSETS (LIABILITIES) - (2.0)% | (4,120,003) | ||
| NET ASSETS - 100% | $209,096,170 |
Legend
(a) Non-income producing
(b) Security or a portion of the security is on loan at period end.
(c) Affiliated fund that is generally available only to investment companies and other accounts managed by Fidelity Investments. The rate quoted is the annualized seven-day yield of the fund at period end. A complete unaudited listing of the fund's holdings as of its most recent quarter end is available upon request. In addition, each Fidelity Central Fund's financial statements are available on the SEC's website or upon request.
(d) Investment made with cash collateral received from securities on loan.
Affiliated Central Funds
Information regarding fiscal year to date income earned by the Fund from investments in Fidelity Central Funds is as follows:
| Fund | Income earned |
| Fidelity Cash Central Fund | $32,349 |
| Fidelity Securities Lending Cash Central Fund | 6,899 |
| Total | $39,248 |
Investment Valuation
The following is a summary of the inputs used, as of May 31, 2017, involving the Fund's assets and liabilities carried at fair value. The inputs or methodology used for valuing securities may not be an indication of the risk associated with investing in those securities. For more information on valuation inputs, and their aggregation into the levels used below, please refer to the Investment Valuation section in the accompanying Notes to Financial Statements.
| Valuation Inputs at Reporting Date: | ||||
| Description | Total | Level 1 | Level 2 | Level 3 |
| Investments in Securities: | ||||
| Equities: | ||||
| Consumer Discretionary | $20,414,606 | $20,414,606 | $-- | $-- |
| Consumer Staples | 14,703,828 | 12,260,892 | 2,442,936 | -- |
| Energy | 14,668,510 | 14,668,510 | -- | -- |
| Financials | 47,824,902 | 46,199,072 | 1,625,830 | -- |
| Health Care | 29,521,389 | 26,845,833 | 2,484,720 | 190,836 |
| Industrials | 13,209,473 | 13,209,473 | -- | -- |
| Information Technology | 26,573,789 | 26,573,789 | -- | -- |
| Materials | 7,288,488 | 7,288,488 | -- | -- |
| Real Estate | 2,036,992 | 2,036,992 | -- | -- |
| Telecommunication Services | 3,246,144 | 3,246,144 | -- | -- |
| Utilities | 8,440,624 | 8,440,624 | -- | -- |
| Money Market Funds | 25,287,428 | 25,287,428 | -- | -- |
| Total Investments in Securities: | $213,216,173 | $206,471,851 | $6,553,486 | $190,836 |
Other Information
Distribution of investments by country or territory of incorporation, as a percentage of Total Net Assets, is as follows (Unaudited):
| United States of America | 77.9% |
| Marshall Islands | 3.5% |
| Netherlands | 2.9% |
| Switzerland | 2.3% |
| Ireland | 2.1% |
| United Kingdom | 2.1% |
| Canada | 2.0% |
| France | 1.8% |
| Israel | 1.2% |
| Germany | 1.2% |
| Others (Individually Less Than 1%) | 3.0% |
| 100.0% |
See accompanying notes which are an integral part of the financial statements.
Financial Statements
Statement of Assets and Liabilities
| May 31, 2017 (Unaudited) | ||
| Assets | ||
| Investment in securities, at value (including securities loaned of $3,587,006) — See accompanying schedule: Unaffiliated issuers (cost $162,675,819) | $187,928,745 | |
| Fidelity Central Funds (cost $25,287,268) | 25,287,428 | |
| Total Investments (cost $187,963,087) | $213,216,173 | |
| Cash | 336,533 | |
| Foreign currency held at value (cost $85) | 85 | |
| Receivable for fund shares sold | 566,766 | |
| Dividends receivable | 434,775 | |
| Distributions receivable from Fidelity Central Funds | 8,784 | |
| Prepaid expenses | 56 | |
| Other receivables | 521 | |
| Total assets | 214,563,693 | |
| Liabilities | ||
| Payable for investments purchased | $1,180,423 | |
| Payable for fund shares redeemed | 415,128 | |
| Accrued management fee | 76,949 | |
| Distribution and service plan fees payable | 56,782 | |
| Other affiliated payables | 36,514 | |
| Other payables and accrued expenses | 35,277 | |
| Collateral on securities loaned | 3,666,450 | |
| Total liabilities | 5,467,523 | |
| Net Assets | $209,096,170 | |
| Net Assets consist of: | ||
| Paid in capital | $181,632,940 | |
| Undistributed net investment income | 590,276 | |
| Accumulated undistributed net realized gain (loss) on investments and foreign currency transactions | 1,619,386 | |
| Net unrealized appreciation (depreciation) on investments and assets and liabilities in foreign currencies | 25,253,568 | |
| Net Assets | $209,096,170 | |
| Calculation of Maximum Offering Price | ||
| Class A: | ||
| Net Asset Value and redemption price per share ($81,732,977 ÷ 4,673,290 shares) | $17.49 | |
| Maximum offering price per share (100/94.25 of $17.49) | $18.56 | |
| Class M: | ||
| Net Asset Value and redemption price per share ($40,220,776 ÷ 2,301,481 shares) | $17.48 | |
| Maximum offering price per share (100/96.50 of $17.48) | $18.11 | |
| Class C: | ||
| Net Asset Value and offering price per share ($27,021,634 ÷ 1,582,193 shares)(a) | $17.08 | |
| Class I: | ||
| Net Asset Value, offering price and redemption price per share ($60,013,669 ÷ 3,376,127 shares) | $17.78 | |
| Class Z: | ||
| Net Asset Value, offering price and redemption price per share ($107,114 ÷ 6,022 shares) | $17.79 |
(a) Redemption price per share is equal to net asset value less any applicable contingent deferred sales charge.
See accompanying notes which are an integral part of the financial statements.
Statement of Operations
| Six months ended May 31, 2017 (Unaudited) | ||
| Investment Income | ||
| Dividends | $1,854,928 | |
| Income from Fidelity Central Funds | 39,248 | |
| Total income | 1,894,176 | |
| Expenses | ||
| Management fee | ||
| Basic fee | $489,436 | |
| Performance adjustment | (22,175) | |
| Transfer agent fees | 188,982 | |
| Distribution and service plan fees | 356,922 | |
| Accounting and security lending fees | 35,178 | |
| Custodian fees and expenses | 11,403 | |
| Independent trustees' fees and expenses | 355 | |
| Registration fees | 77,011 | |
| Audit | 37,298 | |
| Legal | 3,626 | |
| Miscellaneous | 853 | |
| Total expenses before reductions | 1,178,889 | |
| Expense reductions | (19,389) | 1,159,500 |
| Net investment income (loss) | 734,676 | |
| Realized and Unrealized Gain (Loss) | ||
| Net realized gain (loss) on: | ||
| Investment securities: | ||
| Unaffiliated issuers | 4,966,412 | |
| Fidelity Central Funds | 729 | |
| Foreign currency transactions | 4,793 | |
| Total net realized gain (loss) | 4,971,934 | |
| Change in net unrealized appreciation (depreciation) on: Investment securities | 6,296,213 | |
| Assets and liabilities in foreign currencies | 1,419 | |
| Total change in net unrealized appreciation (depreciation) | 6,297,632 | |
| Net gain (loss) | 11,269,566 | |
| Net increase (decrease) in net assets resulting from operations | $12,004,242 |
See accompanying notes which are an integral part of the financial statements.
Statement of Changes in Net Assets
| Six months ended May 31, 2017 (Unaudited) | Year ended November 30, 2016 | |
| Increase (Decrease) in Net Assets | ||
| Operations | ||
| Net investment income (loss) | $734,676 | $1,502,803 |
| Net realized gain (loss) | 4,971,934 | (1,679,697) |
| Change in net unrealized appreciation (depreciation) | 6,297,632 | 13,411,815 |
| Net increase (decrease) in net assets resulting from operations | 12,004,242 | 13,234,921 |
| Distributions to shareholders from net investment income | (1,129,899) | (2,149,087) |
| Distributions to shareholders from net realized gain | – | (1,357,985) |
| Total distributions | (1,129,899) | (3,507,072) |
| Share transactions - net increase (decrease) | 24,891,821 | 5,898,818 |
| Total increase (decrease) in net assets | 35,766,164 | 15,626,667 |
| Net Assets | ||
| Beginning of period | 173,330,006 | 157,703,339 |
| End of period | $209,096,170 | $173,330,006 |
| Other Information | ||
| Undistributed net investment income end of period | $590,276 | $985,499 |
See accompanying notes which are an integral part of the financial statements.
Financial Highlights — Fidelity Advisor Equity Value Fund Class A
| Six months ended (Unaudited) May 31, | Years ended November 30, | |||||
| 2017 | 2016 | 2015 | 2014 | 2013 | 2012 | |
| Selected Per–Share Data | ||||||
| Net asset value, beginning of period | $16.46 | $15.66 | $16.00 | $13.93 | $10.60 | $9.09 |
| Income from Investment Operations | ||||||
| Net investment income (loss)A | .08 | .17 | .35B | .17 | .13 | .12 |
| Net realized and unrealized gain (loss) | 1.08 | 1.00 | (.50)C | 2.01 | 3.33 | 1.44 |
| Total from investment operations | 1.16 | 1.17 | (.15) | 2.18 | 3.46 | 1.56 |
| Distributions from net investment income | (.13) | (.24)D | (.19) | (.11) | (.13) | (.05) |
| Distributions from net realized gain | – | (.13)D | – | – | – | – |
| Total distributions | (.13) | (.37) | (.19) | (.11) | (.13) | (.05) |
| Net asset value, end of period | $17.49 | $16.46 | $15.66 | $16.00 | $13.93 | $10.60 |
| Total ReturnE,F,G | 7.08% | 7.75% | (.91)%C | 15.79% | 33.09% | 17.27% |
| Ratios to Average Net AssetsH,I | ||||||
| Expenses before reductions | 1.17%J | 1.19% | 1.24% | 1.23% | 1.22% | 1.30% |
| Expenses net of fee waivers, if any | 1.15%J | 1.19% | 1.23% | 1.23% | 1.22% | 1.25% |
| Expenses net of all reductions | 1.14%J | 1.19% | 1.23% | 1.23% | 1.20% | 1.25% |
| Net investment income (loss) | .97%J | 1.08% | 2.23%B | 1.15% | 1.07% | 1.20% |
| Supplemental Data | ||||||
| Net assets, end of period (000 omitted) | $81,733 | $77,787 | $67,005 | $50,957 | $39,538 | $29,282 |
| Portfolio turnover rateK | 49%J | 46% | 49% | 68% | 68% | 77% |
A Calculated based on average shares outstanding during the period.
B Net Investment income per share reflects a large, non-recurring dividend which amounted to $.14 per share. Excluding this non-recurring dividend, the ratio of net investment income (loss) to average net assets would have been 1.31%.
C Net realized and unrealized gain (loss) per share reflects proceeds received from litigation which amounted to $0.01 per share. Excluding these litigation proceeds, the total return would have been (.99)%
D The amounts shown reflect certain reclassifications related to book to tax differences that were made in the year shown.
E Total returns for periods of less than one year are not annualized.
F Total returns would have been lower if certain expenses had not been reduced during the applicable periods shown.
G Total returns do not include the effect of the sales charges.
H Fees and expenses of any underlying Fidelity Central Funds are not included in the Fund's expense ratio. The Fund indirectly bears its proportionate share of the expenses of any underlying Fidelity Central Funds.
I Expense ratios reflect operating expenses of the class. Expenses before reductions do not reflect amounts reimbursed by the investment adviser or reductions from brokerage service arrangements or reductions from other expense offset arrangements and do not represent the amount paid by the class during periods when reimbursements or reductions occur. Expenses net of fee waivers reflect expenses after reimbursement by the investment adviser but prior to reductions from brokerage service arrangements or other expense offset arrangements. Expenses net of all reductions represent the net expenses paid by the class.
J Annualized
K Amount does not include the portfolio activity of any underlying Fidelity Central Funds.
See accompanying notes which are an integral part of the financial statements.
Financial Highlights — Fidelity Advisor Equity Value Fund Class M
| Six months ended (Unaudited) May 31, | Years ended November 30, | |||||
| 2017 | 2016 | 2015 | 2014 | 2013 | 2012 | |
| Selected Per–Share Data | ||||||
| Net asset value, beginning of period | $16.43 | $15.62 | $15.96 | $13.90 | $10.57 | $9.06 |
| Income from Investment Operations | ||||||
| Net investment income (loss)A | .06 | .12 | .31B | .13 | .10 | .09 |
| Net realized and unrealized gain (loss) | 1.08 | 1.01 | (.50)C | 2.01 | 3.34 | 1.44 |
| Total from investment operations | 1.14 | 1.13 | (.19) | 2.14 | 3.44 | 1.53 |
| Distributions from net investment income | (.09) | (.19)D | (.15) | (.08) | (.11) | (.02) |
| Distributions from net realized gain | – | (.13)D | – | – | – | – |
| Total distributions | (.09) | (.32) | (.15) | (.08) | (.11) | (.02) |
| Net asset value, end of period | $17.48 | $16.43 | $15.62 | $15.96 | $13.90 | $10.57 |
| Total ReturnE,F,G | 6.94% | 7.49% | (1.19)%C | 15.46% | 32.82% | 16.94% |
| Ratios to Average Net AssetsH,I | ||||||
| Expenses before reductions | 1.43%J | 1.46% | 1.50% | 1.49% | 1.48% | 1.55% |
| Expenses net of fee waivers, if any | 1.41%J | 1.46% | 1.50% | 1.49% | 1.48% | 1.50% |
| Expenses net of all reductions | 1.41%J | 1.45% | 1.50% | 1.49% | 1.46% | 1.50% |
| Net investment income (loss) | .70%J | .81% | 1.96%B | .88% | .81% | .95% |
| Supplemental Data | ||||||
| Net assets, end of period (000 omitted) | $40,221 | $38,565 | $34,643 | $31,087 | $27,241 | $21,212 |
| Portfolio turnover rateK | 49%J | 46% | 49% | 68% | 68% | 77% |
A Calculated based on average shares outstanding during the period.
B Net Investment income per share reflects a large, non-recurring dividend which amounted to $.14 per share. Excluding this non-recurring dividend, the ratio of net investment income (loss) to average net assets would have been 1.05%.
C Net realized and unrealized gain (loss) per share reflects proceeds received from litigation which amounted to $0.01 per share. Excluding these litigation proceeds, the total return would have been (1.27)%
D The amounts shown reflect certain reclassifications related to book to tax differences that were made in the year shown.
E Total returns for periods of less than one year are not annualized.
F Total returns would have been lower if certain expenses had not been reduced during the applicable periods shown.
G Total returns do not include the effect of the sales charges.
H Fees and expenses of any underlying Fidelity Central Funds are not included in the Fund's expense ratio. The Fund indirectly bears its proportionate share of the expenses of any underlying Fidelity Central Funds.
I Expense ratios reflect operating expenses of the class. Expenses before reductions do not reflect amounts reimbursed by the investment adviser or reductions from brokerage service arrangements or reductions from other expense offset arrangements and do not represent the amount paid by the class during periods when reimbursements or reductions occur. Expenses net of fee waivers reflect expenses after reimbursement by the investment adviser but prior to reductions from brokerage service arrangements or other expense offset arrangements. Expenses net of all reductions represent the net expenses paid by the class.
J Annualized
K Amount does not include the portfolio activity of any underlying Fidelity Central Funds.
See accompanying notes which are an integral part of the financial statements.
See accompanying notes which are an integral part of the financial statements.
See accompanying notes which are an integral part of the financial statements.
Financial Highlights — Fidelity Advisor Equity Value Fund Class C
| Six months ended (Unaudited) May 31, | Years ended November 30, | |||||
| 2017 | 2016 | 2015 | 2014 | 2013 | 2012 | |
| Selected Per–Share Data | ||||||
| Net asset value, beginning of period | $16.04 | $15.27 | $15.63 | $13.63 | $10.37 | $8.91 |
| Income from Investment Operations | ||||||
| Net investment income (loss)A | .02 | .05 | .23B | .06 | .04 | .04 |
| Net realized and unrealized gain (loss) | 1.04 | .98 | (.49)C | 1.97 | 3.28 | 1.42 |
| Total from investment operations | 1.06 | 1.03 | (.26) | 2.03 | 3.32 | 1.46 |
| Distributions from net investment income | (.02) | (.13)D | (.10) | (.03) | (.06) | – |
| Distributions from net realized gain | – | (.13)D | – | – | – | – |
| Total distributions | (.02) | (.26) | (.10) | (.03) | (.06) | – |
| Net asset value, end of period | $17.08 | $16.04 | $15.27 | $15.63 | $13.63 | $10.37 |
| Total ReturnE,F,G | 6.64% | 6.95% | (1.68)%C | 14.90% | 32.16% | 16.39% |
| Ratios to Average Net AssetsH,I | ||||||
| Expenses before reductions | 1.94%J | 1.96% | 2.00% | 2.00% | 1.97% | 2.05% |
| Expenses net of fee waivers, if any | 1.92%J | 1.96% | 2.00% | 2.00% | 1.97% | 2.00% |
| Expenses net of all reductions | 1.92%J | 1.95% | 2.00% | 1.99% | 1.96% | 2.00% |
| Net investment income (loss) | .20%J | .31% | 1.46%B | .38% | .32% | .45% |
| Supplemental Data | ||||||
| Net assets, end of period (000 omitted) | $27,022 | $34,006 | $28,295 | $18,614 | $12,329 | $8,785 |
| Portfolio turnover rateK | 49%J | 46% | 49% | 68% | 68% | 77% |
A Calculated based on average shares outstanding during the period.
B Net Investment income per share reflects a large, non-recurring dividend which amounted to $.14 per share. Excluding this non-recurring dividend, the ratio of net investment income (loss) to average net assets would have been .55%.
C Net realized and unrealized gain (loss) per share reflects proceeds received from litigation which amounted to $0.01 per share. Excluding these litigation proceeds, the total return would have been (1.76)%
D The amounts shown reflect certain reclassifications related to book to tax differences that were made in the year shown.
E Total returns for periods of less than one year are not annualized.
F Total returns would have been lower if certain expenses had not been reduced during the applicable periods shown.
G Total returns do not include the effect of the contingent deferred sales charge.
H Fees and expenses of any underlying Fidelity Central Funds are not included in the Fund's expense ratio. The Fund indirectly bears its proportionate share of the expenses of any underlying Fidelity Central Funds.
I Expense ratios reflect operating expenses of the class. Expenses before reductions do not reflect amounts reimbursed by the investment adviser or reductions from brokerage service arrangements or reductions from other expense offset arrangements and do not represent the amount paid by the class during periods when reimbursements or reductions occur. Expenses net of fee waivers reflect expenses after reimbursement by the investment adviser but prior to reductions from brokerage service arrangements or other expense offset arrangements. Expenses net of all reductions represent the net expenses paid by the class.
J Annualized
K Amount does not include the portfolio activity of any underlying Fidelity Central Funds.
See accompanying notes which are an integral part of the financial statements.
Financial Highlights — Fidelity Advisor Equity Value Fund Class I
| Six months ended (Unaudited) May 31, | Years ended November 30, | |||||
| 2017 | 2016 | 2015 | 2014 | 2013 | 2012 | |
| Selected Per–Share Data | ||||||
| Net asset value, beginning of period | $16.74 | $15.93 | $16.27 | $14.16 | $10.75 | $9.22 |
| Income from Investment Operations | ||||||
| Net investment income (loss)A | .11 | .21 | .40B | .22 | .17 | .15 |
| Net realized and unrealized gain (loss) | 1.10 | 1.02 | (.50)C | 2.04 | 3.39 | 1.45 |
| Total from investment operations | 1.21 | 1.23 | (.10) | 2.26 | 3.56 | 1.60 |
| Distributions from net investment income | (.17) | (.29)D | (.24) | (.15) | (.15) | (.07) |
| Distributions from net realized gain | – | (.13)D | – | – | – | – |
| Total distributions | (.17) | (.42) | (.24) | (.15) | (.15) | (.07) |
| Net asset value, end of period | $17.78 | $16.74 | $15.93 | $16.27 | $14.16 | $10.75 |
| Total ReturnE,F | 7.28% | 8.02% | (.60)%C | 16.16% | 33.61% | 17.49% |
| Ratios to Average Net AssetsG,H | ||||||
| Expenses before reductions | .87%I | .91% | .93% | .91% | .89% | .96% |
| Expenses net of fee waivers, if any | .85%I | .91% | .93% | .91% | .89% | .96% |
| Expenses net of all reductions | .85%I | .91% | .93% | .91% | .87% | .96% |
| Net investment income (loss) | 1.26%I | 1.36% | 2.53%B | 1.46% | 1.40% | 1.49% |
| Supplemental Data | ||||||
| Net assets, end of period (000 omitted) | $60,014 | $22,972 | $25,984 | $5,162 | $3,126 | $2,123 |
| Portfolio turnover rateJ | 49%I | 46% | 49% | 68% | 68% | 77% |
A Calculated based on average shares outstanding during the period.
B Net Investment income per share reflects a large, non-recurring dividend which amounted to $.15 per share. Excluding this non-recurring dividend, the ratio of net investment income (loss) to average net assets would have been 1.61%.
C Net realized and unrealized gain (loss) per share reflects proceeds received from litigation which amounted to $0.01 per share. Excluding these litigation proceeds, the total return would have been (.68)%
D The amounts shown reflect certain reclassifications related to book to tax differences that were made in the year shown.
E Total returns for periods of less than one year are not annualized.
F Total returns would have been lower if certain expenses had not been reduced during the applicable periods shown.
G Fees and expenses of any underlying Fidelity Central Funds are not included in the Fund's expense ratio. The Fund indirectly bears its proportionate share of the expenses of any underlying Fidelity Central Funds.
H Expense ratios reflect operating expenses of the class. Expenses before reductions do not reflect amounts reimbursed by the investment adviser or reductions from brokerage service arrangements or reductions from other expense offset arrangements and do not represent the amount paid by the class during periods when reimbursements or reductions occur. Expenses net of fee waivers reflect expenses after reimbursement by the investment adviser but prior to reductions from brokerage service arrangements or other expense offset arrangements. Expenses net of all reductions represent the net expenses paid by the class.
I Annualized
J Amount does not include the portfolio activity of any underlying Fidelity Central Funds.
See accompanying notes which are an integral part of the financial statements.
Financial Highlights — Fidelity Advisor Equity Value Fund Class Z
| Six months ended (Unaudited) May 31, | |
| 2017 A | |
| Selected Per–Share Data | |
| Net asset value, beginning of period | $17.46 |
| Income from Investment Operations | |
| Net investment income (loss)B | .09 |
| Net realized and unrealized gain (loss) | .24 |
| Total from investment operations | .33 |
| Distributions from net investment income | – |
| Total distributions | – |
| Net asset value, end of period | $17.79 |
| Total ReturnC,D | 1.89% |
| Ratios to Average Net AssetsE,F | |
| Expenses before reductions | .76%G |
| Expenses net of fee waivers, if any | .75%G |
| Expenses net of all reductions | .75%G |
| Net investment income (loss) | 1.60%G |
| Supplemental Data | |
| Net assets, end of period (000 omitted) | $107 |
| Portfolio turnover rateH | 49%G |
A For the period February 1, 2017 (commencement of sale of shares) to May 31, 2017.
B Calculated based on average shares outstanding during the period.
C Total returns for periods of less than one year are not annualized.
D Total returns would have been lower if certain expenses had not been reduced during the applicable periods shown.
E Fees and expenses of any underlying Fidelity Central Funds are not included in the Fund's expense ratio. The Fund indirectly bears its proportionate share of the expenses of any underlying Fidelity Central Funds.
F Expense ratios reflect operating expenses of the class. Expenses before reductions do not reflect amounts reimbursed by the investment adviser or reductions from brokerage service arrangements or reductions from other expense offset arrangements and do not represent the amount paid by the class during periods when reimbursements or reductions occur. Expense ratios before reductions for start-up periods may not be representative of longer-term operating periods. Expenses net of fee waivers reflect expenses after reimbursement by the investment adviser but prior to reductions from brokerage service arrangements or other expense offset arrangements. Expenses net of all reductions represent the net expenses paid by the class.
G Annualized
H Amount does not include the portfolio activity of any underlying Fidelity Central Funds.
See accompanying notes which are an integral part of the financial statements.
Notes to Financial Statements (Unaudited)
For the period ended May 31, 2017
1. Organization.
Fidelity Advisor Equity Value Fund (the Fund) is a fund of Fidelity Advisor Series I (the Trust) and is authorized to issue an unlimited number of shares. The Trust is registered under the Investment Company Act of 1940, as amended (the 1940 Act), as an open-end management investment company organized as a Massachusetts business trust. The Fund commenced sale of Class Z shares on February 1, 2017. The Fund offers Class A, Class M (formerly Class T), Class C, Class I and Class Z shares, each of which has equal rights as to assets and voting privileges. Each class has exclusive voting rights with respect to matters that affect that class.
After the close of business on June 24, 2016, all outstanding Class B shares were converted to Class A shares. All prior fiscal period dollar and share amounts for Class B presented in the Notes to Financial Statements are for the period December 1, 2015 through June 24, 2016.
2. Investments in Fidelity Central Funds.
The Fund invests in Fidelity Central Funds, which are open-end investment companies generally available only to other investment companies and accounts managed by the investment adviser and its affiliates. The Fund's Schedule of Investments lists each of the Fidelity Central Funds held as of period end, if any, as an investment of the Fund, but does not include the underlying holdings of each Fidelity Central Fund. As an Investing Fund, the Fund indirectly bears its proportionate share of the expenses of the underlying Fidelity Central Funds.
The Money Market Central Funds seek preservation of capital and current income and are managed by Fidelity Investments Money Management, Inc. (FIMM), an affiliate of the investment adviser. Annualized expenses of the Money Market Central Funds as of their most recent shareholder report date are less than .005%.
A complete unaudited list of holdings for each Fidelity Central Fund is available upon request or at the Securities and Exchange Commission (the SEC) website at www.sec.gov. In addition, the financial statements of the Fidelity Central Funds are available on the SEC website or upon request.
3. Significant Accounting Policies.
The Fund is an investment company and applies the accounting and reporting guidance of the Financial Accounting Standards Board (FASB) Accounting Standards Codification Topic 946 Financial Services – Investments Companies. The financial statements have been prepared in conformity with accounting principles generally accepted in the United States of America (GAAP), which require management to make certain estimates and assumptions at the date of the financial statements. Actual results could differ from those estimates. Subsequent events, if any, through the date that the financial statements were issued have been evaluated in the preparation of the financial statements. The following summarizes the significant accounting policies of the Fund:
Investment Valuation. Investments are valued as of 4:00 p.m. Eastern time on the last calendar day of the period. The Board of Trustees (the Board) has delegated the day to day responsibility for the valuation of the Fund's investments to the Fair Value Committee (the Committee) established by the Fund's investment adviser. In accordance with valuation policies and procedures approved by the Board, the Fund attempts to obtain prices from one or more third party pricing vendors or brokers to value its investments. When current market prices, quotations or currency exchange rates are not readily available or reliable, investments will be fair valued in good faith by the Committee, in accordance with procedures adopted by the Board. Factors used in determining fair value vary by investment type and may include market or investment specific events. The frequency with which these procedures are used cannot be predicted and they may be utilized to a significant extent. The Committee oversees the Fund's valuation policies and procedures and reports to the Board on the Committee's activities and fair value determinations. The Board monitors the appropriateness of the procedures used in valuing the Fund's investments and ratifies the fair value determinations of the Committee.
The Fund categorizes the inputs to valuation techniques used to value its investments into a disclosure hierarchy consisting of three levels as shown below:
- Level 1 – quoted prices in active markets for identical investments
- Level 2 – other significant observable inputs (including quoted prices for similar investments, interest rates, prepayment speeds, etc.)
- Level 3 – unobservable inputs (including the Fund's own assumptions based on the best information available)
Valuation techniques used to value the Fund's investments by major category are as follows:
Equity securities, including restricted securities, for which market quotations are readily available, are valued at the last reported sale price or official closing price as reported by a third party pricing vendor on the primary market or exchange on which they are traded and are categorized as Level 1 in the hierarchy. In the event there were no sales during the day or closing prices are not available, securities are valued at the last quoted bid price or may be valued using the last available price and are generally categorized as Level 2 in the hierarchy. For foreign equity securities, when market or security specific events arise, comparisons to the valuation of American Depositary Receipts (ADRs), futures contracts, Exchange-Traded Funds (ETFs) and certain indexes as well as quoted prices for similar securities may be used and would be categorized as Level 2 in the hierarchy. Utilizing these techniques may result in transfers between Level 1 and Level 2. For equity securities, including restricted securities, where observable inputs are limited, assumptions about market activity and risk are used and these securities may be categorized as Level 3 in the hierarchy.
Investments in open-end mutual funds, including the Fidelity Central Funds, are valued at their closing net asset value (NAV) each business day and are categorized as Level 1 in the hierarchy.
Changes in valuation techniques may result in transfers in or out of an assigned level within the disclosure hierarchy. The aggregate value of investments by input level as of May 31, 2017 is included at the end of the Fund's Schedule of Investments.
Foreign Currency. The Fund may use foreign currency contracts to facilitate transactions in foreign-denominated securities. Gains and losses from these transactions may arise from changes in the value of the foreign currency or if the counterparties do not perform under the contracts' terms.
Foreign-denominated assets, including investment securities, and liabilities are translated into U.S. dollars at the exchange rates at period end. Purchases and sales of investment securities, income and dividends received and expenses denominated in foreign currencies are translated into U.S. dollars at the exchange rate in effect on the transaction date.
The effects of exchange rate fluctuations on investments are included with the net realized and unrealized gain (loss) on investment securities. Other foreign currency transactions resulting in realized and unrealized gain (loss) are disclosed separately.
Investment Transactions and Income. For financial reporting purposes, the Fund's investment holdings and NAV include trades executed through the end of the last business day of the period. The NAV per share for processing shareholder transactions is calculated as of the close of business of the New York Stock Exchange (NYSE), normally 4:00 p.m. Eastern time and includes trades executed through the end of the prior business day. Gains and losses on securities sold are determined on the basis of identified cost and may include proceeds received from litigation. Dividend income is recorded on the ex-dividend date, except for certain dividends from foreign securities where the ex-dividend date may have passed, which are recorded as soon as the Fund is informed of the ex-dividend date. Non-cash dividends included in dividend income, if any, are recorded at the fair market value of the securities received. Income and capital gain distributions from Fidelity Central Funds, if any, are recorded on the ex-dividend date. Certain distributions received by the Fund represent a return of capital or capital gain. The Fund determines the components of these distributions subsequent to the ex-dividend date, based upon receipt of tax filings or other correspondence relating to the underlying investment. These distributions are recorded as a reduction of cost of investments and/or as a realized gain. Interest income is accrued as earned and includes coupon interest and amortization of premium and accretion of discount on debt securities as applicable. Investment income is recorded net of foreign taxes withheld where recovery of such taxes is uncertain.
Class Allocations and Expenses. Investment income, realized and unrealized capital gains and losses, common expenses of the Fund, and certain fund-level expense reductions, if any, are allocated daily on a pro-rata basis to each class based on the relative net assets of each class to the total net assets of the Fund. Each class differs with respect to transfer agent and distribution and service plan fees incurred. Certain expense reductions may also differ by class. For the reporting period, the allocated portion of income and expenses to each class as a percent of its average net assets may vary due to the timing of recording these transactions in relation to fluctuating net assets of the classes. Expenses directly attributable to a fund are charged to that fund. Expenses attributable to more than one fund are allocated among the respective funds on the basis of relative net assets or other appropriate methods. Expense estimates are accrued in the period to which they relate and adjustments are made when actual amounts are known.
Income Tax Information and Distributions to Shareholders. Each year, the Fund intends to qualify as a regulated investment company under Subchapter M of the Internal Revenue Code, including distributing substantially all of its taxable income and realized gains. As a result, no provision for U.S. Federal income taxes is required. The Fund files a U.S. federal tax return, in addition to state and local tax returns as required. The Fund's federal income tax returns are subject to examination by the Internal Revenue Service (IRS) for a period of three fiscal years after they are filed. State and local tax returns may be subject to examination for an additional fiscal year depending on the jurisdiction. Foreign taxes are provided for based on the Fund's understanding of the tax rules and rates that exist in the foreign markets in which it invests.
Distributions are declared and recorded on the ex-dividend date. Income dividends and capital gain distributions are declared separately for each class. Income and capital gain distributions are determined in accordance with income tax regulations, which may differ from GAAP. These differences resulted in distribution reclassifications.
Capital accounts within the financial statements are adjusted for permanent book-tax differences. These adjustments have no impact on net assets or the results of operations. Capital accounts are not adjusted for temporary book-tax differences which will reverse in a subsequent period.
Book-tax differences are primarily due foreign currency transactions, passive foreign investment companies (PFIC), partnerships, capital loss carryforwards and losses deferred due to wash sales and excise tax regulations.
The federal tax cost of investment securities and unrealized appreciation (depreciation) as of period end were as follows:
| Gross unrealized appreciation | $29,293,018 |
| Gross unrealized depreciation | (4,604,027) |
| Net unrealized appreciation (depreciation) on securities | $24,688,991 |
| Tax cost | $188,527,182 |
Capital loss carryforwards are only available to offset future capital gains of the Fund to the extent provided by regulations and may be limited. Under the Regulated Investment Company Modernization Act of 2010 (the Act), the Fund is permitted to carry forward capital losses incurred in taxable years beginning after December 22, 2010 for an unlimited period and such capital losses are required to be used prior to any losses that expire. The capital loss carryforward information presented below, including any applicable limitation, is estimated as of prior fiscal period end and is subject to adjustment.
| No expiration | |
| Short-term | $(923,409) |
| Long-term | (2,072,483) |
| Total capital loss carryforward | $(2,995,892) |
4. Purchases and Sales of Investments.
Purchases and sales of securities, other than short-term securities, aggregated $55,995,651 and $42,013,187, respectively.
5. Fees and Other Transactions with Affiliates.
Management Fee. Fidelity Management & Research Company (the investment adviser) and its affiliates provide the Fund with investment management related services for which the Fund pays a monthly management fee. The management fee is the sum of an individual fund fee rate that is based on an annual rate of .30% of the Fund's average net assets and an annualized group fee rate that averaged .25% during the period. The group fee rate is based upon the average net assets of all the mutual funds advised by the investment adviser, including any mutual funds previously advised by the investment adviser that are currently advised by Fidelity SelectCo, LLC, an affiliate of the investment adviser. The group fee rate decreases as assets under management increase and increases as assets under management decrease. In addition, the management fee is subject to a performance adjustment (up to a maximum of +/- .20% of the Fund's average net assets over a 36 month performance period). The upward or downward adjustment to the management fee is based on the relative investment performance of Class I of the Fund as compared to its benchmark index, the Russell 3000 Value Index, over the same 36 month performance period. For the reporting period, the total annualized management fee rate, including the performance adjustment, was .52% of the Fund's average net assets. The performance adjustment included in the management fee rate may be higher or lower than the maximum performance adjustment rate due to the difference between the average net assets for the reporting and performance periods.
Distribution and Service Plan Fees. In accordance with Rule 12b-1 of the 1940 Act, the Fund has adopted separate Distribution and Service Plans for each class of shares. Certain classes pay Fidelity Distributors Corporation (FDC), an affiliate of the investment adviser, separate Distribution and Service Fees, each of which is based on an annual percentage of each class' average net assets. In addition, FDC may pay financial intermediaries for selling shares of the Fund and providing shareholder support services. For the period, the Distribution and Service Fee rates, total fees and amounts retained by FDC were as follows:
| Distribution Fee | Service Fee | Total Fees | Retained by FDC | |
| Class A | -% | .25% | $102,577 | $3,425 |
| Class M | .25% | .25% | 101,718 | 340 |
| Class C | .75% | .25% | 152,627 | 18,512 |
| $356,922 | $22,277 |
Sales Load. FDC may receive a front-end sales charge of up to 5.75% for selling Class A shares and 3.50% for selling Class M shares, some of which is paid to financial intermediaries for selling shares of the Fund. Depending on the holding period, FDC may receive contingent deferred sales charges levied on Class A, Class M, and Class C redemptions. The deferred sales charges are 1.00% for Class C shares, 1.00% for certain purchases of Class A shares and .25% for certain purchases of Class M shares.
For the period, sales charge amounts retained by FDC were as follows:
| Retained by FDC | |
| Class A | $17,259 |
| Class M | 5,156 |
| Class C(a) | 1,277 |
| $23,692 |
(a) When Class C shares are initially sold, FDC pays commissions from its own resources to financial intermediaries through which the sales are made.
Transfer Agent Fees. Fidelity Investments Institutional Operations Company, Inc., (FIIOC), an affiliate of the investment adviser, is the transfer, dividend disbursing and shareholder servicing agent for each class of the Fund. FIIOC receives account fees and asset-based fees that vary according to the account size and type of account of the shareholders of the respective classes of the Fund, except for Class Z. FIIOC receives an asset-based fee of Class Z's average net assets. FIIOC pays for typesetting, printing and mailing of shareholder reports, except proxy statements.
For the period, transfer agent fees for each class were as follows:
| Amount | % of Class-Level Average Net Assets(a) | |
| Class A | $86,492 | .21 |
| Class M | 45,643 | .22 |
| Class C | 34,799 | .23 |
| Class I | 22,032 | .17 |
| Class Z | 16 | .05 |
| $188,982 |
(a) Annualized
Accounting and Security Lending Fees. Fidelity Service Company, Inc. (FSC), an affiliate of the investment adviser, maintains the Fund's accounting records. The accounting fee is based on the level of average net assets for each month. Under a separate contract, FSC administers the security lending program. The security lending fee is based on the number and duration of lending transactions.
Brokerage Commissions. The Fund placed a portion of its portfolio transactions with brokerage firms which are affiliates of the investment adviser. Brokerage commissions are included in net realized gain (loss) and change in net unrealized appreciation (depreciation) in the Statement of Operations. The commissions paid to these affiliated firms were $1,016 for the period.
Interfund Trades. The Fund may purchase from or sell securities to other Fidelity Funds under procedures adopted by the Board. The procedures have been designed to ensure these interfund trades are executed in accordance with Rule 17a-7 of the 1940 Act. Interfund trades are included within the respective purchases and sales amounts shown in the Purchases and Sales of Investments note.
6. Committed Line of Credit.
The Fund participates with other funds managed by the investment adviser or an affiliate in a $4.25 billion credit facility (the "line of credit") to be utilized for temporary or emergency purposes to fund shareholder redemptions or for other short-term liquidity purposes. The Fund has agreed to pay commitment fees on its pro-rata portion of the line of credit, which amounted to $300 and is reflected in Miscellaneous expenses on the Statement of Operations. During the period, the Fund did not borrow on this line of credit.
7. Security Lending.
The Fund lends portfolio securities through a lending agent from time to time in order to earn additional income. For equity securities, a lending agent is used and may loan securities to certain qualified borrowers, including Fidelity Capital Markets (FCM), a broker-dealer affiliated with the Fund. On the settlement date of the loan, the Fund receives collateral (in the form of U.S. Treasury obligations, letters of credit and/or cash) against the loaned securities and maintains collateral in an amount not less than 100% of the market value of the loaned securities during the period of the loan. The market value of the loaned securities is determined at the close of business of the Fund and any additional required collateral is delivered to the Fund on the next business day. The Fund or borrower may terminate the loan at any time, and if the borrower defaults on its obligation to return the securities loaned because of insolvency or other reasons, the Fund may apply collateral received from the borrower against the obligation. The Fund may experience delays and costs in recovering the securities loaned. Any cash collateral received is invested in the Fidelity Securities Lending Cash Central Fund. The value of loaned securities and cash collateral at period end are disclosed on the Fund's Statement of Assets and Liabilities. At period end, there were no security loans outstanding with FCM. Security lending income represents the income earned on investing cash collateral, less rebates paid to borrowers and any lending agent fees associated with the loan, plus any premium payments received for lending certain types of securities. Security lending income is presented in the Statement of Operations as a component of income from Fidelity Central Funds. Total security lending income during the period amounted to $6,899, including $127 from securities loaned to FCM.
8. Expense Reductions.
The investment adviser voluntarily agreed to reimburse a portion of the Fund's Class A, Class M, Class C and Class I operating expenses. During the period, this reimbursement reduced expenses as follows:
| Reimbursement | |
| Class A | $7,881 |
| Class M | 3,932 |
| Class C | 2,670 |
| Class I | 2,491 |
| $16,974 |
Commissions paid to certain brokers with whom the investment adviser, or its affiliates, places trades on behalf of the Fund include an amount in addition to trade execution, which may be rebated back to the Fund to offset certain expenses. This amount totaled $1,610 for the period.
In addition, during the period the investment adviser reimbursed and/or waived a portion of fund-level operating expenses in the amount of $805.
9. Distributions to Shareholders.
Distributions to shareholders of each class were as follows:
| Six months ended May 31, 2017 | Year ended November 30, 2016 | |
| From net investment income | ||
| Class A | $626,172 | $1,016,439 |
| Class M | 207,818 | 418,210 |
| Class B | – | 6,399 |
| Class C | 51,210 | 238,977 |
| Class I | 244,699 | 469,062 |
| Total | $1,129,899 | $2,149,087 |
| From net realized gain | ||
| Class A | $– | $575,983 |
| Class M | – | 299,128 |
| Class B | – | 15,117 |
| Class C | – | 251,699 |
| Class I | – | 216,058 |
| Total | $– | $1,357,985 |
10. Share Transactions.
Share transactions for each class were as follows and may contain automatic conversions between classes or exchanges between affiliated funds:
| Shares | Shares | Dollars | Dollars | |
| Six months ended May 31, 2017(a) | Year ended November 30, 2016 | Six months ended May 31, 2017(a) | Year ended November 30, 2016 | |
| Class A | ||||
| Shares sold | 558,190 | 1,835,762 | $9,700,759 | $27,477,630 |
| Reinvestment of distributions | 35,742 | 104,688 | 606,544 | 1,546,248 |
| Shares redeemed | (646,046) | (1,492,894) | (11,262,848) | (22,929,181) |
| Net increase (decrease) | (52,114) | 447,556 | $(955,545) | $6,094,697 |
| Class M | ||||
| Shares sold | 229,279 | 779,181 | $3,960,764 | $11,489,838 |
| Reinvestment of distributions | 12,052 | 47,581 | 204,639 | 703,253 |
| Shares redeemed | (287,348) | (696,531) | (4,972,770) | (10,727,723) |
| Net increase (decrease) | (46,017) | 130,231 | $(807,367) | $1,465,368 |
| Class B | ||||
| Shares sold | – | 10,811 | $– | $153,477 |
| Reinvestment of distributions | – | 1,401 | – | 20,707 |
| Shares redeemed | – | (126,900) | – | (1,883,482) |
| Net increase (decrease) | – | (114,688) | $– | $(1,709,298) |
| Class C | ||||
| Shares sold | 177,155 | 699,956 | $2,991,189 | $10,471,711 |
| Reinvestment of distributions | 2,866 | 31,568 | 47,668 | 457,733 |
| Shares redeemed | (718,520) | (463,673) | (12,186,670) | (6,944,408) |
| Net increase (decrease) | (538,499) | 267,851 | $(9,147,813) | $3,985,036 |
| Class I | ||||
| Shares sold | 2,499,287 | 849,680 | $44,423,158 | $13,106,075 |
| Reinvestment of distributions | 8,771 | 30,682 | 151,116 | 459,926 |
| Shares redeemed | (503,866) | (1,139,412) | (8,876,914) | (17,502,986) |
| Net increase (decrease) | 2,004,192 | (259,050) | $35,697,360 | $(3,936,985) |
| Class Z | ||||
| Shares sold | 6,022 | – | $105,186 | $– |
| Net increase (decrease) | 6,022 | – | $105,186 | $– |
(a) Share transactions for Class Z are for the period February 1, 2017 (commencement of sale of shares) to May 31, 2017.
11. Other.
The Fund's organizational documents provide former and current trustees and officers with a limited indemnification against liabilities arising in connection with the performance of their duties to the Fund. In the normal course of business, the Fund may also enter into contracts that provide general indemnifications. The Fund's maximum exposure under these arrangements is unknown as this would be dependent on future claims that may be made against the Fund. The risk of material loss from such claims is considered remote.
Shareholder Expense Example
As a shareholder of the Fund, you incur two types of costs: (1) transaction costs, including sales charges (loads) on purchase payments or redemption proceeds, and (2) ongoing costs, including management fees, distribution and/or service (12b-1) fees and other Fund expenses. This Example is intended to help you understand your ongoing costs (in dollars) of investing in the Fund and to compare these costs with the ongoing costs of investing in other mutual funds.
The actual expense Example is based on an investment of $1,000 invested at the beginning of the period and held for the entire period (December 1, 2016 to May 31, 2017) for Class A, Class M, Class C, and Class I and for the period (February 1, 2017 to May 31, 2017) for Class Z. The hypothetical expense Example is based on an investment of $1,000 invested for the one-half year period (December 1, 2016 to May 31, 2017).
Actual Expenses
The first line of the accompanying table for each class of the Fund provides information about actual account values and actual expenses. You may use the information in this line, together with the amount you invested, to estimate the expenses that you paid over the period. Simply divide your account value by $1,000.00 (for example, an $8,600 account value divided by $1,000.00 = 8.6), then multiply the result by the number in the first line for a class of the Fund under the heading entitled "Expenses Paid During Period" to estimate the expenses you paid on your account during this period. In addition, the Fund, as a shareholder in the underlying Fidelity Central Funds, will indirectly bear its pro-rata share of the fees and expenses incurred by the underlying Fidelity Central Funds. These fees and expenses are not included in the Fund's annualized expense ratio used to calculate the expense estimate in the table below.
Hypothetical Example for Comparison Purposes
The second line of the accompanying table for each class of the Fund provides information about hypothetical account values and hypothetical expenses based on a Class' actual expense ratio and an assumed rate of return of 5% per year before expenses, which is not the Class' actual return. The hypothetical account values and expenses may not be used to estimate the actual ending account balance or expenses you paid for the period. You may use this information to compare the ongoing costs of investing in the Fund and other funds. To do so, compare this 5% hypothetical example with the 5% hypothetical examples that appear in the shareholder reports of the other funds. In addition, the Fund, as a shareholder in the underlying Fidelity Central Funds, will indirectly bear its pro-rata share of the fees and expenses incurred by the underlying Fidelity Central Funds. These fees and expenses are not included in the Fund's annualized expense ratio used to calculate the expense estimate in the table below.
Please note that the expenses shown in the table are meant to highlight your ongoing costs only and do not reflect any transaction costs. Therefore, the second line of the table is useful in comparing ongoing costs only, and will not help you determine the relative total costs of owning different funds. In addition, if these transactional costs were included, your costs would have been higher.
| Annualized Expense Ratio-A | Beginning Account Value | Ending Account Value May 31, 2017 | Expenses Paid During Period | |
| Class A | 1.15% | |||
| Actual | $1,000.00 | $1,070.80 | $5.94-B | |
| Hypothetical-C | $1,000.00 | $1,019.20 | $5.79-D | |
| Class M | 1.41% | |||
| Actual | $1,000.00 | $1,069.40 | $7.27-B | |
| Hypothetical-C | $1,000.00 | $1,017.90 | $7.09-D | |
| Class C | 1.92% | |||
| Actual | $1,000.00 | $1,066.40 | $9.89-B | |
| Hypothetical-C | $1,000.00 | $1,015.36 | $9.65-D | |
| Class I | .85% | |||
| Actual | $1,000.00 | $1,072.80 | $4.39-B | |
| Hypothetical-C | $1,000.00 | $1,020.69 | $4.28-D | |
| Class Z | .75% | |||
| Actual | $1,000.00 | $1,018.90 | $2.49-B | |
| Hypothetical-C | $1,000.00 | $1,021.19 | $3.78-D |
A Annualized expense ratio reflects expenses net of applicable fee waivers.
B Actual expenses are equal to each Class' annualized expense ratio, multiplied by the average account value over the period, multiplied by 182/365 (to reflect the one-half year period) for Class A, Class M, Class C and Class I and multiplied by 120/365 (to reflect the period February 1, 2017 to May 31, 2017) for Class Z.
C 5% return per year before expenses
D Hypothetical expenses are equal to each Class' annualized expense ratio, multiplied by the average account value over the period, multiplied by 182/365 (to reflect the one-half year period).
![]()
AEV-SANN-0717
1.759108.116
Fidelity Advisor® Growth & Income Fund Semi-Annual Report May 31, 2017 |
|
Contents
To view a fund's proxy voting guidelines and proxy voting record for the 12-month period ended June 30, visit http://www.fidelity.com/proxyvotingresults or visit the Securities and Exchange Commission's (SEC) web site at http://www.sec.gov.
You may also call 1-877-208-0098 to request a free copy of the proxy voting guidelines.
Standard & Poor's, S&P and S&P 500 are registered service marks of The McGraw-Hill Companies, Inc. and have been licensed for use by Fidelity Distributors Corporation.
Other third-party marks appearing herein are the property of their respective owners.
All other marks appearing herein are registered or unregistered trademarks or service marks of FMR LLC or an affiliated company. © 2017 FMR LLC. All rights reserved.
This report and the financial statements contained herein are submitted for the general information of the shareholders of the Fund. This report is not authorized for distribution to prospective investors in the Fund unless preceded or accompanied by an effective prospectus.
A fund files its complete schedule of portfolio holdings with the SEC for the first and third quarters of each fiscal year on Form N-Q. Forms N-Q are available on the SEC’s web site at http://www.sec.gov. A fund's Forms N-Q may be reviewed and copied at the SEC’s Public Reference Room in Washington, DC. Information regarding the operation of the SEC's Public Reference Room may be obtained by calling 1-800-SEC-0330.
For a complete list of a fund's portfolio holdings, view the most recent holdings listing, semiannual report, or annual report on Fidelity's web site at http://www.fidelity.com, http://www.institutional.fidelity.com, or http://www.401k.com, as applicable.
NOT FDIC INSURED •MAY LOSE VALUE •NO BANK GUARANTEE
Neither the Fund nor Fidelity Distributors Corporation is a bank.
Investment Summary (Unaudited)
Top Ten Stocks as of May 31, 2017
| % of fund's net assets | % of fund's net assets 6 months ago | |
| Microsoft Corp. | 3.5 | 3.3 |
| Bank of America Corp.(a) | 3.2 | 3.8 |
| JPMorgan Chase & Co.(a) | 3.1 | 3.9 |
| Apple, Inc.(a) | 3.0 | 3.2 |
| Citigroup, Inc.(a) | 2.9 | 2.9 |
| General Electric Co. | 2.4 | 2.7 |
| Comcast Corp. Class A | 2.1 | 1.9 |
| Alphabet, Inc. Class A | 2.1 | 1.5 |
| State Street Corp.(a) | 1.9 | 1.7 |
| GlaxoSmithKline PLC sponsored ADR | 1.8 | 1.4 |
| 26.0 |
(a) Security or a portion of the security is pledged as collateral for call options written.
Top Five Market Sectors as of May 31, 2017
| % of fund's net assets | % of fund's net assets 6 months ago | |
| Financials | 22.8 | 24.9 |
| Information Technology | 17.6 | 18.0 |
| Health Care | 14.4 | 12.3 |
| Energy | 12.2 | 13.5 |
| Industrials | 12.0 | 11.5 |
Asset Allocation (% of fund's net assets)
| As of May 31, 2017*,** | ||
| Stocks | 98.4% | |
| Convertible Securities | 1.2% | |
| Other Investments | 0.2% | |
| Short-Term Investments and Net Other Assets (Liabilities) | 0.2% | |

* Foreign investments - 10.3%
** Written options - (0.1)%
| As of November 30, 2016*,** | ||
| Stocks | 98.5% | |
| Convertible Securities | 1.2% | |
| Other Investments | 0.2% | |
| Short-Term Investments and Net Other Assets (Liabilities) | 0.1% | |

* Foreign investments - 10.1%
** Written options - (0.4)%
Investments May 31, 2017 (Unaudited)
Showing Percentage of Net Assets
| Common Stocks - 98.4% | |||
| Shares | Value (000s) | ||
| CONSUMER DISCRETIONARY - 7.0% | |||
| Automobiles - 0.1% | |||
| General Motors Co. | 17,200 | $584 | |
| Hotels, Restaurants & Leisure - 0.2% | |||
| Cedar Fair LP (depositary unit) | 3,000 | 213 | |
| DineEquity, Inc. | 9,400 | 430 | |
| Dunkin' Brands Group, Inc. | 4,600 | 269 | |
| Marriott International, Inc. Class A | 1,200 | 129 | |
| 1,041 | |||
| Leisure Products - 0.0% | |||
| NJOY, Inc. (a)(b) | 52,210 | 0 | |
| Media - 4.3% | |||
| Comcast Corp. Class A | 278,858 | 11,626 | |
| Omnicom Group, Inc. | 4,000 | 335 | |
| Scripps Networks Interactive, Inc. Class A (c) | 33,972 | 2,250 | |
| The Walt Disney Co. | 35,300 | 3,810 | |
| Time Warner, Inc. | 43,218 | 4,300 | |
| Viacom, Inc. Class B (non-vtg.) | 46,100 | 1,604 | |
| 23,925 | |||
| Multiline Retail - 0.8% | |||
| Dollar General Corp. | 10,200 | 749 | |
| Target Corp. | 71,399 | 3,938 | |
| 4,687 | |||
| Specialty Retail - 1.5% | |||
| L Brands, Inc. | 41,600 | 2,147 | |
| Lowe's Companies, Inc. | 59,157 | 4,660 | |
| TJX Companies, Inc. | 22,400 | 1,685 | |
| 8,492 | |||
| Textiles, Apparel & Luxury Goods - 0.1% | |||
| VF Corp. | 13,300 | 716 | |
| TOTAL CONSUMER DISCRETIONARY | 39,445 | ||
| CONSUMER STAPLES - 7.4% | |||
| Beverages - 3.0% | |||
| Coca-Cola European Partners PLC | 11,000 | 451 | |
| Cott Corp. | 10,000 | 132 | |
| Diageo PLC | 28,311 | 851 | |
| Dr. Pepper Snapple Group, Inc. | 17,600 | 1,633 | |
| Molson Coors Brewing Co. Class B | 39,700 | 3,763 | |
| PepsiCo, Inc. | 12,343 | 1,443 | |
| The Coca-Cola Co. | 189,484 | 8,616 | |
| 16,889 | |||
| Food & Staples Retailing - 1.4% | |||
| Costco Wholesale Corp. (c) | 3,900 | 704 | |
| CVS Health Corp. | 49,151 | 3,776 | |
| Kroger Co. | 95,200 | 2,835 | |
| Wal-Mart Stores, Inc. | 5,400 | 424 | |
| 7,739 | |||
| Food Products - 0.2% | |||
| B&G Foods, Inc. Class A | 19,300 | 783 | |
| Snyders-Lance, Inc. (d) | 7,200 | 265 | |
| 1,048 | |||
| Household Products - 1.6% | |||
| Procter & Gamble Co. | 103,735 | 9,138 | |
| Personal Products - 0.6% | |||
| Coty, Inc. Class A | 62,700 | 1,188 | |
| Edgewell Personal Care Co. (a) | 6,300 | 461 | |
| Unilever NV (NY Reg.) | 27,700 | 1,573 | |
| 3,222 | |||
| Tobacco - 0.6% | |||
| Altria Group, Inc. | 48,000 | 3,621 | |
| TOTAL CONSUMER STAPLES | 41,657 | ||
| ENERGY - 12.0% | |||
| Energy Equipment & Services - 0.9% | |||
| Baker Hughes, Inc. | 26,500 | 1,461 | |
| National Oilwell Varco, Inc. | 45,500 | 1,486 | |
| Oceaneering International, Inc. | 53,500 | 1,304 | |
| Schlumberger Ltd. | 6,734 | 469 | |
| 4,720 | |||
| Oil, Gas & Consumable Fuels - 11.1% | |||
| Amyris, Inc. (a)(d) | 330,352 | 86 | |
| Anadarko Petroleum Corp. | 19,400 | 980 | |
| Apache Corp. | 94,341 | 4,411 | |
| Cabot Oil & Gas Corp. | 94,700 | 2,101 | |
| Cenovus Energy, Inc. | 275,300 | 2,456 | |
| Chevron Corp. | 92,663 | 9,589 | |
| ConocoPhillips Co. | 213,900 | 9,559 | |
| Golar LNG Ltd. | 50,000 | 1,163 | |
| Imperial Oil Ltd. | 106,200 | 3,005 | |
| Kinder Morgan, Inc. | 248,700 | 4,666 | |
| Legacy Reserves LP (a) | 100,900 | 204 | |
| Phillips 66 Co. | 3,300 | 251 | |
| Plains All American Pipeline LP | 7,600 | 201 | |
| PrairieSky Royalty Ltd. | 36,540 | 788 | |
| Suncor Energy, Inc. | 314,390 | 9,840 | |
| Teekay LNG Partners LP | 39,500 | 600 | |
| The Williams Companies, Inc. | 287,731 | 8,229 | |
| Williams Partners LP | 109,020 | 4,270 | |
| 62,399 | |||
| TOTAL ENERGY | 67,119 | ||
| FINANCIALS - 22.8% | |||
| Banks - 14.9% | |||
| Bank of America Corp. (c) | 799,642 | 17,920 | |
| Citigroup, Inc. (c) | 271,627 | 16,444 | |
| Comerica, Inc. (c) | 29,000 | 1,988 | |
| JPMorgan Chase & Co. (c) | 212,243 | 17,436 | |
| M&T Bank Corp. | 15,500 | 2,425 | |
| PNC Financial Services Group, Inc. | 37,216 | 4,418 | |
| Regions Financial Corp. (c) | 157,500 | 2,180 | |
| SunTrust Banks, Inc. (c) | 118,735 | 6,337 | |
| U.S. Bancorp | 113,330 | 5,767 | |
| Wells Fargo & Co. | 174,350 | 8,916 | |
| 83,831 | |||
| Capital Markets - 7.2% | |||
| Apollo Global Management LLC Class A | 43,300 | 1,170 | |
| CBOE Holdings, Inc. | 23,900 | 2,064 | |
| Charles Schwab Corp. | 95,313 | 3,693 | |
| Federated Investors, Inc. Class B (non-vtg.) | 4,800 | 127 | |
| Goldman Sachs Group, Inc. | 8,600 | 1,817 | |
| KKR & Co. LP | 200,213 | 3,688 | |
| Morgan Stanley | 99,530 | 4,154 | |
| Northern Trust Corp. | 62,437 | 5,459 | |
| Oaktree Capital Group LLC Class A | 21,400 | 992 | |
| S&P Global, Inc. | 16,800 | 2,399 | |
| State Street Corp. (c) | 129,070 | 10,514 | |
| TD Ameritrade Holding Corp. | 3,000 | 112 | |
| The Blackstone Group LP | 125,900 | 4,140 | |
| 40,329 | |||
| Insurance - 0.4% | |||
| Marsh & McLennan Companies, Inc. | 27,266 | 2,115 | |
| Thrifts & Mortgage Finance - 0.3% | |||
| MGIC Investment Corp. (a) | 22,600 | 239 | |
| Radian Group, Inc. | 84,490 | 1,357 | |
| 1,596 | |||
| TOTAL FINANCIALS | 127,871 | ||
| HEALTH CARE - 13.5% | |||
| Biotechnology - 2.8% | |||
| Alexion Pharmaceuticals, Inc. (a) | 25,900 | 2,539 | |
| Amgen, Inc. | 47,792 | 7,419 | |
| Biogen, Inc. (a) | 5,500 | 1,363 | |
| Gilead Sciences, Inc. | 31,300 | 2,031 | |
| Intercept Pharmaceuticals, Inc. (a) | 4,600 | 515 | |
| Shire PLC sponsored ADR | 7,700 | 1,330 | |
| Vertex Pharmaceuticals, Inc. (a) | 1,800 | 222 | |
| 15,419 | |||
| Health Care Equipment & Supplies - 1.9% | |||
| Becton, Dickinson & Co. | 1,600 | 303 | |
| Boston Scientific Corp. (a) | 43,600 | 1,179 | |
| Medtronic PLC | 68,042 | 5,735 | |
| Meridian Bioscience, Inc. | 10,300 | 142 | |
| ResMed, Inc. | 7,900 | 562 | |
| Steris PLC | 10,400 | 807 | |
| Zimmer Biomet Holdings, Inc. | 17,890 | 2,133 | |
| 10,861 | |||
| Health Care Providers & Services - 2.8% | |||
| Aetna, Inc. | 4,000 | 579 | |
| Anthem, Inc. | 17,500 | 3,191 | |
| Cardinal Health, Inc. | 5,800 | 431 | |
| Cigna Corp. | 18,900 | 3,047 | |
| Humana, Inc. | 8,800 | 2,044 | |
| McKesson Corp. | 20,233 | 3,300 | |
| Patterson Companies, Inc. (d) | 32,300 | 1,426 | |
| UnitedHealth Group, Inc. | 10,400 | 1,822 | |
| 15,840 | |||
| Life Sciences Tools & Services - 0.3% | |||
| Agilent Technologies, Inc. (c) | 29,700 | 1,792 | |
| Pharmaceuticals - 5.7% | |||
| Allergan PLC | 3,900 | 873 | |
| AstraZeneca PLC sponsored ADR | 36,100 | 1,241 | |
| Bayer AG | 5,800 | 771 | |
| Bristol-Myers Squibb Co. | 64,300 | 3,469 | |
| GlaxoSmithKline PLC sponsored ADR | 222,509 | 9,842 | |
| Innoviva, Inc. (a) | 19,400 | 237 | |
| Johnson & Johnson | 76,401 | 9,798 | |
| Novartis AG sponsored ADR | 2,801 | 229 | |
| Sanofi SA | 18,562 | 1,839 | |
| Teva Pharmaceutical Industries Ltd. sponsored ADR | 126,774 | 3,532 | |
| 31,831 | |||
| TOTAL HEALTH CARE | 75,743 | ||
| INDUSTRIALS - 11.8% | |||
| Aerospace & Defense - 2.5% | |||
| General Dynamics Corp. | 7,900 | 1,606 | |
| Meggitt PLC | 20,306 | 131 | |
| Rolls-Royce Holdings PLC | 110,800 | 1,240 | |
| The Boeing Co. (c) | 20,594 | 3,864 | |
| United Technologies Corp. | 58,131 | 7,050 | |
| 13,891 | |||
| Air Freight & Logistics - 1.6% | |||
| C.H. Robinson Worldwide, Inc. | 33,900 | 2,272 | |
| Expeditors International of Washington, Inc. | 26,200 | 1,399 | |
| United Parcel Service, Inc. Class B | 49,979 | 5,296 | |
| 8,967 | |||
| Commercial Services & Supplies - 0.1% | |||
| KAR Auction Services, Inc. | 14,100 | 614 | |
| Ritchie Brothers Auctioneers, Inc. | 4,500 | 140 | |
| 754 | |||
| Construction & Engineering - 0.1% | |||
| Fluor Corp. | 9,200 | 413 | |
| Electrical Equipment - 0.7% | |||
| Acuity Brands, Inc. (d) | 4,700 | 766 | |
| AMETEK, Inc. | 27,900 | 1,702 | |
| Hubbell, Inc. Class B | 14,612 | 1,694 | |
| 4,162 | |||
| Industrial Conglomerates - 2.4% | |||
| General Electric Co. | 491,393 | 13,454 | |
| Machinery - 0.8% | |||
| Burckhardt Compression Holding AG (d) | 1,030 | 323 | |
| Donaldson Co., Inc. | 16,100 | 772 | |
| Flowserve Corp. | 47,400 | 2,299 | |
| IMI PLC | 6,600 | 107 | |
| Wabtec Corp. | 15,000 | 1,226 | |
| 4,727 | |||
| Professional Services - 0.4% | |||
| Intertrust NV | 33,200 | 690 | |
| Nielsen Holdings PLC | 32,300 | 1,243 | |
| 1,933 | |||
| Road & Rail - 2.5% | |||
| CSX Corp. (c) | 106,833 | 5,787 | |
| J.B. Hunt Transport Services, Inc. | 45,520 | 3,886 | |
| Norfolk Southern Corp. | 21,208 | 2,630 | |
| Union Pacific Corp. | 15,900 | 1,754 | |
| 14,057 | |||
| Trading Companies & Distributors - 0.7% | |||
| Fastenal Co. | 24,300 | 1,049 | |
| Howden Joinery Group PLC | 18,000 | 105 | |
| W.W. Grainger, Inc. (d) | 1,000 | 172 | |
| Watsco, Inc. | 16,964 | 2,394 | |
| 3,720 | |||
| TOTAL INDUSTRIALS | 66,078 | ||
| INFORMATION TECHNOLOGY - 17.6% | |||
| Communications Equipment - 1.5% | |||
| Cisco Systems, Inc. | 271,771 | 8,569 | |
| Electronic Equipment & Components - 0.1% | |||
| Avnet, Inc. | 4,600 | 169 | |
| Philips Lighting NV | 12,200 | 452 | |
| 621 | |||
| Internet Software & Services - 3.7% | |||
| Alphabet, Inc.: | |||
| Class A (a) | 11,618 | 11,468 | |
| Class C (a) | 9,413 | 9,082 | |
| 20,550 | |||
| IT Services - 3.7% | |||
| Accenture PLC Class A | 9,400 | 1,170 | |
| Amdocs Ltd. | 9,600 | 622 | |
| Cognizant Technology Solutions Corp. Class A | 900 | 60 | |
| MasterCard, Inc. Class A | 37,290 | 4,582 | |
| Paychex, Inc. | 95,809 | 5,675 | |
| Unisys Corp. (a)(d) | 102,792 | 1,213 | |
| Visa, Inc. Class A | 77,340 | 7,365 | |
| 20,687 | |||
| Semiconductors & Semiconductor Equipment - 1.7% | |||
| Qualcomm, Inc. | 170,908 | 9,788 | |
| Software - 3.6% | |||
| Microsoft Corp. | 283,773 | 19,818 | |
| Oracle Corp. | 11,384 | 517 | |
| 20,335 | |||
| Technology Hardware, Storage & Peripherals - 3.3% | |||
| Apple, Inc. (c) | 110,278 | 16,846 | |
| Western Digital Corp. (c) | 15,600 | 1,405 | |
| 18,251 | |||
| TOTAL INFORMATION TECHNOLOGY | 98,801 | ||
| MATERIALS - 3.0% | |||
| Chemicals - 2.4% | |||
| CF Industries Holdings, Inc. | 46,500 | 1,251 | |
| E.I. du Pont de Nemours & Co. | 19,031 | 1,502 | |
| LyondellBasell Industries NV Class A | 33,000 | 2,657 | |
| Monsanto Co. | 34,001 | 3,992 | |
| Potash Corp. of Saskatchewan, Inc. | 141,500 | 2,337 | |
| W.R. Grace & Co. | 21,400 | 1,534 | |
| 13,273 | |||
| Containers & Packaging - 0.6% | |||
| Ball Corp. | 37,800 | 1,546 | |
| Graphic Packaging Holding Co. | 6,000 | 81 | |
| WestRock Co. | 30,300 | 1,649 | |
| 3,276 | |||
| Metals & Mining - 0.0% | |||
| Reliance Steel & Aluminum Co. | 1,700 | 124 | |
| TOTAL MATERIALS | 16,673 | ||
| REAL ESTATE - 1.1% | |||
| Equity Real Estate Investment Trusts (REITs) - 1.1% | |||
| American Tower Corp. | 7,100 | 931 | |
| CoreSite Realty Corp. | 3,200 | 337 | |
| Crown Castle International Corp. | 25,300 | 2,572 | |
| First Potomac Realty Trust | 4,672 | 51 | |
| Omega Healthcare Investors, Inc. (d) | 10,600 | 332 | |
| Public Storage | 6,900 | 1,486 | |
| Sabra Health Care REIT, Inc. | 16,700 | 391 | |
| 6,100 | |||
| TELECOMMUNICATION SERVICES - 1.1% | |||
| Diversified Telecommunication Services - 1.1% | |||
| Verizon Communications, Inc. | 126,009 | 5,877 | |
| UTILITIES - 1.1% | |||
| Electric Utilities - 1.1% | |||
| Exelon Corp. | 141,600 | 5,141 | |
| PPL Corp. | 17,500 | 698 | |
| 5,839 | |||
| TOTAL COMMON STOCKS | |||
| (Cost $413,396) | 551,203 | ||
| Preferred Stocks - 1.1% | |||
| Convertible Preferred Stocks - 1.1% | |||
| HEALTH CARE - 0.8% | |||
| Health Care Equipment & Supplies - 0.8% | |||
| Alere, Inc. 3.00% | 9,854 | 3,784 | |
| Becton, Dickinson & Co. Series A 6.125% (a) | 16,700 | 888 | |
| 4,672 | |||
| INDUSTRIALS - 0.2% | |||
| Commercial Services & Supplies - 0.2% | |||
| Stericycle, Inc. 2.25% | 13,600 | 932 | |
| UTILITIES - 0.1% | |||
| Independent Power and Renewable Electricity Producers - 0.1% | |||
| Dynegy, Inc. 7.00% | 5,200 | 325 | |
| TOTAL CONVERTIBLE PREFERRED STOCKS | 5,929 | ||
| Nonconvertible Preferred Stocks - 0.0% | |||
| INDUSTRIALS - 0.0% | |||
| Aerospace & Defense - 0.0% | |||
| Rolls-Royce Holdings PLC: | |||
| (C Shares) | 13,049,030 | 17 | |
| (C Shares) (a) | 7,866,800 | 10 | |
| 27 | |||
| TOTAL PREFERRED STOCKS | |||
| (Cost $5,081) | 5,956 | ||
| Principal Amount (000s)(e) | Value (000s) | ||
| Convertible Bonds - 0.1% | |||
| HEALTH CARE - 0.1% | |||
| Pharmaceuticals - 0.1% | |||
| Bayer Capital Corp. BV 5.625% 11/22/19(f) | |||
| (Cost $534) | 500 | 708 | |
| Shares | Value (000s) | ||
| Other - 0.2% | |||
| ENERGY - 0.2% | |||
| Oil, Gas & Consumable Fuels - 0.2% | |||
| Utica Shale Drilling Program (non-operating revenue interest) (b)(g) | |||
| (Cost $980) | 979,864 | 980 | |
| Money Market Funds - 1.1% | |||
| Fidelity Cash Central Fund, 0.86% (h) | 2,750,721 | 2,751 | |
| Fidelity Securities Lending Cash Central Fund 0.87% (h)(i) | 3,682,220 | 3,683 | |
| TOTAL MONEY MARKET FUNDS | |||
| (Cost $6,434) | 6,434 | ||
| TOTAL INVESTMENT PORTFOLIO - 100.9% | |||
| (Cost $426,425) | 565,281 | ||
| NET OTHER ASSETS (LIABILITIES) - (0.9)% | (5,228) | ||
| NET ASSETS - 100% | $560,053 |
| Written Options | ||||
| Expiration Date/Exercise Price | Number of Contracts | Premium (000s) | Value (000s) | |
| Call Options | ||||
| Agilent Technologies, Inc. | 6/16/17 - $57.50 | 169 | $15 | $(53) |
| Apple, Inc. | 7/21/17 - $155.00 | 60 | 6 | (18) |
| Apple, Inc. | 8/18/17 - $165.00 | 55 | 11 | (9) |
| Bank of America Corp. | 7/21/17 - $26.00 | 800 | 22 | (4) |
| Bank of America Corp. | 8/18/17 - $26.00 | 796 | 14 | (8) |
| Citigroup, Inc. | 8/18/17 - $65.00 | 541 | 75 | (40) |
| Comerica, Inc. | 7/21/17 - $72.50 | 290 | 75 | (30) |
| Costco Wholesale Corp. | 10/20/17 - $178.00 | 23 | 11 | (18) |
| CSX Corp. | 7/21/17 - $52.50 | 159 | 25 | (50) |
| JPMorgan Chase & Co. | 7/21/17 - $95.00 | 212 | 10 | (1) |
| JPMorgan Chase & Co. | 8/18/17 - $90.00 | 211 | 20 | (9) |
| Regions Financial Corp. | 8/18/17 - $16.00 | 157 | 2 | (2) |
| Scripps Network Interactive, Inc. Class A | 6/16/17 - $85.00 | 81 | 12 | 0 |
| State Street Corp. | 8/18/17 - $85.00 | 191 | 26 | (29) |
| SunTrust Banks, Inc. | 7/21/17 - $65.00 | 113 | 16 | 0 |
| The Boeing Co. | 7/21/17 - $185.00 | 49 | 24 | (32) |
| Western Digital Corp. | 7/21/17 - $92.50 | 81 | 19 | (26) |
| TOTAL WRITTEN OPTIONS | $383 | $(329) |
Currency Abbreviations
EUR – European Monetary Unit
Values shown as $0 may reflect amounts less than $500.
Legend
(a) Non-income producing
(b) Restricted securities - Investment in securities not registered under the Securities Act of 1933 (excluding 144A issues). At the end of the period, the value of restricted securities (excluding 144A issues) amounted to $980,000 or 0.2% of net assets.
(c) Security or a portion of the security is pledged as collateral for call options written. At period end, the value of securities pledged amounted to $20,929,000.
(d) Security or a portion of the security is on loan at period end.
(e) Amount is stated in United States dollars unless otherwise noted.
(f) Security exempt from registration under Rule 144A of the Securities Act of 1933. These securities may be resold in transactions exempt from registration, normally to qualified institutional buyers. At the end of the period, the value of these securities amounted to $708,000 or 0.1% of net assets.
(g) Investment is owned by a wholly-owned subsidiary (Subsidiary) that is treated as a corporation for U.S. tax purposes.
(h) Affiliated fund that is generally available only to investment companies and other accounts managed by Fidelity Investments. The rate quoted is the annualized seven-day yield of the fund at period end. A complete unaudited listing of the fund's holdings as of its most recent quarter end is available upon request. In addition, each Fidelity Central Fund's financial statements are available on the SEC's website or upon request.
(i) Investment made with cash collateral received from securities on loan.
Additional information on each restricted holding is as follows:
| Security | Acquisition Date | Acquisition Cost (000s) |
| NJOY, Inc. | 2/14/14 | $91 |
| Utica Shale Drilling Program (non-operating revenue interest) | 10/5/16 - 11/4/16 | $980 |
Affiliated Central Funds
Information regarding fiscal year to date income earned by the Fund from investments in Fidelity Central Funds is as follows:
| Fund | Income earned |
| (Amounts in thousands) | |
| Fidelity Cash Central Fund | $14 |
| Fidelity Securities Lending Cash Central Fund | 12 |
| Total | $26 |
Investment Valuation
The following is a summary of the inputs used, as of May 31, 2017, involving the Fund's assets and liabilities carried at fair value. The inputs or methodology used for valuing securities may not be an indication of the risk associated with investing in those securities. For more information on valuation inputs, and their aggregation into the levels used below, please refer to the Investment Valuation section in the accompanying Notes to Financial Statements.
| Valuation Inputs at Reporting Date: | ||||
| Description | Total | Level 1 | Level 2 | Level 3 |
| (Amounts in thousands) | ||||
| Investments in Securities: | ||||
| Equities: | ||||
| Consumer Discretionary | $39,445 | $39,445 | $-- | $-- |
| Consumer Staples | 41,657 | 40,806 | 851 | -- |
| Energy | 67,119 | 67,119 | -- | -- |
| Financials | 127,871 | 127,871 | -- | -- |
| Health Care | 80,415 | 73,133 | 7,282 | -- |
| Industrials | 67,037 | 64,865 | 2,172 | -- |
| Information Technology | 98,801 | 98,801 | -- | -- |
| Materials | 16,673 | 16,673 | -- | -- |
| Real Estate | 6,100 | 6,100 | -- | -- |
| Telecommunication Services | 5,877 | 5,877 | -- | -- |
| Utilities | 6,164 | 6,164 | -- | -- |
| Corporate Bonds | 708 | -- | 708 | -- |
| Other | 980 | -- | -- | 980 |
| Money Market Funds | 6,434 | 6,434 | -- | -- |
| Total Investments in Securities: | $565,281 | $553,288 | $11,013 | $980 |
| Derivative Instruments: | ||||
| Liabilities | ||||
| Written Options | $(329) | $(329) | $-- | $-- |
| Total Liabilities | $(329) | $(329) | $-- | $-- |
| Total Derivative Instruments: | $(329) | $(329) | $-- | $-- |
Value of Derivative Instruments
The following table is a summary of the Fund's value of derivative instruments by primary risk exposure as of May 31, 2017. For additional information on derivative instruments, please refer to the Derivative Instruments section in the accompanying Notes to Financial Statements.
| Primary Risk Exposure / Derivative Type | Value | |
| Asset | Liability | |
| (Amounts in thousands) | ||
| Equity Risk | ||
| Written Options(a) | $0 | $(329) |
| Total Equity Risk | 0 | (329) |
| Total Value of Derivatives | $0 | $(329) |
(a) Gross value is presented in the Statement of Assets and Liabilities in the written options, at value line-item.
Other Information
Distribution of investments by country or territory of incorporation, as a percentage of Total Net Assets, is as follows (Unaudited):
| United States of America | 89.7% |
| Canada | 3.2% |
| United Kingdom | 2.7% |
| Ireland | 1.4% |
| Netherlands | 1.2% |
| Others (Individually Less Than 1%) | 1.8% |
| 100.0% |
See accompanying notes which are an integral part of the financial statements.
Financial Statements
Statement of Assets and Liabilities
| Amounts in thousands (except per-share amounts) | May 31, 2017 (Unaudited) | |
| Assets | ||
| Investment in securities, at value (including securities loaned of $3,574) — See accompanying schedule: Unaffiliated issuers (cost $419,991) | $558,847 | |
| Fidelity Central Funds (cost $6,434) | 6,434 | |
| Total Investments (cost $426,425) | $565,281 | |
| Cash | 20 | |
| Restricted cash | 12 | |
| Receivable for investments sold | 571 | |
| Receivable for fund shares sold | 161 | |
| Dividends receivable | 1,293 | |
| Interest receivable | 16 | |
| Distributions receivable from Fidelity Central Funds | 4 | |
| Other receivables | 1 | |
| Total assets | 567,359 | |
| Liabilities | ||
| Payable for investments purchased | $357 | |
| Payable for fund shares redeemed | 2,379 | |
| Accrued management fee | 210 | |
| Distribution and service plan fees payable | 198 | |
| Written options, at value (premium received $383) | 329 | |
| Other affiliated payables | 112 | |
| Other payables and accrued expenses | 38 | |
| Collateral on securities loaned | 3,683 | |
| Total liabilities | 7,306 | |
| Net Assets | $560,053 | |
| Net Assets consist of: | ||
| Paid in capital | $402,358 | |
| Undistributed net investment income | 1,820 | |
| Accumulated undistributed net realized gain (loss) on investments and foreign currency transactions | 16,967 | |
| Net unrealized appreciation (depreciation) on investments and assets and liabilities in foreign currencies | 138,908 | |
| Net Assets | $560,053 | |
| Calculation of Maximum Offering Price | ||
| Class A: | ||
| Net Asset Value and redemption price per share ($244,632 �� 8,841.05 shares) | $27.67 | |
| Maximum offering price per share (100/94.25 of $27.67) | $29.36 | |
| Class M: | ||
| Net Asset Value and redemption price per share ($179,681 ÷ 6,492.27 shares) | $27.68 | |
| Maximum offering price per share (100/96.50 of $27.68) | $28.68 | |
| Class C: | ||
| Net Asset Value and offering price per share ($84,268 ÷ 3,230.93 shares)(a) | $26.08 | |
| Class I: | ||
| Net Asset Value, offering price and redemption price per share ($47,399 ÷ 1,681.07 shares) | $28.20 | |
| Class Z: | ||
| Net Asset Value, offering price and redemption price per share ($4,073 ÷ 144.39 shares) | $28.21 |
(a) Redemption price per share is equal to net asset value less any applicable contingent deferred sales charge.
See accompanying notes which are an integral part of the financial statements.
Statement of Operations
| Amounts in thousands | Six months ended May 31, 2017 (Unaudited) | |
| Investment Income | ||
| Dividends | $6,394 | |
| Interest | 56 | |
| Income from Fidelity Central Funds | 26 | |
| Total income | 6,476 | |
| Expenses | ||
| Management fee | $1,254 | |
| Transfer agent fees | 574 | |
| Distribution and service plan fees | 1,192 | |
| Accounting and security lending fees | 106 | |
| Custodian fees and expenses | 30 | |
| Independent trustees' fees and expenses | 1 | |
| Registration fees | 55 | |
| Audit | 32 | |
| Legal | 3 | |
| Miscellaneous | 4 | |
| Total expenses before reductions | 3,251 | |
| Expense reductions | (25) | 3,226 |
| Net investment income (loss) | 3,250 | |
| Realized and Unrealized Gain (Loss) | ||
| Net realized gain (loss) on: | ||
| Investment securities: | ||
| Unaffiliated issuers | 20,255 | |
| Fidelity Central Funds | (1) | |
| Foreign currency transactions | (4) | |
| Written options | 512 | |
| Total net realized gain (loss) | 20,762 | |
| Change in net unrealized appreciation (depreciation) on: Investment securities | 6,671 | |
| Assets and liabilities in foreign currencies | 4 | |
| Written options | 1,791 | |
| Total change in net unrealized appreciation (depreciation) | 8,466 | |
| Net gain (loss) | 29,228 | |
| Net increase (decrease) in net assets resulting from operations | $32,478 |
See accompanying notes which are an integral part of the financial statements.
Statement of Changes in Net Assets
| Amounts in thousands | Six months ended May 31, 2017 (Unaudited) | Year ended November 30, 2016 |
| Increase (Decrease) in Net Assets | ||
| Operations | ||
| Net investment income (loss) | $3,250 | $6,879 |
| Net realized gain (loss) | 20,762 | 7,484 |
| Change in net unrealized appreciation (depreciation) | 8,466 | 36,656 |
| Net increase (decrease) in net assets resulting from operations | 32,478 | 51,019 |
| Distributions to shareholders from net investment income | (7,406) | (7,087) |
| Distributions to shareholders from net realized gain | (8,765) | (32,560) |
| Total distributions | (16,171) | (39,647) |
| Share transactions - net increase (decrease) | (1,177) | (9,916) |
| Total increase (decrease) in net assets | 15,130 | 1,456 |
| Net Assets | ||
| Beginning of period | 544,923 | 543,467 |
| End of period | $560,053 | $544,923 |
| Other Information | ||
| Undistributed net investment income end of period | $1,820 | $5,976 |
See accompanying notes which are an integral part of the financial statements.
Financial Highlights — Fidelity Advisor Growth & Income Fund Class A
| Six months ended (Unaudited) May 31, | Years ended November 30, | |||||
| 2017 | 2016 | 2015 | 2014 | 2013 | 2012 | |
| Selected Per–Share Data | ||||||
| Net asset value, beginning of period | $26.89 | $26.36 | $28.95 | $25.87 | $19.67 | $17.00 |
| Income from Investment Operations | ||||||
| Net investment income (loss)A | .18 | .37 | .42 | .40 | .37 | .33 |
| Net realized and unrealized gain (loss) | 1.44 | 2.12 | (.76)B | 2.97 | 5.88 | 2.90 |
| Total from investment operations | 1.62 | 2.49 | (.34) | 3.37 | 6.25 | 3.23 |
| Distributions from net investment income | (.41) | (.39) | (.36) | (.11) | (.05) | (.53) |
| Distributions from net realized gain | (.43) | (1.57) | (1.88) | (.18) | – | (.03) |
| Total distributions | (.84) | (1.96) | (2.25)C | (.29) | (.05) | (.56) |
| Net asset value, end of period | $27.67 | $26.89 | $26.36 | $28.95 | $25.87 | $19.67 |
| Total ReturnD,E,F | 6.11% | 10.59% | (.96)%B | 13.20% | 31.86% | 19.20% |
| Ratios to Average Net AssetsG,H | ||||||
| Expenses before reductions | .98%I | .99% | .99% | 1.01% | 1.02% | 1.05% |
| Expenses net of fee waivers, if any | .98%I | .99% | .98% | 1.01% | 1.02% | 1.05% |
| Expenses net of all reductions | .97%I | .99% | .98% | 1.01% | 1.00% | 1.04% |
| Net investment income (loss) | 1.33%I | 1.51% | 1.57% | 1.48% | 1.61% | 1.75% |
| Supplemental Data | ||||||
| Net assets, end of period (in millions) | $245 | $253 | $244 | $276 | $255 | $183 |
| Portfolio turnover rateJ | 39%I | 31% | 35% | 44% | 48% | 57% |
A Calculated based on average shares outstanding during the period.
B Net realized and unrealized gain (loss) per share reflects proceeds received from litigation which amounted to $0.04 per share. Excluding these litigation proceeds, the total return would have been (1.10)%
C Total distributions of $2.25 per share is comprised of distributions from net investment income of $.363 and distributions from net realized gain of $1.883 per share.
D Total returns for periods of less than one year are not annualized.
E Total returns would have been lower if certain expenses had not been reduced during the applicable periods shown.
F Total returns do not include the effect of the sales charges.
G Fees and expenses of any underlying Fidelity Central Funds are not included in the Fund's expense ratio. The Fund indirectly bears its proportionate share of the expenses of any underlying Fidelity Central Funds.
H Expense ratios reflect operating expenses of the class. Expenses before reductions do not reflect amounts reimbursed by the investment adviser or reductions from brokerage service arrangements or reductions from other expense offset arrangements and do not represent the amount paid by the class during periods when reimbursements or reductions occur. Expenses net of fee waivers reflect expenses after reimbursement by the investment adviser but prior to reductions from brokerage service arrangements or other expense offset arrangements. Expenses net of all reductions represent the net expenses paid by the class.
I Annualized
J Amount does not include the portfolio activity of any underlying Fidelity Central Funds.
See accompanying notes which are an integral part of the financial statements.
Financial Highlights — Fidelity Advisor Growth & Income Fund Class M
| Six months ended (Unaudited) May 31, | Years ended November 30, | |||||
| 2017 | 2016 | 2015 | 2014 | 2013 | 2012 | |
| Selected Per–Share Data | ||||||
| Net asset value, beginning of period | $26.87 | $26.32 | $28.91 | $25.84 | $19.68 | $16.97 |
| Income from Investment Operations | ||||||
| Net investment income (loss)A | .15 | .31 | .35 | .33 | .32 | .29 |
| Net realized and unrealized gain (loss) | 1.43 | 2.12 | (.76)B | 2.97 | 5.89 | 2.89 |
| Total from investment operations | 1.58 | 2.43 | (.41) | 3.30 | 6.21 | 3.18 |
| Distributions from net investment income | (.34) | (.32) | (.29) | (.05) | (.05) | (.44) |
| Distributions from net realized gain | (.43) | (1.57) | (1.88) | (.18) | – | (.03) |
| Total distributions | (.77) | (1.88)C | (2.18)D | (.23) | (.05) | (.47) |
| Net asset value, end of period | $27.68 | $26.87 | $26.32 | $28.91 | $25.84 | $19.68 |
| Total ReturnE,F,G | 5.97% | 10.36% | (1.22)%B | 12.91% | 31.62% | 18.93% |
| Ratios to Average Net AssetsH,I | ||||||
| Expenses before reductions | 1.24%J | 1.24% | 1.23% | 1.25% | 1.25% | 1.27% |
| Expenses net of fee waivers, if any | 1.23%J | 1.24% | 1.23% | 1.25% | 1.25% | 1.27% |
| Expenses net of all reductions | 1.23%J | 1.24% | 1.23% | 1.24% | 1.23% | 1.26% |
| Net investment income (loss) | 1.08%J | 1.26% | 1.32% | 1.24% | 1.38% | 1.53% |
| Supplemental Data | ||||||
| Net assets, end of period (in millions) | $180 | $176 | $180 | $216 | $214 | $166 |
| Portfolio turnover rateK | 39%J | 31% | 35% | 44% | 48% | 57% |
A Calculated based on average shares outstanding during the period.
B Net realized and unrealized gain (loss) per share reflects proceeds received from litigation which amounted to $0.04 per share. Excluding these litigation proceeds, the total return would have been(1.36)%
C Total distributions of $1.88 per share is comprised of distributions from net investment income of $.319 and distributions from net realized gain of $1.565 per share.
D Total distributions of $2.18 per share is comprised of distributions from net investment income of $.293 and distributions from net realized gain of $1.883 per share.
E Total returns for periods of less than one year are not annualized.
F Total returns would have been lower if certain expenses had not been reduced during the applicable periods shown.
G Total returns do not include the effect of the sales charges.
H Fees and expenses of any underlying Fidelity Central Funds are not included in the Fund's expense ratio. The Fund indirectly bears its proportionate share of the expenses of any underlying Fidelity Central Funds.
I Expense ratios reflect operating expenses of the class. Expenses before reductions do not reflect amounts reimbursed by the investment adviser or reductions from brokerage service arrangements or reductions from other expense offset arrangements and do not represent the amount paid by the class during periods when reimbursements or reductions occur. Expenses net of fee waivers reflect expenses after reimbursement by the investment adviser but prior to reductions from brokerage service arrangements or other expense offset arrangements. Expenses net of all reductions represent the net expenses paid by the class.
J Annualized
K Amount does not include the portfolio activity of any underlying Fidelity Central Funds.
See accompanying notes which are an integral part of the financial statements.
Financial Highlights — Fidelity Advisor Growth & Income Fund Class C
| Six months ended (Unaudited) May 31, | Years ended November 30, | |||||
| 2017 | 2016 | 2015 | 2014 | 2013 | 2012 | |
| Selected Per–Share Data | ||||||
| Net asset value, beginning of period | $25.33 | $24.92 | $27.51 | $24.66 | $18.87 | $16.23 |
| Income from Investment Operations | ||||||
| Net investment income (loss)A | .07 | .17 | .21 | .19 | .19 | .19 |
| Net realized and unrealized gain (loss) | 1.35 | 2.01 | (.73)B | 2.84 | 5.64 | 2.77 |
| Total from investment operations | 1.42 | 2.18 | (.52) | 3.03 | 5.83 | 2.96 |
| Distributions from net investment income | (.24) | (.21) | (.18) | – | (.04) | (.29) |
| Distributions from net realized gain | (.43) | (1.57) | (1.88) | (.18) | – | (.03) |
| Total distributions | (.67) | (1.77)C | (2.07)D | (.18) | (.04) | (.32) |
| Net asset value, end of period | $26.08 | $25.33 | $24.92 | $27.51 | $24.66 | $18.87 |
| Total ReturnE,F,G | 5.67% | 9.81% | (1.74)%B | 12.38% | 30.95% | 18.33% |
| Ratios to Average Net AssetsH,I | ||||||
| Expenses before reductions | 1.74%J | 1.74% | 1.73% | 1.74% | 1.74% | 1.76% |
| Expenses net of fee waivers, if any | 1.73%J | 1.74% | 1.73% | 1.74% | 1.74% | 1.76% |
| Expenses net of all reductions | 1.73%J | 1.74% | 1.73% | 1.74% | 1.73% | 1.76% |
| Net investment income (loss) | .57%J | .76% | .82% | .74% | .89% | 1.04% |
| Supplemental Data | ||||||
| Net assets, end of period (in millions) | $84 | $80 | $79 | $85 | $74 | $58 |
| Portfolio turnover rateK | 39%J | 31% | 35% | 44% | 48% | 57% |
A Calculated based on average shares outstanding during the period.
B Net realized and unrealized gain (loss) per share reflects proceeds received from litigation which amounted to $0.04 per share. Excluding these litigation proceeds, the total return would have been (1.88)%.
C Total distributions of $1.77 per share is comprised of distributions from net investment income of $.206 and distributions from net realized gain of $1.565 per share.
D Total distributions of $2.07 per share is comprised of distributions from net investment income of $.183 and distributions from net realized gain of $1.883 per share.
E Total returns for periods of less than one year are not annualized.
F Total returns would have been lower if certain expenses had not been reduced during the applicable periods shown.
G Total returns do not include the effect of the contingent deferred sales charge.
H Fees and expenses of any underlying Fidelity Central Funds are not included in the Fund's expense ratio. The Fund indirectly bears its proportionate share of the expenses of any underlying Fidelity Central Funds.
I Expense ratios reflect operating expenses of the class. Expenses before reductions do not reflect amounts reimbursed by the investment adviser or reductions from brokerage service arrangements or reductions from other expense offset arrangements and do not represent the amount paid by the class during periods when reimbursements or reductions occur. Expenses net of fee waivers reflect expenses after reimbursement by the investment adviser but prior to reductions from brokerage service arrangements or other expense offset arrangements. Expenses net of all reductions represent the net expenses paid by the class.
J Annualized
K Amount does not include the portfolio activity of any underlying Fidelity Central Funds.
See accompanying notes which are an integral part of the financial statements.
Financial Highlights — Fidelity Advisor Growth & Income Fund Class I
| Six months ended (Unaudited) May 31, | Years ended November 30, | |||||
| 2017 | 2016 | 2015 | 2014 | 2013 | 2012 | |
| Selected Per–Share Data | ||||||
| Net asset value, beginning of period | $27.41 | $26.85 | $29.47 | $26.13 | $19.79 | $17.16 |
| Income from Investment Operations | ||||||
| Net investment income (loss)A | .22 | .44 | .50 | .49 | .43 | .40 |
| Net realized and unrealized gain (loss) | 1.47 | 2.16 | (.78)B | 3.03 | 5.97 | 2.91 |
| Total from investment operations | 1.69 | 2.60 | (.28) | 3.52 | 6.40 | 3.31 |
| Distributions from net investment income | (.47) | (.48) | (.45) | – | (.06) | (.65) |
| Distributions from net realized gain | (.43) | (1.57) | (1.88) | (.18) | – | (.03) |
| Total distributions | (.90) | (2.04)C | (2.34)D | (.18) | (.06) | (.68) |
| Net asset value, end of period | $28.20 | $27.41 | $26.85 | $29.47 | $26.13 | $19.79 |
| Total ReturnE,F | 6.24% | 10.91% | (.70)%B | 13.56% | 32.41% | 19.59% |
| Ratios to Average Net AssetsG,H | ||||||
| Expenses before reductions | .71%I | .73% | .71% | .70% | .70% | .71% |
| Expenses net of fee waivers, if any | .70%I | .73% | .70% | .70% | .70% | .71% |
| Expenses net of all reductions | .70%I | .73% | .70% | .70% | .68% | .70% |
| Net investment income (loss) | 1.60%I | 1.77% | 1.86% | 1.78% | 1.93% | 2.09% |
| Supplemental Data | ||||||
| Net assets, end of period (in millions) | $47 | $35 | $36 | $28 | $24 | $1,031 |
| Portfolio turnover rateJ | 39%I | 31% | 35% | 44% | 48% | 57% |
A Calculated based on average shares outstanding during the period.
B Net realized and unrealized gain (loss) per share reflects proceeds received from litigation which amounted to $0.04 per share. Excluding these litigation proceeds, the total return would have been (.84)%
C Total distributions of $2.04 per share is comprised of distributions from net investment income of $.478 and distributions from net realized gain of $1.565 per share.
D Total distributions of $2.34 per share is comprised of distributions from net investment income of $.454 and distributions from net realized gain of $1.883 per share.
E Total returns for periods of less than one year are not annualized.
F Total returns would have been lower if certain expenses had not been reduced during the applicable periods shown.
G Fees and expenses of any underlying Fidelity Central Funds are not included in the Fund's expense ratio. The Fund indirectly bears its proportionate share of the expenses of any underlying Fidelity Central Funds.
H Expense ratios reflect operating expenses of the class. Expenses before reductions do not reflect amounts reimbursed by the investment adviser or reductions from brokerage service arrangements or reductions from other expense offset arrangements and do not represent the amount paid by the class during periods when reimbursements or reductions occur. Expenses net of fee waivers reflect expenses after reimbursement by the investment adviser but prior to reductions from brokerage service arrangements or other expense offset arrangements. Expenses net of all reductions represent the net expenses paid by the class.
I Annualized
J Amount does not include the portfolio activity of any underlying Fidelity Central Funds.
See accompanying notes which are an integral part of the financial statements.
Financial Highlights — Fidelity Advisor Growth & Income Fund Class Z
| Six months ended (Unaudited) May 31, | |
| 2017A | |
| Selected Per–Share Data | |
| Net asset value, beginning of period | $27.35 |
| Income from Investment Operations | |
| Net investment income (loss)B | .20 |
| Net realized and unrealized gain (loss) | .66 |
| Total from investment operations | .86 |
| Distributions from net investment income | – |
| Distributions from net realized gain | – |
| Total distributions | – |
| Net asset value, end of period | $28.21 |
| Total ReturnC,D | 3.14% |
| Ratios to Average Net AssetsE,F | |
| Expenses before reductions | .58%G |
| Expenses net of fee waivers, if any | .58%G |
| Expenses net of all reductions | .57%G |
| Net investment income (loss) | 2.21%G |
| Supplemental Data | |
| Net assets, end of period (in millions) | $4 |
| Portfolio turnover rateH | 39%G |
A For the period February 1, 2017 (commencement of sale of shares) to May 31, 2017.
B Calculated based on average shares outstanding during the period.
C Total returns for periods of less than one year are not annualized.
D Total returns would have been lower if certain expenses had not been reduced during the applicable periods shown.
E Fees and expenses of any underlying Fidelity Central Funds are not included in the Fund's expense ratio. The Fund indirectly bears its proportionate share of the expenses of any underlying Fidelity Central Funds.
F Expense ratios reflect operating expenses of the class. Expenses before reductions do not reflect amounts reimbursed by the investment adviser or reductions from brokerage service arrangements or reductions from other expense offset arrangements and do not represent the amount paid by the class during periods when reimbursements or reductions occur. Expense ratios before reductions for start-up periods may not be representative of longer-term operating periods. Expenses net of fee waivers reflect expenses after reimbursement by the investment adviser but prior to reductions from brokerage service arrangements or other expense offset arrangements. Expenses net of all reductions represent the net expenses paid by the class.
G Annualized
H Amount does not include the portfolio activity of any underlying Fidelity Central Funds.
See accompanying notes which are an integral part of the financial statements.
Notes to Financial Statements (Unaudited)
For the period ended May 31, 2017
(Amounts in thousands except percentages)
1. Organization.
Fidelity Advisor Growth & Income Fund (the Fund) is a fund of Fidelity Advisor Series I (the Trust) and is authorized to issue an unlimited number of shares. The Trust is registered under the Investment Company Act of 1940, as amended (the 1940 Act), as an open-end management investment company organized as a Massachusetts business trust. The Fund commenced sale of Class Z shares on February 1, 2017. The Fund offers Class A, Class M (formerly Class T), Class C, Class I and Class Z shares, each of which has equal rights as to assets and voting privileges. Each class has exclusive voting rights with respect to matters that affect that class.
After the close of business on June 24, 2016, all outstanding Class B shares were converted to Class A shares. All prior fiscal period dollar and share amounts for Class B presented in the Notes to Financial Statements are for the period December 1, 2015 through June 24, 2016.
2. Investments in Fidelity Central Funds.
The Fund invests in Fidelity Central Funds, which are open-end investment companies generally available only to other investment companies and accounts managed by the investment adviser and its affiliates. The Fund's Schedule of Investments lists each of the Fidelity Central Funds held as of period end, if any, as an investment of the Fund, but does not include the underlying holdings of each Fidelity Central Fund. As an Investing Fund, the Fund indirectly bears its proportionate share of the expenses of the underlying Fidelity Central Funds.
The Money Market Central Funds seek preservation of capital and current income and are managed by Fidelity Investments Money Management, Inc. (FIMM), an affiliate of the investment adviser. Annualized expenses of the Money Market Central Funds as of their most recent shareholder report date are less than .005%.
A complete unaudited list of holdings for each Fidelity Central Fund is available upon request or at the Securities and Exchange Commission (the SEC) website at www.sec.gov. In addition, the financial statements of the Fidelity Central Funds are available on the SEC website or upon request.
3. Significant Accounting Policies.
The Fund is an investment company and applies the accounting and reporting guidance of the Financial Accounting Standards Board (FASB) Accounting Standards Codification Topic 946 Financial Services – Investments Companies. The financial statements have been prepared in conformity with accounting principles generally accepted in the United States of America (GAAP), which require management to make certain estimates and assumptions at the date of the financial statements. Actual results could differ from those estimates. Subsequent events, if any, through the date that the financial statements were issued have been evaluated in the preparation of the financial statements. The following summarizes the significant accounting policies of the Fund:
Investment Valuation. Investments are valued as of 4:00 p.m. Eastern time on the last calendar day of the period. The Board of Trustees (the Board) has delegated the day to day responsibility for the valuation of the Fund's investments to the Fair Value Committee (the Committee) established by the Fund's investment adviser. In accordance with valuation policies and procedures approved by the Board, the Fund attempts to obtain prices from one or more third party pricing vendors or brokers to value its investments. When current market prices, quotations or currency exchange rates are not readily available or reliable, investments will be fair valued in good faith by the Committee, in accordance with procedures adopted by the Board. Factors used in determining fair value vary by investment type and may include market or investment specific events, changes in interest rates and credit quality. The frequency with which these procedures are used cannot be predicted and they may be utilized to a significant extent. The Committee oversees the Fund's valuation policies and procedures and reports to the Board on the Committee's activities and fair value determinations. The Board monitors the appropriateness of the procedures used in valuing the Fund's investments and ratifies the fair value determinations of the Committee.
The Fund categorizes the inputs to valuation techniques used to value its investments into a disclosure hierarchy consisting of three levels as shown below:
- Level 1 – quoted prices in active markets for identical investments
- Level 2 – other significant observable inputs (including quoted prices for similar investments, interest rates, prepayment speeds, etc.)
- Level 3 – unobservable inputs (including the Fund's own assumptions based on the best information available)
Valuation techniques used to value the Fund's investments by major category are as follows:
Equity securities, including restricted securities, for which market quotations are readily available, are valued at the last reported sale price or official closing price as reported by a third party pricing vendor on the primary market or exchange on which they are traded and are categorized as Level 1 in the hierarchy. In the event there were no sales during the day or closing prices are not available, securities are valued at the last quoted bid price or may be valued using the last available price and are generally categorized as Level 2 in the hierarchy. For foreign equity securities, when market or security specific events arise, comparisons to the valuation of American Depositary Receipts (ADRs), futures contracts, Exchange-Traded Funds (ETFs) and certain indexes as well as quoted prices for similar securities may be used and would be categorized as Level 2 in the hierarchy. Utilizing these techniques may result in transfers between Level 1 and Level 2. For equity securities, including restricted securities, where observable inputs are limited, assumptions about market activity and risk are used and these securities may be categorized as Level 3 in the hierarchy.
Debt securities, including restricted securities, are valued based on evaluated prices received from third party pricing vendors or from brokers who make markets in such securities. Corporate bonds are valued by pricing vendors who utilize matrix pricing which considers yield or price of bonds of comparable quality, coupon, maturity and type or by broker-supplied prices. When independent prices are unavailable or unreliable, debt securities may be valued utilizing pricing methodologies which consider similar factors that would be used by third party pricing vendors. Debt securities are generally categorized as Level 2 in the hierarchy but may be Level 3 depending on the circumstances.
Exchange-traded options are valued using the last sale price or, in the absence of a sale, the last offering price and are categorized as Level 1 in the hierarchy. Investments in open-end mutual funds, including the Fidelity Central Funds, are valued at their closing net asset value (NAV) each business day and are categorized as Level 1 in the hierarchy.
Changes in valuation techniques may result in transfers in or out of an assigned level within the disclosure hierarchy. The aggregate value of investments by input level as of May 31, 2017 is included at the end of the Fund's Schedule of Investments.
Foreign Currency. The Fund may use foreign currency contracts to facilitate transactions in foreign-denominated securities. Gains and losses from these transactions may arise from changes in the value of the foreign currency or if the counterparties do not perform under the contracts' terms.
Foreign-denominated assets, including investment securities, and liabilities are translated into U.S. dollars at the exchange rates at period end. Purchases and sales of investment securities, income and dividends received and expenses denominated in foreign currencies are translated into U.S. dollars at the exchange rate in effect on the transaction date.
The effects of exchange rate fluctuations on investments are included with the net realized and unrealized gain (loss) on investment securities. Other foreign currency transactions resulting in realized and unrealized gain (loss) are disclosed separately.
Investment Transactions and Income. For financial reporting purposes, the Fund's investment holdings and NAV include trades executed through the end of the last business day of the period. The NAV per share for processing shareholder transactions is calculated as of the close of business of the New York Stock Exchange (NYSE), normally 4:00 p.m. Eastern time and includes trades executed through the end of the prior business day. Gains and losses on securities sold are determined on the basis of identified cost and may include proceeds received from litigation. Dividend income is recorded on the ex-dividend date, except for certain dividends from foreign securities where the ex-dividend date may have passed, which are recorded as soon as the Fund is informed of the ex-dividend date. Non-cash dividends included in dividend income, if any, are recorded at the fair market value of the securities received. Income and capital gain distributions from Fidelity Central Funds, if any, are recorded on the ex-dividend date. Certain distributions received by the Fund represent a return of capital or capital gain. The Fund determines the components of these distributions subsequent to the ex-dividend date, based upon receipt of tax filings or other correspondence relating to the underlying investment. These distributions are recorded as a reduction of cost of investments and/or as a realized gain. Interest income is accrued as earned and includes coupon interest and amortization of premium and accretion of discount on debt securities as applicable. Investment income is recorded net of foreign taxes withheld where recovery of such taxes is uncertain.
Class Allocations and Expenses. Investment income, realized and unrealized capital gains and losses, common expenses of the Fund, and certain fund-level expense reductions, if any, are allocated daily on a pro-rata basis to each class based on the relative net assets of each class to the total net assets of the Fund. Each class differs with respect to transfer agent and distribution and service plan fees incurred. Certain expense reductions may also differ by class. For the reporting period, the allocated portion of income and expenses to each class as a percent of its average net assets may vary due to the timing of recording these transactions in relation to fluctuating net assets of the classes. Expenses directly attributable to a fund are charged to that fund. Expenses attributable to more than one fund are allocated among the respective funds on the basis of relative net assets or other appropriate methods. Expense estimates are accrued in the period to which they relate and adjustments are made when actual amounts are known.
Income Tax Information and Distributions to Shareholders. Each year, the Fund intends to qualify as a regulated investment company under Subchapter M of the Internal Revenue Code, including distributing substantially all of its taxable income and realized gains. As a result, no provision for U.S. Federal income taxes is required. The Fund files a U.S. federal tax return, in addition to state and local tax returns as required. The Fund's federal income tax returns are subject to examination by the Internal Revenue Service (IRS) for a period of three fiscal years after they are filed. State and local tax returns may be subject to examination for an additional fiscal year depending on the jurisdiction. Foreign taxes are provided for based on the Fund's understanding of the tax rules and rates that exist in the foreign markets in which it invests.
Distributions are declared and recorded on the ex-dividend date. Income dividends and capital gain distributions are declared separately for each class. Income and capital gain distributions are determined in accordance with income tax regulations, which may differ from GAAP.
Capital accounts within the financial statements are adjusted for permanent book-tax differences. These adjustments have no impact on net assets or the results of operations. Capital accounts are not adjusted for temporary book-tax differences which will reverse in a subsequent period.
Book-tax differences are primarily due to foreign currency transactions, passive foreign investment companies (PFIC), market discount, partnerships, equity-debt classifications, certain conversion ratio adjustments and losses deferred due to wash sales.
The federal tax cost of investment securities and unrealized appreciation (depreciation) as of period end were as follows:
| Gross unrealized appreciation | $160,915 |
| Gross unrealized depreciation | (25,060) |
| Net unrealized appreciation (depreciation) on securities | $135,855 |
| Tax cost | $429,426 |
Restricted Securities. The Fund may invest in securities that are subject to legal or contractual restrictions on resale. These securities generally may be resold in transactions exempt from registration or to the public if the securities are registered. Disposal of these securities may involve time-consuming negotiations and expense, and prompt sale at an acceptable price may be difficult. Information regarding restricted securities is included at the end of the Fund's Schedule of Investments.
Consolidated Subsidiary. The Fund invests in certain investments through a wholly-owned subsidiary ("Subsidiary"), which may be subject to federal and state taxes upon disposition.
As of period end, the Fund held an investment of $992 in this Subsidiary, representing .18% of the Fund's net assets. The financial statements have been consolidated and include accounts of the Fund and the Subsidiary. Accordingly, all inter-company transactions and balances have been eliminated.
Any cash held by the Subsidiary is restricted as to its use and is presented as Restricted cash in the Statement of Assets and Liabilities.
4. Derivative Instruments.
Risk Exposures and the Use of Derivative Instruments. The Fund's investment objective allows the Fund to enter into various types of derivative contracts, including options. Derivatives are investments whose value is primarily derived from underlying assets, indices or reference rates and may be transacted on an exchange or over-the-counter (OTC). Derivatives may involve a future commitment to buy or sell a specified asset based on specified terms, to exchange future cash flows at periodic intervals based on a notional principal amount, or for one party to make one or more payments upon the occurrence of specified events in exchange for periodic payments from the other party.
The Fund used derivatives to increase returns and to manage exposure to certain risks as defined below. The success of any strategy involving derivatives depends on analysis of numerous economic factors, and if the strategies for investment do not work as intended, the Fund may not achieve its objectives.
The Fund's use of derivatives increased or decreased its exposure to the following risk:
| Equity Risk | Equity risk relates to the fluctuations in the value of financial instruments as a result of changes in market prices (other than those arising from interest rate risk or foreign exchange risk), whether caused by factors specific to an individual investment, its issuer, or all factors affecting all instruments traded in a market or market segment. |
The Fund is also exposed to additional risks from investing in derivatives, such as liquidity risk and counterparty credit risk. Liquidity risk is the risk that the Fund will be unable to close out the derivative in the open market in a timely manner. Counterparty credit risk is the risk that the counterparty will not be able to fulfill its obligation to the Fund. Counterparty credit risk related to exchange-traded options may be mitigated by the protection provided by the exchange on which they trade.
Investing in derivatives may involve greater risks than investing in the underlying assets directly and, to varying degrees, may involve risk of loss in excess of any initial investment and collateral received and amounts recognized in the Statement of Assets and Liabilities. In addition, there may be the risk that the change in value of the derivative contract does not correspond to the change in value of the underlying instrument.
Options. Options give the purchaser the right, but not the obligation, to buy (call) or sell (put) an underlying security or financial instrument at an agreed exercise or strike price between or on certain dates. Options obligate the seller (writer) to buy (put) or sell (call) an underlying instrument at the exercise or strike price or cash settle an underlying derivative instrument if the holder exercises the option on or before the expiration date.
The Fund used exchange-traded written covered call options to manage its exposure to the market. When the Fund writes a covered call option, the Fund holds the underlying instrument which must be delivered to the holder upon the exercise of the option.
Upon entering into a written options contract, the Fund will receive a premium. Premiums received are reflected as a liability on the Statement of Assets and Liabilities. Options are valued daily and any unrealized appreciation (depreciation) is reflected on the Statement of Assets and Liabilities. When a written option is exercised, the premium is added to the proceeds from the sale of the underlying instrument in determining the gain or loss realized on that investment. When an option is closed the Fund will realize a gain or loss depending on whether the proceeds or amount paid for the closing sale transaction are greater or less than the premium received. When an option expires, gains and losses are realized to the extent of premiums received. The net realized gain (loss) on closed and expired written options and the change in net unrealized appreciation (depreciation) on written options are reflected separately on the Statement of Operations.
Writing call options tends to decrease exposure to the underlying instrument and risk of loss is the change in value in excess of the premium received.
Any open options at period end are presented in the Schedule of Investments under the caption "Written Options".
During the period, the Fund recognized net realized gain (loss) of $512 and a change in net unrealized appreciation (depreciation) of $1,791 related to its investment in written options. This amount is included in the Statement of Operations.
The following is a summary of the Fund's written options activity:
| Number of Contracts | Amount of Premiums | |
| Outstanding at beginning of period | 8 | $492 |
| Options Opened | 12 | 989 |
| Options Exercised | (8) | (558) |
| Options Closed | (2) | (124) |
| Options Expired | (6) | (416) |
| Outstanding at end of period | 4 | $383 |
5. Purchases and Sales of Investments.
Purchases and sales of securities, other than short-term securities, aggregated $109,536 and $121,054, respectively.
6. Fees and Other Transactions with Affiliates.
Management Fee. Fidelity Management & Research Company (the investment adviser) and its affiliates provide the Fund with investment management related services for which the Fund pays a monthly management fee. The management fee is the sum of an individual fund fee rate that is based on an annual rate of .20% of the Fund's average net assets and an annualized group fee rate that averaged .25% during the period. The group fee rate is based upon the average net assets of all the mutual funds advised by the investment adviser, including any mutual funds previously advised by the investment adviser that are currently advised by Fidelity SelectCo, LLC, an affiliate of the investment adviser. The group fee rate decreases as assets under management increase and increases as assets under management decrease. For the reporting period, the total annualized management fee rate was .45% of the Fund's average net assets.
Distribution and Service Plan Fees. In accordance with Rule 12b-1 of the 1940 Act, the Fund has adopted separate Distribution and Service Plans for each class of shares. Certain classes pay Fidelity Distributors Corporation (FDC), an affiliate of the investment adviser, separate Distribution and Service Fees, each of which is based on an annual percentage of each class' average net assets. In addition, FDC may pay financial intermediaries for selling shares of the Fund and providing shareholder support services. For the period, the Distribution and Service Fee rates, total fees and amounts retained by FDC were as follows:
| Distribution Fee | Service Fee | Total Fees | Retained by FDC | |
| Class A | -% | .25% | $315 | $1 |
| Class M | .25% | .25% | 456 | –(a) |
| Class C | .75% | .25% | 421 | 28 |
| $1,192 | $29 |
(a) In the amount of less than five hundred dollars
Sales Load. FDC may receive a front-end sales charge of up to 5.75% for selling Class A shares and 3.50% for selling Class M shares, some of which is paid to financial intermediaries for selling shares of the Fund. Depending on the holding period, FDC may receive contingent deferred sales charges levied on Class A, Class M, and Class C redemptions. The deferred sales charges are 1.00% for Class C shares, 1.00% for certain purchases of Class A shares and .25% for certain purchases of Class M shares.
For the period, sales charge amounts retained by FDC were as follows:
| Retained by FDC | |
| Class A | $38 |
| Class M | 8 |
| Class C(a) | 2 |
| $48 |
(a) When Class C shares are initially sold, FDC pays commissions from its own resources to financial intermediaries through which the sales are made.
Transfer Agent Fees. Fidelity Investments Institutional Operations Company, Inc., (FIIOC), an affiliate of the investment adviser, is the transfer, dividend disbursing and shareholder servicing agent for each class of the Fund. FIIOC receives account fees and asset-based fees that vary according to the account size and type of account of the shareholders of the respective classes of the Fund, except for Class Z. FIIOC receives an asset-based fee of Class Z's average net assets. FIIOC pays for typesetting, printing and mailing of shareholder reports, except proxy statements.
For the period, transfer agent fees for each class were as follows:
| Amount | % of Class-Level Average Net Assets(a) | |
| Class A | $259 | .21 |
| Class M | 189 | .21 |
| Class C | 88 | .21 |
| Class I | 38 | .18 |
| Class Z | –(b) | .05 |
| $574 |
(a) Annualized
(b) In the amount less than five hundred dollars.
Accounting and Security Lending Fees. Fidelity Service Company, Inc. (FSC), an affiliate of the investment adviser, maintains the Fund's accounting records. The accounting fee is based on the level of average net assets for each month. Under a separate contract, FSC administers the security lending program. The security lending fee is based on the number and duration of lending transactions.
Brokerage Commissions. The Fund placed a portion of its portfolio transactions with brokerage firms which are affiliates of the investment adviser. Brokerage commissions are included in net realized gain (loss) and change in net unrealized appreciation (depreciation) in the Statement of Operations. The commissions paid to these affiliated firms were $2 for the period.
Interfund Trades. The Fund may purchase from or sell securities to other Fidelity Funds under procedures adopted by the Board. The procedures have been designed to ensure these interfund trades are executed in accordance with Rule 17a-7 of the 1940 Act. Interfund trades are included within the respective purchases and sales amounts shown in the Purchases and Sales of Investments note.
7. Committed Line of Credit.
The Fund participates with other funds managed by the investment adviser or an affiliate in a $4.25 billion credit facility (the "line of credit") to be utilized for temporary or emergency purposes to fund shareholder redemptions or for other short-term liquidity purposes. The Fund has agreed to pay commitment fees on its pro-rata portion of the line of credit, which amounted to $1 and is reflected in Miscellaneous expenses on the Statement of Operations. During the period, the Fund did not borrow on this line of credit.
8. Security Lending.
The Fund lends portfolio securities through a lending agent from time to time in order to earn additional income. For equity securities, a lending agent is used and may loan securities to certain qualified borrowers, including Fidelity Capital Markets (FCM), a broker-dealer affiliated with the Fund. On the settlement date of the loan, the Fund receives collateral (in the form of U.S. Treasury obligations, letters of credit and/or cash) against the loaned securities and maintains collateral in an amount not less than 100% of the market value of the loaned securities during the period of the loan. The market value of the loaned securities is determined at the close of business of the Fund and any additional required collateral is delivered to the Fund on the next business day. The Fund or borrower may terminate the loan at any time, and if the borrower defaults on its obligation to return the securities loaned because of insolvency or other reasons, the Fund may apply collateral received from the borrower against the obligation. The Fund may experience delays and costs in recovering the securities loaned. Any cash collateral received is invested in the Fidelity Securities Lending Cash Central Fund. The value of loaned securities and cash collateral at period end are disclosed on the Fund's Statement of Assets and Liabilities. At period end, there were no security loans outstanding with FCM. Security lending income represents the income earned on investing cash collateral, less rebates paid to borrowers and any lending agent fees associated with the loan, plus any premium payments received for lending certain types of securities. Security lending income is presented in the Statement of Operations as a component of income from Fidelity Central Funds. Total security lending income during the period amounted to $12, including an amount less than five hundred dollars from securities loaned to FCM.
9. Expense Reductions.
The investment adviser voluntarily agreed to reimburse a portion of the Fund's Class A, Class M, Class C and Class I operating expenses. During the period, this reimbursement reduced expenses as follows:
| Reimbursement | |
| Class A | $7 |
| Class M | 5 |
| Class C | 3 |
| Class I | 1 |
| $16 |
Commissions paid to certain brokers with whom the investment adviser, or its affiliates, places trades on behalf of the Fund include an amount in addition to trade execution, which may be rebated back to the Fund to offset certain expenses. This amount totaled $6 for the period.
In addition, during the period the investment adviser reimbursed and/or waived a portion of fund-level expenses in the amount of $3.
10. Distributions to Shareholders.
Distributions to shareholders of each class were as follows:
| Six months ended May 31, 2017 | Year ended November 30, 2016 | |
| From net investment income | ||
| Class A | $3,771 | $3,587 |
| Class M | 2,262 | 2,175 |
| Class B | – | 15 |
| Class C | 768 | 651 |
| Class I | 605 | 659 |
| Total | $7,406 | $7,087 |
| From net realized gain | ||
| Class A | $3,984 | $14,443 |
| Class M | 2,842 | 10,700 |
| Class B | – | 287 |
| Class C | 1,378 | 4,965 |
| Class I | 561 | 2,165 |
| Total | $8,765 | $32,560 |
11. Share Transactions.
Share transactions for each class were as follows and may contain automatic conversions between classes or exchanges between affiliated funds:
| Shares | Shares | Dollars | Dollars | |
| Six months ended May 31, 2017 (a) | Year ended November 30, 2016 | Six months ended May 31, 2017 (a) | Year ended November 30, 2016 | |
| Class A | ||||
| Shares sold | 543 | 1,081 | $14,908 | $26,026 |
| Reinvestment of distributions | 268 | 720 | 7,224 | 16,776 |
| Shares redeemed | (1,396) | (1,618) | (38,401) | (38,962) |
| Net increase (decrease) | (585) | 183 | $(16,269) | $3,840 |
| Class M | ||||
| Shares sold | 326 | 433 | $8,922 | $10,470 |
| Reinvestment of distributions | 183 | 536 | 4,948 | 12,512 |
| Shares redeemed | (569) | (1,248) | (15,636) | (30,152) |
| Net increase (decrease) | (60) | (279) | $(1,766) | $(7,170) |
| Class B | ||||
| Shares sold | – | 3 | $– | $51 |
| Reinvestment of distributions | – | 12 | – | 278 |
| Shares redeemed | – | (202) | – | (4,522) |
| Net increase (decrease) | – | (187) | $– | $(4,193) |
| Class C | ||||
| Shares sold | 251 | 388 | $6,510 | $8,771 |
| Reinvestment of distributions | 76 | 224 | 1,930 | 4,961 |
| Shares redeemed | (251) | (627) | (6,507) | (14,174) |
| Net increase (decrease) | 76 | (15) | $1,933 | $(442) |
| Class I | ||||
| Shares sold | 704 | 600 | $19,790 | $15,066 |
| Reinvestment of distributions | 39 | 101 | 1,063 | 2,390 |
| Shares redeemed | (356) | (760) | (9,978) | (19,407) |
| Net increase (decrease) | 387 | (59) | $10,875 | $(1,951) |
| Class Z | ||||
| Shares sold | 144 | – | $4,058 | $– |
| Shares redeemed | –(b) | – | (8) | – |
| Net increase (decrease) | 144 | – | $4,050 | $– |
(a) Share transactions for Class Z are for the period February 1, 2017 (commencement of sale of shares) to May 31, 2017
(b) In the amount less than five hundred shares.
12. Other.
The Fund's organizational documents provide former and current trustees and officers with a limited indemnification against liabilities arising in connection with the performance of their duties to the Fund. In the normal course of business, the Fund may also enter into contracts that provide general indemnifications. The Fund's maximum exposure under these arrangements is unknown as this would be dependent on future claims that may be made against the Fund. The risk of material loss from such claims is considered remote.
Shareholder Expense Example
As a shareholder of the Fund, you incur two types of costs: (1) transaction costs, including sales charges (loads) on purchase payments or redemption proceeds, and (2) ongoing costs, including management fees, distribution and/or service (12b-1) fees and other Fund expenses. This Example is intended to help you understand your ongoing costs (in dollars) of investing in the Fund and to compare these costs with the ongoing costs of investing in other mutual funds.
The actual expense Example is based on an investment of $1,000 invested at the beginning of the period and held for the entire period (December 1, 2016 to May 31, 2017) for Class A, Class M, Class C and Class I and for the period (February 1, 2017 to May 31, 2017) for Class Z. The hypothetical expense Example is based on an investment of $1,000 invested for the one-half year period (December 1, 2016 to May 31, 2017).
Actual Expenses
The first line of the accompanying table for each class of the Fund provides information about actual account values and actual expenses. You may use the information in this line, together with the amount you invested, to estimate the expenses that you paid over the period. Simply divide your account value by $1,000.00 (for example, an $8,600 account value divided by $1,000.00 = 8.6), then multiply the result by the number in the first line for a class of the Fund under the heading entitled "Expenses Paid During Period" to estimate the expenses you paid on your account during this period. In addition, the Fund, as a shareholder in the underlying Fidelity Central Funds, will indirectly bear its pro-rata share of the fees and expenses incurred by the underlying Fidelity Central Funds. These fees and expenses are not included in the Fund's annualized expense ratio used to calculate the expense estimate in the table below.
Hypothetical Example for Comparison Purposes
The second line of the accompanying table for each class of the Fund provides information about hypothetical account values and hypothetical expenses based on a Class' actual expense ratio and an assumed rate of return of 5% per year before expenses, which is not the Class' actual return. The hypothetical account values and expenses may not be used to estimate the actual ending account balance or expenses you paid for the period. You may use this information to compare the ongoing costs of investing in the Fund and other funds. To do so, compare this 5% hypothetical example with the 5% hypothetical examples that appear in the shareholder reports of the other funds. In addition, the Fund, as a shareholder in the underlying Fidelity Central Funds, will indirectly bear its pro-rata share of the fees and expenses incurred by the underlying Fidelity Central Funds. These fees and expenses are not included in the Fund's annualized expense ratio used to calculate the expense estimate in the table below.
Please note that the expenses shown in the table are meant to highlight your ongoing costs only and do not reflect any transaction costs. Therefore, the second line of the table is useful in comparing ongoing costs only, and will not help you determine the relative total costs of owning different funds. In addition, if these transactional costs were included, your costs would have been higher.
| Annualized Expense Ratio-A | Beginning Account Value | Ending Account Value May 31, 2017 | Expenses Paid During Period | |
| Class A | .98% | |||
| Actual | $1,000.00 | $1,061.10 | $5.04-B | |
| Hypothetical-C | $1,000.00 | $1,020.04 | $4.94-D | |
| Class M | 1.23% | |||
| Actual | $1,000.00 | $1,059.70 | $6.32-B | |
| Hypothetical-C | $1,000.00 | $1,018.80 | $6.19-D | |
| Class C | 1.73% | |||
| Actual | $1,000.00 | $1,056.70 | $8.87-B | |
| Hypothetical-C | $1,000.00 | $1,016.31 | $8.70-D | |
| Class I | .70% | |||
| Actual | $1,000.00 | $1,062.40 | $3.60-B | |
| Hypothetical-C | $1,000.00 | $1,021.44 | $3.53-D | |
| Class Z | .58% | |||
| Actual | $1,000.00 | $1,031.40 | $1.94-B | |
| Hypothetical-C | $1,000.00 | $1,022.04 | $2.92-D |
A Annualized expense ratio reflects expenses net of applicable fee waivers.
B Actual expenses are equal to each Class' annualized expense ratio, multiplied by the average account value over the period, multiplied by 182/365 (to reflect the one-half year period) for Class A, Class M, Class C and Class I and multiplied by 120/365 (to reflect the period February 1, 2017 to May 31, 2017) for Class Z.
C 5% return per year before expenses
D Hypothetical expenses are equal to each Class' annualized expense ratio, multiplied by the average account value over the period, multiplied by 182/365 (to reflect the one-half year period).
![]()
AGAI-SANN-0717
1.704634.119
Fidelity Advisor® Small Cap Fund Semi-Annual Report May 31, 2017 |
|
Contents
To view a fund's proxy voting guidelines and proxy voting record for the 12-month period ended June 30, visit http://www.fidelity.com/proxyvotingresults or visit the Securities and Exchange Commission's (SEC) web site at http://www.sec.gov.
You may also call 1-877-208-0098 to request a free copy of the proxy voting guidelines.
Standard & Poor's, S&P and S&P 500 are registered service marks of The McGraw-Hill Companies, Inc. and have been licensed for use by Fidelity Distributors Corporation.
Other third-party marks appearing herein are the property of their respective owners.
All other marks appearing herein are registered or unregistered trademarks or service marks of FMR LLC or an affiliated company. © 2017 FMR LLC. All rights reserved.
This report and the financial statements contained herein are submitted for the general information of the shareholders of the Fund. This report is not authorized for distribution to prospective investors in the Fund unless preceded or accompanied by an effective prospectus.
A fund files its complete schedule of portfolio holdings with the SEC for the first and third quarters of each fiscal year on Form N-Q. Forms N-Q are available on the SEC’s web site at http://www.sec.gov. A fund's Forms N-Q may be reviewed and copied at the SEC’s Public Reference Room in Washington, DC. Information regarding the operation of the SEC's Public Reference Room may be obtained by calling 1-800-SEC-0330.
For a complete list of a fund's portfolio holdings, view the most recent holdings listing, semiannual report, or annual report on Fidelity's web site at http://www.fidelity.com, http://www.institutional.fidelity.com, or http://www.401k.com, as applicable.
NOT FDIC INSURED •MAY LOSE VALUE •NO BANK GUARANTEE
Neither the Fund nor Fidelity Distributors Corporation is a bank.
Investment Summary (Unaudited)
Top Ten Stocks as of May 31, 2017
| % of fund's net assets | % of fund's net assets 6 months ago | |
| Marriott Vacations Worldwide Corp. | 3.1 | 1.5 |
| Conduent, Inc. | 2.6 | 0.0 |
| Berry Global Group, Inc. | 2.4 | 1.3 |
| CBRE Group, Inc. | 2.4 | 1.1 |
| Stamps.com, Inc. | 2.3 | 0.8 |
| j2 Global, Inc. | 2.3 | 1.1 |
| Global Payments, Inc. | 2.2 | 0.9 |
| CDW Corp. | 2.2 | 2.5 |
| Premier, Inc. | 2.1 | 1.5 |
| Polaris Industries, Inc. | 2.1 | 0.0 |
| 23.7 |
Top Five Market Sectors as of May 31, 2017
| % of fund's net assets | % of fund's net assets 6 months ago | |
| Information Technology | 21.9 | 19.9 |
| Consumer Discretionary | 16.6 | 10.2 |
| Financials | 14.8 | 16.7 |
| Industrials | 10.4 | 17.7 |
| Health Care | 9.5 | 11.1 |
Asset Allocation (% of fund's net assets)
| As of May 31, 2017* | ||
| Stocks and Equity Futures | 99.3% | |
| Short-Term Investments and Net Other Assets (Liabilities) | 0.7% | |

* Foreign investments - 16.3%
| As of November 30, 2016* | ||
| Stocks and Equity Futures | 99.4% | |
| Short-Term Investments and Net Other Assets (Liabilities) | 0.6% | |

* Foreign investments - 20.2%
Percentages shown as 0.0% may reflect amounts less than 0.05%.
Investments May 31, 2017 (Unaudited)
Showing Percentage of Net Assets
| Common Stocks - 94.5% | |||
| Shares | Value (000s) | ||
| CONSUMER DISCRETIONARY - 16.6% | |||
| Auto Components - 3.7% | |||
| Dorman Products, Inc. (a) | 350,000 | $29,190 | |
| Standard Motor Products, Inc. | 550,000 | 26,763 | |
| Tenneco, Inc. | 700,000 | 39,795 | |
| 95,748 | |||
| Diversified Consumer Services - 1.9% | |||
| Grand Canyon Education, Inc. (a) | 500,000 | 39,200 | |
| Tsukada Global Holdings, Inc. | 1,780,400 | 8,986 | |
| 48,186 | |||
| Hotels, Restaurants & Leisure - 3.1% | |||
| Marriott Vacations Worldwide Corp. | 680,000 | 79,232 | |
| Household Durables - 4.4% | |||
| NVR, Inc. (a) | 18,000 | 41,083 | |
| PulteGroup, Inc. | 1,800,000 | 40,806 | |
| TopBuild Corp. (a) | 600,000 | 32,130 | |
| 114,019 | |||
| Leisure Products - 2.1% | |||
| Polaris Industries, Inc. (b) | 650,000 | 54,340 | |
| Specialty Retail - 1.4% | |||
| Asbury Automotive Group, Inc. (a) | 650,000 | 36,368 | |
| TOTAL CONSUMER DISCRETIONARY | 427,893 | ||
| CONSUMER STAPLES - 1.5% | |||
| Food & Staples Retailing - 1.5% | |||
| McColl's Retail Group PLC | 4,083,188 | 10,680 | |
| Sundrug Co. Ltd. | 320,000 | 12,453 | |
| Tsuruha Holdings, Inc. | 140,000 | 15,523 | |
| 38,656 | |||
| ENERGY - 3.6% | |||
| Energy Equipment & Services - 1.7% | |||
| Hess Midstream Partners LP (c) | 1,860,448 | 43,237 | |
| Oil, Gas & Consumable Fuels - 1.9% | |||
| Noble Midstream Partners LP | 647,933 | 29,798 | |
| World Fuel Services Corp. | 570,700 | 20,169 | |
| 49,967 | |||
| TOTAL ENERGY | 93,204 | ||
| FINANCIALS - 14.8% | |||
| Banks - 9.0% | |||
| Allegiance Bancshares, Inc. (a)(c) | 960,000 | 37,200 | |
| Bank of Hawaii Corp. | 250,000 | 19,433 | |
| Bank of the Ozarks, Inc. | 1,110,000 | 49,062 | |
| ConnectOne Bancorp, Inc. | 1,400,000 | 30,520 | |
| German American Bancorp, Inc. | 713,406 | 22,151 | |
| Great Western Bancorp, Inc. | 683,027 | 25,859 | |
| Home Bancshares, Inc. | 1,000,000 | 23,410 | |
| ServisFirst Bancshares, Inc. (b) | 700,000 | 23,968 | |
| 231,603 | |||
| Insurance - 4.3% | |||
| Enstar Group Ltd. (a) | 130,000 | 24,395 | |
| Hastings Group Holdings PLC | 6,753,539 | 27,297 | |
| James River Group Holdings Ltd. | 492,289 | 19,514 | |
| Reinsurance Group of America, Inc. | 330,000 | 41,088 | |
| 112,294 | |||
| Thrifts & Mortgage Finance - 1.5% | |||
| Essent Group Ltd. (a) | 702,586 | 25,483 | |
| Meridian Bancorp, Inc. Maryland | 800,000 | 12,960 | |
| 38,443 | |||
| TOTAL FINANCIALS | 382,340 | ||
| HEALTH CARE - 9.5% | |||
| Health Care Equipment & Supplies - 1.2% | |||
| LivaNova PLC (a) | 530,000 | 30,125 | |
| Health Care Providers & Services - 6.2% | |||
| HealthSouth Corp. | 1,150,000 | 52,130 | |
| Premier, Inc. (a) | 1,600,300 | 55,242 | |
| Sigma Healthcare Ltd. | 6,200,000 | 3,755 | |
| Surgery Partners, Inc. (a) | 2,200,000 | 47,960 | |
| The Ensign Group, Inc. | 93,797 | 1,724 | |
| 160,811 | |||
| Health Care Technology - 0.4% | |||
| Quality Systems, Inc. (a) | 703,225 | 10,802 | |
| Life Sciences Tools & Services - 1.3% | |||
| ICON PLC (a) | 350,000 | 32,935 | |
| Pharmaceuticals - 0.4% | |||
| Kaken Pharmaceutical Co. Ltd. | 169,700 | 9,776 | |
| TOTAL HEALTH CARE | 244,449 | ||
| INDUSTRIALS - 10.4% | |||
| Building Products - 1.0% | |||
| Apogee Enterprises, Inc. | 500,000 | 26,640 | |
| Commercial Services & Supplies - 2.5% | |||
| Coor Service Management Holding AB | 1,535,502 | 10,600 | |
| Deluxe Corp. | 500,000 | 34,080 | |
| Loomis AB (B Shares) | 540,000 | 20,348 | |
| 65,028 | |||
| Construction & Engineering - 2.1% | |||
| Argan, Inc. | 400,000 | 23,620 | |
| EMCOR Group, Inc. | 500,000 | 31,510 | |
| 55,130 | |||
| Machinery - 0.4% | |||
| Hy-Lok Corp. | 468,708 | 10,027 | |
| Marine - 0.5% | |||
| SITC International Holdings Co. Ltd. | 17,150,000 | 12,457 | |
| Professional Services - 2.2% | |||
| Benefit One, Inc. | 250,000 | 9,515 | |
| ICF International, Inc. (a) | 529,145 | 24,896 | |
| On Assignment, Inc. (a) | 430,000 | 22,532 | |
| 56,943 | |||
| Trading Companies & Distributors - 1.7% | |||
| Univar, Inc. (a) | 1,400,000 | 42,588 | |
| TOTAL INDUSTRIALS | 268,813 | ||
| INFORMATION TECHNOLOGY - 21.9% | |||
| Electronic Equipment & Components - 5.3% | |||
| CDW Corp. | 950,000 | 57,171 | |
| ePlus, Inc. (a) | 369,489 | 29,097 | |
| Fabrinet (a) | 550,000 | 19,377 | |
| SYNNEX Corp. | 290,000 | 32,265 | |
| 137,910 | |||
| Internet Software & Services - 4.6% | |||
| j2 Global, Inc. | 700,000 | 59,234 | |
| Stamps.com, Inc. (a)(b) | 430,309 | 59,340 | |
| 118,574 | |||
| IT Services - 10.8% | |||
| Blackhawk Network Holdings, Inc. (a) | 811,900 | 35,196 | |
| Conduent, Inc. (a) | 4,150,000 | 68,102 | |
| CSRA, Inc. | 1,000,000 | 30,160 | |
| Global Payments, Inc. | 630,000 | 57,714 | |
| Maximus, Inc. | 750,000 | 46,560 | |
| WEX, Inc. (a) | 400,000 | 40,864 | |
| 278,596 | |||
| Software - 0.5% | |||
| Zensar Technologies Ltd. | 868,049 | 11,652 | |
| Technology Hardware, Storage & Peripherals - 0.7% | |||
| NCR Corp. (a) | 500,000 | 19,265 | |
| TOTAL INFORMATION TECHNOLOGY | 565,997 | ||
| MATERIALS - 7.8% | |||
| Chemicals - 0.5% | |||
| SK Kaken Co. Ltd. | 130,000 | 12,255 | |
| Containers & Packaging - 5.0% | |||
| Berry Global Group, Inc. (a) | 1,070,000 | 62,049 | |
| Greif, Inc. Class A | 650,000 | 38,643 | |
| Silgan Holdings, Inc. | 900,000 | 28,629 | |
| 129,321 | |||
| Metals & Mining - 1.1% | |||
| Atkore International Group, Inc. | 1,300,000 | 27,118 | |
| Paper & Forest Products - 1.2% | |||
| Neenah Paper, Inc. | 410,000 | 31,980 | |
| TOTAL MATERIALS | 200,674 | ||
| REAL ESTATE - 6.0% | |||
| Equity Real Estate Investment Trusts (REITs) - 0.9% | |||
| National Health Investors, Inc. | 330,000 | 24,922 | |
| Real Estate Management & Development - 5.1% | |||
| CBRE Group, Inc. (a) | 1,750,000 | 61,040 | |
| Daito Trust Construction Co. Ltd. | 170,000 | 26,816 | |
| Open House Co. Ltd. | 500,000 | 15,508 | |
| Relo Holdings Corp. | 1,400,000 | 28,190 | |
| 131,554 | |||
| TOTAL REAL ESTATE | 156,476 | ||
| TELECOMMUNICATION SERVICES - 0.0% | |||
| Diversified Telecommunication Services - 0.0% | |||
| Asia Satellite Telecommunications Holdings Ltd. | 277,000 | 320 | |
| UTILITIES - 2.4% | |||
| Gas Utilities - 1.7% | |||
| Amerigas Partners LP | 630,000 | 27,934 | |
| Star Gas Partners LP | 1,612,757 | 16,111 | |
| 44,045 | |||
| Multi-Utilities - 0.7% | |||
| Telecom Plus PLC | 1,000,000 | 17,020 | |
| TOTAL UTILITIES | 61,065 | ||
| TOTAL COMMON STOCKS | |||
| (Cost $1,969,118) | 2,439,887 | ||
| Principal Amount (000s) | Value (000s) | ||
| U.S. Treasury Obligations - 0.3% | |||
| U.S. Treasury Bills, yield at date of purchase 0.76% to 0.92% 6/22/17 to 8/24/17 (d) | |||
| (Cost $6,952) | 6,960 | 6,951 | |
| Shares | Value (000s) | ||
| Money Market Funds - 7.4% | |||
| Fidelity Cash Central Fund, 0.86% (e) | 134,014,488 | $134,041 | |
| Fidelity Securities Lending Cash Central Fund 0.87% (e)(f) | 58,058,561 | 58,064 | |
| TOTAL MONEY MARKET FUNDS | |||
| (Cost $192,103) | 192,105 | ||
| TOTAL INVESTMENT PORTFOLIO - 102.2% | |||
| (Cost $2,168,173) | 2,638,943 | ||
| NET OTHER ASSETS (LIABILITIES) - (2.2)% | (56,001) | ||
| NET ASSETS - 100% | $2,582,942 |
| Futures Contracts | |||
| Expiration Date | Underlying Face Amount at Value (000s) | Unrealized Appreciation/(Depreciation) (000s) | |
| Purchased | |||
| Equity Index Contracts | |||
| 1,818 ICE Russell 2000 Index Contracts (United States) | June 2017 | 124,451 | $(659) |
The face value of futures purchased as a percentage of Net Assets is 4.8%
For the period, the average monthly underlying face amount at value for futures contracts in the aggregate was $161,616,884.
Legend
(a) Non-income producing
(b) Security or a portion of the security is on loan at period end.
(c) Affiliated company
(d) Security or a portion of the security was pledged to cover margin requirements for futures contracts. At period end, the value of securities pledged amounted to $6,272,000.
(e) Affiliated fund that is generally available only to investment companies and other accounts managed by Fidelity Investments. The rate quoted is the annualized seven-day yield of the fund at period end. A complete unaudited listing of the fund's holdings as of its most recent quarter end is available upon request. In addition, each Fidelity Central Fund's financial statements are available on the SEC's website or upon request.
(f) Investment made with cash collateral received from securities on loan.
Affiliated Central Funds
Information regarding fiscal year to date income earned by the Fund from investments in Fidelity Central Funds is as follows:
| Fund | Income earned |
| (Amounts in thousands) | |
| Fidelity Cash Central Fund | $539 |
| Fidelity Securities Lending Cash Central Fund | 566 |
| Total | $1,105 |
Other Affiliated Issuers
An affiliated company is a company in which the Fund has ownership of at least 5% of the voting securities. Fiscal year to date transactions with companies which are or were affiliates are as follows:
| Affiliate (Amounts in thousands) | Value, beginning of period | Purchases | Sales Proceeds | Dividend Income | Value, end of period |
| Allegiance Bancshares, Inc. | $11,016 | $23,182 | $-- | $-- | $37,200 |
| Hess Midstream Partners LP | -- | 47,425 | -- | -- | 43,237 |
| Hy-Lok Corp. | 11,375 | -- | 2,142 | 151 | -- |
| Tsukada Global Holdings, Inc. | 17,683 | -- | 5,596 | 99 | -- |
| Total | $40,074 | $70,607 | $7,738 | $250 | $80,437 |
Investment Valuation
The following is a summary of the inputs used, as of May 31, 2017, involving the Fund's assets and liabilities carried at fair value. The inputs or methodology used for valuing securities may not be an indication of the risk associated with investing in those securities. For more information on valuation inputs, and their aggregation into the levels used below, please refer to the Investment Valuation section in the accompanying Notes to Financial Statements.
| Valuation Inputs at Reporting Date: | ||||
| Description | Total | Level 1 | Level 2 | Level 3 |
| (Amounts in thousands) | ||||
| Investments in Securities: | ||||
| Equities: | ||||
| Consumer Discretionary | $427,893 | $427,893 | $-- | $-- |
| Consumer Staples | 38,656 | 38,656 | -- | -- |
| Energy | 93,204 | 93,204 | -- | -- |
| Financials | 382,340 | 382,340 | -- | -- |
| Health Care | 244,449 | 244,449 | -- | -- |
| Industrials | 268,813 | 268,813 | -- | -- |
| Information Technology | 565,997 | 565,997 | -- | -- |
| Materials | 200,674 | 200,674 | -- | -- |
| Real Estate | 156,476 | 156,476 | -- | -- |
| Telecommunication Services | 320 | 320 | -- | -- |
| Utilities | 61,065 | 61,065 | -- | -- |
| U.S. Government and Government Agency Obligations | 6,951 | -- | 6,951 | -- |
| Money Market Funds | 192,105 | 192,105 | -- | -- |
| Total Investments in Securities: | $2,638,943 | $2,631,992 | $6,951 | $-- |
| Derivative Instruments: | ||||
| Liabilities | ||||
| Futures Contracts | $(659) | $(659) | $-- | $-- |
| Total Liabilities | $(659) | $(659) | $-- | $-- |
| Total Derivative Instruments: | $(659) | $(659) | $-- | $-- |
The following is a summary of transfers between Level 1 and Level 2 for the period ended May 31, 2017. Transfers are assumed to have occurred at the beginning of the period, and are primarily attributable to the valuation techniques used for foreign equity securities, as discussed in the accompanying Notes to Financial Statements:
| Transfers | Total (000s) |
| (Amounts in thousands) | |
| Level 1 to Level 2 | $0 |
| Level 2 to Level 1 | $179,996 |
Value of Derivative Instruments
The following table is a summary of the Fund's value of derivative instruments by primary risk exposure as of May 31, 2017. For additional information on derivative instruments, please refer to the Derivative Instruments section in the accompanying Notes to Financial Statements.
| Primary Risk Exposure / Derivative Type | Value | |
| Asset | Liability | |
| (Amounts in thousands) | ||
| Equity Risk | ||
| Futures Contracts(a) | $0 | $(659) |
| Total Equity Risk | 0 | (659) |
| Total Value of Derivatives | $0 | $(659) |
(a) Reflects gross cumulative appreciation (depreciation) on futures contracts as presented in the Schedule of Investments. Only the period end receivable or payable for daily variation margin and net unrealized appreciation (depreciation) are presented in the Statement of Assets and Liabilities.
Other Information
Distribution of investments by country or territory of incorporation, as a percentage of Total Net Assets, is as follows (Unaudited):
| United States of America | 83.7% |
| Japan | 5.5% |
| United Kingdom | 3.4% |
| Bermuda | 2.6% |
| Ireland | 1.3% |
| Cayman Islands | 1.3% |
| Sweden | 1.2% |
| Others (Individually Less Than 1%) | 1.0% |
| 100.0% |
See accompanying notes which are an integral part of the financial statements.
Financial Statements
Statement of Assets and Liabilities
| Amounts in thousands (except per-share amounts) | May 31, 2017 (Unaudited) | |
| Assets | ||
| Investment in securities, at value (including securities loaned of $56,277) — See accompanying schedule: Unaffiliated issuers (cost $1,897,043) | $2,356,374 | |
| Fidelity Central Funds (cost $192,103) | 192,105 | |
| Other affiliated issuers (cost $79,027) | 90,464 | |
| Total Investments (cost $2,168,173) | $2,638,943 | |
| Foreign currency held at value (cost $670) | 670 | |
| Receivable for investments sold | 9,155 | |
| Receivable for fund shares sold | 3,535 | |
| Dividends receivable | 3,081 | |
| Distributions receivable from Fidelity Central Funds | 141 | |
| Prepaid expenses | 1 | |
| Other receivables | 38 | |
| Total assets | 2,655,564 | |
| Liabilities | ||
| Payable to custodian bank | $165 | |
| Payable for investments purchased | 1,094 | |
| Payable for fund shares redeemed | 10,782 | |
| Accrued management fee | 1,184 | |
| Distribution and service plan fees payable | 709 | |
| Payable for daily variation margin for derivative instruments | 79 | |
| Other affiliated payables | 497 | |
| Other payables and accrued expenses | 53 | |
| Collateral on securities loaned | 58,059 | |
| Total liabilities | 72,622 | |
| Net Assets | $2,582,942 | |
| Net Assets consist of: | ||
| Paid in capital | $1,893,726 | |
| Distributions in excess of net investment income | (1,306) | |
| Accumulated undistributed net realized gain (loss) on investments and foreign currency transactions | 220,405 | |
| Net unrealized appreciation (depreciation) on investments and assets and liabilities in foreign currencies | 470,117 | |
| Net Assets | $2,582,942 | |
| Calculation of Maximum Offering Price | ||
| Class A: | ||
| Net Asset Value and redemption price per share ($816,903 ÷ 30,520 shares) | $26.77 | |
| Maximum offering price per share (100/94.25 of $26.77) | $28.40 | |
| Class M: | ||
| Net Asset Value and redemption price per share ($733,162 ÷ 29,276 shares) | $25.04 | |
| Maximum offering price per share (100/96.50 of $25.04) | $25.95 | |
| Class C: | ||
| Net Asset Value and offering price per share ($272,198 ÷ 12,909 shares)(a) | $21.09 | |
| Class I: | ||
| Net Asset Value, offering price and redemption price per share ($722,115 ÷ 24,908 shares) | $28.99 | |
| Class Z: | ||
| Net Asset Value, offering price and redemption price per share ($38,564 ÷ 1,332 shares) | $28.95 |
(a) Redemption price per share is equal to net asset value less any applicable contingent deferred sales charge.
See accompanying notes which are an integral part of the financial statements.
Statement of Operations
| Amounts in thousands | Six months ended May 31, 2017 (Unaudited) | |
| Investment Income | ||
| Dividends (including $250 earned from other affiliated issuers) | $15,309 | |
| Interest | 32 | |
| Income from Fidelity Central Funds | 1,105 | |
| Total income | 16,446 | |
| Expenses | ||
| Management fee | ||
| Basic fee | $9,260 | |
| Performance adjustment | (1,445) | |
| Transfer agent fees | 2,675 | |
| Distribution and service plan fees | 4,386 | |
| Accounting and security lending fees | 399 | |
| Custodian fees and expenses | 58 | |
| Independent trustees' fees and expenses | 5 | |
| Registration fees | 54 | |
| Audit | 36 | |
| Legal | 4 | |
| Miscellaneous | 11 | |
| Total expenses before reductions | 15,443 | |
| Expense reductions | (124) | 15,319 |
| Net investment income (loss) | 1,127 | |
| Realized and Unrealized Gain (Loss) | ||
| Net realized gain (loss) on: | ||
| Investment securities: | ||
| Unaffiliated issuers | 208,620 | |
| Fidelity Central Funds | 1 | |
| Other affiliated issuers | (697) | |
| Foreign currency transactions | 35 | |
| Futures contracts | 13,818 | |
| Total net realized gain (loss) | 221,777 | |
| Change in net unrealized appreciation (depreciation) on: Investment securities | (55,755) | |
| Assets and liabilities in foreign currencies | 99 | |
| Futures contracts | (7,254) | |
| Total change in net unrealized appreciation (depreciation) | (62,910) | |
| Net gain (loss) | 158,867 | |
| Net increase (decrease) in net assets resulting from operations | $159,994 |
See accompanying notes which are an integral part of the financial statements.
Statement of Changes in Net Assets
| Amounts in thousands | Six months ended May 31, 2017 (Unaudited) | Year ended November 30, 2016 |
| Increase (Decrease) in Net Assets | ||
| Operations | ||
| Net investment income (loss) | $1,127 | $11,777 |
| Net realized gain (loss) | 221,777 | 29,088 |
| Change in net unrealized appreciation (depreciation) | (62,910) | (27,109) |
| Net increase (decrease) in net assets resulting from operations | 159,994 | 13,756 |
| Distributions to shareholders from net investment income | (7,493) | – |
| Distributions to shareholders from net realized gain | (26,782) | (249,036) |
| Total distributions | (34,275) | (249,036) |
| Share transactions - net increase (decrease) | (201,029) | (125,212) |
| Total increase (decrease) in net assets | (75,310) | (360,492) |
| Net Assets | ||
| Beginning of period | 2,658,252 | 3,018,744 |
| End of period | $2,582,942 | $2,658,252 |
| Other Information | ||
| Undistributed net investment income end of period | $– | $5,060 |
| Distributions in excess of net investment income end of period | $(1,306) | $– |
See accompanying notes which are an integral part of the financial statements.
Financial Highlights — Fidelity Advisor Small Cap Fund Class A
| Six months ended (Unaudited) May 31, | Years ended November 30, | |||||
| 2017 | 2016 | 2015 | 2014 | 2013 | 2012 | |
| Selected Per–Share Data | ||||||
| Net asset value, beginning of period | $25.52 | $27.56 | $29.85 | $30.96 | $22.45 | $23.60 |
| Income from Investment Operations | ||||||
| Net investment income (loss)A | .02 | .12B | .02C | .04 | .12D | (.03) |
| Net realized and unrealized gain (loss) | 1.56 | .05 | 1.10 | 2.36 | 8.45 | .79 |
| Total from investment operations | 1.58 | .17 | 1.12 | 2.40 | 8.57 | .76 |
| Distributions from net investment income | (.08) | – | – | (.01) | (.05) | – |
| Distributions from net realized gain | (.25) | (2.21) | (3.41) | (3.50) | (.01) | (1.91) |
| Total distributions | (.33) | (2.21) | (3.41) | (3.51) | (.06) | (1.91) |
| Net asset value, end of period | $26.77 | $25.52 | $27.56 | $29.85 | $30.96 | $22.45 |
| Total ReturnE,F,G | 6.23% | 1.31% | 4.17% | 9.06% | 38.30% | 3.87% |
| Ratios to Average Net AssetsH,I | ||||||
| Expenses before reductions | 1.09%J | 1.32% | 1.26% | .98% | 1.01% | 1.06% |
| Expenses net of fee waivers, if any | 1.09%J | 1.32% | 1.26% | .98% | 1.01% | 1.06% |
| Expenses net of all reductions | 1.09%J | 1.31% | 1.25% | .97% | 1.00% | 1.06% |
| Net investment income (loss) | .15%J | .52%B | .07%C | .14% | .46%D | (.13)% |
| Supplemental Data | ||||||
| Net assets, end of period (in millions) | $817 | $932 | $1,047 | $1,097 | $1,263 | $1,212 |
| Portfolio turnover rateK | 74%J | 81% | 33% | 39% | 34% | 69% |
A Calculated based on average shares outstanding during the period.
B Net Investment income per share reflects a large, non-recurring dividend which amounted to $.11 per share. Excluding this non-recurring dividend, the ratio of net investment income (loss) to average net assets would have been .07%.
C Net Investment income per share reflects a large, non-recurring dividend which amounted to $.06 per share. Excluding this non-recurring dividend, the ratio of net investment income (loss) to average net assets would have been (.16) %.
D Net Investment income per share reflects a large, non-recurring dividend which amounted to $.04 per share. Excluding this non-recurring dividend, the ratio of net investment income (loss) to average net assets would have been .29%.
E Total returns for periods of less than one year are not annualized.
F Total returns would have been lower if certain expenses had not been reduced during the applicable periods shown.
G Total returns do not include the effect of the sales charges.
H Fees and expenses of any underlying Fidelity Central Funds are not included in the Fund's expense ratio. The Fund indirectly bears its proportionate share of the expenses of any underlying Fidelity Central Funds.
I Expense ratios reflect operating expenses of the class. Expenses before reductions do not reflect amounts reimbursed by the investment adviser or reductions from brokerage service arrangements or reductions from other expense offset arrangements and do not represent the amount paid by the class during periods when reimbursements or reductions occur. Expenses net of fee waivers reflect expenses after reimbursement by the investment adviser but prior to reductions from brokerage service arrangements or other expense offset arrangements. Expenses net of all reductions represent the net expenses paid by the class.
J Annualized
K Amount does not include the portfolio activity of any underlying Fidelity Central Funds.
See accompanying notes which are an integral part of the financial statements.
Financial Highlights — Fidelity Advisor Small Cap Fund Class M
| Six months ended (Unaudited) May 31, | Years ended November 30, | |||||
| 2017 | 2016 | 2015 | 2014 | 2013 | 2012 | |
| Selected Per–Share Data | ||||||
| Net asset value, beginning of period | $23.88 | $25.99 | $28.40 | $29.69 | $21.52 | $22.75 |
| Income from Investment Operations | ||||||
| Net investment income (loss)A | (.01) | .07B | (.04)C | (.02) | .06D | (.07) |
| Net realized and unrealized gain (loss) | 1.45 | .03 | 1.04 | 2.23 | 8.13 | .75 |
| Total from investment operations | 1.44 | .10 | 1.00 | 2.21 | 8.19 | .68 |
| Distributions from net investment income | (.03) | – | – | – | (.01) | – |
| Distributions from net realized gain | (.25) | (2.21) | (3.41) | (3.50) | (.01) | (1.91) |
| Total distributions | (.28) | (2.21) | (3.41) | (3.50) | (.02) | (1.91) |
| Net asset value, end of period | $25.04 | $23.88 | $25.99 | $28.40 | $29.69 | $21.52 |
| Total ReturnE,F,G | 6.05% | 1.10% | 3.93% | 8.79% | 38.11% | 3.64% |
| Ratios to Average Net AssetsH,I | ||||||
| Expenses before reductions | 1.32%J | 1.54% | 1.49% | 1.20% | 1.22% | 1.26% |
| Expenses net of fee waivers, if any | 1.32%J | 1.54% | 1.49% | 1.20% | 1.22% | 1.26% |
| Expenses net of all reductions | 1.32%J | 1.54% | 1.49% | 1.20% | 1.21% | 1.25% |
| Net investment income (loss) | (.08)%J | .29%B | (.16)%C | (.08)% | .25%D | (.33)% |
| Supplemental Data | ||||||
| Net assets, end of period (in millions) | $733 | $756 | $888 | $958 | $1,113 | $1,054 |
| Portfolio turnover rateK | 74%J | 81% | 33% | 39% | 34% | 69% |
A Calculated based on average shares outstanding during the period.
B Net Investment income per share reflects a large, non-recurring dividend which amounted to $.10 per share. Excluding this non-recurring dividend, the ratio of net investment income (loss) to average net assets would have been (.16) %.
C Net Investment income per share reflects a large, non-recurring dividend which amounted to $.06 per share. Excluding this non-recurring dividend, the ratio of net investment income (loss) to average net assets would have been (.39) %.
D Net Investment income per share reflects a large, non-recurring dividend which amounted to $.04 per share. Excluding this non-recurring dividend, the ratio of net investment income (loss) to average net assets would have been .09%.
E Total returns for periods of less than one year are not annualized.
F Total returns would have been lower if certain expenses had not been reduced during the applicable periods shown.
G Total returns do not include the effect of the sales charges.
H Fees and expenses of any underlying Fidelity Central Funds are not included in the Fund's expense ratio. The Fund indirectly bears its proportionate share of the expenses of any underlying Fidelity Central Funds.
I Expense ratios reflect operating expenses of the class. Expenses before reductions do not reflect amounts reimbursed by the investment adviser or reductions from brokerage service arrangements or reductions from other expense offset arrangements and do not represent the amount paid by the class during periods when reimbursements or reductions occur. Expenses net of fee waivers reflect expenses after reimbursement by the investment adviser but prior to reductions from brokerage service arrangements or other expense offset arrangements. Expenses net of all reductions represent the net expenses paid by the class.
J Annualized
K Amount does not include the portfolio activity of any underlying Fidelity Central Funds.
See accompanying notes which are an integral part of the financial statements.
Financial Highlights — Fidelity Advisor Small Cap Fund Class C
| Six months ended (Unaudited) May 31, | Years ended November 30, | |||||
| 2017 | 2016 | 2015 | 2014 | 2013 | 2012 | |
| Selected Per–Share Data | ||||||
| Net asset value, beginning of period | $20.17 | $22.44 | $25.10 | $26.77 | $19.50 | $20.90 |
| Income from Investment Operations | ||||||
| Net investment income (loss)A | (.06) | (.05)B | (.16)C | (.15) | (.07)D | (.17) |
| Net realized and unrealized gain (loss) | 1.23 | (.01)E | .91 | 1.98 | 7.34 | .68 |
| Total from investment operations | 1.17 | (.06) | .75 | 1.83 | 7.27 | .51 |
| Distributions from net realized gain | (.25) | (2.21) | (3.41) | (3.50) | – | (1.91) |
| Net asset value, end of period | $21.09 | $20.17 | $22.44 | $25.10 | $26.77 | $19.50 |
| Total ReturnF,G,H | 5.84% | .50% | 3.38% | 8.26% | 37.28% | 3.10% |
| Ratios to Average Net AssetsI,J | ||||||
| Expenses before reductions | 1.86%K | 2.08% | 2.02% | 1.73% | 1.76% | 1.81% |
| Expenses net of fee waivers, if any | 1.85%K | 2.08% | 2.02% | 1.73% | 1.76% | 1.81% |
| Expenses net of all reductions | 1.85%K | 2.07% | 2.01% | 1.73% | 1.75% | 1.80% |
| Net investment income (loss) | (.61)%K | (.24)%B | (.69)%C | (.62)% | (.29)%D | (.88)% |
| Supplemental Data | ||||||
| Net assets, end of period (in millions) | $272 | $274 | $318 | $317 | $334 | $284 |
| Portfolio turnover rateL | 74%K | 81% | 33% | 39% | 34% | 69% |
A Calculated based on average shares outstanding during the period.
B Net Investment income per share reflects a large, non-recurring dividend which amounted to $.08 per share. Excluding this non-recurring dividend, the ratio of net investment income (loss) to average net assets would have been (.69) %.
C Net Investment income per share reflects a large, non-recurring dividend which amounted to $.05 per share. Excluding this non-recurring dividend, the ratio of net investment income (loss) to average net assets would have been (.91) %.
D Net Investment income per share reflects a large, non-recurring dividend which amounted to $.04 per share. Excluding this non-recurring dividend, the ratio of net investment income (loss) to average net assets would have been (.45) %.
E The amount shown for a share outstanding does not correspond with the aggregate net gain (loss) on investments for the period due to the timing of sales and repurchases of shares in relation to fluctuating market values of the investments of the Fund.
F Total returns for periods of less than one year are not annualized.
G Total returns would have been lower if certain expenses had not been reduced during the applicable periods shown.
H Total returns do not include the effect of the contingent deferred sales charge.
I Fees and expenses of any underlying Fidelity Central Funds are not included in the Fund's expense ratio. The Fund indirectly bears its proportionate share of the expenses of any underlying Fidelity Central Funds.
J Expense ratios reflect operating expenses of the class. Expenses before reductions do not reflect amounts reimbursed by the investment adviser or reductions from brokerage service arrangements or reductions from other expense offset arrangements and do not represent the amount paid by the class during periods when reimbursements or reductions occur. Expenses net of fee waivers reflect expenses after reimbursement by the investment adviser but prior to reductions from brokerage service arrangements or other expense offset arrangements. Expenses net of all reductions represent the net expenses paid by the class.
K Annualized
L Amount does not include the portfolio activity of any underlying Fidelity Central Funds.
See accompanying notes which are an integral part of the financial statements.
Financial Highlights — Fidelity Advisor Small Cap Fund Class I
| Six months ended (Unaudited) May 31, | Years ended November 30, | |||||
| 2017 | 2016 | 2015 | 2014 | 2013 | 2012 | |
| Selected Per–Share Data | ||||||
| Net asset value, beginning of period | $27.65 | $29.59 | $31.80 | $32.73 | $23.73 | $24.77 |
| Income from Investment Operations | ||||||
| Net investment income (loss)A | .06 | .20B | .10C | .13 | .21D | .04 |
| Net realized and unrealized gain (loss) | 1.69 | .07 | 1.18 | 2.50 | 8.94 | .83 |
| Total from investment operations | 1.75 | .27 | 1.28 | 2.63 | 9.15 | .87 |
| Distributions from net investment income | (.15) | – | (.08) | (.06) | (.13) | – |
| Distributions from net realized gain | (.25) | (2.21) | (3.41) | (3.50) | (.01) | (1.91) |
| Total distributions | (.41)E | (2.21) | (3.49) | (3.56) | (.15)F | (1.91) |
| Net asset value, end of period | $28.99 | $27.65 | $29.59 | $31.80 | $32.73 | $23.73 |
| Total ReturnG,H | 6.35% | 1.58% | 4.46% | 9.33% | 38.79% | 4.15% |
| Ratios to Average Net AssetsI,J | ||||||
| Expenses before reductions | .82%K | 1.05% | .99% | .70% | .71% | .75% |
| Expenses net of fee waivers, if any | .82%K | 1.04% | .99% | .70% | .71% | .75% |
| Expenses net of all reductions | .81%K | 1.04% | .99% | .70% | .70% | .74% |
| Net investment income (loss) | .42%K | .79%B | .34%C | .41% | .76%D | .18% |
| Supplemental Data | ||||||
| Net assets, end of period (in millions) | $722 | $652 | $704 | $627 | $718 | $1,141 |
| Portfolio turnover rateL | 74%K | 81% | 33% | 39% | 34% | 69% |
A Calculated based on average shares outstanding during the period.
B Net Investment income per share reflects a large, non-recurring dividend which amounted to $.12 per share. Excluding this non-recurring dividend, the ratio of net investment income (loss) to average net assets would have been .34%.
C Net Investment income per share reflects a large, non-recurring dividend which amounted to $.07 per share. Excluding this non-recurring dividend, the ratio of net investment income (loss) to average net assets would have been .11%.
D Net Investment income per share reflects a large, non-recurring dividend which amounted to $.05 per share. Excluding this non-recurring dividend, the ratio of net investment income (loss) to average net assets would have been .59%.
E Total distributions of $.41 per share is comprised of distributions from net investment income of $.152 and distributions from net realized gain of $.253 per share.
F Total distributions of $.15 per share is comprised of distributions from net investment income of $.133 and distributions from net realized gain of $.014 per share.
G Total returns for periods of less than one year are not annualized.
H Total returns would have been lower if certain expenses had not been reduced during the applicable periods shown.
I Fees and expenses of any underlying Fidelity Central Funds are not included in the Fund's expense ratio. The Fund indirectly bears its proportionate share of the expenses of any underlying Fidelity Central Funds.
J Expense ratios reflect operating expenses of the class. Expenses before reductions do not reflect amounts reimbursed by the investment adviser or reductions from brokerage service arrangements or reductions from other expense offset arrangements and do not represent the amount paid by the class during periods when reimbursements or reductions occur. Expenses net of fee waivers reflect expenses after reimbursement by the investment adviser but prior to reductions from brokerage service arrangements or other expense offset arrangements. Expenses net of all reductions represent the net expenses paid by the class.
K Annualized
L Amount does not include the portfolio activity of any underlying Fidelity Central Funds.
See accompanying notes which are an integral part of the financial statements.
Financial Highlights — Fidelity Advisor Small Cap Fund Class Z
| Six months ended (Unaudited) May 31, | Years ended November 30, | ||||
| 2017 | 2016 | 2015 | 2014 | 2013 A | |
| Selected Per–Share Data | |||||
| Net asset value, beginning of period | $27.63 | $29.53 | $31.76 | $32.74 | $29.79 |
| Income from Investment Operations | |||||
| Net investment income (loss)B | .08 | .24C | .14D | .17 | .02E |
| Net realized and unrealized gain (loss) | 1.69 | .07 | 1.17 | 2.51 | 2.93 |
| Total from investment operations | 1.77 | .31 | 1.31 | 2.68 | 2.95 |
| Distributions from net investment income | (.20) | – | (.14) | (.16) | – |
| Distributions from net realized gain | (.25) | (2.21) | (3.41) | (3.50) | – |
| Total distributions | (.45) | (2.21) | (3.54)F | (3.66) | – |
| Net asset value, end of period | $28.95 | $27.63 | $29.53 | $31.76 | $32.74 |
| Total ReturnG,H | 6.45% | 1.73% | 4.59% | 9.52% | 9.90% |
| Ratios to Average Net AssetsI,J | |||||
| Expenses before reductions | .68%K | .89% | .84% | .55% | .56%K |
| Expenses net of fee waivers, if any | .68%K | .89% | .84% | .55% | .56%K |
| Expenses net of all reductions | .67%K | .89% | .84% | .54% | .55%K |
| Net investment income (loss) | .57%K | .94%C | .48%D | .57% | .26%E,K |
| Supplemental Data | |||||
| Net assets, end of period (in millions) | $39 | $44 | $41 | $20 | $5 |
| Portfolio turnover rateL | 74%K | 81% | 33% | 39% | 34% |
A For the period August 13, 2013 (commencement of sale of shares) to November 30, 2013.
B Calculated based on average shares outstanding during the period.
C Net Investment income per share reflects a large, non-recurring dividend which amounted to $.12 per share. Excluding this non-recurring dividend, the ratio of net investment income (loss) to average net assets would have been .50%.
D Net Investment income per share reflects a large, non-recurring dividend which amounted to $.07 per share. Excluding this non-recurring dividend, the ratio of net investment income (loss) to average net assets would have been .26%.
E Net Investment income per share reflects a large, non-recurring dividend which amounted to $.01 per share. Excluding this non-recurring dividend, the ratio of net investment income (loss) to average net assets would have been .09%.
F Total distributions of $3.54 per share is comprised of distributions from net investment income of $.136 and distributions from net realized gain of $3.406 per share.
G Total returns for periods of less than one year are not annualized.
H Total returns would have been lower if certain expenses had not been reduced during the applicable periods shown.
I Fees and expenses of any underlying Fidelity Central Funds are not included in the Fund's expense ratio. The Fund indirectly bears its proportionate share of the expenses of any underlying Fidelity Central Funds.
J Expense ratios reflect operating expenses of the class. Expenses before reductions do not reflect amounts reimbursed by the investment adviser or reductions from brokerage service arrangements or reductions from other expense offset arrangements and do not represent the amount paid by the class during periods when reimbursements or reductions occur. Expense ratios before reductions for start-up periods may not be representative of longer-term operating periods. Expenses net of fee waivers reflect expenses after reimbursement by the investment adviser but prior to reductions from brokerage service arrangements or other expense offset arrangements. Expenses net of all reductions represent the net expenses paid by the class.
K Annualized
L Amount does not include the portfolio activity of any underlying Fidelity Central Funds.
See accompanying notes which are an integral part of the financial statements.
Notes to Financial Statements (Unaudited)
For the period ended May 31, 2017
(Amounts in thousands except percentages)
1. Organization.
Fidelity Advisor Small Cap Fund (the Fund) is a fund of Fidelity Advisor Series I (the Trust) and is authorized to issue an unlimited number of shares. The Trust is registered under the Investment Company Act of 1940, as amended (the 1940 Act), as an open-end management investment company organized as a Massachusetts business trust. The Fund offers Class A, Class M (formerly Class T), Class C, Class I and Class Z shares, each of which has equal rights as to assets and voting privileges. Each class has exclusive voting rights with respect to matters that affect that class.
After the close of business on June 24, 2016, all outstanding Class B shares were converted to Class A shares. All prior fiscal period dollar and share amounts for Class B presented in the Notes to Financial Statements are for the period December 1, 2015 through June 24, 2016.
2. Investments in Fidelity Central Funds.
The Fund invests in Fidelity Central Funds, which are open-end investment companies generally available only to other investment companies and accounts managed by the investment adviser and its affiliates. The Fund's Schedule of Investments lists each of the Fidelity Central Funds held as of period end, if any, as an investment of the Fund, but does not include the underlying holdings of each Fidelity Central Fund. As an Investing Fund, the Fund indirectly bears its proportionate share of the expenses of the underlying Fidelity Central Funds.
The Money Market Central Funds seek preservation of capital and current income and are managed by Fidelity Investments Money Management, Inc. (FIMM), an affiliate of the investment adviser. Annualized expenses of the Money Market Central Funds as of their most recent shareholder report date are less than .005%.
A complete unaudited list of holdings for each Fidelity Central Fund is available upon request or at the Securities and Exchange Commission (the SEC) website at www.sec.gov. In addition, the financial statements of the Fidelity Central Funds are available on the SEC website or upon request.
3. Significant Accounting Policies.
The Fund is an investment company and applies the accounting and reporting guidance of the Financial Accounting Standards Board (FASB) Accounting Standards Codification Topic 946 Financial Services – Investments Companies. The financial statements have been prepared in conformity with accounting principles generally accepted in the United States of America (GAAP), which require management to make certain estimates and assumptions at the date of the financial statements. Actual results could differ from those estimates. Subsequent events, if any, through the date that the financial statements were issued have been evaluated in the preparation of the financial statements. The following summarizes the significant accounting policies of the Fund:
Investment Valuation. Investments are valued as of 4:00 p.m. Eastern time on the last calendar day of the period. The Board of Trustees (the Board) has delegated the day to day responsibility for the valuation of the Fund's investments to the Fair Value Committee (the Committee) established by the Fund's investment adviser. In accordance with valuation policies and procedures approved by the Board, the Fund attempts to obtain prices from one or more third party pricing vendors or brokers to value its investments. When current market prices, quotations or currency exchange rates are not readily available or reliable, investments will be fair valued in good faith by the Committee, in accordance with procedures adopted by the Board. Factors used in determining fair value vary by investment type and may include market or investment specific events, changes in interest rates and credit quality. The frequency with which these procedures are used cannot be predicted and they may be utilized to a significant extent. The Committee oversees the Fund's valuation policies and procedures and reports to the Board on the Committee's activities and fair value determinations. The Board monitors the appropriateness of the procedures used in valuing the Fund's investments and ratifies the fair value determinations of the Committee.
The Fund categorizes the inputs to valuation techniques used to value its investments into a disclosure hierarchy consisting of three levels as shown below:
- Level 1 – quoted prices in active markets for identical investments
- Level 2 – other significant observable inputs (including quoted prices for similar investments, interest rates, prepayment speeds, etc.)
- Level 3 – unobservable inputs (including the Fund's own assumptions based on the best information available)
Valuation techniques used to value the Fund's investments by major category are as follows:
Equity securities, including restricted securities, for which market quotations are readily available, are valued at the last reported sale price or official closing price as reported by a third party pricing vendor on the primary market or exchange on which they are traded and are categorized as Level 1 in the hierarchy. In the event there were no sales during the day or closing prices are not available, securities are valued at the last quoted bid price or may be valued using the last available price and are generally categorized as Level 2 in the hierarchy. For foreign equity securities, when market or security specific events arise, comparisons to the valuation of American Depositary Receipts (ADRs), futures contracts, Exchange-Traded Funds (ETFs) and certain indexes as well as quoted prices for similar securities may be used and would be categorized as Level 2 in the hierarchy. Utilizing these techniques may result in transfers between Level 1 and Level 2. For equity securities, including restricted securities, where observable inputs are limited, assumptions about market activity and risk are used and these securities may be categorized as Level 3 in the hierarchy.
Debt securities, including restricted securities, are valued based on evaluated prices received from third party pricing vendors or from brokers who make markets in such securities. U.S. government and government agency obligations are valued by pricing vendors who utilize matrix pricing which considers yield or price of bonds of comparable quality, coupon, maturity and type or by broker-supplied prices. When independent prices are unavailable or unreliable, debt securities may be valued utilizing pricing methodologies which consider similar factors that would be used by third party pricing vendors. Debt securities are generally categorized as Level 2 in the hierarchy but may be Level 3 depending on the circumstances.
Futures contracts are valued at the settlement price established each day by the board of trade or exchange on which they are traded and are categorized as Level 1 in the hierarchy. Investments in open-end mutual funds, including the Fidelity Central Funds, are valued at their closing net asset value (NAV) each business day and are categorized as Level 1 in the hierarchy.
Changes in valuation techniques may result in transfers in or out of an assigned level within the disclosure hierarchy. The aggregate value of investments by input level as of May 31, 2017, including information on transfers between Levels 1 and 2, is included at the end of the Fund's Schedule of Investments.
Foreign Currency. The Fund may use foreign currency contracts to facilitate transactions in foreign-denominated securities. Gains and losses from these transactions may arise from changes in the value of the foreign currency or if the counterparties do not perform under the contracts' terms.
Foreign-denominated assets, including investment securities, and liabilities are translated into U.S. dollars at the exchange rates at period end. Purchases and sales of investment securities, income and dividends received and expenses denominated in foreign currencies are translated into U.S. dollars at the exchange rate in effect on the transaction date.
The effects of exchange rate fluctuations on investments are included with the net realized and unrealized gain (loss) on investment securities. Other foreign currency transactions resulting in realized and unrealized gain (loss) are disclosed separately.
Investment Transactions and Income. For financial reporting purposes, the Fund's investment holdings and NAV include trades executed through the end of the last business day of the period. The NAV per share for processing shareholder transactions is calculated as of the close of business of the New York Stock Exchange (NYSE), normally 4:00 p.m. Eastern time and includes trades executed through the end of the prior business day. Gains and losses on securities sold are determined on the basis of identified cost. Dividend income is recorded on the ex-dividend date, except for certain dividends from foreign securities where the ex-dividend date may have passed, which are recorded as soon as the Fund is informed of the ex-dividend date. Non-cash dividends included in dividend income, if any, are recorded at the fair market value of the securities received. Income and capital gain distributions from Fidelity Central Funds, if any, are recorded on the ex-dividend date. Certain distributions received by the Fund represent a return of capital or capital gain. The Fund determines the components of these distributions subsequent to the ex-dividend date, based upon receipt of tax filings or other correspondence relating to the underlying investment. These distributions are recorded as a reduction of cost of investments and/or as a realized gain. Interest income is accrued as earned and includes coupon interest and amortization of premium and accretion of discount on debt securities as applicable. Investment income is recorded net of foreign taxes withheld where recovery of such taxes is uncertain.
Class Allocations and Expenses. Investment income, realized and unrealized capital gains and losses, common expenses of the Fund, and certain fund-level expense reductions, if any, are allocated daily on a pro-rata basis to each class based on the relative net assets of each class to the total net assets of the Fund. Each class differs with respect to transfer agent and distribution and service plan fees incurred. Certain expense reductions may also differ by class. For the reporting period, the allocated portion of income and expenses to each class as a percent of its average net assets may vary due to the timing of recording these transactions in relation to fluctuating net assets of the classes. Expenses directly attributable to a fund are charged to that fund. Expenses attributable to more than one fund are allocated among the respective funds on the basis of relative net assets or other appropriate methods. Expense estimates are accrued in the period to which they relate and adjustments are made when actual amounts are known.
Income Tax Information and Distributions to Shareholders. Each year, the Fund intends to qualify as a regulated investment company under Subchapter M of the Internal Revenue Code, including distributing substantially all of its taxable income and realized gains. As a result, no provision for U.S. Federal income taxes is required. The Fund files a U.S. federal tax return, in addition to state and local tax returns as required. The Fund's federal income tax returns are subject to examination by the Internal Revenue Service (IRS) for a period of three fiscal years after they are filed. State and local tax returns may be subject to examination for an additional fiscal year depending on the jurisdiction. Foreign taxes are provided for based on the Fund's understanding of the tax rules and rates that exist in the foreign markets in which it invests.
Distributions are declared and recorded on the ex-dividend date. Income dividends and capital gain distributions are declared separately for each class. Income and capital gain distributions are determined in accordance with income tax regulations, which may differ from GAAP.
Capital accounts within the financial statements are adjusted for permanent book-tax differences. These adjustments have no impact on net assets or the results of operations. Capital accounts are not adjusted for temporary book-tax differences which will reverse in a subsequent period.
Book-tax differences are primarily due to futures contracts, market discount, foreign currency transactions, partnerships, losses deferred due to wash sales and excise tax regulations.
The federal tax cost of investment securities and unrealized appreciation (depreciation) as of period end were as follows:
| Gross unrealized appreciation | $509,576 |
| Gross unrealized depreciation | (38,903) |
| Net unrealized appreciation (depreciation) on securities | $470,673 |
| Tax cost | $2,168,270 |
4. Derivative Instruments.
Risk Exposures and the Use of Derivative Instruments. The Fund's investment objective allows the Fund to enter into various types of derivative contracts, including futures contracts. Derivatives are investments whose value is primarily derived from underlying assets, indices or reference rates and may be transacted on an exchange or over-the-counter (OTC). Derivatives may involve a future commitment to buy or sell a specified asset based on specified terms, to exchange future cash flows at periodic intervals based on a notional principal amount, or for one party to make one or more payments upon the occurrence of specified events in exchange for periodic payments from the other party.
The Fund used derivatives to increase returns and to manage exposure to certain risks as defined below. The success of any strategy involving derivatives depends on analysis of numerous economic factors, and if the strategies for investment do not work as intended, the Fund may not achieve its objectives.
The Fund's use of derivatives increased or decreased its exposure to the following risk:
| Equity Risk | Equity risk relates to the fluctuations in the value of financial instruments as a result of changes in market prices (other than those arising from interest rate risk or foreign exchange risk), whether caused by factors specific to an individual investment, its issuer, or all factors affecting all instruments traded in a market or market segment. |
The Fund is also exposed to additional risks from investing in derivatives, such as liquidity risk and counterparty credit risk. Liquidity risk is the risk that the Fund will be unable to close out the derivative in the open market in a timely manner. Counterparty credit risk is the risk that the counterparty will not be able to fulfill its obligation to the Fund. Counterparty credit risk related to exchange-traded futures contracts may be mitigated by the protection provided by the exchange on which they trade.
Investing in derivatives may involve greater risks than investing in the underlying assets directly and, to varying degrees, may involve risk of loss in excess of any initial investment and collateral received and amounts recognized in the Statement of Assets and Liabilities. In addition, there may be the risk that the change in value of the derivative contract does not correspond to the change in value of the underlying instrument.
Futures Contracts. A futures contract is an agreement between two parties to buy or sell a specified underlying instrument for a fixed price at a specified future date. The Fund used futures contracts to manage its exposure to the stock market.
Upon entering into a futures contract, a fund is required to deposit either cash or securities (initial margin) with a clearing broker in an amount equal to a certain percentage of the face value of the contract. Futures contracts are marked-to-market daily and subsequent daily payments (variation margin) are made or received by a fund depending on the daily fluctuations in the value of the futures contracts and are recorded as unrealized appreciation or (depreciation). This receivable and/or payable, if any, is included in daily variation margin for derivative instruments in the Statement of Assets and Liabilities. Realized gain or (loss) is recorded upon the expiration or closing of a futures contract.
Any open futures contracts at period end are presented in the Schedule of Investments under the caption "Futures Contracts". The underlying face amount at value reflects each contract's exposure to the underlying instrument or index at period end. Securities deposited to meet initial margin requirements are identified in the Schedule of Investments.
During the period the Fund recognized net realized gain (loss) of $13,818 and a change in net unrealized appreciation (depreciation) of $(7,254) related to its investment in futures contracts. These amounts are included in the Statement of Operations.
5. Purchases and Sales of Investments.
Purchases and sales of securities, other short-term securities, aggregated $916,676 and $1,195,083, respectively.
6. Fees and Other Transactions with Affiliates.
Management Fee. Fidelity Management & Research Company and its affiliates provide the Fund with investment management related services for which the Fund pays a monthly management fee. The management fee is the sum of an individual fund fee rate that is based on an annual rate of .45% of the Fund's average net assets and an annualized group fee rate that averaged .25% during the period. The group fee rate is based upon the average net assets of all the mutual funds advised by the investment adviser, including any mutual funds previously advised by the investment adviser that are currently advised by Fidelity SelectCo, LLC, an affiliate of the investment adviser. The group fee rate decreases as assets under management increase and increases as assets under management decrease. In addition, the management fee is subject to a performance adjustment (up to a maximum of +/- .20% of the Fund's average net assets over a 36 month performance period). The upward or downward adjustment to the management fee is based on the relative investment performance of Class I of the Fund as compared to its benchmark index, the Russell 2000 Index, over the same 36 month performance period. For the reporting period, the total annualized management fee rate, including the performance adjustment, was .59% of the Fund's average net assets. The performance adjustment included in the management fee rate may be higher or lower than the maximum performance adjustment rate due to the difference between the average net assets for the reporting and performance periods.
Distribution and Service Plan Fees. In accordance with Rule 12b-1 of the 1940 Act, the Fund has adopted separate Distribution and Service Plans for each class of shares. Certain classes pay Fidelity Distributors Corporation (FDC), an affiliate of the investment adviser, separate Distribution and Service Fees, each of which is based on an annual percentage of each class' average net assets. In addition, FDC may pay financial intermediaries for selling shares of the Fund and providing shareholder support services. For the period, the Distribution and Service Fee rates, total fees and amounts retained by FDC were as follows:
| Distribution Fee | Service Fee | Total Fees | Retained by FDC | |
| Class A | -% | .25% | $1,105 | $3 |
| Class M | .25% | .25% | 1,896 | 6 |
| Class C | .75% | .25% | 1,385 | 67 |
| $4,386 | $76 |
Sales Load. FDC may receive a front-end sales charge of up to 5.75% for selling Class A shares and 3.50% for selling Class M shares, some of which is paid to financial intermediaries for selling shares of the Fund. Depending on the holding period, FDC may receive contingent deferred sales charges levied on Class A, Class M, and Class C redemptions. The deferred sales charges range from 1.00% for Class C shares, 1.00% for certain purchases of Class A shares and .25% for certain purchases of Class M shares.
For the period, sales charge amounts retained by FDC were as follows:
| Retained by FDC | |
| Class A | $64 |
| Class M | 10 |
| Class C(a) | 6 |
| $80 |
(a) When Class C shares are initially sold, FDC pays commissions from its own resources to financial intermediaries through which the sales are made.
Transfer Agent Fees. Fidelity Investments Institutional Operations Company, Inc., (FIIOC), an affiliate of the investment adviser, is the transfer, dividend disbursing and shareholder servicing agent for each class of the Fund. FIIOC receives account fees and asset-based fees that vary according to the account size and type of account of the shareholders of the respective classes of the Fund, except for Class Z. FIIOC receives an asset-based fee of Class Z's average net assets. FIIOC pays for typesetting, printing and mailing of shareholder reports, except proxy statements.
For the period, transfer agent fees for each class were as follows:
| Amount | % of Class-Level Average Net Assets(a) | |
| Class A | $943 | .21 |
| Class M | 735 | .19 |
| Class C | 311 | .22 |
| Class I | 675 | .19 |
| Class Z | 11 | .05 |
| $2,675 |
(a) Annualized
Accounting and Security Lending Fees. Fidelity Service Company, Inc. (FSC), an affiliate of the investment adviser, maintains the Fund's accounting records. The accounting fee is based on the level of average net assets for each month. Under a separate contract, FSC administers the security lending program. The security lending fee is based on the number and duration of lending transactions.
Brokerage Commissions. The Fund placed a portion of its portfolio transactions with brokerage firms which are affiliates of the investment adviser. Brokerage commissions are included in net realized gain (loss) and change in net unrealized appreciation (depreciation) in the Statement of Operations. The commissions paid to these affiliated firms were $47 for the period.
Interfund Trades. The Fund may purchase from or sell securities to other Fidelity Funds under procedures adopted by the Board. The procedures have been designed to ensure these interfund trades are executed in accordance with Rule 17a-7 of the 1940 Act. Interfund trades are included within the respective purchases and sales amounts shown in the Purchases and Sales of Investments note.
7. Committed Line of Credit.
The Fund participates with other funds managed by the investment adviser or an affiliate in a $4.25 billion credit facility (the "line of credit") to be utilized for temporary or emergency purposes to fund shareholder redemptions or for other short-term liquidity purposes. The Fund has agreed to pay commitment fees on its pro-rata portion of the line of credit, which amounted to $5 and is reflected in Miscellaneous expenses on the Statement of Operations. During the period, the Fund did not borrow on this line of credit.
8. Security Lending.
The Fund lends portfolio securities through a lending agent from time to time in order to earn additional income. For equity securities, a lending agent is used and may loan securities to certain qualified borrowers, including Fidelity Capital Markets (FCM), a broker-dealer affiliated with the Fund. On the settlement date of the loan, the Fund receives collateral (in the form of U.S. Treasury obligations, letters of credit and/or cash) against the loaned securities and maintains collateral in an amount not less than 100% of the market value of the loaned securities during the period of the loan. The market value of the loaned securities is determined at the close of business of the Fund and any additional required collateral is delivered to the Fund on the next business day. The Fund or borrower may terminate the loan at any time, and if the borrower defaults on its obligation to return the securities loaned because of insolvency or other reasons, the Fund may apply collateral received from the borrower against the obligation. The Fund may experience delays and costs in recovering the securities loaned. Any cash collateral received is invested in the Fidelity Securities Lending Cash Central Fund. The value of loaned securities and cash collateral at period end are disclosed on the Fund's Statement of Assets and Liabilities. The value of securities loaned to FCM at period end was $10,116. Security lending income represents the income earned on investing cash collateral, less rebates paid to borrowers and any lending agent fees associated with the loan, plus any premium payments received for lending certain types of securities. Security lending income is presented in the Statement of Operations as a component of income from Fidelity Central Funds. Total security lending income during the period amounted to $566, including $9 from securities loaned to FCM.
9. Expense Reductions.
Commissions paid to certain brokers with whom the investment adviser, or its affiliates, places trades on behalf of the Fund include an amount in addition to trade execution, which may be rebated back to the Fund to offset certain expenses. This amount totaled $112 for the period.
In addition, during the period the investment adviser reimbursed and/or waived a portion of fund-level operating expenses in the amount of $12.
10. Distributions to Shareholders.
Distributions to shareholders of each class were as follows:
| Six months ended May 31, 2017 | Year ended November 30, 2016 | |
| From net investment income | ||
| Class A | $2,808 | $– |
| Class M | 819 | – |
| Class I | 3,550 | – |
| Class Z | 316 | – |
| Total | $7,493 | $– |
| From net realized gain | ||
| Class A | $9,108 | $84,569 |
| Class M | 7,970 | 76,028 |
| Class B | – | 2,089 |
| Class C | 3,392 | 31,633 |
| Class I | 5,908 | 51,636 |
| Class Z | 404 | 3,081 |
| Total | $26,782 | $249,036 |
11. Share Transactions.
Share transactions for each class were as follows and may contain automatic conversions between classes or exchanges between affiliated funds:
| Shares | Shares | Dollars | Dollars | |
| Six months ended May 31, 2017 | Year ended November 30, 2016 | Six months ended May 31, 2017 | Year ended November 30, 2016 | |
| Class A | ||||
| Shares sold | 1,980 | 5,928 | $52,043 | $140,735 |
| Reinvestment of distributions | 441 | 3,443 | 11,530 | 81,777 |
| Shares redeemed | (8,423) | (10,822) | (222,268) | (258,061) |
| Net increase (decrease) | (6,002) | (1,451) | $(158,695) | $(35,549) |
| Class M | ||||
| Shares sold | 2,168 | 4,643 | $53,277 | $103,682 |
| Reinvestment of distributions | 351 | 3,332 | 8,575 | 74,245 |
| Shares redeemed | (4,893) | (10,503) | (120,505) | (234,117) |
| Net increase (decrease) | (2,374) | (2,528) | $(58,653) | $(56,190) |
| Class B | ||||
| Shares sold | – | 6 | $– | $95 |
| Reinvestment of distributions | – | 108 | – | 2,016 |
| Shares redeemed | – | (1,070) | – | (19,638) |
| Net increase (decrease) | – | (956) | $– | $(17,527) |
| Class C | ||||
| Shares sold | 1,002 | 1,506 | $20,780 | $28,368 |
| Reinvestment of distributions | 153 | 1,552 | 3,158 | 29,420 |
| Shares redeemed | (1,838) | (3,634) | (38,143) | (69,050) |
| Net increase (decrease) | (683) | (576) | $(14,205) | $(11,262) |
| Class I | ||||
| Shares sold | 6,150 | 7,918 | $176,082 | $201,293 |
| Reinvestment of distributions | 294 | 1,747 | 8,296 | 44,806 |
| Shares redeemed | (5,120) | (9,861) | (145,969) | (256,027) |
| Net increase (decrease) | 1,324 | (196) | $38,409 | $(9,928) |
| Class Z | ||||
| Shares sold | 334 | 590 | $9,590 | $15,126 |
| Reinvestment of distributions | 26 | 120 | 720 | 3,081 |
| Shares redeemed | (629) | (500) | (18,195) | (12,963) |
| Net increase (decrease) | (269) | 210 | $(7,885) | $5,244 |
12. Other.
The Fund's organizational documents provide former and current trustees and officers with a limited indemnification against liabilities arising in connection with the performance of their duties to the Fund. In the normal course of business, the Fund may also enter into contracts that provide general indemnifications. The Fund's maximum exposure under these arrangements is unknown as this would be dependent on future claims that may be made against the Fund. The risk of material loss from such claims is considered remote.
Shareholder Expense Example
As a shareholder of the Fund, you incur two types of costs: (1) transaction costs, including sales charges (loads) on purchase payments or redemption proceeds, and (2) ongoing costs, including management fees, distribution and/or service (12b-1) fees and other Fund expenses. This Example is intended to help you understand your ongoing costs (in dollars) of investing in the Fund and to compare these costs with the ongoing costs of investing in other mutual funds.
The Example is based on an investment of $1,000 invested at the beginning of the period and held for the entire period (December 1, 2016 to May 31, 2017).
Actual Expenses
The first line of the accompanying table for each class of the Fund provides information about actual account values and actual expenses. You may use the information in this line, together with the amount you invested, to estimate the expenses that you paid over the period. Simply divide your account value by $1,000.00 (for example, an $8,600 account value divided by $1,000.00 = 8.6), then multiply the result by the number in the first line for a class of the Fund under the heading entitled "Expenses Paid During Period" to estimate the expenses you paid on your account during this period. In addition, the Fund, as a shareholder in the underlying Fidelity Central Funds, will indirectly bear its pro-rata share of the fees and expenses incurred by the underlying Fidelity Central Funds. These fees and expenses are not included in the Fund's annualized expense ratio used to calculate the expense estimate in the table below.
Hypothetical Example for Comparison Purposes
The second line of the accompanying table for each class of the Fund provides information about hypothetical account values and hypothetical expenses based on a Class' actual expense ratio and an assumed rate of return of 5% per year before expenses, which is not the Class' actual return. The hypothetical account values and expenses may not be used to estimate the actual ending account balance or expenses you paid for the period. You may use this information to compare the ongoing costs of investing in the Fund and other funds. To do so, compare this 5% hypothetical example with the 5% hypothetical examples that appear in the shareholder reports of the other funds. In addition, the Fund, as a shareholder in the underlying Fidelity Central Funds, will indirectly bear its pro-rata share of the fees and expenses incurred by the underlying Fidelity Central Funds. These fees and expenses are not included in the Fund's annualized expense ratio used to calculate the expense estimate in the table below.
Please note that the expenses shown in the table are meant to highlight your ongoing costs only and do not reflect any transaction costs. Therefore, the second line of the table is useful in comparing ongoing costs only, and will not help you determine the relative total costs of owning different funds. In addition, if these transactional costs were included, your costs would have been higher.
| Annualized Expense Ratio-A | Beginning Account Value December 1, 2016 | Ending Account Value May 31, 2017 | Expenses Paid During Period-B December 1, 2016 to May 31, 2017 | |
| Class A | 1.09% | |||
| Actual | $1,000.00 | $1,062.30 | $5.60 | |
| Hypothetical-C | $1,000.00 | $1,019.50 | $5.49 | |
| Class M | 1.32% | |||
| Actual | $1,000.00 | $1,060.50 | $6.78 | |
| Hypothetical-C | $1,000.00 | $1,018.35 | $6.64 | |
| Class C | 1.85% | |||
| Actual | $1,000.00 | $1,058.40 | $9.49 | |
| Hypothetical-C | $1,000.00 | $1,015.71 | $9.30 | |
| Class I | .82% | |||
| Actual | $1,000.00 | $1,063.50 | $4.22 | |
| Hypothetical-C | $1,000.00 | $1,020.84 | $4.13 | |
| Class Z | .68% | |||
| Actual | $1,000.00 | $1,064.50 | $3.50 | |
| Hypothetical-C | $1,000.00 | $1,021.54 | $3.43 |
A Annualized expense ratio reflects expenses net of applicable fee waivers.
B Expenses are equal to each Class' annualized expense ratio, multiplied by the average account value over the period, multiplied by 182/365 (to reflect the one-half year period).
C 5% return per year before expenses
![]()
ASCF-SANN-0717
1.721218.118
Fidelity Advisor® Series Equity Growth Fund Semi-Annual Report May 31, 2017 |
|
Contents
To view a fund's proxy voting guidelines and proxy voting record for the 12-month period ended June 30, visit http://www.fidelity.com/proxyvotingresults or visit the Securities and Exchange Commission's (SEC) web site at http://www.sec.gov.
You may also call 1-877-208-0098 to request a free copy of the proxy voting guidelines.
Standard & Poor's, S&P and S&P 500 are registered service marks of The McGraw-Hill Companies, Inc. and have been licensed for use by Fidelity Distributors Corporation.
Other third-party marks appearing herein are the property of their respective owners.
All other marks appearing herein are registered or unregistered trademarks or service marks of FMR LLC or an affiliated company. © 2017 FMR LLC. All rights reserved.
This report and the financial statements contained herein are submitted for the general information of the shareholders of the Fund. This report is not authorized for distribution to prospective investors in the Fund unless preceded or accompanied by an effective prospectus.
A fund files its complete schedule of portfolio holdings with the SEC for the first and third quarters of each fiscal year on Form N-Q. Forms N-Q are available on the SEC’s web site at http://www.sec.gov. A fund's Forms N-Q may be reviewed and copied at the SEC’s Public Reference Room in Washington, DC. Information regarding the operation of the SEC's Public Reference Room may be obtained by calling 1-800-SEC-0330.
For a complete list of a fund's portfolio holdings, view the most recent holdings listing, semiannual report, or annual report on Fidelity's web site at http://www.fidelity.com, http://www.institutional.fidelity.com, or http://www.401k.com, as applicable.
NOT FDIC INSURED •MAY LOSE VALUE •NO BANK GUARANTEE
Neither the Fund nor Fidelity Distributors Corporation is a bank.
Investment Summary (Unaudited)
Top Ten Stocks as of May 31, 2017
| % of fund's net assets | % of fund's net assets 6 months ago | |
| Facebook, Inc. Class A | 6.9 | 9.0 |
| Alphabet, Inc. Class A | 6.3 | 6.0 |
| Amazon.com, Inc. | 4.4 | 3.9 |
| Charter Communications, Inc. Class A | 3.2 | 2.7 |
| Apple, Inc. | 3.0 | 3.0 |
| Home Depot, Inc. | 2.7 | 2.7 |
| Electronic Arts, Inc. | 2.4 | 3.0 |
| Adobe Systems, Inc. | 2.0 | 1.4 |
| Global Payments, Inc. | 1.9 | 1.6 |
| American Tower Corp. | 1.7 | 1.4 |
| 34.5 |
Top Five Market Sectors as of May 31, 2017
| % of fund's net assets | % of fund's net assets 6 months ago | |
| Information Technology | 40.8 | 36.7 |
| Consumer Discretionary | 16.4 | 17.4 |
| Health Care | 11.2 | 13.4 |
| Consumer Staples | 7.7 | 8.1 |
| Industrials | 7.5 | 6.8 |
Asset Allocation (% of fund's net assets)
| As of May 31, 2017* | ||
| Stocks | 97.8% | |
| Convertible Securities | 0.1% | |
| Short-Term Investments and Net Other Assets (Liabilities) | 2.1% | |

* Foreign investments - 10.9%
| As of November 30, 2016* | ||
| Stocks and Equity Futures | 98.6% | |
| Convertible Securities | 0.1% | |
| Short-Term Investments and Net Other Assets (Liabilities) | 1.3% | |

* Foreign investments - 7.1%
Investments May 31, 2017 (Unaudited)
Showing Percentage of Net Assets
| Common Stocks - 97.8% | |||
| Shares | Value | ||
| CONSUMER DISCRETIONARY - 16.4% | |||
| Automobiles - 0.9% | |||
| Tesla, Inc. (a) | 25,100 | $8,559,351 | |
| Diversified Consumer Services - 0.5% | |||
| Grand Canyon Education, Inc. (a) | 63,400 | 4,970,560 | |
| Hotels, Restaurants & Leisure - 1.6% | |||
| Dave & Buster's Entertainment, Inc. (a) | 128,600 | 8,577,620 | |
| Starbucks Corp. | 83,600 | 5,317,796 | |
| Wingstop, Inc. | 49,700 | 1,416,947 | |
| 15,312,363 | |||
| Household Durables - 0.1% | |||
| Gree Electric Appliances, Inc. of Zhuhai Class A | 110,900 | 554,984 | |
| SodaStream International Ltd. (a) | 2,400 | 127,152 | |
| 682,136 | |||
| Internet & Direct Marketing Retail - 5.8% | |||
| Amazon.com, Inc. (a) | 42,500 | 42,271,350 | |
| Ctrip.com International Ltd. ADR (a) | 135,500 | 7,405,075 | |
| Netflix, Inc. (a) | 27,500 | 4,484,425 | |
| NutriSystem, Inc. | 38,600 | 2,009,130 | |
| 56,169,980 | |||
| Media - 3.8% | |||
| Charter Communications, Inc. Class A (a) | 88,200 | 30,477,510 | |
| Cinemark Holdings, Inc. | 46,800 | 1,851,876 | |
| Sirius XM Holdings, Inc. (b) | 750,200 | 3,938,550 | |
| 36,267,936 | |||
| Multiline Retail - 0.6% | |||
| Dollar Tree, Inc. (a) | 33,300 | 2,587,410 | |
| Ollie's Bargain Outlet Holdings, Inc. (a) | 71,300 | 2,933,995 | |
| 5,521,405 | |||
| Specialty Retail - 2.7% | |||
| Five Below, Inc. (a) | 1,900 | 97,470 | |
| Home Depot, Inc. | 170,900 | 26,234,859 | |
| 26,332,329 | |||
| Textiles, Apparel & Luxury Goods - 0.4% | |||
| Canada Goose Holdings, Inc. | 2,000 | 36,081 | |
| Kering SA | 1,500 | 496,071 | |
| LVMH Moet Hennessy - Louis Vuitton SA | 13,465 | 3,441,683 | |
| 3,973,835 | |||
| TOTAL CONSUMER DISCRETIONARY | 157,789,895 | ||
| CONSUMER STAPLES - 7.7% | |||
| Beverages - 2.8% | |||
| Anheuser-Busch InBev SA NV ADR | 37,100 | 4,338,845 | |
| Constellation Brands, Inc. Class A (sub. vtg.) | 14,600 | 2,668,150 | |
| Kweichow Moutai Co. Ltd. (A Shares) | 29,780 | 1,936,954 | |
| PepsiCo, Inc. | 41,500 | 4,850,105 | |
| Pernod Ricard SA ADR | 81,400 | 2,214,080 | |
| The Coca-Cola Co. | 238,000 | 10,821,860 | |
| 26,829,994 | |||
| Food & Staples Retailing - 0.7% | |||
| Costco Wholesale Corp. | 35,400 | 6,387,222 | |
| Food Products - 0.5% | |||
| Danone SA | 63,100 | 4,690,171 | |
| Hostess Brands, Inc. Class A (a) | 19,800 | 311,652 | |
| 5,001,823 | |||
| Personal Products - 2.8% | |||
| Coty, Inc. Class A | 103,800 | 1,965,972 | |
| Estee Lauder Companies, Inc. Class A | 59,300 | 5,582,502 | |
| Herbalife Ltd. (a)(b) | 168,500 | 12,094,930 | |
| Unilever NV (NY Reg.) | 135,500 | 7,693,690 | |
| 27,337,094 | |||
| Tobacco - 0.9% | |||
| British American Tobacco PLC sponsored ADR (b) | 117,640 | 8,484,197 | |
| TOTAL CONSUMER STAPLES | 74,040,330 | ||
| ENERGY - 1.5% | |||
| Energy Equipment & Services - 0.3% | |||
| Baker Hughes, Inc. | 55,400 | 3,055,310 | |
| Oil, Gas & Consumable Fuels - 1.2% | |||
| Cheniere Energy, Inc. (a) | 119,200 | 5,807,424 | |
| Golar LNG Ltd. | 66,674 | 1,551,171 | |
| Reliance Industries Ltd. (a) | 183,371 | 3,810,967 | |
| 11,169,562 | |||
| TOTAL ENERGY | 14,224,872 | ||
| FINANCIALS - 7.2% | |||
| Banks - 2.6% | |||
| Citigroup, Inc. | 37,600 | 2,276,304 | |
| First Republic Bank | 99,800 | 9,191,580 | |
| JPMorgan Chase & Co. | 155,100 | 12,741,465 | |
| Metro Bank PLC (a) | 16,900 | 805,668 | |
| 25,015,017 | |||
| Capital Markets - 3.9% | |||
| BlackRock, Inc. Class A | 5,500 | 2,250,820 | |
| CBOE Holdings, Inc. | 7,752 | 669,540 | |
| Charles Schwab Corp. | 72,200 | 2,797,750 | |
| CME Group, Inc. | 109,138 | 12,800,796 | |
| Goldman Sachs Group, Inc. | 11,100 | 2,344,986 | |
| JMP Group, Inc. | 50,300 | 272,626 | |
| MSCI, Inc. | 47,700 | 4,852,521 | |
| S&P Global, Inc. | 44,800 | 6,397,888 | |
| The Blackstone Group LP | 161,300 | 5,303,544 | |
| 37,690,471 | |||
| Diversified Financial Services - 0.4% | |||
| Berkshire Hathaway, Inc. Class B (a) | 18,600 | 3,074,208 | |
| Bioverativ, Inc. | 3,200 | 176,288 | |
| Quantenna Communications, Inc. | 52,500 | 1,003,800 | |
| 4,254,296 | |||
| Thrifts & Mortgage Finance - 0.3% | |||
| Essent Group Ltd. (a) | 72,000 | 2,611,440 | |
| TOTAL FINANCIALS | 69,571,224 | ||
| HEALTH CARE - 11.2% | |||
| Biotechnology - 5.3% | |||
| Advanced Accelerator Applications SA sponsored ADR (a) | 35,500 | 1,341,190 | |
| Alexion Pharmaceuticals, Inc. (a) | 35,618 | 3,491,633 | |
| Amgen, Inc. | 91,500 | 14,204,460 | |
| Biogen, Inc. (a) | 6,400 | 1,585,728 | |
| BioMarin Pharmaceutical, Inc. (a) | 53,300 | 4,671,212 | |
| Cytokinetics, Inc. (a) | 28,910 | 391,731 | |
| Insmed, Inc. (a) | 237,175 | 3,657,239 | |
| Regeneron Pharmaceuticals, Inc. (a) | 10,400 | 4,774,224 | |
| Samsung Biologics Co. Ltd. | 726 | 142,669 | |
| TESARO, Inc. (a) | 36,500 | 5,449,815 | |
| Vertex Pharmaceuticals, Inc. (a) | 90,467 | 11,181,721 | |
| 50,891,622 | |||
| Health Care Equipment & Supplies - 4.4% | |||
| Boston Scientific Corp. (a) | 453,100 | 12,247,293 | |
| Danaher Corp. | 95,700 | 8,128,758 | |
| DexCom, Inc. (a) | 9,500 | 634,980 | |
| Intuitive Surgical, Inc. (a) | 11,500 | 10,518,820 | |
| Medtronic PLC | 58,500 | 4,930,380 | |
| Novadaq Technologies, Inc. (a) | 292,300 | 2,019,793 | |
| ResMed, Inc. | 31,900 | 2,268,090 | |
| The Cooper Companies, Inc. | 5,100 | 1,115,625 | |
| 41,863,739 | |||
| Health Care Providers & Services - 0.7% | |||
| Henry Schein, Inc. (a) | 9,100 | 1,674,127 | |
| UnitedHealth Group, Inc. | 31,200 | 5,465,616 | |
| 7,139,743 | |||
| Pharmaceuticals - 0.8% | |||
| Allergan PLC | 18,100 | 4,049,875 | |
| Zoetis, Inc. Class A | 64,200 | 3,998,376 | |
| 8,048,251 | |||
| TOTAL HEALTH CARE | 107,943,355 | ||
| INDUSTRIALS - 7.5% | |||
| Aerospace & Defense - 1.0% | |||
| Axon Enterprise, Inc. (a)(b) | 285,077 | 6,844,699 | |
| TransDigm Group, Inc. | 10,900 | 2,922,072 | |
| 9,766,771 | |||
| Airlines - 0.3% | |||
| Ryanair Holdings PLC sponsored ADR (a) | 25,080 | 2,677,039 | |
| Commercial Services & Supplies - 0.6% | |||
| KAR Auction Services, Inc. | 120,500 | 5,250,185 | |
| Electrical Equipment - 1.9% | |||
| AMETEK, Inc. | 143,700 | 8,768,574 | |
| Fortive Corp. | 156,050 | 9,745,323 | |
| 18,513,897 | |||
| Industrial Conglomerates - 0.4% | |||
| Roper Technologies, Inc. | 16,000 | 3,635,200 | |
| Machinery - 1.1% | |||
| Allison Transmission Holdings, Inc. | 263,600 | 10,206,592 | |
| Rational AG | 1,200 | 647,589 | |
| 10,854,181 | |||
| Professional Services - 2.1% | |||
| Equifax, Inc. | 41,900 | 5,731,920 | |
| IHS Markit Ltd. (a) | 172,100 | 7,890,785 | |
| Robert Half International, Inc. | 48,400 | 2,250,116 | |
| TransUnion Holding Co., Inc. (a) | 105,939 | 4,630,594 | |
| 20,503,415 | |||
| Trading Companies & Distributors - 0.1% | |||
| MSC Industrial Direct Co., Inc. Class A | 13,800 | 1,158,372 | |
| TOTAL INDUSTRIALS | 72,359,060 | ||
| INFORMATION TECHNOLOGY - 40.7% | |||
| Electronic Equipment & Components - 0.2% | |||
| CDW Corp. | 34,700 | 2,088,246 | |
| Internet Software & Services - 16.9% | |||
| Alphabet, Inc. Class A (a) | 61,000 | 60,212,490 | |
| CommerceHub, Inc.: | |||
| Series A (a) | 129,269 | 2,200,158 | |
| Series C (a) | 113,920 | 1,957,146 | |
| Facebook, Inc. Class A (a) | 436,200 | 66,066,848 | |
| GoDaddy, Inc. (a) | 110,600 | 4,550,084 | |
| Just Dial Ltd. (a) | 43,239 | 300,180 | |
| NetEase, Inc. ADR | 9,100 | 2,591,498 | |
| Shopify, Inc. Class A (a) | 29,400 | 2,700,684 | |
| Stamps.com, Inc. (a) | 62,900 | 8,673,910 | |
| Tencent Holdings Ltd. | 238,900 | 8,210,365 | |
| VeriSign, Inc. (a) | 56,200 | 5,066,992 | |
| 162,530,355 | |||
| IT Services - 8.3% | |||
| Cognizant Technology Solutions Corp. Class A | 149,592 | 10,009,201 | |
| Fidelity National Information Services, Inc. | 34,500 | 2,962,515 | |
| FleetCor Technologies, Inc. (a) | 11,100 | 1,601,619 | |
| Global Payments, Inc. | 203,400 | 18,633,474 | |
| MasterCard, Inc. Class A | 41,400 | 5,087,232 | |
| PayPal Holdings, Inc. (a) | 256,500 | 13,391,865 | |
| Square, Inc. (a) | 385,800 | 8,869,542 | |
| Vantiv, Inc. (a) | 52,200 | 3,273,984 | |
| Visa, Inc. Class A | 166,200 | 15,827,226 | |
| 79,656,658 | |||
| Semiconductors & Semiconductor Equipment - 2.0% | |||
| ASML Holding NV | 24,800 | 3,273,352 | |
| Maxim Integrated Products, Inc. | 88,814 | 4,245,309 | |
| Monolithic Power Systems, Inc. | 41,148 | 4,040,734 | |
| Qualcomm, Inc. | 134,000 | 7,674,180 | |
| 19,233,575 | |||
| Software - 10.3% | |||
| Activision Blizzard, Inc. | 92,300 | 5,406,934 | |
| Adobe Systems, Inc. (a) | 131,900 | 18,711,334 | |
| Autodesk, Inc. (a) | 130,800 | 14,619,516 | |
| Blackbaud, Inc. | 13,800 | 1,141,674 | |
| Computer Modelling Group Ltd. | 166,300 | 1,259,391 | |
| CyberArk Software Ltd. (a) | 16,600 | 813,566 | |
| Electronic Arts, Inc. (a) | 206,300 | 23,379,979 | |
| Intuit, Inc. | 3,800 | 534,432 | |
| Microsoft Corp. | 141,700 | 9,896,328 | |
| Parametric Technology Corp. (a) | 34,800 | 2,003,784 | |
| Red Hat, Inc. (a) | 38,900 | 3,484,273 | |
| Salesforce.com, Inc. (a) | 140,100 | 12,558,564 | |
| Snap, Inc. Class A (a)(b) | 238,400 | 5,056,464 | |
| 98,866,239 | |||
| Technology Hardware, Storage & Peripherals - 3.0% | |||
| Apple, Inc. | 192,900 | 29,467,404 | |
| TOTAL INFORMATION TECHNOLOGY | 391,842,477 | ||
| MATERIALS - 1.7% | |||
| Chemicals - 1.0% | |||
| Sherwin-Williams Co. | 14,700 | 4,877,019 | |
| The Chemours Co. LLC | 112,500 | 4,498,875 | |
| 9,375,894 | |||
| Construction Materials - 0.7% | |||
| Eagle Materials, Inc. | 59,200 | 5,582,560 | |
| Summit Materials, Inc. | 55,100 | 1,479,986 | |
| 7,062,546 | |||
| TOTAL MATERIALS | 16,438,440 | ||
| REAL ESTATE - 3.9% | |||
| Equity Real Estate Investment Trusts (REITs) - 2.2% | |||
| American Tower Corp. | 122,400 | 16,057,656 | |
| Equinix, Inc. | 6,300 | 2,778,363 | |
| SBA Communications Corp. Class A (a) | 16,800 | 2,321,424 | |
| 21,157,443 | |||
| Real Estate Management & Development - 1.7% | |||
| Realogy Holdings Corp. | 517,400 | 15,760,004 | |
| TOTAL REAL ESTATE | 36,917,447 | ||
| TOTAL COMMON STOCKS | |||
| (Cost $698,198,759) | 941,127,100 | ||
| Convertible Preferred Stocks - 0.1% | |||
| INFORMATION TECHNOLOGY - 0.1% | |||
| IT Services - 0.1% | |||
| AppNexus, Inc. Series E (a)(c) | |||
| (Cost $769,617) | 38,419 | 1,281,274 | |
| Money Market Funds - 2.2% | |||
| Fidelity Cash Central Fund, 0.86% (d) | 1,252,566 | 1,252,817 | |
| Fidelity Securities Lending Cash Central Fund 0.87% (d)(e) | 20,225,768 | 20,227,791 | |
| TOTAL MONEY MARKET FUNDS | |||
| (Cost $21,480,465) | 21,480,608 | ||
| TOTAL INVESTMENT PORTFOLIO - 100.1% | |||
| (Cost $720,448,841) | 963,888,982 | ||
| NET OTHER ASSETS (LIABILITIES) - (0.1)% | (1,016,040) | ||
| NET ASSETS - 100% | $962,872,942 |
Legend
(a) Non-income producing
(b) Security or a portion of the security is on loan at period end.
(c) Restricted securities - Investment in securities not registered under the Securities Act of 1933 (excluding 144A issues). At the end of the period, the value of restricted securities (excluding 144A issues) amounted to $1,281,274 or 0.1% of net assets.
(d) Affiliated fund that is generally available only to investment companies and other accounts managed by Fidelity Investments. The rate quoted is the annualized seven-day yield of the fund at period end. A complete unaudited listing of the fund's holdings as of its most recent quarter end is available upon request. In addition, each Fidelity Central Fund's financial statements are available on the SEC's website or upon request.
(e) Investment made with cash collateral received from securities on loan.
Additional information on each restricted holding is as follows:
| Security | Acquisition Date | Acquisition Cost |
| AppNexus, Inc. Series E | 8/1/14 | $769,617 |
Affiliated Central Funds
Information regarding fiscal year to date income earned by the Fund from investments in Fidelity Central Funds is as follows:
| Fund | Income earned |
| Fidelity Cash Central Fund | $88,259 |
| Fidelity Securities Lending Cash Central Fund | 109,393 |
| Total | $197,652 |
Investment Valuation
The following is a summary of the inputs used, as of May 31, 2017, involving the Fund's assets and liabilities carried at fair value. The inputs or methodology used for valuing securities may not be an indication of the risk associated with investing in those securities. For more information on valuation inputs, and their aggregation into the levels used below, please refer to the Investment Valuation section in the accompanying Notes to Financial Statements.
| Valuation Inputs at Reporting Date: | ||||
| Description | Total | Level 1 | Level 2 | Level 3 |
| Investments in Securities: | ||||
| Equities: | ||||
| Consumer Discretionary | $157,789,895 | $154,348,212 | $3,441,683 | $-- |
| Consumer Staples | 74,040,330 | 69,350,159 | 4,690,171 | -- |
| Energy | 14,224,872 | 14,224,872 | -- | -- |
| Financials | 69,571,224 | 69,571,224 | -- | -- |
| Health Care | 107,943,355 | 107,943,355 | -- | -- |
| Industrials | 72,359,060 | 72,359,060 | -- | -- |
| Information Technology | 393,123,751 | 383,632,112 | 8,210,365 | 1,281,274 |
| Materials | 16,438,440 | 16,438,440 | -- | -- |
| Real Estate | 36,917,447 | 36,917,447 | -- | -- |
| Money Market Funds | 21,480,608 | 21,480,608 | -- | -- |
| Total Investments in Securities: | $963,888,982 | $946,265,489 | $16,342,219 | $1,281,274 |
Other Information
Distribution of investments by country or territory of incorporation, as a percentage of Total Net Assets, is as follows (Unaudited):
| United States of America | 89.1% |
| Cayman Islands | 3.1% |
| Bermuda | 1.3% |
| France | 1.2% |
| Ireland | 1.2% |
| Netherlands | 1.1% |
| United Kingdom | 1.0% |
| Others (Individually Less Than 1%) | 2.0% |
| 100.0% |
See accompanying notes which are an integral part of the financial statements.
Financial Statements
Statement of Assets and Liabilities
| May 31, 2017 (Unaudited) | ||
| Assets | ||
| Investment in securities, at value (including securities loaned of $19,658,041) — See accompanying schedule: Unaffiliated issuers (cost $698,968,376) | $942,408,375 | |
| Fidelity Central Funds (cost $21,480,465) | 21,480,607 | |
| Total Investments (cost $720,448,841) | $963,888,982 | |
| Receivable for investments sold | 55,027,909 | |
| Receivable for fund shares sold | 8,498 | |
| Dividends receivable | 855,284 | |
| Interest receivable | 2,367 | |
| Distributions receivable from Fidelity Central Funds | 45,615 | |
| Prepaid expenses | 4,267 | |
| Other receivables | 6,505 | |
| Total assets | 1,019,839,427 | |
| Liabilities | ||
| Payable for investments purchased | $4,046,839 | |
| Payable for fund shares redeemed | 32,101,234 | |
| Accrued management fee | 406,711 | |
| Other affiliated payables | 157,050 | |
| Other payables and accrued expenses | 28,956 | |
| Collateral on securities loaned | 20,225,695 | |
| Total liabilities | 56,966,485 | |
| Net Assets | $962,872,942 | |
| Net Assets consist of: | ||
| Paid in capital | $661,782,715 | |
| Undistributed net investment income | 774,719 | |
| Accumulated undistributed net realized gain (loss) on investments and foreign currency transactions | 56,873,596 | |
| Net unrealized appreciation (depreciation) on investments and assets and liabilities in foreign currencies | 243,441,912 | |
| Net Assets, for 70,621,941 shares outstanding | $962,872,942 | |
| Net Asset Value, offering price and redemption price per share ($962,872,942 ÷ 70,621,941 shares) | $13.63 |
See accompanying notes which are an integral part of the financial statements.
Statement of Operations
| Six months ended May 31, 2017 (Unaudited) | ||
| Investment Income | ||
| Dividends | $4,154,426 | |
| Interest | 4,948 | |
| Income from Fidelity Central Funds | 197,652 | |
| Total income | 4,357,026 | |
| Expenses | ||
| Management fee | ||
| Basic fee | $2,549,452 | |
| Performance adjustment | (570,024) | |
| Transfer agent fees | 782,962 | |
| Accounting and security lending fees | 157,603 | |
| Custodian fees and expenses | 19,235 | |
| Independent trustees' fees and expenses | 1,849 | |
| Audit | 23,203 | |
| Legal | 1,199 | |
| Miscellaneous | 453 | |
| Total expenses before reductions | 2,965,932 | |
| Expense reductions | (19,625) | 2,946,307 |
| Net investment income (loss) | 1,410,719 | |
| Realized and Unrealized Gain (Loss) | ||
| Net realized gain (loss) on: | ||
| Investment securities: | ||
| Unaffiliated issuers | 60,071,312 | |
| Fidelity Central Funds | 13,172 | |
| Foreign currency transactions | (20,703) | |
| Futures contracts | 2,248,588 | |
| Total net realized gain (loss) | 62,312,369 | |
| Change in net unrealized appreciation (depreciation) on: Investment securities | 120,662,017 | |
| Assets and liabilities in foreign currencies | 4,576 | |
| Futures contracts | (555,053) | |
| Total change in net unrealized appreciation (depreciation) | 120,111,540 | |
| Net gain (loss) | 182,423,909 | |
| Net increase (decrease) in net assets resulting from operations | $183,834,628 |
See accompanying notes which are an integral part of the financial statements.
Statement of Changes in Net Assets
| Six months ended May 31, 2017 (Unaudited) | Year ended November 30, 2016 | |
| Increase (Decrease) in Net Assets | ||
| Operations | ||
| Net investment income (loss) | $1,410,719 | $1,310,366 |
| Net realized gain (loss) | 62,312,369 | 14,270,223 |
| Change in net unrealized appreciation (depreciation) | 120,111,540 | (17,525,762) |
| Net increase (decrease) in net assets resulting from operations | 183,834,628 | (1,945,173) |
| Distributions to shareholders from net investment income | (1,111,461) | (1,456,889) |
| Share transactions | ||
| Proceeds from sales of shares | 36,970,949 | 132,279,798 |
| Reinvestment of distributions | 1,111,461 | 1,456,889 |
| Cost of shares redeemed | (159,922,123) | (193,262,817) |
| Net increase (decrease) in net assets resulting from share transactions | (121,839,713) | (59,526,130) |
| Total increase (decrease) in net assets | 60,883,454 | (62,928,192) |
| Net Assets | ||
| Beginning of period | 901,989,488 | 964,917,680 |
| End of period | $962,872,942 | $901,989,488 |
| Other Information | ||
| Undistributed net investment income end of period | $774,719 | $475,461 |
| Shares | ||
| Sold | 2,998,276 | 12,128,698 |
| Issued in reinvestment of distributions | 97,497 | 133,293 |
| Redeemed | (12,882,591) | (17,651,190) |
| Net increase (decrease) | (9,786,818) | (5,389,199) |
See accompanying notes which are an integral part of the financial statements.
Financial Highlights — Fidelity Advisor Series Equity Growth Fund
| Six months ended (Unaudited) May 31, | Years ended November 30, | |||
| 2017 | 2016 | 2015 | 2014 A | |
| Selected Per–Share Data | ||||
| Net asset value, beginning of period | $11.22 | $11.25 | $10.65 | $10.00 |
| Income from Investment Operations | ||||
| Net investment income (loss)B | .02 | .02 | .02 | .01 |
| Net realized and unrealized gain (loss) | 2.40 | (.03) | .59 | .64 |
| Total from investment operations | 2.42 | (.01) | .61 | .65 |
| Distributions from net investment income | (.01) | (.02) | (.01) | – |
| Net asset value, end of period | $13.63 | $11.22 | $11.25 | $10.65 |
| Total ReturnC,D | 21.63% | (.11)% | 5.70% | 6.50% |
| Ratios to Average Net AssetsE,F | ||||
| Expenses before reductions | .64%G | .65% | .74% | .77%G |
| Expenses net of fee waivers, if any | .63%G | .65% | .74% | .77%G |
| Expenses net of all reductions | .63%G | .65% | .73% | .77%G |
| Net investment income (loss) | .30%G | .15% | .19% | .23%G |
| Supplemental Data | ||||
| Net assets, end of period (000 omitted) | $962,873 | $901,989 | $964,918 | $986,534 |
| Portfolio turnover rateH | 54%G | 60% | 65% | 26%I,J |
A For the period June 6, 2014 (commencement of operations) to November 30, 2014.
B Calculated based on average shares outstanding during the period.
C Total returns for periods of less than one year are not annualized.
D Total returns would have been lower if certain expenses had not been reduced during the applicable periods shown.
E Fees and expenses of any underlying Fidelity Central Funds are not included in the Fund's expense ratio. The Fund indirectly bears its proportionate share of the expenses of any underlying Fidelity Central Funds.
F Expense ratios reflect operating expenses of the Fund. Expenses before reductions do not reflect amounts reimbursed by the investment adviser or reductions from brokerage service arrangements or reductions from other expense offset arrangements and do not represent the amount paid by the Fund during periods when reimbursements or reductions occur. Expense ratios before reductions for start-up periods may not be representative of longer term operating periods. Expenses net of fee waivers reflect expenses after reimbursement by the investment adviser but prior to reductions from brokerage service arrangements or other expense offset arrangements. Expenses net of all reductions represent the net expenses paid by the Fund.
G Annualized
H Amount does not include the portfolio activity of any underlying Fidelity Central Funds.
I Portfolio turnover rate excludes securities received or delivered in-kind.
J Amount not annualized.
See accompanying notes which are an integral part of the financial statements.
Notes to Financial Statements (Unaudited)
For the period ended May 31, 2017
1. Organization.
Fidelity Advisor Series Equity Growth Fund (the Fund) is a fund of Fidelity Advisor Series I (the Trust) and is authorized to issue an unlimited number of shares. Shares of the Fund are only available for purchase by mutual funds for which Fidelity Management & Research Company (FMR) or an affiliate serves as an investment manager. The Trust is registered under the Investment Company Act of 1940, as amended (the 1940 Act), as an open-end management investment company organized as a Massachusetts business trust.
2. Investments in Fidelity Central Funds.
The Fund invests in Fidelity Central Funds, which are open-end investment companies generally available only to other investment companies and accounts managed by the investment adviser and its affiliates. The Fund's Schedule of Investments lists each of the Fidelity Central Funds held as of period end, if any, as an investment of the Fund, but does not include the underlying holdings of each Fidelity Central Fund. As an Investing Fund, the Fund indirectly bears its proportionate share of the expenses of the underlying Fidelity Central Funds.
The Money Market Central Funds seek preservation of capital and current income and are managed by Fidelity Investments Money Management, Inc. (FIMM), an affiliate of the investment adviser. Annualized expenses of the Money Market Central Funds as of their most recent shareholder report date are less than .005%.
A complete unaudited list of holdings for each Fidelity Central Fund is available upon request or at the Securities and Exchange Commission (the SEC) website at www.sec.gov. In addition, the financial statements of the Fidelity Central Funds are available on the SEC website or upon request.
3. Significant Accounting Policies.
The Fund is an investment company and applies the accounting and reporting guidance of the Financial Accounting Standards Board (FASB) Accounting Standards Codification Topic 946 Financial Services – Investments Companies. The financial statements have been prepared in conformity with accounting principles generally accepted in the United States of America (GAAP), which require management to make certain estimates and assumptions at the date of the financial statements. Actual results could differ from those estimates. Subsequent events, if any, through the date that the financial statements were issued have been evaluated in the preparation of the financial statements. The following summarizes the significant accounting policies of the Fund:
Investment Valuation. Investments are valued as of 4:00 p.m. Eastern time on the last calendar day of the period. The Board of Trustees (the Board) has delegated the day to day responsibility for the valuation of the Fund's investments to the Fair Value Committee (the Committee) established by the Fund's investment adviser. In accordance with valuation policies and procedures approved by the Board, the Fund attempts to obtain prices from one or more third party pricing vendors or brokers to value its investments. When current market prices, quotations or currency exchange rates are not readily available or reliable, investments will be fair valued in good faith by the Committee, in accordance with procedures adopted by the Board. Factors used in determining fair value vary by investment type and may include market or investment specific events. The frequency with which these procedures are used cannot be predicted and they may be utilized to a significant extent. The Committee oversees the Fund's valuation policies and procedures and reports to the Board on the Committee's activities and fair value determinations. The Board monitors the appropriateness of the procedures used in valuing the Fund's investments and ratifies the fair value determinations of the Committee.
The Fund categorizes the inputs to valuation techniques used to value its investments into a disclosure hierarchy consisting of three levels as shown below:
- Level 1 – quoted prices in active markets for identical investments
- Level 2 – other significant observable inputs (including quoted prices for similar investments, interest rates, prepayment speeds, etc.)
- Level 3 – unobservable inputs (including the Fund's own assumptions based on the best information available)
Valuation techniques used to value the Fund's investments by major category are as follows:
Equity securities, including restricted securities, for which market quotations are readily available, are valued at the last reported sale price or official closing price as reported by a third party pricing vendor on the primary market or exchange on which they are traded and are categorized as Level 1 in the hierarchy. In the event there were no sales during the day or closing prices are not available, securities are valued at the last quoted bid price or may be valued using the last available price and are generally categorized as Level 2 in the hierarchy. For foreign equity securities, when market or security specific events arise, comparisons to the valuation of American Depositary Receipts (ADRs), futures contracts, Exchange-Traded Funds (ETFs) and certain indexes as well as quoted prices for similar securities may be used and would be categorized as Level 2 in the hierarchy. Utilizing these techniques may result in transfers between Level 1 and Level 2. For equity securities, including restricted securities, where observable inputs are limited, assumptions about market activity and risk are used and these securities may be categorized as Level 3 in the hierarchy.
Investments in open-end mutual funds, including the Fidelity Central Funds, are valued at their closing net asset value (NAV) each business day and are categorized as Level 1 in the hierarchy.
Changes in valuation techniques may result in transfers in or out of an assigned level within the disclosure hierarchy. The aggregate value of investments by input level as of May 31, 2017 is included at the end of the Fund's Schedule of Investments.
Foreign Currency. The Fund may use foreign currency contracts to facilitate transactions in foreign-denominated securities. Gains and losses from these transactions may arise from changes in the value of the foreign currency or if the counterparties do not perform under the contracts' terms.
Foreign-denominated assets, including investment securities, and liabilities are translated into U.S. dollars at the exchange rates at period end. Purchases and sales of investment securities, income and dividends received and expenses denominated in foreign currencies are translated into U.S. dollars at the exchange rate in effect on the transaction date.
The effects of exchange rate fluctuations on investments are included with the net realized and unrealized gain (loss) on investment securities. Other foreign currency transactions resulting in realized and unrealized gain (loss) are disclosed separately.
Investment Transactions and Income. For financial reporting purposes, the Fund's investment holdings and NAV include trades executed through the end of the last business day of the period. The NAV per share for processing shareholder transactions is calculated as of the close of business of the New York Stock Exchange (NYSE), normally 4:00 p.m. Eastern time and includes trades executed through the end of the prior business day. Gains and losses on securities sold are determined on the basis of identified cost. Dividend income is recorded on the ex-dividend date, except for certain dividends from foreign securities where the ex-dividend date may have passed, which are recorded as soon as the Fund is informed of the ex-dividend date. Non-cash dividends included in dividend income, if any, are recorded at the fair market value of the securities received. Income and capital gain distributions from Fidelity Central Funds, if any, are recorded on the ex-dividend date. Certain distributions received by the Fund represent a return of capital or capital gain. The Fund determines the components of these distributions subsequent to the ex-dividend date, based upon receipt of tax filings or other correspondence relating to the underlying investment. These distributions are recorded as a reduction of cost of investments and/or as a realized gain. Interest income is accrued as earned and includes coupon interest and amortization of premium and accretion of discount on debt securities as applicable. Investment income is recorded net of foreign taxes withheld where recovery of such taxes is uncertain.
Expenses. Expenses directly attributable to a fund are charged to that fund. Expenses attributable to more than one fund are allocated among the respective funds on the basis of relative net assets or other appropriate methods. Expense estimates are accrued in the period to which they relate and adjustments are made when actual amounts are known.
Income Tax Information and Distributions to Shareholders. Each year, the Fund intends to qualify as a regulated investment company under Subchapter M of the Internal Revenue Code, including distributing substantially all of its taxable income and realized gains. As a result, no provision for U.S. Federal income taxes is required. The Fund files a U.S. federal tax return, in addition to state and local tax returns as required. The Fund's federal income tax returns are subject to examination by the Internal Revenue Service (IRS) for a period of three fiscal years after they are filed. State and local tax returns may be subject to examination for an additional fiscal year depending on the jurisdiction. Foreign taxes are provided for based on the Fund's understanding of the tax rules and rates that exist in the foreign markets in which it invests.
Distributions are declared and recorded on the ex-dividend date. Income and capital gain distributions are determined in accordance with income tax regulations, which may differ from GAAP.
Capital accounts within the financial statements are adjusted for permanent book-tax differences. These adjustments have no impact on net assets or the results of operations. Capital accounts are not adjusted for temporary book-tax differences which will reverse in a subsequent period.
Book-tax differences are primarily due to futures contracts, foreign currency transactions, market discount, partnerships, capital loss carryforwards and losses deferred due to wash sales.
The federal tax cost of investment securities and unrealized appreciation (depreciation) as of period end were as follows:
| Gross unrealized appreciation | $256,893,626 |
| Gross unrealized depreciation | (13,820,059) |
| Net unrealized appreciation (depreciation) on securities | $243,073,567 |
| Tax cost | $720,815,415 |
Capital loss carryforwards are only available to offset future capital gains of the Fund to the extent provided by regulations and may be limited. Under the Regulated Investment Company Modernization Act of 2010 (the Act), the Fund is permitted to carry forward capital losses incurred in taxable years beginning after December 22, 2010 for an unlimited period and such capital losses are required to be used prior to any losses that expire. The capital loss carryforward information presented below, including any applicable limitation, is estimated as of prior fiscal period end and is subject to adjustment.
| No expiration | |
| Short-term | $(4,340,537) |
Restricted Securities. The Fund may invest in securities that are subject to legal or contractual restrictions on resale. These securities generally may be resold in transactions exempt from registration or to the public if the securities are registered. Disposal of these securities may involve time-consuming negotiations and expense, and prompt sale at an acceptable price may be difficult. Information regarding restricted securities is included at the end of the Fund's Schedule of Investments.
4. Derivative Instruments.
Risk Exposures and the Use of Derivative Instruments. The Fund's investment objective allows the Fund to enter into various types of derivative contracts, including futures contracts. Derivatives are investments whose value is primarily derived from underlying assets, indices or reference rates and may be transacted on an exchange or over-the-counter (OTC). Derivatives may involve a future commitment to buy or sell a specified asset based on specified terms, to exchange future cash flows at periodic intervals based on a notional principal amount, or for one party to make one or more payments upon the occurrence of specified events in exchange for periodic payments from the other party.
The Fund used derivatives to increase returns and to manage exposure to certain risks as defined below. The success of any strategy involving derivatives depends on analysis of numerous economic factors, and if the strategies for investment do not work as intended, the Fund may not achieve its objectives.
The Fund's use of derivatives increased or decreased its exposure to the following risk:
| Equity Risk | Equity risk relates to the fluctuations in the value of financial instruments as a result of changes in market prices (other than those arising from interest rate risk or foreign exchange risk), whether caused by factors specific to an individual investment, its issuer, or all factors affecting all instruments traded in a market or market segment. |
The Fund is also exposed to additional risks from investing in derivatives, such as liquidity risk and counterparty credit risk. Liquidity risk is the risk that the Fund will be unable to close out the derivative in the open market in a timely manner. Counterparty credit risk is the risk that the counterparty will not be able to fulfill its obligation to the Fund. Counterparty credit risk related to exchange-traded futures contracts may be mitigated by the protection provided by the exchange on which they trade.
Investing in derivatives may involve greater risks than investing in the underlying assets directly and, to varying degrees, may involve risk of loss in excess of any initial investment and collateral received and amounts recognized in the Statement of Assets and Liabilities. In addition, there may be the risk that the change in value of the derivative contract does not correspond to the change in value of the underlying instrument.
Futures Contracts. A futures contract is an agreement between two parties to buy or sell a specified underlying instrument for a fixed price at a specified future date. The Fund used futures contracts to manage its exposure to the stock market.
Upon entering into a futures contract, a fund is required to deposit either cash or securities (initial margin) with a clearing broker in an amount equal to a certain percentage of the face value of the contract. Futures contracts are marked-to-market daily and subsequent daily payments (variation margin) are made or received by a fund depending on the daily fluctuations in the value of the futures contracts and are recorded as unrealized appreciation or (depreciation). This receivable and/or payable, if any, is included in daily variation margin for derivative instruments in the Statement of Assets and Liabilities. Realized gain or (loss) is recorded upon the expiration or closing of a futures contract.
Any open futures contracts at period end are presented in the Schedule of Investments under the caption "Futures Contracts". The underlying face amount at value reflects each contract's exposure to the underlying instrument or index at period end.
During the period the Fund recognized net realized gain (loss) of $2,248,588 and a change in net unrealized appreciation (depreciation) of $(555,053) related to its investment in futures contracts. These amounts are included in the Statement of Operations.
5. Purchases and Sales of Investments.
Purchases and sales of securities, other than short-term securities, aggregated $240,644,709 and $328,773,051, respectively.
6. Fees and Other Transactions with Affiliates.
Management Fee. Fidelity Management & Research Company (the investment adviser) and its affiliates provide the Fund with investment management related services for which the Fund pays a monthly management fee. The management fee is the sum of an individual fund fee rate that is based on an annual rate of .30% of the Fund's average net assets and an annualized group fee rate that averaged .25% during the period. The group fee rate is based upon the average net assets of all the mutual funds advised by the investment adviser, including any mutual funds previously advised by the investment adviser that are currently advised by Fidelity SelectCo, LLC, an affiliate of the investment adviser. The group fee rate decreases as assets under management increase and increases as assets under management decrease. In addition, the management fee is subject to a performance adjustment (up to a maximum of +/- .20% of the Fund's average net assets over a 36 month performance period). The upward or downward adjustment to the management fee is based on the Fund's relative investment performance as compared to its benchmark index, the Russell 3000 Growth Index, over the same 36 month performance period. For the reporting period, the total annualized management fee rate, including the performance adjustment, was .42% of the Fund's average net assets. The performance adjustment included in the management fee rate may be higher or lower than the maximum performance adjustment rate due to the difference between the average net assets for the reporting and performance periods.
The Board and shareholders approved a new management contract, effective June 1, 2017. Under the management contract, the Fund will not pay a management fee. In addition, the investment adviser will pay all ordinary operating expenses of the Fund, except custody fees, fees and expenses of the independent Trustees, and certain miscellaneous expenses such as proxy and shareholder meeting expenses.
Transfer Agent Fees. Fidelity Investments Institutional Operations Company, Inc. (FIIOC), an affiliate of the investment adviser, is the Fund's transfer, dividend disbursing and shareholder servicing agent. FIIOC receives account fees and asset-based fees that vary according to account size and type of account. FIIOC pays for typesetting, printing and mailing of shareholder reports, except proxy statements. For the period, the transfer agent fees were equivalent to an annualized rate of .17% of average net assets.
Accounting and Security Lending Fees. Fidelity Service Company, Inc. (FSC), an affiliate of the investment adviser, maintains the Fund's accounting records. The accounting fee is based on the level of average net assets for each month. Under a separate contract, FSC administers the security lending program. The security lending fee is based on the number and duration of lending transactions.
Brokerage Commissions. The Fund placed a portion of its portfolio transactions with brokerage firms which are affiliates of the investment adviser. Brokerage commissions are included in net realized gain (loss) and change in net unrealized appreciation (depreciation) in the Statement of Operations. The commissions paid to these affiliated firms were $7,649 for the period.
Interfund Trades. The Fund may purchase from or sell securities to other Fidelity Funds under procedures adopted by the Board. The procedures have been designed to ensure these interfund trades are executed in accordance with Rule 17a-7 of the 1940 Act. Interfund trades are included within the respective purchases and sales amounts shown in the Purchases and Sales of Investments note.
7. Committed Line of Credit.
The Fund participates with other funds managed by the investment adviser or an affiliate in a $4.25 billion credit facility (the "line of credit") to be utilized for temporary or emergency purposes to fund shareholder redemptions or for other short-term liquidity purposes. The Fund has agreed to pay commitment fees on its pro-rata portion of the line of credit, which amounted to $1,569 and is reflected in Miscellaneous expenses on the Statement of Operations. During the period, the Fund did not borrow on this line of credit.
8. Security Lending.
The Fund lends portfolio securities through a lending agent from time to time in order to earn additional income. For equity securities, a lending agent is used and may loan securities to certain qualified borrowers, including Fidelity Capital Markets (FCM), a broker-dealer affiliated with the Fund. On the settlement date of the loan, the Fund receives collateral (in the form of U.S. Treasury obligations, letters of credit and/or cash) against the loaned securities and maintains collateral in an amount not less than 100% of the market value of the loaned securities during the period of the loan. The market value of the loaned securities is determined at the close of business of the Fund and any additional required collateral is delivered to the Fund on the next business day. The Fund or borrower may terminate the loan at any time, and if the borrower defaults on its obligation to return the securities loaned because of insolvency or other reasons, the Fund may apply collateral received from the borrower against the obligation. The Fund may experience delays and costs in recovering the securities loaned. Any cash collateral received is invested in the Fidelity Securities Lending Cash Central Fund. The value of loaned securities and cash collateral at period end are disclosed on the Fund's Statement of Assets and Liabilities. At period end, there were no security loans outstanding with FCM. Security lending income represents the income earned on investing cash collateral, less rebates paid to borrowers and any lending agent fees associated with the loan, plus any premium payments received for lending certain types of securities. Security lending income is presented in the Statement of Operations as a component of income from Fidelity Central Funds. Total security lending income during the period amounted to $109,393, including $135 from securities loaned to FCM.
9. Expense Reductions.
Commissions paid to certain brokers with whom the investment adviser, or its affiliates, places trades on behalf of the Fund include an amount in addition to trade execution, which may be rebated back to the Fund to offset certain expenses. This amount totaled $15,316 for the period. In addition, through arrangements with the Fund's custodian, credits realized as a result of certain uninvested cash balances were used to reduce the Fund's expenses. During the period, these credits reduced the Fund's custody expenses by $245.
In addition, during the period the investment adviser reimbursed and/or waived a portion of operating expenses in the amount of $4,064.
Effective June 1, 2017, the investment adviser will contractually reimburse expenses of Fund to the extent annual operating expenses exceed .014% of average net assets. Fees and expenses of the independent Trustees and certain miscellaneous expenses such as proxy and shareholder meeting expenses will be excluded from this reimbursement.
10. Other.
The Fund's organizational documents provide former and current trustees and officers with a limited indemnification against liabilities arising in connection with the performance of their duties to the Fund. In the normal course of business, the Fund may also enter into contracts that provide general indemnifications. The Fund's maximum exposure under these arrangements is unknown as this would be dependent on future claims that may be made against the Fund. The risk of material loss from such claims is considered remote.
At the end of the period, mutual funds managed by the investment adviser or its affiliates were the owners of record of all of the outstanding shares of the Fund.
Shareholder Expense Example
As a shareholder of the Fund, you incur two types of costs: (1) transaction costs, and (2) ongoing costs, including management fees and other Fund expenses. This Example is intended to help you understand your ongoing costs (in dollars) of investing in the Fund and to compare these costs with the ongoing costs of investing in other mutual funds.
The Example is based on an investment of $1,000 invested at the beginning of the period and held for the entire period (December 1, 2016 to May 31, 2017).
Actual Expenses
The first line of the accompanying table provides information about actual account values and actual expenses. You may use the information in this line, together with the amount you invested, to estimate the expenses that you paid over the period. Simply divide your account value by $1,000.00 (for example, an $8,600 account value divided by $1,000.00 = 8.6), then multiply the result by the number in the first line under the heading entitled "Expenses Paid During Period" to estimate the expenses you paid on your account during this period. In addition, the Fund, as a shareholder in the underlying Fidelity Central Funds, will indirectly bear its pro-rata share of the fees and expenses incurred by the underlying Fidelity Central Funds. These fees and expenses are not included in the Fund's annualized expense ratio used to calculate the expense estimate in the table below.
Hypothetical Example for Comparison Purposes
The second line of the accompanying table provides information about hypothetical account values and hypothetical expenses based on the Fund's actual expense ratio and an assumed rate of return of 5% per year before expenses, which is not the Fund's actual return. The hypothetical account values and expenses may not be used to estimate the actual ending account balance or expenses you paid for the period. You may use this information to compare the ongoing costs of investing in the Fund and other funds. To do so, compare this 5% hypothetical example with the 5% hypothetical examples that appear in the shareholder reports of the other funds. In addition, the Fund, as a shareholder in the underlying Fidelity Central Funds, will indirectly bear its pro-rata share of the fees and expenses incurred by the underlying Fidelity Central Funds. These fees and expenses are not included in the Fund's annualized expense ratio used to calculate the expense estimate in the table below.
Please note that the expenses shown in the table are meant to highlight your ongoing costs only and do not reflect any transaction costs. Therefore, the second line of the table is useful in comparing ongoing costs only, and will not help you determine the relative total costs of owning different funds.
| Annualized Expense Ratio-A | Beginning Account Value December 1, 2016 | Ending Account Value May 31, 2017 | Expenses Paid During Period-B December 1, 2016 to May 31, 2017 | |
| Actual | .63% | $1,000.00 | $1,216.30 | $3.48-C |
| Hypothetical-D | $1,000.00 | $1,021.79 | $3.18-C |
A Annualized expense ratio reflects expenses net of applicable fee waivers.
B Expenses are equal to the Fund's annualized expense ratio, multiplied by the average account value over the period, multiplied by 182/365 (to reflect the one-half year period).
C If fees and changes to the Fund's expense contract and/or expense cap, effective June 1, 2017 had been in effect during the current period, the restated annualized expense ratio would have been .00% and the expenses paid in the actual and hypothetical examples above would have been $0.00 and $0.00, respectively.
D 5% return per year before expenses
![]()
Corporate Headquarters
245 Summer St.
Boston, MA 02210
www.fidelity.com
AXM1-SANN-0717
1.9860269.102
Fidelity Advisor® Series Growth Opportunities Fund Semi-Annual Report May 31, 2017 |
|
Contents
To view a fund's proxy voting guidelines and proxy voting record for the 12-month period ended June 30, visit http://www.fidelity.com/proxyvotingresults or visit the Securities and Exchange Commission's (SEC) web site at http://www.sec.gov.
You may also call 1-877-208-0098 to request a free copy of the proxy voting guidelines.
Standard & Poor's, S&P and S&P 500 are registered service marks of The McGraw-Hill Companies, Inc. and have been licensed for use by Fidelity Distributors Corporation.
Other third-party marks appearing herein are the property of their respective owners.
All other marks appearing herein are registered or unregistered trademarks or service marks of FMR LLC or an affiliated company. © 2017 FMR LLC. All rights reserved.
This report and the financial statements contained herein are submitted for the general information of the shareholders of the Fund. This report is not authorized for distribution to prospective investors in the Fund unless preceded or accompanied by an effective prospectus.
A fund files its complete schedule of portfolio holdings with the SEC for the first and third quarters of each fiscal year on Form N-Q. Forms N-Q are available on the SEC’s web site at http://www.sec.gov. A fund's Forms N-Q may be reviewed and copied at the SEC’s Public Reference Room in Washington, DC. Information regarding the operation of the SEC's Public Reference Room may be obtained by calling 1-800-SEC-0330.
For a complete list of a fund's portfolio holdings, view the most recent holdings listing, semiannual report, or annual report on Fidelity's web site at http://www.fidelity.com, http://www.institutional.fidelity.com, or http://www.401k.com, as applicable.
NOT FDIC INSURED •MAY LOSE VALUE •NO BANK GUARANTEE
Neither the Fund nor Fidelity Distributors Corporation is a bank.
Investment Summary (Unaudited)
Top Ten Stocks as of May 31, 2017
| % of fund's net assets | % of fund's net assets 6 months ago | |
| Apple, Inc. | 6.7 | 6.0 |
| Alphabet, Inc. Class C | 3.9 | 3.7 |
| Amazon.com, Inc. | 3.8 | 3.0 |
| Tesla, Inc. | 3.6 | 2.3 |
| American Tower Corp. | 3.1 | 3.2 |
| Microsoft Corp. | 2.6 | 2.7 |
| Facebook, Inc. Class A | 2.6 | 2.5 |
| LyondellBasell Industries NV Class A | 2.4 | 1.8 |
| Alphabet, Inc. Class A | 2.4 | 2.2 |
| Charter Communications, Inc. Class A | 2.0 | 2.8 |
| 33.1 |
Top Five Market Sectors as of May 31, 2017
| % of fund's net assets | % of fund's net assets 6 months ago | |
| Information Technology | 40.7 | 40.0 |
| Health Care | 16.7 | 17.2 |
| Consumer Discretionary | 16.0 | 14.6 |
| Consumer Staples | 6.6 | 7.2 |
| Real Estate | 5.0 | 4.9 |
Asset Allocation (% of fund's net assets)
| As of May 31, 2017* | ||
| Stocks | 98.5% | |
| Convertible Securities | 1.0% | |
| Short-Term Investments and Net Other Assets (Liabilities) | 0.5% | |

* Foreign investments - 11.8%
| As of November 30, 2016* | ||
| Stocks | 97.8% | |
| Convertible Securities | 1.0% | |
| Short-Term Investments and Net Other Assets (Liabilities) | 1.2% | |

* Foreign investments - 12.2%
Investments May 31, 2017 (Unaudited)
Showing Percentage of Net Assets
| Common Stocks - 98.5% | |||
| Shares | Value | ||
| CONSUMER DISCRETIONARY - 16.0% | |||
| Automobiles - 3.6% | |||
| Tesla, Inc. (a) | 67,821 | $23,127,639 | |
| Hotels, Restaurants & Leisure - 1.6% | |||
| Chipotle Mexican Grill, Inc. (a) | 2,000 | 954,700 | |
| Marriott International, Inc. Class A | 200 | 21,530 | |
| Starbucks Corp. | 52,000 | 3,307,720 | |
| U.S. Foods Holding Corp. | 196,500 | 5,887,140 | |
| 10,171,090 | |||
| Household Durables - 0.5% | |||
| Newell Brands, Inc. | 56,800 | 3,007,560 | |
| Internet & Direct Marketing Retail - 5.6% | |||
| Amazon.com, Inc. (a) | 24,000 | 23,870,880 | |
| Groupon, Inc. (a) | 451,100 | 1,357,811 | |
| Netflix, Inc. (a) | 6,400 | 1,043,648 | |
| Priceline Group, Inc. (a) | 1,400 | 2,627,926 | |
| Vipshop Holdings Ltd. ADR (a) | 381,000 | 4,712,970 | |
| Wayfair LLC Class A (a) | 29,200 | 1,838,140 | |
| 35,451,375 | |||
| Media - 3.5% | |||
| Charter Communications, Inc. Class A (a) | 37,062 | 12,806,774 | |
| Comcast Corp. Class A | 108,800 | 4,535,872 | |
| Liberty Global PLC LiLAC Class A (a) | 2 | 42 | |
| Liberty Media Corp. Liberty Media Class A (a)(b) | 51,500 | 1,642,850 | |
| Lions Gate Entertainment Corp.: | |||
| Class A (b) | 32,600 | 883,460 | |
| Class B (a) | 32,600 | 824,454 | |
| The Walt Disney Co. | 14,900 | 1,608,306 | |
| 22,301,758 | |||
| Multiline Retail - 0.1% | |||
| Dollar Tree, Inc. (a) | 8,600 | 668,220 | |
| Specialty Retail - 0.9% | |||
| AutoZone, Inc. (a) | 500 | 302,960 | |
| Home Depot, Inc. | 19,500 | 2,993,445 | |
| TJX Companies, Inc. | 29,600 | 2,226,216 | |
| 5,522,621 | |||
| Textiles, Apparel & Luxury Goods - 0.2% | |||
| lululemon athletica, Inc. (a) | 22,600 | 1,090,902 | |
| TOTAL CONSUMER DISCRETIONARY | 101,341,165 | ||
| CONSUMER STAPLES - 6.2% | |||
| Beverages - 1.8% | |||
| Constellation Brands, Inc. Class A (sub. vtg.) | 12,400 | 2,266,100 | |
| Molson Coors Brewing Co. Class B | 42,900 | 4,066,491 | |
| Monster Beverage Corp. (a) | 67,000 | 3,387,520 | |
| The Coca-Cola Co. | 35,000 | 1,591,450 | |
| 11,311,561 | |||
| Food & Staples Retailing - 1.6% | |||
| Costco Wholesale Corp. | 13,000 | 2,345,590 | |
| Performance Food Group Co. (a) | 280,900 | 7,949,470 | |
| 10,295,060 | |||
| Personal Products - 0.6% | |||
| Coty, Inc. Class A | 145,200 | 2,750,088 | |
| Unilever NV (Certificaten Van Aandelen) (Bearer) | 24,200 | 1,378,544 | |
| 4,128,632 | |||
| Tobacco - 2.2% | |||
| British American Tobacco PLC (United Kingdom) | 137,800 | 9,858,570 | |
| Imperial Tobacco Group PLC | 31,577 | 1,476,473 | |
| Philip Morris International, Inc. | 19,900 | 2,384,020 | |
| 13,719,063 | |||
| TOTAL CONSUMER STAPLES | 39,454,316 | ||
| ENERGY - 1.2% | |||
| Oil, Gas & Consumable Fuels - 1.2% | |||
| Anadarko Petroleum Corp. | 11,000 | 555,830 | |
| Cabot Oil & Gas Corp. | 103,800 | 2,303,322 | |
| Devon Energy Corp. | 15,300 | 519,894 | |
| PDC Energy, Inc. (a) | 20,700 | 1,027,962 | |
| Teekay LNG Partners LP | 44,800 | 680,960 | |
| The Williams Companies, Inc. | 32,400 | 926,640 | |
| Williams Partners LP | 39,800 | 1,558,966 | |
| 7,573,574 | |||
| FINANCIALS - 3.6% | |||
| Banks - 0.5% | |||
| HDFC Bank Ltd. sponsored ADR | 38,700 | 3,397,860 | |
| Capital Markets - 2.4% | |||
| BlackRock, Inc. Class A | 800 | 327,392 | |
| CBOE Holdings, Inc. | 135,800 | 11,729,046 | |
| MSCI, Inc. | 3,200 | 325,536 | |
| S&P Global, Inc. | 2,700 | 385,587 | |
| TD Ameritrade Holding Corp. | 61,400 | 2,293,904 | |
| 15,061,465 | |||
| Consumer Finance - 0.7% | |||
| Synchrony Financial | 174,300 | 4,679,955 | |
| TOTAL FINANCIALS | 23,139,280 | ||
| HEALTH CARE - 16.7% | |||
| Biotechnology - 9.0% | |||
| ACADIA Pharmaceuticals, Inc. (a) | 17,846 | 458,821 | |
| Acorda Therapeutics, Inc. (a) | 15,807 | 218,137 | |
| Agios Pharmaceuticals, Inc. (a) | 8,000 | 373,360 | |
| Alexion Pharmaceuticals, Inc. (a) | 105,600 | 10,351,968 | |
| Alkermes PLC (a) | 18,261 | 1,054,755 | |
| Alnylam Pharmaceuticals, Inc. (a) | 46,377 | 3,035,838 | |
| Amgen, Inc. | 78,800 | 12,232,912 | |
| Amicus Therapeutics, Inc. (a) | 159,400 | 1,278,388 | |
| BioMarin Pharmaceutical, Inc. (a) | 26,800 | 2,348,752 | |
| bluebird bio, Inc. (a) | 20,900 | 1,574,815 | |
| Coherus BioSciences, Inc. (a) | 19,000 | 375,250 | |
| Five Prime Therapeutics, Inc. (a) | 14,200 | 401,150 | |
| Genocea Biosciences, Inc. (a)(b) | 14,933 | 91,091 | |
| Insmed, Inc. (a) | 86,200 | 1,329,204 | |
| Intercept Pharmaceuticals, Inc. (a) | 2,900 | 324,510 | |
| Ionis Pharmaceuticals, Inc. (a) | 89,256 | 4,087,032 | |
| Merrimack Pharmaceuticals, Inc. | 104,600 | 189,849 | |
| Neurocrine Biosciences, Inc. (a) | 44,055 | 1,915,071 | |
| Prothena Corp. PLC (a) | 31,405 | 1,601,969 | |
| Regeneron Pharmaceuticals, Inc. (a) | 19,200 | 8,813,952 | |
| Regulus Therapeutics, Inc. (a) | 8,700 | 12,180 | |
| Rigel Pharmaceuticals, Inc. (a) | 181,900 | 416,551 | |
| Sage Therapeutics, Inc. (a) | 6,000 | 396,660 | |
| Spark Therapeutics, Inc. (a) | 2,700 | 137,511 | |
| TESARO, Inc. (a) | 8,000 | 1,194,480 | |
| Vertex Pharmaceuticals, Inc. (a) | 21,600 | 2,669,760 | |
| Xencor, Inc. (a) | 12,400 | 254,200 | |
| 57,138,166 | |||
| Health Care Equipment & Supplies - 2.5% | |||
| Boston Scientific Corp. (a) | 262,700 | 7,100,781 | |
| Danaher Corp. | 17,800 | 1,511,932 | |
| Insulet Corp. (a) | 26,900 | 1,128,993 | |
| Intuitive Surgical, Inc. (a) | 700 | 640,276 | |
| Medtronic PLC | 64,000 | 5,393,920 | |
| 15,775,902 | |||
| Health Care Providers & Services - 2.6% | |||
| Anthem, Inc. | 47,400 | 8,643,390 | |
| Cigna Corp. | 4,500 | 725,535 | |
| Humana, Inc. | 8,900 | 2,067,114 | |
| UnitedHealth Group, Inc. | 28,100 | 4,922,558 | |
| 16,358,597 | |||
| Health Care Technology - 0.5% | |||
| athenahealth, Inc. (a) | 23,323 | 3,124,816 | |
| Castlight Health, Inc. Class B (a) | 28,800 | 100,800 | |
| 3,225,616 | |||
| Pharmaceuticals - 2.1% | |||
| Allergan PLC | 38,660 | 8,650,175 | |
| Bristol-Myers Squibb Co. | 49,500 | 2,670,525 | |
| Innoviva, Inc. (a) | 54,600 | 667,212 | |
| Theravance Biopharma, Inc. (a) | 37,400 | 1,365,100 | |
| 13,353,012 | |||
| TOTAL HEALTH CARE | 105,851,293 | ||
| INDUSTRIALS - 3.3% | |||
| Air Freight & Logistics - 0.2% | |||
| FedEx Corp. | 6,400 | 1,240,576 | |
| Airlines - 0.9% | |||
| Allegiant Travel Co. | 2,100 | 287,700 | |
| JetBlue Airways Corp. (a) | 17,300 | 387,866 | |
| Spirit Airlines, Inc. (a) | 102,700 | 5,453,370 | |
| 6,128,936 | |||
| Electrical Equipment - 0.3% | |||
| Fortive Corp. | 7,400 | 462,130 | |
| Sunrun, Inc. (a) | 281,200 | 1,417,248 | |
| 1,879,378 | |||
| Machinery - 0.6% | |||
| Allison Transmission Holdings, Inc. | 42,399 | 1,641,689 | |
| Caterpillar, Inc. | 20,700 | 2,182,401 | |
| Middleby Corp. (a) | 500 | 64,180 | |
| 3,888,270 | |||
| Professional Services - 0.6% | |||
| Equifax, Inc. | 14,700 | 2,010,960 | |
| Recruit Holdings Co. Ltd. | 6,600 | 349,815 | |
| TransUnion Holding Co., Inc. (a) | 28,400 | 1,241,364 | |
| 3,602,139 | |||
| Road & Rail - 0.1% | |||
| J.B. Hunt Transport Services, Inc. | 7,300 | 623,274 | |
| Trading Companies & Distributors - 0.6% | |||
| Bunzl PLC | 33,700 | 1,055,993 | |
| HD Supply Holdings, Inc. (a) | 64,300 | 2,594,505 | |
| 3,650,498 | |||
| TOTAL INDUSTRIALS | 21,013,071 | ||
| INFORMATION TECHNOLOGY - 40.3% | |||
| Communications Equipment - 0.4% | |||
| Carvana Co. Class A (b) | 247,100 | 2,483,355 | |
| Internet Software & Services - 10.6% | |||
| Alphabet, Inc.: | |||
| Class A (a) | 15,500 | 15,299,895 | |
| Class C (a) | 25,700 | 24,796,902 | |
| Apptio, Inc. Class A | 6,100 | 100,772 | |
| Cloudera, Inc. (b) | 2,600 | 53,950 | |
| Cloudera, Inc. | 10,396 | 194,145 | |
| Criteo SA sponsored ADR (a) | 3,300 | 173,019 | |
| Endurance International Group Holdings, Inc. (a) | 358,594 | 2,707,385 | |
| Facebook, Inc. Class A (a) | 108,700 | 16,463,702 | |
| GoDaddy, Inc. (a) | 110,600 | 4,550,084 | |
| The Trade Desk, Inc. | 3,000 | 165,000 | |
| Wix.com Ltd. (a) | 38,069 | 2,805,685 | |
| 67,310,539 | |||
| IT Services - 11.9% | |||
| Accenture PLC Class A | 2,500 | 311,175 | |
| Alliance Data Systems Corp. | 40,000 | 9,645,200 | |
| Capgemini SA | 29,700 | 3,074,780 | |
| Cognizant Technology Solutions Corp. Class A | 122,800 | 8,216,548 | |
| EPAM Systems, Inc. (a) | 75,600 | 6,341,328 | |
| Euronet Worldwide, Inc. (a) | 43,400 | 3,785,782 | |
| FleetCor Technologies, Inc. (a) | 28,500 | 4,112,265 | |
| Global Payments, Inc. | 75,600 | 6,925,716 | |
| Luxoft Holding, Inc. (a) | 97,000 | 6,266,200 | |
| MasterCard, Inc. Class A | 54,800 | 6,733,824 | |
| PayPal Holdings, Inc. (a) | 63,000 | 3,289,230 | |
| Paysafe Group PLC (a) | 539,400 | 3,478,425 | |
| Presidio, Inc. | 245,400 | 3,771,798 | |
| Visa, Inc. Class A | 101,300 | 9,646,799 | |
| 75,599,070 | |||
| Semiconductors & Semiconductor Equipment - 2.0% | |||
| Advanced Micro Devices, Inc. (a) | 29,000 | 324,510 | |
| Micron Technology, Inc. (a) | 54,100 | 1,664,657 | |
| NVIDIA Corp. | 28,900 | 4,171,715 | |
| Qualcomm, Inc. | 56,300 | 3,224,301 | |
| SolarEdge Technologies, Inc. (a) | 193,180 | 3,593,148 | |
| 12,978,331 | |||
| Software - 8.7% | |||
| Activision Blizzard, Inc. | 105,400 | 6,174,332 | |
| Adobe Systems, Inc. (a) | 45,400 | 6,440,444 | |
| Autodesk, Inc. (a) | 44,600 | 4,984,942 | |
| Electronic Arts, Inc. (a) | 31,700 | 3,592,561 | |
| Microsoft Corp. | 239,100 | 16,698,744 | |
| Red Hat, Inc. (a) | 9,100 | 815,087 | |
| Salesforce.com, Inc. (a) | 117,648 | 10,545,967 | |
| SS&C Technologies Holdings, Inc. | 85,800 | 3,224,364 | |
| Workday, Inc. Class A (a) | 27,200 | 2,719,456 | |
| 55,195,897 | |||
| Technology Hardware, Storage & Peripherals - 6.7% | |||
| Apple, Inc. | 276,500 | 42,238,140 | |
| TOTAL INFORMATION TECHNOLOGY | 255,805,332 | ||
| MATERIALS - 4.9% | |||
| Chemicals - 3.7% | |||
| E.I. du Pont de Nemours & Co. | 55,600 | 4,387,952 | |
| LyondellBasell Industries NV Class A | 191,000 | 15,379,320 | |
| Monsanto Co. | 24,400 | 2,865,048 | |
| The Chemours Co. LLC | 23,200 | 927,768 | |
| 23,560,088 | |||
| Containers & Packaging - 1.2% | |||
| Ball Corp. | 192,600 | 7,877,340 | |
| TOTAL MATERIALS | 31,437,428 | ||
| REAL ESTATE - 4.8% | |||
| Equity Real Estate Investment Trusts (REITs) - 4.8% | |||
| American Tower Corp. | 151,100 | 19,822,809 | |
| Extra Space Storage, Inc. | 80,300 | 6,220,841 | |
| SBA Communications Corp. Class A (a) | 31,700 | 4,380,306 | |
| 30,423,956 | |||
| TELECOMMUNICATION SERVICES - 1.5% | |||
| Wireless Telecommunication Services - 1.5% | |||
| T-Mobile U.S., Inc. (a) | 138,100 | 9,310,702 | |
| TOTAL COMMON STOCKS | |||
| (Cost $460,035,683) | 625,350,117 | ||
| Convertible Preferred Stocks - 0.9% | |||
| CONSUMER STAPLES - 0.3% | |||
| Food & Staples Retailing - 0.1% | |||
| Blue Apron Holdings, Inc. Series D (a)(c) | 56,277 | 872,856 | |
| Tobacco - 0.2% | |||
| PAX Labs, Inc. Series C (a)(c) | 273,248 | 1,052,005 | |
| TOTAL CONSUMER STAPLES | 1,924,861 | ||
| INFORMATION TECHNOLOGY - 0.4% | |||
| Internet Software & Services - 0.4% | |||
| Uber Technologies, Inc. Series D, 8.00% (a)(c) | 55,696 | 2,716,418 | |
| REAL ESTATE - 0.2% | |||
| Real Estate Management & Development - 0.2% | |||
| Redfin Corp. Series G (a)(c) | 282,324 | 1,309,983 | |
| TOTAL CONVERTIBLE PREFERRED STOCKS | |||
| (Cost $3,597,038) | 5,951,262 | ||
| Principal Amount | Value | ||
| Convertible Bonds - 0.1% | |||
| CONSUMER STAPLES - 0.1% | |||
| Food & Staples Retailing - 0.1% | |||
| Blue Apron Holdings, Inc. 3.5% 5/3/19(c) | |||
| (Cost $569,000) | 569,000 | 569,000 | |
| Shares | Value | ||
| Money Market Funds - 2.3% | |||
| Fidelity Cash Central Fund, 0.86% (d) | 11,471,809 | 11,474,104 | |
| Fidelity Securities Lending Cash Central Fund 0.87% (d)(e) | 2,823,266 | 2,823,548 | |
| TOTAL MONEY MARKET FUNDS | |||
| (Cost $14,297,411) | 14,297,652 | ||
| TOTAL INVESTMENT PORTFOLIO - 101.8% | |||
| (Cost $478,499,132) | 646,168,031 | ||
| NET OTHER ASSETS (LIABILITIES) - (1.8)% | (11,162,389) | ||
| NET ASSETS - 100% | $635,005,642 |
Legend
(a) Non-income producing
(b) Security or a portion of the security is on loan at period end.
(c) Restricted securities - Investment in securities not registered under the Securities Act of 1933 (excluding 144A issues). At the end of the period, the value of restricted securities (excluding 144A issues) amounted to $6,520,262 or 1.0% of net assets.
(d) Affiliated fund that is generally available only to investment companies and other accounts managed by Fidelity Investments. The rate quoted is the annualized seven-day yield of the fund at period end. A complete unaudited listing of the fund's holdings as of its most recent quarter end is available upon request. In addition, each Fidelity Central Fund's financial statements are available on the SEC's website or upon request.
(e) Investment made with cash collateral received from securities on loan.
Additional information on each restricted holding is as follows:
| Security | Acquisition Date | Acquisition Cost |
| Blue Apron Holdings, Inc. Series D | 5/18/15 | $749,998 |
| Blue Apron Holdings, Inc. 3.5% 5/3/19 | 5/3/17 | $569,000 |
| PAX Labs, Inc. Series C | 5/22/15 | $1,052,005 |
| Redfin Corp. Series G | 12/16/14 | $931,020 |
| Uber Technologies, Inc. Series D, 8.00% | 6/6/14 | $864,015 |
Affiliated Central Funds
Information regarding fiscal year to date income earned by the Fund from investments in Fidelity Central Funds is as follows:
| Fund | Income earned |
| Fidelity Cash Central Fund | $25,735 |
| Fidelity Securities Lending Cash Central Fund | 152,451 |
| Total | $178,186 |
Investment Valuation
The following is a summary of the inputs used, as of May 31, 2017, involving the Fund's assets and liabilities carried at fair value. The inputs or methodology used for valuing securities may not be an indication of the risk associated with investing in those securities. For more information on valuation inputs, and their aggregation into the levels used below, please refer to the Investment Valuation section in the accompanying Notes to Financial Statements.
| Valuation Inputs at Reporting Date: | ||||
| Description | Total | Level 1 | Level 2 | Level 3 |
| Investments in Securities: | ||||
| Equities: | ||||
| Consumer Discretionary | $101,341,165 | $101,341,165 | $-- | $-- |
| Consumer Staples | 41,379,177 | 28,217,202 | 11,237,114 | 1,924,861 |
| Energy | 7,573,574 | 7,573,574 | -- | -- |
| Financials | 23,139,280 | 23,139,280 | -- | -- |
| Health Care | 105,851,293 | 105,851,293 | -- | -- |
| Industrials | 21,013,071 | 21,013,071 | -- | -- |
| Information Technology | 258,521,750 | 255,611,187 | 194,145 | 2,716,418 |
| Materials | 31,437,428 | 31,437,428 | -- | -- |
| Real Estate | 31,733,939 | 30,423,956 | -- | 1,309,983 |
| Telecommunication Services | 9,310,702 | 9,310,702 | -- | -- |
| Corporate Bonds | 569,000 | -- | -- | 569,000 |
| Money Market Funds | 14,297,652 | 14,297,652 | -- | -- |
| Total Investments in Securities: | $646,168,031 | $628,216,510 | $11,431,259 | $6,520,262 |
The following is a reconciliation of Investments in Securities for which Level 3 inputs were used in determining value:
| Investments in Securities: | |
| Beginning Balance | $5,987,176 |
| Net Realized Gain (Loss) on Investment Securities | -- |
| Net Unrealized Gain (Loss) on Investment Securities | 115,452 |
| Cost of Purchases | 569,000 |
| Proceeds of Sales | (151,366) |
| Amortization/Accretion | -- |
| Transfers into Level 3 | -- |
| Transfers out of Level 3 | -- |
| Ending Balance | $6,520,262 |
| The change in unrealized gain (loss) for the period attributable to Level 3 securities held at May 31, 2017 | $276,400 |
The information used in the above reconciliation represents fiscal year to date activity for any Investments in Securities identified as using Level 3 inputs at either the beginning or the end of the current fiscal period. Transfers in or out of Level 3 represent the beginning value of any Security or Instrument where a change in the pricing level occurred from the beginning to the end of the period. The cost of purchases and the proceeds of sales may include securities received or delivered through corporate actions or exchanges.
Other Information
Distribution of investments by country or territory of incorporation, as a percentage of Total Net Assets, is as follows (Unaudited):
| United States of America | 88.2% |
| Ireland | 2.9% |
| Netherlands | 2.6% |
| United Kingdom | 2.0% |
| British Virgin Islands | 1.0% |
| Others (Individually Less Than 1%) | 3.3% |
| 100.0% |
See accompanying notes which are an integral part of the financial statements.
Financial Statements
Statement of Assets and Liabilities
| May 31, 2017 (Unaudited) | ||
| Assets | ||
| Investment in securities, at value (including securities loaned of $2,719,665) — See accompanying schedule: Unaffiliated issuers (cost $464,201,721) | $631,870,379 | |
| Fidelity Central Funds (cost $14,297,411) | 14,297,652 | |
| Total Investments (cost $478,499,132) | $646,168,031 | |
| Receivable for investments sold | 7,542,127 | |
| Receivable for fund shares sold | 10,473 | |
| Dividends receivable | 496,779 | |
| Interest receivable | 2,460 | |
| Distributions receivable from Fidelity Central Funds | 37,320 | |
| Other receivables | 3,737 | |
| Total assets | 654,260,927 | |
| Liabilities | ||
| Payable for investments purchased | $5,431,320 | |
| Payable for fund shares redeemed | 10,581,504 | |
| Accrued management fee | 272,113 | |
| Other affiliated payables | 104,795 | |
| Other payables and accrued expenses | 39,603 | |
| Collateral on securities loaned | 2,825,950 | |
| Total liabilities | 19,255,285 | |
| Net Assets | $635,005,642 | |
| Net Assets consist of: | ||
| Paid in capital | $451,312,455 | |
| Undistributed net investment income | 1,237,029 | |
| Accumulated undistributed net realized gain (loss) on investments and foreign currency transactions | 14,787,701 | |
| Net unrealized appreciation (depreciation) on investments and assets and liabilities in foreign currencies | 167,668,457 | |
| Net Assets, for 51,639,877 shares outstanding | $635,005,642 | |
| Net Asset Value, offering price and redemption price per share ($635,005,642 ÷ 51,639,877 shares) | $12.30 |
See accompanying notes which are an integral part of the financial statements.
Statement of Operations
| Six months ended May 31, 2017 (Unaudited) | ||
| Investment Income | ||
| Dividends | $3,141,246 | |
| Interest | 2,460 | |
| Income from Fidelity Central Funds | 178,186 | |
| Total income | 3,321,892 | |
| Expenses | ||
| Management fee | ||
| Basic fee | $1,672,163 | |
| Performance adjustment | (514,998) | |
| Transfer agent fees | 514,245 | |
| Accounting and security lending fees | 115,177 | |
| Custodian fees and expenses | 24,954 | |
| Independent trustees' fees and expenses | 1,213 | |
| Audit | 30,079 | |
| Legal | 2,259 | |
| Interest | 718 | |
| Miscellaneous | 3,167 | |
| Total expenses before reductions | 1,848,977 | |
| Expense reductions | (16,477) | 1,832,500 |
| Net investment income (loss) | 1,489,392 | |
| Realized and Unrealized Gain (Loss) | ||
| Net realized gain (loss) on: | ||
| Investment securities: | ||
| Unaffiliated issuers | 16,680,097 | |
| Fidelity Central Funds | (1,831) | |
| Foreign currency transactions | 12,882 | |
| Total net realized gain (loss) | 16,691,148 | |
| Change in net unrealized appreciation (depreciation) on: Investment securities | 94,240,998 | |
| Assets and liabilities in foreign currencies | (281) | |
| Total change in net unrealized appreciation (depreciation) | 94,240,717 | |
| Net gain (loss) | 110,931,865 | |
| Net increase (decrease) in net assets resulting from operations | $112,421,257 |
See accompanying notes which are an integral part of the financial statements.
Statement of Changes in Net Assets
| Six months ended May 31, 2017 (Unaudited) | Year ended November 30, 2016 | |
| Increase (Decrease) in Net Assets | ||
| Operations | ||
| Net investment income (loss) | $1,489,392 | $2,654,868 |
| Net realized gain (loss) | 16,691,148 | 21,127,257 |
| Change in net unrealized appreciation (depreciation) | 94,240,717 | (36,293,383) |
| Net increase (decrease) in net assets resulting from operations | 112,421,257 | (12,511,258) |
| Distributions to shareholders from net investment income | (2,032,804) | (3,620,189) |
| Distributions to shareholders from net realized gain | (19,503,931) | (65,761,689) |
| Total distributions | (21,536,735) | (69,381,878) |
| Share transactions | ||
| Proceeds from sales of shares | 24,253,144 | 82,016,938 |
| Reinvestment of distributions | 21,536,735 | 69,381,877 |
| Cost of shares redeemed | (92,656,647) | (111,626,598) |
| Net increase (decrease) in net assets resulting from share transactions | (46,866,768) | 39,772,217 |
| Total increase (decrease) in net assets | 44,017,754 | (42,120,919) |
| Net Assets | ||
| Beginning of period | 590,987,888 | 633,108,807 |
| End of period | $635,005,642 | $590,987,888 |
| Other Information | ||
| Undistributed net investment income end of period | $1,237,029 | $1,780,441 |
| Shares | ||
| Sold | 2,147,863 | 7,910,300 |
| Issued in reinvestment of distributions | 2,060,932 | 6,584,295 |
| Redeemed | (8,216,180) | (10,624,052) |
| Net increase (decrease) | (4,007,385) | 3,870,543 |
See accompanying notes which are an integral part of the financial statements.
Financial Highlights — Fidelity Advisor Series Growth Opportunities Fund
| Six months ended (Unaudited) May 31, | Years ended November 30, | ||||
| 2017 | 2016 | 2015 | 2014 | 2013 A | |
| Selected Per–Share Data | |||||
| Net asset value, beginning of period | $10.62 | $12.23 | $11.79 | $10.23 | $10.00 |
| Income from Investment Operations | |||||
| Net investment income (loss)B | .03 | .05 | .05C | .02 | –D |
| Net realized and unrealized gain (loss) | 2.04 | (.32) | .60 | 1.56 | .23 |
| Total from investment operations | 2.07 | (.27) | .65 | 1.58 | .23 |
| Distributions from net investment income | (.04) | (.07) | (.02) | –D | – |
| Distributions from net realized gain | (.36) | (1.27) | (.20) | (.02) | – |
| Total distributions | (.39)E | (1.34) | (.21)F | (.02) | – |
| Net asset value, end of period | $12.30 | $10.62 | $12.23 | $11.79 | $10.23 |
| Total ReturnG,H | 20.16% | (2.09)% | 5.71% | 15.51% | 2.30% |
| Ratios to Average Net AssetsI,J | |||||
| Expenses before reductions | .60%K | .62% | .74% | .77% | .85%K |
| Expenses net of fee waivers, if any | .60%K | .62% | .74% | .77% | .85%K |
| Expenses net of all reductions | .60%K | .61% | .74% | .77% | .85%K |
| Net investment income (loss) | .49%K | .45% | .44%C | .16% | .38%K |
| Supplemental Data | |||||
| Net assets, end of period (000 omitted) | $635,006 | $590,988 | $633,109 | $974,463 | $852,281 |
| Portfolio turnover rateL | 49%K | 67% | 50% | 16% | 65%M |
A For the period November 7, 2013 (commencement of operations) to November 30, 2013.
B Calculated based on average shares outstanding during the period.
C Net Investment income per share reflects a large, non-recurring dividend which amounted to $.03 per share. Excluding this non-recurring dividend, the ratio of net investment income (loss) to average net assets would have been .22%.
D Amount represents less than $.005 per share.
E Total distributions of $.39 per share is comprised of distributions from net investment income of $.037 and distributions from net realized gain of $.355 per share.
F Total distributions of $.21 per share is comprised of distributions from net investment income of $.016 and distributions from net realized gain of $.197 per share.
G Total returns for periods of less than one year are not annualized.
H Total returns would have been lower if certain expenses had not been reduced during the applicable periods shown.
I Fees and expenses of any underlying Fidelity Central Funds are not included in the Fund's expense ratio. The Fund indirectly bears its proportionate share of the expenses of any underlying Fidelity Central Funds.
J Expense ratios reflect operating expenses of the Fund. Expenses before reductions do not reflect amounts reimbursed by the investment adviser or reductions from brokerage service arrangements or reductions from other expense offset arrangements and do not represent the amount paid by the Fund during periods when reimbursements or reductions occur. Expense ratios before reductions for start-up periods may not be representative of longer term operating periods. Expenses net of fee waivers reflect expenses after reimbursement by the investment adviser but prior to reductions from brokerage service arrangements or other expense offset arrangements. Expenses net of all reductions represent the net expenses paid by the Fund.
K Annualized
L Amount does not include the portfolio activity of any underlying Fidelity Central Funds.
M Amount not annualized.
See accompanying notes which are an integral part of the financial statements.
Notes to Financial Statements (Unaudited)
For the period ended May 31, 2017
1. Organization.
Fidelity Advisor Series Growth Opportunities Fund (the Fund) is a fund of Fidelity Advisor Series I (the Trust) and is authorized to issue an unlimited number of shares. Shares of the Fund are only available for purchase by mutual funds for which Fidelity Management & Research Company (FMR) or an affiliate serves as an investment manager. The Trust is registered under the Investment Company Act of 1940, as amended (the 1940 Act), as an open-end management investment company organized as a Massachusetts business trust.
2. Investments in Fidelity Central Funds.
The Fund invests in Fidelity Central Funds, which are open-end investment companies generally available only to other investment companies and accounts managed by the investment adviser and its affiliates. The Fund's Schedule of Investments lists each of the Fidelity Central Funds held as of period end, if any, as an investment of the Fund, but does not include the underlying holdings of each Fidelity Central Fund. As an Investing Fund, the Fund indirectly bears its proportionate share of the expenses of the underlying Fidelity Central Funds.
The Money Market Central Funds seek preservation of capital and current income and are managed by Fidelity Investments Money Management, Inc. (FIMM), an affiliate of the investment adviser. Annualized expenses of the Money Market Central Funds as of their most recent shareholder report date are less than .005%.
A complete unaudited list of holdings for each Fidelity Central Fund is available upon request or at the Securities and Exchange Commission (the SEC) website at www.sec.gov. In addition, the financial statements of the Fidelity Central Funds are available on the SEC website or upon request.
3. Significant Accounting Policies.
The Fund is an investment company and applies the accounting and reporting guidance of the Financial Accounting Standards Board (FASB) Accounting Standards Codification Topic 946 Financial Services – Investments Companies. The financial statements have been prepared in conformity with accounting principles generally accepted in the United States of America (GAAP), which require management to make certain estimates and assumptions at the date of the financial statements. Actual results could differ from those estimates. Subsequent events, if any, through the date that the financial statements were issued have been evaluated in the preparation of the financial statements. The following summarizes the significant accounting policies of the Fund:
Investment Valuation. Investments are valued as of 4:00 p.m. Eastern time on the last calendar day of the period. The Board of Trustees (the Board) has delegated the day to day responsibility for the valuation of the Fund's investments to the Fair Value Committee (the Committee) established by the Fund's investment adviser. In accordance with valuation policies and procedures approved by the Board, the Fund attempts to obtain prices from one or more third party pricing vendors or brokers to value its investments. When current market prices, quotations or currency exchange rates are not readily available or reliable, investments will be fair valued in good faith by the Committee, in accordance with procedures adopted by the Board. Factors used in determining fair value vary by investment type and may include market or investment specific events, changes in interest rates and credit quality. The frequency with which these procedures are used cannot be predicted and they may be utilized to a significant extent. The Committee oversees the Fund's valuation policies and procedures and reports to the Board on the Committee's activities and fair value determinations. The Board monitors the appropriateness of the procedures used in valuing the Fund's investments and ratifies the fair value determinations of the Committee.
The Fund categorizes the inputs to valuation techniques used to value its investments into a disclosure hierarchy consisting of three levels as shown below:
- Level 1 – quoted prices in active markets for identical investments
- Level 2 – other significant observable inputs (including quoted prices for similar investments, interest rates, prepayment speeds, etc.)
- Level 3 – unobservable inputs (including the Fund's own assumptions based on the best information available)
Valuation techniques used to value the Fund's investments by major category are as follows:
Equity securities, including restricted securities, for which market quotations are readily available, are valued at the last reported sale price or official closing price as reported by a third party pricing vendor on the primary market or exchange on which they are traded and are categorized as Level 1 in the hierarchy. In the event there were no sales during the day or closing prices are not available, securities are valued at the last quoted bid price or may be valued using the last available price and are generally categorized as Level 2 in the hierarchy. For foreign equity securities, when market or security specific events arise, comparisons to the valuation of American Depositary Receipts (ADRs), futures contracts, Exchange-Traded Funds (ETFs) and certain indexes as well as quoted prices for similar securities may be used and would be categorized as Level 2 in the hierarchy. Utilizing these techniques may result in transfers between Level 1 and Level 2. For equity securities, including restricted securities, where observable inputs are limited, assumptions about market activity and risk are used and these securities may be categorized as Level 3 in the hierarchy.
Debt securities, including restricted securities, are valued based on evaluated prices received from third party pricing vendors or from brokers who make markets in such securities. Corporate bonds are valued by pricing vendors who utilize matrix pricing which considers yield or price of bonds of comparable quality, coupon, maturity and type or by broker-supplied prices.When independent prices are unavailable or unreliable, debt securities may be valued utilizing pricing methodologies which consider similar factors that would be used by third party pricing vendors. Debt securities are generally categorized as Level 2 in the hierarchy but may be Level 3 depending on the circumstances.
Investments in open-end mutual funds, including the Fidelity Central Funds, are valued at their closing net asset value (NAV) each business day and are categorized as Level 1 in the hierarchy.
The following provides information on Level 3 securities held by the Fund that were valued at period end based on unobservable inputs. These amounts exclude valuations provided by a broker.
| Asset Type | Fair Value | Valuation Technique(s) | Unobservable Input | Amount or Range / Weighted Average | Impact to Valuation from an Increase in Input(a) |
| Corporate Bonds | $569,000 | Market approach | Transaction price | $100.00 | Increase |
| Equities | $5,951,262 | Market comparable | Enterprise value/Sales multiple (EV/S) | 2.0 – 2.4 / 2.2 | Decrease |
| Discount rate | 35.0% | Decrease | |||
| Market approach | Transaction price | $3.85 - $48.77 / $36.23 | Increase |
(a) Represents the expected directional change in the fair value of the Level 3 investments that would result from an increase in the corresponding input. A decrease to the unobservable input would have the opposite effect. Significant changes in these inputs could result in significantly higher or lower fair value measurements.
Changes in valuation techniques may result in transfers in or out of an assigned level within the disclosure hierarchy. The aggregate value of investments by input level as of May 31, 2017, as well as a roll forward of Level 3 investments, is included at the end of the Fund's Schedule of Investments.
Foreign Currency. The Fund may use foreign currency contracts to facilitate transactions in foreign-denominated securities. Gains and losses from these transactions may arise from changes in the value of the foreign currency or if the counterparties do not perform under the contracts' terms.
Foreign-denominated assets, including investment securities, and liabilities are translated into U.S. dollars at the exchange rates at period end. Purchases and sales of investment securities, income and dividends received and expenses denominated in foreign currencies are translated into U.S. dollars at the exchange rate in effect on the transaction date.
The effects of exchange rate fluctuations on investments are included with the net realized and unrealized gain (loss) on investment securities. Other foreign currency transactions resulting in realized and unrealized gain (loss) are disclosed separately.
Investment Transactions and Income. For financial reporting purposes, the Fund's investment holdings and NAV include trades executed through the end of the last business day of the period. The NAV per share for processing shareholder transactions is calculated as of the close of business of the New York Stock Exchange (NYSE), normally 4:00 p.m. Eastern time and includes trades executed through the end of the prior business day. Gains and losses on securities sold are determined on the basis of identified cost. Dividend income is recorded on the ex-dividend date, except for certain dividends from foreign securities where the ex-dividend date may have passed, which are recorded as soon as the Fund is informed of the ex-dividend date. Non-cash dividends included in dividend income, if any, are recorded at the fair market value of the securities received. Income and capital gain distributions from Fidelity Central Funds, if any, are recorded on the ex-dividend date. Certain distributions received by the Fund represent a return of capital or capital gain. The Fund determines the components of these distributions subsequent to the ex-dividend date, based upon receipt of tax filings or other correspondence relating to the underlying investment. These distributions are recorded as a reduction of cost of investments and/or as a realized gain. Interest income is accrued as earned and includes coupon interest and amortization of premium and accretion of discount on debt securities as applicable. Investment income is recorded net of foreign taxes withheld where recovery of such taxes is uncertain.
Expenses. Expenses directly attributable to a fund are charged to that fund. Expenses attributable to more than one fund are allocated among the respective funds on the basis of relative net assets or other appropriate methods. Expense estimates are accrued in the period to which they relate and adjustments are made when actual amounts are known.
Income Tax Information and Distributions to Shareholders. Each year, the Fund intends to qualify as a regulated investment company under Subchapter M of the Internal Revenue Code, including distributing substantially all of its taxable income and realized gains. As a result, no provision for U.S. Federal income taxes is required. The Fund files a U.S. federal tax return, in addition to state and local tax returns as required. The Fund's federal income tax returns are subject to examination by the Internal Revenue Service (IRS) for a period of three fiscal years after they are filed. State and local tax returns may be subject to examination for an additional fiscal year depending on the jurisdiction. Foreign taxes are provided for based on the Fund's understanding of the tax rules and rates that exist in the foreign markets in which it invests.
Distributions are declared and recorded on the ex-dividend date. Income and capital gain distributions are determined in accordance with income tax regulations, which may differ from GAAP.
Capital accounts within the financial statements are adjusted for permanent book-tax differences. These adjustments have no impact on net assets or the results of operations. Capital accounts are not adjusted for temporary book-tax differences which will reverse in a subsequent period.
Book-tax differences are primarily due to foreign currency transactions, partnerships, and losses deferred due to wash sales.
The federal tax cost of investment securities and unrealized appreciation (depreciation) as of period end were as follows:
| Gross unrealized appreciation | $181,711,501 |
| Gross unrealized depreciation | (14,252,924) |
| Net unrealized appreciation (depreciation) on securities | $167,458,577 |
| Tax cost | $478,709,454 |
Restricted Securities. The Fund may invest in securities that are subject to legal or contractual restrictions on resale. These securities generally may be resold in transactions exempt from registration or to the public if the securities are registered. Disposal of these securities may involve time-consuming negotiations and expense, and prompt sale at an acceptable price may be difficult. Information regarding restricted securities is included at the end of the Fund's Schedule of Investments.
4. Purchases and Sales of Investments.
Purchases and sales of securities, other than short-term securities, aggregated $147,430,831 and $210,540,165, respectively.
5. Fees and Other Transactions with Affiliates.
Management Fee. Fidelity Management & Research Company (the investment adviser) and its affiliates provide the Fund with investment management related services for which the Fund pays a monthly management fee. The management fee is the sum of an individual fund fee rate that is based on an annual rate of .30% of the Fund's average net assets and an annualized group fee rate that averaged .25% during the period. The group fee rate is based upon the average net assets of all the mutual funds advised by the investment adviser, including any mutual funds previously advised by the investment adviser that are currently advised by Fidelity SelectCo, LLC, an affiliate of the investment adviser. The group fee rate decreases as assets under management increase and increases as assets under management decrease. In addition, the management fee is subject to a performance adjustment (up to a maximum of +/- .20% of the Fund's average net assets over a 36 month performance period). The upward or downward adjustment to the management fee is based on the Fund's relative investment performance as compared to its benchmark index, the Russell 3000 Growth Index, over the same 36 month performance period. For the reporting period, the total annualized management fee rate, including the performance adjustment, was .38% of the Fund's average net assets. The performance adjustment included in the management fee rate may be higher or lower than the maximum performance adjustment rate due to the difference between the average net assets for the reporting and performance periods.
The Board and shareholders approved a new management contract, effective June 1, 2017. Under the management contract, the Fund will not pay a management fee. In addition, the investment adviser will pay all ordinary operating expenses of the Fund, except custody fees, fees and expenses of the independent Trustees, and certain miscellaneous expenses such as proxy and shareholder meeting expenses.
Transfer Agent Fees. Fidelity Investments Institutional Operations Company, Inc. (FIIOC), an affiliate of the investment adviser, is the Fund's transfer, dividend disbursing and shareholder servicing agent. FIIOC receives account fees and asset-based fees that vary according to account size and type of account. FIIOC pays for typesetting, printing and mailing of shareholder reports, except proxy statements. For the period, the transfer agent fees were equivalent to an annualized rate of .17% of average net assets.
Accounting and Security Lending Fees. Fidelity Service Company, Inc. (FSC), an affiliate of the investment adviser, maintains the Fund's accounting records. The accounting fee is based on the level of average net assets for each month. Under a separate contract, FSC administers the security lending program. The security lending fee is based on the number and duration of lending transactions.
Brokerage Commissions. The Fund placed a portion of its portfolio transactions with brokerage firms which are affiliates of the investment adviser. Brokerage commissions are included in net realized gain (loss) and change in net unrealized appreciation (depreciation) in the Statement of Operations. The commissions paid to these affiliated firms were $4,336 for the period.
Interfund Lending Program. Pursuant to an Exemptive Order issued by the SEC, the Fund, along with other registered investment companies having management contracts with FMR or other affiliated entities of FMR, may participate in an interfund lending program. This program provides an alternative credit facility allowing the funds to borrow from, or lend money to, other participating affiliated funds. At period end, there were no interfund loans outstanding. The Fund's activity in this program during the period for which loans were outstanding was as follows:
| Borrower or Lender | Average Loan Balance | Weighted Average Interest Rate | Interest Expense |
| Borrower | $6,286,200 | .82% | $718 |
Interfund Trades. The Fund may purchase from or sell securities to other Fidelity Funds under procedures adopted by the Board. The procedures have been designed to ensure these interfund trades are executed in accordance with Rule 17a-7 of the 1940 Act. Interfund trades are included within the respective purchases and sales amounts shown in the Purchases and Sales of Investments note.
6. Committed Line of Credit.
The Fund participates with other funds managed by the investment adviser or an affiliate in a $4.25 billion credit facility (the "line of credit") to be utilized for temporary or emergency purposes to fund shareholder redemptions or for other short-term liquidity purposes. The Fund has agreed to pay commitment fees on its pro-rata portion of the line of credit, which amounted to $1,030 and is reflected in Miscellaneous expenses on the Statement of Operations. During the period, the Fund did not borrow on this line of credit.
7. Security Lending.
The Fund lends portfolio securities through a lending agent from time to time in order to earn additional income. For equity securities, a lending agent is used and may loan securities to certain qualified borrowers, including Fidelity Capital Markets (FCM), a broker-dealer affiliated with the Fund. On the settlement date of the loan, the Fund receives collateral (in the form of U.S. Treasury obligations, letters of credit and/or cash) against the loaned securities and maintains collateral in an amount not less than 100% of the market value of the loaned securities during the period of the loan. The market value of the loaned securities is determined at the close of business of the Fund and any additional required collateral is delivered to the Fund on the next business day. The Fund or borrower may terminate the loan at any time, and if the borrower defaults on its obligation to return the securities loaned because of insolvency or other reasons, the Fund may apply collateral received from the borrower against the obligation. The Fund may experience delays and costs in recovering the securities loaned. Any cash collateral received is invested in the Fidelity Securities Lending Cash Central Fund. The value of loaned securities and cash collateral at period end are disclosed on the Fund's Statement of Assets and Liabilities. Security lending income represents the income earned on investing cash collateral, less rebates paid to borrowers and any lending agent fees associated with the loan, plus any premium payments received for lending certain types of securities. Security lending income is presented in the Statement of Operations as a component of income from Fidelity Central Funds. Total security lending income during the period amounted to $152,451. During the period, there were no securities loaned to FCM.
8. Expense Reductions.
Commissions paid to certain brokers with whom the investment adviser, or its affiliates, places trades on behalf of the Fund include an amount in addition to trade execution, which may be rebated back to the Fund to offset certain expenses. This amount totaled $13,811 for the period.
In addition, during the period the investment adviser reimbursed and/or waived a portion of operating expenses in the amount of $2,666.
Effective June 1, 2017, the investment adviser will contractually reimburse expenses of the Fund to the extent annual operating expenses exceed .014% of average net assets. Fees and expenses of the independent Trustees and certain miscellaneous expenses such as proxy and shareholder meeting expenses will be excluded from this reimbursement.
9. Other.
The Fund's organizational documents provide former and current trustees and officers with a limited indemnification against liabilities arising in connection with the performance of their duties to the Fund. In the normal course of business, the Fund may also enter into contracts that provide general indemnifications. The Fund's maximum exposure under these arrangements is unknown as this would be dependent on future claims that may be made against the Fund. The risk of material loss from such claims is considered remote.
At the end of the period, mutual funds managed by the investment adviser or its affiliates were the owners of record of all the outstanding shares of the Fund.
Shareholder Expense Example
As a shareholder of the Fund, you incur two types of costs: (1) transaction costs, and (2) ongoing costs, including management fees and other Fund expenses. This Example is intended to help you understand your ongoing costs (in dollars) of investing in the Fund and to compare these costs with the ongoing costs of investing in other mutual funds.
The Example is based on an investment of $1,000 invested at the beginning of the period and held for the entire period (December 1, 2016 to May 31, 2017).
Actual Expenses
The first line of the accompanying table provides information about actual account values and actual expenses. You may use the information in this line, together with the amount you invested, to estimate the expenses that you paid over the period. Simply divide your account value by $1,000.00 (for example, an $8,600 account value divided by $1,000.00 = 8.6), then multiply the result by the number in the first line under the heading entitled "Expenses Paid During Period" to estimate the expenses you paid on your account during this period. In addition, the Fund, as a shareholder in the underlying Fidelity Central Funds, will indirectly bear its pro-rata share of the fees and expenses incurred by the underlying Fidelity Central Funds. These fees and expenses are not included in the Fund's annualized expense ratio used to calculate the expense estimate in the table below.
Hypothetical Example for Comparison Purposes
The second line of the accompanying table provides information about hypothetical account values and hypothetical expenses based on the Fund's actual expense ratio and an assumed rate of return of 5% per year before expenses, which is not the Fund's actual return. The hypothetical account values and expenses may not be used to estimate the actual ending account balance or expenses you paid for the period. You may use this information to compare the ongoing costs of investing in the Fund and other funds. To do so, compare this 5% hypothetical example with the 5% hypothetical examples that appear in the shareholder reports of the other funds. In addition, the Fund, as a shareholder in the underlying Fidelity Central Funds, will indirectly bear its pro-rata share of the fees and expenses incurred by the underlying Fidelity Central Funds. These fees and expenses are not included in the Fund's annualized expense ratio used to calculate the expense estimate in the table below.
Please note that the expenses shown in the table are meant to highlight your ongoing costs only and do not reflect any transaction costs. Therefore, the second line of the table is useful in comparing ongoing costs only, and will not help you determine the relative total costs of owning different funds.
| Annualized Expense Ratio-A | Beginning Account Value December 1, 2016 | Ending Account Value May 31, 2017 | Expenses Paid During Period-B December 1, 2016 to May 31, 2017 | |
| Actual | .60% | $1,000.00 | $1,201.60 | $3.29-C |
| Hypothetical-D | $1,000.00 | $1,021.94 | $3.02-C |
A Annualized expense ratio reflects expenses net of applicable fee waivers.
B Expenses are equal to the Fund's annualized expense ratio, multiplied by the average account value over the period, multiplied by 182/365 (to reflect the one-half year period).
C If fees and changes to the Fund's expense contract and/ or expense cap, effective June 1, 2017, had been in effect during the current period, the restated annualized expense ratio would have been .01% and the expenses paid in the actual and hypothetical examples above would have been $.05 and $.05, respectively.
D 5% return per year before expenses
![]()
Corporate Headquarters
245 Summer St.
Boston, MA 02210
www.fidelity.com
AXS3-SANN-0717
1.967933.103
Fidelity Advisor® Series Small Cap Fund Semi-Annual Report May 31, 2017 |
|
Contents
To view a fund's proxy voting guidelines and proxy voting record for the 12-month period ended June 30, visit http://www.fidelity.com/proxyvotingresults or visit the Securities and Exchange Commission's (SEC) web site at http://www.sec.gov.
You may also call 1-877-208-0098 to request a free copy of the proxy voting guidelines.
Standard & Poor's, S&P and S&P 500 are registered service marks of The McGraw-Hill Companies, Inc. and have been licensed for use by Fidelity Distributors Corporation.
Other third-party marks appearing herein are the property of their respective owners.
All other marks appearing herein are registered or unregistered trademarks or service marks of FMR LLC or an affiliated company. © 2017 FMR LLC. All rights reserved.
This report and the financial statements contained herein are submitted for the general information of the shareholders of the Fund. This report is not authorized for distribution to prospective investors in the Fund unless preceded or accompanied by an effective prospectus.
A fund files its complete schedule of portfolio holdings with the SEC for the first and third quarters of each fiscal year on Form N-Q. Forms N-Q are available on the SEC’s web site at http://www.sec.gov. A fund's Forms N-Q may be reviewed and copied at the SEC’s Public Reference Room in Washington, DC. Information regarding the operation of the SEC's Public Reference Room may be obtained by calling 1-800-SEC-0330.
For a complete list of a fund's portfolio holdings, view the most recent holdings listing, semiannual report, or annual report on Fidelity's web site at http://www.fidelity.com, http://www.institutional.fidelity.com, or http://www.401k.com, as applicable.
NOT FDIC INSURED •MAY LOSE VALUE •NO BANK GUARANTEE
Neither the Fund nor Fidelity Distributors Corporation is a bank.
Investment Summary (Unaudited)
Top Ten Stocks as of May 31, 2017
| % of fund's net assets | % of fund's net assets 6 months ago | |
| Marriott Vacations Worldwide Corp. | 3.0 | 1.5 |
| Conduent, Inc. | 2.6 | 0.0 |
| Berry Global Group, Inc. | 2.3 | 1.3 |
| CBRE Group, Inc. | 2.3 | 1.1 |
| Stamps.com, Inc. | 2.3 | 0.8 |
| j2 Global, Inc. | 2.2 | 1.1 |
| Global Payments, Inc. | 2.2 | 0.9 |
| CDW Corp. | 2.2 | 2.5 |
| Polaris Industries, Inc. | 2.1 | 0.0 |
| Premier, Inc. | 2.1 | 1.5 |
| 23.3 |
Top Five Market Sectors as of May 31, 2017
| % of fund's net assets | % of fund's net assets 6 months ago | |
| Information Technology | 21.5 | 19.9 |
| Consumer Discretionary | 16.1 | 10.0 |
| Financials | 14.5 | 16.7 |
| Industrials | 10.1 | 17.7 |
| Health Care | 9.2 | 11.3 |
Asset Allocation (% of fund's net assets)
| As of May 31, 2017* | ||
| Stocks and Equity Futures | 99.1% | |
| Short-Term Investments and Net Other Assets (Liabilities) | 0.9% | |

* Foreign investments - 15.3%
| As of November 30, 2016* | ||
| Stocks and Equity Futures | 98.8% | |
| Short-Term Investments and Net Other Assets (Liabilities) | 1.2% | |

* Foreign investments - 20.4%
Percentages shown as 0.0% may reflect amounts less than 0.05%.
Investments May 31, 2017 (Unaudited)
Showing Percentage of Net Assets
| Common Stocks - 92.1% | |||
| Shares | Value | ||
| CONSUMER DISCRETIONARY - 16.1% | |||
| Auto Components - 3.6% | |||
| Dorman Products, Inc. (a) | 61,000 | $5,087,400 | |
| Standard Motor Products, Inc. | 96,375 | 4,689,608 | |
| Tenneco, Inc. | 121,900 | 6,930,015 | |
| 16,707,023 | |||
| Diversified Consumer Services - 1.7% | |||
| Grand Canyon Education, Inc. (a) | 87,000 | 6,820,800 | |
| Tsukada Global Holdings, Inc. | 240,600 | 1,214,405 | |
| 8,035,205 | |||
| Hotels, Restaurants & Leisure - 3.0% | |||
| Marriott Vacations Worldwide Corp. | 118,700 | 13,830,925 | |
| Household Durables - 4.3% | |||
| NVR, Inc. (a) | 3,100 | 7,075,378 | |
| PulteGroup, Inc. | 313,300 | 7,102,511 | |
| TopBuild Corp. (a) | 105,500 | 5,649,525 | |
| 19,827,414 | |||
| Leisure Products - 2.1% | |||
| Polaris Industries, Inc. (b) | 114,700 | 9,588,920 | |
| Specialty Retail - 1.4% | |||
| Asbury Automotive Group, Inc. (a) | 113,200 | 6,333,540 | |
| TOTAL CONSUMER DISCRETIONARY | 74,323,027 | ||
| CONSUMER STAPLES - 1.4% | |||
| Food & Staples Retailing - 1.4% | |||
| McColl's Retail Group PLC | 717,991 | 1,877,944 | |
| Sundrug Co. Ltd. | 54,000 | 2,101,490 | |
| Tsuruha Holdings, Inc. | 23,500 | 2,605,688 | |
| 6,585,122 | |||
| ENERGY - 3.5% | |||
| Energy Equipment & Services - 1.6% | |||
| Hess Midstream Partners LP | 322,799 | 7,501,849 | |
| Oil, Gas & Consumable Fuels - 1.9% | |||
| Noble Midstream Partners LP | 112,700 | 5,183,073 | |
| World Fuel Services Corp. | 98,715 | 3,488,588 | |
| 8,671,661 | |||
| TOTAL ENERGY | 16,173,510 | ||
| FINANCIALS - 14.5% | |||
| Banks - 8.8% | |||
| Allegiance Bancshares, Inc. (a) | 169,020 | 6,549,525 | |
| Bank of Hawaii Corp. | 43,500 | 3,381,255 | |
| Bank of the Ozarks, Inc. | 193,600 | 8,557,120 | |
| ConnectOne Bancorp, Inc. | 243,676 | 5,312,137 | |
| German American Bancorp, Inc. | 124,191 | 3,856,131 | |
| Great Western Bancorp, Inc. | 119,855 | 4,537,710 | |
| Home Bancshares, Inc. | 174,900 | 4,094,409 | |
| ServisFirst Bancshares, Inc. | 121,900 | 4,173,856 | |
| 40,462,143 | |||
| Insurance - 4.2% | |||
| Enstar Group Ltd. (a) | 22,600 | 4,240,890 | |
| Hastings Group Holdings PLC | 1,129,671 | 4,565,981 | |
| James River Group Holdings Ltd. | 85,788 | 3,400,636 | |
| Reinsurance Group of America, Inc. | 57,400 | 7,146,874 | |
| 19,354,381 | |||
| Thrifts & Mortgage Finance - 1.5% | |||
| Essent Group Ltd. (a) | 128,037 | 4,643,902 | |
| Meridian Bancorp, Inc. Maryland | 137,510 | 2,227,662 | |
| 6,871,564 | |||
| TOTAL FINANCIALS | 66,688,088 | ||
| HEALTH CARE - 9.2% | |||
| Health Care Equipment & Supplies - 1.1% | |||
| LivaNova PLC (a) | 89,100 | 5,064,444 | |
| Health Care Providers & Services - 6.1% | |||
| HealthSouth Corp. | 203,300 | 9,215,589 | |
| Premier, Inc. (a) | 274,682 | 9,482,023 | |
| Sigma Healthcare Ltd. | 1,042,439 | 631,286 | |
| Surgery Partners, Inc. (a) | 383,000 | 8,349,400 | |
| The Ensign Group, Inc. | 14,323 | 263,257 | |
| 27,941,555 | |||
| Health Care Technology - 0.4% | |||
| Quality Systems, Inc. (a) | 128,762 | 1,977,784 | |
| Life Sciences Tools & Services - 1.2% | |||
| ICON PLC (a) | 58,800 | 5,533,080 | |
| Pharmaceuticals - 0.4% | |||
| Kaken Pharmaceutical Co. Ltd. | 28,400 | 1,636,045 | |
| TOTAL HEALTH CARE | 42,152,908 | ||
| INDUSTRIALS - 10.1% | |||
| Building Products - 1.0% | |||
| Apogee Enterprises, Inc. | 87,000 | 4,635,360 | |
| Commercial Services & Supplies - 2.4% | |||
| Coor Service Management Holding AB | 263,300 | 1,817,659 | |
| Deluxe Corp. | 87,400 | 5,957,184 | |
| Loomis AB (B Shares) | 90,800 | 3,421,428 | |
| 11,196,271 | |||
| Construction & Engineering - 2.1% | |||
| Argan, Inc. | 69,600 | 4,109,880 | |
| EMCOR Group, Inc. | 87,000 | 5,482,740 | |
| 9,592,620 | |||
| Machinery - 0.4% | |||
| Hy-Lok Corp. | 79,784 | 1,706,834 | |
| Marine - 0.5% | |||
| SITC International Holdings Co. Ltd. | 2,876,000 | 2,088,939 | |
| Professional Services - 2.1% | |||
| Benefit One, Inc. | 42,000 | 1,598,465 | |
| ICF International, Inc. (a) | 92,576 | 4,355,701 | |
| On Assignment, Inc. (a) | 75,100 | 3,935,240 | |
| 9,889,406 | |||
| Trading Companies & Distributors - 1.6% | |||
| Univar, Inc. (a) | 244,000 | 7,422,480 | |
| TOTAL INDUSTRIALS | 46,531,910 | ||
| INFORMATION TECHNOLOGY - 21.5% | |||
| Electronic Equipment & Components - 5.4% | |||
| CDW Corp. | 165,300 | 9,947,754 | |
| ePlus, Inc. (a) | 70,813 | 5,576,524 | |
| Fabrinet (a) | 96,700 | 3,406,741 | |
| SYNNEX Corp. | 50,713 | 5,642,328 | |
| 24,573,347 | |||
| Internet Software & Services - 4.5% | |||
| j2 Global, Inc. | 122,100 | 10,332,102 | |
| Stamps.com, Inc. (a) | 75,800 | 10,452,820 | |
| 20,784,922 | |||
| IT Services - 10.5% | |||
| Blackhawk Network Holdings, Inc. (a) | 141,300 | 6,125,355 | |
| Conduent, Inc. (a) | 723,500 | 11,872,635 | |
| CSRA, Inc. | 174,100 | 5,250,856 | |
| Global Payments, Inc. | 109,700 | 10,049,617 | |
| Maximus, Inc. | 130,400 | 8,095,232 | |
| WEX, Inc. (a) | 69,600 | 7,110,336 | |
| 48,504,031 | |||
| Software - 0.4% | |||
| Zensar Technologies Ltd. | 146,128 | 1,961,436 | |
| Technology Hardware, Storage & Peripherals - 0.7% | |||
| NCR Corp. (a) | 87,000 | 3,352,110 | |
| TOTAL INFORMATION TECHNOLOGY | 99,175,846 | ||
| MATERIALS - 7.6% | |||
| Chemicals - 0.5% | |||
| SK Kaken Co. Ltd. | 22,000 | 2,073,860 | |
| Containers & Packaging - 4.9% | |||
| Berry Global Group, Inc. (a) | 186,100 | 10,791,939 | |
| Greif, Inc. Class A | 113,200 | 6,729,740 | |
| Silgan Holdings, Inc. | 156,600 | 4,981,446 | |
| 22,503,125 | |||
| Metals & Mining - 1.0% | |||
| Atkore International Group, Inc. | 227,400 | 4,743,564 | |
| Paper & Forest Products - 1.2% | |||
| Neenah Paper, Inc. | 71,400 | 5,569,200 | |
| TOTAL MATERIALS | 34,889,749 | ||
| REAL ESTATE - 5.9% | |||
| Equity Real Estate Investment Trusts (REITs) - 0.9% | |||
| National Health Investors, Inc. | 57,400 | 4,334,848 | |
| Real Estate Management & Development - 5.0% | |||
| CBRE Group, Inc. (a) | 304,700 | 10,627,936 | |
| Daito Trust Construction Co. Ltd. | 28,600 | 4,511,440 | |
| Open House Co. Ltd. | 84,100 | 2,608,429 | |
| Relo Holdings Corp. | 249,000 | 5,013,725 | |
| 22,761,530 | |||
| TOTAL REAL ESTATE | 27,096,378 | ||
| UTILITIES - 2.3% | |||
| Gas Utilities - 1.7% | |||
| Amerigas Partners LP | 109,700 | 4,864,098 | |
| Star Gas Partners LP | 277,878 | 2,776,001 | |
| 7,640,099 | |||
| Multi-Utilities - 0.6% | |||
| Telecom Plus PLC | 168,100 | 2,861,133 | |
| TOTAL UTILITIES | 10,501,232 | ||
| TOTAL COMMON STOCKS | |||
| (Cost $354,333,362) | 424,117,770 | ||
| Principal Amount | Value | ||
| U.S. Treasury Obligations - 0.4% | |||
| U.S. Treasury Bills, yield at date of purchase 0.71% to 0.92% 6/8/17 to 8/24/17 (c) | |||
| (Cost $1,658,701) | 1,660,000 | 1,658,611 | |
| Shares | Value | ||
| Money Market Funds - 9.4% | |||
| Fidelity Cash Central Fund, 0.86% (d) | 34,678,028 | $34,684,963 | |
| Fidelity Securities Lending Cash Central Fund 0.87% (d)(e) | 8,828,394 | 8,829,277 | |
| TOTAL MONEY MARKET FUNDS | |||
| (Cost $43,514,420) | 43,514,240 | ||
| TOTAL INVESTMENT PORTFOLIO - 101.9% | |||
| (Cost $399,506,483) | 469,290,621 | ||
| NET OTHER ASSETS (LIABILITIES) - (1.9)% | (8,758,812) | ||
| NET ASSETS - 100% | $460,531,809 |
| Futures Contracts | |||
| Expiration Date | Underlying Face Amount at Value | Unrealized Appreciation/(Depreciation) | |
| Purchased | |||
| Equity Index Contracts | |||
| 468 ICE Russell 2000 Index Contracts (United States) | June 2017 | 32,036,940 | $(110,195) |
The face value of futures purchased as a percentage of Net Assets is 7%.
For the period, the average monthly underlying face amount at value for futures contracts in the aggregate was $32,303,937.
(a) Non-income producing
(b) Security or a portion of the security is on loan at period end.
(c) Security or a portion of the security was pledged to cover margin requirements for futures contracts. At period end, the value of securities pledged amounted to $1,658,611.
(d) Affiliated fund that is generally available only to investment companies and other accounts managed by Fidelity Investments. The rate quoted is the annualized seven-day yield of the fund at period end. A complete unaudited listing of the fund's holdings as of its most recent quarter end is available upon request. In addition, each Fidelity Central Fund's financial statements are available on the SEC's website or upon request.
(e) Investment made with cash collateral received from securities on loan.
Affiliated Central Funds
Information regarding fiscal year to date income earned by the Fund from investments in Fidelity Central Funds is as follows:
| Fund | Income earned |
| Fidelity Cash Central Fund | $102,951 |
| Fidelity Securities Lending Cash Central Fund | 65,870 |
| Total | $168,821 |
Investment Valuation
The following is a summary of the inputs used, as of May 31, 2017, involving the Fund's assets and liabilities carried at fair value. The inputs or methodology used for valuing securities may not be an indication of the risk associated with investing in those securities. For more information on valuation inputs, and their aggregation into the levels used below, please refer to the Investment Valuation section in the accompanying Notes to Financial Statements.
| Valuation Inputs at Reporting Date: | ||||
| Description | Total | Level 1 | Level 2 | Level 3 |
| Investments in Securities: | ||||
| Equities: | ||||
| Consumer Discretionary | $74,323,027 | $74,323,027 | $-- | $-- |
| Consumer Staples | 6,585,122 | 6,585,122 | -- | -- |
| Energy | 16,173,510 | 16,173,510 | -- | -- |
| Financials | 66,688,088 | 66,688,088 | -- | -- |
| Health Care | 42,152,908 | 42,152,908 | -- | -- |
| Industrials | 46,531,910 | 46,531,910 | -- | -- |
| Information Technology | 99,175,846 | 99,175,846 | -- | -- |
| Materials | 34,889,749 | 34,889,749 | -- | -- |
| Real Estate | 27,096,378 | 27,096,378 | -- | -- |
| Utilities | 10,501,232 | 10,501,232 | -- | -- |
| U.S. Government and Government Agency Obligations | 1,658,611 | -- | 1,658,611 | -- |
| Money Market Funds | 43,514,240 | 43,514,240 | -- | -- |
| Total Investments in Securities: | $469,290,621 | $467,632,010 | $1,658,611 | $-- |
| Derivative Instruments: | ||||
| Liabilities | ||||
| Futures Contracts | $(110,195) | $(110,195) | $-- | $-- |
| Total Liabilities | $(110,195) | $(110,195) | $-- | $-- |
| Total Derivative Instruments: | $(110,195) | $(110,195) | $-- | $-- |
The following is a summary of transfers between Level 1 and Level 2 for the period ended May 31, 2017. Transfers are assumed to have occurred at the beginning of the period, and are primarily attributable to the valuation techniques used for foreign equity securities, as discussed in the accompanying Notes to Financial Statements:
| Transfers | Total |
| Level 1 to Level 2 | $0 |
| Level 2 to Level 1 | $31,394,937 |
Value of Derivative Instruments
The following table is a summary of the Fund's value of derivative instruments by primary risk exposure as of May 31, 2017. For additional information on derivative instruments, please refer to the Derivative Instruments section in the accompanying Notes to Financial Statements.
| Primary Risk Exposure / Derivative Type | Value | |
| Asset | Liability | |
| Equity Risk | ||
| Futures Contracts(a) | $0 | $(110,195) |
| Total Equity Risk | 0 | (110,195) |
| Total Value of Derivatives | $0 | $(110,195) |
(a) Reflects gross cumulative appreciation (depreciation) on futures contracts as presented in the Schedule of Investments. In the Statement of Assets and Liabilities, the period end daily variation margin is included in receivable or payable for daily variation margin for derivative instruments, and the net cumulative appreciation (depreciation) is included in net unrealized appreciation (depreciation).
Other Information
Distribution of investments by country or territory of incorporation, as a percentage of Total Net Assets, is as follows (Unaudited):
| United States of America | 84.7% |
| Japan | 5.1% |
| United Kingdom | 3.1% |
| Bermuda | 2.6% |
| Cayman Islands | 1.3% |
| Ireland | 1.2% |
| Sweden | 1.1% |
| Others (Individually Less Than 1%) | 0.9% |
| 100.0% |
See accompanying notes which are an integral part of the financial statements.
Financial Statements
Statement of Assets and Liabilities
| May 31, 2017 (Unaudited) | ||
| Assets | ||
| Investment in securities, at value (including securities loaned of $8,533,554) — See accompanying schedule: Unaffiliated issuers (cost $355,992,063) | $425,776,381 | |
| Fidelity Central Funds (cost $43,514,420) | 43,514,240 | |
| Total Investments (cost $399,506,483) | $469,290,621 | |
| Foreign currency held at value (cost $80,406) | 80,406 | |
| Receivable for investments sold | 1,567,748 | |
| Receivable for fund shares sold | 7,984 | |
| Dividends receivable | 532,595 | |
| Distributions receivable from Fidelity Central Funds | 24,692 | |
| Other receivables | 6,531 | |
| Total assets | 471,510,577 | |
| Liabilities | ||
| Payable for investments purchased | $202,894 | |
| Payable for fund shares redeemed | 1,605,084 | |
| Accrued management fee | 204,242 | |
| Payable for daily variation margin for derivative instruments | 21,060 | |
| Other affiliated payables | 78,018 | |
| Other payables and accrued expenses | 37,896 | |
| Collateral on securities loaned | 8,829,574 | |
| Total liabilities | 10,978,768 | |
| Net Assets | $460,531,809 | |
| Net Assets consist of: | ||
| Paid in capital | $388,678,755 | |
| Distributions in excess of net investment income | (24,718) | |
| Accumulated undistributed net realized gain (loss) on investments and foreign currency transactions | 2,202,759 | |
| Net unrealized appreciation (depreciation) on investments and assets and liabilities in foreign currencies | 69,675,013 | |
| Net Assets, for 39,986,128 shares outstanding | $460,531,809 | |
| Net Asset Value, offering price and redemption price per share ($460,531,809 ÷ 39,986,128 shares) | $11.52 |
See accompanying notes which are an integral part of the financial statements.
Statement of Operations
| Six months ended May 31, 2017 (Unaudited) | ||
| Investment Income | ||
| Dividends | $2,596,209 | |
| Interest | 4,733 | |
| Income from Fidelity Central Funds | 168,821 | |
| Total income | 2,769,763 | |
| Expenses | ||
| Management fee | ||
| Basic fee | $1,588,910 | |
| Performance adjustment | (288,907) | |
| Transfer agent fees | 386,530 | |
| Accounting and security lending fees | 89,762 | |
| Custodian fees and expenses | 31,945 | |
| Independent trustees' fees and expenses | 915 | |
| Audit | 30,555 | |
| Legal | 594 | |
| Miscellaneous | 1,943 | |
| Total expenses before reductions | 1,842,247 | |
| Expense reductions | (21,684) | 1,820,563 |
| Net investment income (loss) | 949,200 | |
| Realized and Unrealized Gain (Loss) | ||
| Net realized gain (loss) on: | ||
| Investment securities: | ||
| Unaffiliated issuers | 16,364,524 | |
| Fidelity Central Funds | 545 | |
| Foreign currency transactions | 603 | |
| Futures contracts | 2,302,520 | |
| Total net realized gain (loss) | 18,668,192 | |
| Change in net unrealized appreciation (depreciation) on: Investment securities | 9,355,808 | |
| Assets and liabilities in foreign currencies | 18,470 | |
| Futures contracts | (1,206,990) | |
| Total change in net unrealized appreciation (depreciation) | 8,167,288 | |
| Net gain (loss) | 26,835,480 | |
| Net increase (decrease) in net assets resulting from operations | $27,784,680 |
See accompanying notes which are an integral part of the financial statements.
Statement of Changes in Net Assets
| Six months ended May 31, 2017 (Unaudited) | Year ended November 30, 2016 | |
| Increase (Decrease) in Net Assets | ||
| Operations | ||
| Net investment income (loss) | $949,200 | $3,836,873 |
| Net realized gain (loss) | 18,668,192 | (16,140,191) |
| Change in net unrealized appreciation (depreciation) | 8,167,288 | 21,365,425 |
| Net increase (decrease) in net assets resulting from operations | 27,784,680 | 9,062,107 |
| Distributions to shareholders from net investment income | (3,874,433) | (1,156,042) |
| Distributions to shareholders from net realized gain | – | (21,339,829) |
| Total distributions | (3,874,433) | (22,495,871) |
| Share transactions | ||
| Proceeds from sales of shares | 25,817,513 | 74,361,903 |
| Reinvestment of distributions | 3,874,433 | 22,495,871 |
| Cost of shares redeemed | (44,438,639) | (115,621,992) |
| Net increase (decrease) in net assets resulting from share transactions | (14,746,693) | (18,764,218) |
| Total increase (decrease) in net assets | 9,163,554 | (32,197,982) |
| Net Assets | ||
| Beginning of period | 451,368,255 | 483,566,237 |
| End of period | $460,531,809 | $451,368,255 |
| Other Information | ||
| Undistributed net investment income end of period | $– | $2,900,515 |
| Distributions in excess of net investment income end of period | $(24,718) | $– |
| Shares | ||
| Sold | 2,276,683 | 7,404,925 |
| Issued in reinvestment of distributions | 347,795 | 2,149,872 |
| Redeemed | (3,938,973) | (11,192,117) |
| Net increase (decrease) | (1,314,495) | (1,637,320) |
See accompanying notes which are an integral part of the financial statements.
Financial Highlights — Fidelity Advisor Series Small Cap Fund
| Six months ended (Unaudited) May 31, | Years ended November 30, | ||||
| 2017 | 2016 | 2015 | 2014 | 2013 A | |
| Selected Per–Share Data | |||||
| Net asset value, beginning of period | $10.93 | $11.26 | $11.19 | $10.39 | $10.00 |
| Income from Investment Operations | |||||
| Net investment income (loss)B | .02 | .09C | .03D | .02 | –E,F |
| Net realized and unrealized gain (loss) | .67 | .10 | .38 | .82 | .39 |
| Total from investment operations | .69 | .19 | .41 | .84 | .39 |
| Distributions from net investment income | (.10) | (.03) | (.02) | (.01) | – |
| Distributions from net realized gain | – | (.50) | (.32) | (.03) | – |
| Total distributions | (.10) | (.52)G | (.34) | (.04) | – |
| Net asset value, end of period | $11.52 | $10.93 | $11.26 | $11.19 | $10.39 |
| Total ReturnH,I | 6.30% | 1.96% | 3.81% | 8.12% | 3.90% |
| Ratios to Average Net AssetsJ,K | |||||
| Expenses before reductions | .81%L | .97% | 1.04% | .94% | 1.07%L |
| Expenses net of fee waivers, if any | .81%L | .97% | 1.03% | .94% | .95%L |
| Expenses net of all reductions | .80%L | .97% | 1.02% | .94% | .95%L |
| Net investment income (loss) | .42%L | .85%C | .30%D | .16% | (.25)%E,L |
| Supplemental Data | |||||
| Net assets, end of period (000 omitted) | $460,532 | $451,368 | $483,566 | $517,827 | $485,539 |
| Portfolio turnover rateM | 79%L | 90% | 35% | 58% | 4%N |
A For the period November 7, 2013 (commencement of operations) to November 30, 2013.
B Calculated based on average shares outstanding during the period.
C Net Investment income per share reflects a large, non-recurring dividend which amounted to $.05 per share. Excluding this non-recurring dividend, the ratio of net investment income (loss) to average net assets would have been .40%.
D Net Investment income per share reflects a large, non-recurring dividend which amounted to $.03 per share. Excluding this non-recurring dividend, the ratio of net investment income (loss) to average net assets would have been .06%.
E Net Investment income per share reflects a large, non-recurring dividend which amounted to $.01 amount per share. Excluding this non-recurring dividend, the ratio of net investment income (loss) to average net assets would have been (.36)%.
F Amount represents less than $.005 per share.
G Total distributions of $.52 per share is comprised of distributions from net investment income of $.027 and distributions from net realized gain of $.496 per share.
H Total returns for periods of less than one year are not annualized.
I Total returns would have been lower if certain expenses had not been reduced during the applicable periods shown.
J Fees and expenses of any underlying Fidelity Central Funds are not included in the Fund's expense ratio. The Fund indirectly bears its proportionate share of the expenses of any underlying Fidelity Central Funds.
K Expense ratios reflect operating expenses of the Fund. Expenses before reductions do not reflect amounts reimbursed by the investment adviser or reductions from brokerage service arrangements or reductions from other expense offset arrangements and do not represent the amount paid by the Fund during periods when reimbursements or reductions occur. Expense ratios before reductions for start-up periods may not be representative of longer term operating periods. Expenses net of fee waivers reflect expenses after reimbursement by the investment adviser but prior to reductions from brokerage service arrangements or other expense offset arrangements. Expenses net of all reductions represent the net expenses paid by the Fund.
L Annualized
M Amount does not include the portfolio activity of any underlying Fidelity Central Funds.
N Amount not annualized.
See accompanying notes which are an integral part of the financial statements.
Notes to Financial Statements (Unaudited)
For the period ended May 31, 2017
1. Organization.
Fidelity Advisor Series Small Cap Fund (the Fund) is a fund of Fidelity Advisor Series I (the Trust) and is authorized to issue an unlimited number of shares. Shares of the Fund are only available for purchase by mutual funds for which Fidelity Management & Research Company (FMR) or an affiliate serves as an investment manager. The Trust is registered under the Investment Company Act of 1940, as amended (the 1940 Act), as an open-end management investment company organized as a Massachusetts business trust.
2. Investments in Fidelity Central Funds.
The Fund invests in Fidelity Central Funds, which are open-end investment companies generally available only to other investment companies and accounts managed by the investment adviser and its affiliates. The Fund's Schedule of Investments lists each of the Fidelity Central Funds held as of period end, if any, as an investment of the Fund, but does not include the underlying holdings of each Fidelity Central Fund. As an Investing Fund, the Fund indirectly bears its proportionate share of the expenses of the underlying Fidelity Central Funds.
The Money Market Central Funds seek preservation of capital and current income and are managed by Fidelity Investments Money Management, Inc. (FIMM), an affiliate of the investment adviser. Annualized expenses of the Money Market Central Funds as of their most recent shareholder report date are less than .005%.
A complete unaudited list of holdings for each Fidelity Central Fund is available upon request or at the Securities and Exchange Commission (the SEC) website at www.sec.gov. In addition, the financial statements of the Fidelity Central Funds are available on the SEC website or upon request.
3. Significant Accounting Policies.
The Fund is an investment company and applies the accounting and reporting guidance of the Financial Accounting Standards Board (FASB) Accounting Standards Codification Topic 946 Financial Services – Investments Companies. The financial statements have been prepared in conformity with accounting principles generally accepted in the United States of America (GAAP), which require management to make certain estimates and assumptions at the date of the financial statements. Actual results could differ from those estimates. Subsequent events, if any, through the date that the financial statements were issued have been evaluated in the preparation of the financial statements. The following summarizes the significant accounting policies of the Fund:
Investment Valuation. Investments are valued as of 4:00 p.m. Eastern time on the last calendar day of the period. The Board of Trustees (the Board) has delegated the day to day responsibility for the valuation of the Fund's investments to the Fair Value Committee (the Committee) established by the Fund's investment adviser. In accordance with valuation policies and procedures approved by the Board, the Fund attempts to obtain prices from one or more third party pricing vendors or brokers to value its investments. When current market prices, quotations or currency exchange rates are not readily available or reliable, investments will be fair valued in good faith by the Committee, in accordance with procedures adopted by the Board. Factors used in determining fair value vary by investment type and may include market or investment specific events, changes in interest rates and credit quality. The frequency with which these procedures are used cannot be predicted and they may be utilized to a significant extent. The Committee oversees the Fund's valuation policies and procedures and reports to the Board on the Committee's activities and fair value determinations. The Board monitors the appropriateness of the procedures used in valuing the Fund's investments and ratifies the fair value determinations of the Committee.
The Fund categorizes the inputs to valuation techniques used to value its investments into a disclosure hierarchy consisting of three levels as shown below:
- Level 1 – quoted prices in active markets for identical investments
- Level 2 – other significant observable inputs (including quoted prices for similar investments, interest rates, prepayment speeds, etc.)
- Level 3 – unobservable inputs (including the Fund's own assumptions based on the best information available)
Valuation techniques used to value the Fund's investments by major category are as follows:
Equity securities, including restricted securities, for which market quotations are readily available, are valued at the last reported sale price or official closing price as reported by a third party pricing vendor on the primary market or exchange on which they are traded and are categorized as Level 1 in the hierarchy. In the event there were no sales during the day or closing prices are not available, securities are valued at the last quoted bid price or may be valued using the last available price and are generally categorized as Level 2 in the hierarchy. For foreign equity securities, when market or security specific events arise, comparisons to the valuation of American Depositary Receipts (ADRs), futures contracts, Exchange-Traded Funds (ETFs) and certain indexes as well as quoted prices for similar securities may be used and would be categorized as Level 2 in the hierarchy. Utilizing these techniques may result in transfers between Level 1 and Level 2. For equity securities, including restricted securities, where observable inputs are limited, assumptions about market activity and risk are used and these securities may be categorized as Level 3 in the hierarchy.
Debt securities, including restricted securities, are valued based on evaluated prices received from third party pricing vendors or from brokers who make markets in such securities. U.S. government and government agency obligations are valued by pricing vendors who utilize matrix pricing which considers yield or price of bonds of comparable quality, coupon, maturity and type or by broker-supplied prices. When independent prices are unavailable or unreliable, debt securities may be valued utilizing pricing methodologies which consider similar factors that would be used by third party pricing vendors. Debt securities are generally categorized as Level 2 in the hierarchy but may be Level 3 depending on the circumstances.
Futures contracts are valued at the settlement price established each day by the board of trade or exchange on which they are traded and are categorized as Level 1 in the hierarchy. Investments in open-end mutual funds, including the Fidelity Central Funds, are valued at their closing net asset value (NAV) each business day and are categorized as Level 1 in the hierarchy.
Changes in valuation techniques may result in transfers in or out of an assigned level within the disclosure hierarchy. The aggregate value of investments by input level as of May 31, 2017, including information on transfers between Levels 1 and 2, is included at the end of the Fund's Schedule of Investments.
Foreign Currency. The Fund may use foreign currency contracts to facilitate transactions in foreign-denominated securities. Gains and losses from these transactions may arise from changes in the value of the foreign currency or if the counterparties do not perform under the contracts' terms.
Foreign-denominated assets, including investment securities, and liabilities are translated into U.S. dollars at the exchange rates at period end. Purchases and sales of investment securities, income and dividends received and expenses denominated in foreign currencies are translated into U.S. dollars at the exchange rate in effect on the transaction date.
The effects of exchange rate fluctuations on investments are included with the net realized and unrealized gain (loss) on investment securities. Other foreign currency transactions resulting in realized and unrealized gain (loss) are disclosed separately.
Investment Transactions and Income. For financial reporting purposes, the Fund's investment holdings and NAV include trades executed through the end of the last business day of the period. The NAV per share for processing shareholder transactions is calculated as of the close of business of the New York Stock Exchange (NYSE), normally 4:00 p.m. Eastern time and includes trades executed through the end of the prior business day. Gains and losses on securities sold are determined on the basis of identified cost. Dividend income is recorded on the ex-dividend date, except for certain dividends from foreign securities where the ex-dividend date may have passed, which are recorded as soon as the Fund is informed of the ex-dividend date. Non-cash dividends included in dividend income, if any, are recorded at the fair market value of the securities received. Income and capital gain distributions from Fidelity Central Funds, if any, are recorded on the ex-dividend date. Certain distributions received by the Fund represent a return of capital or capital gain. The Fund determines the components of these distributions subsequent to the ex-dividend date, based upon receipt of tax filings or other correspondence relating to the underlying investment. These distributions are recorded as a reduction of cost of investments and/or as a realized gain. Interest income is accrued as earned and includes coupon interest and amortization of premium and accretion of discount on debt securities as applicable. Investment income is recorded net of foreign taxes withheld where recovery of such taxes is uncertain.
Expenses. Expenses directly attributable to a fund are charged to that fund. Expenses attributable to more than one fund are allocated among the respective funds on the basis of relative net assets or other appropriate methods. Expense estimates are accrued in the period to which they relate and adjustments are made when actual amounts are known.
Income Tax Information and Distributions to Shareholders. Each year, the Fund intends to qualify as a regulated investment company under Subchapter M of the Internal Revenue Code, including distributing substantially all of its taxable income and realized gains. As a result, no provision for U.S. Federal income taxes is required. The Fund files a U.S. federal tax return, in addition to state and local tax returns as required. The Fund's federal income tax returns are subject to examination by the Internal Revenue Service (IRS) for a period of three fiscal years after they are filed. State and local tax returns may be subject to examination for an additional fiscal year depending on the jurisdiction. Foreign taxes are provided for based on the Fund's understanding of the tax rules and rates that exist in the foreign markets in which it invests.
Distributions are declared and recorded on the ex-dividend date. Income and capital gain distributions are determined in accordance with income tax regulations, which may differ from GAAP.
Capital accounts within the financial statements are adjusted for permanent book-tax differences. These adjustments have no impact on net assets or the results of operations. Capital accounts are not adjusted for temporary book-tax differences which will reverse in a subsequent period.
Book-tax differences are primarily due to futures contracts, foreign currency transactions, market discount, partnerships, capital loss carryforwards and losses deferred due to wash sales.
The federal tax cost of investment securities and unrealized appreciation (depreciation) as of period end were as follows:
| Gross unrealized appreciation | $77,510,000 |
| Gross unrealized depreciation | (7,734,241) |
| Net unrealized appreciation (depreciation) on securities | $69,775,759 |
| Tax cost | $399,514,862 |
Capital loss carryforwards are only available to offset future capital gains of the Fund to the extent provided by regulations and may be limited. Under the Regulated Investment Company Modernization Act of 2010 (the Act), the Fund is permitted to carry forward capital losses incurred in taxable years beginning after December 22, 2010 for an unlimited period and such capital losses are required to be used prior to any losses that expire. The capital loss carryforward information presented below, including any applicable limitation, is estimated as of prior fiscal period end and is subject to adjustment.
| No expiration | |
| Short-term | $(6,074,982) |
| Long-term | (9,243,346) |
| Total capital loss carryforward | $(15,318,328) |
4. Derivative Instruments.
Risk Exposures and the Use of Derivative Instruments. The Fund's investment objective allows the Fund to enter into various types of derivative contracts, including futures contracts. Derivatives are investments whose value is primarily derived from underlying assets, indices or reference rates and may be transacted on an exchange or over-the-counter (OTC). Derivatives may involve a future commitment to buy or sell a specified asset based on specified terms, to exchange future cash flows at periodic intervals based on a notional principal amount, or for one party to make one or more payments upon the occurrence of specified events in exchange for periodic payments from the other party.
The Fund used derivatives to increase returns and to manage exposure to certain risks as defined below. The success of any strategy involving derivatives depends on analysis of numerous economic factors, and if the strategies for investment do not work as intended, the Fund may not achieve its objectives.
The Fund's use of derivatives increased or decreased its exposure to the following risk:
| Equity Risk | Equity risk relates to the fluctuations in the value of financial instruments as a result of changes in market prices (other than those arising from interest rate risk or foreign exchange risk), whether caused by factors specific to an individual investment, its issuer, or all factors affecting all instruments traded in a market or market segment. |
The Fund is also exposed to additional risks from investing in derivatives, such as liquidity risk and counterparty credit risk. Liquidity risk is the risk that the Fund will be unable to close out the derivative in the open market in a timely manner. Counterparty credit risk is the risk that the counterparty will not be able to fulfill its obligation to the Fund. Counterparty credit risk related to exchange-traded futures contracts may be mitigated by the protection provided by the exchange on which they trade.
Investing in derivatives may involve greater risks than investing in the underlying assets directly and, to varying degrees, may involve risk of loss in excess of any initial investment and collateral received and amounts recognized in the Statement of Assets and Liabilities. In addition, there may be the risk that the change in value of the derivative contract does not correspond to the change in value of the underlying instrument.
Futures Contracts. A futures contract is an agreement between two parties to buy or sell a specified underlying instrument for a fixed price at a specified future date. The Fund used futures contracts to manage its exposure to the stock market.
Upon entering into a futures contract, a fund is required to deposit either cash or securities (initial margin) with a clearing broker in an amount equal to a certain percentage of the face value of the contract. Futures contracts are marked-to-market daily and subsequent daily payments (variation margin) are made or received by a fund depending on the daily fluctuations in the value of the futures contracts and are recorded as unrealized appreciation or (depreciation). This receivable and/or payable, if any, is included in daily variation margin for derivative instruments in the Statement of Assets and Liabilities. Realized gain or (loss) is recorded upon the expiration or closing of a futures contract.
Any open futures contracts at period end are presented in the Schedule of Investments under the caption "Futures Contracts". The underlying face amount at value reflects each contract's exposure to the underlying instrument or index at period end. Securities deposited to meet initial margin requirements are identified in the Schedule of Investments.
During the period the Fund recognized net realized gain (loss) of $2,302,520 and a change in net unrealized appreciation (depreciation) of $(1,206,990) related to its investment in futures contracts. These amounts are included in the Statement of Operations.
5. Purchases and Sales of Investments.
Purchases and sales of securities, other than short-term securities, aggregated $167,587,840 and $205,317,399, respectively.
6. Fees and Other Transactions with Affiliates.
Management Fee. Fidelity Management & Research Company (the investment adviser) and its affiliates provide the Fund with investment management related services for which the Fund pays a monthly management fee. The management fee is the sum of an individual fund fee rate that is based on an annual rate of .45% of the Fund's average net assets and an annualized group fee rate that averaged .25% during the period. The group fee rate is based upon the average net assets of all the mutual funds advised by the investment adviser, including any mutual funds previously advised by the investment adviser that are currently advised by Fidelity SelectCo, LLC, an affiliate of the investment adviser. The group fee rate decreases as assets under management increase and increases as assets under management decrease. In addition, the management fee is subject to a performance adjustment (up to a maximum of +/- .20% of the Fund's average net assets over a 36 month performance period). The upward or downward adjustment to the management fee is based on the Fund's relative investment performance as compared to its benchmark index, the Russell 2000 Index, over the same 36 month performance period. For the reporting period, the total annualized management fee rate, including the performance adjustment, was .57% of the Fund's average net assets. The performance adjustment included in the management fee rate may be higher or lower than the maximum performance adjustment rate due to the difference between the average net assets for the reporting and performance periods.
The Board and shareholders approved a new management contract, effective June 1, 2017. Under the management contract, the Fund will not pay a management fee. In addition, the investment adviser will pay all ordinary operating expenses of the Fund, except custody fees, fees and expenses of the independent Trustees, and certain miscellaneous expenses such as proxy and shareholder meeting expenses.
Transfer Agent Fees. Fidelity Investments Institutional Operations Company, Inc. (FIIOC), an affiliate of the investment adviser, is the Fund's transfer, dividend disbursing and shareholder servicing agent. FIIOC receives account fees and asset-based fees that vary according to account size and type of account. FIIOC pays for typesetting, printing and mailing of shareholder reports, except proxy statements. For the period, the transfer agent fees were equivalent to an annualized rate of .17% of average net assets.
Accounting and Security Lending Fees. Fidelity Service Company, Inc. (FSC), an affiliate of the investment adviser, maintains the Fund's accounting records. The accounting fee is based on the level of average net assets for each month. Under a separate contract, FSC administers the security lending program. The security lending fee is based on the number and duration of lending transactions.
Brokerage Commissions. The Fund placed a portion of its portfolio transactions with brokerage firms which are affiliates of the investment adviser. Brokerage commissions are included in net realized gain (loss) and change in net unrealized appreciation (depreciation) in the Statement of Operations. The commissions paid to these affiliated firms were $8,117 for the period.
Interfund Trades. The Fund may purchase from or sell securities to other Fidelity Funds under procedures adopted by the Board. The procedures have been designed to ensure these interfund trades are executed in accordance with Rule 17a-7 of the 1940 Act. Interfund trades are included within the respective purchases and sales amounts shown in the Purchases and Sales of Investments note.
7. Committed Line of Credit.
The Fund participates with other funds managed by the investment adviser or an affiliate in a $4.25 billion credit facility (the "line of credit") to be utilized for temporary or emergency purposes to fund shareholder redemptions or for other short-term liquidity purposes. The Fund has agreed to pay commitment fees on its pro-rata portion of the line of credit, which amounted to $779 and is reflected in Miscellaneous expenses on the Statement of Operations. During the period, the Fund did not borrow on this line of credit.
8. Security Lending.
The Fund lends portfolio securities through a lending agent from time to time in order to earn additional income. For equity securities, a lending agent is used and may loan securities to certain qualified borrowers, including Fidelity Capital Markets (FCM), a broker-dealer affiliated with the Fund. On the settlement date of the loan, the Fund receives collateral (in the form of U.S. Treasury obligations, letters of credit and/or cash) against the loaned securities and maintains collateral in an amount not less than 100% of the market value of the loaned securities during the period of the loan. The market value of the loaned securities is determined at the close of business of the Fund and any additional required collateral is delivered to the Fund on the next business day. The Fund or borrower may terminate the loan at any time, and if the borrower defaults on its obligation to return the securities loaned because of insolvency or other reasons, the Fund may apply collateral received from the borrower against the obligation. The Fund may experience delays and costs in recovering the securities loaned. Any cash collateral received is invested in the Fidelity Securities Lending Cash Central Fund. The value of loaned securities and cash collateral at period end are disclosed on the Fund's Statement of Assets and Liabilities. Security lending income represents the income earned on investing cash collateral, less rebates paid to borrowers and any lending agent fees associated with the loan, plus any premium payments received for lending certain types of securities. Security lending income is presented in the Statement of Operations as a component of income from Fidelity Central Funds. Total security lending income during the period amounted to $65,870. During the period, there were no securities loaned to FCM.
9. Expense Reductions.
Commissions paid to certain brokers with whom the investment adviser, or its affiliates, places trades on behalf of the Fund include an amount in addition to trade execution, which may be rebated back to the Fund to offset certain expenses. This amount totaled $19,620 for the period.
In addition, during the period the investment adviser reimbursed and/or waived a portion of the operating expenses in the amount of $2,064.
Effective June 1, 2017, the investment adviser will contractually reimburse expenses of the Fund to the extent annual operating expenses exceed .014% of average net assets. Fees and expenses of the independent Trustees and certain miscellaneous expenses such as proxy and shareholder meeting expenses will be excluded from this reimbursement.
10. Other.
The Fund's organizational documents provide former and current trustees and officers with a limited indemnification against liabilities arising in connection with the performance of their duties to the Fund. In the normal course of business, the Fund may also enter into contracts that provide general indemnifications. The Fund's maximum exposure under these arrangements is unknown as this would be dependent on future claims that may be made against the Fund. The risk of material loss from such claims is considered remote.
At the end of the period, mutual funds managed by the investment adviser or its affiliates were the owners of record of all of the outstanding shares of the Fund.
Shareholder Expense Example
As a shareholder of the Fund, you incur two types of costs: (1) transaction costs and (2) ongoing costs, including management fees and other Fund expenses. This Example is intended to help you understand your ongoing costs (in dollars) of investing in the Fund and to compare these costs with the ongoing costs of investing in other mutual funds.
The Example is based on an investment of $1,000 invested at the beginning of the period and held for the entire period (December 1, 2016 to May 31, 2017).
Actual Expenses
The first line of the accompanying table provides information about actual account values and actual expenses. You may use the information in this line, together with the amount you invested, to estimate the expenses that you paid over the period. Simply divide your account value by $1,000.00 (for example, an $8,600 account value divided by $1,000.00 = 8.6), then multiply the result by the number in the first line under the heading entitled "Expenses Paid During Period" to estimate the expenses you paid on your account during this period. In addition, the Fund, as a shareholder in the underlying Fidelity Central Funds, will indirectly bear its pro-rata share of the fees and expenses incurred by the underlying Fidelity Central Funds. These fees and expenses are not included in the Fund's annualized expense ratio used to calculate the expense estimate in the table below.
Hypothetical Example for Comparison Purposes
The second line of the accompanying table provides information about hypothetical account values and hypothetical expenses based on the Fund's actual expense ratio and an assumed rate of return of 5% per year before expenses, which is not the Fund's actual return. The hypothetical account values and expenses may not be used to estimate the actual ending account balance or expenses you paid for the period. You may use this information to compare the ongoing costs of investing in the Fund and other funds. To do so, compare this 5% hypothetical example with the 5% hypothetical examples that appear in the shareholder reports of the other funds. In addition, the Fund, as a shareholder in the underlying Fidelity Central Funds, will indirectly bear its pro-rata share of the fees and expenses incurred by the underlying Fidelity Central Funds. These fees and expenses are not included in the Fund's annualized expense ratio used to calculate the expense estimate in the table below.
Please note that the expenses shown in the table are meant to highlight your ongoing costs only and do not reflect any transaction costs. Therefore, the second line of the table is useful in comparing ongoing costs only, and will not help you determine the relative total costs of owning different funds.
| Annualized Expense Ratio-A | Beginning Account Value December 1, 2016 | Ending Account Value May 31, 2017 | Expenses Paid During Period-B December 1, 2016 to May 31, 2017 | |
| Actual | .81% | $1,000.00 | $1,063.00 | $4.17-C |
| Hypothetical-D | $1,000.00 | $1,020.89 | $4.08-C |
A Annualized expense ratio reflects expenses net of applicable fee waivers.
B Expenses are equal to the Fund's annualized expense ratio, multiplied by the average account value over the period, multiplied by 182/365 (to reflect the one-half year period).
C If fees and changes to the Fund's expense contract and/ or expense cap, effective June 1, 2017, had been in effect during the current period, the restated annualized expense ratio would have been .01% and the expenses paid in the actual and hypothetical examples above would have been $.05 and $.05, respectively.
D 5% return per year before expenses
![]()
Corporate Headquarters
245 Summer St.
Boston, MA 02210
www.fidelity.com
AXS5-SANN-0717
1.967944.103
Fidelity Advisor® Equity Growth Fund Semi-Annual Report May 31, 2017 |
|
Contents
To view a fund's proxy voting guidelines and proxy voting record for the 12-month period ended June 30, visit http://www.fidelity.com/proxyvotingresults or visit the Securities and Exchange Commission's (SEC) web site at http://www.sec.gov.
You may also call 1-877-208-0098 to request a free copy of the proxy voting guidelines.
Standard & Poor's, S&P and S&P 500 are registered service marks of The McGraw-Hill Companies, Inc. and have been licensed for use by Fidelity Distributors Corporation.
Other third-party marks appearing herein are the property of their respective owners.
All other marks appearing herein are registered or unregistered trademarks or service marks of FMR LLC or an affiliated company. © 2017 FMR LLC. All rights reserved.
This report and the financial statements contained herein are submitted for the general information of the shareholders of the Fund. This report is not authorized for distribution to prospective investors in the Fund unless preceded or accompanied by an effective prospectus.
A fund files its complete schedule of portfolio holdings with the SEC for the first and third quarters of each fiscal year on Form N-Q. Forms N-Q are available on the SEC’s web site at http://www.sec.gov. A fund's Forms N-Q may be reviewed and copied at the SEC’s Public Reference Room in Washington, DC. Information regarding the operation of the SEC's Public Reference Room may be obtained by calling 1-800-SEC-0330.
For a complete list of a fund's portfolio holdings, view the most recent holdings listing, semiannual report, or annual report on Fidelity's web site at http://www.fidelity.com, http://www.institutional.fidelity.com, or http://www.401k.com, as applicable.
NOT FDIC INSURED •MAY LOSE VALUE •NO BANK GUARANTEE
Neither the Fund nor Fidelity Distributors Corporation is a bank.
Investment Summary (Unaudited)
Top Ten Stocks as of May 31, 2017
| % of fund's net assets | % of fund's net assets 6 months ago | |
| Facebook, Inc. Class A | 6.8 | 9.2 |
| Alphabet, Inc. Class A | 6.2 | 6.2 |
| Amazon.com, Inc. | 4.3 | 3.9 |
| Charter Communications, Inc. Class A | 3.1 | 2.9 |
| Apple, Inc. | 3.0 | 3.1 |
| Home Depot, Inc. | 2.7 | 2.6 |
| Electronic Arts, Inc. | 2.4 | 3.1 |
| Adobe Systems, Inc. | 1.9 | 1.5 |
| Global Payments, Inc. | 1.9 | 1.7 |
| American Tower Corp. | 1.7 | 1.4 |
| 34.0 |
Top Five Market Sectors as of May 31, 2017
| % of fund's net assets | % of fund's net assets 6 months ago | |
| Information Technology | 41.1 | 38.5 |
| Consumer Discretionary | 16.2 | 18.1 |
| Health Care | 11.2 | 13.9 |
| Consumer Staples | 7.6 | 8.5 |
| Industrials | 7.4 | 7.2 |
Asset Allocation (% of fund's net assets)
| As of May 31, 2017* | ||
| Stocks | 96.8% | |
| Convertible Securities | 0.9% | |
| Short-Term Investments and Net Other Assets (Liabilities) | 2.3% | |

* Foreign investments - 10.8%
| As of November 30, 2016* | ||
| Stocks and Equity Futures | 97.9% | |
| Convertible Securities | 1.1% | |
| Short-Term Investments and Net Other Assets (Liabilities) | 1.0% | |

* Foreign investments - 7.4%
Investments May 31, 2017 (Unaudited)
Showing Percentage of Net Assets
| Common Stocks - 96.8% | |||
| Shares | Value (000s) | ||
| CONSUMER DISCRETIONARY - 16.2% | |||
| Automobiles - 0.8% | |||
| Tesla, Inc. (a) | 71,100 | $24,246 | |
| Diversified Consumer Services - 0.5% | |||
| Grand Canyon Education, Inc. (a) | 189,800 | 14,880 | |
| Hotels, Restaurants & Leisure - 1.6% | |||
| Dave & Buster's Entertainment, Inc. (a) | 387,800 | 25,866 | |
| Starbucks Corp. | 250,302 | 15,922 | |
| Wingstop, Inc. | 149,500 | 4,262 | |
| 46,050 | |||
| Household Durables - 0.1% | |||
| Gree Electric Appliances, Inc. of Zhuhai Class A | 316,300 | 1,583 | |
| SodaStream International Ltd. (a) | 4,900 | 260 | |
| 1,843 | |||
| Internet & Direct Marketing Retail - 5.8% | |||
| Amazon.com, Inc. (a) | 127,400 | 126,715 | |
| Ctrip.com International Ltd. ADR (a) | 405,800 | 22,177 | |
| Netflix, Inc. (a) | 82,300 | 13,421 | |
| NutriSystem, Inc. | 122,400 | 6,371 | |
| 168,684 | |||
| Leisure Products - 0.0% | |||
| NJOY, Inc. (a)(b) | 202,642 | 0 | |
| Media - 3.7% | |||
| Charter Communications, Inc. Class A (a) | 264,300 | 91,329 | |
| Cinemark Holdings, Inc. | 135,700 | 5,370 | |
| Sirius XM Holdings, Inc. (c) | 2,236,900 | 11,744 | |
| 108,443 | |||
| Multiline Retail - 0.6% | |||
| Dollar Tree, Inc. (a) | 100,000 | 7,770 | |
| Ollie's Bargain Outlet Holdings, Inc. (a) | 211,800 | 8,716 | |
| 16,486 | |||
| Specialty Retail - 2.7% | |||
| Five Below, Inc. (a) | 5,700 | 292 | |
| Home Depot, Inc. | 511,944 | 78,589 | |
| 78,881 | |||
| Textiles, Apparel & Luxury Goods - 0.4% | |||
| Canada Goose Holdings, Inc. (c) | 5,800 | 105 | |
| Kering SA | 4,500 | 1,488 | |
| LVMH Moet Hennessy - Louis Vuitton SA | 40,002 | 10,225 | |
| 11,818 | |||
| TOTAL CONSUMER DISCRETIONARY | 471,331 | ||
| CONSUMER STAPLES - 7.6% | |||
| Beverages - 2.8% | |||
| Anheuser-Busch InBev SA NV ADR | 111,000 | 12,981 | |
| Constellation Brands, Inc. Class A (sub. vtg.) | 44,300 | 8,096 | |
| Kweichow Moutai Co. Ltd. (A Shares) | 87,813 | 5,712 | |
| PepsiCo, Inc. | 123,000 | 14,375 | |
| Pernod Ricard SA ADR | 241,700 | 6,574 | |
| The Coca-Cola Co. | 720,726 | 32,771 | |
| 80,509 | |||
| Food & Staples Retailing - 0.6% | |||
| Costco Wholesale Corp. | 104,800 | 18,909 | |
| Food Products - 0.5% | |||
| Danone SA (c) | 187,200 | 13,914 | |
| Hostess Brands, Inc. Class A (a) | 57,100 | 899 | |
| 14,813 | |||
| Personal Products - 2.8% | |||
| Coty, Inc. Class A | 311,000 | 5,890 | |
| Estee Lauder Companies, Inc. Class A | 174,700 | 16,446 | |
| Herbalife Ltd. (a)(c) | 504,700 | 36,227 | |
| Unilever NV (NY Reg.) | 406,000 | 23,053 | |
| 81,616 | |||
| Tobacco - 0.9% | |||
| British American Tobacco PLC sponsored ADR | 351,381 | 25,342 | |
| TOTAL CONSUMER STAPLES | 221,189 | ||
| ENERGY - 1.4% | |||
| Energy Equipment & Services - 0.3% | |||
| Baker Hughes, Inc. | 165,900 | 9,149 | |
| Oil, Gas & Consumable Fuels - 1.1% | |||
| Cheniere Energy, Inc. (a) | 350,966 | 17,099 | |
| Golar LNG Ltd. | 190,848 | 4,440 | |
| Reliance Industries Ltd. (a) | 538,573 | 11,193 | |
| 32,732 | |||
| TOTAL ENERGY | 41,881 | ||
| FINANCIALS - 7.3% | |||
| Banks - 2.7% | |||
| Citigroup, Inc. | 112,600 | 6,817 | |
| First Republic Bank | 299,100 | 27,547 | |
| HDFC Bank Ltd. | 68,446 | 1,754 | |
| JPMorgan Chase & Co. | 464,600 | 38,167 | |
| Metro Bank PLC (a) | 50,300 | 2,398 | |
| 76,683 | |||
| Capital Markets - 3.9% | |||
| BlackRock, Inc. Class A | 20,500 | 8,389 | |
| CBOE Holdings, Inc. | 22,454 | 1,939 | |
| Charles Schwab Corp. | 213,500 | 8,273 | |
| CME Group, Inc. | 327,054 | 38,360 | |
| Goldman Sachs Group, Inc. | 33,200 | 7,014 | |
| JMP Group, Inc. | 141,100 | 765 | |
| MSCI, Inc. | 140,300 | 14,273 | |
| S&P Global, Inc. | 134,275 | 19,176 | |
| The Blackstone Group LP | 475,400 | 15,631 | |
| 113,820 | |||
| Diversified Financial Services - 0.4% | |||
| Berkshire Hathaway, Inc. Class B (a) | 55,800 | 9,223 | |
| Bioverativ, Inc. | 10,100 | 556 | |
| Quantenna Communications, Inc. (c) | 150,000 | 2,868 | |
| 12,647 | |||
| Thrifts & Mortgage Finance - 0.3% | |||
| Essent Group Ltd. (a) | 229,300 | 8,317 | |
| TOTAL FINANCIALS | 211,467 | ||
| HEALTH CARE - 11.2% | |||
| Biotechnology - 5.3% | |||
| Advanced Accelerator Applications SA sponsored ADR (a) | 102,800 | 3,884 | |
| Alexion Pharmaceuticals, Inc. (a) | 106,700 | 10,460 | |
| Amgen, Inc. | 274,100 | 42,551 | |
| Biogen, Inc. (a) | 20,200 | 5,005 | |
| BioMarin Pharmaceutical, Inc. (a) | 159,679 | 13,994 | |
| Cytokinetics, Inc. (a) | 169,810 | 2,301 | |
| Insmed, Inc. (a) | 712,520 | 10,987 | |
| Regeneron Pharmaceuticals, Inc. (a) | 32,000 | 14,690 | |
| Samsung Biologics Co. Ltd. | 2,090 | 411 | |
| TESARO, Inc. (a) | 108,000 | 16,125 | |
| Vertex Pharmaceuticals, Inc. (a) | 270,964 | 33,491 | |
| 153,899 | |||
| Health Care Equipment & Supplies - 4.3% | |||
| Boston Scientific Corp. (a) | 1,357,300 | 36,688 | |
| Danaher Corp. | 286,814 | 24,362 | |
| DexCom, Inc. (a) | 30,800 | 2,059 | |
| Intuitive Surgical, Inc. (a) | 34,400 | 31,465 | |
| Medtronic PLC | 175,300 | 14,774 | |
| Novadaq Technologies, Inc. (a) | 889,100 | 6,144 | |
| ResMed, Inc. | 98,000 | 6,968 | |
| The Cooper Companies, Inc. | 14,800 | 3,238 | |
| 125,698 | |||
| Health Care Providers & Services - 0.8% | |||
| Henry Schein, Inc. (a) | 25,900 | 4,765 | |
| UnitedHealth Group, Inc. | 96,300 | 16,870 | |
| 21,635 | |||
| Pharmaceuticals - 0.8% | |||
| Allergan PLC | 53,100 | 11,881 | |
| Zoetis, Inc. Class A | 192,100 | 11,964 | |
| 23,845 | |||
| TOTAL HEALTH CARE | 325,077 | ||
| INDUSTRIALS - 7.4% | |||
| Aerospace & Defense - 1.0% | |||
| Axon Enterprise, Inc. (a)(c) | 822,634 | 19,751 | |
| TransDigm Group, Inc. | 33,377 | 8,948 | |
| 28,699 | |||
| Airlines - 0.3% | |||
| Ryanair Holdings PLC sponsored ADR (a) | 75,060 | 8,012 | |
| Commercial Services & Supplies - 0.5% | |||
| KAR Auction Services, Inc. | 356,600 | 15,537 | |
| Electrical Equipment - 1.9% | |||
| AMETEK, Inc. | 430,600 | 26,275 | |
| Fortive Corp. | 467,407 | 29,190 | |
| 55,465 | |||
| Industrial Conglomerates - 0.4% | |||
| Roper Technologies, Inc. | 49,569 | 11,262 | |
| Machinery - 1.1% | |||
| Allison Transmission Holdings, Inc. | 751,100 | 29,083 | |
| Rational AG | 3,600 | 1,943 | |
| 31,026 | |||
| Professional Services - 2.1% | |||
| Equifax, Inc. | 127,000 | 17,374 | |
| IHS Markit Ltd. (a) | 515,400 | 23,631 | |
| Robert Half International, Inc. | 173,600 | 8,071 | |
| TransUnion Holding Co., Inc. (a) | 317,300 | 13,869 | |
| 62,945 | |||
| Trading Companies & Distributors - 0.1% | |||
| MSC Industrial Direct Co., Inc. Class A | 38,900 | 3,265 | |
| TOTAL INDUSTRIALS | 216,211 | ||
| INFORMATION TECHNOLOGY - 40.2% | |||
| Electronic Equipment & Components - 0.2% | |||
| CDW Corp. | 100,000 | 6,018 | |
| Internet Software & Services - 16.6% | |||
| Alphabet, Inc. Class A (a) | 182,750 | 180,391 | |
| CommerceHub, Inc.: | |||
| Series A (a) | 377,849 | 6,431 | |
| Series C (a) | 328,060 | 5,636 | |
| Facebook, Inc. Class A (a) | 1,306,700 | 197,907 | |
| GoDaddy, Inc. (a) | 331,300 | 13,630 | |
| Just Dial Ltd. (a) | 139,013 | 965 | |
| NetEase, Inc. ADR | 27,200 | 7,746 | |
| Shopify, Inc. Class A (a) | 40,800 | 3,748 | |
| Stamps.com, Inc. (a)(c) | 181,100 | 24,974 | |
| Tencent Holdings Ltd. | 715,600 | 24,593 | |
| VeriSign, Inc. (a)(c) | 168,500 | 15,192 | |
| 481,213 | |||
| IT Services - 8.2% | |||
| Cognizant Technology Solutions Corp. Class A | 448,198 | 29,989 | |
| Fidelity National Information Services, Inc. | 102,600 | 8,810 | |
| FleetCor Technologies, Inc. (a) | 31,400 | 4,531 | |
| Global Payments, Inc. | 609,300 | 55,818 | |
| MasterCard, Inc. Class A | 121,900 | 14,979 | |
| PayPal Holdings, Inc. (a) | 768,500 | 40,123 | |
| Square, Inc. (a) | 1,155,800 | 26,572 | |
| Vantiv, Inc. (a) | 156,500 | 9,816 | |
| Visa, Inc. Class A | 497,732 | 47,399 | |
| 238,037 | |||
| Semiconductors & Semiconductor Equipment - 2.0% | |||
| ASML Holding NV | 74,200 | 9,794 | |
| Maxim Integrated Products, Inc. | 273,828 | 13,089 | |
| Monolithic Power Systems, Inc. | 124,232 | 12,200 | |
| Qualcomm, Inc. | 401,400 | 22,988 | |
| 58,071 | |||
| Software - 10.2% | |||
| Activision Blizzard, Inc. | 276,500 | 16,197 | |
| Adobe Systems, Inc. (a) | 395,100 | 56,049 | |
| Autodesk, Inc. (a) | 391,900 | 43,803 | |
| Blackbaud, Inc. | 41,000 | 3,392 | |
| Computer Modelling Group Ltd. | 541,600 | 4,102 | |
| CyberArk Software Ltd. (a) | 53,100 | 2,602 | |
| Electronic Arts, Inc. (a) | 618,145 | 70,054 | |
| Intuit, Inc. | 11,300 | 1,589 | |
| Microsoft Corp. | 424,500 | 29,647 | |
| Parametric Technology Corp. (a) | 102,900 | 5,925 | |
| Red Hat, Inc. (a) | 122,500 | 10,972 | |
| Salesforce.com, Inc. (a) | 419,792 | 37,630 | |
| Snap, Inc. Class A (a)(c) | 701,900 | 14,887 | |
| 296,849 | |||
| Technology Hardware, Storage & Peripherals - 3.0% | |||
| Apple, Inc. | 577,800 | 88,265 | |
| TOTAL INFORMATION TECHNOLOGY | 1,168,453 | ||
| MATERIALS - 1.7% | |||
| Chemicals - 1.0% | |||
| CF Industries Holdings, Inc. | 2,600 | 70 | |
| Sherwin-Williams Co. | 44,000 | 14,598 | |
| The Chemours Co. LLC | 332,700 | 13,305 | |
| 27,973 | |||
| Construction Materials - 0.7% | |||
| Eagle Materials, Inc. | 177,200 | 16,710 | |
| Summit Materials, Inc. | 162,800 | 4,373 | |
| 21,083 | |||
| TOTAL MATERIALS | 49,056 | ||
| REAL ESTATE - 3.8% | |||
| Equity Real Estate Investment Trusts (REITs) - 2.2% | |||
| American Tower Corp. | 366,800 | 48,120 | |
| Equinix, Inc. | 18,500 | 8,159 | |
| SBA Communications Corp. Class A (a) | 53,500 | 7,393 | |
| 63,672 | |||
| Real Estate Management & Development - 1.6% | |||
| Realogy Holdings Corp. | 1,547,818 | 47,147 | |
| TOTAL REAL ESTATE | 110,819 | ||
| TOTAL COMMON STOCKS | |||
| (Cost $2,054,195) | 2,815,484 | ||
| Convertible Preferred Stocks - 0.9% | |||
| CONSUMER DISCRETIONARY - 0.0% | |||
| Household Durables - 0.0% | |||
| Blu Homes, Inc. Series A, 5.00% (a)(b) | 875,350 | 9 | |
| INFORMATION TECHNOLOGY - 0.9% | |||
| Internet Software & Services - 0.8% | |||
| Uber Technologies, Inc. Series D, 8.00% (a)(b) | 485,012 | 23,655 | |
| IT Services - 0.1% | |||
| AppNexus, Inc. Series E (a)(b) | 105,425 | 3,516 | |
| TOTAL INFORMATION TECHNOLOGY | 27,171 | ||
| TOTAL CONVERTIBLE PREFERRED STOCKS | |||
| (Cost $13,680) | 27,180 | ||
| Money Market Funds - 4.0% | |||
| Fidelity Cash Central Fund, 0.86% (d) | 39,898,718 | 39,907 | |
| Fidelity Securities Lending Cash Central Fund 0.87% (d)(e) | 74,596,932 | 74,604 | |
| TOTAL MONEY MARKET FUNDS | |||
| (Cost $114,511) | 114,511 | ||
| TOTAL INVESTMENT PORTFOLIO - 101.7% | |||
| (Cost $2,182,386) | 2,957,175 | ||
| NET OTHER ASSETS (LIABILITIES) - (1.7)% | (48,052) | ||
| NET ASSETS - 100% | $2,909,123 |
Values shown as $0 may reflect amounts less than $500.
Legend
(a) Non-income producing
(b) Restricted securities - Investment in securities not registered under the Securities Act of 1933 (excluding 144A issues). At the end of the period, the value of restricted securities (excluding 144A issues) amounted to $27,180,000 or 0.9% of net assets.
(c) Security or a portion of the security is on loan at period end.
(d) Affiliated fund that is generally available only to investment companies and other accounts managed by Fidelity Investments. The rate quoted is the annualized seven-day yield of the fund at period end. A complete unaudited listing of the fund's holdings as of its most recent quarter end is available upon request. In addition, each Fidelity Central Fund's financial statements are available on the SEC's website or upon request.
(e) Investment made with cash collateral received from securities on loan.
Additional information on each restricted holding is as follows:
| Security | Acquisition Date | Acquisition Cost (000s) |
| AppNexus, Inc. Series E | 8/1/14 | $2,112 |
| Blu Homes, Inc. Series A, 5.00% | 6/21/13 | $4,044 |
| NJOY, Inc. | 9/11/13 | $1,637 |
| Uber Technologies, Inc. Series D, 8.00% | 6/6/14 | $7,524 |
Affiliated Central Funds
Information regarding fiscal year to date income earned by the Fund from investments in Fidelity Central Funds is as follows:
| Fund | Income earned |
| (Amounts in thousands) | |
| Fidelity Cash Central Fund | $185 |
| Fidelity Securities Lending Cash Central Fund | 411 |
| Total | $596 |
Investment Valuation
The following is a summary of the inputs used, as of May 31, 2017, involving the Fund's assets and liabilities carried at fair value. The inputs or methodology used for valuing securities may not be an indication of the risk associated with investing in those securities. For more information on valuation inputs, and their aggregation into the levels used below, please refer to the Investment Valuation section in the accompanying Notes to Financial Statements.
| Valuation Inputs at Reporting Date: | ||||
| Description | Total | Level 1 | Level 2 | Level 3 |
| (Amounts in thousands) | ||||
| Investments in Securities: | ||||
| Equities: | ||||
| Consumer Discretionary | $471,340 | $461,106 | $10,225 | $9 |
| Consumer Staples | 221,189 | 207,275 | 13,914 | -- |
| Energy | 41,881 | 41,881 | -- | -- |
| Financials | 211,467 | 209,713 | 1,754 | -- |
| Health Care | 325,077 | 325,077 | -- | -- |
| Industrials | 216,211 | 216,211 | -- | -- |
| Information Technology | 1,195,624 | 1,143,860 | 24,593 | 27,171 |
| Materials | 49,056 | 49,056 | -- | -- |
| Real Estate | 110,819 | 110,819 | -- | -- |
| Money Market Funds | 114,511 | 114,511 | -- | -- |
| Total Investments in Securities: | $2,957,175 | $2,879,509 | $50,486 | $27,180 |
Other Information
Distribution of investments by country or territory of incorporation, as a percentage of Total Net Assets, is as follows (Unaudited):
| United States of America | 89.2% |
| Cayman Islands | 3.2% |
| Bermuda | 1.2% |
| France | 1.2% |
| Ireland | 1.2% |
| Netherlands | 1.1% |
| United Kingdom | 1.0% |
| Others (Individually Less Than 1%) | 1.9% |
| 100.0% |
See accompanying notes which are an integral part of the financial statements.
Financial Statements
Statement of Assets and Liabilities
| Amounts in thousands (except per-share amounts) | May 31, 2017 (Unaudited) | |
| Assets | ||
| Investment in securities, at value (including securities loaned of $72,738) — See accompanying schedule: Unaffiliated issuers (cost $2,067,875) | $2,842,664 | |
| Fidelity Central Funds (cost $114,511) | 114,511 | |
| Total Investments (cost $2,182,386) | $2,957,175 | |
| Receivable for investments sold | 47,747 | |
| Receivable for fund shares sold | 2,068 | |
| Dividends receivable | 2,461 | |
| Distributions receivable from Fidelity Central Funds | 176 | |
| Prepaid expenses | 1 | |
| Other receivables | 163 | |
| Total assets | 3,009,791 | |
| Liabilities | ||
| Payable for investments purchased | $11,884 | |
| Payable for fund shares redeemed | 11,357 | |
| Accrued management fee | 1,305 | |
| Distribution and service plan fees payable | 834 | |
| Other affiliated payables | 497 | |
| Other payables and accrued expenses | 188 | |
| Collateral on securities loaned | 74,603 | |
| Total liabilities | 100,668 | |
| Net Assets | $2,909,123 | |
| Net Assets consist of: | ||
| Paid in capital | $2,009,533 | |
| Accumulated net investment loss | (12,836) | |
| Accumulated undistributed net realized gain (loss) on investments and foreign currency transactions | 137,631 | |
| Net unrealized appreciation (depreciation) on investments and assets and liabilities in foreign currencies | 774,795 | |
| Net Assets | $2,909,123 | |
| Calculation of Maximum Offering Price | ||
| Class A: | ||
| Net Asset Value and redemption price per share ($776,831 ÷ 7,097.11 shares) | $109.46 | |
| Maximum offering price per share (100/94.25 of $109.46) | $116.14 | |
| Class M: | ||
| Net Asset Value and redemption price per share ($1,271,525 ÷ 11,802.17 shares) | $107.74 | |
| Maximum offering price per share (100/96.50 of $107.74) | $111.65 | |
| Class C: | ||
| Net Asset Value and offering price per share ($187,679 ÷ 1,969.53 shares)(a) | $95.29 | |
| Class I: | ||
| Net Asset Value, offering price and redemption price per share ($623,461 ÷ 5,251.08 shares) | $118.73 | |
| Class Z: | ||
| Net Asset Value, offering price and redemption price per share ($49,627 ÷ 415.64 shares) | $119.40 |
(a) Redemption price per share is equal to net asset value less any applicable contingent deferred sales charge.
See accompanying notes which are an integral part of the financial statements.
Statement of Operations
| Amounts in thousands | Six months ended May 31, 2017 (Unaudited) | |
| Investment Income | ||
| Dividends | $12,109 | |
| Interest | 2 | |
| Income from Fidelity Central Funds | 596 | |
| Total income | 12,707 | |
| Expenses | ||
| Management fee | $7,338 | |
| Transfer agent fees | 2,512 | |
| Distribution and service plan fees | 4,797 | |
| Accounting and security lending fees | 404 | |
| Custodian fees and expenses | 27 | |
| Independent trustees' fees and expenses | 6 | |
| Registration fees | 62 | |
| Audit | 37 | |
| Legal | 8 | |
| Interest | 6 | |
| Miscellaneous | 11 | |
| Total expenses before reductions | 15,208 | |
| Expense reductions | (57) | 15,151 |
| Net investment income (loss) | (2,444) | |
| Realized and Unrealized Gain (Loss) | ||
| Net realized gain (loss) on: | ||
| Investment securities: | ||
| Unaffiliated issuers | 137,738 | |
| Fidelity Central Funds | 17 | |
| Foreign currency transactions | (87) | |
| Futures contracts | 248 | |
| Total net realized gain (loss) | 137,916 | |
| Change in net unrealized appreciation (depreciation) on: Investment securities | 381,308 | |
| Assets and liabilities in foreign currencies | 12 | |
| Futures contracts | (168) | |
| Total change in net unrealized appreciation (depreciation) | 381,152 | |
| Net gain (loss) | 519,068 | |
| Net increase (decrease) in net assets resulting from operations | $516,624 |
See accompanying notes which are an integral part of the financial statements.
Statement of Changes in Net Assets
| Amounts in thousands | Six months ended May 31, 2017 (Unaudited) | Year ended November 30, 2016 |
| Increase (Decrease) in Net Assets | ||
| Operations | ||
| Net investment income (loss) | $(2,444) | $(9,439) |
| Net realized gain (loss) | 137,916 | 155,663 |
| Change in net unrealized appreciation (depreciation) | 381,152 | (165,390) |
| Net increase (decrease) in net assets resulting from operations | 516,624 | (19,166) |
| Distributions to shareholders from net realized gain | (153,216) | (69,494) |
| Share transactions - net increase (decrease) | (14,796) | (226,001) |
| Total increase (decrease) in net assets | 348,612 | (314,661) |
| Net Assets | ||
| Beginning of period | 2,560,511 | 2,875,172 |
| End of period | $2,909,123 | $2,560,511 |
| Other Information | ||
| Accumulated net investment loss end of period | $(12,836) | $(10,392) |
See accompanying notes which are an integral part of the financial statements.
Financial Highlights — Fidelity Advisor Equity Growth Fund Class A
| Six months ended (Unaudited) May 31, | Years ended November 30, | |||||
| 2017 | 2016 | 2015 | 2014 | 2013 | 2012 | |
| Selected Per–Share Data | ||||||
| Net asset value, beginning of period | $96.05 | $98.79 | $93.78 | $80.87 | $61.77 | $54.56 |
| Income from Investment Operations | ||||||
| Net investment income (loss)A | (.04) | (.24) | (.13) | (.07) | (.05) | .02 |
| Net realized and unrealized gain (loss) | 19.28 | (.12) | 5.14 | 12.98 | 19.15 | 7.30 |
| Total from investment operations | 19.24 | (.36) | 5.01 | 12.91 | 19.10 | 7.32 |
| Distributions from net investment income | – | – | – | – | – | – |
| Distributions from net realized gain | (5.83) | (2.38) | – | – | – | (.11) |
| Total distributions | (5.83) | (2.38) | – | – | – | (.11) |
| Net asset value, end of period | $109.46 | $96.05 | $98.79 | $93.78 | $80.87 | $61.77 |
| Total ReturnB,C,D | 21.17% | (.39)% | 5.34% | 15.96% | 30.92% | 13.45% |
| Ratios to Average Net AssetsE,F | ||||||
| Expenses before reductions | 1.04%G | 1.05% | 1.05% | 1.07% | 1.11% | 1.14% |
| Expenses net of fee waivers, if any | 1.04%G | 1.05% | 1.05% | 1.07% | 1.11% | 1.14% |
| Expenses net of all reductions | 1.03%G | 1.05% | 1.04% | 1.07% | 1.10% | 1.14% |
| Net investment income (loss) | (.09)%G | (.25)% | (.13)% | (.08)% | (.07)% | .04% |
| Supplemental Data | ||||||
| Net assets, end of period (in millions) | $777 | $803 | $887 | $853 | $772 | $632 |
| Portfolio turnover rateH | 53%G | 60% | 63% | 49%I | 81% | 73% |
A Calculated based on average shares outstanding during the period.
B Total returns for periods of less than one year are not annualized.
C Total returns would have been lower if certain expenses had not been reduced during the applicable periods shown.
D Total returns do not include the effect of the sales charges.
E Fees and expenses of any underlying Fidelity Central Funds are not included in the Fund's expense ratio. The Fund indirectly bears its proportionate share of the expenses of any underlying Fidelity Central Funds.
F Expense ratios reflect operating expenses of the class. Expenses before reductions do not reflect amounts reimbursed by the investment adviser or reductions from brokerage service arrangements or reductions from other expense offset arrangements and do not represent the amount paid by the class during periods when reimbursements or reductions occur. Expenses net of fee waivers reflect expenses after reimbursement by the investment adviser but prior to reductions from brokerage service arrangements or other expense offset arrangements. Expenses net of all reductions represent the net expenses paid by the class.
G Annualized
H Amount does not include the portfolio activity of any underlying Fidelity Central Funds.
I Portfolio turnover rate excludes securities received or delivered in-kind.
See accompanying notes which are an integral part of the financial statements.
Financial Highlights — Fidelity Advisor Equity Growth Fund Class M
| Six months ended (Unaudited) May 31, | Years ended November 30, | |||||
| 2017 | 2016 | 2015 | 2014 | 2013 | 2012 | |
| Selected Per–Share Data | ||||||
| Net asset value, beginning of period | $94.73 | $97.68 | $92.94 | $80.31 | $61.45 | $54.26 |
| Income from Investment Operations | ||||||
| Net investment income (loss)A | (.16) | (.44) | (.34) | (.25) | (.17) | (.08) |
| Net realized and unrealized gain (loss) | 19.00 | (.13) | 5.08 | 12.88 | 19.03 | 7.27 |
| Total from investment operations | 18.84 | (.57) | 4.74 | 12.63 | 18.86 | 7.19 |
| Distributions from net investment income | – | – | – | – | – | – |
| Distributions from net realized gain | (5.83) | (2.38) | – | – | – | – |
| Total distributions | (5.83) | (2.38) | – | – | – | – |
| Net asset value, end of period | $107.74 | $94.73 | $97.68 | $92.94 | $80.31 | $61.45 |
| Total ReturnB,C,D | 21.04% | (.62)% | 5.10% | 15.73% | 30.69% | 13.25% |
| Ratios to Average Net AssetsE,F | ||||||
| Expenses before reductions | 1.27%G | 1.28% | 1.27% | 1.28% | 1.29% | 1.31% |
| Expenses net of fee waivers, if any | 1.27%G | 1.27% | 1.27% | 1.28% | 1.29% | 1.31% |
| Expenses net of all reductions | 1.26%G | 1.27% | 1.27% | 1.28% | 1.28% | 1.31% |
| Net investment income (loss) | (.32)%G | (.48)% | (.36)% | (.29)% | (.25)% | (.13)% |
| Supplemental Data | ||||||
| Net assets, end of period (in millions) | $1,272 | $1,129 | $1,306 | $1,368 | $1,283 | $1,108 |
| Portfolio turnover rateH | 53%G | 60% | 63% | 49%I | 81% | 73% |
A Calculated based on average shares outstanding during the period.
B Total returns for periods of less than one year are not annualized.
C Total returns would have been lower if certain expenses had not been reduced during the applicable periods shown.
D Total returns do not include the effect of the sales charges.
E Fees and expenses of any underlying Fidelity Central Funds are not included in the Fund's expense ratio. The Fund indirectly bears its proportionate share of the expenses of any underlying Fidelity Central Funds.
F Expense ratios reflect operating expenses of the class. Expenses before reductions do not reflect amounts reimbursed by the investment adviser or reductions from brokerage service arrangements or reductions from other expense offset arrangements and do not represent the amount paid by the class during periods when reimbursements or reductions occur. Expenses net of fee waivers reflect expenses after reimbursement by the investment adviser but prior to reductions from brokerage service arrangements or other expense offset arrangements. Expenses net of all reductions represent the net expenses paid by the class.
G Annualized
H Amount does not include the portfolio activity of any underlying Fidelity Central Funds.
I Portfolio turnover rate excludes securities received or delivered in-kind.
See accompanying notes which are an integral part of the financial statements.
Financial Highlights — Fidelity Advisor Equity Growth Fund Class C
| Six months ended (Unaudited) May 31, | Years ended November 30, | |||||
| 2017 | 2016 | 2015 | 2014 | 2013 | 2012 | |
| Selected Per–Share Data | ||||||
| Net asset value, beginning of period | $84.66 | $88.01 | $84.18 | $73.13 | $56.27 | $49.96 |
| Income from Investment Operations | ||||||
| Net investment income (loss)A | (.37) | (.84) | (.77) | (.66) | (.50) | (.37) |
| Net realized and unrealized gain (loss) | 16.83 | (.13) | 4.60 | 11.71 | 17.36 | 6.68 |
| Total from investment operations | 16.46 | (.97) | 3.83 | 11.05 | 16.86 | 6.31 |
| Distributions from net investment income | – | – | – | – | – | – |
| Distributions from net realized gain | (5.83) | (2.38) | – | – | – | – |
| Total distributions | (5.83) | (2.38) | – | – | – | – |
| Net asset value, end of period | $95.29 | $84.66 | $88.01 | $84.18 | $73.13 | $56.27 |
| Total ReturnB,C,D | 20.71% | (1.15)% | 4.55% | 15.11% | 29.96% | 12.63% |
| Ratios to Average Net AssetsE,F | ||||||
| Expenses before reductions | 1.80%G | 1.81% | 1.81% | 1.81% | 1.84% | 1.86% |
| Expenses net of fee waivers, if any | 1.80%G | 1.81% | 1.81% | 1.81% | 1.84% | 1.86% |
| Expenses net of all reductions | 1.79%G | 1.81% | 1.80% | 1.81% | 1.83% | 1.86% |
| Net investment income (loss) | (.85)%G | (1.01)% | (.89)% | (.83)% | (.79)% | (.68)% |
| Supplemental Data | ||||||
| Net assets, end of period (in millions) | $188 | $161 | $183 | $175 | $157 | $133 |
| Portfolio turnover rateH | 53%G | 60% | 63% | 49%I | 81% | 73% |
A Calculated based on average shares outstanding during the period.
B Total returns for periods of less than one year are not annualized.
C Total returns would have been lower if certain expenses had not been reduced during the applicable periods shown.
D Total returns do not include the effect of the contingent deferred sales charge.
E Fees and expenses of any underlying Fidelity Central Funds are not included in the Fund's expense ratio. The Fund indirectly bears its proportionate share of the expenses of any underlying Fidelity Central Funds.
F Expense ratios reflect operating expenses of the class. Expenses before reductions do not reflect amounts reimbursed by the investment adviser or reductions from brokerage service arrangements or reductions from other expense offset arrangements and do not represent the amount paid by the class during periods when reimbursements or reductions occur. Expenses net of fee waivers reflect expenses after reimbursement by the investment adviser but prior to reductions from brokerage service arrangements or other expense offset arrangements. Expenses net of all reductions represent the net expenses paid by the class.
G Annualized
H Amount does not include the portfolio activity of any underlying Fidelity Central Funds.
I Portfolio turnover rate excludes securities received or delivered in-kind.
See accompanying notes which are an integral part of the financial statements.
Financial Highlights — Fidelity Advisor Equity Growth Fund Class I
| Six months ended (Unaudited) May 31, | Years ended November 30, | |||||
| 2017 | 2016 | 2015 | 2014 | 2013 | 2012 | |
| Selected Per–Share Data | ||||||
| Net asset value, beginning of period | $103.57 | $106.06 | $100.40 | $86.32 | $65.92 | $58.24 |
| Income from Investment Operations | ||||||
| Net investment income (loss)A | .10 | .02 | .15 | .20 | .20 | .25 |
| Net realized and unrealized gain (loss) | 20.89 | (.13) | 5.51 | 13.88 | 20.40 | 7.75 |
| Total from investment operations | 20.99 | (.11) | 5.66 | 14.08 | 20.60 | 8.00 |
| Distributions from net investment income | – | – | – | – | (.20) | – |
| Distributions from net realized gain | (5.83) | (2.38) | – | – | – | (.32) |
| Total distributions | (5.83) | (2.38) | – | – | (.20) | (.32) |
| Net asset value, end of period | $118.73 | $103.57 | $106.06 | $100.40 | $86.32 | $65.92 |
| Total ReturnB,C | 21.33% | (.12)% | 5.64% | 16.31% | 31.36% | 13.83% |
| Ratios to Average Net AssetsD,E | ||||||
| Expenses before reductions | .77%F | .78% | .78% | .77% | .78% | .80% |
| Expenses net of fee waivers, if any | .77%F | .78% | .77% | .77% | .78% | .80% |
| Expenses net of all reductions | .77%F | .77% | .77% | .77% | .77% | .79% |
| Net investment income (loss) | .18%F | .02% | .14% | .21% | .27% | .39% |
| Supplemental Data | ||||||
| Net assets, end of period (in millions) | $623 | $434 | $463 | $432 | $1,266 | $1,063 |
| Portfolio turnover rateG | 53%F | 60% | 63% | 49%H | 81% | 73% |
A Calculated based on average shares outstanding during the period.
B Total returns for periods of less than one year are not annualized.
C Total returns would have been lower if certain expenses had not been reduced during the applicable periods shown.
D Fees and expenses of any underlying Fidelity Central Funds are not included in the Fund's expense ratio. The Fund indirectly bears its proportionate share of the expenses of any underlying Fidelity Central Funds.
E Expense ratios reflect operating expenses of the class. Expenses before reductions do not reflect amounts reimbursed by the investment adviser or reductions from brokerage service arrangements or reductions from other expense offset arrangements and do not represent the amount paid by the class during periods when reimbursements or reductions occur. Expenses net of fee waivers reflect expenses after reimbursement by the investment adviser but prior to reductions from brokerage service arrangements or other expense offset arrangements. Expenses net of all reductions represent the net expenses paid by the class.
F Annualized
G Amount does not include the portfolio activity of any underlying Fidelity Central Funds.
H Portfolio turnover rate excludes securities received or delivered in-kind.
See accompanying notes which are an integral part of the financial statements.
Financial Highlights — Fidelity Advisor Equity Growth Fund Class Z
| Six months ended (Unaudited) May 31, | Years ended November 30, | ||||
| 2017 | 2016 | 2015 | 2014 | 2013 A | |
| Selected Per–Share Data | |||||
| Net asset value, beginning of period | $104.05 | $106.39 | $100.59 | $86.36 | $78.49 |
| Income from Investment Operations | |||||
| Net investment income (loss)B | .17 | .17 | .29 | .33 | .09 |
| Net realized and unrealized gain (loss) | 21.01 | (.13) | 5.51 | 13.90 | 7.78 |
| Total from investment operations | 21.18 | .04 | 5.80 | 14.23 | 7.87 |
| Distributions from net investment income | – | – | – | – | – |
| Distributions from net realized gain | (5.83) | (2.38) | – | – | – |
| Total distributions | (5.83) | (2.38) | – | – | – |
| Net asset value, end of period | $119.40 | $104.05 | $106.39 | $100.59 | $86.36 |
| Total ReturnC,D | 21.42% | .02% | 5.77% | 16.48% | 10.03% |
| Ratios to Average Net AssetsE,F | |||||
| Expenses before reductions | .63%G | .64% | .64% | .64% | .64%G |
| Expenses net of fee waivers, if any | .63%G | .63% | .64% | .64% | .64%G |
| Expenses net of all reductions | .63%G | .63% | .63% | .64% | .63%G |
| Net investment income (loss) | .31%G | .16% | .28% | .35% | .38%G |
| Supplemental Data | |||||
| Net assets, end of period (in millions) | $50 | $33 | $26 | $– | $– |
| Portfolio turnover rateH | 53%G | 60% | 63% | 49%I | 81% |
A For the period August 13, 2013 (commencement of sale of shares) to November 30, 2013.
B Calculated based on average shares outstanding during the period.
C Total returns for periods of less than one year are not annualized.
D Total returns would have been lower if certain expenses had not been reduced during the applicable periods shown.
E Fees and expenses of any underlying Fidelity Central Funds are not included in the Fund's expense ratio. The Fund indirectly bears its proportionate share of the expenses of any underlying Fidelity Central Funds.
F Expense ratios reflect operating expenses of the class. Expenses before reductions do not reflect amounts reimbursed by the investment adviser or reductions from brokerage service arrangements or reductions from other expense offset arrangements and do not represent the amount paid by the class during periods when reimbursements or reductions occur. Expense ratios before reductions for start-up periods may not be representative of longer-term operating periods. Expenses net of fee waivers reflect expenses after reimbursement by the investment adviser but prior to reductions from brokerage service arrangements or other expense offset arrangements. Expenses net of all reductions represent the net expenses paid by the class.
G Annualized
H Amount does not include the portfolio activity of any underlying Fidelity Central Funds.
I Portfolio turnover rate excludes securities received or delivered in-kind.
See accompanying notes which are an integral part of the financial statements.
Notes to Financial Statements (Unaudited)
For the period ended May 31, 2017
(Amounts in thousands except percentages)
1. Organization.
Fidelity Advisor Equity Growth Fund (the Fund) is a fund of Fidelity Advisor Series I (the Trust) and is authorized to issue an unlimited number of shares. The Trust is registered under the Investment Company Act of 1940, as amended (the 1940 Act), as an open-end management investment company organized as a Massachusetts business trust. The Fund offers Class A, Class M (formerly Class T), Class C, Class I and Class Z shares, each of which has equal rights as to assets and voting privileges. Each class has exclusive voting rights with respect to matters that affect that class.
After the close of business on June 24, 2016, all outstanding Class B shares were converted to Class A shares. All prior fiscal period dollar and share amounts for Class B presented in the Notes to Financial Statements are for the period December 1, 2015 through June 24, 2016.
2. Investments in Fidelity Central Funds.
The Fund invests in Fidelity Central Funds, which are open-end investment companies generally available only to other investment companies and accounts managed by the investment adviser and its affiliates. The Fund's Schedule of Investments lists each of the Fidelity Central Funds held as of period end, if any, as an investment of the Fund, but does not include the underlying holdings of each Fidelity Central Fund. As an Investing Fund, the Fund indirectly bears its proportionate share of the expenses of the underlying Fidelity Central Funds.
The Money Market Central Funds seek preservation of capital and current income and are managed by Fidelity Investments Money Management, Inc. (FIMM), an affiliate of the investment adviser. Annualized expenses of the Money Market Central Funds as of their most recent shareholder report date are less than .005%.
A complete unaudited list of holdings for each Fidelity Central Fund is available upon request or at the Securities and Exchange Commission (the SEC) website at www.sec.gov. In addition, the financial statements of the Fidelity Central Funds are available on the SEC website or upon request.
3. Significant Accounting Policies.
The Fund is an investment company and applies the accounting and reporting guidance of the Financial Accounting Standards Board (FASB) Accounting Standards Codification Topic 946 Financial Services – Investments Companies. The financial statements have been prepared in conformity with accounting principles generally accepted in the United States of America (GAAP), which require management to make certain estimates and assumptions at the date of the financial statements. Actual results could differ from those estimates. Subsequent events, if any, through the date that the financial statements were issued have been evaluated in the preparation of the financial statements. The following summarizes the significant accounting policies of the Fund:
Investment Valuation. Investments are valued as of 4:00 p.m. Eastern time on the last calendar day of the period. The Board of Trustees (the Board) has delegated the day to day responsibility for the valuation of the Fund's investments to the Fair Value Committee (the Committee) established by the Fund's investment adviser. In accordance with valuation policies and procedures approved by the Board, the Fund attempts to obtain prices from one or more third party pricing vendors or brokers to value its investments. When current market prices, quotations or currency exchange rates are not readily available or reliable, investments will be fair valued in good faith by the Committee, in accordance with procedures adopted by the Board. Factors used in determining fair value vary by investment type and may include market or investment specific events. The frequency with which these procedures are used cannot be predicted and they may be utilized to a significant extent. The Committee oversees the Fund's valuation policies and procedures and reports to the Board on the Committee's activities and fair value determinations. The Board monitors the appropriateness of the procedures used in valuing the Fund's investments and ratifies the fair value determinations of the Committee.
The Fund categorizes the inputs to valuation techniques used to value its investments into a disclosure hierarchy consisting of three levels as shown below:
- Level 1 – quoted prices in active markets for identical investments
- Level 2 – other significant observable inputs (including quoted prices for similar investments, interest rates, prepayment speeds, etc.)
- Level 3 – unobservable inputs (including the Fund's own assumptions based on the best information available)
Valuation techniques used to value the Fund's investments by major category are as follows:
Equity securities, including restricted securities, for which market quotations are readily available, are valued at the last reported sale price or official closing price as reported by a third party pricing vendor on the primary market or exchange on which they are traded and are categorized as Level 1 in the hierarchy. In the event there were no sales during the day or closing prices are not available, securities are valued at the last quoted bid price or may be valued using the last available price and are generally categorized as Level 2 in the hierarchy. For foreign equity securities, when market or security specific events arise, comparisons to the valuation of American Depositary Receipts (ADRs), futures contracts, Exchange-Traded Funds (ETFs) and certain indexes as well as quoted prices for similar securities may be used and would be categorized as Level 2 in the hierarchy. Utilizing these techniques may result in transfers between Level 1 and Level 2. For equity securities, including restricted securities, where observable inputs are limited, assumptions about market activity and risk are used and these securities may be categorized as Level 3 in the hierarchy.
Investments in open-end mutual funds, including the Fidelity Central Funds, are valued at their closing net asset value (NAV) each business day and are categorized as Level 1 in the hierarchy.
Changes in valuation techniques may result in transfers in or out of an assigned level within the disclosure hierarchy. The aggregate value of investments by input level as of May 31, 2017 is included at the end of the Fund's Schedule of Investments.
Foreign Currency. The Fund may use foreign currency contracts to facilitate transactions in foreign-denominated securities. Gains and losses from these transactions may arise from changes in the value of the foreign currency or if the counterparties do not perform under the contracts' terms.
Foreign-denominated assets, including investment securities, and liabilities are translated into U.S. dollars at the exchange rates at period end. Purchases and sales of investment securities, income and dividends received and expenses denominated in foreign currencies are translated into U.S. dollars at the exchange rate in effect on the transaction date.
The effects of exchange rate fluctuations on investments are included with the net realized and unrealized gain (loss) on investment securities. Other foreign currency transactions resulting in realized and unrealized gain (loss) are disclosed separately.
Investment Transactions and Income. For financial reporting purposes, the Fund's investment holdings and NAV include trades executed through the end of the last business day of the period. The NAV per share for processing shareholder transactions is calculated as of the close of business of the New York Stock Exchange (NYSE), normally 4:00 p.m. Eastern time and includes trades executed through the end of the prior business day. Gains and losses on securities sold are determined on the basis of identified cost and may include proceeds received from litigation. Dividend income is recorded on the ex-dividend date, except for certain dividends from foreign securities where the ex-dividend date may have passed, which are recorded as soon as the Fund is informed of the ex-dividend date. Non-cash dividends included in dividend income, if any, are recorded at the fair market value of the securities received. Income and capital gain distributions from Fidelity Central Funds, if any, are recorded on the ex-dividend date. Certain distributions received by the Fund represent a return of capital or capital gain. The Fund determines the components of these distributions subsequent to the ex-dividend date, based upon receipt of tax filings or other correspondence relating to the underlying investment. These distributions are recorded as a reduction of cost of investments and/or as a realized gain. Interest income is accrued as earned and includes coupon interest and amortization of premium and accretion of discount on debt securities as applicable. Investment income is recorded net of foreign taxes withheld where recovery of such taxes is uncertain.
Class Allocations and Expenses. Investment income, realized and unrealized capital gains and losses, common expenses of the Fund, and certain fund-level expense reductions, if any, are allocated daily on a pro-rata basis to each class based on the relative net assets of each class to the total net assets of the Fund. Each class differs with respect to transfer agent and distribution and service plan fees incurred. Certain expense reductions may also differ by class. For the reporting period, the allocated portion of income and expenses to each class as a percent of its average net assets may vary due to the timing of recording these transactions in relation to fluctuating net assets of the classes. Expenses directly attributable to a fund are charged to that fund. Expenses attributable to more than one fund are allocated among the respective funds on the basis of relative net assets or other appropriate methods. Expense estimates are accrued in the period to which they relate and adjustments are made when actual amounts are known.
Deferred Trustee Compensation. Under a Deferred Compensation Plan (the Plan), independent Trustees may elect to defer receipt of a portion of their annual compensation. Deferred amounts are invested in a cross-section of Fidelity funds, are marked-to-market and remain in the Fund until distributed in accordance with the Plan. The investment of deferred amounts and the offsetting payable to the Trustees are included in the accompanying Statement of Assets and Liabilities.
Income Tax Information and Distributions to Shareholders. Each year, the Fund intends to qualify as a regulated investment company under Subchapter M of the Internal Revenue Code, including distributing substantially all of its taxable income and realized gains. As a result, no provision for U.S. Federal income taxes is required. The Fund files a U.S. federal tax return, in addition to state and local tax returns as required. The Fund's federal income tax returns are subject to examination by the Internal Revenue Service (IRS) for a period of three fiscal years after they are filed. State and local tax returns may be subject to examination for an additional fiscal year depending on the jurisdiction. Foreign taxes are provided for based on the Fund's understanding of the tax rules and rates that exist in the foreign markets in which it invests.
Distributions are declared and recorded on the ex-dividend date. Income dividends and capital gain distributions are declared separately for each class. Income and capital gain distributions are determined in accordance with income tax regulations, which may differ from GAAP.
Capital accounts within the financial statements are adjusted for permanent book-tax differences. These adjustments have no impact on net assets or the results of operations. Capital accounts are not adjusted for temporary book-tax differences which will reverse in a subsequent period.
Book-tax differences are primarily due to futures contracts, partnerships, non-taxable dividends, deferred trustees compensation, capital loss carryforwards, losses deferred due to wash sales and excise tax regulations.
The federal tax cost of investment securities and unrealized appreciation (depreciation) as of period end were as follows:
| Gross unrealized appreciation | $822,095 |
| Gross unrealized depreciation | (48,594) |
| Net unrealized appreciation (depreciation) on securities | $773,501 |
| Tax cost | $2,183,674 |
The Fund elected to defer to its next fiscal year approximately $10,260 of ordinary losses recognized during the period January 1, 2016 to November 30, 2016.
Restricted Securities. The Fund may invest in securities that are subject to legal or contractual restrictions on resale. These securities generally may be resold in transactions exempt from registration or to the public if the securities are registered. Disposal of these securities may involve time-consuming negotiations and expense, and prompt sale at an acceptable price may be difficult. Information regarding restricted securities is included at the end of the Fund's Schedule of Investments.
4. Derivative Instruments.
Risk Exposures and the Use of Derivative Instruments. The Fund's investment objective allows the Fund to enter into various types of derivative contracts, including futures contracts. Derivatives are investments whose value is primarily derived from underlying assets, indices or reference rates and may be transacted on an exchange or over-the-counter (OTC). Derivatives may involve a future commitment to buy or sell a specified asset based on specified terms, to exchange future cash flows at periodic intervals based on a notional principal amount, or for one party to make one or more payments upon the occurrence of specified events in exchange for periodic payments from the other party.
The Fund used derivatives to increase returns and to manage exposure to certain risks as defined below. The success of any strategy involving derivatives depends on analysis of numerous economic factors, and if the strategies for investment do not work as intended, the Fund may not achieve its objectives.
The Fund's use of derivatives increased or decreased its exposure to the following risk:
| Equity Risk | Equity risk relates to the fluctuations in the value of financial instruments as a result of changes in market prices (other than those arising from interest rate risk or foreign exchange risk), whether caused by factors specific to an individual investment, its issuer, or all factors affecting all instruments traded in a market or market segment. |
The Fund is also exposed to additional risks from investing in derivatives, such as liquidity risk and counterparty credit risk. Liquidity risk is the risk that the Fund will be unable to close out the derivative in the open market in a timely manner. Counterparty credit risk is the risk that the counterparty will not be able to fulfill its obligation to the Fund. Counterparty credit risk related to exchange-traded futures contracts may be mitigated by the protection provided by the exchange on which they trade.
Investing in derivatives may involve greater risks than investing in the underlying assets directly and, to varying degrees, may involve risk of loss in excess of any initial investment and collateral received and amounts recognized in the Statement of Assets and Liabilities. In addition, there may be the risk that the change in value of the derivative contract does not correspond to the change in value of the underlying instrument.
Futures Contracts. A futures contract is an agreement between two parties to buy or sell a specified underlying instrument for a fixed price at a specified future date. The Fund used futures contracts to manage its exposure to the stock market.
Upon entering into a futures contract, a fund is required to deposit either cash or securities (initial margin) with a clearing broker in an amount equal to a certain percentage of the face value of the contract. Futures contracts are marked-to-market daily and subsequent daily payments (variation margin) are made or received by a fund depending on the daily fluctuations in the value of the futures contracts and are recorded as unrealized appreciation or (depreciation). This receivable and/or payable, if any, is included in daily variation margin for derivative instruments in the Statement of Assets and Liabilities. Realized gain or (loss) is recorded upon the expiration or closing of a futures contract.
Any open futures contracts at period end are presented in the Schedule of Investments under the caption "Futures Contracts". The underlying face amount at value reflects each contract's exposure to the underlying instrument or index at period end.
During the period the Fund recognized net realized gain (loss) of $248 and a change in net unrealized appreciation (depreciation) of $(168) related to its investment in futures contracts. These amounts are included in the Statement of Operations.
5. Purchases and Sales of Investments.
Purchases and sales of securities, other than short-term securities, aggregated $694,704 and $888,688, respectively.
6. Fees and Other Transactions with Affiliates.
Management Fee. Fidelity Management & Research Company (the investment adviser) and its affiliates provide the Fund with investment management related services for which the Fund pays a monthly management fee. The management fee is the sum of an individual fund fee rate that is based on an annual rate of .30% of the Fund's average net assets and an annualized group fee rate that averaged .25% during the period. The group fee rate is based upon the average net assets of all the mutual funds advised by the investment adviser, including any mutual funds previously advised by the investment adviser that are currently advised by Fidelity SelectCo, LLC, an affiliate of the investment adviser. The group fee rate decreases as assets under management increase and increases as assets under management decrease. For the reporting period, the total annualized management fee rate was .55% of the Fund's average net assets.
Distribution and Service Plan Fees. In accordance with Rule 12b-1 of the 1940 Act, the Fund has adopted separate Distribution and Service Plans for each class of shares. Certain classes pay Fidelity Distributors Corporation (FDC), an affiliate of the investment adviser, separate Distribution and Service Fees, each of which is based on an annual percentage of each class' average net assets. In addition, FDC may pay financial intermediaries for selling shares of the Fund and providing shareholder support services. For the period, the Distribution and Service Fee rates, total fees and amounts retained by FDC were as follows:
| Distribution Fee | Service Fee | Total Fees | Retained by FDC | |
| Class A | -% | .25% | $983 | $12 |
| Class M | .25% | .25% | 2,960 | – |
| Class C | .75% | .25% | 854 | 34 |
| $4,797 | $46 |
Sales Load. FDC may receive a front-end sales charge of up to 5.75% for selling Class A shares and 3.50% for selling Class M shares, some of which is paid to financial intermediaries for selling shares of the Fund. Depending on the holding period, FDC may receive contingent deferred sales charges levied on Class A, Class M and Class C redemptions. The deferred sales charges are 1.00% for Class C shares, 1.00% for certain purchases of Class A shares and .25% for certain purchases of Class M shares.
For the period, sales charge amounts retained by FDC were as follows:
| Retained by FDC | |
| Class A | $51 |
| Class M | 15 |
| Class C(a) | 2 |
| $68 |
(a) When Class C shares are initially sold, FDC pays commissions from its own resources to financial intermediaries through which the sales are made.
Transfer Agent Fees. Fidelity Investments Institutional Operations Company, Inc., (FIIOC), an affiliate of the investment adviser, is the transfer, dividend disbursing and shareholder servicing agent for each class of the Fund. FIIOC receives account fees and asset-based fees that vary according to the account size and type of account of the shareholders of the respective classes of the Fund, except for Class Z. FIIOC receives an asset-based fee of Class Z's average net assets. FIIOC pays for typesetting, printing and mailing of shareholder reports, except proxy statements.
For the period, transfer agent fees for each class were as follows:
| Amount | % of Class-Level Average Net Assets(a) | |
| Class A | $786 | .20 |
| Class M | 1,071 | .18 |
| Class C | 182 | .21 |
| Class I | 463 | .18 |
| Class Z | 10 | .05 |
| $2,512 |
(a) Annualized
Accounting and Security Lending Fees. Fidelity Service Company, Inc. (FSC), an affiliate of the investment adviser, maintains the Fund's accounting records. The accounting fee is based on the level of average net assets for each month. Under a separate contract, FSC administers the security lending program. The security lending fee is based on the number and duration of lending transactions.
Brokerage Commissions. The Fund placed a portion of its portfolio transactions with brokerage firms which are affiliates of the investment adviser. Brokerage commissions are included in net realized gain (loss) and change in net unrealized appreciation (depreciation) in the Statement of Operations. The commissions paid to these affiliated firms were $22 for the period.
Interfund Lending Program. Pursuant to an Exemptive Order issued by the SEC, the Fund, along with other registered investment companies having management contracts with FMR or other affiliated entities of FMR, may participate in an interfund lending program. This program provides an alternative credit facility allowing the funds to borrow from, or lend money to, other participating affiliated funds. At period end, there were no interfund loans outstanding. The Fund's activity in this program during the period for which loans were outstanding was as follows:
| Borrower or Lender | Average Loan Balance | Weighted Average Interest Rate | Interest Expense |
| Borrower | $8,437 | .79% | $5 |
Interfund Trades. The Fund may purchase from or sell securities to other Fidelity Funds under procedures adopted by the Board. The procedures have been designed to ensure these interfund trades are executed in accordance with Rule 17a-7 of the 1940 Act. Interfund trades are included within the respective purchases and sales amounts shown in the Purchases and Sales of Investments note.
7. Committed Line of Credit.
The Fund participates with other funds managed by the investment adviser or an affiliate in a $4.25 billion credit facility (the "line of credit") to be utilized for temporary or emergency purposes to fund shareholder redemptions or for other short-term liquidity purposes. The Fund has agreed to pay commitment fees on its pro-rata portion of the line of credit, which amounted to $4 and is reflected in Miscellaneous expenses on the Statement of Operations. During the period, the Fund did not borrow on this line of credit.
8. Security Lending.
The Fund lends portfolio securities through a lending agent from time to time in order to earn additional income. For equity securities, a lending agent is used and may loan securities to certain qualified borrowers, including Fidelity Capital Markets (FCM), a broker-dealer affiliated with the Fund. On the settlement date of the loan, the Fund receives collateral (in the form of U.S. Treasury obligations, letters of credit and/or cash) against the loaned securities and maintains collateral in an amount not less than 100% of the market value of the loaned securities during the period of the loan. The market value of the loaned securities is determined at the close of business of the Fund and any additional required collateral is delivered to the Fund on the next business day. The Fund or borrower may terminate the loan at any time, and if the borrower defaults on its obligation to return the securities loaned because of insolvency or other reasons, the Fund may apply collateral received from the borrower against the obligation. The Fund may experience delays and costs in recovering the securities loaned. Any cash collateral received is invested in the Fidelity Securities Lending Cash Central Fund. The value of loaned securities and cash collateral at period end are disclosed on the Fund's Statement of Assets and Liabilities. At period end, there were no security loans outstanding with FCM. Security lending income represents the income earned on investing cash collateral, less rebates paid to borrowers and any lending agent fees associated with the loan, plus any premium payments received for lending certain types of securities. Security lending income is presented in the Statement of Operations as a component of income from Fidelity Central Funds. Total security lending income during the period amounted to $411, including an amount less than five hundred dollars from securities loaned to FCM.
9. Bank Borrowings.
The Fund is permitted to have bank borrowings for temporary or emergency purposes to fund shareholder redemptions or for other short-term liquidity requirements. The Fund has established borrowing arrangements with certain banks. The interest rate on the borrowings is the bank's base rate, as revised from time to time. The average loan balance during the period for which loans were outstanding amounted to $3,130. The weighted average interest rate was 1.16%. The interest expense amounted to $1 under the bank borrowing program. At period end, there were no bank borrowings outstanding.
10. Expense Reductions.
Commissions paid to certain brokers with whom the investment adviser, or its affiliates, places trades on behalf of the Fund include an amount in addition to trade execution, which may be rebated back to the Fund to offset certain expenses. This amount totaled $45 for the period.
In addition, during the period the investment adviser reimbursed and/or waived a portion of fund-level operating expenses in the amount of $12.
11. Distributions to Shareholders.
Distributions to shareholders of each class were as follows:
| Six months ended May 31, 2017 | Year ended November 30, 2016 | |
| From net realized gain | ||
| Class A | $47,938 | $21,468 |
| Class M | 68,793 | 31,793 |
| Class B | – | 295 |
| Class C | 10,973 | 4,972 |
| Class I | 23,651 | 10,387 |
| Class Z | 1,861 | 579 |
| Total | $153,216 | $69,494 |
12. Share Transactions.
Share transactions for each class were as follows and may contain automatic conversions between classes or exchanges between affiliated funds:
| Shares | Shares | Dollars | Dollars | |
| Six months ended May 31, 2017 | Year ended November 30, 2016 | Six months ended May 31, 2017 | Year ended November 30, 2016 | |
| Class A | ||||
| Shares sold | 459 | 1,246 | $45,782 | $115,920 |
| Reinvestment of distributions | 485 | 205 | 44,771 | 19,967 |
| Shares redeemed | (2,211) | (2,066) | (220,811) | (193,544) |
| Net increase (decrease) | (1,267) | (615) | $(130,258) | $(57,657) |
| Class M | ||||
| Shares sold | 655 | 1,348 | $64,249 | $123,818 |
| Reinvestment of distributions | 734 | 321 | 66,704 | 30,879 |
| Shares redeemed | (1,507) | (3,117) | (146,511) | (288,966) |
| Net increase (decrease) | (118) | (1,448) | $(15,558) | $(134,269) |
| Class B | ||||
| Shares sold | – | 2 | $– | $126 |
| Reinvestment of distributions | – | 3 | – | 278 |
| Shares redeemed | – | (129) | – | (10,265) |
| Net increase (decrease) | – | (124) | $– | $(9,861) |
| Class C | ||||
| Shares sold | 167 | 215 | $14,690 | $17,757 |
| Reinvestment of distributions | 124 | 52 | 10,000 | 4,525 |
| Shares redeemed | (226) | (442) | (19,589) | (36,398) |
| Net increase (decrease) | 65 | (175) | $5,101 | $(14,116) |
| Class I | ||||
| Shares sold | 1,802 | 822 | $197,078 | $82,756 |
| Reinvestment of distributions | 224 | 95 | 22,400 | 9,952 |
| Shares redeemed | (961) | (1,094) | (103,794) | (110,841) |
| Net increase (decrease) | 1,065 | (177) | $115,684 | $(18,133) |
| Class Z | ||||
| Shares sold | 103 | 111 | $10,985 | $11,539 |
| Reinvestment of distributions | 19 | 6 | 1,861 | 579 |
| Shares redeemed | (24) | (40) | (2,611) | (4,083) |
| Net increase (decrease) | 98 | 77 | $10,235 | $8,035 |
13. Other.
The Fund's organizational documents provide former and current trustees and officers with a limited indemnification against liabilities arising in connection with the performance of their duties to the Fund. In the normal course of business, the Fund may also enter into contracts that provide general indemnifications. The Fund's maximum exposure under these arrangements is unknown as this would be dependent on future claims that may be made against the Fund. The risk of material loss from such claims is considered remote.
Shareholder Expense Example
As a shareholder of the Fund, you incur two types of costs: (1) transaction costs, including sales charges (loads) on purchase payments or redemption proceeds, and (2) ongoing costs, including management fees, distribution and/or service (12b-1) fees and other Fund expenses. This Example is intended to help you understand your ongoing costs (in dollars) of investing in the Fund and to compare these costs with the ongoing costs of investing in other mutual funds.
The Example is based on an investment of $1,000 invested at the beginning of the period and held for the entire period (December 1, 2016 to May 31, 2017).
Actual Expenses
The first line of the accompanying table for each class of the Fund provides information about actual account values and actual expenses. You may use the information in this line, together with the amount you invested, to estimate the expenses that you paid over the period. Simply divide your account value by $1,000.00 (for example, an $8,600 account value divided by $1,000.00 = 8.6), then multiply the result by the number in the first line for a class of the Fund under the heading entitled "Expenses Paid During Period" to estimate the expenses you paid on your account during this period. In addition, the Fund, as a shareholder in the underlying Fidelity Central Funds, will indirectly bear its pro-rata share of the fees and expenses incurred by the underlying Fidelity Central Funds. These fees and expenses are not included in the Fund's annualized expense ratio used to calculate the expense estimate in the table below.
Hypothetical Example for Comparison Purposes
The second line of the accompanying table for each class of the Fund provides information about hypothetical account values and hypothetical expenses based on a Class' actual expense ratio and an assumed rate of return of 5% per year before expenses, which is not the Class' actual return. The hypothetical account values and expenses may not be used to estimate the actual ending account balance or expenses you paid for the period. You may use this information to compare the ongoing costs of investing in the Fund and other funds. To do so, compare this 5% hypothetical example with the 5% hypothetical examples that appear in the shareholder reports of the other funds. In addition, the Fund, as a shareholder in the underlying Fidelity Central Funds, will indirectly bear its pro-rata share of the fees and expenses incurred by the underlying Fidelity Central Funds. These fees and expenses are not included in the Fund's annualized expense ratio used to calculate the expense estimate in the table below.
Please note that the expenses shown in the table are meant to highlight your ongoing costs only and do not reflect any transaction costs. Therefore, the second line of the table is useful in comparing ongoing costs only, and will not help you determine the relative total costs of owning different funds. In addition, if these transactional costs were included, your costs would have been higher.
| Annualized Expense Ratio-A | Beginning Account Value December 1, 2016 | Ending Account Value May 31, 2017 | Expenses Paid During Period-B December 1, 2016 to May 31, 2017 | |
| Class A | 1.04% | |||
| Actual | $1,000.00 | $1,211.70 | $5.73 | |
| Hypothetical-C | $1,000.00 | $1,019.75 | $5.24 | |
| Class M | 1.27% | |||
| Actual | $1,000.00 | $1,210.40 | $7.00 | |
| Hypothetical-C | $1,000.00 | $1,018.60 | $6.39 | |
| Class C | 1.80% | |||
| Actual | $1,000.00 | $1,207.10 | $9.90 | |
| Hypothetical-C | $1,000.00 | $1,015.96 | $9.05 | |
| Class I | .77% | |||
| Actual | $1,000.00 | $1,213.30 | $4.25 | |
| Hypothetical-C | $1,000.00 | $1,021.09 | $3.88 | |
| Class Z | .63% | |||
| Actual | $1,000.00 | $1,214.20 | $3.48 | |
| Hypothetical-C | $1,000.00 | $1,021.79 | $3.18 |
A Annualized expense ratio reflects expenses net of applicable fee waivers.
B Expenses are equal to each Class' annualized expense ratio, multiplied by the average account value over the period, multiplied by 182/365 (to reflect the one-half year period).
C 5% return per year before expenses
![]()
EPG-SANN-0717
1.704747.119
Fidelity Advisor® Equity Income Fund Semi-Annual Report May 31, 2017 |
|
Contents
To view a fund's proxy voting guidelines and proxy voting record for the 12-month period ended June 30, visit http://www.fidelity.com/proxyvotingresults or visit the Securities and Exchange Commission's (SEC) web site at http://www.sec.gov.
You may also call 1-877-208-0098 to request a free copy of the proxy voting guidelines.
Standard & Poor's, S&P and S&P 500 are registered service marks of The McGraw-Hill Companies, Inc. and have been licensed for use by Fidelity Distributors Corporation.
Other third-party marks appearing herein are the property of their respective owners.
All other marks appearing herein are registered or unregistered trademarks or service marks of FMR LLC or an affiliated company. © 2017 FMR LLC. All rights reserved.
This report and the financial statements contained herein are submitted for the general information of the shareholders of the Fund. This report is not authorized for distribution to prospective investors in the Fund unless preceded or accompanied by an effective prospectus.
A fund files its complete schedule of portfolio holdings with the SEC for the first and third quarters of each fiscal year on Form N-Q. Forms N-Q are available on the SEC’s web site at http://www.sec.gov. A fund's Forms N-Q may be reviewed and copied at the SEC’s Public Reference Room in Washington, DC. Information regarding the operation of the SEC's Public Reference Room may be obtained by calling 1-800-SEC-0330.
For a complete list of a fund's portfolio holdings, view the most recent holdings listing, semiannual report, or annual report on Fidelity's web site at http://www.fidelity.com, http://www.institutional.fidelity.com, or http://www.401k.com, as applicable.
NOT FDIC INSURED •MAY LOSE VALUE •NO BANK GUARANTEE
Neither the Fund nor Fidelity Distributors Corporation is a bank.
Investment Summary (Unaudited)
Top Ten Stocks as of May 31, 2017
| % of fund's net assets | % of fund's net assets 6 months ago | |
| JPMorgan Chase & Co.(a) | 4.0 | 4.4 |
| Cisco Systems, Inc. | 3.7 | 3.2 |
| Johnson & Johnson | 3.3 | 2.7 |
| Procter & Gamble Co. | 3.1 | 2.7 |
| Comcast Corp. Class A | 2.6 | 2.0 |
| Chubb Ltd. | 2.5 | 1.9 |
| The Blackstone Group LP | 2.2 | 1.6 |
| Verizon Communications, Inc. | 2.2 | 2.1 |
| Medtronic PLC | 2.1 | 1.6 |
| Exelon Corp. | 2.0 | 1.6 |
| 27.7 |
(a) Security or a portion of the security is pledged as collateral for call options written.
Top Five Market Sectors as of May 31, 2017
| % of fund's net assets | % of fund's net assets 6 months ago | |
| Financials | 24.8 | 24.6 |
| Energy | 11.3 | 13.0 |
| Information Technology | 10.8 | 9.1 |
| Consumer Staples | 10.3 | 8.4 |
| Health Care | 10.0 | 9.1 |
Asset Allocation (% of fund's net assets)
| As of May 31, 2017*,** | ||
| Stocks | 98.6% | |
| Convertible Securities | 0.3% | |
| Other Investments | 0.2% | |
| Short-Term Investments and Net Other Assets (Liabilities) | 0.9% | |

* Foreign investments - 13.1%
** Written options - (0.0%)
| As of November 30, 2016*,** | ||
| Stocks | 95.0% | |
| Bonds | 0.1% | |
| Convertible Securities | 0.5% | |
| Other Investments | 0.2% | |
| Short-Term Investments and Net Other Assets (Liabilities) | 4.2% | |

* Foreign investments - 10.5%
** Written options - (0.2%)
Percentages shown as 0.0% may reflect amounts less than 0.05%.
Investments May 31, 2017 (Unaudited)
Showing Percentage of Net Assets
| Common Stocks - 98.6% | |||
| Shares | Value (000s) | ||
| CONSUMER DISCRETIONARY - 9.0% | |||
| Auto Components - 0.2% | |||
| Delphi Automotive PLC | 51,400 | $4,522 | |
| Automobiles - 2.0% | |||
| Fiat Chrysler Automobiles NV (a) | 99,300 | 1,050 | |
| Fiat Chrysler Automobiles NV (a) | 889,100 | 9,334 | |
| General Motors Co. | 892,200 | 30,272 | |
| 40,656 | |||
| Hotels, Restaurants & Leisure - 1.2% | |||
| Dunkin' Brands Group, Inc. | 338,200 | 19,788 | |
| Whitbread PLC | 101,916 | 5,635 | |
| 25,423 | |||
| Household Durables - 0.7% | |||
| M.D.C. Holdings, Inc. | 262,680 | 8,839 | |
| Tupperware Brands Corp. | 89,500 | 6,436 | |
| 15,275 | |||
| Leisure Products - 0.2% | |||
| New Academy Holding Co. LLC unit (a)(b)(c) | 52,800 | 2,012 | |
| Polaris Industries, Inc. (d) | 21,018 | 1,757 | |
| 3,769 | |||
| Media - 3.5% | |||
| Comcast Corp. Class A | 1,304,748 | 54,395 | |
| The Walt Disney Co. | 62,800 | 6,779 | |
| Time Warner, Inc. | 110,100 | 10,954 | |
| 72,128 | |||
| Multiline Retail - 1.0% | |||
| Kohl's Corp. | 143,148 | 5,501 | |
| Macy's, Inc. | 217,900 | 5,121 | |
| Target Corp. | 178,155 | 9,825 | |
| 20,447 | |||
| Specialty Retail - 0.2% | |||
| Bed Bath & Beyond, Inc. | 24,100 | 829 | |
| GNC Holdings, Inc. (d) | 151,116 | 1,145 | |
| Williams-Sonoma, Inc. | 42,100 | 2,049 | |
| 4,023 | |||
| TOTAL CONSUMER DISCRETIONARY | 186,243 | ||
| CONSUMER STAPLES - 10.3% | |||
| Beverages - 1.2% | |||
| Molson Coors Brewing Co. Class B | 133,305 | 12,636 | |
| The Coca-Cola Co. | 286,700 | 13,036 | |
| 25,672 | |||
| Food & Staples Retailing - 4.0% | |||
| CVS Health Corp. | 304,000 | 23,356 | |
| Kroger Co. | 77,700 | 2,314 | |
| Wal-Mart Stores, Inc. | 373,050 | 29,322 | |
| Walgreens Boots Alliance, Inc. | 276,444 | 22,397 | |
| Whole Foods Market, Inc. | 147,100 | 5,147 | |
| 82,536 | |||
| Food Products - 0.8% | |||
| B&G Foods, Inc. Class A (d) | 233,754 | 9,479 | |
| The Hain Celestial Group, Inc. (a) | 43,900 | 1,533 | |
| The Hershey Co. | 27,700 | 3,193 | |
| The J.M. Smucker Co. | 23,300 | 2,979 | |
| 17,184 | |||
| Household Products - 3.6% | |||
| Kimberly-Clark Corp. | 74,200 | 9,626 | |
| Procter & Gamble Co. | 728,317 | 64,157 | |
| 73,783 | |||
| Personal Products - 0.3% | |||
| Unilever NV (NY Reg.) | 116,100 | 6,592 | |
| Tobacco - 0.4% | |||
| British American Tobacco PLC sponsored ADR | 64,200 | 4,630 | |
| Reynolds American, Inc. | 66,800 | 4,492 | |
| 9,122 | |||
| TOTAL CONSUMER STAPLES | 214,889 | ||
| ENERGY - 11.0% | |||
| Energy Equipment & Services - 1.0% | |||
| Baker Hughes, Inc. | 102,200 | 5,636 | |
| Halliburton Co. | 118,700 | 5,364 | |
| Oceaneering International, Inc. | 32,100 | 783 | |
| Schlumberger Ltd. | 127,000 | 8,838 | |
| 20,621 | |||
| Oil, Gas & Consumable Fuels - 10.0% | |||
| Amyris, Inc. (a) | 65,075 | 17 | |
| Anadarko Petroleum Corp. | 160,445 | 8,107 | |
| Apache Corp. | 161,527 | 7,553 | |
| Chevron Corp. | 294,969 | 30,523 | |
| ConocoPhillips Co. | 667,200 | 29,817 | |
| Energy Transfer Equity LP | 40,800 | 695 | |
| EQT Midstream Partners LP | 5,400 | 398 | |
| Exxon Mobil Corp. | 53,700 | 4,323 | |
| Golar LNG Ltd. | 72,443 | 1,685 | |
| Imperial Oil Ltd. | 136,100 | 3,851 | |
| Kinder Morgan, Inc. | 649,100 | 12,177 | |
| Legacy Reserves LP (a) | 505,299 | 1,021 | |
| MPLX LP | 175,430 | 5,798 | |
| Suncor Energy, Inc. | 819,000 | 25,634 | |
| The Williams Companies, Inc. | 1,391,550 | 39,798 | |
| Williams Partners LP | 914,715 | 35,829 | |
| 207,226 | |||
| TOTAL ENERGY | 227,847 | ||
| FINANCIALS - 24.8% | |||
| Banks - 12.7% | |||
| Bank of America Corp. (e) | 1,590,900 | 35,652 | |
| Comerica, Inc. (e) | 178,380 | 12,230 | |
| Huntington Bancshares, Inc. | 181,000 | 2,270 | |
| JPMorgan Chase & Co. (e) | 1,014,957 | 83,378 | |
| KeyCorp (e) | 723,920 | 12,647 | |
| Lloyds Banking Group PLC | 3,444,300 | 3,135 | |
| M&T Bank Corp. | 153,017 | 23,943 | |
| Prosperity Bancshares, Inc. | 7,900 | 495 | |
| Regions Financial Corp. (e) | 833,800 | 11,540 | |
| Standard Chartered PLC (United Kingdom) (a) | 381,284 | 3,596 | |
| SunTrust Banks, Inc. (e) | 317,300 | 16,934 | |
| U.S. Bancorp | 505,300 | 25,715 | |
| Wells Fargo & Co. (e) | 637,850 | 32,620 | |
| 264,155 | |||
| Capital Markets - 6.8% | |||
| Apollo Global Management LLC Class A | 71,300 | 1,927 | |
| Ares Capital Corp. | 252,842 | 4,210 | |
| Ares Management LP | 70,996 | 1,281 | |
| KKR & Co. LP | 1,870,896 | 34,462 | |
| Morgan Stanley (e) | 424,242 | 17,708 | |
| State Street Corp. | 404,999 | 32,991 | |
| The Blackstone Group LP | 1,421,503 | 46,739 | |
| TPG Specialty Lending, Inc. | 97,270 | 2,012 | |
| Virtu Financial, Inc. Class A (d) | 65,400 | 1,066 | |
| 142,396 | |||
| Insurance - 4.9% | |||
| American International Group, Inc. | 33,500 | 2,132 | |
| Chubb Ltd. | 356,684 | 51,074 | |
| Marsh & McLennan Companies, Inc. | 66,200 | 5,134 | |
| MetLife, Inc. (e) | 567,957 | 28,733 | |
| Prudential Financial, Inc. (e) | 139,598 | 14,637 | |
| 101,710 | |||
| Mortgage Real Estate Investment Trusts - 0.2% | |||
| KKR Real Estate Finance Trust, Inc. | 84,800 | 1,875 | |
| Two Harbors Investment Corp. | 156,941 | 1,566 | |
| 3,441 | |||
| Thrifts & Mortgage Finance - 0.2% | |||
| Radian Group, Inc. | 312,790 | 5,023 | |
| TOTAL FINANCIALS | 516,725 | ||
| HEALTH CARE - 10.0% | |||
| Biotechnology - 1.3% | |||
| Amgen, Inc. | 138,949 | 21,570 | |
| Gilead Sciences, Inc. | 83,800 | 5,438 | |
| 27,008 | |||
| Health Care Equipment & Supplies - 2.4% | |||
| Dentsply Sirona, Inc. | 97,300 | 6,180 | |
| Medtronic PLC | 518,982 | 43,740 | |
| 49,920 | |||
| Health Care Providers & Services - 0.1% | |||
| Anthem, Inc. | 8,200 | 1,495 | |
| Pharmaceuticals - 6.2% | |||
| Astellas Pharma, Inc. | 70,700 | 894 | |
| Bristol-Myers Squibb Co. | 141,300 | 7,623 | |
| GlaxoSmithKline PLC | 1,162,300 | 25,442 | |
| Johnson & Johnson | 530,718 | 68,065 | |
| Merck & Co., Inc. | 132,900 | 8,653 | |
| Pfizer, Inc. | 236,713 | 7,729 | |
| Sanofi SA | 67,634 | 6,699 | |
| Teva Pharmaceutical Industries Ltd. sponsored ADR | 170,700 | 4,756 | |
| 129,861 | |||
| TOTAL HEALTH CARE | 208,284 | ||
| INDUSTRIALS - 9.1% | |||
| Aerospace & Defense - 2.9% | |||
| General Dynamics Corp. | 79,100 | 16,077 | |
| Raytheon Co. | 52,800 | 8,660 | |
| United Technologies Corp. | 302,807 | 36,724 | |
| 61,461 | |||
| Air Freight & Logistics - 2.1% | |||
| C.H. Robinson Worldwide, Inc. | 34,879 | 2,337 | |
| PostNL NV | 1,460,800 | 7,140 | |
| United Parcel Service, Inc. Class B | 323,690 | 34,301 | |
| 43,778 | |||
| Airlines - 0.3% | |||
| Allegiant Travel Co. | 5,000 | 685 | |
| Copa Holdings SA Class A | 41,500 | 4,691 | |
| 5,376 | |||
| Commercial Services & Supplies - 0.8% | |||
| KAR Auction Services, Inc. | 294,904 | 12,849 | |
| Waste Connection, Inc. (Canada) | 32,193 | 3,063 | |
| 15,912 | |||
| Electrical Equipment - 0.9% | |||
| AMETEK, Inc. | 44,700 | 2,728 | |
| Eaton Corp. PLC | 164,800 | 12,752 | |
| Regal Beloit Corp. | 51,900 | 4,110 | |
| 19,590 | |||
| Industrial Conglomerates - 2.0% | |||
| General Electric Co. | 1,513,354 | 41,436 | |
| Machinery - 0.1% | |||
| Allison Transmission Holdings, Inc. | 65,900 | 2,552 | |
| TOTAL INDUSTRIALS | 190,105 | ||
| INFORMATION TECHNOLOGY - 10.7% | |||
| Communications Equipment - 3.7% | |||
| Cisco Systems, Inc. | 2,425,653 | 76,481 | |
| Electronic Equipment & Components - 0.9% | |||
| Dell Technologies, Inc. (a) | 128,100 | 8,889 | |
| TE Connectivity Ltd. | 122,230 | 9,638 | |
| 18,527 | |||
| IT Services - 1.6% | |||
| First Data Corp. (a)(f) | 779,769 | 13,357 | |
| First Data Corp. Class A (a) | 397,700 | 6,813 | |
| Leidos Holdings, Inc. | 20,500 | 1,139 | |
| Paychex, Inc. (e) | 125,678 | 7,444 | |
| Sabre Corp. (d) | 208,500 | 4,677 | |
| 33,430 | |||
| Semiconductors & Semiconductor Equipment - 2.5% | |||
| KLA-Tencor Corp. | 13,400 | 1,394 | |
| Maxim Integrated Products, Inc. | 213,200 | 10,191 | |
| Qualcomm, Inc. | 552,689 | 31,652 | |
| Taiwan Semiconductor Manufacturing Co. Ltd. sponsored ADR | 260,900 | 9,225 | |
| 52,462 | |||
| Software - 1.1% | |||
| Microsoft Corp. | 314,738 | 21,981 | |
| SS&C Technologies Holdings, Inc. | 44,700 | 1,680 | |
| 23,661 | |||
| Technology Hardware, Storage & Peripherals - 0.9% | |||
| Apple, Inc. (e) | 99,100 | 15,139 | |
| Inventec Corp. | 3,486,000 | 2,585 | |
| 17,724 | |||
| TOTAL INFORMATION TECHNOLOGY | 222,285 | ||
| MATERIALS - 1.9% | |||
| Chemicals - 1.3% | |||
| LyondellBasell Industries NV Class A | 102,400 | 8,245 | |
| Potash Corp. of Saskatchewan, Inc. | 196,400 | 3,244 | |
| The Dow Chemical Co. | 247,900 | 15,360 | |
| 26,849 | |||
| Containers & Packaging - 0.6% | |||
| WestRock Co. | 229,700 | 12,500 | |
| TOTAL MATERIALS | 39,349 | ||
| REAL ESTATE - 2.4% | |||
| Equity Real Estate Investment Trusts (REITs) - 2.4% | |||
| American Tower Corp. | 39,900 | 5,234 | |
| Cousins Properties, Inc. | 482,300 | 4,128 | |
| Crown Castle International Corp. | 109,500 | 11,131 | |
| Duke Realty Corp. | 189,400 | 5,430 | |
| First Potomac Realty Trust | 452,777 | 4,953 | |
| Piedmont Office Realty Trust, Inc. Class A | 262,635 | 5,565 | |
| Public Storage | 38,500 | 8,291 | |
| Sabra Health Care REIT, Inc. | 70,700 | 1,657 | |
| Ventas, Inc. | 64,294 | 4,275 | |
| 50,664 | |||
| TELECOMMUNICATION SERVICES - 3.8% | |||
| Diversified Telecommunication Services - 3.7% | |||
| AT&T, Inc. (e) | 798,027 | 30,748 | |
| Verizon Communications, Inc. | 969,590 | 45,222 | |
| 75,970 | |||
| Wireless Telecommunication Services - 0.1% | |||
| KDDI Corp. | 94,900 | 2,634 | |
| TOTAL TELECOMMUNICATION SERVICES | 78,604 | ||
| UTILITIES - 5.6% | |||
| Electric Utilities - 4.9% | |||
| American Electric Power Co., Inc. | 37,915 | 2,722 | |
| Duke Energy Corp. | 83,600 | 7,163 | |
| Entergy Corp. | 159,500 | 12,610 | |
| Exelon Corp. | 1,143,000 | 41,502 | |
| PPL Corp. | 540,100 | 21,555 | |
| Southern Co. | 219,525 | 11,110 | |
| Xcel Energy, Inc. | 111,900 | 5,361 | |
| 102,023 | |||
| Independent Power and Renewable Electricity Producers - 0.1% | |||
| The AES Corp. | 97,300 | 1,136 | |
| Multi-Utilities - 0.6% | |||
| CenterPoint Energy, Inc. | 283,300 | 8,105 | |
| Public Service Enterprise Group, Inc. | 102,100 | 4,585 | |
| 12,690 | |||
| TOTAL UTILITIES | 115,849 | ||
| TOTAL COMMON STOCKS | |||
| (Cost $1,670,173) | 2,050,844 | ||
| Convertible Preferred Stocks - 0.1% | |||
| FINANCIALS - 0.0% | |||
| Banks - 0.0% | |||
| Wells Fargo & Co. 7.50% | 430 | 544 | |
| TELECOMMUNICATION SERVICES - 0.1% | |||
| Wireless Telecommunication Services - 0.1% | |||
| T-Mobile U.S., Inc. Series A 5.50% | 8,000 | 874 | |
| UTILITIES - 0.0% | |||
| Multi-Utilities - 0.0% | |||
| CenterPoint Energy, Inc. 2.00% ZENS | 4,250 | 305 | |
| TOTAL CONVERTIBLE PREFERRED STOCKS | |||
| (Cost $1,353) | 1,723 | ||
| Principal Amount (000s) | Value (000s) | ||
| Corporate Bonds - 0.2% | |||
| Convertible Bonds - 0.2% | |||
| CONSUMER DISCRETIONARY - 0.0% | |||
| Media - 0.0% | |||
| DISH Network Corp. 2.375% 3/15/24 (f) | 910 | 952 | |
| ENERGY - 0.1% | |||
| Oil, Gas & Consumable Fuels - 0.1% | |||
| Amyris, Inc. 9.5% 4/15/19 pay-in-kind | 645 | 426 | |
| Chesapeake Energy Corp. 5.5% 9/15/26 (f) | 360 | 347 | |
| Scorpio Tankers, Inc. 2.375% 7/1/19 (f) | 1,015 | 897 | |
| 1,670 | |||
| INFORMATION TECHNOLOGY - 0.1% | |||
| Internet Software & Services - 0.1% | |||
| Twitter, Inc. 1% 9/15/21 | 1,317 | 1,208 | |
| VeriSign, Inc. 4.452% 8/15/37 (g) | 219 | 579 | |
| 1,787 | |||
| TOTAL CONVERTIBLE BONDS | 4,409 | ||
| Nonconvertible Bonds - 0.0% | |||
| FINANCIALS - 0.0% | |||
| Thrifts & Mortgage Finance - 0.0% | |||
| Prime Securities Services Borrower LLC/Prime Finance, Inc. 9.25% 5/15/23 (f) | 530 | 579 | |
| TOTAL CORPORATE BONDS | |||
| (Cost $4,901) | 4,988 | ||
| Preferred Securities - 0.0% | |||
| INDUSTRIALS - 0.0% | |||
| Industrial Conglomerates - 0.0% | |||
| General Electric Co. 5%(g)(h) | |||
| (Cost $1,209) | 1,150 | 1,240 | |
| Shares | Value (000s) | ||
| Other - 0.2% | |||
| ENERGY - 0.2% | |||
| Oil, Gas & Consumable Fuels - 0.2% | |||
| Utica Shale Drilling Program (non-operating revenue interest) (c)(i) | |||
| (Cost $3,910) | 3,910,236 | 3,910 | |
| Money Market Funds - 1.7% | |||
| Fidelity Cash Central Fund, 0.86% (j) | 22,569,183 | 22,574 | |
| Fidelity Securities Lending Cash Central Fund 0.87% (j)(k) | 12,446,570 | 12,448 | |
| TOTAL MONEY MARKET FUNDS | |||
| (Cost $35,016) | 35,022 | ||
| TOTAL INVESTMENT PORTFOLIO - 100.8% | |||
| (Cost $1,716,562) | 2,097,727 | ||
| NET OTHER ASSETS (LIABILITIES) - (0.8)% | (17,630) | ||
| NET ASSETS - 100% | $2,080,097 |
| Written Options | ||||
| Expiration Date/Exercise Price | Number of Contracts | Premium (000s) | Value (000s) | |
| Call Options | ||||
| Apple, Inc. | 7/21/17 - $165.00 | 241 | $26 | $(17) |
| AT&T, Inc. | 9/15/17 - $40.00 | 1,992 | 86 | (95) |
| Bank of America Corp. | 8/18/17 - $26.00 | 3,976 | 61 | (42) |
| Comerica, Inc. | 6/16/17 - $72.50 | 451 | 16 | (7) |
| JPMorgan Chase & Co. | 8/18/17 - $92.50 | 2,530 | 116 | (49) |
| KeyCorp | 9/15/17 - $20.00 | 1,804 | 34 | (31) |
| Marsh & McLennan Companies, Inc. | 7/21/17 - $75.00 | 165 | 21 | (54) |
| MetLife, Inc. | 9/15/17 - $55.00 | 1,416 | 94 | (93) |
| Morgan Stanley | 9/15/17 - $46.00 | 1,056 | 67 | (66) |
| Paychex, Inc. | 9/15/17 - $60.00 | 308 | 28 | (43) |
| Prudential Financial, Inc. | 9/15/17 - $115.00 | 342 | 42 | (41) |
| Regions Financial Corp. | 8/18/17 - $15.00 | 2,084 | 79 | (58) |
| SunTrust Banks, Inc. | 7/21/17 - $60.00 | 790 | 17 | (10) |
| Wells Fargo & Co. | 9/15/17 - $57.50 | 1,593 | 97 | (48) |
| TOTAL WRITTEN OPTIONS | $784 | $(654) |
Legend
(a) Non-income producing
(b) Investment is owned by an entity that is treated as a U.S. Corporation for tax purposes in which the Fund holds a percentage ownership.
(c) Restricted securities - Investment in securities not registered under the Securities Act of 1933 (excluding 144A issues). At the end of the period, the value of restricted securities (excluding 144A issues) amounted to $5,922,000 or 0.3% of net assets.
(d) Security or a portion of the security is on loan at period end.
(e) Security or a portion of the security is pledged as collateral for call options written. At period end, the value of securities pledged amounted to $79,523,000.
(f) Security exempt from registration under Rule 144A of the Securities Act of 1933. These securities may be resold in transactions exempt from registration, normally to qualified institutional buyers. At the end of the period, the value of these securities amounted to $16,132,000 or 0.8% of net assets.
(g) Coupon rates for floating and adjustable rate securities reflect the rates in effect at period end.
(h) Security is perpetual in nature with no stated maturity date.
(i) Investment is owned by a wholly-owned subsidiary (Subsidiary) that is treated as a corporation for U.S. tax purposes.
(j) Affiliated fund that is generally available only to investment companies and other accounts managed by Fidelity Investments. The rate quoted is the annualized seven-day yield of the fund at period end. A complete unaudited listing of the fund's holdings as of its most recent quarter end is available upon request. In addition, each Fidelity Central Fund's financial statements are available on the SEC's website or upon request.
(k) Investment made with cash collateral received from securities on loan.
Additional information on each restricted holding is as follows:
| Security | Acquisition Date | Acquisition Cost (000s) |
| New Academy Holding Co. LLC unit | 8/1/11 | $5,565 |
| Utica Shale Drilling Program (non-operating revenue interest) | 10/5/16 - 11/4/16 | $3,910 |
Affiliated Central Funds
Information regarding fiscal year to date income earned by the Fund from investments in Fidelity Central Funds is as follows:
| Fund | Income earned |
| (Amounts in thousands) | |
| Fidelity Cash Central Fund | $317 |
| Fidelity Securities Lending Cash Central Fund | 71 |
| Total | $388 |
Investment Valuation
The following is a summary of the inputs used, as of May 31, 2017, involving the Fund's assets and liabilities carried at fair value. The inputs or methodology used for valuing securities may not be an indication of the risk associated with investing in those securities. For more information on valuation inputs, and their aggregation into the levels used below, please refer to the Investment Valuation section in the accompanying Notes to Financial Statements.
| Valuation Inputs at Reporting Date: | ||||
| Description | Total | Level 1 | Level 2 | Level 3 |
| (Amounts in thousands) | ||||
| Investments in Securities: | ||||
| Equities: | ||||
| Consumer Discretionary | $186,243 | $184,231 | $-- | $2,012 |
| Consumer Staples | 214,889 | 214,889 | -- | -- |
| Energy | 227,847 | 227,847 | -- | -- |
| Financials | 517,269 | 513,590 | 3,679 | -- |
| Health Care | 208,284 | 175,249 | 33,035 | -- |
| Industrials | 190,105 | 190,105 | -- | -- |
| Information Technology | 222,285 | 222,285 | -- | -- |
| Materials | 39,349 | 39,349 | -- | -- |
| Real Estate | 50,664 | 50,664 | -- | -- |
| Telecommunication Services | 79,478 | 75,970 | 3,508 | -- |
| Utilities | 116,154 | 115,849 | 305 | -- |
| Corporate Bonds | 4,988 | -- | 4,988 | -- |
| Preferred Securities | 1,240 | -- | 1,240 | -- |
| Other | 3,910 | -- | -- | 3,910 |
| Money Market Funds | 35,022 | 35,022 | -- | -- |
| Total Investments in Securities: | $2,097,727 | $2,045,050 | $46,755 | $5,922 |
| Derivative Instruments: | ||||
| Liabilities | ||||
| Written Options | $(654) | $(600) | $(54) | $-- |
| Total Liabilities | $(654) | $(600) | $(54) | $-- |
| Total Derivative Instruments: | $(654) | $(600) | $(54) | $-- |
Value of Derivative Instruments
The following table is a summary of the Fund's value of derivative instruments by primary risk exposure as of May 31, 2017. For additional information on derivative instruments, please refer to the Derivative Instruments section in the accompanying Notes to Financial Statements.
| Primary Risk Exposure / Derivative Type | Value | |
| Asset | Liability | |
| (Amounts in thousands) | ||
| Equity Risk | ||
| Written Options(a) | $0 | $(654) |
| Total Equity Risk | 0 | (654) |
| Total Value of Derivatives | $0 | $(654) |
(a) Gross value is presented in the Statement of Assets and Liabilities in the written options, at value line-item.
Other Information
Distribution of investments by country or territory of incorporation, as a percentage of Total Net Assets, is as follows (Unaudited):
| United States of America | 86.9% |
| Switzerland | 3.0% |
| Ireland | 2.7% |
| United Kingdom | 2.0% |
| Canada | 1.8% |
| Netherlands | 1.5% |
| Others (Individually Less Than 1%) | 2.1% |
| 100.0% |
See accompanying notes which are an integral part of the financial statements.
Financial Statements
Statement of Assets and Liabilities
| Amounts in thousands (except per-share amounts) | May 31, 2017 (Unaudited) | |
| Assets | ||
| Investment in securities, at value (including securities loaned of $12,195) — See accompanying schedule: Unaffiliated issuers (cost $1,681,546) | $2,062,705 | |
| Fidelity Central Funds (cost $35,016) | 35,022 | |
| Total Investments (cost $1,716,562) | $2,097,727 | |
| Cash | 33 | |
| Restricted cash | 49 | |
| Receivable for investments sold | 2,760 | |
| Receivable for fund shares sold | 330 | |
| Dividends receivable | 5,063 | |
| Interest receivable | 38 | |
| Distributions receivable from Fidelity Central Funds | 52 | |
| Prepaid expenses | 1 | |
| Other receivables | 98 | |
| Total assets | 2,106,151 | |
| Liabilities | ||
| Payable for investments purchased | $1,792 | |
| Payable for fund shares redeemed | 9,183 | |
| Accrued management fee | 802 | |
| Distribution and service plan fees payable | 641 | |
| Written options, at value (premium received $784) | 654 | |
| Other affiliated payables | 402 | |
| Other payables and accrued expenses | 133 | |
| Collateral on securities loaned | 12,447 | |
| Total liabilities | 26,054 | |
| Net Assets | $2,080,097 | |
| Net Assets consist of: | ||
| Paid in capital | $1,677,416 | |
| Undistributed net investment income | 2,131 | |
| Accumulated undistributed net realized gain (loss) on investments and foreign currency transactions | 19,256 | |
| Net unrealized appreciation (depreciation) on investments and assets and liabilities in foreign currencies | 381,294 | |
| Net Assets | $2,080,097 | |
| Calculation of Maximum Offering Price | ||
| Class A: | ||
| Net Asset Value and redemption price per share ($692,146 ÷ 21,053.6 shares) | $32.88 | |
| Maximum offering price per share (100/94.25 of $32.88) | $34.89 | |
| Class M: | ||
| Net Asset Value and redemption price per share ($778,031 ÷ 23,209.5 shares) | $33.52 | |
| Maximum offering price per share (100/96.50 of $33.52) | $34.74 | |
| Class C: | ||
| Net Asset Value and offering price per share ($200,042 ÷ 6,052.9 shares)(a) | $33.05 | |
| Class I: | ||
| Net Asset Value, offering price and redemption price per share ($392,556 ÷ 11,476.6 shares) | $34.20 | |
| Class Z: | ||
| Net Asset Value, offering price and redemption price per share ($17,322 ÷ 506.5 shares) | $34.20 |
(a) Redemption price per share is equal to net asset value less any applicable contingent deferred sales charge.
See accompanying notes which are an integral part of the financial statements.
Statement of Operations
| Amounts in thousands | Six months ended May 31, 2017 (Unaudited) | |
| Investment Income | ||
| Dividends | $27,671 | |
| Interest | 250 | |
| Income from Fidelity Central Funds | 387 | |
| Income before foreign taxes withheld | 28,308 | |
| Less foreign taxes withheld | 28 | |
| Total income | 28,336 | |
| Expenses | ||
| Management fee | $4,897 | |
| Transfer agent fees | 2,115 | |
| Distribution and service plan fees | 3,916 | |
| Accounting and security lending fees | 331 | |
| Custodian fees and expenses | 24 | |
| Independent trustees' fees and expenses | 4 | |
| Registration fees | 52 | |
| Audit | 31 | |
| Legal | 6 | |
| Miscellaneous | 12 | |
| Total expenses before reductions | 11,388 | |
| Expense reductions | (29) | 11,359 |
| Net investment income (loss) | 16,977 | |
| Realized and Unrealized Gain (Loss) | ||
| Net realized gain (loss) on: | ||
| Investment securities: | ||
| Unaffiliated issuers | 18,732 | |
| Fidelity Central Funds | 9 | |
| Foreign currency transactions | (13) | |
| Written options | 1,784 | |
| Total net realized gain (loss) | 20,512 | |
| Change in net unrealized appreciation (depreciation) on: Investment securities | 65,772 | |
| Assets and liabilities in foreign currencies | 5 | |
| Written options | 2,723 | |
| Total change in net unrealized appreciation (depreciation) | 68,500 | |
| Net gain (loss) | 89,012 | |
| Net increase (decrease) in net assets resulting from operations | $105,989 |
See accompanying notes which are an integral part of the financial statements.
Statement of Changes in Net Assets
| Amounts in thousands | Six months ended May 31, 2017 (Unaudited) | Year ended November 30, 2016 |
| Increase (Decrease) in Net Assets | ||
| Operations | ||
| Net investment income (loss) | $16,977 | $39,372 |
| Net realized gain (loss) | 20,512 | 20,185 |
| Change in net unrealized appreciation (depreciation) | 68,500 | 199,690 |
| Net increase (decrease) in net assets resulting from operations | 105,989 | 259,247 |
| Distributions to shareholders from net investment income | (22,306) | (43,001) |
| Distributions to shareholders from net realized gain | (26,509) | (143,228) |
| Total distributions | (48,815) | (186,229) |
| Share transactions - net increase (decrease) | (119,703) | (70,794) |
| Total increase (decrease) in net assets | (62,529) | 2,224 |
| Net Assets | ||
| Beginning of period | 2,142,626 | 2,140,402 |
| End of period | $2,080,097 | $2,142,626 |
| Other Information | ||
| Undistributed net investment income end of period | $2,131 | $7,460 |
See accompanying notes which are an integral part of the financial statements.
Financial Highlights — Fidelity Advisor Equity Income Fund Class A
| Six months ended (Unaudited) May 31, | Years ended November 30, | |||||
| 2017 | 2016 | 2015 | 2014 | 2013 | 2012 | |
| Selected Per–Share Data | ||||||
| Net asset value, beginning of period | $32.05 | $31.10 | $34.44 | $31.60 | $25.55 | $22.18 |
| Income from Investment Operations | ||||||
| Net investment income (loss)A | .27 | .59 | .92 | .84B | .60 | .61 |
| Net realized and unrealized gain (loss) | 1.32 | 3.13 | (2.15) | 2.67 | 6.06 | 3.32 |
| Total from investment operations | 1.59 | 3.72 | (1.23) | 3.51 | 6.66 | 3.93 |
| Distributions from net investment income | (.36) | (.66) | (.98) | (.64) | (.58) | (.56) |
| Distributions from net realized gain | (.40) | (2.11) | (1.14) | (.04) | (.03) | – |
| Total distributions | (.76) | (2.77) | (2.11)C | (.67)D | (.61) | (.56) |
| Net asset value, end of period | $32.88 | $32.05 | $31.10 | $34.44 | $31.60 | $25.55 |
| Total ReturnE,F,G | 5.00% | 13.52% | (3.61)% | 11.28% | 26.43% | 17.90% |
| Ratios to Average Net AssetsH,I | ||||||
| Expenses before reductions | .94%J | .95% | .95% | .96% | .98% | 1.02% |
| Expenses net of fee waivers, if any | .94%J | .95% | .95% | .96% | .98% | 1.02% |
| Expenses net of all reductions | .93%J | .95% | .94% | .95% | .97% | 1.01% |
| Net investment income (loss) | 1.65%J | 2.01% | 2.85% | 2.55%B | 2.07% | 2.52% |
| Supplemental Data | ||||||
| Net assets, end of period (in millions) | $692 | $703 | $688 | $794 | $777 | $646 |
| Portfolio turnover rateK | 20%J | 36% | 53% | 33% | 34% | 49% |
A Calculated based on average shares outstanding during the period.
B Net Investment income per share reflects a large, non-recurring dividend which amounted to $.11 per share. Excluding this non-recurring dividend, the ratio of net investment income (loss) to average net assets would have been 2.21%.
C Total distributions of $2.11 per share is comprised of distributions from net investment income of $.975 and distributions from net realized gain of $1.136 per share.
D Total distributions of $.67 per share is comprised of distributions from net investment income of $.636 and distributions from net realized gain of $.038 per share.
E Total returns for periods of less than one year are not annualized.
F Total returns would have been lower if certain expenses had not been reduced during the applicable periods shown.
G Total returns do not include the effect of the sales charges.
H Fees and expenses of any underlying Fidelity Central Funds are not included in the Fund's expense ratio. The Fund indirectly bears its proportionate share of the expenses of any underlying Fidelity Central Funds.
I Expense ratios reflect operating expenses of the class. Expenses before reductions do not reflect amounts reimbursed by the investment adviser or reductions from brokerage service arrangements or reductions from other expense offset arrangements and do not represent the amount paid by the class during periods when reimbursements or reductions occur. Expenses net of fee waivers reflect expenses after reimbursement by the investment adviser but prior to reductions from brokerage service arrangements or other expense offset arrangements. Expenses net of all reductions represent the net expenses paid by the class.
J Annualized
K Amount does not include the portfolio activity of any underlying Fidelity Central Funds.
See accompanying notes which are an integral part of the financial statements.
Financial Highlights — Fidelity Advisor Equity Income Fund Class M
| Six months ended (Unaudited) May 31, | Years ended November 30, | |||||
| 2017 | 2016 | 2015 | 2014 | 2013 | 2012 | |
| Selected Per–Share Data | ||||||
| Net asset value, beginning of period | $32.66 | $31.64 | $34.99 | $32.09 | $25.94 | $22.50 |
| Income from Investment Operations | ||||||
| Net investment income (loss)A | .24 | .53 | .86 | .78B | .55 | .57 |
| Net realized and unrealized gain (loss) | 1.34 | 3.19 | (2.18) | 2.72 | 6.15 | 3.37 |
| Total from investment operations | 1.58 | 3.72 | (1.32) | 3.50 | 6.70 | 3.94 |
| Distributions from net investment income | (.32) | (.59) | (.89) | (.56) | (.52) | (.50) |
| Distributions from net realized gain | (.40) | (2.11) | (1.14) | (.04) | (.03) | – |
| Total distributions | (.72) | (2.70) | (2.03) | (.60) | (.55) | (.50) |
| Net asset value, end of period | $33.52 | $32.66 | $31.64 | $34.99 | $32.09 | $25.94 |
| Total ReturnC,D,E | 4.87% | 13.24% | (3.83)% | 11.04% | 26.14% | 17.70% |
| Ratios to Average Net AssetsF,G | ||||||
| Expenses before reductions | 1.17%H | 1.18% | 1.18% | 1.18% | 1.19% | 1.21% |
| Expenses net of fee waivers, if any | 1.17%H | 1.18% | 1.18% | 1.18% | 1.19% | 1.21% |
| Expenses net of all reductions | 1.17%H | 1.18% | 1.17% | 1.18% | 1.18% | 1.21% |
| Net investment income (loss) | 1.41%H | 1.78% | 2.62% | 2.33%B | 1.86% | 2.32% |
| Supplemental Data | ||||||
| Net assets, end of period (in millions) | $778 | $787 | $813 | $974 | $984 | $854 |
| Portfolio turnover rateI | 20%H | 36% | 53% | 33% | 34% | 49% |
A Calculated based on average shares outstanding during the period.
B Net Investment income per share reflects a large, non-recurring dividend which amounted to $.11 per share. Excluding this non-recurring dividend, the ratio of net investment income (loss) to average net assets would have been 1.98%.
C Total returns for periods of less than one year are not annualized.
D Total returns would have been lower if certain expenses had not been reduced during the applicable periods shown.
E Total returns do not include the effect of the sales charges.
F Fees and expenses of any underlying Fidelity Central Funds are not included in the Fund's expense ratio. The Fund indirectly bears its proportionate share of the expenses of any underlying Fidelity Central Funds.
G Expense ratios reflect operating expenses of the class. Expenses before reductions do not reflect amounts reimbursed by the investment adviser or reductions from brokerage service arrangements or reductions from other expense offset arrangements and do not represent the amount paid by the class during periods when reimbursements or reductions occur. Expenses net of fee waivers reflect expenses after reimbursement by the investment adviser but prior to reductions from brokerage service arrangements or other expense offset arrangements. Expenses net of all reductions represent the net expenses paid by the class.
H Annualized
I Amount does not include the portfolio activity of any underlying Fidelity Central Funds.
See accompanying notes which are an integral part of the financial statements.
Financial Highlights — Fidelity Advisor Equity Income Fund Class C
| Six months ended (Unaudited) May 31, | Years ended November 30, | |||||
| 2017 | 2016 | 2015 | 2014 | 2013 | 2012 | |
| Selected Per–Share Data | ||||||
| Net asset value, beginning of period | $32.21 | $31.24 | $34.57 | $31.73 | $25.66 | $22.27 |
| Income from Investment Operations | ||||||
| Net investment income (loss)A | .15 | .37 | .68 | .59B | .38 | .43 |
| Net realized and unrealized gain (loss) | 1.32 | 3.14 | (2.15) | 2.69 | 6.09 | 3.33 |
| Total from investment operations | 1.47 | 3.51 | (1.47) | 3.28 | 6.47 | 3.76 |
| Distributions from net investment income | (.23) | (.43) | (.72) | (.40) | (.37) | (.37) |
| Distributions from net realized gain | (.40) | (2.11) | (1.14) | (.04) | (.03) | – |
| Total distributions | (.63) | (2.54) | (1.86) | (.44) | (.40) | (.37) |
| Net asset value, end of period | $33.05 | $32.21 | $31.24 | $34.57 | $31.73 | $25.66 |
| Total ReturnC,D,E | 4.60% | 12.63% | (4.34)% | 10.44% | 25.46% | 17.03% |
| Ratios to Average Net AssetsF,G | ||||||
| Expenses before reductions | 1.71%H | 1.72% | 1.72% | 1.72% | 1.74% | 1.77% |
| Expenses net of fee waivers, if any | 1.70%H | 1.72% | 1.71% | 1.72% | 1.74% | 1.77% |
| Expenses net of all reductions | 1.70%H | 1.71% | 1.71% | 1.71% | 1.73% | 1.77% |
| Net investment income (loss) | .88%H | 1.24% | 2.09% | 1.79%B | 1.32% | 1.76% |
| Supplemental Data | ||||||
| Net assets, end of period (in millions) | $200 | $198 | $187 | $214 | $195 | $143 |
| Portfolio turnover rateI | 20%H | 36% | 53% | 33% | 34% | 49% |
A Calculated based on average shares outstanding during the period.
B Net Investment income per share reflects a large, non-recurring dividend which amounted to $.11 per share. Excluding this non-recurring dividend, the ratio of net investment income (loss) to average net assets would have been 1.45%.
C Total returns for periods of less than one year are not annualized.
D Total returns would have been lower if certain expenses had not been reduced during the applicable periods shown.
E Total returns do not include the effect of the contingent deferred sales charge.
F Fees and expenses of any underlying Fidelity Central Funds are not included in the Fund's expense ratio. The Fund indirectly bears its proportionate share of the expenses of any underlying Fidelity Central Funds.
G Expense ratios reflect operating expenses of the class. Expenses before reductions do not reflect amounts reimbursed by the investment adviser or reductions from brokerage service arrangements or reductions from other expense offset arrangements and do not represent the amount paid by the class during periods when reimbursements or reductions occur. Expenses net of fee waivers reflect expenses after reimbursement by the investment adviser but prior to reductions from brokerage service arrangements or other expense offset arrangements. Expenses net of all reductions represent the net expenses paid by the class.
H Annualized
I Amount does not include the portfolio activity of any underlying Fidelity Central Funds.
See accompanying notes which are an integral part of the financial statements.
Financial Highlights — Fidelity Advisor Equity Income Fund Class I
| Six months ended (Unaudited) May 31, | Years ended November 30, | |||||
| 2017 | 2016 | 2015 | 2014 | 2013 | 2012 | |
| Selected Per–Share Data | ||||||
| Net asset value, beginning of period | $33.31 | $32.21 | $35.59 | $32.62 | $26.36 | $22.86 |
| Income from Investment Operations | ||||||
| Net investment income (loss)A | .32 | .69 | 1.04 | .95B | .70 | .70 |
| Net realized and unrealized gain (loss) | 1.37 | 3.26 | (2.23) | 2.77 | 6.24 | 3.43 |
| Total from investment operations | 1.69 | 3.95 | (1.19) | 3.72 | 6.94 | 4.13 |
| Distributions from net investment income | (.40) | (.74) | (1.06) | (.72) | (.65) | (.63) |
| Distributions from net realized gain | (.40) | (2.11) | (1.14) | (.04) | (.03) | – |
| Total distributions | (.80) | (2.85) | (2.19)C | (.75)D | (.68) | (.63) |
| Net asset value, end of period | $34.20 | $33.31 | $32.21 | $35.59 | $32.62 | $26.36 |
| Total ReturnE,F | 5.11% | 13.82% | (3.37)% | 11.59% | 26.72% | 18.27% |
| Ratios to Average Net AssetsG,H | ||||||
| Expenses before reductions | .68%I | .69% | .69% | .70% | .72% | .73% |
| Expenses net of fee waivers, if any | .68%I | .69% | .69% | .70% | .72% | .73% |
| Expenses net of all reductions | .68%I | .68% | .69% | .70% | .71% | .73% |
| Net investment income (loss) | 1.90%I | 2.27% | 3.11% | 2.81%B | 2.34% | 2.80% |
| Supplemental Data | ||||||
| Net assets, end of period (in millions) | $393 | $439 | $428 | $496 | $483 | $445 |
| Portfolio turnover rateJ | 20%I | 36% | 53% | 33% | 34% | 49% |
A Calculated based on average shares outstanding during the period.
B Net Investment income per share reflects a large, non-recurring dividend which amounted to $.12 per share. Excluding this non-recurring dividend, the ratio of net investment income (loss) to average net assets would have been 2.46%.
C Total distributions of $2.19 per share is comprised of distributions from net investment income of $1.058 and distributions from net realized gain of $1.136 per share.
D Total distributions of $.75 per share is comprised of distributions from net investment income of $.716 and distributions from net realized gain of $.038 per share.
E Total returns for periods of less than one year are not annualized.
F Total returns would have been lower if certain expenses had not been reduced during the applicable periods shown.
G Fees and expenses of any underlying Fidelity Central Funds are not included in the Fund's expense ratio. The Fund indirectly bears its proportionate share of the expenses of any underlying Fidelity Central Funds.
H Expense ratios reflect operating expenses of the class. Expenses before reductions do not reflect amounts reimbursed by the investment adviser or reductions from brokerage service arrangements or reductions from other expense offset arrangements and do not represent the amount paid by the class during periods when reimbursements or reductions occur. Expenses net of fee waivers reflect expenses after reimbursement by the investment adviser but prior to reductions from brokerage service arrangements or other expense offset arrangements. Expenses net of all reductions represent the net expenses paid by the class.
I Annualized
J Amount does not include the portfolio activity of any underlying Fidelity Central Funds.
See accompanying notes which are an integral part of the financial statements.
Financial Highlights — Fidelity Advisor Equity Income Fund Class Z
| Six months ended (Unaudited) May 31, | Years ended November 30, | ||||
| 2017 | 2016 | 2015 | 2014 | 2013 A | |
| Selected Per–Share Data | |||||
| Net asset value, beginning of period | $33.30 | $32.21 | $35.59 | $32.63 | $31.44 |
| Income from Investment Operations | |||||
| Net investment income (loss)B | .35 | .74 | 1.08 | 1.03C | .23 |
| Net realized and unrealized gain (loss) | 1.37 | 3.24 | (2.21) | 2.74 | 1.12 |
| Total from investment operations | 1.72 | 3.98 | (1.13) | 3.77 | 1.35 |
| Distributions from net investment income | (.42) | (.79) | (1.11) | (.78) | (.16) |
| Distributions from net realized gain | (.40) | (2.11) | (1.14) | (.04) | – |
| Total distributions | (.82) | (2.89)D | (2.25) | (.81)E | (.16) |
| Net asset value, end of period | $34.20 | $33.30 | $32.21 | $35.59 | $32.63 |
| Total ReturnF,G | 5.22% | 13.96% | (3.20)% | 11.75% | 4.30% |
| Ratios to Average Net AssetsH,I | |||||
| Expenses before reductions | .54%J | .54% | .54% | .54% | .54%J |
| Expenses net of fee waivers, if any | .53%J | .54% | .54% | .54% | .54%J |
| Expenses net of all reductions | .53%J | .53% | .53% | .54% | .54%J |
| Net investment income (loss) | 2.05%J | 2.42% | 3.26% | 2.97%C | 2.37%J |
| Supplemental Data | |||||
| Net assets, end of period (in millions) | $17 | $15 | $14 | $4 | $– |
| Portfolio turnover rateK | 20%J | 36% | 53% | 33% | 34% |
A For the period August 13, 2013 (commencement of sale of shares) to November 30, 2013.
B Calculated based on average shares outstanding during the period.
C Net Investment income per share reflects a large, non-recurring dividend which amounted to $.12 per share. Excluding this non-recurring dividend, the ratio of net investment income (loss) to average net assets would have been 2.62%.
D Total distributions of $2.89 per share is comprised of distributions from net investment income of $.788 and distributions from net realized gain of $2.106 per share.
E Total distributions of $.81 per share is comprised of distributions from net investment income of $.775 and distributions from net realized gain of $.038 per share.
F Total returns for periods of less than one year are not annualized.
G Total returns would have been lower if certain expenses had not been reduced during the applicable periods shown.
H Fees and expenses of any underlying Fidelity Central Funds are not included in the Fund's expense ratio. The Fund indirectly bears its proportionate share of the expenses of any underlying Fidelity Central Funds.
I Expense ratios reflect operating expenses of the class. Expenses before reductions do not reflect amounts reimbursed by the investment adviser or reductions from brokerage service arrangements or reductions from other expense offset arrangements and do not represent the amount paid by the class during periods when reimbursements or reductions occur. Expense ratios before reductions for start-up periods may not be representative of longer-term operating periods. Expenses net of fee waivers reflect expenses after reimbursement by the investment adviser but prior to reductions from brokerage service arrangements or other expense offset arrangements. Expenses net of all reductions represent the net expenses paid by the class.
J Annualized
K Amount does not include the portfolio activity of any underlying Fidelity Central Funds.
See accompanying notes which are an integral part of the financial statements.
Notes to Financial Statements (Unaudited)
For the period ended May 31, 2017
(Amounts in thousands except percentages)
1. Organization.
Fidelity Advisor Equity Income Fund (the Fund) is a fund of Fidelity Advisor Series I (the Trust) and is authorized to issue an unlimited number of shares. The Trust is registered under the Investment Company Act of 1940, as amended (the 1940 Act), as an open-end management investment company organized as a Massachusetts business trust. The Fund offers Class A, Class M (formerly Class T), Class C, Class I and Class Z shares, each of which has equal rights as to assets and voting privileges. Each class has exclusive voting rights with respect to matters that affect that class.
After the close of business on June 24, 2016, all outstanding Class B shares were converted to Class A shares. All prior fiscal period dollar and share amounts for Class B presented in the Notes to Financial Statements are for the period December 1, 2015 through June 24, 2016.
2. Investments in Fidelity Central Funds.
The Fund invests in Fidelity Central Funds, which are open-end investment companies generally available only to other investment companies and accounts managed by the investment adviser and its affiliates. The Fund's Schedule of Investments lists each of the Fidelity Central Funds held as of period end, if any, as an investment of the Fund, but does not include the underlying holdings of each Fidelity Central Fund. As an Investing Fund, the Fund indirectly bears its proportionate share of the expenses of the underlying Fidelity Central Funds.
The Money Market Central Funds seek preservation of capital and current income and are managed by Fidelity Investments Money Management, Inc. (FIMM), an affiliate of the investment adviser. Annualized expenses of the Money Market Central Funds as of their most recent shareholder report date are less than .005%.
A complete unaudited list of holdings for each Fidelity Central Fund is available upon request or at the Securities and Exchange Commission (the SEC) website at www.sec.gov. In addition, the financial statements of the Fidelity Central Funds are available on the SEC website or upon request.
3. Significant Accounting Policies.
The Fund is an investment company and applies the accounting and reporting guidance of the Financial Accounting Standards Board (FASB) Accounting Standards Codification Topic 946 Financial Services – Investments Companies. The financial statements have been prepared in conformity with accounting principles generally accepted in the United States of America (GAAP), which require management to make certain estimates and assumptions at the date of the financial statements. Actual results could differ from those estimates. Subsequent events, if any, through the date that the financial statements were issued have been evaluated in the preparation of the financial statements. The following summarizes the significant accounting policies of the Fund:
Investment Valuation. Investments are valued as of 4:00 p.m. Eastern time on the last calendar day of the period. The Board of Trustees (the Board) has delegated the day to day responsibility for the valuation of the Fund's investments to the Fair Value Committee (the Committee) established by the Fund's investment adviser. In accordance with valuation policies and procedures approved by the Board, the Fund attempts to obtain prices from one or more third party pricing vendors or brokers to value its investments. When current market prices, quotations or currency exchange rates are not readily available or reliable, investments will be fair valued in good faith by the Committee, in accordance with procedures adopted by the Board. Factors used in determining fair value vary by investment type and may include market or investment specific events, changes in interest rates and credit quality. The frequency with which these procedures are used cannot be predicted and they may be utilized to a significant extent. The Committee oversees the Fund's valuation policies and procedures and reports to the Board on the Committee's activities and fair value determinations. The Board monitors the appropriateness of the procedures used in valuing the Fund's investments and ratifies the fair value determinations of the Committee.
The Fund categorizes the inputs to valuation techniques used to value its investments into a disclosure hierarchy consisting of three levels as shown below:
- Level 1 – quoted prices in active markets for identical investments
- Level 2 – other significant observable inputs (including quoted prices for similar investments, interest rates, prepayment speeds, etc.)
- Level 3 – unobservable inputs (including the Fund's own assumptions based on the best information available)
Valuation techniques used to value the Fund's investments by major category are as follows:
Equity securities, including restricted securities, for which market quotations are readily available, are valued at the last reported sale price or official closing price as reported by a third party pricing vendor on the primary market or exchange on which they are traded and are categorized as Level 1 in the hierarchy. In the event there were no sales during the day or closing prices are not available, securities are valued at the last quoted bid price or may be valued using the last available price and are generally categorized as Level 2 in the hierarchy. For foreign equity securities, when market or security specific events arise, comparisons to the valuation of American Depositary Receipts (ADRs), futures contracts, Exchange-Traded Funds (ETFs) and certain indexes as well as quoted prices for similar securities may be used and would be categorized as Level 2 in the hierarchy. Utilizing these techniques may result in transfers between Level 1 and Level 2. For equity securities, including restricted securities, where observable inputs are limited, assumptions about market activity and risk are used and these securities may be categorized as Level 3 in the hierarchy.
Debt securities, including restricted securities, are valued based on evaluated prices received from third party pricing vendors or from brokers who make markets in such securities. Corporate bonds and preferred securities are valued by pricing vendors who utilize matrix pricing which considers yield or price of bonds of comparable quality, coupon, maturity and type or by broker-supplied prices. When independent prices are unavailable or unreliable, debt securities may be valued utilizing pricing methodologies which consider similar factors that would be used by third party pricing vendors. Debt securities are generally categorized as Level 2 in the hierarchy but may be Level 3 depending on the circumstances.
Exchange-traded options are valued using the last sale price or, in the absence of a sale, the last offering price and are categorized as Level 1 in the hierarchy. Options traded over-the-counter are valued using broker-supplied valuations and are categorized as Level 2 in the hierarchy. Investments in open-end mutual funds, including the Fidelity Central Funds, are valued at their closing net asset value (NAV) each business day and are categorized as Level 1 in the hierarchy.
Changes in valuation techniques may result in transfers in or out of an assigned level within the disclosure hierarchy. The aggregate value of investments by input level as of May 31, 2017 is included at the end of the Fund's Schedule of Investments.
Foreign Currency. The Fund may use foreign currency contracts to facilitate transactions in foreign-denominated securities. Gains and losses from these transactions may arise from changes in the value of the foreign currency or if the counterparties do not perform under the contracts' terms.
Foreign-denominated assets, including investment securities, and liabilities are translated into U.S. dollars at the exchange rates at period end. Purchases and sales of investment securities, income and dividends received and expenses denominated in foreign currencies are translated into U.S. dollars at the exchange rate in effect on the transaction date.
The effects of exchange rate fluctuations on investments are included with the net realized and unrealized gain (loss) on investment securities. Other foreign currency transactions resulting in realized and unrealized gain (loss) are disclosed separately.
Investment Transactions and Income. For financial reporting purposes, the Fund's investment holdings and NAV include trades executed through the end of the last business day of the period. The NAV per share for processing shareholder transactions is calculated as of the close of business of the New York Stock Exchange (NYSE), normally 4:00 p.m. Eastern time and includes trades executed through the end of the prior business day. Gains and losses on securities sold are determined on the basis of identified cost and may include proceeds received from litigation. Dividend income is recorded on the ex-dividend date, except for certain dividends from foreign securities where the ex-dividend date may have passed, which are recorded as soon as the Fund is informed of the ex-dividend date. Non-cash dividends included in dividend income, if any, are recorded at the fair market value of the securities received. Income and capital gain distributions from Fidelity Central Funds, if any, are recorded on the ex-dividend date. Certain distributions received by the Fund represent a return of capital or capital gain. The Fund determines the components of these distributions subsequent to the ex-dividend date, based upon receipt of tax filings or other correspondence relating to the underlying investment. These distributions are recorded as a reduction of cost of investments and/or as a realized gain. Interest income is accrued as earned and includes coupon interest and amortization of premium and accretion of discount on debt securities as applicable. Investment income is recorded net of foreign taxes withheld where recovery of such taxes is uncertain. Debt obligations may be placed on non-accrual status and related interest income may be reduced by ceasing current accruals and writing off interest receivables when the collection of all or a portion of interest has become doubtful based on consistently applied procedures. A debt obligation is removed from non-accrual status when the issuer resumes interest payments or when collectability of interest is reasonably assured.
Class Allocations and Expenses. Investment income, realized and unrealized capital gains and losses, common expenses of the Fund, and certain fund-level expense reductions, if any, are allocated daily on a pro-rata basis to each class based on the relative net assets of each class to the total net assets of the Fund. Each class differs with respect to transfer agent and distribution and service plan fees incurred. Certain expense reductions may also differ by class. For the reporting period, the allocated portion of income and expenses to each class as a percent of its average net assets may vary due to the timing of recording these transactions in relation to fluctuating net assets of the classes. Expenses directly attributable to a fund are charged to that fund. Expenses attributable to more than one fund are allocated among the respective funds on the basis of relative net assets or other appropriate methods. Expense estimates are accrued in the period to which they relate and adjustments are made when actual amounts are known.
Deferred Trustee Compensation. Under a Deferred Compensation Plan (the Plan), independent Trustees may elect to defer receipt of a portion of their annual compensation. Deferred amounts are invested in a cross-section of Fidelity funds, are marked-to-market and remain in the Fund until distributed in accordance with the Plan. The investment of deferred amounts and the offsetting payable to the Trustees are included in the accompanying Statement of Assets and Liabilities.
Income Tax Information and Distributions to Shareholders. Each year, the Fund intends to qualify as a regulated investment company under Subchapter M of the Internal Revenue Code, including distributing substantially all of its taxable income and realized gains. As a result, no provision for U.S. Federal income taxes is required. The Fund files a U.S. federal tax return, in addition to state and local tax returns as required. The Fund's federal income tax returns are subject to examination by the Internal Revenue Service (IRS) for a period of three fiscal years after they are filed. State and local tax returns may be subject to examination for an additional fiscal year depending on the jurisdiction. Foreign taxes are provided for based on the Fund's understanding of the tax rules and rates that exist in the foreign markets in which it invests.
Distributions are declared and recorded on the ex-dividend date. Income dividends and capital gain distributions are declared separately for each class. Income and capital gain distributions are determined in accordance with income tax regulations, which may differ from GAAP.
Capital accounts within the financial statements are adjusted for permanent book-tax differences. These adjustments have no impact on net assets or the results of operations. Capital accounts are not adjusted for temporary book-tax differences which will reverse in a subsequent period.
Book-tax differences are primarily due to foreign currency transactions, partnerships, market discount, deferred trustees compensation, contingent interest, certain conversion ratio adjustments, equity-debt classifications and losses deferred due to wash sales.
The federal tax cost of investment securities and unrealized appreciation (depreciation) as of period end were as follows:
| Gross unrealized appreciation | $455,428 |
| Gross unrealized depreciation | (83,053) |
| Net unrealized appreciation (depreciation) on securities | $372,375 |
| Tax cost | $1,725,352 |
Restricted Securities. The Fund may invest in securities that are subject to legal or contractual restrictions on resale. These securities generally may be resold in transactions exempt from registration or to the public if the securities are registered. Disposal of these securities may involve time-consuming negotiations and expense, and prompt sale at an acceptable price may be difficult. Information regarding restricted securities is included at the end of the Fund's Schedule of Investments.
Consolidated Subsidiary. The Fund invests in certain investments through a wholly-owned subsidiary ("Subsidiary"), which may be subject to federal and state taxes upon disposition.
As of period end, the Fund held an investment of $3,959 in this Subsidiary, representing .19% of the Fund's net assets. The financial statements have been consolidated and include accounts of the Fund and the Subsidiary. Accordingly, all inter-company
transactions and balances have been eliminated.
Any cash held by the Subsidiary is restricted as to its use and is presented as Restricted cash in the Statement of Assets and Liabilities.
4. Derivative Instruments.
Risk Exposures and the Use of Derivative Instruments. The Fund's investment objective allows the Fund to enter into various types of derivative contracts, including options. Derivatives are investments whose value is primarily derived from underlying assets, indices or reference rates and may be transacted on an exchange or over-the-counter (OTC). Derivatives may involve a future commitment to buy or sell a specified asset based on specified terms, to exchange future cash flows at periodic intervals based on a notional principal amount, or for one party to make one or more payments upon the occurrence of specified events in exchange for periodic payments from the other party.
The Fund used derivatives to increase returns and to manage exposure to certain risks as defined below. The success of any strategy involving derivatives depends on analysis of numerous economic factors, and if the strategies for investment do not work as intended, the Fund may not achieve its objectives.
The Fund's use of derivatives increased or decreased its exposure to the following risk:
| Equity Risk | Equity risk relates to the fluctuations in the value of financial instruments as a result of changes in market prices (other than those arising from interest rate risk or foreign exchange risk), whether caused by factors specific to an individual investment, its issuer, or all factors affecting all instruments traded in a market or market segment. |
The Fund is also exposed to additional risks from investing in derivatives, such as liquidity risk and counterparty credit risk. Liquidity risk is the risk that the Fund will be unable to close out the derivative in the open market in a timely manner. Counterparty credit risk is the risk that the counterparty will not be able to fulfill its obligation to the Fund. Derivative counterparty credit risk is managed through formal evaluation of the creditworthiness of all potential counterparties. On certain OTC derivatives such as options, the Fund attempts to reduce its exposure to counterparty credit risk by entering into an International Swaps and Derivatives Association, Inc. (ISDA) Master Agreement with each of its counterparties. The ISDA Master Agreement gives the Fund the right to terminate all transactions traded under such agreement upon the deterioration in the credit quality of the counterparty beyond specified levels. The ISDA Master Agreement gives each party the right, upon an event of default by the other party or a termination of the agreement, to close out all transactions traded under such agreement and to net amounts owed under each transaction to one net payable by one party to the other. To mitigate counterparty credit risk on bi-lateral OTC derivatives, the Fund receives collateral in the form of cash or securities once the Fund's net unrealized appreciation on outstanding derivative contracts under an ISDA Master Agreement exceeds certain applicable thresholds, subject to certain minimum transfer provisions. The collateral received is held in segregated accounts with the Fund's custodian bank in accordance with the collateral agreements entered into between the Fund, the counterparty and the Fund's custodian bank. The Fund could experience delays and costs in gaining access to the collateral even though it is held by the Fund's custodian bank. The Fund's maximum risk of loss from counterparty credit risk related to bi-lateral OTC derivatives is generally the aggregate unrealized appreciation and unpaid counterparty payments in excess of any collateral pledged by the counterparty to the Fund. Counterparty credit risk related to exchange-traded options may be mitigated by the protection provided by the exchange on which they trade.
Investing in derivatives may involve greater risks than investing in the underlying assets directly and, to varying degrees, may involve risk of loss in excess of any initial investment and collateral received and amounts recognized in the Statement of Assets and Liabilities. In addition, there may be the risk that the change in value of the derivative contract does not correspond to the change in value of the underlying instrument.
Options. Options give the purchaser the right, but not the obligation, to buy (call) or sell (put) an underlying security or financial instrument at an agreed exercise or strike price between or on certain dates. Options obligate the seller (writer) to buy (put) or sell (call) an underlying instrument at the exercise or strike price or cash settle an underlying derivative instrument if the holder exercises the option on or before the expiration date.
The Fund used exchange-traded and OTC written covered call options to manage its exposure to the market. When the Fund writes a covered call option, the Fund holds the underlying instrument which must be delivered to the holder upon the exercise of the option.
Upon entering into a written options contract, the Fund will receive a premium. Premiums received are reflected as a liability on the Statement of Assets and Liabilities. Options are valued daily and any unrealized appreciation (depreciation) is reflected on the Statement of Assets and Liabilities. When a written option is exercised, the premium is added to the proceeds from the sale of the underlying instrument in determining the gain or loss realized on that investment. When an option is closed the Fund will realize a gain or loss depending on whether the proceeds or amount paid for the closing sale transaction are greater or less than the premium received. When an option expires, gains and losses are realized to the extent of premiums received. The net realized gain (loss) on closed and expired written options and the change in net unrealized appreciation (depreciation) on written options are reflected separately on the Statement of Operations.
Writing call options tends to decrease exposure to the underlying instrument and risk of loss is the change in value in excess of the premium received.
Any open options at period end are presented in the Schedule of Investments under the caption "Written Options".
During the period, the Fund recognized net realized gain (loss) of $1,784 and a change in net unrealized appreciation (depreciation) of $2,723 related to its investment in written options. This amount is included in the Statement of Operations.
The following is a summary of the Fund's written options activity:
| Number of Contracts | Amount of Premiums | |
| Outstanding at beginning of period | 14 | $1,106 |
| Options Opened | 49 | 2,886 |
| Options Exercised | (14) | (1,424) |
| Options Expired | (30) | (1,784) |
| Outstanding at end of period | 19 | $784 |
5. Purchases and Sales of Investments.
Purchases and sales of securities, other than short-term securities, aggregated $207,710 and $276,400, respectively.
6. Fees and Other Transactions with Affiliates.
Management Fee. Fidelity Management & Research Company (the investment adviser) and its affiliates provide the Fund with investment management related services for which the Fund pays a monthly management fee. The management fee is the sum of an individual fund fee rate that is based on an annual rate of .20% of the Fund's average net assets and an annualized group fee rate that averaged .25% during the period. The group fee rate is based upon the average net assets of all the mutual funds advised by the investment adviser, including any mutual funds previously advised by the investment adviser that are currently advised by Fidelity SelectCo, LLC, an affiliate of the investment adviser. The group fee rate decreases as assets under management increase and increases as assets under management decrease. For the reporting period, the total annualized management fee rate was .45% of the Fund's average net assets.
Distribution and Service Plan Fees. In accordance with Rule 12b-1 of the 1940 Act, the Fund has adopted separate Distribution and Service Plans for each class of shares. Certain classes pay Fidelity Distributors Corporation (FDC), an affiliate of the investment adviser, separate Distribution and Service Fees, each of which is based on an annual percentage of each class' average net assets. In addition, FDC may pay financial intermediaries for selling shares of the Fund and providing shareholder support services. For the period, the Distribution and Service Fee rates, total fees and amounts retained by FDC were as follows:
| Distribution Fee | Service Fee | Total Fees | Retained by FDC | |
| Class A | -% | .25% | $891 | $5 |
| Class M | .25% | .25% | 2,004 | – |
| Class C | .75% | .25% | 1,021 | 58 |
| $3,916 | $63 |
Sales Load. FDC may receive a front-end sales charge of up to 5.75% for selling Class A shares and 3.50% for selling Class M shares, some of which is paid to financial intermediaries for selling shares of the Fund. Depending on the holding period, FDC may receive contingent deferred sales charges levied on Class A, Class M and Class C redemptions. The deferred sales charges are 1.00% for Class C shares, 1.00% for certain purchases of Class A shares and .25% for certain purchases of Class M shares.
For the period, sales charge amounts retained by FDC were as follows:
| Retained by FDC | |
| Class A | $74 |
| Class M | 15 |
| Class C(a) | 6 |
| $95 |
(a) When Class C shares are initially sold, FDC pays commissions from its own resources to financial intermediaries through which the sales are made.
Transfer Agent Fees. Fidelity Investments Institutional Operations Company, Inc., (FIIOC), an affiliate of the investment adviser, is the transfer, dividend disbursing and shareholder servicing agent for each class of the Fund. FIIOC receives account fees and asset-based fees that vary according to the account size and type of account of the shareholders of the respective classes of the Fund, except for Class Z. FIIOC receives an asset-based fee of Class Z's average net assets. FIIOC pays for typesetting, printing and mailing of shareholder reports, except proxy statements.
For the period, transfer agent fees for each class were as follows:
| Amount | % of Class-Level Average Net Assets(a) | |
| Class A | $707 | .20 |
| Class M | 739 | .18 |
| Class C | 221 | .22 |
| Class I | 444 | .19 |
| Class Z | 4 | .05 |
| $2,115 |
(a) Annualized
Accounting and Security Lending Fees. Fidelity Service Company, Inc. (FSC), an affiliate of the investment adviser, maintains the Fund's accounting records. The accounting fee is based on the level of average net assets for each month. Under a separate contract, FSC administers the security lending program. The security lending fee is based on the number and duration of lending transactions.
Brokerage Commissions. The Fund placed a portion of its portfolio transactions with brokerage firms which are affiliates of the investment adviser. Brokerage commissions are included in net realized gain (loss) and change in net unrealized appreciation (depreciation) in the Statement of Operations. The commissions paid to these affiliated firms were $6 for the period.
Interfund Trades. The Fund may purchase from or sell securities to other Fidelity Funds under procedures adopted by the Board. The procedures have been designed to ensure these interfund trades are executed in accordance with Rule 17a-7 of the 1940 Act. Interfund trades are included within the respective purchases and sales amounts shown in the Purchases and Sales of Investments note.
7. Committed Line of Credit.
The Fund participates with other funds managed by the investment adviser or an affiliate in a $4.25 billion credit facility (the "line of credit") to be utilized for temporary or emergency purposes to fund shareholder redemptions or for other short-term liquidity purposes. The Fund has agreed to pay commitment fees on its pro-rata portion of the line of credit, which amounted to $4 and is reflected in Miscellaneous expenses on the Statement of Operations. During the period, the Fund did not borrow on this line of credit.
8. Security Lending.
The Fund lends portfolio securities through a lending agent from time to time in order to earn additional income. For equity securities, a lending agent is used and may loan securities to certain qualified borrowers, including Fidelity Capital Markets (FCM), a broker-dealer affiliated with the Fund. On the settlement date of the loan, the Fund receives collateral (in the form of U.S. Treasury obligations, letters of credit and/or cash) against the loaned securities and maintains collateral in an amount not less than 100% of the market value of the loaned securities during the period of the loan. The market value of the loaned securities is determined at the close of business of the Fund and any additional required collateral is delivered to the Fund on the next business day. The Fund or borrower may terminate the loan at any time, and if the borrower defaults on its obligation to return the securities loaned because of insolvency or other reasons, the Fund may apply collateral received from the borrower against the obligation. The Fund may experience delays and costs in recovering the securities loaned. Any cash collateral received is invested in the Fidelity Securities Lending Cash Central Fund. The value of loaned securities and cash collateral at period end are disclosed on the Fund's Statement of Assets and Liabilities. The value of securities loaned to FCM at period end was $42. Security lending income represents the income earned on investing cash collateral, less rebates paid to borrowers and any lending agent fees associated with the loan, plus any premium payments received for lending certain types of securities. Security lending income is presented in the Statement of Operations as a component of income from Fidelity Central Funds. Total security lending income during the period amounted to $71, including $2 from securities loaned to FCM.
9. Expense Reductions.
Commissions paid to certain brokers with whom the investment adviser, or its affiliates, places trades on behalf of the Fund include an amount in addition to trade execution, which may be rebated back to the Fund to offset certain expenses. This amount totaled $19 for the period. In addition, through arrangements with the Fund's custodian, credits realized as a result of certain uninvested cash balances were used to reduce the Fund's expenses. During the period, these credits reduced the Fund's expenses by an amount less than five hundred dollars.
In addition, during the period the investment adviser reimbursed and/or waived a portion of fund-level operating expenses in the amount of $10.
10. Distributions to Shareholders.
Distributions to shareholders of each class were as follows:
| Six months ended May 31, 2017 | Year ended November 30, 2016 | |
| From net investment income | ||
| Class A | $7,778 | $14,760 |
| Class M | 7,580 | 15,119 |
| Class B | – | 95 |
| Class C | 1,438 | 2,618 |
| Class I | 5,306 | 10,055 |
| Class Z | 204 | 354 |
| Total | $22,306 | $43,001 |
| From net realized gain | ||
| Class A | $8,831 | $46,541 |
| Class M | 9,653 | 54,221 |
| Class B | – | 661 |
| Class C | 2,491 | 12,684 |
| Class I | 5,341 | 28,166 |
| Class Z | 193 | 955 |
| Total | $26,509 | $143,228 |
11. Share Transactions.
Share transactions for each class were as follows and may contain automatic conversions between classes or exchanges between affiliated funds:
| Shares | Shares | Dollars | Dollars | |
| Six months ended May 31, 2017 | Year ended November 30, 2016 | Six months ended May 31, 2017 | Year ended November 30, 2016 | |
| Class A | ||||
| Shares sold | 1,308 | 2,420 | $42,776 | $70,433 |
| Reinvestment of distributions | 484 | 2,081 | 15,662 | 57,784 |
| Shares redeemed | (2,676) | (4,679) | (87,974) | (136,659) |
| Net increase (decrease) | (884) | (178) | $(29,536) | $(8,442) |
| Class M | ||||
| Shares sold | 1,396 | 2,416 | $46,538 | $71,773 |
| Reinvestment of distributions | 508 | 2,392 | 16,792 | 67,591 |
| Shares redeemed | (2,802) | (6,397) | (93,647) | (190,578) |
| Net increase (decrease) | (898) | (1,589) | $(30,317) | $(51,214) |
| Class B | ||||
| Shares sold | – | 4 | $– | $155 |
| Reinvestment of distributions | – | 25 | – | 692 |
| Shares redeemed | – | (351) | – | (10,124) |
| Net increase (decrease) | – | (322) | $– | $(9,277) |
| Class C | ||||
| Shares sold | 489 | 806 | $16,101 | $23,799 |
| Reinvestment of distributions | 110 | 494 | 3,578 | 13,767 |
| Shares redeemed | (689) | (1,149) | (22,721) | (33,678) |
| Net increase (decrease) | (90) | 151 | $(3,042) | $3,888 |
| Class I | ||||
| Shares sold | 1,431 | 2,077 | $48,931 | $63,265 |
| Reinvestment of distributions | 300 | 1,284 | 10,122 | 37,038 |
| Shares redeemed | (3,439) | (3,464) | (117,691) | (106,411) |
| Net increase (decrease) | (1,708) | (103) | $(58,638) | $(6,108) |
| Class Z | ||||
| Shares sold | 98 | 132 | $3,310 | $3,920 |
| Reinvestment of distributions | 12 | 45 | 397 | 1,309 |
| Shares redeemed | (55) | (168) | (1,877) | (4,870) |
| Net increase (decrease) | 55 | 9 | $1,830 | $359 |
12. Other.
The Fund's organizational documents provide former and current trustees and officers with a limited indemnification against liabilities arising in connection with the performance of their duties to the Fund. In the normal course of business, the Fund may also enter into contracts that provide general indemnifications. The Fund's maximum exposure under these arrangements is unknown as this would be dependent on future claims that may be made against the Fund. The risk of material loss from such claims is considered remote.
Shareholder Expense Example
As a shareholder of the Fund, you incur two types of costs: (1) transaction costs, including sales charges (loads) on purchase payments or redemption proceeds, and (2) ongoing costs, including management fees, distribution and/or service (12b-1) fees and other Fund expenses. This Example is intended to help you understand your ongoing costs (in dollars) of investing in the Fund and to compare these costs with the ongoing costs of investing in other mutual funds.
The Example is based on an investment of $1,000 invested at the beginning of the period and held for the entire period (December 1, 2016 to May 31, 2017).
Actual Expenses
The first line of the accompanying table for each class of the Fund provides information about actual account values and actual expenses. You may use the information in this line, together with the amount you invested, to estimate the expenses that you paid over the period. Simply divide your account value by $1,000.00 (for example, an $8,600 account value divided by $1,000.00 = 8.6), then multiply the result by the number in the first line for a class of the Fund under the heading entitled "Expenses Paid During Period" to estimate the expenses you paid on your account during this period. In addition, the Fund, as a shareholder in the underlying Fidelity Central Funds, will indirectly bear its pro-rata share of the fees and expenses incurred by the underlying Fidelity Central Funds. These fees and expenses are not included in the Fund's annualized expense ratio used to calculate the expense estimate in the table below.
Hypothetical Example for Comparison Purposes
The second line of the accompanying table for each class of the Fund provides information about hypothetical account values and hypothetical expenses based on a Class' actual expense ratio and an assumed rate of return of 5% per year before expenses, which is not the Class' actual return. The hypothetical account values and expenses may not be used to estimate the actual ending account balance or expenses you paid for the period. You may use this information to compare the ongoing costs of investing in the Fund and other funds. To do so, compare this 5% hypothetical example with the 5% hypothetical examples that appear in the shareholder reports of the other funds. In addition, the Fund, as a shareholder in the underlying Fidelity Central Funds, will indirectly bear its pro-rata share of the fees and expenses incurred by the underlying Fidelity Central Funds. These fees and expenses are not included in the Fund's annualized expense ratio used to calculate the expense estimate in the table below.
Please note that the expenses shown in the table are meant to highlight your ongoing costs only and do not reflect any transaction costs. Therefore, the second line of the table is useful in comparing ongoing costs only, and will not help you determine the relative total costs of owning different funds. In addition, if these transactional costs were included, your costs would have been higher.
| Annualized Expense Ratio-A | Beginning Account Value December 1, 2016 | Ending Account Value May 31, 2017 | Expenses Paid During Period-B December 1, 2016 to May 31, 2017 | |
| Class A | .94% | |||
| Actual | $1,000.00 | $1,050.00 | $4.80 | |
| Hypothetical-C | $1,000.00 | $1,020.24 | $4.73 | |
| Class M | 1.17% | |||
| Actual | $1,000.00 | $1,048.70 | $5.98 | |
| Hypothetical-C | $1,000.00 | $1,019.10 | $5.89 | |
| Class C | 1.70% | |||
| Actual | $1,000.00 | $1,046.00 | $8.67 | |
| Hypothetical-C | $1,000.00 | $1,016.45 | $8.55 | |
| Class I | .68% | |||
| Actual | $1,000.00 | $1,051.10 | $3.48 | |
| Hypothetical-C | $1,000.00 | $1,021.54 | $3.43 | |
| Class Z | .53% | |||
| Actual | $1,000.00 | $1,052.20 | $2.71 | |
| Hypothetical-C | $1,000.00 | $1,022.29 | $2.67 |
A Annualized expense ratio reflects expenses net of applicable fee waivers.
B Expenses are equal to each Class' annualized expense ratio, multiplied by the average account value over the period, multiplied by 182/365 (to reflect the one-half year period).
C 5% return per year before expenses
![]()
EPI-SANN-0717
1.704674.119
Fidelity Advisor® Growth Opportunities Fund Semi-Annual Report May 31, 2017 |
|
Contents
To view a fund's proxy voting guidelines and proxy voting record for the 12-month period ended June 30, visit http://www.fidelity.com/proxyvotingresults or visit the Securities and Exchange Commission's (SEC) web site at http://www.sec.gov.
You may also call 1-877-208-0098 to request a free copy of the proxy voting guidelines.
Standard & Poor's, S&P and S&P 500 are registered service marks of The McGraw-Hill Companies, Inc. and have been licensed for use by Fidelity Distributors Corporation.
Other third-party marks appearing herein are the property of their respective owners.
All other marks appearing herein are registered or unregistered trademarks or service marks of FMR LLC or an affiliated company. © 2017 FMR LLC. All rights reserved.
This report and the financial statements contained herein are submitted for the general information of the shareholders of the Fund. This report is not authorized for distribution to prospective investors in the Fund unless preceded or accompanied by an effective prospectus.
A fund files its complete schedule of portfolio holdings with the SEC for the first and third quarters of each fiscal year on Form N-Q. Forms N-Q are available on the SEC’s web site at http://www.sec.gov. A fund's Forms N-Q may be reviewed and copied at the SEC’s Public Reference Room in Washington, DC. Information regarding the operation of the SEC's Public Reference Room may be obtained by calling 1-800-SEC-0330.
For a complete list of a fund's portfolio holdings, view the most recent holdings listing, semiannual report, or annual report on Fidelity's web site at http://www.fidelity.com, http://www.institutional.fidelity.com, or http://www.401k.com, as applicable.
NOT FDIC INSURED •MAY LOSE VALUE •NO BANK GUARANTEE
Neither the Fund nor Fidelity Distributors Corporation is a bank.
Investment Summary (Unaudited)
Top Ten Stocks as of May 31, 2017
| % of fund's net assets | % of fund's net assets 6 months ago | |
| Apple, Inc. | 6.6 | 5.8 |
| Alphabet, Inc. Class C | 3.9 | 3.6 |
| Amazon.com, Inc. | 3.8 | 3.0 |
| Tesla, Inc. | 3.6 | 2.3 |
| American Tower Corp. | 3.1 | 3.2 |
| Microsoft Corp. | 2.6 | 2.8 |
| Facebook, Inc. Class A | 2.6 | 2.5 |
| LyondellBasell Industries NV Class A | 2.4 | 1.8 |
| Alphabet, Inc. Class A | 2.4 | 2.2 |
| Charter Communications, Inc. Class A | 2.0 | 2.7 |
| 33.0 |
Top Five Market Sectors as of May 31, 2017
| % of fund's net assets | % of fund's net assets 6 months ago | |
| Information Technology | 40.8 | 39.9 |
| Health Care | 16.8 | 18.0 |
| Consumer Discretionary | 15.9 | 14.6 |
| Consumer Staples | 6.6 | 7.1 |
| Real Estate | 5.0 | 4.9 |
Asset Allocation (% of fund's net assets)
| As of May 31, 2017 * | ||
| Stocks | 98.3% | |
| Convertible Securities | 1.3% | |
| Short-Term Investments and Net Other Assets (Liabilities) | 0.4% | |

* Foreign investments - 11.8%
| As of November 30, 2016 * | ||
| Stocks | 98.4% | |
| Convertible Securities | 1.1% | |
| Short-Term Investments and Net Other Assets (Liabilities) | 0.5% | |

* Foreign investments - 12.7%
Investments May 31, 2017 (Unaudited)
Showing Percentage of Net Assets
| Common Stocks - 98.3% | |||
| Shares | Value (000s) | ||
| CONSUMER DISCRETIONARY - 15.9% | |||
| Automobiles - 3.6% | |||
| Tesla, Inc. (a)(b) | 283,077 | $96,532 | |
| Hotels, Restaurants & Leisure - 1.6% | |||
| Chipotle Mexican Grill, Inc. (a) | 8,500 | 4,057 | |
| Marriott International, Inc. Class A | 800 | 86 | |
| Starbucks Corp. | 216,500 | 13,772 | |
| U.S. Foods Holding Corp. | 824,003 | 24,687 | |
| 42,602 | |||
| Household Durables - 0.5% | |||
| Newell Brands, Inc. | 236,800 | 12,539 | |
| Internet & Direct Marketing Retail - 5.6% | |||
| Amazon.com, Inc. (a) | 100,600 | 100,059 | |
| Groupon, Inc. (a) | 1,889,238 | 5,687 | |
| Netflix, Inc. (a) | 27,000 | 4,403 | |
| Priceline Group, Inc. (a) | 6,000 | 11,263 | |
| Vipshop Holdings Ltd. ADR (a) | 1,597,700 | 19,764 | |
| Wayfair LLC Class A (a) | 127,322 | 8,015 | |
| 149,191 | |||
| Media - 3.5% | |||
| Charter Communications, Inc. Class A (a) | 155,360 | 53,685 | |
| Comcast Corp. Class A | 456,400 | 19,027 | |
| Liberty Media Corp. Liberty Media Class A (a) | 215,000 | 6,859 | |
| Lions Gate Entertainment Corp.: | |||
| Class A | 136,250 | 3,692 | |
| Class B (a)(b) | 136,250 | 3,446 | |
| The Walt Disney Co. | 62,000 | 6,692 | |
| 93,401 | |||
| Multiline Retail - 0.1% | |||
| Dollar Tree, Inc. (a) | 35,900 | 2,789 | |
| Specialty Retail - 0.8% | |||
| AutoZone, Inc. (a) | 1,900 | 1,151 | |
| Home Depot, Inc. | 81,500 | 12,511 | |
| TJX Companies, Inc. | 123,200 | 9,266 | |
| 22,928 | |||
| Textiles, Apparel & Luxury Goods - 0.2% | |||
| lululemon athletica, Inc. (a) | 105,716 | 5,103 | |
| TOTAL CONSUMER DISCRETIONARY | 425,085 | ||
| CONSUMER STAPLES - 6.2% | |||
| Beverages - 1.8% | |||
| Constellation Brands, Inc. Class A (sub. vtg.) | 51,400 | 9,393 | |
| Molson Coors Brewing Co. Class B | 179,600 | 17,024 | |
| Monster Beverage Corp. (a) | 280,600 | 14,187 | |
| The Coca-Cola Co. | 145,900 | 6,634 | |
| 47,238 | |||
| Food & Staples Retailing - 1.6% | |||
| Costco Wholesale Corp. | 54,300 | 9,797 | |
| Performance Food Group Co. (a) | 1,177,850 | 33,333 | |
| 43,130 | |||
| Personal Products - 0.6% | |||
| Coty, Inc. Class A | 607,700 | 11,510 | |
| Unilever NV (Certificaten Van Aandelen) (Bearer) | 101,100 | 5,759 | |
| 17,269 | |||
| Tobacco - 2.2% | |||
| British American Tobacco PLC (United Kingdom) | 575,800 | 41,194 | |
| Imperial Tobacco Group PLC | 134,074 | 6,269 | |
| Philip Morris International, Inc. | 83,300 | 9,979 | |
| 57,442 | |||
| TOTAL CONSUMER STAPLES | 165,079 | ||
| ENERGY - 1.2% | |||
| Oil, Gas & Consumable Fuels - 1.2% | |||
| Anadarko Petroleum Corp. | 45,800 | 2,314 | |
| Cabot Oil & Gas Corp. | 433,100 | 9,610 | |
| Devon Energy Corp. | 63,700 | 2,165 | |
| PDC Energy, Inc. (a) | 86,100 | 4,276 | |
| Teekay LNG Partners LP | 214,200 | 3,256 | |
| The Williams Companies, Inc. | 135,500 | 3,875 | |
| Williams Partners LP | 167,300 | 6,553 | |
| 32,049 | |||
| FINANCIALS - 3.6% | |||
| Banks - 0.5% | |||
| HDFC Bank Ltd. sponsored ADR | 162,111 | 14,233 | |
| Capital Markets - 2.4% | |||
| BlackRock, Inc. Class A | 3,500 | 1,432 | |
| CBOE Holdings, Inc. | 569,500 | 49,188 | |
| MSCI, Inc. | 13,300 | 1,353 | |
| S&P Global, Inc. | 10,800 | 1,542 | |
| TD Ameritrade Holding Corp. | 255,400 | 9,542 | |
| 63,057 | |||
| Consumer Finance - 0.7% | |||
| Synchrony Financial | 730,700 | 19,619 | |
| TOTAL FINANCIALS | 96,909 | ||
| HEALTH CARE - 16.8% | |||
| Biotechnology - 9.2% | |||
| ACADIA Pharmaceuticals, Inc. (a) | 75,100 | 1,931 | |
| Acorda Therapeutics, Inc. (a) | 63,800 | 880 | |
| Agios Pharmaceuticals, Inc. (a) | 83,900 | 3,916 | |
| Alexion Pharmaceuticals, Inc. (a) | 438,600 | 42,996 | |
| Alkermes PLC (a) | 90,200 | 5,210 | |
| Alnylam Pharmaceuticals, Inc. (a) | 243,112 | 15,914 | |
| Amgen, Inc. | 330,600 | 51,322 | |
| Amicus Therapeutics, Inc. (a) | 681,100 | 5,462 | |
| aTyr Pharma, Inc. (a)(c) | 124,876 | 406 | |
| BioMarin Pharmaceutical, Inc. (a) | 111,000 | 9,728 | |
| bluebird bio, Inc. (a) | 88,100 | 6,638 | |
| Coherus BioSciences, Inc. (a) | 88,294 | 1,744 | |
| Five Prime Therapeutics, Inc. (a) | 66,700 | 1,884 | |
| Genocea Biosciences, Inc. (a)(b) | 76,716 | 468 | |
| Insmed, Inc. (a) | 365,479 | 5,636 | |
| Intercept Pharmaceuticals, Inc. (a) | 10,235 | 1,145 | |
| Ionis Pharmaceuticals, Inc. (a) | 373,953 | 17,123 | |
| Merrimack Pharmaceuticals, Inc. (b) | 437,800 | 795 | |
| Neurocrine Biosciences, Inc. (a) | 183,875 | 7,993 | |
| Opko Health, Inc. (a) | 1 | 0 | |
| Prothena Corp. PLC (a) | 132,702 | 6,769 | |
| Regeneron Pharmaceuticals, Inc. (a) | 80,600 | 37,000 | |
| Regulus Therapeutics, Inc. (a)(b) | 318,000 | 445 | |
| Rigel Pharmaceuticals, Inc. (a) | 498,548 | 1,142 | |
| Sage Therapeutics, Inc. (a) | 29,144 | 1,927 | |
| Spark Therapeutics, Inc. (a) | 12,100 | 616 | |
| TESARO, Inc. (a)(b) | 33,200 | 4,957 | |
| Vertex Pharmaceuticals, Inc. (a) | 91,090 | 11,259 | |
| Xencor, Inc. (a) | 47,461 | 973 | |
| 246,279 | |||
| Health Care Equipment & Supplies - 2.5% | |||
| Boston Scientific Corp. (a) | 1,101,600 | 29,776 | |
| Danaher Corp. | 74,400 | 6,320 | |
| Insulet Corp. (a) | 108,600 | 4,558 | |
| Intuitive Surgical, Inc. (a) | 3,100 | 2,836 | |
| Medtronic PLC | 268,200 | 22,604 | |
| 66,094 | |||
| Health Care Providers & Services - 2.5% | |||
| Anthem, Inc. | 198,700 | 36,233 | |
| Cigna Corp. | 19,000 | 3,063 | |
| Humana, Inc. | 37,200 | 8,640 | |
| UnitedHealth Group, Inc. | 117,700 | 20,619 | |
| 68,555 | |||
| Health Care Technology - 0.5% | |||
| athenahealth, Inc. (a) | 94,800 | 12,701 | |
| Castlight Health, Inc. Class B (a)(b) | 117,900 | 413 | |
| 13,114 | |||
| Pharmaceuticals - 2.1% | |||
| Allergan PLC | 161,990 | 36,245 | |
| Bristol-Myers Squibb Co. | 207,000 | 11,168 | |
| Innoviva, Inc. (a) | 227,800 | 2,784 | |
| Theravance Biopharma, Inc. (a)(b) | 152,125 | 5,553 | |
| 55,750 | |||
| TOTAL HEALTH CARE | 449,792 | ||
| INDUSTRIALS - 3.3% | |||
| Air Freight & Logistics - 0.2% | |||
| FedEx Corp. | 26,600 | 5,156 | |
| Airlines - 0.9% | |||
| Allegiant Travel Co. | 8,700 | 1,192 | |
| JetBlue Airways Corp. (a) | 69,800 | 1,565 | |
| Spirit Airlines, Inc. (a) | 430,500 | 22,860 | |
| 25,617 | |||
| Electrical Equipment - 0.3% | |||
| Fortive Corp. | 30,700 | 1,917 | |
| Sunrun, Inc. (a)(b) | 1,215,000 | 6,124 | |
| 8,041 | |||
| Machinery - 0.6% | |||
| Allison Transmission Holdings, Inc. | 178,500 | 6,912 | |
| Caterpillar, Inc. | 86,600 | 9,130 | |
| Middleby Corp. (a) | 2,100 | 270 | |
| 16,312 | |||
| Professional Services - 0.6% | |||
| Equifax, Inc. | 61,700 | 8,441 | |
| Recruit Holdings Co. Ltd. | 26,800 | 1,420 | |
| TransUnion Holding Co., Inc. (a) | 119,000 | 5,201 | |
| 15,062 | |||
| Road & Rail - 0.1% | |||
| J.B. Hunt Transport Services, Inc. | 30,700 | 2,621 | |
| Trading Companies & Distributors - 0.6% | |||
| Bunzl PLC | 141,000 | 4,418 | |
| HD Supply Holdings, Inc. (a) | 269,200 | 10,862 | |
| 15,280 | |||
| TOTAL INDUSTRIALS | 88,089 | ||
| INFORMATION TECHNOLOGY - 40.1% | |||
| Communications Equipment - 0.4% | |||
| Carvana Co. Class A (b) | 1,031,300 | 10,365 | |
| Internet Software & Services - 10.5% | |||
| Alphabet, Inc.: | |||
| Class A (a) | 64,965 | 64,126 | |
| Class C (a) | 107,975 | 104,181 | |
| Apptio, Inc. Class A | 25,400 | 420 | |
| Cloudera, Inc. (b) | 10,900 | 226 | |
| Cloudera, Inc. | 41,786 | 780 | |
| Criteo SA sponsored ADR (a) | 9,800 | 514 | |
| Endurance International Group Holdings, Inc. (a) | 1,507,037 | 11,378 | |
| Facebook, Inc. Class A (a) | 451,441 | 68,375 | |
| GoDaddy, Inc. (a) | 463,849 | 19,083 | |
| The Trade Desk, Inc. | 12,800 | 704 | |
| Wix.com Ltd. (a) | 157,935 | 11,640 | |
| 281,427 | |||
| IT Services - 11.9% | |||
| Accenture PLC Class A | 10,700 | 1,332 | |
| Alliance Data Systems Corp. | 167,700 | 40,438 | |
| Capgemini SA | 124,000 | 12,837 | |
| Cognizant Technology Solutions Corp. Class A | 515,092 | 34,465 | |
| EPAM Systems, Inc. (a) | 316,800 | 26,573 | |
| Euronet Worldwide, Inc. (a) | 181,500 | 15,832 | |
| FleetCor Technologies, Inc. (a) | 118,400 | 17,084 | |
| Global Payments, Inc. | 317,200 | 29,059 | |
| Luxoft Holding, Inc. (a) | 406,800 | 26,279 | |
| MasterCard, Inc. Class A | 229,600 | 28,213 | |
| PayPal Holdings, Inc. (a) | 262,700 | 13,716 | |
| Paysafe Group PLC (a) | 2,257,400 | 14,557 | |
| Presidio, Inc. | 1,023,900 | 15,737 | |
| Visa, Inc. Class A | 424,700 | 40,444 | |
| 316,566 | |||
| Semiconductors & Semiconductor Equipment - 2.0% | |||
| Advanced Micro Devices, Inc. (a) | 120,500 | 1,348 | |
| Micron Technology, Inc. (a) | 225,200 | 6,929 | |
| NVIDIA Corp. | 121,230 | 17,500 | |
| Qualcomm, Inc. | 234,100 | 13,407 | |
| SolarEdge Technologies, Inc. (a)(b) | 805,057 | 14,974 | |
| 54,158 | |||
| Software - 8.7% | |||
| Activision Blizzard, Inc. | 442,100 | 25,898 | |
| Adobe Systems, Inc. (a) | 188,500 | 26,741 | |
| Autodesk, Inc. (a) | 187,100 | 20,912 | |
| Electronic Arts, Inc. (a) | 132,200 | 14,982 | |
| Microsoft Corp. | 1,002,800 | 70,036 | |
| Red Hat, Inc. (a) | 38,230 | 3,424 | |
| Salesforce.com, Inc. (a) | 493,500 | 44,237 | |
| SS&C Technologies Holdings, Inc. | 357,900 | 13,450 | |
| Workday, Inc. Class A (a) | 114,300 | 11,428 | |
| 231,108 | |||
| Technology Hardware, Storage & Peripherals - 6.6% | |||
| Apple, Inc. | 1,159,306 | 177,096 | |
| TOTAL INFORMATION TECHNOLOGY | 1,070,720 | ||
| MATERIALS - 4.9% | |||
| Chemicals - 3.7% | |||
| E.I. du Pont de Nemours & Co. | 233,000 | 18,388 | |
| LyondellBasell Industries NV Class A | 801,000 | 64,497 | |
| Monsanto Co. | 102,300 | 12,012 | |
| The Chemours Co. LLC | 97,000 | 3,879 | |
| 98,776 | |||
| Containers & Packaging - 1.2% | |||
| Ball Corp. | 807,600 | 33,031 | |
| TOTAL MATERIALS | 131,807 | ||
| REAL ESTATE - 4.8% | |||
| Equity Real Estate Investment Trusts (REITs) - 4.8% | |||
| American Tower Corp. | 633,400 | 83,096 | |
| Extra Space Storage, Inc. | 336,800 | 26,092 | |
| SBA Communications Corp. Class A (a) | 133,100 | 18,392 | |
| 127,580 | |||
| TELECOMMUNICATION SERVICES - 1.5% | |||
| Wireless Telecommunication Services - 1.5% | |||
| T-Mobile U.S., Inc. (a) | 574,000 | 38,699 | |
| TOTAL COMMON STOCKS | |||
| (Cost $1,645,781) | 2,625,809 | ||
| Convertible Preferred Stocks - 1.2% | |||
| CONSUMER STAPLES - 0.3% | |||
| Food & Staples Retailing - 0.1% | |||
| Blue Apron Holdings, Inc. Series D (a)(d) | 217,605 | 3,375 | |
| Tobacco - 0.2% | |||
| PAX Labs, Inc. Series C (a)(d) | 1,069,313 | 4,117 | |
| TOTAL CONSUMER STAPLES | 7,492 | ||
| INFORMATION TECHNOLOGY - 0.7% | |||
| Internet Software & Services - 0.4% | |||
| Uber Technologies, Inc. Series D, 8.00% (a)(d) | 221,104 | 10,784 | |
| Software - 0.3% | |||
| MongoDB, Inc. Series F, 8.00% (a)(d) | 515,124 | 8,615 | |
| TOTAL INFORMATION TECHNOLOGY | 19,399 | ||
| REAL ESTATE - 0.2% | |||
| Real Estate Management & Development - 0.2% | |||
| Redfin Corp. Series G (a)(d) | 1,081,736 | 5,019 | |
| TOTAL CONVERTIBLE PREFERRED STOCKS | |||
| (Cost $22,629) | 31,910 | ||
| Principal Amount (000s) | Value (000s) | ||
| Convertible Bonds - 0.1% | |||
| CONSUMER STAPLES - 0.1% | |||
| Food & Staples Retailing - 0.1% | |||
| Blue Apron Holdings, Inc. 3.5% 5/3/19(d) | |||
| (Cost $2,390) | 2,390 | 2,390 | |
| Shares | Value (000s) | ||
| Money Market Funds - 4.5% | |||
| Fidelity Cash Central Fund, 0.86% (e) | 17,623,971 | 17,627 | |
| Fidelity Securities Lending Cash Central Fund 0.87% (e)(f) | 103,599,675 | 103,610 | |
| TOTAL MONEY MARKET FUNDS | |||
| (Cost $121,234) | 121,237 | ||
| TOTAL INVESTMENT PORTFOLIO - 104.1% | |||
| (Cost $1,792,034) | 2,781,346 | ||
| NET OTHER ASSETS (LIABILITIES) - (4.1)% | (108,380) | ||
| NET ASSETS - 100% | $2,672,966 |
Values shown as $0 may reflect amounts less than $500.
Legend
(a) Non-income producing
(b) Security or a portion of the security is on loan at period end.
(c) Security exempt from registration under Rule 144A of the Securities Act of 1933. These securities may be resold in transactions exempt from registration, normally to qualified institutional buyers. At the end of the period, the value of these securities amounted to $406,000 or 0.0% of net assets.
(d) Restricted securities - Investment in securities not registered under the Securities Act of 1933 (excluding 144A issues). At the end of the period, the value of restricted securities (excluding 144A issues) amounted to $34,300,000 or 1.3% of net assets.
(e) Affiliated fund that is generally available only to investment companies and other accounts managed by Fidelity Investments. The rate quoted is the annualized seven-day yield of the fund at period end. A complete unaudited listing of the fund's holdings as of its most recent quarter end is available upon request. In addition, each Fidelity Central Fund's financial statements are available on the SEC's website or upon request.
(f) Investment made with cash collateral received from securities on loan.
Additional information on each restricted holding is as follows:
| Security | Acquisition Date | Acquisition Cost (000s) |
| Blue Apron Holdings, Inc. Series D | 5/18/15 | $2,900 |
| Blue Apron Holdings, Inc. 3.5% 5/3/19 | 5/3/17 | $2,390 |
| MongoDB, Inc. Series F, 8.00% | 10/2/13 | $8,615 |
| PAX Labs, Inc. Series C | 5/22/15 | $4,117 |
| Redfin Corp. Series G | 12/16/14 | $3,567 |
| Uber Technologies, Inc. Series D, 8.00% | 6/6/14 | $3,430 |
Affiliated Central Funds
Information regarding fiscal year to date income earned by the Fund from investments in Fidelity Central Funds is as follows:
| Fund | Income earned |
| (Amounts in thousands) | |
| Fidelity Cash Central Fund | $22 |
| Fidelity Securities Lending Cash Central Fund | 554 |
| Total | $576 |
Investment Valuation
The following is a summary of the inputs used, as of May 31, 2017, involving the Fund's assets and liabilities carried at fair value. The inputs or methodology used for valuing securities may not be an indication of the risk associated with investing in those securities. For more information on valuation inputs, and their aggregation into the levels used below, please refer to the Investment Valuation section in the accompanying Notes to Financial Statements.
| Valuation Inputs at Reporting Date: | ||||
| Description | Total | Level 1 | Level 2 | Level 3 |
| (Amounts in thousands) | ||||
| Investments in Securities: | ||||
| Equities: | ||||
| Consumer Discretionary | $425,085 | $425,085 | $-- | $-- |
| Consumer Staples | 172,571 | 118,126 | 46,953 | 7,492 |
| Energy | 32,049 | 32,049 | -- | -- |
| Financials | 96,909 | 96,909 | -- | -- |
| Health Care | 449,792 | 449,792 | -- | -- |
| Industrials | 88,089 | 88,089 | -- | -- |
| Information Technology | 1,090,119 | 1,069,940 | 780 | 19,399 |
| Materials | 131,807 | 131,807 | -- | -- |
| Real Estate | 132,599 | 127,580 | -- | 5,019 |
| Telecommunication Services | 38,699 | 38,699 | -- | -- |
| Corporate Bonds | 2,390 | -- | -- | 2,390 |
| Money Market Funds | 121,237 | 121,237 | -- | -- |
| Total Investments in Securities: | $2,781,346 | $2,699,313 | $47,733 | $34,300 |
The following is a reconciliation of Investments in Securities and Derivative Instruments for which Level 3 inputs were used in determining value:
| (Amounts in thousands) | ||||
| Investments in Securities: | ||||
| Beginning Balance | $27,830 | |||
| Net Realized Gain (Loss) on Investment Securities | -- | |||
| Net Unrealized Gain (Loss) on Investment Securities | 4,688 | |||
| Cost of Purchases | 2,390 | |||
| Proceeds of Sales | (608) | |||
| Amortization/Accretion | -- | |||
| Transfers into Level 3 | -- | |||
| Transfers out of Level 3 | -- | |||
| Ending Balance | $34,300 | |||
| The change in unrealized gain (loss) for the period attributable to Level 3 securities held at May 31, 2017 | $5,335 |
The information used in the above reconciliation represents fiscal year to date activity for any Investments in Securities identified as using Level 3 inputs at either the beginning or the end of the current fiscal period. Transfers in or out of Level 3 represent the beginning value of any Security or Instrument where a change in the pricing level occurred from the beginning to the end of the period. The cost of purchases and the proceeds of sales may include securities received or delivered through corporate actions or exchanges.
Other Information
Distribution of investments by country or territory of incorporation, as a percentage of Total Net Assets, is as follows (Unaudited):
| United States of America | 88.2% |
| Ireland | 2.9% |
| Netherlands | 2.6% |
| United Kingdom | 2.0% |
| British Virgin Islands | 1.0% |
| Others (Individually Less Than 1%) | 3.3% |
| 100.0% |
See accompanying notes which are an integral part of the financial statements.
Financial Statements
Statement of Assets and Liabilities
| Amounts in thousands (except per-share amounts) | May 31, 2017 (Unaudited) | |
| Assets | ||
| Investment in securities, at value (including securities loaned of $102,891) — See accompanying schedule: Unaffiliated issuers (cost $1,670,800) | $2,660,109 | |
| Fidelity Central Funds (cost $121,234) | 121,237 | |
| Total Investments (cost $1,792,034) | $2,781,346 | |
| Receivable for investments sold | 25,045 | |
| Receivable for fund shares sold | 816 | |
| Dividends receivable | 2,127 | |
| Interest receivable | 7 | |
| Distributions receivable from Fidelity Central Funds | 102 | |
| Prepaid expenses | 1 | |
| Other receivables | 127 | |
| Total assets | 2,809,571 | |
| Liabilities | ||
| Payable for investments purchased | $21,424 | |
| Payable for fund shares redeemed | 9,048 | |
| Accrued management fee | 1,067 | |
| Distribution and service plan fees payable | 834 | |
| Other affiliated payables | 465 | |
| Other payables and accrued expenses | 160 | |
| Collateral on securities loaned | 103,607 | |
| Total liabilities | 136,605 | |
| Net Assets | $2,672,966 | |
| Net Assets consist of: | ||
| Paid in capital | $1,575,546 | |
| Undistributed net investment income | 1,519 | |
| Accumulated undistributed net realized gain (loss) on investments and foreign currency transactions | 106,591 | |
| Net unrealized appreciation (depreciation) on investments and assets and liabilities in foreign currencies | 989,310 | |
| Net Assets | $2,672,966 | |
| Calculation of Maximum Offering Price | ||
| Class A: | ||
| Net Asset Value and redemption price per share ($499,989 ÷ 8,138.8 shares) | $61.43 | |
| Maximum offering price per share (100/94.25 of $61.43) | $65.18 | |
| Class M: | ||
| Net Asset Value and redemption price per share ($1,400,804 ÷ 22,939.6 shares) | $61.06 | |
| Maximum offering price per share (100/96.50 of $61.06) | $63.27 | |
| Class C: | ||
| Net Asset Value and offering price per share ($184,979 ÷ 3,403.7 shares)(a) | $54.35 | |
| Class I: | ||
| Net Asset Value, offering price and redemption price per share ($571,780 ÷ 8,734.0 shares) | $65.47 | |
| Class Z: | ||
| Net Asset Value, offering price and redemption price per share ($15,414 ÷ 234.0 shares) | $65.87 |
(a) Redemption price per share is equal to net asset value less any applicable contingent deferred sales charge.
See accompanying notes which are an integral part of the financial statements.
Statement of Operations
| Amounts in thousands | Six months ended May 31, 2017 (Unaudited) | |
| Investment Income | ||
| Dividends | $13,086 | |
| Interest | 7 | |
| Income from Fidelity Central Funds | 576 | |
| Total income | 13,669 | |
| Expenses | ||
| Management fee | ||
| Basic fee | $6,930 | |
| Performance adjustment | (2,497) | |
| Transfer agent fees | 2,359 | |
| Distribution and service plan fees | 4,790 | |
| Accounting and security lending fees | 387 | |
| Custodian fees and expenses | 32 | |
| Independent trustees' fees and expenses | 5 | |
| Appreciation in deferred trustee compensation account | 1 | |
| Registration fees | 47 | |
| Audit | 38 | |
| Legal | 6 | |
| Interest | 5 | |
| Miscellaneous | 12 | |
| Total expenses before reductions | 12,115 | |
| Expense reductions | (70) | 12,045 |
| Net investment income (loss) | 1,624 | |
| Realized and Unrealized Gain (Loss) | ||
| Net realized gain (loss) on: | ||
| Investment securities: | ||
| Unaffiliated issuers | 121,613 | |
| Foreign currency transactions | 57 | |
| Total net realized gain (loss) | 121,670 | |
| Change in net unrealized appreciation (depreciation) on: Investment securities | 344,251 | |
| Assets and liabilities in foreign currencies | (1) | |
| Total change in net unrealized appreciation (depreciation) | 344,250 | |
| Net gain (loss) | 465,920 | |
| Net increase (decrease) in net assets resulting from operations | $467,544 |
See accompanying notes which are an integral part of the financial statements.
Statement of Changes in Net Assets
| Amounts in thousands | Six months ended May 31, 2017 (Unaudited) | Year ended November 30, 2016 |
| Increase (Decrease) in Net Assets | ||
| Operations | ||
| Net investment income (loss) | $1,624 | $1,051 |
| Net realized gain (loss) | 121,670 | 350,793 |
| Change in net unrealized appreciation (depreciation) | 344,250 | (466,911) |
| Net increase (decrease) in net assets resulting from operations | 467,544 | (115,067) |
| Distributions to shareholders from net realized gain | (308,776) | (371,621) |
| Share transactions - net increase (decrease) | 15,238 | (448,647) |
| Total increase (decrease) in net assets | 174,006 | (935,335) |
| Net Assets | ||
| Beginning of period | 2,498,960 | 3,434,295 |
| End of period | $2,672,966 | $2,498,960 |
| Other Information | ||
| Undistributed net investment income end of period | $1,519 | $– |
| Accumulated net investment loss end of period | $– | $(105) |
See accompanying notes which are an integral part of the financial statements.
Financial Highlights — Fidelity Advisor Growth Opportunities Fund Class A
| Six months ended (Unaudited) May 31, | Years ended November 30, | |||||
| 2017 | 2016 | 2015 | 2014 | 2013 | 2012 | |
| Selected Per–Share Data | �� | |||||
| Net asset value, beginning of period | $58.24 | $66.87 | $63.52 | $54.89 | $41.34 | $35.39 |
| Income from Investment Operations | ||||||
| Net investment income (loss)A | .07 | .07 | (.08) | (.11) | (.10) | (.11) |
| Net realized and unrealized gain (loss) | 10.50 | (1.46) | 3.43 | 8.74 | 13.65 | 6.06 |
| Total from investment operations | 10.57 | (1.39) | 3.35 | 8.63 | 13.55 | 5.95 |
| Distributions from net realized gain | (7.38) | (7.24) | – | – | – | – |
| Total distributions | (7.38) | (7.24) | – | – | – | – |
| Net asset value, end of period | $61.43 | $58.24 | $66.87 | $63.52 | $54.89 | $41.34 |
| Total ReturnB,C,D | 20.29% | (2.37)% | 5.27% | 15.72% | 32.78% | 16.81% |
| Ratios to Average Net AssetsE,F | ||||||
| Expenses before reductions | .85%G | .86% | 1.05% | 1.08% | 1.23% | 1.30% |
| Expenses net of fee waivers, if any | .84%G | .86% | 1.05% | 1.08% | 1.23% | 1.29% |
| Expenses net of all reductions | .84%G | .86% | 1.05% | 1.08% | 1.23% | 1.29% |
| Net investment income (loss) | .24%G | .13% | (.12)% | (.18)% | (.20)% | (.29)% |
| Supplemental Data | ||||||
| Net assets, end of period (in millions) | $500 | $502 | $664 | $648 | $555 | $359 |
| Portfolio turnover rateH | 47%G | 66% | 51% | 13% | 17% | 34% |
A Calculated based on average shares outstanding during the period.
B Total returns for periods of less than one year are not annualized.
C Total returns would have been lower if certain expenses had not been reduced during the applicable periods shown.
D Total returns do not include the effect of the sales charges.
E Fees and expenses of any underlying Fidelity Central Funds are not included in the Fund's expense ratio. The Fund indirectly bears its proportionate share of the expenses of any underlying Fidelity Central Funds.
F Expense ratios reflect operating expenses of the class. Expenses before reductions do not reflect amounts reimbursed by the investment adviser or reductions from brokerage service arrangements or reductions from other expense offset arrangements and do not represent the amount paid by the class during periods when reimbursements or reductions occur. Expenses net of fee waivers reflect expenses after reimbursement by the investment adviser but prior to reductions from brokerage service arrangements or other expense offset arrangements. Expenses net of all reductions represent the net expenses paid by the class.
G Annualized
H Amount does not include the portfolio activity of any underlying Fidelity Central Funds.
See accompanying notes which are an integral part of the financial statements.
Financial Highlights — Fidelity Advisor Growth Opportunities Fund Class M
| Six months ended (Unaudited) May 31, | Years ended November 30, | |||||
| 2017 | 2016 | 2015 | 2014 | 2013 | 2012 | |
| Selected Per–Share Data | ||||||
| Net asset value, beginning of period | $57.99 | $66.75 | $63.55 | $55.04 | $41.54 | $35.62 |
| Income from Investment Operations | ||||||
| Net investment income (loss)A | –B | (.06) | (.23) | (.24) | (.19) | (.19) |
| Net realized and unrealized gain (loss) | 10.45 | (1.46) | 3.43 | 8.75 | 13.69 | 6.11 |
| Total from investment operations | 10.45 | (1.52) | 3.20 | 8.51 | 13.50 | 5.92 |
| Distributions from net realized gain | (7.38) | (7.24) | – | – | – | – |
| Total distributions | (7.38) | (7.24) | – | – | – | – |
| Net asset value, end of period | $61.06 | $57.99 | $66.75 | $63.55 | $55.04 | $41.54 |
| Total ReturnC,D,E | 20.15% | (2.59)% | 5.04% | 15.46% | 32.50% | 16.62% |
| Ratios to Average Net AssetsF,G | ||||||
| Expenses before reductions | 1.07%H | 1.09% | 1.28% | 1.31% | 1.43% | 1.48% |
| Expenses net of fee waivers, if any | 1.07%H | 1.09% | 1.28% | 1.31% | 1.43% | 1.48% |
| Expenses net of all reductions | 1.07%H | 1.09% | 1.28% | 1.31% | 1.43% | 1.48% |
| Net investment income (loss) | .01%H | (.10)% | (.35)% | (.40)% | (.40)% | (.48)% |
| Supplemental Data | ||||||
| Net assets, end of period (in millions) | $1,401 | $1,250 | $1,461 | $1,504 | $1,426 | $1,187 |
| Portfolio turnover rateI | 47%H | 66% | 51% | 13% | 17% | 34% |
A Calculated based on average shares outstanding during the period.
B Amount represents less than $.005 per share.
C Total returns for periods of less than one year are not annualized.
D Total returns would have been lower if certain expenses had not been reduced during the applicable periods shown.
E Total returns do not include the effect of the sales charges.
F Fees and expenses of any underlying Fidelity Central Funds are not included in the Fund's expense ratio. The Fund indirectly bears its proportionate share of the expenses of any underlying Fidelity Central Funds.
G Expense ratios reflect operating expenses of the class. Expenses before reductions do not reflect amounts reimbursed by the investment adviser or reductions from brokerage service arrangements or reductions from other expense offset arrangements and do not represent the amount paid by the class during periods when reimbursements or reductions occur. Expenses net of fee waivers reflect expenses after reimbursement by the investment adviser but prior to reductions from brokerage service arrangements or other expense offset arrangements. Expenses net of all reductions represent the net expenses paid by the class.
H Annualized
I Amount does not include the portfolio activity of any underlying Fidelity Central Funds.
See accompanying notes which are an integral part of the financial statements.
Financial Highlights — Fidelity Advisor Growth Opportunities Fund Class C
| Six months ended (Unaudited) May 31, | Years ended November 30, | |||||
| 2017 | 2016 | 2015 | 2014 | 2013 | 2012 | |
| Selected Per–Share Data | ||||||
| Net asset value, beginning of period | $52.52 | $61.42 | $58.78 | $51.17 | $38.83 | $33.48 |
| Income from Investment Operations | ||||||
| Net investment income (loss)A | (.13) | (.32) | (.52) | (.50) | (.42) | (.38) |
| Net realized and unrealized gain (loss) | 9.34 | (1.34) | 3.16 | 8.11 | 12.76 | 5.73 |
| Total from investment operations | 9.21 | (1.66) | 2.64 | 7.61 | 12.34 | 5.35 |
| Distributions from net realized gain | (7.38) | (7.24) | – | – | – | – |
| Total distributions | (7.38) | (7.24) | – | – | – | – |
| Net asset value, end of period | $54.35 | $52.52 | $61.42 | $58.78 | $51.17 | $38.83 |
| Total ReturnB,C,D | 19.86% | (3.10)% | 4.49% | 14.87% | 31.78% | 15.98% |
| Ratios to Average Net AssetsE,F | ||||||
| Expenses before reductions | 1.60%G | 1.61% | 1.80% | 1.83% | 1.96% | 2.04% |
| Expenses net of fee waivers, if any | 1.60%G | 1.61% | 1.80% | 1.83% | 1.96% | 2.03% |
| Expenses net of all reductions | 1.59%G | 1.61% | 1.80% | 1.83% | 1.96% | 2.02% |
| Net investment income (loss) | (.51)%G | (.62)% | (.87)% | (.93)% | (.93)% | (1.02)% |
| Supplemental Data | ||||||
| Net assets, end of period (in millions) | $185 | $178 | $238 | $212 | $159 | $71 |
| Portfolio turnover rateH | 47%G | 66% | 51% | 13% | 17% | 34% |
A Calculated based on average shares outstanding during the period.
B Total returns for periods of less than one year are not annualized.
C Total returns would have been lower if certain expenses had not been reduced during the applicable periods shown.
D Total returns do not include the effect of the contingent deferred sales charge.
E Fees and expenses of any underlying Fidelity Central Funds are not included in the Fund's expense ratio. The Fund indirectly bears its proportionate share of the expenses of any underlying Fidelity Central Funds.
F Expense ratios reflect operating expenses of the class. Expenses before reductions do not reflect amounts reimbursed by the investment adviser or reductions from brokerage service arrangements or reductions from other expense offset arrangements and do not represent the amount paid by the class during periods when reimbursements or reductions occur. Expenses net of fee waivers reflect expenses after reimbursement by the investment adviser but prior to reductions from brokerage service arrangements or other expense offset arrangements. Expenses net of all reductions represent the net expenses paid by the class.
G Annualized
H Amount does not include the portfolio activity of any underlying Fidelity Central Funds.
See accompanying notes which are an integral part of the financial statements.
Financial Highlights — Fidelity Advisor Growth Opportunities Fund Class I
| Six months ended (Unaudited) May 31, | Years ended November 30, | |||||
| 2017 | 2016 | 2015 | 2014 | 2013 | 2012 | |
| Selected Per–Share Data | ||||||
| Net asset value, beginning of period | $61.52 | $70.05 | $66.35 | $57.18 | $42.94 | $36.63 |
| Income from Investment Operations | ||||||
| Net investment income (loss)A | .16 | .25 | .11 | .05 | .05 | .01 |
| Net realized and unrealized gain (loss) | 11.17 | (1.54) | 3.59 | 9.12 | 14.19 | 6.30 |
| Total from investment operations | 11.33 | (1.29) | 3.70 | 9.17 | 14.24 | 6.31 |
| Distributions from net realized gain | (7.38) | (7.24) | – | – | – | – |
| Total distributions | (7.38) | (7.24) | – | – | – | – |
| Net asset value, end of period | $65.47 | $61.52 | $70.05 | $66.35 | $57.18 | $42.94 |
| Total ReturnB,C | 20.46% | (2.09)% | 5.58% | 16.04% | 33.16% | 17.23% |
| Ratios to Average Net AssetsD,E | ||||||
| Expenses before reductions | .57%F | .58% | .77% | .81% | .93% | .97% |
| Expenses net of fee waivers, if any | .57%F | .58% | .77% | .81% | .93% | .97% |
| Expenses net of all reductions | .56%F | .58% | .77% | .81% | .93% | .97% |
| Net investment income (loss) | .51%F | .41% | .16% | .09% | .09% | .04% |
| Supplemental Data | ||||||
| Net assets, end of period (in millions) | $572 | $562 | $1,061 | $1,357 | $1,112 | $475 |
| Portfolio turnover rateG | 47%F | 66% | 51% | 13% | 17% | 34% |
A Calculated based on average shares outstanding during the period.
B Total returns for periods of less than one year are not annualized.
C Total returns would have been lower if certain expenses had not been reduced during the applicable periods shown.
D Fees and expenses of any underlying Fidelity Central Funds are not included in the Fund's expense ratio. The Fund indirectly bears its proportionate share of the expenses of any underlying Fidelity Central Funds.
E Expense ratios reflect operating expenses of the class. Expenses before reductions do not reflect amounts reimbursed by the investment adviser or reductions from brokerage service arrangements or reductions from other expense offset arrangements and do not represent the amount paid by the class during periods when reimbursements or reductions occur. Expenses net of fee waivers reflect expenses after reimbursement by the investment adviser but prior to reductions from brokerage service arrangements or other expense offset arrangements. Expenses net of all reductions represent the net expenses paid by the class.
F Annualized
G Amount does not include the portfolio activity of any underlying Fidelity Central Funds.
See accompanying notes which are an integral part of the financial statements.
Financial Highlights — Fidelity Advisor Growth Opportunities Fund Class Z
| Six months ended (Unaudited) May 31, | Years ended November 30, | ||||
| 2017 | 2016 | 2015 | 2014 | 2013 A | |
| Selected Per–Share Data | |||||
| Net asset value, beginning of period | $61.82 | $70.27 | $66.48 | $57.20 | $53.30 |
| Income from Investment Operations | |||||
| Net investment income (loss)B | .20 | .33 | .20 | .14 | .02 |
| Net realized and unrealized gain (loss) | 11.23 | (1.54) | 3.59 | 9.14 | 3.88 |
| Total from investment operations | 11.43 | (1.21) | 3.79 | 9.28 | 3.90 |
| Distributions from net realized gain | (7.38) | (7.24) | – | – | – |
| Total distributions | (7.38) | (7.24) | – | – | – |
| Net asset value, end of period | $65.87 | $61.82 | $70.27 | $66.48 | $57.20 |
| Total ReturnC,D | 20.53% | (1.96)% | 5.70% | 16.22% | 7.32% |
| Ratios to Average Net AssetsE,F | |||||
| Expenses before reductions | .44%G | .45% | .64% | .67% | .78%G |
| Expenses net of fee waivers, if any | .44%G | .45% | .64% | .67% | .78%G |
| Expenses net of all reductions | .43%G | .45% | .64% | .67% | .78%G |
| Net investment income (loss) | .64%G | .54% | .29% | .24% | .14%G |
| Supplemental Data | |||||
| Net assets, end of period (in millions) | $15 | $7 | $5 | $3 | $– |
| Portfolio turnover rateH | 47%G | 66% | 51% | 13% | 17% |
A For the period August 13, 2013 (commencement of sale of shares) to November 30, 2013.
B Calculated based on average shares outstanding during the period.
C Total returns for periods of less than one year are not annualized.
D Total returns would have been lower if certain expenses had not been reduced during the applicable periods shown.
E Fees and expenses of any underlying Fidelity Central Funds are not included in the Fund's expense ratio. The Fund indirectly bears its proportionate share of the expenses of any underlying Fidelity Central Funds.
F Expense ratios reflect operating expenses of the class. Expenses before reductions do not reflect amounts reimbursed by the investment adviser or reductions from brokerage service arrangements or reductions from other expense offset arrangements and do not represent the amount paid by the class during periods when reimbursements or reductions occur. Expense ratios before reductions for start-up periods may not be representative of longer-term operating periods. Expenses net of fee waivers reflect expenses after reimbursement by the investment adviser but prior to reductions from brokerage service arrangements or other expense offset arrangements. Expenses net of all reductions represent the net expenses paid by the class.
G Annualized
H Amount does not include the portfolio activity of any underlying Fidelity Central Funds.
See accompanying notes which are an integral part of the financial statements.
Notes to Financial Statements (Unaudited)
For the period ended May 31, 2017
(Amounts in thousands except percentages)
1. Organization.
Fidelity Advisor Growth Opportunities Fund (the Fund) is a fund of Fidelity Advisor Series I (the Trust) and is authorized to issue an unlimited number of shares. The Trust is registered under the Investment Company Act of 1940, as amended (the 1940 Act), as an open-end management investment company organized as a Massachusetts business trust. The Fund offers Class A, Class M (formerly Class T), Class C, Class I and Class Z shares, each of which has equal rights as to assets and voting privileges. Each class has exclusive voting rights with respect to matters that affect that class.
After the close of business on June 24, 2016, all outstanding Class B shares were converted to Class A shares. All prior fiscal period dollar and share amounts for Class B presented in the Notes to Financial Statements are for the period December 1, 2015 through June 24, 2016.
2. Investments in Fidelity Central Funds.
The Fund invests in Fidelity Central Funds, which are open-end investment companies generally available only to other investment companies and accounts managed by the investment adviser and its affiliates. The Fund's Schedule of Investments lists each of the Fidelity Central Funds held as of period end, if any, as an investment of the Fund, but does not include the underlying holdings of each Fidelity Central Fund. As an Investing Fund, the Fund indirectly bears its proportionate share of the expenses of the underlying Fidelity Central Funds.
The Money Market Central Funds seek preservation of capital and current income and are managed by Fidelity Investments Money Management, Inc. (FIMM), an affiliate of the investment adviser. Annualized expenses of the Money Market Central Funds as of their most recent shareholder report date are less than .005%.
A complete unaudited list of holdings for each Fidelity Central Fund is available upon request or at the Securities and Exchange Commission (the SEC) website at www.sec.gov. In addition, the financial statements of the Fidelity Central Funds are available on the SEC website or upon request.
3. Significant Accounting Policies.
The Fund is an investment company and applies the accounting and reporting guidance of the Financial Accounting Standards Board (FASB) Accounting Standards Codification Topic 946 Financial Services – Investments Companies. The financial statements have been prepared in conformity with accounting principles generally accepted in the United States of America (GAAP), which require management to make certain estimates and assumptions at the date of the financial statements. Actual results could differ from those estimates. Subsequent events, if any, through the date that the financial statements were issued have been evaluated in the preparation of the financial statements. The following summarizes the significant accounting policies of the Fund:
Investment Valuation. Investments are valued as of 4:00 p.m. Eastern time on the last calendar day of the period. The Board of Trustees (the Board) has delegated the day to day responsibility for the valuation of the Fund's investments to the Fair Value Committee (the Committee) established by the Fund's investment adviser. In accordance with valuation policies and procedures approved by the Board, the Fund attempts to obtain prices from one or more third party pricing vendors or brokers to value its investments. When current market prices, quotations or currency exchange rates are not readily available or reliable, investments will be fair valued in good faith by the Committee, in accordance with procedures adopted by the Board. Factors used in determining fair value vary by investment type and may include market or investment specific events, changes in interest rates and credit quality. The frequency with which these procedures are used cannot be predicted and they may be utilized to a significant extent. The Committee oversees the Fund's valuation policies and procedures and reports to the Board on the Committee's activities and fair value determinations. The Board monitors the appropriateness of the procedures used in valuing the Fund's investments and ratifies the fair value determinations of the Committee.
The Fund categorizes the inputs to valuation techniques used to value its investments into a disclosure hierarchy consisting of three levels as shown below:
- Level 1 – quoted prices in active markets for identical investments
- Level 2 – other significant observable inputs (including quoted prices for similar investments, interest rates, prepayment speeds, etc.)
- Level 3 – unobservable inputs (including the Fund's own assumptions based on the best information available)
Valuation techniques used to value the Fund's investments by major category are as follows:
Equity securities, including restricted securities, for which market quotations are readily available, are valued at the last reported sale price or official closing price as reported by a third party pricing vendor on the primary market or exchange on which they are traded and are categorized as Level 1 in the hierarchy. In the event there were no sales during the day or closing prices are not available, securities are valued at the last quoted bid price or may be valued using the last available price and are generally categorized as Level 2 in the hierarchy. For foreign equity securities, when market or security specific events arise, comparisons to the valuation of American Depositary Receipts (ADRs), futures contracts, Exchange-Traded Funds (ETFs)and certain indexes as well as quoted prices for similar securities may be used and would be categorized as Level 2 in the hierarchy. Utilizing these techniques may result in transfers between Level 1 and Level 2. For equity securities, including restricted securities, where observable inputs are limited, assumptions about market activity and risk are used and these securities may be categorized as Level 3 in the hierarchy. Equity securities, including restricted securities, for which observable inputs are not available are valued using alternate valuation approaches, including the market approach and the income approach and are categorized as Level 3 in the hierarchy. The market approach generally consists of using comparable market transactions while the income approach generally consists of using the net present value of estimated future cash flows, adjusted as appropriate for liquidity, credit, market and/or other risk factors.
Debt securities, including restricted securities, are valued based on evaluated prices received from third party pricing vendors or from brokers who make markets in such securities. Corporate bonds are valued by pricing vendors who utilize matrix pricing which considers yield or price of bonds of comparable quality, coupon, maturity and type or by broker-supplied prices. Independent prices obtained from a single source or broker are evaluated by management and may be categorized as Level 3 in the hierarchy. When independent prices are unavailable or unreliable, debt securities may be valued utilizing pricing methodologies which consider similar factors that would be used by third party pricing vendors. Debt securities are generally categorized as Level 2 in the hierarchy but may be Level 3 depending on the circumstances.
Investments in open-end mutual funds, including the Fidelity Central Funds, are valued at their closing net asset value (NAV) each business day and are categorized as Level 1 in the hierarchy.
The following provides information on Level 3 securities held by the Fund that were valued at period end based on unobservable inputs. These amounts exclude valuations provided by a broker.
| Asset Type | Fair Value | Valuation Technique(s) | Unobservable Input | Amount or Range/Weighted Average | Impact to Valuation from an Increase in Input(a) |
| Corporate Bonds | $2,390 | Market approach | Transaction price | $100.00 | Increase |
| Equities | $31,910 | Market comparable | Enterprise value/Sales multiple (EV/S) | 2.0 - 2.4 / 2.2 | Increase |
| Discount rate | 35.0% | Decrease | |||
| Market approach | Transaction price | $3.85 - $48.77 / $29.17 | Increase |
(a) Represents the expected directional change in the fair value of the Level 3 investments that would result from an increase in the corresponding input. A decrease to the unobservable input would have the opposite effect. Significant changes in these inputs could result in significantly higher or lower fair value measurements.
Changes in valuation techniques may result in transfers in or out of an assigned level within the disclosure hierarchy. The aggregate value of investments by input level as of May 31, 2017, as well as a roll forward of Level 3 investments, is included at the end of the Fund's Schedule of Investments.
Foreign Currency. The Fund may use foreign currency contracts to facilitate transactions in foreign-denominated securities. Gains and losses from these transactions may arise from changes in the value of the foreign currency or if the counterparties do not perform under the contracts' terms.
Foreign-denominated assets, including investment securities, and liabilities are translated into U.S. dollars at the exchange rates at period end. Purchases and sales of investment securities, income and dividends received and expenses denominated in foreign currencies are translated into U.S. dollars at the exchange rate in effect on the transaction date.
The effects of exchange rate fluctuations on investments are included with the net realized and unrealized gain (loss) on investment securities. Other foreign currency transactions resulting in realized and unrealized gain (loss) are disclosed separately.
Investment Transactions and Income. For financial reporting purposes, the Fund's investment holdings and NAV include trades executed through the end of the last business day of the period. The NAV per share for processing shareholder transactions is calculated as of the close of business of the New York Stock Exchange (NYSE), normally 4:00 p.m. Eastern time and includes trades executed through the end of the prior business day. Gains and losses on securities sold are determined on the basis of identified cost and may include proceeds received from litigation. Dividend income is recorded on the ex-dividend date, except for certain dividends from foreign securities where the ex-dividend date may have passed, which are recorded as soon as the Fund is informed of the ex-dividend date. Non-cash dividends included in dividend income, if any, are recorded at the fair market value of the securities received. Income and capital gain distributions from Fidelity Central Funds, if any, are recorded on the ex-dividend date. Certain distributions received by the Fund represent a return of capital or capital gain. The Fund determines the components of these distributions subsequent to the ex-dividend date, based upon receipt of tax filings or other correspondence relating to the underlying investment. These distributions are recorded as a reduction of cost of investments and/or as a realized gain. Interest income is accrued as earned and includes coupon interest and amortization of premium and accretion of discount on debt securities as applicable. Investment income is recorded net of foreign taxes withheld where recovery of such taxes is uncertain.
Class Allocations and Expenses. Investment income, realized and unrealized capital gains and losses, common expenses of the Fund, and certain fund-level expense reductions, if any, are allocated daily on a pro-rata basis to each class based on the relative net assets of each class to the total net assets of the Fund. Each class differs with respect to transfer agent and distribution and service plan fees incurred. Certain expense reductions may also differ by class. For the reporting period, the allocated portion of income and expenses to each class as a percent of its average net assets may vary due to the timing of recording these transactions in relation to fluctuating net assets of the classes. Expenses directly attributable to a fund are charged to that fund. Expenses attributable to more than one fund are allocated among the respective funds on the basis of relative net assets or other appropriate methods. Expense estimates are accrued in the period to which they relate and adjustments are made when actual amounts are known.
Deferred Trustee Compensation. Under a Deferred Compensation Plan (the Plan), independent Trustees may elect to defer receipt of a portion of their annual compensation. Deferred amounts are invested in a cross-section of Fidelity funds, are marked-to-market and remain in the Fund until distributed in accordance with the Plan. The investment of deferred amounts and the offsetting payable to the Trustees are included in the accompanying Statement of Assets and Liabilities.
Income Tax Information and Distributions to Shareholders. Each year, the Fund intends to qualify as a regulated investment company under Subchapter M of the Internal Revenue Code, including distributing substantially all of its taxable income and realized gains. As a result, no provision for U.S. Federal income taxes is required. The Fund files a U.S. federal tax return, in addition to state and local tax returns as required. The Fund's federal income tax returns are subject to examination by the Internal Revenue Service (IRS) for a period of three fiscal years after they are filed. State and local tax returns may be subject to examination for an additional fiscal year depending on the jurisdiction. Foreign taxes are provided for based on the Fund's understanding of the tax rules and rates that exist in the foreign markets in which it invests.
Distributions are declared and recorded on the ex-dividend date. Income dividends and capital gain distributions are declared separately for each class. Income and capital gain distributions are determined in accordance with income tax regulations, which may differ from GAAP.
Capital accounts within the financial statements are adjusted for permanent book-tax differences. These adjustments have no impact on net assets or the results of operations. Capital accounts are not adjusted for temporary book-tax differences which will reverse in a subsequent period.
Book-tax differences are primarily due to foreign currency transactions, partnerships, passive foreign investment companies (PFIC), deferred trustees compensation, and losses deferred due to wash sales and excise tax regulations.
The federal tax cost of investment securities and unrealized appreciation (depreciation) as of period end were as follows:
| Gross unrealized appreciation | $1,046,018 |
| Gross unrealized depreciation | (59,317) |
| Net unrealized appreciation (depreciation) on securities | $986,701 |
| Tax cost | $1,794,645 |
Restricted Securities. The Fund may invest in securities that are subject to legal or contractual restrictions on resale. These securities generally may be resold in transactions exempt from registration or to the public if the securities are registered. Disposal of these securities may involve time-consuming negotiations and expense, and prompt sale at an acceptable price may be difficult. Information regarding restricted securities is included at the end of the Fund's Schedule of Investments.
4. Purchases and Sales of Investments.
Purchases and sales of securities other than short-term securities, aggregated $601,200 and $892,593, respectively.
5. Fees and Other Transactions with Affiliates.
Management Fee. Fidelity Management & Research Company (the investment adviser) and its affiliates provide the Fund with investment management related services for which the Fund pays a monthly management fee. The management fee is the sum of an individual fund fee rate that is based on an annual rate of .30% of the Fund's average net assets and an annualized group fee rate that averaged .25% during the period. The group fee rate is based upon the average net assets of all the mutual funds advised by the investment adviser, including any mutual funds previously advised by the investment adviser that are currently advised by Fidelity SelectCo, LLC, an affiliate of the investment adviser. The group fee rate decreases as assets under management increase and increases as assets under management decrease. In addition, the management fee is subject to a performance adjustment (up to a maximum of +/- .20% of the Fund's average net assets over a 36 month performance period). The upward or downward adjustment to the management fee is based on the investment performance of the asset-weighted return of all classes as compared to its benchmark index, the Russell 1000 Growth Index, over the same 36 month performance period. For the reporting period, the total annualized management fee rate, including the performance adjustment, was .35% of the Fund's average net assets. The performance adjustment included in the management fee rate may be higher or lower than the maximum performance adjustment rate due to the difference between the average net assets for the reporting and performance periods.
Distribution and Service Plan Fees. In accordance with Rule 12b-1 of the 1940 Act, the Fund has adopted separate Distribution and Service Plans for each class of shares. Certain classes pay Fidelity Distributors Corporation (FDC), an affiliate of the investment adviser, separate Distribution and Service Fees, each of which is based on an annual percentage of each class' average net assets. In addition, FDC may pay financial intermediaries for selling shares of the Fund and providing shareholder support services. For the period, the Distribution and Service Fee rates, total fees and amounts retained by FDC were as follows:
| Distribution Fee | Service Fee | Total Fees | Retained by FDC | |
| Class A | -% | .25% | $613 | $4 |
| Class M | .25% | .25% | 3,297 | – |
| Class C | .75% | .25% | 880 | 33 |
| $4,790 | $37 |
Sales Load. FDC may receive a front-end sales charge of up to 5.75% for selling Class A shares and 3.50% for selling Class M shares, some of which is paid to financial intermediaries for selling shares of the Fund. Depending on the holding period, FDC may receive contingent deferred sales charges levied on Class A, Class M, and Class C redemptions. The deferred sales charges are 1.00% for Class C shares, 1.00% for certain purchases of Class A shares and .25% for certain purchases of Class M shares.
For the period, sales charge amounts retained by FDC were as follows:
| Retained by FDC | |
| Class A | $43 |
| Class M | 14 |
| Class C(a) | 3 |
| $60 |
(a) When Class C shares are initially sold, FDC pays commissions from its own resources to financial intermediaries through which the sales are made.
Transfer Agent Fees. Fidelity Investments Institutional Operations Company, Inc., (FIIOC), an affiliate of the investment adviser, is the transfer, dividend disbursing and shareholder servicing agent for each class of the Fund. FIIOC receives account fees and asset-based fees that vary according to the account size and type of account of the shareholders of the respective classes of the Fund, except for Class Z. FIIOC pays for typesetting, printing and mailing of shareholder reports, except proxy statements.
For the period, transfer agent fees for each class were as follows:
| Amount | % of Class-Level Average Net Assets(a) | |
| Class A | $501 | .20 |
| Class M | 1,195 | .18 |
| Class C | 181 | .21 |
| Class I | 480 | .18 |
| Class Z | 2 | .05 |
| $2,359 |
(a) Annualized
Accounting and Security Lending Fees. Fidelity Service Company, Inc. (FSC), an affiliate of the investment adviser, maintains the Fund's accounting records. The accounting fee is based on the level of average net assets for each month. Under a separate contract, FSC administers the security lending program. The security lending fee is based on the number and duration of lending transactions.
Brokerage Commissions. The Fund placed a portion of its portfolio transactions with brokerage firms which are affiliates of the investment adviser. Brokerage commissions are included in net realized gain (loss) and change in net unrealized appreciation (depreciation) in the Statement of Operations. The commissions paid to these affiliated firms were $17 for the period.
Interfund Lending Program. Pursuant to an Exemptive Order issued by the SEC, the Fund, along with other registered investment companies having management contracts with FMR or other affiliated entities of FMR, may participate in an interfund lending program. This program provides an alternative credit facility allowing the funds to borrow from, or lend money to, other participating affiliated funds. At period end, there were no interfund loans outstanding. The Fund's activity in this program during the period for which loans were outstanding was as follows:
| Borrower or Lender | Average Loan Balance | Weighted Average Interest Rate | Interest Expense |
| Borrower | $8,777 | .79% | $5 |
Interfund Trades. The Fund may purchase from or sell securities to other Fidelity Funds under procedures adopted by the Board. The procedures have been designed to ensure these interfund trades are executed in accordance with Rule 17a-7 of the 1940 Act. Interfund trades are included within the respective purchases and sales amounts shown in the Purchases and Sales of Investments note.
6. Committed Line of Credit.
The Fund participates with other funds managed by the investment adviser FMR or an affiliate in a $4.25 billion credit facility (the "line of credit") to be utilized for temporary or emergency purposes to fund shareholder redemptions or for other short-term liquidity purposes. The Fund has agreed to pay commitment fees on its pro-rata portion of the line of credit, which amounted to $4 and is reflected in Miscellaneous expenses on the Statement of Operations. During the period, the Fund did not borrow on this line of credit.
7. Security Lending.
The Fund lends portfolio securities through a lending agent from time to time in order to earn additional income. For equity securities, a lending agent is used and may loan securities to certain qualified borrowers, including Fidelity Capital Markets (FCM), a broker-dealer affiliated with the Fund. On the settlement date of the loan, the Fund receives collateral (in the form of U.S. Treasury obligations, letters of credit and/or cash) against the loaned securities and maintains collateral in an amount not less than 100% of the market value of the loaned securities during the period of the loan. The market value of the loaned securities is determined at the close of business of the Fund and any additional required collateral is delivered to the Fund on the next business day. The Fund or borrower may terminate the loan at any time, and if the borrower defaults on its obligation to return the securities loaned because of insolvency or other reasons, the Fund may apply collateral received from the borrower against the obligation. The Fund may experience delays and costs in recovering the securities loaned. Any cash collateral received is invested in the Fidelity Securities Lending Cash Central Fund. The value of loaned securities and cash collateral at period end are disclosed on the Fund's Statement of Assets and Liabilities. The value of securities loaned to FCM at period end was $13,843. Security lending income represents the income earned on investing cash collateral, less rebates paid to borrowers and any lending agent fees associated with the loan, plus any premium payments received for lending certain types of securities. Security lending income is presented in the Statement of Operations as a component of income from Fidelity Central Funds. Total security lending income during the period amounted to $554, including $62 from securities loaned to FCM.
8. Expense Reductions.
Commissions paid to certain brokers with whom the investment adviser, or its affiliates, places trades on behalf of the Fund include an amount in addition to trade execution, which may be rebated back to the Fund to offset certain expenses. This amount totaled $59 for the period.
In addition, during the period the investments adviser reimbursed and/or waived a portion of fund-level operating expenses in the amount of $11.
9. Distributions to Shareholders.
Distributions to shareholders of each class were as follows:
| Six months ended May 31, 2017 | Year ended November 30, 2016 | |
| From net realized gain | ||
| Class A | $61,177 | $72,321 |
| Class M | 157,755 | 159,663 |
| Class B | – | 693 |
| Class C | 23,721 | 28,157 |
| Class I | 65,238 | 110,148 |
| Class Z | 885 | 639 |
| Total | $308,776 | $371,621 |
10. Share Transactions.
Share transactions for each class were as follows and may contain automatic conversions between classes or exchanges between affiliated funds:
| Shares | Shares | Dollars | Dollars | |
| Six months ended May 31, 2017 | Year ended November 30, 2016 | Six months ended May 31, 2017 | Year ended November 30, 2016 | |
| Class A | ||||
| Shares sold | 418 | 1,311 | $23,731 | $74,507 |
| Reinvestment of distributions | 1,085 | 1,108 | 57,029 | 66,937 |
| Shares redeemed | (1,981) | (3,734) | (112,532) | (212,794) |
| Net increase (decrease) | (478) | (1,315) | $(31,772) | $(71,350) |
| Class M | ||||
| Shares sold | 977 | 1,836 | $54,973 | $103,265 |
| Reinvestment of distributions | 2,861 | 2,514 | 149,667 | 151,539 |
| Shares redeemed | (2,448) | (4,690) | (138,080) | (265,874) |
| Net increase (decrease) | 1,390 | (340) | $66,560 | $(11,070) |
| Class B | ||||
| Shares sold | – | 1 | $– | $86 |
| Reinvestment of distributions | – | 12 | – | 660 |
| Shares redeemed | – | (109) | – | (5,429) |
| Net increase (decrease) | – | (96) | $– | $(4,683) |
| Class C | ||||
| Shares sold | 273 | 580 | $13,471 | $30,299 |
| Reinvestment of distributions | 437 | 428 | 20,384 | 23,475 |
| Shares redeemed | (699) | (1,488) | (35,212) | (77,315) |
| Net increase (decrease) | 11 | (480) | $(1,357) | $(23,541) |
| Class I | ||||
| Shares sold | 1,170 | 2,036 | $70,882 | $122,538 |
| Reinvestment of distributions | 782 | 1,258 | 43,776 | 79,978 |
| Shares redeemed | (2,351) | (9,303) | (139,872) | (544,163) |
| Net increase (decrease) | (399) | (6,009) | $(25,214) | $(341,647) |
| Class Z | ||||
| Shares sold | 174 | 79 | $10,788 | $5,053 |
| Reinvestment of distributions | 16 | 10 | 885 | 639 |
| Shares redeemed | (76) | (34) | (4,651) | (2,048) |
| Net increase (decrease) | 114 | 55 | $7,022 | $3,644 |
11. Other.
The Fund's organizational documents provide former and current trustees and officers with a limited indemnification against liabilities arising in connection with the performance of their duties to the Fund. In the normal course of business, the Fund may also enter into contracts that provide general indemnifications. The Fund's maximum exposure under these arrangements is unknown as this would be dependent on future claims that may be made against the Fund. The risk of material loss from such claims is considered remote.
Shareholder Expense Example
As a shareholder of the Fund, you incur two types of costs: (1) transaction costs, including sales charges (loads) on purchase payments or redemption proceeds, and (2) ongoing costs, including management fees, distribution and/or service (12b-1) fees and other Fund expenses. This Example is intended to help you understand your ongoing costs (in dollars) of investing in the Fund and to compare these costs with the ongoing costs of investing in other mutual funds.
The Example is based on an investment of $1,000 invested at the beginning of the period and held for the entire period (December 1, 2016 to May 31, 2017).
Actual Expenses
The first line of the accompanying table for each class of the Fund provides information about actual account values and actual expenses. You may use the information in this line, together with the amount you invested, to estimate the expenses that you paid over the period. Simply divide your account value by $1,000.00 (for example, an $8,600 account value divided by $1,000.00 = 8.6), then multiply the result by the number in the first line for a class of the Fund under the heading entitled "Expenses Paid During Period" to estimate the expenses you paid on your account during this period. In addition, the Fund, as a shareholder in the underlying Fidelity Central Funds, will indirectly bear its pro-rata share of the fees and expenses incurred by the underlying Fidelity Central Funds. These fees and expenses are not included in the Fund's annualized expense ratio used to calculate the expense estimate in the table below.
Hypothetical Example for Comparison Purposes
The second line of the accompanying table for each class of the Fund provides information about hypothetical account values and hypothetical expenses based on a Class' actual expense ratio and an assumed rate of return of 5% per year before expenses, which is not the Class' actual return. The hypothetical account values and expenses may not be used to estimate the actual ending account balance or expenses you paid for the period. You may use this information to compare the ongoing costs of investing in the Fund and other funds. To do so, compare this 5% hypothetical example with the 5% hypothetical examples that appear in the shareholder reports of the other funds. In addition, the Fund, as a shareholder in the underlying Fidelity Central Funds, will indirectly bear its pro-rata share of the fees and expenses incurred by the underlying Fidelity Central Funds. These fees and expenses are not included in the Fund's annualized expense ratio used to calculate the expense estimate in the table below.
Please note that the expenses shown in the table are meant to highlight your ongoing costs only and do not reflect any transaction costs. Therefore, the second line of the table is useful in comparing ongoing costs only, and will not help you determine the relative total costs of owning different funds. In addition, if these transactional costs were included, your costs would have been higher.
| Annualized Expense Ratio-A | Beginning Account Value December 1, 2016 | Ending Account Value May 31, 2017 | Expenses Paid During Period-B December 1, 2016 to May 31, 2017 | |
| Class A | .84% | |||
| Actual | $1,000.00 | $1,202.90 | $4.61 | |
| Hypothetical-C | $1,000.00 | $1,020.74 | $4.23 | |
| Class M | 1.07% | |||
| Actual | $1,000.00 | $1,201.50 | $5.87 | |
| Hypothetical-C | $1,000.00 | $1,019.60 | $5.39 | |
| Class C | 1.60% | |||
| Actual | $1,000.00 | $1,198.60 | $8.77 | |
| Hypothetical-C | $1,000.00 | $1,016.95 | $8.05 | |
| Class I | .57% | |||
| Actual | $1,000.00 | $1,204.60 | $3.13 | |
| Hypothetical-C | $1,000.00 | $1,022.09 | $2.87 | |
| Class Z | .44% | |||
| Actual | $1,000.00 | $1,205.30 | $2.42 | |
| Hypothetical-C | $1,000.00 | $1,022.74 | $2.22 |
A Annualized expense ratio reflects expenses net of applicable fee waivers.
B Expenses are equal to each Class' annualized expense ratio, multiplied by the average account value over the period, multiplied by 182/365 (to reflect the one-half year period).
C 5% return per year before expenses
![]()
GO-SANN-0717
1.704615.119
Fidelity Advisor® Large Cap Fund Semi-Annual Report May 31, 2017 |
|
Contents
To view a fund's proxy voting guidelines and proxy voting record for the 12-month period ended June 30, visit http://www.fidelity.com/proxyvotingresults or visit the Securities and Exchange Commission's (SEC) web site at http://www.sec.gov.
You may also call 1-877-208-0098 to request a free copy of the proxy voting guidelines.
Standard & Poor's, S&P and S&P 500 are registered service marks of The McGraw-Hill Companies, Inc. and have been licensed for use by Fidelity Distributors Corporation.
Other third-party marks appearing herein are the property of their respective owners.
All other marks appearing herein are registered or unregistered trademarks or service marks of FMR LLC or an affiliated company. © 2017 FMR LLC. All rights reserved.
This report and the financial statements contained herein are submitted for the general information of the shareholders of the Fund. This report is not authorized for distribution to prospective investors in the Fund unless preceded or accompanied by an effective prospectus.
A fund files its complete schedule of portfolio holdings with the SEC for the first and third quarters of each fiscal year on Form N-Q. Forms N-Q are available on the SEC’s web site at http://www.sec.gov. A fund's Forms N-Q may be reviewed and copied at the SEC’s Public Reference Room in Washington, DC. Information regarding the operation of the SEC's Public Reference Room may be obtained by calling 1-800-SEC-0330.
For a complete list of a fund's portfolio holdings, view the most recent holdings listing, semiannual report, or annual report on Fidelity's web site at http://www.fidelity.com, http://www.institutional.fidelity.com, or http://www.401k.com, as applicable.
NOT FDIC INSURED •MAY LOSE VALUE •NO BANK GUARANTEE
Neither the Fund nor Fidelity Distributors Corporation is a bank.
Investment Summary (Unaudited)
Top Ten Stocks as of May 31, 2017
| % of fund's net assets | % of fund's net assets 6 months ago | |
| Apple, Inc. | 3.3 | 3.1 |
| Bank of America Corp. | 3.3 | 3.6 |
| Microsoft Corp. | 3.2 | 2.9 |
| JPMorgan Chase & Co. | 3.1 | 3.5 |
| Citigroup, Inc. | 3.0 | 2.7 |
| General Electric Co. | 2.3 | 2.5 |
| Comcast Corp. Class A | 2.2 | 1.9 |
| Alphabet, Inc. Class A | 2.1 | 1.7 |
| State Street Corp. | 1.9 | 1.9 |
| ConocoPhillips Co. | 1.8 | 1.6 |
| 26.2 |
Top Five Market Sectors as of May 31, 2017
| % of fund's net assets | % of fund's net assets 6 months ago | |
| Financials | 22.8 | 23.4 |
| Information Technology | 19.2 | 19.0 |
| Health Care | 15.0 | 13.1 |
| Energy | 12.3 | 14.0 |
| Industrials | 11.0 | 11.2 |
Asset Allocation (% of fund's net assets)
| As of May 31, 2017 * | ||
| Stocks | 99.1% | |
| Other Investments | 0.2% | |
| Short-Term Investments and Net Other Assets (Liabilities) | 0.7% | |

* Foreign investments - 8.4%
| As of November 30, 2016 * | ||
| Stocks | 99.2% | |
| Other Investments | 0.2% | |
| Short-Term Investments and Net Other Assets (Liabilities) | 0.6% | |

* Foreign investments - 8.8%
Investments May 31, 2017 (Unaudited)
Showing Percentage of Net Assets
| Common Stocks - 99.1% | |||
| Shares | Value | ||
| CONSUMER DISCRETIONARY - 7.7% | |||
| Automobiles - 0.0% | |||
| General Motors Co. | 14,600 | $495,378 | |
| Distributors - 0.4% | |||
| LKQ Corp. (a) | 151,700 | 4,777,033 | |
| Household Durables - 0.6% | |||
| KB Home | 221,800 | 4,653,364 | |
| Taylor Morrison Home Corp. (a) | 140,900 | 3,275,925 | |
| 7,929,289 | |||
| Leisure Products - 0.0% | |||
| NJOY, Inc. (a)(b) | 417,589 | 4 | |
| Media - 4.7% | |||
| AMC Networks, Inc. Class A (a) | 37,700 | 1,997,346 | |
| Comcast Corp. Class A | 702,374 | 29,281,972 | |
| Scripps Networks Interactive, Inc. Class A | 78,500 | 5,198,270 | |
| Sinclair Broadcast Group, Inc. Class A | 36,500 | 1,182,600 | |
| The Walt Disney Co. | 78,000 | 8,419,320 | |
| Time Warner, Inc. | 127,859 | 12,720,692 | |
| Viacom, Inc. Class B (non-vtg.) | 142,500 | 4,957,575 | |
| 63,757,775 | |||
| Multiline Retail - 0.7% | |||
| Target Corp. | 162,840 | 8,980,626 | |
| Specialty Retail - 1.3% | |||
| AutoZone, Inc. (a) | 1,200 | 727,104 | |
| L Brands, Inc. | 53,900 | 2,781,240 | |
| Lowe's Companies, Inc. | 151,279 | 11,916,247 | |
| TJX Companies, Inc. | 31,900 | 2,399,199 | |
| 17,823,790 | |||
| TOTAL CONSUMER DISCRETIONARY | 103,763,895 | ||
| CONSUMER STAPLES - 5.8% | |||
| Beverages - 2.2% | |||
| Diageo PLC | 67,802 | 2,038,037 | |
| Dr. Pepper Snapple Group, Inc. | 29,100 | 2,700,771 | |
| Molson Coors Brewing Co. Class B | 77,200 | 7,317,788 | |
| The Coca-Cola Co. | 388,975 | 17,686,693 | |
| 29,743,289 | |||
| Food & Staples Retailing - 1.0% | |||
| Costco Wholesale Corp. | 11,700 | 2,111,031 | |
| CVS Health Corp. | 94,111 | 7,230,548 | |
| Kroger Co. | 139,100 | 4,142,398 | |
| Wal-Mart Stores, Inc. | 6,000 | 471,600 | |
| 13,955,577 | |||
| Food Products - 0.1% | |||
| Amplify Snack Brands, Inc. (a) | 142,800 | 1,306,620 | |
| Household Products - 1.7% | |||
| Procter & Gamble Co. | 253,152 | 22,300,160 | |
| Personal Products - 0.4% | |||
| Coty, Inc. Class A | 170,400 | 3,227,376 | |
| Unilever NV (NY Reg.) | 41,200 | 2,339,336 | |
| 5,566,712 | |||
| Tobacco - 0.4% | |||
| Altria Group, Inc. | 64,000 | 4,828,160 | |
| TOTAL CONSUMER STAPLES | 77,700,518 | ||
| ENERGY - 12.1% | |||
| Energy Equipment & Services - 1.2% | |||
| Baker Hughes, Inc. | 93,400 | 5,151,010 | |
| Ensco PLC Class A | 100,450 | 626,808 | |
| National Oilwell Varco, Inc. | 148,232 | 4,842,739 | |
| Oceaneering International, Inc. | 136,800 | 3,335,184 | |
| Schlumberger Ltd. | 21,905 | 1,524,369 | |
| 15,480,110 | |||
| Oil, Gas & Consumable Fuels - 10.9% | |||
| Amyris, Inc. (a)(c) | 953,908 | 247,062 | |
| Anadarko Petroleum Corp. | 81,800 | 4,133,354 | |
| Apache Corp. | 250,410 | 11,709,172 | |
| Cabot Oil & Gas Corp. | 295,700 | 6,561,583 | |
| Cenovus Energy, Inc. | 728,200 | 6,495,769 | |
| Chevron Corp. | 174,807 | 18,089,028 | |
| ConocoPhillips Co. | 533,000 | 23,819,770 | |
| Golar LNG Ltd. | 65,000 | 1,512,225 | |
| Imperial Oil Ltd. | 213,800 | 6,049,107 | |
| Kinder Morgan, Inc. | 567,000 | 10,636,920 | |
| Legacy Reserves LP (a) | 97,600 | 197,152 | |
| Noble Energy, Inc. | 16,900 | 484,861 | |
| PDC Energy, Inc. (a) | 9,500 | 471,770 | |
| Phillips 66 Co. | 4,500 | 342,495 | |
| SM Energy Co. | 76,700 | 1,301,599 | |
| Suncor Energy, Inc. | 740,000 | 23,161,121 | |
| Teekay Offshore Partners LP | 77,900 | 243,827 | |
| The Williams Companies, Inc. | 735,329 | 21,030,409 | |
| Williams Partners LP | 264,700 | 10,368,299 | |
| 146,855,523 | |||
| TOTAL ENERGY | 162,335,633 | ||
| FINANCIALS - 22.8% | |||
| Banks - 14.7% | |||
| Bank of America Corp. | 1,957,499 | 43,867,553 | |
| Citigroup, Inc. | 669,897 | 40,555,564 | |
| Comerica, Inc. | 54,200 | 3,715,952 | |
| JPMorgan Chase & Co. | 503,168 | 41,335,251 | |
| PNC Financial Services Group, Inc. | 83,285 | 9,885,930 | |
| Regions Financial Corp. | 499,400 | 6,911,696 | |
| Standard Chartered PLC (United Kingdom) (a) | 114,429 | 1,079,084 | |
| SunTrust Banks, Inc. | 316,608 | 16,897,369 | |
| U.S. Bancorp | 268,765 | 13,677,451 | |
| Wells Fargo & Co. | 380,194 | 19,443,121 | |
| 197,368,971 | |||
| Capital Markets - 6.6% | |||
| CBOE Holdings, Inc. | 33,200 | 2,867,484 | |
| Charles Schwab Corp. | 252,153 | 9,770,929 | |
| Goldman Sachs Group, Inc. | 29,000 | 6,126,540 | |
| KKR & Co. LP | 349,436 | 6,436,611 | |
| Morgan Stanley | 363,943 | 15,190,981 | |
| Northern Trust Corp. | 146,986 | 12,852,456 | |
| State Street Corp. | 315,058 | 25,664,625 | |
| TD Ameritrade Holding Corp. | 16,400 | 612,704 | |
| The Blackstone Group LP | 293,900 | 9,663,432 | |
| 89,185,762 | |||
| Diversified Financial Services - 0.6% | |||
| KKR Renaissance Co-Invest LP unit (a)(b) | 29,500 | 7,455,378 | |
| Thrifts & Mortgage Finance - 0.9% | |||
| MGIC Investment Corp. (a) | 254,092 | 2,688,293 | |
| Radian Group, Inc. | 583,568 | 9,372,102 | |
| 12,060,395 | |||
| TOTAL FINANCIALS | 306,070,506 | ||
| HEALTH CARE - 15.0% | |||
| Biotechnology - 3.9% | |||
| Alexion Pharmaceuticals, Inc. (a) | 79,005 | 7,744,860 | |
| Alnylam Pharmaceuticals, Inc. (a) | 17,300 | 1,132,458 | |
| Amgen, Inc. | 110,857 | 17,209,441 | |
| Biogen, Inc. (a) | 17,600 | 4,360,752 | |
| BioMarin Pharmaceutical, Inc. (a) | 30,900 | 2,708,076 | |
| Celldex Therapeutics, Inc. (a) | 4,800 | 13,584 | |
| Genocea Biosciences, Inc. (a) | 21,200 | 129,320 | |
| Gilead Sciences, Inc. | 62,400 | 4,049,136 | |
| Insmed, Inc. (a) | 63,764 | 983,241 | |
| Intercept Pharmaceuticals, Inc. (a) | 45,731 | 5,117,299 | |
| Myriad Genetics, Inc. (a)(c) | 33,800 | 687,830 | |
| Regeneron Pharmaceuticals, Inc. (a) | 4,300 | 1,973,958 | |
| Spark Therapeutics, Inc. (a) | 22,400 | 1,140,832 | |
| TESARO, Inc. (a) | 3,000 | 447,930 | |
| Trevena, Inc. (a) | 113,400 | 264,222 | |
| Vertex Pharmaceuticals, Inc. (a) | 37,000 | 4,573,200 | |
| 52,536,139 | |||
| Health Care Equipment & Supplies - 3.1% | |||
| Alere, Inc. (a) | 114,500 | 5,554,395 | |
| Boston Scientific Corp. (a) | 763,086 | 20,626,215 | |
| Medtronic PLC | 99,800 | 8,411,144 | |
| NxStage Medical, Inc. (a) | 115,300 | 2,497,398 | |
| Zimmer Biomet Holdings, Inc. | 33,400 | 3,981,614 | |
| 41,070,766 | |||
| Health Care Providers & Services - 2.6% | |||
| Aetna, Inc. | 10,100 | 1,463,086 | |
| Anthem, Inc. | 31,000 | 5,652,850 | |
| Cardinal Health, Inc. | 7,600 | 564,604 | |
| Cigna Corp. | 41,400 | 6,674,922 | |
| Express Scripts Holding Co. (a) | 50,710 | 3,029,923 | |
| Humana, Inc. | 20,100 | 4,668,426 | |
| McKesson Corp. | 52,696 | 8,594,191 | |
| UnitedHealth Group, Inc. | 24,600 | 4,309,428 | |
| 34,957,430 | |||
| Health Care Technology - 0.1% | |||
| Castlight Health, Inc. Class B (a) | 219,080 | 766,780 | |
| Life Sciences Tools & Services - 0.3% | |||
| Agilent Technologies, Inc. | 73,200 | 4,416,888 | |
| Pharmaceuticals - 5.0% | |||
| Allergan PLC | 13,329 | 2,982,364 | |
| Bayer AG | 3,300 | 438,480 | |
| Bristol-Myers Squibb Co. | 137,500 | 7,418,125 | |
| GlaxoSmithKline PLC sponsored ADR | 521,629 | 23,071,651 | |
| Jazz Pharmaceuticals PLC (a) | 51,107 | 7,439,135 | |
| Johnson & Johnson | 107,863 | 13,833,430 | |
| Novartis AG sponsored ADR | 900 | 73,593 | |
| Sanofi SA | 11,429 | 1,132,085 | |
| Teva Pharmaceutical Industries Ltd. sponsored ADR | 297,691 | 8,293,671 | |
| TherapeuticsMD, Inc. (a) | 529,000 | 2,195,350 | |
| 66,877,884 | |||
| TOTAL HEALTH CARE | 200,625,887 | ||
| INDUSTRIALS - 11.0% | |||
| Aerospace & Defense - 2.1% | |||
| General Dynamics Corp. | 7,900 | 1,605,675 | |
| Textron, Inc. | 62,600 | 2,992,280 | |
| The Boeing Co. | 36,763 | 6,897,842 | |
| United Technologies Corp. | 137,982 | 16,734,457 | |
| 28,230,254 | |||
| Air Freight & Logistics - 1.5% | |||
| C.H. Robinson Worldwide, Inc. | 55,459 | 3,716,308 | |
| FedEx Corp. | 18,400 | 3,566,656 | |
| United Parcel Service, Inc. Class B | 113,175 | 11,993,155 | |
| 19,276,119 | |||
| Commercial Services & Supplies - 0.2% | |||
| Stericycle, Inc. (a) | 32,100 | 2,624,817 | |
| Electrical Equipment - 1.1% | |||
| Acuity Brands, Inc. | 10,500 | 1,710,555 | |
| AMETEK, Inc. | 124,630 | 7,604,923 | |
| Hubbell, Inc. Class B | 21,782 | 2,524,752 | |
| Melrose Industries PLC | 934,101 | 2,879,475 | |
| 14,719,705 | |||
| Industrial Conglomerates - 2.3% | |||
| General Electric Co. | 1,141,244 | 31,247,261 | |
| Machinery - 0.8% | |||
| Colfax Corp. (a) | 18,000 | 730,080 | |
| Deere & Co. | 9,900 | 1,212,354 | |
| Flowserve Corp. | 118,500 | 5,747,250 | |
| Wabtec Corp. | 39,900 | 3,261,825 | |
| 10,951,509 | |||
| Professional Services - 0.2% | |||
| Acacia Research Corp. (a) | 36,900 | 145,755 | |
| IHS Markit Ltd. (a) | 66,136 | 3,032,336 | |
| 3,178,091 | |||
| Road & Rail - 2.8% | |||
| CSX Corp. | 255,201 | 13,824,238 | |
| Genesee & Wyoming, Inc. Class A (a) | 58,300 | 3,818,650 | |
| J.B. Hunt Transport Services, Inc. | 91,200 | 7,786,656 | |
| Norfolk Southern Corp. | 47,558 | 5,898,619 | |
| Old Dominion Freight Lines, Inc. | 31,600 | 2,822,512 | |
| Union Pacific Corp. | 30,100 | 3,320,030 | |
| 37,470,705 | |||
| TOTAL INDUSTRIALS | 147,698,461 | ||
| INFORMATION TECHNOLOGY - 19.2% | |||
| Communications Equipment - 1.5% | |||
| Cisco Systems, Inc. | 652,054 | 20,559,263 | |
| Internet Software & Services - 4.3% | |||
| Akamai Technologies, Inc. (a) | 5,700 | 268,755 | |
| Alphabet, Inc.: | |||
| Class A (a) | 27,756 | 27,397,670 | |
| Class C (a) | 23,637 | 22,806,396 | |
| Facebook, Inc. Class A (a) | 44,700 | 6,770,262 | |
| 57,243,083 | |||
| IT Services - 4.1% | |||
| Cognizant Technology Solutions Corp. Class A | 40,884 | 2,735,548 | |
| FleetCor Technologies, Inc. (a) | 19,600 | 2,828,084 | |
| MasterCard, Inc. Class A | 120,100 | 14,757,888 | |
| Paychex, Inc. | 162,422 | 9,620,255 | |
| PayPal Holdings, Inc. (a) | 51,900 | 2,709,699 | |
| Unisys Corp. (a)(c) | 307,187 | 3,624,807 | |
| Visa, Inc. Class A | 201,110 | 19,151,705 | |
| 55,427,986 | |||
| Semiconductors & Semiconductor Equipment - 1.8% | |||
| Qualcomm, Inc. | 408,950 | 23,420,567 | |
| Software - 4.1% | |||
| Adobe Systems, Inc. (a) | 35,710 | 5,065,821 | |
| Autodesk, Inc. (a) | 57,781 | 6,458,182 | |
| Microsoft Corp. | 623,054 | 43,514,091 | |
| 55,038,094 | |||
| Technology Hardware, Storage & Peripherals - 3.4% | |||
| Apple, Inc. | 293,321 | 44,807,712 | |
| Western Digital Corp. | 14,300 | 1,287,858 | |
| 46,095,570 | |||
| TOTAL INFORMATION TECHNOLOGY | 257,784,563 | ||
| MATERIALS - 3.3% | |||
| Chemicals - 2.7% | |||
| CF Industries Holdings, Inc. | 119,800 | 3,222,620 | |
| E.I. du Pont de Nemours & Co. | 32,815 | 2,589,760 | |
| Intrepid Potash, Inc. (a)(c) | 692,560 | 1,482,078 | |
| LyondellBasell Industries NV Class A | 67,400 | 5,427,048 | |
| Monsanto Co. | 102,017 | 11,978,836 | |
| Potash Corp. of Saskatchewan, Inc. | 318,600 | 5,261,847 | |
| W.R. Grace & Co. | 84,100 | 6,029,129 | |
| 35,991,318 | |||
| Containers & Packaging - 0.5% | |||
| WestRock Co. | 118,189 | 6,431,845 | |
| Metals & Mining - 0.1% | |||
| Freeport-McMoRan, Inc. (a) | 192,100 | 2,207,229 | |
| TOTAL MATERIALS | 44,630,392 | ||
| REAL ESTATE - 0.3% | |||
| Equity Real Estate Investment Trusts (REITs) - 0.3% | |||
| American Tower Corp. | 2,100 | 275,499 | |
| Crown Castle International Corp. | 12,900 | 1,311,285 | |
| Public Storage | 9,600 | 2,067,360 | |
| 3,654,144 | |||
| TELECOMMUNICATION SERVICES - 0.8% | |||
| Diversified Telecommunication Services - 0.8% | |||
| Verizon Communications, Inc. | 223,094 | 10,405,104 | |
| UTILITIES - 1.1% | |||
| Electric Utilities - 0.9% | |||
| Exelon Corp. | 304,400 | 11,052,764 | |
| PPL Corp. | 10,500 | 419,055 | |
| 11,471,819 | |||
| Independent Power and Renewable Electricity Producers - 0.2% | |||
| Dynegy, Inc. (a) | 330,300 | 2,731,581 | |
| TOTAL UTILITIES | 14,203,400 | ||
| TOTAL COMMON STOCKS | |||
| (Cost $1,030,056,711) | 1,328,872,503 | ||
| Energy - 0.2% | |||
| Oil, Gas & Consumable Fuels - 0.2% | |||
| Utica Shale Drilling Program (non-operating revenue interest) (b)(d) | |||
| (Cost $2,201,528) | 2,201,072 | 2,201,072 | |
| Money Market Funds - 1.0% | |||
| Fidelity Cash Central Fund, 0.86% (e) | 11,995,212 | 11,997,611 | |
| Fidelity Securities Lending Cash Central Fund 0.87% (e)(f) | 2,051,166 | 2,051,371 | |
| TOTAL MONEY MARKET FUNDS | |||
| (Cost $14,048,945) | 14,048,982 | ||
| TOTAL INVESTMENT PORTFOLIO - 100.3% | |||
| (Cost $1,046,307,184) | 1,345,122,557 | ||
| NET OTHER ASSETS (LIABILITIES) - (0.3)% | (3,806,812) | ||
| NET ASSETS - 100% | $1,341,315,745 |
Legend
(a) Non-income producing
(b) Restricted securities - Investment in securities not registered under the Securities Act of 1933 (excluding 144A issues). At the end of the period, the value of restricted securities (excluding 144A issues) amounted to $9,656,454 or 0.7% of net assets.
(c) Security or a portion of the security is on loan at period end.
(d) Investment is owned by a wholly-owned subsidiary (Subsidiary) that is treated as a corporation for U.S. tax purposes.
(e) Affiliated fund that is generally available only to investment companies and other accounts managed by Fidelity Investments. The rate quoted is the annualized seven-day yield of the fund at period end. A complete unaudited listing of the fund's holdings as of its most recent quarter end is available upon request. In addition, each Fidelity Central Fund's financial statements are available on the SEC's website or upon request.
(f) Investment made with cash collateral received from securities on loan.
Additional information on each restricted holding is as follows:
| Security | Acquisition Date | Acquisition Cost |
| KKR Renaissance Co-Invest LP unit | 7/25/13 | $3,112,250 |
| NJOY, Inc. | 6/7/13 - 10/24/13 | $1,208,497 |
| Utica Shale Drilling Program (non-operating revenue interest) | 10/5/16 - 11/4/16 | $2,201,072 |
Affiliated Central Funds
Information regarding fiscal year to date income earned by the Fund from investments in Fidelity Central Funds is as follows:
| Fund | Income earned |
| Fidelity Cash Central Fund | $48,704 |
| Fidelity Securities Lending Cash Central Fund | 40,708 |
| Total | $89,412 |
Investment Valuation
The following is a summary of the inputs used, as of May 31, 2017, involving the Fund's assets and liabilities carried at fair value. The inputs or methodology used for valuing securities may not be an indication of the risk associated with investing in those securities. For more information on valuation inputs, and their aggregation into the levels used below, please refer to the Investment Valuation section in the accompanying Notes to Financial Statements.
| Valuation Inputs at Reporting Date: | ||||
| Description | Total | Level 1 | Level 2 | Level 3 |
| Investments in Securities: | ||||
| Equities: | ||||
| Consumer Discretionary | $103,763,895 | $103,763,891 | $-- | $4 |
| Consumer Staples | 77,700,518 | 75,662,481 | 2,038,037 | -- |
| Energy | 162,335,633 | 162,335,633 | -- | -- |
| Financials | 306,070,506 | 298,615,128 | 7,455,378 | -- |
| Health Care | 200,625,887 | 199,055,322 | 1,570,565 | -- |
| Industrials | 147,698,461 | 147,698,461 | -- | -- |
| Information Technology | 257,784,563 | 257,784,563 | -- | -- |
| Materials | 44,630,392 | 44,630,392 | -- | -- |
| Real Estate | 3,654,144 | 3,654,144 | -- | -- |
| Telecommunication Services | 10,405,104 | 10,405,104 | -- | -- |
| Utilities | 14,203,400 | 14,203,400 | -- | -- |
| Other | 2,201,072 | -- | -- | 2,201,072 |
| Money Market Funds | 14,048,982 | 14,048,982 | -- | -- |
| Total Investments in Securities: | $1,345,122,557 | $1,331,857,501 | $11,063,980 | $2,201,076 |
See accompanying notes which are an integral part of the financial statements.
Financial Statements
Statement of Assets and Liabilities
| May 31, 2017 (Unaudited) | ||
| Assets | ||
| Investment in securities, at value (including securities loaned of $1,688,884) — See accompanying schedule: Unaffiliated issuers (cost $1,032,258,239) | $1,331,073,575 | |
| Fidelity Central Funds (cost $14,048,945) | 14,048,982 | |
| Total Investments (cost $1,046,307,184) | $1,345,122,557 | |
| Restricted cash | 27,404 | |
| Receivable for investments sold | 1,519,627 | |
| Receivable for fund shares sold | 1,972,647 | |
| Dividends receivable | 2,592,481 | |
| Distributions receivable from Fidelity Central Funds | 13,158 | |
| Prepaid expenses | 391 | |
| Other receivables | 3,735 | |
| Total assets | 1,351,252,000 | |
| Liabilities | ||
| Payable for investments purchased | $2,036,768 | |
| Payable for fund shares redeemed | 4,776,355 | |
| Accrued management fee | 449,784 | |
| Distribution and service plan fees payable | 333,202 | |
| Other affiliated payables | 248,697 | |
| Other payables and accrued expenses | 38,249 | |
| Collateral on securities loaned | 2,053,200 | |
| Total liabilities | 9,936,255 | |
| Net Assets | $1,341,315,745 | |
| Net Assets consist of: | ||
| Paid in capital | $1,016,335,892 | |
| Undistributed net investment income | 5,677,446 | |
| Accumulated undistributed net realized gain (loss) on investments and foreign currency transactions | 20,489,776 | |
| Net unrealized appreciation (depreciation) on investments and assets and liabilities in foreign currencies | 298,812,631 | |
| Net Assets | $1,341,315,745 | |
| Calculation of Maximum Offering Price | ||
| Class A: | ||
| Net Asset Value and redemption price per share ($448,412,219 ÷ 14,169,324 shares) | $31.65 | |
| Maximum offering price per share (100/94.25 of $31.65) | $33.58 | |
| Class M: | ||
| Net Asset Value and redemption price per share ($183,590,459 ÷ 5,813,697 shares) | $31.58 | |
| Maximum offering price per share (100/96.50 of $31.58) | $32.73 | |
| Class C: | ||
| Net Asset Value and offering price per share ($190,886,722 ÷ 6,612,962 shares)(a) | $28.87 | |
| Class I: | ||
| Net Asset Value, offering price and redemption price per share ($507,249,589 ÷ 15,365,258 shares) | $33.01 | |
| Class Z: | ||
| Net Asset Value, offering price and redemption price per share ($11,176,756 ÷ 338,430 shares) | $33.03 |
(a) Redemption price per share is equal to net asset value less any applicable contingent deferred sales charge.
See accompanying notes which are an integral part of the financial statements.
Statement of Operations
| Six months ended May 31, 2017 (Unaudited) | ||
| Investment Income | ||
| Dividends | $12,748,293 | |
| Interest | 39,449 | |
| Income from Fidelity Central Funds | 89,412 | |
| Total income | 12,877,154 | |
| Expenses | ||
| Management fee | ||
| Basic fee | $3,626,336 | |
| Performance adjustment | (807,349) | |
| Transfer agent fees | 1,279,954 | |
| Distribution and service plan fees | 1,984,829 | |
| Accounting and security lending fees | 211,824 | |
| Custodian fees and expenses | 27,722 | |
| Independent trustees' fees and expenses | 2,608 | |
| Registration fees | 69,462 | |
| Audit | 33,882 | |
| Legal | 6,258 | |
| Miscellaneous | 6,261 | |
| Total expenses before reductions | 6,441,787 | |
| Expense reductions | (35,001) | 6,406,786 |
| Net investment income (loss) | 6,470,368 | |
| Realized and Unrealized Gain (Loss) | ||
| Net realized gain (loss) on: | ||
| Investment securities: | ||
| Unaffiliated issuers | 28,890,392 | |
| Fidelity Central Funds | (2,151) | |
| Foreign currency transactions | (2,642) | |
| Total net realized gain (loss) | 28,885,599 | |
| Change in net unrealized appreciation (depreciation) on: Investment securities | 47,073,652 | |
| Assets and liabilities in foreign currencies | 2,620 | |
| Total change in net unrealized appreciation (depreciation) | 47,076,272 | |
| Net gain (loss) | 75,961,871 | |
| Net increase (decrease) in net assets resulting from operations | $82,432,239 |
See accompanying notes which are an integral part of the financial statements.
Statement of Changes in Net Assets
| Six months ended May 31, 2017 (Unaudited) | Year ended November 30, 2016 | |
| Increase (Decrease) in Net Assets | ||
| Operations | ||
| Net investment income (loss) | $6,470,368 | $14,380,305 |
| Net realized gain (loss) | 28,885,599 | 7,404,292 |
| Change in net unrealized appreciation (depreciation) | 47,076,272 | 95,980,039 |
| Net increase (decrease) in net assets resulting from operations | 82,432,239 | 117,764,636 |
| Distributions to shareholders from net investment income | (13,125,295) | (10,152,553) |
| Distributions to shareholders from net realized gain | (11,235,785) | (28,234,872) |
| Total distributions | (24,361,080) | (38,387,425) |
| Share transactions - net increase (decrease) | 52,341,121 | (180,256,330) |
| Total increase (decrease) in net assets | 110,412,280 | (100,879,119) |
| Net Assets | ||
| Beginning of period | 1,230,903,465 | 1,331,782,584 |
| End of period | $1,341,315,745 | $1,230,903,465 |
| Other Information | ||
| Undistributed net investment income end of period | $5,677,446 | $12,332,373 |
See accompanying notes which are an integral part of the financial statements.
Financial Highlights — Fidelity Advisor Large Cap Fund Class A
| Six months ended (Unaudited) May 31, | Years ended November 30, | |||||
| 2017 | 2016 | 2015 | 2014 | 2013 | 2012 | |
| Selected Per–Share Data | ||||||
| Net asset value, beginning of period | $30.27 | $28.12 | $29.60 | $28.11 | $20.43 | $17.57 |
| Income from Investment Operations | ||||||
| Net investment income (loss)A | .16 | .34 | .25 | .20 | .16 | .15 |
| Net realized and unrealized gain (loss) | 1.83 | 2.64 | (.74) | 3.45 | 7.61 | 3.30 |
| Total from investment operations | 1.99 | 2.98 | (.49) | 3.65 | 7.77 | 3.45 |
| Distributions from net investment income | (.33) | (.23) | (.14) | (.22) | (.02) | (.18) |
| Distributions from net realized gain | (.27) | (.60) | (.85) | (1.94) | (.07) | (.41) |
| Total distributions | (.61)B | (.83) | (.99) | (2.16) | (.09) | (.59) |
| Net asset value, end of period | $31.65 | $30.27 | $28.12 | $29.60 | $28.11 | $20.43 |
| Total ReturnC,D,E | 6.62% | 11.09% | (1.57)% | 14.13% | 38.16% | 19.69% |
| Ratios to Average Net AssetsF,G | ||||||
| Expenses before reductions | .92%H | .92% | 1.15% | 1.30% | 1.26% | 1.25% |
| Expenses net of fee waivers, if any | .92%H | .92% | 1.15% | 1.25% | 1.26% | 1.25% |
| Expenses net of all reductions | .92%H | .91% | 1.15% | 1.25% | 1.24% | 1.24% |
| Net investment income (loss) | 1.02%H | 1.25% | .90% | .72% | .68% | .76% |
| Supplemental Data | ||||||
| Net assets, end of period (000 omitted) | $448,412 | $455,182 | $469,026 | $414,421 | $214,686 | $123,303 |
| Portfolio turnover rateI | 30%H | 28% | 31% | 28% | 54% | 59% |
A Calculated based on average shares outstanding during the period.
B Total distributions of $.61 per share is comprised of distributions from net investment income of $.334 and distributions from net realized gain of $.273 per share.
C Total returns for periods of less than one year are not annualized.
D Total returns would have been lower if certain expenses had not been reduced during the applicable periods shown.
E Total returns do not include the effect of the sales charges.
F Fees and expenses of any underlying Fidelity Central Funds are not included in the Fund's expense ratio. The Fund indirectly bears its proportionate share of the expenses of any underlying Fidelity Central Funds.
G Expense ratios reflect operating expenses of the class. Expenses before reductions do not reflect amounts reimbursed by the investment adviser or reductions from brokerage service arrangements or reductions from other expense offset arrangements and do not represent the amount paid by the class during periods when reimbursements or reductions occur. Expenses net of fee waivers reflect expenses after reimbursement by the investment adviser but prior to reductions from brokerage service arrangements or other expense offset arrangements. Expenses net of all reductions represent the net expenses paid by the class.
H Annualized
I Amount does not include the portfolio activity of any underlying Fidelity Central Funds.
See accompanying notes which are an integral part of the financial statements.
Financial Highlights — Fidelity Advisor Large Cap Fund Class M
| Six months ended (Unaudited) May 31, | Years ended November 30, | |||||
| 2017 | 2016 | 2015 | 2014 | 2013 | 2012 | |
| Selected Per–Share Data | ||||||
| Net asset value, beginning of period | $30.17 | $28.02 | $29.50 | $28.02 | $20.41 | $17.51 |
| Income from Investment Operations | ||||||
| Net investment income (loss)A | .12 | .27 | .18 | .13 | .10 | .10 |
| Net realized and unrealized gain (loss) | 1.82 | 2.64 | (.74) | 3.44 | 7.59 | 3.29 |
| Total from investment operations | 1.94 | 2.91 | (.56) | 3.57 | 7.69 | 3.39 |
| Distributions from net investment income | (.26) | (.16) | (.07) | (.15) | (.01) | (.10) |
| Distributions from net realized gain | (.27) | (.60) | (.85) | (1.94) | (.07) | (.39) |
| Total distributions | (.53) | (.76) | (.92) | (2.09) | (.08) | (.49) |
| Net asset value, end of period | $31.58 | $30.17 | $28.02 | $29.50 | $28.02 | $20.41 |
| Total ReturnB,C,D | 6.48% | 10.81% | (1.84)% | 13.83% | 37.82% | 19.39% |
| Ratios to Average Net AssetsE,F | ||||||
| Expenses before reductions | 1.19%G | 1.18% | 1.41% | 1.56% | 1.51% | 1.49% |
| Expenses net of fee waivers, if any | 1.18%G | 1.18% | 1.41% | 1.50% | 1.51% | 1.49% |
| Expenses net of all reductions | 1.18%G | 1.18% | 1.41% | 1.50% | 1.49% | 1.49% |
| Net investment income (loss) | .76%G | .99% | .63% | .47% | .42% | .52% |
| Supplemental Data | ||||||
| Net assets, end of period (000 omitted) | $183,590 | $173,119 | $177,560 | $170,613 | $114,864 | $76,151 |
| Portfolio turnover rateH | 30%G | 28% | 31% | 28% | 54% | 59% |
A Calculated based on average shares outstanding during the period.
B Total returns for periods of less than one year are not annualized.
C Total returns would have been lower if certain expenses had not been reduced during the applicable periods shown.
D Total returns do not include the effect of the sales charges.
E Fees and expenses of any underlying Fidelity Central Funds are not included in the Fund's expense ratio. The Fund indirectly bears its proportionate share of the expenses of any underlying Fidelity Central Funds.
F Expense ratios reflect operating expenses of the class. Expenses before reductions do not reflect amounts reimbursed by the investment adviser or reductions from brokerage service arrangements or reductions from other expense offset arrangements and do not represent the amount paid by the class during periods when reimbursements or reductions occur. Expenses net of fee waivers reflect expenses after reimbursement by the investment adviser but prior to reductions from brokerage service arrangements or other expense offset arrangements. Expenses net of all reductions represent the net expenses paid by the class.
G Annualized
H Amount does not include the portfolio activity of any underlying Fidelity Central Funds.
See accompanying notes which are an integral part of the financial statements.
Financial Highlights — Fidelity Advisor Large Cap Fund Class C
| Six months ended (Unaudited) May 31, | Years ended November 30, | |||||
| 2017 | 2016 | 2015 | 2014 | 2013 | 2012 | |
| Selected Per–Share Data | ||||||
| Net asset value, beginning of period | $27.58 | $25.70 | $27.21 | $26.07 | $19.08 | $16.41 |
| Income from Investment Operations | ||||||
| Net investment income (loss)A | .04 | .12 | .04 | (.01) | (.02) | –B |
| Net realized and unrealized gain (loss) | 1.68 | 2.40 | (.69) | 3.19 | 7.08 | 3.09 |
| Total from investment operations | 1.72 | 2.52 | (.65) | 3.18 | 7.06 | 3.09 |
| Distributions from net investment income | (.15) | (.04) | (.01) | (.10) | –B | (.03) |
| Distributions from net realized gain | (.27) | (.60) | (.85) | (1.94) | (.07) | (.39) |
| Total distributions | (.43)C | (.64) | (.86) | (2.04) | (.07) | (.42) |
| Net asset value, end of period | $28.87 | $27.58 | $25.70 | $27.21 | $26.07 | $19.08 |
| Total ReturnD,E,F | 6.26% | 10.21% | (2.33)% | 13.31% | 37.14% | 18.83% |
| Ratios to Average Net AssetsG,H | ||||||
| Expenses before reductions | 1.68%I | 1.67% | 1.90% | 2.05% | 2.00% | 2.00% |
| Expenses net of fee waivers, if any | 1.68%I | 1.67% | 1.90% | 2.00% | 2.00% | 2.00% |
| Expenses net of all reductions | 1.68%I | 1.67% | 1.90% | 2.00% | 1.99% | 1.99% |
| Net investment income (loss) | .26%I | .49% | .14% | (.03)% | (.07)% | .01% |
| Supplemental Data | ||||||
| Net assets, end of period (000 omitted) | $190,887 | $169,524 | $181,957 | $168,763 | $67,780 | $28,856 |
| Portfolio turnover rateJ | 30%I | 28% | 31% | 28% | 54% | 59% |
A Calculated based on average shares outstanding during the period.
B Amount represents less than $.005 per share.
C Total distributions of $.43 per share is comprised of distributions from net investment income of $.152 and distributions from net realized gain of $.273 per share.
D Total returns for periods of less than one year are not annualized.
E Total returns would have been lower if certain expenses had not been reduced during the applicable periods shown.
F Total returns do not include the effect of the contingent deferred sales charge.
G Fees and expenses of any underlying Fidelity Central Funds are not included in the Fund's expense ratio. The Fund indirectly bears its proportionate share of the expenses of any underlying Fidelity Central Funds.
H Expense ratios reflect operating expenses of the class. Expenses before reductions do not reflect amounts reimbursed by the investment adviser or reductions from brokerage service arrangements or reductions from other expense offset arrangements and do not represent the amount paid by the class during periods when reimbursements or reductions occur. Expenses net of fee waivers reflect expenses after reimbursement by the investment adviser but prior to reductions from brokerage service arrangements or other expense offset arrangements. Expenses net of all reductions represent the net expenses paid by the class.
I Annualized
J Amount does not include the portfolio activity of any underlying Fidelity Central Funds.
See accompanying notes which are an integral part of the financial statements.
Financial Highlights — Fidelity Advisor Large Cap Fund Class I
| Six months ended (Unaudited) May 31, | Years ended November 30, | |||||
| 2017 | 2016 | 2015 | 2014 | 2013 | 2012 | |
| Selected Per–Share Data | ||||||
| Net asset value, beginning of period | $31.57 | $29.30 | $30.78 | $29.03 | $21.03 | $18.13 |
| Income from Investment Operations | ||||||
| Net investment income (loss)A | .21 | .43 | .34 | .28 | .24 | .22 |
| Net realized and unrealized gain (loss) | 1.91 | 2.74 | (.78) | 3.59 | 7.85 | 3.40 |
| Total from investment operations | 2.12 | 3.17 | (.44) | 3.87 | 8.09 | 3.62 |
| Distributions from net investment income | (.40) | (.30) | (.20) | (.18) | (.02) | (.31) |
| Distributions from net realized gain | (.27) | (.60) | (.85) | (1.94) | (.07) | (.41) |
| Total distributions | (.68)B | (.90) | (1.04)C | (2.12) | (.09) | (.72) |
| Net asset value, end of period | $33.01 | $31.57 | $29.30 | $30.78 | $29.03 | $21.03 |
| Total ReturnD,E | 6.77% | 11.34% | (1.33)% | 14.43% | 38.62% | 20.10% |
| Ratios to Average Net AssetsF,G | ||||||
| Expenses before reductions | .66%H | .65% | .89% | 1.04% | .95% | .91% |
| Expenses net of fee waivers, if any | .66%H | .65% | .89% | 1.00% | .95% | .91% |
| Expenses net of all reductions | .65%H | .65% | .89% | 1.00% | .94% | .91% |
| Net investment income (loss) | 1.28%H | 1.51% | 1.15% | .97% | .98% | 1.10% |
| Supplemental Data | ||||||
| Net assets, end of period (000 omitted) | $507,250 | $433,079 | $498,404 | $515,771 | $242,897 | $1,071,491 |
| Portfolio turnover rateI | 30%H | 28% | 31% | 28% | 54% | 59% |
A Calculated based on average shares outstanding during the period.
B Total distributions of $.68 per share is comprised of distributions from net investment income of $.404 and distributions from net realized gain of $.273 per share.
C Total distributions of $1.04 per share is comprised of distributions from net investment income of $.195 and distributions from net realized gain of $.849 per share.
D Total returns for periods of less than one year are not annualized.
E Total returns would have been lower if certain expenses had not been reduced during the applicable periods shown.
F Fees and expenses of any underlying Fidelity Central Funds are not included in the Fund's expense ratio. The Fund indirectly bears its proportionate share of the expenses of any underlying Fidelity Central Funds.
G Expense ratios reflect operating expenses of the class. Expenses before reductions do not reflect amounts reimbursed by the investment adviser or reductions from brokerage service arrangements or reductions from other expense offset arrangements and do not represent the amount paid by the class during periods when reimbursements or reductions occur. Expenses net of fee waivers reflect expenses after reimbursement by the investment adviser but prior to reductions from brokerage service arrangements or other expense offset arrangements. Expenses net of all reductions represent the net expenses paid by the class.
H Annualized
I Amount does not include the portfolio activity of any underlying Fidelity Central Funds.
See accompanying notes which are an integral part of the financial statements.
Financial Highlights — Fidelity Advisor Large Cap Fund Class Z
| Six months ended (Unaudited) May 31, | |
| 2017 A | |
| Selected Per–Share Data | |
| Net asset value, beginning of period | $32.04 |
| Income from Investment Operations | |
| Net investment income (loss)B | .20 |
| Net realized and unrealized gain (loss) | .79 |
| Total from investment operations | .99 |
| Distributions from net investment income | – |
| Distributions from net realized gain | – |
| Total distributions | – |
| Net asset value, end of period | $33.03 |
| Total ReturnC,D | 3.09% |
| Ratios to Average Net AssetsE,F | |
| Expenses before reductions | .53%G |
| Expenses net of fee waivers, if any | .53%G |
| Expenses net of all reductions | .52%G |
| Net investment income (loss) | 1.90%G |
| Supplemental Data | |
| Net assets, end of period (000 omitted) | $11,177 |
| Portfolio turnover rateH | 30%G |
A For the period February 1, 2017 (commencement of sale of shares) to May 31, 2017.
B Calculated based on average shares outstanding during the period.
C Total returns for periods of less than one year are not annualized.
D Total returns would have been lower if certain expenses had not been reduced during the applicable periods shown.
E Fees and expenses of any underlying Fidelity Central Funds are not included in the Fund's expense ratio. The Fund indirectly bears its proportionate share of the expenses of any underlying Fidelity Central Funds.
F Expense ratios reflect operating expenses of the class. Expenses before reductions do not reflect amounts reimbursed by the investment adviser or reductions from brokerage service arrangements or reductions from other expense offset arrangements and do not represent the amount paid by the class during periods when reimbursements or reductions occur. Expense ratios before reductions for start-up periods may not be representative of longer-term operating periods. Expenses net of fee waivers reflect expenses after reimbursement by the investment adviser but prior to reductions from brokerage service arrangements or other expense offset arrangements. Expenses net of all reductions represent the net expenses paid by the class.
G Annualized
H Amount does not include the portfolio activity of any underlying Fidelity Central Funds.
See accompanying notes which are an integral part of the financial statements.
Notes to Financial Statements (Unaudited)
For the period ended May 31, 2017
1. Organization.
Fidelity Advisor Large Cap Fund (the Fund) is a fund of Fidelity Advisor Series I (the Trust) and is authorized to issue an unlimited number of shares. The Trust is registered under the Investment Company Act of 1940, as amended (the 1940 Act), as an open-end management investment company organized as a Massachusetts business trust. The Fund commenced sale of Class Z shares on February 1, 2017. The Fund offers Class A, Class M (formerly Class T), Class C, Class I and Class Z shares, each of which has equal rights as to assets and voting privileges. Each class has exclusive voting rights with respect to matters that affect that class.
After the close of business on June 24, 2016, all outstanding Class B shares were converted to Class A shares. All prior fiscal period dollar and share amounts for Class B presented in the Notes to Financial Statements are for the period December 1, 2015 through June 24, 2016.
2. Investments in Fidelity Central Funds.
The Fund invests in Fidelity Central Funds, which are open-end investment companies generally available only to other investment companies and accounts managed by the investment adviser and its affiliates. The Fund's Schedule of Investments lists each of the Fidelity Central Funds held as of period end, if any, as an investment of the Fund, but does not include the underlying holdings of each Fidelity Central Fund. As an Investing Fund, the Fund indirectly bears its proportionate share of the expenses of the underlying Fidelity Central Funds.
The Money Market Central Funds seek preservation of capital and current income and are managed by Fidelity Investments Money Management, Inc. (FIMM), an affiliate of the investment adviser. Annualized expenses of the Money Market Central Funds as of their most recent shareholder report date are less than .005%.
A complete unaudited list of holdings for each Fidelity Central Fund is available upon request or at the Securities and Exchange Commission (the SEC) website at www.sec.gov. In addition, the financial statements of the Fidelity Central Funds are available on the SEC website or upon request.
3. Significant Accounting Policies.
The Fund is an investment company and applies the accounting and reporting guidance of the Financial Accounting Standards Board (FASB) Accounting Standards Codification Topic 946 Financial Services – Investments Companies. The financial statements have been prepared in conformity with accounting principles generally accepted in the United States of America (GAAP), which require management to make certain estimates and assumptions at the date of the financial statements. Actual results could differ from those estimates. Subsequent events, if any, through the date that the financial statements were issued have been evaluated in the preparation of the financial statements. The following summarizes the significant accounting policies of the Fund:
Investment Valuation. Investments are valued as of 4:00 p.m. Eastern time on the last calendar day of the period. The Board of Trustees (the Board) has delegated the day to day responsibility for the valuation of the Fund's investments to the Fair Value Committee (the Committee) established by the Fund's investment adviser. In accordance with valuation policies and procedures approved by the Board, the Fund attempts to obtain prices from one or more third party pricing vendors or brokers to value its investments. When current market prices, quotations or currency exchange rates are not readily available or reliable, investments will be fair valued in good faith by the Committee, in accordance with procedures adopted by the Board. Factors used in determining fair value vary by investment type and may include market or investment specific events. The frequency with which these procedures are used cannot be predicted and they may be utilized to a significant extent. The Committee oversees the Fund's valuation policies and procedures and reports to the Board on the Committee's activities and fair value determinations. The Board monitors the appropriateness of the procedures used in valuing the Fund's investments and ratifies the fair value determinations of the Committee.
The Fund categorizes the inputs to valuation techniques used to value its investments into a disclosure hierarchy consisting of three levels as shown below:
- Level 1 – quoted prices in active markets for identical investments
- Level 2 – other significant observable inputs (including quoted prices for similar investments, interest rates, prepayment speeds, etc.)
- Level 3 – unobservable inputs (including the Fund's own assumptions based on the best information available)
Valuation techniques used to value the Fund's investments by major category are as follows:
Equity securities, including restricted securities, for which market quotations are readily available, are valued at the last reported sale price or official closing price as reported by a third party pricing vendor on the primary market or exchange on which they are traded and are categorized as Level 1 in the hierarchy. In the event there were no sales during the day or closing prices are not available, securities are valued at the last quoted bid price or may be valued using the last available price and are generally categorized as Level 2 in the hierarchy. For foreign equity securities, when market or security specific events arise, comparisons to the valuation of American Depositary Receipts (ADRs), futures contracts, Exchange-Traded Funds (ETFs) and certain indexes as well as quoted prices for similar securities may be used and would be categorized as Level 2 in the hierarchy. Utilizing these techniques may result in transfers between Level 1 and Level 2. For equity securities, including restricted securities, where observable inputs are limited, assumptions about market activity and risk are used and these securities may be categorized as Level 3 in the hierarchy.
Investments in open-end mutual funds, including the Fidelity Central Funds, are valued at their closing net asset value (NAV) each business day and are categorized as Level 1 in the hierarchy.
Changes in valuation techniques may result in transfers in or out of an assigned level within the disclosure hierarchy. The aggregate value of investments by input level as of May 31, 2017 is included at the end of the Fund's Schedule of Investments.
Foreign Currency. The Fund may use foreign currency contracts to facilitate transactions in foreign-denominated securities. Gains and losses from these transactions may arise from changes in the value of the foreign currency or if the counterparties do not perform under the contracts' terms.
Foreign-denominated assets, including investment securities, and liabilities are translated into U.S. dollars at the exchange rates at period end. Purchases and sales of investment securities, income and dividends received and expenses denominated in foreign currencies are translated into U.S. dollars at the exchange rate in effect on the transaction date.
The effects of exchange rate fluctuations on investments are included with the net realized and unrealized gain (loss) on investment securities. Other foreign currency transactions resulting in realized and unrealized gain (loss) are disclosed separately.
Investment Transactions and Income. For financial reporting purposes, the Fund's investment holdings and NAV include trades executed through the end of the last business day of the period. The NAV per share for processing shareholder transactions is calculated as of the close of business of the New York Stock Exchange (NYSE), normally 4:00 p.m. Eastern time and includes trades executed through the end of the prior business day. Gains and losses on securities sold are determined on the basis of identified cost and may include proceeds received from litigation. Dividend income is recorded on the ex-dividend date, except for certain dividends from foreign securities where the ex-dividend date may have passed, which are recorded as soon as the Fund is informed of the ex-dividend date. Non-cash dividends included in dividend income, if any, are recorded at the fair market value of the securities received. Income and capital gain distributions from Fidelity Central Funds, if any, are recorded on the ex-dividend date. Certain distributions received by the Fund represent a return of capital or capital gain. The Fund determines the components of these distributions subsequent to the ex-dividend date, based upon receipt of tax filings or other correspondence relating to the underlying investment. These distributions are recorded as a reduction of cost of investments and/or as a realized gain. Interest income is accrued as earned and includes coupon interest and amortization of premium and accretion of discount on debt securities as applicable. Investment income is recorded net of foreign taxes withheld where recovery of such taxes is uncertain.
Class Allocations and Expenses. Investment income, realized and unrealized capital gains and losses, common expenses of the Fund, and certain fund-level expense reductions, if any, are allocated daily on a pro-rata basis to each class based on the relative net assets of each class to the total net assets of the Fund. Each class differs with respect to transfer agent and distribution and service plan fees incurred. Certain expense reductions may also differ by class. For the reporting period, the allocated portion of income and expenses to each class as a percent of its average net assets may vary due to the timing of recording these transactions in relation to fluctuating net assets of the classes. Expenses directly attributable to a fund are charged to that fund. Expenses attributable to more than one fund are allocated among the respective funds on the basis of relative net assets or other appropriate methods. Expense estimates are accrued in the period to which they relate and adjustments are made when actual amounts are known.
Income Tax Information and Distributions to Shareholders. Each year, the Fund intends to qualify as a regulated investment company under Subchapter M of the Internal Revenue Code, including distributing substantially all of its taxable income and realized gains. As a result, no provision for U.S. Federal income taxes is required. The Fund files a U.S. federal tax return, in addition to state and local tax returns as required. The Fund's federal income tax returns are subject to examination by the Internal Revenue Service (IRS) for a period of three fiscal years after they are filed. State and local tax returns may be subject to examination for an additional fiscal year depending on the jurisdiction. Foreign taxes are provided for based on the Fund's understanding of the tax rules and rates that exist in the foreign markets in which it invests.
Distributions are declared and recorded on the ex-dividend date. Income dividends and capital gain distributions are declared separately for each class. Income and capital gain distributions are determined in accordance with income tax regulations, which may differ from GAAP.
Capital accounts within the financial statements are adjusted for permanent book-tax differences. These adjustments have no impact on net assets or the results of operations. Capital accounts are not adjusted for temporary book-tax differences which will reverse in a subsequent period.
Book-tax differences are primarily due to partnerships, foreign currency transactions, deferred trustees compensation and losses deferred due to wash sales.
The federal tax cost of investment securities and unrealized appreciation (depreciation) as of period end were as follows:
| Gross unrealized appreciation | $363,515,464 |
| Gross unrealized depreciation | (70,129,478) |
| Net unrealized appreciation (depreciation) on securities | $293,385,986 |
| Tax cost | $1,051,736,571 |
Restricted Securities. The Fund may invest in securities that are subject to legal or contractual restrictions on resale. These securities generally may be resold in transactions exempt from registration or to the public if the securities are registered. Disposal of these securities may involve time-consuming negotiations and expense, and prompt sale at an acceptable price may be difficult. Information regarding restricted securities is included at the end of the Fund's Schedule of Investments.
Consolidated Subsidiary. The Fund invests in certain investments through a wholly-owned subsidiary ("Subsidiary"), which may be subject to federal and state taxes upon disposition.
As of period end, the Fund held an investment of $2,228,476 in this Subsidiary, representing .17% of the Fund's net assets. The financial statements have been consolidated and include accounts of the Fund and the Subsidiary. Accordingly, all inter-company transactions and balances have been eliminated.
Any cash held by the Subsidiary is restricted as to its use and is presented as Restricted cash in the Statement of Assets and Liabilities.
4. Purchases and Sales of Investments.
Purchases and sales of securities, other than short-term securities, aggregated $225,874,924 and $194,611,953, respectively.
5. Fees and Other Transactions with Affiliates.
Management Fee. Fidelity Management & Research Company (the investment adviser) and its affiliates provide the Fund with investment management related services for which the Fund pays a monthly management fee. The management fee is the sum of an individual fund fee rate that is based on an annual rate of .30% of the Fund's average net assets and an annualized group fee rate that averaged .25% during the period. The group fee rate is based upon the average net assets of all the mutual funds advised by the investment adviser, including any mutual funds previously advised by the investment adviser that are currently advised by Fidelity SelectCo, LLC, an affiliate of the investment adviser. The group fee rate decreases as assets under management increase and increases as assets under management decrease. In addition, the management fee is subject to a performance adjustment (up to a maximum of +/- .20% of the Fund's average net assets over a 36 month performance period). The upward or downward adjustment to the management fee is based on the relative investment performance of Class I of the Fund as compared to its benchmark index, the S&P 500 Index, over the same 36 month performance period. For the reporting period, the total annualized management fee rate, including the performance adjustment, was .42% of the Fund's average net assets. The performance adjustment included in the management fee rate may be higher or lower than the maximum performance adjustment rate due to the difference between the average net assets for the reporting and performance periods.
Distribution and Service Plan Fees. In accordance with Rule 12b-1 of the 1940 Act, the Fund has adopted separate Distribution and Service Plans for each class of shares. Certain classes pay Fidelity Distributors Corporation (FDC), an affiliate of the investment adviser, separate Distribution and Service Fees, each of which is based on an annual percentage of each class' average net assets. In addition, FDC may pay financial intermediaries for selling shares of the Fund and providing shareholder support services. For the period, the Distribution and Service Fee rates, total fees and amounts retained by FDC were as follows:
| Distribution Fee | Service Fee | Total Fees | Retained by FDC | |
| Class A | -% | .25% | $583,459 | $18,146 |
| Class M | .25% | .25% | 457,930 | – |
| Class C | .75% | .25% | 943,440 | 106,861 |
| $1,984,829 | $125,007 |
Sales Load. FDC may receive a front-end sales charge of up to 5.75% for selling Class A shares and 3.50% for selling Class M shares, some of which is paid to financial intermediaries for selling shares of the Fund. Depending on the holding period, FDC may receive contingent deferred sales charges levied on Class A, Class M, and Class C redemptions. The deferred sales charges are 1.00% for Class C shares, 1.00% for certain purchases of Class A shares and .25% for certain purchases of Class M shares.
For the period, sales charge amounts retained by FDC were as follows:
| Retained by FDC | |
| Class A | $90,023 |
| Class M | 15,547 |
| Class C(a) | 9,596 |
| $115,166 |
(a) When Class C shares are initially sold, FDC pays commissions from its own resources to financial intermediaries through which the sales are made.
Transfer Agent Fees. Fidelity Investments Institutional Operations Company, Inc., (FIIOC), an affiliate of the investment adviser, is the transfer, dividend disbursing and shareholder servicing agent for each class of the Fund. FIIOC receives account fees and asset-based fees that vary according to the account size and type of account of the shareholders of the respective classes of the Fund, except for Class Z. FIIOC receives an asset-based fee of Class Z's average net assets. FIIOC pays for typesetting, printing and mailing of shareholder reports, except proxy statements.
For the period, transfer agent fees for each applicable class were as follows:
| Amount | % of Class-Level Average Net Assets(a) | |
| Class A | $454,160 | .19 |
| Class M | 189,379 | .21 |
| Class C | 193,895 | .21 |
| Class I | 441,794 | .18 |
| Class Z | 726 | .05 |
| $1,279,954 |
(a) Annualized
Accounting and Security Lending Fees. Fidelity Service Company, Inc. (FSC), an affiliate of the investment adviser, maintains the Fund's accounting records. The accounting fee is based on the level of average net assets for each month. Under a separate contract, FSC administers the security lending program. The security lending fee is based on the number and duration of lending transactions.
Brokerage Commissions. The Fund placed a portion of its portfolio transactions with brokerage firms which are affiliates of the investment adviser. Brokerage commissions are included in net realized gain (loss) and change in net unrealized appreciation (depreciation) in the Statement of Operations. The commissions paid to these affiliated firms were $4,922 for the period.
Interfund Trades. The Fund may purchase from or sell securities to other Fidelity Funds under procedures adopted by the Board. The procedures have been designed to ensure these interfund trades are executed in accordance with Rule 17a-7 of the 1940 Act. Interfund trades are included within the respective purchases and sales amounts shown in the Purchases and Sales of Investments note.
6. Committed Line of Credit.
The Fund participates with other funds managed by the investment adviser or an affiliate in a $4.25 billion credit facility (the "line of credit") to be utilized for temporary or emergency purposes to fund shareholder redemptions or for other short-term liquidity purposes. The Fund has agreed to pay commitment fees on its pro-rata portion of the line of credit, which amounted to $2,168 and is reflected in Miscellaneous expenses on the Statement of Operations. During the period, the Fund did not borrow on this line of credit.
7. Security Lending.
The Fund lends portfolio securities through a lending agent from time to time in order to earn additional income. For equity securities, a lending agent is used and may loan securities to certain qualified borrowers, including Fidelity Capital Markets (FCM), a broker-dealer affiliated with the Fund. On the settlement date of the loan, the Fund receives collateral (in the form of U.S. Treasury obligations, letters of credit and/or cash) against the loaned securities and maintains collateral in an amount not less than 100% of the market value of the loaned securities during the period of the loan. The market value of the loaned securities is determined at the close of business of the Fund and any additional required collateral is delivered to the Fund on the next business day. The Fund or borrower may terminate the loan at any time, and if the borrower defaults on its obligation to return the securities loaned because of insolvency or other reasons, the Fund may apply collateral received from the borrower against the obligation. The Fund may experience delays and costs in recovering the securities loaned. Any cash collateral received is invested in the Fidelity Securities Lending Cash Central Fund. The value of loaned securities and cash collateral at period end are disclosed on the Fund's Statement of Assets and Liabilities. Security lending income represents the income earned on investing cash collateral, less rebates paid to borrowers and any lending agent fees associated with the loan, plus any premium payments received for lending certain types of securities. Security lending income is presented in the Statement of Operations as a component of income from Fidelity Central Funds. Total security lending income during the period amounted to $40,708. During the period, there were no securities loaned to FCM.
8. Expense Reductions.
The investment adviser voluntarily agreed to reimburse a portion of the Fund's Class A, Class M, Class C and Class I operating expenses. During the period, this reimbursement reduced expenses as follows:
| Reimbursement | |
| Class A | $5,718 |
| Class M | 2,338 |
| Class C | 2,458 |
| Class I | 6,462 |
| $16,976 |
Commissions paid to certain brokers with whom the investment adviser, or its affiliates, places trades on behalf of the Fund include an amount in addition to trade execution, which may be rebated back to the Fund to offset certain expenses. This amount totaled $12,321 for the period.
In addition, during the period the investment adviser reimbursed and/or waived a portion of fund-level operating expenses in the amount of $5,704.
9. Distributions to Shareholders.
Distributions to shareholders of each class were as follows:
| Six months ended May 31, 2017 | Year ended November 30, 2016 | |
| From net investment income | ||
| Class A | $5,099,262 | $3,826,802 |
| Class M | 1,475,457 | 981,442 |
| Class C | 953,207 | 295,369 |
| Class I | 5,597,369 | 5,048,940 |
| Total | $13,125,295 | $10,152,553 |
| From net realized gain | ||
| Class A | $4,167,959 | $9,966,960 |
| Class M | 1,573,436 | 3,809,662 |
| Class B | – | 110,345 |
| Class C | 1,712,010 | 4,228,922 |
| Class I | 3,782,380 | 10,118,983 |
| Total | $11,235,785 | $28,234,872 |
10. Share Transactions.
Share transactions for each class were as follows and may contain automatic conversions between classes or exchanges between affiliated funds:
| Shares | Shares | Dollars | Dollars | |
| Six months ended May 31, 2017(a) | Year ended November 30, 2016 | Six months ended May 31, 2017(a) | Year ended November 30, 2016 | |
| Class A | ||||
| Shares sold | 2,307,871 | 3,471,102 | $72,152,867 | $92,742,592 |
| Reinvestment of distributions | 289,062 | 506,726 | 8,882,868 | 13,174,015 |
| Shares redeemed | (3,467,334) | (5,617,229) | (109,482,189) | (150,837,777) |
| Net increase (decrease) | (870,401) | (1,639,401) | $(28,446,454) | $(44,921,170) |
| Class M | ||||
| Shares sold | 636,743 | 838,207 | $19,887,822 | $22,424,576 |
| Reinvestment of distributions | 96,793 | 178,870 | 2,971,547 | 4,645,631 |
| Shares redeemed | (658,803) | (1,614,297) | (20,624,808) | (43,435,570) |
| Net increase (decrease) | 74,733 | (597,220) | $2,234,561 | $(16,365,363) |
| Class B | ||||
| Shares sold | – | 1,731 | $– | $41,950 |
| Reinvestment of distributions | – | 4,310 | – | 104,666 |
| Shares redeemed | – | (191,235) | – | (4,624,336) |
| Net increase (decrease) | – | (185,194) | $– | $(4,477,720) |
| Class C | ||||
| Shares sold | 1,313,895 | 967,123 | $37,487,654 | $24,084,991 |
| Reinvestment of distributions | 83,161 | 161,472 | 2,338,494 | 3,852,174 |
| Shares redeemed | (929,672) | (2,063,532) | (26,653,249) | (50,478,565) |
| Net increase (decrease) | 467,384 | (934,937) | $13,172,899 | $(22,541,400) |
| Class I | ||||
| Shares sold | 3,822,337 | 3,784,048 | $125,672,677 | $106,099,731 |
| Reinvestment of distributions | 273,175 | 510,015 | 8,747,051 | 13,796,737 |
| Shares redeemed | (2,446,877) | (7,590,256) | (80,194,809) | (211,847,145) |
| Net increase (decrease) | 1,648,635 | (3,296,193) | $54,224,919 | $(91,950,677) |
| Class Z | ||||
| Shares sold | 342,018 | – | $11,273,351 | $– |
| Shares redeemed | (3,588) | – | (118,155) | – |
| Net increase (decrease) | 338,430 | – | $11,155,196 | $– |
(a) Share transactions for Class Z are for the period February 1, 2017 (commencement of sale of shares) to May 31, 2017
11. Other.
The Fund's organizational documents provide former and current trustees and officers with a limited indemnification against liabilities arising in connection with the performance of their duties to the Fund. In the normal course of business, the Fund may also enter into contracts that provide general indemnifications. The Fund's maximum exposure under these arrangements is unknown as this would be dependent on future claims that may be made against the Fund. The risk of material loss from such claims is considered remote.
Shareholder Expense Example
As a shareholder of the Fund, you incur two types of costs: (1) transaction costs, including sales charges (loads) on purchase payments or redemption proceeds, and (2) ongoing costs, including management fees, distribution and/or service (12b-1) fees and other Fund expenses. This Example is intended to help you understand your ongoing costs (in dollars) of investing in the Fund and to compare these costs with the ongoing costs of investing in other mutual funds.
The actual expense example is based on an investment of $1,000 invested at the beginning of the period and held for the entire period (December 1, 2016 to May 31, 2017) for Class A, Class M, Class C and Class I and for the period (February 1, 2017 to May 31, 2017) for Class Z. The hypothetical expense Example is based on an investment of $1,000 invested for the one-half year period (December 1, 2016 to May 31, 2017).
Actual Expenses
The first line of the accompanying table for each class of the Fund provides information about actual account values and actual expenses. You may use the information in this line, together with the amount you invested, to estimate the expenses that you paid over the period. Simply divide your account value by $1,000.00 (for example, an $8,600 account value divided by $1,000.00 = 8.6), then multiply the result by the number in the first line for a class of the Fund under the heading entitled "Expenses Paid During Period" to estimate the expenses you paid on your account during this period. In addition, the Fund, as a shareholder in the underlying Fidelity Central Funds, will indirectly bear its pro-rata share of the fees and expenses incurred by the underlying Fidelity Central Funds. These fees and expenses are not included in the Fund's annualized expense ratio used to calculate the expense estimate in the table below.
Hypothetical Example for Comparison Purposes
The second line of the accompanying table for each class of the Fund provides information about hypothetical account values and hypothetical expenses based on a Class' actual expense ratio and an assumed rate of return of 5% per year before expenses, which is not the Class' actual return. The hypothetical account values and expenses may not be used to estimate the actual ending account balance or expenses you paid for the period. You may use this information to compare the ongoing costs of investing in the Fund and other funds. To do so, compare this 5% hypothetical example with the 5% hypothetical examples that appear in the shareholder reports of the other funds. In addition, the Fund, as a shareholder in the underlying Fidelity Central Funds, will indirectly bear its pro-rata share of the fees and expenses incurred by the underlying Fidelity Central Funds. These fees and expenses are not included in the Fund's annualized expense ratio used to calculate the expense estimate in the table below.
Please note that the expenses shown in the table are meant to highlight your ongoing costs only and do not reflect any transaction costs. Therefore, the second line of the table is useful in comparing ongoing costs only, and will not help you determine the relative total costs of owning different funds. In addition, if these transactional costs were included, your costs would have been higher.
| Annualized Expense Ratio-A | Beginning Account Value | Ending Account Value May 31, 2017 | Expenses Paid During Period | |
| Class A | .92% | |||
| Actual | $1,000.00 | $1,066.20 | $4.74-B | |
| Hypothetical-C | $1,000.00 | $1,020.34 | $4.63-D | |
| Class M | 1.18% | |||
| Actual | $1,000.00 | $1,064.80 | $6.07-B | |
| Hypothetical-C | $1,000.00 | $1,019.05 | $5.94-D | |
| Class C | 1.68% | |||
| Actual | $1,000.00 | $1,062.60 | $8.64-B | |
| Hypothetical-C | $1,000.00 | $1,016.55 | $8.45-D | |
| Class I | .66% | |||
| Actual | $1,000.00 | $1,067.70 | $3.40-B | |
| Hypothetical-C | $1,000.00 | $1,021.64 | $3.33-D | |
| Class Z | .53% | |||
| Actual | $1,000.00 | $1,030.90 | $1.77-B | |
| Hypothetical-C | $1,000.00 | $1,022.29 | $2.67-D |
A Annualized expense ratio reflects expenses net of applicable fee waivers.
B Actual expenses are equal to each Class' annualized expense ratio, multiplied by the average account value over the period, multiplied by 182/365 (to reflect the one-half year period) for Class A, Class M, Class C and Class I and multiplied by 120/365 (to reflect the period February 1, 2017 to May 31, 2017) for Class Z.
C 5% return per year before expenses
D Hypothetical expenses are equal to each Class' annualized expense ratio, multiplied by the average account value over the period, multiplied by 182/365 (to reflect the one-half year period).
![]()
LC-SANN-0717
1.704742.119
Fidelity Advisor® Stock Selector Mid Cap Fund Semi-Annual Report May 31, 2017 |
|
Contents
To view a fund's proxy voting guidelines and proxy voting record for the 12-month period ended June 30, visit http://www.fidelity.com/proxyvotingresults or visit the Securities and Exchange Commission's (SEC) web site at http://www.sec.gov.
You may also call 1-877-208-0098 to request a free copy of the proxy voting guidelines.
Standard & Poor's, S&P and S&P 500 are registered service marks of The McGraw-Hill Companies, Inc. and have been licensed for use by Fidelity Distributors Corporation.
Other third-party marks appearing herein are the property of their respective owners.
All other marks appearing herein are registered or unregistered trademarks or service marks of FMR LLC or an affiliated company. © 2017 FMR LLC. All rights reserved.
This report and the financial statements contained herein are submitted for the general information of the shareholders of the Fund. This report is not authorized for distribution to prospective investors in the Fund unless preceded or accompanied by an effective prospectus.
A fund files its complete schedule of portfolio holdings with the SEC for the first and third quarters of each fiscal year on Form N-Q. Forms N-Q are available on the SEC’s web site at http://www.sec.gov. A fund's Forms N-Q may be reviewed and copied at the SEC’s Public Reference Room in Washington, DC. Information regarding the operation of the SEC's Public Reference Room may be obtained by calling 1-800-SEC-0330.
For a complete list of a fund's portfolio holdings, view the most recent holdings listing, semiannual report, or annual report on Fidelity's web site at http://www.fidelity.com, http://www.institutional.fidelity.com, or http://www.401k.com, as applicable.
NOT FDIC INSURED •MAY LOSE VALUE •NO BANK GUARANTEE
Neither the Fund nor Fidelity Distributors Corporation is a bank.
Investment Summary (Unaudited)
Top Ten Stocks as of May 31, 2017
| % of fund's net assets | % of fund's net assets 6 months ago | |
| Huntington Bancshares, Inc. | 1.7 | 1.8 |
| Capital One Financial Corp. | 1.6 | 2.0 |
| AECOM | 1.6 | 0.0 |
| Steel Dynamics, Inc. | 1.5 | 1.5 |
| American Airlines Group, Inc. | 1.2 | 0.4 |
| SLM Corp. | 1.2 | 1.3 |
| Jabil Circuit, Inc. | 1.1 | 0.9 |
| NVR, Inc. | 1.1 | 0.8 |
| AMETEK, Inc. | 1.1 | 1.2 |
| Packaging Corp. of America | 1.0 | 0.0 |
| 13.1 |
Top Five Market Sectors as of May 31, 2017
| % of fund's net assets | % of fund's net assets 6 months ago | |
| Information Technology | 17.4 | 17.1 |
| Financials | 15.6 | 16.7 |
| Consumer Discretionary | 12.8 | 12.4 |
| Industrials | 12.5 | 13.6 |
| Real Estate | 9.9 | 10.5 |
Asset Allocation (% of fund's net assets)
| As of May 31, 2017 * | ||
| Stocks and Equity Futures | 96.5% | |
| Short-Term Investments and Net Other Assets (Liabilities) | 3.5% | |

* Foreign investments - 7.4%
| As of November 30, 2016 * | ||
| Stocks and Equity Futures | 98.5% | |
| Short-Term Investments and Net Other Assets (Liabilities) | 1.5% | |

* Foreign investments - 7.9%
Percentages shown as 0.0% may reflect amounts less than 0.05%.
Investments May 31, 2017 (Unaudited)
Showing Percentage of Net Assets
| Common Stocks - 95.3% | |||
| Shares | Value (000s) | ||
| CONSUMER DISCRETIONARY - 12.8% | |||
| Auto Components - 0.5% | |||
| Gentex Corp. | 585,000 | $11,103 | |
| Distributors - 0.4% | |||
| LKQ Corp. (a) | 301,900 | 9,507 | |
| Diversified Consumer Services - 1.2% | |||
| Grand Canyon Education, Inc. (a) | 115,300 | 9,040 | |
| ServiceMaster Global Holdings, Inc. (a) | 463,656 | 17,526 | |
| 26,566 | |||
| Hotels, Restaurants & Leisure - 1.6% | |||
| ARAMARK Holdings Corp. | 262,900 | 9,796 | |
| Brinker International, Inc. (b) | 168,500 | 6,610 | |
| DineEquity, Inc. | 84,800 | 3,880 | |
| Hilton, Inc. | 164,000 | 10,901 | |
| U.S. Foods Holding Corp. | 187,500 | 5,618 | |
| 36,805 | |||
| Household Durables - 1.1% | |||
| NVR, Inc. (a) | 10,900 | 24,878 | |
| Internet & Direct Marketing Retail - 0.3% | |||
| Liberty Interactive Corp. (Venture Group) Series A (a) | 123,040 | 6,631 | |
| Media - 3.5% | |||
| Cinemark Holdings, Inc. | 388,500 | 15,373 | |
| Discovery Communications, Inc. Class A (a) | 151,000 | 4,002 | |
| Interpublic Group of Companies, Inc. | 388,600 | 9,688 | |
| Liberty Broadband Corp. Class A (a) | 124,800 | 11,014 | |
| Liberty Media Corp. Liberty Media Class A (a)(b) | 259,700 | 8,284 | |
| Lions Gate Entertainment Corp. Class B (a) | 240,610 | 6,085 | |
| Omnicom Group, Inc. | 133,300 | 11,160 | |
| Scripps Networks Interactive, Inc. Class A | 121,300 | 8,032 | |
| The Madison Square Garden Co. (a) | 21,000 | 4,104 | |
| 77,742 | |||
| Multiline Retail - 1.3% | |||
| Dollar General Corp. | 217,000 | 15,926 | |
| Dollar Tree, Inc. (a) | 168,200 | 13,069 | |
| 28,995 | |||
| Specialty Retail - 2.0% | |||
| AutoZone, Inc. (a) | 21,600 | 13,088 | |
| Foot Locker, Inc. | 118,200 | 7,022 | |
| GameStop Corp. Class A | 98,617 | 2,183 | |
| L Brands, Inc. | 75,000 | 3,870 | |
| Ross Stores, Inc. | 275,200 | 17,591 | |
| 43,754 | |||
| Textiles, Apparel & Luxury Goods - 0.9% | |||
| PVH Corp. | 99,800 | 10,574 | |
| VF Corp. | 183,900 | 9,894 | |
| 20,468 | |||
| TOTAL CONSUMER DISCRETIONARY | 286,449 | ||
| CONSUMER STAPLES - 3.6% | |||
| Beverages - 1.1% | |||
| Coca-Cola European Partners PLC | 201,400 | 8,265 | |
| Dr. Pepper Snapple Group, Inc. | 58,600 | 5,439 | |
| Molson Coors Brewing Co. Class B | 121,600 | 11,526 | |
| 25,230 | |||
| Food Products - 1.5% | |||
| Hostess Brands, Inc. Class A (a) | 671,010 | 10,562 | |
| Lamb Weston Holdings, Inc. | 218,300 | 10,131 | |
| Mead Johnson Nutrition Co. Class A | 17,000 | 1,520 | |
| Pinnacle Foods, Inc. | 92,200 | 5,745 | |
| The J.M. Smucker Co. | 37,800 | 4,833 | |
| 32,791 | |||
| Household Products - 0.8% | |||
| Church & Dwight Co., Inc. | 126,600 | 6,540 | |
| Energizer Holdings, Inc. | 167,800 | 8,994 | |
| Spectrum Brands Holdings, Inc. | 26,300 | 3,536 | |
| 19,070 | |||
| Personal Products - 0.2% | |||
| Coty, Inc. Class A | 236,200 | 4,474 | |
| TOTAL CONSUMER STAPLES | 81,565 | ||
| ENERGY - 3.0% | |||
| Energy Equipment & Services - 1.0% | |||
| Dril-Quip, Inc. (a) | 135,400 | 6,716 | |
| Nabors Industries Ltd. | 805,300 | 7,087 | |
| Oil States International, Inc. (a) | 247,000 | 7,225 | |
| 21,028 | |||
| Oil, Gas & Consumable Fuels - 2.0% | |||
| Cimarex Energy Co. | 54,800 | 5,894 | |
| Energen Corp. (a) | 226,200 | 12,902 | |
| HollyFrontier Corp. | 394,500 | 9,429 | |
| PDC Energy, Inc. (a) | 83,100 | 4,127 | |
| Whiting Petroleum Corp. (a) | 517,600 | 3,654 | |
| WPX Energy, Inc. (a) | 895,000 | 9,684 | |
| 45,690 | |||
| TOTAL ENERGY | 66,718 | ||
| FINANCIALS - 15.6% | |||
| Banks - 4.2% | |||
| CIT Group, Inc. | 253,936 | 11,440 | |
| Huntington Bancshares, Inc. | 3,014,106 | 37,796 | |
| Signature Bank (a) | 46,500 | 6,650 | |
| SVB Financial Group (a) | 114,700 | 19,556 | |
| Synovus Financial Corp. | 390,427 | 15,961 | |
| The Jammu & Kashmir Bank Ltd. | 2,435,385 | 3,084 | |
| 94,487 | |||
| Capital Markets - 3.2% | |||
| CBOE Holdings, Inc. | 256,000 | 22,111 | |
| E*TRADE Financial Corp. (a) | 333,900 | 11,556 | |
| Legg Mason, Inc. | 237,800 | 8,768 | |
| MSCI, Inc. | 167,000 | 16,989 | |
| Virtu Financial, Inc. Class A (b) | 744,000 | 12,127 | |
| 71,551 | |||
| Consumer Finance - 3.5% | |||
| Capital One Financial Corp. | 472,600 | 36,352 | |
| OneMain Holdings, Inc. (a) | 713,980 | 16,107 | |
| SLM Corp. (a) | 2,433,016 | 25,279 | |
| 77,738 | |||
| Diversified Financial Services - 1.5% | |||
| Bioverativ, Inc. | 310,000 | 17,078 | |
| On Deck Capital, Inc. (a)(b) | 1,189,658 | 4,211 | |
| Valvoline, Inc. | 497,729 | 11,134 | |
| 32,423 | |||
| Insurance - 2.1% | |||
| Arthur J. Gallagher & Co. | 395,800 | 22,454 | |
| Direct Line Insurance Group PLC | 2,311,558 | 10,382 | |
| Employers Holdings, Inc. | 117,906 | 4,722 | |
| FNF Group | 239,700 | 10,214 | |
| 47,772 | |||
| Mortgage Real Estate Investment Trusts - 0.5% | |||
| Redwood Trust, Inc. | 675,500 | 11,429 | |
| Thrifts & Mortgage Finance - 0.6% | |||
| Essent Group Ltd. (a) | 181,300 | 6,576 | |
| LIC Housing Finance Ltd. | 680,966 | 7,749 | |
| 14,325 | |||
| TOTAL FINANCIALS | 349,725 | ||
| HEALTH CARE - 7.5% | |||
| Biotechnology - 0.6% | |||
| Puma Biotechnology, Inc. (a) | 55,000 | 4,208 | |
| Vertex Pharmaceuticals, Inc. (a) | 77,000 | 9,517 | |
| 13,725 | |||
| Health Care Equipment & Supplies - 2.5% | |||
| Boston Scientific Corp. (a) | 440,000 | 11,893 | |
| DexCom, Inc. (a) | 125,000 | 8,355 | |
| Insulet Corp. (a) | 188,000 | 7,890 | |
| NxStage Medical, Inc. (a) | 380,000 | 8,231 | |
| The Spectranetics Corp. (a) | 330,000 | 8,910 | |
| Wright Medical Group NV (a) | 420,000 | 11,222 | |
| 56,501 | |||
| Health Care Providers & Services - 1.8% | |||
| American Renal Associates Holdings, Inc. (a) | 510,000 | 8,262 | |
| Envision Healthcare Corp. (a) | 95,000 | 5,188 | |
| MEDNAX, Inc. (a) | 28,000 | 1,520 | |
| Premier, Inc. (a) | 248,100 | 8,564 | |
| Teladoc, Inc. (a) | 400,000 | 12,240 | |
| Tenet Healthcare Corp. (a)(b) | 280,000 | 4,631 | |
| 40,405 | |||
| Health Care Technology - 0.4% | |||
| Evolent Health, Inc. (a) | 344,000 | 7,895 | |
| Life Sciences Tools & Services - 1.0% | |||
| Agilent Technologies, Inc. | 124,000 | 7,482 | |
| Bio-Rad Laboratories, Inc. Class A (a) | 69,000 | 15,420 | |
| 22,902 | |||
| Pharmaceuticals - 1.2% | |||
| Catalent, Inc. (a) | 484,000 | 17,197 | |
| Jazz Pharmaceuticals PLC (a) | 70,000 | 10,189 | |
| 27,386 | |||
| TOTAL HEALTH CARE | 168,814 | ||
| INDUSTRIALS - 12.5% | |||
| Aerospace & Defense - 1.5% | |||
| Aerojet Rocketdyne Holdings, Inc. (a) | 1,039,436 | 22,764 | |
| Axon Enterprise, Inc. (a)(b) | 463,000 | 11,117 | |
| 33,881 | |||
| Airlines - 1.7% | |||
| American Airlines Group, Inc. | 563,800 | 27,294 | |
| JetBlue Airways Corp. (a) | 493,000 | 11,053 | |
| 38,347 | |||
| Building Products - 0.8% | |||
| Allegion PLC | 223,510 | 17,575 | |
| Commercial Services & Supplies - 0.5% | |||
| Aggreko PLC | 895,000 | 9,969 | |
| Construction & Engineering - 2.1% | |||
| AECOM (a) | 1,085,537 | 34,857 | |
| KBR, Inc. | 903,626 | 12,316 | |
| 47,173 | |||
| Electrical Equipment - 2.5% | |||
| AMETEK, Inc. | 404,272 | 24,669 | |
| Fortive Corp. | 274,100 | 17,118 | |
| Sensata Technologies Holding BV (a) | 375,400 | 15,177 | |
| 56,964 | |||
| Machinery - 1.3% | |||
| Allison Transmission Holdings, Inc. | 250,963 | 9,717 | |
| IDEX Corp. | 82,658 | 8,966 | |
| WABCO Holdings, Inc. (a) | 88,000 | 10,720 | |
| 29,403 | |||
| Road & Rail - 0.8% | |||
| CSX Corp. | 183,700 | 9,951 | |
| Norfolk Southern Corp. | 69,400 | 8,608 | |
| 18,559 | |||
| Trading Companies & Distributors - 1.3% | |||
| MRC Global, Inc. (a) | 1,195,085 | 21,571 | |
| Nexeo Solutions, Inc. (a) | 920,700 | 8,102 | |
| 29,673 | |||
| TOTAL INDUSTRIALS | 281,544 | ||
| INFORMATION TECHNOLOGY - 17.4% | |||
| Communications Equipment - 0.5% | |||
| CommScope Holding Co., Inc. (a) | 310,100 | 11,471 | |
| F5 Networks, Inc. (a) | 30 | 4 | |
| 11,475 | |||
| Electronic Equipment & Components - 2.6% | |||
| Arrow Electronics, Inc. (a) | 153,100 | 11,573 | |
| IPG Photonics Corp. (a) | 48,600 | 6,757 | |
| Jabil Circuit, Inc. | 832,600 | 24,911 | |
| Keysight Technologies, Inc. (a) | 23,500 | 908 | |
| Largan Precision Co. Ltd. | 82,000 | 12,922 | |
| 57,071 | |||
| Internet Software & Services - 0.9% | |||
| Stamps.com, Inc. (a) | 144,700 | 19,954 | |
| Velti PLC (a)(c) | 215,084 | 1 | |
| 19,955 | |||
| IT Services - 5.4% | |||
| Capgemini SA | 134,800 | 13,956 | |
| Cognizant Technology Solutions Corp. Class A | 201,200 | 13,462 | |
| DXC Technology Co. | 83,100 | 6,442 | |
| EPAM Systems, Inc. (a) | 179,200 | 15,031 | |
| FleetCor Technologies, Inc. (a) | 63,400 | 9,148 | |
| Global Payments, Inc. | 146,900 | 13,458 | |
| Jack Henry & Associates, Inc. | 102,000 | 10,833 | |
| Leidos Holdings, Inc. | 339,300 | 18,852 | |
| Maximus, Inc. | 151,100 | 9,380 | |
| Reply SpA | 54,636 | 10,802 | |
| 121,364 | |||
| Semiconductors & Semiconductor Equipment - 4.0% | |||
| Cirrus Logic, Inc. (a) | 25,700 | 1,695 | |
| Dialog Semiconductor PLC (a) | 290,300 | 13,858 | |
| Integrated Device Technology, Inc. (a) | 255,800 | 6,543 | |
| KLA-Tencor Corp. | 137,000 | 14,248 | |
| Lam Research Corp. | 90,900 | 14,105 | |
| Maxim Integrated Products, Inc. | 94,100 | 4,498 | |
| ON Semiconductor Corp. (a) | 650,400 | 10,068 | |
| Qorvo, Inc. (a) | 181,900 | 14,179 | |
| Skyworks Solutions, Inc. | 94,600 | 10,068 | |
| 89,262 | |||
| Software - 4.0% | |||
| ANSYS, Inc. (a) | 64,200 | 8,110 | |
| CDK Global, Inc. | 350,600 | 21,548 | |
| Fair Isaac Corp. | 43,800 | 5,811 | |
| Parametric Technology Corp. (a) | 371,400 | 21,385 | |
| Tableau Software, Inc. (a) | 206,700 | 12,817 | |
| Ultimate Software Group, Inc. (a) | 93,000 | 20,529 | |
| 90,200 | |||
| TOTAL INFORMATION TECHNOLOGY | 389,327 | ||
| MATERIALS - 7.5% | |||
| Chemicals - 4.0% | |||
| Ashland Global Holdings, Inc. | 181,300 | 12,064 | |
| Axalta Coating Systems (a) | 372,500 | 11,659 | |
| Olin Corp. | 588,300 | 17,261 | |
| PPG Industries, Inc. | 75,800 | 8,062 | |
| RPM International, Inc. | 326,000 | 17,679 | |
| The Chemours Co. LLC | 352,900 | 14,112 | |
| W.R. Grace & Co. | 140,897 | 10,101 | |
| 90,938 | |||
| Containers & Packaging - 2.0% | |||
| Greif, Inc. Class A | 81,900 | 4,869 | |
| Packaging Corp. of America | 231,900 | 23,691 | |
| Sealed Air Corp. | 185,400 | 8,235 | |
| Silgan Holdings, Inc. | 257,400 | 8,188 | |
| 44,983 | |||
| Metals & Mining - 1.5% | |||
| Steel Dynamics, Inc. | 967,400 | 32,882 | |
| TOTAL MATERIALS | 168,803 | ||
| REAL ESTATE - 9.9% | |||
| Equity Real Estate Investment Trusts (REITs) - 9.1% | |||
| Altisource Residential Corp. Class B | 671,221 | 9,223 | |
| CareTrust (REIT), Inc. | 761,700 | 13,901 | |
| Communications Sales & Leasing, Inc. | 289,200 | 7,233 | |
| CoreSite Realty Corp. | 60,200 | 6,338 | |
| Corporate Office Properties Trust (SBI) | 591,200 | 19,941 | |
| Corrections Corp. of America | 371,096 | 10,669 | |
| DCT Industrial Trust, Inc. | 249,390 | 13,145 | |
| Duke Realty Corp. | 709,000 | 20,327 | |
| Equity Lifestyle Properties, Inc. | 152,000 | 12,829 | |
| Extra Space Storage, Inc. | 73,200 | 5,671 | |
| Healthcare Realty Trust, Inc. | 590,300 | 19,633 | |
| Hudson Pacific Properties, Inc. | 527,100 | 17,268 | |
| InfraReit, Inc. | 129,223 | 2,493 | |
| Outfront Media, Inc. | 324,000 | 7,403 | |
| Potlatch Corp. | 140,700 | 6,437 | |
| SBA Communications Corp. Class A (a) | 21,870 | 3,022 | |
| Taubman Centers, Inc. | 144,200 | 8,818 | |
| Urban Edge Properties | 275,068 | 6,558 | |
| VEREIT, Inc. | 1,553,700 | 12,849 | |
| 203,758 | |||
| Real Estate Management & Development - 0.8% | |||
| CBRE Group, Inc. (a) | 207,250 | 7,229 | |
| Invitation Homes, Inc. | 487,500 | 10,491 | |
| 17,720 | |||
| TOTAL REAL ESTATE | 221,478 | ||
| TELECOMMUNICATION SERVICES - 0.1% | |||
| Wireless Telecommunication Services - 0.1% | |||
| T-Mobile U.S., Inc. (a) | 50,150 | 3,381 | |
| UTILITIES - 5.4% | |||
| Electric Utilities - 2.3% | |||
| Great Plains Energy, Inc. | 698,800 | 20,077 | |
| OGE Energy Corp. | 554,526 | 19,758 | |
| PNM Resources, Inc. | 202,200 | 7,785 | |
| Westar Energy, Inc. | 81,500 | 4,315 | |
| 51,935 | |||
| Gas Utilities - 1.5% | |||
| Atmos Energy Corp. | 217,040 | 18,082 | |
| National Fuel Gas Co. (b) | 194,111 | 11,018 | |
| South Jersey Industries, Inc. | 153,700 | 5,596 | |
| 34,696 | |||
| Multi-Utilities - 1.6% | |||
| Avangrid, Inc. | 275,800 | 12,530 | |
| Black Hills Corp. | 243,705 | 16,947 | |
| MDU Resources Group, Inc. | 195,705 | 5,329 | |
| 34,806 | |||
| TOTAL UTILITIES | 121,437 | ||
| TOTAL COMMON STOCKS | |||
| (Cost $1,885,283) | 2,139,241 | ||
| Principal Amount (000s) | Value (000s) | ||
| U.S. Treasury Obligations - 0.1% | |||
| U.S. Treasury Bills, yield at date of purchase 0.79% to 0.8% 7/6/17 to 7/20/17 (d) | |||
| (Cost $1,808) | 1,810 | 1,808 | |
| Shares | Value (000s) | ||
| Money Market Funds - 6.0% | |||
| Fidelity Cash Central Fund, 0.86% (e) | 104,637,527 | $104,658 | |
| Fidelity Securities Lending Cash Central Fund 0.87% (e)(f) | 29,928,248 | 29,931 | |
| TOTAL MONEY MARKET FUNDS | |||
| (Cost $134,587) | 134,589 | ||
| TOTAL INVESTMENT PORTFOLIO - 101.4% | |||
| (Cost $2,021,678) | 2,275,638 | ||
| NET OTHER ASSETS (LIABILITIES) - (1.4)% | (32,173) | ||
| NET ASSETS - 100% | $2,243,465 |
| Futures Contracts | |||
| Expiration Date | Underlying Face Amount at Value (000s) | Unrealized Appreciation/(Depreciation) (000s) | |
| Purchased | |||
| Equity Index Contracts | |||
| 163 CME E-mini S&P MidCap 400 Index Contracts (United States) | June 2017 | 28,036 | $135 |
The face value of futures purchased as a percentage of Net Assets is 1.2%
Legend
(a) Non-income producing
(b) Security or a portion of the security is on loan at period end.
(c) Restricted securities - Investment in securities not registered under the Securities Act of 1933 (excluding 144A issues). At the end of the period, the value of restricted securities (excluding 144A issues) amounted to $1,000 or 0.0% of net assets.
(d) Security or a portion of the security was pledged to cover margin requirements for futures contracts. At period end, the value of securities pledged amounted to $1,159,000.
(e) Affiliated fund that is generally available only to investment companies and other accounts managed by Fidelity Investments. The rate quoted is the annualized seven-day yield of the fund at period end. A complete unaudited listing of the fund's holdings as of its most recent quarter end is available upon request. In addition, each Fidelity Central Fund's financial statements are available on the SEC's website or upon request.
(f) Investment made with cash collateral received from securities on loan.
Additional information on each restricted holding is as follows:
| Security | Acquisition Date | Acquisition Cost (000s) |
| Velti PLC | 4/19/13 | $323 |
Affiliated Central Funds
Information regarding fiscal year to date income earned by the Fund from investments in Fidelity Central Funds is as follows:
| Fund | Income earned |
| (Amounts in thousands) | |
| Fidelity Cash Central Fund | $254 |
| Fidelity Securities Lending Cash Central Fund | 61 |
| Total | $315 |
Investment Valuation
The following is a summary of the inputs used, as of May 31, 2017, involving the Fund's assets and liabilities carried at fair value. The inputs or methodology used for valuing securities may not be an indication of the risk associated with investing in those securities. For more information on valuation inputs, and their aggregation into the levels used below, please refer to the Investment Valuation section in the accompanying Notes to Financial Statements.
| Valuation Inputs at Reporting Date: | ||||
| Description | Total | Level 1 | Level 2 | Level 3 |
| (Amounts in thousands) | ||||
| Investments in Securities: | ||||
| Equities: | ||||
| Consumer Discretionary | $286,449 | $286,449 | $-- | $-- |
| Consumer Staples | 81,565 | 81,565 | -- | -- |
| Energy | 66,718 | 66,718 | -- | -- |
| Financials | 349,725 | 349,725 | -- | -- |
| Health Care | 168,814 | 168,814 | -- | -- |
| Industrials | 281,544 | 281,544 | -- | -- |
| Information Technology | 389,327 | 389,327 | -- | -- |
| Materials | 168,803 | 168,803 | -- | -- |
| Real Estate | 221,478 | 221,478 | -- | -- |
| Telecommunication Services | 3,381 | 3,381 | -- | -- |
| Utilities | 121,437 | 121,437 | -- | -- |
| U.S. Government and Government Agency Obligations | 1,808 | -- | 1,808 | -- |
| Money Market Funds | 134,589 | 134,589 | -- | -- |
| Total Investments in Securities: | $2,275,638 | $2,273,830 | $1,808 | $-- |
| Derivative Instruments: | ||||
| Assets | ||||
| Futures Contracts | $135 | $135 | $-- | $-- |
| Total Assets | $135 | $135 | $-- | $-- |
| Total Derivative Instruments: | $135 | $135 | $-- | $-- |
Value of Derivative Instruments
The following table is a summary of the Fund's value of derivative instruments by primary risk exposure as of May 31, 2017. For additional information on derivative instruments, please refer to the Derivative Instruments section in the accompanying Notes to Financial Statements.
| Primary Risk Exposure / Derivative Type | Value | |
| Asset | Liability | |
| (Amounts in thousands) | ||
| Equity Risk | ||
| Futures Contracts(a) | $135 | $0 |
| Total Equity Risk | 135 | 0 |
| Total Value of Derivatives | $135 | $0 |
(a) Reflects gross cumulative appreciation (depreciation) on futures contracts as presented in the Schedule of Investments. In the Statement of Assets and Liabilities, the period end daily variation margin is included in receivable or payable for daily variation margin for derivative instruments, and the net cumulative appreciation (depreciation) is included in net unrealized appreciation (depreciation).
See accompanying notes which are an integral part of the financial statements.
Financial Statements
Statement of Assets and Liabilities
| Amounts in thousands (except per-share amounts) | May 31, 2017 (Unaudited) | |
| Assets | ||
| Investment in securities, at value (including securities loaned of $28,903) — See accompanying schedule: Unaffiliated issuers (cost $1,887,091) | $2,141,049 | |
| Fidelity Central Funds (cost $134,587) | 134,589 | |
| Total Investments (cost $2,021,678) | $2,275,638 | |
| Foreign currency held at value (cost $19) | 19 | |
| Receivable for investments sold | 27,009 | |
| Receivable for fund shares sold | 1,160 | |
| Dividends receivable | 2,047 | |
| Interest receivable | 6 | |
| Distributions receivable from Fidelity Central Funds | 84 | |
| Prepaid expenses | 1 | |
| Other receivables | 30 | |
| Total assets | 2,305,994 | |
| Liabilities | ||
| Payable to custodian bank | $2,066 | |
| Payable for investments purchased | 25,174 | |
| Payable for fund shares redeemed | 3,669 | |
| Accrued management fee | 726 | |
| Distribution and service plan fees payable | 478 | |
| Payable for daily variation margin for derivative instruments | 7 | |
| Other affiliated payables | 436 | |
| Other payables and accrued expenses | 43 | |
| Collateral on securities loaned | 29,930 | |
| Total liabilities | 62,529 | |
| Net Assets | $2,243,465 | |
| Net Assets consist of: | ||
| Paid in capital | $1,976,571 | |
| Undistributed net investment income | 1,828 | |
| Accumulated undistributed net realized gain (loss) on investments and foreign currency transactions | 10,979 | |
| Net unrealized appreciation (depreciation) on investments and assets and liabilities in foreign currencies | 254,087 | |
| Net Assets | $2,243,465 | |
| Calculation of Maximum Offering Price | ||
| Class A: | ||
| Net Asset Value and redemption price per share ($553,946 ÷ 15,340.49 shares) | $36.11 | |
| Maximum offering price per share (100/94.25 of $36.11) | $38.31 | |
| Class M: | ||
| Net Asset Value and redemption price per share ($582,304 ÷ 16,046.58 shares) | $36.29 | |
| Maximum offering price per share (100/96.50 of $36.29) | $37.61 | |
| Class C: | ||
| Net Asset Value and offering price per share ($140,951 ÷ 4,262.70 shares)(a) | $33.07 | |
| Fidelity Stock Selector Mid Cap Fund: | ||
| Net Asset Value, offering price and redemption price per share ($363,581 ÷ 9,664.11 shares) | $37.62 | |
| Class I: | ||
| Net Asset Value, offering price and redemption price per share ($602,372 ÷ 15,987.49 shares) | $37.68 | |
| Class Z: | ||
| Net Asset Value, offering price and redemption price per share ($311 ÷ 8.25 shares) | $37.70 |
(a) Redemption price per share is equal to net asset value less any applicable contingent deferred sales charge.
See accompanying notes which are an integral part of the financial statements.
Statement of Operations
| Amounts in thousands | Six months ended May 31, 2017 (Unaudited) | |
| Investment Income | ||
| Dividends | $12,580 | |
| Interest | 9 | |
| Income from Fidelity Central Funds | 315 | |
| Total income | 12,904 | |
| Expenses | ||
| Management fee | ||
| Basic fee | $5,821 | |
| Performance adjustment | (2,096) | |
| Transfer agent fees | 2,144 | |
| Distribution and service plan fees | 2,903 | |
| Accounting and security lending fees | 324 | |
| Custodian fees and expenses | 44 | |
| Independent trustees' fees and expenses | 4 | |
| Registration fees | 99 | |
| Audit | 32 | |
| Legal | 7 | |
| Miscellaneous | 10 | |
| Total expenses before reductions | 9,292 | |
| Expense reductions | (146) | 9,146 |
| Net investment income (loss) | 3,758 | |
| Realized and Unrealized Gain (Loss) | ||
| Net realized gain (loss) on: | ||
| Investment securities: | ||
| Unaffiliated issuers | 101,501 | |
| Fidelity Central Funds | 2 | |
| Foreign currency transactions | 10 | |
| Futures contracts | 758 | |
| Total net realized gain (loss) | 102,271 | |
| Change in net unrealized appreciation (depreciation) on: Investment securities | 87,053 | |
| Assets and liabilities in foreign currencies | 5 | |
| Futures contracts | 55 | |
| Total change in net unrealized appreciation (depreciation) | 87,113 | |
| Net gain (loss) | 189,384 | |
| Net increase (decrease) in net assets resulting from operations | $193,142 |
See accompanying notes which are an integral part of the financial statements.
Statement of Changes in Net Assets
| Amounts in thousands | Six months ended May 31, 2017 (Unaudited) | Year ended November 30, 2016 |
| Increase (Decrease) in Net Assets | ||
| Operations | ||
| Net investment income (loss) | $3,758 | $12,537 |
| Net realized gain (loss) | 102,271 | (88,889) |
| Change in net unrealized appreciation (depreciation) | 87,113 | 160,670 |
| Net increase (decrease) in net assets resulting from operations | 193,142 | 84,318 |
| Distributions to shareholders from net investment income | (10,708) | (3,959) |
| Distributions to shareholders from net realized gain | (333) | (39,216) |
| Total distributions | (11,041) | (43,175) |
| Share transactions - net increase (decrease) | 38,422 | (421,318) |
| Total increase (decrease) in net assets | 220,523 | (380,175) |
| Net Assets | ||
| Beginning of period | 2,022,942 | 2,403,117 |
| End of period | $2,243,465 | $2,022,942 |
| Other Information | ||
| Undistributed net investment income end of period | $1,828 | $8,778 |
See accompanying notes which are an integral part of the financial statements.
Financial Highlights — Fidelity Advisor Stock Selector Mid Cap Fund Class A
| Six months ended (Unaudited) May 31, | Years ended November 30, | |||||
| 2017 | 2016 | 2015 | 2014 | 2013 | 2012 | |
| Selected Per–Share Data | ||||||
| Net asset value, beginning of period | $33.13 | $32.01 | $31.80 | $28.37 | $22.16 | $19.15 |
| Income from Investment Operations | ||||||
| Net investment income (loss)A | .07 | .20 | .08 | .08 | .10 | .09 |
| Net realized and unrealized gain (loss) | 3.11 | 1.49 | .13 | 3.36 | 6.29 | 3.02 |
| Total from investment operations | 3.18 | 1.69 | .21 | 3.44 | 6.39 | 3.11 |
| Distributions from net investment income | (.19) | (.04) | – | (.01) | (.14) | (.10) |
| Distributions from net realized gain | (.01) | (.53) | – | – | (.04) | – |
| Total distributions | (.20) | (.57) | – | (.01) | (.18) | (.10) |
| Net asset value, end of period | $36.11 | $33.13 | $32.01 | $31.80 | $28.37 | $22.16 |
| Total ReturnB,C,D | 9.62% | 5.49% | .66% | 12.11% | 29.07% | 16.32% |
| Ratios to Average Net AssetsE,F | ||||||
| Expenses before reductions | .85%G | .88% | .98% | 1.05% | .95% | .94% |
| Expenses net of fee waivers, if any | .84%G | .88% | .98% | 1.05% | .95% | .94% |
| Expenses net of all reductions | .83%G | .88% | .97% | 1.05% | .92% | .94% |
| Net investment income (loss) | .38%G | .64% | .24% | .26% | .39% | .41% |
| Supplemental Data | ||||||
| Net assets, end of period (in millions) | $554 | $546 | $593 | $652 | $692 | $593 |
| Portfolio turnover rateH | 93%G | 98% | 109% | 89% | 79%I | 72% |
A Calculated based on average shares outstanding during the period.
B Total returns for periods of less than one year are not annualized.
C Total returns would have been lower if certain expenses had not been reduced during the applicable periods shown.
D Total returns do not include the effect of the sales charges.
E Fees and expenses of any underlying Fidelity Central Funds are not included in the Fund's expense ratio. The Fund indirectly bears its proportionate share of the expenses of any underlying Fidelity Central Funds.
F Expense ratios reflect operating expenses of the class. Expenses before reductions do not reflect amounts reimbursed by the investment adviser or reductions from brokerage service arrangements or reductions from other expense offset arrangements and do not represent the amount paid by the class during periods when reimbursements or reductions occur. Expenses net of fee waivers reflect expenses after reimbursement by the investment adviser but prior to reductions from brokerage service arrangements or other expense offset arrangements. Expenses net of all reductions represent the net expenses paid by the class.
G Annualized
H Amount does not include the portfolio activity of any underlying Fidelity Central Funds.
I The portfolio turnover rate does not include the assets acquired in the merger.
See accompanying notes which are an integral part of the financial statements.
Financial Highlights — Fidelity Advisor Stock Selector Mid Cap Fund Class M
| Six months ended (Unaudited) May 31, | Years ended November 30, | |||||
| 2017 | 2016 | 2015 | 2014 | 2013 | 2012 | |
| Selected Per–Share Data | ||||||
| Net asset value, beginning of period | $33.25 | $32.16 | $32.02 | $28.63 | $22.36 | $19.30 |
| Income from Investment Operations | ||||||
| Net investment income (loss)A | .02 | .13 | – | .01 | .04 | .05 |
| Net realized and unrealized gain (loss) | 3.13 | 1.49 | .14 | 3.38 | 6.36 | 3.05 |
| Total from investment operations | 3.15 | 1.62 | .14 | 3.39 | 6.40 | 3.10 |
| Distributions from net investment income | (.11) | – | – | – | (.09) | (.04) |
| Distributions from net realized gain | (.01) | (.53) | – | – | (.04) | – |
| Total distributions | (.11)B | (.53) | – | – | (.13) | (.04) |
| Net asset value, end of period | $36.29 | $33.25 | $32.16 | $32.02 | $28.63 | $22.36 |
| Total ReturnC,D,E | 9.50% | 5.22% | .44% | 11.84% | 28.80% | 16.12% |
| Ratios to Average Net AssetsF,G | ||||||
| Expenses before reductions | 1.09%H | 1.12% | 1.22% | 1.28% | 1.16% | 1.14% |
| Expenses net of fee waivers, if any | 1.08%H | 1.12% | 1.21% | 1.28% | 1.16% | 1.14% |
| Expenses net of all reductions | 1.07%H | 1.11% | 1.21% | 1.27% | 1.13% | 1.13% |
| Net investment income (loss) | .14%H | .41% | .01% | .03% | .17% | .22% |
| Supplemental Data | ||||||
| Net assets, end of period (in millions) | $582 | $591 | $681 | $794 | $817 | $755 |
| Portfolio turnover rateI | 93%H | 98% | 109% | 89% | 79%J | 72% |
A Calculated based on average shares outstanding during the period.
B Total distributions of $.11 per share is comprised of distributions from net investment income of $.106 and distributions from net realized gain of $.006 per share.
C Total returns for periods of less than one year are not annualized.
D Total returns would have been lower if certain expenses had not been reduced during the applicable periods shown.
E Total returns do not include the effect of the sales charges.
F Fees and expenses of any underlying Fidelity Central Funds are not included in the Fund's expense ratio. The Fund indirectly bears its proportionate share of the expenses of any underlying Fidelity Central Funds.
G Expense ratios reflect operating expenses of the class. Expenses before reductions do not reflect amounts reimbursed by the investment adviser or reductions from brokerage service arrangements or reductions from other expense offset arrangements and do not represent the amount paid by the class during periods when reimbursements or reductions occur. Expenses net of fee waivers reflect expenses after reimbursement by the investment adviser but prior to reductions from brokerage service arrangements or other expense offset arrangements. Expenses net of all reductions represent the net expenses paid by the class.
H Annualized
I Amount does not include the portfolio activity of any underlying Fidelity Central Funds.
J The portfolio turnover rate does not include the assets acquired in the merger.
See accompanying notes which are an integral part of the financial statements.
Financial Highlights — Fidelity Advisor Stock Selector Mid Cap Fund Class C
| Six months ended (Unaudited) May 31, | Years ended November 30, | |||||
| 2017 | 2016 | 2015 | 2014 | 2013 | 2012 | |
| Selected Per–Share Data | ||||||
| Net asset value, beginning of period | $30.28 | $29.48 | $29.51 | $26.52 | $20.73 | $17.95 |
| Income from Investment Operations | ||||||
| Net investment income (loss)A | (.06) | (.03) | (.15) | (.14) | (.09) | (.06) |
| Net realized and unrealized gain (loss) | 2.85 | 1.36 | .12 | 3.13 | 5.91 | 2.84 |
| Total from investment operations | 2.79 | 1.33 | (.03) | 2.99 | 5.82 | 2.78 |
| Distributions from net investment income | – | – | – | – | (.02) | – |
| Distributions from net realized gain | – | (.53) | – | – | (.01) | – |
| Total distributions | – | (.53) | – | – | (.03) | – |
| Net asset value, end of period | $33.07 | $30.28 | $29.48 | $29.51 | $26.52 | $20.73 |
| Total ReturnB,C,D | 9.21% | 4.71% | (.10)% | 11.27% | 28.09% | 15.49% |
| Ratios to Average Net AssetsE,F | ||||||
| Expenses before reductions | 1.60%G | 1.63% | 1.74% | 1.80% | 1.69% | 1.68% |
| Expenses net of fee waivers, if any | 1.60%G | 1.63% | 1.73% | 1.80% | 1.69% | 1.68% |
| Expenses net of all reductions | 1.59%G | 1.63% | 1.73% | 1.80% | 1.67% | 1.68% |
| Net investment income (loss) | (.38)%G | (.11)% | (.51)% | (.49)% | (.36)% | (.33)% |
| Supplemental Data | ||||||
| Net assets, end of period (in millions) | $141 | $140 | $155 | $172 | $172 | $141 |
| Portfolio turnover rateH | 93%G | 98% | 109% | 89% | 79%I | 72% |
A Calculated based on average shares outstanding during the period.
B Total returns for periods of less than one year are not annualized.
C Total returns would have been lower if certain expenses had not been reduced during the applicable periods shown.
D Total returns do not include the effect of the contingent deferred sales charge.
E Fees and expenses of any underlying Fidelity Central Funds are not included in the Fund's expense ratio. The Fund indirectly bears its proportionate share of the expenses of any underlying Fidelity Central Funds.
F Expense ratios reflect operating expenses of the class. Expenses before reductions do not reflect amounts reimbursed by the investment adviser or reductions from brokerage service arrangements or reductions from other expense offset arrangements and do not represent the amount paid by the class during periods when reimbursements or reductions occur. Expenses net of fee waivers reflect expenses after reimbursement by the investment adviser but prior to reductions from brokerage service arrangements or other expense offset arrangements. Expenses net of all reductions represent the net expenses paid by the class.
G Annualized
H Amount does not include the portfolio activity of any underlying Fidelity Central Funds.
I The portfolio turnover rate does not include the assets acquired in the merger.
See accompanying notes which are an integral part of the financial statements.
Financial Highlights — Fidelity Stock Selector Mid Cap Fund
| Six months ended (Unaudited) May 31, | Years ended November 30, | |||||
| 2017 | 2016 | 2015 | 2014 | 2013 | 2012A | |
| Selected Per–Share Data | ||||||
| Net asset value, beginning of period | $34.53 | $33.34 | $33.14 | $29.56 | $23.14 | $21.20 |
| Income from Investment Operations | ||||||
| Net investment income (loss)B | .11 | .28 | .16 | .16 | .17 | .09 |
| Net realized and unrealized gain (loss) | 3.24 | 1.55 | .14 | 3.49 | 6.54 | 1.85 |
| Total from investment operations | 3.35 | 1.83 | .30 | 3.65 | 6.71 | 1.94 |
| Distributions from net investment income | (.26) | (.12) | (.10) | (.07) | (.25) | – |
| Distributions from net realized gain | (.01) | (.53) | – | – | (.04) | – |
| Total distributions | (.26)C | (.64)D | (.10) | (.07) | (.29) | – |
| Net asset value, end of period | $37.62 | $34.53 | $33.34 | $33.14 | $29.56 | $23.14 |
| Total ReturnE,F | 9.76% | 5.73% | .90% | 12.38% | 29.36% | 9.15% |
| Ratios to Average Net AssetsG,H | ||||||
| Expenses before reductions | .62%I | .64% | .75% | .81% | .71% | .59%I |
| Expenses net of fee waivers, if any | .62%I | .64% | .74% | .81% | .71% | .59%I |
| Expenses net of all reductions | .61%I | .63% | .74% | .81% | .69% | .58%I |
| Net investment income (loss) | .60%I | .89% | .48% | .50% | .62% | .86%I |
| Supplemental Data | ||||||
| Net assets, end of period (in millions) | $364 | $222 | $486 | $553 | $225 | $1 |
| Portfolio turnover rateJ | 93%I | 98% | 109% | 89% | 79%K | 72% |
A For the period June 6, 2012 (commencement of sale of shares) to November 30, 2012.
B Calculated based on average shares outstanding during the period.
C Total distributions of $.26 per share is comprised of distributions from net investment income of $.255 and distributions from net realized gain of $.006 per share.
D Total distributions of $.64 per share is comprised of distributions from net investment income of $.115 and distributions from net realized gain of $.529 per share.
E Total returns for periods of less than one year are not annualized.
F Total returns would have been lower if certain expenses had not been reduced during the applicable periods shown.
G Fees and expenses of any underlying Fidelity Central Funds are not included in the Fund's expense ratio. The Fund indirectly bears its proportionate share of the expenses of any underlying Fidelity Central Funds.
H Expense ratios reflect operating expenses of the class. Expenses before reductions do not reflect amounts reimbursed by the investment adviser or reductions from brokerage service arrangements or reductions from other expense offset arrangements and do not represent the amount paid by the class during periods when reimbursements or reductions occur. Expenses net of fee waivers reflect expenses after reimbursement by the investment adviser but prior to reductions from brokerage service arrangements or other expense offset arrangements. Expenses net of all reductions represent the net expenses paid by the class.
I Annualized
J Amount does not include the portfolio activity of any underlying Fidelity Central Funds.
K The portfolio turnover rate does not include the assets acquired in the merger.
See accompanying notes which are an integral part of the financial statements.
Financial Highlights — Fidelity Advisor Stock Selector Mid Cap Fund Class I
| Six months ended (Unaudited) May 31, | Years ended November 30, | |||||
| 2017 | 2016 | 2015 | 2014 | 2013 | 2012 | |
| Selected Per–Share Data | ||||||
| Net asset value, beginning of period | $34.60 | $33.39 | $33.22 | $29.64 | $23.14 | $20.01 |
| Income from Investment Operations | ||||||
| Net investment income (loss)A | .11 | .28 | .13 | .16 | .18 | .15 |
| Net realized and unrealized gain (loss) | 3.25 | 1.56 | .14 | 3.50 | 6.56 | 3.15 |
| Total from investment operations | 3.36 | 1.84 | .27 | 3.66 | 6.74 | 3.30 |
| Distributions from net investment income | (.27) | (.11) | (.10) | (.08) | (.20) | (.17) |
| Distributions from net realized gain | (.01) | (.53) | – | – | (.04) | – |
| Total distributions | (.28) | (.63)B | (.10) | (.08) | (.24) | (.17) |
| Net asset value, end of period | $37.68 | $34.60 | $33.39 | $33.22 | $29.64 | $23.14 |
| Total ReturnC,D | 9.76% | 5.75% | .80% | 12.39% | 29.44% | 16.66% |
| Ratios to Average Net AssetsE,F | ||||||
| Expenses before reductions | .60%G | .64% | .83% | .80% | .67% | .65% |
| Expenses net of fee waivers, if any | .60%G | .64% | .83% | .80% | .67% | .65% |
| Expenses net of all reductions | .59%G | .64% | .82% | .80% | .65% | .64% |
| Net investment income (loss) | .62%G | .88% | .39% | .51% | .66% | .71% |
| Supplemental Data | ||||||
| Net assets, end of period (in millions) | $602 | $523 | $479 | $371 | $214 | $172 |
| Portfolio turnover rateH | 93%G | 98% | 109% | 89% | 79%I | 72% |
A Calculated based on average shares outstanding during the period.
B Total distributions of $.63 per share is comprised of distributions from net investment income of $.105 and distributions from net realized gain of $.529 per share.
C Total returns for periods of less than one year are not annualized.
D Total returns would have been lower if certain expenses had not been reduced during the applicable periods shown.
E Fees and expenses of any underlying Fidelity Central Funds are not included in the Fund's expense ratio. The Fund indirectly bears its proportionate share of the expenses of any underlying Fidelity Central Funds.
F Expense ratios reflect operating expenses of the class. Expenses before reductions do not reflect amounts reimbursed by the investment adviser or reductions from brokerage service arrangements or reductions from other expense offset arrangements and do not represent the amount paid by the class during periods when reimbursements or reductions occur. Expenses net of fee waivers reflect expenses after reimbursement by the investment adviser but prior to reductions from brokerage service arrangements or other expense offset arrangements. Expenses net of all reductions represent the net expenses paid by the class.
G Annualized
H Amount does not include the portfolio activity of any underlying Fidelity Central Funds.
I The portfolio turnover rate does not include the assets acquired in the merger.
See accompanying notes which are an integral part of the financial statements.
Financial Highlights — Fidelity Advisor Stock Selector Mid Cap Fund Class Z
| Six months ended (Unaudited) May 31, | |
| 2017 A | |
| Selected Per–Share Data | |
| Net asset value, beginning of period | $35.79 |
| Income from Investment Operations | |
| Net investment income (loss)B | .11 |
| Net realized and unrealized gain (loss) | 1.80 |
| Total from investment operations | 1.91 |
| Distributions from net investment income | – |
| Distributions from net realized gain | – |
| Total distributions | – |
| Net asset value, end of period | $37.70 |
| Total ReturnC,D | 5.34% |
| Ratios to Average Net AssetsE,F | |
| Expenses before reductions | .45%G |
| Expenses net of fee waivers, if any | .44%G |
| Expenses net of all reductions | .43%G |
| Net investment income (loss) | .90%G |
| Supplemental Data | |
| Net assets, end of period (in millions) | $– |
| Portfolio turnover rateH | 93%G |
A For the period February 1, 2017 (commencement of sale of shares) to May 31, 2017.
B Calculated based on average shares outstanding during the period.
C Total returns for periods of less than one year are not annualized.
D Total returns would have been lower if certain expenses had not been reduced during the applicable periods shown.
E Fees and expenses of any underlying Fidelity Central Funds are not included in the Fund's expense ratio. The Fund indirectly bears its proportionate share of the expenses of any underlying Fidelity Central Funds.
F Expense ratios reflect operating expenses of the class. Expenses before reductions do not reflect amounts reimbursed by the investment adviser or reductions from brokerage service arrangements or reductions from other expense offset arrangements and do not represent the amount paid by the class during periods when reimbursements or reductions occur. Expense ratios before reductions for start-up periods may not be representative of longer-term operating periods. Expenses net of fee waivers reflect expenses after reimbursement by the investment adviser but prior to reductions from brokerage service arrangements or other expense offset arrangements. Expenses net of all reductions represent the net expenses paid by the class.
G Annualized
H Amount does not include the portfolio activity of any underlying Fidelity Central Funds.
See accompanying notes which are an integral part of the financial statements.
Notes to Financial Statements (Unaudited)
For the period ended May 31, 2017
(Amounts in thousands except percentages)
1. Organization.
Fidelity Advisor Stock Selector Mid Cap Fund (the Fund) is a fund of Fidelity Advisor Series I (the Trust) and is authorized to issue an unlimited number of shares. The Trust is registered under the Investment Company Act of 1940, as amended (the 1940 Act), as an open-end management investment company organized as a Massachusetts business trust. The Fund commenced sale of Class Z shares on February 1, 2017. The Fund offers Class A, Class M (formerly Class T), Class C, Fidelity Stock Selector Mid Cap Fund, Class I and Class Z shares, each of which has equal rights as to assets and voting privileges. Each class has exclusive voting rights with respect to matters that affect that class.
After the close of business on June 24, 2016, all outstanding Class B shares were converted to Class A shares. All prior fiscal period dollar and share amounts for Class B presented in the Notes to Financial Statements are for the period December 1, 2015 through June 24, 2016.
2. Investments in Fidelity Central Funds.
The Fund invests in Fidelity Central Funds, which are open-end investment companies generally available only to other investment companies and accounts managed by the investment adviser and its affiliates. The Fund's Schedule of Investments lists each of the Fidelity Central Funds held as of period end, if any, as an investment of the Fund, but does not include the underlying holdings of each Fidelity Central Fund. As an Investing Fund, the Fund indirectly bears its proportionate share of the expenses of the underlying Fidelity Central Funds.
The Money Market Central Funds seek preservation of capital and current income and are managed by Fidelity Investments Money Management, Inc. (FIMM), an affiliate of the investment adviser. Annualized expenses of the Money Market Central Funds as of their most recent shareholder report date are less than .005%.
A complete unaudited list of holdings for each Fidelity Central Fund is available upon request or at the Securities and Exchange Commission (the SEC) website at www.sec.gov. In addition, the financial statements of the Fidelity Central Funds are available on the SEC website or upon request.
3. Significant Accounting Policies.
The Fund is an investment company and applies the accounting and reporting guidance of the Financial Accounting Standards Board (FASB) Accounting Standards Codification Topic 946 Financial Services – Investments Companies. The financial statements have been prepared in conformity with accounting principles generally accepted in the United States of America (GAAP), which require management to make certain estimates and assumptions at the date of the financial statements. Actual results could differ from those estimates. Subsequent events, if any, through the date that the financial statements were issued have been evaluated in the preparation of the financial statements. The following summarizes the significant accounting policies of the Fund:
Investment Valuation. Investments are valued as of 4:00 p.m. Eastern time on the last calendar day of the period. The Board of Trustees (the Board) has delegated the day to day responsibility for the valuation of the Fund's investments to the Fair Value Committee (the Committee) established by the Fund's investment adviser. In accordance with valuation policies and procedures approved by the Board, the Fund attempts to obtain prices from one or more third party pricing vendors or brokers to value its investments. When current market prices, quotations or currency exchange rates are not readily available or reliable, investments will be fair valued in good faith by the Committee, in accordance with procedures adopted by the Board. Factors used in determining fair value vary by investment type and may include market or investment specific events, changes in interest rates and credit quality. The frequency with which these procedures are used cannot be predicted and they may be utilized to a significant extent. The Committee oversees the Fund's valuation policies and procedures and reports to the Board on the Committee's activities and fair value determinations. The Board monitors the appropriateness of the procedures used in valuing the Fund's investments and ratifies the fair value determinations of the Committee.
The Fund categorizes the inputs to valuation techniques used to value its investments into a disclosure hierarchy consisting of three levels as shown below:
- Level 1 – quoted prices in active markets for identical investments
- Level 2 – other significant observable inputs (including quoted prices for similar investments, interest rates, prepayment speeds, etc.)
- Level 3 – unobservable inputs (including the Fund's own assumptions based on the best information available)
Valuation techniques used to value the Fund's investments by major category are as follows:
Equity securities, including restricted securities, for which market quotations are readily available, are valued at the last reported sale price or official closing price as reported by a third party pricing vendor on the primary market or exchange on which they are traded and are categorized as Level 1 in the hierarchy. In the event there were no sales during the day or closing prices are not available, securities are valued at the last quoted bid price or may be valued using the last available price and are generally categorized as Level 2 in the hierarchy. For foreign equity securities, when market or security specific events arise, comparisons to the valuation of American Depositary Receipts (ADRs), futures contracts, Exchange-Traded Funds (ETFs) and certain indexes as well as quoted prices for similar securities may be used and would be categorized as Level 2 in the hierarchy. Utilizing these techniques may result in transfers between Level 1 and Level 2. For equity securities, including restricted securities, where observable inputs are limited, assumptions about market activity and risk are used and these securities may be categorized as Level 3 in the hierarchy.
Debt securities, including restricted securities, are valued based on evaluated prices received from third party pricing vendors or from brokers who make markets in such securities. U.S. government and government agency obligations are valued by pricing vendors who utilize matrix pricing which considers yield or price of bonds of comparable quality, coupon, maturity and type or by broker-supplied prices. When independent prices are unavailable or unreliable, debt securities may be valued utilizing pricing methodologies which consider similar factors that would be used by third party pricing vendors. Debt securities are generally categorized as Level 2 in the hierarchy but may be Level 3 depending on the circumstances.
Futures contracts are valued at the settlement price established each day by the board of trade or exchange on which they are traded and are categorized as Level 1 in the hierarchy. Investments in open-end mutual funds, including the Fidelity Central Funds, are valued at their closing net asset value (NAV) each business day and are categorized as Level 1 in the hierarchy.
Changes in valuation techniques may result in transfers in or out of an assigned level within the disclosure hierarchy. The aggregate value of investments by input level as of May 31, 2017, is included at the end of the Fund's Schedule of Investments.
Foreign Currency. The Fund may use foreign currency contracts to facilitate transactions in foreign-denominated securities. Gains and losses from these transactions may arise from changes in the value of the foreign currency or if the counterparties do not perform under the contracts' terms.
Foreign-denominated assets, including investment securities, and liabilities are translated into U.S. dollars at the exchange rates at period end. Purchases and sales of investment securities, income and dividends received and expenses denominated in foreign currencies are translated into U.S. dollars at the exchange rate in effect on the transaction date.
The effects of exchange rate fluctuations on investments are included with the net realized and unrealized gain (loss) on investment securities. Other foreign currency transactions resulting in realized and unrealized gain (loss) are disclosed separately.
Investment Transactions and Income. For financial reporting purposes, the Fund's investment holdings and NAV include trades executed through the end of the last business day of the period. The NAV per share for processing shareholder transactions is calculated as of the close of business of the New York Stock Exchange (NYSE), normally 4:00 p.m. Eastern time and includes trades executed through the end of the prior business day. Gains and losses on securities sold are determined on the basis of identified cost and may include proceeds received from litigation. Dividend income is recorded on the ex-dividend date, except for certain dividends from foreign securities where the ex-dividend date may have passed, which are recorded as soon as the Fund is informed of the ex-dividend date. Non-cash dividends included in dividend income, if any, are recorded at the fair market value of the securities received. Income and capital gain distributions from Fidelity Central Funds, if any, are recorded on the ex-dividend date. Certain distributions received by the Fund represent a return of capital or capital gain. The Fund determines the components of these distributions subsequent to the ex-dividend date, based upon receipt of tax filings or other correspondence relating to the underlying investment. These distributions are recorded as a reduction of cost of investments and/or as a realized gain. Interest income is accrued as earned and includes coupon interest and amortization of premium and accretion of discount on debt securities as applicable. Investment income is recorded net of foreign taxes withheld where recovery of such taxes is uncertain.
Class Allocations and Expenses. Investment income, realized and unrealized capital gains and losses, common expenses of the Fund, and certain fund-level expense reductions, if any, are allocated daily on a pro-rata basis to each class based on the relative net assets of each class to the total net assets of the Fund. Each class differs with respect to transfer agent and distribution and service plan fees incurred. Certain expense reductions may also differ by class. For the reporting period, the allocated portion of income and expenses to each class as a percent of its average net assets may vary due to the timing of recording these transactions in relation to fluctuating net assets of the classes. Expenses directly attributable to a fund are charged to that fund. Expenses attributable to more than one fund are allocated among the respective funds on the basis of relative net assets or other appropriate methods. Expense estimates are accrued in the period to which they relate and adjustments are made when actual amounts are known.
Income Tax Information and Distributions to Shareholders. Each year, the Fund intends to qualify as a regulated investment company under Subchapter M of the Internal Revenue Code, including distributing substantially all of its taxable income and realized gains. As a result, no provision for U.S. Federal income taxes is required. The Fund files a U.S. federal tax return, in addition to state and local tax returns as required. The Fund's federal income tax returns are subject to examination by the Internal Revenue Service (IRS) for a period of three fiscal years after they are filed. State and local tax returns may be subject to examination for an additional fiscal year depending on the jurisdiction. Foreign taxes are provided for based on the Fund's understanding of the tax rules and rates that exist in the foreign markets in which it invests.
Distributions are declared and recorded on the ex-dividend date. Income dividends and capital gain distributions are declared separately for each class. Income and capital gain distributions are determined in accordance with income tax regulations, which may differ from GAAP.
Capital accounts within the financial statements are adjusted for permanent book-tax differences. These adjustments have no impact on net assets or the results of operations. Capital accounts are not adjusted for temporary book-tax differences which will reverse in a subsequent period.
Book-tax differences are primarily due to futures contracts, market discount, foreign currency transactions, partnerships, deferred trustees compensation, capital loss carryforwards, expiring capital loss carryforwards and losses deferred due to wash sales.
The federal tax cost of investment securities and unrealized appreciation (depreciation) as of period end were as follows:
| Gross unrealized appreciation | $331,707 |
| Gross unrealized depreciation | (82,393) |
| Net unrealized appreciation (depreciation) on securities | $249,314 |
| Tax cost | $2,026,324 |
Capital loss carryforwards are only available to offset future capital gains of the Fund to the extent provided by regulations and may be limited. Under the Regulated Investment Company Modernization Act of 2010 (the Act), the Fund is permitted to carry forward capital losses incurred in taxable years beginning after December 22, 2010 for an unlimited period and such capital losses are required to be used prior to any losses that expire. The capital loss carryforward information presented below, including any applicable limitation, is estimated as of prior fiscal period end and is subject to adjustment.
| Fiscal year of expiration | |
| No expiration | |
| Short-term | $(52,961) |
| Long-term | (33,840) |
| Total capital loss carryforward | $(86,801) |
Restricted Securities. The Fund may invest in securities that are subject to legal or contractual restrictions on resale. These securities generally may be resold in transactions exempt from registration or to the public if the securities are registered. Disposal of these securities may involve time-consuming negotiations and expense, and prompt sale at an acceptable price may be difficult. Information regarding restricted securities is included at the end of the Fund's Schedule of Investments.
4. Derivative Instruments.
Risk Exposures and the Use of Derivative Instruments. The Fund's investment objective allows the Fund to enter into various types of derivative contracts, including futures contracts. Derivatives are investments whose value is primarily derived from underlying assets, indices or reference rates and may be transacted on an exchange or over-the-counter (OTC). Derivatives may involve a future commitment to buy or sell a specified asset based on specified terms, to exchange future cash flows at periodic intervals based on a notional principal amount, or for one party to make one or more payments upon the occurrence of specified events in exchange for periodic payments from the other party.
The Fund used derivatives to increase returns and to manage exposure to certain risks as defined below. The success of any strategy involving derivatives depends on analysis of numerous economic factors, and if the strategies for investment do not work as intended, the Fund may not achieve its objectives.
The Fund's use of derivatives increased or decreased its exposure to the following risk:
| Equity Risk | Equity risk relates to the fluctuations in the value of financial instruments as a result of changes in market prices (other than those arising from interest rate risk or foreign exchange risk), whether caused by factors specific to an individual investment, its issuer, or all factors affecting all instruments traded in a market or market segment. |
The Fund is also exposed to additional risks from investing in derivatives, such as liquidity risk and counterparty credit risk. Liquidity risk is the risk that the Fund will be unable to close out the derivative in the open market in a timely manner. Counterparty credit risk is the risk that the counterparty will not be able to fulfill its obligation to the Fund. Counterparty credit risk related to exchange-traded futures contracts may be mitigated by the protection provided by the exchange on which they trade.
Investing in derivatives may involve greater risks than investing in the underlying assets directly and, to varying degrees, may involve risk of loss in excess of any initial investment and collateral received and amounts recognized in the Statement of Assets and Liabilities. In addition, there may be the risk that the change in value of the derivative contract does not correspond to the change in value of the underlying instrument.
Futures Contracts. A futures contract is an agreement between two parties to buy or sell a specified underlying instrument for a fixed price at a specified future date. The Fund used futures contracts to manage its exposure to the stock market.
Upon entering into a futures contract, a fund is required to deposit either cash or securities (initial margin) with a clearing broker in an amount equal to a certain percentage of the face value of the contract. Futures contracts are marked-to-market daily and subsequent daily payments (variation margin) are made or received by a fund depending on the daily fluctuations in the value of the futures contracts and are recorded as unrealized appreciation or (depreciation). This receivable and/or payable, if any, is included in daily variation margin for derivative instruments in the Statement of Assets and Liabilities. Realized gain or (loss) is recorded upon the expiration or closing of a futures contract.
Any open futures contracts at period end are presented in the Schedule of Investments under the caption "Futures Contracts". The underlying face amount at value reflects each contract's exposure to the underlying instrument or index at period end and is representative of volume of activity during the period. Securities deposited to meet initial margin requirements are identified in the Schedule of Investments.
During the period the Fund recognized net realized gain (loss) of $758 and a change in net unrealized appreciation (depreciation) of $55 related to its investment in futures contracts. These amounts are included in the Statement of Operations.
5. Purchases and Sales of Investments.
Purchases and sales of securities, other than short-term securities, aggregated $962,211 and $996,063, respectively.
6. Fees and Other Transactions with Affiliates.
Management Fee. Fidelity Management & Research Company (the investment adviser) and its affiliates provide the Fund with investment management related services for which the Fund pays a monthly management fee. The management fee is the sum of an individual fund fee rate that is based on an annual rate of .30% of the Fund's average net assets and an annualized group fee rate that averaged .25% during the period. The group fee rate is based upon the average net assets of all the mutual funds advised by the investment adviser, including any mutual funds previously advised by the investment adviser that are currently advised by Fidelity SelectCo, LLC, an affiliate of the investment adviser. The group fee rate decreases as assets under management increase and increases as assets under management decrease. In addition, the management fee is subject to a performance adjustment (up to a maximum of +/- .20% of the Fund's average net assets over a 36 month performance period). The upward or downward adjustment to the management fee is based on the relative investment performance of Class I of the Fund as compared to its benchmark index, the S&P MidCap 400 Index, over the same 36 month performance period. For the reporting period, the total annualized management fee rate, including the performance adjustment, was .35% of the Fund's average net assets. The performance adjustment included in the management fee rate may be higher or lower than the maximum performance adjustment rate due to the difference between the average net assets for the reporting and performance periods.
Distribution and Service Plan Fees. In accordance with Rule 12b-1 of the 1940 Act, the Fund has adopted separate Distribution and Service Plans for each class of shares. Certain classes pay Fidelity Distributors Corporation (FDC), an affiliate of the investment adviser, separate Distribution and Service Fees, each of which is based on an annual percentage of each class' average net assets. In addition, FDC may pay financial intermediaries for selling shares of the Fund and providing shareholder support services. For the period, the Distribution and Service Fee rates, total fees and amounts retained by FDC were as follows:
| Distribution Fee | Service Fee | Total Fees | Retained by FDC | |
| Class A | -% | .25% | $697 | $1 |
| Class M | .25% | .25% | 1,491 | 3 |
| Class C | .75% | .25% | 715 | – |
| $2,903 | $4 |
Sales Load. FDC may receive a front-end sales charge of up to 5.75% for selling Class A shares and 3.50% for selling Class M shares, some of which is paid to financial intermediaries for selling shares of the Fund. Depending on the holding period, FDC may receive contingent deferred sales charges levied on Class A, Class M, and Class C redemptions. The deferred sales charges are 1.00% for Class C shares, 1.00% for certain purchases of Class A shares and .25% for certain purchases of Class M shares.
For the period, sales charge amounts retained by FDC were as follows:
| Retained by FDC | |
| Class A | $19 |
| Class M | 6 |
| Class C(a) | 1 |
| $26 |
(a) When Class C shares are initially sold, FDC pays commissions from its own resources to financial intermediaries through which the sales are made.
Transfer Agent Fees. Fidelity Investments Institutional Operations Company, Inc., (FIIOC), an affiliate of the investment adviser, is the transfer, dividend disbursing and shareholder servicing agent for each class of the Fund. FIIOC receives account fees and asset-based fees that vary according to the account size and type of account of the shareholders of the respective classes of the Fund, except for Class Z. FIIOC receives an asset-based fee of Class Z's average net assets. FIIOC pays for typesetting, printing and mailing of shareholder reports, except proxy statements.
For the period, transfer agent fees for each applicable class were as follows:
| Amount | % of Class-Level Average Net Assets(a) | |
| Class A | $551 | .20 |
| Class M | 563 | .19 |
| Class C | 147 | .21 |
| Fidelity Stock Selector Mid Cap Fund | 298 | .23 |
| Class I | 585 | .20 |
| Class Z | –(b) | .05 |
| $2,144 |
(a) Annualized
(b) In the amount less than five hundred dollars.
Accounting and Security Lending Fees. Fidelity Service Company, Inc. (FSC), an affiliate of the investment adviser, maintains the Fund's accounting records. The accounting fee is based on the level of average net assets for each month. Under a separate contract, FSC administers the security lending program. The security lending fee is based on the number and duration of lending transactions.
Brokerage Commissions. The Fund placed a portion of its portfolio transactions with brokerage firms which are affiliates of the investment adviser. Brokerage commissions are included in net realized gain (loss) and change in net unrealized appreciation (depreciation) in the Statement of Operations. The commissions paid to these affiliated firms were $31 for the period.
Interfund Trades. The Fund may purchase from or sell securities to other Fidelity Funds under procedures adopted by the Board. The procedures have been designed to ensure these interfund trades are executed in accordance with Rule 17a-7 of the 1940 Act. Interfund trades are included within the respective purchases and sales amounts shown in the Purchases and Sales of Investments note.
7. Committed Line of Credit.
The Fund participates with other funds managed by the investment adviser or an affiliate in a $4.25 billion credit facility (the "line of credit") to be utilized for temporary or emergency purposes to fund shareholder redemptions or for other short-term liquidity purposes. The Fund has agreed to pay commitment fees on its pro-rata portion of the line of credit, which amounted to $3 and is reflected in Miscellaneous expenses on the Statement of Operations. During the period, the Fund did not borrow on this line of credit.
8. Security Lending.
The Fund lends portfolio securities through a lending agent from time to time in order to earn additional income. For equity securities, a lending agent is used and may loan securities to certain qualified borrowers, including Fidelity Capital Markets (FCM), a broker-dealer affiliated with the Fund. On the settlement date of the loan, the Fund receives collateral (in the form of U.S. Treasury obligations, letters of credit and/or cash) against the loaned securities and maintains collateral in an amount not less than 100% of the market value of the loaned securities during the period of the loan. The market value of the loaned securities is determined at the close of business of the Fund and any additional required collateral is delivered to the Fund on the next business day. The Fund or borrower may terminate the loan at any time, and if the borrower defaults on its obligation to return the securities loaned because of insolvency or other reasons, the Fund may apply collateral received from the borrower against the obligation. The Fund may experience delays and costs in recovering the securities loaned. Any cash collateral received is invested in the Fidelity Securities Lending Cash Central Fund. The value of loaned securities and cash collateral at period end are disclosed on the Fund's Statement of Assets and Liabilities. The value of securities loaned to FCM at period end was $1,868. Security lending income represents the income earned on investing cash collateral, less rebates paid to borrowers and any lending agent fees associated with the loan, plus any premium payments received for lending certain types of securities. Security lending income is presented in the Statement of Operations as a component of income from Fidelity Central Funds. Total security lending income during the period amounted to $61, including $7 from securities loaned to FCM.
9. Expense Reductions.
The investment adviser voluntarily agreed to reimburse a portion of the Fund's Class A, Class M, Class C, Fidelity Stock Selector Mid Cap Fund and Class I operating expenses. During the period, this reimbursement reduced expenses as follows:
| Reimbursement | |
| Class A | $4 |
| Class M | 4 |
| Class C | 1 |
| Fidelity Stock Selector Mid Cap Fund | 3 |
| Class I | 5 |
| $17 |
Commissions paid to certain brokers with whom the investment adviser, or its affiliates, places trades on behalf of the Fund include an amount in addition to trade execution, which may be rebated back to the Fund to offset certain expenses. This amount totaled $120 for the period.
In addition, during the period the investment adviser reimbursed and/or waived a portion of fund-level operating expenses in the amount of $9.
10. Distributions to Shareholders.
Distributions to shareholders of each class were as follows:
| Six months ended May 31, 2017 | Year ended November 30, 2016 | |
| From net investment income | ||
| Class A | $3,079 | $755 |
| Class M | 1,865 | – |
| Fidelity Stock Selector Mid Cap Fund | 1,644 | 1,674 |
| Class I | 4,120 | 1,530 |
| Total | $10,708 | $3,959 |
| From net realized gain | ||
| Class A | $98 | $9,744 |
| Class M | 105 | 11,098 |
| Class B | – | 166 |
| Class C | – | 2,758 |
| Fidelity Stock Selector Mid Cap Fund | 39 | 7,708 |
| Class I | 91 | 7,742 |
| Total | $333 | $39,216 |
11. Share Transactions.
Share transactions for each class were as follows and may contain automatic conversions between classes or exchanges between affiliated funds:
| Shares | Shares | Dollars | Dollars | |
| Six months ended May 31, 2017 (a) | Year ended November 30, 2016 | Six months ended May 31, 2017 (a) | Year ended November 30, 2016 | |
| Class A | ||||
| Shares sold | 533 | 1,039 | $18,796 | $31,500 |
| Reinvestment of distributions | 88 | 331 | 2,963 | 9,838 |
| Shares redeemed | (1,760) | (3,402) | (61,748) | (104,169) |
| Net increase (decrease) | (1,139) | (2,032) | $(39,989) | $(62,831) |
| Class M | ||||
| Shares sold | 560 | 1,180 | $19,670 | $36,250 |
| Reinvestment of distributions | 55 | 356 | 1,885 | 10,639 |
| Shares redeemed | (2,345) | (4,950) | (82,773) | (152,516) |
| Net increase (decrease) | (1,730) | (3,414) | $(61,218) | $(105,627) |
| Class B | ||||
| Shares sold | – | 1 | $– | $31 |
| Reinvestment of distributions | – | 5 | – | 145 |
| Shares redeemed | – | (331) | – | (9,046) |
| Net increase (decrease) | – | (325) | $– | $(8,870) |
| Class C | ||||
| Shares sold | 86 | 114 | $2,746 | $3,221 |
| Reinvestment of distributions | – | 90 | – | 2,469 |
| Shares redeemed | (451) | (819) | (14,517) | (23,061) |
| Net increase (decrease) | (365) | (615) | $(11,771) | $(17,371) |
| Fidelity Stock Selector Mid Cap Fund | ||||
| Shares sold | 3,801 | 1,163 | $140,563 | $37,438 |
| Reinvestment of distributions | 47 | 300 | 1,639 | 9,281 |
| Shares redeemed | (625) | (9,609) | (22,863) | (298,117) |
| Net increase (decrease) | 3,223 | (8,146) | $119,339 | $(251,398) |
| Class I | ||||
| Shares sold | 2,421 | 5,294 | $89,040 | $166,666 |
| Reinvestment of distributions | 114 | 291 | 4,019 | 9,016 |
| Shares redeemed | (1,678) | (4,795) | (61,302) | (150,903) |
| Net increase (decrease) | 857 | 790 | $31,757 | $24,779 |
| Class Z | ||||
| Shares sold | 8 | – | $304 | $– |
| Net increase (decrease) | 8 | – | $304 | $– |
(a) Share transactions for Class Z are for the period February 1, 2017 (commencement of sale of shares) to May 31, 2017.
12. Other.
The Fund's organizational documents provide former and current trustees and officers with a limited indemnification against liabilities arising in connection with the performance of their duties to the Fund. In the normal course of business, the Fund may also enter into contracts that provide general indemnifications. The Fund's maximum exposure under these arrangements is unknown as this would be dependent on future claims that may be made against the Fund. The risk of material loss from such claims is considered remote.
Shareholder Expense Example
As a shareholder of the Fund, you incur two types of costs: (1) transaction costs, including sales charges (loads) on purchase payments or redemption proceeds, and (2) ongoing costs, including management fees, distribution and/or service (12b-1) fees and other Fund expenses. This Example is intended to help you understand your ongoing costs (in dollars) of investing in the Fund and to compare these costs with the ongoing costs of investing in other mutual funds.
The actual expense Example is based on an investment of $1,000 invested at the beginning of the period and held for the entire period (December 1, 2016 to May 31, 2017) for Class A, Class M, Class C, Fidelity Stock Selector Mid Cap Fund, and Class I and for the period (February 1, 2017 to May 31, 2017) for Class Z. The hypothetical expense Example is based on an investment of $1,000 invested for the one-half year period (December 1, 2016 to May 31, 2017).
Actual Expenses
The first line of the accompanying table for each class of the Fund provides information about actual account values and actual expenses. You may use the information in this line, together with the amount you invested, to estimate the expenses that you paid over the period. Simply divide your account value by $1,000.00 (for example, an $8,600 account value divided by $1,000.00 = 8.6), then multiply the result by the number in the first line for a class of the Fund under the heading entitled "Expenses Paid During Period" to estimate the expenses you paid on your account during this period. A small balance maintenance fee of $12.00 that is charged once a year may apply for certain accounts with a value of less than $2,000. This fee is not included in the table below. If it was, the estimate of expenses you paid during the period would be higher, and your ending account value lower, by this amount. In addition, the Fund, as a shareholder in the underlying Fidelity Central Funds, will indirectly bear its pro-rata share of the fees and expenses incurred by the underlying Fidelity Central Funds. These fees and expenses are not included in the Fund's annualized expense ratio used to calculate the expense estimate in the table below.
Hypothetical Example for Comparison Purposes
The second line of the accompanying table for each class of the Fund provides information about hypothetical account values and hypothetical expenses based on a Class' actual expense ratio and an assumed rate of return of 5% per year before expenses, which is not the Class' actual return. The hypothetical account values and expenses may not be used to estimate the actual ending account balance or expenses you paid for the period. You may use this information to compare the ongoing costs of investing in the Fund and other funds. To do so, compare this 5% hypothetical example with the 5% hypothetical examples that appear in the shareholder reports of the other funds. A small balance maintenance fee of $12.00 that is charged once a year may apply for certain accounts with a value of less than $2,000. This fee is not included in the table below. If it was, the estimate of expenses you paid during the period would be higher, and your ending account value lower, by this amount. In addition, the Fund, as a shareholder in the underlying Fidelity Central Funds, will indirectly bear its pro-rata share of the fees and expenses incurred by the underlying Fidelity Central Funds. These fees and expenses are not included in the Fund's annualized expense ratio used to calculate the expense estimate in the table below.
Please note that the expenses shown in the table are meant to highlight your ongoing costs only and do not reflect any transaction costs. Therefore, the second line of the table is useful in comparing ongoing costs only, and will not help you determine the relative total costs of owning different funds. In addition, if these transactional costs were included, your costs would have been higher.
| Annualized Expense Ratio-A | Beginning Account Value | Ending Account Value May 31, 2017 | Expenses Paid During Period | |
| Class A | .84% | |||
| Actual | $1,000.00 | $1,096.20 | $4.39-B | |
| Hypothetical-C | $1,000.00 | $1,020.74 | $4.23-D | |
| Class M | 1.08% | |||
| Actual | $1,000.00 | $1,095.00 | $5.64-B | |
| Hypothetical-C | $1,000.00 | $1,019.55 | $5.44-D | |
| Class C | 1.60% | |||
| Actual | $1,000.00 | $1,092.10 | $8.35-B | |
| Hypothetical-C | $1,000.00 | $1,016.95 | $8.05-D | |
| Fidelity Stock Selector Mid Cap Fund | .62% | |||
| Actual | $1,000.00 | $1,097.60 | $3.24-B | |
| Hypothetical-C | $1,000.00 | $1,021.84 | $3.13-D | |
| Class I | .60% | |||
| Actual | $1,000.00 | $1,097.60 | $3.14-B | |
| Hypothetical-C | $1,000.00 | $1,021.94 | $3.02-D | |
| Class Z | .44% | |||
| Actual | $1,000.00 | $1,053.40 | $1.49-B | |
| Hypothetical-C | $1,000.00 | $1,022.74 | $2.22-D |
A Annualized expense ratio reflects expenses net of applicable fee waivers.
B Actual expenses are equal to each Class' annualized expense ratio, multiplied by the average account value over the period, multiplied by 182/365 (to reflect the one-half year period) for Class A, Class M, Class C, Fidelity Stock Selector Mid Cap Fund and Class I and multiplied by 120/365 (to reflect the period February 1, 2017 to May 31, 2017) for Class Z.
C 5% return per year before expenses
D Hypothetical expenses are equal to each Class' annualized expense ratio, multiplied by the average account value over the period, multiplied by 182/365 (to reflect the one-half year period).
![]()
MC-SANN-0717
1.704677.119
Fidelity® Real Estate High Income Fund Semi-Annual Report May 31, 2017 |
|
Contents
To view a fund's proxy voting guidelines and proxy voting record for the 12-month period ended June 30, visit http://www.fidelity.com/proxyvotingresults or visit the Securities and Exchange Commission's (SEC) web site at http://www.sec.gov.
You may also call (collect) 1-401-292-6402 to request a free copy of the proxy voting guidelines.
Standard & Poor's, S&P and S&P 500 are registered service marks of The McGraw-Hill Companies, Inc. and have been licensed for use by Fidelity Distributors Corporation.
Other third-party marks appearing herein are the property of their respective owners.
All other marks appearing herein are registered or unregistered trademarks or service marks of FMR LLC or an affiliated company. © 2017 FMR LLC. All rights reserved.
This report and the financial statements contained herein are submitted for the general information of the shareholders of the Fund. This report is not authorized for distribution to prospective investors in the Fund unless preceded or accompanied by an effective prospectus.
A fund files its complete schedule of portfolio holdings with the SEC for the first and third quarters of each fiscal year on Form N-Q. Forms N-Q are available on the SEC’s web site at http://www.sec.gov. A fund's Forms N-Q may be reviewed and copied at the SEC’s Public Reference Room in Washington, DC. Information regarding the operation of the SEC's Public Reference Room may be obtained by calling 1-800-SEC-0330.
For a complete list of a fund's portfolio holdings, view the most recent holdings listing, semiannual report, or annual report on Fidelity's web site at http://www.fidelity.com, http://www.institutional.fidelity.com, or http://www.401k.com, as applicable.
NOT FDIC INSURED •MAY LOSE VALUE •NO BANK GUARANTEE
Neither the Fund nor Fidelity Distributors Corporation is a bank.
Investment Summary (Unaudited)
Quality Diversification (% of fund's net assets)
| As of May 31, 2017 | ||
| AAA,AA,A | 13.5% | |
| BBB | 24.9% | |
| BB | 15.2% | |
| B | 15.5% | |
| CCC,CC,C | 2.9% | |
| Not Rated | 15.5% | |
| Equities | 3.7% | |
| Short-Term Investments and Net Other Assets | 8.8% | |
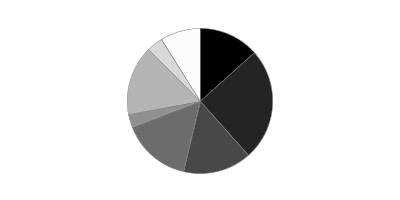
| As of November 30, 2016 | ||
| AAA,AA,A | 14.9% | |
| BBB | 28.6% | |
| BB | 16.8% | |
| B | 11.8% | |
| CCC,CC,C | 2.9% | |
| D | 0.1% | |
| Not Rated | 15.4% | |
| Equities | 4.6% | |
| Short-Term Investments and Net Other Assets | 4.9% | |
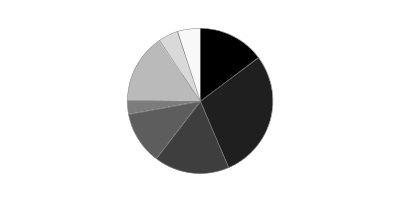
We have used ratings from Moody's Investors Service, Inc. Where Moody's® ratings are not available, we have used S&P® ratings. Where neither Moody's nor S&P ratings are available, we have used Fitch® ratings. All ratings are as of the date indicated and do not reflect subsequent changes.
Asset Allocation (% of fund's net assets)
| As of May 31, 2017 | ||
| CMOs and Other Mortgage Related Securities | 76.9% | |
| Asset-Backed Securities | 1.7% | |
| Nonconvertible Bonds | 4.6% | |
| Convertible Bonds, Preferred Stocks | 3.5% | |
| Common Stocks | 0.2% | |
| Bank Loan Obligations | 4.3% | |
| Short-Term Investments and Net Other Assets (Liabilities) | 8.8% | |

| As of November 30, 2016 | ||
| CMOs and Other Mortgage Related Securities | 79.7% | |
| Asset-Backed Securities | 2.7% | |
| Nonconvertible Bonds | 3.9% | |
| Convertible Bonds, Preferred Stocks | 4.6% | |
| Bank Loan Obligations | 4.2% | |
| Short-Term Investments and Net Other Assets (Liabilities) | 4.9% | |

Investments May 31, 2017
Showing Percentage of Net Assets
| Nonconvertible Bonds - 4.6% | |||
| Principal Amount(a) | Value | ||
| Diversified Financial Services - 0.1% | |||
| CBL & Associates LP 4.6% 10/15/24 | $1,144,000 | $1,065,694 | |
| Healthcare - 0.8% | |||
| CTR Partnership LP/CareTrust Capital Corp. 5.25% 6/1/25 | 1,720,000 | 1,741,500 | |
| MPT Operating Partnership LP/MPT Finance Corp. 5.25% 8/1/26 | 400,000 | 420,000 | |
| Omega Healthcare Investors, Inc. 4.95% 4/1/24 | 311,000 | 325,251 | |
| Sabra Health Care LP/Sabra Capital Corp. 5.375% 6/1/23 | 3,000,000 | 3,112,500 | |
| Senior Housing Properties Trust 6.75% 4/15/20 | 3,000,000 | 3,240,840 | |
| TOTAL HEALTHCARE | 8,840,091 | ||
| Homebuilders/Real Estate - 2.0% | |||
| CalAtlantic Group, Inc. 8.375% 5/15/18 | 1,000,000 | 1,057,700 | |
| CBRE Group, Inc. 5% 3/15/23 | 2,325,000 | 2,423,813 | |
| DDR Corp.: | |||
| 4.625% 7/15/22 | 288,000 | 301,712 | |
| 4.7% 6/1/27 | 3,354,000 | 3,396,002 | |
| 7.875% 9/1/20 | 2,437,000 | 2,808,560 | |
| Howard Hughes Corp. 5.375% 3/15/25 (b) | 2,505,000 | 2,583,281 | |
| Hunt Companies, Inc. 9.625% 3/1/21 (b) | 4,235,000 | 4,457,338 | |
| iStar Financial, Inc. 6% 4/1/22 | 3,075,000 | 3,128,813 | |
| Realogy Group LLC/Realogy Co.-Issuer Corp. 4.5% 4/15/19 (b) | 1,170,000 | 1,213,875 | |
| Ventas Realty LP/Ventas Capital Corp. 4.25% 3/1/22 | 1,000,000 | 1,060,468 | |
| TOTAL HOMEBUILDERS/REAL ESTATE | 22,431,562 | ||
| Hotels - 1.6% | |||
| ESH Hospitality, Inc. 5.25% 5/1/25 (b) | 4,250,000 | 4,342,820 | |
| FelCor Lodging LP 5.625% 3/1/23 | 755,000 | 788,975 | |
| Host Hotels & Resorts LP 4.75% 3/1/23 | 890,000 | 955,746 | |
| RHP Hotel Properties LP/RHP Finance Corp. 5% 4/15/23 | 2,300,000 | 2,354,625 | |
| Times Square Hotel Trust 8.528% 8/1/26 (b) | 7,290,503 | 8,728,953 | |
| TOTAL HOTELS | 17,171,119 | ||
| Super Retail - 0.1% | |||
| JC Penney Corp., Inc. 5.875% 7/1/23 (b) | 720,000 | 716,400 | |
| TOTAL NONCONVERTIBLE BONDS | |||
| (Cost $47,424,932) | 50,224,866 | ||
| Asset-Backed Securities - 1.7% | |||
| American Homes 4 Rent: | |||
| Series 2014-SFR2 Class E, 6.231% 10/17/36 (b) | 672,000 | 745,701 | |
| Series 2014-SFR3 Class E, 6.418% 12/17/36 (b) | 1,864,000 | 2,097,793 | |
| Series 2015-SFR1 Class E, 5.639% 4/17/52 (b) | 2,557,223 | 2,746,381 | |
| Series 2015-SFR2: | |||
| Class E, 6.07% 10/17/45 (b) | 4,476,000 | 4,937,046 | |
| Class XS, 0% 10/17/45 (b)(c)(d) | 3,247,053 | 32 | |
| Argent Securities, Inc. pass-thru certificates Series 2004-W9 Class M7, 4.255% 6/26/34 (b)(c) | 73,793 | 17,396 | |
| Capital Trust RE CDO Ltd. Series 2005-1A: | |||
| Class D, 2.5099% 3/20/50 (b)(c) | 750,000 | 75 | |
| Class E, 3.1099% 3/20/50 (b)(c) | 3,000,000 | 300 | |
| Crest Clarendon Street Ltd./Crest Clarendon Corp. Series 2002-1A Class D, 9% 12/28/35 (b) | 2,687,456 | 1,018,707 | |
| Crest Ltd.: | |||
| Series 2000-1A Class D, 10% 8/31/36 (b) | 736,187 | 74 | |
| Series 2004-1A Class H1, 4.8618% 1/28/40 (b)(c) | 2,870,581 | 287 | |
| Invitation Homes Trust: | |||
| Series 2014-SFR3 Class E, 5.4939% 12/17/31 (b)(c) | 310,234 | 311,235 | |
| Series 2014-SRF2 Class F, 4.9939% 9/17/31 (b)(c) | 1,000,000 | 1,001,522 | |
| Series 2015-SRF1 Class E, 5.1939% 3/17/32 (b)(c) | 1,000,000 | 1,002,615 | |
| Merit Securities Corp. Series 13 Class M1, 7.8204% 12/28/33 (c) | 1,665,000 | 1,719,107 | |
| Progress Residential Trust Series 2015-SFR3 Class F, 6.643% 11/12/32 (b) | 714,000 | 745,077 | |
| Residential Asset Securities Corp. Series 2003-KS10 Class MI3, 6.41% 12/25/33 | 256,832 | 177,563 | |
| Taberna Preferred Funding III Ltd. Series 2005-3A: | |||
| Class D, 3.8212% 2/5/36 (b)(c) | 2,732,158 | 205 | |
| Class E, 5.6712% 2/5/36 (b)(c) | 857,871 | 64 | |
| Taberna Preferred Funding VI Ltd. Series 2006-6A Class F1, 5.6712% 12/5/36 (b)(c) | 5,075,662 | 381 | |
| Tricon American Homes Trust Series 2016-SFR1 Class F, 5.769% 11/17/33 (b) | 1,914,000 | 1,950,308 | |
| TOTAL ASSET-BACKED SECURITIES | |||
| (Cost $28,914,379) | 18,471,869 | ||
| Collateralized Mortgage Obligations - 1.1% | |||
| Private Sponsor - 1.1% | |||
| Countrywide Home Loans, Inc. Series 2003-R1: | |||
| Class 2B4, 3.2853% 2/25/43 (b)(c) | 48,566 | 27,250 | |
| Class 2B5, 3.2853% 2/25/43 (b)(c) | 55,776 | 9,143 | |
| Credit Suisse First Boston Mortgage Acceptance Corp. Series 2004-6 Class B4, 4.7483% 9/25/19 (b)(c) | 7,306 | 31 | |
| Credit Suisse First Boston Mortgage Securities Corp. Series 2002-26 Class 4B3, 7% 10/25/17 | 9,036 | 8,720 | |
| FREMF Mortgage Trust: | |||
| Series 2010-K6 Class B, 5.542% 12/25/46 (b)(c) | 6,045,000 | 6,501,955 | |
| Series 2010-K7 Class B, 5.6853% 4/25/20 (b)(c) | 5,000,000 | 5,423,123 | |
| RESI Finance LP/RESI Finance DE Corp. floater Series 2003-B Class B9, 12.9394% 6/10/35 (b)(c) | 116,438 | 73,362 | |
| RESIX Finance Ltd. floater: | |||
| Series 2004-A Class B7, 5.2394% 2/10/36 (b)(c) | 51,252 | 5,429 | |
| Series 2004-B: | |||
| Class B8, 5.7394% 2/10/36 (b)(c) | 50,965 | 7,576 | |
| Class B9, 9.2394% 2/10/36 (b)(c) | 50,725 | 1,678 | |
| Series 2004-C Class B7, 4.4894% 9/10/36 (b)(c) | 203,514 | 14,262 | |
| TOTAL PRIVATE SPONSOR | 12,072,529 | ||
| U.S. Government Agency - 0.0% | |||
| Fannie Mae REMIC Trust: | |||
| Series 2001-W3 subordinate REMIC pass thru certificates, Class B3, 7% 9/25/41 (e) | 89,915 | 17,980 | |
| Series 2002-W1 subordinate REMIC pass thru certificates: | |||
| Class 3B3, 3.3739% 2/25/42 (b)(c) | 58,908 | 34,962 | |
| Class 3B5, 3.3739% 2/25/42 (b)(c) | 6,065 | 405 | |
| Series 2002-W6 subordinate REMIC pass thru certificates, Class 3B4, 3.5035% 1/25/42 (b)(c) | 52,434 | 23,488 | |
| Series 2003-W1 subordinate REMIC pass thru certificates, Class B3, 3.8892% 12/25/42 (c)(e) | 229,858 | 22,589 | |
| Series 2003-W10 subordinate REMIC pass thru certificates: | |||
| Class 2B4, 3.3523% 6/25/43 (c)(e) | 195,797 | 77,126 | |
| Class 2B5, 3.3523% 6/25/43 (c)(e) | 60,069 | 5,543 | |
| TOTAL U.S. GOVERNMENT AGENCY | 182,093 | ||
| TOTAL COLLATERALIZED MORTGAGE OBLIGATIONS | |||
| (Cost $11,815,744) | 12,254,622 | ||
| Commercial Mortgage Securities - 75.8% | |||
| Americold LLC Trust Series 2010-ARTA Class D, 7.443% 1/14/29 (b) | 1,230,000 | 1,387,867 | |
| Asset Securitization Corp. Series 1997-D4 Class B5, 7.525% 4/14/29 | 4,476,925 | 4,470,956 | |
| Aventura Mall Trust Series 2013-AVM Class E, 3.8674% 12/5/32 (b)(c) | 2,308,000 | 2,368,069 | |
| Banc of America Commercial Mortgage Trust: | |||
| Series 2005-1 Class CJ, 5.2802% 11/10/42 (c) | 153,813 | 153,626 | |
| Series 2005-5 Class D, 5.5806% 10/10/45 (c) | 531,429 | 530,984 | |
| Series 2008-1 Class D, 6.49% 2/10/51 (b)(c) | 1,970,000 | 1,494,931 | |
| BANK Series 2017-BNK4 Class D, 3.357% 5/15/50 (b) | 5,301,000 | 4,438,570 | |
| Bank of America Commercial Mortgage Securities Trust Series 2017-BNK3 Class D, 3.25% 2/15/50 (b) | 2,642,000 | 2,150,753 | |
| Bank of America Commercial Mortgage Trust Series 2015-UBS7 Class C, 4.5116% 9/15/48 (c) | 1,826,000 | 1,862,679 | |
| Barclays Commercial Mortgage Securities LLC Series 2015-STP Class E, 4.4272% 9/10/28 (b)(c) | 7,884,000 | 7,584,605 | |
| BBCMS Mortgage Trust Series 2016-ETC Class D, 3.7292% 8/14/36 (b)(c) | 2,100,000 | 2,040,685 | |
| Bear Stearns Commercial Mortgage Securities Trust Series 2006-T22 Class B, 5.714% 4/12/38 (b)(c) | 817,437 | 827,980 | |
| Beckman Coulter, Inc. sequential payer Series 2000-A Class A, 7.4975% 12/15/18 (b) | 4,692,121 | 4,845,558 | |
| BKB Commercial Mortgage Trust Series 1997-C1 Class H, 0.9601% 10/25/22 (b)(c) | 19,260 | 18,475 | |
| BLCP Hotel Trust: | |||
| floater Series 2014-CLRN Class F, 4.0226% 8/15/29 (b)(c) | 2,591,000 | 2,567,053 | |
| Series 2014-CLMZ Class M, 6.7165% 8/15/29 (b)(c) | 3,467,513 | 3,502,215 | |
| CCRESG Commercial Mortgage Trust Series 2016-HEAT Class E, 5.6712% 4/10/29 (b)(c) | 3,478,000 | 3,409,326 | |
| CD Mortgage Trust Series 2017-CD3: | |||
| Class C, 4.563% 2/10/50 | 5,600,000 | 5,921,831 | |
| Class D, 3.25% 2/10/50 (b) | 2,977,000 | 2,483,561 | |
| CG-CCRE Commercial Mortgage Trust: | |||
| Series 2014-FL1: | |||
| Class YTC2, 3.4829% 6/15/31 (b)(c) | 2,383,609 | 2,188,620 | |
| Class YTC3, 3.4829% 6/15/31 (b)(c) | 856,962 | 775,922 | |
| Series 2014-FL1, 3.4829% 6/15/31 (b)(c) | 2,383,609 | 2,211,832 | |
| CGBAM Commercial Mortgage Trust Series 2015-SMRT: | |||
| Class E, 3.9121% 4/10/28 (b)(c) | 683,000 | 687,959 | |
| Class F, 3.9121% 4/10/28 (b)(c) | 3,987,000 | 3,934,402 | |
| Chase Commercial Mortgage Securities Corp.: | |||
| Series 1998-1 Class H, 6.34% 5/18/30 (b) | 2,846,928 | 2,900,642 | |
| Series 1998-2 Class J, 6.39% 11/18/30 (b) | 3,329,253 | 3,340,315 | |
| Citigroup Commercial Mortgage Trust: | |||
| Series 2013-GC15 Class D, 5.2753% 9/10/46 (b)(c) | 8,792,000 | 8,476,126 | |
| Series 2015-SHP2 Class E, 5.344% 7/15/27 (b)(c) | 3,568,000 | 3,578,243 | |
| Series 2016-C3 Class D, 3% 11/15/49 (b) | 5,297,000 | 3,869,375 | |
| Series 2016-SMPL Class E, 4.509% 9/10/31 (b) | 1,722,000 | 1,732,200 | |
| COMM Mortgage Trust: | |||
| floater Series 2014-PAT Class E, 4.063% 8/13/27 (b)(c) | 3,339,000 | 3,353,101 | |
| sequential payer Series 2013-LC6 Class E, 3.5% 1/10/46 (b) | 5,250,000 | 3,820,977 | |
| Series 2012-CR1: | |||
| Class C, 5.4987% 5/15/45 (c) | 2,060,000 | 2,187,286 | |
| Class D, 5.4987% 5/15/45 (b)(c) | 6,994,000 | 6,875,177 | |
| Class G, 2.462% 5/15/45 (b) | 966,000 | 561,618 | |
| Series 2012-CR5 Class D, 4.4748% 12/10/45 (b)(c) | 1,550,000 | 1,494,145 | |
| Series 2012-LC4 Class D, 5.7631% 12/10/44 (b)(c) | 7,914,000 | 7,987,946 | |
| Series 2013-CCRE6 Class E, 4.309% 3/10/46 (b)(c) | 189,000 | 139,638 | |
| Series 2013-CR10: | |||
| Class C, 4.9484% 8/10/46 (b)(c) | 1,310,000 | 1,344,091 | |
| Class D, 4.9484% 8/10/46 (b)(c) | 4,410,000 | 3,832,854 | |
| Series 2013-CR12 Class D, 5.2519% 10/10/46 (b)(c) | 7,745,000 | 6,405,172 | |
| Series 2013-CR6 Class F, 4.309% 3/10/46 (b)(c) | 1,727,000 | 1,118,146 | |
| Series 2013-CR9 Class D, 4.3972% 7/10/45 (b)(c) | 1,184,000 | 1,035,238 | |
| Series 2013-LC6 Class D, 4.426% 1/10/46 (b)(c) | 6,629,000 | 6,064,191 | |
| Series 2014-CR15 Class D, 4.9124% 2/10/47 (b)(c) | 1,273,000 | 1,144,083 | |
| Series 2014-CR17: | |||
| Class D, 4.9587% 5/10/47 (b)(c) | 3,728,000 | 3,282,393 | |
| Class E, 4.9587% 5/10/47 (b)(c) | 662,000 | 453,504 | |
| Series 2014-UBS2 Class D, 5.1819% 3/10/47 (b)(c) | 4,146,000 | 3,545,517 | |
| Series 2015-3BP Class F, 3.3463% 2/10/35 (b)(c) | 5,288,000 | 4,812,010 | |
| Series 2015-CR23 Class CME, 3.8073% 5/10/48 (b)(c) | 1,991,000 | 1,827,783 | |
| Series 2016-CD1 Class D, 2.7723% 8/10/49 (b)(c) | 2,782,000 | 2,109,775 | |
| Series 2017-CD4 Class D, 3.3% 5/10/50 (b) | 3,082,000 | 2,572,257 | |
| Commercial Mortgage Asset Trust Series 1999-C2: | |||
| Class G, 6% 11/17/32 | 1,089,846 | 1,109,123 | |
| Class H, 6% 11/17/32 (b) | 3,530,553 | 3,584,508 | |
| Commercial Mortgage Trust Series 2016-CD2: | |||
| Class C, 3.031% 11/10/49 | 1,500,000 | 1,525,482 | |
| Class D, 2.9159% 11/10/49 (c) | 2,017,000 | 1,610,447 | |
| Commercial Mortgage Trust pass-thru certificates: | |||
| Series 2012-CR2: | |||
| Class E, 5.002% 8/15/45 (b)(c) | 6,370,000 | 6,231,060 | |
| Class F, 4.25% 8/15/45 (b) | 7,900,000 | 6,335,375 | |
| Series 2014-CR2 Class G, 4.25% 8/15/45 (b) | 1,868,000 | 1,142,052 | |
| Core Industrial Trust: | |||
| Series 2015-CALW Class G, 3.9787% 2/10/34 (b)(c) | 3,107,000 | 3,038,458 | |
| Series 2015-TEXW Class F, 3.977% 2/10/34 (b)(c) | 2,080,000 | 2,011,493 | |
| Series 2015-WEST Class F, 4.3677% 2/10/37 (b)(c) | 6,476,000 | 6,155,226 | |
| Cosmopolitan Hotel Trust floater Series 2016-CSMO Class C, 3.639% 11/15/33 (b)(c) | 2,816,000 | 2,841,601 | |
| Credit Suisse First Boston Mortgage Securities Corp.: | |||
| Series 1998-C1: | |||
| Class F, 6% 5/17/40 (b) | 2,614,246 | 2,654,545 | |
| Class H, 6% 5/17/40 (b) | 2,501,042 | 1,967,623 | |
| Series 1998-C2 Class G, 6.75% 11/15/30 (b) | 976,403 | 989,165 | |
| CSMC Trust: | |||
| floater Series 2015-DEAL: | |||
| Class D, 4.089% 4/15/29 (b)(c) | 4,500,000 | 4,516,904 | |
| Class E, 4.989% 4/15/29 (b)(c) | 3,542,000 | 3,560,869 | |
| Class F, 5.739% 4/15/29 (b)(c) | 2,721,000 | 2,724,404 | |
| Series 2016-MFF Class F, 8.2439% 11/15/33 (b)(c) | 4,003,000 | 4,028,256 | |
| DBCCRE Mortgage Trust Series 2014-ARCP Class E, 5.099% 1/10/34 (b)(c) | 5,120,000 | 4,671,236 | |
| DBUBS Mortgage Trust: | |||
| Series 2011-LC1A: | |||
| Class D, 5.8706% 11/10/46 (b)(c) | 1,000,000 | 1,092,247 | |
| Class E, 5.8706% 11/10/46 (b)(c) | 8,929,000 | 9,504,232 | |
| Class F, 5.8706% 11/10/46 (b)(c) | 7,806,000 | 7,615,611 | |
| Class G, 4.652% 11/10/46 (b) | 9,378,000 | 8,254,684 | |
| Series 2011-LC3A Class D, 5.5102% 8/10/44 (b)(c) | 4,111,000 | 4,259,458 | |
| Deutsche Bank Commercial Mortgage Trust Series 2016-C3 Class C, 3.636% 9/10/49 (c) | 2,200,000 | 2,135,710 | |
| Freddie Mac: | |||
| pass-thru certificates Series K013 Class X3, 2.9089% 1/25/43 (c)(d) | 5,370,000 | 516,503 | |
| Series KAIV Class X2, 3.6147% 6/25/46 (c)(d) | 2,780,000 | 358,216 | |
| FREMF Mortgage Trust: | |||
| Series 2010-K9 Class B, 5.3625% 9/25/45 (b)(c) | 4,544,000 | 4,925,379 | |
| Series 2011-K10 Class B, 4.7902% 11/25/49 (b)(c) | 2,500,000 | 2,672,707 | |
| Series 2011-K11 Class B, 4.573% 12/25/48 (b)(c) | 3,190,000 | 3,395,901 | |
| GAHR Commercial Mortgage Trust Series 2015-NRF: | |||
| Class EFX, 3.4949% 12/15/34 (b)(c) | 6,500,000 | 6,494,459 | |
| Class FFX, 3.4949% 12/15/34 (b)(c) | 4,631,000 | 4,588,385 | |
| GE Capital Commercial Mortgage Corp. Series 2005-C3 Class J, 5.2715% 7/10/45 (b)(c) | 887,600 | 559,299 | |
| GMAC Commercial Mortgage Securities, Inc.: | |||
| Series 1997-C1 Class H, 6.6% 7/15/29 | 1,265,970 | 1,229,329 | |
| Series 1997-C2: | |||
| Class G, 6.75% 4/15/29 (c) | 661,661 | 666,446 | |
| Class H, 6.75% 4/15/29 (c) | 6,130,384 | 4,738,075 | |
| Series 1999-C2I Class K, 6.481% 9/15/33 | 7,875,000 | 7,178,733 | |
| GP Portfolio Trust Series 2014-GPP: | |||
| Class D, 3.9944% 2/15/27 (b)(c) | 2,691,000 | 2,697,788 | |
| Class E, 5.0944% 2/15/27 (b)(c) | 1,717,000 | 1,672,325 | |
| Grace Mortgage Trust Series 2014-GRCE Class F, 3.7098% 6/10/28 (b)(c) | 1,491,000 | 1,491,017 | |
| GS Mortgage Securities Corp. II Series 2010-C1: | |||
| Class D, 6.1674% 8/10/43 (b)(c) | 2,450,000 | 2,545,451 | |
| Class E, 4% 8/10/43 (b) | 5,951,000 | 5,667,631 | |
| Class F, 4% 8/10/43 (b) | 3,909,000 | 3,356,384 | |
| GS Mortgage Securities Trust: | |||
| Series 2010-C2 Class D, 5.3563% 12/10/43 (b)(c) | 4,100,000 | 4,158,548 | |
| Series 2011-GC3 Class D, 5.8201% 3/10/44 (b)(c) | 1,239,000 | 1,297,149 | |
| Series 2011-GC5: | |||
| Class C, 5.5657% 8/10/44 (b)(c) | 5,010,000 | 5,290,741 | |
| Class D, 5.5657% 8/10/44 (b)(c) | 7,012,000 | 6,746,604 | |
| Class E, 5.5657% 8/10/44 (b)(c) | 2,919,000 | 2,320,419 | |
| Class F, 4.5% 8/10/44 (b) | 4,500,000 | 3,041,078 | |
| Series 2012-GC6: | |||
| Class D, 5.8407% 1/10/45 (b)(c) | 3,529,000 | 3,398,276 | |
| Class E, 5% 1/10/45 (b)(c) | 1,822,000 | 1,549,319 | |
| Series 2012-GC6I Class F, 5% 1/10/45 (c) | 1,810,000 | 1,173,347 | |
| Series 2012-GCJ7: | |||
| Class C, 5.889% 5/10/45 (c) | 5,830,000 | 6,148,023 | |
| Class D, 5.889% 5/10/45 (b)(c) | 10,512,500 | 10,329,991 | |
| Class E, 5% 5/10/45 (b) | 6,263,000 | 5,046,299 | |
| Class F, 5% 5/10/45 (b) | 8,442,000 | 5,375,363 | |
| Series 2012-GCJ9 Class D, 5.0129% 11/10/45 (b)(c) | 4,788,000 | 4,563,993 | |
| Series 2013-GC12 Class D, 4.584% 6/10/46 (b)(c) | 1,043,000 | 934,727 | |
| Series 2013-GC13 Class D, 4.2029% 7/10/46 (b)(c) | 6,567,000 | 6,074,570 | |
| Series 2013-GC16: | |||
| Class D, 5.4975% 11/10/46 (b)(c) | 4,709,000 | 4,490,331 | |
| Class F, 3.5% 11/10/46 (b) | 3,037,000 | 2,091,368 | |
| Series 2016-GS2 Class C, 4.6809% 5/10/49 (c) | 2,959,000 | 3,188,770 | |
| Series 2016-GS3 Class D, 2.728% 10/10/49 (b) | 7,306,000 | 5,600,336 | |
| Series 2016-REMZ Class MZB, 7.727% 2/10/21 (b) | 4,683,000 | 4,539,925 | |
| Series 2016-RENT: | |||
| Class E, 4.2022% 2/10/29 (b)(c) | 2,050,000 | 2,048,179 | |
| Class F, 4.2022% 2/10/29 (b)(c) | 6,374,000 | 5,980,021 | |
| Series 2017-GS6 Class D, 3.331% 5/10/50 (b) | 4,414,000 | 3,554,451 | |
| Hilton U.S.A. Trust: | |||
| floater Series 2014-ORL Class E, 4.2439% 7/15/29 (b)(c) | 2,884,000 | 2,896,496 | |
| Series 2016-HHV Class F, 4.3333% 11/5/38 (b)(c) | 4,500,000 | 3,534,518 | |
| Series 2016-SFP Class F, 6.0801% 11/5/35 (b) | 2,207,000 | 2,199,823 | |
| JPMBB Commercial Mortgage Securities Trust: | |||
| Series 2014-C22 Class D, 4.7116% 9/15/47 (b)(c) | 2,472,000 | 2,081,614 | |
| Series 2014-C26 Class D, 4.0689% 1/15/48 (b)(c) | 2,796,000 | 2,363,461 | |
| Series 2015-C32 Class C, 4.8181% 11/15/48 (c) | 8,179,000 | 7,901,742 | |
| JPMCC Commercial Mortgage Securities Trust Series 2016-JP4 Class D, 3.4619% 12/15/49 (b) | 1,147,000 | 889,843 | |
| JPMDB Commercial Mortgage Securities Trust Series 2016-C4 Class D, 3.2248% 12/15/49 (b)(c) | 4,642,000 | 3,571,502 | |
| JPMorgan Chase Commercial Mortgage Securities Corp.: | |||
| Series 2003-C1 Class F, 5.4363% 1/12/37 (b)(c) | 787,559 | 783,960 | |
| Series 2009-IWST: | |||
| Class C, 7.6935% 12/5/27 (b)(c) | 2,260,000 | 2,548,088 | |
| Class D, 7.6935% 12/5/27 (b)(c) | 10,670,000 | 11,860,892 | |
| Series 2010-CNTR Class D, 6.3899% 8/5/32 (b)(c) | 4,170,000 | 4,523,785 | |
| Series 2012-CBX: | |||
| Class D, 5.3877% 6/16/45 (b)(c) | 4,050,000 | 4,148,875 | |
| Class E, 5.3877% 6/15/45 (b)(c) | 3,618,000 | 3,650,249 | |
| Class F, 4% 6/15/45 (b) | 4,494,000 | 3,570,899 | |
| Class G 4% 6/15/45 (b) | 4,957,000 | 3,047,527 | |
| JPMorgan Chase Commercial Mortgage Securities Trust: | |||
| Series 2004-CBX Class D, 5.097% 1/12/37 (c) | 1,215,000 | 1,254,192 | |
| Series 2005-LDP2: | |||
| Class E, 4.981% 7/15/42 (c) | 1,827,000 | 1,849,893 | |
| Class F, 5.01% 7/15/42 (c) | 811,000 | 818,436 | |
| Series 2011-C3: | |||
| Class E, 5.8007% 2/15/46 (b)(c) | 2,903,000 | 2,946,157 | |
| Class H, 4.409% 2/15/46 (b)(c) | 3,147,000 | 2,221,794 | |
| Series 2011-C4: | |||
| Class E, 5.5344% 7/15/46 (b)(c) | 6,160,000 | 6,361,184 | |
| Class F, 3.873% 7/15/46 (b) | 555,000 | 463,855 | |
| Class H, 3.873% 7/15/46 (b) | 3,221,000 | 2,229,240 | |
| Class NR, 3.873% 7/15/46 (b) | 1,588,500 | 944,740 | |
| Class TAC1, 7.99% 7/15/46 (b) | 3,064,781 | 3,078,076 | |
| Class TAC2, 7.99% 7/15/46 (b) | 3,196,000 | 3,182,343 | |
| Series 2011-C5: | |||
| Class C, 5.5878% 8/15/46 (b)(c) | 5,803,234 | 6,294,251 | |
| Class D, 5.5878% 8/15/46 (b)(c) | 2,000,000 | 2,039,235 | |
| Series 2013-LC11: | |||
| Class C, 3.9582% 4/15/46 (c) | 201,000 | 199,896 | |
| Class D, 4.4021% 4/15/46 (c) | 4,395,000 | 4,023,135 | |
| Class E, 3.25% 4/15/46 (b)(c) | 104,000 | 75,519 | |
| Class F, 3.25% 4/15/46 (b)(c) | 7,077,000 | 3,989,191 | |
| Series 2014-DSTY: | |||
| Class D, 3.9314% 6/10/27 (b)(c) | 3,858,000 | 3,661,419 | |
| Class E, 3.9314% 6/10/27 (b)(c) | 4,173,000 | 3,909,115 | |
| Series 2015-UES Class F, 3.7417% 9/5/32 (b)(c) | 5,061,000 | 4,921,321 | |
| JPMorgan Commercial Mortgage Finance Corp. Series 1999-C8 Class H, 6% 7/15/31 (b) | 239,275 | 201,707 | |
| Ladder Capital Commercial Mortgage Securities Trust Series 2014-909 Class E, 4.0278% 5/15/31 (b)(c) | 5,117,000 | 5,024,715 | |
| LB Commercial Conduit Mortgage Trust Series 1998-C1 Class K, 6.3% 2/18/30 (b) | 1,013,282 | 852,902 | |
| Liberty Street Trust Series 2016-225L: | |||
| Class D, 4.8035% 2/10/36 (b)(c) | 2,459,000 | 2,629,897 | |
| Class E, 4.8035% 2/10/36 (b)(c) | 2,478,000 | 2,508,428 | |
| LSTAR Commercial Mortgage Trust Series 2014-2: | |||
| Class D, 5.0051% 1/20/41 (b)(c) | 1,228,000 | 1,231,522 | |
| Class E, 5.0051% 1/20/41 (b)(c) | 1,913,000 | 1,756,888 | |
| Mach One Trust LLC Series 2004-1A: | |||
| Class L, 5.45% 5/28/40 (b)(c) | 1,393,000 | 1,369,500 | |
| Class M, 5.45% 5/28/40 (b)(c) | 1,533,000 | 1,434,788 | |
| Merrill Lynch Mortgage Investors Trust Series 1997-C2 Class F, 6.25% 12/10/29 (c) | 1,396,665 | 1,392,601 | |
| Merrill Lynch Mortgage Trust Series 2006-C1 Class AJ, 5.7513% 5/12/39 (c) | 2,377,502 | 2,375,141 | |
| Mezz Capital Commercial Mortgage Trust: | |||
| Series 2004-C1 Class IO, 9.321% 1/15/37 (b)(c)(d) | 17,571 | 903 | |
| Series 2004-C2 Class D, 7.347% 10/15/40 (b) | 691,578 | 345,789 | |
| Morgan Stanley BAML Trust: | |||
| sequential payer Series 2014-C18 Class 300E, 4.6896% 8/15/31 (b) | 2,000,000 | 1,935,866 | |
| Series 2012-C6 Class D, 4.8018% 11/15/45 (b)(c) | 4,361,000 | 4,364,631 | |
| Series 2013-C12 Class D, 4.9235% 10/15/46 (b)(c) | 4,000,000 | 3,750,454 | |
| Series 2013-C13: | |||
| Class D, 5.0535% 11/15/46 (b)(c) | 5,023,000 | 4,787,795 | |
| Class E, 5.0535% 11/15/46 (b)(c) | 2,000,000 | 1,548,140 | |
| Series 2013-C7: | |||
| Class D, 4.3981% 2/15/46 (b)(c) | 5,751,000 | 5,345,268 | |
| Class E, 4.3981% 2/15/46 (b)(c) | 1,580,000 | 1,188,202 | |
| Series 2013-C8 Class D, 4.1969% 12/15/48 (b)(c) | 2,260,000 | 2,050,196 | |
| Series 2013-C9: | |||
| Class C, 4.2041% 5/15/46 (c) | 3,784,000 | 3,823,835 | |
| Class D, 4.2921% 5/15/46 (b)(c) | 5,331,000 | 4,907,689 | |
| Series 2016-C30: | |||
| Class C, 4.2709% 9/15/49 (c) | 1,722,000 | 1,709,091 | |
| Class D, 3% 9/15/49 (b) | 1,879,000 | 1,406,403 | |
| Series 2016-C31 Class D, 3% 11/15/49 (b)(c) | 2,945,000 | 2,099,950 | |
| Series 2016-C32: | |||
| Class C, 4.296% 12/15/49 | 2,000,000 | 2,032,044 | |
| Class D, 3.396% 12/15/49 (b) | 3,703,000 | 2,738,420 | |
| Series 2017-C33 Class D, 3.25% 5/15/50 (b) | 3,520,000 | 2,815,711 | |
| Morgan Stanley Capital I Trust: | |||
| sequential payer Series 2012-C4 Class E, 5.6015% 3/15/45 (b)(c) | 5,018,000 | 4,528,443 | |
| Series 1997-RR Class F, 7.51% 4/30/39 (b)(c) | 176,335 | 176,070 | |
| Series 1998-CF1 Class G, 7.35% 7/15/32 (b) | 1,098,551 | 1,082,250 | |
| Series 1999-CAM1: | |||
| Class M, 6.54% 3/15/32 (b) | 31,813 | 31,616 | |
| Class N, 6.54% 3/15/32 (b) | 39,157 | 39,174 | |
| Series 1999-WF1: | |||
| Class N, 5.91% 11/15/31 (b) | 1,600,000 | 1,588,119 | |
| Class O, 5.91% 11/15/31 (b) | 1,199,225 | 1,037,122 | |
| Series 2004-IQ7 Class G, 5.2791% 6/15/38 (b)(c) | 1,140,000 | 1,152,093 | |
| Series 2011-C1: | |||
| Class C, 5.6003% 9/15/47 (b)(c) | 2,050,000 | 2,247,549 | |
| Class D, 5.6003% 9/15/47 (b)(c) | 10,522,000 | 11,338,178 | |
| Class E, 5.6003% 9/15/47 (b)(c) | 1,500,000 | 1,607,133 | |
| Series 2011-C2: | |||
| Class D, 5.6658% 6/15/44 (b)(c) | 6,316,000 | 6,576,042 | |
| Class E, 5.6658% 6/15/44 (b)(c) | 4,900,000 | 4,648,829 | |
| Class F, 5.6658% 6/15/44 (b)(c) | 3,620,000 | 3,085,580 | |
| Series 2011-C3: | |||
| Class C, 5.3268% 7/15/49 (b)(c) | 1,920,000 | 2,067,615 | |
| Class D, 5.3268% 7/15/49 (b)(c) | 7,530,000 | 7,779,601 | |
| Class E, 5.3268% 7/15/49 (b)(c) | 3,029,000 | 3,030,894 | |
| Class G, 5.3268% 7/15/49 (b)(c) | 4,040,000 | 3,399,011 | |
| Series 2012-C4: | |||
| Class D, 5.6015% 3/15/45 (b)(c) | 1,950,000 | 2,021,535 | |
| Class F, 3.07% 3/15/45 (b) | 1,500,000 | 1,062,859 | |
| Series 2014-150E: | |||
| Class C, 4.4382% 9/9/32 (b)(c) | 2,867,000 | 3,051,505 | |
| Class F, 4.4382% 9/9/32 (b)(c) | 2,900,000 | 2,665,731 | |
| Series 2014-CPT Class F, 3.5604% 7/13/29 (b)(c) | 4,412,000 | 4,378,205 | |
| Series 2015-MS1: | |||
| Class C, 4.1641% 5/15/48 (c) | 3,074,000 | 2,955,206 | |
| Class D, 4.1641% 5/15/48 (b)(c) | 3,750,000 | 3,197,969 | |
| Series 2015-UBS8 Class D, 3.18% 12/15/48 (b) | 3,409,000 | 2,682,291 | |
| Series 2016-BNK2 Class C, 3% 11/15/49 (b) | 5,410,000 | 4,356,155 | |
| Morgan Stanley Dean Witter Capital I Trust Series 2001-TOP3 Class E, 7.8267% 7/15/33 (b)(c) | 808,833 | 841,925 | |
| Motel 6 Trust Series 2015-MTL6: | |||
| Class E, 5.2785% 2/5/30 (b) | 9,506,000 | 9,540,474 | |
| Class F, 5% 2/5/30 (b) | 3,564,000 | 3,523,639 | |
| MSCG Trust Series 2016-SNR: | |||
| Class D, 6.55% 11/15/34 (b) | 8,760,000 | 8,724,858 | |
| Class E, 6.8087% 11/15/34 (b) | 2,439,000 | 2,332,958 | |
| MSJP Commercial Securities Mortgage Trust Series 2015-HAUL Class E, 5.0127% 9/5/47 (b)(c) | 1,217,000 | 1,169,774 | |
| NationsLink Funding Corp. Series 1999-LTL1 Class D, 6.45% 1/22/26 (b) | 2,213,413 | 2,236,352 | |
| Providence Place Group Ltd. Partnership Series 2000-C1 Class A2, 7.75% 7/20/28 (b) | 2,733,679 | 3,335,089 | |
| Real Estate Asset Liquidity Trust: | |||
| Series 2006-2: | |||
| Class J, 4.456% 9/12/38 (b) | CAD | 293,152 | 214,173 |
| Class K, 4.456% 9/12/38 (b) | CAD | 195,000 | 141,098 |
| Class L, 4.456% 9/12/38 (b) | CAD | 281,000 | 199,272 |
| Class M, 4.456% 9/12/38 (b) | CAD | 1,134,647 | 777,248 |
| Series 2007-1: | |||
| Class F, 4.57% 4/12/23 | CAD | 1,515,000 | 1,120,955 |
| Class G, 4.57% 4/12/23 | CAD | 505,000 | 373,465 |
| Class H, 4.57% 4/12/23 | CAD | 505,000 | 373,278 |
| Class J, 4.57% 4/12/23 | CAD | 505,000 | 373,091 |
| Class K, 4.57% 4/12/23 | CAD | 253,000 | 186,821 |
| Class L, 4.57% 4/12/23 | CAD | 757,000 | 558,286 |
| Class M, 4.57% 4/12/23 | CAD | 1,864,935 | 1,341,798 |
| SCG Trust Series 2013-SRP1 Class D, 4.3328% 11/15/26 (b)(c) | 6,931,000 | 6,558,529 | |
| Starwood Retail Property Trust Series 2014-STAR Class D, 4.2439% 11/15/27 (b)(c) | 5,526,000 | 5,300,754 | |
| TIAA Seasoned Commercial Mortgage Trust: | |||
| sequential payer Series 2007-C4 Class AJ, 5.4745% 8/15/39 (c) | 450,265 | 454,673 | |
| Series 2007-C4 Class F, 5.4745% 8/15/39 (c) | 5,345,000 | 4,910,943 | |
| UBS Commercial Mortgage Trust Series 2012-C1: | |||
| Class D, 5.7307% 5/10/45 (b)(c) | 5,491,000 | 5,556,344 | |
| Class E, 5% 5/10/45 (b)(c) | 2,294,000 | 1,933,426 | |
| Class F, 5% 5/10/45 (b)(c) | 2,982,000 | 2,038,537 | |
| UBS-BAMLL Trust: | |||
| Series 12-WRM Class D, 4.238% 6/10/30 (b)(c) | 1,550,000 | 1,531,698 | |
| Series 2012-WRM Class C, 4.238% 6/10/30 (b)(c) | 1,000,000 | 990,824 | |
| Wells Fargo Commercial Mortgage Trust: | |||
| Series 2010-C1 Class XB, 0.6769% 11/15/43 (b)(c)(d) | 26,055,541 | 488,687 | |
| Series 2012-LC5 Class D, 4.9345% 10/15/45 (b)(c) | 6,749,000 | 6,527,459 | |
| Series 2013-LC12 Class C, 4.4311% 7/15/46 (c) | 3,238,000 | 3,280,727 | |
| Series 2015-NXS4 Class E, 3.7548% 12/15/48 (b)(c) | 2,457,000 | 1,799,759 | |
| Series 2016-BNK1 Class D, 3% 8/15/49 (b) | 1,832,000 | 1,478,185 | |
| Series 2016-C35 Class D, 3.142% 7/15/48 (b) | 6,557,000 | 4,654,895 | |
| Series 2016-LC25 Class C, 4.5845% 12/15/59 (c) | 2,200,000 | 2,176,057 | |
| Series 2016-NXS6 Class D, 3.059% 11/15/49 (b) | 5,102,000 | 3,612,945 | |
| Series 2017-RB1 Class D, 3.401% 3/15/50 (b) | 2,189,000 | 1,771,796 | |
| WF-RBS Commercial Mortgage Trust: | |||
| sequential payer Series 2011-C4I Class G, 5% 6/15/44 (b) | 1,502,600 | 997,098 | |
| Series 2011-C3: | |||
| Class C, 5.335% 3/15/44 (b) | 2,240,000 | 2,383,361 | |
| Class D, 5.813% 3/15/44 (b)(c) | 3,984,000 | 3,669,307 | |
| Class E, 5% 3/15/44 (b) | 1,510,000 | 1,342,401 | |
| Class F, 5% 3/15/44 (b) | 2,907,350 | 1,993,682 | |
| Series 2011-C4: | |||
| Class D, 5.4145% 6/15/44 (b)(c) | 1,940,000 | 1,978,722 | |
| Class E, 5.4145% 6/15/44 (b)(c) | 2,554,000 | 2,469,930 | |
| Series 2011-C5: | |||
| Class C, 5.8614% 11/15/44 (b)(c) | 1,670,000 | 1,844,587 | |
| Class D, 5.8614% 11/15/44 (b)(c) | 3,575,000 | 3,827,665 | |
| Class E, 5.8614% 11/15/44 (b)(c) | 4,450,655 | 4,569,793 | |
| Class F, 5.25% 11/15/44 (b)(c) | 4,587,000 | 3,959,214 | |
| Class G, 5.25% 11/15/44 (b)(c) | 1,507,150 | 1,212,814 | |
| Series 2012-C10: | |||
| Class E, 4.6014% 12/15/45 (b)(c) | 5,765,000 | 4,289,660 | |
| Class F, 4.6014% 12/15/45 (b)(c) | 7,537,000 | 4,031,451 | |
| Series 2012-C6 Class D, 5.7606% 4/15/45 (b)(c) | 3,250,000 | 3,274,199 | |
| Series 2012-C7: | |||
| Class C, 4.9881% 6/15/45 (c) | 3,793,000 | 3,844,149 | |
| Class E, 4.9881% 6/15/45 (b)(c) | 4,374,000 | 3,703,047 | |
| Class F, 4.5% 6/15/45 (b) | 1,765,000 | 1,289,535 | |
| Class G, 4.5% 6/15/45 (b) | 5,063,750 | 3,115,427 | |
| Series 2012-C8: | |||
| Class D, 5.0634% 8/15/45 (b)(c) | 1,000,000 | 996,247 | |
| Class E, 5.0634% 8/15/45 (b)(c) | 1,400,000 | 1,359,430 | |
| Series 2013-C11: | |||
| Class D, 4.3468% 3/15/45 (b)(c) | 2,240,000 | 2,036,549 | |
| Class E, 4.3468% 3/15/45 (b)(c) | 6,000,000 | 4,532,474 | |
| Series 2013-C13 Class D, 4.1386% 5/15/45 (b)(c) | 1,800,000 | 1,665,186 | |
| Series 2013-C16 Class D, 5.147% 9/15/46 (b)(c) | 801,000 | 772,747 | |
| Series 2013-UBS1 Class D, 4.7801% 3/15/46 (b)(c) | 3,168,000 | 2,974,709 | |
| WFCG Commercial Mortgage Trust floater Series 2015-BXRP: | |||
| Class F, 4.7142% 11/15/29 (b)(c) | 4,379,481 | 4,390,486 | |
| Class G, 4.0139% 11/15/29 (b)(c) | 1,867,968 | 1,833,384 | |
| WP Glimcher Mall Trust Series 2015-WPG: | |||
| Class PR1, 3.516% 6/5/35 (b)(c) | 1,218,000 | 957,696 | |
| Class PR2, 3.6332% 6/5/35 (b)(c) | 5,227,000 | 3,795,978 | |
| TOTAL COMMERCIAL MORTGAGE SECURITIES | |||
| (Cost $823,017,992) | 833,971,124 | ||
| Shares | Value | ||
| Common Stocks - 0.2% | |||
| Homebuilders/Real Estate - 0.2% | |||
| Store Capital Corp. | |||
| (Cost $2,042,875) | 100,000 | 2,038,000 | |
| Preferred Stocks - 3.5% | |||
| Convertible Preferred Stocks - 0.4% | |||
| Homebuilders/Real Estate - 0.2% | |||
| Alexandria Real Estate Equities, Inc. Series D, 7.00% | 64,000 | 2,278,400 | |
| Hotels - 0.2% | |||
| FelCor Lodging Trust, Inc. Series A, 1.95% | 84,700 | 2,181,872 | |
| TOTAL CONVERTIBLE PREFERRED STOCKS | 4,460,272 | ||
| Nonconvertible Preferred Stocks - 3.1% | |||
| Diversified Financial Services - 0.2% | |||
| American Homes 4 Rent Series D, 6.50% | 103,400 | 2,647,040 | |
| Homebuilders/Real Estate - 2.9% | |||
| Annaly Capital Management, Inc.: | |||
| Series A, 7.875% | 108,781 | 2,820,691 | |
| Series C, 7.625% | 48,000 | 1,213,920 | |
| CBL & Associates Properties, Inc. Series D, 7.375% | 129,000 | 2,927,010 | |
| Cedar Shopping Centers, Inc. Series B, 7.25% | 30,000 | 752,700 | |
| Corporate Office Properties Trust Series L, 7.375% | 71,383 | 1,807,418 | |
| CYS Investments, Inc. Series B, 7.50% | 80,500 | 1,952,125 | |
| DDR Corp. Series K, 6.25% | 90,662 | 2,265,643 | |
| Equity Lifestyle Properties, Inc. Series C, 6.75% | 161,628 | 4,139,293 | |
| MFA Financial, Inc. Series B, 7.50% | 96,700 | 2,456,180 | |
| Public Storage: | |||
| Series F 5.15% | 47,700 | 1,184,391 | |
| Series S, 5.90% | 50,000 | 1,266,000 | |
| Retail Properties America, Inc. Series A, 7.00% | 135,649 | 3,430,563 | |
| Sun Communities, Inc. Series A, 7.125% | 149,435 | 3,824,042 | |
| Taubman Centers, Inc. Series J, 6.50% | 66,277 | 1,683,436 | |
| 31,723,412 | |||
| TOTAL NONCONVERTIBLE PREFERRED STOCKS | 34,370,452 | ||
| TOTAL PREFERRED STOCKS | |||
| (Cost $37,225,850) | 38,830,724 | ||
| Principal Amount | Value | ||
| Bank Loan Obligations - 4.3% | |||
| Diversified Financial Services - 0.5% | |||
| Extell Boston 5.154% 8/31/21 (c) | 5,033,890 | 5,053,522 | |
| Food & Drug Retail - 0.4% | |||
| Albertson's LLC Tranche B 5LN, term loan 4.4013% 12/21/22 (c) | 4,213,615 | 4,241,256 | |
| Homebuilders/Real Estate - 1.9% | |||
| Americold Realty Operating Partnership LP Tranche B, term loan 4.7947% 12/1/22 (c) | 3,758,898 | 3,798,855 | |
| Capital Automotive LP: | |||
| Trahche B 1LN, term loan 4.0294% 3/24/24 (c) | 685,000 | 690,350 | |
| Tranch 2LN, term loan 7.0294% 3/24/25 (c) | 3,675,000 | 3,748,500 | |
| DTZ U.S. Borrower LLC Tranche B 1LN, term loan 4.3431% 11/4/21 (c) | 2,400,567 | 2,406,016 | |
| iStar Financial, Inc. Tranche B, term loan 4.75% 7/1/20 (c) | 5,134,838 | 5,192,605 | |
| Simply Storage Management LLC 8.2375% 9/6/21 (c) | 5,530,000 | 5,530,000 | |
| TOTAL HOMEBUILDERS/REAL ESTATE | 21,366,326 | ||
| Hotels - 1.3% | |||
| ESH Hospitality, Inc. Tranche B, term loan 3.5447% 8/30/23 (c) | 2,145,181 | 2,156,636 | |
| Hilton Worldwide Finance LLC Tranche B 2LN, term loan 3.0236% 10/25/23 (c) | 4,869,297 | 4,896,419 | |
| La Quinta Intermediate Holdings LLC Tranche B LN, term loan 3.9084% 4/14/21 (c) | 5,859,485 | 5,890,013 | |
| Playa Resorts Holding BV Tranche B, term loan 4.1704% 4/27/24 (c) | 575,000 | 576,029 | |
| Ryman Hospitality Properties, Inc. Tranche B, term loan 3.44% 5/11/24 (c) | 1,185,000 | 1,190,190 | |
| TOTAL HOTELS | 14,709,287 | ||
| Super Retail - 0.2% | |||
| JC Penney Corp., Inc. Tranche B, term loan 5.4504% 6/23/23 (c) | 2,320,656 | 2,289,722 | |
| TOTAL BANK LOAN OBLIGATIONS | |||
| (Cost $47,327,797) | 47,660,113 | ||
| Preferred Securities - 0.0% | |||
| Homebuilders/Real Estate - 0.0% | |||
| Crest Clarendon Street 2002-1 Ltd. Series 2002-1A Class PS, 12/28/35 (b) | 3,000,000 | 1,500 | |
| Crest Dartmouth Street 2003 1 Ltd. Series 2003-1A Class PS, 6/28/38 (b) | 3,100,000 | 310 | |
| TOTAL PREFERRED SECURITIES | |||
| (Cost $6,004,704) | 1,810 | ||
| Shares | Value | ||
| Money Market Funds - 8.6% | |||
| Fidelity Cash Central Fund, 0.86% (f) | |||
| (Cost $94,448,687) | 94,428,646 | 94,447,532 | |
| TOTAL INVESTMENT PORTFOLIO - 99.8% | |||
| (Cost $1,098,222,960) | 1,097,900,660 | ||
| NET OTHER ASSETS (LIABILITIES) - 0.2% | 1,750,701 | ||
| NET ASSETS - 100% | $1,099,651,361 |
Currency Abbreviations
CAD – Canadian dollar
Legend
(a) Amount is stated in United States dollars unless otherwise noted.
(b) Security exempt from registration under Rule 144A of the Securities Act of 1933. These securities may be resold in transactions exempt from registration, normally to qualified institutional buyers. At the end of the period, the value of these securities amounted to $788,678,443 or 71.7% of net assets.
(c) Coupon rates for floating and adjustable rate securities reflect the rates in effect at period end.
(d) Security represents right to receive monthly interest payments on an underlying pool of mortgages or assets. Principal shown is the outstanding par amount of the pool as of the end of the period.
(e) Restricted securities - Investment in securities not registered under the Securities Act of 1933 (excluding 144A issues). At the end of the period, the value of restricted securities (excluding 144A issues) amounted to $123,238 or 0.0% of net assets.
(f) Affiliated fund that is generally available only to investment companies and other accounts managed by Fidelity Investments. The rate quoted is the annualized seven-day yield of the fund at period end. A complete unaudited listing of the fund's holdings as of its most recent quarter end is available upon request. In addition, each Fidelity Central Fund's financial statements, which are not covered by the Fund's Report of Independent Registered Public Accounting Firm, are available on the SEC's website or upon request.
Additional information on each restricted holding is as follows:
| Security | Acquisition Date | Acquisition Cost |
| Fannie Mae REMIC Trust Series 2001-W3 subordinate REMIC pass thru certificates, Class B3, 7% 9/25/41 | 5/21/03 | $77,917 |
| Fannie Mae REMIC Trust Series 2003-W1 subordinate REMIC pass thru certificates, Class B3, 3.8892% 12/25/42 | 3/25/03 | $132,073 |
| Fannie Mae REMIC Trust Series 2003-W10 subordinate REMIC pass thru certificates, Class 2B4, 3.3523% 6/25/43 | 9/29/03 | $79,512 |
| Fannie Mae REMIC Trust Series 2003-W10 subordinate REMIC pass thru certificates, Class 2B5, 3.3523% 6/25/43 | 9/29/03 | $8,199 |
Affiliated Central Funds
Information regarding fiscal year to date income earned by the Fund from investments in Fidelity Central Funds is as follows:
| Fund | Income earned |
| Fidelity Cash Central Fund | $227,688 |
| Total | $227,688 |
Investment Valuation
The following is a summary of the inputs used, as of May 31, 2017, involving the Fund's assets and liabilities carried at fair value. The inputs or methodology used for valuing securities may not be an indication of the risk associated with investing in those securities. For more information on valuation inputs, and their aggregation into the levels used below, please refer to the Investment Valuation section in the accompanying Notes to Financial Statements.
| Valuation Inputs at Reporting Date: | ||||
| Description | Total | Level 1 | Level 2 | Level 3 |
| Investments in Securities: | ||||
| Equities: | ||||
| Financials | $8,442,916 | $8,442,916 | $-- | $-- |
| Real Estate | 32,425,808 | 32,425,808 | -- | -- |
| Corporate Bonds | 50,224,866 | -- | 50,224,866 | -- |
| Asset-Backed Securities | 18,471,869 | -- | 17,434,348 | 1,037,521 |
| Collateralized Mortgage Obligations | 12,254,622 | -- | 11,977,903 | 276,719 |
| Commercial Mortgage Securities | 833,971,124 | -- | 829,144,508 | 4,826,616 |
| Bank Loan Obligations | 47,660,113 | -- | 42,130,113 | 5,530,000 |
| Preferred Securities | 1,810 | -- | -- | 1,810 |
| Money Market Funds | 94,447,532 | 94,447,532 | -- | -- |
| Total Investments in Securities: | $1,097,900,660 | $135,316,256 | $950,911,738 | $11,672,666 |
The following is a reconciliation of Investments in Securities for which Level 3 inputs were used in determining value:
| Investments in Securities: | |
| Commercial Mortgage Securities | |
| Beginning Balance | $26,457,073 |
| Net Realized Gain (Loss) on Investment Securities | (525,802) |
| Net Unrealized Gain (Loss) on Investment Securities | 774,801 |
| Cost of Purchases | -- |
| Proceeds of Sales | (3,752,622) |
| Amortization/Accretion | 113,062 |
| Transfers into Level 3 | 3,007,944 |
| Transfers out of Level 3 | (21,247,840) |
| Ending Balance | $4,826,616 |
| The change in unrealized gain (loss) for the period attributable to Level 3 securities held at May 31, 2017 | $176,507 |
| Other Investments in Securities | |
| Beginning Balance | $6,283,231 |
| Net Realized Gain (Loss) on Investment Securities | (32,978) |
| Net Unrealized Gain (Loss) on Investment Securities | 840,466 |
| Cost of Purchases | 363,224 |
| Proceeds of Sales | (98,525) |
| Amortization/Accretion | (324,192) |
| Transfers into Level 3 | 13,631 |
| Transfers out of Level 3 | (198,807) |
| Ending Balance | $6,846,050 |
| The change in unrealized gain (loss) for the period attributable to Level 3 securities held at May 31, 2017 | $840,469 |
The information used in the above reconciliations represents fiscal year to date activity for any Investments in Securities identified as using Level 3 inputs at either the beginning or the end of the current fiscal period. Transfers into Level 3 were attributable to a lack of observable market data resulting from decreases in market activity, decreases in liquidity, security restructurings or corporate actions. Transfers out of Level 3 were attributable to observable market data becoming available for those securities. Transfers in or out of Level 3 represent the beginning value of any Security or Instrument where a change in the pricing level occurred from the beginning to the end of the period. The cost of purchases and the proceeds of sales may include securities received or delivered through corporate actions or exchanges. Realized and unrealized gains (losses) disclosed in the reconciliations are included in Net Gain (Loss) on the Fund's Statement of Operations.
See accompanying notes which are an integral part of the financial statements.
Financial Statements
Statement of Assets and Liabilities
| May 31, 2017 | ||
| Assets | ||
| Investment in securities, at value — See accompanying schedule: Unaffiliated issuers (cost $1,003,774,273) | $1,003,453,128 | |
| Fidelity Central Funds (cost $94,448,687) | 94,447,532 | |
| Total Investments (cost $1,098,222,960) | $1,097,900,660 | |
| Cash | 478,832 | |
| Receivable for investments sold | 2,233 | |
| Dividends receivable | 121,744 | |
| Interest receivable | 4,556,834 | |
| Distributions receivable from Fidelity Central Funds | 58,704 | |
| Prepaid expenses | 340 | |
| Total assets | 1,103,119,347 | |
| Liabilities | ||
| Payable for investments purchased | $2,374,542 | |
| Distributions payable | 230,674 | |
| Accrued management fee | 635,285 | |
| Other affiliated payables | 50,888 | |
| Other payables and accrued expenses | 176,597 | |
| Total liabilities | 3,467,986 | |
| Net Assets | $1,099,651,361 | |
| Net Assets consist of: | ||
| Paid in capital | $1,128,737,198 | |
| Undistributed net investment income | 3,090,176 | |
| Accumulated undistributed net realized gain (loss) on investments and foreign currency transactions | (31,853,852) | |
| Net unrealized appreciation (depreciation) on investments and assets and liabilities in foreign currencies | (322,161) | |
| Net Assets, for 127,412,397 shares outstanding | $1,099,651,361 | |
| Net Asset Value, offering price and redemption price per share ($1,099,651,361 ÷ 127,412,397 shares) | $8.63 |
See accompanying notes which are an integral part of the financial statements.
Statement of Operations
| Six months ended May 31, 2017 | ||
| Investment Income | ||
| Dividends | $1,588,146 | |
| Interest | 29,962,943 | |
| Income from Fidelity Central Funds | 227,688 | |
| Total income | 31,778,777 | |
| Expenses | ||
| Management fee | $3,725,436 | |
| Transfer agent fees | 78,823 | |
| Accounting fees and expenses | 220,248 | |
| Custodian fees and expenses | 12,963 | |
| Independent trustees' fees and expenses | 2,094 | |
| Audit | 177,630 | |
| Legal | 5,371 | |
| Miscellaneous | 5,115 | |
| Total expenses before reductions | 4,227,680 | |
| Expense reductions | (4,710) | 4,222,970 |
| Net investment income (loss) | 27,555,807 | |
| Realized and Unrealized Gain (Loss) | ||
| Net realized gain (loss) on: | ||
| Investment securities: | ||
| Unaffiliated issuers | 782,258 | |
| Fidelity Central Funds | 5,081 | |
| Foreign currency transactions | (50,862) | |
| Total net realized gain (loss) | 736,477 | |
| Change in net unrealized appreciation (depreciation) on: Investment securities | 11,682,553 | |
| Assets and liabilities in foreign currencies | 102 | |
| Total change in net unrealized appreciation (depreciation) | 11,682,655 | |
| Net gain (loss) | 12,419,132 | |
| Net increase (decrease) in net assets resulting from operations | $39,974,939 |
See accompanying notes which are an integral part of the financial statements.
Statement of Changes in Net Assets
| Six months ended May 31, 2017 | Year ended November 30, 2016 | |
| Increase (Decrease) in Net Assets | ||
| Operations | ||
| Net investment income (loss) | $27,555,807 | $54,135,570 |
| Net realized gain (loss) | 736,477 | (1,612,440) |
| Change in net unrealized appreciation (depreciation) | 11,682,655 | (39,373,181) |
| Net increase (decrease) in net assets resulting from operations | 39,974,939 | 13,149,949 |
| Distributions to shareholders from net investment income | (25,345,106) | (47,734,877) |
| Share transactions | ||
| Proceeds from sales of shares | 54,867,000 | 152,302,000 |
| Reinvestment of distributions | 23,942,968 | 44,613,666 |
| Cost of shares redeemed | (27,019,960) | (181,272,137) |
| Net increase (decrease) in net assets resulting from share transactions | 51,790,008 | 15,643,529 |
| Total increase (decrease) in net assets | 66,419,841 | (18,941,399) |
| Net Assets | ||
| Beginning of period | 1,033,231,520 | 1,052,172,919 |
| End of period | $1,099,651,361 | $1,033,231,520 |
| Other Information | ||
| Undistributed net investment income end of period | $3,090,176 | $879,475 |
| Shares | ||
| Sold | 6,384,385 | 17,689,948 |
| Issued in reinvestment of distributions | 2,788,003 | 5,176,977 |
| Redeemed | (3,149,847) | (21,071,193) |
| Net increase (decrease) | 6,022,541 | 1,795,732 |
See accompanying notes which are an integral part of the financial statements.
Financial Highlights — Fidelity Real Estate High Income Fund
| Six months endedMay 31, | Years ended November 30, | |||||
| 2017 | 2016 | 2015 | 2014 | 2013 | 2012 | |
| Selected Per–Share Data | ||||||
| Net asset value, beginning of period | $8.51 | $8.80 | $8.99 | $8.77 | $8.72 | $7.87 |
| Income from Investment Operations | ||||||
| Net investment income (loss)A | .225 | .451 | .539 | .560 | .542 | .537 |
| Net realized and unrealized gain (loss) | .102 | (.343) | (.190) | .205 | .048 | .898 |
| Total from investment operations | .327 | .108 | .349 | .765 | .590 | 1.435 |
| Distributions from net investment income | (.207) | (.398) | (.462) | (.495) | (.505) | (.574) |
| Distributions from net realized gain | – | – | (.050) | (.050) | (.035) | (.011) |
| Tax return of capital | – | – | (.027) | – | – | – |
| Total distributions | (.207) | (.398) | (.539) | (.545) | (.540) | (.585) |
| Net asset value, end of period | $8.63 | $8.51 | $8.80 | $8.99 | $8.77 | $8.72 |
| Total ReturnB,C | 3.88% | 1.26% | 3.96% | 8.98% | 6.96% | 18.94% |
| Ratios to Average Net AssetsD,E | ||||||
| Expenses before reductions | .81%F | .80% | .80% | .81% | .83% | .81% |
| Expenses net of fee waivers, if any | .81%F | .80% | .80% | .81% | .83% | .81% |
| Expenses net of all reductions | .81%F | .80% | .80% | .81% | .83% | .81% |
| Net investment income (loss) | 5.26%F | 5.23% | 6.05% | 6.31% | 6.18% | 6.52% |
| Supplemental Data | ||||||
| Net assets, end of period (000 omitted) | $1,099,651 | $1,033,232 | $1,052,173 | $953,814 | $877,459 | $902,714 |
| Portfolio turnover rateG | 20%F | 19% | 20% | 20% | 22% | 21% |
A Calculated based on average shares outstanding during the period.
B Total returns for periods of less than one year are not annualized.
C Total returns would have been lower if certain expenses had not been reduced during the applicable periods shown.
D Fees and expenses of any underlying Fidelity Central Funds are not included in the Fund's expense ratio. The Fund indirectly bears its proportionate share of the expenses of any underlying Fidelity Central Funds.
E Expense ratios reflect operating expenses of the Fund. Expenses before reductions do not reflect amounts reimbursed by the investment adviser or reductions from brokerage service arrangements or reductions from other expense offset arrangements and do not represent the amount paid by the Fund during periods when reimbursements or reductions occur. Expenses net of fee waivers reflect expenses after reimbursement by the investment adviser but prior to reductions from brokerage service arrangements or other expense offset arrangements. Expenses net of all reductions represent the net expenses paid by the Fund.
F Annualized
G Amount does not include the portfolio activity of any underlying Fidelity Central Funds.
See accompanying notes which are an integral part of the financial statements.
Notes to Financial Statements
For the period ended May 31, 2017
1. Organization.
Fidelity Real Estate High Income Fund (the Fund) is a fund of Fidelity Advisor Series I (the Trust) and is authorized to issue an unlimited number of shares. The Trust is registered under the Investment Company Act of 1940, as amended (the 1940 Act), as an open-end management investment company organized as a Massachusetts business trust.
2. Investments in Fidelity Central Funds.
The Fund invests in Fidelity Central Funds, which are open-end investment companies generally available only to other investment companies and accounts managed by the investment adviser and its affiliates. The Fund's Schedule of Investments lists each of the Fidelity Central Funds held as of period end, if any, as an investment of the Fund, but does not include the underlying holdings of each Fidelity Central Fund. As an Investing Fund, the Fund indirectly bears its proportionate share of the expenses of the underlying Fidelity Central Funds.
The Money Market Central Funds seek preservation of capital and current income and are managed by Fidelity Investments Money Management, Inc. (FIMM), an affiliate of the investment adviser. Annualized expenses of the Money Market Central Funds as of their most recent shareholder report date are less than .005%.
A complete unaudited list of holdings for each Fidelity Central Fund is available upon request or at the Securities and Exchange Commission (the SEC) website at www.sec.gov. In addition, the financial statements of the Fidelity Central Funds, which are not covered by the Fund's Report of Independent Registered Public Accounting Firm, are available on the SEC website or upon request.
3. Significant Accounting Policies.
The Fund is an investment company and applies the accounting and reporting guidance of the Financial Accounting Standards Board (FASB) Accounting Standards Codification Topic 946 Financial Services – Investments Companies. The financial statements have been prepared in conformity with accounting principles generally accepted in the United States of America (GAAP), which require management to make certain estimates and assumptions at the date of the financial statements. Actual results could differ from those estimates. Subsequent events, if any, through the date that the financial statements were issued have been evaluated in the preparation of the financial statements. The following summarizes the significant accounting policies of the Fund:
Investment Valuation. Investments are valued as of 4:00 p.m. Eastern time on the last calendar day of the period. The Board of Trustees (the Board) has delegated the day to day responsibility for the valuation of the Fund's investments to the Fair Value Committee (the Committee) established by the Fund's investment adviser. In accordance with valuation policies and procedures approved by the Board, the Fund attempts to obtain prices from one or more third party pricing vendors or brokers to value its investments. When current market prices, quotations or currency exchange rates are not readily available or reliable, investments will be fair valued in good faith by the Committee, in accordance with procedures adopted by the Board. Factors used in determining fair value vary by investment type and may include market or investment specific events, changes in interest rates and credit quality. The frequency with which these procedures are used cannot be predicted and they may be utilized to a significant extent. The Committee oversees the Fund's valuation policies and procedures and reports to the Board on the Committee's activities and fair value determinations. The Board monitors the appropriateness of the procedures used in valuing the Fund's investments and ratifies the fair value determinations of the Committee.
The Fund categorizes the inputs to valuation techniques used to value its investments into a disclosure hierarchy consisting of three levels as shown below:
- Level 1 – quoted prices in active markets for identical investments
- Level 2 – other significant observable inputs (including quoted prices for similar investments, interest rates, prepayment speeds, etc.)
- Level 3 – unobservable inputs (including the Fund's own assumptions based on the best information available)
Valuation techniques used to value the Fund's investments by major category are as follows:
Debt securities, including restricted securities, are valued based on evaluated prices received from third party pricing vendors or from brokers who make markets in such securities. Corporate bonds, bank loan obligations and preferred securities are valued by pricing vendors who utilize matrix pricing which considers yield or price of bonds of comparable quality, coupon, maturity and type or by broker-supplied prices. Asset backed securities, collateralized mortgage obligations and commercial mortgage securities are valued by pricing vendors who utilize matrix pricing which considers prepayment speed assumptions, attributes of the collateral, yield or price of bonds of comparable quality, coupon, maturity and type or by broker-supplied prices. When independent prices are unavailable or unreliable, debt securities may be valued utilizing pricing methodologies which consider similar factors that would be used by third party pricing vendors. Debt securities are generally categorized as Level 2 in the hierarchy but may be Level 3 depending on the circumstances. The Fund invests a significant portion of its assets in below investment grade securities. The value of these securities can be more volatile due to changes in the credit quality of the issuer and is sensitive to changes in economic, market and regulatory conditions.
Equity securities, including restricted securities, for which market quotations are readily available, are valued at the last reported sale price or official closing price as reported by a third party pricing vendor on the primary market or exchange on which they are traded and are categorized as Level 1 in the hierarchy. In the event there were no sales during the day or closing prices are not available, securities are valued at the last quoted bid price or may be valued using the last available price and are generally categorized as Level 2 in the hierarchy. For equity securities, including restricted securities, where observable inputs are limited, assumptions about market activity and risk are used and these securities may be categorized as Level 3 in the hierarchy.
The Fund attempts to obtain prices from one or more third party pricing vendors or brokers. For certain securities, independent prices may be unavailable, unreliable or limited to a single third party pricing vendor or broker, and the values reflected may differ from the amount that would be realized if the securities were sold.
Investments in open-end mutual funds, including the Fidelity Central Funds, are valued at their closing net asset value (NAV) each business day and are categorized as Level 1 in the hierarchy.
Changes in valuation techniques may result in transfers in or out of an assigned level within the disclosure hierarchy. The aggregate value of investments by input level as of May 31, 2017, as well as a roll forward of Level 3 investments, is included at the end of the Fund's Schedule of Investments.
Foreign Currency. The Fund may use foreign currency contracts to facilitate transactions in foreign-denominated securities. Gains and losses from these transactions may arise from changes in the value of the foreign currency or if the counterparties do not perform under the contracts' terms.
Foreign-denominated assets, including investment securities, and liabilities are translated into U.S. dollars at the exchange rates at period end. Purchases and sales of investment securities, income and dividends received and expenses denominated in foreign currencies are translated into U.S. dollars at the exchange rate in effect on the transaction date.
The effects of exchange rate fluctuations on investments are included with the net realized and unrealized gain (loss) on investment securities. Other foreign currency transactions resulting in realized and unrealized gain (loss) are disclosed separately.
Investment Transactions and Income. For financial reporting purposes, the Fund's investment holdings and NAV include trades executed through the end of the last business day of the period. The NAV per share for processing shareholder transactions is calculated as of the close of business of the New York Stock Exchange (NYSE), normally 4:00 p.m. Eastern time and includes trades executed through the end of the prior business day. Gains and losses on securities sold are determined on the basis of identified cost and may include proceeds received from litigation. Dividend income is recorded on the ex-dividend date, except for certain dividends from foreign securities where the ex-dividend date may have passed, which are recorded as soon as the Fund is informed of the ex-dividend date. Non-cash dividends included in dividend income, if any, are recorded at the fair market value of the securities received. Income and capital gain distributions from Fidelity Central Funds, if any, are recorded on the ex-dividend date. Certain distributions received by the Fund represent a return of capital or capital gain. The Fund determines the components of these distributions subsequent to the ex-dividend date, based upon receipt of tax filings or other correspondence relating to the underlying investment. These distributions are recorded as a reduction of cost of investments and/or as a realized gain. Interest income is accrued as earned and includes coupon interest and amortization of premium and accretion of discount on debt securities as applicable. For certain lower credit quality securitized assets that have contractual cash flows (for example, asset backed securities, collateralized mortgage obligations and commercial mortgage-backed securities), changes in estimated cash flows are periodically evaluated and the estimated yield is adjusted on a prospective basis, resulting in increases or decreases to Interest Income in the accompanying Statement of Operations. Investment income is recorded net of foreign taxes withheld where recovery of such taxes is uncertain. Debt obligations may be placed on non-accrual status and related interest income may be reduced by ceasing current accruals and writing off interest receivables when the collection of all or a portion of interest has become doubtful based on consistently applied procedures. A debt obligation is removed from non-accrual status when the issuer resumes interest payments or when collectability of interest is reasonably assured.
Expenses. Expenses directly attributable to a fund are charged to that fund. Expenses attributable to more than one fund are allocated among the respective funds on the basis of relative net assets or other appropriate methods. Expense estimates are accrued in the period to which they relate and adjustments are made when actual amounts are known.
Income Tax Information and Distributions to Shareholders. Each year, the Fund intends to qualify as a regulated investment company under Subchapter M of the Internal Revenue Code, including distributing substantially all of its taxable income and realized gains. As a result, no provision for U.S. Federal income taxes is required. The Fund files a U.S. federal tax return, in addition to state and local tax returns as required. The Fund's federal income tax returns are subject to examination by the Internal Revenue Service (IRS) for a period of three fiscal years after they are filed. State and local tax returns may be subject to examination for an additional fiscal year depending on the jurisdiction. Foreign taxes are provided for based on the Fund's understanding of the tax rules and rates that exist in the foreign markets in which it invests.
Dividends are declared and recorded daily and paid monthly from net investment income. Distributions from realized gains, if any, are declared and recorded on the ex-dividend date. Income and capital gain distributions are determined in accordance with income tax regulations, which may differ from GAAP.
Capital accounts within the financial statements are adjusted for permanent book-tax differences. These adjustments have no impact on net assets or the results of operations. Capital accounts are not adjusted for temporary book-tax differences which will reverse in a subsequent period.
Book-tax differences are primarily due to foreign currency transactions, passive foreign investment companies (PFIC), market discount, capital loss carryforwards, expiring capital loss carryforwards and losses deferred due to excise tax regulations.
The federal tax cost of investment securities and unrealized appreciation (depreciation) as of period end were as follows:
| Gross unrealized appreciation | $40,809,192 |
| Gross unrealized depreciation | (41,061,623) |
| Net unrealized appreciation (depreciation) on securities | $(252,431) |
| Tax cost | $1,098,153,091 |
Capital loss carryforwards are only available to offset future capital gains of the Fund to the extent provided by regulations and may be limited. Under the Regulated Investment Company Modernization Act of 2010 (the Act), the Fund is permitted to carry forward capital losses incurred in taxable years beginning after December 22, 2010 for an unlimited period and such capital losses are required to be used prior to any losses that expire. The capital loss carryforward information presented below, including any applicable limitation, is estimated as of prior fiscal period end and is subject to adjustment.
| Fiscal year of expiration | |
| 2017 | $(12,497,160) |
| 2019 | (15,362,164) |
| Total with expiration | $(27,859,324) |
| No expiration | |
| Short-term | $(1,645,063) |
| Long-term | (3,728,983) |
| Total no expiration | $(5,374,046) |
| Total capital loss carryforward | $(33,233,370) |
The Fund elected to defer to its next fiscal year approximately $30,299 of capital losses recognized during the period November 1, 2016 to November 30, 2016.
Restricted Securities. The Fund may invest in securities that are subject to legal or contractual restrictions on resale. These securities generally may be resold in transactions exempt from registration or to the public if the securities are registered. Disposal of these securities may involve time-consuming negotiations and expense, and prompt sale at an acceptable price may be difficult. Information regarding restricted securities is included at the end of the Fund's Schedule of Investments.
Loans and Other Direct Debt Instruments. The Fund invests in direct debt instruments which are interests in amounts owed to lenders by corporate or other borrowers. These instruments may be in the form of loans, trade claims or other receivables and may include standby financing commitments such as revolving credit facilities that obligate the Fund to supply additional cash to the borrower on demand. Loans may be acquired through assignment or participation. The Fund did not have any unfunded loan commitments, which are contractual obligations for future funding, at period end.
New Accounting Pronouncement. In March 2017, the Financial Accounting Standards Board (FASB) issued an Accounting Standards Update (ASU), ASU 2017-08, which amends the amortization period for certain callable debt securities that are held at a premium. The amendment requires the premium to be amortized to the earliest call date. The amendments do not require an accounting change for securities held at a discount. The ASU is effective for annual periods beginning after December 15, 2019. Management is currently evaluating the potential impact of these changes to the financial statements.
4. Purchases and Sales of Investments.
Purchases and sales of securities, other than short-term securities and U.S. government securities, aggregated $101,373,567 and $96,670,417, respectively.
5. Fees and Other Transactions with Affiliates.
Management Fee. Fidelity Management & Research Company (the investment adviser) and its affiliates provide the Fund with investment management related services for which the Fund pays a monthly management fee. The management fee is the sum of an individual fund fee rate that is based on an annual rate of .60% of the Fund's average net assets and an annualized group fee rate that averaged .11% during the period. The group fee rate is based upon the average net assets of all the mutual funds advised by the investment adviser, including any mutual funds previously advised by the investment adviser that are currently advised by Fidelity SelectCo, LLC, an affiliate of the investment adviser. The group fee rate decreases as assets under management increase and increases as assets under management decrease. For the reporting period, the total annualized management fee rate was .71% of the Fund's average net assets.
Transfer Agent Fees. Fidelity Investments Institutional Operations Company, Inc. (FIIOC), an affiliate of the investment adviser, is the Fund's transfer, dividend disbursing and shareholder servicing agent. FIIOC receives an asset-based fee of .02% of the Fund's average net assets. FIIOC pays for typesetting, printing and mailing of shareholder reports, except proxy statements.
Accounting Fees. Fidelity Service Company, Inc. (FSC), an affiliate of the investment adviser, maintains the Fund's accounting records. The fee is based on the level of average net assets for each month.
Interfund Trades. The Fund may purchase from or sell securities to other Fidelity Funds under procedures adopted by the Board. The procedures have been designed to ensure these interfund trades are executed in accordance with Rule 17a-7 of the 1940 Act. Interfund trades are included within the respective purchases and sales amounts shown in the Purchases and Sales of Investments note.
6. Committed Line of Credit.
The Fund participates with other funds managed by the investment adviser or an affiliate in a $4.25 billion credit facility (the "line of credit") to be utilized for temporary or emergency purposes to fund shareholder redemptions or for other short-term liquidity purposes. The Fund has agreed to pay commitment fees on its pro-rata portion of the line of credit, which amounted to $1,771 and is reflected in Miscellaneous expenses on the Statement of Operations. During the period, the Fund did not borrow on this line of credit.
7. Expense Reductions.
Through arrangements with the Fund's custodian, credits realized as a result of certain uninvested cash balances were used to reduce the Fund's expenses. During the period, these credits reduced the Fund's custody expenses by $1,627.
In addition, during the period the investment adviser reimbursed and/or waived a portion of operating expenses in the amount of $3,083.
8. Other.
The Fund's organizational documents provide former and current trustees and officers with a limited indemnification against liabilities arising in connection with the performance of their duties to the Fund. In the normal course of business, the Fund may also enter into contracts that provide general indemnifications. The Fund's maximum exposure under these arrangements is unknown as this would be dependent on future claims that may be made against the Fund. The risk of material loss from such claims is considered remote.
At the end of the period, two otherwise unaffiliated shareholders were the owners of record of approximately 34% of the total outstanding shares of the Fund.
9. Credit and Liquidity Risk.
The Fund invests a significant portion of its assets in below investment grade securities with contractual cash flows, such as asset backed securities, collateralized mortgage obligations and commercial mortgage backed securities. As these securities have a higher degree of sensitivity to changes in economic conditions, including real estate values, the risk of default is higher, and the liquidity and/or value of such securities may be adversely affected.
Report of Independent Registered Public Accounting Firm
To the Trustees of Fidelity Advisor Series I and Shareholders of Fidelity Real Estate High Income Fund:
In our opinion, the accompanying statement of assets and liabilities, including the schedule of investments, and the related statements of operations and of changes in net assets and the financial highlights present fairly, in all material respects, the financial position of Fidelity Real Estate High Income Fund (a fund of Fidelity Advisor Series I) as of May 31, 2017, the results of its operations for the for the periods indicated, the changes in its net assets for each of the periods indicated and the financial highlights for each of the periods indicated, in conformity with accounting principles generally accepted in the United States of America. These financial statements and financial highlights (hereafter referred to as “financial statements”) are the responsibility of the Fidelity Real Estate High Income Fund’s management. Our responsibility is to express an opinion on these financial statements based on our audits. We conducted our audits of these financial statements in accordance with the standards of the Public Company Accounting Oversight Board (United States). Those standards require that we plan and perform the audit to obtain reasonable assurance about whether the financial statements are free of material misstatement. An audit includes examining, on a test basis, evidence supporting the amounts and disclosures in the financial statements, assessing the accounting principles used and significant estimates made by management, and evaluating the overall financial statement presentation. Our procedures included confirmation of securities owned as of May 31, 2017 by correspondence with the custodians and brokers; when replies were not received from brokers, we performed other auditing procedures. We believe that our audits provide a reasonable basis for our opinion.
PricewaterhouseCoopers LLP
Boston, Massachusetts
July 20, 2017
Shareholder Expense Example
As a shareholder of the Fund, you incur two types of costs: (1) transaction costs, and (2) ongoing costs, including management fees and other Fund expenses. This Example is intended to help you understand your ongoing costs (in dollars) of investing in the Fund and to compare these costs with the ongoing costs of investing in other mutual funds.
The Example is based on an investment of $1,000 invested at the beginning of the period and held for the entire period (December 1, 2016 to May 31, 2017).
Actual Expenses
The first line of the accompanying table provides information about actual account values and actual expenses. You may use the information in this line, together with the amount you invested, to estimate the expenses that you paid over the period. Simply divide your account value by $1,000.00 (for example, an $8,600 account value divided by $1,000.00 = 8.6), then multiply the result by the number in the first line under the heading entitled "Expenses Paid During Period" to estimate the expenses you paid on your account during this period. In addition, the Fund, as a shareholder in the underlying Fidelity Central Funds, will indirectly bear its pro-rata share of the fees and expenses incurred by the underlying Fidelity Central Funds. These fees and expenses are not included in the Fund's annualized expense ratio used to calculate the expense estimate in the table below.
Hypothetical Example for Comparison Purposes
The second line of the accompanying table provides information about hypothetical account values and hypothetical expenses based on the Fund's actual expense ratio and an assumed rate of return of 5% per year before expenses, which is not the Fund's actual return. The hypothetical account values and expenses may not be used to estimate the actual ending account balance or expenses you paid for the period. You may use this information to compare the ongoing costs of investing in the Fund and other funds. To do so, compare this 5% hypothetical example with the 5% hypothetical examples that appear in the shareholder reports of the other funds. In addition, the Fund, as a shareholder in the underlying Fidelity Central Funds, will indirectly bear its pro-rata share of the fees and expenses incurred by the underlying Fidelity Central Funds. These fees and expenses are not included in the Fund's annualized expense ratio used to calculate the expense estimate in the table below.
Please note that the expenses shown in the table are meant to highlight your ongoing costs only and do not reflect any transaction costs. Therefore, the second line of the table is useful in comparing ongoing costs only, and will not help you determine the relative total costs of owning different funds.
| Annualized Expense Ratio-A | Beginning Account Value December 1, 2016 | Ending Account Value May 31, 2017 | Expenses Paid During Period-B December 1, 2016 to May 31, 2017 | |
| Actual | .81% | $1,000.00 | $1,038.80 | $4.12 |
| Hypothetical-C | $1,000.00 | $1,020.89 | $4.08 |
A Annualized expense ratio reflects expenses net of applicable fee waivers.
B Expenses are equal to the Fund's annualized expense ratio, multiplied by the average account value over the period, multiplied by 182/365 (to reflect the one-half year period).
C 5% return per year before expenses
![]()
Corporate Headquarters
245 Summer St.
Boston, MA 02210
www.fidelity.com
REHI-SANN-0717
1.723505.118
Fidelity® Stock Selector Mid Cap Fund Semi-Annual Report May 31, 2017 Fidelity® Stock Selector Mid Cap Fund is a class of Fidelity Advisor® Stock Selector Mid Cap Fund |
|
Contents
To view a fund's proxy voting guidelines and proxy voting record for the 12-month period ended June 30, visit http://www.fidelity.com/proxyvotingresults or visit the Securities and Exchange Commission's (SEC) web site at http://www.sec.gov.
You may also call 1-800-544-8544 to request a free copy of the proxy voting guidelines.
Standard & Poor's, S&P and S&P 500 are registered service marks of The McGraw-Hill Companies, Inc. and have been licensed for use by Fidelity Distributors Corporation.
Other third-party marks appearing herein are the property of their respective owners.
All other marks appearing herein are registered or unregistered trademarks or service marks of FMR LLC or an affiliated company. © 2017 FMR LLC. All rights reserved.
This report and the financial statements contained herein are submitted for the general information of the shareholders of the Fund. This report is not authorized for distribution to prospective investors in the Fund unless preceded or accompanied by an effective prospectus.
A fund files its complete schedule of portfolio holdings with the SEC for the first and third quarters of each fiscal year on Form N-Q. Forms N-Q are available on the SEC’s web site at http://www.sec.gov. A fund's Forms N-Q may be reviewed and copied at the SEC’s Public Reference Room in Washington, DC. Information regarding the operation of the SEC's Public Reference Room may be obtained by calling 1-800-SEC-0330.
For a complete list of a fund's portfolio holdings, view the most recent holdings listing, semiannual report, or annual report on Fidelity's web site at http://www.fidelity.com, http://www.institutional.fidelity.com, or http://www.401k.com, as applicable.
NOT FDIC INSURED •MAY LOSE VALUE •NO BANK GUARANTEE
Neither the Fund nor Fidelity Distributors Corporation is a bank.
Investment Summary (Unaudited)
Top Ten Stocks as of May 31, 2017
| % of fund's net assets | % of fund's net assets 6 months ago | |
| Huntington Bancshares, Inc. | 1.7 | 1.8 |
| Capital One Financial Corp. | 1.6 | 2.0 |
| AECOM | 1.6 | 0.0 |
| Steel Dynamics, Inc. | 1.5 | 1.5 |
| American Airlines Group, Inc. | 1.2 | 0.4 |
| SLM Corp. | 1.2 | 1.3 |
| Jabil Circuit, Inc. | 1.1 | 0.9 |
| NVR, Inc. | 1.1 | 0.8 |
| AMETEK, Inc. | 1.1 | 1.2 |
| Packaging Corp. of America | 1.0 | 0.0 |
| 13.1 |
Top Five Market Sectors as of May 31, 2017
| % of fund's net assets | % of fund's net assets 6 months ago | |
| Information Technology | 17.4 | 17.1 |
| Financials | 15.6 | 16.7 |
| Consumer Discretionary | 12.8 | 12.4 |
| Industrials | 12.5 | 13.6 |
| Real Estate | 9.9 | 10.5 |
Asset Allocation (% of fund's net assets)
| As of May 31, 2017 * | ||
| Stocks and Equity Futures | 96.5% | |
| Short-Term Investments and Net Other Assets (Liabilities) | 3.5% | |

* Foreign investments - 7.4%
| As of November 30, 2016 * | ||
| Stocks and Equity Futures | 98.5% | |
| Short-Term Investments and Net Other Assets (Liabilities) | 1.5% | |

* Foreign investments - 7.9%
Percentages shown as 0.0% may reflect amounts less than 0.05%.
Investments May 31, 2017 (Unaudited)
Showing Percentage of Net Assets
| Common Stocks - 95.3% | |||
| Shares | Value (000s) | ||
| CONSUMER DISCRETIONARY - 12.8% | |||
| Auto Components - 0.5% | |||
| Gentex Corp. | 585,000 | $11,103 | |
| Distributors - 0.4% | |||
| LKQ Corp. (a) | 301,900 | 9,507 | |
| Diversified Consumer Services - 1.2% | |||
| Grand Canyon Education, Inc. (a) | 115,300 | 9,040 | |
| ServiceMaster Global Holdings, Inc. (a) | 463,656 | 17,526 | |
| 26,566 | |||
| Hotels, Restaurants & Leisure - 1.6% | |||
| ARAMARK Holdings Corp. | 262,900 | 9,796 | |
| Brinker International, Inc. (b) | 168,500 | 6,610 | |
| DineEquity, Inc. | 84,800 | 3,880 | |
| Hilton, Inc. | 164,000 | 10,901 | |
| U.S. Foods Holding Corp. | 187,500 | 5,618 | |
| 36,805 | |||
| Household Durables - 1.1% | |||
| NVR, Inc. (a) | 10,900 | 24,878 | |
| Internet & Direct Marketing Retail - 0.3% | |||
| Liberty Interactive Corp. (Venture Group) Series A (a) | 123,040 | 6,631 | |
| Media - 3.5% | |||
| Cinemark Holdings, Inc. | 388,500 | 15,373 | |
| Discovery Communications, Inc. Class A (a) | 151,000 | 4,002 | |
| Interpublic Group of Companies, Inc. | 388,600 | 9,688 | |
| Liberty Broadband Corp. Class A (a) | 124,800 | 11,014 | |
| Liberty Media Corp. Liberty Media Class A (a)(b) | 259,700 | 8,284 | |
| Lions Gate Entertainment Corp. Class B (a) | 240,610 | 6,085 | |
| Omnicom Group, Inc. | 133,300 | 11,160 | |
| Scripps Networks Interactive, Inc. Class A | 121,300 | 8,032 | |
| The Madison Square Garden Co. (a) | 21,000 | 4,104 | |
| 77,742 | |||
| Multiline Retail - 1.3% | |||
| Dollar General Corp. | 217,000 | 15,926 | |
| Dollar Tree, Inc. (a) | 168,200 | 13,069 | |
| 28,995 | |||
| Specialty Retail - 2.0% | |||
| AutoZone, Inc. (a) | 21,600 | 13,088 | |
| Foot Locker, Inc. | 118,200 | 7,022 | |
| GameStop Corp. Class A | 98,617 | 2,183 | |
| L Brands, Inc. | 75,000 | 3,870 | |
| Ross Stores, Inc. | 275,200 | 17,591 | |
| 43,754 | |||
| Textiles, Apparel & Luxury Goods - 0.9% | |||
| PVH Corp. | 99,800 | 10,574 | |
| VF Corp. | 183,900 | 9,894 | |
| 20,468 | |||
| TOTAL CONSUMER DISCRETIONARY | 286,449 | ||
| CONSUMER STAPLES - 3.6% | |||
| Beverages - 1.1% | |||
| Coca-Cola European Partners PLC | 201,400 | 8,265 | |
| Dr. Pepper Snapple Group, Inc. | 58,600 | 5,439 | |
| Molson Coors Brewing Co. Class B | 121,600 | 11,526 | |
| 25,230 | |||
| Food Products - 1.5% | |||
| Hostess Brands, Inc. Class A (a) | 671,010 | 10,562 | |
| Lamb Weston Holdings, Inc. | 218,300 | 10,131 | |
| Mead Johnson Nutrition Co. Class A | 17,000 | 1,520 | |
| Pinnacle Foods, Inc. | 92,200 | 5,745 | |
| The J.M. Smucker Co. | 37,800 | 4,833 | |
| 32,791 | |||
| Household Products - 0.8% | |||
| Church & Dwight Co., Inc. | 126,600 | 6,540 | |
| Energizer Holdings, Inc. | 167,800 | 8,994 | |
| Spectrum Brands Holdings, Inc. | 26,300 | 3,536 | |
| 19,070 | |||
| Personal Products - 0.2% | |||
| Coty, Inc. Class A | 236,200 | 4,474 | |
| TOTAL CONSUMER STAPLES | 81,565 | ||
| ENERGY - 3.0% | |||
| Energy Equipment & Services - 1.0% | |||
| Dril-Quip, Inc. (a) | 135,400 | 6,716 | |
| Nabors Industries Ltd. | 805,300 | 7,087 | |
| Oil States International, Inc. (a) | 247,000 | 7,225 | |
| 21,028 | |||
| Oil, Gas & Consumable Fuels - 2.0% | |||
| Cimarex Energy Co. | 54,800 | 5,894 | |
| Energen Corp. (a) | 226,200 | 12,902 | |
| HollyFrontier Corp. | 394,500 | 9,429 | |
| PDC Energy, Inc. (a) | 83,100 | 4,127 | |
| Whiting Petroleum Corp. (a) | 517,600 | 3,654 | |
| WPX Energy, Inc. (a) | 895,000 | 9,684 | |
| 45,690 | |||
| TOTAL ENERGY | 66,718 | ||
| FINANCIALS - 15.6% | |||
| Banks - 4.2% | |||
| CIT Group, Inc. | 253,936 | 11,440 | |
| Huntington Bancshares, Inc. | 3,014,106 | 37,796 | |
| Signature Bank (a) | 46,500 | 6,650 | |
| SVB Financial Group (a) | 114,700 | 19,556 | |
| Synovus Financial Corp. | 390,427 | 15,961 | |
| The Jammu & Kashmir Bank Ltd. | 2,435,385 | 3,084 | |
| 94,487 | |||
| Capital Markets - 3.2% | |||
| CBOE Holdings, Inc. | 256,000 | 22,111 | |
| E*TRADE Financial Corp. (a) | 333,900 | 11,556 | |
| Legg Mason, Inc. | 237,800 | 8,768 | |
| MSCI, Inc. | 167,000 | 16,989 | |
| Virtu Financial, Inc. Class A (b) | 744,000 | 12,127 | |
| 71,551 | |||
| Consumer Finance - 3.5% | |||
| Capital One Financial Corp. | 472,600 | 36,352 | |
| OneMain Holdings, Inc. (a) | 713,980 | 16,107 | |
| SLM Corp. (a) | 2,433,016 | 25,279 | |
| 77,738 | |||
| Diversified Financial Services - 1.5% | |||
| Bioverativ, Inc. | 310,000 | 17,078 | |
| On Deck Capital, Inc. (a)(b) | 1,189,658 | 4,211 | |
| Valvoline, Inc. | 497,729 | 11,134 | |
| 32,423 | |||
| Insurance - 2.1% | |||
| Arthur J. Gallagher & Co. | 395,800 | 22,454 | |
| Direct Line Insurance Group PLC | 2,311,558 | 10,382 | |
| Employers Holdings, Inc. | 117,906 | 4,722 | |
| FNF Group | 239,700 | 10,214 | |
| 47,772 | |||
| Mortgage Real Estate Investment Trusts - 0.5% | |||
| Redwood Trust, Inc. | 675,500 | 11,429 | |
| Thrifts & Mortgage Finance - 0.6% | |||
| Essent Group Ltd. (a) | 181,300 | 6,576 | |
| LIC Housing Finance Ltd. | 680,966 | 7,749 | |
| 14,325 | |||
| TOTAL FINANCIALS | 349,725 | ||
| HEALTH CARE - 7.5% | |||
| Biotechnology - 0.6% | |||
| Puma Biotechnology, Inc. (a) | 55,000 | 4,208 | |
| Vertex Pharmaceuticals, Inc. (a) | 77,000 | 9,517 | |
| 13,725 | |||
| Health Care Equipment & Supplies - 2.5% | |||
| Boston Scientific Corp. (a) | 440,000 | 11,893 | |
| DexCom, Inc. (a) | 125,000 | 8,355 | |
| Insulet Corp. (a) | 188,000 | 7,890 | |
| NxStage Medical, Inc. (a) | 380,000 | 8,231 | |
| The Spectranetics Corp. (a) | 330,000 | 8,910 | |
| Wright Medical Group NV (a) | 420,000 | 11,222 | |
| 56,501 | |||
| Health Care Providers & Services - 1.8% | |||
| American Renal Associates Holdings, Inc. (a) | 510,000 | 8,262 | |
| Envision Healthcare Corp. (a) | 95,000 | 5,188 | |
| MEDNAX, Inc. (a) | 28,000 | 1,520 | |
| Premier, Inc. (a) | 248,100 | 8,564 | |
| Teladoc, Inc. (a) | 400,000 | 12,240 | |
| Tenet Healthcare Corp. (a)(b) | 280,000 | 4,631 | |
| 40,405 | |||
| Health Care Technology - 0.4% | |||
| Evolent Health, Inc. (a) | 344,000 | 7,895 | |
| Life Sciences Tools & Services - 1.0% | |||
| Agilent Technologies, Inc. | 124,000 | 7,482 | |
| Bio-Rad Laboratories, Inc. Class A (a) | 69,000 | 15,420 | |
| 22,902 | |||
| Pharmaceuticals - 1.2% | |||
| Catalent, Inc. (a) | 484,000 | 17,197 | |
| Jazz Pharmaceuticals PLC (a) | 70,000 | 10,189 | |
| 27,386 | |||
| TOTAL HEALTH CARE | 168,814 | ||
| INDUSTRIALS - 12.5% | |||
| Aerospace & Defense - 1.5% | |||
| Aerojet Rocketdyne Holdings, Inc. (a) | 1,039,436 | 22,764 | |
| Axon Enterprise, Inc. (a)(b) | 463,000 | 11,117 | |
| 33,881 | |||
| Airlines - 1.7% | |||
| American Airlines Group, Inc. | 563,800 | 27,294 | |
| JetBlue Airways Corp. (a) | 493,000 | 11,053 | |
| 38,347 | |||
| Building Products - 0.8% | |||
| Allegion PLC | 223,510 | 17,575 | |
| Commercial Services & Supplies - 0.5% | |||
| Aggreko PLC | 895,000 | 9,969 | |
| Construction & Engineering - 2.1% | |||
| AECOM (a) | 1,085,537 | 34,857 | |
| KBR, Inc. | 903,626 | 12,316 | |
| 47,173 | |||
| Electrical Equipment - 2.5% | |||
| AMETEK, Inc. | 404,272 | 24,669 | |
| Fortive Corp. | 274,100 | 17,118 | |
| Sensata Technologies Holding BV (a) | 375,400 | 15,177 | |
| 56,964 | |||
| Machinery - 1.3% | |||
| Allison Transmission Holdings, Inc. | 250,963 | 9,717 | |
| IDEX Corp. | 82,658 | 8,966 | |
| WABCO Holdings, Inc. (a) | 88,000 | 10,720 | |
| 29,403 | |||
| Road & Rail - 0.8% | |||
| CSX Corp. | 183,700 | 9,951 | |
| Norfolk Southern Corp. | 69,400 | 8,608 | |
| 18,559 | |||
| Trading Companies & Distributors - 1.3% | |||
| MRC Global, Inc. (a) | 1,195,085 | 21,571 | |
| Nexeo Solutions, Inc. (a) | 920,700 | 8,102 | |
| 29,673 | |||
| TOTAL INDUSTRIALS | 281,544 | ||
| INFORMATION TECHNOLOGY - 17.4% | |||
| Communications Equipment - 0.5% | |||
| CommScope Holding Co., Inc. (a) | 310,100 | 11,471 | |
| F5 Networks, Inc. (a) | 30 | 4 | |
| 11,475 | |||
| Electronic Equipment & Components - 2.6% | |||
| Arrow Electronics, Inc. (a) | 153,100 | 11,573 | |
| IPG Photonics Corp. (a) | 48,600 | 6,757 | |
| Jabil Circuit, Inc. | 832,600 | 24,911 | |
| Keysight Technologies, Inc. (a) | 23,500 | 908 | |
| Largan Precision Co. Ltd. | 82,000 | 12,922 | |
| 57,071 | |||
| Internet Software & Services - 0.9% | |||
| Stamps.com, Inc. (a) | 144,700 | 19,954 | |
| Velti PLC (a)(c) | 215,084 | 1 | |
| 19,955 | |||
| IT Services - 5.4% | |||
| Capgemini SA | 134,800 | 13,956 | |
| Cognizant Technology Solutions Corp. Class A | 201,200 | 13,462 | |
| DXC Technology Co. | 83,100 | 6,442 | |
| EPAM Systems, Inc. (a) | 179,200 | 15,031 | |
| FleetCor Technologies, Inc. (a) | 63,400 | 9,148 | |
| Global Payments, Inc. | 146,900 | 13,458 | |
| Jack Henry & Associates, Inc. | 102,000 | 10,833 | |
| Leidos Holdings, Inc. | 339,300 | 18,852 | |
| Maximus, Inc. | 151,100 | 9,380 | |
| Reply SpA | 54,636 | 10,802 | |
| 121,364 | |||
| Semiconductors & Semiconductor Equipment - 4.0% | |||
| Cirrus Logic, Inc. (a) | 25,700 | 1,695 | |
| Dialog Semiconductor PLC (a) | 290,300 | 13,858 | |
| Integrated Device Technology, Inc. (a) | 255,800 | 6,543 | |
| KLA-Tencor Corp. | 137,000 | 14,248 | |
| Lam Research Corp. | 90,900 | 14,105 | |
| Maxim Integrated Products, Inc. | 94,100 | 4,498 | |
| ON Semiconductor Corp. (a) | 650,400 | 10,068 | |
| Qorvo, Inc. (a) | 181,900 | 14,179 | |
| Skyworks Solutions, Inc. | 94,600 | 10,068 | |
| 89,262 | |||
| Software - 4.0% | |||
| ANSYS, Inc. (a) | 64,200 | 8,110 | |
| CDK Global, Inc. | 350,600 | 21,548 | |
| Fair Isaac Corp. | 43,800 | 5,811 | |
| Parametric Technology Corp. (a) | 371,400 | 21,385 | |
| Tableau Software, Inc. (a) | 206,700 | 12,817 | |
| Ultimate Software Group, Inc. (a) | 93,000 | 20,529 | |
| 90,200 | |||
| TOTAL INFORMATION TECHNOLOGY | 389,327 | ||
| MATERIALS - 7.5% | |||
| Chemicals - 4.0% | |||
| Ashland Global Holdings, Inc. | 181,300 | 12,064 | |
| Axalta Coating Systems (a) | 372,500 | 11,659 | |
| Olin Corp. | 588,300 | 17,261 | |
| PPG Industries, Inc. | 75,800 | 8,062 | |
| RPM International, Inc. | 326,000 | 17,679 | |
| The Chemours Co. LLC | 352,900 | 14,112 | |
| W.R. Grace & Co. | 140,897 | 10,101 | |
| 90,938 | |||
| Containers & Packaging - 2.0% | |||
| Greif, Inc. Class A | 81,900 | 4,869 | |
| Packaging Corp. of America | 231,900 | 23,691 | |
| Sealed Air Corp. | 185,400 | 8,235 | |
| Silgan Holdings, Inc. | 257,400 | 8,188 | |
| 44,983 | |||
| Metals & Mining - 1.5% | |||
| Steel Dynamics, Inc. | 967,400 | 32,882 | |
| TOTAL MATERIALS | 168,803 | ||
| REAL ESTATE - 9.9% | |||
| Equity Real Estate Investment Trusts (REITs) - 9.1% | |||
| Altisource Residential Corp. Class B | 671,221 | 9,223 | |
| CareTrust (REIT), Inc. | 761,700 | 13,901 | |
| Communications Sales & Leasing, Inc. | 289,200 | 7,233 | |
| CoreSite Realty Corp. | 60,200 | 6,338 | |
| Corporate Office Properties Trust (SBI) | 591,200 | 19,941 | |
| Corrections Corp. of America | 371,096 | 10,669 | |
| DCT Industrial Trust, Inc. | 249,390 | 13,145 | |
| Duke Realty Corp. | 709,000 | 20,327 | |
| Equity Lifestyle Properties, Inc. | 152,000 | 12,829 | |
| Extra Space Storage, Inc. | 73,200 | 5,671 | |
| Healthcare Realty Trust, Inc. | 590,300 | 19,633 | |
| Hudson Pacific Properties, Inc. | 527,100 | 17,268 | |
| InfraReit, Inc. | 129,223 | 2,493 | |
| Outfront Media, Inc. | 324,000 | 7,403 | |
| Potlatch Corp. | 140,700 | 6,437 | |
| SBA Communications Corp. Class A (a) | 21,870 | 3,022 | |
| Taubman Centers, Inc. | 144,200 | 8,818 | |
| Urban Edge Properties | 275,068 | 6,558 | |
| VEREIT, Inc. | 1,553,700 | 12,849 | |
| 203,758 | |||
| Real Estate Management & Development - 0.8% | |||
| CBRE Group, Inc. (a) | 207,250 | 7,229 | |
| Invitation Homes, Inc. | 487,500 | 10,491 | |
| 17,720 | |||
| TOTAL REAL ESTATE | 221,478 | ||
| TELECOMMUNICATION SERVICES - 0.1% | |||
| Wireless Telecommunication Services - 0.1% | |||
| T-Mobile U.S., Inc. (a) | 50,150 | 3,381 | |
| UTILITIES - 5.4% | |||
| Electric Utilities - 2.3% | |||
| Great Plains Energy, Inc. | 698,800 | 20,077 | |
| OGE Energy Corp. | 554,526 | 19,758 | |
| PNM Resources, Inc. | 202,200 | 7,785 | |
| Westar Energy, Inc. | 81,500 | 4,315 | |
| 51,935 | |||
| Gas Utilities - 1.5% | |||
| Atmos Energy Corp. | 217,040 | 18,082 | |
| National Fuel Gas Co. (b) | 194,111 | 11,018 | |
| South Jersey Industries, Inc. | 153,700 | 5,596 | |
| 34,696 | |||
| Multi-Utilities - 1.6% | |||
| Avangrid, Inc. | 275,800 | 12,530 | |
| Black Hills Corp. | 243,705 | 16,947 | |
| MDU Resources Group, Inc. | 195,705 | 5,329 | |
| 34,806 | |||
| TOTAL UTILITIES | 121,437 | ||
| TOTAL COMMON STOCKS | |||
| (Cost $1,885,283) | 2,139,241 | ||
| Principal Amount (000s) | Value (000s) | ||
| U.S. Treasury Obligations - 0.1% | |||
| U.S. Treasury Bills, yield at date of purchase 0.79% to 0.8% 7/6/17 to 7/20/17 (d) | |||
| (Cost $1,808) | 1,810 | 1,808 | |
| Shares | Value (000s) | ||
| Money Market Funds - 6.0% | |||
| Fidelity Cash Central Fund, 0.86% (e) | 104,637,527 | $104,658 | |
| Fidelity Securities Lending Cash Central Fund 0.87% (e)(f) | 29,928,248 | 29,931 | |
| TOTAL MONEY MARKET FUNDS | |||
| (Cost $134,587) | 134,589 | ||
| TOTAL INVESTMENT PORTFOLIO - 101.4% | |||
| (Cost $2,021,678) | 2,275,638 | ||
| NET OTHER ASSETS (LIABILITIES) - (1.4)% | (32,173) | ||
| NET ASSETS - 100% | $2,243,465 |
| Futures Contracts | |||
| Expiration Date | Underlying Face Amount at Value (000s) | Unrealized Appreciation/(Depreciation) (000s) | |
| Purchased | |||
| Equity Index Contracts | |||
| 163 CME E-mini S&P MidCap 400 Index Contracts (United States) | June 2017 | 28,036 | $135 |
The face value of futures purchased as a percentage of Net Assets is 1.2%
Legend
(a) Non-income producing
(b) Security or a portion of the security is on loan at period end.
(c) Restricted securities - Investment in securities not registered under the Securities Act of 1933 (excluding 144A issues). At the end of the period, the value of restricted securities (excluding 144A issues) amounted to $1,000 or 0.0% of net assets.
(d) Security or a portion of the security was pledged to cover margin requirements for futures contracts. At period end, the value of securities pledged amounted to $1,159,000.
(e) Affiliated fund that is generally available only to investment companies and other accounts managed by Fidelity Investments. The rate quoted is the annualized seven-day yield of the fund at period end. A complete unaudited listing of the fund's holdings as of its most recent quarter end is available upon request. In addition, each Fidelity Central Fund's financial statements are available on the SEC's website or upon request.
(f) Investment made with cash collateral received from securities on loan.
Additional information on each restricted holding is as follows:
| Security | Acquisition Date | Acquisition Cost (000s) |
| Velti PLC | 4/19/13 | $323 |
Affiliated Central Funds
Information regarding fiscal year to date income earned by the Fund from investments in Fidelity Central Funds is as follows:
| Fund | Income earned |
| (Amounts in thousands) | |
| Fidelity Cash Central Fund | $254 |
| Fidelity Securities Lending Cash Central Fund | 61 |
| Total | $315 |
Investment Valuation
The following is a summary of the inputs used, as of May 31, 2017, involving the Fund's assets and liabilities carried at fair value. The inputs or methodology used for valuing securities may not be an indication of the risk associated with investing in those securities. For more information on valuation inputs, and their aggregation into the levels used below, please refer to the Investment Valuation section in the accompanying Notes to Financial Statements.
| Valuation Inputs at Reporting Date: | ||||
| Description | Total | Level 1 | Level 2 | Level 3 |
| (Amounts in thousands) | ||||
| Investments in Securities: | ||||
| Equities: | ||||
| Consumer Discretionary | $286,449 | $286,449 | $-- | $-- |
| Consumer Staples | 81,565 | 81,565 | -- | -- |
| Energy | 66,718 | 66,718 | -- | -- |
| Financials | 349,725 | 349,725 | -- | -- |
| Health Care | 168,814 | 168,814 | -- | -- |
| Industrials | 281,544 | 281,544 | -- | -- |
| Information Technology | 389,327 | 389,327 | -- | -- |
| Materials | 168,803 | 168,803 | -- | -- |
| Real Estate | 221,478 | 221,478 | -- | -- |
| Telecommunication Services | 3,381 | 3,381 | -- | -- |
| Utilities | 121,437 | 121,437 | -- | -- |
| U.S. Government and Government Agency Obligations | 1,808 | -- | 1,808 | -- |
| Money Market Funds | 134,589 | 134,589 | -- | -- |
| Total Investments in Securities: | $2,275,638 | $2,273,830 | $1,808 | $-- |
| Derivative Instruments: | ||||
| Assets | ||||
| Futures Contracts | $135 | $135 | $-- | $-- |
| Total Assets | $135 | $135 | $-- | $-- |
| Total Derivative Instruments: | $135 | $135 | $-- | $-- |
Value of Derivative Instruments
The following table is a summary of the Fund's value of derivative instruments by primary risk exposure as of May 31, 2017. For additional information on derivative instruments, please refer to the Derivative Instruments section in the accompanying Notes to Financial Statements.
| Primary Risk Exposure / Derivative Type | Value | |
| Asset | Liability | |
| (Amounts in thousands) | ||
| Equity Risk | ||
| Futures Contracts(a) | $135 | $0 |
| Total Equity Risk | 135 | 0 |
| Total Value of Derivatives | $135 | $0 |
(a) Reflects gross cumulative appreciation (depreciation) on futures contracts as presented in the Schedule of Investments. In the Statement of Assets and Liabilities, the period end daily variation margin is included in receivable or payable for daily variation margin for derivative instruments, and the net cumulative appreciation (depreciation) is included in net unrealized appreciation (depreciation).
See accompanying notes which are an integral part of the financial statements.
Financial Statements
Statement of Assets and Liabilities
| Amounts in thousands (except per-share amounts) | May 31, 2017 (Unaudited) | |
| Assets | ||
| Investment in securities, at value (including securities loaned of $28,903) — See accompanying schedule: Unaffiliated issuers (cost $1,887,091) | $2,141,049 | |
| Fidelity Central Funds (cost $134,587) | 134,589 | |
| Total Investments (cost $2,021,678) | $2,275,638 | |
| Foreign currency held at value (cost $19) | 19 | |
| Receivable for investments sold | 27,009 | |
| Receivable for fund shares sold | 1,160 | |
| Dividends receivable | 2,047 | |
| Interest receivable | 6 | |
| Distributions receivable from Fidelity Central Funds | 84 | |
| Prepaid expenses | 1 | |
| Other receivables | 30 | |
| Total assets | 2,305,994 | |
| Liabilities | ||
| Payable to custodian bank | $2,066 | |
| Payable for investments purchased | 25,174 | |
| Payable for fund shares redeemed | 3,669 | |
| Accrued management fee | 726 | |
| Distribution and service plan fees payable | 478 | |
| Payable for daily variation margin for derivative instruments | 7 | |
| Other affiliated payables | 436 | |
| Other payables and accrued expenses | 43 | |
| Collateral on securities loaned | 29,930 | |
| Total liabilities | 62,529 | |
| Net Assets | $2,243,465 | |
| Net Assets consist of: | ||
| Paid in capital | $1,976,571 | |
| Undistributed net investment income | 1,828 | |
| Accumulated undistributed net realized gain (loss) on investments and foreign currency transactions | 10,979 | |
| Net unrealized appreciation (depreciation) on investments and assets and liabilities in foreign currencies | 254,087 | |
| Net Assets | $2,243,465 | |
| Calculation of Maximum Offering Price | ||
| Class A: | ||
| Net Asset Value and redemption price per share ($553,946 ÷ 15,340.49 shares) | $36.11 | |
| Maximum offering price per share (100/94.25 of $36.11) | $38.31 | |
| Class M: | ||
| Net Asset Value and redemption price per share ($582,304 ÷ 16,046.58 shares) | $36.29 | |
| Maximum offering price per share (100/96.50 of $36.29) | $37.61 | |
| Class C: | ||
| Net Asset Value and offering price per share ($140,951 ÷ 4,262.70 shares)(a) | $33.07 | |
| Fidelity Stock Selector Mid Cap Fund: | ||
| Net Asset Value, offering price and redemption price per share ($363,581 ÷ 9,664.11 shares) | $37.62 | |
| Class I: | ||
| Net Asset Value, offering price and redemption price per share ($602,372 ÷ 15,987.49 shares) | $37.68 | |
| Class Z: | ||
| Net Asset Value, offering price and redemption price per share ($311 ÷ 8.25 shares) | $37.70 |
(a) Redemption price per share is equal to net asset value less any applicable contingent deferred sales charge.
See accompanying notes which are an integral part of the financial statements.
Statement of Operations
| Amounts in thousands | Six months ended May 31, 2017 (Unaudited) | |
| Investment Income | ||
| Dividends | $12,580 | |
| Interest | 9 | |
| Income from Fidelity Central Funds | 315 | |
| Total income | 12,904 | |
| Expenses | ||
| Management fee | ||
| Basic fee | $5,821 | |
| Performance adjustment | (2,096) | |
| Transfer agent fees | 2,144 | |
| Distribution and service plan fees | 2,903 | |
| Accounting and security lending fees | 324 | |
| Custodian fees and expenses | 44 | |
| Independent trustees' fees and expenses | 4 | |
| Registration fees | 99 | |
| Audit | 32 | |
| Legal | 7 | |
| Miscellaneous | 10 | |
| Total expenses before reductions | 9,292 | |
| Expense reductions | (146) | 9,146 |
| Net investment income (loss) | 3,758 | |
| Realized and Unrealized Gain (Loss) | ||
| Net realized gain (loss) on: | ||
| Investment securities: | ||
| Unaffiliated issuers | 101,501 | |
| Fidelity Central Funds | 2 | |
| Foreign currency transactions | 10 | |
| Futures contracts | 758 | |
| Total net realized gain (loss) | 102,271 | |
| Change in net unrealized appreciation (depreciation) on: Investment securities | 87,053 | |
| Assets and liabilities in foreign currencies | 5 | |
| Futures contracts | 55 | |
| Total change in net unrealized appreciation (depreciation) | 87,113 | |
| Net gain (loss) | 189,384 | |
| Net increase (decrease) in net assets resulting from operations | $193,142 |
See accompanying notes which are an integral part of the financial statements.
Statement of Changes in Net Assets
| Amounts in thousands | Six months ended May 31, 2017 (Unaudited) | Year ended November 30, 2016 |
| Increase (Decrease) in Net Assets | ||
| Operations | ||
| Net investment income (loss) | $3,758 | $12,537 |
| Net realized gain (loss) | 102,271 | (88,889) |
| Change in net unrealized appreciation (depreciation) | 87,113 | 160,670 |
| Net increase (decrease) in net assets resulting from operations | 193,142 | 84,318 |
| Distributions to shareholders from net investment income | (10,708) | (3,959) |
| Distributions to shareholders from net realized gain | (333) | (39,216) |
| Total distributions | (11,041) | (43,175) |
| Share transactions - net increase (decrease) | 38,422 | (421,318) |
| Total increase (decrease) in net assets | 220,523 | (380,175) |
| Net Assets | ||
| Beginning of period | 2,022,942 | 2,403,117 |
| End of period | $2,243,465 | $2,022,942 |
| Other Information | ||
| Undistributed net investment income end of period | $1,828 | $8,778 |
See accompanying notes which are an integral part of the financial statements.
Financial Highlights — Fidelity Advisor Stock Selector Mid Cap Fund Class A
| Six months ended (Unaudited) May 31, | Years ended November 30, | |||||
| 2017 | 2016 | 2015 | 2014 | 2013 | 2012 | |
| Selected Per–Share Data | ||||||
| Net asset value, beginning of period | $33.13 | $32.01 | $31.80 | $28.37 | $22.16 | $19.15 |
| Income from Investment Operations | ||||||
| Net investment income (loss)A | .07 | .20 | .08 | .08 | .10 | .09 |
| Net realized and unrealized gain (loss) | 3.11 | 1.49 | .13 | 3.36 | 6.29 | 3.02 |
| Total from investment operations | 3.18 | 1.69 | .21 | 3.44 | 6.39 | 3.11 |
| Distributions from net investment income | (.19) | (.04) | – | (.01) | (.14) | (.10) |
| Distributions from net realized gain | (.01) | (.53) | – | – | (.04) | – |
| Total distributions | (.20) | (.57) | – | (.01) | (.18) | (.10) |
| Net asset value, end of period | $36.11 | $33.13 | $32.01 | $31.80 | $28.37 | $22.16 |
| Total ReturnB,C,D | 9.62% | 5.49% | .66% | 12.11% | 29.07% | 16.32% |
| Ratios to Average Net AssetsE,F | ||||||
| Expenses before reductions | .85%G | .88% | .98% | 1.05% | .95% | .94% |
| Expenses net of fee waivers, if any | .84%G | .88% | .98% | 1.05% | .95% | .94% |
| Expenses net of all reductions | .83%G | .88% | .97% | 1.05% | .92% | .94% |
| Net investment income (loss) | .38%G | .64% | .24% | .26% | .39% | .41% |
| Supplemental Data | ||||||
| Net assets, end of period (in millions) | $554 | $546 | $593 | $652 | $692 | $593 |
| Portfolio turnover rateH | 93%G | 98% | 109% | 89% | 79%I | 72% |
A Calculated based on average shares outstanding during the period.
B Total returns for periods of less than one year are not annualized.
C Total returns would have been lower if certain expenses had not been reduced during the applicable periods shown.
D Total returns do not include the effect of the sales charges.
E Fees and expenses of any underlying Fidelity Central Funds are not included in the Fund's expense ratio. The Fund indirectly bears its proportionate share of the expenses of any underlying Fidelity Central Funds.
F Expense ratios reflect operating expenses of the class. Expenses before reductions do not reflect amounts reimbursed by the investment adviser or reductions from brokerage service arrangements or reductions from other expense offset arrangements and do not represent the amount paid by the class during periods when reimbursements or reductions occur. Expenses net of fee waivers reflect expenses after reimbursement by the investment adviser but prior to reductions from brokerage service arrangements or other expense offset arrangements. Expenses net of all reductions represent the net expenses paid by the class.
G Annualized
H Amount does not include the portfolio activity of any underlying Fidelity Central Funds.
I The portfolio turnover rate does not include the assets acquired in the merger.
See accompanying notes which are an integral part of the financial statements.
Financial Highlights — Fidelity Advisor Stock Selector Mid Cap Fund Class M
| Six months ended (Unaudited) May 31, | Years ended November 30, | |||||
| 2017 | 2016 | 2015 | 2014 | 2013 | 2012 | |
| Selected Per–Share Data | ||||||
| Net asset value, beginning of period | $33.25 | $32.16 | $32.02 | $28.63 | $22.36 | $19.30 |
| Income from Investment Operations | ||||||
| Net investment income (loss)A | .02 | .13 | – | .01 | .04 | .05 |
| Net realized and unrealized gain (loss) | 3.13 | 1.49 | .14 | 3.38 | 6.36 | 3.05 |
| Total from investment operations | 3.15 | 1.62 | .14 | 3.39 | 6.40 | 3.10 |
| Distributions from net investment income | (.11) | – | – | – | (.09) | (.04) |
| Distributions from net realized gain | (.01) | (.53) | – | – | (.04) | – |
| Total distributions | (.11)B | (.53) | – | – | (.13) | (.04) |
| Net asset value, end of period | $36.29 | $33.25 | $32.16 | $32.02 | $28.63 | $22.36 |
| Total ReturnC,D,E | 9.50% | 5.22% | .44% | 11.84% | 28.80% | 16.12% |
| Ratios to Average Net AssetsF,G | ||||||
| Expenses before reductions | 1.09%H | 1.12% | 1.22% | 1.28% | 1.16% | 1.14% |
| Expenses net of fee waivers, if any | 1.08%H | 1.12% | 1.21% | 1.28% | 1.16% | 1.14% |
| Expenses net of all reductions | 1.07%H | 1.11% | 1.21% | 1.27% | 1.13% | 1.13% |
| Net investment income (loss) | .14%H | .41% | .01% | .03% | .17% | .22% |
| Supplemental Data | ||||||
| Net assets, end of period (in millions) | $582 | $591 | $681 | $794 | $817 | $755 |
| Portfolio turnover rateI | 93%H | 98% | 109% | 89% | 79%J | 72% |
A Calculated based on average shares outstanding during the period.
B Total distributions of $.11 per share is comprised of distributions from net investment income of $.106 and distributions from net realized gain of $.006 per share.
C Total returns for periods of less than one year are not annualized.
D Total returns would have been lower if certain expenses had not been reduced during the applicable periods shown.
E Total returns do not include the effect of the sales charges.
F Fees and expenses of any underlying Fidelity Central Funds are not included in the Fund's expense ratio. The Fund indirectly bears its proportionate share of the expenses of any underlying Fidelity Central Funds.
G Expense ratios reflect operating expenses of the class. Expenses before reductions do not reflect amounts reimbursed by the investment adviser or reductions from brokerage service arrangements or reductions from other expense offset arrangements and do not represent the amount paid by the class during periods when reimbursements or reductions occur. Expenses net of fee waivers reflect expenses after reimbursement by the investment adviser but prior to reductions from brokerage service arrangements or other expense offset arrangements. Expenses net of all reductions represent the net expenses paid by the class.
H Annualized
I Amount does not include the portfolio activity of any underlying Fidelity Central Funds.
J The portfolio turnover rate does not include the assets acquired in the merger.
See accompanying notes which are an integral part of the financial statements.
Financial Highlights — Fidelity Advisor Stock Selector Mid Cap Fund Class C
| Six months ended (Unaudited) May 31, | Years ended November 30, | |||||
| 2017 | 2016 | 2015 | 2014 | 2013 | 2012 | |
| Selected Per–Share Data | ||||||
| Net asset value, beginning of period | $30.28 | $29.48 | $29.51 | $26.52 | $20.73 | $17.95 |
| Income from Investment Operations | ||||||
| Net investment income (loss)A | (.06) | (.03) | (.15) | (.14) | (.09) | (.06) |
| Net realized and unrealized gain (loss) | 2.85 | 1.36 | .12 | 3.13 | 5.91 | 2.84 |
| Total from investment operations | 2.79 | 1.33 | (.03) | 2.99 | 5.82 | 2.78 |
| Distributions from net investment income | – | – | – | – | (.02) | – |
| Distributions from net realized gain | – | (.53) | – | – | (.01) | – |
| Total distributions | – | (.53) | – | – | (.03) | – |
| Net asset value, end of period | $33.07 | $30.28 | $29.48 | $29.51 | $26.52 | $20.73 |
| Total ReturnB,C,D | 9.21% | 4.71% | (.10)% | 11.27% | 28.09% | 15.49% |
| Ratios to Average Net AssetsE,F | ||||||
| Expenses before reductions | 1.60%G | 1.63% | 1.74% | 1.80% | 1.69% | 1.68% |
| Expenses net of fee waivers, if any | 1.60%G | 1.63% | 1.73% | 1.80% | 1.69% | 1.68% |
| Expenses net of all reductions | 1.59%G | 1.63% | 1.73% | 1.80% | 1.67% | 1.68% |
| Net investment income (loss) | (.38)%G | (.11)% | (.51)% | (.49)% | (.36)% | (.33)% |
| Supplemental Data | ||||||
| Net assets, end of period (in millions) | $141 | $140 | $155 | $172 | $172 | $141 |
| Portfolio turnover rateH | 93%G | 98% | 109% | 89% | 79%I | 72% |
A Calculated based on average shares outstanding during the period.
B Total returns for periods of less than one year are not annualized.
C Total returns would have been lower if certain expenses had not been reduced during the applicable periods shown.
D Total returns do not include the effect of the contingent deferred sales charge.
E Fees and expenses of any underlying Fidelity Central Funds are not included in the Fund's expense ratio. The Fund indirectly bears its proportionate share of the expenses of any underlying Fidelity Central Funds.
F Expense ratios reflect operating expenses of the class. Expenses before reductions do not reflect amounts reimbursed by the investment adviser or reductions from brokerage service arrangements or reductions from other expense offset arrangements and do not represent the amount paid by the class during periods when reimbursements or reductions occur. Expenses net of fee waivers reflect expenses after reimbursement by the investment adviser but prior to reductions from brokerage service arrangements or other expense offset arrangements. Expenses net of all reductions represent the net expenses paid by the class.
G Annualized
H Amount does not include the portfolio activity of any underlying Fidelity Central Funds.
I The portfolio turnover rate does not include the assets acquired in the merger.
See accompanying notes which are an integral part of the financial statements.
Financial Highlights — Fidelity Stock Selector Mid Cap Fund
| Six months ended (Unaudited) May 31, | Years ended November 30, | |||||
| 2017 | 2016 | 2015 | 2014 | 2013 | 2012A | |
| Selected Per–Share Data | ||||||
| Net asset value, beginning of period | $34.53 | $33.34 | $33.14 | $29.56 | $23.14 | $21.20 |
| Income from Investment Operations | ||||||
| Net investment income (loss)B | .11 | .28 | .16 | .16 | .17 | .09 |
| Net realized and unrealized gain (loss) | 3.24 | 1.55 | .14 | 3.49 | 6.54 | 1.85 |
| Total from investment operations | 3.35 | 1.83 | .30 | 3.65 | 6.71 | 1.94 |
| Distributions from net investment income | (.26) | (.12) | (.10) | (.07) | (.25) | – |
| Distributions from net realized gain | (.01) | (.53) | – | – | (.04) | – |
| Total distributions | (.26)C | (.64)D | (.10) | (.07) | (.29) | – |
| Net asset value, end of period | $37.62 | $34.53 | $33.34 | $33.14 | $29.56 | $23.14 |
| Total ReturnE,F | 9.76% | 5.73% | .90% | 12.38% | 29.36% | 9.15% |
| Ratios to Average Net AssetsG,H | ||||||
| Expenses before reductions | .62%I | .64% | .75% | .81% | .71% | .59%I |
| Expenses net of fee waivers, if any | .62%I | .64% | .74% | .81% | .71% | .59%I |
| Expenses net of all reductions | .61%I | .63% | .74% | .81% | .69% | .58%I |
| Net investment income (loss) | .60%I | .89% | .48% | .50% | .62% | .86%I |
| Supplemental Data | ||||||
| Net assets, end of period (in millions) | $364 | $222 | $486 | $553 | $225 | $1 |
| Portfolio turnover rateJ | 93%I | 98% | 109% | 89% | 79%K | 72% |
A For the period June 6, 2012 (commencement of sale of shares) to November 30, 2012.
B Calculated based on average shares outstanding during the period.
C Total distributions of $.26 per share is comprised of distributions from net investment income of $.255 and distributions from net realized gain of $.006 per share.
D Total distributions of $.64 per share is comprised of distributions from net investment income of $.115 and distributions from net realized gain of $.529 per share.
E Total returns for periods of less than one year are not annualized.
F Total returns would have been lower if certain expenses had not been reduced during the applicable periods shown.
G Fees and expenses of any underlying Fidelity Central Funds are not included in the Fund's expense ratio. The Fund indirectly bears its proportionate share of the expenses of any underlying Fidelity Central Funds.
H Expense ratios reflect operating expenses of the class. Expenses before reductions do not reflect amounts reimbursed by the investment adviser or reductions from brokerage service arrangements or reductions from other expense offset arrangements and do not represent the amount paid by the class during periods when reimbursements or reductions occur. Expenses net of fee waivers reflect expenses after reimbursement by the investment adviser but prior to reductions from brokerage service arrangements or other expense offset arrangements. Expenses net of all reductions represent the net expenses paid by the class.
I Annualized
J Amount does not include the portfolio activity of any underlying Fidelity Central Funds.
K The portfolio turnover rate does not include the assets acquired in the merger.
See accompanying notes which are an integral part of the financial statements.
Financial Highlights — Fidelity Advisor Stock Selector Mid Cap Fund Class I
| Six months ended (Unaudited) May 31, | Years ended November 30, | |||||
| 2017 | 2016 | 2015 | 2014 | 2013 | 2012 | |
| Selected Per–Share Data | ||||||
| Net asset value, beginning of period | $34.60 | $33.39 | $33.22 | $29.64 | $23.14 | $20.01 |
| Income from Investment Operations | ||||||
| Net investment income (loss)A | .11 | .28 | .13 | .16 | .18 | .15 |
| Net realized and unrealized gain (loss) | 3.25 | 1.56 | .14 | 3.50 | 6.56 | 3.15 |
| Total from investment operations | 3.36 | 1.84 | .27 | 3.66 | 6.74 | 3.30 |
| Distributions from net investment income | (.27) | (.11) | (.10) | (.08) | (.20) | (.17) |
| Distributions from net realized gain | (.01) | (.53) | – | – | (.04) | – |
| Total distributions | (.28) | (.63)B | (.10) | (.08) | (.24) | (.17) |
| Net asset value, end of period | $37.68 | $34.60 | $33.39 | $33.22 | $29.64 | $23.14 |
| Total ReturnC,D | 9.76% | 5.75% | .80% | 12.39% | 29.44% | 16.66% |
| Ratios to Average Net AssetsE,F | ||||||
| Expenses before reductions | .60%G | .64% | .83% | .80% | .67% | .65% |
| Expenses net of fee waivers, if any | .60%G | .64% | .83% | .80% | .67% | .65% |
| Expenses net of all reductions | .59%G | .64% | .82% | .80% | .65% | .64% |
| Net investment income (loss) | .62%G | .88% | .39% | .51% | .66% | .71% |
| Supplemental Data | ||||||
| Net assets, end of period (in millions) | $602 | $523 | $479 | $371 | $214 | $172 |
| Portfolio turnover rateH | 93%G | 98% | 109% | 89% | 79%I | 72% |
A Calculated based on average shares outstanding during the period.
B Total distributions of $.63 per share is comprised of distributions from net investment income of $.105 and distributions from net realized gain of $.529 per share.
C Total returns for periods of less than one year are not annualized.
D Total returns would have been lower if certain expenses had not been reduced during the applicable periods shown.
E Fees and expenses of any underlying Fidelity Central Funds are not included in the Fund's expense ratio. The Fund indirectly bears its proportionate share of the expenses of any underlying Fidelity Central Funds.
F Expense ratios reflect operating expenses of the class. Expenses before reductions do not reflect amounts reimbursed by the investment adviser or reductions from brokerage service arrangements or reductions from other expense offset arrangements and do not represent the amount paid by the class during periods when reimbursements or reductions occur. Expenses net of fee waivers reflect expenses after reimbursement by the investment adviser but prior to reductions from brokerage service arrangements or other expense offset arrangements. Expenses net of all reductions represent the net expenses paid by the class.
G Annualized
H Amount does not include the portfolio activity of any underlying Fidelity Central Funds.
I The portfolio turnover rate does not include the assets acquired in the merger.
See accompanying notes which are an integral part of the financial statements.
Financial Highlights — Fidelity Advisor Stock Selector Mid Cap Fund Class Z
| Six months ended (Unaudited) May 31, | |
| 2017 A | |
| Selected Per–Share Data | |
| Net asset value, beginning of period | $35.79 |
| Income from Investment Operations | |
| Net investment income (loss)B | .11 |
| Net realized and unrealized gain (loss) | 1.80 |
| Total from investment operations | 1.91 |
| Distributions from net investment income | – |
| Distributions from net realized gain | – |
| Total distributions | – |
| Net asset value, end of period | $37.70 |
| Total ReturnC,D | 5.34% |
| Ratios to Average Net AssetsE,F | |
| Expenses before reductions | .45%G |
| Expenses net of fee waivers, if any | .44%G |
| Expenses net of all reductions | .43%G |
| Net investment income (loss) | .90%G |
| Supplemental Data | |
| Net assets, end of period (in millions) | $– |
| Portfolio turnover rateH | 93%G |
A For the period February 1, 2017 (commencement of sale of shares) to May 31, 2017.
B Calculated based on average shares outstanding during the period.
C Total returns for periods of less than one year are not annualized.
D Total returns would have been lower if certain expenses had not been reduced during the applicable periods shown.
E Fees and expenses of any underlying Fidelity Central Funds are not included in the Fund's expense ratio. The Fund indirectly bears its proportionate share of the expenses of any underlying Fidelity Central Funds.
F Expense ratios reflect operating expenses of the class. Expenses before reductions do not reflect amounts reimbursed by the investment adviser or reductions from brokerage service arrangements or reductions from other expense offset arrangements and do not represent the amount paid by the class during periods when reimbursements or reductions occur. Expense ratios before reductions for start-up periods may not be representative of longer-term operating periods. Expenses net of fee waivers reflect expenses after reimbursement by the investment adviser but prior to reductions from brokerage service arrangements or other expense offset arrangements. Expenses net of all reductions represent the net expenses paid by the class.
G Annualized
H Amount does not include the portfolio activity of any underlying Fidelity Central Funds.
See accompanying notes which are an integral part of the financial statements.
Notes to Financial Statements (Unaudited)
For the period ended May 31, 2017
(Amounts in thousands except percentages)
1. Organization.
Fidelity Advisor Stock Selector Mid Cap Fund (the Fund) is a fund of Fidelity Advisor Series I (the Trust) and is authorized to issue an unlimited number of shares. The Trust is registered under the Investment Company Act of 1940, as amended (the 1940 Act), as an open-end management investment company organized as a Massachusetts business trust. The Fund commenced sale of Class Z shares on February 1, 2017. The Fund offers Class A, Class M (formerly Class T), Class C, Fidelity Stock Selector Mid Cap Fund, Class I and Class Z shares, each of which has equal rights as to assets and voting privileges. Each class has exclusive voting rights with respect to matters that affect that class.
After the close of business on June 24, 2016, all outstanding Class B shares were converted to Class A shares. All prior fiscal period dollar and share amounts for Class B presented in the Notes to Financial Statements are for the period December 1, 2015 through June 24, 2016.
2. Investments in Fidelity Central Funds.
The Fund invests in Fidelity Central Funds, which are open-end investment companies generally available only to other investment companies and accounts managed by the investment adviser and its affiliates. The Fund's Schedule of Investments lists each of the Fidelity Central Funds held as of period end, if any, as an investment of the Fund, but does not include the underlying holdings of each Fidelity Central Fund. As an Investing Fund, the Fund indirectly bears its proportionate share of the expenses of the underlying Fidelity Central Funds.
The Money Market Central Funds seek preservation of capital and current income and are managed by Fidelity Investments Money Management, Inc. (FIMM), an affiliate of the investment adviser. Annualized expenses of the Money Market Central Funds as of their most recent shareholder report date are less than .005%.
A complete unaudited list of holdings for each Fidelity Central Fund is available upon request or at the Securities and Exchange Commission (the SEC) website at www.sec.gov. In addition, the financial statements of the Fidelity Central Funds are available on the SEC website or upon request.
3. Significant Accounting Policies.
The Fund is an investment company and applies the accounting and reporting guidance of the Financial Accounting Standards Board (FASB) Accounting Standards Codification Topic 946 Financial Services – Investments Companies. The financial statements have been prepared in conformity with accounting principles generally accepted in the United States of America (GAAP), which require management to make certain estimates and assumptions at the date of the financial statements. Actual results could differ from those estimates. Subsequent events, if any, through the date that the financial statements were issued have been evaluated in the preparation of the financial statements. The following summarizes the significant accounting policies of the Fund:
Investment Valuation. Investments are valued as of 4:00 p.m. Eastern time on the last calendar day of the period. The Board of Trustees (the Board) has delegated the day to day responsibility for the valuation of the Fund's investments to the Fair Value Committee (the Committee) established by the Fund's investment adviser. In accordance with valuation policies and procedures approved by the Board, the Fund attempts to obtain prices from one or more third party pricing vendors or brokers to value its investments. When current market prices, quotations or currency exchange rates are not readily available or reliable, investments will be fair valued in good faith by the Committee, in accordance with procedures adopted by the Board. Factors used in determining fair value vary by investment type and may include market or investment specific events, changes in interest rates and credit quality. The frequency with which these procedures are used cannot be predicted and they may be utilized to a significant extent. The Committee oversees the Fund's valuation policies and procedures and reports to the Board on the Committee's activities and fair value determinations. The Board monitors the appropriateness of the procedures used in valuing the Fund's investments and ratifies the fair value determinations of the Committee.
The Fund categorizes the inputs to valuation techniques used to value its investments into a disclosure hierarchy consisting of three levels as shown below:
- Level 1 – quoted prices in active markets for identical investments
- Level 2 – other significant observable inputs (including quoted prices for similar investments, interest rates, prepayment speeds, etc.)
- Level 3 – unobservable inputs (including the Fund's own assumptions based on the best information available)
Valuation techniques used to value the Fund's investments by major category are as follows:
Equity securities, including restricted securities, for which market quotations are readily available, are valued at the last reported sale price or official closing price as reported by a third party pricing vendor on the primary market or exchange on which they are traded and are categorized as Level 1 in the hierarchy. In the event there were no sales during the day or closing prices are not available, securities are valued at the last quoted bid price or may be valued using the last available price and are generally categorized as Level 2 in the hierarchy. For foreign equity securities, when market or security specific events arise, comparisons to the valuation of American Depositary Receipts (ADRs), futures contracts, Exchange-Traded Funds (ETFs) and certain indexes as well as quoted prices for similar securities may be used and would be categorized as Level 2 in the hierarchy. Utilizing these techniques may result in transfers between Level 1 and Level 2. For equity securities, including restricted securities, where observable inputs are limited, assumptions about market activity and risk are used and these securities may be categorized as Level 3 in the hierarchy.
Debt securities, including restricted securities, are valued based on evaluated prices received from third party pricing vendors or from brokers who make markets in such securities. U.S. government and government agency obligations are valued by pricing vendors who utilize matrix pricing which considers yield or price of bonds of comparable quality, coupon, maturity and type or by broker-supplied prices. When independent prices are unavailable or unreliable, debt securities may be valued utilizing pricing methodologies which consider similar factors that would be used by third party pricing vendors. Debt securities are generally categorized as Level 2 in the hierarchy but may be Level 3 depending on the circumstances.
Futures contracts are valued at the settlement price established each day by the board of trade or exchange on which they are traded and are categorized as Level 1 in the hierarchy. Investments in open-end mutual funds, including the Fidelity Central Funds, are valued at their closing net asset value (NAV) each business day and are categorized as Level 1 in the hierarchy.
Changes in valuation techniques may result in transfers in or out of an assigned level within the disclosure hierarchy. The aggregate value of investments by input level as of May 31, 2017, is included at the end of the Fund's Schedule of Investments.
Foreign Currency. The Fund may use foreign currency contracts to facilitate transactions in foreign-denominated securities. Gains and losses from these transactions may arise from changes in the value of the foreign currency or if the counterparties do not perform under the contracts' terms.
Foreign-denominated assets, including investment securities, and liabilities are translated into U.S. dollars at the exchange rates at period end. Purchases and sales of investment securities, income and dividends received and expenses denominated in foreign currencies are translated into U.S. dollars at the exchange rate in effect on the transaction date.
The effects of exchange rate fluctuations on investments are included with the net realized and unrealized gain (loss) on investment securities. Other foreign currency transactions resulting in realized and unrealized gain (loss) are disclosed separately.
Investment Transactions and Income. For financial reporting purposes, the Fund's investment holdings and NAV include trades executed through the end of the last business day of the period. The NAV per share for processing shareholder transactions is calculated as of the close of business of the New York Stock Exchange (NYSE), normally 4:00 p.m. Eastern time and includes trades executed through the end of the prior business day. Gains and losses on securities sold are determined on the basis of identified cost and may include proceeds received from litigation. Dividend income is recorded on the ex-dividend date, except for certain dividends from foreign securities where the ex-dividend date may have passed, which are recorded as soon as the Fund is informed of the ex-dividend date. Non-cash dividends included in dividend income, if any, are recorded at the fair market value of the securities received. Income and capital gain distributions from Fidelity Central Funds, if any, are recorded on the ex-dividend date. Certain distributions received by the Fund represent a return of capital or capital gain. The Fund determines the components of these distributions subsequent to the ex-dividend date, based upon receipt of tax filings or other correspondence relating to the underlying investment. These distributions are recorded as a reduction of cost of investments and/or as a realized gain. Interest income is accrued as earned and includes coupon interest and amortization of premium and accretion of discount on debt securities as applicable. Investment income is recorded net of foreign taxes withheld where recovery of such taxes is uncertain.
Class Allocations and Expenses. Investment income, realized and unrealized capital gains and losses, common expenses of the Fund, and certain fund-level expense reductions, if any, are allocated daily on a pro-rata basis to each class based on the relative net assets of each class to the total net assets of the Fund. Each class differs with respect to transfer agent and distribution and service plan fees incurred. Certain expense reductions may also differ by class. For the reporting period, the allocated portion of income and expenses to each class as a percent of its average net assets may vary due to the timing of recording these transactions in relation to fluctuating net assets of the classes. Expenses directly attributable to a fund are charged to that fund. Expenses attributable to more than one fund are allocated among the respective funds on the basis of relative net assets or other appropriate methods. Expense estimates are accrued in the period to which they relate and adjustments are made when actual amounts are known.
Income Tax Information and Distributions to Shareholders. Each year, the Fund intends to qualify as a regulated investment company under Subchapter M of the Internal Revenue Code, including distributing substantially all of its taxable income and realized gains. As a result, no provision for U.S. Federal income taxes is required. The Fund files a U.S. federal tax return, in addition to state and local tax returns as required. The Fund's federal income tax returns are subject to examination by the Internal Revenue Service (IRS) for a period of three fiscal years after they are filed. State and local tax returns may be subject to examination for an additional fiscal year depending on the jurisdiction. Foreign taxes are provided for based on the Fund's understanding of the tax rules and rates that exist in the foreign markets in which it invests.
Distributions are declared and recorded on the ex-dividend date. Income dividends and capital gain distributions are declared separately for each class. Income and capital gain distributions are determined in accordance with income tax regulations, which may differ from GAAP.
Capital accounts within the financial statements are adjusted for permanent book-tax differences. These adjustments have no impact on net assets or the results of operations. Capital accounts are not adjusted for temporary book-tax differences which will reverse in a subsequent period.
Book-tax differences are primarily due to futures contracts, market discount, foreign currency transactions, partnerships, deferred trustees compensation, capital loss carryforwards, expiring capital loss carryforwards and losses deferred due to wash sales.
The federal tax cost of investment securities and unrealized appreciation (depreciation) as of period end were as follows:
| Gross unrealized appreciation | $331,707 |
| Gross unrealized depreciation | (82,393) |
| Net unrealized appreciation (depreciation) on securities | $249,314 |
| Tax cost | $2,026,324 |
Capital loss carryforwards are only available to offset future capital gains of the Fund to the extent provided by regulations and may be limited. Under the Regulated Investment Company Modernization Act of 2010 (the Act), the Fund is permitted to carry forward capital losses incurred in taxable years beginning after December 22, 2010 for an unlimited period and such capital losses are required to be used prior to any losses that expire. The capital loss carryforward information presented below, including any applicable limitation, is estimated as of prior fiscal period end and is subject to adjustment.
| Fiscal year of expiration | |
| No expiration | |
| Short-term | $(52,961) |
| Long-term | (33,840) |
| Total capital loss carryforward | $(86,801) |
Restricted Securities. The Fund may invest in securities that are subject to legal or contractual restrictions on resale. These securities generally may be resold in transactions exempt from registration or to the public if the securities are registered. Disposal of these securities may involve time-consuming negotiations and expense, and prompt sale at an acceptable price may be difficult. Information regarding restricted securities is included at the end of the Fund's Schedule of Investments.
4. Derivative Instruments.
Risk Exposures and the Use of Derivative Instruments. The Fund's investment objective allows the Fund to enter into various types of derivative contracts, including futures contracts. Derivatives are investments whose value is primarily derived from underlying assets, indices or reference rates and may be transacted on an exchange or over-the-counter (OTC). Derivatives may involve a future commitment to buy or sell a specified asset based on specified terms, to exchange future cash flows at periodic intervals based on a notional principal amount, or for one party to make one or more payments upon the occurrence of specified events in exchange for periodic payments from the other party.
The Fund used derivatives to increase returns and to manage exposure to certain risks as defined below. The success of any strategy involving derivatives depends on analysis of numerous economic factors, and if the strategies for investment do not work as intended, the Fund may not achieve its objectives.
The Fund's use of derivatives increased or decreased its exposure to the following risk:
| Equity Risk | Equity risk relates to the fluctuations in the value of financial instruments as a result of changes in market prices (other than those arising from interest rate risk or foreign exchange risk), whether caused by factors specific to an individual investment, its issuer, or all factors affecting all instruments traded in a market or market segment. |
The Fund is also exposed to additional risks from investing in derivatives, such as liquidity risk and counterparty credit risk. Liquidity risk is the risk that the Fund will be unable to close out the derivative in the open market in a timely manner. Counterparty credit risk is the risk that the counterparty will not be able to fulfill its obligation to the Fund. Counterparty credit risk related to exchange-traded futures contracts may be mitigated by the protection provided by the exchange on which they trade.
Investing in derivatives may involve greater risks than investing in the underlying assets directly and, to varying degrees, may involve risk of loss in excess of any initial investment and collateral received and amounts recognized in the Statement of Assets and Liabilities. In addition, there may be the risk that the change in value of the derivative contract does not correspond to the change in value of the underlying instrument.
Futures Contracts. A futures contract is an agreement between two parties to buy or sell a specified underlying instrument for a fixed price at a specified future date. The Fund used futures contracts to manage its exposure to the stock market.
Upon entering into a futures contract, a fund is required to deposit either cash or securities (initial margin) with a clearing broker in an amount equal to a certain percentage of the face value of the contract. Futures contracts are marked-to-market daily and subsequent daily payments (variation margin) are made or received by a fund depending on the daily fluctuations in the value of the futures contracts and are recorded as unrealized appreciation or (depreciation). This receivable and/or payable, if any, is included in daily variation margin for derivative instruments in the Statement of Assets and Liabilities. Realized gain or (loss) is recorded upon the expiration or closing of a futures contract.
Any open futures contracts at period end are presented in the Schedule of Investments under the caption "Futures Contracts". The underlying face amount at value reflects each contract's exposure to the underlying instrument or index at period end and is representative of volume of activity during the period. Securities deposited to meet initial margin requirements are identified in the Schedule of Investments.
During the period the Fund recognized net realized gain (loss) of $758 and a change in net unrealized appreciation (depreciation) of $55 related to its investment in futures contracts. These amounts are included in the Statement of Operations.
5. Purchases and Sales of Investments.
Purchases and sales of securities, other than short-term securities, aggregated $962,211 and $996,063, respectively.
6. Fees and Other Transactions with Affiliates.
Management Fee. Fidelity Management & Research Company (the investment adviser) and its affiliates provide the Fund with investment management related services for which the Fund pays a monthly management fee. The management fee is the sum of an individual fund fee rate that is based on an annual rate of .30% of the Fund's average net assets and an annualized group fee rate that averaged .25% during the period. The group fee rate is based upon the average net assets of all the mutual funds advised by the investment adviser, including any mutual funds previously advised by the investment adviser that are currently advised by Fidelity SelectCo, LLC, an affiliate of the investment adviser. The group fee rate decreases as assets under management increase and increases as assets under management decrease. In addition, the management fee is subject to a performance adjustment (up to a maximum of +/- .20% of the Fund's average net assets over a 36 month performance period). The upward or downward adjustment to the management fee is based on the relative investment performance of Class I of the Fund as compared to its benchmark index, the S&P MidCap 400 Index, over the same 36 month performance period. For the reporting period, the total annualized management fee rate, including the performance adjustment, was .35% of the Fund's average net assets. The performance adjustment included in the management fee rate may be higher or lower than the maximum performance adjustment rate due to the difference between the average net assets for the reporting and performance periods.
Distribution and Service Plan Fees. In accordance with Rule 12b-1 of the 1940 Act, the Fund has adopted separate Distribution and Service Plans for each class of shares. Certain classes pay Fidelity Distributors Corporation (FDC), an affiliate of the investment adviser, separate Distribution and Service Fees, each of which is based on an annual percentage of each class' average net assets. In addition, FDC may pay financial intermediaries for selling shares of the Fund and providing shareholder support services. For the period, the Distribution and Service Fee rates, total fees and amounts retained by FDC were as follows:
| Distribution Fee | Service Fee | Total Fees | Retained by FDC | |
| Class A | -% | .25% | $697 | $1 |
| Class M | .25% | .25% | 1,491 | 3 |
| Class C | .75% | .25% | 715 | – |
| $2,903 | $4 |
Sales Load. FDC may receive a front-end sales charge of up to 5.75% for selling Class A shares and 3.50% for selling Class M shares, some of which is paid to financial intermediaries for selling shares of the Fund. Depending on the holding period, FDC may receive contingent deferred sales charges levied on Class A, Class M, and Class C redemptions. The deferred sales charges are 1.00% for Class C shares, 1.00% for certain purchases of Class A shares and .25% for certain purchases of Class M shares.
For the period, sales charge amounts retained by FDC were as follows:
| Retained by FDC | |
| Class A | $19 |
| Class M | 6 |
| Class C(a) | 1 |
| $26 |
(a) When Class C shares are initially sold, FDC pays commissions from its own resources to financial intermediaries through which the sales are made.
Transfer Agent Fees. Fidelity Investments Institutional Operations Company, Inc., (FIIOC), an affiliate of the investment adviser, is the transfer, dividend disbursing and shareholder servicing agent for each class of the Fund. FIIOC receives account fees and asset-based fees that vary according to the account size and type of account of the shareholders of the respective classes of the Fund, except for Class Z. FIIOC receives an asset-based fee of Class Z's average net assets. FIIOC pays for typesetting, printing and mailing of shareholder reports, except proxy statements.
For the period, transfer agent fees for each applicable class were as follows:
| Amount | % of Class-Level Average Net Assets(a) | |
| Class A | $551 | .20 |
| Class M | 563 | .19 |
| Class C | 147 | .21 |
| Fidelity Stock Selector Mid Cap Fund | 298 | .23 |
| Class I | 585 | .20 |
| Class Z | –(b) | .05 |
| $2,144 |
(a) Annualized
(b) In the amount less than five hundred dollars.
Accounting and Security Lending Fees. Fidelity Service Company, Inc. (FSC), an affiliate of the investment adviser, maintains the Fund's accounting records. The accounting fee is based on the level of average net assets for each month. Under a separate contract, FSC administers the security lending program. The security lending fee is based on the number and duration of lending transactions.
Brokerage Commissions. The Fund placed a portion of its portfolio transactions with brokerage firms which are affiliates of the investment adviser. Brokerage commissions are included in net realized gain (loss) and change in net unrealized appreciation (depreciation) in the Statement of Operations. The commissions paid to these affiliated firms were $31 for the period.
Interfund Trades. The Fund may purchase from or sell securities to other Fidelity Funds under procedures adopted by the Board. The procedures have been designed to ensure these interfund trades are executed in accordance with Rule 17a-7 of the 1940 Act. Interfund trades are included within the respective purchases and sales amounts shown in the Purchases and Sales of Investments note.
7. Committed Line of Credit.
The Fund participates with other funds managed by the investment adviser or an affiliate in a $4.25 billion credit facility (the "line of credit") to be utilized for temporary or emergency purposes to fund shareholder redemptions or for other short-term liquidity purposes. The Fund has agreed to pay commitment fees on its pro-rata portion of the line of credit, which amounted to $3 and is reflected in Miscellaneous expenses on the Statement of Operations. During the period, the Fund did not borrow on this line of credit.
8. Security Lending.
The Fund lends portfolio securities through a lending agent from time to time in order to earn additional income. For equity securities, a lending agent is used and may loan securities to certain qualified borrowers, including Fidelity Capital Markets (FCM), a broker-dealer affiliated with the Fund. On the settlement date of the loan, the Fund receives collateral (in the form of U.S. Treasury obligations, letters of credit and/or cash) against the loaned securities and maintains collateral in an amount not less than 100% of the market value of the loaned securities during the period of the loan. The market value of the loaned securities is determined at the close of business of the Fund and any additional required collateral is delivered to the Fund on the next business day. The Fund or borrower may terminate the loan at any time, and if the borrower defaults on its obligation to return the securities loaned because of insolvency or other reasons, the Fund may apply collateral received from the borrower against the obligation. The Fund may experience delays and costs in recovering the securities loaned. Any cash collateral received is invested in the Fidelity Securities Lending Cash Central Fund. The value of loaned securities and cash collateral at period end are disclosed on the Fund's Statement of Assets and Liabilities. The value of securities loaned to FCM at period end was $1,868. Security lending income represents the income earned on investing cash collateral, less rebates paid to borrowers and any lending agent fees associated with the loan, plus any premium payments received for lending certain types of securities. Security lending income is presented in the Statement of Operations as a component of income from Fidelity Central Funds. Total security lending income during the period amounted to $61, including $7 from securities loaned to FCM.
9. Expense Reductions.
The investment adviser voluntarily agreed to reimburse a portion of the Fund's Class A, Class M, Class C, Fidelity Stock Selector Mid Cap Fund and Class I operating expenses. During the period, this reimbursement reduced expenses as follows:
| Reimbursement | |
| Class A | $4 |
| Class M | 4 |
| Class C | 1 |
| Fidelity Stock Selector Mid Cap Fund | 3 |
| Class I | 5 |
| $17 |
Commissions paid to certain brokers with whom the investment adviser, or its affiliates, places trades on behalf of the Fund include an amount in addition to trade execution, which may be rebated back to the Fund to offset certain expenses. This amount totaled $120 for the period.
In addition, during the period the investment adviser reimbursed and/or waived a portion of fund-level operating expenses in the amount of $9.
10. Distributions to Shareholders.
Distributions to shareholders of each class were as follows:
| Six months ended May 31, 2017 | Year ended November 30, 2016 | |
| From net investment income | ||
| Class A | $3,079 | $755 |
| Class M | 1,865 | – |
| Fidelity Stock Selector Mid Cap Fund | 1,644 | 1,674 |
| Class I | 4,120 | 1,530 |
| Total | $10,708 | $3,959 |
| From net realized gain | ||
| Class A | $98 | $9,744 |
| Class M | 105 | 11,098 |
| Class B | – | 166 |
| Class C | – | 2,758 |
| Fidelity Stock Selector Mid Cap Fund | 39 | 7,708 |
| Class I | 91 | 7,742 |
| Total | $333 | $39,216 |
11. Share Transactions.
Share transactions for each class were as follows and may contain automatic conversions between classes or exchanges between affiliated funds:
| Shares | Shares | Dollars | Dollars | |
| Six months ended May 31, 2017 (a) | Year ended November 30, 2016 | Six months ended May 31, 2017 (a) | Year ended November 30, 2016 | |
| Class A | ||||
| Shares sold | 533 | 1,039 | $18,796 | $31,500 |
| Reinvestment of distributions | 88 | 331 | 2,963 | 9,838 |
| Shares redeemed | (1,760) | (3,402) | (61,748) | (104,169) |
| Net increase (decrease) | (1,139) | (2,032) | $(39,989) | $(62,831) |
| Class M | ||||
| Shares sold | 560 | 1,180 | $19,670 | $36,250 |
| Reinvestment of distributions | 55 | 356 | 1,885 | 10,639 |
| Shares redeemed | (2,345) | (4,950) | (82,773) | (152,516) |
| Net increase (decrease) | (1,730) | (3,414) | $(61,218) | $(105,627) |
| Class B | ||||
| Shares sold | – | 1 | $– | $31 |
| Reinvestment of distributions | – | 5 | – | 145 |
| Shares redeemed | – | (331) | – | (9,046) |
| Net increase (decrease) | – | (325) | $– | $(8,870) |
| Class C | ||||
| Shares sold | 86 | 114 | $2,746 | $3,221 |
| Reinvestment of distributions | – | 90 | – | 2,469 |
| Shares redeemed | (451) | (819) | (14,517) | (23,061) |
| Net increase (decrease) | (365) | (615) | $(11,771) | $(17,371) |
| Fidelity Stock Selector Mid Cap Fund | ||||
| Shares sold | 3,801 | 1,163 | $140,563 | $37,438 |
| Reinvestment of distributions | 47 | 300 | 1,639 | 9,281 |
| Shares redeemed | (625) | (9,609) | (22,863) | (298,117) |
| Net increase (decrease) | 3,223 | (8,146) | $119,339 | $(251,398) |
| Class I | ||||
| Shares sold | 2,421 | 5,294 | $89,040 | $166,666 |
| Reinvestment of distributions | 114 | 291 | 4,019 | 9,016 |
| Shares redeemed | (1,678) | (4,795) | (61,302) | (150,903) |
| Net increase (decrease) | 857 | 790 | $31,757 | $24,779 |
| Class Z | ||||
| Shares sold | 8 | – | $304 | $– |
| Net increase (decrease) | 8 | – | $304 | $– |
(a) Share transactions for Class Z are for the period February 1, 2017 (commencement of sale of shares) to May 31, 2017.
12. Other.
The Fund's organizational documents provide former and current trustees and officers with a limited indemnification against liabilities arising in connection with the performance of their duties to the Fund. In the normal course of business, the Fund may also enter into contracts that provide general indemnifications. The Fund's maximum exposure under these arrangements is unknown as this would be dependent on future claims that may be made against the Fund. The risk of material loss from such claims is considered remote.
Shareholder Expense Example
As a shareholder of the Fund, you incur two types of costs: (1) transaction costs, including sales charges (loads) on purchase payments or redemption proceeds, and (2) ongoing costs, including management fees, distribution and/or service (12b-1) fees and other Fund expenses. This Example is intended to help you understand your ongoing costs (in dollars) of investing in the Fund and to compare these costs with the ongoing costs of investing in other mutual funds.
The actual expense Example is based on an investment of $1,000 invested at the beginning of the period and held for the entire period (December 1, 2016 to May 31, 2017) for Class A, Class M, Class C, Fidelity Stock Selector Mid Cap Fund, and Class I and for the period (February 1, 2017 to May 31, 2017) for Class Z. The hypothetical expense Example is based on an investment of $1,000 invested for the one-half year period (December 1, 2016 to May 31, 2017).
Actual Expenses
The first line of the accompanying table for each class of the Fund provides information about actual account values and actual expenses. You may use the information in this line, together with the amount you invested, to estimate the expenses that you paid over the period. Simply divide your account value by $1,000.00 (for example, an $8,600 account value divided by $1,000.00 = 8.6), then multiply the result by the number in the first line for a class of the Fund under the heading entitled "Expenses Paid During Period" to estimate the expenses you paid on your account during this period. A small balance maintenance fee of $12.00 that is charged once a year may apply for certain accounts with a value of less than $2,000. This fee is not included in the table below. If it was, the estimate of expenses you paid during the period would be higher, and your ending account value lower, by this amount. In addition, the Fund, as a shareholder in the underlying Fidelity Central Funds, will indirectly bear its pro-rata share of the fees and expenses incurred by the underlying Fidelity Central Funds. These fees and expenses are not included in the Fund's annualized expense ratio used to calculate the expense estimate in the table below.
Hypothetical Example for Comparison Purposes
The second line of the accompanying table for each class of the Fund provides information about hypothetical account values and hypothetical expenses based on a Class' actual expense ratio and an assumed rate of return of 5% per year before expenses, which is not the Class' actual return. The hypothetical account values and expenses may not be used to estimate the actual ending account balance or expenses you paid for the period. You may use this information to compare the ongoing costs of investing in the Fund and other funds. To do so, compare this 5% hypothetical example with the 5% hypothetical examples that appear in the shareholder reports of the other funds. A small balance maintenance fee of $12.00 that is charged once a year may apply for certain accounts with a value of less than $2,000. This fee is not included in the table below. If it was, the estimate of expenses you paid during the period would be higher, and your ending account value lower, by this amount. In addition, the Fund, as a shareholder in the underlying Fidelity Central Funds, will indirectly bear its pro-rata share of the fees and expenses incurred by the underlying Fidelity Central Funds. These fees and expenses are not included in the Fund's annualized expense ratio used to calculate the expense estimate in the table below.
Please note that the expenses shown in the table are meant to highlight your ongoing costs only and do not reflect any transaction costs. Therefore, the second line of the table is useful in comparing ongoing costs only, and will not help you determine the relative total costs of owning different funds. In addition, if these transactional costs were included, your costs would have been higher.
| Annualized Expense Ratio-A | Beginning Account Value | Ending Account Value May 31, 2017 | Expenses Paid During Period | |
| Class A | .84% | |||
| Actual | $1,000.00 | $1,096.20 | $4.39-B | |
| Hypothetical-C | $1,000.00 | $1,020.74 | $4.23-D | |
| Class M | 1.08% | |||
| Actual | $1,000.00 | $1,095.00 | $5.64-B | |
| Hypothetical-C | $1,000.00 | $1,019.55 | $5.44-D | |
| Class C | 1.60% | |||
| Actual | $1,000.00 | $1,092.10 | $8.35-B | |
| Hypothetical-C | $1,000.00 | $1,016.95 | $8.05-D | |
| Fidelity Stock Selector Mid Cap Fund | .62% | |||
| Actual | $1,000.00 | $1,097.60 | $3.24-B | |
| Hypothetical-C | $1,000.00 | $1,021.84 | $3.13-D | |
| Class I | .60% | |||
| Actual | $1,000.00 | $1,097.60 | $3.14-B | |
| Hypothetical-C | $1,000.00 | $1,021.94 | $3.02-D | |
| Class Z | .44% | |||
| Actual | $1,000.00 | $1,053.40 | $1.49-B | |
| Hypothetical-C | $1,000.00 | $1,022.74 | $2.22-D |
A Annualized expense ratio reflects expenses net of applicable fee waivers.
B Actual expenses are equal to each Class' annualized expense ratio, multiplied by the average account value over the period, multiplied by 182/365 (to reflect the one-half year period) for Class A, Class M, Class C, Fidelity Stock Selector Mid Cap Fund and Class I and multiplied by 120/365 (to reflect the period February 1, 2017 to May 31, 2017) for Class Z.
C 5% return per year before expenses
D Hypothetical expenses are equal to each Class' annualized expense ratio, multiplied by the average account value over the period, multiplied by 182/365 (to reflect the one-half year period).
![]()
Corporate Headquarters
245 Summer St.
Boston, MA 02210
www.fidelity.com
SKD-SANN-0717
1.940902.104
Fidelity® Value Strategies Fund Semi-Annual Report May 31, 2017 (A class of Fidelity Advisor® Value Strategies Fund) |
|
Contents
To view a fund's proxy voting guidelines and proxy voting record for the 12-month period ended June 30, visit http://www.fidelity.com/proxyvotingresults or visit the Securities and Exchange Commission's (SEC) web site at http://www.sec.gov.
You may also call 1-800-835-5092 to request a free copy of the proxy voting guidelines.
Standard & Poor's, S&P and S&P 500 are registered service marks of The McGraw-Hill Companies, Inc. and have been licensed for use by Fidelity Distributors Corporation.
Other third-party marks appearing herein are the property of their respective owners.
All other marks appearing herein are registered or unregistered trademarks or service marks of FMR LLC or an affiliated company. © 2017 FMR LLC. All rights reserved.
This report and the financial statements contained herein are submitted for the general information of the shareholders of the Fund. This report is not authorized for distribution to prospective investors in the Fund unless preceded or accompanied by an effective prospectus.
A fund files its complete schedule of portfolio holdings with the SEC for the first and third quarters of each fiscal year on Form N-Q. Forms N-Q are available on the SEC’s web site at http://www.sec.gov. A fund's Forms N-Q may be reviewed and copied at the SEC’s Public Reference Room in Washington, DC. Information regarding the operation of the SEC's Public Reference Room may be obtained by calling 1-800-SEC-0330.
For a complete list of a fund's portfolio holdings, view the most recent holdings listing, semiannual report, or annual report on Fidelity's web site at http://www.fidelity.com, http://www.institutional.fidelity.com, or http://www.401k.com, as applicable.
NOT FDIC INSURED •MAY LOSE VALUE •NO BANK GUARANTEE
Neither the Fund nor Fidelity Distributors Corporation is a bank.
Investment Summary (Unaudited)
Top Ten Stocks as of May 31, 2017
| % of fund's net assets | % of fund's net assets 6 months ago | |
| American Tower Corp. | 3.4 | 2.4 |
| Edison International | 3.3 | 3.1 |
| Sempra Energy | 3.1 | 3.0 |
| U.S. Bancorp | 2.4 | 2.6 |
| Synchrony Financial | 2.2 | 2.7 |
| American Electric Power Co., Inc. | 2.2 | 2.0 |
| Extra Space Storage, Inc. | 2.2 | 1.9 |
| Jazz Pharmaceuticals PLC | 2.2 | 1.6 |
| Equity Lifestyle Properties, Inc. | 2.0 | 0.8 |
| Douglas Emmett, Inc. | 1.9 | 0.0 |
| 24.9 |
Top Five Market Sectors as of May 31, 2017
| % of fund's net assets | % of fund's net assets 6 months ago | |
| Financials | 16.3 | 18.3 |
| Real Estate | 13.8 | 11.2 |
| Information Technology | 11.5 | 11.8 |
| Industrials | 11.3 | 10.2 |
| Consumer Discretionary | 9.7 | 12.5 |
Asset Allocation (% of fund's net assets)
| As of May 31, 2017* | ||
| Stocks | 99.2% | |
| Convertible Securities | 0.6% | |
| Short-Term Investments and Net Other Assets (Liabilities) | 0.2% | |

* Foreign investments - 16.7%
| As of November 30, 2016* | ||
| Stocks | 99.0% | |
| Convertible Securities | 0.7% | |
| Short-Term Investments and Net Other Assets (Liabilities) | 0.3% | |

* Foreign investments - 16.3%
Percentages shown as 0.0% may reflect amounts less than 0.05%.
Investments May 31, 2017 (Unaudited)
Showing Percentage of Net Assets
| Common Stocks - 99.2% | |||
| Shares | Value (000s) | ||
| CONSUMER DISCRETIONARY - 9.7% | |||
| Auto Components - 1.7% | |||
| Delphi Automotive PLC | 210,377 | $18,507 | |
| Diversified Consumer Services - 2.9% | |||
| Houghton Mifflin Harcourt Co. (a) | 1,039,456 | 12,837 | |
| Service Corp. International | 553,650 | 17,650 | |
| 30,487 | |||
| Hotels, Restaurants & Leisure - 1.0% | |||
| Wyndham Worldwide Corp. | 106,867 | 10,792 | |
| Leisure Products - 0.3% | |||
| Vista Outdoor, Inc. (a) | 169,156 | 3,549 | |
| Media - 3.2% | |||
| Liberty Broadband Corp. Class C (a) | 105,415 | 9,400 | |
| Liberty Global PLC Class C (a) | 249,900 | 7,427 | |
| Sinclair Broadcast Group, Inc. Class A (b) | 347,799 | 11,269 | |
| Twenty-First Century Fox, Inc. Class A | 238,000 | 6,455 | |
| 34,551 | |||
| Specialty Retail - 0.6% | |||
| GameStop Corp. Class A (b) | 305,313 | 6,760 | |
| TOTAL CONSUMER DISCRETIONARY | 104,646 | ||
| CONSUMER STAPLES - 4.1% | |||
| Beverages - 1.1% | |||
| Cott Corp. | 896,364 | 11,825 | |
| Food & Staples Retailing - 1.8% | |||
| Kroger Co. | 264,700 | 7,883 | |
| Whole Foods Market, Inc. | 326,356 | 11,419 | |
| 19,302 | |||
| Food Products - 1.2% | |||
| Darling International, Inc. (a) | 839,122 | 13,149 | |
| TOTAL CONSUMER STAPLES | 44,276 | ||
| ENERGY - 7.4% | |||
| Energy Equipment & Services - 1.2% | |||
| Baker Hughes, Inc. | 227,230 | 12,532 | |
| Oil, Gas & Consumable Fuels - 6.2% | |||
| Anadarko Petroleum Corp. | 152,500 | 7,706 | |
| Boardwalk Pipeline Partners, LP | 740,936 | 13,389 | |
| Cabot Oil & Gas Corp. | 330,200 | 7,327 | |
| ConocoPhillips Co. | 302,300 | 13,510 | |
| EQT Corp. | 96,200 | 5,317 | |
| GasLog Ltd. (b) | 543,261 | 7,035 | |
| Teekay Corp. (b) | 1,472,713 | 8,998 | |
| Teekay Offshore Partners LP | 1,330,500 | 4,164 | |
| 67,446 | |||
| TOTAL ENERGY | 79,978 | ||
| FINANCIALS - 16.3% | |||
| Banks - 5.1% | |||
| PNC Financial Services Group, Inc. | 91,100 | 10,814 | |
| U.S. Bancorp | 515,484 | 26,233 | |
| Wells Fargo & Co. | 346,470 | 17,718 | |
| 54,765 | |||
| Capital Markets - 3.6% | |||
| Apollo Global Management LLC Class A | 443,250 | 11,981 | |
| Legg Mason, Inc. | 370,317 | 13,654 | |
| The Blackstone Group LP | 402,800 | 13,244 | |
| 38,879 | |||
| Consumer Finance - 4.4% | |||
| Discover Financial Services | 226,200 | 13,278 | |
| OneMain Holdings, Inc. (a) | 445,100 | 10,041 | |
| Synchrony Financial | 886,613 | 23,806 | |
| 47,125 | |||
| Insurance - 3.2% | |||
| Chubb Ltd. | 98,682 | 14,130 | |
| FNF Group | 481,359 | 20,511 | |
| 34,641 | |||
| TOTAL FINANCIALS | 175,410 | ||
| HEALTH CARE - 7.9% | |||
| Biotechnology - 2.4% | |||
| Amgen, Inc. | 79,200 | 12,295 | |
| United Therapeutics Corp. (a) | 112,300 | 13,576 | |
| 25,871 | |||
| Health Care Providers & Services - 2.5% | |||
| Aetna, Inc. | 69,400 | 10,053 | |
| Envision Healthcare Corp. (a) | 127,151 | 6,944 | |
| Laboratory Corp. of America Holdings (a) | 71,578 | 9,949 | |
| 26,946 | |||
| Pharmaceuticals - 3.0% | |||
| Jazz Pharmaceuticals PLC (a) | 160,400 | 23,348 | |
| Teva Pharmaceutical Industries Ltd. sponsored ADR | 332,300 | 9,258 | |
| 32,606 | |||
| TOTAL HEALTH CARE | 85,423 | ||
| INDUSTRIALS - 11.3% | |||
| Aerospace & Defense - 2.2% | |||
| KLX, Inc. (a) | 265,610 | 12,853 | |
| Rockwell Collins, Inc. | 96,300 | 10,502 | |
| 23,355 | |||
| Airlines - 1.2% | |||
| Delta Air Lines, Inc. | 265,900 | 13,064 | |
| Commercial Services & Supplies - 1.6% | |||
| IWG PLC | 1,635,100 | 7,001 | |
| KAR Auction Services, Inc. | 231,200 | 10,073 | |
| 17,074 | |||
| Construction & Engineering - 1.3% | |||
| AECOM (a) | 450,400 | 14,462 | |
| Machinery - 2.8% | |||
| Allison Transmission Holdings, Inc. | 451,275 | 17,473 | |
| Ingersoll-Rand PLC | 135,700 | 12,159 | |
| 29,632 | |||
| Road & Rail - 0.6% | |||
| Swift Transporation Co. (a) | 282,800 | 6,773 | |
| Trading Companies & Distributors - 1.6% | |||
| AerCap Holdings NV (a) | 393,437 | 17,319 | |
| TOTAL INDUSTRIALS | 121,679 | ||
| INFORMATION TECHNOLOGY - 11.5% | |||
| Communications Equipment - 1.2% | |||
| CommScope Holding Co., Inc. (a) | 346,568 | 12,820 | |
| Electronic Equipment & Components - 1.6% | |||
| Jabil Circuit, Inc. | 102,109 | 3,055 | |
| TE Connectivity Ltd. | 176,981 | 13,955 | |
| 17,010 | |||
| IT Services - 7.3% | |||
| Amdocs Ltd. | 169,000 | 10,948 | |
| Cognizant Technology Solutions Corp. Class A | 268,500 | 17,965 | |
| DXC Technology Co. | 263,400 | 20,419 | |
| First Data Corp. Class A (a) | 881,140 | 15,094 | |
| Total System Services, Inc. | 227,900 | 13,571 | |
| 77,997 | |||
| Semiconductors & Semiconductor Equipment - 1.4% | |||
| Qualcomm, Inc. | 267,600 | 15,325 | |
| TOTAL INFORMATION TECHNOLOGY | 123,152 | ||
| MATERIALS - 8.6% | |||
| Chemicals - 6.9% | |||
| CF Industries Holdings, Inc. | 348,953 | 9,387 | |
| E.I. du Pont de Nemours & Co. | 233,600 | 18,436 | |
| Eastman Chemical Co. | 216,934 | 17,379 | |
| LyondellBasell Industries NV Class A | 178,492 | 14,372 | |
| Westlake Chemical Corp. | 239,703 | 14,732 | |
| 74,306 | |||
| Containers & Packaging - 1.7% | |||
| Ball Corp. | 254,666 | 10,416 | |
| Sealed Air Corp. | 178,100 | 7,911 | |
| 18,327 | |||
| TOTAL MATERIALS | 92,633 | ||
| REAL ESTATE - 13.8% | |||
| Equity Real Estate Investment Trusts (REITs) - 12.5% | |||
| American Tower Corp. | 278,208 | 36,496 | |
| Douglas Emmett, Inc. | 551,900 | 20,950 | |
| Equinix, Inc. | 43,600 | 19,228 | |
| Equity Lifestyle Properties, Inc. | 253,700 | 21,412 | |
| Extra Space Storage, Inc. | 301,728 | 23,375 | |
| Outfront Media, Inc. | 551,504 | 12,602 | |
| 134,063 | |||
| Real Estate Management & Development - 1.3% | |||
| CBRE Group, Inc. (a) | 402,400 | 14,036 | |
| TOTAL REAL ESTATE | 148,099 | ||
| UTILITIES - 8.6% | |||
| Electric Utilities - 5.5% | |||
| American Electric Power Co., Inc. | 325,742 | 23,382 | |
| Edison International | 435,971 | 35,562 | |
| 58,944 | |||
| Multi-Utilities - 3.1% | |||
| Sempra Energy | 291,888 | 34,002 | |
| TOTAL UTILITIES | 92,946 | ||
| TOTAL COMMON STOCKS | |||
| (Cost $934,096) | 1,068,242 | ||
| Principal Amount (000s) | Value (000s) | ||
| Convertible Bonds - 0.6% | |||
| ENERGY - 0.6% | |||
| Oil, Gas & Consumable Fuels - 0.6% | |||
| Cobalt International Energy, Inc. 2.625% 12/1/19 (Cost $9,900) | 18,190 | 6,374 | |
| Shares | Value (000s) | ||
| Money Market Funds - 2.5% | |||
| Fidelity Cash Central Fund, 0.86% (c) | 2,331,345 | 2,332 | |
| Fidelity Securities Lending Cash Central Fund 0.87% (c)(d) | 24,933,416 | 24,936 | |
| TOTAL MONEY MARKET FUNDS | |||
| (Cost $27,268) | 27,268 | ||
| TOTAL INVESTMENT PORTFOLIO - 102.3% | |||
| (Cost $971,264) | 1,101,884 | ||
| NET OTHER ASSETS (LIABILITIES) - (2.3)% | (24,933) | ||
| NET ASSETS - 100% | $1,076,951 |
Legend
(a) Non-income producing
(b) Security or a portion of the security is on loan at period end.
(c) Affiliated fund that is generally available only to investment companies and other accounts managed by Fidelity Investments. The rate quoted is the annualized seven-day yield of the fund at period end. A complete unaudited listing of the fund's holdings as of its most recent quarter end is available upon request. In addition, each Fidelity Central Fund's financial statements are available on the SEC's website or upon request.
(d) Investment made with cash collateral received from securities on loan.
Affiliated Central Funds
Information regarding fiscal year to date income earned by the Fund from investments in Fidelity Central Funds is as follows:
| Fund | Income earned |
| (Amounts in thousands) | |
| Fidelity Cash Central Fund | $11 |
| Fidelity Securities Lending Cash Central Fund | 27 |
| Total | $38 |
Investment Valuation
The following is a summary of the inputs used, as of May 31, 2017, involving the Fund's assets and liabilities carried at fair value. The inputs or methodology used for valuing securities may not be an indication of the risk associated with investing in those securities. For more information on valuation inputs, and their aggregation into the levels used below, please refer to the Investment Valuation section in the accompanying Notes to Financial Statements.
| Valuation Inputs at Reporting Date: | ||||
| Description | Total | Level 1 | Level 2 | Level 3 |
| (Amounts in thousands) | ||||
| Investments in Securities: | ||||
| Equities: | ||||
| Consumer Discretionary | $104,646 | $104,646 | $-- | $-- |
| Consumer Staples | 44,276 | 44,276 | -- | -- |
| Energy | 79,978 | 79,978 | -- | -- |
| Financials | 175,410 | 175,410 | -- | -- |
| Health Care | 85,423 | 85,423 | -- | -- |
| Industrials | 121,679 | 121,679 | -- | -- |
| Information Technology | 123,152 | 123,152 | -- | -- |
| Materials | 92,633 | 92,633 | -- | -- |
| Real Estate | 148,099 | 148,099 | -- | -- |
| Utilities | 92,946 | 92,946 | -- | -- |
| Corporate Bonds | 6,374 | -- | 6,374 | -- |
| Money Market Funds | 27,268 | 27,268 | -- | -- |
| Total Investments in Securities: | $1,101,884 | $1,095,510 | $6,374 | $-- |
Other Information
Distribution of investments by country or territory of incorporation, as a percentage of Total Net Assets, is as follows (Unaudited):
| United States of America | 83.3% |
| Ireland | 3.4% |
| Netherlands | 2.9% |
| Switzerland | 2.6% |
| Bailiwick of Jersey | 2.4% |
| Marshall Islands | 1.2% |
| Canada | 1.1% |
| Bailiwick of Guernsey | 1.0% |
| Others (Individually Less Than 1%) | 2.1% |
| 100.0% |
See accompanying notes which are an integral part of the financial statements.
Financial Statements
Statement of Assets and Liabilities
| Amounts in thousands (except per-share amounts) | May 31, 2017 (Unaudited) | |
| Assets | ||
| Investment in securities, at value (including securities loaned of $23,947) — See accompanying schedule: Unaffiliated issuers (cost $943,996) | $1,074,616 | |
| Fidelity Central Funds (cost $27,268) | 27,268 | |
| Total Investments (cost $971,264) | $1,101,884 | |
| Receivable for investments sold | 2,632 | |
| Receivable for fund shares sold | 240 | |
| Dividends receivable | 1,285 | |
| Interest receivable | 242 | |
| Distributions receivable from Fidelity Central Funds | 9 | |
| Other receivables | 11 | |
| Total assets | 1,106,303 | |
| Liabilities | ||
| Payable for investments purchased | $1,145 | |
| Payable for fund shares redeemed | 2,517 | |
| Accrued management fee | 334 | |
| Distribution and service plan fees payable | 188 | |
| Other affiliated payables | 197 | |
| Other payables and accrued expenses | 34 | |
| Collateral on securities loaned | 24,937 | |
| Total liabilities | 29,352 | |
| Net Assets | $1,076,951 | |
| Net Assets consist of: | ||
| Paid in capital | $892,078 | |
| Undistributed net investment income | 6,820 | |
| Accumulated undistributed net realized gain (loss) on investments and foreign currency transactions | 47,433 | |
| Net unrealized appreciation (depreciation) on investments and assets and liabilities in foreign currencies | 130,620 | |
| Net Assets | $1,076,951 | |
| Calculation of Maximum Offering Price | ||
| Class A: | ||
| Net Asset Value and redemption price per share ($201,183 ÷ 5,681.8 shares) | $35.41 | |
| Maximum offering price per share (100/94.25 of $35.41) | $37.57 | |
| Class M: | ||
| Net Asset Value and redemption price per share ($259,598 ÷ 7,002.7 shares) | $37.07 | |
| Maximum offering price per share (100/96.50 of $37.07) | $38.41 | |
| Class C: | ||
| Net Asset Value and offering price per share ($44,530 ÷ 1,430.2 shares)(a) | $31.14 | |
| Fidelity Value Strategies Fund: | ||
| Net Asset Value, offering price and redemption price per share ($437,687 ÷ 10,748.1 shares) | $40.72 | |
| Class K: | ||
| Net Asset Value, offering price and redemption price per share ($63,354 ÷ 1,556.7 shares) | $40.70 | |
| Class I: | ||
| Net Asset Value, offering price and redemption price per share ($70,599 ÷ 1,837.4 shares) | $38.42 |
(a) Redemption price per share is equal to net asset value less any applicable contingent deferred sales charge.
See accompanying notes which are an integral part of the financial statements.
Statement of Operations
| Amounts in thousands | Six months ended May 31, 2017 (Unaudited) | |
| Investment Income | ||
| Dividends | $11,973 | |
| Interest | 1,354 | |
| Income from Fidelity Central Funds | 38 | |
| Total income | 13,365 | |
| Expenses | ||
| Management fee | ||
| Basic fee | $3,166 | |
| Performance adjustment | (1,210) | |
| Transfer agent fees | 1,039 | |
| Distribution and service plan fees | 1,143 | |
| Accounting and security lending fees | 189 | |
| Custodian fees and expenses | 21 | |
| Independent trustees' fees and expenses | 3 | |
| Registration fees | 70 | |
| Audit | 33 | |
| Legal | 4 | |
| Interest | 4 | |
| Miscellaneous | 6 | |
| Total expenses before reductions | 4,468 | |
| Expense reductions | (53) | 4,415 |
| Net investment income (loss) | 8,950 | |
| Realized and Unrealized Gain (Loss) | ||
| Net realized gain (loss) on: | ||
| Investment securities: | ||
| Unaffiliated issuers | 46,986 | |
| Fidelity Central Funds | (2) | |
| Foreign currency transactions | (3) | |
| Total net realized gain (loss) | 46,981 | |
| Change in net unrealized appreciation (depreciation) on: Investment securities | 49,448 | |
| Total change in net unrealized appreciation (depreciation) | 49,448 | |
| Net gain (loss) | 96,429 | |
| Net increase (decrease) in net assets resulting from operations | $105,379 |
See accompanying notes which are an integral part of the financial statements.
Statement of Changes in Net Assets
| Amounts in thousands | Six months ended May 31, 2017 (Unaudited) | Year ended November 30, 2016 |
| Increase (Decrease) in Net Assets | ||
| Operations | ||
| Net investment income (loss) | $8,950 | $22,186 |
| Net realized gain (loss) | 46,981 | 392,411 |
| Change in net unrealized appreciation (depreciation) | 49,448 | (369,931) |
| Net increase (decrease) in net assets resulting from operations | 105,379 | 44,666 |
| Distributions to shareholders from net investment income | (18,090) | (15,368) |
| Distributions to shareholders from net realized gain | (229,818) | (316) |
| Total distributions | (247,908) | (15,684) |
| Share transactions - net increase (decrease) | (143,630) | (80,508) |
| Total increase (decrease) in net assets | (286,159) | (51,526) |
| Net Assets | ||
| Beginning of period | 1,363,110 | 1,414,636 |
| End of period | $1,076,951 | $1,363,110 |
| Other Information | ||
| Undistributed net investment income end of period | $6,820 | $15,960 |
See accompanying notes which are an integral part of the financial statements.
Financial Highlights — Fidelity Advisor Value Strategies Fund Class A
| Six months ended (Unaudited) May 31, | Years ended November 30, | |||||
| 2017 | 2016 | 2015 | 2014 | 2013 | 2012 | |
| Selected Per–Share Data | ||||||
| Net asset value, beginning of period | $40.25 | $39.01 | $38.91 | $36.02 | $27.62 | $22.71 |
| Income from Investment Operations | ||||||
| Net investment income (loss)A | .26 | .56 | .35 | .25 | .23 | –B |
| Net realized and unrealized gain (loss) | 2.97 | 1.09 | .06 | 2.87 | 8.25 | 5.03 |
| Total from investment operations | 3.23 | 1.65 | .41 | 3.12 | 8.48 | 5.03 |
| Distributions from net investment income | (.56) | (.40) | (.28)C | (.23) | (.08) | (.12) |
| Distributions from net realized gain | (7.52) | (.01) | (.03)C | – | – | – |
| Total distributions | (8.07)D | (.41) | (.31) | (.23) | (.08) | (.12) |
| Net asset value, end of period | $35.41 | $40.25 | $39.01 | $38.91 | $36.02 | $27.62 |
| Total ReturnE,F,G | 9.06% | 4.33% | 1.07% | 8.74% | 30.77% | 22.29% |
| Ratios to Average Net AssetsH,I | ||||||
| Expenses before reductions | .86%J | .86% | .93% | .96% | 1.04% | 1.21% |
| Expenses net of fee waivers, if any | .85%J | .86% | .93% | .96% | 1.04% | 1.21% |
| Expenses net of all reductions | .85%J | .86% | .93% | .96% | 1.03% | 1.21% |
| Net investment income (loss) | 1.46%J | 1.48% | .89% | .68% | .73% | - %B |
| Supplemental Data | ||||||
| Net assets, end of period (in millions) | $201 | $203 | $215 | $233 | $243 | $203 |
| Portfolio turnover rateK | 40%J | 121% | 9% | 6% | 22% | 23% |
A Calculated based on average shares outstanding during the period.
B Net Investment income per share reflects a large, non-recurring dividend which amounted to $.07 per share. Excluding this non-recurring dividend, the ratio of net investment income (loss) to average net assets would have been (.28) %.
C The amounts shown reflect certain reclassifications related to book to tax differences that were made in the year shown.
D Total distributions of $8.07 per share is comprised of distributions from net investment income of $.555 and distributions from net realized gain of $7.517 per share.
E Total returns for periods of less than one year are not annualized.
F Total returns would have been lower if certain expenses had not been reduced during the applicable periods shown.
G Total returns do not include the effect of the sales charges.
H Fees and expenses of any underlying Fidelity Central Funds are not included in the Fund's expense ratio. The Fund indirectly bears its proportionate share of the expenses of any underlying Fidelity Central Funds.
I Expense ratios reflect operating expenses of the class. Expenses before reductions do not reflect amounts reimbursed by the investment adviser or reductions from brokerage service arrangements or reductions from other expense offset arrangements and do not represent the amount paid by the class during periods when reimbursements or reductions occur. Expenses net of fee waivers reflect expenses after reimbursement by the investment adviser but prior to reductions from brokerage service arrangements or other expense offset arrangements. Expenses net of all reductions represent the net expenses paid by the class.
J Annualized
K Amount does not include the portfolio activity of any underlying Fidelity Central Funds.
See accompanying notes which are an integral part of the financial statements.
Financial Highlights — Fidelity Advisor Value Strategies Fund Class M
| Six months ended (Unaudited) May 31, | Years ended November 30, | |||||
| 2017 | 2016 | 2015 | 2014 | 2013 | 2012 | |
| Selected Per–Share Data | ||||||
| Net asset value, beginning of period | $41.72 | $40.40 | $40.28 | $37.28 | $28.58 | $23.48 |
| Income from Investment Operations | ||||||
| Net investment income (loss)A | .23 | .49 | .28 | .18 | .18 | (.05)B |
| Net realized and unrealized gain (loss) | 3.09 | 1.14 | .06 | 2.98 | 8.54 | 5.22 |
| Total from investment operations | 3.32 | 1.63 | .34 | 3.16 | 8.72 | 5.17 |
| Distributions from net investment income | (.46) | (.30) | (.19)C | (.16) | (.02) | (.07) |
| Distributions from net realized gain | (7.52) | (.01) | (.03)C | – | – | – |
| Total distributions | (7.97)D | (.31) | (.22) | (.16) | (.02) | (.07) |
| Net asset value, end of period | $37.07 | $41.72 | $40.40 | $40.28 | $37.28 | $28.58 |
| Total ReturnE,F,G | 8.93% | 4.11% | .86% | 8.51% | 30.52% | 22.08% |
| Ratios to Average Net AssetsH,I | ||||||
| Expenses before reductions | 1.08%J | 1.08% | 1.15% | 1.17% | 1.23% | 1.38% |
| Expenses net of fee waivers, if any | 1.08%J | 1.08% | 1.14% | 1.17% | 1.23% | 1.38% |
| Expenses net of all reductions | 1.07%J | 1.07% | 1.14% | 1.17% | 1.22% | 1.38% |
| Net investment income (loss) | 1.24%J | 1.27% | .68% | .47% | .54% | (.17)%B |
| Supplemental Data | ||||||
| Net assets, end of period (in millions) | $260 | $263 | $294 | $324 | $335 | $283 |
| Portfolio turnover rateK | 40%J | 121% | 9% | 6% | 22% | 23% |
A Calculated based on average shares outstanding during the period.
B Net Investment income per share reflects a large, non-recurring dividend which amounted to $.07 per share. Excluding this non-recurring dividend, the ratio of net investment income (loss) to average net assets would have been (.45) %.
C The amounts shown reflect certain reclassifications related to book to tax differences that were made in the year shown.
D Total distributions of $7.97 per share is comprised of distributions from net investment income of $.456 and distributions from net realized gain of $7.517 per share.
E Total returns for periods of less than one year are not annualized.
F Total returns would have been lower if certain expenses had not been reduced during the applicable periods shown.
G Total returns do not include the effect of the sales charges.
H Fees and expenses of any underlying Fidelity Central Funds are not included in the Fund's expense ratio. The Fund indirectly bears its proportionate share of the expenses of any underlying Fidelity Central Funds.
I Expense ratios reflect operating expenses of the class. Expenses before reductions do not reflect amounts reimbursed by the investment adviser or reductions from brokerage service arrangements or reductions from other expense offset arrangements and do not represent the amount paid by the class during periods when reimbursements or reductions occur. Expenses net of fee waivers reflect expenses after reimbursement by the investment adviser but prior to reductions from brokerage service arrangements or other expense offset arrangements. Expenses net of all reductions represent the net expenses paid by the class.
J Annualized
K Amount does not include the portfolio activity of any underlying Fidelity Central Funds.
See accompanying notes which are an integral part of the financial statements.
Financial Highlights — Fidelity Advisor Value Strategies Fund Class C
| Six months ended (Unaudited) May 31, | Years ended November 30, | |||||
| 2017 | 2016 | 2015 | 2014 | 2013 | 2012 | |
| Selected Per–Share Data | ||||||
| Net asset value, beginning of period | $36.19 | $35.12 | $35.07 | $32.52 | $25.06 | $20.64 |
| Income from Investment Operations | ||||||
| Net investment income (loss)A | .11 | .24 | .05 | (.03) | (.01) | (.17)B |
| Net realized and unrealized gain (loss) | 2.65 | .97 | .07 | 2.60 | 7.47 | 4.59 |
| Total from investment operations | 2.76 | 1.21 | .12 | 2.57 | 7.46 | 4.42 |
| Distributions from net investment income | (.30) | (.13) | (.04)C | (.02) | – | – |
| Distributions from net realized gain | (7.52) | (.01) | (.03)C | – | – | – |
| Total distributions | (7.81)D | (.14) | (.07) | (.02) | – | – |
| Net asset value, end of period | $31.14 | $36.19 | $35.12 | $35.07 | $32.52 | $25.06 |
| Total ReturnE,F,G | 8.67% | 3.49% | .33% | 7.91% | 29.77% | 21.41% |
| Ratios to Average Net AssetsH,I | ||||||
| Expenses before reductions | 1.63%J | 1.63% | 1.70% | 1.72% | 1.78% | 1.95% |
| Expenses net of fee waivers, if any | 1.63%J | 1.63% | 1.69% | 1.72% | 1.78% | 1.95% |
| Expenses net of all reductions | 1.62%J | 1.63% | 1.69% | 1.72% | 1.77% | 1.95% |
| Net investment income (loss) | .69%J | .72% | .13% | (.08)% | (.02)% | (.75)%B |
| Supplemental Data | ||||||
| Net assets, end of period (in millions) | $45 | $44 | $49 | $53 | $54 | $43 |
| Portfolio turnover rateK | 40%J | 121% | 9% | 6% | 22% | 23% |
A Calculated based on average shares outstanding during the period.
B Net Investment income per share reflects a large, non-recurring dividend which amounted to $.06 per share. Excluding this non-recurring dividend, the ratio of net investment income (loss) to average net assets would have been (1.02) %.
C The amounts shown reflect certain reclassifications related to book to tax differences that were made in the year shown.
D Total distributions of $7.81 per share is comprised of distributions from net investment income of $.295 and distributions from net realized gain of $7.517 per share.
E Total returns for periods of less than one year are not annualized.
F Total returns would have been lower if certain expenses had not been reduced during the applicable periods shown.
G Total returns do not include the effect of the contingent deferred sales charge.
H Fees and expenses of any underlying Fidelity Central Funds are not included in the Fund's expense ratio. The Fund indirectly bears its proportionate share of the expenses of any underlying Fidelity Central Funds.
I Expense ratios reflect operating expenses of the class. Expenses before reductions do not reflect amounts reimbursed by the investment adviser or reductions from brokerage service arrangements or reductions from other expense offset arrangements and do not represent the amount paid by the class during periods when reimbursements or reductions occur. Expenses net of fee waivers reflect expenses after reimbursement by the investment adviser but prior to reductions from brokerage service arrangements or other expense offset arrangements. Expenses net of all reductions represent the net expenses paid by the class.
J Annualized
K Amount does not include the portfolio activity of any underlying Fidelity Central Funds.
See accompanying notes which are an integral part of the financial statements.
Financial Highlights — Fidelity Value Strategies Fund
| Six months ended (Unaudited) May 31, | Years ended November 30, | |||||
| 2017 | 2016 | 2015 | 2014 | 2013 | 2012 | |
| Selected Per–Share Data | ||||||
| Net asset value, beginning of period | $45.17 | $43.72 | $43.56 | $40.28 | $30.89 | $25.37 |
| Income from Investment Operations | ||||||
| Net investment income (loss)A | .36 | .76 | .51 | .40 | .37 | .09B |
| Net realized and unrealized gain (loss) | 3.37 | 1.21 | .07 | 3.21 | 9.20 | 5.62 |
| Total from investment operations | 3.73 | 1.97 | .58 | 3.61 | 9.57 | 5.71 |
| Distributions from net investment income | (.66) | (.51) | (.39)C | (.33) | (.18) | (.19) |
| Distributions from net realized gain | (7.52) | (.01) | (.03)C | – | – | – |
| Total distributions | (8.18) | (.52) | (.42) | (.33) | (.18) | (.19) |
| Net asset value, end of period | $40.72 | $45.17 | $43.72 | $43.56 | $40.28 | $30.89 |
| Total ReturnD,E | 9.21% | 4.64% | 1.35% | 9.05% | 31.14% | 22.69% |
| Ratios to Average Net AssetsF,G | ||||||
| Expenses before reductions | .57%H | .56% | .67% | .69% | .73% | .89% |
| Expenses net of fee waivers, if any | .56%H | .56% | .67% | .69% | .73% | .89% |
| Expenses net of all reductions | .56%H | .55% | .66% | .69% | .72% | .89% |
| Net investment income (loss) | 1.75%H | 1.79% | 1.16% | .95% | 1.03% | .31%B |
| Supplemental Data | ||||||
| Net assets, end of period (in millions) | $438 | $713 | $716 | $786 | $681 | $396 |
| Portfolio turnover rateI | 40%H | 121% | 9% | 6% | 22% | 23% |
A Calculated based on average shares outstanding during the period.
B Net Investment income per share reflects a large, non-recurring dividend which amounted to $.08 per share. Excluding this non-recurring dividend, the ratio of net investment income (loss) to average net assets would have been .04%.
C The amounts shown reflect certain reclassifications related to book to tax differences that were made in the year shown.
D Total returns for periods of less than one year are not annualized.
E Total returns would have been lower if certain expenses had not been reduced during the applicable periods shown.
F Fees and expenses of any underlying Fidelity Central Funds are not included in the Fund's expense ratio. The Fund indirectly bears its proportionate share of the expenses of any underlying Fidelity Central Funds.
G Expense ratios reflect operating expenses of the class. Expenses before reductions do not reflect amounts reimbursed by the investment adviser or reductions from brokerage service arrangements or reductions from other expense offset arrangements and do not represent the amount paid by the class during periods when reimbursements or reductions occur. Expenses net of fee waivers reflect expenses after reimbursement by the investment adviser but prior to reductions from brokerage service arrangements or other expense offset arrangements. Expenses net of all reductions represent the net expenses paid by the class.
H Annualized
I Amount does not include the portfolio activity of any underlying Fidelity Central Funds.
See accompanying notes which are an integral part of the financial statements.
Financial Highlights — Fidelity Advisor Value Strategies Fund Class K
| Six months ended (Unaudited) May 31, | Years ended November 30, | |||||
| 2017 | 2016 | 2015 | 2014 | 2013 | 2012 | |
| Selected Per–Share Data | ||||||
| Net asset value, beginning of period | $45.18 | $43.74 | $43.57 | $40.28 | $30.89 | $25.38 |
| Income from Investment Operations | ||||||
| Net investment income (loss)A | .38 | .80 | .58 | .47 | .43 | .14B |
| Net realized and unrealized gain (loss) | 3.38 | 1.22 | .07 | 3.20 | 9.18 | 5.61 |
| Total from investment operations | 3.76 | 2.02 | .65 | 3.67 | 9.61 | 5.75 |
| Distributions from net investment income | (.72) | (.57) | (.45)C | (.38) | (.22) | (.24) |
| Distributions from net realized gain | (7.52) | (.01) | (.03)C | – | – | – |
| Total distributions | (8.24) | (.58) | (.48) | (.38) | (.22) | (.24) |
| Net asset value, end of period | $40.70 | $45.18 | $43.74 | $43.57 | $40.28 | $30.89 |
| Total ReturnD,E | 9.29% | 4.76% | 1.51% | 9.21% | 31.34% | 22.93% |
| Ratios to Average Net AssetsF,G | ||||||
| Expenses before reductions | .44%H | .44% | .51% | .53% | .58% | .71% |
| Expenses net of fee waivers, if any | .44%H | .44% | .51% | .53% | .58% | .71% |
| Expenses net of all reductions | .43%H | .43% | .51% | .53% | .57% | .71% |
| Net investment income (loss) | 1.88%H | 1.91% | 1.31% | 1.11% | 1.18% | .50%B |
| Supplemental Data | ||||||
| Net assets, end of period (in millions) | $63 | $68 | $72 | $97 | $119 | $70 |
| Portfolio turnover rateI | 40%H | 121% | 9% | 6% | 22% | 23% |
A Calculated based on average shares outstanding during the period.
B Net Investment income per share reflects a large, non-recurring dividend which amounted to $.08 per share. Excluding this non-recurring dividend, the ratio of net investment income (loss) to average net assets would have been .22%.
C The amounts shown reflect certain reclassifications related to book to tax differences that were made in the year shown.
D Total returns for periods of less than one year are not annualized.
E Total returns would have been lower if certain expenses had not been reduced during the applicable periods shown.
F Fees and expenses of any underlying Fidelity Central Funds are not included in the Fund's expense ratio. The Fund indirectly bears its proportionate share of the expenses of any underlying Fidelity Central Funds.
G Expense ratios reflect operating expenses of the class. Expenses before reductions do not reflect amounts reimbursed by the investment adviser or reductions from brokerage service arrangements or reductions from other expense offset arrangements and do not represent the amount paid by the class during periods when reimbursements or reductions occur. Expenses net of fee waivers reflect expenses after reimbursement by the investment adviser but prior to reductions from brokerage service arrangements or other expense offset arrangements. Expenses net of all reductions represent the net expenses paid by the class.
H Annualized
I Amount does not include the portfolio activity of any underlying Fidelity Central Funds.
See accompanying notes which are an integral part of the financial statements.
Financial Highlights — Fidelity Advisor Value Strategies Fund Class I
| Six months ended (Unaudited) May 31, | Years ended November 30, | |||||
| 2017 | 2016 | 2015 | 2014 | 2013 | 2012 | |
| Selected Per–Share Data | ||||||
| Net asset value, beginning of period | $43.07 | $41.71 | $41.57 | $38.46 | $29.51 | $24.26 |
| Income from Investment Operations | ||||||
| Net investment income (loss)A | .33 | .70 | .48 | .37 | .34 | .08B |
| Net realized and unrealized gain (loss) | 3.20 | 1.15 | .08 | 3.06 | 8.79 | 5.37 |
| Total from investment operations | 3.53 | 1.85 | .56 | 3.43 | 9.13 | 5.45 |
| Distributions from net investment income | (.66) | (.48) | (.39)C | (.32) | (.18) | (.20) |
| Distributions from net realized gain | (7.52) | (.01) | (.03)C | – | – | – |
| Total distributions | (8.18) | (.49) | (.42) | (.32) | (.18) | (.20) |
| Net asset value, end of period | $38.42 | $43.07 | $41.71 | $41.57 | $38.46 | $29.51 |
| Total ReturnD,E | 9.19% | 4.57% | 1.36% | 9.01% | 31.11% | 22.67% |
| Ratios to Average Net AssetsF,G | ||||||
| Expenses before reductions | .62%H | .61% | .68% | .71% | .76% | .90% |
| Expenses net of fee waivers, if any | .62%H | .61% | .68% | .71% | .76% | .90% |
| Expenses net of all reductions | .61%H | .61% | .68% | .71% | .75% | .90% |
| Net investment income (loss) | 1.70%H | 1.74% | 1.14% | .93% | 1.00% | .31%B |
| Supplemental Data | ||||||
| Net assets, end of period (in millions) | $71 | $73 | $65 | $86 | $74 | $66 |
| Portfolio turnover rateI | 40%H | 121% | 9% | 6% | 22% | 23% |
A Calculated based on average shares outstanding during the period.
B Net Investment income per share reflects a large, non-recurring dividend which amounted to $.08 per share. Excluding this non-recurring dividend, the ratio of net investment income (loss) to average net assets would have been .03%.
C The amounts shown reflect certain reclassifications related to book to tax differences that were made in the year shown.
D Total returns for periods of less than one year are not annualized.
E Total returns would have been lower if certain expenses had not been reduced during the applicable periods shown.
F Fees and expenses of any underlying Fidelity Central Funds are not included in the Fund's expense ratio. The Fund indirectly bears its proportionate share of the expenses of any underlying Fidelity Central Funds.
G Expense ratios reflect operating expenses of the class. Expenses before reductions do not reflect amounts reimbursed by the investment adviser or reductions from brokerage service arrangements or reductions from other expense offset arrangements and do not represent the amount paid by the class during periods when reimbursements or reductions occur. Expenses net of fee waivers reflect expenses after reimbursement by the investment adviser but prior to reductions from brokerage service arrangements or other expense offset arrangements. Expenses net of all reductions represent the net expenses paid by the class.
H Annualized
I Amount does not include the portfolio activity of any underlying Fidelity Central Funds.
See accompanying notes which are an integral part of the financial statements.
Notes to Financial Statements (Unaudited)
For the period ended May 31, 2017
(Amounts in thousands except percentages)
1. Organization.
Fidelity Advisor Value Strategies Fund (the Fund) is a fund of Fidelity Advisor Series I (the Trust) and is authorized to issue an unlimited number of shares. The Trust is registered under the Investment Company Act of 1940, as amended (the 1940 Act), as an open-end management investment company organized as a Massachusetts business trust. The Fund offers Class A, Class M (formerly Class T), Class C, Fidelity Value Strategies Fund, Class K and Class I shares, each of which has equal rights as to assets and voting privileges. Each class has exclusive voting rights with respect to matters that affect that class.
After the close of business on June 24, 2016, all outstanding Class B shares were converted to Class A shares. All prior fiscal period dollar and share amounts for Class B presented in the Notes to Financial Statements are for the period December 1, 2015 through June 24, 2016.
2. Investments in Fidelity Central Funds.
The Fund invests in Fidelity Central Funds, which are open-end investment companies generally available only to other investment companies and accounts managed by the investment adviser and its affiliates. The Fund's Schedule of Investments lists each of the Fidelity Central Funds held as of period end, if any, as an investment of the Fund, but does not include the underlying holdings of each Fidelity Central Fund. As an Investing Fund, the Fund indirectly bears its proportionate share of the expenses of the underlying Fidelity Central Funds.
The Money Market Central Funds seek preservation of capital and current income and are managed by Fidelity Investments Money Management, Inc. (FIMM), an affiliate of the investment adviser. Annualized expenses of the Money Market Central Funds as of their most recent shareholder report date are less than .005%.
A complete unaudited list of holdings for each Fidelity Central Fund is available upon request or at the Securities and Exchange Commission (the SEC) website at www.sec.gov. In addition, the financial statements of the Fidelity Central Funds are available on the SEC website or upon request.
3. Significant Accounting Policies.
The Fund is an investment company and applies the accounting and reporting guidance of the Financial Accounting Standards Board (FASB) Accounting Standards Codification Topic 946 Financial Services – Investments Companies. The financial statements have been prepared in conformity with accounting principles generally accepted in the United States of America (GAAP), which require management to make certain estimates and assumptions at the date of the financial statements. Actual results could differ from those estimates. Subsequent events, if any, through the date that the financial statements were issued have been evaluated in the preparation of the financial statements. The following summarizes the significant accounting policies of the Fund:
Investment Valuation. Investments are valued as of 4:00 p.m. Eastern time on the last calendar day of the period. The Board of Trustees (the Board) has delegated the day to day responsibility for the valuation of the Fund's investments to the Fair Value Committee (the Committee) established by the Fund's investment adviser. In accordance with valuation policies and procedures approved by the Board, the Fund attempts to obtain prices from one or more third party pricing vendors or brokers to value its investments. When current market prices, quotations or currency exchange rates are not readily available or reliable, investments will be fair valued in good faith by the Committee, in accordance with procedures adopted by the Board. Factors used in determining fair value vary by investment type and may include market or investment specific events, changes in interest rates and credit quality. The frequency with which these procedures are used cannot be predicted and they may be utilized to a significant extent. The Committee oversees the Fund's valuation policies and procedures and reports to the Board on the Committee's activities and fair value determinations. The Board monitors the appropriateness of the procedures used in valuing the Fund's investments and ratifies the fair value determinations of the Committee.
The Fund categorizes the inputs to valuation techniques used to value its investments into a disclosure hierarchy consisting of three levels as shown below:
- Level 1 – quoted prices in active markets for identical investments
- Level 2 – other significant observable inputs (including quoted prices for similar investments, interest rates, prepayment speeds, etc.)
- Level 3 – unobservable inputs (including the Fund's own assumptions based on the best information available)
Valuation techniques used to value the Fund's investments by major category are as follows:
Equity securities, including restricted securities, for which market quotations are readily available, are valued at the last reported sale price or official closing price as reported by a third party pricing vendor on the primary market or exchange on which they are traded and are categorized as Level 1 in the hierarchy. In the event there were no sales during the day or closing prices are not available, securities are valued at the last quoted bid price or may be valued using the last available price and are generally categorized as Level 2 in the hierarchy. For foreign equity securities, when market or security specific events arise, comparisons to the valuation of American Depositary Receipts (ADRs), futures contracts, Exchange-Traded Funds (ETFs) and certain indexes as well as quoted prices for similar securities may be used and would be categorized as Level 2 in the hierarchy. Utilizing these techniques may result in transfers between Level 1 and Level 2. For equity securities, including restricted securities, where observable inputs are limited, assumptions about market activity and risk are used and these securities may be categorized as Level 3 in the hierarchy.
Debt securities, including restricted securities, are valued based on evaluated prices received from third party pricing vendors or from brokers who make markets in such securities. Corporate bonds are valued by pricing vendors who utilize matrix pricing which considers yield or price of bonds of comparable quality, coupon, maturity and type or by broker-supplied prices. When independent prices are unavailable or unreliable, debt securities may be valued utilizing pricing methodologies which consider similar factors that would be used by third party pricing vendors. Debt securities are generally categorized as Level 2 in the hierarchy but may be Level 3 depending on the circumstances.
Investments in open-end mutual funds, including the Fidelity Central Funds, are valued at their closing net asset value (NAV) each business day and are categorized as Level 1 in the hierarchy.
Changes in valuation techniques may result in transfers in or out of an assigned level within the disclosure hierarchy. The aggregate value of investments by input level as of May 31, 2017 is included at the end of the Fund's Schedule of Investments.
Foreign Currency. The Fund may use foreign currency contracts to facilitate transactions in foreign-denominated securities. Gains and losses from these transactions may arise from changes in the value of the foreign currency or if the counterparties do not perform under the contracts' terms.
Foreign-denominated assets, including investment securities, and liabilities are translated into U.S. dollars at the exchange rates at period end. Purchases and sales of investment securities, income and dividends received and expenses denominated in foreign currencies are translated into U.S. dollars at the exchange rate in effect on the transaction date.
The effects of exchange rate fluctuations on investments are included with the net realized and unrealized gain (loss) on investment securities. Other foreign currency transactions resulting in realized and unrealized gain (loss) are disclosed separately.
Investment Transactions and Income. For financial reporting purposes, the Fund's investment holdings and NAV include trades executed through the end of the last business day of the period. The NAV per share for processing shareholder transactions is calculated as of the close of business of the New York Stock Exchange (NYSE), normally 4:00 p.m. Eastern time and includes trades executed through the end of the prior business day. Gains and losses on securities sold are determined on the basis of identified cost and may include proceeds received from litigation. Dividend income is recorded on the ex-dividend date, except for certain dividends from foreign securities where the ex-dividend date may have passed, which are recorded as soon as the Fund is informed of the ex-dividend date. Non-cash dividends included in dividend income, if any, are recorded at the fair market value of the securities received. Income and capital gain distributions from Fidelity Central Funds, if any, are recorded on the ex-dividend date. Certain distributions received by the Fund represent a return of capital or capital gain. The Fund determines the components of these distributions subsequent to the ex-dividend date, based upon receipt of tax filings or other correspondence relating to the underlying investment. These distributions are recorded as a reduction of cost of investments and/or as a realized gain. Interest income is accrued as earned and includes coupon interest and amortization of premium and accretion of discount on debt securities as applicable. Investment income is recorded net of foreign taxes withheld where recovery of such taxes is uncertain.
Class Allocations and Expenses. Investment income, realized and unrealized capital gains and losses, common expenses of the Fund, and certain fund-level expense reductions, if any, are allocated daily on a pro-rata basis to each class based on the relative net assets of each class to the total net assets of the Fund. Each class differs with respect to transfer agent and distribution and service plan fees incurred. Certain expense reductions may also differ by class. For the reporting period, the allocated portion of income and expenses to each class as a percent of its average net assets may vary due to the timing of recording these transactions in relation to fluctuating net assets of the classes. Expenses directly attributable to a fund are charged to that fund. Expenses attributable to more than one fund are allocated among the respective funds on the basis of relative net assets or other appropriate methods. Expense estimates are accrued in the period to which they relate and adjustments are made when actual amounts are known.
Income Tax Information and Distributions to Shareholders. Each year, the Fund intends to qualify as a regulated investment company under Subchapter M of the Internal Revenue Code, including distributing substantially all of its taxable income and realized gains. As a result, no provision for U.S. Federal income taxes is required. The Fund files a U.S. federal tax return, in addition to state and local tax returns as required. The Fund's federal income tax returns are subject to examination by the Internal Revenue Service (IRS) for a period of three fiscal years after they are filed. State and local tax returns may be subject to examination for an additional fiscal year depending on the jurisdiction. Foreign taxes are provided for based on the Fund's understanding of the tax rules and rates that exist in the foreign markets in which it invests.
Distributions are declared and recorded on the ex-dividend date. Income dividends and capital gain distributions are declared separately for each class. Income and capital gain distributions are determined in accordance with income tax regulations, which may differ from GAAP.
Capital accounts within the financial statements are adjusted for permanent book-tax differences. These adjustments have no impact on net assets or the results of operations. Capital accounts are not adjusted for temporary book-tax differences which will reverse in a subsequent period.
Book-tax differences are primarily due to foreign currency transactions, futures contracts, passive foreign investment companies (PFIC), partnerships, market discount, deferred trustees compensation and losses deferred due to wash sales.
The federal tax cost of investment securities and unrealized appreciation (depreciation) as of period end were as follows:
| Gross unrealized appreciation | $165,568 |
| Gross unrealized depreciation | (35,361) |
| Net unrealized appreciation (depreciation) on securities | $130,207 |
| Tax cost | $971,677 |
4. Purchases and Sales of Investments.
Purchases and sales of securities, other than short-term securities, aggregated $232,802 and $613,222, respectively.
5. Fees and Other Transactions with Affiliates.
Management Fee. Fidelity Management & Research Company (the investment adviser) and its affiliates provide the Fund with investment management related services for which the Fund pays a monthly management fee. The management fee is the sum of an individual fund fee rate that is based on an annual rate of .30% of the Fund's average net assets and an annualized group fee rate that averaged .25% during the period. The group fee rate is based upon the average net assets of all the mutual funds advised by the investment adviser, including any mutual funds previously advised by the investment adviser that are currently advised by Fidelity SelectCo, LLC, an affiliate of the investment adviser. The group fee rate decreases as assets under management increase and increases as assets under management decrease. In addition, the management fee is subject to a performance adjustment (up to a maximum of +/- .20% of the Fund's average net assets over a 36 month performance period). The upward or downward adjustment to the management fee is based on the relative investment performance of Fidelity Value Strategies Fund as compared to its benchmark index, the Russell Midcap Value Index, over the same 36 month performance period. For the reporting period, the total annualized management fee rate, including the performance adjustment, was .34% of the Fund's average net assets. The performance adjustment included in the management fee rate may be higher or lower than the maximum performance adjustment rate due to the difference between the average net assets for the reporting and performance periods.
Distribution and Service Plan Fees. In accordance with Rule 12b-1 of the 1940 Act, the Fund has adopted separate Distribution and Service Plans for each class of shares. Certain classes pay Fidelity Distributors Corporation (FDC), an affiliate of the investment adviser, separate Distribution and Service Fees, each of which is based on an annual percentage of each class' average net assets. In addition, FDC may pay financial intermediaries for selling shares of the Fund and providing shareholder support services. For the period, the Distribution and Service Fee rates, total fees and amounts retained by FDC were as follows:
| Distribution Fee | Service Fee | Total Fees | Retained by FDC | |
| Class A | -% | .25% | $255 | $1 |
| Class M | .25% | .25% | 663 | 3 |
| Class C | .75% | .25% | 225 | 8 |
| $1,143 | $12 |
Sales Load. FDC may receive a front-end sales charge of up to 5.75% for selling Class A shares and 3.50% for selling Class M shares, some of which is paid to financial intermediaries for selling shares of the Fund. Depending on the holding period, FDC may receive contingent deferred sales charges levied on Class A, Class M and Class C redemptions. The deferred sales charges are 1.00% for Class C shares, 1.00% for certain purchases of Class A shares and .25% for certain purchases of Class M shares.
For the period, sales charge amounts retained by FDC were as follows:
| Retained by FDC | |
| Class A | $9 |
| Class M | 3 |
| Class C(a) | 1 |
| $13 |
(a) When Class C shares are initially sold, FDC pays commissions from its own resources to financial intermediaries through which the sales are made.
Transfer Agent Fees. Fidelity Investments Institutional Operations Company, Inc., (FIIOC), an affiliate of the investment adviser, is the transfer, dividend disbursing and shareholder servicing agent for each class of the Fund. FIIOC receives account fees and asset-based fees that vary according to the account size and type of account of the shareholders of the respective classes of the Fund, except for Class K. FIIOC receives an asset-based fee of Class K's average net assets. FIIOC pays for typesetting, printing and mailing of shareholder reports, except proxy statements.
For the period, transfer agent fees for each class were as follows:
| Amount | % of Class-Level Average Net Assets(a) | |
| Class A | $215 | .21 |
| Class M | 244 | .18 |
| Class C | 52 | .23 |
| Fidelity Value Strategies Fund | 428 | .17 |
| Class K | 16 | .05 |
| Class I | 84 | .22 |
| $1,039 |
(a) Annualized
Accounting and Security Lending Fees. Fidelity Service Company, Inc. (FSC), an affiliate of the investment adviser, maintains the Fund's accounting records. The accounting fee is based on the level of average net assets for each month. Under a separate contract, FSC administers the security lending program. The security lending fee is based on the number and duration of lending transactions.
Brokerage Commissions. The Fund placed a portion of its portfolio transactions with brokerage firms which are affiliates of the investment adviser. Brokerage commissions are included in net realized gain (loss) and change in net unrealized appreciation (depreciation) in the Statement of Operations. The commissions paid to these affiliated firms were $12 for the period.
Interfund Lending Program. Pursuant to an Exemptive Order issued by the SEC, the Fund, along with other registered investment companies having management contracts with FMR or other affiliated entities of FMR, may participate in an interfund lending program. This program provides an alternative credit facility allowing the funds to borrow from, or lend money to, other participating affiliated funds. At period end, there were no interfund loans outstanding. The Fund's activity in this program during the period for which loans were outstanding was as follows:
| Borrower or Lender | Average Loan Balance | Weighted Average Interest Rate | Interest Expense |
| Borrower | $13,420 | .84% | $3 |
Interfund Trades. The Fund may purchase from or sell securities to other Fidelity Funds under procedures adopted by the Board. The procedures have been designed to ensure these interfund trades are executed in accordance with Rule 17a-7 of the 1940 Act. Interfund trades are included within the respective purchases and sales amounts shown in the Purchases and Sales of Investments note.
6. Committed Line of Credit.
The Fund participates with other funds managed by the investment adviser or an affiliate in a $4.25 billion credit facility (the "line of credit") to be utilized for temporary or emergency purposes to fund shareholder redemptions or for other short-term liquidity purposes. The Fund has agreed to pay commitment fees on its pro-rata portion of the line of credit, which amounted to $2 and is reflected in Miscellaneous expenses on the Statement of Operations. During the period, the Fund did not borrow on this line of credit.
7. Security Lending.
The Fund lends portfolio securities through a lending agent from time to time in order to earn additional income. For equity securities, a lending agent is used and may loan securities to certain qualified borrowers, including Fidelity Capital Markets (FCM), a broker-dealer affiliated with the Fund. On the settlement date of the loan, the Fund receives collateral (in the form of U.S. Treasury obligations, letters of credit and/or cash) against the loaned securities and maintains collateral in an amount not less than 100% of the market value of the loaned securities during the period of the loan. The market value of the loaned securities is determined at the close of business of the Fund and any additional required collateral is delivered to the Fund on the next business day. The Fund or borrower may terminate the loan at any time, and if the borrower defaults on its obligation to return the securities loaned because of insolvency or other reasons, the Fund may apply collateral received from the borrower against the obligation. The Fund may experience delays and costs in recovering the securities loaned. Any cash collateral received is invested in the Fidelity Securities Lending Cash Central Fund. The value of loaned securities and cash collateral at period end are disclosed on the Fund's Statement of Assets and Liabilities. At period end, there were no security loans outstanding with FCM. Security lending income represents the income earned on investing cash collateral, less rebates paid to borrowers and any lending agent fees associated with the loan, plus any premium payments received for lending certain types of securities. Security lending income is presented in the Statement of Operations as a component of income from Fidelity Central Funds. Total security lending income during the period amounted to $27, including an amount of less than five hundred dollars from securities loaned to FCM.
8. Bank Borrowings.
The Fund is permitted to have bank borrowings for temporary or emergency purposes to fund shareholder redemptions or for other short-term liquidity requirements. The Fund has established borrowing arrangements with certain banks. The interest rate on the borrowings is the bank's base rate, as revised from time to time. The average loan balance during the period for which loans were outstanding amounted to $5,859. The weighted average interest rate was 1.16%. The interest expense amounted to $1 under the bank borrowing program. At period end, there were no bank borrowings outstanding.
9. Expense Reductions.
Commissions paid to certain brokers with whom the investment adviser, or its affiliates, places trades on behalf of the Fund include an amount in addition to trade execution, which may be rebated back to the Fund to offset certain expenses. This amount totaled $47 for the period.
In addition, during the period the investment adviser reimbursed and/or waived a portion of fund-level operating expenses in the amount of $6.
10. Distributions to Shareholders.
Distributions to shareholders of each class were as follows:
| Six months ended May 31, 2017 | Year ended November 30, 2016 | |
| From net investment income | ||
| Class A | $2,766 | $2,186 |
| Class M | 2,831 | 2,155 |
| Class C | 357 | 187 |
| Fidelity Value Strategies Fund | 9,926 | 9,139 |
| Class K | 1,087 | 955 |
| Class I | 1,123 | 746 |
| Total | $18,090 | $15,368 |
| From net realized gain | ||
| Class A | $37,462 | $49 |
| Class M | 46,673 | 65 |
| Class C | 9,088 | 13 |
| Fidelity Value Strategies Fund | 112,547 | 160 |
| Class K | 11,298 | 15 |
| Class I | 12,750 | 14 |
| Total | $229,818 | $316 |
11. Share Transactions.
Share transactions for each class were as follows and may contain automatic conversions between classes or exchanges between affiliated funds:
| Shares | Shares | Dollars | Dollars | |
| Six months ended May 31, 2017 | Year ended November 30, 2016 | Six months ended May 31, 2017 | Year ended November 30, 2016 | |
| Class A | ||||
| Shares sold | 192 | 471 | $6,787 | $17,474 |
| Reinvestment of distributions | 1,127 | 58 | 37,943 | 2,110 |
| Shares redeemed | (683) | (998) | (24,175) | (37,279) |
| Net increase (decrease) | 636 | (469) | $20,555 | $(17,695) |
| Class M | ||||
| Shares sold | 232 | 349 | $8,465 | $13,447 |
| Reinvestment of distributions | 1,294 | 54 | 45,666 | 2,045 |
| Shares redeemed | (821) | (1,385) | (30,524) | (53,890) |
| Net increase (decrease) | 705 | (982) | $23,607 | $(38,398) |
| Class B | ||||
| Shares sold | – | – | $– | $9 |
| Shares redeemed | – | (110) | – | (3,723) |
| Net increase (decrease) | – | (110) | $– | $(3,714) |
| Class C | ||||
| Shares sold | 53 | 78 | $1,654 | $2,605 |
| Reinvestment of distributions | 307 | 6 | 9,116 | 191 |
| Shares redeemed | (150) | (263) | (4,672) | (8,759) |
| Net increase (decrease) | 210 | (179) | $6,098 | $(5,963) |
| Fidelity Value Strategies Fund | ||||
| Shares sold | 772 | 9,301 | $33,461 | $395,357 |
| Reinvestment of distributions | 2,966 | 182 | 114,742 | 7,409 |
| Shares redeemed | (8,769) | (10,077) | (349,323) | (417,147) |
| Net increase (decrease) | (5,031) | (594) | $(201,120) | $(14,381) |
| Class K | ||||
| Shares sold | 164 | 480 | $6,706 | $20,396 |
| Reinvestment of distributions | 321 | 24 | 12,385 | 970 |
| Shares redeemed | (426) | (644) | (17,009) | (27,300) |
| Net increase (decrease) | 59 | (140) | $2,082 | $(5,934) |
| Class I | ||||
| Shares sold | 334 | 445 | $12,821 | $18,090 |
| Reinvestment of distributions | 339 | 19 | 12,386 | 723 |
| Shares redeemed | (526) | (330) | (20,059) | (13,236) |
| Net increase (decrease) | 147 | 134 | $5,148 | $5,577 |
12. Other.
The Fund's organizational documents provide former and current trustees and officers with a limited indemnification against liabilities arising in connection with the performance of their duties to the Fund. In the normal course of business, the Fund may also enter into contracts that provide general indemnifications. The Fund's maximum exposure under these arrangements is unknown as this would be dependent on future claims that may be made against the Fund. The risk of material loss from such claims is considered remote.
Shareholder Expense Example
As a shareholder of the Fund, you incur two types of costs: (1) transaction costs, including sales charges (loads) on purchase payments or redemption proceeds, and (2) ongoing costs, including management fees, distribution and/or service (12b-1) fees and other Fund expenses. This Example is intended to help you understand your ongoing costs (in dollars) of investing in the Fund and to compare these costs with the ongoing costs of investing in other mutual funds.
The Example is based on an investment of $1,000 invested at the beginning of the period and held for the entire period (December 1, 2016 to May 31, 2017).
Actual Expenses
The first line of the accompanying table for each class of the Fund provides information about actual account values and actual expenses. You may use the information in this line, together with the amount you invested, to estimate the expenses that you paid over the period. Simply divide your account value by $1,000.00 (for example, an $8,600 account value divided by $1,000.00 = 8.6), then multiply the result by the number in the first line for a class of the Fund under the heading entitled "Expenses Paid During Period" to estimate the expenses you paid on your account during this period. A small balance maintenance fee of $12.00 that is charged once a year may apply for certain accounts with a value of less than $2,000. This fee is not included in the table below. If it was, the estimate of expenses you paid during the period would be higher, and your ending account value lower, by this amount. In addition, the Fund, as a shareholder in the underlying Fidelity Central Funds, will indirectly bear its pro-rata share of the fees and expenses incurred by the underlying Fidelity Central Funds. These fees and expenses are not included in the Fund's annualized expense ratio used to calculate the expense estimate in the table below.
Hypothetical Example for Comparison Purposes
The second line of the accompanying table for each class of the Fund provides information about hypothetical account values and hypothetical expenses based on a Class' actual expense ratio and an assumed rate of return of 5% per year before expenses, which is not the Class' actual return. The hypothetical account values and expenses may not be used to estimate the actual ending account balance or expenses you paid for the period. You may use this information to compare the ongoing costs of investing in the Fund and other funds. To do so, compare this 5% hypothetical example with the 5% hypothetical examples that appear in the shareholder reports of the other funds. A small balance maintenance fee of $12.00 that is charged once a year may apply for certain accounts with a value of less than $2,000. This fee is not included in the table below. If it was, the estimate of expenses you paid during the period would be higher, and your ending account value lower, by this amount. In addition, the Fund, as a shareholder in the underlying Fidelity Central Funds, will indirectly bear its pro-rata share of the fees and expenses incurred by the underlying Fidelity Central Funds. These fees and expenses are not included in the Fund's annualized expense ratio used to calculate the expense estimate in the table below.
Please note that the expenses shown in the table are meant to highlight your ongoing costs only and do not reflect any transaction costs. Therefore, the second line of the table is useful in comparing ongoing costs only, and will not help you determine the relative total costs of owning different funds. In addition, if these transactional costs were included, your costs would have been higher.
| Annualized Expense Ratio-A | Beginning Account Value December 1, 2016 | Ending Account Value May 31, 2017 | Expenses Paid During Period-B December 1, 2016 to May 31, 2017 | |
| Class A | .85% | |||
| Actual | $1,000.00 | $1,090.60 | $4.43 | |
| Hypothetical-C | $1,000.00 | $1,020.69 | $4.28 | |
| Class M | 1.08% | |||
| Actual | $1,000.00 | $1,089.30 | $5.63 | |
| Hypothetical-C | $1,000.00 | $1,019.55 | $5.44 | |
| Class C | 1.63% | |||
| Actual | $1,000.00 | $1,086.70 | $8.48 | |
| Hypothetical-C | $1,000.00 | $1,016.80 | $8.20 | |
| Fidelity Value Strategies Fund | .56% | |||
| Actual | $1,000.00 | $1,092.10 | $2.92 | |
| Hypothetical-C | $1,000.00 | $1,022.14 | $2.82 | |
| Class K | .44% | |||
| Actual | $1,000.00 | $1,092.90 | $2.30 | |
| Hypothetical-C | $1,000.00 | $1,022.74 | $2.22 | |
| Class I | .62% | |||
| Actual | $1,000.00 | $1,091.90 | $3.23 | |
| Hypothetical-C | $1,000.00 | $1,021.84 | $3.13 |
A Annualized expense ratio reflects expenses net of applicable fee waivers.
B Expenses are equal to each Class' annualized expense ratio, multiplied by the average account value over the period, multiplied by 182/365 (to reflect the one-half year period).
C 5% return per year before expenses
![]()
Corporate Headquarters
245 Summer St.
Boston, MA 02210
www.fidelity.com
SOI-K-SANN-0717
1.863339.108
Fidelity Advisor® Value Strategies Fund Semi-Annual Report May 31, 2017 |
|
Contents
To view a fund's proxy voting guidelines and proxy voting record for the 12-month period ended June 30, visit http://www.fidelity.com/proxyvotingresults or visit the Securities and Exchange Commission's (SEC) web site at http://www.sec.gov.
You may also call 1-877-208-0098 to request a free copy of the proxy voting guidelines.
Standard & Poor's, S&P and S&P 500 are registered service marks of The McGraw-Hill Companies, Inc. and have been licensed for use by Fidelity Distributors Corporation.
Other third-party marks appearing herein are the property of their respective owners.
All other marks appearing herein are registered or unregistered trademarks or service marks of FMR LLC or an affiliated company. © 2017 FMR LLC. All rights reserved.
This report and the financial statements contained herein are submitted for the general information of the shareholders of the Fund. This report is not authorized for distribution to prospective investors in the Fund unless preceded or accompanied by an effective prospectus.
A fund files its complete schedule of portfolio holdings with the SEC for the first and third quarters of each fiscal year on Form N-Q. Forms N-Q are available on the SEC’s web site at http://www.sec.gov. A fund's Forms N-Q may be reviewed and copied at the SEC’s Public Reference Room in Washington, DC. Information regarding the operation of the SEC's Public Reference Room may be obtained by calling 1-800-SEC-0330.
For a complete list of a fund's portfolio holdings, view the most recent holdings listing, semiannual report, or annual report on Fidelity's web site at http://www.fidelity.com, http://www.institutional.fidelity.com, or http://www.401k.com, as applicable.
NOT FDIC INSURED •MAY LOSE VALUE •NO BANK GUARANTEE
Neither the Fund nor Fidelity Distributors Corporation is a bank.
Investment Summary (Unaudited)
Top Ten Stocks as of May 31, 2017
| % of fund's net assets | % of fund's net assets 6 months ago | |
| American Tower Corp. | 3.4 | 2.4 |
| Edison International | 3.3 | 3.1 |
| Sempra Energy | 3.1 | 3.0 |
| U.S. Bancorp | 2.4 | 2.6 |
| Synchrony Financial | 2.2 | 2.7 |
| American Electric Power Co., Inc. | 2.2 | 2.0 |
| Extra Space Storage, Inc. | 2.2 | 1.9 |
| Jazz Pharmaceuticals PLC | 2.2 | 1.6 |
| Equity Lifestyle Properties, Inc. | 2.0 | 0.8 |
| Douglas Emmett, Inc. | 1.9 | 0.0 |
| 24.9 |
Top Five Market Sectors as of May 31, 2017
| % of fund's net assets | % of fund's net assets 6 months ago | |
| Financials | 16.3 | 18.3 |
| Real Estate | 13.8 | 11.2 |
| Information Technology | 11.5 | 11.8 |
| Industrials | 11.3 | 10.2 |
| Consumer Discretionary | 9.7 | 12.5 |
Asset Allocation (% of fund's net assets)
| As of May 31, 2017* | ||
| Stocks | 99.2% | |
| Convertible Securities | 0.6% | |
| Short-Term Investments and Net Other Assets (Liabilities) | 0.2% | |

* Foreign investments - 16.7%
| As of November 30, 2016* | ||
| Stocks | 99.0% | |
| Convertible Securities | 0.7% | |
| Short-Term Investments and Net Other Assets (Liabilities) | 0.3% | |

* Foreign investments - 16.3%
Percentages shown as 0.0% may reflect amounts less than 0.05%.
Investments May 31, 2017 (Unaudited)
Showing Percentage of Net Assets
| Common Stocks - 99.2% | |||
| Shares | Value (000s) | ||
| CONSUMER DISCRETIONARY - 9.7% | |||
| Auto Components - 1.7% | |||
| Delphi Automotive PLC | 210,377 | $18,507 | |
| Diversified Consumer Services - 2.9% | |||
| Houghton Mifflin Harcourt Co. (a) | 1,039,456 | 12,837 | |
| Service Corp. International | 553,650 | 17,650 | |
| 30,487 | |||
| Hotels, Restaurants & Leisure - 1.0% | |||
| Wyndham Worldwide Corp. | 106,867 | 10,792 | |
| Leisure Products - 0.3% | |||
| Vista Outdoor, Inc. (a) | 169,156 | 3,549 | |
| Media - 3.2% | |||
| Liberty Broadband Corp. Class C (a) | 105,415 | 9,400 | |
| Liberty Global PLC Class C (a) | 249,900 | 7,427 | |
| Sinclair Broadcast Group, Inc. Class A (b) | 347,799 | 11,269 | |
| Twenty-First Century Fox, Inc. Class A | 238,000 | 6,455 | |
| 34,551 | |||
| Specialty Retail - 0.6% | |||
| GameStop Corp. Class A (b) | 305,313 | 6,760 | |
| TOTAL CONSUMER DISCRETIONARY | 104,646 | ||
| CONSUMER STAPLES - 4.1% | |||
| Beverages - 1.1% | |||
| Cott Corp. | 896,364 | 11,825 | |
| Food & Staples Retailing - 1.8% | |||
| Kroger Co. | 264,700 | 7,883 | |
| Whole Foods Market, Inc. | 326,356 | 11,419 | |
| 19,302 | |||
| Food Products - 1.2% | |||
| Darling International, Inc. (a) | 839,122 | 13,149 | |
| TOTAL CONSUMER STAPLES | 44,276 | ||
| ENERGY - 7.4% | |||
| Energy Equipment & Services - 1.2% | |||
| Baker Hughes, Inc. | 227,230 | 12,532 | |
| Oil, Gas & Consumable Fuels - 6.2% | |||
| Anadarko Petroleum Corp. | 152,500 | 7,706 | |
| Boardwalk Pipeline Partners, LP | 740,936 | 13,389 | |
| Cabot Oil & Gas Corp. | 330,200 | 7,327 | |
| ConocoPhillips Co. | 302,300 | 13,510 | |
| EQT Corp. | 96,200 | 5,317 | |
| GasLog Ltd. (b) | 543,261 | 7,035 | |
| Teekay Corp. (b) | 1,472,713 | 8,998 | |
| Teekay Offshore Partners LP | 1,330,500 | 4,164 | |
| 67,446 | |||
| TOTAL ENERGY | 79,978 | ||
| FINANCIALS - 16.3% | |||
| Banks - 5.1% | |||
| PNC Financial Services Group, Inc. | 91,100 | 10,814 | |
| U.S. Bancorp | 515,484 | 26,233 | |
| Wells Fargo & Co. | 346,470 | 17,718 | |
| 54,765 | |||
| Capital Markets - 3.6% | |||
| Apollo Global Management LLC Class A | 443,250 | 11,981 | |
| Legg Mason, Inc. | 370,317 | 13,654 | |
| The Blackstone Group LP | 402,800 | 13,244 | |
| 38,879 | |||
| Consumer Finance - 4.4% | |||
| Discover Financial Services | 226,200 | 13,278 | |
| OneMain Holdings, Inc. (a) | 445,100 | 10,041 | |
| Synchrony Financial | 886,613 | 23,806 | |
| 47,125 | |||
| Insurance - 3.2% | |||
| Chubb Ltd. | 98,682 | 14,130 | |
| FNF Group | 481,359 | 20,511 | |
| 34,641 | |||
| TOTAL FINANCIALS | 175,410 | ||
| HEALTH CARE - 7.9% | |||
| Biotechnology - 2.4% | |||
| Amgen, Inc. | 79,200 | 12,295 | |
| United Therapeutics Corp. (a) | 112,300 | 13,576 | |
| 25,871 | |||
| Health Care Providers & Services - 2.5% | |||
| Aetna, Inc. | 69,400 | 10,053 | |
| Envision Healthcare Corp. (a) | 127,151 | 6,944 | |
| Laboratory Corp. of America Holdings (a) | 71,578 | 9,949 | |
| 26,946 | |||
| Pharmaceuticals - 3.0% | |||
| Jazz Pharmaceuticals PLC (a) | 160,400 | 23,348 | |
| Teva Pharmaceutical Industries Ltd. sponsored ADR | 332,300 | 9,258 | |
| 32,606 | |||
| TOTAL HEALTH CARE | 85,423 | ||
| INDUSTRIALS - 11.3% | |||
| Aerospace & Defense - 2.2% | |||
| KLX, Inc. (a) | 265,610 | 12,853 | |
| Rockwell Collins, Inc. | 96,300 | 10,502 | |
| 23,355 | |||
| Airlines - 1.2% | |||
| Delta Air Lines, Inc. | 265,900 | 13,064 | |
| Commercial Services & Supplies - 1.6% | |||
| IWG PLC | 1,635,100 | 7,001 | |
| KAR Auction Services, Inc. | 231,200 | 10,073 | |
| 17,074 | |||
| Construction & Engineering - 1.3% | |||
| AECOM (a) | 450,400 | 14,462 | |
| Machinery - 2.8% | |||
| Allison Transmission Holdings, Inc. | 451,275 | 17,473 | |
| Ingersoll-Rand PLC | 135,700 | 12,159 | |
| 29,632 | |||
| Road & Rail - 0.6% | |||
| Swift Transporation Co. (a) | 282,800 | 6,773 | |
| Trading Companies & Distributors - 1.6% | |||
| AerCap Holdings NV (a) | 393,437 | 17,319 | |
| TOTAL INDUSTRIALS | 121,679 | ||
| INFORMATION TECHNOLOGY - 11.5% | |||
| Communications Equipment - 1.2% | |||
| CommScope Holding Co., Inc. (a) | 346,568 | 12,820 | |
| Electronic Equipment & Components - 1.6% | |||
| Jabil Circuit, Inc. | 102,109 | 3,055 | |
| TE Connectivity Ltd. | 176,981 | 13,955 | |
| 17,010 | |||
| IT Services - 7.3% | |||
| Amdocs Ltd. | 169,000 | 10,948 | |
| Cognizant Technology Solutions Corp. Class A | 268,500 | 17,965 | |
| DXC Technology Co. | 263,400 | 20,419 | |
| First Data Corp. Class A (a) | 881,140 | 15,094 | |
| Total System Services, Inc. | 227,900 | 13,571 | |
| 77,997 | |||
| Semiconductors & Semiconductor Equipment - 1.4% | |||
| Qualcomm, Inc. | 267,600 | 15,325 | |
| TOTAL INFORMATION TECHNOLOGY | 123,152 | ||
| MATERIALS - 8.6% | |||
| Chemicals - 6.9% | |||
| CF Industries Holdings, Inc. | 348,953 | 9,387 | |
| E.I. du Pont de Nemours & Co. | 233,600 | 18,436 | |
| Eastman Chemical Co. | 216,934 | 17,379 | |
| LyondellBasell Industries NV Class A | 178,492 | 14,372 | |
| Westlake Chemical Corp. | 239,703 | 14,732 | |
| 74,306 | |||
| Containers & Packaging - 1.7% | |||
| Ball Corp. | 254,666 | 10,416 | |
| Sealed Air Corp. | 178,100 | 7,911 | |
| 18,327 | |||
| TOTAL MATERIALS | 92,633 | ||
| REAL ESTATE - 13.8% | |||
| Equity Real Estate Investment Trusts (REITs) - 12.5% | |||
| American Tower Corp. | 278,208 | 36,496 | |
| Douglas Emmett, Inc. | 551,900 | 20,950 | |
| Equinix, Inc. | 43,600 | 19,228 | |
| Equity Lifestyle Properties, Inc. | 253,700 | 21,412 | |
| Extra Space Storage, Inc. | 301,728 | 23,375 | |
| Outfront Media, Inc. | 551,504 | 12,602 | |
| 134,063 | |||
| Real Estate Management & Development - 1.3% | |||
| CBRE Group, Inc. (a) | 402,400 | 14,036 | |
| TOTAL REAL ESTATE | 148,099 | ||
| UTILITIES - 8.6% | |||
| Electric Utilities - 5.5% | |||
| American Electric Power Co., Inc. | 325,742 | 23,382 | |
| Edison International | 435,971 | 35,562 | |
| 58,944 | |||
| Multi-Utilities - 3.1% | |||
| Sempra Energy | 291,888 | 34,002 | |
| TOTAL UTILITIES | 92,946 | ||
| TOTAL COMMON STOCKS | |||
| (Cost $934,096) | 1,068,242 | ||
| Principal Amount (000s) | Value (000s) | ||
| Convertible Bonds - 0.6% | |||
| ENERGY - 0.6% | |||
| Oil, Gas & Consumable Fuels - 0.6% | |||
| Cobalt International Energy, Inc. 2.625% 12/1/19 (Cost $9,900) | 18,190 | 6,374 | |
| Shares | Value (000s) | ||
| Money Market Funds - 2.5% | |||
| Fidelity Cash Central Fund, 0.86% (c) | 2,331,345 | 2,332 | |
| Fidelity Securities Lending Cash Central Fund 0.87% (c)(d) | 24,933,416 | 24,936 | |
| TOTAL MONEY MARKET FUNDS | |||
| (Cost $27,268) | 27,268 | ||
| TOTAL INVESTMENT PORTFOLIO - 102.3% | |||
| (Cost $971,264) | 1,101,884 | ||
| NET OTHER ASSETS (LIABILITIES) - (2.3)% | (24,933) | ||
| NET ASSETS - 100% | $1,076,951 |
Legend
(a) Non-income producing
(b) Security or a portion of the security is on loan at period end.
(c) Affiliated fund that is generally available only to investment companies and other accounts managed by Fidelity Investments. The rate quoted is the annualized seven-day yield of the fund at period end. A complete unaudited listing of the fund's holdings as of its most recent quarter end is available upon request. In addition, each Fidelity Central Fund's financial statements are available on the SEC's website or upon request.
(d) Investment made with cash collateral received from securities on loan.
Affiliated Central Funds
Information regarding fiscal year to date income earned by the Fund from investments in Fidelity Central Funds is as follows:
| Fund | Income earned |
| (Amounts in thousands) | |
| Fidelity Cash Central Fund | $11 |
| Fidelity Securities Lending Cash Central Fund | 27 |
| Total | $38 |
Investment Valuation
The following is a summary of the inputs used, as of May 31, 2017, involving the Fund's assets and liabilities carried at fair value. The inputs or methodology used for valuing securities may not be an indication of the risk associated with investing in those securities. For more information on valuation inputs, and their aggregation into the levels used below, please refer to the Investment Valuation section in the accompanying Notes to Financial Statements.
| Valuation Inputs at Reporting Date: | ||||
| Description | Total | Level 1 | Level 2 | Level 3 |
| (Amounts in thousands) | ||||
| Investments in Securities: | ||||
| Equities: | ||||
| Consumer Discretionary | $104,646 | $104,646 | $-- | $-- |
| Consumer Staples | 44,276 | 44,276 | -- | -- |
| Energy | 79,978 | 79,978 | -- | -- |
| Financials | 175,410 | 175,410 | -- | -- |
| Health Care | 85,423 | 85,423 | -- | -- |
| Industrials | 121,679 | 121,679 | -- | -- |
| Information Technology | 123,152 | 123,152 | -- | -- |
| Materials | 92,633 | 92,633 | -- | -- |
| Real Estate | 148,099 | 148,099 | -- | -- |
| Utilities | 92,946 | 92,946 | -- | -- |
| Corporate Bonds | 6,374 | -- | 6,374 | -- |
| Money Market Funds | 27,268 | 27,268 | -- | -- |
| Total Investments in Securities: | $1,101,884 | $1,095,510 | $6,374 | $-- |
Other Information
Distribution of investments by country or territory of incorporation, as a percentage of Total Net Assets, is as follows (Unaudited):
| United States of America | 83.3% |
| Ireland | 3.4% |
| Netherlands | 2.9% |
| Switzerland | 2.6% |
| Bailiwick of Jersey | 2.4% |
| Marshall Islands | 1.2% |
| Canada | 1.1% |
| Bailiwick of Guernsey | 1.0% |
| Others (Individually Less Than 1%) | 2.1% |
| 100.0% |
See accompanying notes which are an integral part of the financial statements.
Financial Statements
Statement of Assets and Liabilities
| Amounts in thousands (except per-share amounts) | May 31, 2017 (Unaudited) | |
| Assets | ||
| Investment in securities, at value (including securities loaned of $23,947) — See accompanying schedule: Unaffiliated issuers (cost $943,996) | $1,074,616 | |
| Fidelity Central Funds (cost $27,268) | 27,268 | |
| Total Investments (cost $971,264) | $1,101,884 | |
| Receivable for investments sold | 2,632 | |
| Receivable for fund shares sold | 240 | |
| Dividends receivable | 1,285 | |
| Interest receivable | 242 | |
| Distributions receivable from Fidelity Central Funds | 9 | |
| Other receivables | 11 | |
| Total assets | 1,106,303 | |
| Liabilities | ||
| Payable for investments purchased | $1,145 | |
| Payable for fund shares redeemed | 2,517 | |
| Accrued management fee | 334 | |
| Distribution and service plan fees payable | 188 | |
| Other affiliated payables | 197 | |
| Other payables and accrued expenses | 34 | |
| Collateral on securities loaned | 24,937 | |
| Total liabilities | 29,352 | |
| Net Assets | $1,076,951 | |
| Net Assets consist of: | ||
| Paid in capital | $892,078 | |
| Undistributed net investment income | 6,820 | |
| Accumulated undistributed net realized gain (loss) on investments and foreign currency transactions | 47,433 | |
| Net unrealized appreciation (depreciation) on investments and assets and liabilities in foreign currencies | 130,620 | |
| Net Assets | $1,076,951 | |
| Calculation of Maximum Offering Price | ||
| Class A: | ||
| Net Asset Value and redemption price per share ($201,183 ÷ 5,681.8 shares) | $35.41 | |
| Maximum offering price per share (100/94.25 of $35.41) | $37.57 | |
| Class M: | ||
| Net Asset Value and redemption price per share ($259,598 ÷ 7,002.7 shares) | $37.07 | |
| Maximum offering price per share (100/96.50 of $37.07) | $38.41 | |
| Class C: | ||
| Net Asset Value and offering price per share ($44,530 ÷ 1,430.2 shares)(a) | $31.14 | |
| Fidelity Value Strategies Fund: | ||
| Net Asset Value, offering price and redemption price per share ($437,687 ÷ 10,748.1 shares) | $40.72 | |
| Class K: | ||
| Net Asset Value, offering price and redemption price per share ($63,354 ÷ 1,556.7 shares) | $40.70 | |
| Class I: | ||
| Net Asset Value, offering price and redemption price per share ($70,599 ÷ 1,837.4 shares) | $38.42 |
(a) Redemption price per share is equal to net asset value less any applicable contingent deferred sales charge.
See accompanying notes which are an integral part of the financial statements.
Statement of Operations
| Amounts in thousands | Six months ended May 31, 2017 (Unaudited) | |
| Investment Income | ||
| Dividends | $11,973 | |
| Interest | 1,354 | |
| Income from Fidelity Central Funds | 38 | |
| Total income | 13,365 | |
| Expenses | ||
| Management fee | ||
| Basic fee | $3,166 | |
| Performance adjustment | (1,210) | |
| Transfer agent fees | 1,039 | |
| Distribution and service plan fees | 1,143 | |
| Accounting and security lending fees | 189 | |
| Custodian fees and expenses | 21 | |
| Independent trustees' fees and expenses | 3 | |
| Registration fees | 70 | |
| Audit | 33 | |
| Legal | 4 | |
| Interest | 4 | |
| Miscellaneous | 6 | |
| Total expenses before reductions | 4,468 | |
| Expense reductions | (53) | 4,415 |
| Net investment income (loss) | 8,950 | |
| Realized and Unrealized Gain (Loss) | ||
| Net realized gain (loss) on: | ||
| Investment securities: | ||
| Unaffiliated issuers | 46,986 | |
| Fidelity Central Funds | (2) | |
| Foreign currency transactions | (3) | |
| Total net realized gain (loss) | 46,981 | |
| Change in net unrealized appreciation (depreciation) on: Investment securities | 49,448 | |
| Total change in net unrealized appreciation (depreciation) | 49,448 | |
| Net gain (loss) | 96,429 | |
| Net increase (decrease) in net assets resulting from operations | $105,379 |
See accompanying notes which are an integral part of the financial statements.
Statement of Changes in Net Assets
| Amounts in thousands | Six months ended May 31, 2017 (Unaudited) | Year ended November 30, 2016 |
| Increase (Decrease) in Net Assets | ||
| Operations | ||
| Net investment income (loss) | $8,950 | $22,186 |
| Net realized gain (loss) | 46,981 | 392,411 |
| Change in net unrealized appreciation (depreciation) | 49,448 | (369,931) |
| Net increase (decrease) in net assets resulting from operations | 105,379 | 44,666 |
| Distributions to shareholders from net investment income | (18,090) | (15,368) |
| Distributions to shareholders from net realized gain | (229,818) | (316) |
| Total distributions | (247,908) | (15,684) |
| Share transactions - net increase (decrease) | (143,630) | (80,508) |
| Total increase (decrease) in net assets | (286,159) | (51,526) |
| Net Assets | ||
| Beginning of period | 1,363,110 | 1,414,636 |
| End of period | $1,076,951 | $1,363,110 |
| Other Information | ||
| Undistributed net investment income end of period | $6,820 | $15,960 |
See accompanying notes which are an integral part of the financial statements.
Financial Highlights — Fidelity Advisor Value Strategies Fund Class A
| Six months ended (Unaudited) May 31, | Years ended November 30, | |||||
| 2017 | 2016 | 2015 | 2014 | 2013 | 2012 | |
| Selected Per–Share Data | ||||||
| Net asset value, beginning of period | $40.25 | $39.01 | $38.91 | $36.02 | $27.62 | $22.71 |
| Income from Investment Operations | ||||||
| Net investment income (loss)A | .26 | .56 | .35 | .25 | .23 | –B |
| Net realized and unrealized gain (loss) | 2.97 | 1.09 | .06 | 2.87 | 8.25 | 5.03 |
| Total from investment operations | 3.23 | 1.65 | .41 | 3.12 | 8.48 | 5.03 |
| Distributions from net investment income | (.56) | (.40) | (.28)C | (.23) | (.08) | (.12) |
| Distributions from net realized gain | (7.52) | (.01) | (.03)C | – | – | – |
| Total distributions | (8.07)D | (.41) | (.31) | (.23) | (.08) | (.12) |
| Net asset value, end of period | $35.41 | $40.25 | $39.01 | $38.91 | $36.02 | $27.62 |
| Total ReturnE,F,G | 9.06% | 4.33% | 1.07% | 8.74% | 30.77% | 22.29% |
| Ratios to Average Net AssetsH,I | ||||||
| Expenses before reductions | .86%J | .86% | .93% | .96% | 1.04% | 1.21% |
| Expenses net of fee waivers, if any | .85%J | .86% | .93% | .96% | 1.04% | 1.21% |
| Expenses net of all reductions | .85%J | .86% | .93% | .96% | 1.03% | 1.21% |
| Net investment income (loss) | 1.46%J | 1.48% | .89% | .68% | .73% | - %B |
| Supplemental Data | ||||||
| Net assets, end of period (in millions) | $201 | $203 | $215 | $233 | $243 | $203 |
| Portfolio turnover rateK | 40%J | 121% | 9% | 6% | 22% | 23% |
A Calculated based on average shares outstanding during the period.
B Net Investment income per share reflects a large, non-recurring dividend which amounted to $.07 per share. Excluding this non-recurring dividend, the ratio of net investment income (loss) to average net assets would have been (.28) %.
C The amounts shown reflect certain reclassifications related to book to tax differences that were made in the year shown.
D Total distributions of $8.07 per share is comprised of distributions from net investment income of $.555 and distributions from net realized gain of $7.517 per share.
E Total returns for periods of less than one year are not annualized.
F Total returns would have been lower if certain expenses had not been reduced during the applicable periods shown.
G Total returns do not include the effect of the sales charges.
H Fees and expenses of any underlying Fidelity Central Funds are not included in the Fund's expense ratio. The Fund indirectly bears its proportionate share of the expenses of any underlying Fidelity Central Funds.
I Expense ratios reflect operating expenses of the class. Expenses before reductions do not reflect amounts reimbursed by the investment adviser or reductions from brokerage service arrangements or reductions from other expense offset arrangements and do not represent the amount paid by the class during periods when reimbursements or reductions occur. Expenses net of fee waivers reflect expenses after reimbursement by the investment adviser but prior to reductions from brokerage service arrangements or other expense offset arrangements. Expenses net of all reductions represent the net expenses paid by the class.
J Annualized
K Amount does not include the portfolio activity of any underlying Fidelity Central Funds.
See accompanying notes which are an integral part of the financial statements.
Financial Highlights — Fidelity Advisor Value Strategies Fund Class M
| Six months ended (Unaudited) May 31, | Years ended November 30, | |||||
| 2017 | 2016 | 2015 | 2014 | 2013 | 2012 | |
| Selected Per–Share Data | ||||||
| Net asset value, beginning of period | $41.72 | $40.40 | $40.28 | $37.28 | $28.58 | $23.48 |
| Income from Investment Operations | ||||||
| Net investment income (loss)A | .23 | .49 | .28 | .18 | .18 | (.05)B |
| Net realized and unrealized gain (loss) | 3.09 | 1.14 | .06 | 2.98 | 8.54 | 5.22 |
| Total from investment operations | 3.32 | 1.63 | .34 | 3.16 | 8.72 | 5.17 |
| Distributions from net investment income | (.46) | (.30) | (.19)C | (.16) | (.02) | (.07) |
| Distributions from net realized gain | (7.52) | (.01) | (.03)C | – | – | – |
| Total distributions | (7.97)D | (.31) | (.22) | (.16) | (.02) | (.07) |
| Net asset value, end of period | $37.07 | $41.72 | $40.40 | $40.28 | $37.28 | $28.58 |
| Total ReturnE,F,G | 8.93% | 4.11% | .86% | 8.51% | 30.52% | 22.08% |
| Ratios to Average Net AssetsH,I | ||||||
| Expenses before reductions | 1.08%J | 1.08% | 1.15% | 1.17% | 1.23% | 1.38% |
| Expenses net of fee waivers, if any | 1.08%J | 1.08% | 1.14% | 1.17% | 1.23% | 1.38% |
| Expenses net of all reductions | 1.07%J | 1.07% | 1.14% | 1.17% | 1.22% | 1.38% |
| Net investment income (loss) | 1.24%J | 1.27% | .68% | .47% | .54% | (.17)%B |
| Supplemental Data | ||||||
| Net assets, end of period (in millions) | $260 | $263 | $294 | $324 | $335 | $283 |
| Portfolio turnover rateK | 40%J | 121% | 9% | 6% | 22% | 23% |
A Calculated based on average shares outstanding during the period.
B Net Investment income per share reflects a large, non-recurring dividend which amounted to $.07 per share. Excluding this non-recurring dividend, the ratio of net investment income (loss) to average net assets would have been (.45) %.
C The amounts shown reflect certain reclassifications related to book to tax differences that were made in the year shown.
D Total distributions of $7.97 per share is comprised of distributions from net investment income of $.456 and distributions from net realized gain of $7.517 per share.
E Total returns for periods of less than one year are not annualized.
F Total returns would have been lower if certain expenses had not been reduced during the applicable periods shown.
G Total returns do not include the effect of the sales charges.
H Fees and expenses of any underlying Fidelity Central Funds are not included in the Fund's expense ratio. The Fund indirectly bears its proportionate share of the expenses of any underlying Fidelity Central Funds.
I Expense ratios reflect operating expenses of the class. Expenses before reductions do not reflect amounts reimbursed by the investment adviser or reductions from brokerage service arrangements or reductions from other expense offset arrangements and do not represent the amount paid by the class during periods when reimbursements or reductions occur. Expenses net of fee waivers reflect expenses after reimbursement by the investment adviser but prior to reductions from brokerage service arrangements or other expense offset arrangements. Expenses net of all reductions represent the net expenses paid by the class.
J Annualized
K Amount does not include the portfolio activity of any underlying Fidelity Central Funds.
See accompanying notes which are an integral part of the financial statements.
Financial Highlights — Fidelity Advisor Value Strategies Fund Class C
| Six months ended (Unaudited) May 31, | Years ended November 30, | |||||
| 2017 | 2016 | 2015 | 2014 | 2013 | 2012 | |
| Selected Per–Share Data | ||||||
| Net asset value, beginning of period | $36.19 | $35.12 | $35.07 | $32.52 | $25.06 | $20.64 |
| Income from Investment Operations | ||||||
| Net investment income (loss)A | .11 | .24 | .05 | (.03) | (.01) | (.17)B |
| Net realized and unrealized gain (loss) | 2.65 | .97 | .07 | 2.60 | 7.47 | 4.59 |
| Total from investment operations | 2.76 | 1.21 | .12 | 2.57 | 7.46 | 4.42 |
| Distributions from net investment income | (.30) | (.13) | (.04)C | (.02) | – | – |
| Distributions from net realized gain | (7.52) | (.01) | (.03)C | – | – | – |
| Total distributions | (7.81)D | (.14) | (.07) | (.02) | – | – |
| Net asset value, end of period | $31.14 | $36.19 | $35.12 | $35.07 | $32.52 | $25.06 |
| Total ReturnE,F,G | 8.67% | 3.49% | .33% | 7.91% | 29.77% | 21.41% |
| Ratios to Average Net AssetsH,I | ||||||
| Expenses before reductions | 1.63%J | 1.63% | 1.70% | 1.72% | 1.78% | 1.95% |
| Expenses net of fee waivers, if any | 1.63%J | 1.63% | 1.69% | 1.72% | 1.78% | 1.95% |
| Expenses net of all reductions | 1.62%J | 1.63% | 1.69% | 1.72% | 1.77% | 1.95% |
| Net investment income (loss) | .69%J | .72% | .13% | (.08)% | (.02)% | (.75)%B |
| Supplemental Data | ||||||
| Net assets, end of period (in millions) | $45 | $44 | $49 | $53 | $54 | $43 |
| Portfolio turnover rateK | 40%J | 121% | 9% | 6% | 22% | 23% |
A Calculated based on average shares outstanding during the period.
B Net Investment income per share reflects a large, non-recurring dividend which amounted to $.06 per share. Excluding this non-recurring dividend, the ratio of net investment income (loss) to average net assets would have been (1.02) %.
C The amounts shown reflect certain reclassifications related to book to tax differences that were made in the year shown.
D Total distributions of $7.81 per share is comprised of distributions from net investment income of $.295 and distributions from net realized gain of $7.517 per share.
E Total returns for periods of less than one year are not annualized.
F Total returns would have been lower if certain expenses had not been reduced during the applicable periods shown.
G Total returns do not include the effect of the contingent deferred sales charge.
H Fees and expenses of any underlying Fidelity Central Funds are not included in the Fund's expense ratio. The Fund indirectly bears its proportionate share of the expenses of any underlying Fidelity Central Funds.
I Expense ratios reflect operating expenses of the class. Expenses before reductions do not reflect amounts reimbursed by the investment adviser or reductions from brokerage service arrangements or reductions from other expense offset arrangements and do not represent the amount paid by the class during periods when reimbursements or reductions occur. Expenses net of fee waivers reflect expenses after reimbursement by the investment adviser but prior to reductions from brokerage service arrangements or other expense offset arrangements. Expenses net of all reductions represent the net expenses paid by the class.
J Annualized
K Amount does not include the portfolio activity of any underlying Fidelity Central Funds.
See accompanying notes which are an integral part of the financial statements.
Financial Highlights — Fidelity Value Strategies Fund
| Six months ended (Unaudited) May 31, | Years ended November 30, | |||||
| 2017 | 2016 | 2015 | 2014 | 2013 | 2012 | |
| Selected Per–Share Data | ||||||
| Net asset value, beginning of period | $45.17 | $43.72 | $43.56 | $40.28 | $30.89 | $25.37 |
| Income from Investment Operations | ||||||
| Net investment income (loss)A | .36 | .76 | .51 | .40 | .37 | .09B |
| Net realized and unrealized gain (loss) | 3.37 | 1.21 | .07 | 3.21 | 9.20 | 5.62 |
| Total from investment operations | 3.73 | 1.97 | .58 | 3.61 | 9.57 | 5.71 |
| Distributions from net investment income | (.66) | (.51) | (.39)C | (.33) | (.18) | (.19) |
| Distributions from net realized gain | (7.52) | (.01) | (.03)C | – | – | – |
| Total distributions | (8.18) | (.52) | (.42) | (.33) | (.18) | (.19) |
| Net asset value, end of period | $40.72 | $45.17 | $43.72 | $43.56 | $40.28 | $30.89 |
| Total ReturnD,E | 9.21% | 4.64% | 1.35% | 9.05% | 31.14% | 22.69% |
| Ratios to Average Net AssetsF,G | ||||||
| Expenses before reductions | .57%H | .56% | .67% | .69% | .73% | .89% |
| Expenses net of fee waivers, if any | .56%H | .56% | .67% | .69% | .73% | .89% |
| Expenses net of all reductions | .56%H | .55% | .66% | .69% | .72% | .89% |
| Net investment income (loss) | 1.75%H | 1.79% | 1.16% | .95% | 1.03% | .31%B |
| Supplemental Data | ||||||
| Net assets, end of period (in millions) | $438 | $713 | $716 | $786 | $681 | $396 |
| Portfolio turnover rateI | 40%H | 121% | 9% | 6% | 22% | 23% |
A Calculated based on average shares outstanding during the period.
B Net Investment income per share reflects a large, non-recurring dividend which amounted to $.08 per share. Excluding this non-recurring dividend, the ratio of net investment income (loss) to average net assets would have been .04%.
C The amounts shown reflect certain reclassifications related to book to tax differences that were made in the year shown.
D Total returns for periods of less than one year are not annualized.
E Total returns would have been lower if certain expenses had not been reduced during the applicable periods shown.
F Fees and expenses of any underlying Fidelity Central Funds are not included in the Fund's expense ratio. The Fund indirectly bears its proportionate share of the expenses of any underlying Fidelity Central Funds.
G Expense ratios reflect operating expenses of the class. Expenses before reductions do not reflect amounts reimbursed by the investment adviser or reductions from brokerage service arrangements or reductions from other expense offset arrangements and do not represent the amount paid by the class during periods when reimbursements or reductions occur. Expenses net of fee waivers reflect expenses after reimbursement by the investment adviser but prior to reductions from brokerage service arrangements or other expense offset arrangements. Expenses net of all reductions represent the net expenses paid by the class.
H Annualized
I Amount does not include the portfolio activity of any underlying Fidelity Central Funds.
See accompanying notes which are an integral part of the financial statements.
Financial Highlights — Fidelity Advisor Value Strategies Fund Class K
| Six months ended (Unaudited) May 31, | Years ended November 30, | |||||
| 2017 | 2016 | 2015 | 2014 | 2013 | 2012 | |
| Selected Per–Share Data | ||||||
| Net asset value, beginning of period | $45.18 | $43.74 | $43.57 | $40.28 | $30.89 | $25.38 |
| Income from Investment Operations | ||||||
| Net investment income (loss)A | .38 | .80 | .58 | .47 | .43 | .14B |
| Net realized and unrealized gain (loss) | 3.38 | 1.22 | .07 | 3.20 | 9.18 | 5.61 |
| Total from investment operations | 3.76 | 2.02 | .65 | 3.67 | 9.61 | 5.75 |
| Distributions from net investment income | (.72) | (.57) | (.45)C | (.38) | (.22) | (.24) |
| Distributions from net realized gain | (7.52) | (.01) | (.03)C | – | – | – |
| Total distributions | (8.24) | (.58) | (.48) | (.38) | (.22) | (.24) |
| Net asset value, end of period | $40.70 | $45.18 | $43.74 | $43.57 | $40.28 | $30.89 |
| Total ReturnD,E | 9.29% | 4.76% | 1.51% | 9.21% | 31.34% | 22.93% |
| Ratios to Average Net AssetsF,G | ||||||
| Expenses before reductions | .44%H | .44% | .51% | .53% | .58% | .71% |
| Expenses net of fee waivers, if any | .44%H | .44% | .51% | .53% | .58% | .71% |
| Expenses net of all reductions | .43%H | .43% | .51% | .53% | .57% | .71% |
| Net investment income (loss) | 1.88%H | 1.91% | 1.31% | 1.11% | 1.18% | .50%B |
| Supplemental Data | ||||||
| Net assets, end of period (in millions) | $63 | $68 | $72 | $97 | $119 | $70 |
| Portfolio turnover rateI | 40%H | 121% | 9% | 6% | 22% | 23% |
A Calculated based on average shares outstanding during the period.
B Net Investment income per share reflects a large, non-recurring dividend which amounted to $.08 per share. Excluding this non-recurring dividend, the ratio of net investment income (loss) to average net assets would have been .22%.
C The amounts shown reflect certain reclassifications related to book to tax differences that were made in the year shown.
D Total returns for periods of less than one year are not annualized.
E Total returns would have been lower if certain expenses had not been reduced during the applicable periods shown.
F Fees and expenses of any underlying Fidelity Central Funds are not included in the Fund's expense ratio. The Fund indirectly bears its proportionate share of the expenses of any underlying Fidelity Central Funds.
G Expense ratios reflect operating expenses of the class. Expenses before reductions do not reflect amounts reimbursed by the investment adviser or reductions from brokerage service arrangements or reductions from other expense offset arrangements and do not represent the amount paid by the class during periods when reimbursements or reductions occur. Expenses net of fee waivers reflect expenses after reimbursement by the investment adviser but prior to reductions from brokerage service arrangements or other expense offset arrangements. Expenses net of all reductions represent the net expenses paid by the class.
H Annualized
I Amount does not include the portfolio activity of any underlying Fidelity Central Funds.
See accompanying notes which are an integral part of the financial statements.
Financial Highlights — Fidelity Advisor Value Strategies Fund Class I
| Six months ended (Unaudited) May 31, | Years ended November 30, | |||||
| 2017 | 2016 | 2015 | 2014 | 2013 | 2012 | |
| Selected Per–Share Data | ||||||
| Net asset value, beginning of period | $43.07 | $41.71 | $41.57 | $38.46 | $29.51 | $24.26 |
| Income from Investment Operations | ||||||
| Net investment income (loss)A | .33 | .70 | .48 | .37 | .34 | .08B |
| Net realized and unrealized gain (loss) | 3.20 | 1.15 | .08 | 3.06 | 8.79 | 5.37 |
| Total from investment operations | 3.53 | 1.85 | .56 | 3.43 | 9.13 | 5.45 |
| Distributions from net investment income | (.66) | (.48) | (.39)C | (.32) | (.18) | (.20) |
| Distributions from net realized gain | (7.52) | (.01) | (.03)C | – | – | – |
| Total distributions | (8.18) | (.49) | (.42) | (.32) | (.18) | (.20) |
| Net asset value, end of period | $38.42 | $43.07 | $41.71 | $41.57 | $38.46 | $29.51 |
| Total ReturnD,E | 9.19% | 4.57% | 1.36% | 9.01% | 31.11% | 22.67% |
| Ratios to Average Net AssetsF,G | ||||||
| Expenses before reductions | .62%H | .61% | .68% | .71% | .76% | .90% |
| Expenses net of fee waivers, if any | .62%H | .61% | .68% | .71% | .76% | .90% |
| Expenses net of all reductions | .61%H | .61% | .68% | .71% | .75% | .90% |
| Net investment income (loss) | 1.70%H | 1.74% | 1.14% | .93% | 1.00% | .31%B |
| Supplemental Data | ||||||
| Net assets, end of period (in millions) | $71 | $73 | $65 | $86 | $74 | $66 |
| Portfolio turnover rateI | 40%H | 121% | 9% | 6% | 22% | 23% |
A Calculated based on average shares outstanding during the period.
B Net Investment income per share reflects a large, non-recurring dividend which amounted to $.08 per share. Excluding this non-recurring dividend, the ratio of net investment income (loss) to average net assets would have been .03%.
C The amounts shown reflect certain reclassifications related to book to tax differences that were made in the year shown.
D Total returns for periods of less than one year are not annualized.
E Total returns would have been lower if certain expenses had not been reduced during the applicable periods shown.
F Fees and expenses of any underlying Fidelity Central Funds are not included in the Fund's expense ratio. The Fund indirectly bears its proportionate share of the expenses of any underlying Fidelity Central Funds.
G Expense ratios reflect operating expenses of the class. Expenses before reductions do not reflect amounts reimbursed by the investment adviser or reductions from brokerage service arrangements or reductions from other expense offset arrangements and do not represent the amount paid by the class during periods when reimbursements or reductions occur. Expenses net of fee waivers reflect expenses after reimbursement by the investment adviser but prior to reductions from brokerage service arrangements or other expense offset arrangements. Expenses net of all reductions represent the net expenses paid by the class.
H Annualized
I Amount does not include the portfolio activity of any underlying Fidelity Central Funds.
See accompanying notes which are an integral part of the financial statements.
Notes to Financial Statements (Unaudited)
For the period ended May 31, 2017
(Amounts in thousands except percentages)
1. Organization.
Fidelity Advisor Value Strategies Fund (the Fund) is a fund of Fidelity Advisor Series I (the Trust) and is authorized to issue an unlimited number of shares. The Trust is registered under the Investment Company Act of 1940, as amended (the 1940 Act), as an open-end management investment company organized as a Massachusetts business trust. The Fund offers Class A, Class M (formerly Class T), Class C, Fidelity Value Strategies Fund, Class K and Class I shares, each of which has equal rights as to assets and voting privileges. Each class has exclusive voting rights with respect to matters that affect that class.
After the close of business on June 24, 2016, all outstanding Class B shares were converted to Class A shares. All prior fiscal period dollar and share amounts for Class B presented in the Notes to Financial Statements are for the period December 1, 2015 through June 24, 2016.
2. Investments in Fidelity Central Funds.
The Fund invests in Fidelity Central Funds, which are open-end investment companies generally available only to other investment companies and accounts managed by the investment adviser and its affiliates. The Fund's Schedule of Investments lists each of the Fidelity Central Funds held as of period end, if any, as an investment of the Fund, but does not include the underlying holdings of each Fidelity Central Fund. As an Investing Fund, the Fund indirectly bears its proportionate share of the expenses of the underlying Fidelity Central Funds.
The Money Market Central Funds seek preservation of capital and current income and are managed by Fidelity Investments Money Management, Inc. (FIMM), an affiliate of the investment adviser. Annualized expenses of the Money Market Central Funds as of their most recent shareholder report date are less than .005%.
A complete unaudited list of holdings for each Fidelity Central Fund is available upon request or at the Securities and Exchange Commission (the SEC) website at www.sec.gov. In addition, the financial statements of the Fidelity Central Funds are available on the SEC website or upon request.
3. Significant Accounting Policies.
The Fund is an investment company and applies the accounting and reporting guidance of the Financial Accounting Standards Board (FASB) Accounting Standards Codification Topic 946 Financial Services – Investments Companies. The financial statements have been prepared in conformity with accounting principles generally accepted in the United States of America (GAAP), which require management to make certain estimates and assumptions at the date of the financial statements. Actual results could differ from those estimates. Subsequent events, if any, through the date that the financial statements were issued have been evaluated in the preparation of the financial statements. The following summarizes the significant accounting policies of the Fund:
Investment Valuation. Investments are valued as of 4:00 p.m. Eastern time on the last calendar day of the period. The Board of Trustees (the Board) has delegated the day to day responsibility for the valuation of the Fund's investments to the Fair Value Committee (the Committee) established by the Fund's investment adviser. In accordance with valuation policies and procedures approved by the Board, the Fund attempts to obtain prices from one or more third party pricing vendors or brokers to value its investments. When current market prices, quotations or currency exchange rates are not readily available or reliable, investments will be fair valued in good faith by the Committee, in accordance with procedures adopted by the Board. Factors used in determining fair value vary by investment type and may include market or investment specific events, changes in interest rates and credit quality. The frequency with which these procedures are used cannot be predicted and they may be utilized to a significant extent. The Committee oversees the Fund's valuation policies and procedures and reports to the Board on the Committee's activities and fair value determinations. The Board monitors the appropriateness of the procedures used in valuing the Fund's investments and ratifies the fair value determinations of the Committee.
The Fund categorizes the inputs to valuation techniques used to value its investments into a disclosure hierarchy consisting of three levels as shown below:
- Level 1 – quoted prices in active markets for identical investments
- Level 2 – other significant observable inputs (including quoted prices for similar investments, interest rates, prepayment speeds, etc.)
- Level 3 – unobservable inputs (including the Fund's own assumptions based on the best information available)
Valuation techniques used to value the Fund's investments by major category are as follows:
Equity securities, including restricted securities, for which market quotations are readily available, are valued at the last reported sale price or official closing price as reported by a third party pricing vendor on the primary market or exchange on which they are traded and are categorized as Level 1 in the hierarchy. In the event there were no sales during the day or closing prices are not available, securities are valued at the last quoted bid price or may be valued using the last available price and are generally categorized as Level 2 in the hierarchy. For foreign equity securities, when market or security specific events arise, comparisons to the valuation of American Depositary Receipts (ADRs), futures contracts, Exchange-Traded Funds (ETFs) and certain indexes as well as quoted prices for similar securities may be used and would be categorized as Level 2 in the hierarchy. Utilizing these techniques may result in transfers between Level 1 and Level 2. For equity securities, including restricted securities, where observable inputs are limited, assumptions about market activity and risk are used and these securities may be categorized as Level 3 in the hierarchy.
Debt securities, including restricted securities, are valued based on evaluated prices received from third party pricing vendors or from brokers who make markets in such securities. Corporate bonds are valued by pricing vendors who utilize matrix pricing which considers yield or price of bonds of comparable quality, coupon, maturity and type or by broker-supplied prices. When independent prices are unavailable or unreliable, debt securities may be valued utilizing pricing methodologies which consider similar factors that would be used by third party pricing vendors. Debt securities are generally categorized as Level 2 in the hierarchy but may be Level 3 depending on the circumstances.
Investments in open-end mutual funds, including the Fidelity Central Funds, are valued at their closing net asset value (NAV) each business day and are categorized as Level 1 in the hierarchy.
Changes in valuation techniques may result in transfers in or out of an assigned level within the disclosure hierarchy. The aggregate value of investments by input level as of May 31, 2017 is included at the end of the Fund's Schedule of Investments.
Foreign Currency. The Fund may use foreign currency contracts to facilitate transactions in foreign-denominated securities. Gains and losses from these transactions may arise from changes in the value of the foreign currency or if the counterparties do not perform under the contracts' terms.
Foreign-denominated assets, including investment securities, and liabilities are translated into U.S. dollars at the exchange rates at period end. Purchases and sales of investment securities, income and dividends received and expenses denominated in foreign currencies are translated into U.S. dollars at the exchange rate in effect on the transaction date.
The effects of exchange rate fluctuations on investments are included with the net realized and unrealized gain (loss) on investment securities. Other foreign currency transactions resulting in realized and unrealized gain (loss) are disclosed separately.
Investment Transactions and Income. For financial reporting purposes, the Fund's investment holdings and NAV include trades executed through the end of the last business day of the period. The NAV per share for processing shareholder transactions is calculated as of the close of business of the New York Stock Exchange (NYSE), normally 4:00 p.m. Eastern time and includes trades executed through the end of the prior business day. Gains and losses on securities sold are determined on the basis of identified cost and may include proceeds received from litigation. Dividend income is recorded on the ex-dividend date, except for certain dividends from foreign securities where the ex-dividend date may have passed, which are recorded as soon as the Fund is informed of the ex-dividend date. Non-cash dividends included in dividend income, if any, are recorded at the fair market value of the securities received. Income and capital gain distributions from Fidelity Central Funds, if any, are recorded on the ex-dividend date. Certain distributions received by the Fund represent a return of capital or capital gain. The Fund determines the components of these distributions subsequent to the ex-dividend date, based upon receipt of tax filings or other correspondence relating to the underlying investment. These distributions are recorded as a reduction of cost of investments and/or as a realized gain. Interest income is accrued as earned and includes coupon interest and amortization of premium and accretion of discount on debt securities as applicable. Investment income is recorded net of foreign taxes withheld where recovery of such taxes is uncertain.
Class Allocations and Expenses. Investment income, realized and unrealized capital gains and losses, common expenses of the Fund, and certain fund-level expense reductions, if any, are allocated daily on a pro-rata basis to each class based on the relative net assets of each class to the total net assets of the Fund. Each class differs with respect to transfer agent and distribution and service plan fees incurred. Certain expense reductions may also differ by class. For the reporting period, the allocated portion of income and expenses to each class as a percent of its average net assets may vary due to the timing of recording these transactions in relation to fluctuating net assets of the classes. Expenses directly attributable to a fund are charged to that fund. Expenses attributable to more than one fund are allocated among the respective funds on the basis of relative net assets or other appropriate methods. Expense estimates are accrued in the period to which they relate and adjustments are made when actual amounts are known.
Income Tax Information and Distributions to Shareholders. Each year, the Fund intends to qualify as a regulated investment company under Subchapter M of the Internal Revenue Code, including distributing substantially all of its taxable income and realized gains. As a result, no provision for U.S. Federal income taxes is required. The Fund files a U.S. federal tax return, in addition to state and local tax returns as required. The Fund's federal income tax returns are subject to examination by the Internal Revenue Service (IRS) for a period of three fiscal years after they are filed. State and local tax returns may be subject to examination for an additional fiscal year depending on the jurisdiction. Foreign taxes are provided for based on the Fund's understanding of the tax rules and rates that exist in the foreign markets in which it invests.
Distributions are declared and recorded on the ex-dividend date. Income dividends and capital gain distributions are declared separately for each class. Income and capital gain distributions are determined in accordance with income tax regulations, which may differ from GAAP.
Capital accounts within the financial statements are adjusted for permanent book-tax differences. These adjustments have no impact on net assets or the results of operations. Capital accounts are not adjusted for temporary book-tax differences which will reverse in a subsequent period.
Book-tax differences are primarily due to foreign currency transactions, futures contracts, passive foreign investment companies (PFIC), partnerships, market discount, deferred trustees compensation and losses deferred due to wash sales.
The federal tax cost of investment securities and unrealized appreciation (depreciation) as of period end were as follows:
| Gross unrealized appreciation | $165,568 |
| Gross unrealized depreciation | (35,361) |
| Net unrealized appreciation (depreciation) on securities | $130,207 |
| Tax cost | $971,677 |
4. Purchases and Sales of Investments.
Purchases and sales of securities, other than short-term securities, aggregated $232,802 and $613,222, respectively.
5. Fees and Other Transactions with Affiliates.
Management Fee. Fidelity Management & Research Company (the investment adviser) and its affiliates provide the Fund with investment management related services for which the Fund pays a monthly management fee. The management fee is the sum of an individual fund fee rate that is based on an annual rate of .30% of the Fund's average net assets and an annualized group fee rate that averaged .25% during the period. The group fee rate is based upon the average net assets of all the mutual funds advised by the investment adviser, including any mutual funds previously advised by the investment adviser that are currently advised by Fidelity SelectCo, LLC, an affiliate of the investment adviser. The group fee rate decreases as assets under management increase and increases as assets under management decrease. In addition, the management fee is subject to a performance adjustment (up to a maximum of +/- .20% of the Fund's average net assets over a 36 month performance period). The upward or downward adjustment to the management fee is based on the relative investment performance of Fidelity Value Strategies Fund as compared to its benchmark index, the Russell Midcap Value Index, over the same 36 month performance period. For the reporting period, the total annualized management fee rate, including the performance adjustment, was .34% of the Fund's average net assets. The performance adjustment included in the management fee rate may be higher or lower than the maximum performance adjustment rate due to the difference between the average net assets for the reporting and performance periods.
Distribution and Service Plan Fees. In accordance with Rule 12b-1 of the 1940 Act, the Fund has adopted separate Distribution and Service Plans for each class of shares. Certain classes pay Fidelity Distributors Corporation (FDC), an affiliate of the investment adviser, separate Distribution and Service Fees, each of which is based on an annual percentage of each class' average net assets. In addition, FDC may pay financial intermediaries for selling shares of the Fund and providing shareholder support services. For the period, the Distribution and Service Fee rates, total fees and amounts retained by FDC were as follows:
| Distribution Fee | Service Fee | Total Fees | Retained by FDC | |
| Class A | -% | .25% | $255 | $1 |
| Class M | .25% | .25% | 663 | 3 |
| Class C | .75% | .25% | 225 | 8 |
| $1,143 | $12 |
Sales Load. FDC may receive a front-end sales charge of up to 5.75% for selling Class A shares and 3.50% for selling Class M shares, some of which is paid to financial intermediaries for selling shares of the Fund. Depending on the holding period, FDC may receive contingent deferred sales charges levied on Class A, Class M and Class C redemptions. The deferred sales charges are 1.00% for Class C shares, 1.00% for certain purchases of Class A shares and .25% for certain purchases of Class M shares.
For the period, sales charge amounts retained by FDC were as follows:
| Retained by FDC | |
| Class A | $9 |
| Class M | 3 |
| Class C(a) | 1 |
| $13 |
(a) When Class C shares are initially sold, FDC pays commissions from its own resources to financial intermediaries through which the sales are made.
Transfer Agent Fees. Fidelity Investments Institutional Operations Company, Inc., (FIIOC), an affiliate of the investment adviser, is the transfer, dividend disbursing and shareholder servicing agent for each class of the Fund. FIIOC receives account fees and asset-based fees that vary according to the account size and type of account of the shareholders of the respective classes of the Fund, except for Class K. FIIOC receives an asset-based fee of Class K's average net assets. FIIOC pays for typesetting, printing and mailing of shareholder reports, except proxy statements.
For the period, transfer agent fees for each class were as follows:
| Amount | % of Class-Level Average Net Assets(a) | |
| Class A | $215 | .21 |
| Class M | 244 | .18 |
| Class C | 52 | .23 |
| Fidelity Value Strategies Fund | 428 | .17 |
| Class K | 16 | .05 |
| Class I | 84 | .22 |
| $1,039 |
(a) Annualized
Accounting and Security Lending Fees. Fidelity Service Company, Inc. (FSC), an affiliate of the investment adviser, maintains the Fund's accounting records. The accounting fee is based on the level of average net assets for each month. Under a separate contract, FSC administers the security lending program. The security lending fee is based on the number and duration of lending transactions.
Brokerage Commissions. The Fund placed a portion of its portfolio transactions with brokerage firms which are affiliates of the investment adviser. Brokerage commissions are included in net realized gain (loss) and change in net unrealized appreciation (depreciation) in the Statement of Operations. The commissions paid to these affiliated firms were $12 for the period.
Interfund Lending Program. Pursuant to an Exemptive Order issued by the SEC, the Fund, along with other registered investment companies having management contracts with FMR or other affiliated entities of FMR, may participate in an interfund lending program. This program provides an alternative credit facility allowing the funds to borrow from, or lend money to, other participating affiliated funds. At period end, there were no interfund loans outstanding. The Fund's activity in this program during the period for which loans were outstanding was as follows:
| Borrower or Lender | Average Loan Balance | Weighted Average Interest Rate | Interest Expense |
| Borrower | $13,420 | .84% | $3 |
Interfund Trades. The Fund may purchase from or sell securities to other Fidelity Funds under procedures adopted by the Board. The procedures have been designed to ensure these interfund trades are executed in accordance with Rule 17a-7 of the 1940 Act. Interfund trades are included within the respective purchases and sales amounts shown in the Purchases and Sales of Investments note.
6. Committed Line of Credit.
The Fund participates with other funds managed by the investment adviser or an affiliate in a $4.25 billion credit facility (the "line of credit") to be utilized for temporary or emergency purposes to fund shareholder redemptions or for other short-term liquidity purposes. The Fund has agreed to pay commitment fees on its pro-rata portion of the line of credit, which amounted to $2 and is reflected in Miscellaneous expenses on the Statement of Operations. During the period, the Fund did not borrow on this line of credit.
7. Security Lending.
The Fund lends portfolio securities through a lending agent from time to time in order to earn additional income. For equity securities, a lending agent is used and may loan securities to certain qualified borrowers, including Fidelity Capital Markets (FCM), a broker-dealer affiliated with the Fund. On the settlement date of the loan, the Fund receives collateral (in the form of U.S. Treasury obligations, letters of credit and/or cash) against the loaned securities and maintains collateral in an amount not less than 100% of the market value of the loaned securities during the period of the loan. The market value of the loaned securities is determined at the close of business of the Fund and any additional required collateral is delivered to the Fund on the next business day. The Fund or borrower may terminate the loan at any time, and if the borrower defaults on its obligation to return the securities loaned because of insolvency or other reasons, the Fund may apply collateral received from the borrower against the obligation. The Fund may experience delays and costs in recovering the securities loaned. Any cash collateral received is invested in the Fidelity Securities Lending Cash Central Fund. The value of loaned securities and cash collateral at period end are disclosed on the Fund's Statement of Assets and Liabilities. At period end, there were no security loans outstanding with FCM. Security lending income represents the income earned on investing cash collateral, less rebates paid to borrowers and any lending agent fees associated with the loan, plus any premium payments received for lending certain types of securities. Security lending income is presented in the Statement of Operations as a component of income from Fidelity Central Funds. Total security lending income during the period amounted to $27, including an amount of less than five hundred dollars from securities loaned to FCM.
8. Bank Borrowings.
The Fund is permitted to have bank borrowings for temporary or emergency purposes to fund shareholder redemptions or for other short-term liquidity requirements. The Fund has established borrowing arrangements with certain banks. The interest rate on the borrowings is the bank's base rate, as revised from time to time. The average loan balance during the period for which loans were outstanding amounted to $5,859. The weighted average interest rate was 1.16%. The interest expense amounted to $1 under the bank borrowing program. At period end, there were no bank borrowings outstanding.
9. Expense Reductions.
Commissions paid to certain brokers with whom the investment adviser, or its affiliates, places trades on behalf of the Fund include an amount in addition to trade execution, which may be rebated back to the Fund to offset certain expenses. This amount totaled $47 for the period.
In addition, during the period the investment adviser reimbursed and/or waived a portion of fund-level operating expenses in the amount of $6.
10. Distributions to Shareholders.
Distributions to shareholders of each class were as follows:
| Six months ended May 31, 2017 | Year ended November 30, 2016 | |
| From net investment income | ||
| Class A | $2,766 | $2,186 |
| Class M | 2,831 | 2,155 |
| Class C | 357 | 187 |
| Fidelity Value Strategies Fund | 9,926 | 9,139 |
| Class K | 1,087 | 955 |
| Class I | 1,123 | 746 |
| Total | $18,090 | $15,368 |
| From net realized gain | ||
| Class A | $37,462 | $49 |
| Class M | 46,673 | 65 |
| Class C | 9,088 | 13 |
| Fidelity Value Strategies Fund | 112,547 | 160 |
| Class K | 11,298 | 15 |
| Class I | 12,750 | 14 |
| Total | $229,818 | $316 |
11. Share Transactions.
Share transactions for each class were as follows and may contain automatic conversions between classes or exchanges between affiliated funds:
| Shares | Shares | Dollars | Dollars | |
| Six months ended May 31, 2017 | Year ended November 30, 2016 | Six months ended May 31, 2017 | Year ended November 30, 2016 | |
| Class A | ||||
| Shares sold | 192 | 471 | $6,787 | $17,474 |
| Reinvestment of distributions | 1,127 | 58 | 37,943 | 2,110 |
| Shares redeemed | (683) | (998) | (24,175) | (37,279) |
| Net increase (decrease) | 636 | (469) | $20,555 | $(17,695) |
| Class M | ||||
| Shares sold | 232 | 349 | $8,465 | $13,447 |
| Reinvestment of distributions | 1,294 | 54 | 45,666 | 2,045 |
| Shares redeemed | (821) | (1,385) | (30,524) | (53,890) |
| Net increase (decrease) | 705 | (982) | $23,607 | $(38,398) |
| Class B | ||||
| Shares sold | – | – | $– | $9 |
| Shares redeemed | – | (110) | – | (3,723) |
| Net increase (decrease) | – | (110) | $– | $(3,714) |
| Class C | ||||
| Shares sold | 53 | 78 | $1,654 | $2,605 |
| Reinvestment of distributions | 307 | 6 | 9,116 | 191 |
| Shares redeemed | (150) | (263) | (4,672) | (8,759) |
| Net increase (decrease) | 210 | (179) | $6,098 | $(5,963) |
| Fidelity Value Strategies Fund | ||||
| Shares sold | 772 | 9,301 | $33,461 | $395,357 |
| Reinvestment of distributions | 2,966 | 182 | 114,742 | 7,409 |
| Shares redeemed | (8,769) | (10,077) | (349,323) | (417,147) |
| Net increase (decrease) | (5,031) | (594) | $(201,120) | $(14,381) |
| Class K | ||||
| Shares sold | 164 | 480 | $6,706 | $20,396 |
| Reinvestment of distributions | 321 | 24 | 12,385 | 970 |
| Shares redeemed | (426) | (644) | (17,009) | (27,300) |
| Net increase (decrease) | 59 | (140) | $2,082 | $(5,934) |
| Class I | ||||
| Shares sold | 334 | 445 | $12,821 | $18,090 |
| Reinvestment of distributions | 339 | 19 | 12,386 | 723 |
| Shares redeemed | (526) | (330) | (20,059) | (13,236) |
| Net increase (decrease) | 147 | 134 | $5,148 | $5,577 |
12. Other.
The Fund's organizational documents provide former and current trustees and officers with a limited indemnification against liabilities arising in connection with the performance of their duties to the Fund. In the normal course of business, the Fund may also enter into contracts that provide general indemnifications. The Fund's maximum exposure under these arrangements is unknown as this would be dependent on future claims that may be made against the Fund. The risk of material loss from such claims is considered remote.
Shareholder Expense Example
As a shareholder of the Fund, you incur two types of costs: (1) transaction costs, including sales charges (loads) on purchase payments or redemption proceeds, and (2) ongoing costs, including management fees, distribution and/or service (12b-1) fees and other Fund expenses. This Example is intended to help you understand your ongoing costs (in dollars) of investing in the Fund and to compare these costs with the ongoing costs of investing in other mutual funds.
The Example is based on an investment of $1,000 invested at the beginning of the period and held for the entire period (December 1, 2016 to May 31, 2017).
Actual Expenses
The first line of the accompanying table for each class of the Fund provides information about actual account values and actual expenses. You may use the information in this line, together with the amount you invested, to estimate the expenses that you paid over the period. Simply divide your account value by $1,000.00 (for example, an $8,600 account value divided by $1,000.00 = 8.6), then multiply the result by the number in the first line for a class of the Fund under the heading entitled "Expenses Paid During Period" to estimate the expenses you paid on your account during this period. A small balance maintenance fee of $12.00 that is charged once a year may apply for certain accounts with a value of less than $2,000. This fee is not included in the table below. If it was, the estimate of expenses you paid during the period would be higher, and your ending account value lower, by this amount. In addition, the Fund, as a shareholder in the underlying Fidelity Central Funds, will indirectly bear its pro-rata share of the fees and expenses incurred by the underlying Fidelity Central Funds. These fees and expenses are not included in the Fund's annualized expense ratio used to calculate the expense estimate in the table below.
Hypothetical Example for Comparison Purposes
The second line of the accompanying table for each class of the Fund provides information about hypothetical account values and hypothetical expenses based on a Class' actual expense ratio and an assumed rate of return of 5% per year before expenses, which is not the Class' actual return. The hypothetical account values and expenses may not be used to estimate the actual ending account balance or expenses you paid for the period. You may use this information to compare the ongoing costs of investing in the Fund and other funds. To do so, compare this 5% hypothetical example with the 5% hypothetical examples that appear in the shareholder reports of the other funds. A small balance maintenance fee of $12.00 that is charged once a year may apply for certain accounts with a value of less than $2,000. This fee is not included in the table below. If it was, the estimate of expenses you paid during the period would be higher, and your ending account value lower, by this amount. In addition, the Fund, as a shareholder in the underlying Fidelity Central Funds, will indirectly bear its pro-rata share of the fees and expenses incurred by the underlying Fidelity Central Funds. These fees and expenses are not included in the Fund's annualized expense ratio used to calculate the expense estimate in the table below.
Please note that the expenses shown in the table are meant to highlight your ongoing costs only and do not reflect any transaction costs. Therefore, the second line of the table is useful in comparing ongoing costs only, and will not help you determine the relative total costs of owning different funds. In addition, if these transactional costs were included, your costs would have been higher.
| Annualized Expense Ratio-A | Beginning Account Value December 1, 2016 | Ending Account Value May 31, 2017 | Expenses Paid During Period-B December 1, 2016 to May 31, 2017 | |
| Class A | .85% | |||
| Actual | $1,000.00 | $1,090.60 | $4.43 | |
| Hypothetical-C | $1,000.00 | $1,020.69 | $4.28 | |
| Class M | 1.08% | |||
| Actual | $1,000.00 | $1,089.30 | $5.63 | |
| Hypothetical-C | $1,000.00 | $1,019.55 | $5.44 | |
| Class C | 1.63% | |||
| Actual | $1,000.00 | $1,086.70 | $8.48 | |
| Hypothetical-C | $1,000.00 | $1,016.80 | $8.20 | |
| Fidelity Value Strategies Fund | .56% | |||
| Actual | $1,000.00 | $1,092.10 | $2.92 | |
| Hypothetical-C | $1,000.00 | $1,022.14 | $2.82 | |
| Class K | .44% | |||
| Actual | $1,000.00 | $1,092.90 | $2.30 | |
| Hypothetical-C | $1,000.00 | $1,022.74 | $2.22 | |
| Class I | .62% | |||
| Actual | $1,000.00 | $1,091.90 | $3.23 | |
| Hypothetical-C | $1,000.00 | $1,021.84 | $3.13 |
A Annualized expense ratio reflects expenses net of applicable fee waivers.
B Expenses are equal to each Class' annualized expense ratio, multiplied by the average account value over the period, multiplied by 182/365 (to reflect the one-half year period).
C 5% return per year before expenses
![]()
SO-SANN-0717
1.704744.119
Fidelity® Value Strategies Fund Semi-Annual Report May 31, 2017 Fidelity® Value Strategies Fund is a class of Fidelity Advisor® Value Strategies Fund |
|
Contents
To view a fund's proxy voting guidelines and proxy voting record for the 12-month period ended June 30, visit http://www.fidelity.com/proxyvotingresults or visit the Securities and Exchange Commission's (SEC) web site at http://www.sec.gov.
You may also call 1-800-544-8544 to request a free copy of the proxy voting guidelines.
Standard & Poor's, S&P and S&P 500 are registered service marks of The McGraw-Hill Companies, Inc. and have been licensed for use by Fidelity Distributors Corporation.
Other third-party marks appearing herein are the property of their respective owners.
All other marks appearing herein are registered or unregistered trademarks or service marks of FMR LLC or an affiliated company. © 2017 FMR LLC. All rights reserved.
This report and the financial statements contained herein are submitted for the general information of the shareholders of the Fund. This report is not authorized for distribution to prospective investors in the Fund unless preceded or accompanied by an effective prospectus.
A fund files its complete schedule of portfolio holdings with the SEC for the first and third quarters of each fiscal year on Form N-Q. Forms N-Q are available on the SEC’s web site at http://www.sec.gov. A fund's Forms N-Q may be reviewed and copied at the SEC’s Public Reference Room in Washington, DC. Information regarding the operation of the SEC's Public Reference Room may be obtained by calling 1-800-SEC-0330.
For a complete list of a fund's portfolio holdings, view the most recent holdings listing, semiannual report, or annual report on Fidelity's web site at http://www.fidelity.com, http://www.institutional.fidelity.com, or http://www.401k.com, as applicable.
NOT FDIC INSURED •MAY LOSE VALUE •NO BANK GUARANTEE
Neither the Fund nor Fidelity Distributors Corporation is a bank.
Investment Summary (Unaudited)
Top Ten Stocks as of May 31, 2017
| % of fund's net assets | % of fund's net assets 6 months ago | |
| American Tower Corp. | 3.4 | 2.4 |
| Edison International | 3.3 | 3.1 |
| Sempra Energy | 3.1 | 3.0 |
| U.S. Bancorp | 2.4 | 2.6 |
| Synchrony Financial | 2.2 | 2.7 |
| American Electric Power Co., Inc. | 2.2 | 2.0 |
| Extra Space Storage, Inc. | 2.2 | 1.9 |
| Jazz Pharmaceuticals PLC | 2.2 | 1.6 |
| Equity Lifestyle Properties, Inc. | 2.0 | 0.8 |
| Douglas Emmett, Inc. | 1.9 | 0.0 |
| 24.9 |
Top Five Market Sectors as of May 31, 2017
| % of fund's net assets | % of fund's net assets 6 months ago | |
| Financials | 16.3 | 18.3 |
| Real Estate | 13.8 | 11.2 |
| Information Technology | 11.5 | 11.8 |
| Industrials | 11.3 | 10.2 |
| Consumer Discretionary | 9.7 | 12.5 |
Asset Allocation (% of fund's net assets)
| As of May 31, 2017* | ||
| Stocks | 99.2% | |
| Convertible Securities | 0.6% | |
| Short-Term Investments and Net Other Assets (Liabilities) | 0.2% | |

* Foreign investments - 16.7%
| As of November 30, 2016* | ||
| Stocks | 99.0% | |
| Convertible Securities | 0.7% | |
| Short-Term Investments and Net Other Assets (Liabilities) | 0.3% | |

* Foreign investments - 16.3%
Percentages shown as 0.0% may reflect amounts less than 0.05%.
Investments May 31, 2017 (Unaudited)
Showing Percentage of Net Assets
| Common Stocks - 99.2% | |||
| Shares | Value (000s) | ||
| CONSUMER DISCRETIONARY - 9.7% | |||
| Auto Components - 1.7% | |||
| Delphi Automotive PLC | 210,377 | $18,507 | |
| Diversified Consumer Services - 2.9% | |||
| Houghton Mifflin Harcourt Co. (a) | 1,039,456 | 12,837 | |
| Service Corp. International | 553,650 | 17,650 | |
| 30,487 | |||
| Hotels, Restaurants & Leisure - 1.0% | |||
| Wyndham Worldwide Corp. | 106,867 | 10,792 | |
| Leisure Products - 0.3% | |||
| Vista Outdoor, Inc. (a) | 169,156 | 3,549 | |
| Media - 3.2% | |||
| Liberty Broadband Corp. Class C (a) | 105,415 | 9,400 | |
| Liberty Global PLC Class C (a) | 249,900 | 7,427 | |
| Sinclair Broadcast Group, Inc. Class A (b) | 347,799 | 11,269 | |
| Twenty-First Century Fox, Inc. Class A | 238,000 | 6,455 | |
| 34,551 | |||
| Specialty Retail - 0.6% | |||
| GameStop Corp. Class A (b) | 305,313 | 6,760 | |
| TOTAL CONSUMER DISCRETIONARY | 104,646 | ||
| CONSUMER STAPLES - 4.1% | |||
| Beverages - 1.1% | |||
| Cott Corp. | 896,364 | 11,825 | |
| Food & Staples Retailing - 1.8% | |||
| Kroger Co. | 264,700 | 7,883 | |
| Whole Foods Market, Inc. | 326,356 | 11,419 | |
| 19,302 | |||
| Food Products - 1.2% | |||
| Darling International, Inc. (a) | 839,122 | 13,149 | |
| TOTAL CONSUMER STAPLES | 44,276 | ||
| ENERGY - 7.4% | |||
| Energy Equipment & Services - 1.2% | |||
| Baker Hughes, Inc. | 227,230 | 12,532 | |
| Oil, Gas & Consumable Fuels - 6.2% | |||
| Anadarko Petroleum Corp. | 152,500 | 7,706 | |
| Boardwalk Pipeline Partners, LP | 740,936 | 13,389 | |
| Cabot Oil & Gas Corp. | 330,200 | 7,327 | |
| ConocoPhillips Co. | 302,300 | 13,510 | |
| EQT Corp. | 96,200 | 5,317 | |
| GasLog Ltd. (b) | 543,261 | 7,035 | |
| Teekay Corp. (b) | 1,472,713 | 8,998 | |
| Teekay Offshore Partners LP | 1,330,500 | 4,164 | |
| 67,446 | |||
| TOTAL ENERGY | 79,978 | ||
| FINANCIALS - 16.3% | |||
| Banks - 5.1% | |||
| PNC Financial Services Group, Inc. | 91,100 | 10,814 | |
| U.S. Bancorp | 515,484 | 26,233 | |
| Wells Fargo & Co. | 346,470 | 17,718 | |
| 54,765 | |||
| Capital Markets - 3.6% | |||
| Apollo Global Management LLC Class A | 443,250 | 11,981 | |
| Legg Mason, Inc. | 370,317 | 13,654 | |
| The Blackstone Group LP | 402,800 | 13,244 | |
| 38,879 | |||
| Consumer Finance - 4.4% | |||
| Discover Financial Services | 226,200 | 13,278 | |
| OneMain Holdings, Inc. (a) | 445,100 | 10,041 | |
| Synchrony Financial | 886,613 | 23,806 | |
| 47,125 | |||
| Insurance - 3.2% | |||
| Chubb Ltd. | 98,682 | 14,130 | |
| FNF Group | 481,359 | 20,511 | |
| 34,641 | |||
| TOTAL FINANCIALS | 175,410 | ||
| HEALTH CARE - 7.9% | |||
| Biotechnology - 2.4% | |||
| Amgen, Inc. | 79,200 | 12,295 | |
| United Therapeutics Corp. (a) | 112,300 | 13,576 | |
| 25,871 | |||
| Health Care Providers & Services - 2.5% | |||
| Aetna, Inc. | 69,400 | 10,053 | |
| Envision Healthcare Corp. (a) | 127,151 | 6,944 | |
| Laboratory Corp. of America Holdings (a) | 71,578 | 9,949 | |
| 26,946 | |||
| Pharmaceuticals - 3.0% | |||
| Jazz Pharmaceuticals PLC (a) | 160,400 | 23,348 | |
| Teva Pharmaceutical Industries Ltd. sponsored ADR | 332,300 | 9,258 | |
| 32,606 | |||
| TOTAL HEALTH CARE | 85,423 | ||
| INDUSTRIALS - 11.3% | |||
| Aerospace & Defense - 2.2% | |||
| KLX, Inc. (a) | 265,610 | 12,853 | |
| Rockwell Collins, Inc. | 96,300 | 10,502 | |
| 23,355 | |||
| Airlines - 1.2% | |||
| Delta Air Lines, Inc. | 265,900 | 13,064 | |
| Commercial Services & Supplies - 1.6% | |||
| IWG PLC | 1,635,100 | 7,001 | |
| KAR Auction Services, Inc. | 231,200 | 10,073 | |
| 17,074 | |||
| Construction & Engineering - 1.3% | |||
| AECOM (a) | 450,400 | 14,462 | |
| Machinery - 2.8% | |||
| Allison Transmission Holdings, Inc. | 451,275 | 17,473 | |
| Ingersoll-Rand PLC | 135,700 | 12,159 | |
| 29,632 | |||
| Road & Rail - 0.6% | |||
| Swift Transporation Co. (a) | 282,800 | 6,773 | |
| Trading Companies & Distributors - 1.6% | |||
| AerCap Holdings NV (a) | 393,437 | 17,319 | |
| TOTAL INDUSTRIALS | 121,679 | ||
| INFORMATION TECHNOLOGY - 11.5% | |||
| Communications Equipment - 1.2% | |||
| CommScope Holding Co., Inc. (a) | 346,568 | 12,820 | |
| Electronic Equipment & Components - 1.6% | |||
| Jabil Circuit, Inc. | 102,109 | 3,055 | |
| TE Connectivity Ltd. | 176,981 | 13,955 | |
| 17,010 | |||
| IT Services - 7.3% | |||
| Amdocs Ltd. | 169,000 | 10,948 | |
| Cognizant Technology Solutions Corp. Class A | 268,500 | 17,965 | |
| DXC Technology Co. | 263,400 | 20,419 | |
| First Data Corp. Class A (a) | 881,140 | 15,094 | |
| Total System Services, Inc. | 227,900 | 13,571 | |
| 77,997 | |||
| Semiconductors & Semiconductor Equipment - 1.4% | |||
| Qualcomm, Inc. | 267,600 | 15,325 | |
| TOTAL INFORMATION TECHNOLOGY | 123,152 | ||
| MATERIALS - 8.6% | |||
| Chemicals - 6.9% | |||
| CF Industries Holdings, Inc. | 348,953 | 9,387 | |
| E.I. du Pont de Nemours & Co. | 233,600 | 18,436 | |
| Eastman Chemical Co. | 216,934 | 17,379 | |
| LyondellBasell Industries NV Class A | 178,492 | 14,372 | |
| Westlake Chemical Corp. | 239,703 | 14,732 | |
| 74,306 | |||
| Containers & Packaging - 1.7% | |||
| Ball Corp. | 254,666 | 10,416 | |
| Sealed Air Corp. | 178,100 | 7,911 | |
| 18,327 | |||
| TOTAL MATERIALS | 92,633 | ||
| REAL ESTATE - 13.8% | |||
| Equity Real Estate Investment Trusts (REITs) - 12.5% | |||
| American Tower Corp. | 278,208 | 36,496 | |
| Douglas Emmett, Inc. | 551,900 | 20,950 | |
| Equinix, Inc. | 43,600 | 19,228 | |
| Equity Lifestyle Properties, Inc. | 253,700 | 21,412 | |
| Extra Space Storage, Inc. | 301,728 | 23,375 | |
| Outfront Media, Inc. | 551,504 | 12,602 | |
| 134,063 | |||
| Real Estate Management & Development - 1.3% | |||
| CBRE Group, Inc. (a) | 402,400 | 14,036 | |
| TOTAL REAL ESTATE | 148,099 | ||
| UTILITIES - 8.6% | |||
| Electric Utilities - 5.5% | |||
| American Electric Power Co., Inc. | 325,742 | 23,382 | |
| Edison International | 435,971 | 35,562 | |
| 58,944 | |||
| Multi-Utilities - 3.1% | |||
| Sempra Energy | 291,888 | 34,002 | |
| TOTAL UTILITIES | 92,946 | ||
| TOTAL COMMON STOCKS | |||
| (Cost $934,096) | 1,068,242 | ||
| Principal Amount (000s) | Value (000s) | ||
| Convertible Bonds - 0.6% | |||
| ENERGY - 0.6% | |||
| Oil, Gas & Consumable Fuels - 0.6% | |||
| Cobalt International Energy, Inc. 2.625% 12/1/19 (Cost $9,900) | 18,190 | 6,374 | |
| Shares | Value (000s) | ||
| Money Market Funds - 2.5% | |||
| Fidelity Cash Central Fund, 0.86% (c) | 2,331,345 | 2,332 | |
| Fidelity Securities Lending Cash Central Fund 0.87% (c)(d) | 24,933,416 | 24,936 | |
| TOTAL MONEY MARKET FUNDS | |||
| (Cost $27,268) | 27,268 | ||
| TOTAL INVESTMENT PORTFOLIO - 102.3% | |||
| (Cost $971,264) | 1,101,884 | ||
| NET OTHER ASSETS (LIABILITIES) - (2.3)% | (24,933) | ||
| NET ASSETS - 100% | $1,076,951 |
Legend
(a) Non-income producing
(b) Security or a portion of the security is on loan at period end.
(c) Affiliated fund that is generally available only to investment companies and other accounts managed by Fidelity Investments. The rate quoted is the annualized seven-day yield of the fund at period end. A complete unaudited listing of the fund's holdings as of its most recent quarter end is available upon request. In addition, each Fidelity Central Fund's financial statements are available on the SEC's website or upon request.
(d) Investment made with cash collateral received from securities on loan.
Affiliated Central Funds
Information regarding fiscal year to date income earned by the Fund from investments in Fidelity Central Funds is as follows:
| Fund | Income earned |
| (Amounts in thousands) | |
| Fidelity Cash Central Fund | $11 |
| Fidelity Securities Lending Cash Central Fund | 27 |
| Total | $38 |
Investment Valuation
The following is a summary of the inputs used, as of May 31, 2017, involving the Fund's assets and liabilities carried at fair value. The inputs or methodology used for valuing securities may not be an indication of the risk associated with investing in those securities. For more information on valuation inputs, and their aggregation into the levels used below, please refer to the Investment Valuation section in the accompanying Notes to Financial Statements.
| Valuation Inputs at Reporting Date: | ||||
| Description | Total | Level 1 | Level 2 | Level 3 |
| (Amounts in thousands) | ||||
| Investments in Securities: | ||||
| Equities: | ||||
| Consumer Discretionary | $104,646 | $104,646 | $-- | $-- |
| Consumer Staples | 44,276 | 44,276 | -- | -- |
| Energy | 79,978 | 79,978 | -- | -- |
| Financials | 175,410 | 175,410 | -- | -- |
| Health Care | 85,423 | 85,423 | -- | -- |
| Industrials | 121,679 | 121,679 | -- | -- |
| Information Technology | 123,152 | 123,152 | -- | -- |
| Materials | 92,633 | 92,633 | -- | -- |
| Real Estate | 148,099 | 148,099 | -- | -- |
| Utilities | 92,946 | 92,946 | -- | -- |
| Corporate Bonds | 6,374 | -- | 6,374 | -- |
| Money Market Funds | 27,268 | 27,268 | -- | -- |
| Total Investments in Securities: | $1,101,884 | $1,095,510 | $6,374 | $-- |
Other Information
Distribution of investments by country or territory of incorporation, as a percentage of Total Net Assets, is as follows (Unaudited):
| United States of America | 83.3% |
| Ireland | 3.4% |
| Netherlands | 2.9% |
| Switzerland | 2.6% |
| Bailiwick of Jersey | 2.4% |
| Marshall Islands | 1.2% |
| Canada | 1.1% |
| Bailiwick of Guernsey | 1.0% |
| Others (Individually Less Than 1%) | 2.1% |
| 100.0% |
See accompanying notes which are an integral part of the financial statements.
Financial Statements
Statement of Assets and Liabilities
| Amounts in thousands (except per-share amounts) | May 31, 2017 (Unaudited) | |
| Assets | ||
| Investment in securities, at value (including securities loaned of $23,947) — See accompanying schedule: Unaffiliated issuers (cost $943,996) | $1,074,616 | |
| Fidelity Central Funds (cost $27,268) | 27,268 | |
| Total Investments (cost $971,264) | $1,101,884 | |
| Receivable for investments sold | 2,632 | |
| Receivable for fund shares sold | 240 | |
| Dividends receivable | 1,285 | |
| Interest receivable | 242 | |
| Distributions receivable from Fidelity Central Funds | 9 | |
| Other receivables | 11 | |
| Total assets | 1,106,303 | |
| Liabilities | ||
| Payable for investments purchased | $1,145 | |
| Payable for fund shares redeemed | 2,517 | |
| Accrued management fee | 334 | |
| Distribution and service plan fees payable | 188 | |
| Other affiliated payables | 197 | |
| Other payables and accrued expenses | 34 | |
| Collateral on securities loaned | 24,937 | |
| Total liabilities | 29,352 | |
| Net Assets | $1,076,951 | |
| Net Assets consist of: | ||
| Paid in capital | $892,078 | |
| Undistributed net investment income | 6,820 | |
| Accumulated undistributed net realized gain (loss) on investments and foreign currency transactions | 47,433 | |
| Net unrealized appreciation (depreciation) on investments and assets and liabilities in foreign currencies | 130,620 | |
| Net Assets | $1,076,951 | |
| Calculation of Maximum Offering Price | ||
| Class A: | ||
| Net Asset Value and redemption price per share ($201,183 ÷ 5,681.8 shares) | $35.41 | |
| Maximum offering price per share (100/94.25 of $35.41) | $37.57 | |
| Class M: | ||
| Net Asset Value and redemption price per share ($259,598 ÷ 7,002.7 shares) | $37.07 | |
| Maximum offering price per share (100/96.50 of $37.07) | $38.41 | |
| Class C: | ||
| Net Asset Value and offering price per share ($44,530 ÷ 1,430.2 shares)(a) | $31.14 | |
| Fidelity Value Strategies Fund: | ||
| Net Asset Value, offering price and redemption price per share ($437,687 ÷ 10,748.1 shares) | $40.72 | |
| Class K: | ||
| Net Asset Value, offering price and redemption price per share ($63,354 ÷ 1,556.7 shares) | $40.70 | |
| Class I: | ||
| Net Asset Value, offering price and redemption price per share ($70,599 ÷ 1,837.4 shares) | $38.42 |
(a) Redemption price per share is equal to net asset value less any applicable contingent deferred sales charge.
See accompanying notes which are an integral part of the financial statements.
Statement of Operations
| Amounts in thousands | Six months ended May 31, 2017 (Unaudited) | |
| Investment Income | ||
| Dividends | $11,973 | |
| Interest | 1,354 | |
| Income from Fidelity Central Funds | 38 | |
| Total income | 13,365 | |
| Expenses | ||
| Management fee | ||
| Basic fee | $3,166 | |
| Performance adjustment | (1,210) | |
| Transfer agent fees | 1,039 | |
| Distribution and service plan fees | 1,143 | |
| Accounting and security lending fees | 189 | |
| Custodian fees and expenses | 21 | |
| Independent trustees' fees and expenses | 3 | |
| Registration fees | 70 | |
| Audit | 33 | |
| Legal | 4 | |
| Interest | 4 | |
| Miscellaneous | 6 | |
| Total expenses before reductions | 4,468 | |
| Expense reductions | (53) | 4,415 |
| Net investment income (loss) | 8,950 | |
| Realized and Unrealized Gain (Loss) | ||
| Net realized gain (loss) on: | ||
| Investment securities: | ||
| Unaffiliated issuers | 46,986 | |
| Fidelity Central Funds | (2) | |
| Foreign currency transactions | (3) | |
| Total net realized gain (loss) | 46,981 | |
| Change in net unrealized appreciation (depreciation) on: Investment securities | 49,448 | |
| Total change in net unrealized appreciation (depreciation) | 49,448 | |
| Net gain (loss) | 96,429 | |
| Net increase (decrease) in net assets resulting from operations | $105,379 |
See accompanying notes which are an integral part of the financial statements.
Statement of Changes in Net Assets
| Amounts in thousands | Six months ended May 31, 2017 (Unaudited) | Year ended November 30, 2016 |
| Increase (Decrease) in Net Assets | ||
| Operations | ||
| Net investment income (loss) | $8,950 | $22,186 |
| Net realized gain (loss) | 46,981 | 392,411 |
| Change in net unrealized appreciation (depreciation) | 49,448 | (369,931) |
| Net increase (decrease) in net assets resulting from operations | 105,379 | 44,666 |
| Distributions to shareholders from net investment income | (18,090) | (15,368) |
| Distributions to shareholders from net realized gain | (229,818) | (316) |
| Total distributions | (247,908) | (15,684) |
| Share transactions - net increase (decrease) | (143,630) | (80,508) |
| Total increase (decrease) in net assets | (286,159) | (51,526) |
| Net Assets | ||
| Beginning of period | 1,363,110 | 1,414,636 |
| End of period | $1,076,951 | $1,363,110 |
| Other Information | ||
| Undistributed net investment income end of period | $6,820 | $15,960 |
See accompanying notes which are an integral part of the financial statements.
Financial Highlights — Fidelity Advisor Value Strategies Fund Class A
| Six months ended (Unaudited) May 31, | Years ended November 30, | |||||
| 2017 | 2016 | 2015 | 2014 | 2013 | 2012 | |
| Selected Per–Share Data | ||||||
| Net asset value, beginning of period | $40.25 | $39.01 | $38.91 | $36.02 | $27.62 | $22.71 |
| Income from Investment Operations | ||||||
| Net investment income (loss)A | .26 | .56 | .35 | .25 | .23 | –B |
| Net realized and unrealized gain (loss) | 2.97 | 1.09 | .06 | 2.87 | 8.25 | 5.03 |
| Total from investment operations | 3.23 | 1.65 | .41 | 3.12 | 8.48 | 5.03 |
| Distributions from net investment income | (.56) | (.40) | (.28)C | (.23) | (.08) | (.12) |
| Distributions from net realized gain | (7.52) | (.01) | (.03)C | – | – | – |
| Total distributions | (8.07)D | (.41) | (.31) | (.23) | (.08) | (.12) |
| Net asset value, end of period | $35.41 | $40.25 | $39.01 | $38.91 | $36.02 | $27.62 |
| Total ReturnE,F,G | 9.06% | 4.33% | 1.07% | 8.74% | 30.77% | 22.29% |
| Ratios to Average Net AssetsH,I | ||||||
| Expenses before reductions | .86%J | .86% | .93% | .96% | 1.04% | 1.21% |
| Expenses net of fee waivers, if any | .85%J | .86% | .93% | .96% | 1.04% | 1.21% |
| Expenses net of all reductions | .85%J | .86% | .93% | .96% | 1.03% | 1.21% |
| Net investment income (loss) | 1.46%J | 1.48% | .89% | .68% | .73% | - %B |
| Supplemental Data | ||||||
| Net assets, end of period (in millions) | $201 | $203 | $215 | $233 | $243 | $203 |
| Portfolio turnover rateK | 40%J | 121% | 9% | 6% | 22% | 23% |
A Calculated based on average shares outstanding during the period.
B Net Investment income per share reflects a large, non-recurring dividend which amounted to $.07 per share. Excluding this non-recurring dividend, the ratio of net investment income (loss) to average net assets would have been (.28) %.
C The amounts shown reflect certain reclassifications related to book to tax differences that were made in the year shown.
D Total distributions of $8.07 per share is comprised of distributions from net investment income of $.555 and distributions from net realized gain of $7.517 per share.
E Total returns for periods of less than one year are not annualized.
F Total returns would have been lower if certain expenses had not been reduced during the applicable periods shown.
G Total returns do not include the effect of the sales charges.
H Fees and expenses of any underlying Fidelity Central Funds are not included in the Fund's expense ratio. The Fund indirectly bears its proportionate share of the expenses of any underlying Fidelity Central Funds.
I Expense ratios reflect operating expenses of the class. Expenses before reductions do not reflect amounts reimbursed by the investment adviser or reductions from brokerage service arrangements or reductions from other expense offset arrangements and do not represent the amount paid by the class during periods when reimbursements or reductions occur. Expenses net of fee waivers reflect expenses after reimbursement by the investment adviser but prior to reductions from brokerage service arrangements or other expense offset arrangements. Expenses net of all reductions represent the net expenses paid by the class.
J Annualized
K Amount does not include the portfolio activity of any underlying Fidelity Central Funds.
See accompanying notes which are an integral part of the financial statements.
Financial Highlights — Fidelity Advisor Value Strategies Fund Class M
| Six months ended (Unaudited) May 31, | Years ended November 30, | |||||
| 2017 | 2016 | 2015 | 2014 | 2013 | 2012 | |
| Selected Per–Share Data | ||||||
| Net asset value, beginning of period | $41.72 | $40.40 | $40.28 | $37.28 | $28.58 | $23.48 |
| Income from Investment Operations | ||||||
| Net investment income (loss)A | .23 | .49 | .28 | .18 | .18 | (.05)B |
| Net realized and unrealized gain (loss) | 3.09 | 1.14 | .06 | 2.98 | 8.54 | 5.22 |
| Total from investment operations | 3.32 | 1.63 | .34 | 3.16 | 8.72 | 5.17 |
| Distributions from net investment income | (.46) | (.30) | (.19)C | (.16) | (.02) | (.07) |
| Distributions from net realized gain | (7.52) | (.01) | (.03)C | – | – | – |
| Total distributions | (7.97)D | (.31) | (.22) | (.16) | (.02) | (.07) |
| Net asset value, end of period | $37.07 | $41.72 | $40.40 | $40.28 | $37.28 | $28.58 |
| Total ReturnE,F,G | 8.93% | 4.11% | .86% | 8.51% | 30.52% | 22.08% |
| Ratios to Average Net AssetsH,I | ||||||
| Expenses before reductions | 1.08%J | 1.08% | 1.15% | 1.17% | 1.23% | 1.38% |
| Expenses net of fee waivers, if any | 1.08%J | 1.08% | 1.14% | 1.17% | 1.23% | 1.38% |
| Expenses net of all reductions | 1.07%J | 1.07% | 1.14% | 1.17% | 1.22% | 1.38% |
| Net investment income (loss) | 1.24%J | 1.27% | .68% | .47% | .54% | (.17)%B |
| Supplemental Data | ||||||
| Net assets, end of period (in millions) | $260 | $263 | $294 | $324 | $335 | $283 |
| Portfolio turnover rateK | 40%J | 121% | 9% | 6% | 22% | 23% |
A Calculated based on average shares outstanding during the period.
B Net Investment income per share reflects a large, non-recurring dividend which amounted to $.07 per share. Excluding this non-recurring dividend, the ratio of net investment income (loss) to average net assets would have been (.45) %.
C The amounts shown reflect certain reclassifications related to book to tax differences that were made in the year shown.
D Total distributions of $7.97 per share is comprised of distributions from net investment income of $.456 and distributions from net realized gain of $7.517 per share.
E Total returns for periods of less than one year are not annualized.
F Total returns would have been lower if certain expenses had not been reduced during the applicable periods shown.
G Total returns do not include the effect of the sales charges.
H Fees and expenses of any underlying Fidelity Central Funds are not included in the Fund's expense ratio. The Fund indirectly bears its proportionate share of the expenses of any underlying Fidelity Central Funds.
I Expense ratios reflect operating expenses of the class. Expenses before reductions do not reflect amounts reimbursed by the investment adviser or reductions from brokerage service arrangements or reductions from other expense offset arrangements and do not represent the amount paid by the class during periods when reimbursements or reductions occur. Expenses net of fee waivers reflect expenses after reimbursement by the investment adviser but prior to reductions from brokerage service arrangements or other expense offset arrangements. Expenses net of all reductions represent the net expenses paid by the class.
J Annualized
K Amount does not include the portfolio activity of any underlying Fidelity Central Funds.
See accompanying notes which are an integral part of the financial statements.
Financial Highlights — Fidelity Advisor Value Strategies Fund Class C
| Six months ended (Unaudited) May 31, | Years ended November 30, | |||||
| 2017 | 2016 | 2015 | 2014 | 2013 | 2012 | |
| Selected Per–Share Data | ||||||
| Net asset value, beginning of period | $36.19 | $35.12 | $35.07 | $32.52 | $25.06 | $20.64 |
| Income from Investment Operations | ||||||
| Net investment income (loss)A | .11 | .24 | .05 | (.03) | (.01) | (.17)B |
| Net realized and unrealized gain (loss) | 2.65 | .97 | .07 | 2.60 | 7.47 | 4.59 |
| Total from investment operations | 2.76 | 1.21 | .12 | 2.57 | 7.46 | 4.42 |
| Distributions from net investment income | (.30) | (.13) | (.04)C | (.02) | – | – |
| Distributions from net realized gain | (7.52) | (.01) | (.03)C | – | – | – |
| Total distributions | (7.81)D | (.14) | (.07) | (.02) | – | – |
| Net asset value, end of period | $31.14 | $36.19 | $35.12 | $35.07 | $32.52 | $25.06 |
| Total ReturnE,F,G | 8.67% | 3.49% | .33% | 7.91% | 29.77% | 21.41% |
| Ratios to Average Net AssetsH,I | ||||||
| Expenses before reductions | 1.63%J | 1.63% | 1.70% | 1.72% | 1.78% | 1.95% |
| Expenses net of fee waivers, if any | 1.63%J | 1.63% | 1.69% | 1.72% | 1.78% | 1.95% |
| Expenses net of all reductions | 1.62%J | 1.63% | 1.69% | 1.72% | 1.77% | 1.95% |
| Net investment income (loss) | .69%J | .72% | .13% | (.08)% | (.02)% | (.75)%B |
| Supplemental Data | ||||||
| Net assets, end of period (in millions) | $45 | $44 | $49 | $53 | $54 | $43 |
| Portfolio turnover rateK | 40%J | 121% | 9% | 6% | 22% | 23% |
A Calculated based on average shares outstanding during the period.
B Net Investment income per share reflects a large, non-recurring dividend which amounted to $.06 per share. Excluding this non-recurring dividend, the ratio of net investment income (loss) to average net assets would have been (1.02) %.
C The amounts shown reflect certain reclassifications related to book to tax differences that were made in the year shown.
D Total distributions of $7.81 per share is comprised of distributions from net investment income of $.295 and distributions from net realized gain of $7.517 per share.
E Total returns for periods of less than one year are not annualized.
F Total returns would have been lower if certain expenses had not been reduced during the applicable periods shown.
G Total returns do not include the effect of the contingent deferred sales charge.
H Fees and expenses of any underlying Fidelity Central Funds are not included in the Fund's expense ratio. The Fund indirectly bears its proportionate share of the expenses of any underlying Fidelity Central Funds.
I Expense ratios reflect operating expenses of the class. Expenses before reductions do not reflect amounts reimbursed by the investment adviser or reductions from brokerage service arrangements or reductions from other expense offset arrangements and do not represent the amount paid by the class during periods when reimbursements or reductions occur. Expenses net of fee waivers reflect expenses after reimbursement by the investment adviser but prior to reductions from brokerage service arrangements or other expense offset arrangements. Expenses net of all reductions represent the net expenses paid by the class.
J Annualized
K Amount does not include the portfolio activity of any underlying Fidelity Central Funds.
See accompanying notes which are an integral part of the financial statements.
Financial Highlights — Fidelity Value Strategies Fund
| Six months ended (Unaudited) May 31, | Years ended November 30, | |||||
| 2017 | 2016 | 2015 | 2014 | 2013 | 2012 | |
| Selected Per–Share Data | ||||||
| Net asset value, beginning of period | $45.17 | $43.72 | $43.56 | $40.28 | $30.89 | $25.37 |
| Income from Investment Operations | ||||||
| Net investment income (loss)A | .36 | .76 | .51 | .40 | .37 | .09B |
| Net realized and unrealized gain (loss) | 3.37 | 1.21 | .07 | 3.21 | 9.20 | 5.62 |
| Total from investment operations | 3.73 | 1.97 | .58 | 3.61 | 9.57 | 5.71 |
| Distributions from net investment income | (.66) | (.51) | (.39)C | (.33) | (.18) | (.19) |
| Distributions from net realized gain | (7.52) | (.01) | (.03)C | – | – | – |
| Total distributions | (8.18) | (.52) | (.42) | (.33) | (.18) | (.19) |
| Net asset value, end of period | $40.72 | $45.17 | $43.72 | $43.56 | $40.28 | $30.89 |
| Total ReturnD,E | 9.21% | 4.64% | 1.35% | 9.05% | 31.14% | 22.69% |
| Ratios to Average Net AssetsF,G | ||||||
| Expenses before reductions | .57%H | .56% | .67% | .69% | .73% | .89% |
| Expenses net of fee waivers, if any | .56%H | .56% | .67% | .69% | .73% | .89% |
| Expenses net of all reductions | .56%H | .55% | .66% | .69% | .72% | .89% |
| Net investment income (loss) | 1.75%H | 1.79% | 1.16% | .95% | 1.03% | .31%B |
| Supplemental Data | ||||||
| Net assets, end of period (in millions) | $438 | $713 | $716 | $786 | $681 | $396 |
| Portfolio turnover rateI | 40%H | 121% | 9% | 6% | 22% | 23% |
A Calculated based on average shares outstanding during the period.
B Net Investment income per share reflects a large, non-recurring dividend which amounted to $.08 per share. Excluding this non-recurring dividend, the ratio of net investment income (loss) to average net assets would have been .04%.
C The amounts shown reflect certain reclassifications related to book to tax differences that were made in the year shown.
D Total returns for periods of less than one year are not annualized.
E Total returns would have been lower if certain expenses had not been reduced during the applicable periods shown.
F Fees and expenses of any underlying Fidelity Central Funds are not included in the Fund's expense ratio. The Fund indirectly bears its proportionate share of the expenses of any underlying Fidelity Central Funds.
G Expense ratios reflect operating expenses of the class. Expenses before reductions do not reflect amounts reimbursed by the investment adviser or reductions from brokerage service arrangements or reductions from other expense offset arrangements and do not represent the amount paid by the class during periods when reimbursements or reductions occur. Expenses net of fee waivers reflect expenses after reimbursement by the investment adviser but prior to reductions from brokerage service arrangements or other expense offset arrangements. Expenses net of all reductions represent the net expenses paid by the class.
H Annualized
I Amount does not include the portfolio activity of any underlying Fidelity Central Funds.
See accompanying notes which are an integral part of the financial statements.
Financial Highlights — Fidelity Advisor Value Strategies Fund Class K
| Six months ended (Unaudited) May 31, | Years ended November 30, | |||||
| 2017 | 2016 | 2015 | 2014 | 2013 | 2012 | |
| Selected Per–Share Data | ||||||
| Net asset value, beginning of period | $45.18 | $43.74 | $43.57 | $40.28 | $30.89 | $25.38 |
| Income from Investment Operations | ||||||
| Net investment income (loss)A | .38 | .80 | .58 | .47 | .43 | .14B |
| Net realized and unrealized gain (loss) | 3.38 | 1.22 | .07 | 3.20 | 9.18 | 5.61 |
| Total from investment operations | 3.76 | 2.02 | .65 | 3.67 | 9.61 | 5.75 |
| Distributions from net investment income | (.72) | (.57) | (.45)C | (.38) | (.22) | (.24) |
| Distributions from net realized gain | (7.52) | (.01) | (.03)C | – | – | – |
| Total distributions | (8.24) | (.58) | (.48) | (.38) | (.22) | (.24) |
| Net asset value, end of period | $40.70 | $45.18 | $43.74 | $43.57 | $40.28 | $30.89 |
| Total ReturnD,E | 9.29% | 4.76% | 1.51% | 9.21% | 31.34% | 22.93% |
| Ratios to Average Net AssetsF,G | ||||||
| Expenses before reductions | .44%H | .44% | .51% | .53% | .58% | .71% |
| Expenses net of fee waivers, if any | .44%H | .44% | .51% | .53% | .58% | .71% |
| Expenses net of all reductions | .43%H | .43% | .51% | .53% | .57% | .71% |
| Net investment income (loss) | 1.88%H | 1.91% | 1.31% | 1.11% | 1.18% | .50%B |
| Supplemental Data | ||||||
| Net assets, end of period (in millions) | $63 | $68 | $72 | $97 | $119 | $70 |
| Portfolio turnover rateI | 40%H | 121% | 9% | 6% | 22% | 23% |
A Calculated based on average shares outstanding during the period.
B Net Investment income per share reflects a large, non-recurring dividend which amounted to $.08 per share. Excluding this non-recurring dividend, the ratio of net investment income (loss) to average net assets would have been .22%.
C The amounts shown reflect certain reclassifications related to book to tax differences that were made in the year shown.
D Total returns for periods of less than one year are not annualized.
E Total returns would have been lower if certain expenses had not been reduced during the applicable periods shown.
F Fees and expenses of any underlying Fidelity Central Funds are not included in the Fund's expense ratio. The Fund indirectly bears its proportionate share of the expenses of any underlying Fidelity Central Funds.
G Expense ratios reflect operating expenses of the class. Expenses before reductions do not reflect amounts reimbursed by the investment adviser or reductions from brokerage service arrangements or reductions from other expense offset arrangements and do not represent the amount paid by the class during periods when reimbursements or reductions occur. Expenses net of fee waivers reflect expenses after reimbursement by the investment adviser but prior to reductions from brokerage service arrangements or other expense offset arrangements. Expenses net of all reductions represent the net expenses paid by the class.
H Annualized
I Amount does not include the portfolio activity of any underlying Fidelity Central Funds.
See accompanying notes which are an integral part of the financial statements.
Financial Highlights — Fidelity Advisor Value Strategies Fund Class I
| Six months ended (Unaudited) May 31, | Years ended November 30, | |||||
| 2017 | 2016 | 2015 | 2014 | 2013 | 2012 | |
| Selected Per–Share Data | ||||||
| Net asset value, beginning of period | $43.07 | $41.71 | $41.57 | $38.46 | $29.51 | $24.26 |
| Income from Investment Operations | ||||||
| Net investment income (loss)A | .33 | .70 | .48 | .37 | .34 | .08B |
| Net realized and unrealized gain (loss) | 3.20 | 1.15 | .08 | 3.06 | 8.79 | 5.37 |
| Total from investment operations | 3.53 | 1.85 | .56 | 3.43 | 9.13 | 5.45 |
| Distributions from net investment income | (.66) | (.48) | (.39)C | (.32) | (.18) | (.20) |
| Distributions from net realized gain | (7.52) | (.01) | (.03)C | – | – | – |
| Total distributions | (8.18) | (.49) | (.42) | (.32) | (.18) | (.20) |
| Net asset value, end of period | $38.42 | $43.07 | $41.71 | $41.57 | $38.46 | $29.51 |
| Total ReturnD,E | 9.19% | 4.57% | 1.36% | 9.01% | 31.11% | 22.67% |
| Ratios to Average Net AssetsF,G | ||||||
| Expenses before reductions | .62%H | .61% | .68% | .71% | .76% | .90% |
| Expenses net of fee waivers, if any | .62%H | .61% | .68% | .71% | .76% | .90% |
| Expenses net of all reductions | .61%H | .61% | .68% | .71% | .75% | .90% |
| Net investment income (loss) | 1.70%H | 1.74% | 1.14% | .93% | 1.00% | .31%B |
| Supplemental Data | ||||||
| Net assets, end of period (in millions) | $71 | $73 | $65 | $86 | $74 | $66 |
| Portfolio turnover rateI | 40%H | 121% | 9% | 6% | 22% | 23% |
A Calculated based on average shares outstanding during the period.
B Net Investment income per share reflects a large, non-recurring dividend which amounted to $.08 per share. Excluding this non-recurring dividend, the ratio of net investment income (loss) to average net assets would have been .03%.
C The amounts shown reflect certain reclassifications related to book to tax differences that were made in the year shown.
D Total returns for periods of less than one year are not annualized.
E Total returns would have been lower if certain expenses had not been reduced during the applicable periods shown.
F Fees and expenses of any underlying Fidelity Central Funds are not included in the Fund's expense ratio. The Fund indirectly bears its proportionate share of the expenses of any underlying Fidelity Central Funds.
G Expense ratios reflect operating expenses of the class. Expenses before reductions do not reflect amounts reimbursed by the investment adviser or reductions from brokerage service arrangements or reductions from other expense offset arrangements and do not represent the amount paid by the class during periods when reimbursements or reductions occur. Expenses net of fee waivers reflect expenses after reimbursement by the investment adviser but prior to reductions from brokerage service arrangements or other expense offset arrangements. Expenses net of all reductions represent the net expenses paid by the class.
H Annualized
I Amount does not include the portfolio activity of any underlying Fidelity Central Funds.
See accompanying notes which are an integral part of the financial statements.
Notes to Financial Statements (Unaudited)
For the period ended May 31, 2017
(Amounts in thousands except percentages)
1. Organization.
Fidelity Advisor Value Strategies Fund (the Fund) is a fund of Fidelity Advisor Series I (the Trust) and is authorized to issue an unlimited number of shares. The Trust is registered under the Investment Company Act of 1940, as amended (the 1940 Act), as an open-end management investment company organized as a Massachusetts business trust. The Fund offers Class A, Class M (formerly Class T), Class C, Fidelity Value Strategies Fund, Class K and Class I shares, each of which has equal rights as to assets and voting privileges. Each class has exclusive voting rights with respect to matters that affect that class.
After the close of business on June 24, 2016, all outstanding Class B shares were converted to Class A shares. All prior fiscal period dollar and share amounts for Class B presented in the Notes to Financial Statements are for the period December 1, 2015 through June 24, 2016.
2. Investments in Fidelity Central Funds.
The Fund invests in Fidelity Central Funds, which are open-end investment companies generally available only to other investment companies and accounts managed by the investment adviser and its affiliates. The Fund's Schedule of Investments lists each of the Fidelity Central Funds held as of period end, if any, as an investment of the Fund, but does not include the underlying holdings of each Fidelity Central Fund. As an Investing Fund, the Fund indirectly bears its proportionate share of the expenses of the underlying Fidelity Central Funds.
The Money Market Central Funds seek preservation of capital and current income and are managed by Fidelity Investments Money Management, Inc. (FIMM), an affiliate of the investment adviser. Annualized expenses of the Money Market Central Funds as of their most recent shareholder report date are less than .005%.
A complete unaudited list of holdings for each Fidelity Central Fund is available upon request or at the Securities and Exchange Commission (the SEC) website at www.sec.gov. In addition, the financial statements of the Fidelity Central Funds are available on the SEC website or upon request.
3. Significant Accounting Policies.
The Fund is an investment company and applies the accounting and reporting guidance of the Financial Accounting Standards Board (FASB) Accounting Standards Codification Topic 946 Financial Services – Investments Companies. The financial statements have been prepared in conformity with accounting principles generally accepted in the United States of America (GAAP), which require management to make certain estimates and assumptions at the date of the financial statements. Actual results could differ from those estimates. Subsequent events, if any, through the date that the financial statements were issued have been evaluated in the preparation of the financial statements. The following summarizes the significant accounting policies of the Fund:
Investment Valuation. Investments are valued as of 4:00 p.m. Eastern time on the last calendar day of the period. The Board of Trustees (the Board) has delegated the day to day responsibility for the valuation of the Fund's investments to the Fair Value Committee (the Committee) established by the Fund's investment adviser. In accordance with valuation policies and procedures approved by the Board, the Fund attempts to obtain prices from one or more third party pricing vendors or brokers to value its investments. When current market prices, quotations or currency exchange rates are not readily available or reliable, investments will be fair valued in good faith by the Committee, in accordance with procedures adopted by the Board. Factors used in determining fair value vary by investment type and may include market or investment specific events, changes in interest rates and credit quality. The frequency with which these procedures are used cannot be predicted and they may be utilized to a significant extent. The Committee oversees the Fund's valuation policies and procedures and reports to the Board on the Committee's activities and fair value determinations. The Board monitors the appropriateness of the procedures used in valuing the Fund's investments and ratifies the fair value determinations of the Committee.
The Fund categorizes the inputs to valuation techniques used to value its investments into a disclosure hierarchy consisting of three levels as shown below:
- Level 1 – quoted prices in active markets for identical investments
- Level 2 – other significant observable inputs (including quoted prices for similar investments, interest rates, prepayment speeds, etc.)
- Level 3 – unobservable inputs (including the Fund's own assumptions based on the best information available)
Valuation techniques used to value the Fund's investments by major category are as follows:
Equity securities, including restricted securities, for which market quotations are readily available, are valued at the last reported sale price or official closing price as reported by a third party pricing vendor on the primary market or exchange on which they are traded and are categorized as Level 1 in the hierarchy. In the event there were no sales during the day or closing prices are not available, securities are valued at the last quoted bid price or may be valued using the last available price and are generally categorized as Level 2 in the hierarchy. For foreign equity securities, when market or security specific events arise, comparisons to the valuation of American Depositary Receipts (ADRs), futures contracts, Exchange-Traded Funds (ETFs) and certain indexes as well as quoted prices for similar securities may be used and would be categorized as Level 2 in the hierarchy. Utilizing these techniques may result in transfers between Level 1 and Level 2. For equity securities, including restricted securities, where observable inputs are limited, assumptions about market activity and risk are used and these securities may be categorized as Level 3 in the hierarchy.
Debt securities, including restricted securities, are valued based on evaluated prices received from third party pricing vendors or from brokers who make markets in such securities. Corporate bonds are valued by pricing vendors who utilize matrix pricing which considers yield or price of bonds of comparable quality, coupon, maturity and type or by broker-supplied prices. When independent prices are unavailable or unreliable, debt securities may be valued utilizing pricing methodologies which consider similar factors that would be used by third party pricing vendors. Debt securities are generally categorized as Level 2 in the hierarchy but may be Level 3 depending on the circumstances.
Investments in open-end mutual funds, including the Fidelity Central Funds, are valued at their closing net asset value (NAV) each business day and are categorized as Level 1 in the hierarchy.
Changes in valuation techniques may result in transfers in or out of an assigned level within the disclosure hierarchy. The aggregate value of investments by input level as of May 31, 2017 is included at the end of the Fund's Schedule of Investments.
Foreign Currency. The Fund may use foreign currency contracts to facilitate transactions in foreign-denominated securities. Gains and losses from these transactions may arise from changes in the value of the foreign currency or if the counterparties do not perform under the contracts' terms.
Foreign-denominated assets, including investment securities, and liabilities are translated into U.S. dollars at the exchange rates at period end. Purchases and sales of investment securities, income and dividends received and expenses denominated in foreign currencies are translated into U.S. dollars at the exchange rate in effect on the transaction date.
The effects of exchange rate fluctuations on investments are included with the net realized and unrealized gain (loss) on investment securities. Other foreign currency transactions resulting in realized and unrealized gain (loss) are disclosed separately.
Investment Transactions and Income. For financial reporting purposes, the Fund's investment holdings and NAV include trades executed through the end of the last business day of the period. The NAV per share for processing shareholder transactions is calculated as of the close of business of the New York Stock Exchange (NYSE), normally 4:00 p.m. Eastern time and includes trades executed through the end of the prior business day. Gains and losses on securities sold are determined on the basis of identified cost and may include proceeds received from litigation. Dividend income is recorded on the ex-dividend date, except for certain dividends from foreign securities where the ex-dividend date may have passed, which are recorded as soon as the Fund is informed of the ex-dividend date. Non-cash dividends included in dividend income, if any, are recorded at the fair market value of the securities received. Income and capital gain distributions from Fidelity Central Funds, if any, are recorded on the ex-dividend date. Certain distributions received by the Fund represent a return of capital or capital gain. The Fund determines the components of these distributions subsequent to the ex-dividend date, based upon receipt of tax filings or other correspondence relating to the underlying investment. These distributions are recorded as a reduction of cost of investments and/or as a realized gain. Interest income is accrued as earned and includes coupon interest and amortization of premium and accretion of discount on debt securities as applicable. Investment income is recorded net of foreign taxes withheld where recovery of such taxes is uncertain.
Class Allocations and Expenses. Investment income, realized and unrealized capital gains and losses, common expenses of the Fund, and certain fund-level expense reductions, if any, are allocated daily on a pro-rata basis to each class based on the relative net assets of each class to the total net assets of the Fund. Each class differs with respect to transfer agent and distribution and service plan fees incurred. Certain expense reductions may also differ by class. For the reporting period, the allocated portion of income and expenses to each class as a percent of its average net assets may vary due to the timing of recording these transactions in relation to fluctuating net assets of the classes. Expenses directly attributable to a fund are charged to that fund. Expenses attributable to more than one fund are allocated among the respective funds on the basis of relative net assets or other appropriate methods. Expense estimates are accrued in the period to which they relate and adjustments are made when actual amounts are known.
Income Tax Information and Distributions to Shareholders. Each year, the Fund intends to qualify as a regulated investment company under Subchapter M of the Internal Revenue Code, including distributing substantially all of its taxable income and realized gains. As a result, no provision for U.S. Federal income taxes is required. The Fund files a U.S. federal tax return, in addition to state and local tax returns as required. The Fund's federal income tax returns are subject to examination by the Internal Revenue Service (IRS) for a period of three fiscal years after they are filed. State and local tax returns may be subject to examination for an additional fiscal year depending on the jurisdiction. Foreign taxes are provided for based on the Fund's understanding of the tax rules and rates that exist in the foreign markets in which it invests.
Distributions are declared and recorded on the ex-dividend date. Income dividends and capital gain distributions are declared separately for each class. Income and capital gain distributions are determined in accordance with income tax regulations, which may differ from GAAP.
Capital accounts within the financial statements are adjusted for permanent book-tax differences. These adjustments have no impact on net assets or the results of operations. Capital accounts are not adjusted for temporary book-tax differences which will reverse in a subsequent period.
Book-tax differences are primarily due to foreign currency transactions, futures contracts, passive foreign investment companies (PFIC), partnerships, market discount, deferred trustees compensation and losses deferred due to wash sales.
The federal tax cost of investment securities and unrealized appreciation (depreciation) as of period end were as follows:
| Gross unrealized appreciation | $165,568 |
| Gross unrealized depreciation | (35,361) |
| Net unrealized appreciation (depreciation) on securities | $130,207 |
| Tax cost | $971,677 |
4. Purchases and Sales of Investments.
Purchases and sales of securities, other than short-term securities, aggregated $232,802 and $613,222, respectively.
5. Fees and Other Transactions with Affiliates.
Management Fee. Fidelity Management & Research Company (the investment adviser) and its affiliates provide the Fund with investment management related services for which the Fund pays a monthly management fee. The management fee is the sum of an individual fund fee rate that is based on an annual rate of .30% of the Fund's average net assets and an annualized group fee rate that averaged .25% during the period. The group fee rate is based upon the average net assets of all the mutual funds advised by the investment adviser, including any mutual funds previously advised by the investment adviser that are currently advised by Fidelity SelectCo, LLC, an affiliate of the investment adviser. The group fee rate decreases as assets under management increase and increases as assets under management decrease. In addition, the management fee is subject to a performance adjustment (up to a maximum of +/- .20% of the Fund's average net assets over a 36 month performance period). The upward or downward adjustment to the management fee is based on the relative investment performance of Fidelity Value Strategies Fund as compared to its benchmark index, the Russell Midcap Value Index, over the same 36 month performance period. For the reporting period, the total annualized management fee rate, including the performance adjustment, was .34% of the Fund's average net assets. The performance adjustment included in the management fee rate may be higher or lower than the maximum performance adjustment rate due to the difference between the average net assets for the reporting and performance periods.
Distribution and Service Plan Fees. In accordance with Rule 12b-1 of the 1940 Act, the Fund has adopted separate Distribution and Service Plans for each class of shares. Certain classes pay Fidelity Distributors Corporation (FDC), an affiliate of the investment adviser, separate Distribution and Service Fees, each of which is based on an annual percentage of each class' average net assets. In addition, FDC may pay financial intermediaries for selling shares of the Fund and providing shareholder support services. For the period, the Distribution and Service Fee rates, total fees and amounts retained by FDC were as follows:
| Distribution Fee | Service Fee | Total Fees | Retained by FDC | |
| Class A | -% | .25% | $255 | $1 |
| Class M | .25% | .25% | 663 | 3 |
| Class C | .75% | .25% | 225 | 8 |
| $1,143 | $12 |
Sales Load. FDC may receive a front-end sales charge of up to 5.75% for selling Class A shares and 3.50% for selling Class M shares, some of which is paid to financial intermediaries for selling shares of the Fund. Depending on the holding period, FDC may receive contingent deferred sales charges levied on Class A, Class M and Class C redemptions. The deferred sales charges are 1.00% for Class C shares, 1.00% for certain purchases of Class A shares and .25% for certain purchases of Class M shares.
For the period, sales charge amounts retained by FDC were as follows:
| Retained by FDC | |
| Class A | $9 |
| Class M | 3 |
| Class C(a) | 1 |
| $13 |
(a) When Class C shares are initially sold, FDC pays commissions from its own resources to financial intermediaries through which the sales are made.
Transfer Agent Fees. Fidelity Investments Institutional Operations Company, Inc., (FIIOC), an affiliate of the investment adviser, is the transfer, dividend disbursing and shareholder servicing agent for each class of the Fund. FIIOC receives account fees and asset-based fees that vary according to the account size and type of account of the shareholders of the respective classes of the Fund, except for Class K. FIIOC receives an asset-based fee of Class K's average net assets. FIIOC pays for typesetting, printing and mailing of shareholder reports, except proxy statements.
For the period, transfer agent fees for each class were as follows:
| Amount | % of Class-Level Average Net Assets(a) | |
| Class A | $215 | .21 |
| Class M | 244 | .18 |
| Class C | 52 | .23 |
| Fidelity Value Strategies Fund | 428 | .17 |
| Class K | 16 | .05 |
| Class I | 84 | .22 |
| $1,039 |
(a) Annualized
Accounting and Security Lending Fees. Fidelity Service Company, Inc. (FSC), an affiliate of the investment adviser, maintains the Fund's accounting records. The accounting fee is based on the level of average net assets for each month. Under a separate contract, FSC administers the security lending program. The security lending fee is based on the number and duration of lending transactions.
Brokerage Commissions. The Fund placed a portion of its portfolio transactions with brokerage firms which are affiliates of the investment adviser. Brokerage commissions are included in net realized gain (loss) and change in net unrealized appreciation (depreciation) in the Statement of Operations. The commissions paid to these affiliated firms were $12 for the period.
Interfund Lending Program. Pursuant to an Exemptive Order issued by the SEC, the Fund, along with other registered investment companies having management contracts with FMR or other affiliated entities of FMR, may participate in an interfund lending program. This program provides an alternative credit facility allowing the funds to borrow from, or lend money to, other participating affiliated funds. At period end, there were no interfund loans outstanding. The Fund's activity in this program during the period for which loans were outstanding was as follows:
| Borrower or Lender | Average Loan Balance | Weighted Average Interest Rate | Interest Expense |
| Borrower | $13,420 | .84% | $3 |
Interfund Trades. The Fund may purchase from or sell securities to other Fidelity Funds under procedures adopted by the Board. The procedures have been designed to ensure these interfund trades are executed in accordance with Rule 17a-7 of the 1940 Act. Interfund trades are included within the respective purchases and sales amounts shown in the Purchases and Sales of Investments note.
6. Committed Line of Credit.
The Fund participates with other funds managed by the investment adviser or an affiliate in a $4.25 billion credit facility (the "line of credit") to be utilized for temporary or emergency purposes to fund shareholder redemptions or for other short-term liquidity purposes. The Fund has agreed to pay commitment fees on its pro-rata portion of the line of credit, which amounted to $2 and is reflected in Miscellaneous expenses on the Statement of Operations. During the period, the Fund did not borrow on this line of credit.
7. Security Lending.
The Fund lends portfolio securities through a lending agent from time to time in order to earn additional income. For equity securities, a lending agent is used and may loan securities to certain qualified borrowers, including Fidelity Capital Markets (FCM), a broker-dealer affiliated with the Fund. On the settlement date of the loan, the Fund receives collateral (in the form of U.S. Treasury obligations, letters of credit and/or cash) against the loaned securities and maintains collateral in an amount not less than 100% of the market value of the loaned securities during the period of the loan. The market value of the loaned securities is determined at the close of business of the Fund and any additional required collateral is delivered to the Fund on the next business day. The Fund or borrower may terminate the loan at any time, and if the borrower defaults on its obligation to return the securities loaned because of insolvency or other reasons, the Fund may apply collateral received from the borrower against the obligation. The Fund may experience delays and costs in recovering the securities loaned. Any cash collateral received is invested in the Fidelity Securities Lending Cash Central Fund. The value of loaned securities and cash collateral at period end are disclosed on the Fund's Statement of Assets and Liabilities. At period end, there were no security loans outstanding with FCM. Security lending income represents the income earned on investing cash collateral, less rebates paid to borrowers and any lending agent fees associated with the loan, plus any premium payments received for lending certain types of securities. Security lending income is presented in the Statement of Operations as a component of income from Fidelity Central Funds. Total security lending income during the period amounted to $27, including an amount of less than five hundred dollars from securities loaned to FCM.
8. Bank Borrowings.
The Fund is permitted to have bank borrowings for temporary or emergency purposes to fund shareholder redemptions or for other short-term liquidity requirements. The Fund has established borrowing arrangements with certain banks. The interest rate on the borrowings is the bank's base rate, as revised from time to time. The average loan balance during the period for which loans were outstanding amounted to $5,859. The weighted average interest rate was 1.16%. The interest expense amounted to $1 under the bank borrowing program. At period end, there were no bank borrowings outstanding.
9. Expense Reductions.
Commissions paid to certain brokers with whom the investment adviser, or its affiliates, places trades on behalf of the Fund include an amount in addition to trade execution, which may be rebated back to the Fund to offset certain expenses. This amount totaled $47 for the period.
In addition, during the period the investment adviser reimbursed and/or waived a portion of fund-level operating expenses in the amount of $6.
10. Distributions to Shareholders.
Distributions to shareholders of each class were as follows:
| Six months ended May 31, 2017 | Year ended November 30, 2016 | |
| From net investment income | ||
| Class A | $2,766 | $2,186 |
| Class M | 2,831 | 2,155 |
| Class C | 357 | 187 |
| Fidelity Value Strategies Fund | 9,926 | 9,139 |
| Class K | 1,087 | 955 |
| Class I | 1,123 | 746 |
| Total | $18,090 | $15,368 |
| From net realized gain | ||
| Class A | $37,462 | $49 |
| Class M | 46,673 | 65 |
| Class C | 9,088 | 13 |
| Fidelity Value Strategies Fund | 112,547 | 160 |
| Class K | 11,298 | 15 |
| Class I | 12,750 | 14 |
| Total | $229,818 | $316 |
11. Share Transactions.
Share transactions for each class were as follows and may contain automatic conversions between classes or exchanges between affiliated funds:
| Shares | Shares | Dollars | Dollars | |
| Six months ended May 31, 2017 | Year ended November 30, 2016 | Six months ended May 31, 2017 | Year ended November 30, 2016 | |
| Class A | ||||
| Shares sold | 192 | 471 | $6,787 | $17,474 |
| Reinvestment of distributions | 1,127 | 58 | 37,943 | 2,110 |
| Shares redeemed | (683) | (998) | (24,175) | (37,279) |
| Net increase (decrease) | 636 | (469) | $20,555 | $(17,695) |
| Class M | ||||
| Shares sold | 232 | 349 | $8,465 | $13,447 |
| Reinvestment of distributions | 1,294 | 54 | 45,666 | 2,045 |
| Shares redeemed | (821) | (1,385) | (30,524) | (53,890) |
| Net increase (decrease) | 705 | (982) | $23,607 | $(38,398) |
| Class B | ||||
| Shares sold | – | – | $– | $9 |
| Shares redeemed | – | (110) | – | (3,723) |
| Net increase (decrease) | – | (110) | $– | $(3,714) |
| Class C | ||||
| Shares sold | 53 | 78 | $1,654 | $2,605 |
| Reinvestment of distributions | 307 | 6 | 9,116 | 191 |
| Shares redeemed | (150) | (263) | (4,672) | (8,759) |
| Net increase (decrease) | 210 | (179) | $6,098 | $(5,963) |
| Fidelity Value Strategies Fund | ||||
| Shares sold | 772 | 9,301 | $33,461 | $395,357 |
| Reinvestment of distributions | 2,966 | 182 | 114,742 | 7,409 |
| Shares redeemed | (8,769) | (10,077) | (349,323) | (417,147) |
| Net increase (decrease) | (5,031) | (594) | $(201,120) | $(14,381) |
| Class K | ||||
| Shares sold | 164 | 480 | $6,706 | $20,396 |
| Reinvestment of distributions | 321 | 24 | 12,385 | 970 |
| Shares redeemed | (426) | (644) | (17,009) | (27,300) |
| Net increase (decrease) | 59 | (140) | $2,082 | $(5,934) |
| Class I | ||||
| Shares sold | 334 | 445 | $12,821 | $18,090 |
| Reinvestment of distributions | 339 | 19 | 12,386 | 723 |
| Shares redeemed | (526) | (330) | (20,059) | (13,236) |
| Net increase (decrease) | 147 | 134 | $5,148 | $5,577 |
12. Other.
The Fund's organizational documents provide former and current trustees and officers with a limited indemnification against liabilities arising in connection with the performance of their duties to the Fund. In the normal course of business, the Fund may also enter into contracts that provide general indemnifications. The Fund's maximum exposure under these arrangements is unknown as this would be dependent on future claims that may be made against the Fund. The risk of material loss from such claims is considered remote.
Shareholder Expense Example
As a shareholder of the Fund, you incur two types of costs: (1) transaction costs, including sales charges (loads) on purchase payments or redemption proceeds, and (2) ongoing costs, including management fees, distribution and/or service (12b-1) fees and other Fund expenses. This Example is intended to help you understand your ongoing costs (in dollars) of investing in the Fund and to compare these costs with the ongoing costs of investing in other mutual funds.
The Example is based on an investment of $1,000 invested at the beginning of the period and held for the entire period (December 1, 2016 to May 31, 2017).
Actual Expenses
The first line of the accompanying table for each class of the Fund provides information about actual account values and actual expenses. You may use the information in this line, together with the amount you invested, to estimate the expenses that you paid over the period. Simply divide your account value by $1,000.00 (for example, an $8,600 account value divided by $1,000.00 = 8.6), then multiply the result by the number in the first line for a class of the Fund under the heading entitled "Expenses Paid During Period" to estimate the expenses you paid on your account during this period. A small balance maintenance fee of $12.00 that is charged once a year may apply for certain accounts with a value of less than $2,000. This fee is not included in the table below. If it was, the estimate of expenses you paid during the period would be higher, and your ending account value lower, by this amount. In addition, the Fund, as a shareholder in the underlying Fidelity Central Funds, will indirectly bear its pro-rata share of the fees and expenses incurred by the underlying Fidelity Central Funds. These fees and expenses are not included in the Fund's annualized expense ratio used to calculate the expense estimate in the table below.
Hypothetical Example for Comparison Purposes
The second line of the accompanying table for each class of the Fund provides information about hypothetical account values and hypothetical expenses based on a Class' actual expense ratio and an assumed rate of return of 5% per year before expenses, which is not the Class' actual return. The hypothetical account values and expenses may not be used to estimate the actual ending account balance or expenses you paid for the period. You may use this information to compare the ongoing costs of investing in the Fund and other funds. To do so, compare this 5% hypothetical example with the 5% hypothetical examples that appear in the shareholder reports of the other funds. A small balance maintenance fee of $12.00 that is charged once a year may apply for certain accounts with a value of less than $2,000. This fee is not included in the table below. If it was, the estimate of expenses you paid during the period would be higher, and your ending account value lower, by this amount. In addition, the Fund, as a shareholder in the underlying Fidelity Central Funds, will indirectly bear its pro-rata share of the fees and expenses incurred by the underlying Fidelity Central Funds. These fees and expenses are not included in the Fund's annualized expense ratio used to calculate the expense estimate in the table below.
Please note that the expenses shown in the table are meant to highlight your ongoing costs only and do not reflect any transaction costs. Therefore, the second line of the table is useful in comparing ongoing costs only, and will not help you determine the relative total costs of owning different funds. In addition, if these transactional costs were included, your costs would have been higher.
| Annualized Expense Ratio-A | Beginning Account Value December 1, 2016 | Ending Account Value May 31, 2017 | Expenses Paid During Period-B December 1, 2016 to May 31, 2017 | |
| Class A | .85% | |||
| Actual | $1,000.00 | $1,090.60 | $4.43 | |
| Hypothetical-C | $1,000.00 | $1,020.69 | $4.28 | |
| Class M | 1.08% | |||
| Actual | $1,000.00 | $1,089.30 | $5.63 | |
| Hypothetical-C | $1,000.00 | $1,019.55 | $5.44 | |
| Class C | 1.63% | |||
| Actual | $1,000.00 | $1,086.70 | $8.48 | |
| Hypothetical-C | $1,000.00 | $1,016.80 | $8.20 | |
| Fidelity Value Strategies Fund | .56% | |||
| Actual | $1,000.00 | $1,092.10 | $2.92 | |
| Hypothetical-C | $1,000.00 | $1,022.14 | $2.82 | |
| Class K | .44% | |||
| Actual | $1,000.00 | $1,092.90 | $2.30 | |
| Hypothetical-C | $1,000.00 | $1,022.74 | $2.22 | |
| Class I | .62% | |||
| Actual | $1,000.00 | $1,091.90 | $3.23 | |
| Hypothetical-C | $1,000.00 | $1,021.84 | $3.13 |
A Annualized expense ratio reflects expenses net of applicable fee waivers.
B Expenses are equal to each Class' annualized expense ratio, multiplied by the average account value over the period, multiplied by 182/365 (to reflect the one-half year period).
C 5% return per year before expenses
![]()
Corporate Headquarters
245 Summer St.
Boston, MA 02210
www.fidelity.com
SOI-SANN-0717
1.704746.119
Item 2.
Code of Ethics
Not applicable.
Item 3.
Audit Committee Financial Expert
Not applicable.
Item 4.
Principal Accountant Fees and Services
Not applicable.
Item 5.
Audit Committee of Listed Registrants
Not applicable.
Item 6.
Investments
(a)
Not applicable.
(b)
Not applicable
Item 7.
Disclosure of Proxy Voting Policies and Procedures for Closed-End Management Investment Companies
Not applicable.
Item 8.
Portfolio Managers of Closed-End Management Investment Companies
Not applicable.
Item 9.
Purchase of Equity Securities by Closed-End Management Investment Company and Affiliated Purchasers
Not applicable.
Item 10.
Submission of Matters to a Vote of Security Holders
There were no material changes to the procedures by which shareholders may recommend nominees to the Fidelity Advisor Series I’s Board of Trustees.
Item 11.
Controls and Procedures
(a)(i) The President and Treasurer and the Chief Financial Officer have concluded that the Fidelity Advisor Series I’s (the “Trust”) disclosure controls and procedures (as defined in Rule 30a-3(c) under the Investment Company Act) provide reasonable
assurances that material information relating to the Trust is made known to them by the appropriate persons, based on their evaluation of these controls and procedures as of a date within 90 days of the filing date of this report.
(a)(ii) There was no change in the Trust’s internal control over financial reporting (as defined in Rule 30a-3(d) under the Investment Company Act) that occurred during the second fiscal quarter of the period covered by this report that has materially affected, or is reasonably likely to materially affect, the Trust’s internal control over financial reporting.
Item 12.
Exhibits
(a) | (1) | Not applicable. |
(a) | (2) | Certification pursuant to Rule 30a-2(a) under the Investment Company Act of 1940 (17 CFR 270.30a-2(a)) is filed and attached hereto as Exhibit 99.CERT. |
(a) | (3) | Not applicable. |
(b) | Certification pursuant to Rule 30a-2(b) under the Investment Company Act of 1940 (17 CFR 270.30a-2(b)) is furnished and attached hereto as Exhibit 99.906CERT. |
SIGNATURES
Pursuant to the requirements of the Securities Exchange Act of 1934 and the Investment Company Act of 1940, the registrant has duly caused this report to be signed on its behalf by the undersigned, thereunto duly authorized.
Fidelity Advisor Series I
By: | /s/Stacie M. Smith |
Stacie M. Smith | |
President and Treasurer | |
Date: | July 25, 2017 |
Pursuant to the requirements of the Securities Exchange Act of 1934 and the Investment Company Act of 1940, this report has been signed below by the following persons on behalf of the registrant and in the capacities and on the dates indicated.
By: | /s/Stacie M. Smith |
Stacie M. Smith | |
President and Treasurer | |
Date: | July 25, 2017 |
By: | /s/Howard J. Galligan III |
Howard J. Galligan III | |
Chief Financial Officer | |
Date: | July 25, 2017 |